Embed Size (px)
Citation preview

This article appeared in a journal published by Elsevier. The attachedcopy is furnished to the author for internal non-commercial researchand education use, including for instruction at the authors institution
and sharing with colleagues.
Other uses, including reproduction and distribution, or selling orlicensing copies, or posting to personal, institutional or third party
websites are prohibited.
In most cases authors are permitted to post their version of thearticle (e.g. in Word or Tex form) to their personal website orinstitutional repository. Authors requiring further information
regarding Elsevier’s archiving and manuscript policies areencouraged to visit:
http://www.elsevier.com/authorsrights

Author's personal copy
Silencing of the Charcot–Marie–Tooth disease-associated gene GDAP1 inducesabnormal mitochondrial distribution and affects Ca2+ homeostasis by reducingstore-operated Ca2+ entry
David Pla-Martín a,b,c,1, Carlos B. Rueda b,d,1, Anna Estela a,b,c, Maribel Sánchez-Piris a,Paloma González-Sánchez b,d, Javier Traba b,d, Sergio de la Fuente e, Luca Scorrano f,g,Jaime Renau-Piqueras h, Javier Alvarez e, Jorgina Satrústegui b,d,⁎, Francesc Palau a,b,c, i,⁎⁎a Laboratory of Genetics and Molecular Medicine, Instituto de Biomedicina de Valencia, CSIC, Valencia 46010, Spainb CIBER de Enfermedades Raras (CIBERER), Valencia 46010 and Madrid 28049, Spainc Program in Rare and Genetic Diseases, Centro de Investigación Príncipe Felipe, Valencia 46012, Spaind Centro de Biología Molecular Severo Ochoa, UAM-CSIC, Cantoblanco, Madrid 28049, Spaine Departamento de Bioquímica y Biología Molecular y Fisiología, Instituto de Biología y Genética Molecular (IBGM), Facultad de Medicina, Universidad de Valladolid, Valladolid 47005, Spainf Dulbecco-Telethon Institute, Venetian Institute of Molecular Medicine, Padova 35129, Italyg Department of Cell Physiology and Metabolism, University of Geneva Medical School, Geneva 1211, Switzerlandh Centro de Investigación, Instituto de Investigación Sanitaria La Fe, Hospital Universitari i Politècnic La Fe, Valencia 46009, Spaini Facultad de Medicina de Ciudad Real, Universidad de Castilla-La Mancha, Ciudad Real 13071, Spain
a b s t r a c ta r t i c l e i n f o
Article history:Received 11 January 2013Revised 4 March 2013Accepted 19 March 2013Available online 28 March 2013
Keywords:GDAP1Charcot–Marie–Tooth diseaseMitochondrial distribution and motilityEndoplasmic reticulumCalcium homeostasisStore-operated Ca2+ entry
GDAP1 is an outer mitochondrial membrane protein that acts as a regulator of mitochondrial dynamics. Mu-tations of the GDAP1 gene cause Charcot–Marie–Tooth (CMT) neuropathy. We show that GDAP1 interactswith the vesicle-organelle trafficking proteins RAB6B and caytaxin, which suggests that GDAP1 may partici-pate in the mitochondrial movement within the cell. GDAP1 silencing in the SH-SY5Y cell line induces abnor-mal distribution of the mitochondrial network, reduces the contact between mitochondria and endoplasmicreticulum (ER) and alters the mobilization of mitochondria towards plasma membrane upon depletion ofER-Ca2+ stores. GDAP1 silencing does not affect mitochondrial Ca2+ uptake, ER-Ca2+, or Ca2+ flow fromER to mitochondria, but reduces Ca2+ inflow through store-operated Ca2+ entry (SOCE) following mobiliza-tion of ER-Ca2+ and SOCE-driven Ca2+ entry in mitochondria. Our studies suggest that the pathophysiologyof GDAP1-related CMT neuropathies may be associated with abnormal distribution and movement of mito-chondria throughout cytoskeleton towards the ER and subplasmalemmal microdomains, resulting in a de-crease in SOCE activity and impaired SOCE-driven Ca2+ uptake in mitochondria.
© 2013 Elsevier Inc. All rights reserved.
Introduction
Charcot–Marie–Tooth (CMT) disease is the most common inheritedneurological disorder affecting 1–4 of 10,000 inhabitants (Braathenet al., 2011; Combarros et al., 1987; Skre, 1974). GDAP1 (ganglioside-induced differentiation associated protein 1) gene causes either demy-elinating autosomal recessive CMT4A (Baxter et al., 2002), axonal reces-sive AR-CMT2K (Cuesta et al., 2002) or dominant CMT2K (Claramunt etal., 2005) peripheral neuropathies. GDAP1 belongs to a glutathioneS-transferase enzyme subfamily (Marco et al., 2004) that is mainly
expressed not only in neurons (Pedrola et al., 2005, 2008) but also inSchwann cells (Niemann et al., 2005). GDAP1 is located in the mito-chondrial outer membrane (MOM) (Niemann et al., 2005; Pedrolaet al., 2005) and a role as a regulator of mitochondrial dynamicshas been proposed (Niemann et al., 2005; Pedrola et al., 2008).Overexpression of GDAP1 in COS7 or HeLa cells causes mitochondrialfission and a substantial accumulation of mitochondria around the nu-cleus. The effect of GDAP1 mutations in mitochondrial dynamicsseems to depend on the inheritance pattern (Niemann et al., 2009).
The aim of this work was to study the disease cell pathogenesis byinvestigating protein interactions of GDAP1 along with the role of theprotein in mitochondrial dynamics and calcium homeostasis. In thelast years, disruption of calciumhomeostasis with involvement ofmito-chondria has been shown to play a role in a number of neurodegenera-tive disorders such as Alzheimer's, Parkinson's and Huntington'sdiseases (Mattson, 2007), and may also be involved in Charcot–Marie–Tooth disease. Mitochondria are well known players in calcium
Neurobiology of Disease 55 (2013) 140–151
⁎ Corresponding author.⁎⁎ Correspondence to: F. Palau, Instituto de Biomedicina de Valencia, CSIC, Valencia46010, Spain. Fax: +34 96 369 0800.
E-mail address: [email protected] (F. Palau).Available online on ScienceDirect (www.sciencedirect.com).
1 These authors contributed equally.
0969-9961/$ – see front matter © 2013 Elsevier Inc. All rights reserved.http://dx.doi.org/10.1016/j.nbd.2013.03.010
Contents lists available at SciVerse ScienceDirect
Neurobiology of Disease
j ourna l homepage: www.e lsev ie r .com/ locate /ynbd i

Author's personal copy
homeostasis due to their capacity to take up Ca2+ which results in theshaping of cytosolic calcium signals and to their capacity to move to-wards and away of Ca2+ sources (Rizzuto et al., 2012) and any ofthese properties may be affected by mutations in GDAP1.
Here we demonstrate that GDAP1 is located at MAM fractioninteracting with RAB6B, a protein involved in retrograde vesicle traf-ficking (Matanis et al., 2002; Stenmark, 2009; Wanschers et al., 2007)and caytaxin, a protein participating in the anterograde movementof mitochondria (Aoyama et al., 2009), which suggest that GDAP1may be important for movement of mitochondria within the cell to-wards the endoplasmic reticulum (ER). GDAP1 silencing alters mito-chondrial interconnectivity and motility of the mitochondrial networkwithin the cell and calcium homeostasis. We propose that GDAP1-related CMT neuropathies may be the consequence of abnormal mito-chondrial distribution andmovement throughout cytoskeleton towardsthe ER and plasma membrane. This results in a failure to sustainstore-operated Ca2+ entry (SOCE) upon mobilization of ER-Ca2+ dueto an impaired SOCE-driven Ca2+ uptake in mitochondria.
Material and methods
Microorganism strains, plasmids and Y2H assay
GDAP11–318 cDNAwas cloned in pBTM116 fused in 5′with LexA andthen used for yeast two-hybrid screening (Fields and Song, 1989)against a commercial humanbrain cDNA library, pACT2-GAL4 (ClontechLaboratories Inc., San Jose, CA) as described by Moreno et al. (2009).RAB6B ORF (OriGene, Rockville, MD) and ATCAY ORF (Geneservice Ltd.,Cambridge) were amplified and cloned in pCMV-HA or pCMV-myc forcoimmunoprecipitation and immunofluorescence assays. GDAP1 andGDAP1missense mutations were cloned in pEGFP-C1 for mitochondrialmotility assays, in pBTM116 for β-galactosidase liquid assay and inpCMV plasmids for coimmunoprecipitation and immunofluorescence.Plasmids used in this work are summarized in Supplementary Table 1.
Cell culture, silenced stable cell lines by RNA interference,co-immunoprecipitation assays and MAM gradient separation
For the generation of GDAP1-silenced stable cell lines, SH-SY5Ycells were transfected with pKLO.1 vector (MISSION® shRNA PlasmidDNA, Sigma-Aldrich) containing hairpin sequence of GDAP1 andnon-target control vector (pKLO-NT), which has at least 5 bp mis-matches within the shRNA. Transfections were performed usingSuperFect Transfection (Qiagen, Dusseldorf, Germany) according tothe manufacturer's instructions. Cells were grown in DMEM-F12(Gibco, Invitrogen, Carlsbad, CA) with 10% FBS, 2 mM L-glutamineand 100 mg/ml penicillin–streptomycin (Invitrogen, Carlsbad, CA),at 37 °Cwith 5% CO2 and 2 μg/ml puromycin tomaintain the selection.HeLa cells were grown in DMEM containing 10% FBS, 2 mM L-gluta-mine, and 100 mg/ml penicillin–streptomycin. Cells were transfectedusing FuGENE Transfection Reagent (Roche, Mannheim, Germany)according to the manufacturer's instructions. We confirmed thatGDAP1::c-myc construct was properly expressed in HeLa cells (Sup-plementary Fig. S1). Coimmunoprecipitation was carried out using500 μg of protein from transfected cells and 5 μl of rabbit α-c-myc(Sigma-Aldrich) for immunoprecipitation as described by Fukudaand Yamamoto (2005).
Mitochondria associated membranes were isolated as describedpreviously (Wieckowski et al., 2009). Briefly, two adult mouse brainswere homogenized following differential centrifugation steps to sep-arate different organelles. Percoll gradient was used to separate mito-chondria and mitochondria associated membranes. Fractions weresolubilized in SDS-PAGE buffer to analyze in western blot.
Antibodies used in all fractionation experiments and immunofluores-cencewereα-cytochrome c (Zymed, Invitrogen, Carlsbad, CA) and rabbitpolyclonal α-TOM20 (Sigma-Aldrich, St. Louis, MO) as mitochondrial
inner and outer membrane markers, respectively; rabbit polyclonalα-GRP94 (Abcam, Cambridge, UK) as an ER marker; rabbit polyclonalβ-COP (Abcam, Cambridge, UK) as cis-Golgi marker; rabbit polyclonalα-RAB6B (Abcam, Cambridge, UK), mouse polyclonal α-GDAP1(Abnova, Taipei, Taiwan), rabbit polyclonal α-FALCS-1 and α-calnexin(Cell Signalling, Beverly, MA) as MAM markers; mouse monoclonalcomplex V α-ATPase (Sigma, St. Louis, MO) as a mitochondrial innermembrane marker, and monoclonal α-ATPase Na+/K+ alpha1 (Devel-opmental Studies, Iowa, IA) as plasma membrane marker. A summaryof used antibodies is shown in Supplementary Table 2.
Immunofluorescence assays, ER–mitochondria interaction, mitochondrialmotility and missense mutation constructs
For immunofluorescence HeLa cells were fixed with paraformalde-hyde (PFA) 4% for 20 min or PFA 2% for 10 min and PFA 4% for 10 minmore for SH-SY5Y cells. Cells were permeabilized with 0.5% Triton,blocked and then probed with primary antibodies. Antibodies used fordetection of transfected proteins were mouse monoclonal α-c-mycand α-HA (Sigma-Aldrich). Primary antibodies were detected usinggoat anti-mouse or goat anti-rabbit antibodies coupled to Alexa Fluor488 or Alexa Fluor 633 (Molecular Probes, Invitrogen, Carlsbad, CA).Samples were examined using Leica TCS SP Confocal System and ana-lyzed with the public domain ImageJ program (developed by NIH).
To examine the different patterns of mitochondrial morphologywe analyzed at least 100 transfected HeLa cells per experiment with3 replicates in blinded condition. To calculate the number of mito-chondria, elongation index (inverse circularity) andmitochondrial in-terconnectivity, confocal images of SH-SY5Y were analyzed aspreviously described using ImageJ and Plugins described previouslyby Dagda et al. (2009).
For analysis of the mitochondria–ER interaction in living cells, 105
cells were seeded onto 24-mm round glass coverslips and processedas described by de Brito and Scorrano (2008). For analysis of the 2Dmitochondria–ER interaction, we took a representative stack of thecell and then, images were deconvolved, automatically thresholdedand analyzed using JACoP Plugin of ImageJ to obtain Manders' coeffi-cient and Pearson's correlation coefficient (Bolte and Cordelieres,2006). Pearson's coefficient measures the degree of correlative varia-tion of the two channels. In addition, Manders' coefficient measuresthe portion of the intensity in each channel that coincides withsome intensity in the other channel. Both indexes are commonlyused to measure colocalization of two channels.
Mitochondrial motility was carried out as described by Shprung andGozes (2009) using μ-Dish 35 mm (Ibidi, Martinsried, Germany) platesand Leica TCS SP Confocal System and analyzed using ImageJ. Analysiswas carried out using 400 nM MitoTracker Deep Red. Images were ac-quired each 30 s during 2.5 min to obtain 5 movement episodes in 5cells replicated 3 times. To analyze mitochondrial motility, imageswere automatically thresholded, converse to binary and subtracted.The resulted area was taken as index of moved mitochondria.
To investigate the effect of GDAP1 missense mutations we usedsite-directed mutated cDNAs previously developed in our laboratorywith primers including the corresponding nucleotide change (Pedrolaet al., 2008) (Supplementary Table S1).
To address mitochondrial network distribution within the cell andrelation to plasma membrane during SOCE activation we use encodedOrai1:CFP and mito:YFP plasmids to transfect SH-SY5Y cell lines. Im-ages were taken using Leica TCS SP8 Confocal System. Twelve imageswith 0.25 μm between each were acquired. Images were deconvolvedand 3D reconstructed using Volume J Plugin for ImageJ (Abramoff andViergever, 2002). Experiments were performed three times. To per-form radial profile of mitochondrial fluorescence we analyzed 20cells of each cell line using ImageJ Plugin Radial profile (Bravo et al.,2011).
141D. Pla-Martín et al. / Neurobiology of Disease 55 (2013) 140–151

Author's personal copy
Measurement of [Ca2+]cyt, [Ca2+]mit, [Ca
2+]ER and Ca2+
uptake in mitochondria
Cytosolic calcium imagingwith Fura-2was performed as describedby Ruiz et al. (1998). Briefly, cells were plated onto 12 mm round cov-erslips loaded with Fura-2AM by incubation in 15 mM D-glucoseCa2+-free HCSS with 5 μM Fura-2AM and 50 μM pluronic F.127 acid(Molecular Probes), for 20 min at 37 °C, and rinsed with HCSS,2 mM CaCl2, for 30 min. Regions of interest (ROIs) were selected cov-ering single cells. Fluorescence (emission 510 nm) ratio of Ca2+-free(F380) to Ca2+-bound probe (F340) was analyzed using Aquacosmos2.5 software (Hamamatsu). Experiments of GDAP1 expression recov-ery were performed with transfections either with GDAP1 cDNA orempty vector (pCMV) as control.
To image mitochondrial Ca2+, cells were plated onto 4-wellLab-Tek™ Chamber Slides and transfected using Metafectene(Biontex Laboratories) with the plasmid coding for mitochondrialtargeted ratiometric GEM-GECO-1 (Addgene plasmid 32461), andprocessed as described by Zhao et al. (2011). Briefly, cells wereexcited for 100 ms at 436/20 and the emitted fluorescence was col-lected alternatively at 480/40 (CFP) and 535/30 (YFP) every 5 susing a filter wheel (Lambda 10-2, Sutter Instruments, San Rafael,CA, USA) and recorded by a Hamamatsu C9100-02 camera (all filterspurchased from Chroma). Single cell fluorescence recordings wereanalyzed using ImageJ or MetaMorph (Universal Imaging). ROIswere selected on mitochondrial containing areas (identified basedon their morphology).
For the experiments with aequorin, cells were transfected with theconstructs for either cytosolic native aequorin (Brini et al., 1995),mitochondrially-targeted native aequorin (Rizzuto et al., 1992),mitochondrially-targeted mutated aequorin (Montero et al., 2000)or ER-targetedmutated aequorin (Montero et al., 1997). Cells express-ing cytosolic or mitochondrially-targeted aequorin, both native andmutated, were reconstituted with native coelenterazine by incubatingthe cells for 1–2 h at room temperature with 1 μM of wild-typecoelenterazine. Cells expressing ER-targeted mutated aequorin weredepleted of Ca2+ prior to reconstitution. To this end, cells were incu-bated in standard medium (145 mM NaCl, 5 mM KCl, 1 mM MgCl2,1 mM CaCl2, 10 mM glucose, and 10 mM HEPES, pH 7.4) containing0.5 mM EGTA and 10 μM BHQ for 10 min, then washed andresuspended again in medium containing 0.5 mM EGTA, 10 μM BHQand 2 μM coelenterazine n for 1–2 h. Cells were then placed in theperfusion chamber of a purpose-built luminometer and perfusedwith the required solutions. Calibration of the luminescence datainto [Ca2+] was made using an algorithm as previously described(Montero et al., 1997).
Mitochondrial Ca2+ uptake rate was studied after addition oftrains of Ca2+ pulses to permeabilized cells as described previously(Traba et al., 2012). Cells were harvested by trypsinization, followedby centrifugation in growth medium. Then they were washed andresuspended in intracellular (IC) buffer (125 mM KCl, 2 mM KPi,1 mMMgCl2, and 20 mMHEPES, pH 7.4) supplemented with respira-tory substrate (5 mM succinate + 1 μM rotenone) and 80–100 μMdigitonin was then added to permeabilize the cells. Experimentswere carried out at 30 °C in an Aminco-Bowman (series 2) fluorime-ter with temperature control and continuous stirring in the presenceof the Ca2+-sensitive fluorescent probe Calcium-Green 5N (0.1 μM,excitation 506 nm, emission 532 nm). In some experiments 200 nMruthenium red was added to specifically inhibit mitochondrial Ca2+
uptake.
Electron microscopy
HeLa cells were transfected as described previously and fixed in2.5% glutaraldehyde and 2% formaldehyde in 0.1 M cacodylate bufferaccording to Karnovsky's solution, agar-included and post-fixed with
2% osmium. Then, cells were washed with distilled water anddehydrated in acetone and propylene oxide and included in epoxyresin. Ultrathin sections (70–80 nm) were mounted in copper grids,counterstained with uranyl acetate and lead citrate and examined ina JEOL 1010 EM with digital camera MegaView III and softwareanalysis.
Results
GDAP1 silencing induces changes in mitochondrial network distributionand motility
GDAP1 overexpression induces fragmentation of the mitochondrialnetwork suggesting that GDAP1 is related to the fission pathway of mi-tochondrial dynamics (Niemann et al., 2005; Pedrola et al., 2005). Thus,we expected that GDAP1 depletion should balance the mitochondrialreticulum dynamics towards the fusion pathway, causingmitochondri-al tubulation as observed in Niemann et al. (2005). To investigate suchhypothesis, we generated five GDAP1 knock-down clones of thehuman neuroblastoma SH-SY5Y cell line. Clones G1 and G4 (approxi-mately 40% and 80% protein reduction, respectively) were selected toperformcellular and biochemical experiments (Fig. 1A).We studiedmi-tochondrial dynamics in silenced clones by image analysis measuringorganelle number, as a number of objects in the image, shape andsize, using the inverse of object circularity as an elongation index, andmitochondrial interconnectivity using the area/perimeter ratio, whichis higher in the interconnected mitochondrial network than in thefragmented network (Dagda et al., 2009). All the measurements werecompared with wild type SH-SY5Y and a control clone that expresseda non-targeted shRNA (pKLO-NT) (Fig. 1A). As overexpression ofGDAP1 in COS-7 and HeLa cells induces fragmentation of themitochon-drial network (Pedrola et al., 2005) we expected to find a more tubularnetwork expressed as a reduction of the number of mitochondria andincrease in the elongation index. However, our results did not confirmsuch a hypothesis. We observed a significant increase in the numberof mitochondria in both silenced clones, G1 and G4 (Fig. 1B), with nor-mal elongation indexes (Fig. 1C). On the other hand, mitochondrial in-terconnectivity scores were significantly decreased in the silencedclones compared with control non-targeted cells (Fig. 1D).
To further study the effect of reduction of GDAP1 levels in the mi-tochondrial behavior we investigated the motility of mitochondria bymeasuring time-lapse confocal microscopy images in the depletedclones. We observed significant 1.6 and 2-fold increases in movementin the G1 and G4 silenced cells, respectively (Fig. 1E). Thus, it seemsthat reduction of connections between mitochondria or changes intheir distribution may facilitate the organelle motility.
To compare the effect of GDAP1 silencing with the consequence ofexpression of both wild type and GDAP1 mutations on the mitochon-drial network dynamics and distribution we expressed gene con-structs in HeLa cells. These cells have the advantages that they donot physiologically express GDAP1 at all (data not shown). HeLa cellshave additional advantages with regard to neuroblastoma cells asoverexpression of GDAP1 in SH-SY5Y cells induces drastic perinuclearaggregation of mitochondria that make difficult the morphologicalanalysis. Overexpression of GDAP1 and mutated GDAP1 constructs inHeLa cells produced an aggregation pattern of mitochondria (Supple-mentary Fig. S1A) associated with decrease in the number of mito-chondria (Supplementary Fig. S1B), decrease in the elongation index(Supplementary Fig. S1C) and increase of mitochondrial interconnec-tivity index (Supplementary Fig. S1D). In spite of observing somequantitative differences among mutations and wild type GDAP1(black bar) we did not observe any qualitative difference and changein the effect of either recessive (gray bars) or dominant (red bars)mu-tations on the mitochondrial morphology with regard to wild typegene (Supplementary Figs. S1B–D). It seems that missense mutations
142 D. Pla-Martín et al. / Neurobiology of Disease 55 (2013) 140–151

Author's personal copy
have no specific effect on the mitochondrial reticulum morphologydifferent to that of wild type GDAP1.
Thus, the opposite effects between reduction and excess of GDAP1suggest that both depletion and overexpression of GDAP1 inducecomplex changes in the morphology and distribution of the mito-chondrial network.
GDAP1 interacts with the cytoskeleton and trafficking-associated proteins
To further understand the molecular mechanisms by which reduc-tion of GDAP1 alters mitochondrial network distribution, we searchedfor GDAP1–protein interactions. We conducted yeast two-hybridscreening using the GDAP11–318 truncated cytosolic protein as bait.We confirmed the biochemical interaction with β-tubulin (Estelaet al., 2011), and found interactionswith RAB6B, a protein related to ret-rograde vesicle transport from Golgi apparatus to endoplasmic reticu-lum, and caytaxin, a protein involved in anterograde transport ofvesicles and mitochondria, by β-galactosidase assay in yeast (Fig. 2A),and coimmunoprecipitation assays in HeLa cells using full-length pro-teins; moreover, we also detected coimmunoprecipitation betweenGDAP1::c-myc and GDAP1::HA (Fig. 2B).
To confirm interaction with RAB6B we generated two protein vari-ants by site-directed mutagenesis, the dominant negative RAB6BT27N
and the constitutively active RAB6BQ72L proteins (Opdam et al., 2000)(Supplementary Table S2). Interaction with RAB6B was obtained in
the presence of GTP-γ-S, an analog of GTP that could not be hydrolyzedand maintain the protein active, and GTP for the constitutively activeRAB6BQ72L, that remains active when bounded to GTP. However,coimmunoprecipitation was not observed with the inactive RAB6BT27N
variant in the presence of GTP-γ-S (Fig. 2B).In that way, overexpression experiments in HeLa cells showed
contact points between mitochondria expressing GDAP1 and eitherRAB6B, RAB6BQ72L or caytaxin (Fig. 2C). GDAP1 and caytaxin havebeen related to mitochondrial dynamics and movement (Aoyamaet al., 2009; Niemann et al., 2005; Pedrola et al., 2005) but not inthe case of RAB6B that has never been related to mitochondria.
In order to characterize the role of GDAP1 interaction with RAB6Band caytaxin onmitochondrialmorphology anddynamicswe quantifiedthe proportion of mitochondrial patterns after expression of these pro-teins in blinded experiments. GDAP1 induced fragmentation and vesicu-lation of mitochondria (Fig. 2D), which is reversed by co-expression ofactive RAB6BQ72L but notwith RAB6B or the inactive RAB6BT27N proteins.These findings suggest that RAB6B has a dominant effect over GDAP1when it is functionally active. Conversely, caytaxin has an enhancing ef-fect on mitochondrial fission and does not recover the GDAP1 pattern.These results suggest that both active RAB6B and caytaxin have impor-tant roles in the mitochondrial trafficking. Thus, molecular interactionof GDAP1 with β-tubulin, RAB6B and caytaxin suggests that GDAP1may facilitate the interaction between mitochondria and cytoskeleton,and retrograde and anterograde organelle transports.
Fig. 1. GDAP1 silencing affects mitochondrial interconnectivity and motility. (A) Basal expression of GDAP1 in wild type SH-SY5Y cells, pKLO-NT as non-targeted shRNA controlcells, G1 and G4 silenced clones, and silenced clones by shRNA against frataxin (FXN) as a positive control of the RNAi technique. β-Tubulin is used as a control of protein loading.(B–E) Mitochondrial morphology and dynamic studies in silenced clones were analyzed by measuring (B) number of mitochondria (n = 30 cells per experiment; 3 replicates),(C) mitochondrial elongation index (n = 30 cells per experiment; 3 replicates), (D) mitochondrial interconnectivity (n = 30 cells per experiment; 3 replicates) and (E) mitochon-drial motility (5 movement episodes in 5 different cells replicated 3 times). One-way ANOVA, Tukey's multiple comparison test; **p b 0.01, ***p b 0.001. Error bars represent s.e.m.
143D. Pla-Martín et al. / Neurobiology of Disease 55 (2013) 140–151

Author's personal copy
Fig. 2. GDAP1 interacts with cytoskeleton and trafficking-associated proteins. (A) β-Galactosidase filter assay to test interaction of GDAP1 with β-tubulin (TUBB), RAB6B andcaytaxin, obtained from positive clones using GDAP1 as a bait in yeast two-hybrid assay with the human fetal brain cDNA library pACT2-GAL4. (B) Coimmunoprecipitation inHeLa cells of GDAP1 with proteins obtained in the yeast two-hybrid. Cells were transfected with pCMV-GDAP1::c-myc constructions and pCMV-HA construction with putativeinteractor protein. α-c-myc was used for immunoprecipitation. (C) HeLa cell colocalization of GDAP1::HA (green signal) with RAB6B::c-myc, RAB6BQ72L::c-myc and Caytaxin::c-myc (red signal). Arrows indicate contact points between both proteins. Bars indicate 10 μm. (D) Percentage distributions of indicated mitochondrial shape patterns in blindedcounting for every transfected cell. Differences between GDAP1 and GDAP1 plus RAB6BQ72L were significant for the tubular (p b 0.001), fragmented (p b 0.05) and vesicular(p b 0.001) patterns. (E) Colocalization images of HeLa cells transfected with either RAB6B::c-myc, RAB6BQ72L::c-myc or RAB6BT27N::c-myc (red signal), and the mitochondrialouter membrane marker TOMM20 (green signal). Arrows show contact points between organelles. Bars indicate 10 μm. (F) Western blot of mitochondria associated membranes(MAMs) obtained from mice brains. Both GDAP1 and RAB6B are detected in the MAM fraction. α-Calreticulin and α-FALCS-1 were used as MAM markers; α-TOMM20 was used asmitochondrial outer membrane marker; α-ATPase (complex V) and α-cyt c were used as mitochondrial inner membrane marker; α-ATPase Na+/K+ alpha1 was used as plasmamembrane marker.
144 D. Pla-Martín et al. / Neurobiology of Disease 55 (2013) 140–151

Author's personal copy
Fig. 3. GDAP1 modifies ER–mitochondrial colocalization and structure. (A) Three-dimensional reconstructions of ER and mitochondria in GDAP1-silenced and control clones. Cellswere transfected with vectors targeted to mitochondria, pEYFP-mito (red signal), and endoplasmic reticulum (ER), pDsRed2-ER (green signal). Manders' coefficient was calculatedin 20 cells replicated 3 times. Error bars represent s.e.m. Bars indicate 8 μm. (B) 2D confocal images showing mitochondria labeled with α-cyt c (red signal) and ER labeled withα-GRP94 (green signal). Images were used to calculate Manders' coefficient (left lower panel) and Pearson's correlation coefficient normalized to ER volume from a representativestack of cells (n = 3, 30 cells per experiment). One way ANOVA, Tukey's multiple comparison test; *p b 0.05, ***p b 0.001. Error bars represent s.e.m. Bars indicate 8 μm.(C) Colocalization between mitochondria and ER measured by Manders' coefficient normalized to mitochondrial volume in 2D images of the SH-SY5Y control and knock-downclones (n = 3, 30 cells per experiment). One way ANOVA, Tukey's multiple comparison test; *p b 0.05. Error bars represent s.e.m. (D) Manders' coefficient in a representativestack of HeLa cells (white bar) overexpressing wild type GDAP1 (black bar), autosomal recessive missense mutations (gray bars) or autosomal dominant (red bars) (n = 3, 30cells per experiment). Colocalization was normalized to the ER volume. One way ANOVA, Tukey's multiple comparison test; *p b 0.05, ***p b 0.001. Error bars represent s.e.m.(E, F) Electron microscope studies of HeLa wild type and HeLa cells transfected with GDAP1::c-myc construct (E) and pKLO-NT and G4 clone cells (F). ER, rough endoplasmicreticulum; M, mitochondria. Arrows indicate rough ER with ribosomes; some of them are amplified in panel D right pictures. Bars indicate 1 μm.
145D. Pla-Martín et al. / Neurobiology of Disease 55 (2013) 140–151

Author's personal copy
To investigate the effect of GDAP1 mutant proteins on the molecu-lar interactions andmitochondrial behaviorwe selected diseasemuta-tions located within theα-loop domain or in its boundaries (inheriteddominant p.R120Wand de novo dominant p.T157P, and autosomal re-cessive p.R120Q) (Claramunt et al., 2005), and one additional autoso-mal recessive p.R282C placed near the transmembrane domain(Sivera et al., 2010) (Supplementary Fig. S2A). As mentioned above,overexpression of GDAP1missense mutations did not change substan-tially the effect inmitochondrialmorphology compared to GDAP1wildtype (Supplementary Fig. S1). Overexpression of inherited dominantmutations (p.R120W and p.T157P), produced decrease in the numberof mitochondria, related to an increase in the aggregation pattern(Supplementary Fig. S1B, red bars). As described in other cell lines(Pedrola et al., 2008), no effect could be related to inheritance forthe elongation index (Supplementary Fig. S1C). Overexpression ofinherited recessive mutations (gray bars), related to less aggregatedpattern, has a decrease in the mitochondrial interconnectivity indexcompared to GDAP1 wild type (black bar).
We have previously observed that interaction between GDAP1 andβ-tubulin occurs at the α-loop domain and is increased by mutantproteins (Estela et al., 2011). In that way, interaction with RAB6Band caytaxin also occurs at the α-loop domain (SupplementaryFig. S2B). Interestingly, we observed increased interaction of bothRAB6B and caytaxin with dominant mutations p.R120W and p.T157P(Supplementary Fig. S2C). We also observed that overexpression ofGDAP1 also increased mitochondrial motility, a phenomenon thatwas even more pronounced for proteins with dominant mutations(Supplementary Fig. S2D), which suggest that these could be the mo-lecular basis of the differences in the inheritance pattern.
To know further whether RAB6Bmay relate GDAP1 andmitochon-dria with vesicle trafficking we performed colocalization experimentsof the RAB6B::c-myc construct expressed in HeLa cells. We confirmedthat RAB6B partially localized in ER, Golgi and trans-Golgi network(TGN) (Supplementary Fig. S2E). More interestingly, we observedcolocalization of RAB6B with the MOM marker TOM20 (Fig. 2E). Thecolocalization was enhanced when the experiment was performedwith the constitutively expressed mutation Rab6BQ72L and was lostwhen expressing the inactive RAB6BT27N protein; in addition, wedetected RAB6B in both cytoplasmic and mitochondrial fractions ofSH-SY5Y cells (Supplementary Fig. S2F). Then, we searched for specif-ic location of RAB6B and GDAP1 in subcellular cell fractions fromadult mice brain mitochondrial-associated membranes (MAMs). Weobserved that both GDAP1 and RAB6B are located not only in mito-chondria but also in MAMs, which suggest that MAMs are the placewhere GDAP1 and RAB6B interact (Fig. 2F), and may have a role inthe interface between mitochondria and ER.
GDAP1 deficiency affects mitochondria–ER colocalization
Mitochondria and ER tethering is a well-established structural cellfeature. Location of both GDAP1 and RAB6B at MAMs and participa-tion of RAB6B in the retrograde movement between Golgi and ERprompted us to investigate a possible role of GDAP1 in the interactionbetween mitochondria and ER. We investigated colocalization be-tween ER and mitochondria by determining the Manders' coefficientand Pearson's correlation coefficient in knock-down cells. In 3D re-constructions of z-axis stacks of confocal images we observed signifi-cant reduction of the Manders' coefficient in G1 and G4 (Fig. 3A), thatcorrelates with the level of GDAP1 silencing. We then performed 2Dmeasures of the same G1 and G4 clones in a representative stack ofthe cells (Fig. 3B) and we confirmed significant reductions for bothManders' (Fig. 3B, left lower panel) and Pearson's correlation coeffi-cients (Fig. 3B, right lower panel). Differences were recovered afterexpression of wild type GDAP1::c-myc construct (Fig. 3B, left lowerpanel). Reduced ER–mitochondrial colocalization was not a conse-quence of the increased ER volume as we detected differences when
normalized to the total ER surface on the 2D images but not whencolocalization is normalized to the mitochondrial volume (Fig. 3C).Overexpression of GDAP1::c-myc in HeLa cells significantly increasedManders' coefficient. Interestingly, while recessive mutations have asimilar effect than that of wild-type GDAP1 on mitochondria–ER in-teraction with the increase of Manders' coefficient, dominant muta-tions did not induce any significant change (Fig. 3D).
In order to know more about the effect of GDAP1 in suchinterorganelle interaction, we investigated the ultrastructure of bothHeLa cells overexpressing GDAP1 and GDAP1-silenced SH-SY5Y neu-roblastoma cells. Both overexpression and silencing of GDAP1 wereassociated with enlarged ER tubules and cisternae but mitochondrialpattern was very different: whereas overexpression induced redistri-bution of mitochondria that where located very close to the ER net-work in HeLa cells (Fig. 3E), and contacts between ER cisternae andmitochondria in depleted neuroblastoma cells were markedly re-duced (Fig. 3F).
Effect of GDAP1 silencing on calcium signaling
As spots of colocalization of mitochondria and ER appear to de-crease in GDAP1-silenced cells, transfer of ER-Ca2+ signals to mito-chondria might be disturbed as shown for mitofusin 2 deficient cells(de Brito and Scorrano, 2008). To test this possibility we have usedagents which mobilize ER-Ca2+ and studied mitochondrial handlingof the mobilized Ca2+. ATP and carbachol, as agonists of purinergicand muscarinic G-coupled receptors, mobilize ER-Ca2+ through acti-vation of IP3 receptors (Majumder et al., 2007; Van Acker et al.,2002). Thapsigargin (TG) and benzohydroquinone (BHQ) are inhibi-tors of SERCA, the ER Ca2+-ATPase, that allow net Ca2+ leak fromthe ER, a process also attributed to the basal Ca2+ efflux through theIP3 receptor (Cardenas et al., 2010). The emptying of ER-Ca2+ storestriggered by either of these agents activates Ca2+ entry throughlow-conductance plasmalemmal channels that are regulated by thelevel of Ca2+ stored in the ER, a process named store-operated Ca2+
entry (SOCE) (Putney, 2009).We first studied [Ca2+]cyt signals obtained by stimulationwith ATP
in a Ca2+-free medium, where only the ER contributes to the signal,using Fura-2. The basal [Ca2+]cyt levels were increased in theGDAP1-silenced cells (Fig. 4A) due to yet unknown reasons. Therefore,the [Ca2+]cyt responses were normalized to the initial values.[Ca2+]cyt transients elicited by ATP obtained in these conditionswere essentially the same, regardless of the presence or absence ofGDAP1 (Fig. 4B). On the other hand, aequorin targeted to the ER(ER-AEQ) reported similar ER-Ca2+ levels in all cell lines (Fig. 4C). Inaddition, ionophore (Br-A23187)-mediated Ca2+ mobilization in aCa2+-free medium, which also reflects the ER-Ca2+ pool, resulted insimilar [Ca2+]cyt transients among cell lines (Fig. 4D).
Having ruled out differences in ER-Ca2+ due to GDAP1 deficiency,we investigated mitochondrial Ca2+ handling in these conditionsusing aequorin targeted to mitochondria (Mit-AEQ). The [Ca2+]mit sig-nals elicited by ATP or SERCA pump inhibitors in Ca2+-free mediumwere too small to be reliably quantified either with native or low-affinity mutant aequorin. However, 0.5 mM carbachol gave rise to a ro-bust [Ca2+]mit signal whichwas the same regardless of GDAP1 deficien-cy (Fig. 4E). In conclusion, contrary to our initial expectations,mitochondrial Ca2+ uptake in response to ER-Ca2+ mobilization isnot modified by GDAP1 deficiency, ruling out a disturbed traffic ofCa2+ from ER to mitochondria.
While studying [Ca2+]cyt signals triggered by emptying of ER-Ca2+
in Ca2+-freemediumwenoticed that the response to Ca2+ readmissionwas strikingly different among cell lines. The increase in [Ca2+]cyt in re-sponse to 10 mM Ca2+ in cells previously treated with ATP or TG in aCa2+-free medium was much smaller in GDAP1 deficient cells than inwild type and control cells (Fig. 5A, insets). This effect was furtherverified in cells expressing cytosolic aequorin (Cyt-AEQ) which were
146 D. Pla-Martín et al. / Neurobiology of Disease 55 (2013) 140–151

Author's personal copy
depleted of ER-Ca2+with 10 μMBHQ in Ca2+-freemedium. UponCa2+
readmission, larger [Ca2+]cyt signals were observed in both wild-typeand pKLO-NT control cells than in GDAP1 deficient cells (Fig. 5B). Thisreveals an unexpected effect of GDAP1 deficiency on SOCE.
Mitochondrial handling of Ca2+ entry through capacitative calciumchannels has been shown to regulate SOCE activity by preventingCa2+-inactivation of STIM1-Orai1 channels (Naghdi et al., 2010;Quintana et al., 2011; Singaravelu et al., 2011). Indeed, mitochondrialdepolarization by treatment with antimycin plus oligomycin results ina large reduction of SOCE activity in SH-S5SY cells (SupplementaryFigs. S3A, B). As GDAP1 deficiency alters mitochondrial interconnectiv-ity and movement, we reasoned that decreased SOCE activity could beassociated with an impairment of mitochondrial Ca2+ uptake in re-sponse to SOCE-induced Ca2+ entry. To study this possibility, we haveused two types of genetically encoded Ca2+ sensors targeted to mito-chondria, the FRET probe GEM-GECO1 (Zhao et al., 2011) and nativeaequorin. We found an increase in the basal Mit-GEM-GECO1 ratio(480/535 or CFP/YFP) in mitochondria from GDAP1 depleted cells,which was significant for G4 (Supplementary Figs. S3C, D). Therefore,SOCE-inducedmitochondrial Ca2+ uptake was normalized to the initialCFP/YFP ratio. The initial rate of Ca2+ entry in mitochondria upon Ca2+
readmission gave a robust increase in the GEM-GECO1 ratio which wasseverely decreased in theG4 clone cells (Figs. 5C, E). However,when an-alyzedwithmitochondrial aequorin, SOCE-inducedmitochondrial Ca2+
uptake rate shows a similar decrease in the two silenced clones(Figs. 5D, F). This is not due to a defect in Ca2+ uptake in mitochondria,
as GDAP1 deficiency did not change Ca2+ transport kinetics or total re-tention capacity in mitochondria from digitonin-permeabilized cells(Supplementary Figs. S3E, F). Indeed, GDAP1 expression in GDAP1-silenced cells restores capacitative calcium entry (Fig. 5G). These resultssuggested that the decrease in SOCE activity associated with GDAP1 de-ficiency could be due, at least in part, to an impaired handling by mito-chondria of calcium entering through SOCE, which may result in itsCa2+-dependent inactivation due tomisregulation ofmitochondrial dy-namics and distribution processes.
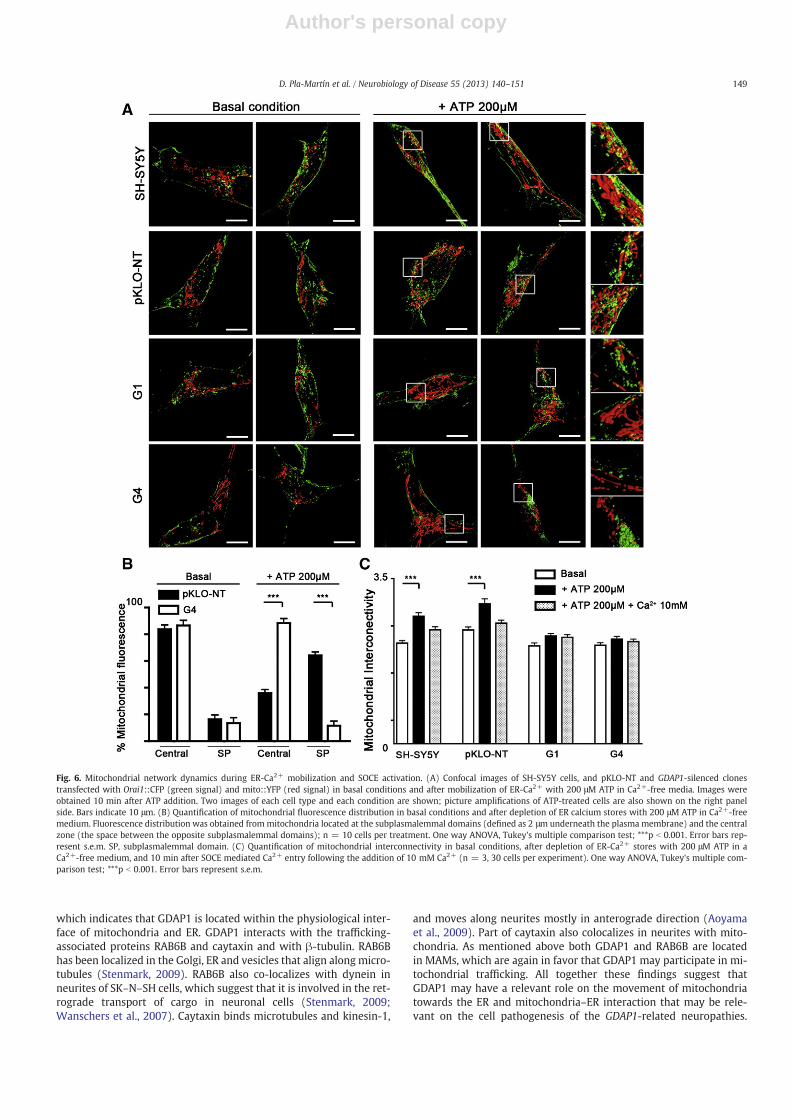
To investigate whether the reduced mitochondrial Ca2+ uptake is acause, and not a consequence, of the reduced SOCE activity, we studiedthe distribution, morphology and localization of mitochondria in rela-tion to subplasmalemmal microdomains using Orai1::CFP expressionas a marker of the plasma membrane, in cells challenged with ATP inCa2+-free medium to induce ER-Ca2+ depletion and SOCE activation.After ATP treatment we observed movement of mitochondria towardssubplasmalemmal microdomains in both wild type and pKLO-NT con-trol cells. In contrast, the mitochondria of GDAP1-silenced cells weremobilized towards the plasma membrane to a lesser extent (Fig. 6A).To confirm the abnormal mobilization of mitochondria after SOCE acti-vation we studied the mitochondrial distribution between oppositeplasma membranes considering the two subplasmalemmal zones andthe central cell zone in the control and G4 clones (Fig. 6B). Whileboth pKLO-NT control and G4 cells showed central distribution of mito-chondria, ER-Ca2+ mobilization by ATP caused a shift of the mitochon-dria towards the subplasmalemmal zones in control cells but not in
Fig. 4. Calcium homeostasis in GDAP1-depleted SH-SY5Y cells. [Ca2+]cyt, [Ca2+]mit and [Ca2+]ER signals were measured in SH-SY5Y (dark blue), pKLO-NT (light blue) and GDAP1knock-down cells (light red for G1 and dark red for G4) by imaging either Fura-2/GEM-GECO1 fluorescence or aequorin luminescence, with probes targeted to the different cellularcompartments. Experiments were performed at 37 °C except indicated otherwise in Ca2+ free-medium. (A) Analysis of basal [Ca2+]cyt measured with Fura-2 after 5 min in Ca2+
free-medium. Mean basal calcium values from at least 14 experiments from 3 different platings were used. *p b 0.05 (ANOVA). (B) Agonist elicited [Ca2+]cyt signals in calciumfree-medium expressed as normalized Fura-2 ratio. 200 μM ATP was used. Traces were obtained averaging at least 120 cells from no less than 4 experiments. Error bars in thecolor of the trace represent s.e.m. (C) ER calcium loading at 22 °C after passive discharge with 10 μM BHQ in 0.5 mM EGTA medium, by perfusing cells with 2 mM Ca2+; a repre-sentative experiment is shown. Inset represents the mean maximal [Ca2+]ER value for each cell line. (D) Fura-2 recordings of 5 μM Br-A23187 (Br-A23) elicited [Ca2+]cyt peak inCa2+-free medium. Inset represents the mean maximal [Ca2+]cyt peak for each cell line. Traces were obtained averaging at least 90 cells from no less than 3 experiments.(E) Mit-AEQ recordings of [Ca2+]mit of cells challenged with 500 μM carbachol in a medium made Ca2+ free 30 s before; a representative experiment is shown.Low-Ca2+-affinity mutated aequorin was employed for both ER and mitochondrial measurements in panels C and E.
147D. Pla-Martín et al. / Neurobiology of Disease 55 (2013) 140–151

Author's personal copy
GDAP1-silenced cells (Fig. 6B, Supplementary Fig. S4A). We also stud-ied the effect of ER-Ca2+ mobilization on the mitochondrial networkfrom perinuclear zone towards the plasma membrane by determiningthe radial profile. While in pKLO-NT cells the peak of mitochondrialfluorescence moved from the central zone towards subplasmalemmaldomain after ER-Ca2+ mobilization, no changes were observed in theG4 clone cells (Supplementary Fig. S4B). We then measured the effectof depletion of ER calcium stores with ATP on the mitochondrial net-work interconnectivity. In contrast to control cells we observed thatthe interconnectivity index in mitochondria from GDAP1-silencedclones did not change significantly. Calcium addition to refill ER storesrecovered original state of mitochondrial interconnectivity in bothwild-type and control cells but had no effect on G1 or G4 clones(Fig. 6C). On the other hand, we did not observe any significant changeof STIM1 protein levels in GDAP1-silenced cells (SupplementaryFig. S4C), which indicates that the observed abnormal SOCE activity isnot caused by STIM1 down-regulation.
Discussion
GDAP1, a mitochondrial outer membrane protein, has been relatedto mitochondrial dynamics pathways because overexpression ofwild type protein produces drastic fragmentation of mitochondrion
(Niemann et al., 2005; Pedrola et al., 2005). Our data confirm previousresults (Pedrola et al., 2008) that suggest that overexpression ofmutant alleles does not produce additional changes in mitochondrialmorphology different to that of overexpression of wild type protein,suggesting that GDAP1 may have other unknown functions. Recently,GDAP1 has been described as a fission factor dependent of Fis1 andDrp1 (Niemann et al., 2009) indicating that the effect on mitochon-drial fission may be a secondary one and that GPAD1 has probablyother primary functions.
We show that GDAP1 depletion in SH-SY5Y cells induces changesin the mitochondrial network distribution as suggested by reductionof the mitochondrial interconnectivity and the increase of organellemotility. In contrast of the increase of tubular mitochondrial mor-phology previously shown by Niemann et al. (2005) in the mouseneuroblastoma N1E-115 cell line, reduction of GDAP1 levels inhuman neuroblastoma SH-SY5Y cells did not change the elongationindex. There is no evident explanation for such a different responseto GDAP1 depletion but it may be related to the different cell line or-igins and the experimental procedure.
We observed reduced colocalization between mitochondria andER, and enlargement of ER cisternae. Interestingly, overexpressionof GDAP1 in HeLa cells induced redistribution of mitochondria thatshowed increased contacts with ER. We detected GDAP1 in MAMs,
Fig. 5. SOCE alteration in GDAP1-silenced SH-SY5Y cells. (A) Fura-2 [Ca2+]cyt signals upon re-addition of 10 mM Ca2+ after stimulation 6 min before with either 200 μM ATP (leftpanel) or 7.76 μM TG (right panel) in Ca2+-free medium. Traces were obtained averaging at least 120 cells from no less than 4 experiments. Insets represent Δratio ± s.e.m. foreach cell line. *p b 0.05, **p b 0.01 (ANOVA). (B) Cyt-AEQ recordings of [Ca2+]cyt signals for each cell line upon re-addition of 2 mM Ca2+ after stimulation with 10 μM BHQ inCa2+ free medium. Traces represent means of 4–5 experiments from two different platings ± s.e.m. (C) Normalized Mit-GEM-GECO1 ratio recordings of [Ca2+]mit uponre-addition of 10 mM Ca2+ after stimulation with 100 μM tBuBHQ in 1 mM EGTA medium. Traces represent means from at least 20 cells from 3 to 10 experiments and three dif-ferent platings. The increases in mitochondrial CFP/YFP ratios obtained do not saturate the response of the probe to Ca2+, as a further increase was obtained after carbachol addition(Supplementary Material Fig. S3d). (D) Same experiment as that in panel B, with the mitochondrial native aequorin. Traces represent means of 4–5 experiments from two differentplatings ± s.e.m. (E and F) Mean ± s.e.m. of mitochondrial Ca2+ uptake rate upon 10 mM Ca2+ (from C) or 2 mM Ca2+ (from D) readmission [(E, increase in Mit-GEM-GECO1ratio × s−1, *p b 0.05), (F, [Ca2+]mit (μM) × s−1, *p b 0.05, **p b 0.01)]. (G) Fura-2 [Ca2+]cyt signals upon re-addition of 2 mM Ca2+ to cells treated with TG in Ca2+-free medium.Where specified either GDAP1 or empty vector was transfected 24 h before Ca2+ measurements. Traces were obtained averaging 4–5 experiments for each cell line ± s.e.m.
148 D. Pla-Martín et al. / Neurobiology of Disease 55 (2013) 140–151
Author's personal copy
which indicates that GDAP1 is located within the physiological inter-face of mitochondria and ER. GDAP1 interacts with the trafficking-associated proteins RAB6B and caytaxin and with β-tubulin. RAB6Bhas been localized in the Golgi, ER and vesicles that align along micro-tubules (Stenmark, 2009). RAB6B also co-localizes with dynein inneurites of SK–N–SH cells, which suggest that it is involved in the ret-rograde transport of cargo in neuronal cells (Stenmark, 2009;Wanschers et al., 2007). Caytaxin binds microtubules and kinesin-1,
and moves along neurites mostly in anterograde direction (Aoyamaet al., 2009). Part of caytaxin also colocalizes in neurites with mito-chondria. As mentioned above both GDAP1 and RAB6B are locatedin MAMs, which are again in favor that GDAP1 may participate in mi-tochondrial trafficking. All together these findings suggest thatGDAP1 may have a relevant role on the movement of mitochondriatowards the ER and mitochondria–ER interaction that may be rele-vant on the cell pathogenesis of the GDAP1-related neuropathies.
Fig. 6. Mitochondrial network dynamics during ER-Ca2+ mobilization and SOCE activation. (A) Confocal images of SH-SY5Y cells, and pKLO-NT and GDAP1-silenced clonestransfected with Orai1::CFP (green signal) and mito::YFP (red signal) in basal conditions and after mobilization of ER-Ca2+ with 200 μM ATP in Ca2+-free media. Images wereobtained 10 min after ATP addition. Two images of each cell type and each condition are shown; picture amplifications of ATP-treated cells are also shown on the right panelside. Bars indicate 10 μm. (B) Quantification of mitochondrial fluorescence distribution in basal conditions and after depletion of ER calcium stores with 200 μM ATP in Ca2+-freemedium. Fluorescence distribution was obtained frommitochondria located at the subplasmalemmal domains (defined as 2 μm underneath the plasma membrane) and the centralzone (the space between the opposite subplasmalemmal domains); n = 10 cells per treatment. One way ANOVA, Tukey's multiple comparison test; ***p b 0.001. Error bars rep-resent s.e.m. SP, subplasmalemmal domain. (C) Quantification of mitochondrial interconnectivity in basal conditions, after depletion of ER-Ca2+ stores with 200 μM ATP in aCa2+-free medium, and 10 min after SOCE mediated Ca2+ entry following the addition of 10 mM Ca2+ (n = 3, 30 cells per experiment). One way ANOVA, Tukey's multiple com-parison test; ***p b 0.001. Error bars represent s.e.m.
149D. Pla-Martín et al. / Neurobiology of Disease 55 (2013) 140–151

Author's personal copy
Rab small GTPases have been involved in other CMT neuropathies,which support the role of organelle trafficking and endocytosis inthe pathogenesis of inherited peripheral neuropathies. This is thecase for the dominant axonopathy CMT2B caused by mutations inthe RAB7 gene that regulates long-range retrograde axonal transportof neurotrophins and neurotrophin receptors (Deinhardt et al.,2006) and the demyelinating neuropathy CMT4C caused by muta-tions in the SH3TC2 gene, which encodes a protein that localizes toearly and recycling endosomes (Lupo et al., 2009; Roberts et al.,2010) and interacts with the small GTPase Rab11 (Roberts et al.,2010; Stendel et al., 2010).
Most of CMT disease has been reported to be caused by nonsensemutations or frameshift that is supposed toproduce loss-of-function trun-cated proteins. By silencing GDAP1, we try to simulate a partial loss offunction by reducing the amount of protein. Although still speculativethese results provide new ways to investigate the pathophysiology ofCharcot–Marie–Tooth disease. These changes could be the basis for theaxonal neurodegeneration associated to CMT produced by GDAP1mutations that may impair axonal mitochondrial positioning and trans-port. Interestingly, alterations in synaptic transmission have also beensuggested for CMT2A neuropathy caused by mutations in the MFN2gene (de Brito and Scorrano, 2008; Misko et al., 2012).
We clearly show that GDAP1 deficiency impairs SOCE activity anddecreases Ca2+ entry in mitochondria following store-operated calciumentry. As neither Ca2+ uptake in isolatedmitochondria normitochondrialCa2+ handling of ER calcium is modified in GDAP1-silenced cells, GDAP1deficiency appears to have a specific effect on mitochondrial handling ofCa2+ entering through SOCE. Our data suggest that the defect in SOCEmay be caused by the altered mitochondrial network distribution inGDAP1-deficient cells, and the failure of GDAP1-deficient mitochondriatomove towards the subplasmalemmal domain upon ER-Ca2+ emptyingand SOCE activation, which would cause Ca2+-inactivation of SOCE. Thisdoes not exclude a direct effect of GDAP1 deficiency on the SOCEmecha-nism itself as reported for mitofusin 2 mutants (Singaravelu et al., 2011),
whichwould also result in a decrease inmitochondrial uptake of Ca2+en-tering through SOCE.
In neurons, the mechanism of Ca2+ store refilling after intracellularCa2+ release was initially thought to depend on any of the plasmamembrane Ca2+ entry mechanisms present in these cells. However,STIM1 and Orai1 have been shown to function as SOCE downstream ofIP3-mediated Ca2+ release in Drosophila flight neurons and mammaliansensory neurons (Gemes et al., 2011; Venkiteswaran and Hasan, 2009).The fact that STIM1 recruitment to the plasma membrane after Ca2+
release from intracellular stores has opposing actions on Orai1 (activationof SOCE) and Cav1.2, theα subunit of L-type Ca2+ channels (inhibition ofchannel activity) (Park et al., 2010) may explain why SOCE channels arespecifically recruited in neurons to replenish intracellular Ca2+ stores.Interference with SOCE may deplete intracellular Ca2+ stores in sensoryneurons and results in abnormal flight initiation and maintenance inDrosophila (Venkiteswaran and Hasan, 2009). This raises the possibilitythat impaired SOCE activity in GDAP1-deficient neuronsmay be involvedin altered vertebrate peripheral nervous system function in CMT.
Mitochondria–ER apposition is necessary for Ca2+ buffering and sig-naling in cell physiology and to maintain the interorganelle functionspostulated by the microdomain theory (Csordas et al., 2010;Giacomello et al., 2010; Rizzuto et al., 2009).We now show a new inter-relation between mitochondrial retrograde–anterograde movementand mitochondria–ER localization. GDAP1 has an important role inthese biological processes and may gauge the molecular relationshipbetween mitochondrial dynamics and microtubule-mediated traffick-ing both to tether mitochondria and ER (de Brito and Scorrano, 2010)and to position mitochondria near calcium microdomains (Quintanaet al., 2011) (Fig. 7A). Depletion of GDAP1 may affect the proper mito-chondrial network distribution, its relationship with the ER, and its po-sitioning near subplasmalemmal regions which may impair the SOCEprocess and Ca2+ ER refilling (Fig. 7B). It is also tentative to proposethat dominantmutationsmay have a dominant-negative effect bymod-ifying the behavior of mitochondria within the microtubule network
Fig. 7. A proposedmodel for GDAP1 function. (A) The scheme shows GDAP1 participation in both retrograde and anterogrademovementsmediated by RAB6B and caytaxin, respectively,which allowsmitochondria to be positioned at Ca2+microdomains between ER and plasmamembrane. (B, C)Mitochondrial movementmight be affected by the absence ofGDAP1 in thecase of null mutations (B) or by retention of mitochondria in the case of missense mutations by a dominant-negative mechanism (C). In both cases interaction of mitochondria withmicrotubule network and trafficking is modified, which might affect the proper mitochondrial localization at the subplasmalemmal microdomains affecting SOCE activity. This figurewas produced using ServierMedical Art (http://www.servier.com/serviermedical-art/powerpoint-image-bank).
150 D. Pla-Martín et al. / Neurobiology of Disease 55 (2013) 140–151

Author's personal copy
and axonal transport, and by reducing proper juxtaposition betweenmitochondria and ER (Fig. 7C). We propose that both the abnormal mi-tochondria distribution and its impact in Ca2+ homeostasis could un-derlie the pathogenesis of GDAP1-related CMT disease, an aspect thatneeds further studies in rodent disease models to be confirmed.
Supplementary data to this article can be found online at http://dx.doi.org/10.1016/j.nbd.2013.03.010.
Conflict of interest
The authors declare no competing financial interests.
Acknowledgments
We thank Prof. P. Sanz, Institute of Biomedicine of Valencia, foradvising on the 2-hybrid screening and gift TAT7 strain and pBTMcloning vector. This work has been funded by grants from the SpanishMinistry of Science and Innovation SAF2009-07063 (to F.P.) andBFU2011-30456-C02-01/BMC (to J.S.), the Generalitat ValencianaPrometeo Programme 2009/059 (to F.P.), the Comunidad de MadridS2010/BMD-2402 MITOLAB-CM (to J.S.), by an institutional grant fromthe FundaciónRamónAreces to the Centro de BiologíaMolecular SeveroOchoa, and the Collaborative Joint Project awarded by IRDiRC andfunded by ISCIII grant IR11/TREAT-CMT, Instituto de Salud Carlos III(to both F.P. and J.S.). This work has also been funded by the CIBERER,an initiative from the Instituto de Salud Carlos III, the INGENIO 2010programme. A.E. has a “Sara Borrell” postdoctoral contract from theInstituto de Salud Carlos III, J.T. has a postdoctoral contract from theComunidad de Madrid, PG-S has a starting PhD fellowship fromCIBERER, and D.P-M. and C.B.R. have FPI and FPU fellowships, respec-tively, from the Spanish Ministry of Science and Innovation.
References
Abramoff, M.D., Viergever, M.A., 2002. Computation and visualization of three-dimensional soft tissue motion in the orbit. IEEE Trans. Med. Imaging 21, 296–304.
Aoyama, T., et al., 2009. Cayman ataxia protein caytaxin is transported by kinesin alongneurites through binding to kinesin light chains. J. Cell Sci. 122, 4177–4185.
Baxter, R.V., et al., 2002. Ganglioside-induced differentiation-associated protein-1 ismutant in Charcot–Marie–Tooth disease type 4A/8q21. Nat. Genet. 30, 21–22.
Bolte, S., Cordelieres, F.P., 2006. A guided tour into subcellular colocalization analysis inlight microscopy. J. Microsc. 224, 213–232.
Braathen, G.J., et al., 2011. Genetic epidemiology of Charcot–Marie–Tooth in the generalpopulation. Eur. J. Neurol. 18, 39–48.
Bravo, R., et al., 2011. Increased ER–mitochondrial coupling promotes mitochondrialrespiration and bioenergetics during early phases of ER stress. J. Cell Sci. 124,2143–2152.
Brini, M., et al., 1995. Transfected aequorin in the measurement of cytosolic Ca2+
concentration ([Ca2+]c). A critical evaluation. J. Biol. Chem. 270, 9896–9903.Cardenas, C., et al., 2010. Essential regulation of cell bioenergetics by constitutive InsP3
receptor Ca2+ transfer to mitochondria. Cell 142, 270–283.Claramunt, R., et al., 2005. Genetics of Charcot–Marie–Tooth disease type 4A: mutations,
inheritance, phenotypic variability, and founder effect. J. Med. Genet. 42, 358–365.Combarros, O., et al., 1987. Prevalence of hereditary motor and sensory neuropathy in
Cantabria. Acta Neurol. Scand. 75, 9–12.Csordas, G., et al., 2010. Imaging interorganelle contacts and local calcium dynamics at
the ER–mitochondrial interface. Mol. Cell 39, 121–132.Cuesta, A., et al., 2002. The gene encoding ganglioside-induced differentiation-
associated protein 1 is mutated in axonal Charcot–Marie–Tooth type 4A disease.Nat. Genet. 30, 22–25.
Dagda, R.K., et al., 2009. Loss of PINK1 function promotes mitophagy through effects onoxidative stress and mitochondrial fission. J. Biol. Chem. 284, 13843–13855.
de Brito, O.M., Scorrano, L., 2008. Mitofusin 2 tethers endoplasmic reticulum to mito-chondria. Nature 456, 605–610.
de Brito, O.M., Scorrano, L., 2010. An intimate liaison: spatial organization of the endo-plasmic reticulum–mitochondria relationship. EMBO J. 29, 2715–2723.
Deinhardt, K., et al., 2006. Rab5 and Rab7 control endocytic sorting along the axonalretrograde transport pathway. Neuron 52, 293–305.
Estela, A., et al., 2011. Charcot–Marie–Tooth-related gene GDAP1 complements cellcycle delay at G2/M phase in Saccharomyces cerevisiae fis1 gene-defective cells.J. Biol. Chem. 286, 36777–36786.
Fields, S., Song, O., 1989. A novel genetic system to detect protein–protein interactions.Nature 340, 245–246.
Fukuda, M., Yamamoto, A., 2005. Assay of the Rab-binding specificity of rabphilin andNoc2: target molecules for Rab27. Methods Enzymol. 403, 469–481.
Gemes, G., et al., 2011. Store-operated Ca2+ entry in sensory neurons: functional roleand the effect of painful nerve injury. J. Neurosci. 31, 3536–3549.
Giacomello, M., et al., 2010. Ca2+ hot spots on the mitochondrial surface are generatedby Ca2+ mobilization from stores, but not by activation of store-operated Ca2+
channels. Mol. Cell 38, 280–290.Lupo, V., et al., 2009. Missense mutations in the SH3TC2 protein causing Charcot–
Marie–Tooth disease type 4C affect its localization in the plasma membrane andendocytic pathway. Hum. Mol. Genet. 18, 4603–4614.
Majumder, P., et al., 2007. New insights into purinergic receptor signaling in neuronaldifferentiation, neuroprotection, and brain disorders. Purinergic Signal 3, 317–331.
Marco, A., et al., 2004. Evolutionary and structural analyses of GDAP1, involved in Charcot–Marie–Tooth disease, characterize a novel class of glutathione transferase-relatedgenes. Mol. Biol. Evol. 21, 176–187.
Matanis, T., et al., 2002. Bicaudal-D regulates COPI-independent Golgi–ER transport byrecruiting the dynein–dynactin motor complex. Nat. Cell Biol. 4, 986–992.
Mattson, M.P., 2007. Calcium and neurodegeneration. Aging Cell 6, 337–350.Misko, A.L., et al., 2012. Mitofusin2 mutations disrupt axonal mitochondrial positioning
and promote axon degeneration. J. Neurosci. 32, 4145–4155.Montero, M., et al., 1997. [Ca2+] microdomains control agonist-induced Ca2+ release
in intact HeLa cells. FASEB J. 11, 881–885.Montero, M., et al., 2000. Chromaffin-cell stimulation triggers fast millimolar mito-
chondrial Ca2+ transients that modulate secretion. Nat. Cell Biol. 2, 57–61.Moreno, D., et al., 2009. Two-hybrid analysis identifies PSMD11, a non-ATPase subunit
of the proteasome, as a novel interaction partner of AMP-activated protein kinase.Int. J. Biochem. Cell Biol. 41, 2431–2439.
Naghdi, S., et al., 2010. Mitochondrial Ca2+ uptake and not mitochondrial motility is re-quired for STIM1-Orai1-dependent store-operated Ca2+ entry. J. Cell Sci. 123,2553–2564.
Niemann, A., et al., 2005. Ganglioside-induced differentiation associated protein 1 is aregulator of the mitochondrial network: new implications for Charcot–Marie–Tooth disease. J. Cell Biol. 170, 1067–1078.
Niemann, A., et al., 2009. GDAP1mutations differ in their effects onmitochondrial dynam-ics and apoptosis depending on the mode of inheritance. Neurobiol. Dis. 36, 509–520.
Opdam, F.J., et al., 2000. The small GTPase Rab6B, a novel Rab6 subfamily member, iscell-type specifically expressed and localised to the Golgi apparatus. J. Cell Sci.113, 2725–2735.
Park, C.Y., et al., 2010. The CRAC channel activator STIM1 binds and inhibits L-typevoltage-gated calcium channels. Science 330, 101–105.
Pedrola, L., et al., 2005. GDAP1, the protein causing Charcot–Marie–Tooth disease type4A, is expressed in neurons and is associated with mitochondria. Hum. Mol. Genet.14, 1087–1094.
Pedrola, L., et al., 2008. Cell expression of GDAP1 in the nervous system and pathogenesisof Charcot–Marie–Tooth type 4A disease. J. Cell Mol. Med. 12, 679–689.
Putney, J.W., 2009. Capacitative calcium entry: from concept to molecules. Immunol.Rev. 231, 10–22.
Quintana, A., et al., 2011. Calcium microdomains at the immunological synapse: howORAI channels, mitochondria and calcium pumps generate local calcium signalsfor efficient T-cell activation. EMBO J. 30, 3895–3912.
Rizzuto, R., et al., 1992. Rapid changes of mitochondrial Ca2+ revealed by specificallytargeted recombinant aequorin. Nature 358, 325–327.
Rizzuto, R., et al., 2009. Ca(2+) transfer from the ER to mitochondria: when, how andwhy. Biochim. Biophys. Acta 1787, 1342–1351.
Rizzuto, R., et al., 2012. Mitochondria as sensors and regulators of calcium signalling.Nat. Rev. 13, 566–578.
Roberts, R.C., et al., 2010. Mistargeting of SH3TC2 away from the recycling endosomecauses Charcot–Marie–Tooth disease type 4C. Hum. Mol. Genet. 19, 1009–1018.
Ruiz, F., et al., 1998. Protection by pyruvate and malate against glutamate-mediatedneurotoxicity. Neuroreport 9, 1277–1282.
Shprung, T., Gozes, I., 2009. A novel method for analyzing mitochondrial movement: inhi-bition by paclitaxel in a pheochromocytoma cell model. J. Mol. Neurosci. 37, 254–262.
Singaravelu, K., et al., 2011. Mitofusin 2 regulates STIM1 migration from the Ca2+ storeto the plasma membrane in cells with depolarized mitochondria. J. Biol. Chem. 286,12189–12201.
Sivera, R., et al., 2010. Phenotypical features of the p.R120W mutation in the GDAP1gene causing autosomal dominant Charcot–Marie–Tooth disease. J. Peripher.Nerv. Syst. 15, 334–344.
Skre, H., 1974. Genetic and clinical aspects of Charcot–Marie–Tooth's disease. Clin.Genet. 6, 98–118.
Stendel, C., et al., 2010. SH3TC2, a protein mutant in Charcot–Marie–Tooth neuropathy,links peripheral nerve myelination to endosomal recycling. Brain 133, 2462–2474.
Stenmark, H., 2009. Rab GTPases as coordinators of vesicle traffic. Nat. Rev. 10, 513–525.Traba, J., et al., 2012. SCaMC-1 promotes cancer cell survival by desensitizing mito-
chondrial permeability transition via ATP/ADP-mediated matrix Ca(2+) buffering.Cell Death Differ. 19, 650–660.
Van Acker, K., et al., 2002. IP(3)-mediated Ca(2+) signals in human neuroblastoma SH-SY5Y cells with exogenous overexpression of type 3 IP(3) receptor. Cell Calcium 32,71–81.
Venkiteswaran, G., Hasan, G., 2009. Intracellular Ca2+ signaling and store-operated Ca2+
entry are required in Drosophila neurons for flight. Proc. Natl. Acad. Sci. U. S. A. 106,10326–10331.
Wanschers, B.F., et al., 2007. A role for the Rab6B Bicaudal–D1 interaction in retrogradetransport in neuronal cells. Exp. Cell Res. 313, 3408–3420.
Wieckowski, M.R., et al., 2009. Isolation of mitochondria-associated membranes andmitochondria from animal tissues and cells. Nat. Protoc. 4, 1582–1590.
Zhao, Y., et al., 2011. An expanded palette of genetically encoded Ca(2) indicators.Science 333, 1888–1891.
151D. Pla-Martín et al. / Neurobiology of Disease 55 (2013) 140–151


![K+ and Ca2+ channel activity and cytosolic [Ca2+] in oxygen-sensing tissues](https://img.pdfslide.net/doc/110x75/63480d3009e11fdd740a92ad/k-and-ca2-channel-activity-and-cytosolic-ca2-in-oxygen-sensing-tissues.jpg)


