Embed Size (px)
Citation preview

Montana Tech Library Montana Tech Library
Digital Commons @ Montana Tech Digital Commons @ Montana Tech
Graduate Theses & Non-Theses Student Scholarship
Spring 2021
POST-RECLAMATION AND PRE-MINING GEOCHEMISTRY OF THE POST-RECLAMATION AND PRE-MINING GEOCHEMISTRY OF THE
GALENA CREEK WATERSHED IN THE BARKER-HUGHESVILLE GALENA CREEK WATERSHED IN THE BARKER-HUGHESVILLE
MINING DISTRICT, JUDITH BASIN COUNTY, MONTANA MINING DISTRICT, JUDITH BASIN COUNTY, MONTANA
Austin Neaville
Follow this and additional works at: https://digitalcommons.mtech.edu/grad_rsch

POST-RECLAMATION AND PRE-MINING GEOCHEMISTRY OF THE
GALENA CREEK WATERSHED IN THE BARKER-HUGHESVILLE
MINING DISTRICT, JUDITH BASIN COUNTY, MONTANA
by
Austin C. Neaville
A thesis submitted in partial fulfillment of the
requirements for the degree of
Master of Science: Geoscience
Montana Tech
2021
ii
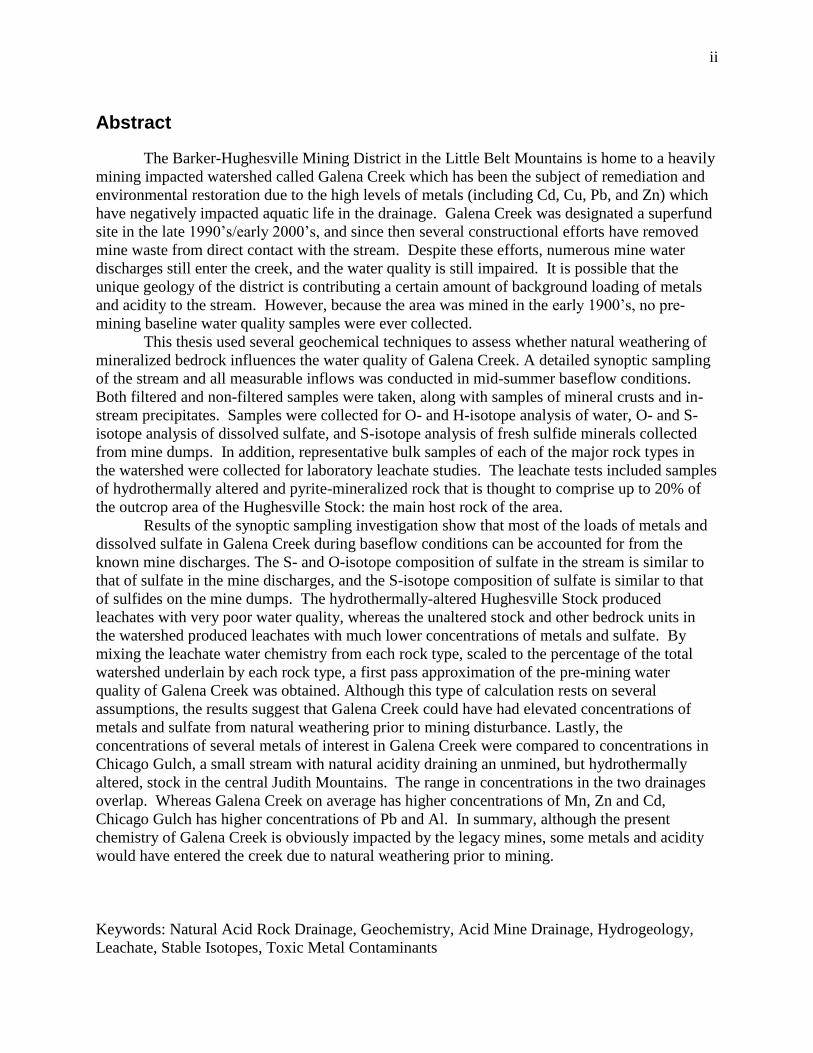
Abstract
The Barker-Hughesville Mining District in the Little Belt Mountains is home to a heavily
mining impacted watershed called Galena Creek which has been the subject of remediation and
environmental restoration due to the high levels of metals (including Cd, Cu, Pb, and Zn) which
have negatively impacted aquatic life in the drainage. Galena Creek was designated a superfund
site in the late 1990’s/early 2000’s, and since then several constructional efforts have removed
mine waste from direct contact with the stream. Despite these efforts, numerous mine water
discharges still enter the creek, and the water quality is still impaired. It is possible that the
unique geology of the district is contributing a certain amount of background loading of metals
and acidity to the stream. However, because the area was mined in the early 1900’s, no pre-
mining baseline water quality samples were ever collected.
This thesis used several geochemical techniques to assess whether natural weathering of
mineralized bedrock influences the water quality of Galena Creek. A detailed synoptic sampling
of the stream and all measurable inflows was conducted in mid-summer baseflow conditions.
Both filtered and non-filtered samples were taken, along with samples of mineral crusts and in-
stream precipitates. Samples were collected for O- and H-isotope analysis of water, O- and S-
isotope analysis of dissolved sulfate, and S-isotope analysis of fresh sulfide minerals collected
from mine dumps. In addition, representative bulk samples of each of the major rock types in
the watershed were collected for laboratory leachate studies. The leachate tests included samples
of hydrothermally altered and pyrite-mineralized rock that is thought to comprise up to 20% of
the outcrop area of the Hughesville Stock: the main host rock of the area.
Results of the synoptic sampling investigation show that most of the loads of metals and
dissolved sulfate in Galena Creek during baseflow conditions can be accounted for from the
known mine discharges. The S- and O-isotope composition of sulfate in the stream is similar to
that of sulfate in the mine discharges, and the S-isotope composition of sulfate is similar to that
of sulfides on the mine dumps. The hydrothermally-altered Hughesville Stock produced
leachates with very poor water quality, whereas the unaltered stock and other bedrock units in
the watershed produced leachates with much lower concentrations of metals and sulfate. By
mixing the leachate water chemistry from each rock type, scaled to the percentage of the total
watershed underlain by each rock type, a first pass approximation of the pre-mining water
quality of Galena Creek was obtained. Although this type of calculation rests on several
assumptions, the results suggest that Galena Creek could have had elevated concentrations of
metals and sulfate from natural weathering prior to mining disturbance. Lastly, the
concentrations of several metals of interest in Galena Creek were compared to concentrations in
Chicago Gulch, a small stream with natural acidity draining an unmined, but hydrothermally
altered, stock in the central Judith Mountains. The range in concentrations in the two drainages
overlap. Whereas Galena Creek on average has higher concentrations of Mn, Zn and Cd,
Chicago Gulch has higher concentrations of Pb and Al. In summary, although the present
chemistry of Galena Creek is obviously impacted by the legacy mines, some metals and acidity
would have entered the creek due to natural weathering prior to mining.
Keywords: Natural Acid Rock Drainage, Geochemistry, Acid Mine Drainage, Hydrogeology,
Leachate, Stable Isotopes, Toxic Metal Contaminants

iii
Dedication
This work is dedicated to my mother, sister, father, and family as well as the friends and mentors
who believed in me. Without them and their support I would not have made it this far.

iv
Acknowledgements
Thanks to Wood PLC in Helena, MT and the Doe Run Resources Corporation for funding lab
work as well as the USEPA and MTDEQ for their assistance and information. I also want to
thank Ashley Huft, Jackie Timmer, and the Montana Bureau of Mines and Geology laboratory
for analyzing water samples needed. Lastly, I want to thank my advisor Dr. Chris Gammons and
my committee members Dr. Brian St Clair and Dr. Raja Nagisetty for their support and
mentorship.
v
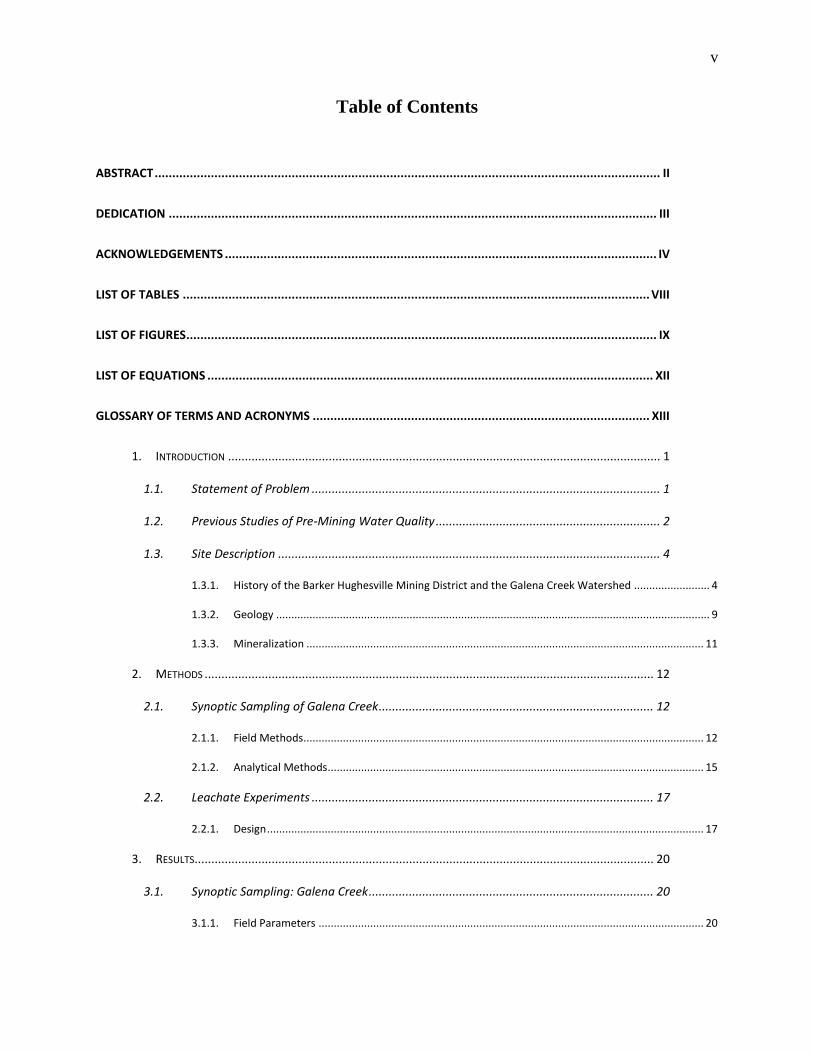
Table of Contents
ABSTRACT ................................................................................................................................................ II
DEDICATION ........................................................................................................................................... III
ACKNOWLEDGEMENTS ........................................................................................................................... IV
LIST OF TABLES ..................................................................................................................................... VIII
LIST OF FIGURES ...................................................................................................................................... IX
LIST OF EQUATIONS ............................................................................................................................... XII
GLOSSARY OF TERMS AND ACRONYMS ................................................................................................ XIII
1. INTRODUCTION ................................................................................................................................. 1
1.1. Statement of Problem ........................................................................................................ 1
1.2. Previous Studies of Pre-Mining Water Quality ................................................................... 2
1.3. Site Description .................................................................................................................. 4
1.3.1. History of the Barker Hughesville Mining District and the Galena Creek Watershed ......................... 4
1.3.2. Geology ............................................................................................................................................... 9
1.3.3. Mineralization ................................................................................................................................... 11
2. METHODS ...................................................................................................................................... 12
2.1. Synoptic Sampling of Galena Creek .................................................................................. 12
2.1.1. Field Methods.................................................................................................................................... 12
2.1.2. Analytical Methods ............................................................................................................................ 15
2.2. Leachate Experiments ...................................................................................................... 17
2.2.1. Design ................................................................................................................................................ 17
3. RESULTS ......................................................................................................................................... 20
3.1. Synoptic Sampling: Galena Creek ..................................................................................... 20
3.1.1. Field Parameters ............................................................................................................................... 20
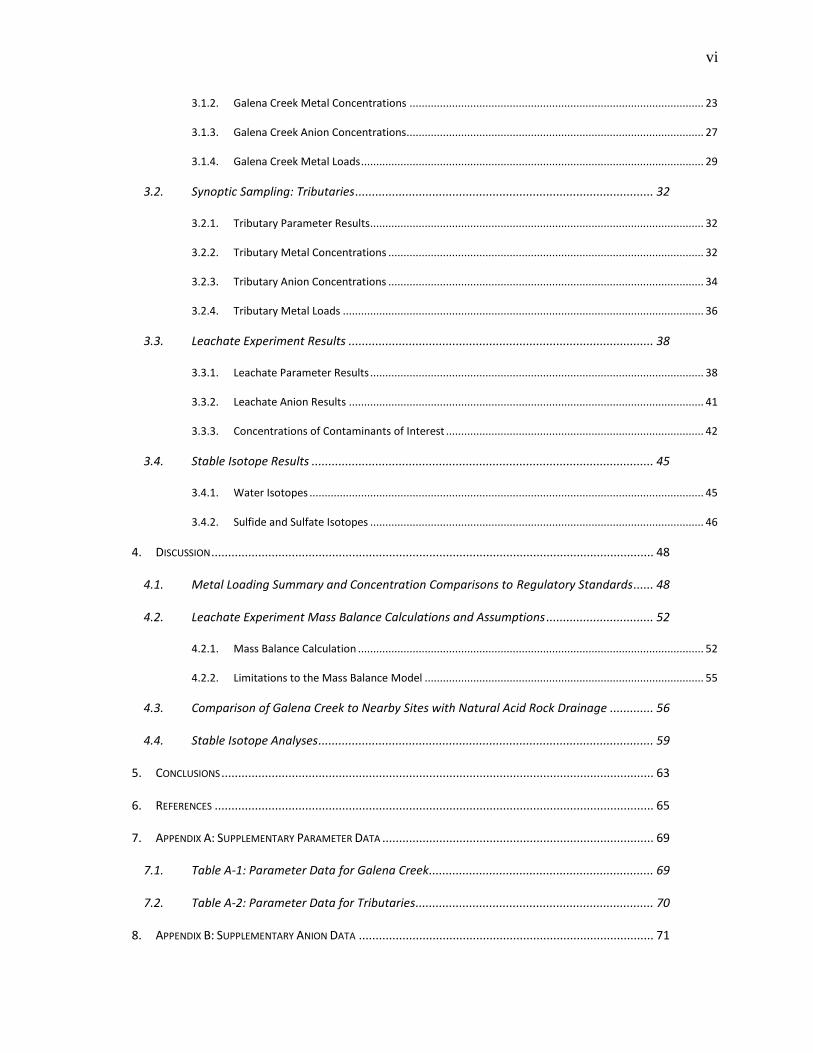
vi
3.1.2. Galena Creek Metal Concentrations ................................................................................................. 23
3.1.3. Galena Creek Anion Concentrations.................................................................................................. 27
3.1.4. Galena Creek Metal Loads ................................................................................................................. 29
3.2. Synoptic Sampling: Tributaries ......................................................................................... 32
3.2.1. Tributary Parameter Results.............................................................................................................. 32
3.2.2. Tributary Metal Concentrations ........................................................................................................ 32
3.2.3. Tributary Anion Concentrations ........................................................................................................ 34
3.2.4. Tributary Metal Loads ....................................................................................................................... 36
3.3. Leachate Experiment Results ........................................................................................... 38
3.3.1. Leachate Parameter Results .............................................................................................................. 38
3.3.2. Leachate Anion Results ..................................................................................................................... 41
3.3.3. Concentrations of Contaminants of Interest ..................................................................................... 42
3.4. Stable Isotope Results ...................................................................................................... 45
3.4.1. Water Isotopes .................................................................................................................................. 45
3.4.2. Sulfide and Sulfate Isotopes .............................................................................................................. 46
4. DISCUSSION .................................................................................................................................... 48
4.1. Metal Loading Summary and Concentration Comparisons to Regulatory Standards ...... 48
4.2. Leachate Experiment Mass Balance Calculations and Assumptions ................................ 52
4.2.1. Mass Balance Calculation .................................................................................................................. 52
4.2.2. Limitations to the Mass Balance Model ............................................................................................ 55
4.3. Comparison of Galena Creek to Nearby Sites with Natural Acid Rock Drainage ............. 56
4.4. Stable Isotope Analyses .................................................................................................... 59
5. CONCLUSIONS ................................................................................................................................. 63
6. REFERENCES ................................................................................................................................... 65
7. APPENDIX A: SUPPLEMENTARY PARAMETER DATA ................................................................................. 69
7.1. Table A-1: Parameter Data for Galena Creek ................................................................... 69
7.2. Table A-2: Parameter Data for Tributaries....................................................................... 70
8. APPENDIX B: SUPPLEMENTARY ANION DATA ........................................................................................ 71

vii
8.1. Table B-1: Anion Data for Galena Creek .......................................................................... 71
8.2. Table B-2: Anion Data for Tributaries .............................................................................. 71
9. APPENDIX C: SUPPLEMENTAL DATA-GALENA CREEK SYNOPTIC STUDY ....................................................... 72
9.1. Table C-1 ICP-MS Results .................................................................................................. 72
9.2. Table C-2 ICP-MS Quality Assurance ................................................................................ 77
9.3. Table C-3 ICP-OES Results ................................................................................................ 80
10. APPENDIX D: SUPPLEMENTAL DATA-LEACHATE EXPERIMENT ................................................................... 83
10.1. Table D-1 Leachate ICP-MS Results .................................................................................. 83
10.2. Table D-2 Leachate ICP-MS Quality Assurance ................................................................ 88
10.3. Table D-3 ICP-OES Results ................................................................................................ 91
11. APPENDIX E: IN-STREAM PRECIPITATE DATA (XRF) ................................................................................ 94
11.1. Table E-1 XRF data for in stream precipitate samples for notable metals ....................... 94
11.2. Table E-2 XRF data (mg/kg) for Mn-oxide and Fe-oxide crusts on boulders in the streambed
95
11.3. Table E-3 XRF analyses of samples used in leachate studies (mg/kg) .............................. 97
12. APPENDIX F: PHOTOGRAPHS .............................................................................................................. 98
12.1. Figure F1 Representative Hand Samples for Leachate Experiments ................................ 98
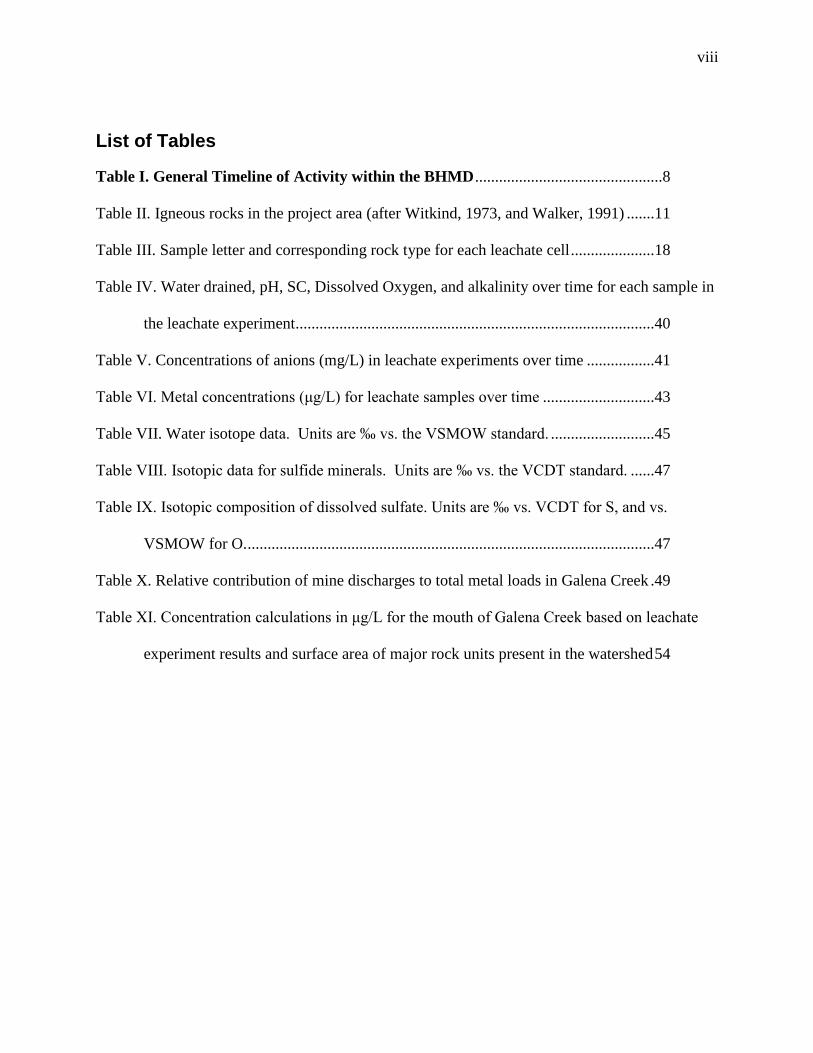
viii
List of Tables
Table I. General Timeline of Activity within the BHMD ...............................................8
Table II. Igneous rocks in the project area (after Witkind, 1973, and Walker, 1991) .......11
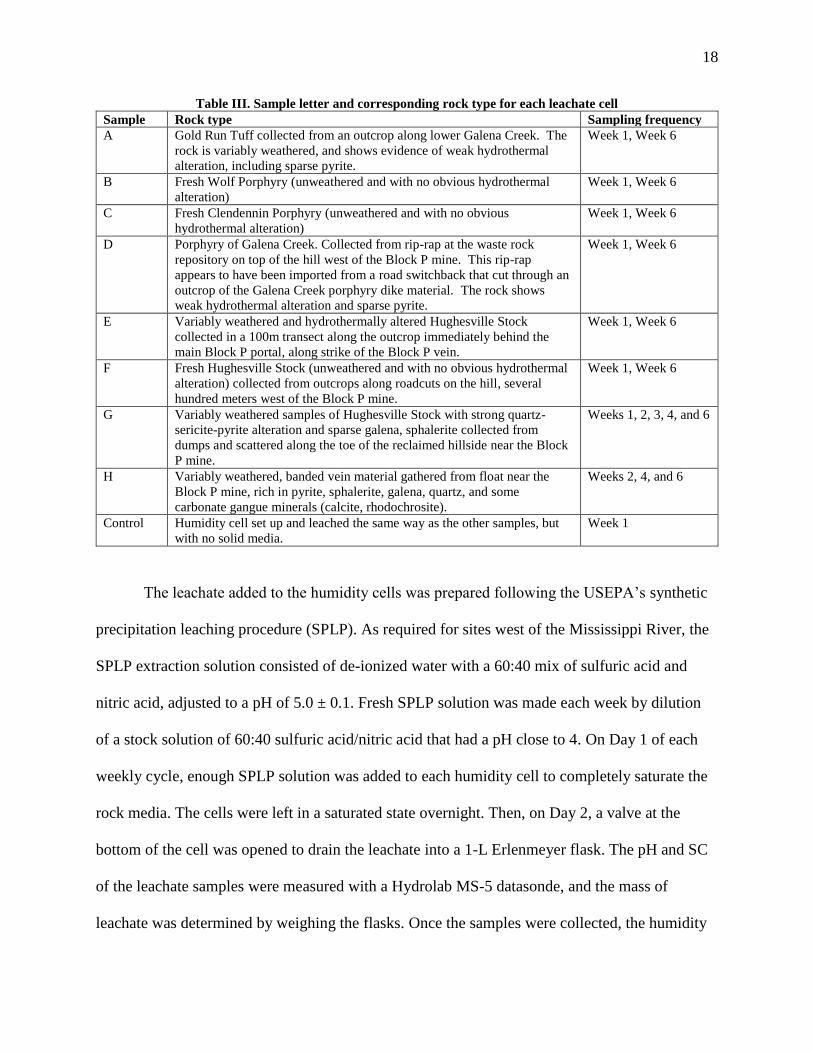
Table III. Sample letter and corresponding rock type for each leachate cell .....................18
Table IV. Water drained, pH, SC, Dissolved Oxygen, and alkalinity over time for each sample in
the leachate experiment..........................................................................................40
Table V. Concentrations of anions (mg/L) in leachate experiments over time .................41
Table VI. Metal concentrations (μg/L) for leachate samples over time ............................43
Table VII. Water isotope data. Units are ‰ vs. the VSMOW standard. ..........................45
Table VIII. Isotopic data for sulfide minerals. Units are ‰ vs. the VCDT standard. ......47
Table IX. Isotopic composition of dissolved sulfate. Units are ‰ vs. VCDT for S, and vs.
VSMOW for O. ......................................................................................................47
Table X. Relative contribution of mine discharges to total metal loads in Galena Creek .49
Table XI. Concentration calculations in μg/L for the mouth of Galena Creek based on leachate
experiment results and surface area of major rock units present in the watershed 54

ix
List of Figures
Figure 1. Location of the study area in the Little Belt Mountains, Montana (Witkind 1973)
..................................................................................................................................5
Figure 2. Map of the Galena Creek watershed showing topography, tributary streams, and the
location of the Block P mine. Other abandoned mines are shown in Figure 3. ......6
Figure 3 Location of mine sites within the middle and upper reaches of the Galena Creek
watershed (CDM Smith 2016) .................................................................................7
Figure 4. Geologic map of the study area (after Walker, 1991). Letters (A through H) show
locations of bulk sample collection for leaching tests. ..........................................10
Figure 5. Sampling Locations for Synoptic Field Event at Galena Creek Watershed in BHMD
conducted in July 2020. .........................................................................................12
Figure 6. Flows of Galena Creek (top) and tributaries (bottom) measured during the synoptic
sampling event. Units are L/sec. ............................................................................21
Figure 7. pH, SC, and alkalinity trends in Galena Creek. Tributary inflows are shown with
arrows. ....................................................................................................................22
Figure 8. Dissolved concentrations (µg/L) for contaminants of interest in Galena Creek. Dashed
lines show the location of significant mine discharges. .........................................24
Figure 9. Dissolved concentrations (µg/L) for contaminants of interest in Galena Creek. Dashed
lines show the location of significant tributary streams. ........................................25
Figure 10. Total (unfiltered) vs. dissolved (filtered) metal concentrations for contaminants of
interest in Galena Creek. ........................................................................................26

x
Figure 11. Fluoride (top), chloride (middle), and sulfate (bottom) data in mg/L vs. distance
downstream (m) with reference to significant mine and creek tributary locations and
Galena Creek sampling stations. ............................................................................28
Figure 12. Dissolved load results for Galena Creek samples (mg/min) for each contaminant
metals of interest with reference to significant mine remnant locations and distance
downstream (m). ....................................................................................................30
Figure 13. Dissolved load results for Galena Creek samples (mg/min) for each contaminant
metals of interest with reference to significant creek tributary locations and distance
downstream (m). ....................................................................................................31
Figure 14. pH values for tributaries and mine seeps. .........................................................32
Figure 15. Dissolved concentrations of contaminants of interest in tributary samples. ....33
Figure 16. Anion concentrations (mg/L) for tributary samples. ........................................35
Figure 17. Loads (mg/min) of contaminants of interest in tributary samples. ...................37
Figure 18. pH and SC over time for leachate rock sample experiments. ...........................39
Figure 19. Concentrations of contaminants of interest in leachates from mineralized rock samples
G, H, and F over time.............................................................................................44
Figure 20. Isotopic composition of water samples from Galena Creek and tributaries. The global
meteoric water line (MWL) and Butte MWL are from Craig (1961) and Gammons and
others (2006). .........................................................................................................46
Figure 21. Total metal loads for contaminants of interest compared to the metal load of the
mouth of Galena Creek (Cu, Al, Fe, Tl). ...............................................................50
Figure 22. Total metal loads for contaminants of interest compared to the metal load of the
mouth of Galena Creek (As, Mn, Cd, Pb)..............................................................50
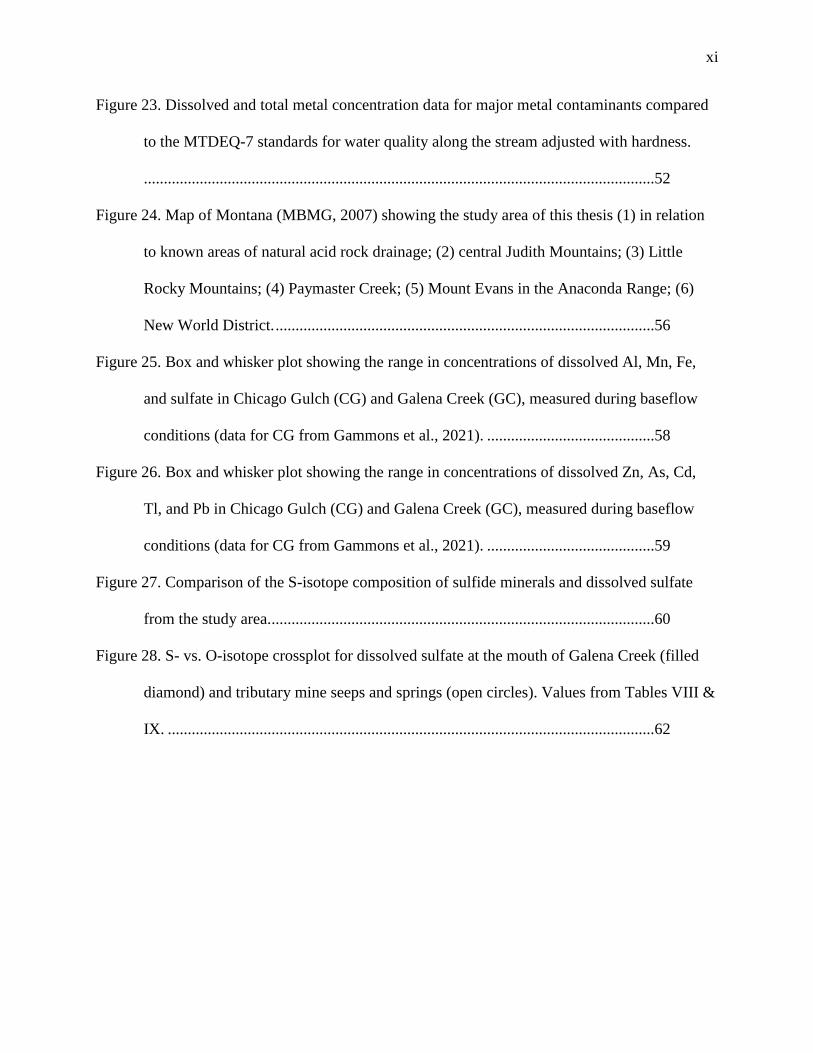
xi
Figure 23. Dissolved and total metal concentration data for major metal contaminants compared
to the MTDEQ-7 standards for water quality along the stream adjusted with hardness.
................................................................................................................................52
Figure 24. Map of Montana (MBMG, 2007) showing the study area of this thesis (1) in relation
to known areas of natural acid rock drainage; (2) central Judith Mountains; (3) Little
Rocky Mountains; (4) Paymaster Creek; (5) Mount Evans in the Anaconda Range; (6)
New World District. ...............................................................................................56
Figure 25. Box and whisker plot showing the range in concentrations of dissolved Al, Mn, Fe,
and sulfate in Chicago Gulch (CG) and Galena Creek (GC), measured during baseflow
conditions (data for CG from Gammons et al., 2021). ..........................................58
Figure 26. Box and whisker plot showing the range in concentrations of dissolved Zn, As, Cd,
Tl, and Pb in Chicago Gulch (CG) and Galena Creek (GC), measured during baseflow
conditions (data for CG from Gammons et al., 2021). ..........................................59
Figure 27. Comparison of the S-isotope composition of sulfide minerals and dissolved sulfate
from the study area.................................................................................................60
Figure 28. S- vs. O-isotope crossplot for dissolved sulfate at the mouth of Galena Creek (filled
diamond) and tributary mine seeps and springs (open circles). Values from Tables VIII &
IX. ..........................................................................................................................62

xii
List of Equations
Equation 1. Mass Balance: Leachate .................................................................................52
Equation 2. Differing Chemical Reactions for Pyrite Oxidation at high and low pH .......60
xiii
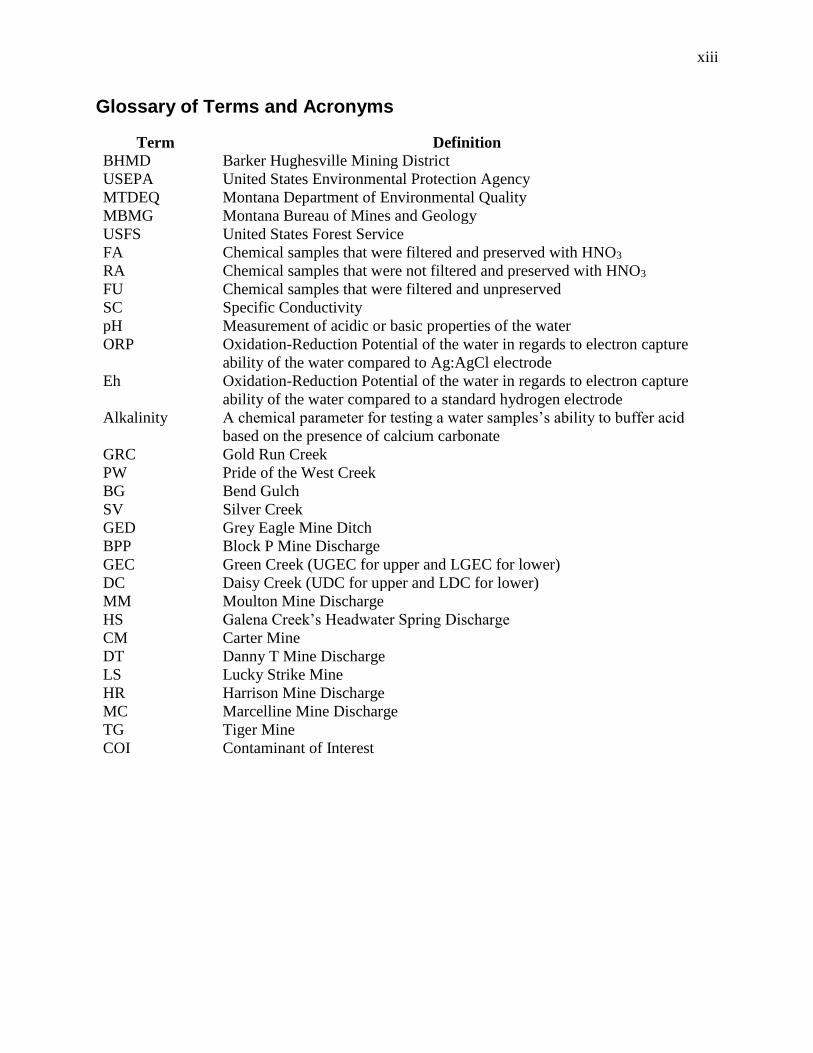
Glossary of Terms and Acronyms
Term Definition
BHMD Barker Hughesville Mining District
USEPA United States Environmental Protection Agency
MTDEQ Montana Department of Environmental Quality
MBMG Montana Bureau of Mines and Geology
USFS United States Forest Service
FA Chemical samples that were filtered and preserved with HNO3
RA Chemical samples that were not filtered and preserved with HNO3 FU Chemical samples that were filtered and unpreserved
SC Specific Conductivity
pH Measurement of acidic or basic properties of the water
ORP Oxidation-Reduction Potential of the water in regards to electron capture
ability of the water compared to Ag:AgCl electrode
Eh Oxidation-Reduction Potential of the water in regards to electron capture
ability of the water compared to a standard hydrogen electrode
Alkalinity A chemical parameter for testing a water samples’s ability to buffer acid
based on the presence of calcium carbonate
GRC Gold Run Creek
PW Pride of the West Creek
BG Bend Gulch
SV Silver Creek
GED Grey Eagle Mine Ditch
BPP Block P Mine Discharge
GEC Green Creek (UGEC for upper and LGEC for lower)
DC Daisy Creek (UDC for upper and LDC for lower)
MM Moulton Mine Discharge
HS Galena Creek’s Headwater Spring Discharge
CM Carter Mine
DT Danny T Mine Discharge
LS Lucky Strike Mine
HR Harrison Mine Discharge
MC Marcelline Mine Discharge
TG Tiger Mine
COI Contaminant of Interest
1
1. Introduction
1.1. Statement of Problem
Knowing the baseline level of background water quality before mining, or other
industrial disturbances, would be advantageous in determining remediation strategies for
watersheds affected by acid-mine drainage (AMD). AMD is intensified by such industrial
operations exposing sulfide surfaces which chemically react with oxygen and water to lower the
pH in streams and increase levels of heavy metals which are toxic to aquatic life. However, in
many cases, it is predicted that a certain level of poor water quality and abnormally high metal
concentrations were present before a significant industrial endeavor. This phenomenon is often
called natural acid rock drainage (NARD) and is defined by the United States Environmental
Protection Agency (USEPA) as “substances or locations that are not influenced by the releases
from a site and are usually described as naturally occurring or anthropogenic” (Nordstrom 2015).
The Galena Creek watershed in the Little Belt Mountains of Montana is a good example
of a stream that is impacted by historic mining, but, for which, no pre-mining water chemistry
data is available. The main objectives of this thesis are: 1) to conduct a detailed synoptic
sampling to quantify sources, concentrations, and loads of contaminants of interest in Galena
Creek; and 2) to combine these data with laboratory leachate tests, stable isotopes, and analog
site comparison to help constrain what the water quality of Galena Creek might have been like
prior to mining.

2
1.2. Previous Studies of Pre-Mining Water Quality
Prior studies of pre-mining water quality have used different geochemical approaches,
including: (1) comparing AMD afflicted watersheds with an analog site that has a similar
geological and hydrological setting and no history of industrial disturbance; (2) detailed synoptic
water sampling to identify and subtract different sources of AMD and NARD with mass balance
calculations; (3) comparing the trace element concentration of pre-mining ferricrete deposits to
modern in-stream precipitates; (4) using stable isotopes of water, sulfide minerals, and sulfate to
trace and discriminate between NARD vs. AMD; and (5) using laboratory leachate studies to
characterize the chemistry of runoff or shallow groundwater interacting with mineralized
bedrock.
Finding an undisturbed “analog” watershed for a mining-impacted watershed can be a
very difficult task. In his review paper, Nordstrom (2015) explains the differences in using
proximal vs. remote analog sites. However, most watersheds that drain mineralized bedrock
close to a mining center have also seen mining disturbances which makes finding analog sites
increasingly difficult. Not only are analog hard to come by but they also do not provide an exact
way to find a baseline level as no sites is going to be precisely the same.
A detailed synoptic sampling investigation, mass balance calculations coupled with
geochemical modeling can sometimes be used to separate NARD sources from AMD sources
(Nordstrom 2015). However, if the two types of sources are mixed over the same stream reach,
separation of what is natural and what is mining-related can be unclear or impossible.
Additionally, this method can rely heavily on decisions made by the modeler which adds a
degree of inaccuracy and uncertainty (Nordstrom 2015).
Ferricrete trace-element analysis provides another potential way of estimating the pre-
modern pH and water quality of streams with NARD (Nimick et al., 2009; Williams et al. 2015;

3
Edinberg 2016; Gammons et al. 2021). This method requires a continuous outcrop of ferricrete
along a stream that experiences a gradual increase in pH: conditions that may not apply to many
field sites. It can be hard to tell if a given ferricrete outcrop formed before or after mining,
especially for complex legacy sites where reclamation activity has changed the physical and
hydrological properties of the stream. Exact dates for the ferrricrete can be obtained if plant
matter is preserved that can be dated by radiocarbon methods (Furniss et al. 1999). However,
fossilized plant matter in ferricretes cannot be dated if the organic carbon has been replaced by
goethite (Edinberg, 2016; Gammons et al., 2021).
Wright and Nordstrom (1999) suggested that the stable isotope composition of dissolved
sulfate might be helpful to separate NARD vs. AMD. This method requires that the O-isotopes
of sulfate coming from NARD are different (usually enriched in 18O) compared to sulfate coming
from AMD. If this can be shown to be the case, then quantifying and separating sources of acid
drainage using stable isotopes can be done at a fraction of the cost of conducting a detailed
synoptic sampling event (Wright and Nordstrom, 1999).
Leachate methods can be used to approximate the chemistry of water draining various
bedrock types. For example, Edinberg (2016) showed that interaction of distilled water with
mineralized bedrock in the Judith Mountains, Montana, produced leachate that had similar
chemistry to headwater streams in the same area. Problems with leachate tests include the need
to collect representative bedrock samples, as well as extrapolation of weathering rates obtained
from controlled laboratory conditions to rates that occur in the natural environment.
As stated by Nordstrom (2015), when approaching the question of what background
chemistry might have been like in mining affected sites, it is best to employ more than one of the
above methods. Each method has its own limitations and using more than one method will
4
typically improve the accuracy of the results, which is important for agencies who need to make
reclamation decisions.
1.3. Site Description
1.3.1. History of the Barker Hughesville Mining District and the Galena Creek Watershed
Galena Creek (GC) is located in the Little Belt Mountains of Montana, approximately 10
miles east of the town of Monarch (Figure 1). Galena Creek is a first order stream that joins the
Dry Fork of Belt Creek, a tributary to Belt Creek and the Missouri River. Galena Creek runs
through the Barker-Hughesville Mining District (BHMD) and has been significantly impacted by
acid-mine drainage associated with the historic mining activities (CDM Smith 2016). The 3.5-
mile-long span of Galena Creek can be divided into three sections (Figure 2): the upper reach
runs from the headwaters to the confluence of Green Creek; the middle reach stretches from the
Green Creek confluence to just below the culvert on the main access road near the town of
Barker; the lower reach ends at the confluence of Galena Creek and the Dry Fork of Belt Creek.
The upper reach of Galena Creek is sometimes marked as Daisy Creek on older topographic
maps. However, as shown in Figure 2, Daisy Creek is a smaller tributary that enters Galena
Creek near the end of the upper reach.
The elevation of Galena Creek ranges from about 6000′ at its mouth to just under 7000′ at
its headwaters (Figure 2). The high point in the watershed is Mixes Baldy Mountain, at 7952′.
Annual precipitation for the field area is 21.4 inches and average annual snowfall is 113 inches
(CDM Smith 2016). The climate is typical for that of Montana’s mountain areas with most
precipitation events happening in the spring season and snowfall in the winter season. The
average baseflow near the mouth of Galena Creek is about 2 cubic feet per second (cfs), with a
recorded range in flow from 0.4 to 30 cfs (CDM Smith 2016). Tributaries to Galena Creek are

5
shown in Figure 2, and include Daisy Creek, Green Creek, Silver Creek, Bend Gulch, Pride of
the West Creek, and Gold Run Creek. Gold Run Creek is by far the largest tributary, nearly
doubling the flow of Galena Creek shortly before it runs into the Dry Fork. The flow of Galena
Creek is also increased by numerous mine discharges, discussed below.
Figure 1. Location of the study area in the Little Belt Mountains, Montana (Witkind 1973)

6
Figure 2. Map of the Galena Creek watershed showing topography, tributary streams, and the location of
the Block P mine. Other abandoned mines are shown in Figure 3.
The mines in the BHMD followed mineralized fissure veins in search of Pb, Zn, and Ag
sulfide ore deposits (Walker 1991, Witkind 1973, Spiroff 1938, Weed 1900). The total value of
the district is estimated at 6 million dollars before mining (Witkind 1973). The largest operation
was the Block P mine which followed the Block P vein 1,500 m deep and 1098 m along strike
(Walker 1991, Spiroff 1938). Block P reached its peak production in 1929 after being purchased
by St. Joseph Lead Co. in 1927 and was the largest producer of lead in Montana at the time
(Spiroff 1928). Block P stopped operation near the depression in 1930 and did not re-open until
1941 during World War II when demand for metals was high. The mine then officially closed
7
just after 1943 because the mine shaft designs did not meet new safety requirements the
government put into place (Walker 1991). Other mining operations in the district produced over
the same time frame, and included the Tiger, Danny T, Carter, Moulton, Pioneer, Grey Eagle,
Liberty, Dockter Kalloch, Edwards, Wright Lode, Barker, Harrison, Lucky Strike, and several
other low tier operations that were noted in site assessment accounts (CDM Smith 2016). This
thesis makes reference to mine sites that are actively discharging water or are in close contact
with the Galena Creek itself. These are the Block P, Danny T, Marcelline, Carter, Moulton, Grey
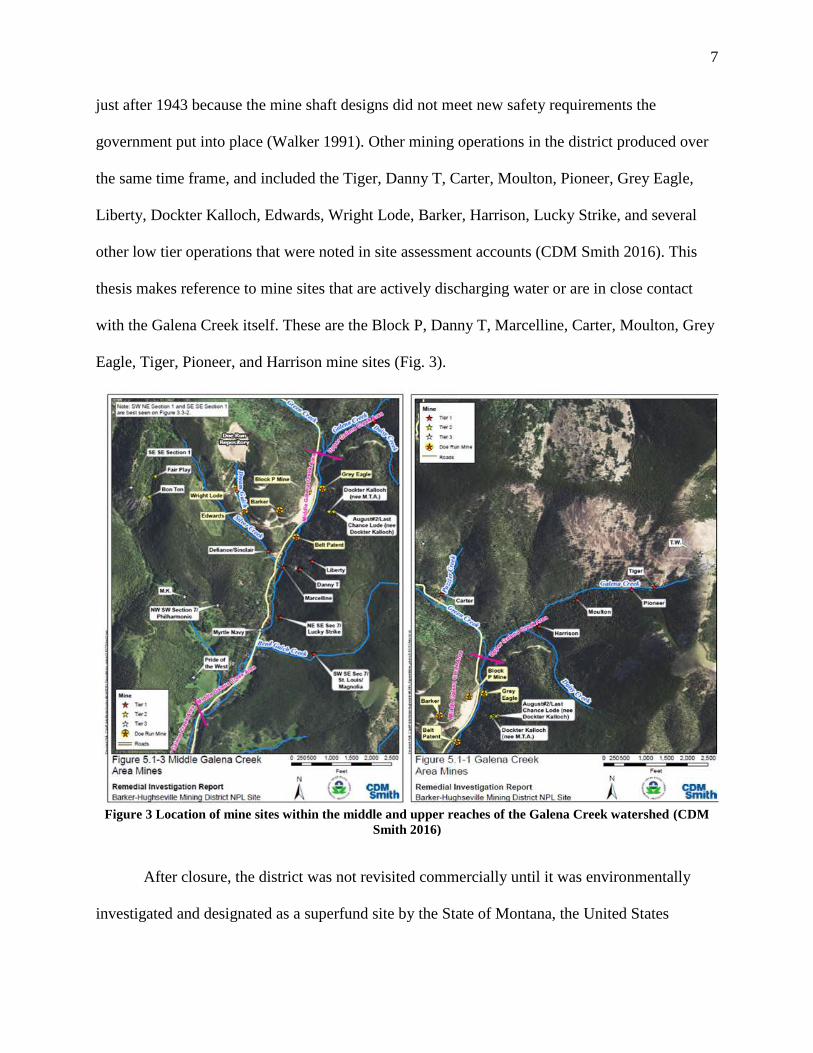
Eagle, Tiger, Pioneer, and Harrison mine sites (Fig. 3).
Figure 3 Location of mine sites within the middle and upper reaches of the Galena Creek watershed (CDM
Smith 2016)
After closure, the district was not revisited commercially until it was environmentally
investigated and designated as a superfund site by the State of Montana, the United States

8
Environmental Protection Agency (USEPA), the United States Forest Service (USFS), and the
Montana Department of Environmental Quality (MTDEQ) between 1991 and 2001 (CDM Smith
2016). Beginning in 2004, efforts have been made by responsible parties and government
agencies to improve the quality of the watershed and reduce acid-mine drainage, including
relocating mine waste in contact with Galena Creek, minor stream diversion, reconstruction of
Galena Creek near the Block P mine, and attempts to block acidic seeps with bentonite at the
Block-P mine. Additionally, there have been ongoing efforts to plant non-invasive plant species
near impacted sites to return barren areas to pre-disturbed conditions and to plug open holes left
by mine workings which caused safety hazards. While important, these reclamation activities
changed the physical state of the middle section of Galena Creek, making it difficult to determine
the origin of small outcrops of ferricrete and host rocks that occur, for example, in the floodplain
of the stream below the Block P mine (CDM Smith 2016, Wood, Environment & Infrastructure,
Inc. 2020).
Table I. General Timeline of Activity within the BHMD
Date
Activity
1879-1943 Prospecting and active mining
2001 Superfund site designation on National Priorities List
1991- Present Environmental preliminary and annual studies
2004 - Present Reclamation efforts and mine waste excavations

9
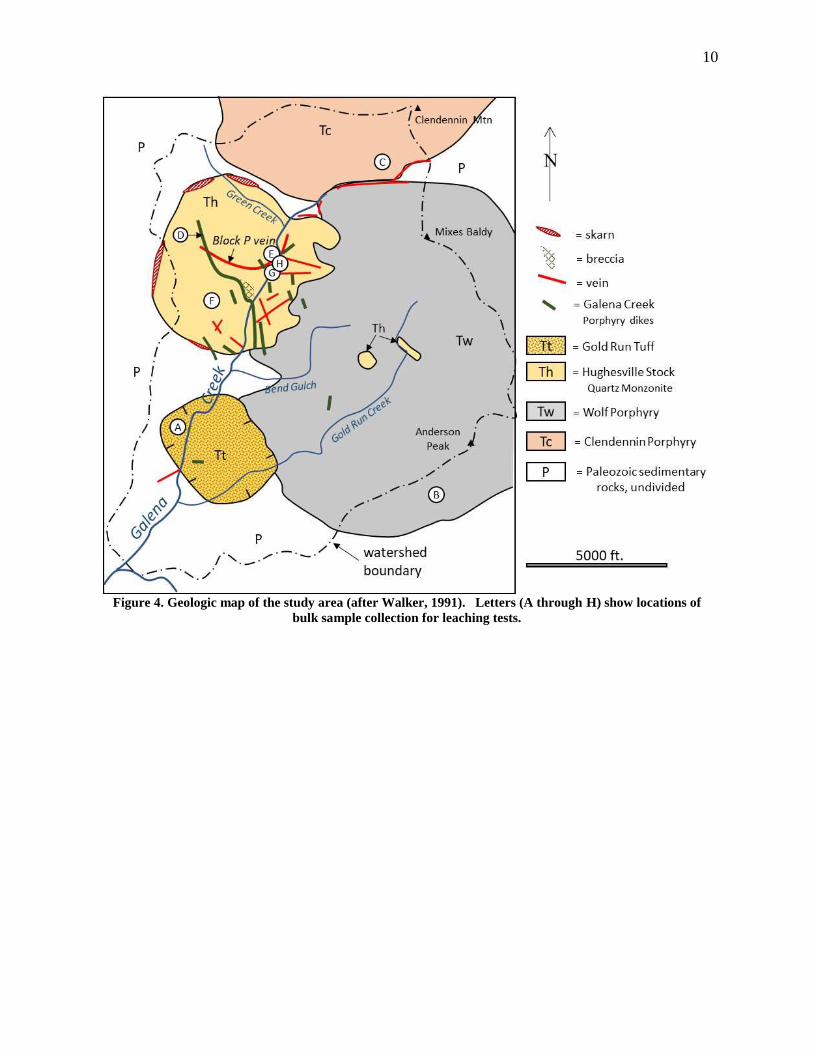
1.3.2. Geology
The geology of the Galena Creek area was summarized in detail by Weed (1900), Spiroff
(1938), and Witkind (1973), and more recently by Walker (1991). A geologic map, redrawn
from Walker (1991), is given in Figure 4, and Table II gives more detailed descriptions of the
igneous rock types. The oldest rocks in the study area are Paleozoic sedimentary rocks,
including the Mississippian Madison Group limestone. These rocks were intruded in Tertiary
time by two large rhyolite laccoliths (dome shaped intrusions) termed the Clendennin Porphyry
(55.0 Ma) and the Wolf Porphyry (47.0 Ma), as well as the Hughesville Quartz Monzonite stock
(45.0 Ma). As discussed by Witkind (1973), the area now occupied by the Hughesville Stock
may have been the magma conduit that fed into the laccoliths. Unlike the laccoliths, which are
mostly unmineralized, the Hughesville Stock is hydrothermally altered and mineralized, and
contains most of the major Ag-Pb-Zn veins of the district, as well as several mineralized skarn
zones at contacts with meta-sedimentary rocks (Figure 4). A set of rhyolite-porphyry dikes,
termed the Galena Creek Porphyry (44.0 Ma), cuts the Hughesville stock and to a lesser extent
the older laccoliths. These dikes contain minor sulfide minerals. The youngest rock in the field
area, termed the Gold Run Tuff by Walker (1991), is a volcanic diatreme filled with brecciated
fragments of all older rock types, also containing sparse sulfides. This unit, mapped as
“indurated alluvium” by Witkind (1973), was reinterpreted as a diatreme based on the results of
exploration drilling in the 1980s (Walker, 1991).
10
Figure 4. Geologic map of the study area (after Walker, 1991). Letters (A through H) show locations of
bulk sample collection for leaching tests.

11
Table II. Igneous rocks in the project area (after Witkind, 1973, and Walker, 1991)
Youngest
Oldest
Map unit Rock name Rock Type and Mineralogy
Tt Tertiary volcanic diatreme Gold Run Tuff Weakly lithified volcanic breccia with
clasts of all other rock types in the
area. Locally contains sparse sulfides.
Tgc
Rhyolite dikes Porphyry of Galena
Creek
Rhyolite porphyry, with abundant
round phenocrysts of clear-smoky
quartz, with some sanidine, albite,
biotite. Locally hydrothermally altered
with pyrite.
Th Hughesville Stock Quartz Monzonite of
Hughesville
Quartz monzonite with feldspar
phenocrysts. Locally highly altered
and mineralized. Altered rock consists
of quartz-sericite-pyrite and makes up
to 20% of Hughesville stock unit.
Tw Mixes Baldy-Anderson
Peak laccolith
Wolf Porphyry Granite porphyry with large
phenocrysts of smoky quartz, sanidine,
oligoclase, hornblende, biotite. Non-
mineralized.
Tc Clendennin-Peterson
laccolith
Porphyry of
Clendennin
Mountain
Rhyolite porphyry with phenocrysts of
sanidine, oligoclase, hornblende,
biotite. Non-mineralized.
1.3.3. Mineralization
Spiroff (1938) gave a detailed account of mineralization at the Block P mine. The main
Block P vein was mined for over 4000 feet along strike, and to a depth of 1400 feet. The vein
had an arcuate (concave to the north) strike (Fig. 4), with steep dips inclined toward the center of
the semicircle. Principal ore minerals included galena, sphalerite, pyrite, chalcopyrite, and Ag-
bearing tetrahedrite in a gangue of quartz, barite, calcite, rhodochrosite, and minor siderite. As
discussed by Spiroff (1938), and later by Witkind (1973), the Hughesville Quartz Monzonite is
hydrothermally altered to quartz + sericite + pyrite adjacent to the Block P vein, as well as the
other smaller veins that cut the stock. Referring to the Hughesville stock, Witkind (1973) stated
that “a conservative estimate is that between 20 and 30 percent of the rock shows significant
effects of hydrothermal alteration”. Weathering of this volume of hydrothermally altered and
pyrite-rich rock could have been a source of natural acid rock drainage prior to mining.
12
2. Methods
2.1. Synoptic Sampling of Galena Creek
2.1.1. Field Methods
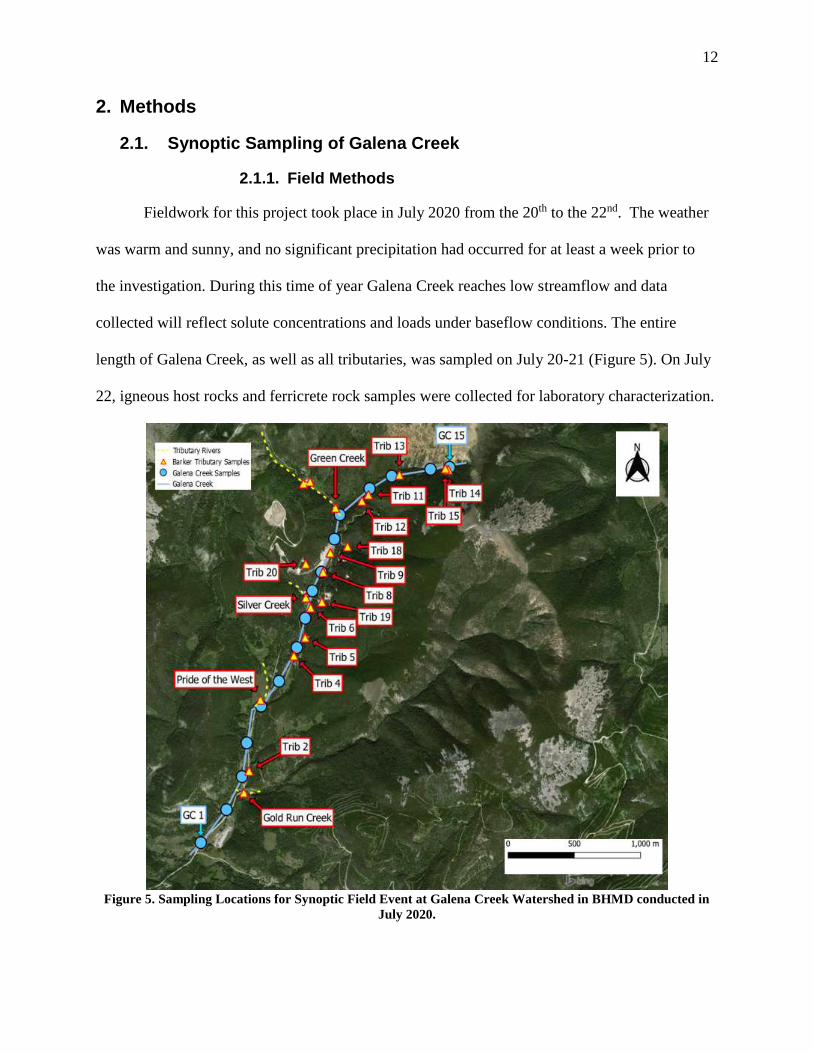
Fieldwork for this project took place in July 2020 from the 20th to the 22nd. The weather
was warm and sunny, and no significant precipitation had occurred for at least a week prior to
the investigation. During this time of year Galena Creek reaches low streamflow and data
collected will reflect solute concentrations and loads under baseflow conditions. The entire
length of Galena Creek, as well as all tributaries, was sampled on July 20-21 (Figure 5). On July
22, igneous host rocks and ferricrete rock samples were collected for laboratory characterization.
Figure 5. Sampling Locations for Synoptic Field Event at Galena Creek Watershed in BHMD conducted in
July 2020.
13
As seen in Figure 5, 16 surface water locations were sampled along Galena Creek starting
at the mouth (GC-1) and working upstream to the headwaters (GC-15). Tributary samples were
taken as they were encountered during the same time as the Galena Creek samples. A total of 20
tributary samples were collected, including mine discharges. At each sampling location, field
parameters were collected using a YSI 556 multiparameter meter, which included pH, electrical
conductivity (EC), temperature (°C), dissolved oxygen (DO), and oxidation-reduction potential
(ORP). The pH meter was calibrated with pH 4 and 7 standard solutions at the beginning of the
day, and readings were back-corrected to account for minor drift during the sampling event.
ORP readings were adjusted to true Eh with a Zobell’s solution standard. Since the YSI was
recording electric conductivity (EC), not specific conductivity (SC) referenced to 25°C, a
separate WTW meter was used to collect the SC values reported in this thesis. Streamflow was
determined using a salt dilution method where a known mass of NaCl solution is added to the
stream and then the integrated spike in SC is measured with an SC meter at site roughly 20-30m
downstream (Moore 2004). This method is believed to have an accuracy of ±5% for small flows
(< 1 cfs), decreasing to an accuracy of ±10% for larger flows (> 1 cfs). Where possible, a few
tributary flows were measured with a bucket-and-stopwatch method, using a 5-gallon container.
At each main stem location, three sets of water samples were collected: “RU” (raw,
unfiltered and unacidified); “FU” (filtered and un-acidified); and “FA” (filtered and acidified to
1% v/v HNO3). All bottles were 60 mL high density polyethylene (HDPE). The FA bottles were
acid-washed with 10% HNO3 and then rinsed 3 times with deionized water prior to field use. All
filtrations were done during sample collection by drawing water up into a 60 mL plastic syringe
(rinsed 3x with stream water) and then pushing through a disposable 0.2 µm polyethersulfone
(PES) filter into the appropriate container, which was rinsed once with filtered water. The FA

14
samples were acidified within 10 hours of collection by addition of 0.6 mL of trace-metal-HNO3.
For tributary streams and mine discharges, only FA and FU samples were collected.
Occasionally, a duplicate sample was taken for some tributaries and some Galena Creek
sampling stations to check for quality assurance. These samples matched the other samples
match closely with the sample they are meant to duplicate confirming good quality
measurements from the laboratory. The data for these duplicates can be found in the Appendix as
part of the supplementary data and will have a letter “D” as part of the sample name.
Alkalinity measurements were taken for any water samples that had a pH > 4.5. These
samples were collected in 120 mL HDPE bottles and were tested using a digital titrator in the
laboratory within 48 h of sample collection.
At most of the main stem Galena Creek stations, a sample of in-stream precipitates (ISPs)
was collected by skimming off the fluffy coatings of hydrous ferric oxide (HFO) that had settled
on cobbles and boulders into a polyethylene bag. In addition, at sites in the middle and lower
reaches of Galena Creek, thin black coatings rich in hydrous manganese oxide (HMO) were
collected from the undersides of boulders in the stream bed. The ISP and HMO samples were
air-dried in the sun at the campsite, and then analyzed for elemental composition with a Niton
Gold portable X-ray Fluorescence (XRF) meter (the XRF data is available in Appendix E).
Representative subsamples were archived for later use.
Representative bulk samples (> 3 kg) of the major bedrock map units were collected in 5-
gallon buckets for later use in the laboratory leachate experiments (see Table III), sample
locations are given in Figure 4). Effort was made to break the outcrops with a sledge to get the
freshest rock possible, and to avoid any lichen. Each bulk sample consisted of 20 or more smaller
fragments up to 6” in diameter. In the case of the hydrothermally-altered Hughesville Stock,
15
samples containing strong “quartz-sericite-pyrite” (QSP) alteration were collected from float in
the reconstructed floodplain and on the hillside below the Block P portal.
2.1.2. Analytical Methods
Alkalinity values were assessed in the laboratory using a digital titrator for all samples
that had a pH of 4.5 or higher. 0.16N sulfuric acid cartridges were used in the titrator to release
into an Erlenmeyer flask that contained the water from the sample being tested and bromcresol
green-methyl red pH indicator dye on a magnetic stirrer. Alkalinity on the titrator was recorded
once water turned bright pink. Alkalinity concentrations in mg/L CaCO3,eq were also converted
to mg/L of HCO3- by adjusting for the gram formula weights. This calculation assumes that
bicarbonate ion was the only source of alkalinity in the water samples. This is a good assumption
because all the samples had pH < 7.5, were well-oxidized, and had low concentrations of
nutrients (e.g., PO43-).
All FA, RA, and FU samples were sent to the Montana Bureau of Mines and Geology
(MBMG) geochemical laboratory for analysis. An Inductively Coupled Plasma Mass
Spectrometer (ICP-MS) and an Inductively Coupled Plasma-Optical Emission Spectrometer
(ICP-OES) were used to analyze FA and RA samples for trace and major solute concentrations
data based on EPA methods 200.8 and 200.7, respectively. FU samples were submitted for
analysis by Ion Chromatography (IC) according to EPA method 300.0. Laboratory QC checks
were performed on the main contaminants of interest, including arsenic, cadmium, copper, lead,
and zinc. Results of the QC checks are included in the appendices of this thesis.
A set of filtered but unpreserved water samples was collected for isotopic analysis of H
and O in water. The isotope analyses were conducted at MBMG using a Picarro L1102-I cavity
ring-down spectrometer (CRDS). Isotopic values are reported in the usual δ notation in units of
16
‰ (per mil, or parts per thousand), versus Vienna Standard Mean Ocean Water (VSMOW). The
analyses were calibrated using isotopic standards USGS 47, USGS 48, and Vienna Standard
Mean Ocean Water (VSMOW). Analytical uncertainties are estimated at ±0.2‰ for δ18Owater
and ±1‰ for δDwater.
Several filtered but unacidified water samples were collected for S- and O-isotope
analysis of dissolved sulfate. Dissolved sulfate was precipitated in the lab as barite, following
the procedures of Carmody et al. (1998). The white BaSO4 precipitates were filtered, rinsed
several times with deionized water, dried overnight at 50˚C, and shipped to the University of
Nevada-Reno for S- and O-isotope analysis using a Eurovector elemental analyzer interfaced to a
Micromass IsoPrime stable isotope ratio mass spectrometer (IRMS). Analysis followed the
methods of Giesemann et al. (1994) for δ34S and Kornexl et al. (1999) for δ18O. Based on
replicate laboratory analyses, analytical uncertainties are ±0.2‰ for δ34Ssulfate and ±0.4‰ for
δ18Osulfate. The results are reported in δ notation in units of ‰ vs. Vienna Canon Diablo Troilite
(VCDT) for δ34Ssulfate and VSMOW for δ18Osulfate.
Several hand samples containing fresh sulfide minerals were collected from mine dumps
in the study area. These samples were carefully picked by hand under a binocular microscope to
get pure mineral separates of pyrite, sphalerite, and/or galena that were sent to the University of
Nevada-Reno for S-isotope analysis, following the methods described above.

17
2.2. Leachate Experiments
2.2.1. Design
Leachate experiments used humidity cells in Dr. Gammons’ laboratory that were
constructed according to the American Society for Testing and Materials, Method D5744-96.
The sample chambers were made of clear acrylic with a 4.5” OD x 8” height, and ¼” -thick
walls. All the sample chambers were soaked for 2 days with 2% HNO3 and then rinsed
thoroughly with de-ionized water to clean them before use. A cloth filter was placed on top of a
perforated acrylic disk at the bottom of each cell. The purpose of the cloth filter was to minimize
entrainment of fine sediment out of the cells during leachate collection. Approximately 1.0 kg of
crushed rock collected from each of the bedrock units in the study area was added to each cell.
Rock descriptions are given in Table III and the location where each of these samples was
collected is shown in Figure 4. Photographs of each rock type are included in the Appendix F,
and XRF data on the -100 sieve fraction of each rock type are given in Appendix E.
18
Table III. Sample letter and corresponding rock type for each leachate cell
Sample Rock type Sampling frequency
A Gold Run Tuff collected from an outcrop along lower Galena Creek. The
rock is variably weathered, and shows evidence of weak hydrothermal
alteration, including sparse pyrite.
Week 1, Week 6
B Fresh Wolf Porphyry (unweathered and with no obvious hydrothermal
alteration)
Week 1, Week 6
C Fresh Clendennin Porphyry (unweathered and with no obvious
hydrothermal alteration)
Week 1, Week 6
D Porphyry of Galena Creek. Collected from rip-rap at the waste rock
repository on top of the hill west of the Block P mine. This rip-rap
appears to have been imported from a road switchback that cut through an
outcrop of the Galena Creek porphyry dike material. The rock shows
weak hydrothermal alteration and sparse pyrite.
Week 1, Week 6
E Variably weathered and hydrothermally altered Hughesville Stock
collected in a 100m transect along the outcrop immediately behind the
main Block P portal, along strike of the Block P vein.
Week 1, Week 6
F Fresh Hughesville Stock (unweathered and with no obvious hydrothermal
alteration) collected from outcrops along roadcuts on the hill, several
hundred meters west of the Block P mine.
Week 1, Week 6
G Variably weathered samples of Hughesville Stock with strong quartz-
sericite-pyrite alteration and sparse galena, sphalerite collected from
dumps and scattered along the toe of the reclaimed hillside near the Block
P mine.
Weeks 1, 2, 3, 4, and 6
H Variably weathered, banded vein material gathered from float near the
Block P mine, rich in pyrite, sphalerite, galena, quartz, and some
carbonate gangue minerals (calcite, rhodochrosite).
Weeks 2, 4, and 6
Control Humidity cell set up and leached the same way as the other samples, but
with no solid media.
Week 1
The leachate added to the humidity cells was prepared following the USEPA’s synthetic
precipitation leaching procedure (SPLP). As required for sites west of the Mississippi River, the
SPLP extraction solution consisted of de-ionized water with a 60:40 mix of sulfuric acid and
nitric acid, adjusted to a pH of 5.0 ± 0.1. Fresh SPLP solution was made each week by dilution
of a stock solution of 60:40 sulfuric acid/nitric acid that had a pH close to 4. On Day 1 of each
weekly cycle, enough SPLP solution was added to each humidity cell to completely saturate the
rock media. The cells were left in a saturated state overnight. Then, on Day 2, a valve at the
bottom of the cell was opened to drain the leachate into a 1-L Erlenmeyer flask. The pH and SC
of the leachate samples were measured with a Hydrolab MS-5 datasonde, and the mass of
leachate was determined by weighing the flasks. Once the samples were collected, the humidity

19
cells were left with their bottom drains open for the remainder of the week, letting them slowly
drain. This weekly cycle was repeated for a total of six weeks.
After the first and the last leach cycle, FA and FU samples were collected from each of
the humidity cells for ICP-OES, ICP-MS, and IC analysis of major, minor, and trace solutes.
These analyses were done at the MBMG lab following the procedures outlined above for the
stream samples. Also, any sample that had a pH > 4.5 was analyzed for alkalinity, following the
methods outlined above. Because it was considered of highest importance, Sample G, the highly
altered and pyrite-rich Hughesville Stock, was sampled for ICP-MS metals every week except
week 5. As a control, one humidity cell was set up and leached during the first weekly cycle, but
with no solid rock media. This leachate, listed as “Sample Blank” in the datasets of Appendix D,
showed somewhat elevated levels of some metals, including Cu, Pb, and Zn.
20
3. Results
3.1. Synoptic Sampling: Galena Creek
3.1.1. Field Parameters
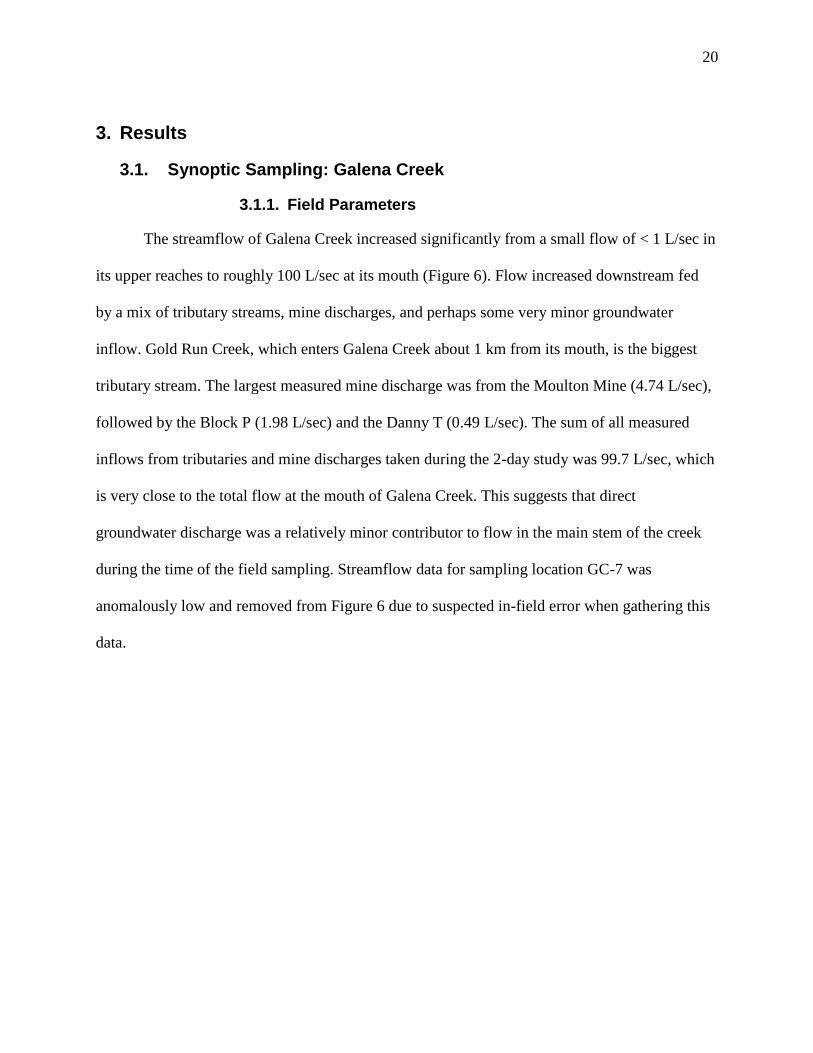
The streamflow of Galena Creek increased significantly from a small flow of < 1 L/sec in
its upper reaches to roughly 100 L/sec at its mouth (Figure 6). Flow increased downstream fed
by a mix of tributary streams, mine discharges, and perhaps some very minor groundwater
inflow. Gold Run Creek, which enters Galena Creek about 1 km from its mouth, is the biggest
tributary stream. The largest measured mine discharge was from the Moulton Mine (4.74 L/sec),
followed by the Block P (1.98 L/sec) and the Danny T (0.49 L/sec). The sum of all measured
inflows from tributaries and mine discharges taken during the 2-day study was 99.7 L/sec, which
is very close to the total flow at the mouth of Galena Creek. This suggests that direct
groundwater discharge was a relatively minor contributor to flow in the main stem of the creek
during the time of the field sampling. Streamflow data for sampling location GC-7 was
anomalously low and removed from Figure 6 due to suspected in-field error when gathering this
data.

21
Figure 6. Flows of Galena Creek (top) and tributaries (bottom) measured during the synoptic sampling
event. Units are L/sec.
Changes in the pH and SC of Galena Creek with distance downstream are shown in
Figure 7. The only sampling locations with strongly acidic pH were upstream of the confluence
of the Moulton discharge. The Moulton discharge itself had near-neutral pH, so it had the effect
of raising the pH of the main stem of the creek. A slight dip in pH and increase in SC were noted
below the Block P discharge, but pH remained near-neutral to the bottom of the stream. Galena
Creek was well-oxygenated over its entire length, with daytime temperatures of 8 to 13°C. Raw
data for these parameters can be found in Appendix A.

22
Figure 7. pH, SC, and alkalinity trends in Galena Creek. Tributary inflows are shown with arrows.
23
3.1.2. Galena Creek Metal Concentrations
Dissolved (filtered to 0.2 m) and total (unfiltered) metal concentrations for the synoptic
analysis of Galena Creek are in Figures 8 & 9, which follow, for each of the contaminants of
interest (COI). The COI’s for this project include manganese (Mn), iron (Fe), copper (Cu), zinc
(Zn), lead (Pb), thallium (Tl), aluminum (Al), arsenic (As), and cadmium (Cd).
Concentrations of dissolved Fe, Mn, Zn, Cd and As followed a pattern with high values
in the uppermost reach near the Tiger Mine, a decrease to the mouth of Green Creek, and then an
increase below the Block P discharge (Figures 8 and 9). In contrast, concentrations of Cu, Al,
and Pb were highest near the Tiger Mine, and decreased to the mouth of Galena Creek without a
noticeable spike below the Block P 75’ adit discharge. Concentrations of dissolved thallium (Tl)
showed the opposite trend, being low in the upper reaches of Galena Creek and increasing below
the Block P discharge.
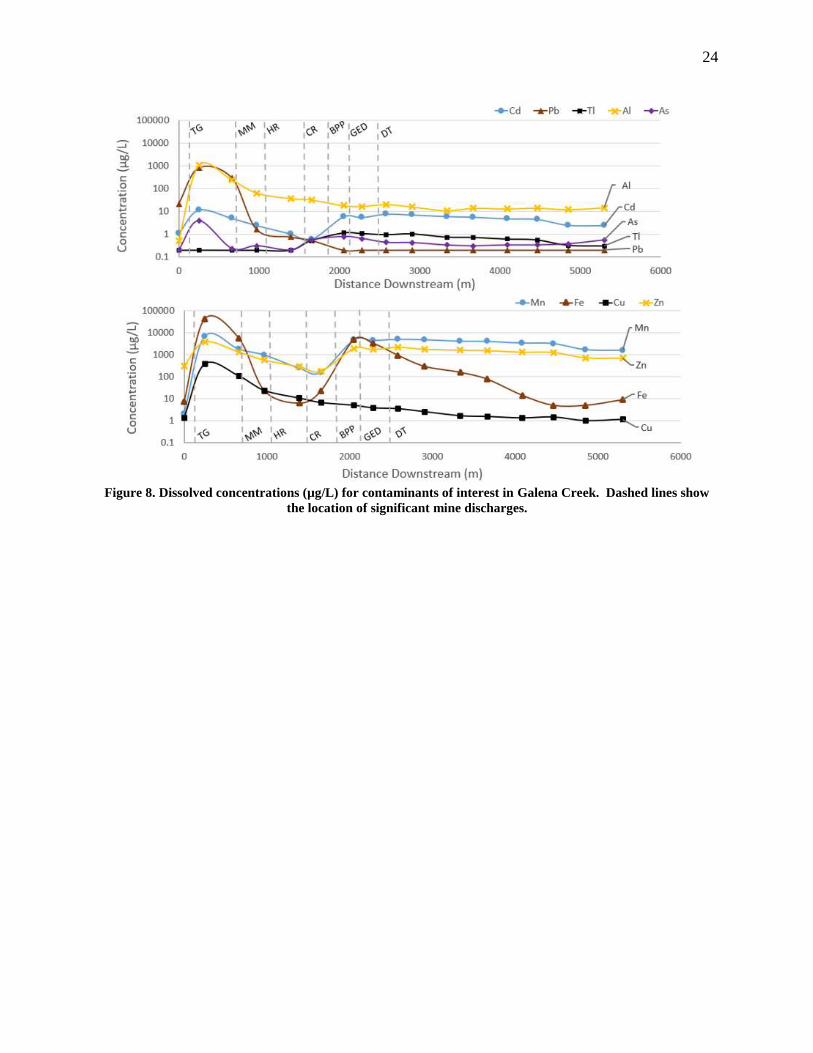
24
Figure 8. Dissolved concentrations (µg/L) for contaminants of interest in Galena Creek. Dashed lines show
the location of significant mine discharges.

25
Figure 9. Dissolved concentrations (µg/L) for contaminants of interest in Galena Creek. Dashed lines show
the location of significant tributary streams.
Figure 10 shows a comparison of filtered vs. total (unfiltered) concentrations in Galena
Creek for each COI. Some solutes, including Mn, Zn, Cd, and Tl, were primarily in the dissolved
state, so there is very little difference between their total and filtered concentrations. In contrast,
Fe, Al, As, Cu, and Pb all showed a strong tendency to partition into suspended particles. The
graph for Fe shows an influx of soluble Fe near the headwaters and again at the Block P
discharge (BPP). Each influx was followed by a tail in which soluble Fe decreased rapidly but
total Fe remained elevated. This is explained by oxidation of soluble Fe2+ to hydrous ferric oxide
(HFO), which remained in suspension due to the steep gradient of the stream.

26
Figure 10. Total (unfiltered) vs. dissolved (filtered) metal concentrations for contaminants of interest in
Galena Creek.
27
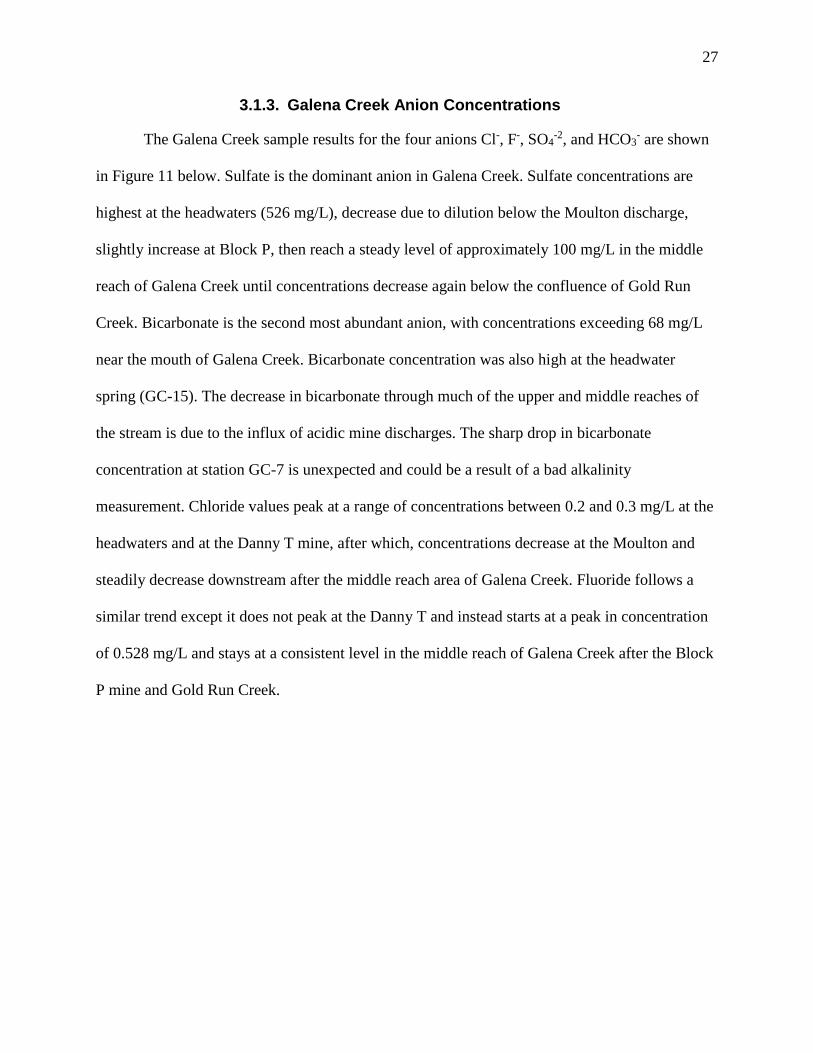
3.1.3. Galena Creek Anion Concentrations
The Galena Creek sample results for the four anions Cl-, F-, SO4-2, and HCO3
- are shown
in Figure 11 below. Sulfate is the dominant anion in Galena Creek. Sulfate concentrations are
highest at the headwaters (526 mg/L), decrease due to dilution below the Moulton discharge,
slightly increase at Block P, then reach a steady level of approximately 100 mg/L in the middle
reach of Galena Creek until concentrations decrease again below the confluence of Gold Run
Creek. Bicarbonate is the second most abundant anion, with concentrations exceeding 68 mg/L
near the mouth of Galena Creek. Bicarbonate concentration was also high at the headwater
spring (GC-15). The decrease in bicarbonate through much of the upper and middle reaches of
the stream is due to the influx of acidic mine discharges. The sharp drop in bicarbonate
concentration at station GC-7 is unexpected and could be a result of a bad alkalinity
measurement. Chloride values peak at a range of concentrations between 0.2 and 0.3 mg/L at the
headwaters and at the Danny T mine, after which, concentrations decrease at the Moulton and
steadily decrease downstream after the middle reach area of Galena Creek. Fluoride follows a
similar trend except it does not peak at the Danny T and instead starts at a peak in concentration
of 0.528 mg/L and stays at a consistent level in the middle reach of Galena Creek after the Block
P mine and Gold Run Creek.

28
Figure 11. Fluoride (top), chloride (middle), and sulfate (bottom) data in mg/L vs. distance downstream
(m) with reference to significant mine and creek tributary locations and Galena Creek sampling stations.
29
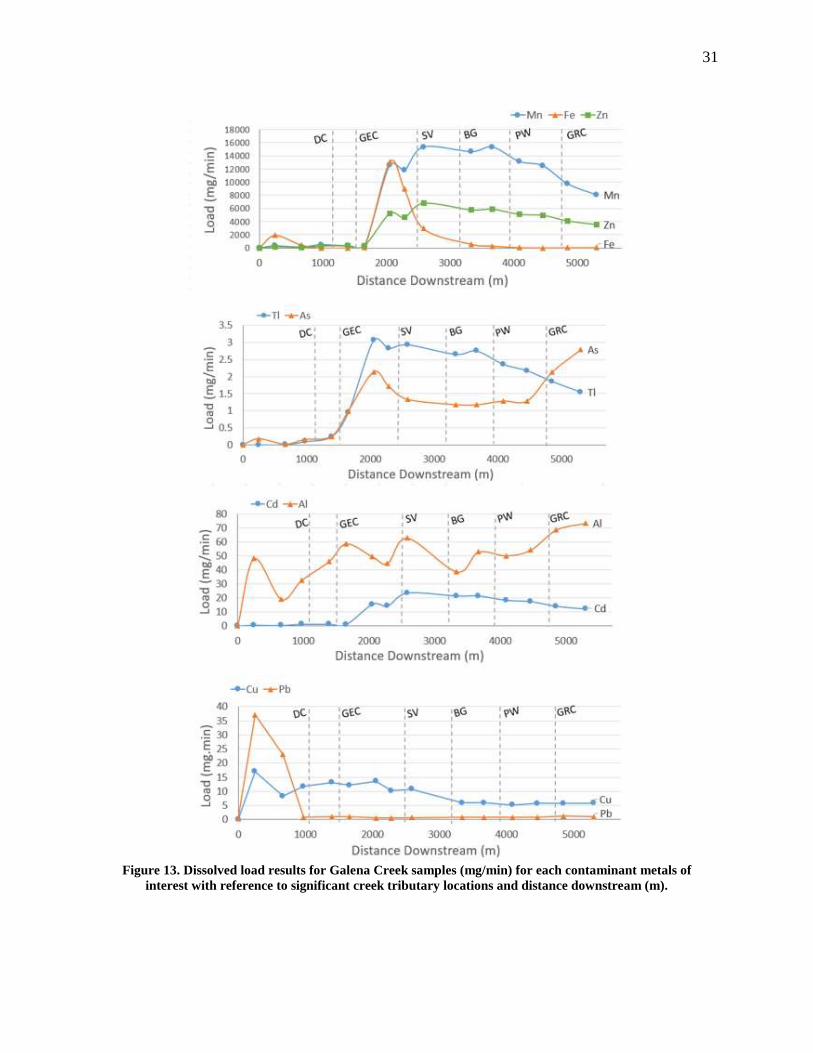
3.1.4. Galena Creek Metal Loads
Dissolved load trends ranged between groups of metals. Iron showed a small peak below
the Tiger Mine which quickly dropped back to baseline, and then a much larger peak after the
confluence with the Block P discharge, followed by another rapid drop to baseline. Dissolved
loads of Zn, Tl, and Cd peaked between the Block P and Danny T mine workings, then gradually
decreased to the mouth of the stream. Arsenic (As) load peaked below Block P, then dropped to
an intermediate level, and then increased unexpectedly in the last kilometer of the stream. Loads
of aluminum show erratic behavior with an overall increase down the entire length of Galena
Creek. Unlike the other COIs, loads of Pb and Cu showed their highest values immediately
below the Tiger Mine. Copper loads remained high through the middle reach of Galena Creek
and then decreased slightly to the mouth. In difference, Pb loads dropped abruptly back to
baseline values below the Moulton Mine.
Figure 13 shows the same load data discussed in the previous paragraph, but with the
locations of tributary streams marked by vertical dashed lines. Viewing the graphs this way, it
appears that there is a stepped increase in load of several metals, including Mn, Zn, and Tl,
below the confluence of Silver Creek. The mouth of Silver Creek contains elevated Mn and Zn
concentrations (next section), possibly due to mine waste sources in that drainage. Other
tributaries, such as Bend Gulch, Pride of the West Creek, and Gold Run Creek, contributed no
increases in metal loads to the profiles.
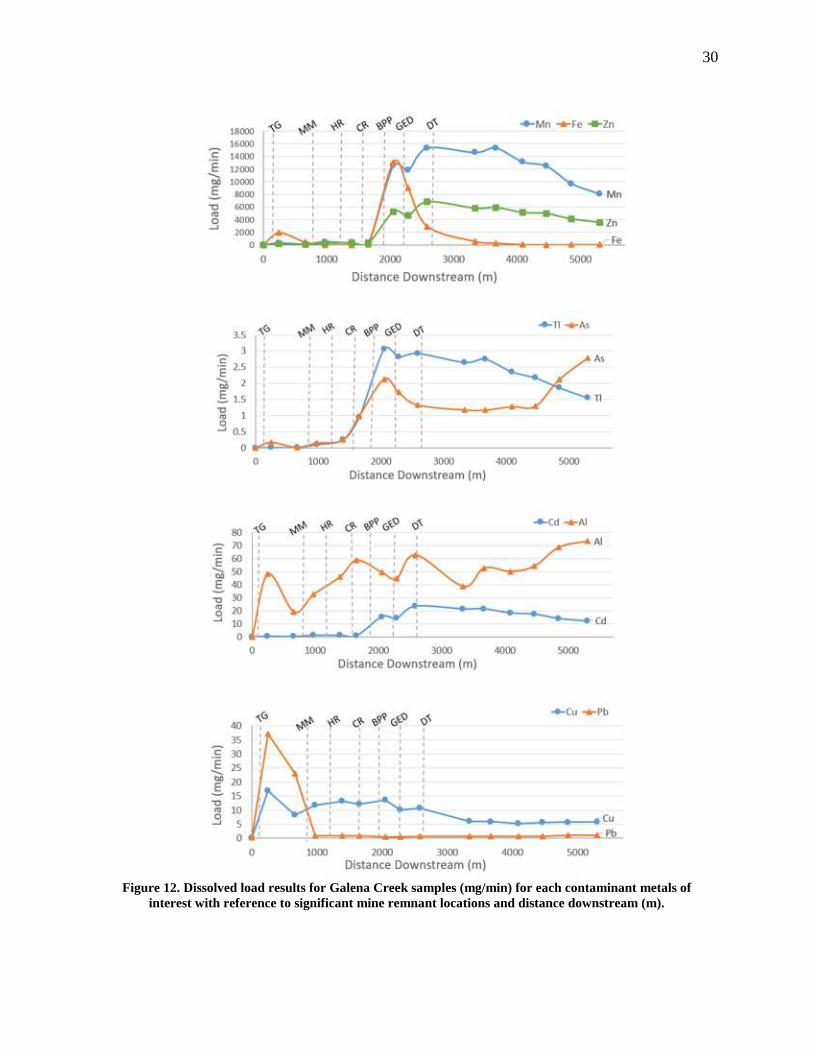
30
Figure 12. Dissolved load results for Galena Creek samples (mg/min) for each contaminant metals of
interest with reference to significant mine remnant locations and distance downstream (m).
31
Figure 13. Dissolved load results for Galena Creek samples (mg/min) for each contaminant metals of
interest with reference to significant creek tributary locations and distance downstream (m).
32
3.2. Synoptic Sampling: Tributaries
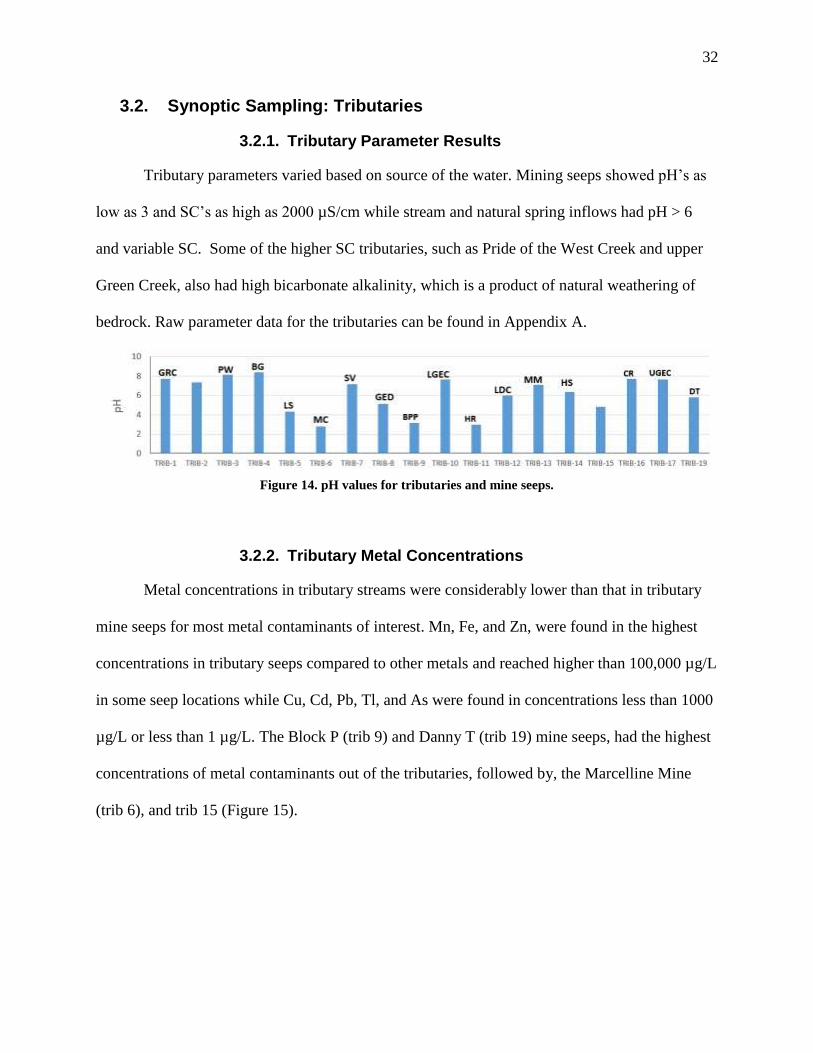
3.2.1. Tributary Parameter Results
Tributary parameters varied based on source of the water. Mining seeps showed pH’s as
low as 3 and SC’s as high as 2000 µS/cm while stream and natural spring inflows had pH > 6
and variable SC. Some of the higher SC tributaries, such as Pride of the West Creek and upper
Green Creek, also had high bicarbonate alkalinity, which is a product of natural weathering of
bedrock. Raw parameter data for the tributaries can be found in Appendix A.
Figure 14. pH values for tributaries and mine seeps.
3.2.2. Tributary Metal Concentrations
Metal concentrations in tributary streams were considerably lower than that in tributary
mine seeps for most metal contaminants of interest. Mn, Fe, and Zn, were found in the highest
concentrations in tributary seeps compared to other metals and reached higher than 100,000 µg/L
in some seep locations while Cu, Cd, Pb, Tl, and As were found in concentrations less than 1000
µg/L or less than 1 µg/L. The Block P (trib 9) and Danny T (trib 19) mine seeps, had the highest
concentrations of metal contaminants out of the tributaries, followed by, the Marcelline Mine
(trib 6), and trib 15 (Figure 15).

33
Figure 15. Dissolved concentrations of contaminants of interest in tributary samples.
34
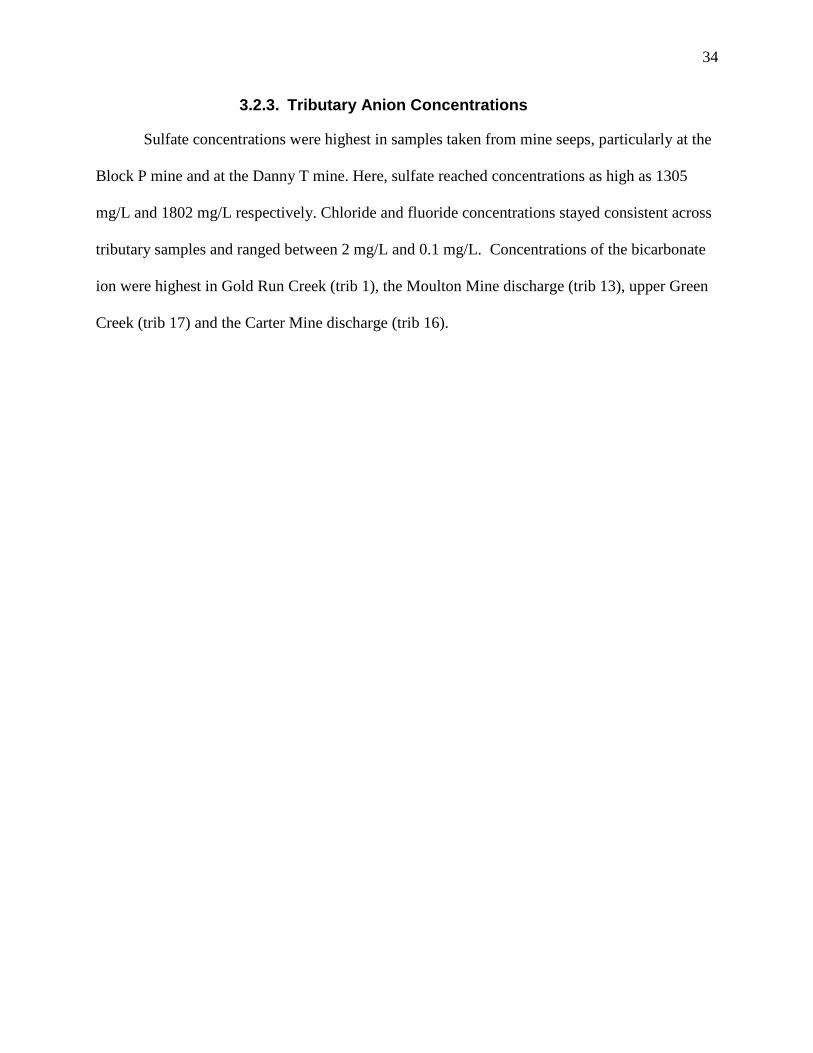
3.2.3. Tributary Anion Concentrations
Sulfate concentrations were highest in samples taken from mine seeps, particularly at the
Block P mine and at the Danny T mine. Here, sulfate reached concentrations as high as 1305
mg/L and 1802 mg/L respectively. Chloride and fluoride concentrations stayed consistent across
tributary samples and ranged between 2 mg/L and 0.1 mg/L. Concentrations of the bicarbonate
ion were highest in Gold Run Creek (trib 1), the Moulton Mine discharge (trib 13), upper Green
Creek (trib 17) and the Carter Mine discharge (trib 16).

35
Figure 16. Anion concentrations (mg/L) for tributary samples.

36
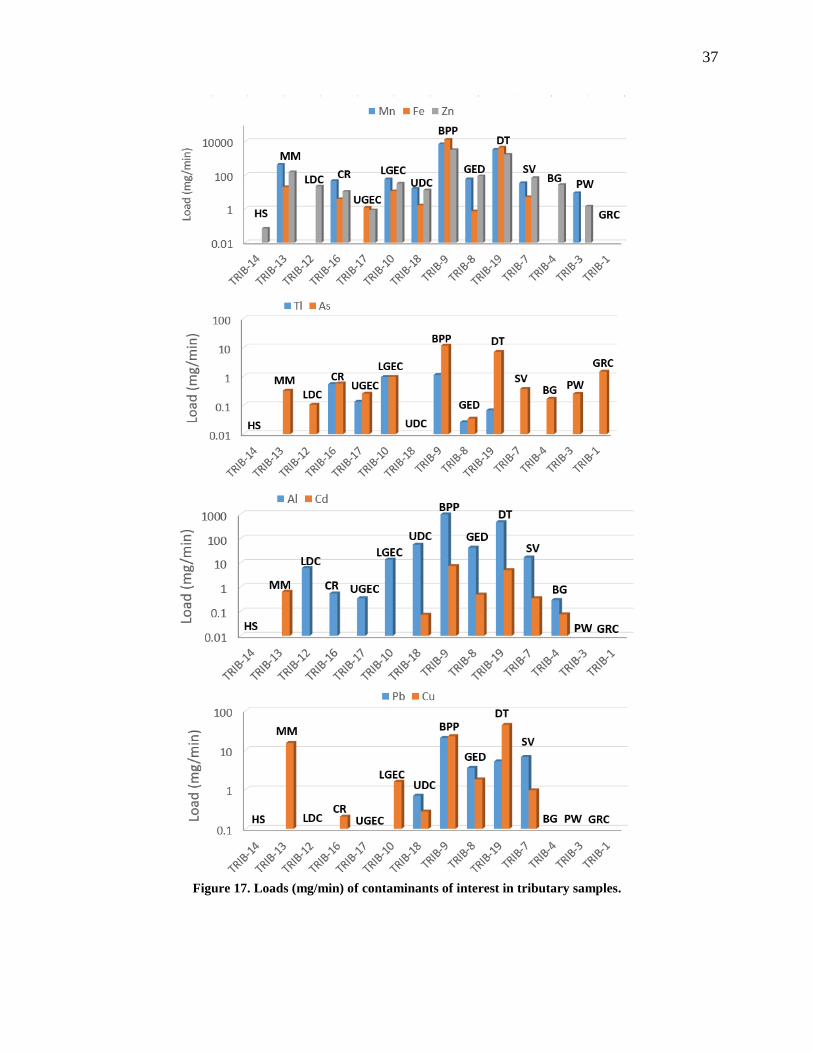
3.2.4. Tributary Metal Loads
Tributary loads were highest for most contaminants of interest at the Block P discharge
and the Danny T adit seep for all metals shown in Figure 17. The Moulton Mine discharge also
showed high loads of dissolved Mn, Cu, Fe, and Zn near 800 mg/min, 27 mg/min, 35mg/min,
and 300 mg/min, respectively. The Moulton seep showed non-detectable amounts of dissolved
Pb, however, Galena Creek near the Moulton and Pioneer mine sites has a relatively high
dissolved Pb load. This is likely due to Pb’s non-conservative nature causing data differences in
total and dissolved Pb concentrations. The tributary streams had lower metal loads relative to the
mine seeps except for loads of Al which, on average, exhibited higher loads in some of tributary
streams when compared to some mine seeps.
37
Figure 17. Loads (mg/min) of contaminants of interest in tributary samples.
38
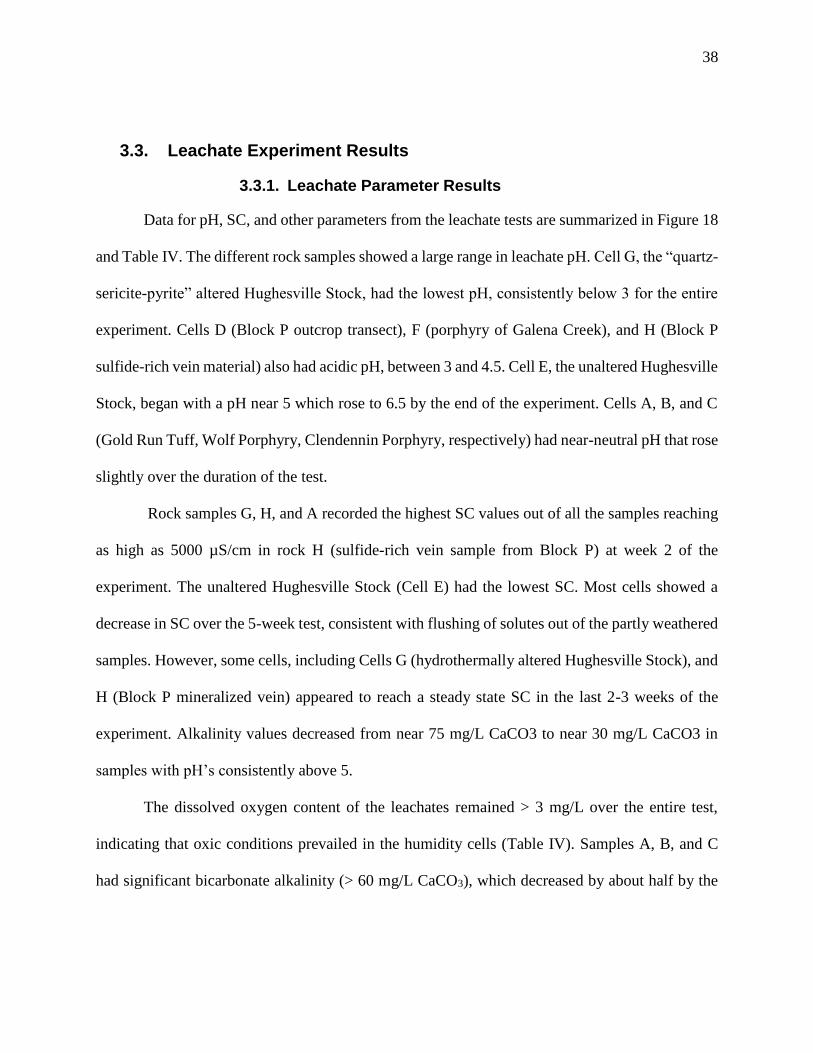
3.3. Leachate Experiment Results
3.3.1. Leachate Parameter Results
Data for pH, SC, and other parameters from the leachate tests are summarized in Figure 18
and Table IV. The different rock samples showed a large range in leachate pH. Cell G, the “quartz-
sericite-pyrite” altered Hughesville Stock, had the lowest pH, consistently below 3 for the entire
experiment. Cells D (Block P outcrop transect), F (porphyry of Galena Creek), and H (Block P
sulfide-rich vein material) also had acidic pH, between 3 and 4.5. Cell E, the unaltered Hughesville
Stock, began with a pH near 5 which rose to 6.5 by the end of the experiment. Cells A, B, and C
(Gold Run Tuff, Wolf Porphyry, Clendennin Porphyry, respectively) had near-neutral pH that rose
slightly over the duration of the test.
Rock samples G, H, and A recorded the highest SC values out of all the samples reaching
as high as 5000 µS/cm in rock H (sulfide-rich vein sample from Block P) at week 2 of the
experiment. The unaltered Hughesville Stock (Cell E) had the lowest SC. Most cells showed a
decrease in SC over the 5-week test, consistent with flushing of solutes out of the partly weathered
samples. However, some cells, including Cells G (hydrothermally altered Hughesville Stock), and
H (Block P mineralized vein) appeared to reach a steady state SC in the last 2-3 weeks of the
experiment. Alkalinity values decreased from near 75 mg/L CaCO3 to near 30 mg/L CaCO3 in
samples with pH’s consistently above 5.
The dissolved oxygen content of the leachates remained > 3 mg/L over the entire test,
indicating that oxic conditions prevailed in the humidity cells (Table IV). Samples A, B, and C
had significant bicarbonate alkalinity (> 60 mg/L CaCO3), which decreased by about half by the

39
end of the experiment. This could indicate leaching of secondary carbonate minerals in the partly
weathered samples.
Figure 18. pH and SC over time for leachate rock sample experiments.
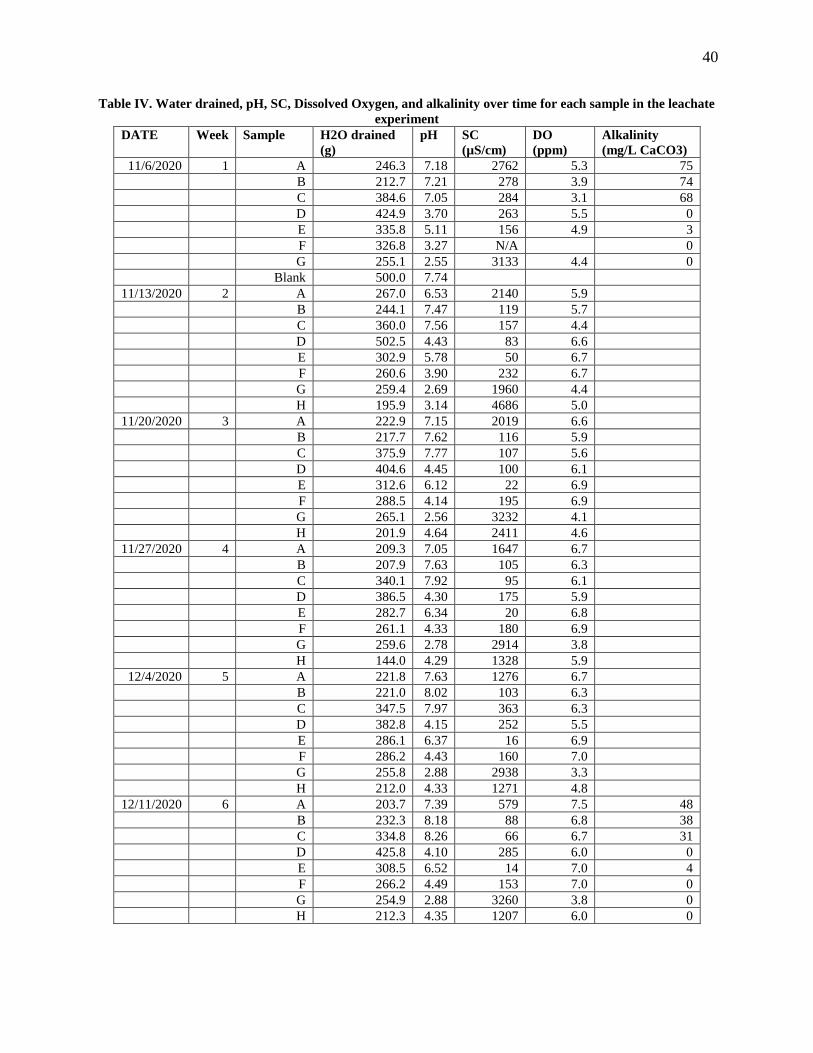
40
Table IV. Water drained, pH, SC, Dissolved Oxygen, and alkalinity over time for each sample in the leachate
experiment
DATE Week Sample H2O drained
(g)
pH SC
(µS/cm)
DO
(ppm)
Alkalinity
(mg/L CaCO3)
11/6/2020 1 A 246.3 7.18 2762 5.3 75 B 212.7 7.21 278 3.9 74 C 384.6 7.05 284 3.1 68 D 424.9 3.70 263 5.5 0 E 335.8 5.11 156 4.9 3 F 326.8 3.27 N/A 0 G 255.1 2.55 3133 4.4 0
Blank 500.0 7.74
11/13/2020 2 A 267.0 6.53 2140 5.9 B 244.1 7.47 119 5.7 C 360.0 7.56 157 4.4 D 502.5 4.43 83 6.6 E 302.9 5.78 50 6.7 F 260.6 3.90 232 6.7 G 259.4 2.69 1960 4.4 H 195.9 3.14 4686 5.0
11/20/2020 3 A 222.9 7.15 2019 6.6 B 217.7 7.62 116 5.9 C 375.9 7.77 107 5.6 D 404.6 4.45 100 6.1 E 312.6 6.12 22 6.9 F 288.5 4.14 195 6.9 G 265.1 2.56 3232 4.1 H 201.9 4.64 2411 4.6
11/27/2020 4 A 209.3 7.05 1647 6.7 B 207.9 7.63 105 6.3 C 340.1 7.92 95 6.1 D 386.5 4.30 175 5.9 E 282.7 6.34 20 6.8 F 261.1 4.33 180 6.9 G 259.6 2.78 2914 3.8 H 144.0 4.29 1328 5.9
12/4/2020 5 A 221.8 7.63 1276 6.7 B 221.0 8.02 103 6.3 C 347.5 7.97 363 6.3 D 382.8 4.15 252 5.5 E 286.1 6.37 16 6.9 F 286.2 4.43 160 7.0 G 255.8 2.88 2938 3.3 H 212.0 4.33 1271 4.8
12/11/2020 6 A 203.7 7.39 579 7.5 48 B 232.3 8.18 88 6.8 38 C 334.8 8.26 66 6.7 31 D 425.8 4.10 285 6.0 0 E 308.5 6.52 14 7.0 4 F 266.2 4.49 153 7.0 0 G 254.9 2.88 3260 3.8 0
H 212.3 4.35 1207 6.0 0

41
3.3.2. Leachate Anion Results
The dominant anion for the most leachate samples was sulfate (Table V), although Cells
A, B and C also had significant bicarbonate ion (see above). Most rock samples decreased in sulfate
over time except for rock D which increased from week 1 to week 5. Rock samples A (Gold Run
Tuff), G (Hydrothermally altered Hughesville Stock) and H (mineralized Block P vein) had the
highest sulfate concentrations (> 1000 mg/L). This is consistent with the fact that samples G and
H had the highest concentration of pyrite and other sulfides, while sample A (Gold Run Tuff) also
had some pyrite.
Table V. Concentrations of anions (mg/L) in leachate experiments over time
Sample
Name
Date Fluoride Chloride Nitrite Bromide Nitrate Phosphate Sulfate
A-1 11/6/2020 0.35 2.78 0.11 <0.01 2.92 <0.02 2121
B-1 11/6/2020 0.81 4.97 0.09 0.21 2.94 <0.02 9
C-1 11/6/2020 0.80 7.38 0.06 <0.01 0.93 <0.02 28
D-1 11/6/2020 0.18 1.58 <0.01 <0.01 3.96 <0.02 124
E-1 11/6/2020 0.62 38.3 <0.01 0.14 1.76 <0.02 35
F-1 11/6/2020 0.48 4.18 <0.01 <0.01 1.47 0.02 186
G-1 11/6/2020 8.24 2.05 0.09 <0.01 2.57 0.20 1977
Blank 11/6/2020 0.08 0.36 <0.01 <0.01 0.36 <0.02 43
G-2 11/13/2020 4.87 0.92 0.07 0.15 0.32 0.08 1106
H-1 11/13/2020 1.34 6.94 <0.01 <0.01 0.05 <0.02 4019
G-3 11/20/2020 4.52 0.54 0.09 0.13 0.10 0.11 1517
G-4 11/27/2020 1.86 0.44 0.09 0.14 0.09 0.16 1356
H-2 11/27/2020 0.24 2.64 0.09 <0.01 0.11 <0.02 1477
G-5 12/11/2020 1.31 0.40 0.10 <0.01 0.08 0.41 1562
H-3 12/11/2020 0.19 1.08 0.08 <0.01 0.07 <0.02 949
A-2 12/11/2020 0.49 0.36 <0.01 <0.01 0.10 <0.02 580
B-2 12/11/2020 0.73 0.37 <0.01 0.09 0.11 <0.02 2
C-2 12/11/2020 0.54 0.36 0.09 <0.01 0.10 0.02 4
D-2 12/11/2020 0.13 0.39 <0.01 <0.01 0.08 0.05 181
E-2 12/11/2020 0.35 0.45 <0.01 <0.01 0.08 <0.02 15
F-2 12/11/2020 0.50 0.93 <0.01 <0.01 0.13 0.02 132
NOTE: Nitrite and Nitrate are reported as N. Phosphate is reported as P.

42
3.3.3. Concentrations of Contaminants of Interest
Concentrations of contaminants of interest in the leachate tests are summarized in Table
VI and Figure 19. By far the highest concentrations of most COIs were produced from cells G
(hydrothermally altered Hughesville Stock) and H (mineralized Block P vein), although Cell F
(bedrock transect behind the Block P mine) also had high values of several COIs, including Mn,
Zn, Cu, Cd, and Pb. Concentrations in weekly samples from Cell G appeared to reach a steady
state towards the end of the test for all of the COIs, including Al (~ 9 mg/L) , Mn (~110 mg/L),
Fe (~200 mg/L), Cu (~ 4 mg/L), Zn (~18 mg/L), As (500-800 g/L), Cd (~ 120 g/L), Tl (~ 5
g/L), and Pb (~ 2 mg/L). Concentrations of COIs for Cell H (the sulfide-rich vein sample)
dropped sharply after the first week but were closer in the last two leachate samples, indicating
flushing of soluble metal salts (e.g., sulfates, hydroxides, or carbonate minerals) out of the partly
weathered samples in the first flush. Cell A, from the Gold Run Tuff, had generally low
concentrations of COIs, with the, possible, exception of thallium (up to 9 g/L). This sample had
circum-neutral pH and leached a large amount of Ca out of the rock, possibly, from dissolution
of secondary calcite and/or gypsum. Samples B, C, and E (unaltered Wolf, Clendennin, and
Hughesville stock) had somewhat elevated COI concentrations after the first leach that decreased
dramatically at the end of the test. This suggests flushing of COIs that were weakly adsorbed to
the partly weathered outcrop samples. Sample D (porphyry of Galena Creek) leached COIs at
generally low concentrations. Note that the sample blank data listed in Table VI shows the
presence of a few metals, particularly, Pb at 89 μg/L. The source of this lead could have come
from potentially some leftover residue in the cell that made through the nitric cleaning or from
the filter cloth, but this level of metals would not have impacted the conclusions made from the
dataset in this thesis.

43
Table VI. Metal concentrations (μg/L) for leachate samples over time Sample
Name
Date
Sampled
Al Ca Mn Fe Cu Zn As Cd Tl Pb
G-1 11/6/2020 22900 220000* 94300* 281000* 8090* 37000* 478 102 21 2150*
G-2 11/13/2020 9750 120000* 81000* 113000* 3790 20100 250 196 16 2220
G-3 11/20/2020 11800 112000* 124000* 168000* 4480 31600 672 201 8 2060
G-4 11/27/2020 8990 35795 114000* 152000* 3830 17900 561 163 6 2080
G-5 12/11/2020 9200 22441 112000* 242000* 4310 17500 883 118 5 1710
H-1 11/13/2020 8570 38554 420000* 1222000* 9590 487000* 357 2830 26 3410
H-2 11/27/2020 239 18087 466000* 46600* 491 162000* 115 1210 8 3080
H-3 12/11/2020 136 9132 285000* 36000* 636 87600* 95 696 8 3960
A-1 11/6/2020 3 476000* 282 <5 6 36 2 1 9 0.2
A-2 12/11/2020 1 174000* 12.8 <5 <1 4 1 <0.2 3 <0.2
B-1 11/6/2020 18 36300* 1690 54 88 78 1 <0.2 <0.2 1
B-2 12/11/2020 27 11400* 156 <5 8 5 1 <0.2 0.4 0.4
C-1 11/6/2020 60 38700* 1170 1130 137 181 5 1 <0.2 68
C-2 12/11/2020 34 10900* 89.6 8 43 9 3 <0.2 <0.2 1
D-1 11/6/2020 189 16200* 277 2370 49 166 4 2 2 3
D-2 12/11/2020 295 20000* 300 293 60 238 4 3 2 3
E-1 11/6/2020 53 10100* 465 32 39 190 2 1 0.3 6
E-2 12/11/2020 18 327 3 <5 6 19 1 <0.2 <0.2 0.4
F-1 11/6/2020 945 22500* 2680* 83 156 4100* 1 60 2 309
F-2 12/11/2020 399 12800* 1830 24 66 2770* 1 40 1 130
Blank 11/6/2020 11 103 <2 6 4 27 <0.2 <0.2 <0.2 89
Note: All values with an * are ICP-OES to replace ICP-MS values that were over-range

44
Figure 19. Concentrations of contaminants of interest in leachates from mineralized rock samples G, H,
and F over time.
45
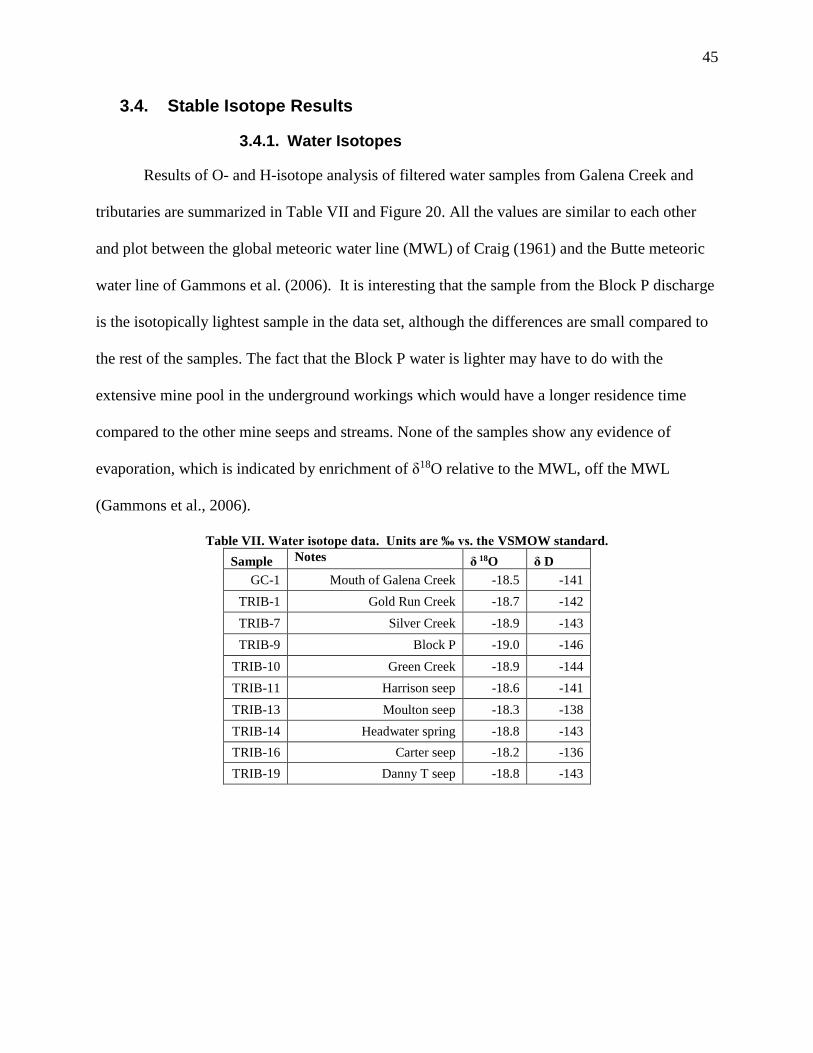
3.4. Stable Isotope Results
3.4.1. Water Isotopes
Results of O- and H-isotope analysis of filtered water samples from Galena Creek and
tributaries are summarized in Table VII and Figure 20. All the values are similar to each other
and plot between the global meteoric water line (MWL) of Craig (1961) and the Butte meteoric
water line of Gammons et al. (2006). It is interesting that the sample from the Block P discharge
is the isotopically lightest sample in the data set, although the differences are small compared to
the rest of the samples. The fact that the Block P water is lighter may have to do with the
extensive mine pool in the underground workings which would have a longer residence time
compared to the other mine seeps and streams. None of the samples show any evidence of
evaporation, which is indicated by enrichment of δ18O relative to the MWL, off the MWL
(Gammons et al., 2006).
Table VII. Water isotope data. Units are ‰ vs. the VSMOW standard.
Sample Notes δ 18O δ D
GC-1 Mouth of Galena Creek -18.5 -141
TRIB-1 Gold Run Creek -18.7 -142
TRIB-7 Silver Creek -18.9 -143
TRIB-9 Block P -19.0 -146
TRIB-10 Green Creek -18.9 -144
TRIB-11 Harrison seep -18.6 -141
TRIB-13 Moulton seep -18.3 -138
TRIB-14 Headwater spring -18.8 -143
TRIB-16 Carter seep -18.2 -136
TRIB-19 Danny T seep -18.8 -143

46
Figure 20. Isotopic composition of water samples from Galena Creek and tributaries. The global meteoric
water line (MWL) and Butte MWL are from Craig (1961) and Gammons and others (2006).
3.4.2. Sulfide and Sulfate Isotopes
Sulfur isotope data for 8 sulfide mineral separates from mine dumps in the study area are
summarized in Table VIII. The range in 34S is +3.0 to +6.6 ‰, with an average value of +5.0
±1.2 ‰. There is no consistent difference in 34S between mines or between mineral type
(galena vs. pyrite vs. sphalerite). The S- and O-isotope composition of 6 samples of dissolved
sulfate from Galena Creek and mine adit seeps in the field area are summarized in Table IX. The
S-isotope composition of sulfate ranges from +3.1 to +6.1 ‰, with an average of +4.5 ± 1.3 ‰.
Values of 18O-sulfate have a tight range from -12.0 to -13.8 ‰, averaging -13.1 ± 0.6‰. The
stable isotope data for sulfides and sulfates are discussed further in the next chapter.
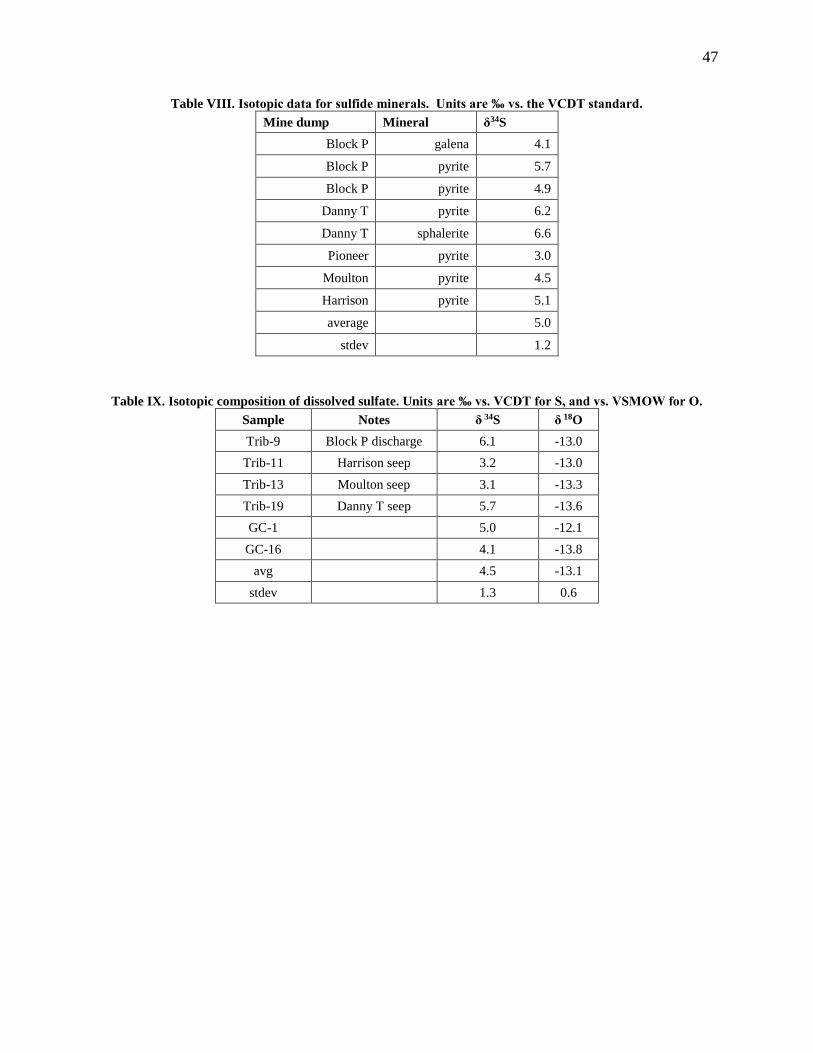
47
Table VIII. Isotopic data for sulfide minerals. Units are ‰ vs. the VCDT standard.
Mine dump Mineral δ34S
Block P galena 4.1
Block P pyrite 5.7
Block P pyrite 4.9
Danny T pyrite 6.2
Danny T sphalerite 6.6
Pioneer pyrite 3.0
Moulton pyrite 4.5
Harrison pyrite 5.1
average 5.0
stdev 1.2
Table IX. Isotopic composition of dissolved sulfate. Units are ‰ vs. VCDT for S, and vs. VSMOW for O.
Sample Notes δ 34S δ 18O
Trib-9 Block P discharge 6.1 -13.0
Trib-11 Harrison seep 3.2 -13.0
Trib-13 Moulton seep 3.1 -13.3
Trib-19 Danny T seep 5.7 -13.6
GC-1 5.0 -12.1
GC-16 4.1 -13.8
avg 4.5 -13.1
stdev 1.3 0.6
48
4. Discussion
4.1. Metal Loading Summary and Concentration Comparisons to Regulatory Standards
Data from the synoptic investigation of this thesis can be used to help determine whether
there are significant sources of NARD in Galena Creek today. One indirect line of evidence of
NARD might be, for example, if all the known mine discharges and tributaries could not account
for the total metal load at the mouth of Galena Creek.
The percent of the total load of each contaminant of interest at the mouth of Galena Creek
(GC1) that can be accounted for from the five measured mine discharges (Moulton, Carter,
Block P, Grey Eagle, and Danny T) is summarized in Table X. During the investigation period,
the sum of the loads from the mine seeps accounts for 100% or more of the total load of Mn, Fe,
Cu, Zn, Tl, Al, and As at GC1. The mine seeps account for only 81% and 42% of the Cd and Pb
loads, respectively. However, when Galena Creek at GC13 (GC upstream of Green Creek) is
added as a highly contaminated tributary stream, it is seen that the load from the mine discharges
+ GC13 accounts for 87% and 83% of the Cd and Pb loads, respectively, at the mouth of Galena
Creek. These results demonstrate that the known mine discharges can account for nearly all, or
more than all, of the metal load at the mouth of Galena Creek. There is no need to assume that
there are additional loads coming from influent groundwater and/or NARD sources of
contamination. The relative contributions of each mine discharge to the total metal loads are
summarized in the pie graphs of Figures 21 to 22. Note, in Figures 21 and 22, “Upper Galena”
represents the incoming metal load from mine discharges and tributaries upstream of the
confluence with Green Creek.

49
Table X. Relative contribution of mine discharges to total metal loads in Galena Creek
Location Mn Fe Cu Zn Cd Pb Tl Al As
Mine discharges (dissolved load, mg/minute)
Moulton 421 20 15.2 154 0.65 - - - 0.32
Carter 47 4 0.2 11 - - 0.54 0.6 0.57
Block P 7069 13187 22.6 3148 7.46 20.5 1.11 986 11.6
Grey Eagle 60 1 1.8 88 0.50 3.53 0.03 42.6 0.03
Danny T 3322 4498 43.5 1693 5.07 5.17 0.07 479 6.97
Total Mine Seeps 10919 17709 83.3 5094 13.7 29.2 1.74 1508 19.5
Streams (total loads, mg/minute)
Upper Galena (GC13) 317 432 49.0 400 1.30 21.5 0.25 155 0.42
Galena at GC1 8408 8914 67.2 4795 16.9 69.4 1.65 1575 14.01
Percent of total load at GC1 accounted for by seeps and tribs
Mine seeps only 130% 199% 124% 106% 81% 42% 105% 100% 139%
Mine seeps + GC13 129% 203% 178% 113% 87% 83% 145% 110% 156%
The minor missing inputs for Pb and Cd shown in Figures 21, 22 and Table X can be
explained by Pb’s ability to attach and be carried by Fe and Al which would remove a minor part
of the suspended load from this dataset. A very small amount of Pb and Cd could also be
discharging from a minor leakage not sampleable as part of this study. This does not prove that
there was never NARD before mining occurred, just that there is likely not a major source of it in
the present day after mining disturbance. Since most of the highly mineralized rock was
removed by mining, natural weathering of this material is no longer a major source of metal
loading to the stream.

50
Figure 21. Total metal loads for contaminants of interest compared to the metal load of the mouth of
Galena Creek (Cu, Al, Fe, Tl).
Figure 22. Total metal loads for contaminants of interest compared to the metal load of the mouth of
Galena Creek (As, Mn, Cd, Pb).

51
Figure 23 plots the total and dissolved (filtered to 0.2 m) concentrations of Pb, Zn, Cu,
and Cd in Galena Creek along with the DEQ-7 hardness-adjusted standards for chronic exposure
to aquatic life (MTDEQ 2012). The State of Montana bases their aquatic life standards on total
recoverable (TR) concentrations, which involves a microwave/acid digestion of an unfiltered water
sample. In this thesis, “total concentrations” were measured on samples that were unfiltered and
acidified to 1% v/v with HNO3. Because these samples were never micro-wave digested, the
“total” concentrations reported in this thesis are equal to or less than the concentrations that would
have been obtained following TR protocols. However, this difference does not change any of the
major conclusions of this study.
As shown in Figure 23, concentrations of total Pb, Zn, Cu and Cd exceeded regulatory
standards (or were very close to the standards) for all samples in Galena Creek. Maximum
exceedances occur in the headwaters below the Tiger Mine, and again in the middle reach below
the Block P and Danny T discharges. Unlike Zn and Cd, there is a clear split between total and
dissolved concentrations for Cu and Pb. All filtered samples in the middle and lower reaches of
Galena Creek met regulatory standards for Cu and Pb, whereas total samples did not (although
total Cu at the mouth of Galena Creek below the confluence of Gold Run Creek was close to the
standard). This underscores the tendency of copper and lead to partition into suspended
(filterable) particles which remain suspended all the way to the mouth of Galena Creek.
Although thallium does not have an aquatic standard, concentrations of Tl in the middle reach of
Galena Creek are well above the EPA human-health standard of 0.24 mg/L (EPA, 2003), as
shown in Figure 10 of the Results. To the best of the author’s knowledge, there are no residents
in the area that rely on Galena Creek as a source of drinking water.
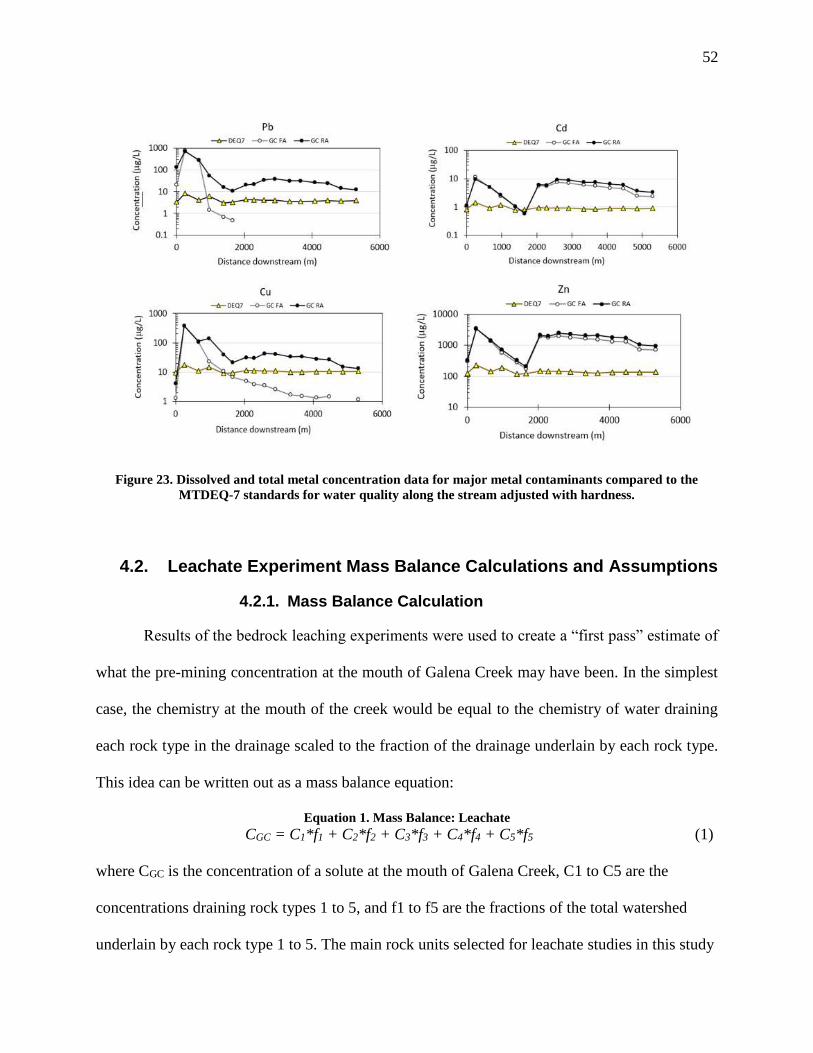
52
Figure 23. Dissolved and total metal concentration data for major metal contaminants compared to the
MTDEQ-7 standards for water quality along the stream adjusted with hardness.
4.2. Leachate Experiment Mass Balance Calculations and Assumptions
4.2.1. Mass Balance Calculation
Results of the bedrock leaching experiments were used to create a “first pass” estimate of
what the pre-mining concentration at the mouth of Galena Creek may have been. In the simplest
case, the chemistry at the mouth of the creek would be equal to the chemistry of water draining
each rock type in the drainage scaled to the fraction of the drainage underlain by each rock type.
This idea can be written out as a mass balance equation:
Equation 1. Mass Balance: Leachate
CGC = C1*f1 + C2*f2 + C3*f3 + C4*f4 + C5*f5 (1)
where CGC is the concentration of a solute at the mouth of Galena Creek, C1 to C5 are the
concentrations draining rock types 1 to 5, and f1 to f5 are the fractions of the total watershed
underlain by each rock type 1 to 5. The main rock units selected for leachate studies in this study

53
include: 1) the Wolf Porphyry; 2) the Clendennin porphyry; 3) the Gold Run Tuff; 4) the
unaltered Hughesville Stock; and 5) hydrothermally altered Hughesville Stock. Table XI
summarizes the concentrations of selected solutes in the last leachate sample collected for each
of these rock types, as well as the fraction of the total watershed that is underlain by each rock
type. Table XI also shows the estimated solute concentrations at the mouth of Galena Creek,
based on equation (1), the measured concentrations at the mouth of Galena Creek (GC-1,
filtered), and the ratio of the estimated/measured concentrations. Some solutes (e.g., Al, Fe, Cu,
As, Pb) have estimated concentrations that are much greater than their observed concentrations.
The most likely reason is that equation (1) assumes conservative behavior for all solutes.
Concentrations of dissolved Al and Fe coming from acidic seeps draining the hydrothermally
altered stock should drop sharply in Galena Creek because of precipitation of hydrous Al and Fe
oxides at pH values > 5. It can be assumed that As, Cu, and Pb would adsorb strongly onto these
hydrous metal oxides in a pre-mining scenario, just as they did in the synoptic sampling of this
thesis. Concentrations of major ions (Ca2+, Mg2+, K+, Na+, and SO42-), as well as the more
conservative trace elements (Mn, Zn, Cd, Tl), show reasonably good agreement between the
predicted and measured values. The higher predicted concentrations of Ca and Mg compared to
their measured values might be because no attempt was made to include Paleozoic sedimentary
rock in the mass balance equation. Although Paleozoic rocks do not cover a large area of the
drainage, water draining these rocks could have high Ca/Mg content owing to the presence of
carbonates (limestone, dolomite) in the section.
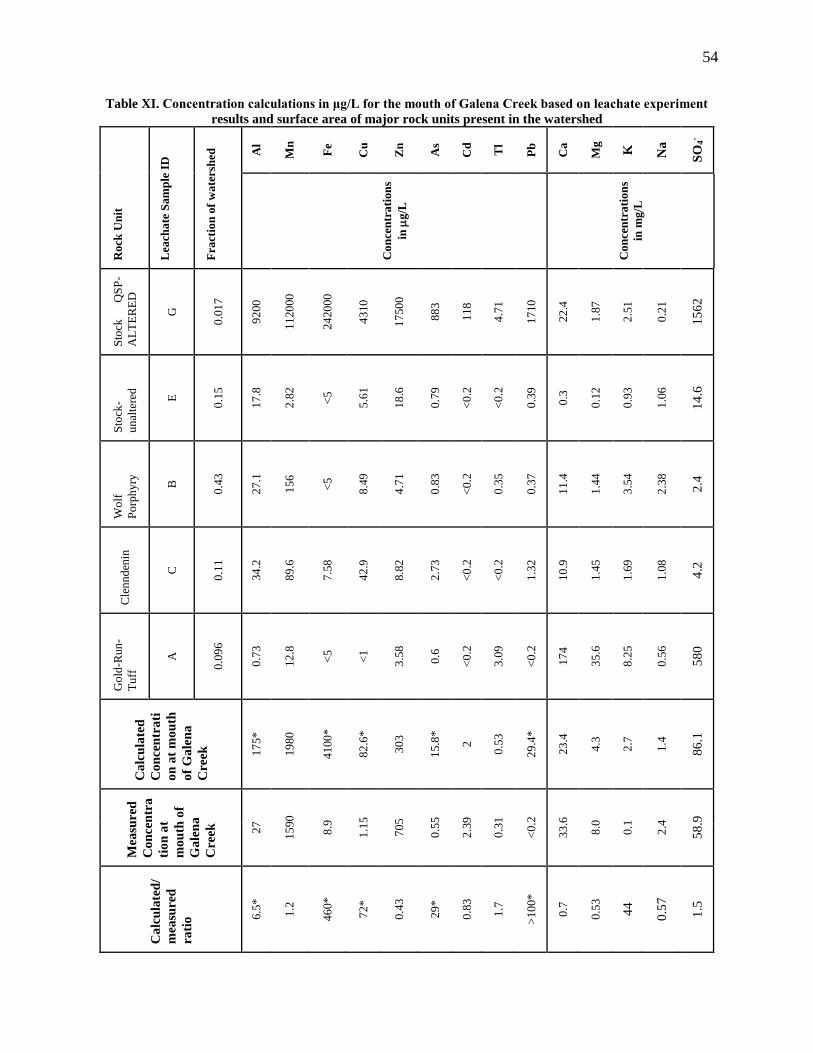
54
Table XI. Concentration calculations in μg/L for the mouth of Galena Creek based on leachate experiment
results and surface area of major rock units present in the watershed R
ock
Un
it
Lea
cha
te S
am
ple
ID
Fra
ctio
n o
f w
ate
rsh
ed
Al
Mn
Fe
Cu
Zn
As
Cd
Tl
Pb
Ca
Mg
K
Na
SO
4-
Co
nce
ntr
ati
on
s
in
g/L
Co
nce
ntr
ati
on
s
in m
g/L
Sto
ck
QS
P-
AL
TE
RE
D
G
0.0
17
92
00
11
20
00
24
20
00
43
10
17
50
0
88
3
11
8
4.7
1
17
10
22
.4
1.8
7
2.5
1
0.2
1
15
62
Sto
ck-
un
alte
red
E
0.1
5
17
.8
2.8
2
<5
5.6
1
18
.6
0.7
9
<0
.2
<0
.2
0.3
9
0.3
0.1
2
0.9
3
1.0
6
14
.6
Wo
lf
Po
rph
yry
B
0.4
3
27
.1
15
6
<5
8.4
9
4.7
1
0.8
3
<0
.2
0.3
5
0.3
7
11
.4
1.4
4
3.5
4
2.3
8
2.4
Cle
nn
den
in
C
0.1
1
34
.2
89
.6
7.5
8
42
.9
8.8
2
2.7
3
<0
.2
<0
.2
1.3
2
10
.9
1.4
5
1.6
9
1.0
8
4.2
Go
ld-R
un
-
Tu
ff
A
0.0
96
0.7
3
12
.8
<5
<1
3.5
8
0.6
<0
.2
3.0
9
<0
.2
17
4
35
.6
8.2
5
0.5
6
58
0
Ca
lcu
late
d
Co
nce
ntr
ati
on
at
mo
uth
of
Ga
len
a
Cre
ek
17
5*
19
80
41
00
*
82
.6*
30
3
15
.8*
2
0.5
3
29
.4*
23
.4
4.3
2.7
1.4
86
.1
Mea
sure
d
Co
nce
ntr
a
tio
n a
t
mo
uth
of
Ga
len
a
Cre
ek
27
15
90
8.9
1.1
5
70
5
0.5
5
2.3
9
0.3
1
<0
.2
33
.6
8.0
0.1
2.4
58
.9
Ca
lcu
late
d/
mea
sure
d
rati
o 6.5
*
1.2
46
0*
72
*
0.4
3
29
*
0.8
3
1.7
>1
00*
0.7
0.5
3
44
0.5
7
1.5
55
4.2.2. Limitations to the Mass Balance Model
There are several reasons why the predicted chemistry for the mouth of Galena Creek
based on the mass balance approach discussed in the preceding section could be in error. These
include:
i) The bedrock samples collected in the field might not be representative of each rock
type. For example, the bulk sample of “hydrothermally altered Hughesville stock” was collected
from pieces of waste rock located near the Block P portal and may have been biased to a higher
pyrite content compared to the altered stock as a whole.
ii) Although the leachate tests were conducted over a 5-week period, it is unlikely that a
steady state solute release rate was attained for all the samples. Some of the graphs of solute
concentration vs. time for the leachate samples show a general decrease in concentration in many
cases not reaching a steady-state value.
iii) The rate of release of solutes from the leaching tests may not match the actual rate of
solute release in the natural setting due to chemical weathering. In fact, it is likely that the release
of solutes is more rapid in the benchtop experiments since the humidity cells are designed to
simulate “accelerated” chemical weathering.
Points (i) and (iii) are probably the biggest sources of uncertainty in the mass balance
model. These limitations would have been very difficult if not impossible to get around in a
study such as this thesis that had limited funding and time.
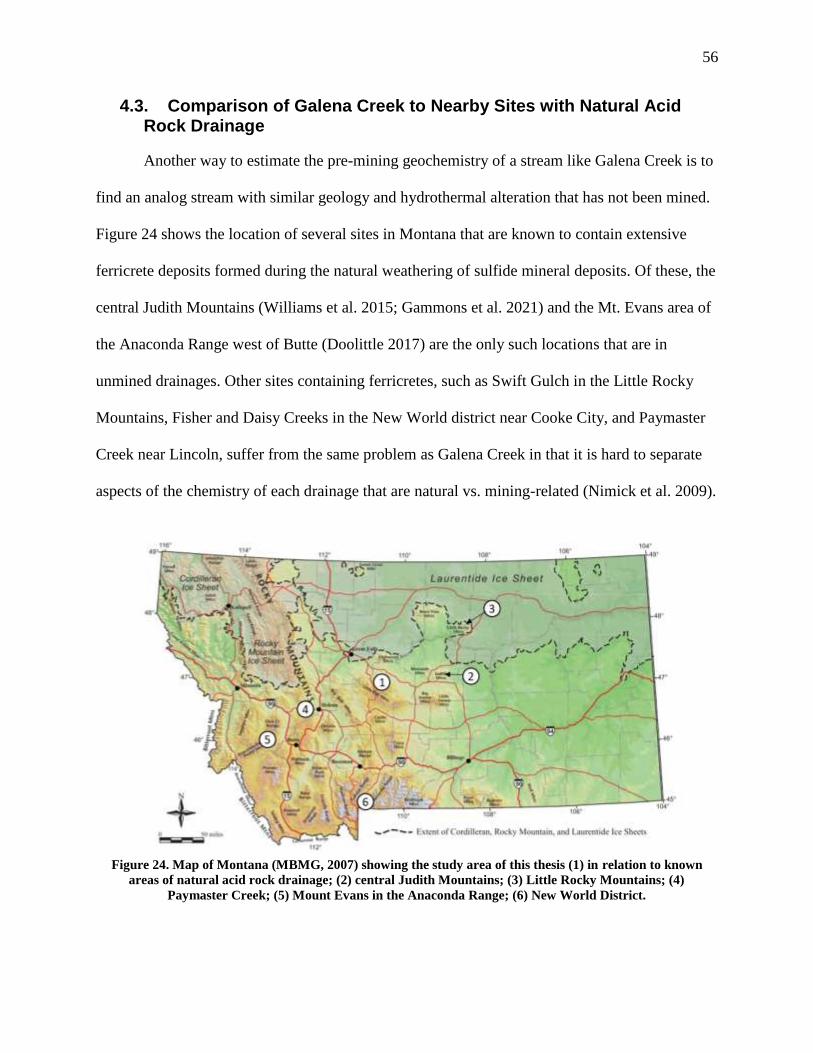
56
4.3. Comparison of Galena Creek to Nearby Sites with Natural Acid Rock Drainage
Another way to estimate the pre-mining geochemistry of a stream like Galena Creek is to
find an analog stream with similar geology and hydrothermal alteration that has not been mined.
Figure 24 shows the location of several sites in Montana that are known to contain extensive
ferricrete deposits formed during the natural weathering of sulfide mineral deposits. Of these, the
central Judith Mountains (Williams et al. 2015; Gammons et al. 2021) and the Mt. Evans area of
the Anaconda Range west of Butte (Doolittle 2017) are the only such locations that are in
unmined drainages. Other sites containing ferricretes, such as Swift Gulch in the Little Rocky
Mountains, Fisher and Daisy Creeks in the New World district near Cooke City, and Paymaster
Creek near Lincoln, suffer from the same problem as Galena Creek in that it is hard to separate
aspects of the chemistry of each drainage that are natural vs. mining-related (Nimick et al. 2009).
Figure 24. Map of Montana (MBMG, 2007) showing the study area of this thesis (1) in relation to known
areas of natural acid rock drainage; (2) central Judith Mountains; (3) Little Rocky Mountains; (4)
Paymaster Creek; (5) Mount Evans in the Anaconda Range; (6) New World District.

57
Of the sites shown in Figure 24, the Red Mountain area of the Judith Mountains is
probably the closest analog to Galena Creek. As discussed by Williams et al. (2015), three small
streams draining different sides of Red Mountain are strongly acidic (pH < 4) in their
headwaters, grading to near-neutral pH with increased distance downstream. A recent study
(Gammons et al., 2021) looked in detail at one of these streams named Chicago Gulch.
Similarities between Galena Creek and Chicago Gulch include: i) they have a similar drainage
area and streamflow; ii) they have a similar climate and range in elevations; and iii) they have a
similar geology. The geology of the headwaters of Chicago Gulch consists of a Tertiary-aged,
hydrothermally altered granitic stock, a similar situation to the Hughesville Stock of Galena
Creek. One important difference is that Red Mountain is strongly altered and pyrite-rich over its
entire outcrop area, whereas only 10 to 20% of the Hughesville Stock is hydrothermally altered
(Witikind, 1973).
Filtered solute concentrations measured in Chicago Gulch by Gammons et al. (2021) are
compared to Galena Creek (this study) for aluminum, manganese, iron, and sulfate (Figure 25),
and zinc, arsenic, cadmium, thallium, and lead (Figure 26). Both studies involved a detailed
synoptic sampling conducted in summer baseflow conditions. The complete set of synoptic
samples, collected from the top to the bottom of each watershed, is summarized side-by-side
using box-and-whisker plots. The results show higher concentrations of some solutes in Galena
Creek compared to Chicago Gulch, including Mn, Zn, and Cd. Other solutes, including sulfate,
As and Tl, show a similar range in concentration in the two drainages. Still other solutes,
including Al, Fe, and Pb, have higher overall concentrations in the unmined drainage (Chicago
Gulch) compared to the mined drainage (Galena Creek).

58
The comparable levels of dissolved metals combined with the similarities in geology
between the two streams support the idea that the Judith Mountains could be used as an analog
site for the Galena Creek watershed. The biggest difference between the two sites, besides the
lack of mining history in the Judith Mountains, is the larger extent of hydrothermally altered rock
rich in pyrite at the summit and flanks of Red Mountain at Chicago Gulch compared to the lesser
surface area of hydrothermally altered rock in the Galena Creek watershed.
Figure 25. Box and whisker plot showing the range in concentrations of dissolved Al, Mn, Fe, and sulfate in
Chicago Gulch (CG) and Galena Creek (GC), measured during baseflow conditions (data for CG from
Gammons et al., 2021).
Co
nce
ntr
atio
n (
Al, M
n,
Fe
in
g/L
; S
O4 in
mg/L
)
1e+0
1e+1
1e+2
1e+3
1e+4
1e+5
CG GC CG GC CG GC CG GC
Aluminum Manganese Iron Sulfate
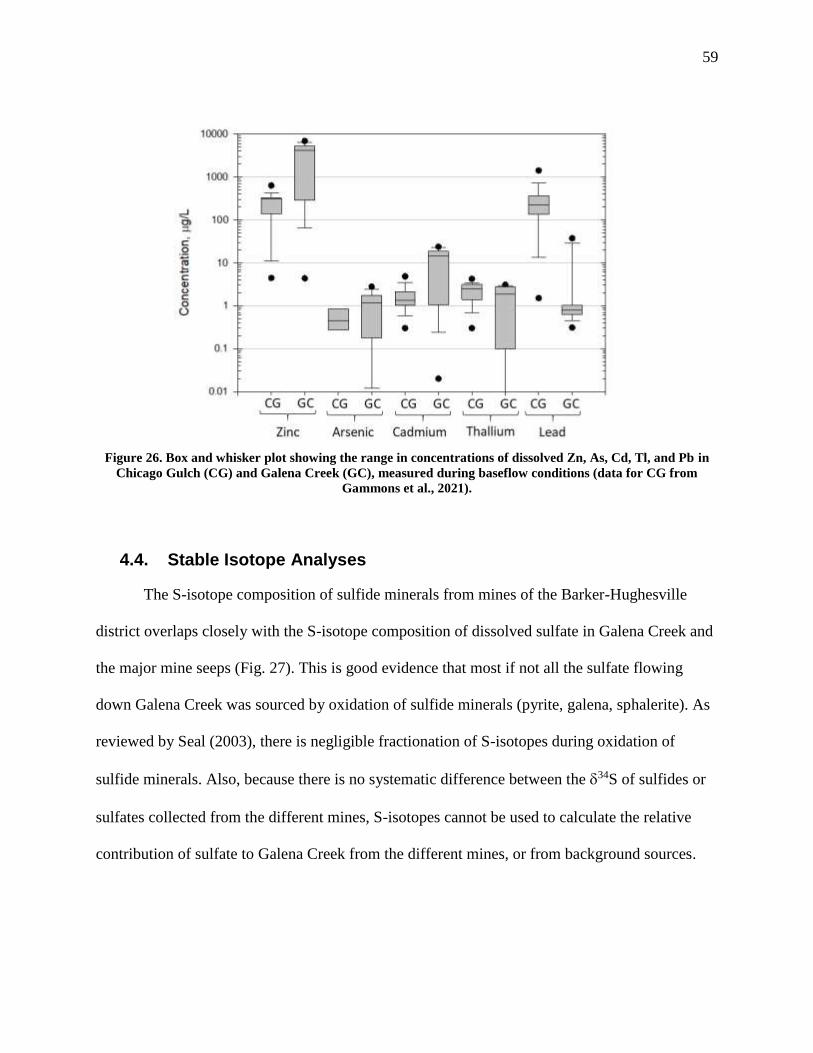
59
Figure 26. Box and whisker plot showing the range in concentrations of dissolved Zn, As, Cd, Tl, and Pb in
Chicago Gulch (CG) and Galena Creek (GC), measured during baseflow conditions (data for CG from
Gammons et al., 2021).
4.4. Stable Isotope Analyses
The S-isotope composition of sulfide minerals from mines of the Barker-Hughesville
district overlaps closely with the S-isotope composition of dissolved sulfate in Galena Creek and
the major mine seeps (Fig. 27). This is good evidence that most if not all the sulfate flowing
down Galena Creek was sourced by oxidation of sulfide minerals (pyrite, galena, sphalerite). As
reviewed by Seal (2003), there is negligible fractionation of S-isotopes during oxidation of
sulfide minerals. Also, because there is no systematic difference between the 34S of sulfides or
sulfates collected from the different mines, S-isotopes cannot be used to calculate the relative
contribution of sulfate to Galena Creek from the different mines, or from background sources.
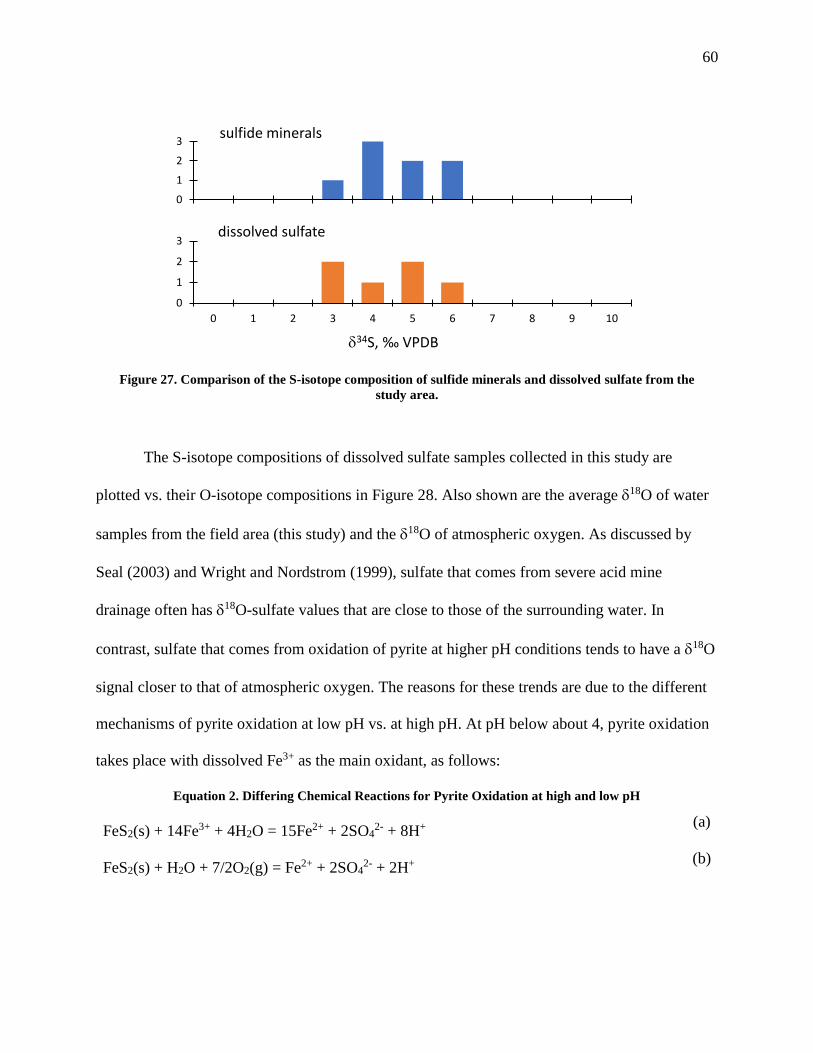
60
Figure 27. Comparison of the S-isotope composition of sulfide minerals and dissolved sulfate from the
study area.
The S-isotope compositions of dissolved sulfate samples collected in this study are
plotted vs. their O-isotope compositions in Figure 28. Also shown are the average 18O of water
samples from the field area (this study) and the 18O of atmospheric oxygen. As discussed by
Seal (2003) and Wright and Nordstrom (1999), sulfate that comes from severe acid mine
drainage often has 18O-sulfate values that are close to those of the surrounding water. In
contrast, sulfate that comes from oxidation of pyrite at higher pH conditions tends to have a 18O
signal closer to that of atmospheric oxygen. The reasons for these trends are due to the different
mechanisms of pyrite oxidation at low pH vs. at high pH. At pH below about 4, pyrite oxidation
takes place with dissolved Fe3+ as the main oxidant, as follows:
Equation 2. Differing Chemical Reactions for Pyrite Oxidation at high and low pH
FeS2(s) + 14Fe3+ + 4H2O = 15Fe2+ + 2SO42- + 8H+
(a)
FeS2(s) + H2O + 7/2O2(g) = Fe2+ + 2SO42- + 2H+
(b)
0
1
2
3
0 1 2 3 4 5 6 7 8 9 10
sulfide minerals
0
1
2
3
0 1 2 3 4 5 6 7 8 9 10
dissolved sulfate
34S, ‰ VPDB
61
In reaction (a), it makes sense that most of the O molecules in sulfate would come from
water. As opposed to, when pH > 4, Fe3+ is no longer soluble, and pyrite oxidation involves
atmospheric oxygen. In reaction (b), there is a greater likelihood that some O in sulfate would be
inherited from O2 (g). If the above assumptions are correct, this would lead to a positive
correlation between 18O-sulfate and pH across a spectrum of acidic environments. Because
natural acid rock drainage (NARD) is thought to take place at pH’s that are higher than acid
mine drainage (AMD), this could mean that sulfate coming from NARD would have a higher
(more positive) value of 18O than sulfate coming from AMD. In fact, the situation is not this
simple, and there are other side-reactions that complicate the O-isotope mass balance during
oxidation of pyrite (Seal, 2003).
Probably the most important conclusion from the isotope results of this thesis is that the
S- and O-isotope composition of sulfate at the mouth of Galena Creek is essentially the same as
that of sulfate coming from the known mine discharges. There is no evidence, isotopically, to
suggest that significant sulfate is entering the creek from other sources, such as natural acid rock
drainage. However, this does not mean that sulfate did not enter the creek from NARD prior to
mining in the watershed.
62
Figure 28. S- vs. O-isotope crossplot for dissolved sulfate at the mouth of Galena Creek (filled diamond)
and tributary mine seeps and springs (open circles). Values from Tables VIII & IX.
-5
0
5
10
-20 -10 0 10 20 30
δ34S
, ‰
VP
DB
δ18O, ‰ VSMOW
local meteoric
water
atmospheric
O2 (g)
range in δ34S
of sulfides
dissolved sulfate
63
5. Conclusions
The following are some of the more important findings of this thesis:
Despite contamination from historic mining, most of Galena Creek under baseflow
conditions has a near-neutral pH over its middle and lower reaches and has improved
since recent constructional and reclamation efforts were completed.
During mid-summer, most of the water flowing down Galena Creek can be accounted for
by mine discharges and tributary streams. Groundwater inflows are negligible under
baseflow conditions.
Most or all of the loads of each contaminant of interest (Al, As, Cd, Cu, Fe, Mn, Pb, Zn,
sulfate) in Galena Creek today can be traced to the known discharges from the historic
mines.
Dissolved Al and Fe from mine discharges precipitates as hydrous Al and Fe oxides after
dilution and oxidation with the main stem of Galena Creek. Some metals (e.g., As, Pb,
Cu) adsorb strongly onto the hydrous Al-Fe oxides, a fraction of which remains
suspended all the way to the mouth of Galena Creek. Other metals (e.g., Zn, Cd, Tl)
adsorb weakly onto the hydrous oxides, and therefore behave conservatively.
The Hughesville Stock, in the center of the district, is mineralized and hydrothermally
altered. Leachates produced by interacting synthetic precipitation with pyrite-rich
Hughesville Stock had low pH (< 3) and very high concentrations of several
contaminants of interest, including As, Cd, Cu, Pb, Tl, Zn, and sulfate. Natural
weathering of this altered rock could have contributed metals and acidity to Galena Creek
prior to historic mining.
64
Concentrations of trace metals and sulfate in Galena Creek are broadly similar to those in
Chicago Gulch, a small stream with natural acid rock drainage in the central Judith
Mountains of Montana. Because Chicago Gulch has a similar-sized watershed with a
similar climate and geology, it could possibly be used as reference or analog site to
Galena Creek.
The stable S-isotope composition of dissolved sulfate in Galena Creek is similar to that of
sulfide minerals (pyrite, sphalerite, galena) collected from several mine dumps in the
study area. Also, the S- and O-isotope composition of dissolved sulfate in the Galena
Creek is similar to that of sulfate coming from the mine discharges. This means that the
main source of sulfate in Galena Creek is oxidation of pyrite and other sulfide minerals in
the mine workings.
Although there is little chemical or isotopic evidence for natural acid rock drainage
occurring in Galena Creek today, this does not mean that NARD did not occur prior to
mining. In fact, the leachate studies conducted in this thesis, coupled with a comparison
to Chicago Gulch (a possible analog site), suggests that significant loading of acidity,
metals and sulfate would have occurred due to natural weathering of the mineralized
Hughesville Stock.
65
6. References
Carmody, R.W., Plummer, L.N., Busenberg, E., Coplen, T.B.,1998. Methods for collection of
dissolved sulfate and sulfide and analysis of their sulfur isotopic composition. U.S. Geol
.Surv., Open File Report 997–234.
CDM Smith, (2016). Remedial Investigation Report, Barker Hughesville Mining District,
Cascade and Judith Basin Counties.
Craig H. (1961) Isotopic variations in meteoric waters. Science, v.133(3465), p.1702-1703.
Doolittle M. (2017) Naturally occurring acid rock drainage in the Anaconda-Pintler Mountain
Range, Montana: A case study of geochemistry in two streams flowing from Mount
Evans. Montana Tech. Univ., Non-thesis research paper.
(https://digitalcommons.mtech.edu/grad_rsch/117/
Edinberg S. C. (2016) Natural acid rock drainage chemistry and ferricrete deposit chemistry of
the Judith Mountains, Montana. M.S. thesis, Montana Technol. Univ., Butte, MT.
EPA (2003) U.S. Environmental Protection Agency, National Recommended Water Quality
Criteria - Human Health Criteria Table. https://www.epa.gov/wqc/national-
recommended-water-quality-criteria-human-health-criteria-table. Retrieved 2021-04-12.
Furniss, G., Hinman, N.W., Doyle, G.A., Runnells, D.D. (1999) Radiocarbon-dated ferricrete
provides a record of natural acid rock drainage and paleoclimate changes, New World
Mining District, MT. U.S.A. Environ. Geol. v. 37, p. 102–106.
Gammons C. H., Poulson S. R., Pellicori D. A., Reed,P. J., Roesler A. J., & Petrescu E. M.
(2006) The hydrogen and oxygen isotopic composition of precipitation, evaporated mine
water, and river water in Montana, USA. Journal of Hydrology, v. 328, p. 319-330.
66
Gammons C.H., Edinberg S.C., Gammons C.H., Parker S.R., Ogawa Y. (2021) Geochemistry of
natural acid rock drainage in the Judith Mountains, Montana, Part 2: Seasonal and spatial
trends in Chicago Gulch. Applied Geochemistry, in press,
https://doi.org/10.1016/j.apgeochem.2021.104968
Gammons C.H., Doolittle M., Eastman K., and Poulson S.R. (in review) Geochemistry of natural
acid rock drainage in the Anaconda-Pintler Mountains, Montana, USA. Submitted to J.
of Geochemical Exploration.
Giesemann, A., Jager, H.J., Norman, A.L., Krouse, H.P., Brand,W.A. (1994) On-line sulfur-
isotope determination using anelemental analyzer coupled to a mass spectrometer.
Analytical Chemistry, v. 66, p. 2816–2819.
Kornexl, B.E., Gehre, M., Hoffling, R., Werner, R.A. (1999) On-line 18O measurement of
organic and inorganic substances. Rapid Commun. Mass Spectrom. v. 13, p. 1685–1693.
MBMG (2007) Geologic Map of Montana. Mont. Bur. Mines Geol, Geol. Map 62, 67p.
http://www.mbmg.mtech.edu/pdf/GM62_2007Booklet.pdf
MTDEQ (2012). Montana Department of Environmental Quality, DEQ-7 Montana Numeric
Water Quality Standards.
Moore, R.D. (2004) Introduction to salt dilution gauging for stream flow measurement: Part 1.
Streamline Watershed Management Bull., v. 7(4), p. 20-23.
Nimick, D. A., Gurrieri, J. T., & Furniss, G., (2009). An empirical method for estimating
instream pre-mining pH and dissolved cu concentration in catchments with acidic
drainage and ferricrete. Applied Geochemistry, v. 24, p. 106-119.
http://dx.doi.org/10.1016/j.apgeochem.2008.11.007 7.
67
Nordstrom D. K. (2015) Baseline and premining geochemical characterization of mined sites.
Applied Geochemistry, v. 57, p. 17-34. doi:10.1016/j.apgeochem.2014.12.010
Seal II, R. R. (2003) Stable-isotope geochemistry of mine waters and related solids. Mineral.
Soc. Canada, Short Course Series 31, 303-334.
Spiroff K. (1938) Geological observations of the Block P mine, Hughesville, Montana: Econ.
Geology, v. 33, p. 554-567.
Walker, G.E. (1991) Geology of the Barker mining district, Judith Basin and Cascade Counties,
Montana, in Baker, D.W., and Berg, R.B., eds., Guidebook of the Central Montana
alkalic province: Montana Bureau of Mines and Geology Special Publication 100, p. 28–
37
Weed W. H. (1900) Geology of the Little Belt Mountains, Montana, with notes on the mineral
deposits of the Neihart, Barker, Yogo, and other districts; accompanied by a report on
the petrography of the igneous rocks of the district, by L. V. Pirsson: U.S. Geol. Survey
20th Ann. Rept. (1898-99), pt. 3, p 257-581.
Williams G. P., Petteys K., Gammons C. H., & Parker S. R. (2015) An investigation of acidic
head-water streams in the Judith Mountains, Montana, USA. Applied Geochemistry, v.
62, p. 48-60.
Wood, Environment & Infrastructure, Inc. (2020) 2017-2019 Mine Workings Construction
Completion Report, Block P Mine Complex, Barker-Hughesville Mining District,
Monarch, Montana.
Wright W. G., Nordstrom K. D. (1999) Oxygen isotopes of dissolved sulfate as a tool to
distinguish natural and mining-related dissolved constituents. In: Tailings and Mine
Waste 99 Rotterdam Balkema (1999), p. 671-678

68
Witkind, I. J. (1973) Igneous rocks and related mineral deposits of the Barker Quadrangle, Little
Belt Mountains, Montana. U. S. Geol. Surv., Professional Paper 752, 58 p.

69
7. Appendix A: Supplementary Parameter Data
7.1. Table A-1: Parameter Data for Galena Creek
Sample Date Time Distance
Downstream
meters
SC
µS/cm
pH DO
mg/L
Eh
mV
Temp
°C
Alkalinity
mg/L
CaCO3
GC 1 7/20/2020 8:30 5299 256 7.54 10.20 155 8.09 56
GC 2 7/20/2020 9:42 4849 251 7.69 9.95 136 8.64 56
GC 3 7/20/2020 10:30 4461 280 7.33 10.31 94 9.54 32
GC 4 7/20/2020 11:05 4087 275 7.36 9.75 144 9.73 30
GC 5 7/20/2020 11:50 3664 270 7.23 9.81 167 9.55 18
GC 6 7/20/2020 12:10 3335 272 7.18 9.68 174 9.88 18
GC 7 7/20/2020 13:45 2904 299 7.28 8.82 179 12.52 8
GC 8 7/20/2020 14:50 2582 306 6.78 8.65 187 13.27 18
GC 9 7/20/2020 15:40 2282 314 6.70 8.67 192 12.97 20
GC 10 7/20/2020 16:45 2049 328 6.44 8.98 218 11.64 21
GC 11 7/20/2020 17:35 1652 226 7.21 9.60 302 8.71 40
GC 12 7/20/2020 18:35 1392 226 7.42 9.67 236 7.82 39
GC 13 7/21/2020 10:15 972 361 7.10 9.98 184 6.53 N/A
GC 14 7/21/2020 11:22 661 432 3.76 9.26 606 8.26 N/A
GC 16 7/21/2020 13:45 249 950 5.58 9.77 673 10.47 N/A
GC 15 7/21/2020 12:45 0 275 6.93 7.91 274 8.45 54
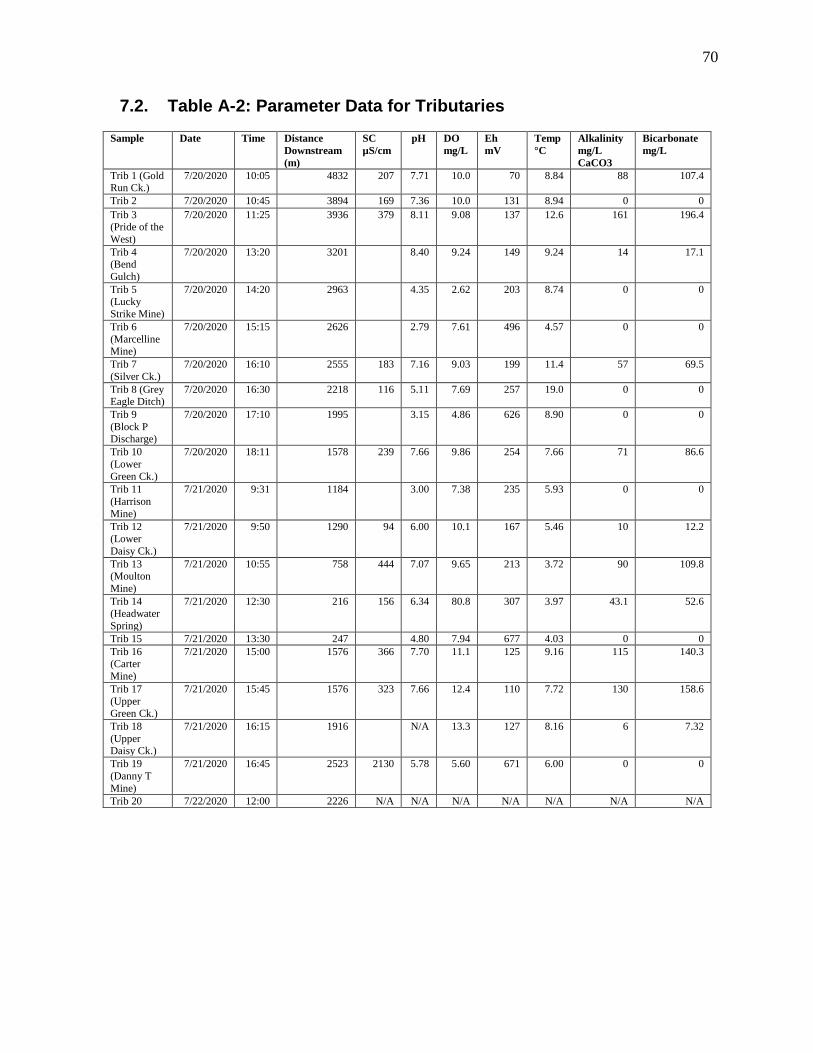
70
7.2. Table A-2: Parameter Data for Tributaries
Sample Date Time Distance
Downstream
(m)
SC
µS/cm
pH DO
mg/L
Eh
mV
Temp
°C
Alkalinity
mg/L
CaCO3
Bicarbonate
mg/L
Trib 1 (Gold Run Ck.)
7/20/2020 10:05 4832 207 7.71 10.0 70 8.84 88 107.4
Trib 2 7/20/2020 10:45 3894 169 7.36 10.0 131 8.94 0 0
Trib 3 (Pride of the
West)
7/20/2020 11:25 3936 379 8.11 9.08 137 12.6 161 196.4
Trib 4 (Bend
Gulch)
7/20/2020 13:20 3201
8.40 9.24 149 9.24 14 17.1
Trib 5 (Lucky
Strike Mine)
7/20/2020 14:20 2963
4.35 2.62 203 8.74 0 0
Trib 6
(Marcelline Mine)
7/20/2020 15:15 2626
2.79 7.61 496 4.57 0 0
Trib 7
(Silver Ck.)
7/20/2020 16:10 2555 183 7.16 9.03 199 11.4 57 69.5
Trib 8 (Grey Eagle Ditch)
7/20/2020 16:30 2218 116 5.11 7.69 257 19.0 0 0
Trib 9
(Block P Discharge)
7/20/2020 17:10 1995
3.15 4.86 626 8.90 0 0
Trib 10
(Lower
Green Ck.)
7/20/2020 18:11 1578 239 7.66 9.86 254 7.66 71 86.6
Trib 11
(Harrison
Mine)
7/21/2020 9:31 1184
3.00 7.38 235 5.93 0 0
Trib 12 (Lower
Daisy Ck.)
7/21/2020 9:50 1290 94 6.00 10.1 167 5.46 10 12.2
Trib 13 (Moulton
Mine)
7/21/2020 10:55 758 444 7.07 9.65 213 3.72 90 109.8
Trib 14 (Headwater
Spring)
7/21/2020 12:30 216 156 6.34 80.8 307 3.97 43.1 52.6
Trib 15 7/21/2020 13:30 247
4.80 7.94 677 4.03 0 0
Trib 16 (Carter
Mine)
7/21/2020 15:00 1576 366 7.70 11.1 125 9.16 115 140.3
Trib 17
(Upper Green Ck.)
7/21/2020 15:45 1576 323 7.66 12.4 110 7.72 130 158.6
Trib 18
(Upper Daisy Ck.)
7/21/2020 16:15 1916
N/A 13.3 127 8.16 6 7.32
Trib 19
(Danny T
Mine)
7/21/2020 16:45 2523 2130 5.78 5.60 671 6.00 0 0
Trib 20 7/22/2020 12:00 2226 N/A N/A N/A N/A N/A N/A N/A

71
8. Appendix B: Supplementary Anion Data
8.1. Table B-1: Anion Data for Galena Creek
Sample Distance
Downstream
(m)
Fluoride Chloride Sulfate Bicarbonate
GC-1 5299 0.17 0.39 59 68.3
GC-2 4849 0.17 0.38 55 68.3
GC-3 4461 0.22 0.41 95 39.5
GC-4 4087 0.22 0.40 95 36.8
GC-5 3664 0.23 0.40 110 22.1
GC-6 3335 0.23 0.41 112 21.4
GC-7 2904 0.26 0.41 125 9.15
GC-8 2582 0.25 0.42 128 21.6
GC-9 2282 0.22 0.41 126 24.3
GC-10 2049 0.20 0.42 131 25.6
GC-11 1652 0.11 0.37 59 48.9
GC-12 1392 0.10 0.38 73 47.6
GC-13 972 0.10 0.36 138 0
GC-14 661 0.09 0.38 217 0
GC-16 249 0.23 0.41 526 0
GC-15 0 0.15 0.53 34 65.9
8.2. Table B-2: Anion Data for Tributaries
Tributary Fluoride Chloride Sulfate Bicarbonate
1 0.12 0.36 7.44 107.4
7 0.13 0.35 24.3 69.5
9 1.61 1.70 1305 0
10 0.16 0.36 37.8 86.6
11 0.38 1.38 69.6 0
12 0.12 0.40 30.3 12.2
13 0.13 0.38 129 109.8
14 0.07 0.33 13.5 52.6
15 0.22 0.38 652 0
16 0.20 0.39 59.4 140.3
17 0.11 0.34 26.4 158.6
18 0.33 0.41 41.4 7.32
19 2.16 1.81 1802 0
20 0.60 0.50 363 N/A
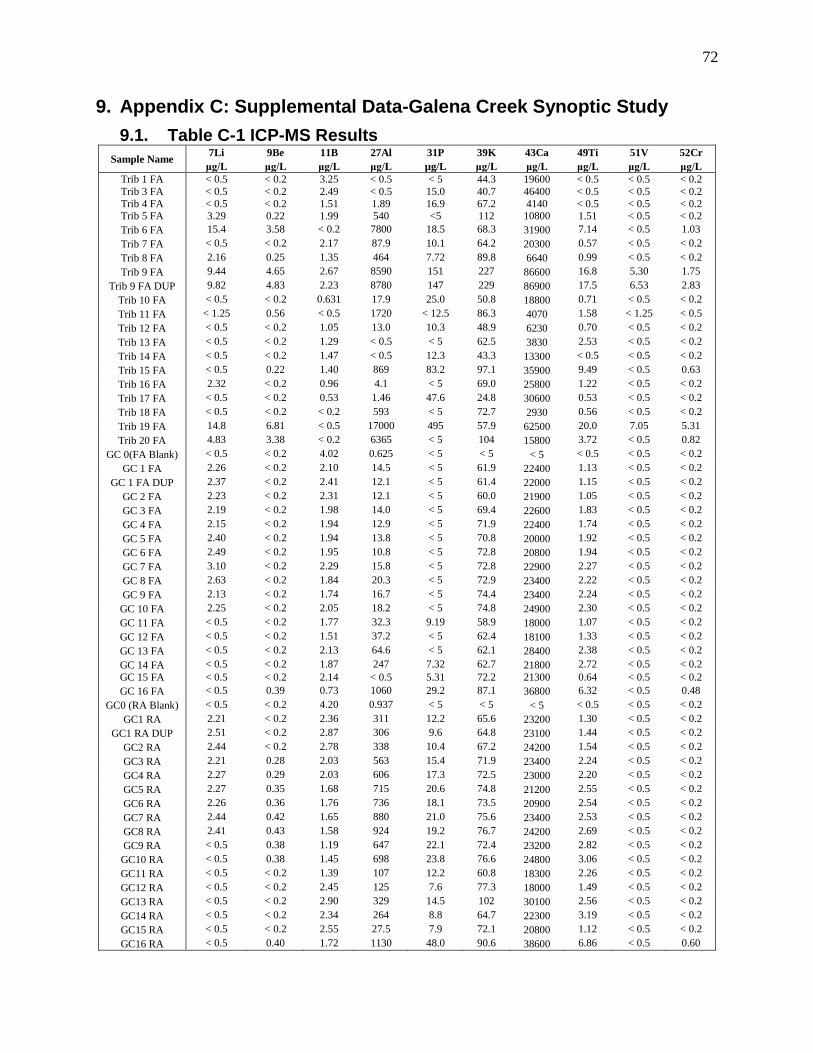
72
9. Appendix C: Supplemental Data-Galena Creek Synoptic Study
9.1. Table C-1 ICP-MS Results
Sample Name 7Li 9Be 11B 27Al 31P 39K 43Ca 49Ti 51V 52Cr
μg/L μg/L μg/L μg/L µg/L μg/L μg/L μg/L μg/L μg/L
Trib 1 FA < 0.5 < 0.2 3.25 < 0.5 < 5 44.3 19600 < 0.5 < 0.5 < 0.2
Trib 3 FA < 0.5 < 0.2 2.49 < 0.5 15.0 40.7 46400 < 0.5 < 0.5 < 0.2
Trib 4 FA < 0.5 < 0.2 1.51 1.89 16.9 67.2 4140 < 0.5 < 0.5 < 0.2 Trib 5 FA 3.29 0.22 1.99 540 <5 112 10800 1.51 < 0.5 < 0.2
Trib 6 FA 15.4 3.58 < 0.2 7800 18.5 68.3 31900 7.14 < 0.5 1.03
Trib 7 FA < 0.5 < 0.2 2.17 87.9 10.1 64.2 20300 0.57 < 0.5 < 0.2
Trib 8 FA 2.16 0.25 1.35 464 7.72 89.8 6640 0.99 < 0.5 < 0.2
Trib 9 FA 9.44 4.65 2.67 8590 151 227 86600 16.8 5.30 1.75
Trib 9 FA DUP 9.82 4.83 2.23 8780 147 229 86900 17.5 6.53 2.83
Trib 10 FA < 0.5 < 0.2 0.631 17.9 25.0 50.8 18800 0.71 < 0.5 < 0.2
Trib 11 FA < 1.25 0.56 < 0.5 1720 < 12.5 86.3 4070 1.58 < 1.25 < 0.5
Trib 12 FA < 0.5 < 0.2 1.05 13.0 10.3 48.9 6230 0.70 < 0.5 < 0.2
Trib 13 FA < 0.5 < 0.2 1.29 < 0.5 < 5 62.5 3830 2.53 < 0.5 < 0.2
Trib 14 FA < 0.5 < 0.2 1.47 < 0.5 12.3 43.3 13300 < 0.5 < 0.5 < 0.2
Trib 15 FA < 0.5 0.22 1.40 869 83.2 97.1 35900 9.49 < 0.5 0.63
Trib 16 FA 2.32 < 0.2 0.96 4.1 < 5 69.0 25800 1.22 < 0.5 < 0.2
Trib 17 FA < 0.5 < 0.2 0.53 1.46 47.6 24.8 30600 0.53 < 0.5 < 0.2
Trib 18 FA < 0.5 < 0.2 < 0.2 593 < 5 72.7 2930 0.56 < 0.5 < 0.2
Trib 19 FA 14.8 6.81 < 0.5 17000 495 57.9 62500 20.0 7.05 5.31
Trib 20 FA 4.83 3.38 < 0.2 6365 < 5 104 15800 3.72 < 0.5 0.82
GC 0(FA Blank) < 0.5 < 0.2 4.02 0.625 < 5 < 5 < 5 < 0.5 < 0.5 < 0.2
GC 1 FA 2.26 < 0.2 2.10 14.5 < 5 61.9 22400 1.13 < 0.5 < 0.2
GC 1 FA DUP 2.37 < 0.2 2.41 12.1 < 5 61.4 22000 1.15 < 0.5 < 0.2
GC 2 FA 2.23 < 0.2 2.31 12.1 < 5 60.0 21900 1.05 < 0.5 < 0.2
GC 3 FA 2.19 < 0.2 1.98 14.0 < 5 69.4 22600 1.83 < 0.5 < 0.2
GC 4 FA 2.15 < 0.2 1.94 12.9 < 5 71.9 22400 1.74 < 0.5 < 0.2
GC 5 FA 2.40 < 0.2 1.94 13.8 < 5 70.8 20000 1.92 < 0.5 < 0.2
GC 6 FA 2.49 < 0.2 1.95 10.8 < 5 72.8 20800 1.94 < 0.5 < 0.2
GC 7 FA 3.10 < 0.2 2.29 15.8 < 5 72.8 22900 2.27 < 0.5 < 0.2
GC 8 FA 2.63 < 0.2 1.84 20.3 < 5 72.9 23400 2.22 < 0.5 < 0.2
GC 9 FA 2.13 < 0.2 1.74 16.7 < 5 74.4 23400 2.24 < 0.5 < 0.2
GC 10 FA 2.25 < 0.2 2.05 18.2 < 5 74.8 24900 2.30 < 0.5 < 0.2
GC 11 FA < 0.5 < 0.2 1.77 32.3 9.19 58.9 18000 1.07 < 0.5 < 0.2
GC 12 FA < 0.5 < 0.2 1.51 37.2 < 5 62.4 18100 1.33 < 0.5 < 0.2
GC 13 FA < 0.5 < 0.2 2.13 64.6 < 5 62.1 28400 2.38 < 0.5 < 0.2
GC 14 FA < 0.5 < 0.2 1.87 247 7.32 62.7 21800 2.72 < 0.5 < 0.2
GC 15 FA < 0.5 < 0.2 2.14 < 0.5 5.31 72.2 21300 0.64 < 0.5 < 0.2
GC 16 FA < 0.5 0.39 0.73 1060 29.2 87.1 36800 6.32 < 0.5 0.48
GC0 (RA Blank) < 0.5 < 0.2 4.20 0.937 < 5 < 5 < 5 < 0.5 < 0.5 < 0.2
GC1 RA 2.21 < 0.2 2.36 311 12.2 65.6 23200 1.30 < 0.5 < 0.2
GC1 RA DUP 2.51 < 0.2 2.87 306 9.6 64.8 23100 1.44 < 0.5 < 0.2
GC2 RA 2.44 < 0.2 2.78 338 10.4 67.2 24200 1.54 < 0.5 < 0.2
GC3 RA 2.21 0.28 2.03 563 15.4 71.9 23400 2.24 < 0.5 < 0.2
GC4 RA 2.27 0.29 2.03 606 17.3 72.5 23000 2.20 < 0.5 < 0.2
GC5 RA 2.27 0.35 1.68 715 20.6 74.8 21200 2.55 < 0.5 < 0.2
GC6 RA 2.26 0.36 1.76 736 18.1 73.5 20900 2.54 < 0.5 < 0.2
GC7 RA 2.44 0.42 1.65 880 21.0 75.6 23400 2.53 < 0.5 < 0.2
GC8 RA 2.41 0.43 1.58 924 19.2 76.7 24200 2.69 < 0.5 < 0.2
GC9 RA < 0.5 0.38 1.19 647 22.1 72.4 23200 2.82 < 0.5 < 0.2
GC10 RA < 0.5 0.38 1.45 698 23.8 76.6 24800 3.06 < 0.5 < 0.2
GC11 RA < 0.5 < 0.2 1.39 107 12.2 60.8 18300 2.26 < 0.5 < 0.2
GC12 RA < 0.5 < 0.2 2.45 125 7.6 77.3 18000 1.49 < 0.5 < 0.2
GC13 RA < 0.5 < 0.2 2.90 329 14.5 102 30100 2.56 < 0.5 < 0.2
GC14 RA < 0.5 < 0.2 2.34 264 8.8 64.7 22300 3.19 < 0.5 < 0.2
GC15 RA < 0.5 < 0.2 2.55 27.5 7.9 72.1 20800 1.12 < 0.5 < 0.2
GC16 RA < 0.5 0.40 1.72 1130 48.0 90.6 38600 6.86 < 0.5 0.60
73
ICP-MS Results Continued
Sample Name 55Mn 56Fe 59Co 60Ni 63Cu 66Zn 71Ga 75As 82Se
μg/L μg/L μg/L μg/L μg/L μg/L μg/L μg/L μg/L
Trib 1 FA < 2 < 5 <0.5 <0.5 < 1 < 1 6.14 0.41 < 0.2
Trib 3 FA 26.6 < 5 <0.5 <0.5 < 1 4.3 2.35 0.75 < 0.2
Trib 4 FA < 2 < 5 <0.5 0.58 < 1 174 2.27 1.05 < 0.2
Trib 5 FA 1130 16.7 1.52 3.02 18.8 460 1.85 0.28 < 0.2
Trib 6 FA 31100 5800 23.4 18.2 195 14200 < 0.5 2.63 0.73
Trib 7 FA 182 26.7 <0.5 <0.5 4.95 363 1.58 1.93 < 0.2
Trib 8 FA 652 8.06 1.21 2.70 19.6 955 2.56 0.37 < 0.2
Trib 9 FA 61400 110000 46.6 55.3 190 24600 1.09 97.9 < 0.5
Trib 9 FA DUP 61300 111000 46.7 55.7 190 24400 1.14 98.1 1.99
Trib 10 FA 76.9 14.7 <0.5 0.80 2.05 42.3 1.37 1.23 < 0.2
Trib 11 FA 1310 1160 4.58 6.87 16.6 1900 1.02 0.64 < 0.5
Trib 12 FA < 2 < 5 <0.5 0.59 < 1 46.7 2.04 0.22 < 0.2
Trib 13 FA 1480 69.5 0.55 1.45 53.3 540 1.19 1.13 < 0.2
Trib 14 FA < 2 < 5 <0.5 <0.5 < 1 2.68 3.60 < 0.2 < 0.2
Trib 15 FA 11300 96200 2.74 6.20 627 4960 0.93 12.3 0.65
Trib 16 FA 350 29.1 0.69 2.18 1.52 80.0 < 0.5 4.22 < 0.2
Trib 17 FA < 2 < 5 <0.5 <0.5 < 1 3.56 1.99 1.04 < 0.2
Trib 18 FA 172 17.3 1.12 2.18 2.88 137 2.63 < 0.2 < 0.2
Trib 19 FA 113000 151000 47.3 31.6 1480 52900 2.94 237 1.65
Trib 20 FA 10300 3810 20.0 19.2 253 4190 0.65 0.30 < 0.2
GC 0(FA Blank) < 2 < 5 <0.5 <0.5 < 1 < 1 < 0.5 < 0.2 < 0.2
GC 1 FA 1590 9.0 1.26 1.69 1.15 705 3.04 0.55 < 0.2
GC 1 FA DUP 1600 < 5 1.29 1.68 1.06 718 3.12 0.51 < 0.2
GC 2 FA 1700 < 5 1.37 1.77 < 1 721 3.19 0.37 < 0.2
GC 3 FA 3160 < 5 2.55 3.33 1.5 1280 1.56 0.33 < 0.2
GC 4 FA 3310 14.2 2.64 3.37 1.3 1320 1.56 0.33 < 0.2
GC 5 FA 3870 76.8 3.08 3.99 1.5 1540 1.39 0.30 < 0.2
GC 6 FA 4030 158 3.18 4.16 1.7 1620 1.40 0.33 < 0.2
GC 7 FA 4660 296 3.85 4.73 2.6 1780 1.32 0.42 < 0.2
GC 8 FA 4890 950 3.91 4.69 3.5 2000 1.34 0.43 < 0.2
GC 9 FA 4340 3310 3.62 4.71 3.8 1730 1.39 0.64 < 0.2
GC 10 FA 4710 4920 3.95 5.01 5.0 1920 1.39 0.78 < 0.2
GC 11 FA 156 22.4 <0.5 1.10 6.7 173 1.45 0.54 < 0.2
GC 12 FA 245 6.31 <0.5 1.60 10.6 280 1.78 < 0.2 < 0.2
GC 13 FA 967 22.8 0.55 2.36 23.2 564 1.30 0.31 < 0.2
GC 14 FA 1770 5670 0.77 3.34 107 1340 1.25 0.23 < 0.2
GC 15 FA < 2 7.1 <0.5 <0.5 1.3 303 3.09 < 0.2 < 0.2
GC 16 FA 6690 42200 2.82 6.02 373 3380 0.97 3.87 0.43
GC0 (RA Blank) < 2 28.2 <0.5 <0.5 < 1 < 1 < 0.5 < 0.2 < 0.2
GC1 RA 1660 1760 1.33 1.77 13.3 947 3.19 2.77 < 0.2
GC1 RA DUP 1650 1740 1.30 1.74 13.4 959 3.19 2.81 < 0.2
GC2 RA 1850 2010 1.52 1.93 15.2 1030 3.51 3.10 < 0.2
GC3 RA 3220 3350 2.55 3.47 26.5 1720 1.67 4.95 < 0.2
GC4 RA 3430 3600 2.78 3.57 28.3 1780 1.66 5.18 < 0.2
GC5 RA 4030 4290 3.29 4.27 34.0 2070 1.56 5.94 < 0.2
GC6 RA 4000 4360 3.23 4.13 33.6 2010 1.52 5.92 < 0.2
GC7 RA 4750 5270 3.99 5.03 41.0 2270 1.64 7.13 < 0.2
GC8 RA 5020 5760 4.09 5.07 42.5 2420 1.49 7.43 < 0.2
GC9 RA 4350 6600 3.65 4.75 29.9 1950 1.46 7.94 < 0.2
GC10 RA 4770 7570 4.01 5.09 31.5 2120 1.46 8.87 < 0.2
GC11 RA 170 344 <0.5 1.21 21.0 205 1.56 1.11 < 0.2
GC12 RA 256 348 <0.5 1.55 39.4 322 1.66 0.34 < 0.2
GC13 RA 991 1190 0.62 2.75 140 707 1.40 0.82 < 0.2
GC14 RA 1850 6450 0.84 3.36 112 1430 1.30 0.62 < 0.2
GC15 RA 9.2 317 <0.5 <0.5 4.0 325 3.36 0.26 < 0.2
GC16 RA 6880 47600 2.88 6.23 378 3430 0.95 7.59 0.433
74
ICP-MS Results Continued
Sample Name 85Rb 88Sr 90Zr 93Nb 98Mo 105Pd 107Ag 111Cd 118Sn
μg/L μg/L μg/L μg/L μg/L μg/L μg/L μg/L μg/L
Trib 1 FA 1.41 189 < 0.5 < 0.5 1.09 < 0.5 < 0.2 < 0.2 < 0.5
Trib 3 FA 1.09 126 < 0.5 < 0.5 0.82 < 0.5 < 0.2 < 0.2 < 0.5
Trib 4 FA 2.30 48.1 < 0.5 < 0.5 < 0.5 < 0.5 < 0.2 0.49 < 0.5
Trib 5 FA 8.53 118 < 0.5 < 0.5 < 0.5 < 0.5 < 0.2 1.85 < 0.5
Trib 6 FA 27.5 402 0.64 < 0.5 0.51 0.8 0.5 70.1 < 0.5
Trib 7 FA 4.14 72.5 < 0.5 < 0.5 0.78 < 0.5 < 0.2 1.82 < 0.5
Trib 8 FA 7.08 271 < 0.5 < 0.5 < 0.5 < 0.5 < 0.2 5.42 < 0.5
Trib 9 FA 33.7 744 2.58 < 1.25 1.38 1.3 < 0.5 62.8 < 1.25
Trib 9 FA DUP 33.2 738 1.19 < 1.25 2.27 < 1.25 < 0.5 62.8 < 1.25
Trib 10 FA 3.62 65.7 < 0.5 < 0.5 0.63 < 0.5 < 0.2 < 0.2 < 0.5
Trib 11 FA 7.53 61.4 < 1.25 < 1.25 < 1.25 < 1.25 < 0.5 6.01 < 1.25
Trib 12 FA 1.75 147 < 0.5 < 0.5 < 0.5 < 0.5 < 0.2 < 0.2 < 0.5
Trib 13 FA 1.61 158 < 0.5 < 0.5 1.15 < 0.5 < 0.2 2.30 < 0.5
Trib 14 FA 1.24 111 < 0.5 < 0.5 1.15 < 0.5 < 0.2 < 0.2 < 0.5
Trib 15 FA 2.95 64.0 0.60 < 0.5 < 0.5 < 0.5 < 0.2 14.7 < 0.5
Trib 16 FA 5.98 99.8 < 0.5 < 0.5 1.05 < 0.5 < 0.2 < 0.2 < 0.5
Trib 17 FA 1.14 65.4 < 0.5 < 0.5 0.88 < 0.5 < 0.2 < 0.2 < 0.5
Trib 18 FA 5.09 123 < 0.5 < 0.5 < 0.5 < 0.5 < 0.2 0.773 < 0.5
Trib 19 FA 15.3 610 1.59 < 1.25 1.47 < 1.25 < 0.5 173 < 1.25
Trib 20 FA 17.2 121 < 0.5 < 0.5 < 0.5 < 0.5 < 0.2 23.4 < 0.5
GC 0(FA Blank) < 0.5 < 1 < 0.5 < 0.5 < 0.5 < 0.5 < 0.2 < 0.2 < 0.5
GC 1 FA 3.05 166 < 0.5 < 0.5 < 0.5 < 0.5 < 0.2 2.39 < 0.5
GC 1 FA DUP 3.04 167 < 0.5 < 0.5 0.64 < 0.5 < 0.2 2.43 < 0.5
GC 2 FA 3.12 168 < 0.5 < 0.5 0.71 < 0.5 < 0.2 2.47 < 0.5
GC 3 FA 4.49 145 < 0.5 < 0.5 < 0.5 < 0.5 < 0.2 4.50 < 0.5
GC 4 FA 4.47 143 < 0.5 < 0.5 < 0.5 < 0.5 < 0.2 4.74 < 0.5
GC 5 FA 4.89 149 < 0.5 < 0.5 < 0.5 < 0.5 < 0.2 5.60 < 0.5
GC 6 FA 4.93 152 < 0.5 < 0.5 < 0.5 < 0.5 < 0.2 6.01 < 0.5
GC 7 FA 5.47 169 < 0.5 < 0.5 < 0.5 < 0.5 < 0.2 6.98 < 0.5
GC 8 FA 5.58 174 < 0.5 < 0.5 < 0.5 < 0.5 < 0.2 7.62 < 0.5
GC 9 FA 5.19 170 0.55 < 0.5 0.84 < 0.5 0.3 5.37 < 0.5
GC 10 FA 5.27 168 < 0.5 < 0.5 < 0.5 < 0.5 < 0.2 5.70 < 0.5
GC 11 FA 2.82 95.8 < 0.5 < 0.5 < 0.5 < 0.5 < 0.2 0.58 < 0.5
GC 12 FA 1.91 121 < 0.5 < 0.5 < 0.5 < 0.5 < 0.2 1.03 < 0.5
GC 13 FA 1.43 119 < 0.5 < 0.5 0.89 < 0.5 0.3 2.39 < 0.5
GC 14 FA 1.36 58.5 < 0.5 < 0.5 < 0.5 < 0.5 < 0.2 4.96 < 0.5
GC 15 FA 1.23 106 < 0.5 < 0.5 < 0.5 < 0.5 < 0.2 1.06 < 0.5
GC 16 FA 2.41 78.1 < 0.5 < 0.5 < 0.5 < 0.5 < 0.2 11.5 < 0.5
GC0 (RA Blank) < 0.5 < 1 < 0.5 < 0.5 < 0.5 < 0.5 < 0.2 < 0.2 < 0.5
GC1 RA 3.03 166 < 0.5 < 0.5 1.17 < 0.5 0.3 3.33 < 0.5
GC1 RA DUP 3.08 166 < 0.5 < 0.5 0.67 < 0.5 < 0.2 3.31 < 0.5
GC2 RA 3.25 176 < 0.5 < 0.5 0.65 < 0.5 < 0.2 3.69 < 0.5
GC3 RA 4.53 148 < 0.5 < 0.5 < 0.5 < 0.5 < 0.2 6.06 < 0.5
GC4 RA 4.58 146 < 0.5 < 0.5 < 0.5 < 0.5 < 0.2 6.46 < 0.5
GC5 RA 5.05 155 < 0.5 < 0.5 < 0.5 < 0.5 < 0.2 7.52 < 0.5
GC6 RA 4.90 152 < 0.5 < 0.5 < 0.5 < 0.5 < 0.2 7.57 < 0.5
GC7 RA 5.49 169 < 0.5 < 0.5 < 0.5 < 0.5 < 0.2 8.97 < 0.5
GC8 RA 5.61 173 < 0.5 < 0.5 0.70 < 0.5 0.4 9.18 < 0.5
GC9 RA 5.27 169 < 0.5 < 0.5 < 0.5 < 0.5 < 0.2 5.89 < 0.5
GC10 RA 5.34 168 < 0.5 < 0.5 < 0.5 < 0.5 < 0.2 6.13 < 0.5
GC11 RA 3.00 99.8 < 0.5 < 0.5 < 0.5 < 0.5 < 0.2 0.60 < 0.5
GC12 RA 2.14 125 < 0.5 < 0.5 < 0.5 < 0.5 < 0.2 1.05 < 0.5
GC13 RA 1.86 123 < 0.5 < 0.5 < 0.5 < 0.5 < 0.2 2.67 < 0.5
GC14 RA 1.48 61.6 < 0.5 < 0.5 < 0.5 < 0.5 < 0.2 5.13 < 0.5
GC15 RA 1.36 106 < 0.5 < 0.5 < 0.5 < 0.5 < 0.2 1.14 < 0.5
GC16 RA 2.38 79.4 < 0.5 < 0.5 < 0.5 < 0.5 < 0.2 9.53 < 0.5

75
ICP-MS Results Continued
Sample Name 121Sb 133Cs 137Ba 139La 140Ce 141Pr 146Nd 182W 205Tl
μg/L μg/L μg/L μg/L μg/L μg/L μg/L μg/L μg/L
Trib 1 FA < 0.2 < 0.5 95.9 < 0.2 < 0.2 < 0.2 < 0.2 < 0.2 < 0.2
Trib 3 FA < 0.2 < 0.5 42.3 < 0.2 < 0.2 < 0.2 < 0.2 < 0.2 < 0.2
Trib 4 FA < 0.2 < 0.5 42.0 < 0.2 < 0.2 < 0.2 < 0.2 < 0.2 < 0.2
Trib 5 FA < 0.2 1.8 33.4 3.8 6.1 0.8 2.6 < 0.2 0.8
Trib 6 FA < 0.2 7.1 5.3 55.2 115 14.5 53.5 < 0.2 1.1
Trib 7 FA 0.3 1.4 30.1 0.5 0.8 < 0.2 0.3 < 0.2 < 0.2
Trib 8 FA < 0.2 < 0.5 46.8 3.4 5.9 0.9 3.3 < 0.2 0.3
Trib 9 FA 0.7 29.4 4.3 46.5 108 13.4 49.2 < 0.2 9.4
Trib 9 FA DUP 1.3 29.3 4.6 46.0 107 13.4 49.2 < 0.2 9.8
Trib 10 FA < 0.2 1.7 26.1 < 0.2 < 0.2 < 0.2 < 0.2 < 0.2 1.2
Trib 11 FA < 0.5 1.5 18.7 5.2 10.0 1.1 4.1 < 0.2 1.2
Trib 12 FA < 0.2 < 0.5 37.7 < 0.2 < 0.2 < 0.2 < 0.2 < 0.2 < 0.2
Trib 13 FA < 0.2 < 0.5 21.9 < 0.2 < 0.2 < 0.2 < 0.2 < 0.2 < 0.2
Trib 14 FA < 0.2 < 0.5 67.5 0.2 < 0.2 < 0.2 < 0.2 < 0.2 < 0.2
Trib 15 FA < 0.2 < 0.5 10.5 1.7 3.6 0.4 1.9 < 0.2 < 0.2
Trib 16 FA < 0.2 2.6 7.5 < 0.2 < 0.2 < 0.2 < 0.2 < 0.2 4.0
Trib 17 FA < 0.2 0.6 37.7 < 0.2 < 0.2 < 0.2 < 0.2 < 0.2 0.6
Trib 18 FA < 0.2 < 0.5 48.6 1.2 1.9 0.3 1.1 < 0.2 < 0.2
Trib 19 FA < 0.5 6.2 2.42 116 244 28.1 106 < 0.2 2.3
Trib 20 FA < 0.2 13.8 10.4 30.7 62.7 7.2 25.6 < 0.2 3.0
GC 0(FA Blank) < 0.2 < 0.5 < 1 < 0.2 < 0.2 < 0.2 < 0.2 < 0.2 < 0.2
GC 1 FA < 0.2 1.1 59.2 < 0.2 < 0.2 < 0.2 < 0.2 < 0.2 0.3
GC 1 FA DUP < 0.2 1.1 58.1 < 0.2 < 0.2 < 0.2 < 0.2 < 0.2 0.3
GC 2 FA < 0.2 1.2 60.4 < 0.2 < 0.2 < 0.2 < 0.2 < 0.2 0.3
GC 3 FA < 0.2 1.9 29.2 < 0.2 < 0.2 < 0.2 < 0.2 < 0.2 0.6
GC 4 FA < 0.2 1.9 29.9 < 0.2 < 0.2 < 0.2 < 0.2 < 0.2 0.6
GC 5 FA < 0.2 2.2 26.7 < 0.2 < 0.2 < 0.2 < 0.2 < 0.2 0.7
GC 6 FA < 0.2 2.3 27.2 < 0.2 < 0.2 < 0.2 < 0.2 < 0.2 0.7
GC 7 FA < 0.2 2.6 25.6 < 0.2 < 0.2 < 0.2 < 0.2 < 0.2 1.0
GC 8 FA < 0.2 2.7 26.2 0.2 0.2 < 0.2 < 0.2 < 0.2 0.9
GC 9 FA < 0.2 2.8 26.8 < 0.2 < 0.2 < 0.2 < 0.2 0.2 1.1
GC 10 FA < 0.2 2.9 27.1 0.4 0.4 < 0.2 < 0.2 < 0.2 1.1
GC 11 FA < 0.2 0.9 28.3 < 0.2 < 0.2 < 0.2 < 0.2 < 0.2 0.5
GC 12 FA < 0.2 < 0.5 31.6 0.2 0.2 < 0.2 < 0.2 < 0.2 < 0.2
GC 13 FA < 0.2 < 0.5 25.4 0.4 0.4 < 0.2 < 0.2 0.3 < 0.2
GC 14 FA < 0.2 < 0.5 23.9 1.9 2.9 0.3 1.2 < 0.2 < 0.2
GC 15 FA < 0.2 < 0.5 61.1 < 0.2 < 0.2 < 0.2 < 0.2 < 0.2 < 0.2
GC 16 FA < 0.2 < 0.5 14.9 7.1 12.0 1.5 5.3 < 0.2 0.2
GC0 (RA Blank) < 0.2 < 0.5 < 1 < 0.2 < 0.2 < 0.2 < 0.2 < 0.2 < 0.2
GC1 RA < 0.2 1.2 62.2 2.0 4.1 0.5 1.9 < 0.2 0.3
GC1 RA DUP < 0.2 1.2 61.0 1.9 3.9 0.5 1.8 < 0.2 0.3
GC2 RA < 0.2 1.3 68.1 2.3 4.6 0.6 2.1 < 0.2 0.4
GC3 RA < 0.2 1.9 31.9 3.7 7.8 1.0 3.6 < 0.2 0.6
GC4 RA < 0.2 2.0 32.7 4.1 8.4 1.1 3.9 < 0.2 0.7
GC5 RA < 0.2 2.3 29.8 4.8 9.9 1.3 4.6 < 0.2 0.8
GC6 RA < 0.2 2.3 28.8 4.9 10.2 1.3 4.6 < 0.2 0.8
GC7 RA < 0.2 2.7 27.9 6.1 12.5 1.5 5.8 < 0.2 1.0
GC8 RA < 0.2 2.8 27.8 6.1 12.8 1.6 5.9 < 0.2 1.0
GC9 RA < 0.2 2.8 27.6 4.1 8.8 1.1 4.0 < 0.2 1.1
GC10 RA < 0.2 3.0 27.7 4.3 9.4 1.2 4.2 < 0.2 1.2
GC11 RA < 0.2 0.9 30.0 0.7 1.0 < 0.2 0.5 < 0.2 0.6
GC12 RA < 0.2 < 0.5 31.9 0.9 1.3 < 0.2 0.6 < 0.2 < 0.2
GC13 RA < 0.2 < 0.5 27.4 2.8 4.1 0.5 1.7 < 0.2 < 0.2
GC14 RA < 0.2 < 0.5 24.4 2.0 3.1 0.4 1.3 < 0.2 < 0.2
GC15 RA < 0.2 < 0.5 66.3 0.3 0.2 < 0.2 < 0.2 < 0.2 < 0.2
GC16 RA < 0.2 < 0.5 13.6 6.35 10.8 1.3 5.3 < 0.2 < 0.2
76
ICP-MS Results Continued
Sample Name 206Pb 207Pb 208Pb 232Th 238U
μg/L μg/L μg/L μg/L μg/L
Trib 1 FA < 0.2 < 0.2 < 0.2 < 0.2 5.0
Trib 3 FA < 0.2 < 0.2 < 0.2 < 0.2 0.6
Trib 4 FA < 0.2 < 0.2 < 0.2 < 0.2 < 0.2
Trib 5 FA 86.5 95.1 94.0 < 0.2 0.3
Trib 6 FA 192 214 208 1.9 21.3
Trib 7 FA 32.2 35.7 35.2 < 0.2 0.5
Trib 8 FA 35.9 39.4 38.4 < 0.2 0.8
Trib 9 FA 158 175 172 2.6 6.2
Trib 9 FA DUP 158 173 170 1.9 6.2
Trib 10 FA < 0.2 < 0.2 < 0.2 < 0.2 1.1
Trib 11 FA 27.0 30.0 29.6 < 0.5 5.0
Trib 12 FA < 0.2 < 0.2 < 0.2 < 0.2 < 0.2
Trib 13 FA < 0.2 < 0.2 < 0.2 < 0.2 5.9
Trib 14 FA < 0.2 < 0.2 < 0.2 < 0.2 9.9
Trib 15 FA 727 796 783 0.3 1.1
Trib 16 FA < 0.2 < 0.2 < 0.2 < 0.2 4.4
Trib 17 FA < 0.2 < 0.2 < 0.2 0.2 0.7
Trib 18 FA 6.6 7.4 7.34 < 0.2 0.4
Trib 19 FA 161 178 176 13.5 28.9
Trib 20 FA 13.9 15.5 15.3 1.3 11.8
GC 0(FA Blank) < 0.2 < 0.2 < 0.2 < 0.2 < 0.2
GC 1 FA < 0.2 < 0.2 < 0.2 0.2 2.6
GC 1 FA DUP < 0.2 < 0.2 < 0.2 < 0.2 2.6
GC 2 FA < 0.2 < 0.2 < 0.2 < 0.2 2.7
GC 3 FA < 0.2 < 0.2 < 0.2 < 0.2 0.8
GC 4 FA < 0.2 < 0.2 < 0.2 0.3 0.8
GC 5 FA < 0.2 < 0.2 < 0.2 < 0.2 0.7
GC 6 FA < 0.2 < 0.2 < 0.2 < 0.2 0.7
GC 7 FA < 0.2 < 0.2 < 0.2 < 0.2 0.8
GC 8 FA < 0.2 < 0.2 < 0.2 < 0.2 0.9
GC 9 FA < 0.2 < 0.2 < 0.2 0.9 0.8
GC 10 FA < 0.2 < 0.2 < 0.2 < 0.2 0.9
GC 11 FA 0.5 0.5 0.5 < 0.2 1.1
GC 12 FA 0.7 0.7 0.7 < 0.2 1.4
GC 13 FA 1.5 1.5 1.6 0.8 3.1
GC 14 FA 277 304 296 0.3 0.8
GC 15 FA 20.3 22.5 22.1 < 0.2 3.6
GC 16 FA 753 826 817 0.5 2.1
GC0 (RA Blank) 0.3 0.3 0.3 < 0.2 < 0.2
GC1 RA 12.5 13.9 13.7 0.7 3.0
GC1 RA DUP 12.3 13.5 13.3 < 0.2 2.9
GC2 RA 14.2 15.7 15.5 < 0.2 3.2
GC3 RA 24.4 26.9 26.7 < 0.2 1.3
GC4 RA 26.3 29.0 28.6 < 0.2 1.4
GC5 RA 31.1 34.6 34.0 < 0.2 1.5
GC6 RA 31.6 34.9 34.6 < 0.2 1.5
GC7 RA 38.1 42.0 41.2 0.2 1.8
GC8 RA 34.1 37.6 37.4 0.6 1.9
GC9 RA 22.0 24.3 24.0 0.2 1.5
GC10 RA 20.4 22.6 22.5 < 0.2 1.6
GC11 RA 10.8 12.0 11.8 < 0.2 1.1
GC12 RA 15.8 17.5 17.3 < 0.2 1.4
GC13 RA 54.9 60.7 58.7 < 0.2 3.6
GC14 RA 278 306 297 < 0.2 0.9
GC15 RA 131 145 141 < 0.2 3.8
GC16 RA 704 770 754 0.5 1.7

77
9.2. Table C-2 ICP-MS Quality Assurance
65Cu 66Zn 75As 111Cd 206Pb 207Pb 208Pb 232Th
Lab ID Dilution μg/L μg/L μg/L μg/L μg/L μg/L μg/L μg/L
MDL 0.564 0.976 0.449 0.460 0.472 0.463 0.467 0.211
CRQL 2.00 2.00 1.00 1.00 1.00 1.00 1.00 1.00
INSTRUMENT
ICV 1 109.1 111.9 112.8 112.4 111.6 113.5 113.0 NA
RECOVERY
(85-
115) 109% 112% 113% 112% 112% 113% 113% ICV TEST 1 PASS PASS PASS PASS PASS PASS PASS
ICB 1
-
0.0145 -0.1177 0.0205 0.0220 0.0211 0.0175 0.0191 0.0191
ICB TEST PASS PASS PASS PASS PASS PASS PASS PASS DISSOLVED - NO PREP
DISS BLANK 1
-
0.0265 -2.6090 0.0139 -0.0051
-
0.0276
-
0.0350
-
0.0319 0.0484
ICB TEST PASS PASS PASS PASS PASS PASS PASS PASS
DISS BLANK 1 0.0930 -2.5380 ###### -0.0074
-
0.0308
-
0.0360
-
0.0324
-
0.0227
ICB TEST PASS PASS PASS PASS PASS PASS PASS PASS LCS-S-241 1 450.1 990.4 46.6 28.9 39.9 39.7 39.1 NA
RECOVERY
(85-
115) 1 1 100% 99% 99% 99% 98%
LCS-WS-253 1 1414.6 317.5 12.1 49.0 78.9 80.9 78.5 NA
RECOVERY
(85-
115) 101% 102% 114% 97% 99% 98% 97%
FORTIFICATION AND DUPLICATION
2021W0052 1 0.149 0.524 0.409 0.0546 0.0214 0.0199 0.0269 0.0402
2021W0052-MD 1 0.117 0.475 0.415 0.0581 0.0266 0.0174 0.0230 0.0209
RPD
<
20% 24% 10% 1% 6% 22% 13% 16% 63%
OK
<5X
MDL
OK
<5X
MDL
OK
<5X
MDL
2021W0053 1 0.102 4.33 0.751 ######
-
0.0255
-
0.0309
-
0.0260 0.0239
2021W0053-LFM 1 54.6 55.8 54.0 54.8 58.8 59.0 57.4 27.1
RECOVERY
(75-
125) 109% 103% 106% 110% 118% 118% 115% 108%
2021W0063 1 0.140 50.7 0.219 0.0621 0.0437 0.0409 0.0406 0.0233
2021W0063MD 1 0.131 50.8 0.207 0.0591 0.0407 0.0344 0.0430 0.0096
RPD
<
20% 6% 0% 6% 5% 7% 17% 6% 83%
OK
<5X
MDL
2021W0064 1 51.8 511 1.10 2.30 0.0510 0.0523 0.0474 0.121
2021W0064LFM 1 101 533 54.2 55.2 57.5 57.0 56.0 26.9
RECOVERY
(75-
125) 99% 45% 106% 106% 115% 114% 112% 107%
78
>4X SA
OK
2021W0073 1 1.15 667 0.549 2.38 0.0554 0.0642 0.0615 0.2325
2021W0073MD 1 1.14 670 0.557 2.38 0.0567 0.0618 0.0640 0.0643
RPD
<
20% 1% 0% 1% 0% 2% 4% 4% 113%
OK
<5X
MDL
2021W0074 1 1.1 687 0.506 2.43 0.0285 0.0210 0.0265 0.0155
2021W0074LFM 1 55.0 715 54.3 56.5 57.0 57.5 55.4 26.4
RECOVERY
(75-
125) 108% 54% 108% 108% 114% 115% 111% 106%
>4X SA
OK
2021W0084 1 6.63 175 0.542 0.580 0.485 0.535 0.534 0.022
2021W0084MD 1 6.44 172 0.550 0.538 0.501 0.527 0.534 0.014
RPD
<
20% 3% 2% 2% 7% 3% 1% 0% 48%
OK
<5X
MDL
2021W0085 1 10.2 267 0.168 0.930 0.7 0.8 0.8 0.0
2021W0085LFM 1 66.0 303 55.53 58.18 61.8 61.4 59.6 28.1
RECOVERY
(75-
125) 112% 73% 111% 115% 122% 121% 118% 112%
>4X SA
OK
2021W0097 1 33.4 1987 5.97 7.48 31.8 35.4 34.8 0.179
2021W0097MD 1 34.8 2074 6.06 7.67 33.5 36.7 36.7 0.192
RPD
<
20% 4% 4% 1% 3% 5% 4% 5% 7%
2021W0098 1 39.5 2214 6.93 8.50 38.2 42.1 40.5 0.2
2021W0098LFM 1 97.5 2297 64.4 67.4 98.2 102 101 29.8
RECOVERY
(75-
125) 116% 167% 115% 118% 120% 119% 121% 118%
>4X SA
OK TOTAL RECOVERY PREP
CALIBRATION VERIFICATION
CCV-1 1 104.65 98.37 99.42 100.12 100.40 99.55 99.47 49.28
CCV TEST
(90-
110) 101% 102% 99% 97% 96% 97% 96% 96%
CCB-1
1
-
0.0380
-
2.5740 0.0244
-
0.0010
-
0.0269
-
0.0311
-
0.0283 0.1338
CCB TEST PASS PASS PASS PASS PASS PASS PASS PASS
CCV-2 1 104.35 98.88 99.39 99.79 100.98 99.49 100.92 49.61
CCV TEST
(90-
110) 104% 99% 99% 100% 101% 99% 101% 99%
CCB-2 1
-
0.0383
-
2.5611 0.0139
-
0.0005
-
0.0284
-
0.0361
-
0.0340 0.1332
CCB TEST PASS PASS PASS PASS PASS PASS PASS PASS

79
CCV-3 1 104.40 98.14 99.93 99.92 99.47 99.80 99.78 49.66
CCV TEST
(90-
110) 103% 109% 102% 100% 97% 97% 97% 97%
CCB-3 1
-
0.0376
-
2.6257 0.0246 0.0017
-
0.0225
-
0.0297
-
0.0268 0.1409
CCB TEST PASS PASS PASS PASS PASS PASS PASS PASS
CCV-4 1 105.19 97.54 99.50 100.48 100.99 99.56 99.85 49.00
CCV TEST
(90-
110) 103% 108% 102% 100% 99% 99% 99% 99%
CCB-4 1
-
0.0241 -2.632 0.008
-
0.0027
-
0.0325
-
0.0332
-
0.0327 0.1396
CCB TEST PASS PASS PASS PASS PASS PASS PASS PASS
CCV-5 1 104.71 99.18 100.18 99.85 100.99 101.64 100.27 49.17
CCV TEST
(90-
110) 102% 109% 102% 98% 96% 96% 96% 96%
CCB-5 1
-
0.0336
-
2.5143 0.025 -0.002
-
0.0309
-
0.0358
-
0.0310 0.1380
CCB TEST PASS PASS PASS PASS PASS PASS PASS PASS
CCV-6 1 103.84 97.45 99.69 99.65 100.74 99.98 100.73 49.12
CCV TEST
(90-
110) 102% 107% 101% 97% 93% 94% 94% 94%
CCB-6 1 -0.024 -2.529 0.009 -0.001 -0.032 -0.038 -0.034 0.141
CCB TEST PASS PASS PASS PASS PASS PASS PASS PASS
CCV-7 1 108.46 101.10 101.91 104.44 104.18 104.20 102.78 51.11
CCV TEST
(90-
110) 103% 106% 100% 102% 100% 99% 99% 99%
CCB-7 1 -0.023 -2.58 0.022 -0.001 -0.02 -0.03 -0.02 0.14
CCB TEST PASS PASS PASS PASS PASS PASS PASS PASS
CCV-8 1 106.06 99.31 99.86 103.41 102.72 102.54 102.84 50.64
CCV TEST
(90-
110) 102% 106% 101% 99% 97% 96% 99% 99%
CCB-8 1 -0.044 -2.484 0.009 -0.004 -0.032 -0.035 -0.034 0.139
CCB TEST PASS PASS PASS PASS PASS PASS PASS PASS
CCV-9 1 103.01 97.91 98.08 100.37 101.02 100.42 101.59 49.44
CCV TEST
(90-
110) 96% 101% 96% 96% 96% 95% 95% 95%
CCB-9 1 -0.035 -2.585 0.017 -0.001 -0.034 -0.039 -0.033 0.146
CCB TEST PASS PASS PASS PASS PASS PASS PASS PASS
CCV-10 1 104.76 102.40 99.19 104.56 103.90 104.00 104.86 51.38
CCV TEST
(90-
110) 95% 99% 93% 95% 94% 94% 93% 93%
CCB-10 1 0.0845
-
1.5548 0.0739 0.1101 0.0491 0.0414 0.0472 0.4568
CCB TEST PASS PASS PASS PASS PASS PASS PASS PASS
CCV-11 1 105.86 101.97 99.25 104.91 104.00 104.34 104.72 52.39
CCV TEST
(90-
110) 95% 99% 93% 95% 94% 94% 93% 93%
CCB-11 1 0.1500
-
2.1779 0.1398 0.1641 0.0910 0.0907 0.0943 0.4995
CCB TEST PASS PASS PASS PASS PASS PASS PASS PASS
CCV-12 1 101.05 97.37 95.33 102.07 101.85 103.73 102.56 49.91
CCV TEST
(90-
110) 95% 99% 93% 95% 94% 94% 93% 93%
CCB-12 1 0.1467
-
2.1548 0.1254 0.1825 0.1308 0.1356 0.1366 0.4691
CCB TEST PASS PASS PASS PASS PASS PASS PASS PASS

80
9.3. Table C-3 ICP-OES Results
Sample Name Al As B Ba Be Ca Cd Co Cr
mg/L mg/L mg/L mg/L mg/L mg/L mg/L mg/L mg/L
Trib1 <0.0228 <0.1 <0.0135 0.101 <0.0063 29.6 <0.0061 <0.006 <0.0151
Trib3 <0.0228 <0.1 <0.0135 0.0407 <0.0063 72.7 <0.0061 <0.006 <0.0151
Trib4 <0.0228 <0.1 <0.0135 0.0414 <0.0063 6.22 <0.0061 <0.006 <0.0151
Trib5 0.526 <0.1 <0.0135 0.0328 <0.0063 16.1 <0.0061 <0.006 <0.0151
Trib6 7.57 <0.1 <0.0135 <0.0108 <0.0063 50.2 0.0746 0.0210 <0.0151
Trib7 0.0764 <0.1 <0.0135 0.0288 <0.0063 29.5 <0.0061 <0.006 <0.0151
Trib8 0.445 <0.1 <0.0135 0.0462 <0.0063 9.80 <0.0061 <0.006 <0.0151
Trib9 8.30 <0.1 0.0371 <0.0108 <0.0063 132 0.0702 0.0414 0.0249
Trib9-D 8.24 <0.1 0.0361 <0.0108 <0.0063 131 0.0711 0.0396 0.0243
Trib10 <0.0228 <0.1 <0.0135 0.0251 <0.0063 28.1 <0.0061 <0.006 <0.0151
Trib11 1.71 <0.1 <0.0135 0.0200 <0.0063 6.67 0.00667 <0.006 <0.0151
Trib 12 <0.0228 <0.1 <0.0135 0.0375 <0.0063 9.23 <0.0061 <0.006 <0.0151
Trib13 <0.0228 <0.1 <0.0135 0.0219 <0.0063 57.9 <0.0061 <0.006 <0.0151
Trib 14 <0.0228 <0.1 <0.0135 0.0657 <0.0063 20.0 <0.0061 <0.006 <0.0151
Trib15 0.785 <0.1 0.0317 0.0133 <0.0063 52.9 0.0212 <0.006 <0.0151
Trib16 <0.0228 <0.1 <0.0135 <0.0108 <0.0063 38.7 <0.0061 <0.006 <0.0151
Trib17 <0.0228 <0.1 <0.0135 0.0365 <0.0063 45.4 <0.0061 <0.006 <0.0151
Trib18 0.575 <0.1 <0.0135 0.0470 <0.0063 4.42 <0.0061 <0.006 <0.0151
Trib19 16.3 0.251 0.0501 <0.0108 0.00802 95.1 0.305 0.0410 0.0475
Trib20 6.14 <0.1 <0.0135 0.0110 <0.0063 24.8 0.0240 0.0176 <0.0151
GC0 <0.0228 <0.1 <0.0135 <0.0108 <0.0063 <0.0128 <0.0061 <0.006 <0.0151
GC1 0.0274 <0.1 <0.0135 0.0577 <0.0063 33.6 <0.0061 <0.006 <0.0151
GC1-D <0.0228 <0.1 <0.0135 0.0582 <0.0063 33.2 <0.0061 <0.006 <0.0151
GC2 <0.0228 <0.1 <0.0135 0.0600 <0.0063 32.5 <0.0061 <0.006 <0.0151
GC3 0.0229 <0.1 <0.0135 0.0294 <0.0063 33.7 <0.0061 <0.006 <0.0151
GC4 0.0252 <0.1 <0.0135 0.0301 <0.0063 33.0 <0.0061 <0.006 <0.0151
GC5 0.0236 <0.1 <0.0135 0.0270 <0.0063 30.5 <0.0061 <0.006 <0.0151
GC6 <0.0228 <0.1 <0.0135 0.0273 <0.0063 30.7 0.00667 <0.006 <0.0151
GC7 <0.0228 <0.1 <0.0135 0.0259 <0.0063 34.0 0.00694 <0.006 <0.0151
GC8 0.0276 <0.1 <0.0135 0.0260 <0.0063 34.4 0.00835 <0.006 <0.0151
GC9 <0.0228 <0.1 <0.0135 0.0267 <0.0063 34.8 <0.0061 <0.006 <0.0151
GC10 0.0249 <0.1 <0.0135 0.0265 <0.0063 35.2 0.00666 <0.006 <0.0151
GC11 0.0404 <0.1 <0.0135 0.0292 <0.0063 26.8 <0.0061 <0.006 <0.0151
GC12 0.0424 <0.1 <0.0135 0.0312 <0.0063 26.4 <0.0061 <0.006 <0.0151
GC13 0.0699 <0.1 <0.0135 0.0253 <0.0063 43.8 <0.0061 <0.006 <0.0151
GC14 0.241 <0.1 <0.0135 0.0249 <0.0063 32.1 <0.0061 <0.006 <0.0151
GC15 <0.0228 <0.1 <0.0135 0.0581 <0.0063 29.6 <0.0061 <0.006 <0.0151
GC16 1.03 <0.1 0.0159 0.0174 <0.0063 54.9 0.0154 <0.006 <0.0151
81
ICP-OES Results Continued
Sample Name Cu Fe K Li Mg Mn Mo Na Ni
mg/L mg/L mg/L mg/L mg/L mg/L mg/L mg/L mg/L
Trib1 <0.0073 <0.0157 0.349 <0.0188 7.21 <0.009 <0.013 1.77 <0.0097
Trib3 <0.0073 <0.0157 0.435 <0.0188 5.66 0.0305 <0.013 1.47 <0.0097
Trib4 <0.0073 <0.0157 0.633 <0.0188 2.06 <0.009 <0.013 2.46 <0.0097
Trib5 0.0194 0.0204 1.11 <0.0188 3.66 1.12 <0.013 2.52 <0.0097
Trib6 0.195 5.94 0.674 <0.0188 12.3 30.7 <0.013 3.71 0.0204
Trib7 <0.0073 0.0281 0.615 <0.0188 2.41 0.183 <0.013 1.65 <0.0097
Trib8 0.0192 <0.0157 0.874 <0.0188 2.17 0.666 <0.013 3.59 <0.0097
Trib9 0.193 111 2.36 <0.0188 22.9 59.5 <0.013 6.58 0.0567
Trib9-D 0.200 110 2.30 <0.0188 22.6 58.8 <0.013 6.64 0.0552
Trib10 <0.0073 0.0233 0.443 <0.0188 10.6 0.0902 <0.013 2.45 <0.0097
Trib11 0.0175 1.23 0.876 <0.0188 1.93 1.40 <0.013 4.25 <0.0097
Trib 12 <0.0073 <0.0157 0.450 <0.0188 2.22 <0.009 <0.013 3.01 <0.0097
Trib13 0.0563 0.0693 0.615 <0.0188 18.4 1.49 <0.013 2.45 <0.0097
Trib 14 <0.0073 <0.0157 0.397 <0.0188 6.45 <0.009 <0.013 1.75 <0.0097
Trib15 0.636 94.4 0.974 <0.0188 17.0 10.9 <0.013 0.720 <0.0097
Trib16 <0.0073 0.0358 0.687 <0.0188 21.5 0.360 <0.013 3.01 <0.0097
Trib17 <0.0073 <0.0157 0.120 <0.0188 13.0 <0.009 <0.013 1.53 <0.0097
Trib18 <0.0073 0.0259 0.786 <0.0188 1.36 0.187 <0.013 3.66 <0.0097
Trib19 1.54 153 0.617 <0.0188 21.4 110 <0.013 4.55 0.0334
Trib20 0.264 4.02 1.09 <0.0188 5.95 10.6 <0.013 4.75 0.0224
GC0 <0.0073 <0.0157 <0.06 <0.0188 <0.0078 <0.009 <0.013 0.0258 <0.0097
GC1 <0.0073 <0.0157 0.597 <0.0188 7.99 1.62 <0.013 2.41 <0.0097
GC1-D <0.0073 <0.0157 0.594 <0.0188 7.97 1.64 <0.013 2.35 <0.0097
GC2 <0.0073 <0.0157 0.608 <0.0188 7.73 1.72 <0.013 2.30 <0.0097
GC3 <0.0073 <0.0157 0.692 <0.0188 7.89 3.21 <0.013 2.66 <0.0097
GC4 <0.0073 0.0204 0.681 <0.0188 7.55 3.38 <0.013 2.60 <0.0097
GC5 <0.0073 0.0800 0.742 <0.0188 7.74 3.99 <0.013 2.82 <0.0097
GC6 <0.0073 0.177 0.692 <0.0188 7.80 4.08 <0.013 2.85 <0.0097
GC7 <0.0073 0.300 0.753 <0.0188 8.56 4.75 <0.013 3.01 <0.0097
GC8 <0.0073 0.961 0.768 <0.0188 8.66 4.95 <0.013 2.93 <0.0097
GC9 0.00872 3.34 0.748 <0.0188 9.12 4.41 <0.013 3.02 <0.0097
GC10 <0.0073 4.79 0.722 <0.0188 9.31 4.62 <0.013 2.94 <0.0097
GC11 0.0103 0.0224 0.619 <0.0188 8.50 0.174 <0.013 2.76 <0.0097
GC12 0.0126 <0.0157 0.618 <0.0188 7.55 0.256 <0.013 2.57 <0.0097
GC13 0.0230 0.0256 0.653 <0.0188 14.4 0.991 <0.013 2.24 <0.0097
GC14 0.114 5.79 0.667 <0.0188 10.0 1.83 <0.013 1.65 <0.0097
GC15 <0.0073 <0.0157 0.676 <0.0188 7.28 <0.009 <0.013 2.02 <0.0097
GC16 0.399 43.2 0.883 <0.0188 18.1 6.90 <0.013 1.32 <0.0097
82
ICP-OES Results Continued
Sample Name P Pb Sb Se Si Sr Ti Tl V Zn
mg/L mg/L mg/L mg/L mg/L mg/L mg/L mg/L mg/L mg/L
Trib1 <0.0546 <0.0336 <0.0411 <0.0737 5.70 0.196 <0.0062 <0.0444 <0.0088 <0.0055
Trib3 <0.0546 <0.0336 <0.0411 <0.0737 7.02 0.130 <0.0062 <0.0444 <0.0088 0.00796
Trib4 <0.0546 <0.0336 <0.0411 <0.0737 9.80 0.0485 <0.0062 <0.0444 <0.0088 0.181
Trib5 <0.0546 0.0798 <0.0411 <0.0737 11.4 0.115 <0.0062 <0.0444 <0.0088 0.468
Trib6 <0.0546 0.180 <0.0411 <0.0737 23.2 0.407 <0.0062 <0.0444 <0.0088 15.2
Trib7 <0.0546 <0.0336 <0.0411 <0.0737 7.81 0.0707 <0.0062 <0.0444 <0.0088 0.372
Trib8 <0.0546 <0.0336 <0.0411 <0.0737 15.8 0.278 <0.0062 <0.0444 <0.0088 0.974
Trib9 0.217 0.164 <0.0411 <0.0737 25.1 0.783 0.00670 <0.0444 <0.0088 26.5
Trib9-D 0.165 0.161 <0.0411 <0.0737 24.8 0.784 0.00663 <0.0444 <0.0088 26.5
Trib10 <0.0546 <0.0336 <0.0411 <0.0737 10.9 0.0653 <0.0062 <0.0444 <0.0088 0.0520
Trib11 <0.0546 <0.0336 <0.0411 <0.0737 19.0 0.0636 <0.0062 <0.0444 <0.0088 2.06
Trib 12 <0.0546 <0.0336 <0.0411 <0.0737 10.4 0.150 <0.0062 <0.0444 <0.0088 0.0557
Trib13 <0.0546 <0.0336 <0.0411 <0.0737 6.72 0.164 <0.0062 <0.0444 <0.0088 0.587
Trib 14 <0.0546 <0.0336 <0.0411 <0.0737 5.03 0.113 <0.0062 <0.0444 <0.0088 0.00593
Trib15 0.107 0.907 <0.0411 <0.0737 4.36 0.0742 <0.0062 <0.0444 <0.0088 5.34
Trib16 <0.0546 <0.0336 <0.0411 <0.0737 12.7 0.100 <0.0062 <0.0444 <0.0088 0.0938
Trib17 <0.0546 <0.0336 <0.0411 <0.0737 7.59 0.0667 <0.0062 <0.0444 <0.0088 0.00752
Trib18 <0.0546 <0.0336 <0.0411 <0.0737 16.1 0.127 <0.0062 <0.0444 <0.0088 0.148
Trib19 0.563 0.177 <0.0411 <0.0737 24.0 0.726 0.00682 <0.0444 <0.0088 57.6
Trib20 <0.0546 <0.0336 <0.0411 <0.0737 23.2 0.131 <0.0062 <0.0444 <0.0088 4.65
GC0 <0.0546 <0.0336 <0.0411 <0.0737 0.298 <0.0111 <0.0062 <0.0444 <0.0088 <0.0055
GC1 <0.0546 <0.0336 <0.0411 <0.0737 8.16 0.175 <0.0062 <0.0444 <0.0088 0.762
GC1-D <0.0546 <0.0336 <0.0411 <0.0737 8.30 0.176 <0.0062 <0.0444 <0.0088 0.769
GC2 <0.0546 <0.0336 <0.0411 <0.0737 8.32 0.176 <0.0062 <0.0444 <0.0088 0.772
GC3 <0.0546 <0.0336 <0.0411 <0.0737 10.1 0.153 <0.0062 <0.0444 <0.0088 1.40
GC4 <0.0546 <0.0336 <0.0411 <0.0737 10.2 0.154 <0.0062 <0.0444 <0.0088 1.47
GC5 <0.0546 <0.0336 <0.0411 <0.0737 10.7 0.160 <0.0062 <0.0444 <0.0088 1.72
GC6 <0.0546 <0.0336 <0.0411 <0.0737 10.8 0.161 <0.0062 <0.0444 <0.0088 1.78
GC7 <0.0546 <0.0336 <0.0411 <0.0737 11.0 0.178 <0.0062 <0.0444 <0.0088 1.98
GC8 <0.0546 <0.0336 <0.0411 <0.0737 11.1 0.181 <0.0062 <0.0444 <0.0088 2.20
GC9 <0.0546 <0.0336 <0.0411 <0.0737 11.4 0.182 <0.0062 <0.0444 <0.0088 1.94
GC10 <0.0546 <0.0336 <0.0411 <0.0737 11.2 0.173 <0.0062 <0.0444 <0.0088 2.08
GC11 <0.0546 <0.0336 <0.0411 <0.0737 10.8 0.101 <0.0062 <0.0444 <0.0088 0.192
GC12 <0.0546 <0.0336 <0.0411 <0.0737 10.0 0.123 <0.0062 <0.0444 <0.0088 0.305
GC13 <0.0546 <0.0336 <0.0411 <0.0737 7.56 0.123 <0.0062 <0.0444 <0.0088 0.626
GC14 <0.0546 0.237 <0.0411 <0.0737 6.04 0.0634 <0.0062 <0.0444 <0.0088 1.53
GC15 <0.0546 <0.0336 <0.0411 <0.0737 5.05 0.108 <0.0062 <0.0444 <0.0088 0.329
GC16 <0.0546 0.821 <0.0411 <0.0737 5.83 0.0900 <0.0062 <0.0444 <0.0088 3.90
83
10. Appendix D: Supplemental Data-Leachate Experiment
10.1. Table D-1 Leachate ICP-MS Results
Sample
Name
7Li 9Be 11B 27Al 31P 31P 39K 39K 43Ca
μg/L μg/L μg/L μg/L µg/L mg/L μg/L mg/L μg/L
A1 28.2 < 0.2 181 2.86 10.9 0.0109 2210 2.21 252000
B1 2.63 < 0.2 696 18.0 59.0 0.0590 818 0.818 20000
C1 5.96 0.427 497 60.2 105 0.105 519 0.519 19700
D1 5.88 0.294 44.4 189 29.5 0.0295 806 0.806 8640
E1 < 0.5 < 0.2 408 53.1 35.0 0.0350 509 0.509 5530
F1 6.18 1.38 155 945 26.2 0.0262 533 0.533 12100
G1 4.62 9.36 81.3 22900 815 0.815 1600 1.60 107000
Sample
Blank < 0.5 < 0.2 3.38 10.7 < 5 < 0.005 6.48 0.00648
103
G-2 < 5 8.11 < 2 9750 250 0.250 785 0.785 55807
H-1 20.7 10.8 < 2 8570 22.0 0.0220 56.7 0.0567 38554
G-3 < 5 7.89 < 2 11800 1880 1.88 571 0.571 50436
G-4 < 5 5.69 < 2 8990 1590 1.59 422 0.422 35795
H-2 < 5 < 2 < 2 239 < 50 < 0.05 < 5 < 0.05 18087
G-5 < 5 3.88 < 2 9200 2970 2.97 252 0.252 22441
H-3 < 5 < 2 < 2 136 < 50 < 0.05 < 5 < 0.05 9132
A-2 13.0 < 0.2 17.6 0.727 < 5 < 0.005 837 0.837 78038
B-2 < 0.5 0.241 23.1 27.1 12.3 0.0123 364 0.364 5255
C-2 < 0.5 < 0.2 9.55 34.2 23.0 0.0230 179 0.179 4940
D-2 2.24 0.602 < 0.2 295 < 5 < 0.005 501 0.501 8900
E-2 < 0.5 < 0.2 27.6 17.8 24.5 0.0245 108 0.108 327
F-2 4.00 0.771 15.0 399 < 5 < 0.005 264 0.264 5744

84
ICP-MS Results Continued
Sample
Name
43Ca 49Ti 51V 52Cr 55Mn 55Mn 56Fe 56Fe 59Co
mg/L μg/L μg/L μg/L μg/L mg/L μg/L mg/L μg/L
A1 252 26.3 < 0.5 0.506 282 0.282 < 5 < 0.005 1.55
B1 20.0 0.547 < 0.5 0.801 1690 1.69 54.3 0.0543 0.704
C1 19.7 1.88 1.15 3.31 1170 1.17 1130 1.13 2.58
D1 8.64 1.40 < 0.5 < 0.2 277 0.277 2550 2.55 4.12
E1 5.53 0.537 < 0.5 < 0.2 465 0.465 31.7 0.0317 0.884
F1 12.1 1.49 < 0.5 0.346 2930 2.93 82.7 0.0827 3.04
G1 107 12.68 38.5 15.9 96600 96.6 285000 285 65.0
Sample
Blank 0.103 < 0.5 < 0.5 < 0.2 < 2 < 0.002 6.25 0.00625 < 0.5
G-2 55.8 10.3 13.9 6.50 75700 75.7 104000 104 35.5
H-1 38.6 56.2 2.76 3.10 354000 354 1010000 1010 212
G-3 50.4 14.9 32.8 9.92 112000 112 152000 152 34.8
G-4 35.8 11.4 24.1 8.23 104000 104 137000 137 28.6
H-2 18.1 15.9 < 5 0.001 438000 438 41400 41.4 44.2
G-5 22.4 13.6 19.3 8.94 96100 96.1 207000 207 31.9
H-3 9.13 7.10 < 5 < 2 254000 254 36000 36.0 11.2
A-2 78.0 6.77 < 0.5 < 0.2 12.8 0.0128 < 5 < 0.005 < 0.5
B-2 5.25 < 0.5 1.04 0.424 156 0.156 < 5 < 0.005 < 0.5
C-2 4.94 < 0.5 0.822 0.274 89.6 0.0896 7.58 0.00758 < 0.5
D-2 8.90 1.33 < 0.5 < 0.2 300 0.300 293 0.293 6.53
E-2 0.327 < 0.5 < 0.5 < 0.2 2.82 0.00282 < 5 < 0.005 < 0.5
F-2 5.74 < 0.5 < 0.5 < 0.2 1830 1.83 24.1 0.0241 1.68
85
ICP-MS Results Continued
Sample
Name
60Ni 63Cu 66Zn 71Ga 75As 82Se 85Rb 88Sr 90Zr
μg/L μg/L μg/L μg/L μg/L μg/L μg/L μg/L μg/L
A1 < 0.5 5.95 36.2 1.04 1.92 10.4 92.7 1600 4.07
B1 11.2 88.4 77.6 18.0 1.17 0.828 7.72 254 1.56
C1 18.2 137 181 6.56 5.23 1.09 7.17 202 116
D1 3.32 48.6 166 6.12 3.55 < 0.2 30.9 159 0.750
E1 3.70 38.9 190 15.9 1.88 0.951 7.86 113 < 0.5
F1 7.54 156 4060 2.33 1.27 < 0.2 21.7 58.7 < 0.5
G1 89.5 6520 33200 1.20 478 1.32 102 165 1.26
Sample
Blank < 0.5 4.39 26.5 < 0.5 < 0.2 < 0.2 < 0.5 < 1 < 0.5
G-2 56.7 3790 20100 < 5 250 < 2 67.4 175 < 5
H-1 26.7 9590 397000 10.9 357 4.54 6.01 14.7 < 5
G-3 48.2 4480 31600 < 5 672 < 2 48.1 168 < 5
G-4 38.0 3830 17900 < 5 561 < 2 37.1 125 < 5
H-2 8.35 491 150000 < 5 115 < 2 < 5 17.7 < 5
G-5 29.9 4310 17500 6.33 883 < 2 26.0 112 < 5
H-3 2.1 636 78700 < 5 95.3 < 2 < 5 12.6 < 5
A-2 < 0.5 < 1 3.58 3.29 0.597 0.919 36.9 389 0.638
B-2 < 0.5 8.49 4.71 4.76 0.830 0.662 3.43 67.4 < 0.5
C-2 1.03 42.9 8.82 5.45 2.73 0.546 2.72 51.5 4.62
D-2 4.40 59.7 238 53.0 3.56 < 0.2 24.6 179 < 0.5
E-2 < 0.5 5.61 18.6 1.38 0.786 0.762 1.87 7.06 < 0.5
F-2 4.49 66.4 2520 53.8 1.37 < 0.2 10.4 34.6 < 0.5

86
ICP-MS Results Continued
Sample
Name
93Nb 98Mo 105Pd 107Ag 111Cd 118Sn 121Sb 133Cs 137Ba
μg/L μg/L μg/L μg/L μg/L μg/L μg/L μg/L μg/L
A1 1.14 33.1 1.04 0.471 0.791 < 0.5 0.658 37.7 29.9
B1 0.512 12.2 < 0.5 < 0.2 < 0.2 < 0.5 10.2 < 0.5 400
C1 0.858 27.7 0.964 0.330 1.13 2.86 11.9 < 0.5 134
D1 < 0.5 < 0.5 < 0.5 0.774 1.55 < 0.5 0.366 2.68 132
E1 < 0.5 2.85 < 0.5 < 0.2 0.985 < 0.5 5.53 < 0.5 355
F1 < 0.5 < 0.5 < 0.5 < 0.2 60.4 0.637 0.248 3.79 49.9
G1 0.654 1.41 0.929 0.261 102 < 0.5 1.42 30.5 3.86
Sample
Blank < 0.5 < 0.5 < 0.5 0.440 < 0.2 < 0.5 < 0.2 < 0.5 1.23
G-2 5.84 < 5 < 5 13.1 196 < 5 3.86 45.0 11.7
H-1 < 5 < 5 < 5 < 2 2830 < 5 77.9 11.6 < 10
G-3 < 5 < 5 < 5 3.02 201 < 5 3.35 40.1 < 10
G-4 < 5 < 5 < 5 4.22 163 < 5 3.07 35.9 < 10
H-2 < 5 < 5 < 5 < 2 1210 < 5 59.0 5.15 < 10
G-5 < 5 < 5 < 5 12.3 118 < 5 3.18 30.8 89.1
H-3 < 5 < 5 < 5 < 2 696 < 5 50.6 < 5 33.4
A-2 < 0.5 46.0 < 0.5 < 0.2 < 0.2 < 0.5 < 0.5 14.4 74.4
B-2 < 0.5 8.33 < 0.5 < 0.2 < 0.2 < 0.5 9.52 < 0.5 100
C-2 < 0.5 7.93 < 0.5 0.349 < 0.2 < 0.5 4.91 < 0.5 110
D-2 < 0.5 < 0.5 < 0.5 < 0.2 2.50 < 0.5 < 0.5 1.63 900
E-2 < 0.5 1.22 < 0.5 < 0.2 < 0.2 < 0.5 3.67 < 0.5 30.0
F-2 < 0.5 < 0.5 < 0.5 0.465 40.2 < 0.5 < 0.5 1.50 954
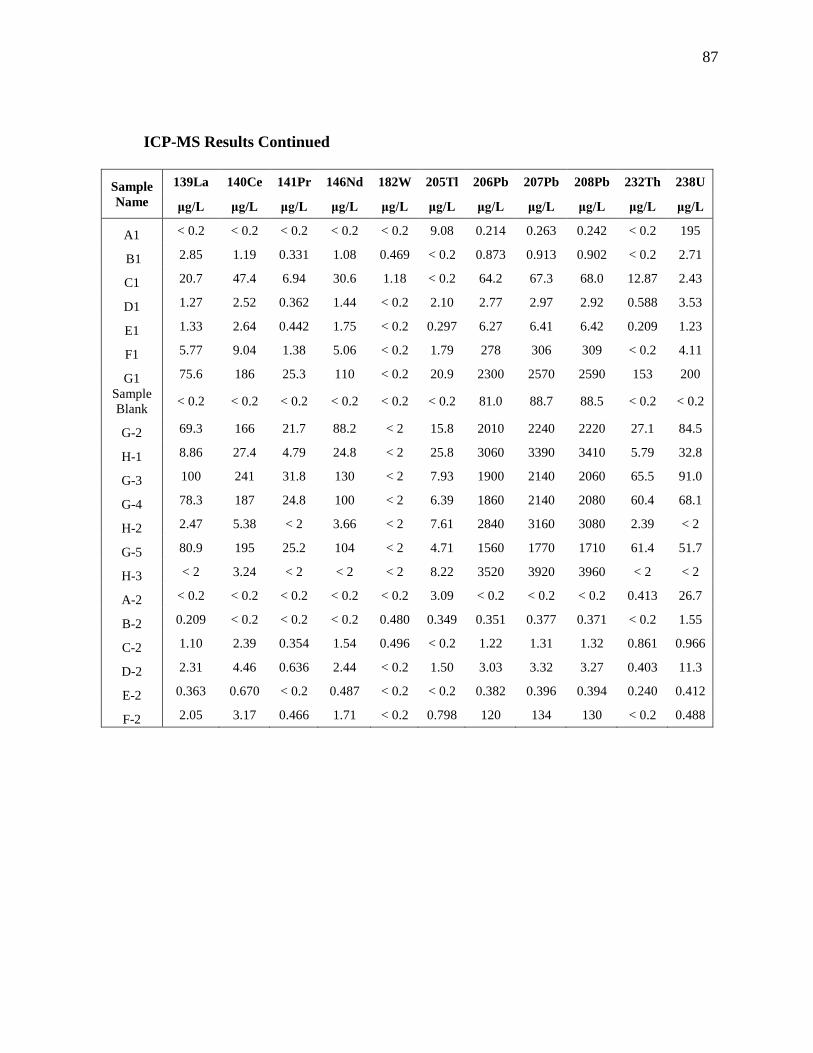
87
ICP-MS Results Continued
Sample
Name
139La 140Ce 141Pr 146Nd 182W 205Tl 206Pb 207Pb 208Pb 232Th 238U
μg/L μg/L μg/L μg/L μg/L μg/L μg/L μg/L μg/L μg/L μg/L
A1 < 0.2 < 0.2 < 0.2 < 0.2 < 0.2 9.08 0.214 0.263 0.242 < 0.2 195
B1 2.85 1.19 0.331 1.08 0.469 < 0.2 0.873 0.913 0.902 < 0.2 2.71
C1 20.7 47.4 6.94 30.6 1.18 < 0.2 64.2 67.3 68.0 12.87 2.43
D1 1.27 2.52 0.362 1.44 < 0.2 2.10 2.77 2.97 2.92 0.588 3.53
E1 1.33 2.64 0.442 1.75 < 0.2 0.297 6.27 6.41 6.42 0.209 1.23
F1 5.77 9.04 1.38 5.06 < 0.2 1.79 278 306 309 < 0.2 4.11
G1 75.6 186 25.3 110 < 0.2 20.9 2300 2570 2590 153 200
Sample
Blank < 0.2 < 0.2 < 0.2 < 0.2 < 0.2 < 0.2 81.0 88.7 88.5 < 0.2 < 0.2
G-2 69.3 166 21.7 88.2 < 2 15.8 2010 2240 2220 27.1 84.5
H-1 8.86 27.4 4.79 24.8 < 2 25.8 3060 3390 3410 5.79 32.8
G-3 100 241 31.8 130 < 2 7.93 1900 2140 2060 65.5 91.0
G-4 78.3 187 24.8 100 < 2 6.39 1860 2140 2080 60.4 68.1
H-2 2.47 5.38 < 2 3.66 < 2 7.61 2840 3160 3080 2.39 < 2
G-5 80.9 195 25.2 104 < 2 4.71 1560 1770 1710 61.4 51.7
H-3 < 2 3.24 < 2 < 2 < 2 8.22 3520 3920 3960 < 2 < 2
A-2 < 0.2 < 0.2 < 0.2 < 0.2 < 0.2 3.09 < 0.2 < 0.2 < 0.2 0.413 26.7
B-2 0.209 < 0.2 < 0.2 < 0.2 0.480 0.349 0.351 0.377 0.371 < 0.2 1.55
C-2 1.10 2.39 0.354 1.54 0.496 < 0.2 1.22 1.31 1.32 0.861 0.966
D-2 2.31 4.46 0.636 2.44 < 0.2 1.50 3.03 3.32 3.27 0.403 11.3
E-2 0.363 0.670 < 0.2 0.487 < 0.2 < 0.2 0.382 0.396 0.394 0.240 0.412
F-2 2.05 3.17 0.466 1.71 < 0.2 0.798 120 134 130 < 0.2 0.488
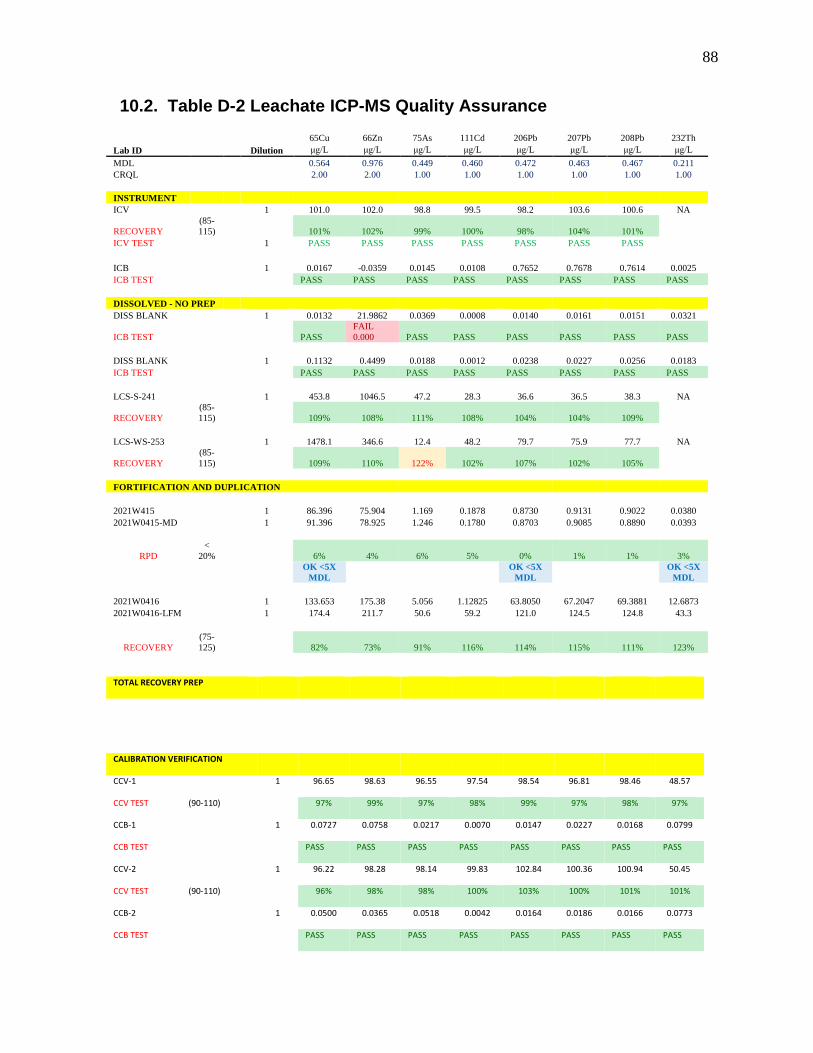
88
10.2. Table D-2 Leachate ICP-MS Quality Assurance
65Cu 66Zn 75As 111Cd 206Pb 207Pb 208Pb 232Th
Lab ID Dilution μg/L μg/L μg/L μg/L μg/L μg/L μg/L μg/L
MDL 0.564 0.976 0.449 0.460 0.472 0.463 0.467 0.211
CRQL 2.00 2.00 1.00 1.00 1.00 1.00 1.00 1.00
INSTRUMENT
ICV 1 101.0 102.0 98.8 99.5 98.2 103.6 100.6 NA
RECOVERY
(85-
115) 101% 102% 99% 100% 98% 104% 101% ICV TEST 1 PASS PASS PASS PASS PASS PASS PASS
ICB 1 0.0167 -0.0359 0.0145 0.0108 0.7652 0.7678 0.7614 0.0025
ICB TEST PASS PASS PASS PASS PASS PASS PASS PASS
DISSOLVED - NO PREP
DISS BLANK 1 0.0132 21.9862 0.0369 0.0008 0.0140 0.0161 0.0151 0.0321
ICB TEST PASS
FAIL
0.000 PASS PASS PASS PASS PASS PASS
DISS BLANK 1 0.1132 0.4499 0.0188 0.0012 0.0238 0.0227 0.0256 0.0183
ICB TEST PASS PASS PASS PASS PASS PASS PASS PASS
LCS-S-241 1 453.8 1046.5 47.2 28.3 36.6 36.5 38.3 NA
RECOVERY
(85-
115) 109% 108% 111% 108% 104% 104% 109%
LCS-WS-253 1 1478.1 346.6 12.4 48.2 79.7 75.9 77.7 NA
RECOVERY
(85-
115) 109% 110% 122% 102% 107% 102% 105%
FORTIFICATION AND DUPLICATION
2021W415 1 86.396 75.904 1.169 0.1878 0.8730 0.9131 0.9022 0.0380
2021W0415-MD 1 91.396 78.925 1.246 0.1780 0.8703 0.9085 0.8890 0.0393
RPD
<
20% 6% 4% 6% 5% 0% 1% 1% 3%
OK <5X
MDL
OK <5X
MDL
OK <5X
MDL
2021W0416 1 133.653 175.38 5.056 1.12825 63.8050 67.2047 69.3881 12.6873
2021W0416-LFM 1 174.4 211.7 50.6 59.2 121.0 124.5 124.8 43.3
RECOVERY
(75-
125) 82% 73% 91% 116% 114% 115% 111% 123%
TOTAL RECOVERY PREP
CALIBRATION VERIFICATION
CCV-1 1 96.65 98.63 96.55 97.54 98.54 96.81 98.46 48.57
CCV TEST (90-110)
97% 99% 97% 98% 99% 97% 98% 97%
CCB-1 1 0.0727 0.0758 0.0217 0.0070 0.0147 0.0227 0.0168 0.0799
CCB TEST
PASS PASS PASS PASS PASS PASS PASS PASS
CCV-2
1 96.22 98.28 98.14 99.83 102.84 100.36 100.94 50.45
CCV TEST (90-110)
96% 98% 98% 100% 103% 100% 101% 101%
CCB-2
1 0.0500 0.0365 0.0518 0.0042 0.0164 0.0186 0.0166 0.0773
CCB TEST
PASS PASS PASS PASS PASS PASS PASS PASS

89
CCV-3
1 96.30 98.41 95.97 102.20 106.15 105.35 105.72 53.38
CCV TEST (90-110)
96% 98% 96% 102% 106% 105% 106% 107%
CCB-3
1 0.0466 0.0241 0.0399 0.0053 0.0218 0.0273 0.0232 0.0788
CCB TEST
PASS PASS PASS PASS PASS PASS PASS PASS
CCV-4
1 96.51 98.61 93.86 108.76 109.68 108.34 108.02 55.73
CCV TEST (90-110)
97% 99% 94% 109% 110% 108% 108% 111%
CCB-4
1 0.0702 0.115 0.047 0.0061 0.0188 0.0208 0.0191 0.0808
CCB TEST
PASS PASS PASS PASS PASS PASS PASS PASS
CCV-5
1 94.78 96.96 92.69 100.02 102.05 101.63 102.72 51.02
CCV TEST (90-110)
95% 97% 93% 100% 102% 102% 103% 102%
CCB-5
1 0.0663 0.0878 0.037 0.005 0.0154 0.0185 0.0155 0.0925
CCB TEST
PASS PASS PASS PASS PASS PASS PASS PASS
CCV-6
1 95.43 100.19 94.32 100.47 104.02 103.38 101.78 51.84
CCV TEST (90-110)
95% 100% 94% 100% 104% 103% 102% 104%
CCB-6
1 0.068 0.062 0.011 0.006 0.018 0.019 0.018 0.110
CCB TEST
PASS PASS PASS PASS PASS PASS PASS PASS
CCV-7
1 105.39 108.60 106.87 102.58 101.80 101.14 100.92 50.85
CCV TEST (90-110)
105% 109% 107% 103% 102% 101% 101% 102%
CCB-7
1 0.090 0.13 0.019 0.006 0.01 0.02 0.01 0.09
CCB TEST
PASS PASS PASS PASS PASS PASS PASS PASS
CCV-8
1 103.03 107.35 103.80 103.73 105.72 105.52 105.50 52.82
CCV TEST (90-110)
103% 107% 104% 104% 106% 106% 105% 106%
CCB-8
1 0.075 0.007 0.028 0.007 0.018 0.023 0.016 0.095
CCB TEST
PASS PASS PASS PASS PASS PASS PASS PASS
CCV-9
1 99.89 104.00 98.36 106.78 110.98 108.89 110.44 54.66
CCV TEST (90-110)
100% 104% 98% 107% 111% 109% 110% 109%
CCB-9
1 0.069 0.054 0.019 0.005 0.014 0.018 0.016 0.096
CCB TEST
PASS PASS PASS PASS PASS PASS PASS PASS
CCV-10
1 91.12 97.18 90.04 102.85 105.06 104.51 107.27 53.58
CCV TEST (90-110)
91% 97% 90% 103% 105% 105% 107% 107%
CCB-10
1 0.0854 0.9369 0.0602 0.0072 0.0208 0.0247 0.0238 0.0818
CCB TEST
PASS PASS PASS PASS PASS PASS PASS PASS
CCV-11
1 94.76 98.37 95.92 101.81 104.72 105.62 103.63 52.03
CCV TEST (90-110)
95% 98% 96% 102% 105% 106% 104% 104%
CCB-11
1 0.0726 0.3481 0.0842 0.0054 0.0207 0.0265 0.0198 0.0972
CCB TEST
PASS PASS PASS PASS PASS PASS PASS PASS
CCV-12
1 97.86 99.55 99.04 100.59 104.84 101.74 103.00 51.70
CCV TEST (90-110)
98% 100% 99% 101% 105% 102% 103% 103%
CCB-12
1 0.0685 0.1388 0.0815 0.0090 0.0167 0.0206 0.0186 0.0939
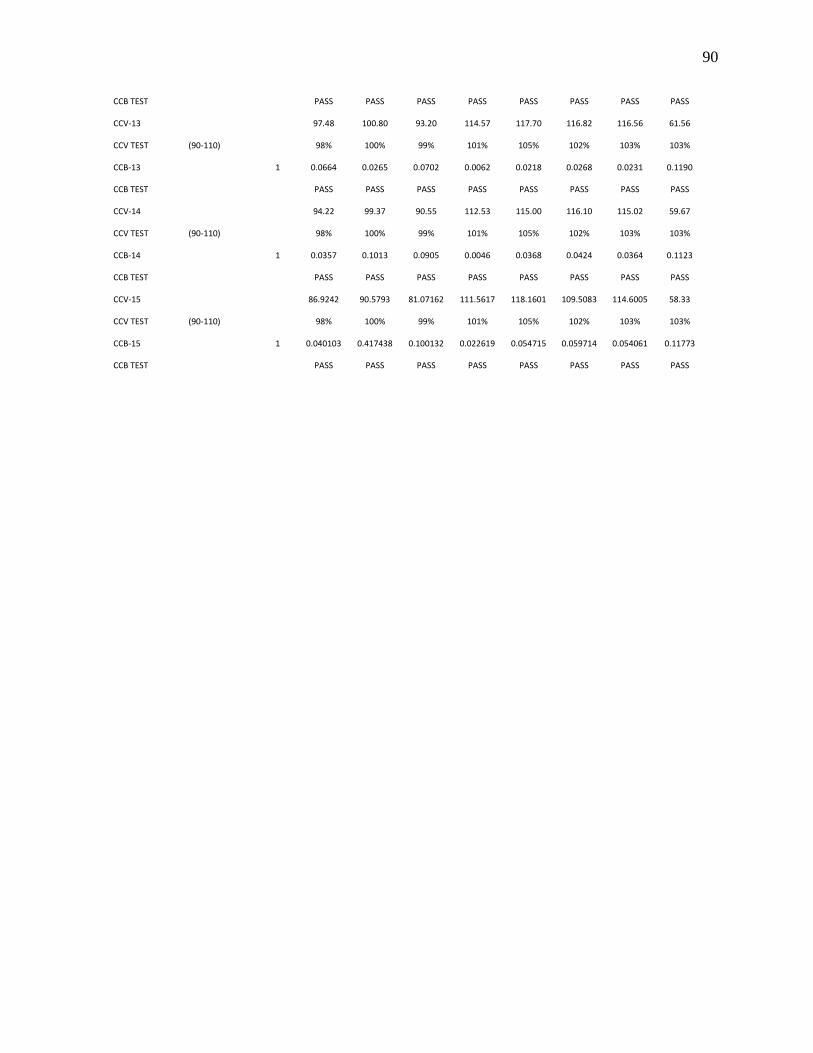
90
CCB TEST
PASS PASS PASS PASS PASS PASS PASS PASS
CCV-13
97.48 100.80 93.20 114.57 117.70 116.82 116.56 61.56
CCV TEST (90-110)
98% 100% 99% 101% 105% 102% 103% 103%
CCB-13
1 0.0664 0.0265 0.0702 0.0062 0.0218 0.0268 0.0231 0.1190
CCB TEST
PASS PASS PASS PASS PASS PASS PASS PASS
CCV-14
94.22 99.37 90.55 112.53 115.00 116.10 115.02 59.67
CCV TEST (90-110)
98% 100% 99% 101% 105% 102% 103% 103%
CCB-14
1 0.0357 0.1013 0.0905 0.0046 0.0368 0.0424 0.0364 0.1123
CCB TEST
PASS PASS PASS PASS PASS PASS PASS PASS
CCV-15
86.9242 90.5793 81.07162 111.5617 118.1601 109.5083 114.6005 58.33
CCV TEST (90-110)
98% 100% 99% 101% 105% 102% 103% 103%
CCB-15
1 0.040103 0.417438 0.100132 0.022619 0.054715 0.059714 0.054061 0.11773
CCB TEST
PASS PASS PASS PASS PASS PASS PASS PASS

91
10.3. Table D-3 ICP-OES Results
Sample
Name
mg/L mg/L mg/L mg/L mg/L mg/L mg/L mg/L mg/L
Al As B Ba Be Ca Cd Co Cr
A1 0.131 <0.1 0.200 0.0264 <0.0131 476 <0.0037 <0.0042 <0.0146
B1 0.0381 <0.1 0.693 0.330 <0.0131 36.3 <0.0037 <0.0042 <0.0146
C1 0.0805 <0.1 0.508 0.120 <0.0131 38.7 <0.0037 <0.0042 <0.0146
D1 0.204 <0.1 0.0516 0.114 <0.0131 16.2 <0.0037 <0.0042 <0.0146
E1 0.0571 <0.1 0.397 0.293 <0.0131 10.1 <0.0037 <0.0042 <0.0146
F1 0.904 <0.1 0.151 0.0421 <0.0131 22.5 0.0473 <0.0042 <0.0146
G1 24.6 0.552 0.521 0.00946 0.0159 220 0.298 0.0742 0.0431
Blank <0.0373 <0.1 <0.0138 <0.0072 <0.0131 0.197 <0.0037 <0.0042 <0.0146
G-2 10.8 0.295 0.192 0.0130 <0.012 120 0.205 0.0439 0.0304
H-1 9.90 0.419 1.73 <0.0092 0.0124 83.0 3.16 0.261 0.113
G-3 13.6 0.816 0.256 <0.0092 <0.012 112 0.231 0.0421 0.0461
G-4 10.6 0.686 0.232 0.00969 <0.012 77.3 0.185 0.0339 0.0450
H-2 0.278 0.126 0.116 <0.0092 <0.012 40.0 1.24 0.0550 0.139
G-5 10.4 1.10 0.339 0.103 <0.012 48.8 0.168 0.0397 0.0428
H-3 0.162 0.106 0.0838 0.0323 <0.012 19.4 0.707 0.0141 0.0813
A-2 <0.0307 <0.1 0.0365 0.0689 <0.012 174 <0.0041 <0.0022 <0.0168
B-2 <0.0307 <0.1 0.0413 0.104 <0.012 11.4 <0.0041 <0.0022 <0.0168
C-2 0.0371 <0.1 0.0201 0.113 <0.012 10.9 <0.0041 <0.0022 <0.0168
D-2 0.321 <0.1 <0.011 0.743 <0.012 20.0 <0.0041 0.00760 <0.0168
E-2 <0.0307 <0.1 0.0446 0.0298 <0.012 0.718 <0.0041 <0.0022 <0.0168
F-2 0.467 <0.1 0.0291 0.899 <0.012 12.8 0.0393 <0.0022 <0.0168

92
ICP-OES Results Continued
Sample
Name
mg/L mg/L mg/L mg/L mg/L mg/L mg/L mg/L mg/L
Cu Fe K Li Mg Mn Mo Na Ni
A1 0.0140 <0.0128 22.4 0.0374 180 0.269 0.0331 4.54 0.00783
B1 0.0888 0.0722 7.91 <0.0261 5.12 1.55 0.0120 10.3 0.0118
C1 0.145 1.10 5.13 <0.0261 6.12 1.11 0.0279 8.96 0.0201
D1 0.0518 2.37 7.74 <0.0261 4.69 0.259 <0.005 0.817 <0.0054
E1 0.0400 0.0389 4.79 <0.0261 1.96 0.425 <0.005 11.7 <0.0054
F1 0.162 0.0867 5.19 <0.0261 1.32 2.68 <0.005 3.16 0.00808
G1 8.09 281 17.8 <0.0261 6.67 94.3 <0.005 1.77 0.130
Blank 0.00796 0.0162 <0.118 <0.0261 0.0148 <0.0164 <0.005 0.0573 <0.0054
G-2 4.59 113 7.62 <0.036 3.65 81.0 <0.009 0.734 0.0746
H-1 12.0 1222 0.240 <0.036 14.3 420 <0.009 2.09 0.0150
G-3 5.50 168 5.75 <0.036 3.62 124 <0.009 0.401 0.0698
G-4 4.73 152 4.26 <0.036 2.66 114 <0.009 0.261 0.0557
H-2 0.640 46.6 0.133 <0.036 9.86 466 <0.009 0.592 0.0282
G-5 5.38 242 2.51 <0.036 1.87 112 <0.009 0.207 0.0458
H-3 0.820 40.2 <0.131 <0.036 4.74 285 <0.009 0.340 0.0123
A-2 <0.006 <0.0176 8.25 <0.036 35.6 0.0274 0.0556 0.567 <0.0065
B-2 0.0113 <0.0176 3.54 <0.036 1.44 0.178 0.0104 2.38 <0.0065
C-2 0.0533 <0.0176 1.69 <0.036 1.45 0.100 <0.009 1.08 <0.0065
D-2 0.0736 0.340 5.11 <0.036 5.55 0.334 <0.009 0.221 0.00686
E-2 0.00932 <0.0176 0.931 <0.036 0.124 <0.157 <0.009 1.06 <0.0065
F-2 0.0812 0.0343 2.69 <0.036 0.745 2.04 <0.009 0.556 0.00808

93
ICP-OES Results Continued
Sample
Name
mg/L mg/L mg/L mg/L mg/L mg/L mg/L mg/L mg/L mg/L
P Pb Sb Se Si Sr Ti Tl V Zn
A1 <0.0195 <0.0204 <0.0198 <0.0167 3.11 1.69 <0.0105 0.0226 <0.0139 0.0535
B1 0.0487 <0.0204 <0.0198 <0.0167 4.21 0.251 <0.0105 <0.0183 <0.0139 0.0783
C1 0.0925 0.0593 <0.0198 <0.0167 6.83 0.203 <0.0105 <0.0183 <0.0139 0.187
D1 0.0331 <0.0204 <0.0198 <0.0167 8.35 0.160 <0.0105 <0.0183 <0.0139 0.170
E1 0.0258 <0.0204 <0.0198 <0.0167 6.22 0.111 <0.0105 <0.0183 <0.0139 0.190
F1 <0.0195 0.243 <0.0198 <0.0167 17.4 0.0568 <0.0105 <0.0183 <0.0139 4.10
G1 0.602 2.15 <0.0198 <0.0167 15.3 0.266 <0.0105 0.111 <0.0139 37.0
Blank <0.0195 0.0731 <0.0198 <0.0167 0.222 <0.0069 <0.0105 <0.0183 <0.0139 0.0278
G-2 0.222 2.20 <0.0161 <0.0193 11.6 0.201 <0.0104 0.0834 <0.0127 21.4
H-1 <0.0168 3.45 0.100 <0.0193 5.68 0.0235 <0.0104 0.379 <0.0127 487
G-3 1.91 2.12 <0.0161 <0.0193 9.91 0.195 <0.0104 0.115 <0.0127 22.9
G-4 1.69 2.10 <0.0161 0.0250 7.76 0.151 <0.0104 0.109 <0.0127 19.3
H-2 0.0576 3.18 0.0174 0.192 4.41 0.0218 <0.0104 0.425 <0.0127 162
G-5 3.34 1.78 <0.0161 <0.0193 6.41 0.137 <0.0104 0.0935 <0.0127 18.9
H-3 0.0347 4.03 0.0329 0.121 3.32 0.0154 <0.0104 0.262 <0.0127 87.6
A-2 <0.0168 <0.0233 <0.0161 <0.0193 2.03 0.470 <0.0104 <0.032 <0.0127 0.00990
B-2 <0.0168 <0.0233 <0.0161 <0.0193 2.95 0.0812 <0.0104 <0.032 <0.0127 0.00603
C-2 0.0284 <0.0233 <0.0161 <0.0193 3.30 0.0583 <0.0104 <0.032 <0.0127 0.00966
D-2 <0.0168 <0.0233 <0.0161 <0.0193 6.34 0.197 <0.0104 <0.032 <0.0127 0.255
E-2 <0.0168 <0.0233 <0.0161 <0.0193 2.86 0.00787 <0.0104 <0.032 <0.0127 0.0213
F-2 <0.0168 0.133 <0.0161 <0.0193 13.3 0.0394 <0.0104 <0.032 <0.0127 2.77
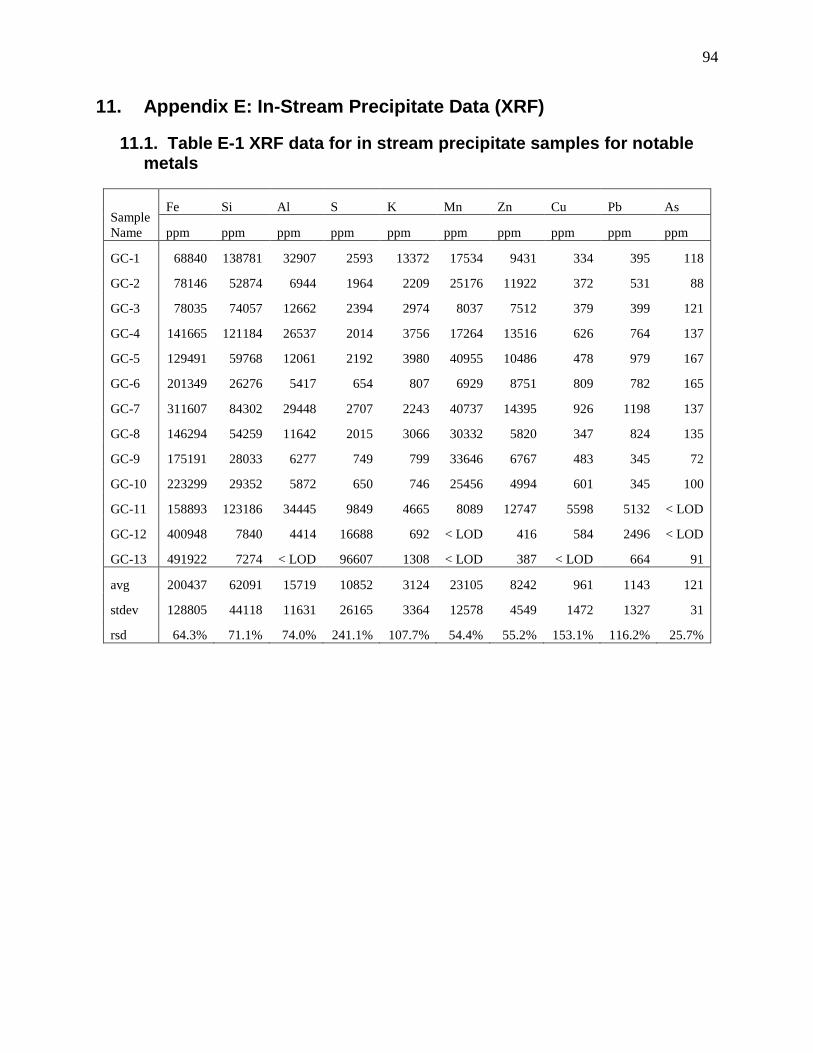
94
11. Appendix E: In-Stream Precipitate Data (XRF)
11.1. Table E-1 XRF data for in stream precipitate samples for notable metals
Sample
Name
Fe Si Al S K Mn Zn Cu Pb As
ppm ppm ppm ppm ppm ppm ppm ppm ppm ppm
GC-1 68840 138781 32907 2593 13372 17534 9431 334 395 118
GC-2 78146 52874 6944 1964 2209 25176 11922 372 531 88
GC-3 78035 74057 12662 2394 2974 8037 7512 379 399 121
GC-4 141665 121184 26537 2014 3756 17264 13516 626 764 137
GC-5 129491 59768 12061 2192 3980 40955 10486 478 979 167
GC-6 201349 26276 5417 654 807 6929 8751 809 782 165
GC-7 311607 84302 29448 2707 2243 40737 14395 926 1198 137
GC-8 146294 54259 11642 2015 3066 30332 5820 347 824 135
GC-9 175191 28033 6277 749 799 33646 6767 483 345 72
GC-10 223299 29352 5872 650 746 25456 4994 601 345 100
GC-11 158893 123186 34445 9849 4665 8089 12747 5598 5132 < LOD
GC-12 400948 7840 4414 16688 692 < LOD 416 584 2496 < LOD
GC-13 491922 7274 < LOD 96607 1308 < LOD 387 < LOD 664 91
avg 200437 62091 15719 10852 3124 23105 8242 961 1143 121
stdev 128805 44118 11631 26165 3364 12578 4549 1472 1327 31
rsd 64.3% 71.1% 74.0% 241.1% 107.7% 54.4% 55.2% 153.1% 116.2% 25.7%
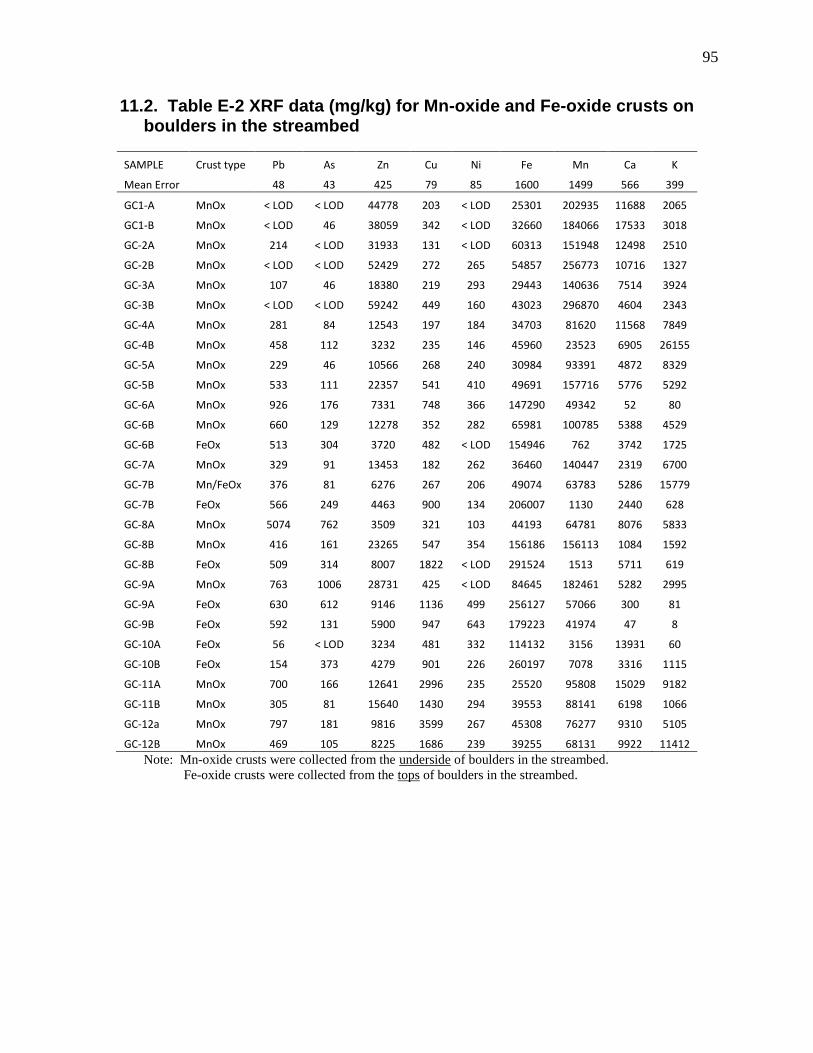
95
11.2. Table E-2 XRF data (mg/kg) for Mn-oxide and Fe-oxide crusts on boulders in the streambed
SAMPLE Crust type Pb As Zn Cu Ni Fe Mn Ca K
Mean Error 48 43 425 79 85 1600 1499 566 399
GC1-A MnOx < LOD < LOD 44778 203 < LOD 25301 202935 11688 2065
GC1-B MnOx < LOD 46 38059 342 < LOD 32660 184066 17533 3018
GC-2A MnOx 214 < LOD 31933 131 < LOD 60313 151948 12498 2510
GC-2B MnOx < LOD < LOD 52429 272 265 54857 256773 10716 1327
GC-3A MnOx 107 46 18380 219 293 29443 140636 7514 3924
GC-3B MnOx < LOD < LOD 59242 449 160 43023 296870 4604 2343
GC-4A MnOx 281 84 12543 197 184 34703 81620 11568 7849
GC-4B MnOx 458 112 3232 235 146 45960 23523 6905 26155
GC-5A MnOx 229 46 10566 268 240 30984 93391 4872 8329
GC-5B MnOx 533 111 22357 541 410 49691 157716 5776 5292
GC-6A MnOx 926 176 7331 748 366 147290 49342 52 80
GC-6B MnOx 660 129 12278 352 282 65981 100785 5388 4529
GC-6B FeOx 513 304 3720 482 < LOD 154946 762 3742 1725
GC-7A MnOx 329 91 13453 182 262 36460 140447 2319 6700
GC-7B Mn/FeOx 376 81 6276 267 206 49074 63783 5286 15779
GC-7B FeOx 566 249 4463 900 134 206007 1130 2440 628
GC-8A MnOx 5074 762 3509 321 103 44193 64781 8076 5833
GC-8B MnOx 416 161 23265 547 354 156186 156113 1084 1592
GC-8B FeOx 509 314 8007 1822 < LOD 291524 1513 5711 619
GC-9A MnOx 763 1006 28731 425 < LOD 84645 182461 5282 2995
GC-9A FeOx 630 612 9146 1136 499 256127 57066 300 81
GC-9B FeOx 592 131 5900 947 643 179223 41974 47 8
GC-10A FeOx 56 < LOD 3234 481 332 114132 3156 13931 60
GC-10B FeOx 154 373 4279 901 226 260197 7078 3316 1115
GC-11A MnOx 700 166 12641 2996 235 25520 95808 15029 9182
GC-11B MnOx 305 81 15640 1430 294 39553 88141 6198 1066
GC-12a MnOx 797 181 9816 3599 267 45308 76277 9310 5105
GC-12B MnOx 469 105 8225 1686 239 39255 68131 9922 11412
Note: Mn-oxide crusts were collected from the underside of boulders in the streambed.
Fe-oxide crusts were collected from the tops of boulders in the streambed.
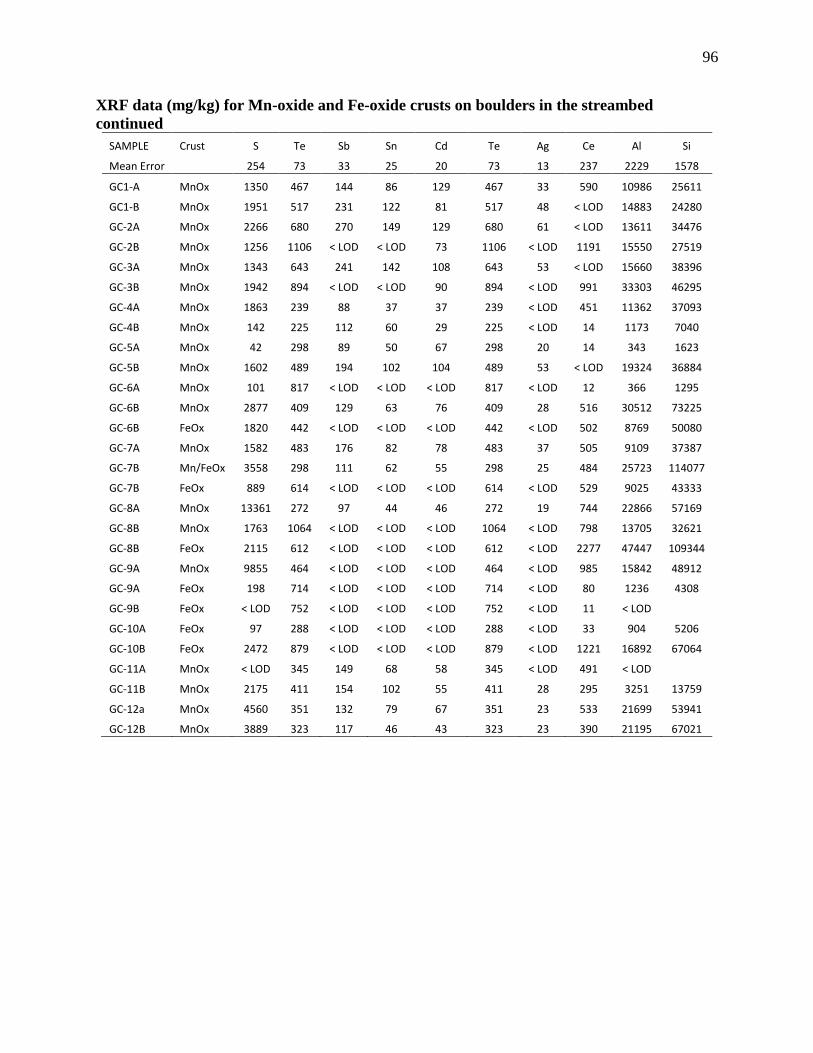
96
XRF data (mg/kg) for Mn-oxide and Fe-oxide crusts on boulders in the streambed
continued
SAMPLE Crust S Te Sb Sn Cd Te Ag Ce Al Si
Mean Error 254 73 33 25 20 73 13 237 2229 1578
GC1-A MnOx 1350 467 144 86 129 467 33 590 10986 25611
GC1-B MnOx 1951 517 231 122 81 517 48 < LOD 14883 24280
GC-2A MnOx 2266 680 270 149 129 680 61 < LOD 13611 34476
GC-2B MnOx 1256 1106 < LOD < LOD 73 1106 < LOD 1191 15550 27519
GC-3A MnOx 1343 643 241 142 108 643 53 < LOD 15660 38396
GC-3B MnOx 1942 894 < LOD < LOD 90 894 < LOD 991 33303 46295
GC-4A MnOx 1863 239 88 37 37 239 < LOD 451 11362 37093
GC-4B MnOx 142 225 112 60 29 225 < LOD 14 1173 7040
GC-5A MnOx 42 298 89 50 67 298 20 14 343 1623
GC-5B MnOx 1602 489 194 102 104 489 53 < LOD 19324 36884
GC-6A MnOx 101 817 < LOD < LOD < LOD 817 < LOD 12 366 1295
GC-6B MnOx 2877 409 129 63 76 409 28 516 30512 73225
GC-6B FeOx 1820 442 < LOD < LOD < LOD 442 < LOD 502 8769 50080
GC-7A MnOx 1582 483 176 82 78 483 37 505 9109 37387
GC-7B Mn/FeOx 3558 298 111 62 55 298 25 484 25723 114077
GC-7B FeOx 889 614 < LOD < LOD < LOD 614 < LOD 529 9025 43333
GC-8A MnOx 13361 272 97 44 46 272 19 744 22866 57169
GC-8B MnOx 1763 1064 < LOD < LOD < LOD 1064 < LOD 798 13705 32621
GC-8B FeOx 2115 612 < LOD < LOD < LOD 612 < LOD 2277 47447 109344
GC-9A MnOx 9855 464 < LOD < LOD < LOD 464 < LOD 985 15842 48912
GC-9A FeOx 198 714 < LOD < LOD < LOD 714 < LOD 80 1236 4308
GC-9B FeOx < LOD 752 < LOD < LOD < LOD 752 < LOD 11 < LOD
GC-10A FeOx 97 288 < LOD < LOD < LOD 288 < LOD 33 904 5206
GC-10B FeOx 2472 879 < LOD < LOD < LOD 879 < LOD 1221 16892 67064
GC-11A MnOx < LOD 345 149 68 58 345 < LOD 491 < LOD
GC-11B MnOx 2175 411 154 102 55 411 28 295 3251 13759
GC-12a MnOx 4560 351 132 79 67 351 23 533 21699 53941
GC-12B MnOx 3889 323 117 46 43 323 23 390 21195 67021

97
11.3. Table E-3 XRF analyses of samples used in leachate studies (mg/kg)
SA
MP
LE
Cel
l # Pb
As
Zn
Cu
Ni
Co
Fe
Mn
S
Al
Si
Bla
nk
(cru
cib
le)
24
< L
OD
< L
OD
< L
OD
< L
OD
< L
OD
96
4
< L
OD
42
9
n.a
.
n.a
.
Cle
nd
enn
in
pp
y
C
25
9
< L
OD
67
9
31
5
< L
OD
< L
OD
23
94
8
44
2
99
8
33
41
3
26
45
66
Gal
ena
Cre
ek p
py
D
22
3
65
79
65
45
< L
OD
10
00
9
13
8
31
98
76
60
8
29
02
11
Wo
lf p
py
B
11
9
< L
OD
10
7
12
4
< L
OD
< L
OD
18
81
6
68
5
10
62
86
58
91
60
5
Hu
gh
esvil
le
Sto
ck
(fre
sh) E
92
20
22
4
89
< L
OD
29
1
32
23
3
53
6
10
99
43
62
8
25
35
31
Go
ld R
un
Tu
ff A
95
32
31
5
14
8
15
2
< L
OD
19
91
8
57
2
36
1
37
70
26
88
4
Ou
tcro
p
tran
sect
beh
ind
Blo
ck P
F
71
16
46
1
35
1
40
8
13
1
< L
OD
12
20
71
27
51
29
76
68
64
35
94
9
QS
P-a
lter
ed
Hu
gh
esvil
le
Sto
ck G
22
67
34
7
18
96
97
3
< L
OD
37
0
55
35
9
50
2
75
26
7
48
34
9
19
56
59
Cle
nd
enn
in
reru
n C
25
4
< L
OD
50
8
33
1
18
7
< L
OD
20
77
9
52
3
85
24
38
25
40
7

98
12. Appendix F: Photographs
12.1. Figure F1 Representative Hand Samples for Leachate Experiments

99