Embed Size (px)
Citation preview

Journal of Geophysical Research: Solid Earth
RESEARCH ARTICLE10.1002/2013JB010590
Key Points:• Seismic source mechanisms of
Vulcanian explosions• Full moment tensor inversion of very
long period seismic signals• Opening of an ellipsoidal
magma cavity associated withvolcanic explosions
Correspondence to:K. Kim,[email protected]
Citation:Kim, K., J. M. Lees, and M. C. Ruiz(2014), Source mechanism ofVulcanian eruption at TungurahuaVolcano, Ecuador, derived fromseismic moment tensor inversions, J.Geophys. Res. Solid Earth, 119,1145–1164, doi:10.1002/2013JB010590.
Received 7 AUG 2013
Accepted 14 JAN 2014
Accepted article online 20 JAN 2014
Published online 13 FEB 2014
Source mechanism of Vulcanian eruption at TungurahuaVolcano, Ecuador, derived from seismic momenttensor inversionsKeehoon Kim1, Jonathan M. Lees1, and Mario C. Ruiz2
1Department of Geological Sciences, University of North Carolina at Chapel Hill, Chapel Hill, North Carolina, USA,2Instituto Geofísico de la Escuela Politécnica Nacional, Quito, Ecuador
Abstract Source mechanisms of explosive volcanic eruptions are critical for understanding magmaticplumbing systems and magma transport. Tungurahua is a large andesitic stratovolcano whereseismoacoustic data has been recorded over several years. In May 2010, an energetic eruption cycle beganwith a midsize Vulcanian explosion followed by swarms of explosive eruptions. The five-stationseismoacoustic network recorded significant seismic and infrasonic signals from the explosions. Sourcemechanisms of 50 explosion earthquakes associated with Vulcanian explosions during this eruptive periodare investigated here. The source centroid locations and geometries of explosive signals in the 10–2 s bandwere determined by full-waveform moment tensor inversion. The observed waveforms are well explainedby a combination of volumetric moment tensor components and a single, vertical, downward forcecomponent. The source centroids are positioned about 1.5 km below and about 320 m north of the activecrater. Eigenvalue and eigenvector analysis indicates that the source geometries can be described by asubhorizontal, thin ellipsoid representing a sill-like magma accumulation. Resultant source time historiesshow a repetitive sequence of inflation and deflation from event to event, indicating identical sourceprocesses frequently occurred over the period. The inflation/deflation in the deep source region may bethe result of crack opening. Volatile bubble growth at depth opens a pathway for gases to escape andtriggers shallow explosions at the summit crater. The associated downward single force is interpreted asan exchange of linear momentum between the source and the surrounding region during the escapinggas flow.
1. Introduction
Quantitative analysis of seismic sources excited by volcanic processes can provide constraints on the geom-etry of magma plumbing systems, magma transport budgets, and temporal evolution of eruption processes.Portable broadband seismic instrumentation and digital networks have come into wide use in volcano mon-itoring. In recent years detailed monitoring has yielded seismic data of high enough quality to facilitate thequantification of seismic source mechanisms of volcanic eruptions, which ultimately will contribute to theassessment of volcanic behavior and associated hazard.
With the use of broadband seismometers, very long period (VLP) seismic signals with typical periods in therange of 2–100 s are frequently observed at many volcanoes. Because low-frequency waves suffer relativelyless path distortion compared to the high frequency, VLP signals can provide a window into source pro-cesses related to volcanic activity. Systematic moment tensor inversion of VLP signal has been investigatedwhere seismic source mechanisms were successfully extracted at a number of active volcanoes, includ-ing Kilauea [Ohminato et al., 1998; Chouet et al., 2010; Chouet and Dawson, 2011], Stromboli [Chouet et al.,2003; Auger et al., 2006], Popocatépetl [Chouet et al., 2005], Asama [Ohminato et al., 2006], Erebus [Aster etal., 2008], Etna [Cannata et al., 2009], Augustine [Dawson et al., 2011], Tungurahua [Kumagai et al., 2011],and Redoubt [Haney et al., 2012]. Whereas tectonic earthquakes can be described by double-couple (DC)force systems, volumetric changes in seismic moment tensors were commonly observed at those volcanoes,occasionally with a single-force component [Chouet et al., 2005; Ohminato et al., 2006]. The volume changeand single force component are typically interpreted as manifestations of inertial forces associated with thetransport of magmatic fluids through volcano plumbing systems [Chouet and Matoza, 2013].
Explosive eruptions of Vulcanian type are characterized by the instantaneous ejection of volcanic bombs,ash, and gases and often associated with strong air shocks and seismic events. The seismic events
KIM ET AL. ©2014. American Geophysical Union. All Rights Reserved. 1145

Journal of Geophysical Research: Solid Earth 10.1002/2013JB010590
accompanying explosive Vulcanian eruptions, called “explosion earthquakes” hereafter, have also beeninverted for moment tensor solution. At Mount St. Helens, 1980, it was shown that explosion earthquakescan be modeled by a combination of a single force and an implosive source [Kanamori et al., 1984]. Tameguriet al. [2002] showed that an isotropic expansion occurred at a depth of 2 km before the explosive eruptionat Mt. Sakurajima. Iguchi et al. [2008] also observed a triggering expansion preceding the surface explosionat Sakurajima, Suwanosejima, and Semeru Volcanoes. As explosion earthquakes are direct manifestationsof dynamic conditions in the magma plumbing system, their moment tensor analysis can provide quantita-tive information about eruption processes such as the geometry of the conduit systems and the temporalevolution of seismic sources.
In this study, we investigate source mechanisms of Vulcanian eruptions at Tungurahua Volcano. Tungu-rahua (1.45◦S, 78.43◦W) is one of the most active andesitic volcanoes in Ecuador. Located on the CordilleraReal at the eastern border of the Interandean Valley, it has a 5023 m high summit with a 300 m wide crater,steep flanks, and extreme relief. Its current cone developed over the past 2300 years superimposed abovetwo ancient edifices which were partially destroyed by large debris avalanches [Hall et al., 1999]. Tungu-rahua has experienced at least 17 major eruptions in the last three millennia [Le Pennec et al., 2006]. Sincecolonial times (1534), Tungurahua has exhibited five eruptive periods 1640–1645, 1773–1781, 1886–1888,1916–1918, and 1999 to present [Hall et al., 1999; Le Pennec et al., 2006]. These eruptions were characterizedby Vulcanian explosions and transitions between Vulcanian to Strombolian with mainly andesitic to daciticcompositions [Ruiz et al., 2006].
During the recent eruptive period (1999 to present), volcanic activity at Tungurahua was dominated byepisodic explosions with emissions of ash and gas through the vent in the summit crater. On 26 May 2010,an energetic eruption episode started with a strong explosion at the vent. Two days passed with no eruptiveactivity, then an even larger explosion occurred on 28 May, generating a 10 km high column and pyroclas-tic flows pouring down the volcano flanks. The volcano commenced explosive swarm activity includinghundreds of events after 5 h of quiescence until 18 June, at which point the volcano returned to quies-cence. Some explosions produced large noises resembling “cannon shot” which often vibrated windowsand doors in the local area [Venzke et al., 2002]. Extremely strong infrasound up to 200 Pa at 5 km distancewas recorded with these explosions.
In this paper, explosion earthquakes associated with eruptive events during the May–June crises wereinverted for seismic moment tensor. We used the linear inversion method proposed by Ohminato et al.[1998] to quantify the source mechanism of the explosion earthquakes. Synthetic waveforms were con-structed by a superposition of Green’s functions obtained for six moment tensor components and threesingle-force components. The geometry and temporal evolution of source mechanism is inferred here fromthe resultant moment tensor. The relationship between the explosion earthquakes and the vent explosionin the summit crater was further investigated using recorded infrasound data.
2. Data
Between 2006 and 2008 a network of five broadband seismoacoustic stations (Figure 1) was deployed byIG-EPN (Instituto Geofísico de la Escuela Politécnica Nacional, Ecuador), with support from Japan Inter-national Cooperation Agency (JICA) program to monitor Tungurahua for hazard mitigation and volcanoresearch [Kumagai et al., 2007]. Each station included a broadband seismometer (Guralp CMG-40T) withflat response to velocity from 30 s to 50 Hz and an ACO Type-7144/4144 acoustic sensor. The nominal infra-sound sensor response was 0.1 to 100 Hz, with microphone sensitivity of 0.025 V/Pa and output voltage of±5 V. The sensors were set to record 893.5 Pa at full scale with sensitivity of −0.005593 V/Pa, and a 100 Hzlow-pass filter was applied in the amplifier circuits. The microphones were designed specifically to record inharsh volcanic settings. Distances between the vent and stations ranged from 4.7 km at BPAT to 6.5 km atthe furthest station BRUN.
A massive swarm of seismoacoustic events were recorded during the May–June crises of Tungurahua. Anexample of seismoacoustic records associated with the explosion is shown in Figure 2a. The observedseismoacoustic signals are characterized by (1) strong impulsive infrasound (∼ 300 Pa) excited by explo-sions at the summit crater, (2) an emergent, compressional first-motion seismic arrival, and (3) followingquasi-harmonic coda and volcanic tremor (or long-period waves). These data are representative of trueground displacement after being deconvolved for instrument response in the 0.02–30 s band. The VLP
KIM ET AL. ©2014. American Geophysical Union. All Rights Reserved. 1146

Journal of Geophysical Research: Solid Earth 10.1002/2013JB010590
Figure 1. Map of Tungurahua volcano with the station geometry. Distances between the summit crater and stations range from 4.7 kmat BPAT to 6.5 km at the farthest station BRUN.
signals of the first arrival motions (shown at 20 s in Figure 2a) were extracted by band-pass filtering the datain the 2–10 s band using fourth-order zero-phase-shift Butterworth filter. Overall VLP waveforms are impul-sive (Figure 3a), but BPAT and BBIL stations show longer oscillatory tails than other stations. This may reflectlocal scattering or higher-frequency noises associated the explosion event. Even if unfiltered signals showclear compressional first motions, filtered VLP waveforms have dilatational motion (denoted in Figure 3a,arrows) just before the main compressional motion. This is caused by ringing effects of fourth-order Butter-worth filter which rolls off rapidly around the cutoff frequency. The second-order Butterworth filter has lessringing effects in waveforms but introduces additional noises from higher-frequency band because of theirslower roll-off, which markedly lowers signal-to-noise ratios of the signals.
Even if the representative event in Figure 2 shows distinct characteristics in seismic and acoustic signals,many of explosion earthquakes are obscure in waveforms. There may be two reasons for this. First is that theVLP band used in the study is partly overlapped with microseism noise band which typically has the bandin 3 s to 7 s. Hence, if the explosion earthquakes are not large enough compared to microseismic noise, it ishard to recognize the entire waveforms of the first motion. Second is high-frequency energy associated withexplosion earthquakes. Especially, BPAT and BBIL show marked noise near 1 Hz and make it hard to removeit completely from VLP band (2 s to 10 s). The high-frequency energy possibly comes from either local siteeffects or the surface explosion process that is not due to the VLP source.
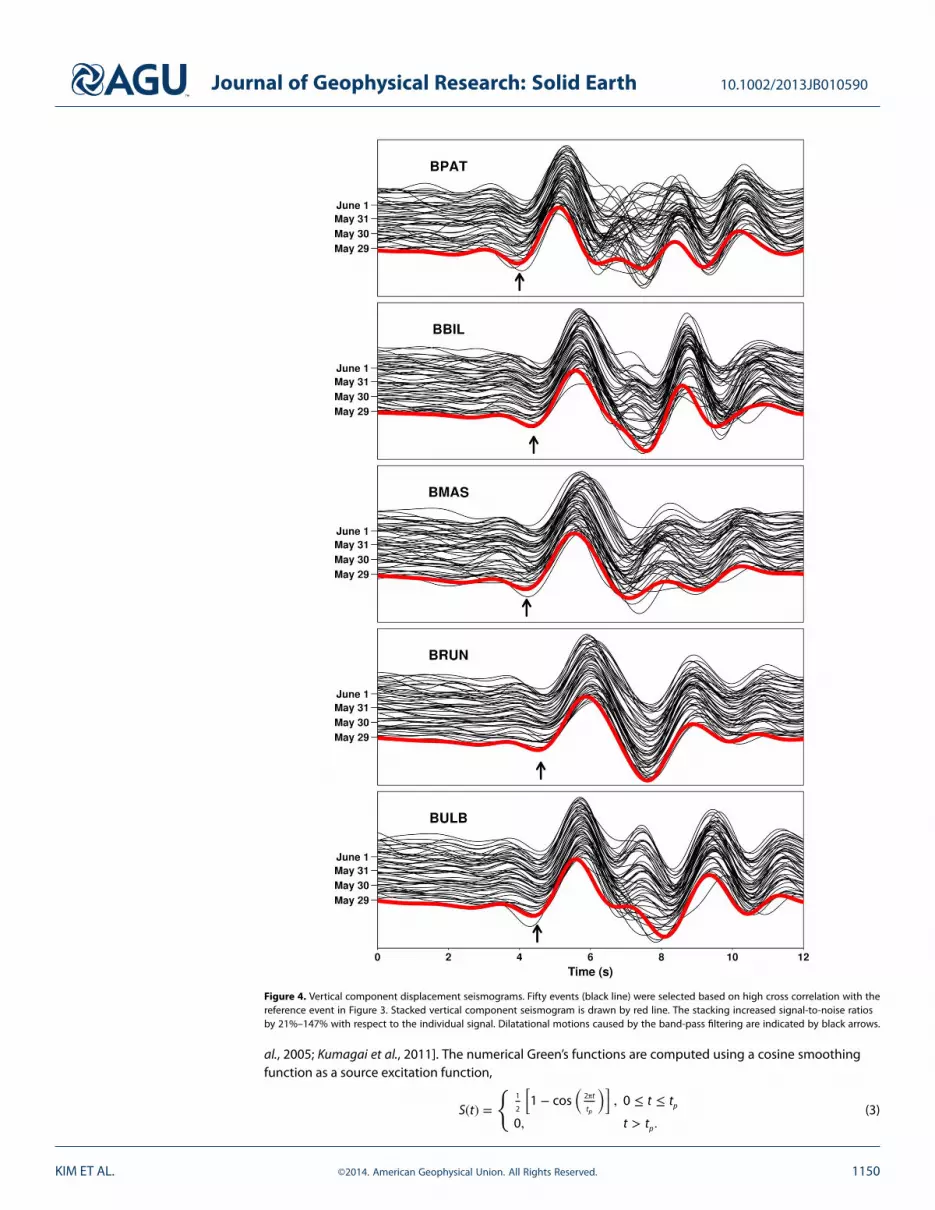
In order to increase signal-to-noise ratio of the signals and reliability of moment tensor inversion, we hereperform the inversion using a stacked data set from 50 similar events between 29 May and 1 June 2010(Figure 4). Waveform similarity was quantified using waveform cross correlation. First, explosion earthquakeswere selected, which were associated with surface explosions sharing the same characteristics described inFigure 2. We then computed the cross-correlation coefficient of vertical component at station BPAT betweenthe prescreened events and the reference event in Figure 2 over a 16 s window that includes 8 s of preeventnoise. This station was chosen because it is closest to the vent and showed the largest amplitudes for allevents. Finally, 50 events were correlated with the master event at 0.8 or above. The waveforms for all sta-tions were aligned to minimize the cross-correlation lags measured at BPAT and stacked. Before stacking theevents, each station showed 14.3±1.9 (15.7) dB, 15.6±2.8 (19.5) dB, 11.6±2.9 (14.2) dB, 15.2±3.8 (16.1) dB,and 15.6±3.8 (16.5) dB of signal-to-noise ratios of vertical component for BPAT, BBIL, BMAS, BRUN, and BULB,respectively, with the stacked waveform versions in parentheses. Respective signal-to-noise ratios increasedby 21–147%.
KIM ET AL. ©2014. American Geophysical Union. All Rights Reserved. 1147

Journal of Geophysical Research: Solid Earth 10.1002/2013JB010590
Figure 2. An example of seismoacoustic records associated with a crater explosion, which shows (a) vertical components and (b) infra-sound for the reference event. Figure 2a shows the seismic signals which are characterized by a compressional P wave first motionemerging near 20 s and following quasi-harmonic coda and volcanic tremor. Figure 2b shows large impulsive waveform (∼ 120 Pa) ofinfrasound that suggests a strong explosion at the summit crater.
Horizontal particle motions and east and north components of the stacked VLP waveforms are shown inFigure 5. Early part of motions (denoted by Figure 5, red lines) are elliptical or rectilinear pointing to thesummit crater. Later part of motions, however, shows more complicated motions including transverse com-ponents. This may reflect local scattering and surface wave phases. The rectilinear motion of the early part ofsignal may be useful for approximating epicentral source location indicating that the VLP source is locatednear the summit crater. However, since topography can greatly influence waveforms, waveform modeling isrequired to clearly identify the source location [Neuberg and Pointer, 2000].
In this study, we applied inversion to stacked data and 10 explosion earthquakes showing highcross-correlation values (> 0.9) with respect to the reference event in Figure 2. The moment tensor inver-sion technique proposed by Ohminato et al. [1998] was used to extract source mechanisms represented bysix moments and three single forces. High cross-correlation values among 50 events over May–June crisessuggests a common explosive source process. We here present source parameters obtained only for 10
KIM ET AL. ©2014. American Geophysical Union. All Rights Reserved. 1148

Journal of Geophysical Research: Solid Earth 10.1002/2013JB010590
Figure 3. Band-pass filtered signals (10 s to 2 s) and power spectra of the first compressional motion between two vertical dashedlines in Figure 2. (a) The signals are representative of true ground displacement after being deconvolved for instrument response.Fourth-order zero-phase-shift Butterworth filter in 2–10 s band is used for band-pass filtering, and dilatational motions (indicated byarrows) are due to ringing effects of rapid roll-off around the cutoff frequency. (b) The signals showing impulsive waveforms havesignificant energy from 10 s to 2 s.
events (Table 2), and a full description, including source time function, is provided only for the stacked sig-nal because all 10 events share common characteristics in the moment tensor solution; thus, an analysis of arepresentative event is adequate to describe the overall source mechanism.
3. Moment Tensor Inversion
The seismic displacement field can be expressed by a convolution of the Green’s function with the sourceterms [Chouet, 1996],
un(t) = Fp(t) ∗ Gnp(t) + Mpq(t) ∗ Gnp,q(t) p, q = x, y, z, (1)
where un(t) is the n component of seismic displacement at a station at time t, Fp(t) is the time history ofthe force applied in the p direction, Mpq(t) is the time history of the pq component of the moment tensor,and Gnp(t) is the Green tensor which relates the n component of displacement at the receiver position withthe p component of impulsive force at the source position. The notation q indicates spatial differentiationwith respect to the q coordinate and the symbol ∗ denotes convolution. If we form the column vector 𝐝 thatcontains the displacement components at all stations and column vector 𝐦 containing the moment tensorand single force components, equation (1) can be rewritten in matrix form [Ohminato et al., 1998],
𝐝 = 𝐆𝐦. (2)
Equation (2) is iteratively solved for 𝐦 using the sparse linear equations and least square problemsalgorithm, widely used for solving large, sparse, and ill-posed linear system [Paige and Saunders, 1982].
The synthetic Green’s functions are generated with the three-dimensional finite difference method[Ohminato and Chouet, 1997] taking into account the 3-D topography of Tungurahua Volcano. As the num-ber of grid nodes searched for source locations is quite large, reciprocal relations for Green’s functions wereused to reduce the number of numerical simulations. Using reciprocity, the Green’s function at each sourcenode was derived from Green’s functions at each receiver node in the network [Chouet et al., 2005]. Becausethe number of receiver is much less than the number of source nodes, use of the reciprocity reduces hugeamount of computational time. We assume a homogeneous velocity and density structure, a compressionalwave velocity Vp = 3.5 km/s, shear wave velocity Vs = 2 km/s, and density 𝜌 = 2650 kg/m3 [Molina et
KIM ET AL. ©2014. American Geophysical Union. All Rights Reserved. 1149
Journal of Geophysical Research: Solid Earth 10.1002/2013JB010590
Figure 4. Vertical component displacement seismograms. Fifty events (black line) were selected based on high cross correlation with thereference event in Figure 3. Stacked vertical component seismogram is drawn by red line. The stacking increased signal-to-noise ratiosby 21%–147% with respect to the individual signal. Dilatational motions caused by the band-pass filtering are indicated by black arrows.
al., 2005; Kumagai et al., 2011]. The numerical Green’s functions are computed using a cosine smoothingfunction as a source excitation function,
S(t) =
{1
2
[1 − cos
(2πt
tp
)], 0 ≤ t ≤ tp
0, t > tp.
(3)
KIM ET AL. ©2014. American Geophysical Union. All Rights Reserved. 1150

Journal of Geophysical Research: Solid Earth 10.1002/2013JB010590
Figure 5. (a) Horizontal particle motion of the stacked VLP signal. (b) The records show east (E) and north (N) components of displace-ment seismogram, band-pass filtered in 10 s to 2 s. Early part of motions (denoted by red lines) are elliptical or rectilinear pointing tothe summit crater. Later part of motions shows more complicated motions, including transversal components (blue lines).
where tp = 2 s. The period of the smoothing function significantly influences the temporal resolution of themoment tensor solution and computation time for the Green’s functions: the shorter the period, the higherthe resolution of the resultant source time function. However, short-period smoothing functions requiredense finite-difference grids for numerical stability, and, in turn, increase the computation time for Green’sfunction. Since our data were band-pass filtered longer than 2 s, higher-frequency (< 2 s) components ofthe Green’s function do not significantly contribute to the inversion result. Our computational domain iscentered at the summit of Tungurahua and has lateral dimensions of 40 × 40 km, vertical dimensions of40 km, which is sufficiently large to avoid spurious edge reflections. The node spacing is 80 m, yielding a 3-Dmesh with 500 × 500 × 500 nodes. While 25 nodes per wavelength are required for accurate modeling, 80 mspacing provides 50 nodes per wavelength (2000 m/s × 2 s = 4000 m) for periods considered in this study.
In order to assess the goodness of fit of the inversion, we use two definitions of squared errors as follows.
E1 =1
Nr
Nr∑n=1
⎡⎢⎢⎢⎢⎣3∑1
Ns∑p=1
(u0n(pΔt) − us
n(pΔt))2
3∑1
Ns∑p=1
(u0n(pΔt))2
⎤⎥⎥⎥⎥⎦, (4)
and
E2 =
Nt∑n=1
Ns∑p=1
(u0n(pΔt) − us
n(pΔt))2
Nt∑n=1
Ns∑p=1
(u0n(pΔt))2
, (5)
where u0n(pΔt) is the pth sample of the nth data trace, us
n(pΔt) is the pth sample of the nth synthetic
trace, Nt is the number of data traces, Ns is the number of samples in each trace, and Nr is the number ofthree-component stations. In equation (4), the squared error is normalized per station so that stationswith weak-amplitude signals contribute equally to the squared error as stations with large-amplitude sig-nals. In equation (5), the squared error is not normalized by station so that large-amplitude signals on thenear-source stations dominate the squared error and the discrepancy between low-amplitude data andsynthetics do not contribute significantly.
A grid search was conducted to determine the best fit source location. First, we searched 440 grid points(Figure 6) sparsely distributed over the 8000 m × 8000 m × 5000 m gridded region in the east, north, and
KIM ET AL. ©2014. American Geophysical Union. All Rights Reserved. 1151

Journal of Geophysical Research: Solid Earth 10.1002/2013JB010590
Figure 6. Horizontal, east-west and north-south vertical cross sections through the source domain. The positions of the cross sectionsare indicated by the dashed lines in map view. Dots indicate 440 grid nodes used in preliminary source location (see the text for details).The grid spacing is 400 m near the vent. The shaded rectangle indicates grid search domain in which grid nodes are densely distributedby 80 m. Final source location is determined within this region.
vertical directions, respectively. The grid spacing is finest near the vent (up to 400 m spacing) and coarserfurther away (up to 2000 m spacing). The least squares solutions to equation (2) are computed with respectto all grid points, and the preliminary source location is chosen by minimizing the squared error. Second,we defined densely distributed grid nodes surrounding the preliminary source position. In this region, gridnodes are spaced by 80 m apart in a uniform mesh extending to 800 m in the east-west and north-southdirections and from 2560 to 4160 m in elevation. Final source location is determined by grid search withinthis region.
Since single forces can play an important role in volcanic processes, we consider three possible sourcemechanisms for the model parameters, 𝐦: (1) six moments and three single forces, (2) six moments, and (3)three single forces. The optimum solution is chosen based on the squared error defined by equations (4)and (5), relevance of the free parameters used in the model, and physical significance of the resulting sourcemechanism. Relevance of the free parameters in each model is assessed by calculating Akaike’s InformationCriterion (AIC) [Akaike, 1974],
AIC = Nobs ln E + 2Npar, (6)
where Nobs = 3 × NrNs is the number of independent data, E is the squared error defined by equations (4)and (5), Npar = Ns × (the number of source mechanisms) is the number of model parameters used to fit thedata. The model is considered to be physically relevant if it minimizes both the squared error and AIC. Finally,physical plausibility of a moment tensor solution is considered. Consistent time history among all momenttensor components is required to make a plausible interpretation of the solution.
4. Result4.1. Squared ErrorInversion errors for the selected events are listed in Table 1. Residual errors defined in equation (4) orequation (5) are calculated for three different source models: six moments plus three single forces (Model 1),six moments only (Model 2), and three single forces only (Model 3). Model 1 shows at least 10% lower resid-uals in E1 and E2 than for other two models. According to the residual reduction, waveforms of the explosionearthquakes are best described by the combination of six moments and three single forces (Figure 8). E2
errors are about 2% lower than E1 errors. This residual reduction is achieved by fitting larger-amplitude
KIM ET AL. ©2014. American Geophysical Union. All Rights Reserved. 1152

Journal of Geophysical Research: Solid Earth 10.1002/2013JB010590
Table 1. Residual Errors and Corresponding Akaike’s Information Criterion
Model 1b Model 2 Model 3
Event Noa. E1 AIC(E1) E2 AIC(E2) E1 AIC(E1) E1 AIC(E1)
Stacked 0.096 −3443 0.075 −4177 0.242 −1862 0.510 −8231 0.101 −3276 0.085 −3801 0.254 −1707 0.499 −8862c 0.098 −3368 0.077 −4081 0.285 −1368 0.452 −11823 0.128 −2573 0.120 −2755 0.302 −1193 0.532 −6914 0.111 −3005 0.084 −3837 0.272 −1501 0.490 −9385 0.136 −2390 0.121 −2739 0.301 −1200 0.528 −7186 0.133 −2457 0.113 −2953 0.273 −1490 0.527 −7207 0.109 −3058 0.093 −3519 0.242 −1852 0.488 −9508 0.153 −2023 0.137 −2363 0.304 −1174 0.536 −6739 0.101 −3292 0.094 −3503 0.239 −1889 0.507 −83510 0.090 −3618 0.082 −3918 0.248 −1782 0.457 −1148
aThe event number denotes chronological order in Table 2.bModels 1, 2, and 3 are composed of six moments plus three forces, six moments only,
and three forces only, respectively.cReference event used to compute cross-correlation coefficient.
traces in stations closer to the summit sacrificing goodness-of-fit to smaller-amplitude signals. The mostappropriate model for source mechanisms, however, cannot be determined solely by residual reductionsince the large number of free model parameters decrease residual errors of inversion. To evaluate influ-ence of the number of free parameters on residual errors, AICs are computed according to equation (6).The source model with six moments and three single forces consistently yield the minimum AICs for all theevents. The small AICs suggest that the reduction of residuals for Model 1 is not merely a numerical artifactcaused by a large number of free parameters but attributed to physical relevance of all model parameters.Physical relevance of Model 1 is further justified by consistent waveforms among moment tensor compo-nents in Figure 9, which allows a plausible interpretation of the solution. Hence, we focus on investigatingsource mechanism represented by Model 1 in the following sections.
4.2. Source LocationFigure 7 shows the locations of source centroids for Model 1 and the distribution of residual errors(E1 and E2) of the stacked and 10 selected events (Table 2). Source centroids for the stacked data (Figure 7,red spheres) with the minimum error in E1 and E2 and isosurfaces (Figure 7, red surfaces) representingthe 2.0% error increment above the minimum residuals are computed and projected on Figure 7 (sideand bottom). The isosurfaces are obtained by interpolation between 80 m spacing grid points. Sourcecentroids obtained using the minimum error, E1, are shown in Figure 7a. The minimum residual of thestacked data (E1 = 9.6%, Table 2) yields a source centroid located 3280 m above sea level (1520 m belowthe summit crater) and 320 m north of the crater. Shape and extent of the isosurface can provide a mea-sure of the uncertainty in source location. Volume surrounded by the surface has horizontal dimensionsof ∼ 500 m and spans the range 2800–3700 m in elevation. The volume is elongated in the vertical direc-tions implying that vertical uncertainty in source location is larger than horizontal. This may be due tothe station configuration where the closest deployment is 4.7 km from the crater, resulting in relativelypoorly constrained depth of hypocenter below the crater. Best fit source positions for the selected events(Figure 7, blue spheres) in Table 2 are also plotted in Figure 7a. Their hypocenter locations are consis-tent with that of the stacked signal within 2.0% error increment. In Figure 7b, best fitting source locationsare obtained according to the E2 error (equation 5). The hypocenter of the stacked data (E2 = 7.5%)is located 3360 m above sea level (1440 m below the crater) and 80 m east and 320 north of the crater.This is 80 m east and 80 m above the best fitting point of E1 error minimum. Isosurface for the 2.0% errorincrement above the best fitting point has horizontal dimension of about 500 m and vertical dimen-sion of about 900 m. The shape and extent of this volume is similar to that of the volume obtained byE1 residual error. Hypocenters for the 10 events using E2 residual error are all located within the 2.0%error increment bound. Similarity in source location and misfit distribution between two different mea-sures of residual error, E1 and E2, indicates a stable inversion for the source location. Small error reduction(∼ 2%, Table 1) between E1 and E2 minimum error further support the observation that the source centroidinversion is not solely governed by a few stations with larger amplitude. Even if the optimum solution
KIM ET AL. ©2014. American Geophysical Union. All Rights Reserved. 1153

Journal of Geophysical Research: Solid Earth 10.1002/2013JB010590
Figure 7. Best fit source location and error distribution for VLP eventsin Table 1. (a) Source locations obtained by minimizing E1 error areplotted with red (stacked event) and blue spheres (10 events in Table 1).Isosurface (red surface) indicates the 2.0% error increment above theminimum residual. Source centroid and error outlines are projectedon Figure 7 (side and bottom). (b) Same as Figure 7a but obtained byminimizing E2 instead of E1. See the text for details.
yielded from E2 error shows lower misfit thanE1 error, we prefer the best fit solution fromthe E1 error definition to avoid the influenceof high-frequency noises consistently associ-ated with station BPAT. Waveform fits betweenthe stacked data and synthetic data obtainedfrom the moment tensor solution at the sourcelocation show consistency (Figure 8). Overallfits are excellent, as demonstrated by the smallresidual error (E1 = 9.6%). The misfit errors ofwaveforms are normalized for each station sothat stations with weak-amplitudes contributeequally to the moment tensor solution.
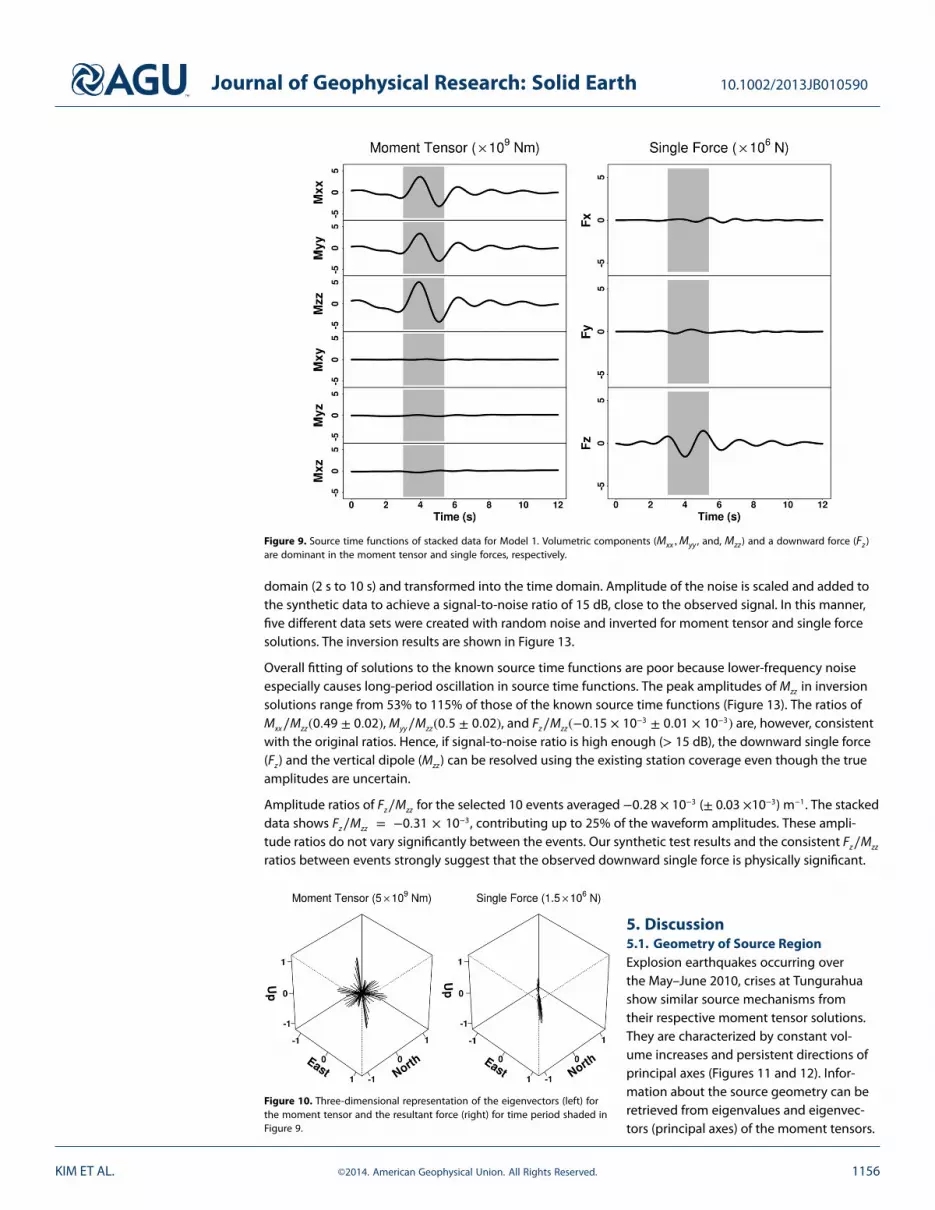
4.3. Source Time Function and Source TypeSource time functions of six moments andthree single forces for the stacked data areshown in Figure 9. The waveforms are pulse-likeand similar across moment and single forcecomponents. This similarity enables consis-tent interpretation of source mechanism fromthe source time functions. The volumetriccomponents (Mxx , Myy , and Mzz) clearly domi-nate off-diagonal components in the momenttensor. In addition, the vertical dipole, Mzz ,dominates over the two horizontal dipoles,Mxx and Myy . Time-varying eigenvectors of themoment tensors and total forces are plotted inFigure 10. The directions and amplitude ratiosof the three eigenvectors are stable both beforeand after the peak amplitude. Principal com-ponents of the static moment tensor, whichrepresents the time-varying moment tensorsolutions, are extracted from peak-to-troughamplitudes of the three eigenvectors.
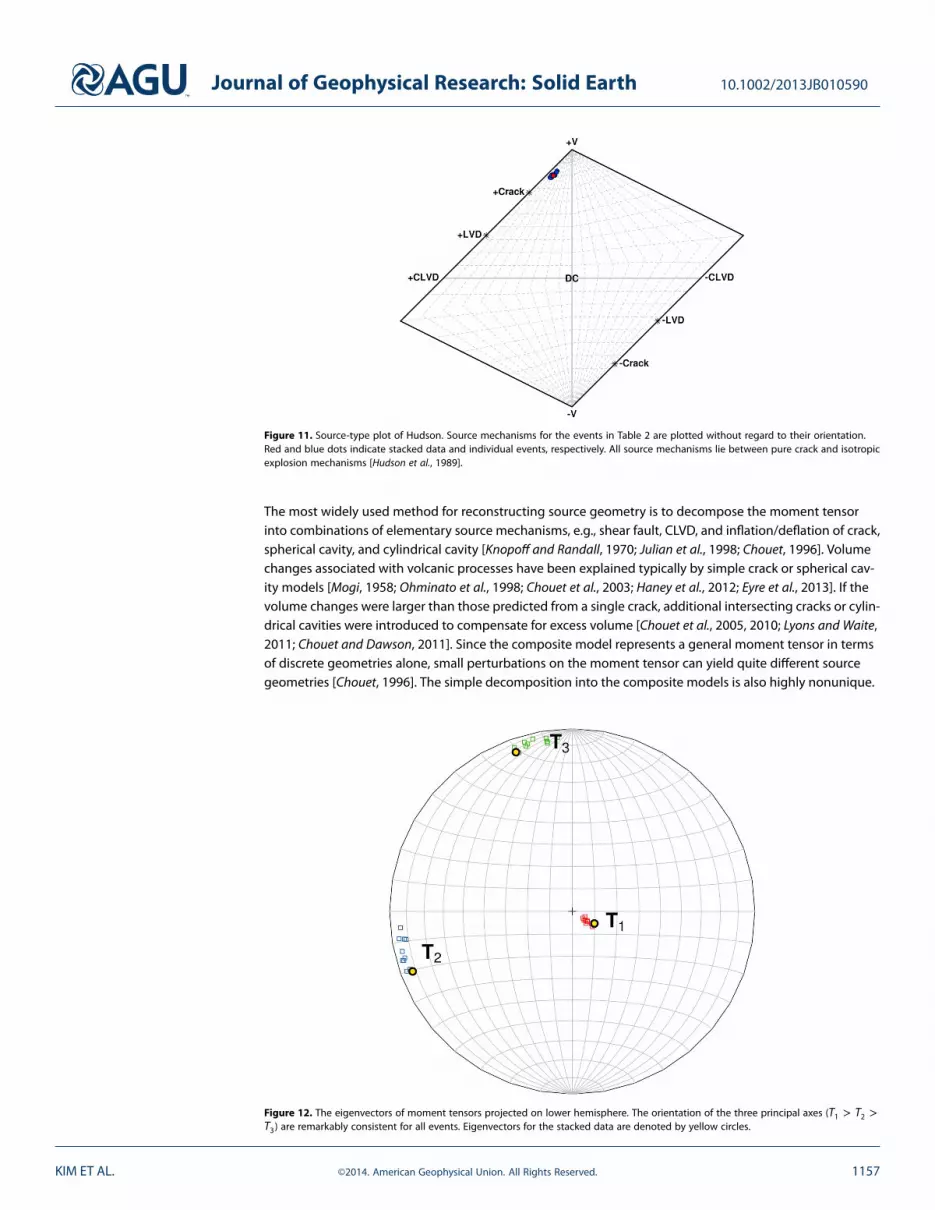
Figure 11 shows static moment tensorsobtained from peak-to-trough amplitudes ofthe eigenvectors on a source-type plot [Hudsonet al., 1989]. The components of the momenttensors are listed in Table 2. The source-typeplot displays characteristics of the momenttensor in terms of isotropic, double couple(DC), and compensated linear vector dipole(CLVD). The horizontal coordinate (T) describesthe relative sizes of the DC (T = 0) and CLVDcomponents (T = ±1), and the vertical coordi-
nate is a measure of volume change (k) [Hudson et al., 1989]. Source mechanisms for all the events involvedominant volume increases (k = 0.81 ± 0.02). Volumetric changes are frequently observed with volcanicactivity and are typically attributed to mass transport associated with volcanic processes [Miller et al., 1998;Chouet et al., 2003]. The combination of significant CLVD components (T = −0.67 ± 0.12) and volumechange indicates crack-like focal mechanisms. By assuming a Poisson ratio of 𝜈 = 1∕3, appropriate for vol-canic rock [Murase and McBirney, 1973], source mechanisms of all the events lie along a trend between apure crack and an isotropic explosion (Figure 11). The source-type plot shows only relative sizes of principalsource types but does not contain any information about orientation of the source mechanism. In order toinvestigate directionality of the source mechanisms, the eigenvectors for the moment tensor solutions are
KIM ET AL. ©2014. American Geophysical Union. All Rights Reserved. 1154

Journal of Geophysical Research: Solid Earth 10.1002/2013JB010590
Table 2. Moment Tensor Inversion Result
No. Date Time Maxx Mxy Mxz Myy Myz Mzz Mb
0 mcB
Stacked - - +0.727 +0.013 −0.049 +0.679 +0.032 +0.989 +0.940× 10¹⁰ 2.91 05/29 02:50:01.69 +0.705 +0.011 −0.036 +0.654 +0.027 +0.994 +1.415× 10¹⁰ 2.92d 05/29 11:26:25.79 +0.705 +0.011 −0.025 +0.664 +0.018 +0.997 +1.048× 10¹⁰ 2.93 05/29 13:49:39.21 +0.781 +0.003 −0.038 +0.731 +0.030 +0.990 +0.916× 10¹⁰ 2.94 05/30 01:14:18.83 +0.733 +0.013 −0.027 +0.671 +0.015 +0.997 +1.043× 10¹⁰ 2.95 05/30 03:33:11.70 +0.769 +0.005 −0.035 +0.714 +0.028 +0.992 +1.069× 10¹⁰ 2.96 05/30 19:16:26.98 +0.713 +0.007 −0.027 +0.657 +0.024 +0.996 +1.307× 10¹⁰ 2.97 05/31 04:17:29.14 +0.699 +0.009 −0.034 +0.659 +0.033 +0.993 +0.824× 10¹⁰ 2.88 05/31 08:18:41.83 +0.725 +0.001 −0.032 +0.684 +0.025 +0.994 +1.090× 10¹⁰ 2.99 06/01 00:50:42.72 +0.737 +0.009 −0.042 +0.699 +0.037 +0.989 +1.157× 10¹⁰ 2.910 06/01 05:46:17.98 +0.729 +0.018 −0.029 +0.678 +0.023 +0.996 +0.635× 10¹⁰ 2.8
aAll the moment tensor components are normalized with respect to the scalar moment (M0) event by event. Date ispresented as month/date.
bScalar moment (MT0 , defined as proposed by Bowers and Hudson [1999, equation (11)].
cBody wave magnitude determined by the relation between mB and M0 [Kanamori, 1983].dReference event used for computing cross-correlation coefficients.
presented in Figure 12. The orientations of the three principal axes (T1 > T2 > T3) are remarkably consistentthrough all events. The direction of the longest principal axis (T1) is tilted to the northwest by approximately10◦ away from the vertical axis. The results from the source-type plot and the orientation of principal axessuggest that the source mechanisms of the explosion earthquakes were consistent among the selectedevents. While the dominant, vertical, principal axis, and source-type plot indicates involvement of subhori-zontal crack-like source mechanism, the volume increase associated with the solutions are much larger thanexpected from a single, pure crack (k = 0.65). This result implies that true source geometry may be morecomplicated than a pure crack. In the next section, we discuss a possible source geometry in more detail.
4.4. Resolution Capability for Single ForcesApparent single forces accompany the volumetric moments in our solutions (Figure 9). A vertical compo-nent (Fz) dominates the single forces. Timing of the negative peak in Fz coincides with that of the positivepeaks in moment components implying that a downward force may be associated with the volumetricsource process. The capability of the inversion method to decouple single forces from moment tensorcomponents is assessed by a synthetic test. Due to the similarities of Mzz and Fz in the Green’s functions,these components may be difficult to resolve when the station coverage is limited [Uhira and Takeo, 1994].Synthetic waveforms are created using a point source at a depth of 1.6 km below the crater. The sourcemechanism is assumed to be a horizontal crack (Mxx : Myy : Mzz = 0.5 : 0.5 : 1) with a downward single force(Fz/Mzz = −0.125 × 10⁻³), contributing ∼ 10% of the waveform amplitudes. The single force and momenttensor components contribute equally to the observed signal amplitudes when the ratio (Fz/Mzz) is about1.2 × 10−3 in this source/receiver configuration. Random noise signals are synthesized in the frequency
Figure 8. Waveform fit for stacked data (black lines). Synthetic waveforms (red lines) are obtained at the best fit source location inFigure 7a. Misfit errors (E1 in equation (4)) of waveforms are normalized per station.
KIM ET AL. ©2014. American Geophysical Union. All Rights Reserved. 1155
Journal of Geophysical Research: Solid Earth 10.1002/2013JB010590
Figure 9. Source time functions of stacked data for Model 1. Volumetric components (Mxx ,Myy , and, Mzz ) and a downward force (Fz )are dominant in the moment tensor and single forces, respectively.
domain (2 s to 10 s) and transformed into the time domain. Amplitude of the noise is scaled and added tothe synthetic data to achieve a signal-to-noise ratio of 15 dB, close to the observed signal. In this manner,five different data sets were created with random noise and inverted for moment tensor and single forcesolutions. The inversion results are shown in Figure 13.
Overall fitting of solutions to the known source time functions are poor because lower-frequency noiseespecially causes long-period oscillation in source time functions. The peak amplitudes of Mzz in inversionsolutions range from 53% to 115% of those of the known source time functions (Figure 13). The ratios ofMxx∕Mzz(0.49 ± 0.02), Myy∕Mzz(0.5 ± 0.02), and Fz∕Mzz(−0.15 × 10⁻³ ± 0.01 × 10⁻³) are, however, consistentwith the original ratios. Hence, if signal-to-noise ratio is high enough (> 15 dB), the downward single force(Fz) and the vertical dipole (Mzz) can be resolved using the existing station coverage even though the trueamplitudes are uncertain.
Amplitude ratios of Fz∕Mzz for the selected 10 events averaged −0.28 × 10⁻³ (± 0.03 ×10⁻³) m−1. The stackeddata shows Fz∕Mzz = −0.31 × 10⁻³, contributing up to 25% of the waveform amplitudes. These ampli-tude ratios do not vary significantly between the events. Our synthetic test results and the consistent Fz∕Mzz
ratios between events strongly suggest that the observed downward single force is physically significant.
Figure 10. Three-dimensional representation of the eigenvectors (left) forthe moment tensor and the resultant force (right) for time period shaded inFigure 9.
5. Discussion5.1. Geometry of Source RegionExplosion earthquakes occurring overthe May–June 2010, crises at Tungurahuashow similar source mechanisms fromtheir respective moment tensor solutions.They are characterized by constant vol-ume increases and persistent directions ofprincipal axes (Figures 11 and 12). Infor-mation about the source geometry can beretrieved from eigenvalues and eigenvec-tors (principal axes) of the moment tensors.
KIM ET AL. ©2014. American Geophysical Union. All Rights Reserved. 1156
Journal of Geophysical Research: Solid Earth 10.1002/2013JB010590
Figure 11. Source-type plot of Hudson. Source mechanisms for the events in Table 2 are plotted without regard to their orientation.Red and blue dots indicate stacked data and individual events, respectively. All source mechanisms lie between pure crack and isotropicexplosion mechanisms [Hudson et al., 1989].
The most widely used method for reconstructing source geometry is to decompose the moment tensorinto combinations of elementary source mechanisms, e.g., shear fault, CLVD, and inflation/deflation of crack,spherical cavity, and cylindrical cavity [Knopoff and Randall, 1970; Julian et al., 1998; Chouet, 1996]. Volumechanges associated with volcanic processes have been explained typically by simple crack or spherical cav-ity models [Mogi, 1958; Ohminato et al., 1998; Chouet et al., 2003; Haney et al., 2012; Eyre et al., 2013]. If thevolume changes were larger than those predicted from a single crack, additional intersecting cracks or cylin-drical cavities were introduced to compensate for excess volume [Chouet et al., 2005, 2010; Lyons and Waite,2011; Chouet and Dawson, 2011]. Since the composite model represents a general moment tensor in termsof discrete geometries alone, small perturbations on the moment tensor can yield quite different sourcegeometries [Chouet, 1996]. The simple decomposition into the composite models is also highly nonunique.
Figure 12. The eigenvectors of moment tensors projected on lower hemisphere. The orientation of the three principal axes (T1 > T2 >
T3) are remarkably consistent for all events. Eigenvectors for the stacked data are denoted by yellow circles.
KIM ET AL. ©2014. American Geophysical Union. All Rights Reserved. 1157

Journal of Geophysical Research: Solid Earth 10.1002/2013JB010590
Figure 13. Numerical test of the capability of the inversion method to reconstruct known source time functions. Thick dashed lines areoriginal source time functions, and solid lines indicate results of the inversion. The ratios of principal dipole components and the singleforce are Mxx : Myy : Mzz = 0.5 : 0.5 : 1 and Fz /Mzz = -0.125 ×10⁻³ for true source time functions, and Mxx : Myy : Mzz = 0.49 : 0.5 : 1 andFz /Mzz = -0.15 ×10⁻³ for the results of the inversion (see the text for details).
Another way to represent the general moment tensor is to assume an ellipsoidal inclusion for infla-tion/deflation sources [Eshelby, 1957; Davis, 1986]. In contrast to the composite model, variations in cavityshapes between crack to sphere can be represented by a single triaxial ellipsoid without employing addi-tional cavities. Since the ellipsoids are defined along a continuum with respect to the eigenvalue ratios ofthe moment tensor, small perturbations of the moment tensor results in correspondingly small changes inthe geometrical shape (Figure 14). Whereas the composite model can describe fully general moment tensorsby adding further cavities, only limited subsets of moment tensors can be represented by the single ellip-soid model (Figure 14). Since geometrical shapes corresponding to a moment tensor are not unique, a prioriassumptions regarding the source geometry are important for retrieving appropriate source parameters.
In this study, moment tensor solutions are interpreted in terms of the single-ellipsoid model [Eshelby, 1957;Davis, 1986]. The elastic field due to an ellipsoidal inclusion in a half-space was treated by Davis [1986] byintegrating distributions of point forces over the surface of the ellipsoid [Eshelby, 1957]. The pressurizedellipsoidal cavity can be described in terms of a moment tensor by point source approximation. FollowingDavis [1986], orientations of the ellipsoid are given by the eigenvectors of the moment tensor. The eigenval-ues (M3 < M2 < M1) are inversely related to the lengths of the ellipsoid axes (a > b > c), yielding ratiosb∕a and c∕a. The eigenvalues are also proportional to the product between the source volume (V) and inter-nal overpressure (ΔP) of the ellipsoid. Only a limited number of eigenvalue ratios (M2∕M1 versus M3∕M1) areallowable when obtaining ellipsoidal source shapes (denoted in Figure 14, shaded region). Pure cracks andspherical sources are special cases of ellipsoidal cavities.
Eigenvalue ratios for all events in Table 2 lie inside the shaded region of Figure 14, indicating that the solu-tions can be described by the single ellipsoidal model. The ratios of M2∕M1 and M3∕M1 range over 0.7–0.8and 0.65–0.76, respectively. Furthermore, as noted above, orientations of eigenvectors are consistent acrossthe events (Figure 12).
Consequent source parameters estimated for the pressurized ellipsoid model are listed in Table 3. Ellipsoidalshapes corresponding to the stacked waveforms are depicted in Figure 15 in which the center of the ellip-soids are assumed to be at the best fit source location obtained in the previous section. All of the ellipsoidsinverted from the solutions are well constrained into asymmetric subhorizontal oblates. The oblates areelongated in the NW-SE direction. Due to the tight variances in the orientation and the ratios of ellipsoid
KIM ET AL. ©2014. American Geophysical Union. All Rights Reserved. 1158

Journal of Geophysical Research: Solid Earth 10.1002/2013JB010590
Figure 14. Ratios of eigenvalues M3∕M1 and M2∕M1 for all individual events (blue circle) and stacked data (red circle) assuming aPoisson ratio of 𝜈 = 1∕3. All the events are within the region allowed for ellipsoidal cavities. Ellipsoid for the stacked signal is depictedin Figure 15.
axes (b∕a = 0.54 ± 0.09 and c∕a = 0.29 ± 0.06), the stacked model (b∕a = 0.50 and c∕a = 0.27) well rep-resents the overall shape of the ellipsoids. The absolute dimensions of the ellipsoids cannot be determinedunambiguously since there is a trade-off between the volume and overpressure of the ellipsoidal cavities.
We compared our results to previous investigation on Tungurahua Volcano. Molina et al. [2005] performedtomographic inversion with volcano-tectonic (VT) earthquakes recorded from 1999 to 2003. A low-velocityzone (Vp ∼ 3 km/s) was found under the NW flank at a depth of 2–2.5 km. Geological evidence suggests thatthe NW flank of Tungurahua was built by filling in of the caldera following an earlier sector collapse [Hallet al., 1999]. Molina et al. [2005] interpreted the lower velocity zone as relatively low density, young, andpoorly consolidated deposits filling the old caldera. Alternatively, the decrease in velocity may be attributedto fracture systems developed below the NW flank. The majority of the 263 deeper VT events used byMolina et al. [2005] were aligned vertically to a depth of 5 km beneath the crater. Above the 2 km depthlevel, however, most of the hypocenters were located below the west flank, spread ∼ 500 m from the crater.Kumagai et al. [2011] located long volcanic tremors associated with an explosion event on 11 February 2010by using vertical seismic amplitudes. The shallow tremors were located below the NW flank down to 2 kmdepth. Since volcanic tremor is often interpreted to be a manifestation of fluid-crack interactions, the tremor
Table 3. Source Parameters Retrieved From theMoment Tensor Based on Ellipsoidal Model
Event No. b∕aa c∕a VΔPb (N ⋅ m)Stacked 0.505 0.275 6.6 × 10⁸
1 0.435 0.225 9.3 × 10⁸
2 0.530 0.270 7.1 × 10⁸
3 0.685 0.410 7.4 × 10⁸
4 0.430 0.245 7.4 × 10⁸
5 0.630 0.370 8.4 × 10⁸
6 0.445 0.235 8.8 × 10⁸
7 0.510 0.255 5.5 × 10⁸
8 0.650 0.335 7.9 × 10⁸
9 0.640 0.345 8.6 × 10⁸
10 0.465 0.260 4.5 × 10⁸
aLengths of the ellipsoid axes (a > b > c).bVolume (V) and internal overpressure (ΔP).
locations suggest possible fracture systemsunder the NW flanks. Our moment tensor inver-sion indicates a subhorizontal oblate cavity(1.5 km below and 320 m north of the sum-mit crater) representing a sill-like crack from ageological perspective. Hence, predevelopedcrack systems under NW flank were likely reac-tivated during the May–June crises and servedas a magma accumulation region that fedsurface eruptions.
5.2. Source DynamicsThe source centroids imaged from inversion ofexplosion earthquakes were located at a depthof about 1.5 km. Our results indicate that thesource locations and the source time histories
KIM ET AL. ©2014. American Geophysical Union. All Rights Reserved. 1159

Journal of Geophysical Research: Solid Earth 10.1002/2013JB010590
Figure 15. Resultant ellipsoidal cavity obtained from the stacked signal. Ellipsoids are centered at the best fit location in Figure 7a.Overall size is arbitrary, depending on the choice of V and Δp.
of the explosion earthquakes are similar from event to event, from which we infer that the same sourceregion was activated repeatedly over the period of the volcanic crises in May 2010. The source geometriesare thin subhorizontal ellipsoids geologically representing sill-like magma accumulations. Since these earth-quakes produced Vulcanian explosions, ejecting volcanic bombs, ash, and gases, the source mechanisms ofthe events should be linked to observed activity at the vent.
Kanamori et al. [1984] proposed an equivalent force system appropriate for a volcanic eruption. In thismodel, sudden removal of a restraining cap above a pressurized magma cavity at shallow depth causesthe volcanic explosion. The explosion is represented by combination of a downward vertical force and animplosive moment tensor. The downward vertical force is the reactive force of the volcanic jet or ejecta[Chouet, 1996]. The implosive moment tensor indicates a pressure decrease of the magma cavity as vol-canic gases are released. Many volcanic eruptions associated with remarkable deflation at a shallow magmareservoir were interpreted using this model [Kanamori et al., 1984; Nishimura, 1998; Ohminato, 2006; Zobinet al., 2006; Cruz-Atienza et al., 2001]. In these cases, the burst of the conduit lids were attributed directly tothe source of explosion earthquakes. Kanamori’s model was adapted by Uhira and Takeo [1994] to accountfor the source mechanism of deep explosions at Sakurajima. A magma reservoir with small channel to thevent was placed at a depth of a few kilometers. Observed seismic waves were explained by an implosivemoment tensor and a downward single force representing upward gas flow. Tameguri et al. [2002] sug-gested that explosive eruptions can be triggered by pressure waves generated by an initial, deeper, seismicsource. Explosive earthquakes preceding the surface explosions at Sakurajima suggested that explosionsat the crater were generated by isotropic expansions at a depth of 2 km [Tameguri et al., 2002]. Deep explo-sive earthquakes preceding the eruptive activity at Sakurajima, Suwanosejima, and Semeru Volcanoes havealso been observed to follow a similar trend [Ishihara, 1985; Iguchi et al., 2008]. According to this model[Tameguri et al., 2002], a pressure wave is induced by fluctuations in the magma cavity and propagatesthrough the conduit to the crater, triggering a surface explosion. The initial pressure disturbance can becaused by the burst of a gas bubble. The burst of a gas bubble opens a pathway for gases to escape, startingupward gas flow, thus causing a pressure drop in the deeper source region [Uhira and Takeo, 1994].
Our moment tensor analysis of the explosion earthquakes indicate abrupt pressure increases followed byrapid decreases in the magma cavity at a depth of 1.5 km. This source time history is well explained byTameguri’s model. The upward gas flow may explain the downward single force that coincides with the infla-tion in the moment tensor solution (Figure 9). A single force on the Earth can be generated by an exchangeof linear momentum between the source volume and the surrounding region [Chouet et al., 2005]. The
KIM ET AL. ©2014. American Geophysical Union. All Rights Reserved. 1160

Journal of Geophysical Research: Solid Earth 10.1002/2013JB010590
overpressured gas and magma are forced into the vertical conduit that connects the magma cavity to thesurface crater, and the resultant upward acceleration is represented by a downward single force.
The dynamics of pressure fluctuations observed in the source time function may be explained by diffusivebubble growth in magma. Using Henry’s law and assuming a closed conduit (40 MPa, lithostatic pressure at1.5 km depth) and Henry’s constant of 9 × 10⁻¹²(basaltic magma) − 1.6 × 10⁻¹¹ (rhyolitic magma) [Nishimura,2004], water concentration in silicate melts at a depth of 1.5 km is about 1.8–2.5 wt %. Magmas containing1.8–2.5 wt % water can start to exsolve water at this depth. Amphiboles represent the phase most indicativeof volatile abundance; however, they are not found in recent volcanic products from Tungurahua [Kumagaiet al., 2010], suggesting that the water content of the magma is less than 3–4 wt % [Cashman, 2004]. Basedon simulations of diffusive bubble growth in magmas the timescale for bubble growth to its final equilib-rium size varies from 22 s for basaltic magma (4.0 wt % water, 50 MPa confining pressure) to 1.2 × 10⁴ sfor rhyolitic magma (8.0 wt % water, 50 MPa confining pressure) [see Prousevitch et al., 1993, Table 2]. Lowvolatile contents also significantly decrease the bubble growth rate. Assuming 1.8–2.5 wt % water concen-tration in magma, the time for complete growth of a bubble should be much longer than 22 s. This timescaleis much longer than the few seconds observed in the VLP signals presented here. Alternatively, this rapidpressure fluctuation may be accounted for by crack or plug opening of the magma reservoir. Recall that themoment tensor solution is proportional to the volume (V) of the magma cavity and internal overpressure(ΔP = Pin − Pf ), where Pin is the pressure exerted on the internal wall of the cavity, and Pf is the confin-ing pressure on the cavity. As bubbles grow in magma, the internal pressure will increase gradually. Whenthe internal pressure exceeds the material strength of the plug, the plug will rupture or the crack will open.This opening will drop the confining pressure instantaneously, resulting in an abrupt increase of internaloverpressure. Decrease of the internal overpressure will be followed by escape of gas bubbles and recov-ery of the confining pressure. Assuming that the semimajor axis of the ellipsoidal cavity obtained fromstacked event (Table 3) is in the range 10 m < a < 20 m, the volume of the cavity and overpressure willvary by 581 m3 < V < 4653 m3 and 1.1 MPa > Δp > 0.14 MPa, respectively, according to the momenttensor solution.
To show the connection between the earthquake sources and their surface manifestation we comparearrival times of seismic and acoustic waves. Onset times of seismic events are defined as the time whenthe moment tensor solutions exhibit peak amplitude in the source time history (Figure 9). Onset timesof explosions are inferred from arrival times of infrasound on the five stations by assuming a constantsound velocity:
toi= ta
i−
di
c, (7)
where toi
is the origin time derived at the ith station, di is the distance from the summit crater to the ith sta-tion, ta
iis the arrival time at ith station, and c is the atmospheric sound speed. The sound speed is assumed
to be 340 m/s, appropriate for the average atmospheric temperature (15◦C) in May at Tungurahua. (Anerror of ±5 m/s in sound speed can change the traveltime at 5 km distant stations by ±0.2 s.) The bestfit origin time is selected to minimize the variance of to
iamong the five stations. We determined origin
times for the 10 events in Table 2 (Figure 16, traveltime curves are indicated by dashed lines). The origintime of infrasonic waves is 0.8 ± 0.3 s earlier than the observed onset estimates of the explosion earth-quakes. If we assume that shock waves, however, were produced by the explosion, we must correspondinglyadjust the infrasound origin times indicating a later arrival than those obtained assuming a simple constantvelocity (Figure 16).
Observations of shock waves are commonly associated with Vulcanian explosions [Ishihara, 1985;Gottschämmer and Surono, 2000]. Shock waves are nonlinear waves excited by supersonic flows or extremevariations of pressure over short time periods. The higher the overpressure at the shock front, the greater thevelocity of the shock wave. Initially, shock velocities may be quite high, several times the speed of sound inair. As shock waves propagate away from the vent, the pressure at the shock front decreases and the veloc-ity falls off accordingly, approaching ambient sound speeds [Glasstone, 1964]. Under these circumstancestraveltime curves for shock waves will not follow a simple linear trend and estimating the appropriate origintime may be difficult. At Tungurahua, however, all stations are situated further than 4.8 km from the vent,where the shock wave velocity has most likely decreased to the ambient sound speed. For the purposesof this study we will assume a constant shock velocity of 560 m/s (originally measured at Bromo Volcano,
KIM ET AL. ©2014. American Geophysical Union. All Rights Reserved. 1161

Journal of Geophysical Research: Solid Earth 10.1002/2013JB010590
Figure 16. Traveltime curves for the infrasound excited by the explosion at the crater. Origin times are calculated for all events byassuming constant sound speed (340 m/s). Mean arrival times and standard deviations are denoted per station.
Indonesia, 2 km away from the vent [Gottschämmer and Surono, 2000]). Using this estimate, the surfaceexplosions at Tungurahua occur 1.5 ± 0.3 s later than associated explosion earthquakes (Figure 16).
While the predicted origin times, based on linear infrasound projections, suggest that explosion earth-quakes occur close to the onset of the surface explosions, we reject that possibility based on the momenttensor inversion solutions. We note that the time sequence of the two events (deep seismic, shallow explo-sion) is ambiguous because of the possible presence, and accelerated acoustic speeds, of shock waves.Considering the fact that shock waves are commonly accompanied by Vulcanian explosions and the source
Figure 17. Comparison of scalar moments to amplitude of air shock excited by explosions at the summit crater (Table 2). The pressurewas measured at BBIL consistently showing the largest amplitude among the stations. No significant correlation is observed, indicatingthat the signals (infrasound and seismic) emanate from two different event phenomena.
KIM ET AL. ©2014. American Geophysical Union. All Rights Reserved. 1162

Journal of Geophysical Research: Solid Earth 10.1002/2013JB010590
mechanism of the explosion earthquakes suggest a deep-triggering pressure increase, the observed surfaceexplosions most likely occur later than the associated seismic events.
We compared the amplitude of infrasound with the corresponding seismic moments in Figure 17. Pressurerecorded at station BBIL is used to represent the energy of the explosive eruption at the vent because ofits large amplitude. Amplitudes of infrasound observed from the 10 events show virtually no correlation(𝜎 = −0.11) with the seismic moments. This suggests that the signals (infrasound and seismic) emanatefrom two, different, event phenomena.
6. Conclusion
We investigate source mechanisms of Vulcanian explosions at Tungurahua Volcano. Low-frequency seis-mic events associated with explosive eruptions are inverted for the seismic moment tensors and singleforces. The results point to a source 1.5 km below and 320 m north of the summit crater. The moment tensorsolutions are represented by an ellipsoidal pressurized cavity. The semiminor axis of the ellipsoid is almostvertical indicating a sill-like magma cavity. Comparison of magnitudes of the moment tensors and corre-sponding air shocks shows no correlation, suggesting the seismic and acoustic signals emanate from twodifferent event phenomena. If we assume that shock waves accompany surface explosions and thus intro-duce an accelerated acoustic wave, the measured time delay between the predicted origins of acousticrelative to the seismic waves is strong evidence that surface explosions at Tungurahua are triggered by deepseismic events in the magma reservoir. Analysis suggests that inflation/deflation in the deep source regionsare the result of crack openings. Pressure increase by bubble growth in the rising magma opens a pathwayfor gases to escape and subsequently triggers surface explosion. The downward single force in our solutionmay be produced by an exchange of linear momentum between the source and the surrounding regionduring the escaping gas flow.
ReferencesAkaike, H. (1974), A new look at the statistical model identification, IEEE T. Automat. Contr., 19(6), 716–723, doi:10.1109/TAC.1974.1100705.Aster, R., D. Zandomeneghi, S. Mah, S. McNamara, D. Henderson, H. Knox, and K. Jones (2008), Moment tensor inversion of
very long period seismic signals from strombolian eruptions of Erebus Volcano, J. Volcanol. Geotherm. Res., 177, 635–647,doi:10.1016/j.jvolgeores.2008.08.013.
Auger, E., L. D’Auria, M. Martini, B. Chouet, and P. Dawson (2006), Real-time monitoring and massive inversion of source param-eters of very long period seismic signals: An application to Stromboli Volcano, Italy, Geophys. Res. Lett., 33(4), L04301,doi:10.1029/2005GL024703.
Bowers, D., and J. A. Hudson (1999), Defining the scalar moment of a seismic source with a general moment tensor, Bull. Seismol. Soc.Am., 89(5), 1390–1394.
Cannata, A., M. Hellweg, G. D. Grazia, S. Ford, S. Alparone, S. Gresta, P. Montalto, and D. Patan (2009), Long period and very long periodevents at Mt. Etna Volcano: Characteristics, variability and causality, and implications for their sources, J. Volcanol. Geotherm. Res., 187,227–249, doi:10.1016/j.jvolgeores.2009.09.007.
Cashman, K. V. (2004), Volatile controls on magma ascent and eruption, in The State of the Planet: Frontiers and Challenges in Geophysics,edited by R. S. J. Sparks and C. J. Hawkesworth, pp. 109–124, AGU, Washington, D. C., doi:10.1029/150GM10.
Chouet, B. (1996), New methods and future trends in seismological volcano monitoring, in Monitoring and Mitigation of Volcano Hazards,edited by R. Scarpa and R. Tilling, pp. 23–97, Springer, Berlin, Germany.
Chouet, B., and P. Dawson (2011), Shallow conduit system at Kilauea Volcano, Hawaii, revealed by seismic signals associated withdegassing bursts, J. Geophys. Res., 116, B12317, doi:10.1029/2011JB008677.
Chouet, B., P. Dawson, T. Ohminato, M. Martini, G. Saccorotti, F. Giudicepietro, G. De Luca, G. Milana, and R. Scarpa (2003), Source mecha-nisms of explosions at Stromboli Volcano, Italy, determined from moment-tensor inversions of very-long-period data, J. Geophys. Res,108(B1), 2019, doi:10.1029/2002JB001919.
Chouet, B., P. Dawson, and A. Arciniega-Ceballos (2005), Source mechanism of Vulcanian degassing at Popocatpétl Volcano, Mexico,determined from waveform inversions of very long period signals, J. Geophys. Res., 110, B07301, doi:10.1029/2004JB003524.
Chouet, B. A., and R. S. Matoza (2013), A multi-decadal view of seismic methods for detecting precursors of magma movement anderuption, J. Volcanol. Geotherm. Res., 252, 108–175, doi:10.1016/j.jvolgeores.2012.11.013.
Chouet, B. A., P. B. Dawson, M. R. James, and S. J. Lane (2010), Seismic source mechanism of degassing bursts at Kilauea Volcano, Hawaii:Results from waveform inversion in the 10–50 s band, J. Geophys. Res., 115, B09311, doi:10.1029/2009JB006661.
Cruz-Atienza, V. M., J. F. Pacheco, S. K. Singh, N. M. Shapiro, C. Valds, and A. Iglesias (2001), Size of Popocatepetl volcano explosions(1997–2001) from waveform inversion, Geophys. Res. Lett., 28(21), 4027–4030, doi:10.1029/2001GL013207.
Davis, P. M. (1986), Surface deformation due to inflation of an arbitrarily oriented triaxial ellipsoidal cavity in an elastic half-space, withreference to Kilauea Volcano, Hawaii, J. Geophys. Res., 91(B7), 7429–7438, doi:10.1029/JB091iB07p07429.
Dawson, P. B., B. A. Chouet, and J. Power (2011), Determining the seismic source mechanism and location for an explosive eruption withlimited observational data: Augustine Volcano, Alaska, Geophys. Res. Lett., 38, L03302, doi:10.1029/2010GL045977.
Eshelby, J. D. (1957), The determination of the elastic field of an ellipsoidal inclusion, and related problems, Proc. R. Soc. London, Ser. A,241(1226), 376–396, doi:10.1098/rspa.1957.0133.
Eyre, T. S., C. J. Bean, L. D. Barros, G. S. O’Brien, F. Martini, I. Lokmer, M. M. Mora, J. F. Pacheco, and G. J. Soto (2013), Moment tensorinversion for the source location and mechanism of long period (LP) seismic events from 2009 at Turrialba Volcano, Costa Rica, J.Volcanol. Geotherm. Res., 258, 215–223, doi:10.1016/j.jvolgeores.2013.04.016.
AcknowledgmentsThis research was supported by theNational Science Foundation GrantOIA-1125185 and EAR-0838395, andSENESCYT Project PIN-08 Fortale-cemiento del Sistema Nacional deSismología y Vulcanologia. We thankHiroyuki Kumagai for establishing thehigh-quality seismoacoustic networkat Tungurahua through cooperationbetween the Japanese JICA programand Fortalecimiento del Sistema deMonitoreo sísmico y volcánicos. Wealso thank the authorities and staff ofthe Instituto Geofisico and Observato-rio Vulcanologico del Tungurahua forsharing data and providing support.
KIM ET AL. ©2014. American Geophysical Union. All Rights Reserved. 1163

Journal of Geophysical Research: Solid Earth 10.1002/2013JB010590
Glasstone, S., (1964), The effects of nuclear weapons, Tech. Rep., U.S. Department of Defense, Univ. of California, Santa Barbara, Calif.[Available at http://www.fourmilab.ch/etexts/www/effects/.]
Gottschämmer, E., and I. Surono (2000), Locating tremor and shock sources recorded at Bromo Volcano, J. Volcanol. Geotherm. Res.,101(1–2), 199–209, doi:10.1016/S0377-0273(00)00171-2.
Hall, M. L., C. Robin, B. Beate, P. Mothes, and M. Monzier (1999), Tungurahua Volcano, Ecuador: Structure, eruptive history and hazards, J.Volcanol. Geotherm. Res., 91(1), 1–21, doi:10.1016/S0377-0273(99)00047-5.
Haney, M. M., B. A. Chouet, P. B. Dawson, and J. A. Power (2012), Source characterization for an explosion during the 2009 eruption ofRedoubt Volcano from very-long-period seismic waves, J. Volcanol. Geotherm. Res., 259, 77–88, doi:10.1016/j.jvolgeores.2012.04.018.
Hudson, J. A., R. G. Pearce, and R. M. Rogers (1989), Source type plot for inversion of the moment tensor, J. Geophys. Res., 94(B1), 765–774.Iguchi, M., H. Yakiwara, T. Tameguri, M. Hendrasto, and J. Hirabayashi (2008), Mechanism of explosive eruption revealed by
geophysical observations at the Sakurajima, Suwanosejima and Semeru Volcanoes, J. Volcanol. Geotherm. Res., 178, 1–9,doi:10.1016/j.jvolgeores.2007.10.010.
Ishihara, K. (1985), Dynamical analysis of volcanic explosion, J. Geodyn., 3(3), 327–349, doi:10.1016/0264-3707(85)90041-9.Julian, B. R., A. D. Miller, and G. R. Foulger (1998), Non-double-couple earthquakes 1. Theory, Rev. Geophys., 36(4), 525–549.Kanamori, H. (1983), Magnitude scale and quantification of earthquakes, Tectonophysics, 93 (3–4), 185–199,
doi:10.1016/0040-1951(83)90273-1.Kanamori, H., J. W. Given, and T. Lay (1984), Analysis of seismic body waves excited by the Mount St. Helens eruption of May 18, 1980, J.
Geophys. Res., 89(B3), 1856–1866.Knopoff, L., and M. J. Randall (1970), The compensated linear-vector dipole: A possible mechanism for deep earthquakes, J. Geophys. Res.,
75(26), 4957–4963.Kumagai, H., et al. (2007), Enhancing volcano-monitoring capabilities in Ecuador, EOS Trans. AGU, 88, 245–246,
doi:10.1029/2007EO230001.Kumagai, H., M. Nakano, T. Maeda, H. Yepes, P. Palacios, M. Ruiz, S. Arrais, M. Vaca, I. Molina, and T. Yamashima (2010), Broad-
band seismic monitoring of active volcanoes using deterministic and stochastic approaches, J. Geophys. Res., 115(B8), B08303,doi:10.1029/2009JB006889.
Kumagai, H., P. Placios, M. Ruiz, H. Yepes, and T. Kozono (2011), Ascending seismic source during an explosive eruption at TungurahuaVolcano, Ecuador, Geophys. Res. Lett., 38, L01306, doi:10.1029/2010GL045944.
Le Pennec, J. L., D. Jaya, and J. van der Plicht (2006), Recurrence pattern of late Holocene eruptions at Tungurahua Volcano (Ecuador)revealed by radiocarbon dating of charcoal in pyroclastic flow deposits, paper presented at Internationale/ “Cities on Volcanoes”/,Quito, volume des résumés, 64.
Lyons, J. J., and G. P. Waite (2011), Dynamics of explosive volcanism at Fuego Volcano imaged with very long period seismicity, J.Geophys. Res., 116, B09303, doi:10.1029/2011JB008521.
Miller, A. D., G. R. Foulger, and B. R. Julian (1998), Non-double-couple earthquakes 2. Observations, Rev. Geophys., 36(4), 551–568.Mogi, K. (1958), Relations between the eruptions of various volcanoes and the deformations of the ground surfaces around them, Bull.
Earthq. Res. Inst, 36, 99–134.Molina, I., H. Kumagai, J.-L. L. Pennec, and M. Hall (2005), Three-dimensional P-wave velocity structure of Tungurahua Volcano, Ecuador,
J. Volcanol. Geotherm. Res., 147, 144–156, doi:10.1016/j.jvolgeores.2005.03.011.Murase, T., and A. McBirney (1973), Properties of some common igneous rocks and their melts at high temperatures, Geol. Soc. Am. Bull.,
84(11), 3563–3592.Neuberg, J., and T. Pointer (2000), Effects of volcano topography on seismic broad-band waveforms, Geophys. J. Int., 143(1), 239–248,
doi:10.1046/j.1365-246x.2000.00251.x.Nishimura, T. (1998), Source mechanisms of volcanic explosion earthquakes: Single force and implosive sources, J. Volcanol. Geotherm.
Res., 86(1), 97–106, doi:10.1016/S0377-0273(98)00088-2.Nishimura, T. (2004), Pressure recovery in magma due to bubble growth, Geophys. Res. Lett., 31, L12613, doi:10.1029/2004GL019810.Ohminato, T. (2006), Characteristics and source modeling of broadband seismic signals associated with the hydrothermal system at
Satsuma-Iwojima Volcano, Japan, J. Volcanol. Geotherm. Res., 158, 467–490, doi:10.1016/j.jvolgeores.2006.08.004.Ohminato, T., and B. A. Chouet (1997), A free-surface boundary condition for including 3D topography in the finite-difference method,
Bull. Seismol. Soc. Am., 87(2), 494–515.Ohminato, T., B. A. Chouet, P. Dawson, and S. Kedar (1998), Waveform inversion of very long period impulsive signals associated with
magmatic injection beneath Kilauea Volcano, Hawaii, J. Geophys. Res., 103(B10), 23,839–23,862.Ohminato, T., M. Takeo, H. Kumagai, T. Yamashina, J. Oikawa, E. Koyama, H. Tsuji, and T. Urabe (2006), Vulcanian eruptions with dominant
single force components observed during the Asama 2004 volcanic activity in Japan, Earth Planets Space, 58, 583–593.Paige, C. C., and M. A. Saunders (1982), Lsqr: An algorithm for sparse linear equations and sparse least squares, ACM Trans. Math. Softw.,
8(1), 43–71, doi:10.1145/355984.355989.Prousevitch, A. A., D. L. Sahagian, and A. T. Anderson (1993), Dynamics of diffusive bubble growth in magmas: Isothermal case, J.
Geophys. Res., 98(B12), 22,283–22,307, doi:10.1029/93JB02027.Ruiz, M., J. Lees, and J. Johnson (2006), Source constraints of Tungurahua Volcano explosion events, B. Volcanol., 68, 480–490.Tameguri, T., M. Iguchi, and K. Ishihara (2002), Mechanism of explosive eruptions from moment tensor analyses of explosion earthquakes
at Sakurajima Volcano, Japan, Bull. Volcanol. Soc. Jpn., 47(4), 197–215.Uhira, K., and M. Takeo (1994), The source of explosive eruptions of Sakurajima Volcano, Japan, J. Geophys. Res., 99(B9), 17,775–17,789,
doi:10.1029/94JB00990.Venzke, E., R. W. Wunderman, L. McClelland, T. Simkin, J. Luhr, L. Siebert, G. Mayberry, and S. Sennert (2002), Global volcanism, 1968 to
the present. Smithsonian Institution, Global Volcanism Program Digital Information Series, GVP-4 (http://www.volcano.si.edu/reports/),Smithsonian Institution, Global Volcanism program digital information series.
Zobin, V. M., C. Navarro, G. Reyes-Dávila, J. Orozco, M. Bretón, A. Tellez, G. Reyes-Alfaro, and H. Vázquez (2006), The methodology ofquantification of volcanic explosions from broad-band seismic signals and its application to the 2004–2005 explosions at Volcán deColima, Mexico, Geophys. J. Int., 167, 467–478, doi:10.1111/j.1365-246X.2006.03108.x.
KIM ET AL. ©2014. American Geophysical Union. All Rights Reserved. 1164


