Embed Size (px)
Citation preview
The Author 2005. Published by Oxford University Press on behalf of the Society for Molecular Biology and Evolution. All rights reserved. For permissions, please e-mail: [email protected]
1
Submitted to Molecular Biology and Evolution: Research Article
Baleen whale phylogeny and a past extensive radiation event revealed by
SINE insertion analysis
Masato Nikaido1, Healy Hamilton2, Hitomi Makino1, Takeshi Sasaki3, Kazuhiko
Takahashi3, Mutsuo Goto4, Naohisa Kanda4, Luis A Pastene4, and Norihiro Okada1,3#
1Graduate School of Bioscience and Biotechnology, Tokyo Institute of Technology, Yokohama,
Japan; 2California Academy of Sciences, San Francisco, CA; 3Department of Cell Biology,
National Institute for Basic Biology, Myodaiji, Okazaki, Japan; 4The Institute of Cetacean
Research, Tokyo Japan
#Corresponding author: N. Okada, Department of Biological Sciences, Graduate School of
Bioscience and Biotechnology, Tokyo Institute of Technology, Nagatsuta-cho, Midori-ku,
Yokohama 226-8501, Japan
Tel: 81-45-924-5742, Fax: 81-45-924-5835
Email: [email protected]
Key words: baleen whales, phylogeny, radiation event, incomplete lineage sorting
Abbreviations: MYBP, million years before present; SINE, short interspersed repetitive
element.
Data deposition: AB196472 to AB195501
by guest on June 5, 2013http://m
be.oxfordjournals.org/D
ownloaded from
2
Abstract
Baleen whales (suborder Mysticeti) comprise eleven extant species that are classified into
four families. Although several phylogenetic hypotheses about these taxa have been proposed,
their phylogenetic relationships remain confused. We addressed this problem using SINE
(short interspersed repetitive element) insertion data, which now are regarded as almost ideal
shared, derived characteristics at the molecular level. We reconstructed the phylogenetic
relationships of baleen whales by characterizing 36 informative SINE loci. One of the
intriguing conclusions is that balaenopterids and eschrichtiids radiated very rapidly during a
very short evolutionary period. During this period, speciation occurred in balaenopterids and
eschrichtiids while newly inserted SINE loci remains polymorphic. Later on these SINEs were
sorted incompletely into each lineage. Thus, there are now inconsistencies among species
regarding the presence or absence of a given SINE. This is in sharp contrast to the phylogeny of
toothed whales, for which no SINE inconsistencies have been found. Furthermore, we found
monophyletic groupings between humpback and fin whales as well as between (sei + Bryde’s)
whales and blue whales, both of which have not previously been recognized. The
comprehensive SINE insertion data, together with the mitochondrial DNA phylogeny that was
recently completed (Sasaki et al., 2005 Syst. Biol. 56:77-90; Rychel, Reeder and Berta 2004,
Mol. Phylogenet. Evol. 32:892-901), provide a nearly complete picture of the evolutionary
history of baleen whales.
by guest on June 5, 2013http://m
be.oxfordjournals.org/D
ownloaded from
3
Introduction
The order Cetacea (whales) is traditionally classified into two suborders, Odontoceti (toothed
whales) and Mysticeti (baleen whales), which comprise more than 80 extant species (Rice
1998). Their morphologies are highly specialized for adaptation to fully aquatic life, including
regression of the hind limbs and loss of hair. The acquisition of an echolocating ability and its
accompanying morphological features in toothed whales and the presence of baleen plates
instead of teeth in baleen whales are also remarkable. The origin and phylogeny of whales have
been of great interest to evolutionary biologists for a long time, but their highly specialized
features have made it very difficult to reconstruct the evolutionary history of cetaceans. Recent
advances in molecular phylogenetics have begun to shed light on this issue. The cetaceans are
now known to be nested within artiodactyls, and are closely related to hippopotamuses
(Shimamura et al. 1997; Gatesy 1998; Nikaido, Rooney and Okada 1999). Concerning the
problem of toothed whales monophyly or paraphyly, we succeeded in isolating three
independent SINE loci, which support a monophyletic origin of toothed whales (Nikaido et al.
2001a), however, except for SINEs, there are few molecular data supporting the traditional
hypothesis of toothed whale monophyly (Milinkovitch, Orti and Meyer 1993; Adachi and
Hasegawa 1995; Milinkovitch 1995; Smith et al. 1996). The paraphyly of river dolphins is an
important discovery in the systematics of cetaceans (Arnason and Gullberg 1996; Cassens et al.
2000; Hamilton et al. 2001; Nikaido et al. 2001a).
Although the phylogeny of toothed whales as well as the origin of whales has been well
studied over the past ten years, inter-relationships among baleen whales have not been explored
extensively. Arnason, Gullberg and Widegren (1993) and Arnason and Gullberg (1994)
by guest on June 5, 2013http://m
be.oxfordjournals.org/D
ownloaded from
4
determined and analyzed mitochondrial DNA sequences of a control region and cytochrome b,
respectively, of several baleen whales to resolve their phylogenetic relationships. These two
analyses yielded the following three consistent conclusions. Balaenidae (bowhead and right
whales) are monophyletic at the basal of mysticetes. Neobalaenidae (pygmy right whale)
diverged next, followed by minke whales and by sei and Bryde’s whales, which are
monophyletic. The phylogenetic relationships of species among Balaenopteridae (humpback,
fin, sei/Bryde’s, and minke whales) and Eschrichtiidae (gray whale) are not, however, well
resolved. For example, in the tree reconstructed by the analysis of the control region (Arnason,
Gullberg and Widegren 1993), fin and blue whales are monophyletic, whereas in the
phylogenetic tree of cytochrome b (Arnason and Gullberg 1994), humpback and blue whales
are monophyletic. Both trees nested gray whales within balaenopterids, showing paraphyly of
Balaenopteridae, although the exact phylogenetic position of the gray whale is different
between the two studies. Indeed, each topology suggested by different genes is not support by
enough bootstrap values, implying the difficulty of clarifying the relationships among
Balaenopteridae and Eschrichtiidae.
Recently, Sasaki et al. (2005) determined the complete mitochondrial genome sequence of ten
extant baleen whales and constructed a phylogenetic tree of Mysticeti by adding the data of
blue and fin whales from the GenBank database. Those results showed the monophyly of the
Eschrichtiidae + Balaenopteridae and the presence of four principal lineages among the
Eschrichtiidae + Balaenopteridae—lineage I (the two minke whales), lineage II (the fin and
humpback whales), lineage III (the sei, Bryde’s and blue whales) and lineage IV (the gray
whale)—but the data failed to resolve the relationships among these four lineages. The failure
by guest on June 5, 2013http://m
be.oxfordjournals.org/D
ownloaded from
5
in resolving the relationships among these four major lineages is present also in the case of
Rychel, Reeder and Berta (2004), where the partial mitochondrial and nuclear DNA sequences
were analyzed.
In our present study, we applied a SINE insertion analysis (Okada1991a; Okada 1991b; Okada,
Shedlock, and Nikaido 2004) to clarify the evolutionary history of mysticetes, with special
reference to that of balaenopterids and eschrichtiids.
SINEs are retroposons that are amplified via cDNA intermediates and are reintegrated into
the host genome by retroposition (Rogers 1985; Weiner, Deininger and Efstratiadis 1986;
Okada 1991a,b; Kazazian 2000). The integration of a SINE is irreversible, and the probability
of independent insertions of a SINE at the same genomic position in different lineages is
infinitely small. The polarity of a SINE insertion is fixed from the absence to the presence.
These attributes imply that SINEs represent ideal, homoplasy-free markers for inferring
phylogenetic relationships among organisms (Shedlock and Okada 2000; Okada, Shedlock,
and Nikaido 2004). By applying the SINE method, we recently clarified the phylogeny of
cetaceans and their relatives (Shimamura et al. 1997; Nikaido, Rooney and Okada 1999,
Nikaido et al. 2001a).
In the present study, we used the SINE method to reconstruct a phylogenetic tree of 11 extant
baleen whale species. We identify an extensive radiation event during speciation of the
common ancestors of balaenopterids and eschrichtiids. We also establish the phylogenetic
relationships of baleen whales. We show the power of the SINE method not only for inferring
the phylogeny of baleen whales but also for detecting an ancient incomplete lineage sorting,
which implies a past radiation event during baleen whale evolution.
by guest on June 5, 2013http://m
be.oxfordjournals.org/D
ownloaded from

6
by guest on June 5, 2013http://m
be.oxfordjournals.org/D
ownloaded from
7
Materials and Methods
Fourteen cetaceans species (11 mysticetes and 3 odontocetes; all of the DNA samples used in
this study are described in supplemental table 1) were examined in this study, using
hippopotamus as an outgroup (Nikaido, Rooney and Okada 1999). Their DNAs were extracted
using phenol/chloroform and then precipitated by ethanol according to Blin and Stafford
(1976). The genomic libraries were constructed for all baleen whale species except for pygmy
right whale and bowhead whale, for which we had insufficient DNA. We screened these
libraries using the CHR-2 SINE (especially the CD subfamily) sequence as a probe, taking into
consideration the timing of amplification of SINE subfamilies and the phylogeny of whales
(Nikaido et al. 2001a,b). Positively hybridized clones were sequenced and then primer sets
were designed. All primer sets used in this study are shown in supplemental table 2. PCR was
performed with these primer sets for each SINE locus using cetacean and hippopotamus DNAs
as templates. The PCR products were then separated by electrophoresis; larger PCR products
indicated the presence of the SINE. To confirm the presence or absence of SINE and the precise
site of SINE insertions at particular loci, we roughly sequenced a short surrounding region of
each insertion site for almost all bands in the gels (supplemental figure 3 and 5). For
phylogenetic analysis, the SINE insertion data were compiled into the data matrix, in which the
absence of a SINE at a particular locus was coded as 0 and the presence of a SINE at that same
locus was coded as 1 (supplemental table 3). In cases where a PCR band was not visible, the
character state was coded as missing (denoted by ?). The resultant data matrics were applied to
PAUP* (ver. 4. 0b10; Swofford 1998) for reconstruction of a strict-consensus parsimony tree.
The analysis was carried out under 'IRREV.UP' option, regarding '0' as the ancestral state.
by guest on June 5, 2013http://m
be.oxfordjournals.org/D
ownloaded from

8
Because the polarity of a SINE insertion is fixed, there is no need to root the resultant
phylogeny.
by guest on June 5, 2013http://m
be.oxfordjournals.org/D
ownloaded from
9
Results and Discussion
Phylogenetic relationships of baleen whales
We prepared genomic libraries of nine species of baleen whales and characterized 36 SINE
loci, all of which are informative in terms of phylogenetics of cetaceans (all PCR patterns of
the 36 loci are shown in Supplemental figure 1). It should be noted that SINEs were screened
from genomic libraries of almost all species examined, thereby eliminating ascertainment bias
that might be derived from choosing a single species as the source of SINE loci for the analysis.
We confirmed the fixation of SINE insertions by examining several (3 to 10) individuals for
each species using SINE flanking PCR experiments (we did not confirm right, bowhead,
pygmy right and gray whales, because we did not have enough individuals for these species).
No within-species polymorphisms, with respect to the presence or absence of a SINE, were
detected for the loci characterized here (data not shown).
Fig. 1 shows the PCR patterns of 12 SINE loci, which represent each clade of A to I, and
inconsistent loci J (described later). Clade A represents the monophyly of the order Cetacea,
which is supported by five newly isolated loci (Fig. 1, 2a). Clade B represents the monophyly
of the suborder Mysticeti (baleen whales), which is supported by five independent loci (Fig. 1,
2a). Because we did not identify any loci that support the sister relationship of baleen whales
and sperm whales, we could not validate the monophyly of these two groups, which have been
once proposed (e.g., Milinkovitch, Orti and Meyer 1993; Milinkovitch 1995).
We elucidated the order in which baleen whales diverged. The right whales and bowhead
whales, which are monophyletic (Fig.1, 2a; clade I), diverged first among baleen whales as
shown by five SINE loci (Fig. 1, 2a; clade C). The pygmy right whale diverged next as shown
by guest on June 5, 2013http://m
be.oxfordjournals.org/D
ownloaded from
10
by five SINE loci (Fig. 1, 2a; clade D). Clade C represents the monophyly of Neobalaenidae,
Eschrichtiidae and Balaenopteridae, and clade D represents the monophyly of Eschrichtiidae
and Balaenopteridae. Because clades C and D were supported by five independent SINE loci
that were isolated and characterized from genomic libraries of more than two species, these two
clades remain robust. These results are consistent with previous molecular studies (Arnason,
Gretarsdottir and Widegren 1992; Adegoke, Arnason and Widegren 1993; Arnason and
Gullberg 1994) and are supported by the high bootstrap values calculated in our recent
complete mitochondrial DNA study (Fig. 2b, Sasaki et al. 2005). They are also consistent with
morphological studies (e.g., Barnes and McLeod 1984; Mead and Brownell 1993).
We further determined the presence of the four major lineages that radiated from a common
ancestor of Eschrichtiidae and Balaenopteridae. One lineage (I) is a monophyletic group of
common and Antarctic minke whales, which is supported by three loci (Fig. 1, 2a; clade E).
The second lineage (II) consists of humpback and fin whales, which is supported by three loci
(Fig. 1, 2a; clade F). The discovery of this clade is of special interest from the viewpoint of
baleen whale systematics. The humpback whale is classified in the genus Megaptera, members
of which are morphologically distinct from those of the genus Balaenoptera, which includes
fin, blue, sei, Bryde’s, and minke whales. The present study supports previous molecular
evidence (Adegoke, Arnason and Widegren 1993; Arnason and Gullberg 1994) that the genus
Megaptera is nested within the genus Balaenoptera. Regarding the sister species of humpback
whales, however, results of previous molecular studies are confusing. The findings of Baker et
al. (1993) recovered the monophyly of humpback and fin whales by the analysis of partial
sequences of the mitochondrial control region of baleen whales, but these investigators did not
by guest on June 5, 2013http://m
be.oxfordjournals.org/D
ownloaded from
11
stress this issue. Furthermore, the analysis of the complete sequence of the mitochondrial
control region by Arnason, Gullberg and Widegren (1993) showed very weak (below 50%
bootstrap percentage) grouping of fin and blue whales. Thus, no obvious conclusion
concerning the relationships of humpback and fin whales was proposed from the analyses of
mitochondrial control region. Next, the sister relationship between humpback and blue whales
is supported by the analysis of mitochondrial cytochrome b (Arnason and Gullberg 1994). The
analysis of nuclear DNA sequences of intron fragments from the actin gene by Cipriano and
Palumbi (1999) connected humpback and fin whales as sibling species, although only four
species were included in the analysis. The analysis of common cetacean nuclear satellite DNA
by Arnason, Gretarsdottir and Widegren (1992) suggests a blue and fin whale clade. As
described above, the sister species of humpback whales has not been clarified. Taking the facts
described above, the grouping between humpback and fin whales is quite striking, even for
molecular phylogeneticists, morphologists and paleontologists, because humpback whales
possess distinct morphological characters compared to other balaenopterids (e.g. enlarged
flippers). Large-scale changes in the developmental systems of humpback whales in their own
lineage might make their features distinct and may have created an inconsistency between
morphological and molecular phylogenies, resulting in the paraphyly of Balaenoptera.
Lineage III is a monophyletic group of sei, Bryde’s and blue whales that is supported by two
loci (Fig. 1, 2a; clade G). Within this clade, the monophyly of sei and Bryde’s whales is
supported by three loci (Fig. 1, 2a; clade H). Although the monophyly of sei and Bryde’s
whales has been supported by several lines of evidence for these more than ten years (Arnason,
Gullberg and Widegren 1993; Arnason and Gullberg 1994; Arnason and Gullberg 1996), the
by guest on June 5, 2013http://m
be.oxfordjournals.org/D
ownloaded from
12
sister relationship of blue whales to (sei + Bryde’s) whales has been recovered by very recent
two molecular studies (Rychel, Reeder and Berta 2004, Sasaki et al. 2005). Rychel, Reeder and
Berta (2004), who compared partial mitochondrial and nuclear DNA sequences, and Sasaki et
al. (2005), who compared complete mitochondrial genomes resulted in the same topology. The
clade G supported by the present SINE data is consistent with these two analyses.Lineage IV is
a gray whale lineage (Fig. 2a).
Although the monophyly of each of the lineages I–IV is strongly supported by multiple
SINE insertion data, the order in which they branched remains unresolved (see below). Fig. 2a
is a phylogenetic tree with multifurcation of these four lineages (hereafter referred to as a
consensus tree).
Characterization of inconsistent SINE loci suggests a radiation event from a common ancestor
of balaenopterids and eschrichtiids
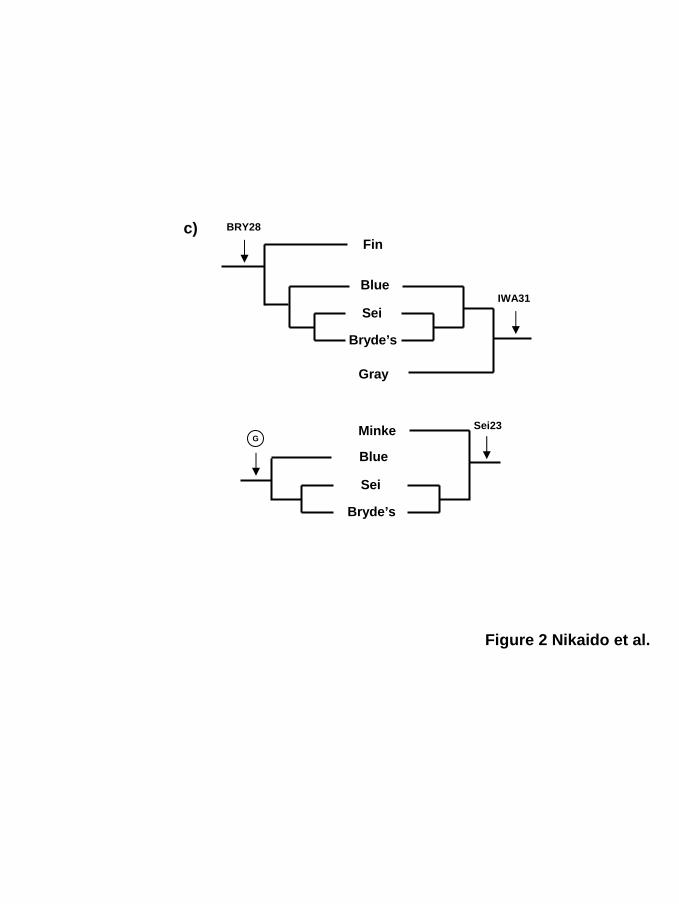
During our extensive analysis of SINE insertions in the genomes of baleen whales, we
characterized three interesting SINE loci, two of which (BRY28, Sei23) are inconsistent with
the consensus tree shown in Fig. 2a, and all of which are inconsistent with one another. For
example, the locus IWA31 (Fig. 1, 2c) indicates monophyly of lineages III and IV (sei, Bryde’s,
blue and gray whales), whereas locus BRY28 indicates monophyly of lineage III (sei, Bryde’s
and blue whales) and fin whales. Thus, these loci contradict each other, and locus BRY28
violates the monophyly of fin and humpback whales. Furthermore, locus Sei23 indicates the
monophyly of lineage I (common and Antarctic minke whales) and sei/Bryde’s whales, thus
repudiating the clade G. Locus Sei23 is also inconsistent with BRY28 and IWA31, although
by guest on June 5, 2013http://m
be.oxfordjournals.org/D
ownloaded from
13
these two are consistent with clade G. The presence or absence of the SINE for each locus was
confirmed by sequencing the PCR bands, and the partial alignments of these loci are shown in
supplemental figure 3. Such inconsistencies were also reported in the recent study by Rychel,
Reeder and Berta (2004), who analyzed baleen whale phylogeny using mitochondrial and
nuclear DNA data, where the topologies for each gene was inconsistent. These phylogenetic
inconsistencies were detected among the balaenopterids and eschrichtiids, that are very similar
to that obtained from our SINE analysis.
These inconsistent loci prompted us to construct the most parsimonious tree using the
PAUP* program (1998). Supplemental table 3 shows the data matrix for the presence or
absence of a SINE at all 36 loci. Because of the three inconsistent loci, the bootstrap value for
connecting the two clades of lineages III and IV was low (59%; see supplemental figure 2),
making it reasonable for these two clades to be positioned as multifurcations (Fig. 2a; J), which
again recovered the consensus SINE tree.
The SINE tree versus the complete mitochondrial DNA tree
A complete mitochondrial genome analysis of almost all baleen whale species was recently
completed (Sasaki et al. 2005). The resulting proposed phylogenetic tree (Fig. 2b) is essentially
consistent with the SINE tree generated from the present data (Fig. 2a), in which several clades,
such as the monophyly of humpback and fin whales (lineage II) and monophyly of Bryde’s/sei
and blue whales (lineage III), are supported by high bootstrap probabilities. However, the
bootstrap probabilities of each of the nodes that give the branching order of lineages I–IV are
quite low. It is possible that these low bootstrap values might be a result of rapid, successive
divergence events of these four lineages during baleen whale evolution. In that respect, the
by guest on June 5, 2013http://m
be.oxfordjournals.org/D
ownloaded from
14
mitochondrial DNA tree is largely consistent with the SINE consensus tree. Furthermore, a
comprehensive analysis of the cetartiodactyl mito-genomic data by Arnason, Gullberg and
Janke (2004) showed a quite similar conclusion in that the phylogenetic relationships of
Eschrictiidae and Balaenopteridae are not clear. Their phylogenetic tree showed that the
branches joining each baleen whale tended to be short, implying that these groups underwent a
rapid split.
Ancestral polymorphisms, incomplete lineage sorting and radiation
As described in the Introduction, SINE inserts can provide an excellent record of biological
history that is largely free from character reversals and parallel evolution. Namely, the
possibility that a SINE is independently inserted in the same genomic locus in different
lineages is extremely small (Shedlock and Okada 2000). Accordingly, the history of each SINE
at a particular genomic locus represents a gene tree of that locus. Even though there are several
individual SINE loci that are inconsistent with one another, each SINE should represent its
respective true gene tree. Such inconsistencies might have been generated by ancestral SINE
polymorphisms followed by incomplete lineage sorting, which have been frequently observed
in cases of rapid successive speciation (Shedlock, Takahashi, and Okada 2004 ). Supplemental
figure 4 illustrates how an ancestral polymorphism in a common ancestor of the radiated
species, followed by incomplete lineage sorting, creates inconsistent SINE patterns during
evolution (see Nei and Kumar 2000).
In previous analyses of the origin of whales and the phylogeny of toothed whales using
SINEs, inconsistent SINE loci were not detected (Shimamura et al. 1997; Nikaido, Rooney and
by guest on June 5, 2013http://m
be.oxfordjournals.org/D
ownloaded from
15
Okada 1999; Nikaido et al. 2001a). It is only at the clades F and G that we found
inconsistencies in cetacean phylogenetics, suggesting that, at the time of divergence of
Balaenopteridae and Eschrictiidae, baleen whales experienced a radiation event. It should be
noted that we found no inconsistent loci for clades A, B, C, D, E and H, supporting strongly
each of these monophyletic groupings.
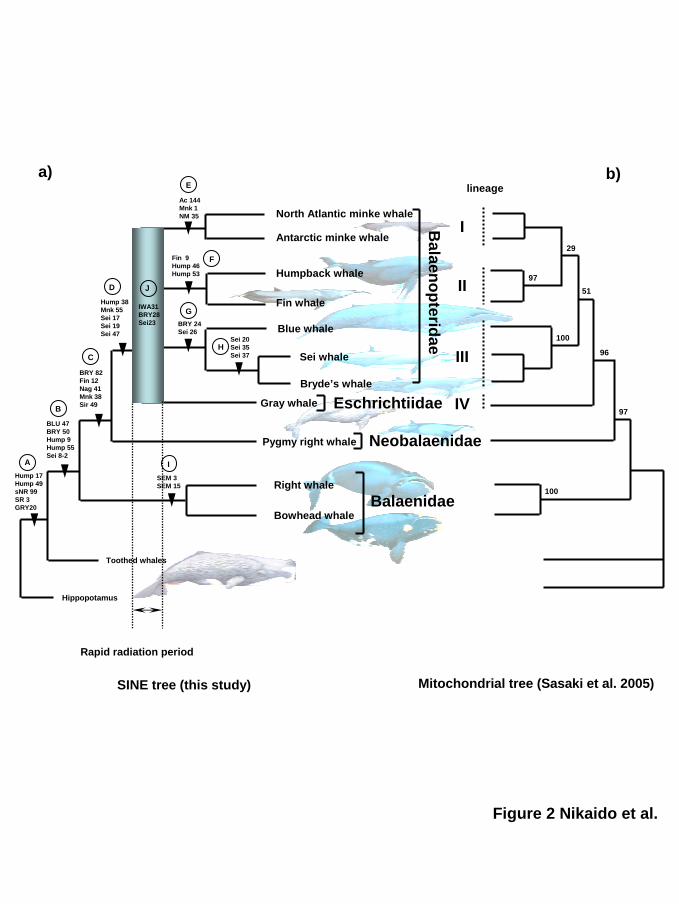
One noteworthy conclusion of the present study is that lineages I–IV of balaenopterids and
eschrichtiids radiated very rapidly over a short evolutionary period. This event is highlighted
by the gradated box on the phylogenetic tree of baleen whales (Fig. 2a; J). This possible
radiation was deduced by inconsistent SINE patterns for three independent loci (Fig. 1), which
might have resulted from ancient incomplete lineage sorting of the SINE polymorphisms that
were retained among the common ancestors of extant balaenopterids and eschrichtiids after the
divergence of pygmy right whales (a hypothetical ancestor of balaenopterids and eschrichtiids;
J). This suggests that the period around J is short. Considering that the effective population size
is also one of the most critical factors affecting incomplete lineage sorting (Nei 1987; Pamilo
and Nei 1988; Takahata 1989; Shedlock, Takahashi, and Okada 2004), our data indicate that
the population size of ancestral whales around J might have been relatively large or might have
expanded during successive radiation events of baleen whales. In the previous study of Sasaki
et al. (2005), the period of divergence for J was calculated as ~19 MYBP. They also suggested
that almost all (10 of 12) major extant baleen whale lineages arose during this period, between
the early Miocene (23 MYBP) and Middle Miocene (10 MYBP). There is a rich amount of
fossil data of the stem group for Balaenopteridae, implying the prosperity of this lineage
(Sasaki et al. 2005). Taking the SINE data and the molecular timescale of mitochondrial
by guest on June 5, 2013http://m
be.oxfordjournals.org/D
ownloaded from
16
sequences into account, the baleen whale ancestors have experienced rapid radiation events,
especially around 19 MYBP, which are represented by the discovery of extinct
stem-balaenopterid groups (Parabalaenoptera, Aglaocetus and Cophocetus, Sasaki et al. 2005).
The data described above have prompted us to explore the oceanic and geographic evidence of
past environmental changes that might have occurred around 19 MYBP, an analysis that will
help to elucidate the true history of cetacean evolution.
Conclusions
We propose that the isolation of multiple incongruent SINE loci indicates the presence of a
radiation event in a common ancestor of Balaenopteridae and Eschrictiidae. During this
radiation, successive speciation occurred (Shedlock, Takahashi, and Okada 2004).
Polymorphic SINEs in the past could not have become fixed during such a short period and
were incompletely sorted into lineages, resulting in incongruence of SINEs among different
lineages. Predicting the presence of a radiation event based on phylogenetic analysis by DNA
sequence comparison is difficult because radiation causes low bootstrap values, which are not
necessarily caused by radiation. Taking this issue into account, SINE insertion data may form
the basis for an ideal method for detecting lineage sorting effects, because it enables us to
analyze large data sets of multiple nuclear loci independently (Hillis 1999; Miyamoto 1999;
Shedlock, Milinkovitch and Okada 2000) and provides strong reliability when inferring a gene
tree (Shedlock, Takahashi and Okada 2004). The validity of the SINE method for tracking
ancient radiation events has been well demonstrated and is yet another benefit of this useful
phylogenetic marker. Inconsistent SINE patterns have also been detected among the genomes
of African cichlid fishes in Lake Tanganyika (Takahashi et al. 2001) and in ancestral river
by guest on June 5, 2013http://m
be.oxfordjournals.org/D
ownloaded from
17
populations of cichlids (Terai et al. 2003). We predict that future SINE analyses will detect
such inconsistencies in many other lineages in which radiation events might have occurred,
such as turtles, ruminants, felids and primates.
Acknowledgement
For permissions and research support, we thank J. Mead of the U.S. National Museum of
Natural History, and S. Chivers, A. E. Dizon and K. Robertson of the Protected Resources
Division, National Marine Fisheries Service. This work was supported by a Grant-in-Aid to N.
O. from the Ministry of Education, Science, Sports and Culture of Japan.
Literature Cited
Adachi, J. and M. Hasegawa. 1995. Phylogeny of whales: dependence of the inference on
species sampling. Mol. Biol. Evol. 12:177-179.
Adegoke, J. A., U. Arnason, and B. Widegren. 1993. Sequence organization and evolution, in
all extant whalebone whales, of a DNA satellite with terminal chromosome localization.
Chromosoma 102:382-388.
Arnason, U., A. Gullberg, and B. Widegren. 1993. Cetacean mitochondrial DNA control
region: sequences of all extant baleen whales and two sperm whale species. Mol. Biol. Evol.
10:960-970.
Arnason, U. and A. Gullberg. 1994. Relationship of baleen whales established by cytochrome b
gene sequence comparison. Nature 367:726-728.
Arnason, U. and A. Gullberg. 1996. Cytochrome b nucleotide sequences and the identification
of five primary lineages of extant cetaceans. Mol. Biol. Evol. 13:407-417.
by guest on June 5, 2013http://m
be.oxfordjournals.org/D
ownloaded from
18
Arnason, U., A. Gullberg, and A. Janke. 2004. Mitogenomic analyses provide new insights into
cetacean origin and evolution. Gene 333:27-34.
Arnason, U., S. Gretarsdottir, and B. Widegren. 1992. Mysticete (baleen whale) relationships
based upon the sequence of the common cetacean DNA satellite. Mol. Biol. Evol.
9:1018-1028.
Baker, C. S., A. Perry, J. L. Bannister et al. (14 co-authors). 1993. Abundant mitochondrial
DNA variation and world-wide population structure in humpback whales. Proc. Natl. Acad. Sci.
USA 90:8239-8243.
Barnes, L. G. and S. A. McLeod. 1984. The fossil record and phyletic relationships of gray
whales. Pp. 3-32 in M. L. Jones, S. L. Swartz, and S. Leatherwood, eds. The Gray whale,
Eschrichtius robustus. Academic Press, New York.
Blin, N. and D. W. Stafford. 1976. A general method for isolation of high molecular weight
DNA from eukaryotes. Nucleic Acids Res. 3:2303-2308.
Cassens, I., S. Vicario, B. Waddell et al. (13 co-authors). 2000. Independent adaptation to
riverine habitats allowed survival of ancient cetacean lineages. Proc. Natl. Acad. Sci. USA
97:11343-11347.
Cipriano, F. and S. R. Palumbi. 1999. Genetic tracking of a protected whale. Nature
397:307-308.
Gatesy, J. 1998. Molecular evidence for the phylogenetic affinities of Cetacea. Pp. 63–111 in J.
G. M. Thewissen, ed. The Emergence of Whales. Plenum, New York.
Hamilton, H., S. Caballero, A. G. Collins, and R. L. Brownell Jr. 2001. Evolution of river
dolphins. Proc. R. Soc. London Ser. B Biol. Sci. 268:549-556.
Hillis, D. M. 1999. SINEs of the perfect character. Proc. Natl. Acad. Sci. USA 96:9979-9981.
by guest on June 5, 2013http://m
be.oxfordjournals.org/D
ownloaded from
19
Kazazian, H. H. Jr. 2000. Genetics. L1 retrotransposons shape the mammalian
genome. Science 289:1152-1153.
Mead, J. M. and R. L. Brownell. 1993. Order Cetacea. Pp. 349-364 in D. E. Wilson, and D. M.
Reeder, eds. Mammal Species of the World. Smithsonian Inst. Press, Washington DC.
Messenger, S. L. and J. A. Mcguire. 1998. Morphology, molecules, and the phylogenetics of
cetaceans. Syst. Biol. 47:90–124.
Milinkovitch, M. C., G. Orti, and A. Meyer. 1993. Revised phylogeny of whales suggested by
mitochondrial ribosomal DNA sequences. Nature 367:346-348.
Milinkovitch, M. C. 1995. Molecular phylogeny of cetaceans prompts revision of
morphological transformations. Trends Ecol. Evol. 10:328-334.
Miyamoto, M. M. 1999. Molecular systematics: Perfect SINEs of evolutionary history? Curr.
Biol. 9:R816-R819.
Nei, M. 1987. Molecular evolutionary genetics. Columbia University Press, New York.
Nei, M. and S. Kumar. 2000. Molecular Evolution and Phylogenetics. Oxford University Press,
New York.
Nikaido, M., A. P. Rooney, and N. Okada. 1999. Phylogenetic relationships among
cetartiodactyls based on insertions of short and long interspersed elements: hippopotamuses
are the closest extant relatives of whales. Proc. Natl. Acad. Sci. USA 96:10261-10266.
Nikaido, M., F. Matsuno, H. Hamilton et al. (11 co-authors). 2001a. Retroposon analysis of
major cetacean lineages: the monophyly of toothed whales and the paraphyly of river dolphins.
Proc. Natl. Acad. Sci. USA 98:7384-7389.
by guest on June 5, 2013http://m
be.oxfordjournals.org/D
ownloaded from
20
Nikaido, M., F. Matsuno, H. Abe, M. Shimamura, H. Hamilton, H. Matsubayashi, and N.
Okada. 2001b. Evolution of CHR-2 SINEs in cetartiodactyl genomes: possible evidence for the
monophyletic origin of toothed whales. Mammal. Genome 12:909-915.
Okada, N. 1991a. SINEs. Curr. Opin. Genet. Dev. 1:498-504.
Okada, N. 1991b. SINEs: Short interspersed repeated elements of the eukaryotic genome.
Trends Ecol. Evol. 6:358-361.
Okada, N., A. M. Shedlock, and M. Nikaido 2004 Retroposon mapping in molecular
systematics. Pp. 189-226. in W. J. Miller, and P. Capy, eds. Mobile Genetic Elements. Humana
Press, New Jersey.
Pamilo, P. and M. Nei. 1988. Relationships between gene trees and species trees. Mol. Biol.
Evol. 5:568-583.
Rice, D. W. 1998. Marine Mammals of the world: Systematics and Distribution. Soc. Mar.
Mamm., Lawrence, KS.
Rogers, J. H. 1985. Origins of repeated DNA. Nature 317:765-766.
Rychel, A. L., T. W. Reeder, and A. Berta. 2004. Phylogeny of mysticete whales based on
mitochondrial and nuclear data. Mol. Phylogenet. Evol. 32:892-901.
Sasaki, T., M. Nikaido, H. Healy, M. Goto, H. Kato, N. Kanda, L. A. Pastene, Y. Cao, R. E.
Fordyce, M. Hasegawa, and N. Okada. 2005. Mitochondrial Phylogenetics and Evolution of
Mysticete Whales. Syst. Biol. 56:77-90.
Shedlock, A. M., and N. Okada. 2000. SINE Insertions: Powerful Tools for Molecular
Systematics. BioEssays 22:148-160.
Shedlock, A. M., M. C. Milinkovitch, and N. Okada. 2000. SINE evolution, missing data, and
the origin of whales. Syst. Biol. 49:808-817.
by guest on June 5, 2013http://m
be.oxfordjournals.org/D
ownloaded from
21
Shedlock, A. M., K. Takahashi, and N. Okada. 2004. SINEs of speciation: tracking lineages
with retroposons. Trends Ecol. Evol. 19:545-553
Shimamura, M., H. Yasue, K. Ohshima, H. Abe, H. Kato, T. Kishiro, M. Goto, I. Munechika,
and N. Okada. 1997. Molecular evidence from retroposons that whales form a clade within
even-toed ungulates. Nature 388:666-670.
Smith, M. R., M. S. Shivji, V. G. Waddell, M. J. Stanhope. 1996. Phylogenetic evidence from
the IRBP gene for the paraphyly of toothed whales, with mixed support for Cetacea as a
suborder of Artiodactyla. Mol. Biol. Evol. 13:918–922.
Swofford, D. L. 1998. PAUP*: Phylogenetic Analysis Using Parsimony (Sinauer, Sunderland,
MA), Version 4.0.
Takahashi, K., Y. Terai, M. Nishida, and N. Okada. 2001. Phylogenetic relationships and
ancient incomplete lineage sorting among cichlid fishes in Lake Tanganyika as revealed by
analysis of the insertion of retroposons. Mol. Biol. Evol. 18:2057-2066.
Takahata, N. 1989. Gene genealogy in three related populations: consistency probability
between gene and population trees. Genetics 122:957-966.
Terai, Y., K. Takahashi, M. Nishida, T. Sato, and N. Okada. 2003. Using SINEs to Probe
Ancient Explosive Speciation: "Hidden" Radiation of African Cichlids? Mol. Biol. Evol.
20:924-930.
Weiner, A. M., P. L. Deininger, and A. Efstratiadis. 1986. Nonviral retroposons: genes,
pseudogenes, and transposable elements generated by the reverse flow of genetic information.
Annu. Rev. Biochem. 55:631-661.
by guest on June 5, 2013http://m
be.oxfordjournals.org/D
ownloaded from
22
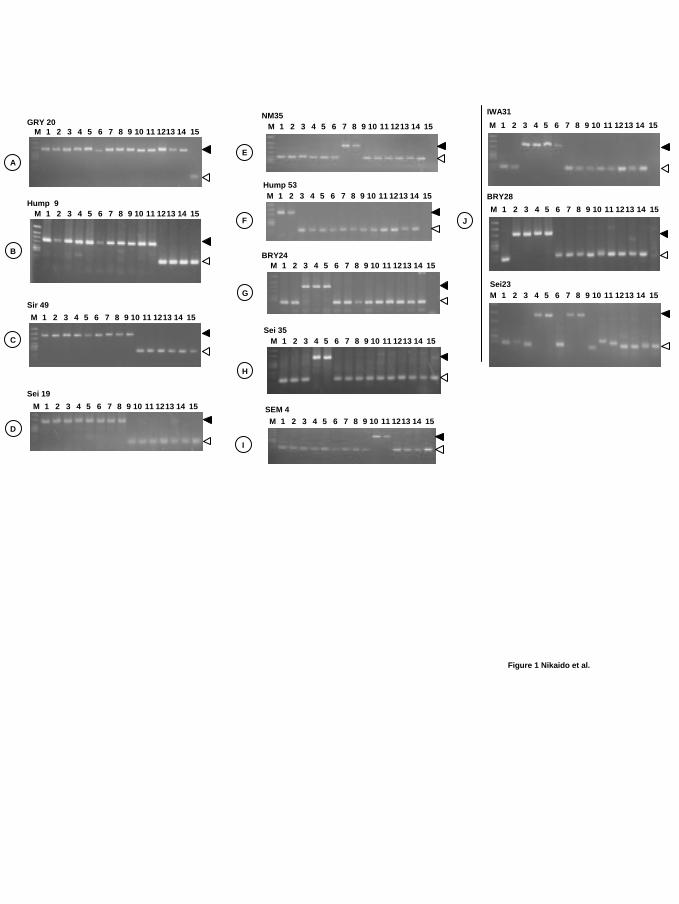
Figure 1. PCR patterns of representative SINE loci
Electrophoretic gel patterns of PCR products for 12 representative SINE loci. All 36 loci
analyzed in this study are shown in Supplemental Figure 1. Bands indicating the presence of
the SINE are shown by filled arrowheads, whereas open arrowheads show those that indicate
SINE absence. Loci are assigned alphabetically from A to J according to the clade on the
phylogenetic tree shown in Figure 2. The name of each locus is based on the whale species
from which the genomic library was constructed (BRY, Bryde’s; GRY, gray; Hump, humpback;
NM, common minke; Sei and IWA, sei; SEM, right; Sir, blue). The species are numbered as
follows: 1, humpback; 2, fin; 3, blue; 4, sei; 5, Bryde’s; 6, gray; 7, common minke; 8, Antarctic
minke; 9, pygmy right; 10, right; 11, bowhead; 12, sperm; 13, beaked; 14, bottlenose dolphin;
15, hippopotamus.
Figure 2. Evolution of baleen whales deduced from SINE insertion data
a) The consensus tree of baleen whales based on data for 36 SINE insertions. All loci mapped
onto the tree were newly isolated and characterized in the present study. Each clade is named
alphabetically, A to I. The multifurcation point (not a clade) is named J. The four major
lineages (I–IV) and radiation period are indicated.
b) Maximum-likelihood (ML) tree of the concatenated amino acid sequences of 12
mitochondrial proteins, which were recently reported by Sasaki et al. (2005). Numbers indicate
bootstrap probabilities (percent). Because the clade of common and Antarctic minke whales is
supported by 100% bootstrap values in the preliminary quartet-puzzling analysis, it was fixed
as a monophyletic group in this ML analysis (see Sasaki et al. 2005). Only the tree topology is
by guest on June 5, 2013http://m
be.oxfordjournals.org/D
ownloaded from
23
shown here (The branch length is not proportional to the estimated number of amino acid
substitutions.).
c) Four inconsistent topologies suggested by four independent SINE loci. Each locus
contradicts the others. The topology supported by the clade G is a consensus topology.
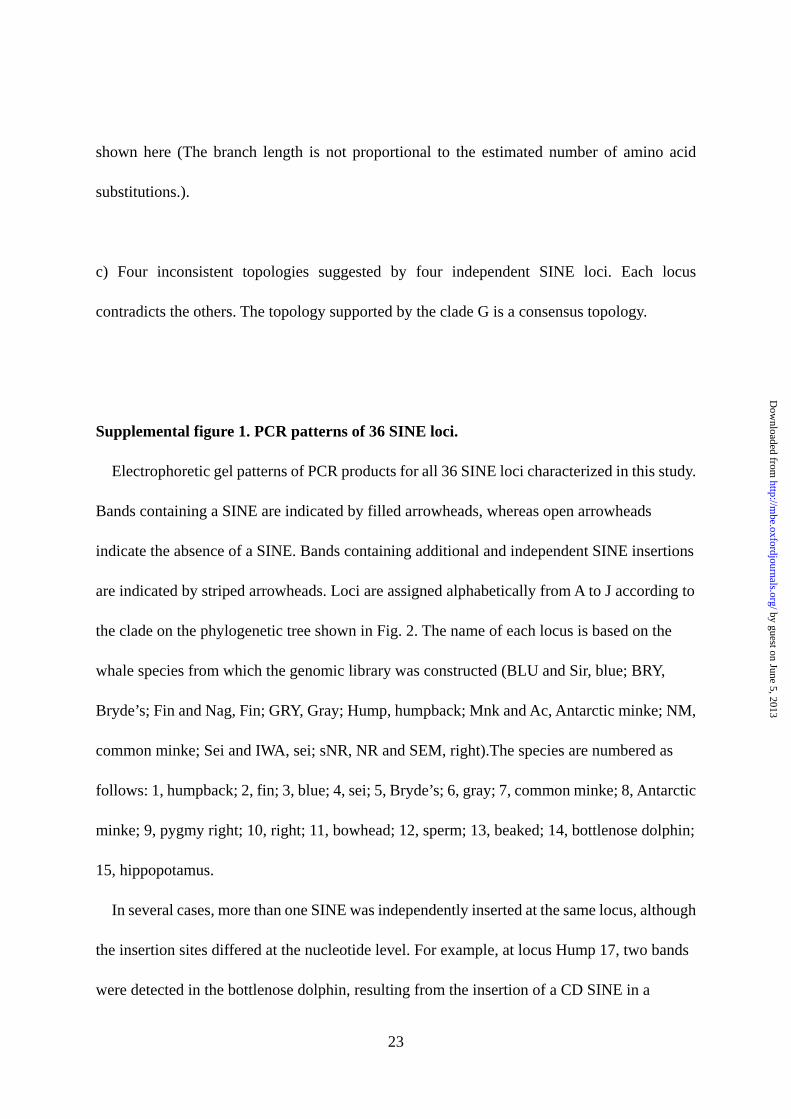
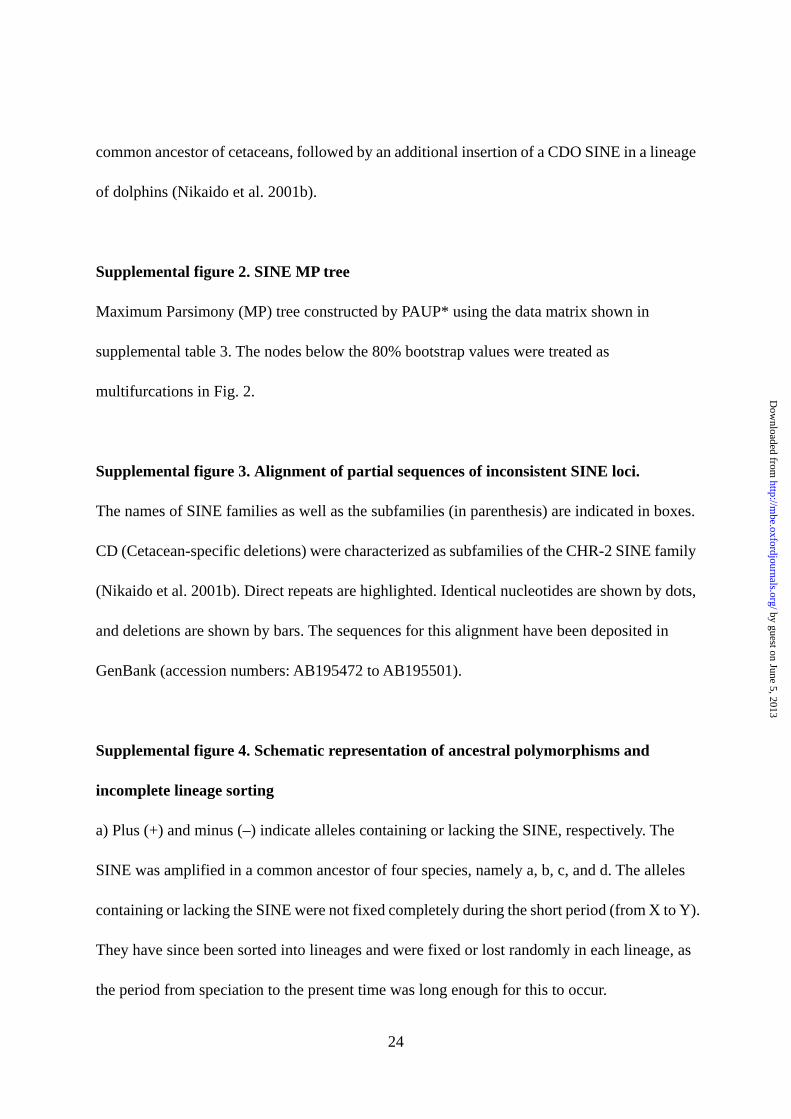
Supplemental figure 1. PCR patterns of 36 SINE loci.
Electrophoretic gel patterns of PCR products for all 36 SINE loci characterized in this study.
Bands containing a SINE are indicated by filled arrowheads, whereas open arrowheads
indicate the absence of a SINE. Bands containing additional and independent SINE insertions
are indicated by striped arrowheads. Loci are assigned alphabetically from A to J according to
the clade on the phylogenetic tree shown in Fig. 2. The name of each locus is based on the
whale species from which the genomic library was constructed (BLU and Sir, blue; BRY,
Bryde’s; Fin and Nag, Fin; GRY, Gray; Hump, humpback; Mnk and Ac, Antarctic minke; NM,
common minke; Sei and IWA, sei; sNR, NR and SEM, right).The species are numbered as
follows: 1, humpback; 2, fin; 3, blue; 4, sei; 5, Bryde’s; 6, gray; 7, common minke; 8, Antarctic
minke; 9, pygmy right; 10, right; 11, bowhead; 12, sperm; 13, beaked; 14, bottlenose dolphin;
15, hippopotamus.
In several cases, more than one SINE was independently inserted at the same locus, although
the insertion sites differed at the nucleotide level. For example, at locus Hump 17, two bands
were detected in the bottlenose dolphin, resulting from the insertion of a CD SINE in a
by guest on June 5, 2013http://m
be.oxfordjournals.org/D
ownloaded from
24
common ancestor of cetaceans, followed by an additional insertion of a CDO SINE in a lineage
of dolphins (Nikaido et al. 2001b).
Supplemental figure 2. SINE MP tree
Maximum Parsimony (MP) tree constructed by PAUP* using the data matrix shown in
supplemental table 3. The nodes below the 80% bootstrap values were treated as
multifurcations in Fig. 2.
Supplemental figure 3. Alignment of partial sequences of inconsistent SINE loci.
The names of SINE families as well as the subfamilies (in parenthesis) are indicated in boxes.
CD (Cetacean-specific deletions) were characterized as subfamilies of the CHR-2 SINE family
(Nikaido et al. 2001b). Direct repeats are highlighted. Identical nucleotides are shown by dots,
and deletions are shown by bars. The sequences for this alignment have been deposited in
GenBank (accession numbers: AB195472 to AB195501).
Supplemental figure 4. Schematic representation of ancestral polymorphisms and
incomplete lineage sorting
a) Plus (+) and minus (–) indicate alleles containing or lacking the SINE, respectively. The
SINE was amplified in a common ancestor of four species, namely a, b, c, and d. The alleles
containing or lacking the SINE were not fixed completely during the short period (from X to Y).
They have since been sorted into lineages and were fixed or lost randomly in each lineage, as
the period from speciation to the present time was long enough for this to occur.
by guest on June 5, 2013http://m
be.oxfordjournals.org/D
ownloaded from
25
b) Although the species tree is the one in which species a and b are sibling species, the gene tree
deduced from this locus shows species a and c as a monophyletic group.
Supplemental figure 5. Confirmation of SINE insertion by sequencing and aligning the
loci isolated in this study.
The middle region of the alignment was abbreviated using Xs. The numberings of the species
are followed by that of electrophoresis figure. Direct repeats were highlighted by box. The
sequences are not deposited in GenBank because these sequences have been determined just
roughly and contain many Ns.
Supplemental Table 1.
DNA samples used in this study. The location and the dates of sampling are shown in this table.
The samples of unknown location and/or dates are shown by ?.
Supplemental Table 2.
The primers used in this study.
Supplemental Table 3.
Data matrix showing the character states for the loci isolated in the present study. 0 = absence;
1 = presence; ? = missing. The descriptions of each locus and taxa analyzed in this study are
shown in the boxes.
by guest on June 5, 2013http://m
be.oxfordjournals.org/D
ownloaded from
A
1 2 3 4 5 6 7 8 9 10 11 1213M 14 15GRY 20
1 2 3 4 5 6 7 8 9 10 11 1213M 14 15Sir 49
D
1 2 3 4 5 6 7 8 9 10 11 1213M 14 15Sei 19
Figure 1 Nikaido et al.
1 2 3 4 5 6 7 8 9 10 11 1213M 14 15Hump 9
B
C
NM351 2 3 4 5 6 7 8 9 10 11 1213M 14 15
E
Hump 531 2 3 4 5 6 7 8 9 10 11 1213M 14 15
F
G
BRY241 2 3 4 5 6 7 8 9 10 11 1213M 14 15
H
Sei 351 2 3 4 5 6 7 8 9 10 11 1213M 14 15
I
SEM 41 2 3 4 5 6 7 8 9 10 11 1213M 14 15
Sei23
IWA31
BRY28
1 2 3 4 5 6 7 8 9 10 11 1213M 14 15
1 2 3 4 5 6 7 8 9 10 11 1213M 14 15
1 2 3 4 5 6 7 8 9 10 11 1213M 14 15J
by guest on June 5, 2013http://m
be.oxfordjournals.org/D
ownloaded from
Blue whale
Sei whale
Bryde’s whale
Sei 20Sei 35Sei 37
BRY 24Sei 26
Fin 9 Hump 46Hump 53
Fin whale
Humpback whale
E
North Atlantic minke whale
Antarctic minke whale
Ac 144Mnk 1NM 35
H
Right whale
BLU 47BRY 50Hump 9Hump 55Sei 8-2
Hump 38Mnk 55Sei 17Sei 19Sei 47
Pygmy right whale
BRY 82Fin 12Nag 41 Mnk 38Sir 49
Toothed whales
Gray whale
Bowhead whale
Hump 17Hump 49sNR 99SR 3GRY20
SEM 3SEM 15
Hippopotamus
Rapid radiation period
IWA31BRY28Sei23
A
B
C
D
F
G
I
J
Balaenopteridae
Eschrichtiidae
Neobalaenidae
I
II
III
IV
lineage
Figure 2 Nikaido et al.
29
97
100
51
96
97
100Balaenidae
SINE tree (this study) Mitochondrial tree (Sasaki et al. 2005)
a) b)
by guest on June 5, 2013http://m
be.oxfordjournals.org/D
ownloaded from
Blue
Sei
Bryde’s
Fin
Gray
IWA31
BRY28
Sei23
Blue
Sei
Bryde’s
GMinke
Figure 2 Nikaido et al.
c)
by guest on June 5, 2013http://m
be.oxfordjournals.org/D
ownloaded from


