Embed Size (px)
Citation preview

Journal of Environmental Science and Health Part B (2008) 43, 665–674Copyright C© Taylor & Francis Group, LLCISSN: 0360-1234 (Print); 1532-4109 (Online)DOI: 10.1080/03601230802388728
Spatial and temporal analysis of pesticides concentrations insurface water: Pesticides atlas
MARTINA G. VIJVER, MAARTEN VAN ‘T ZELFDE, WIL L.M. TAMIS, KEES J.M. MUSTERSand GEERT R. DE SNOO
Leiden University, Institute of Environmental Sciences (CML), Leiden, the Netherlands
Dutch water boards have a well-established program for monitoring pesticide contamination of surface waters. These monitoringdata have been processed into a graphic format accessible online and designed to provide insight into pesticide presence in Dutchsurface waters and trends over time: the Pesticides Atlas (www.pesticidesatlas.nl). With this tool one can easily get maps of where apesticide is being measured and where it might possibly constitute an environmental problem over the years. Presently, results of theperiods 1997/1998 until 2005/2006 are available at the level of individual active ingredients. At a national level, the percentage ofpesticides concentrations that exceed the maximum tolerable risk has declined 30% to 38% over the years 2003/2004 compared with1997/1998. This means that surface water quality in the Netherlands has improved with respect to pesticides, however there are stillmany locations at which the measured concentrations exceed the environmental quality standards. The results on linking land use topesticides concentrations were shown to assist in optimization of monitoring programs. By developing the present Internet tool, manynew opportunities for environmental risk assessment and risk management were identified, e.g. optimization of monitoring strategiesand communication to policymakers.
Keywords: Pesticides; monitoring; surface waters; geographic presentation; internet tool.
Introduction
The inappropriate use of pesticides is causing world-widepollution. In addition, the pollution of aquatic environ-ment, is becoming more complex as more pesticides areused.[1,2] Pesticide pollution usually comes as a result of thelegitimate application of pesticides by farmers and not justthrough illegal use or accidents.[2,3] However, pesticide use isnot only confined to agriculture. These substances are alsoused on roads and rail tracks, in homes and in gardens.[4]
They are used as anti-fouling paints on ships and boats,[5]
timber treatments and surface biocides and against humandisease vectors such as mosquitoes. Pesticides enter in thesurface waters with several ways. Pesticides may be washedinto ditches and rivers by rainfall;[6,7] surface waters can becontaminated by sprays either intentionally (e.g. in orderto control water weeds) or unintentionally, (i.e. when cropsare sprayed near ditches[8,9] or via runoff and leaching from
Address correspondence to Dr. Martina G Vijver, Leiden Uni-versity, Institute of Environmental Sciences (CML), P.O. Box9518, 2300 RA, Leiden, the Netherlands; E-mail: [email protected] paper was presented at the CEMEPE conference held onJune 24–28, 2007 at the Skiathos Island, Greece.Received May 15, 2008.
agricultural fields.[10]) Pesticides that are sprayed on hardsurfaces such as pavements are subject to particularly highrunoff into drainage pipes and sewers.
In most countries, national and regional water authori-ties monitor pesticides concentrations in surface waters fre-quently. These monitoring programs are a tool in policymaking, either to keep track of the effectiveness of environ-mental, water, or pollution policies (e.g European UnionWater Framework Directive[11]) or as surveillances indicat-ing where actions should be taken such as clean up actionsof locations, restriction of use of certain pesticides in specificareas or re-evaluation of the standards of active ingredients.Also in the Netherlands these surveillances of the surfacewaters is done under different monitoring programs. Theresults of these programs, however, are amalgamated andreported periodically by different stakeholders. Due to thelack of transparency of monitoring data, optimal use ofthese data was difficult especially at a national level.
Moreover, the traditional (tabular) presentation of themonitoring results is difficult to interpret and geographicpresentation of individual pesticide concentrations in theform of maps has several advantages.[12] Against this back-ground, Leiden University Institute of Environmental Sci-ences (CML) initiated with solid support of an array ofother organizations a study to assess the potential for pre-senting such maps in the form of a Pesticides Atlas of the
666 Vijver et al.
Netherlands at the Internet.[13] The Pesticides Atlas aims toprovide an insight into pesticide contamination of Dutchsurface waters and to investigate: (i) where a pesticide isbeing measured and when it exceed an environmental stan-dard, (ii) whether pesticides concentrations changes overtime, (iii) whether it is possible to link pesticide concen-trations with land use data and (iv) how to improve theregional monitoring systems.
The Internet tool makes information available at the levelof active ingredients.[14] Active ingredients are in this paperfurther described as pesticides. Additionally, the tool pro-vides an executive summary of the main results of activeingredients that is especially made for management goals.These summaries include total number of measurements,results of groups of pesticides classified by mode of actionof pesticides, top ten lists of the most polluting categories ofland use and trend-analyses of pesticide-related problemsover time. The Pesticides Atlas is not only interesting for sci-entists, but has also been implemented as a tool that is rel-evant for society. It is an Internet tool that is publicly avail-able and free accessible at http://www.pesticidesatlas.nl.In this paper we will focus on the results of the monitoringfollowing the four main goals of the Pesticides Atlas.
Material and methods
Processing and aggregation of monitoring data
Pesticides monitoring data for the periods 1997–2006 werederived from databases owned and administered by the 28Water Boards in the Netherlands with prior checks beingmade on data quality and quantity. Criteria checks wereamong other things verification of CAS-numbers and pes-ticides identification, a check on x-y coordinates, a checkon detection limits, aggregation of time series in reportedmonitoring data, the exclusion of extreme values by us-ing an outliers check. The raw monitoring data are ini-tially processed and aggregated in a stepwise procedure.Spatial aggregation is carried out at the level of: one byone or five by five kilometer-grid cells. Temporal aggre-gation is carried out firstly over annual periods followedby two-years periods.[14] Environmental quality standardsused to compare the pesticides concentrations are the Eu-ropean drinking water standard, the Maximum TolerableRisk (MTR) and the pesticide authorization standard ap-plied by the Dutch Board for the Authorization of PlantProtection Products and Biocides (CTGB). The drinkingwater standard has been set at 0.1 µg/L for almost all indi-vidual pesticides. The limit for the sum of pesticides accord-ing to the drinking water standard is 0.5 µg/L. MTR andCTGB criteria are pesticide-specific and vary, dependingon the ecotoxicity of the pesticide. In the case of the MTRand CTGB standard, monitoring data are aggregated bycalculating the 90% percentile. In the case of the drink-ing water standard, data are aggregated in the form of the
maximum-recorded value. The percentage of pesticides ex-ceeding environmental quality standards has been calcu-lated by dividing, for each 5 × 5 km grid cell, the number ofsubstances exceeding the standard by the number of sub-stances assessed. A substance is regarded as exceeding thestandard if the 90th percentile of the measurements exceedsthe standard.
Within the aggregation, measurements either “below” or“above or equal to” the quantitation limit (LOQ) are pro-ceeded parallel to each other. When comparing aggregatevalues with standards, the following three situations maytherefore arise[14]:
(i) when there is just one aggregate value and it is above orequal to the LOQ, then this is the only value available.In this case we have an assessable value, which may ormay not exceed the standard.
(ii) when there is just one aggregate value and it is belowthe LOQ, again this is the only value available. Oneof two situations may then arise: a) when the value isbelow or equal to the standard, we have an assessablevalue that does not exceed the standard in question,b) when the value is above the standard, we have anon-assessable value, as there is no way of establishingwhether or not the actual, unknown value does indeedexceed the standard.
(iii) When there are two aggregate values, one below theLOQ, the other above or equal to it, there are threealternatives: a) when the value above or equal to theLOQ exceeds the standard, only this value is used:we then have an assessable value that exceeds the stan-dard, b) when both values are below or equal to thestandard, we have assessable values that do not exceedthe standard, c) when the value above or equal to theLOQ is less than or equal to the standard and the ag-gregated value below the LOQ exceeds that standard,we have a non-assessable value, as there is no way ofestablishing whether or not the actual, unknown valueindeed exceeds the standard.
For the calculation of different products on environmen-tal target exceeding a minimum of five to fifteen measure-ments, depending on the kind of product, are used in or-der to exclude incidental measurements from the nationaloverviews.
Mapping monitoring data
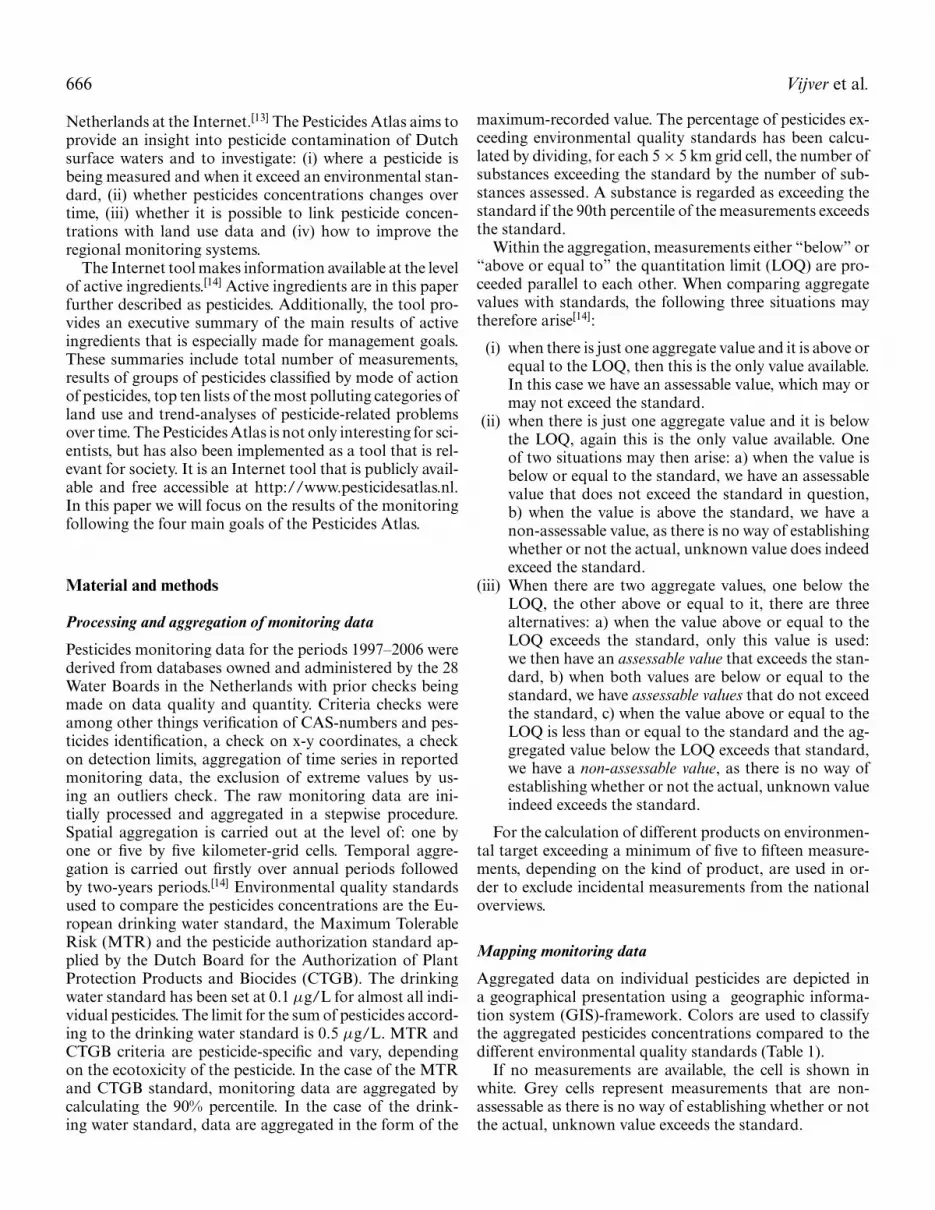
Aggregated data on individual pesticides are depicted ina geographical presentation using a geographic informa-tion system (GIS)-framework. Colors are used to classifythe aggregated pesticides concentrations compared to thedifferent environmental quality standards (Table 1).
If no measurements are available, the cell is shown inwhite. Grey cells represent measurements that are non-assessable as there is no way of establishing whether or notthe actual, unknown value exceeds the standard.

Pesticides concentration in surface water 667
Table 1. Overview of classes to compare concentrations with en-vironmental standards.
Color DW classes CTGB classes MTR classes
blue <DW <0.01 <NRgreen — >0.01, <CTGB NR >, <MTRyellow <10x DW >CTGB >MTRorange — >2x CTGB >2x MTRred >10x DW >5x CTGB >5x MTR
DW = Drinking water criteria; CTGB = Authorization criteria; MTR= maximum tolerable risk, NR = negligible risk both having an ecotox-icological basis.
Note that most figures contain a version date of Septem-ber 2006 on the picture; this is the date at which thedatabase with measurements was updated. Frequently re-sults of the pesticides monitoring are updated at the Inter-net. For the most recent information, go to http://www.pesticidesatlas.nl.[13]
Trend analyses
Trend analyses were performed to get insight into changesof environmental quality of surface waters with respect topesticides concentrations over time. The analyses over timewere depicted both using geographical visualization and us-ing a trend line graph. To compile these maps, for each 5 ×5 km Atlas cell the value of the numerical category forthe selected period is deducted from that for the referenceperiod 1997/1998. If the result is negative, this means thatthere has been increased exceeding of the standard in thecell in question and thus the situation has deteriorated. Ifthe result is zero, the situation has remained the same, andif it is positive, the situation has improved. The results arethen assigned colors for use on the maps: red, orange oryellow for a decline in quality, green for an improvementand blue for unchanged. If, for a given 5 × 5 km cell, thereis no measurement available in one of the two periods orif the measurement is non-assessable in one or both ofthe periods, the cell is colored grey. If no measurementsare available for either of the periods, the 5 × 5 km cell iscolored white. The advantage of this method is that it issimple, in line with the idea of an atlas—involving a literalcomparison between map codings—and likely to be ratherinsensitive to outliers in the monitoring data. A drawbackis that it will also be insensitive to any major changes oc-curring within an individual numerical category. Thus, if aparticular compound changes from exceeding the MTR bya factor 100 to exceeding it by a factor 10 in a given cell, forexample, the cell would still be marked on the map as “un-changed”, as both values are in the category “> 5x MTR”.
When measurements of the pesticides were made in everyperiod, trend analyses was done on the actual (aggregated)data. In case of missing values in the monitoring over theyears, data were imputed using TRIM software.[15] The rea-son to use an imputing technique is because missing data
are not randomly distributed over space and time; ratherfull regional or whole monitoring periods are missing. Forthese missing values, the anticipated value is then ‘imputed’.A number of basic assumptions were involved: (a) The dif-ferences between periods are the same in all cells, (b) Theonly cells that could be assigned to a category other than‘no data‘ or ‘non-assessable‘ in at least one period, c) Onlypesticides having, in all periods, at least one cell with animputed value greater than 0 or exceeding of the standard,d) Only pesticides for which fewer than 50% of cells havea missing value. In the data presentation, trends in whichmissing values have been imputed can be recognized by thefact that the trend is then indexed, with the average valuefor the reference period 1997/1998 being set at 100 andchanges expressed relative to that period.
Comparing monitoring data with land use data
Observed concentrations of the pesticides were analyzedfor correlation with acreages of dominant crops in TheNetherlands (statistically analyzed at the 1 × 1 km baseusing a non-parametric Spearman test). In this atlas we areconcerned solely with cases that give an indication of thepossible causes of high pesticide levels, i.e. in the positivecorrelations. Significant correlations are those that have aP-value <0.05. Twenty-four major crop types were distin-guished based on two national sources; the national landuse database[16] largely based on satellite images and a dig-itized database of landscape ecological characteristics.[17]
To establish the relations between exceeding of qualitystandards and crop acreage, all assessable measurementswere statistically analyzed (non-parametric Mann-WhitneyU-test). If there are significantly larger areas devoted to aparticular type of land use in cells where standards are ex-ceeded, the pesticide is deemed to be ‘in exceeding’ for thatcategory of land use. The final step is to count, for eachland use category, how many pesticides exceed limits.
Results and discussion
The number of active ingredients and the number of lo-cations where measurements have being carried out overthe periods of 1997 to 2006 are shown in Table 2. Fromthis table it is clear that for every period data of about
Table 2. Overview of the amount of pesticides data in the database.
Number ofactive ingredients# Number of locations
1997/1998 199 5121999/2000 187 7172001/2002 216 7812003/2004 290 8772005/2006 442 891
#active ingredients and relevant metabolites.

668 Vijver et al.
200 active ingredients (and metabolites) are available. Thenumber of measurement locations has been increased overtime. Of all active ingredients the number of measurementsvaries strongly. Totally for every 2-year period there areabout 150,000 measurements available. The geographicalvariation in the number of pesticides measured through theNetherlands varies.
Fig. 1. Percentage of locations with pesticides concentrations exceeding an environmental standard during the year (2003/2004):Upper graph: European drinking water standard (0.1 µg/L), lower graph: authorization standard.
Pesticide monitoring data and environmental standards
The percentage of locations at which pesticides concentra-tions exceed the European drinking water standard over thedifferent months in a year, is given in Fig. 1 (upper graph).The results show that at 28–62% of the locations, levels ex-ceeding of drinking water criteria can be found over the

Pesticides concentration in surface water 669
Fig. 2. Left side: Percentage of pesticides exceeding the European Union (EU) drinking water standard during the period 2003/2004.Right side: Percentage of pesticides exceeding the maximum tolerable risk (MTR) during the period 2003/2004. Figures were madeon a 5 × 5 km grid scale.
different months of the monitoring period 2003/2004. Thehighest percentage of locations that exceed the drinking wa-ter criteria can be detected in the months May and June.This period is the growing season for many different cropsand therefore a large pesticides use can be expected. It is re-markable that pesticide concentrations were also above thisstandard during the winter period, because during winterpesticides are hardly used.
The percentage of locations where the pesticide autho-rization standard (CTGB) is exceeded is much lower (rightgraph, Fig. 1), between 5 and 14%. The highest percentageof locations that exceed the authorization standard occur inMay and December. The differences between the numbersof pesticides concentrations exceeding the drinking waterstandard and these exceeding authorization standard canbe explained by the differences in values of the quality tar-gets. Moreover—to a minor extent—not all pesticides thatexceed the EU-drinking water standard have an authoriza-tion standard.
The percentage of pesticides in the Netherlands that ex-ceed the European drinking water standard (0.1µg/L) andMTR over the periods 2003/2004 is also presented in ageographical way (Fig. 2).
Many sites can be found that have at least 10% of thepesticides measured exceeding a target value. Regional dif-
ferences are obviously seen from these figures. Especially inthe western part of the country many pesticides concentra-tions exceed the standards. With this geographical presen-tation, the overall environmental quality of surface watercan be evaluated.
Interpretation of the results at the regional scale is alsopossible by means of zooming at a certain area (not shownin this paper). With this facility, additional layers of land-scape ecological characteristics, boundaries of water bodybasins and water discharge areas can be evoked.
Changes in pesticide concentrations over time
Changes in the percentage of pesticides exceeding the MTRstandard have been calculated by subtracting the percent-age of substances exceeding the standard in the referenceperiod (1997/1998) from the corresponding percentage inthe period 2003/2004 (Fig. 3). Percentages are regarded asunchanged if they differ by less than 5% between the twoperiods. From Fig. 3 locations can be identified where thequality has improved or is deteriorated.
The results show that especially in the northern and west-ern part of the country water quality regarding pesticidesconcentrations has improved. In the southern part of thecountry increased percentages of exceeding pesticides were

670 Vijver et al.
Fig. 3. Differences in the percentage of locations exceeding the maximum tolerable risk (MTR)-value between 2003/2004 period and1997/1998 period.
observed, meaning that the quality has deteriorated. At themoment for many locations evaluation of the trend was notpossible (grey cells in Fig. 3).
The same data can be used to calculated the average nu-merical category of the percentage of substances that exceedthe MTR value per 5 × 5 km cell. Here the overall changein pesticides exceeding at a national scale is indexed to the
average value in the reference period 1997/1998 that is setto 100 (Fig. 4).
As can be seen, the percentage of pesticides found inthe Dutch surface waters has decreased approximatelyby 30–38% (Fig. 4) meaning that the overall surface wa-ter quality regarding pesticides improved between the pe-riod 2003/2004 and 1997/1998 at national scale. Not that

Pesticides concentration in surface water 671
Fig. 4. Trend analyses of the percentage of pesticides exceeding the maximum tolerable risk (MTR). The accuracy of the calculationsis indicated as the standard error: the smaller the error, the more accurate the calculation.
although the water quality with respect to pesticides im-proved, there are still many locations at which the MTR isexceeded (Fig. 2).
A list of most serious problem pesticides exceeding theMTR was calculated based on a weighted approach. Theweighted number takes into account the level of exceed-ing per 1 × 1 km grid cell and the number of 1 × 1 kmgrid cells in which the substance has been assessed. Thelevel of exceeding was divided into classes for purpose ofthe calculation. Substances that have been assessed in fewerthan ten 1 × 1 km grid cells were omitted. The pesticidesgiving problem in the Netherlands in the period 2003/2004were in descending order: (1) imidacloprid, (2) fenamiphos,(3) pyrimiphos-methyl, (4) aldicarbsulfoxide, (5) dithianon,(6) pyridaben. Every two years a new list can be calculatedbased on the surveillance data of that period. When pesti-cides seriously exceed limits over the years, measures can betaken for e.g. the effectiveness of policies activities such asbanning of certain pesticides, replacement of certain pesti-cides or restricted uses and application techniques. A spe-cific example is the Dutch Plant Protection policy[18] whichis aimed at reaching sustainable agriculture in the Nether-lands. Operational goals with respect to the environmentbased on MTR exceedings are given in this policy docu-ment. Bottlenecks in the achievement of goals can be iden-tified using the information of the Pesticides Atlas.
Optimizing monitoring effort
One of the aims of the Pesticides Atlas is to assist in build-ing an optimal monitoring program. The costs of gather-ing pesticides concentrations in the various surface waters
(think of sampling and analytical costs but also concerningdata interpretation) are very high. Yet many Dutch WaterBoards can improve their programs by investigating whichpesticides are allowed to be used in their areas and in thestream areas that are connected to their districts. The neces-sity of this is illustrated by measurement data on metribuzinfor the period 1999/2000 (Fig. 5, left side) next to land usedata from potato fields (Fig. 5, right side). The pesticidemetribuzin is used almost exclusively on potatoes. Obvi-ously monitoring in the south-east part of the country canbe discussed. In contrast, in the polders in the middle of thecountry, many potato fields can be found, however thereare no measurements of this pesticide in this area (see thearrows in the Fig. 5) because Water Boards did not includemetribuzin in their surveillance programs.
In the Atlas, statistical correlations have been computedbetween surface water pesticide concentrations on the onehand and the areas devoted to types of land use (generallytypes of crop) on the other. Statistical relationships thatare scientifically sound could be derived for 249 combi-nations of active ingredients and land use. By knowingthis correlation, the expected pesticides to be used in anarea can be calculated based on the presence of a certainland-use type and compared to the actual measured activeingredients (Fig. 6).
It appears that at most locations in the Netherlands a lowpercentage of the expected pesticides is included in moni-toring programs. Actually, nowhere is this exceeding 75%and the percentage of measured pesticides varies largelyamong regions. In the western part of the country, moni-toring programs are adjusted to expected pesticides com-pared to other regions. In the eastern part of the country,

672 Vijver et al.
Fig. 5. Example on measurements performed on metribuzin, a pesticide allowed to be used only in potatoes growing. On the left side:measurements on metribuzin, on the right side: potato cultivation in the Netherlands.
monitoring programs cover only 3–25% of the expected pes-ticides. In general in the whole country, monitoring pro-grams can be improved substantially by adjusting the listof included pesticides to the calculated expected pesticidesbased on local land use.
Correlations used for environmental riskassessment purposes
Another use of the correlations based on exceedings is tofind out in which type of land use the largest amount &levels exceeding of environmental quality standards are cal-culated. For instance the most problematic pesticide of theperiod 2003/2004 was imidacloprid, for which levels havestrong significant (P-value <0.001) relationship with green-house, floriculture and potatoes growing. For fenamiphosand pyridaben the contribution of land use categories tothe exceedance of the MTR could not be calculated due toinsufficient monitoring data. Levels of pirimiphos-methylconcentrations to the MTR could be correlated significantlyto greenhouse and floriculture (P-value <0.001). MTR ex-ceedings of aldicarbsulfoxide could be correlated to grow-ing cabbage (P-value >0.01 and <0.05). The exceedings ofdithianon could not be correlated to a specific land use cate-gory. From these examples it is shown that, the correlationsmay assist in prioritizing effective policy measures to dimin-ish emission of problematic pesticides by actions such as
restricted use of substances in certain crops or stimulationof technical developments in those agricultural businesses.
The pros and cons of using measurements
Measuring pesticides concentrations in surface waters istime-consuming and rather expensive. Another disadvan-tage is that not all pesticides that exist can be covered in thesurveillance programs. Inherent to the use of surveillancedata is the fact that detailed spatial and temporal informa-tion is lost. As a result the exact distance to the crop ofthe surface water sample can only be estimated. Also theapplication time compared to the time of sampling is un-known. To partially overcome these disadvantages and tomake it possible to work with surveillance data, statisticaltechniques such as data aggregation and impute of missingdata as described above are used in order to make gen-eral interpretations. Obviously not all disadvantages canbe dealt with. Nevertheless, the advantages of the use ofmonitoring data are substantial since actual detected con-centrations are being used. These result from all emissions,including these from illegal use, from pesticides used in non-agricultural practices and from pesticides from neighbor-ing countries. Furthermore, surveillance data provide anactual view of a specific moment in time. These concentra-tions reflect the state of affairs in the dynamic agriculturalbusiness which can hardly be incorporated in models that

Pesticides concentration in surface water 673
Fig. 6. Measuring map of pesticides potentially present according to land use.
predict pesticides concentrations. Agricultural business re-act differently each year, e.g. due to weather changes thathave impact on crop diseases and subsequently the specificpesticides that need to be used to control these diseases,change and progression in the different application tech-niques and annually rotating crops. Therefore it is possi-ble to monitor the actual field situation, in this case the
pesticides concentrations in the surface waters. Since thePesticides Atlas is easy to use and freely available, com-munication can be stimulated. This can result in the opti-mization of a cost-effective monitoring program. It is alsogiving risk assessors a powerful decision-making tool forprioritizing of problem areas, problem crops, or prob-lematic active ingredients. Future perspective is that the

674 Vijver et al.
Pesticides Atlas enables environmental policies to be com-pared across different areas and different water managers,so-called benchmarking.
Conclusions
The unique way of mapping pesticides concentrations asdone in the Pesticides Atlas allows for transparent commu-nication to a broad user group such as national and localwater managers. With the actual tool available on the In-ternet, a wide range of actors such as policy makers, regu-lators, farmers, chemical industry, food industry and non-governmental organizations can have a good visual impres-sion of the geographic spread of pesticide concentrations insurface water in the Netherlands. The pesticides maps giverelevant information about where and when a pesticide ismeasured, found and where it is exceeding an environmen-tal standard. Based on this type of information not onlymonitoring systems of water authorities can be improved(measurements at relevant sites etc.), but the Pesticides At-las might also be used for evaluating environmental policyover time as well. At the national scale, surface water qual-ity in the Netherlands has been improved by approximately30–38%. Hence, the surface water quality can differ overthe regions which are obviously seen in the geographicalrepresentation of the results. Since it is shown that in manycases pesticides concentrations and exceedings of an envi-ronmental standard can be statistically linked with land usedata, the maps can also be used in the registration process,and decision making for land use planning.
Acknowledgment
We thank Dennis Kalf (Waterdienst) and his colleagues fortheir assistance in the development of the Pesticides Atlas.We thank Roel Knoben and his colleagues (Royal Haskon-ing) for hosting and designing our Internet tool. We thankTon van der Linden, National Institute for Public Healthand the Environment (RIVM), for his comment on themanuscript and the three anonymous reviewers.
References
[1] Stoate, C.; Boatman, N.D.; Borralho, R.J.; Rio Carvalho, C.; DeSnoo, G.R.; Eden, P. Ecological impacts of arable intensification inEurope. Journal of Environ Manag. 2001, 63, 337–365.
[2] De Snoo, G.R.; De Jong, F.M.W. Eds. Bestrijdingsmiddelen en milieu;Uitgeverij Jan van Arkel: Utrecht. 1999, 1–184 (in Dutch).
[3] De Snoo, G.R. Variation in agricultural practice and environmen-tal care. In Pesticides: Problems, Improvements, Alternatives; DenHond, F. Groenewegen., P. Van Straalen, N.M., Eds.; SustainablePest Manag. Series Blackwell Science: Oxford, UK, 2003, 100–112.
[4] Kempenaar, C.; Spijker, J.H. Weed control on hard surfaces in theNetherlands. Pest Manag Sci. 2004, 60, 595–599.
[5] Konstantinou, I.K.; Albanis, T.A. Worldwide occurrence and effectsof antifouling paint booster biocides in the aquatic environment: areview. Env. Intern, 2004, 235–248.
[6] Van Dijk, H.F.G.; Van Pul, W.A.J.; De Voogt P., Eds. Fate of Pes-ticides in the Atmosphere. Implications for environmental risk as-sessment. Kluwer Academic Publishers: Amsterdam, Netherlands,1999, 1–276.
[7] De Jong, F.M.W.; Van der Voet, E.; Canters, K.J. Possible side-effects of airborne pesticides on fungi and vascular plants in theNetherlands. Ecotox. Environ. Saf. 1995, 30, 77–83.
[8] De Snoo, G.R.; De Wit, P.J. Buffer zones for reducing pesticide driftto ditches and risks to aquatic organisms. Ecotox. Environ. Saf.1998, 41, 112–118.
[9] Snoo, G.R. De Wit, P.J. Pesticide drift from knapsack sprayersto ditches and ditch banks. Proc. Brighton Crop Protection Con-ferencec Weeds, Brighton, UK, November 22–25, 1993, 2, 879–884.
[10] De Snoo, G.R.; Wegener Sleeswijk, A. Use of pesticides along ditchbanks and field margins. Med. Fac. Landbouww. Univ. Gent. 1993,58, 921–926.
[11] European Union. Directive 2000/60/EC of the European parlia-ment and of the council of October 23, 2000 establishing a frame-work for Community action in the field of water policy.
[12] Van’t Zelfde, M.; De Snoo, G.R. Atlas of pesticide concentrations inDutch surface waters: A pilot study. Comm. Appl. Biol. Sci. GhentUniversity 2003, 68, 727–737.
[13] De Snoo, G.R.; Tamis, W.L.M.; Vijver, M.G.; Musters, C.J.M.; Van’tZelfde, M. Risk mapping of pesticides: the Dutch atlas of pesticideconcentrations in surface waters; www.pesticidesatlas.nl. Comm.Appl. Biol. Sci. Ghent University. 2006, 71, 49–58.
[14] TRIM software. Netherlands Statistics, CBS http://www.cbs.nl[15] Landelijk grondgebruiksbestand Nederland (LGN-1). Wageningen
Universiteit: Wageningen, the Netherlands. (In Dutch). 1986.[16] Bolsius, E.C.A. Een digital bestand voor de lanschapsecologie van
Nederland: eindrapport van het LKN-project. Rijksplanologische di-enst: The Hague, the Netherlands. (In Dutch). 1990.
[17] Van der Linden, A.M.A.; Van Beelen, P.; Van den Berg, G.A.; DeBoer, M.; Van der Gaag, D.J.; Groenwold, J.G.; Huijsmans, J.F.M.;Kalf, D.F.; De Kool, S.A.M.; Kruijne, R.; Merkelbach, R.C.M.; DeSnoo, G.R.; Vijftigschild, R.A.N.; Vijver, M.G.; Van der Wal, A.J.Midterm evaluation of the plant protection policy of the Nether-lands; Environment 2006. RIVM-report. http://www.rivm.nl
[18] Institute of Environmental Science (CML), University Leiden.Available at www.pesticidesatlas.nl, Pesticide Atlas, downloaddatabase version 12 March 2008. This Internet tool is financed byDictoraat Generaal Water, Ministry of VenW in cooperation withthe Ministries of LNV, VROM and UvW and CTgB.