Embed Size (px)
Citation preview
arX
iv:0
806.
3640
v1 [
astr
o-ph
] 23
Jun
200
8Astronomy & Astrophysicsmanuscript no. 0002 c© ESO 2014January 13, 2014
Spectroscopic and photometric variability ofthe O9.5 Vp star HD 93521⋆
G. Rauw1,⋆⋆, M. De Becker1,⋆⋆⋆, H. van Winckel2, C. Aerts2, P. Eenens3,K. Lefever2, B. Vandenbussche2, N. Linder1, Y. Naze1,⋆⋆⋆, and E. Gosset1,⋆⋆
1 Institut d’Astrophysique et de Geophysique, Universitede Liege, Allee du 6 Aout, Bat B5c, 4000 Liege, Belgium2 Instituut voor Sterrenkunde, K.U. Leuven, Celestijnenlaan 200D, 3001 Leuven, Belgium3 Departamento de Astronomıa, Universidad de Guanajuato, Apartado 144, 36000 Guanajuato, GTO, Mexico
Received date/ Accepted date
ABSTRACT
Aims. The line profile variability and photometric variability ofthe O9.5 Vp star HD 93521 are examined in order to establish theproperties of the non-radial pulsations in this star.Methods. Fourier techniques are used to characterize the modulations of the Hei λλ5876, 6678 and Hα lines in several spectroscopictime series and to search for variations in a photometric time series.Results. Our spectroscopic data confirm the existence of two periods of 1.75 and 2.89 hr. The line profiles, especially those affectedby emission wings, exhibit also modulations on longer time scales, but these are epoch-dependent and change from line toline. Unlikeprevious claims, we find no unambiguous signature of the rotational period in our data, nor of a third pulsation period (correspondingto a frequency of 2.66 d−1).Conclusions. HD 93521 very likely exhibits non-radial pulsations with periods of 1.75 and 2.89 hr withl ≃ 8 ± 1 andl ≃ 4 ± 1respectively. No significant signal is found in the first harmonics of these two periods. The 2.89 hr mode is seen at all epochs and inall lines investigated, while the visibility of the 1.75 hr mode is clearly epoch dependent. Whilst light variations aredetected, theirconnection to these periodicities is not straightforward.
Key words. Stars: early-type – Stars: individual: HD 93521 – Stars: oscillations – Stars: variables: other – Stars: fundamental param-eters
1. Introduction
Time resolved spectroscopy of O-type stars has shown thatabsorption line profile variability at the level of a few per centis a common feature (e.g. Fullerton et al. 1996). Various mech-anisms, including magnetic fields, stochastic structures at thebase of the wind and non-radial pulsations have been proposedto explain this variability. Despite their rather subtle signature,the diagnostic potential of these phenomena is considerable.Especially in the case of non-radial pulsations, the emergingdiscipline of asteroseismology offers the possibility to gaininsight into the interiors of early-type stars. However, tocharac-terize the nature of the phenomenon requires a rather long andwell sampled time series of spectra with a high resolution and ahigh S/N (see e.g. Aerts et al. 2004 for the case of theβCepheivariableνEri). Up to now, such detailed studies have thereforebeen restricted to a few, rather bright and well-known O-starssuch asζ Pup (Baade et al. 1991) andζOph (Kambe et al. 1997).
In this context, the high Galactic latitude O-star HD 93521(lII = 183.14◦, bII = 62.15◦) is an extremely interesting target.
Send offprint requests to: G. Rauw⋆ Based on observations collected at the Observatoire de Haute
Provence (France), the Flemish 1.2 m Mercator telescope at the Roquede los Muchachos observatory (La Palma, Spain) and the ObservatorioAstronomico Nacional of San Pedro Martir (Mexico).⋆⋆ Research Associate FRS-FNRS (Belgium)⋆⋆⋆ Postdoctoral Researcher FRS-FNRS (Belgium)Correspondence to: [email protected]
Based on optical spectroscopy, Fullerton et al. (1991) andHowarth & Reid (1993) found HD 93521 to exhibit bumps atthe 1% level moving from blue to red across the profiles of theHei lines, whilst no variability was detected in the Heii lines.Fullerton et al. (1991) as well as Howarth & Reid (1993) accord-ingly interpreted these features as the signature of non-radialpulsations with a period of 1.8 hours. The Hei – Heii dichotomywas interpreted as arising from the substantial gravity darkeningthat favours Hei line formation near the cooler equatorial regionswhere the pulsational amplitude attains a maximum (Townsend1997). The existence of non-radial pulsations was subsequentlyconfirmed by Howarth et al. (1998) usingIUE spectra and threedifferent periods were identified. Recently, Rzaev & Panchuk(2006) reported on the existence of slightly different variabilitypatterns between the strong and weak Hei lines. However, sincethe Rzaev & Panchuk (2006) data set covered only 2.7 hours,it yields hardly any constraint on the properties of the pulsations.
HD 93521 has one of the largest rotational velocities knownamong O-stars (341 km s−1, Penny 1996; 432 km s−1, Howarth etal. 1997; 390 km s−1, see below in this paper). The stellar windhas an apparently low terminal velocity and is likely heavily dis-torted by rotation (e.g. Bjorkman et al. 1994). In the optical, thewind produces emission features in the wings of the Hα line, al-though this line has so far never been reported as a pure emissionfeature.
While the optical spectrum of HD 93521 leads to an O9.5 Vclassification, the nature of this star has been subject to debateover many years. In fact, assuming a typical absolute magnitude
2 G. Rauw et al.: Spectroscopic and photometric variabilityofthe O9.5 Vp star HD 93521
Table 1. Summary of our observing runs (see text for the meaning of thedifferent columns). The green and red wavelength rangesstand respectively for 5500 – 5920 and 6530 – 6710 Å, whilst SPM stands for the echelle spectra taken at San Pedro Martir. The lastcolumn yields the mean signal-to-noise ratio of the spectragathered during the corresponding campaign. The last line refers to thephotometric monitoring campaign that took place in coordination with the April 2005 spectroscopic campaign.
Epoch Domain ∆T (days) N ∆t (days) ∆ νnat (d−1) νmax (d−1) S/NFebruary 1997 red 4.155 35 2.49× 10⁻² 0.241 20.1 165April 2005 red 3.809 55 1.72× 10⁻² 0.263 29.1 280April 2005 SPM 5.096 90 0.84× 10⁻² 0.196 59.6 250February 2006 green 6.173 75 1.60× 10⁻² 0.162 31.3 650April 2006 green 0.180 13 1.49× 10⁻² 5.55 33.5 580April 2007 green 6.191 56 1.46× 10⁻² 0.162 34.2 550April 2005 U B B1 B2 V V1 G 28.221 378 0.31× 10⁻² 0.035 161.3
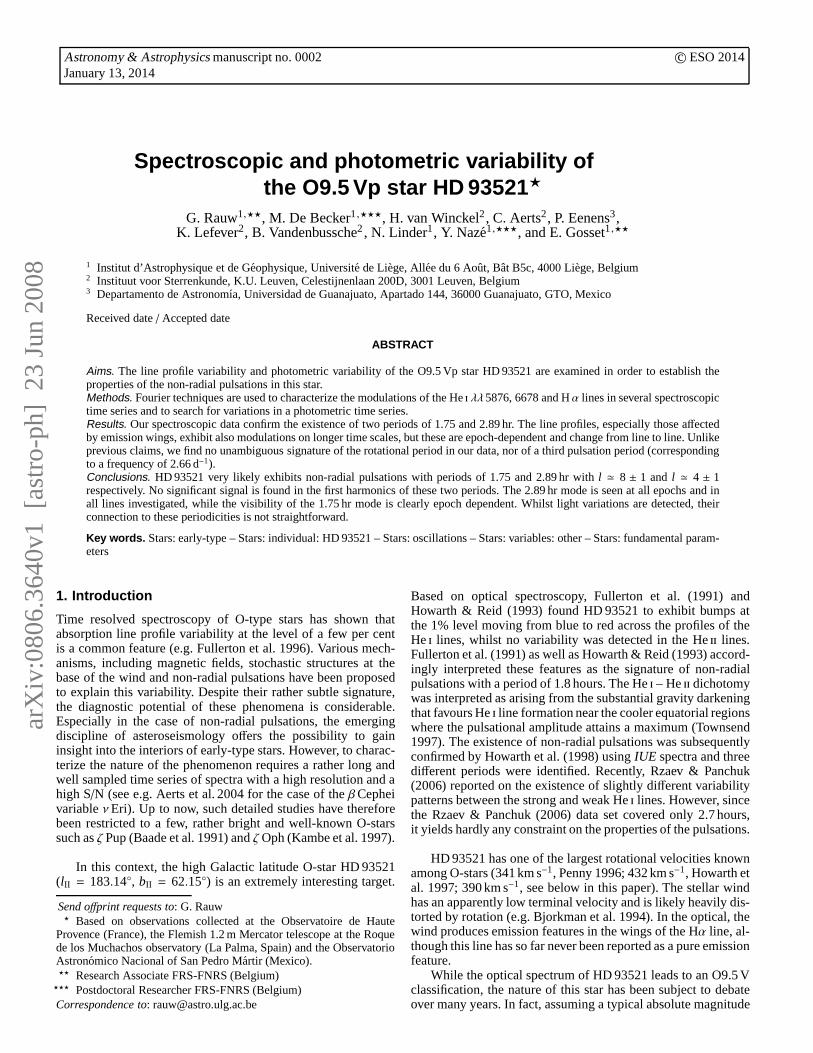
Fig. 1. Average spectrum (top) and temporal variance spectrum (TVS, bottom) computed from the green, red and SPM spectrataken in February+ April 2006 (left panel), April 2005 (middle) and April 2005 (right) respectively. The dotted lines yield the 99%significance level for the variability evaluated followingthe approach of Fullerton et al. (1996).
for a Population I O9.5 V star, HD 93521 is located about1.4 kpc above the Galactic plane (Irvine 1989), far away fromany site of recent massive star formation. While there is stillsome uncertainty concerning the motion of the star (towardsoraway from the Galactic plane, see Gies 1987), it seems unlikelythat HD 93521 could have formed in the plane and subsequentlymoved to its current position. Furthermore, based on the ratherlow stellar wind terminal velocity of HD 93521 and assumingthat v∞ = 3 × vesc, Ebbets & Savage (1982) concluded thatthis star was likely a low-mass evolved Population II object.However, Irvine (1989) showed that the relation betweenv∞andvesc does not hold for late O-type stars such as HD 93521and he proposed that the star is in fact a normal main sequencestar that has formed in the Galactic halo (another example ofamassive star born in the halo can be found in Heber et al. 1995).Lennon et al. (1991) measured the equivalent widths (EWs) ofseveral metal lines in the spectrum of HD 93521. Though theselines are washed out by rotational broadening and the EWs areaffected by large uncertainties, their strengths are inconsistentwith Population II metal abundances. Finally, Massa (1995)showed that the other peculiar features of this star (its unusuallylow UV continuum, its abnormally strong wind lines in the UV,its low excitation photospheric lines) can all be accountedforby the effect of gravity darkening in a ‘normal’ Population I starrotating at 90% of its breakup velocity and seen nearly equatoron.
In this paper, we present the results of a spectroscopic andphotometric monitoring campaign of HD 93521. The aim of thisproject was to check the long-term stability of the periodicitiesidentified in previous investigations.
2. Observations
2.1. Spectroscopy
We observed HD 93521 during five observing campaigns (inFebruary 1997, April 2005, February and April 2006 as well asApril 2007) with the Aurelie spectrograph at the 1.52 m tele-scope of the Observatoire de Haute Provence (OHP). The 1997and 2005 data were taken with a 1200 lines/mm grating blazed at5000 Å and covered the wavelength domain from 6530 to 6710Åwith a resolving power ofR ≃ 21000. The 2006 and 2007 datawere obtained with a 600 lines/mm grating also blazed at 5000Åand covering this time the region between 5500 and 5920 Å withR ≃ 10000. In 1997, the detector was a Thomson TH7832 lineararray with 2048 pixels of 13µm each, whilst later observationsused an EEV 42-20 CCD with 2048× 1024 pixels. All the OHPdata were reduced in the standard way (see Rauw et al. 2003)using the MIDAS software provided by ESO. To correct the ob-served spectra to first order for telluric (mainly water vapor) ab-sorption lines, a template of the telluric spectrum was built fromobservations of a bright star at very different airmasses (usuallyaround 1.2 and 3.0). The stars used for this purpose wereνOri(B3 V) and HD 100889 (B9.5 Vn) in February 1997, HD 177724
G. Rauw et al.: Spectroscopic and photometric variability ofthe O9.5 Vp star HD 93521 3
(A0 Vn) in April 2005 and Regulus (αLeo, B7 V) in February2006. Finally, the spectra were normalized using properly cho-sen continuum windows. Special care was taken to ensure thatall the data were normalized in a homogeneous way to allow aself-consistent search for variability.
In April 2005, we gathered a series of 90 spectra with theechelle spectrograph mounted on the 2.1 m telescope at theObservatorio Astronomico Nacional of San Pedro Martir (SPM)in Mexico. The instrument covers the spectral domain betweenabout 3800 and 6800 Å with a resolving power of 18000 at5000 Å. The detector was a SITe CCD with 1024× 1024 pix-els of 24µm2. The data were reduced using the echelle contextof the MIDAS software and specific orders covering several im-portant lines (Hei λλ 4471, 5876, Hβ and Hα) were normalizedusing a set of selected continuum windows. Unfortunately, theHei λ 6678 line could not be studied because it fell too close tothe edge of an order.
A summary of the main characteristics of our various datasets is provided in Table 1. For each run,∆T gives the timeelapsed between our first and our last observation, while N isthe total number of observations.∆t is the average time inter-val between two consecutive exposures during the same night.In light of the Fourier analysis in Section 3.2, we further list thetypical FWHM of a peak in the power spectrum∆ νnat = 1/∆T,as well asνmax = 1/(2∆t) which provides a rough indicationof the highest frequencies that could be sampled with our timeseries.
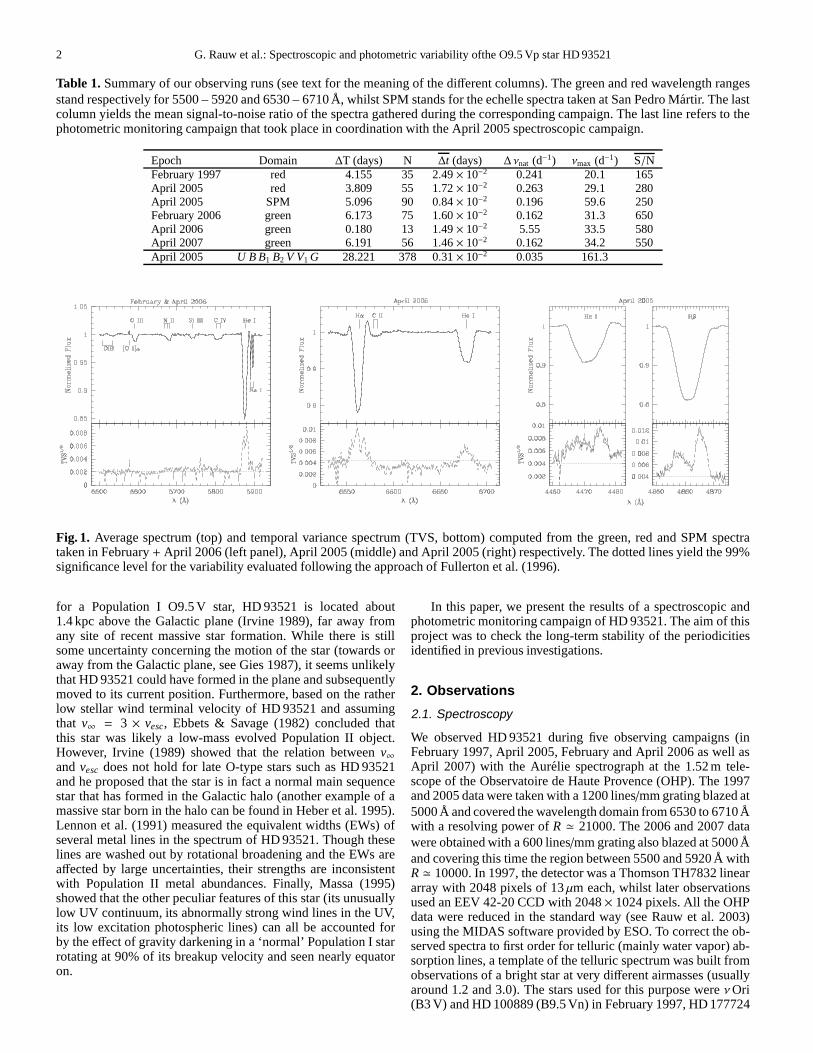
During the April 2006 campaign, HD 93521 was also ob-served in the near-infrared with the Aurelie spectrograph. Thedata were obtained with a 300 lines/mm grating blazed at 6000Åand covering the region between 8055 and 8965 Å withR ≃6500. Whilst the individual spectra in this wavelength domaindo not have a sufficient quality to perform a meaningful vari-ability analysis, we present the mean spectrum over the usefulband from 8420 to 8900 Å in Fig. 2. The spectrum is largelydominated by broad and shallow hydrogen absorption lines ofthe Paschen series (from Pa11 to at least Pa16) with some mod-est contributions from Hei and possibly Heii, C iii and Niiilines. The RVS instrument onboard ESA’s forthcoming astrome-try mission GAIA will cover a sub-domain (from 8470 – 8740 Å)of the band shown in Fig. 2 with a resolving power twice as largeas that of our data to measure among other things the radial androtational velocities. Our spectrum indicates that the only promi-nent features in the RVS spectra of rapidly rotating late O-typedwarfs are the Paschen lines.
Fig. 2. Mean spectrum of HD 93521 over the 8420 – 8900Åwavelength domain. The ions responsible for the lines (eitherstellar, or telluric in the case of the OH emissions) are indicatedabove the spectrum, whilst the diffuse interstellar bands (DIBs)are indicated below.
2.2. Photometry
Time resolved photometry of HD 93521 through the(U B B1 B2 V V1 G)G Geneva filter system (see e.g. Rufener1981, Bessell 2005) was obtained with the Mercator telescopein April 2005. Mercator is a 1.2 m semi-robotic telescope,situated at Roque de los Muchachos (La Palma Island, Spain).The telescope is equipped with the P 7 photometer, which is atwo channel photometer for quasi simultaneous 7 band mea-surements. The first channel (A) is centered on the star whilethe second channel (B) is centered on the sky. The positionangle of the sky can be changed by turning the derotator whilechanging the distance between both channels needs manualinteraction. The filter wheel turns at 4 Hz and a chopper directsboth channels alternatively to the photomultiplier. As such,the photomultiplier measures both beams A and B through theseven filters four times each second.
The strategy for performing the observations is oriented to-wards obtaining high-precision photometry. In order to achievethis, we measure stars within a range of 0.1 in air-massFzfor nights of good atmospheric conditions. It is advantageousto measure a variable star with a period of the order of hoursfrequently each night, so we have opted for the intervalFz ∈
[1.05; 1.15] to measure HD 93521. For the reduction process ofsuch a type of observing night, typically 2–3 standard starsofdifferent colour are observed each hour. The determination ofthe extinction coefficients was done according to the method out-lined in Burki et al. (1995) and results in measurements withatypical accuracy of a few mmag for the colours of stars with vi-sual magnitude between 5 and 10. A total of 378 data points weregathered between 29 March and 27 April (UT dates). In our anal-ysis we have restricted ourselves to those 315 data points thathave weights of 3 or 4 (for good or exceptional quality measure-ments respectively, see Rufener 1981). Nights with these qualityweights are characterized by standard deviations on the measure-ments of standard stars of less than 0.005 mag.
3. Results
3.1. Spectroscopy
The average spectra of the star over the wavelength domains in-vestigated here are shown in Fig. 1. Besides a few diffuse inter-stellar bands (DIBs), identified following the catalogue ofinter-stellar features from Herbig (1995), we note the broad absorptionlines as well as the emission components of Hα and Hei λ 5876.Note that the Hei lines appear relatively strong compared to theHα line. This can be understood in view of the helium overabun-dance (y = 0.18± 0.03) reported by Lennon et al. (1991) andHowarth & Smith (2001).
In addition to the Oiii λ 5592, Civ λλ 5801, 5812 and Heiλ 5876 absorptions that are typical for an O-type star, the spec-trum in the region between 5500 and 5900 Å also reveals severalunusual features, such as the Nii λλ 5667, 5676, 5680 blend andthe Siiii λ 5740 line. These lines are strong in the spectra of earlyB supergiants, but are usually absent from O-star spectra (seeWalborn 1980). The same remark applies to the feature near thered emission wing of Hα that we identify as Cii λλ 6578, 6583which are clearly seen in the spectra of early B-type stars. Theseparticularities are reminiscent of the description of theIUE spec-trum of the star given by Massa (1995) and thus likely reflect thestrong temperature gradient that exists at the stellar surface as aresult of gravity darkening. According to Massa (1995), thepo-lar region has a temperature close to that of an O7 star, whilst the
4 G. Rauw et al.: Spectroscopic and photometric variabilityofthe O9.5 Vp star HD 93521
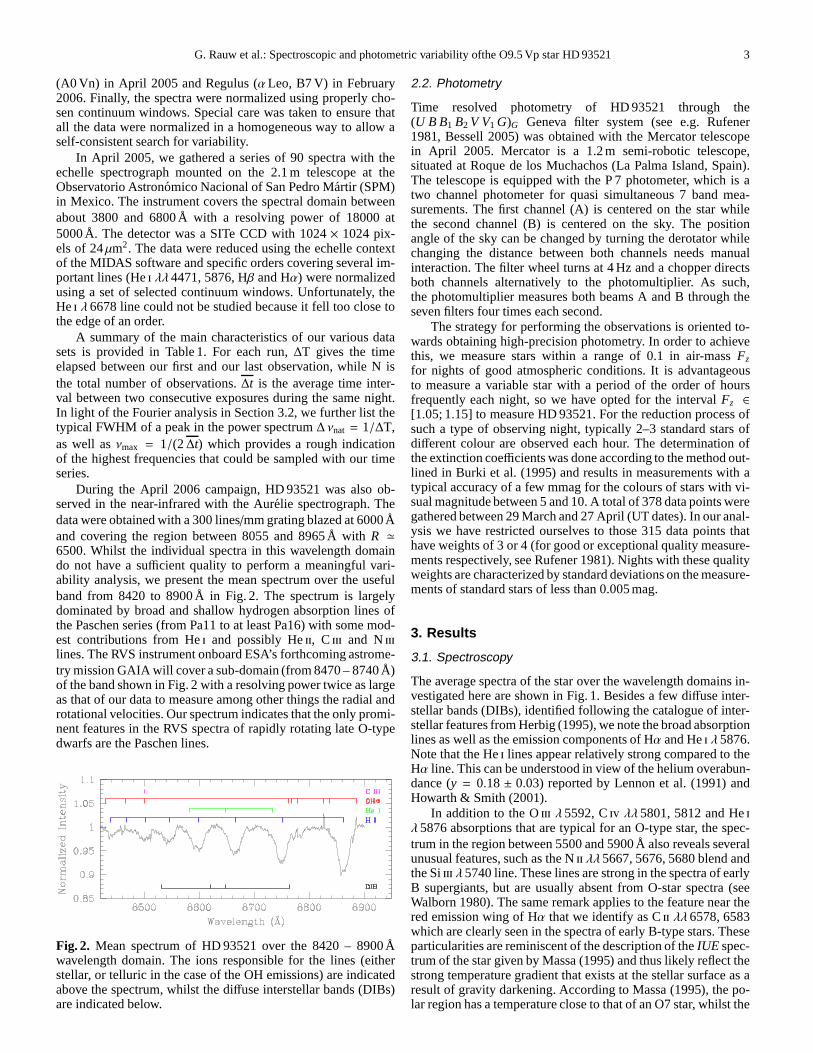
Fig. 3. Determination of the rotational velocity of HD 93521 us-ing the Fourier technique. The top panel illustrates the mean pro-file of the Hei λ 6678 line as observed in April 2005. The lowerpanel illustrates the resulting Fourier transform along with theFourier transformG(σ) of a rotational broadening function (seeGray 2005) evaluated forv sini = 395 km s−1.
equatorial region is much cooler and experiences a lower surfacegravity, hence producing a spectrum similar to that of an early Bsupergiant.
We have determined the star’s projected rotational velocityv sini applying the Fourier method (see Gray 2005, Simon-Dıaz& Herrero 2007) to the mean profiles of the Hei λλ 5876,6678 and Oiii λ 5592 lines. To first order, the structure of theFourier transforms of these lines can be explained by projectedequatorial rotational velocities of 345, 395 and 380 km s−1
respectively. While the results for the Hei λ 6678 and Oiiiλ 5592 line are in very reasonable agreement, Hei λ 5876yields a significantly lower value. There are several reasonswhy the three lines do not yield exactly the same result. Firstof all, the profile of Hei λ 5876 is affected by emission thatcould fill-in the absorption in the wings of the line, henceleading to an apparently lowerv sini. In addition, although wehave used the mean profiles evaluated from a large number ofobservations, the line profile variability (see below) leaves someresidual structure in the profiles. These features lead in turn to aFourier transform that deviates from the one expected for a purerotational broadening1. The cleanest result is obtained for theHei λ 6678 line (see Fig. 3). In summary, we conclude that theprojected equatorial rotational velocity of the star is most likely390± 10 km s−1. There is a caveat here: our determination ofv sini likely represents a lower limit to the actual value. Indeed,Townsend et al. (2004) argued that the rotational velocitiesof very rapidly rotating Be-type stars might be systematicallyunderestimated as a result of the effect of gravity darkening thatwould reduce the weight of the equatorial region (and hence
1 Macroturbulence also affects the shape of the Fourier transform,but this is mainly an issue for very slow rotators which is notthe caseof HD 93521.
of the highest rotational velocities) in the formation of theabsorption line profiles. For B0 stars, Townsend et al. find thatthe Hei λ 4471 and Mgii λ4481 lines underestimatev sini byabout 10%. A similar underestimate could hold in our case.
To quantify the variability of the spectral lines, we havecomputed the temporal variance spectrum (TVS, Fullerton etal.1996) for the data of each observing campaign. The TVS dia-grams of the spectral regions investigated here reveal no signif-icant variability in the metallic lines, except perhaps forsomemarginal variations in the region between 5660 and 5810 Å. Thesignificant variability is restricted to the Hei λ 4471, Hβ, Heiλ 5876, Hα and Hei λ 6678 lines. The majority of these lines (ex-cept perhaps the Hβ line, see Fig. 1) exhibit evidence for emis-sion wings.
3.2. Fourier analysis
For each of the variable lines, we have performed a 2-D Fourieranalysis (see e.g. Rauw et al. 2001, 2003) where the Fourierpower spectrum is calculated at each wavelength step acrosstheline profile using the technique of Heck et al. (1985) revisedbyGosset et al. (2001). This algorithm is specifically designed tohandle time series with an uneven sampling. The periodogramswere calculated for each line and for each campaign up to a max-imum frequency of 30 d−1.
For the frequencies that are identified from the peri-odograms, we have further applied the different techniques out-lined in Rauw et al. (2001). For each line and for each observingcampaign, we have fitted an expression of the type
I(λ, t) = I0(λ) +q∑
i=1
Ai(λ) sin [2π νi t + φi(λ)] (1)
to the time series. HereI(λ, t) is the line intensity at wavelengthλ and at timet, νi are the frequencies corresponding to the high-est peaks in the periodogram, whilstAi(λ) andφi(λ) are respec-tively the semiamplitudes and the phases for these frequencies asa function of wavelength (see Rauw et al. 2001)2. The numberqof frequencies that were simultaneously fitted was progressivelyincreased from 1 up to 3. This method not only allows us to char-acterize the properties of a given frequency, but further enablesus to ‘prewhiten’ the data by removing the modulation at thisfrequency from the time series and re-compute the periodogramfor the ‘prewhitened’ data set. We start by removing the high-est peak frequency found in the periodogram of the original dataset. Next, we identify the highest frequency in the periodogramof the new (prewhitened) time series and prewhiten then thedata simultaneously for the two frequencies. The procedureisrepeated for up to three different frequencies3. Indeed, three fre-quencies are usually sufficient to reduce the residual amplitudein the prewhitened Fourier power spectra to a level compatiblewith the noise level of the data.
To evaluate the error bars on the semiamplitudes and phasesof the various Fourier components, we have used Monte Carlo
2 These techniques are especially useful if the line profile variationsare interpreted in terms of non-radial pulsations. Indeed,in this case,Telting & Schrijvers (1997) and Schrijvers & Telting (1999)have shownthat the observable phase differences between the blue and red linewings can be related directly to the degreel and to the absolute value ofthe azimuthal order|m| of the pulsation mode.
3 We caution that some of the low frequencies identified throughoutthis work likely correspond to long-term trends rather thanto actualperiods.
G. Rauw et al.: Spectroscopic and photometric variability ofthe O9.5 Vp star HD 93521 5
0 10 20 30
0.1
0.15
0.2
0 10 20 30
0.1
0.15
0.2
0 10 20 30
0
0.2
0.4
0.6
0.8
1
0 10 20 30
0.05
0.1
0.15
0 10 20 30
0.05
0.1
0.15
0 10 20 30
0
0.2
0.4
0.6
0.8
1
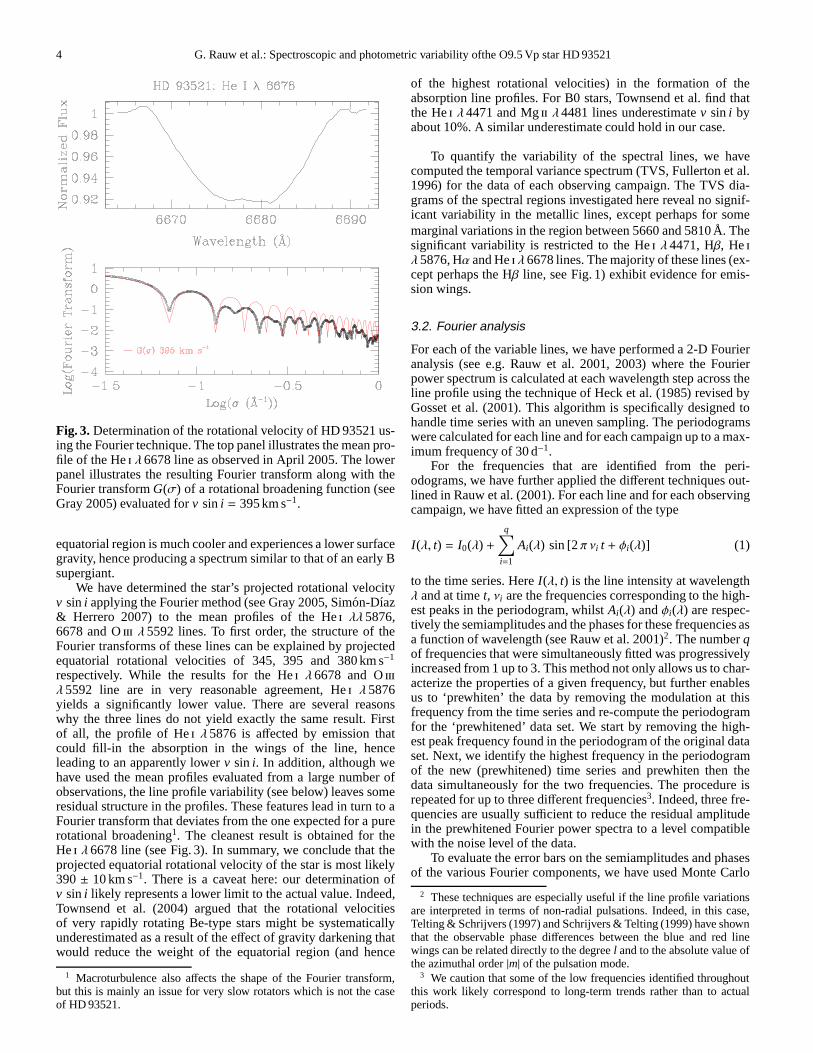
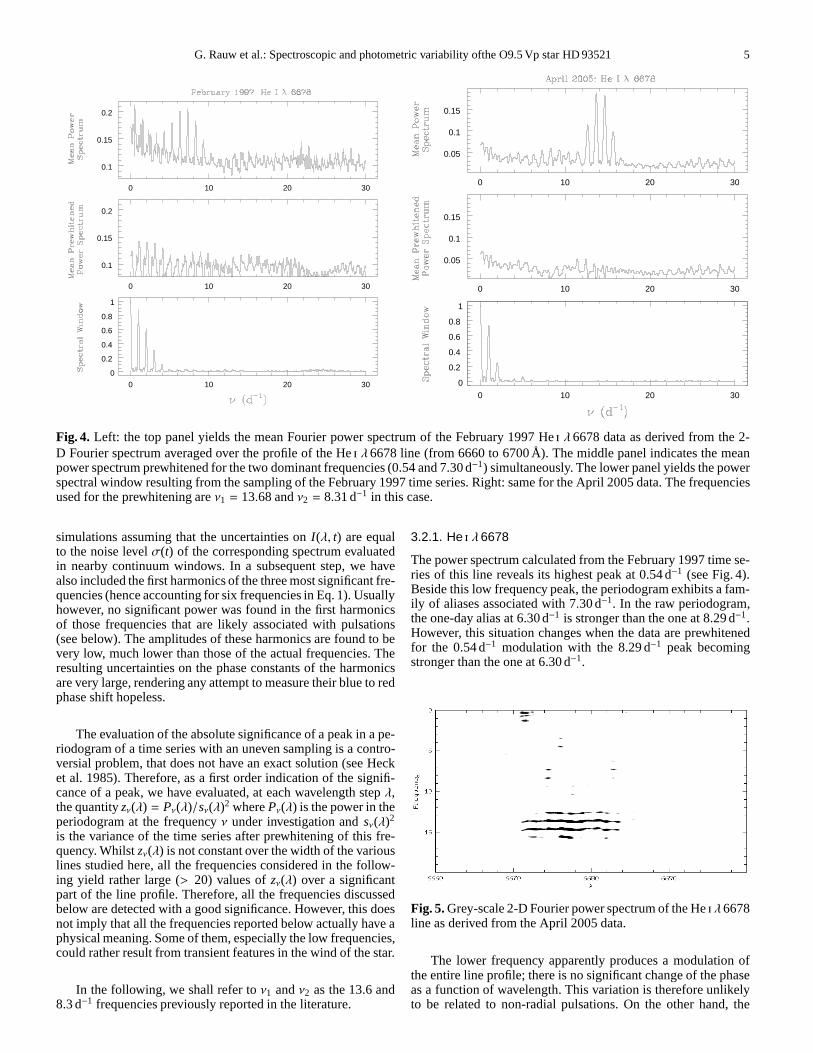
Fig. 4. Left: the top panel yields the mean Fourier power spectrum ofthe February 1997 Hei λ 6678 data as derived from the 2-D Fourier spectrum averaged over the profile of the Hei λ6678 line (from 6660 to 6700 Å). The middle panel indicates the meanpower spectrum prewhitened for the two dominant frequencies (0.54 and 7.30 d−1) simultaneously. The lower panel yields the powerspectral window resulting from the sampling of the February1997 time series. Right: same for the April 2005 data. The frequenciesused for the prewhitening areν1 = 13.68 andν2 = 8.31 d−1 in this case.
simulations assuming that the uncertainties onI(λ, t) are equalto the noise levelσ(t) of the corresponding spectrum evaluatedin nearby continuum windows. In a subsequent step, we havealso included the first harmonics of the three most significant fre-quencies (hence accounting for six frequencies in Eq. 1). Usuallyhowever, no significant power was found in the first harmonicsof those frequencies that are likely associated with pulsations(see below). The amplitudes of these harmonics are found to bevery low, much lower than those of the actual frequencies. Theresulting uncertainties on the phase constants of the harmonicsare very large, rendering any attempt to measure their blue to redphase shift hopeless.
The evaluation of the absolute significance of a peak in a pe-riodogram of a time series with an uneven sampling is a contro-versial problem, that does not have an exact solution (see Hecket al. 1985). Therefore, as a first order indication of the signifi-cance of a peak, we have evaluated, at each wavelength stepλ,the quantityzν(λ) = Pν(λ)/sν(λ)2 wherePν(λ) is the power in theperiodogram at the frequencyν under investigation andsν(λ)2
is the variance of the time series after prewhitening of thisfre-quency. Whilstzν(λ) is not constant over the width of the variouslines studied here, all the frequencies considered in the follow-ing yield rather large (> 20) values ofzν(λ) over a significantpart of the line profile. Therefore, all the frequencies discussedbelow are detected with a good significance. However, this doesnot imply that all the frequencies reported below actually have aphysical meaning. Some of them, especially the low frequencies,could rather result from transient features in the wind of the star.
In the following, we shall refer toν1 andν2 as the 13.6 and8.3 d−1 frequencies previously reported in the literature.
3.2.1. He i λ6678
The power spectrum calculated from the February 1997 time se-ries of this line reveals its highest peak at 0.54 d−1 (see Fig. 4).Beside this low frequency peak, the periodogram exhibits a fam-ily of aliases associated with 7.30 d−1. In the raw periodogram,the one-day alias at 6.30 d−1 is stronger than the one at 8.29 d−1.However, this situation changes when the data are prewhitenedfor the 0.54 d−1 modulation with the 8.29 d−1 peak becomingstronger than the one at 6.30 d−1.
Fig. 5. Grey-scale 2-D Fourier power spectrum of the Hei λ6678line as derived from the April 2005 data.
The lower frequency apparently produces a modulation ofthe entire line profile; there is no significant change of the phaseas a function of wavelength. This variation is therefore unlikelyto be related to non-radial pulsations. On the other hand, the
6 G. Rauw et al.: Spectroscopic and photometric variabilityofthe O9.5 Vp star HD 93521
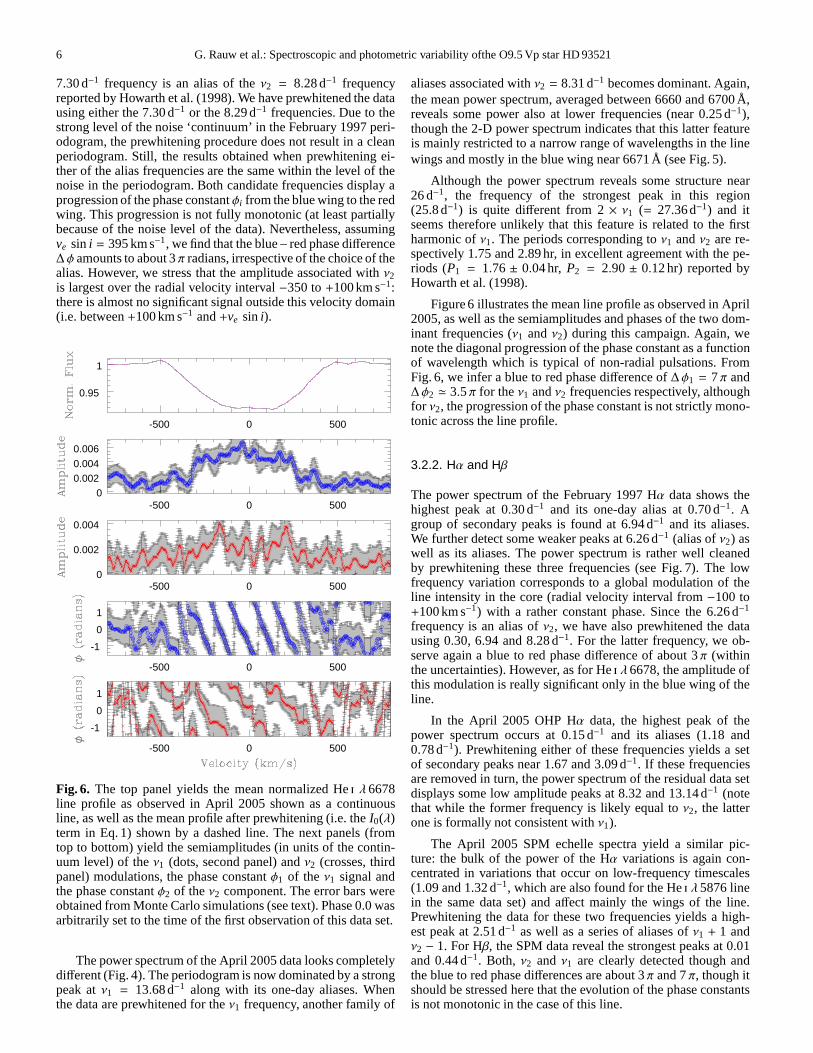
7.30 d−1 frequency is an alias of theν2 = 8.28 d−1 frequencyreported by Howarth et al. (1998). We have prewhitened the datausing either the 7.30 d−1 or the 8.29 d−1 frequencies. Due to thestrong level of the noise ‘continuum’ in the February 1997 peri-odogram, the prewhitening procedure does not result in a cleanperiodogram. Still, the results obtained when prewhitening ei-ther of the alias frequencies are the same within the level ofthenoise in the periodogram. Both candidate frequencies display aprogression of the phase constantφi from the blue wing to the redwing. This progression is not fully monotonic (at least partiallybecause of the noise level of the data). Nevertheless, assumingve sini = 395 km s−1, we find that the blue – red phase difference∆φ amounts to about 3π radians, irrespective of the choice of thealias. However, we stress that the amplitude associated with ν2is largest over the radial velocity interval−350 to+100 km s−1:there is almost no significant signal outside this velocity domain(i.e. between+100 km s−1 and+ve sini).
-500 0 500
0.95
1
-500 0 5000
0.0020.004
0.006
-500 0 5000
0.002
0.004
-500 0 500
-1
0
1
-500 0 500
-1
0
1
Fig. 6. The top panel yields the mean normalized Hei λ 6678line profile as observed in April 2005 shown as a continuousline, as well as the mean profile after prewhitening (i.e. theI0(λ)term in Eq. 1) shown by a dashed line. The next panels (fromtop to bottom) yield the semiamplitudes (in units of the contin-uum level) of theν1 (dots, second panel) andν2 (crosses, thirdpanel) modulations, the phase constantφ1 of the ν1 signal andthe phase constantφ2 of theν2 component. The error bars wereobtained from Monte Carlo simulations (see text). Phase 0.0wasarbitrarily set to the time of the first observation of this data set.
The power spectrum of the April 2005 data looks completelydifferent (Fig. 4). The periodogram is now dominated by a strongpeak atν1 = 13.68d−1 along with its one-day aliases. Whenthe data are prewhitened for theν1 frequency, another family of
aliases associated withν2 = 8.31 d−1 becomes dominant. Again,the mean power spectrum, averaged between 6660 and 6700 Å,reveals some power also at lower frequencies (near 0.25 d−1),though the 2-D power spectrum indicates that this latter featureis mainly restricted to a narrow range of wavelengths in the linewings and mostly in the blue wing near 6671 Å (see Fig. 5).
Although the power spectrum reveals some structure near26 d−1, the frequency of the strongest peak in this region(25.8 d−1) is quite different from 2× ν1 (= 27.36d−1) and itseems therefore unlikely that this feature is related to thefirstharmonic ofν1. The periods corresponding toν1 andν2 are re-spectively 1.75 and 2.89 hr, in excellent agreement with thepe-riods (P1 = 1.76± 0.04 hr, P2 = 2.90± 0.12 hr) reported byHowarth et al. (1998).
Figure 6 illustrates the mean line profile as observed in April2005, as well as the semiamplitudes and phases of the two dom-inant frequencies (ν1 andν2) during this campaign. Again, wenote the diagonal progression of the phase constant as a functionof wavelength which is typical of non-radial pulsations. FromFig. 6, we infer a blue to red phase difference of∆φ1 = 7π and∆φ2 ≃ 3.5π for theν1 andν2 frequencies respectively, althoughfor ν2, the progression of the phase constant is not strictly mono-tonic across the line profile.
3.2.2. Hα and Hβ
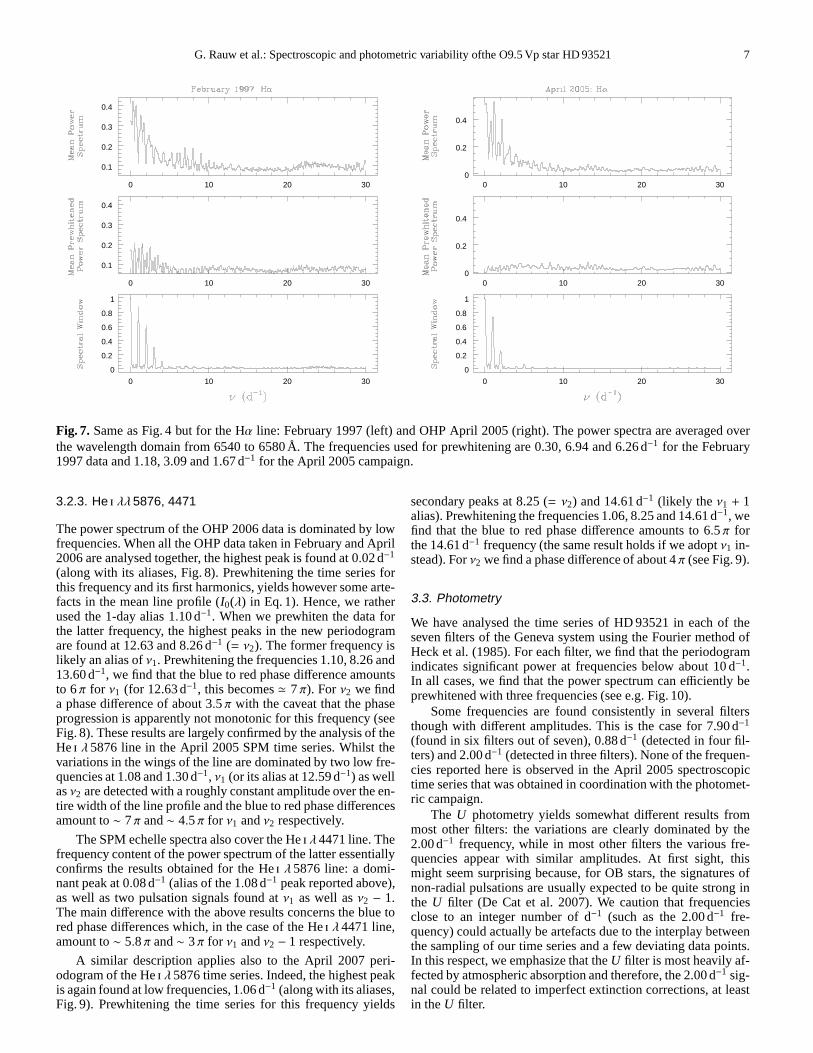
The power spectrum of the February 1997 Hα data shows thehighest peak at 0.30 d−1 and its one-day alias at 0.70 d−1. Agroup of secondary peaks is found at 6.94 d−1 and its aliases.We further detect some weaker peaks at 6.26 d−1 (alias ofν2) aswell as its aliases. The power spectrum is rather well cleanedby prewhitening these three frequencies (see Fig. 7). The lowfrequency variation corresponds to a global modulation of theline intensity in the core (radial velocity interval from−100 to+100 km s−1) with a rather constant phase. Since the 6.26 d−1
frequency is an alias ofν2, we have also prewhitened the datausing 0.30, 6.94 and 8.28 d−1. For the latter frequency, we ob-serve again a blue to red phase difference of about 3π (withinthe uncertainties). However, as for Hei λ 6678, the amplitude ofthis modulation is really significant only in the blue wing oftheline.
In the April 2005 OHP Hα data, the highest peak of thepower spectrum occurs at 0.15 d−1 and its aliases (1.18 and0.78 d−1). Prewhitening either of these frequencies yields a setof secondary peaks near 1.67 and 3.09 d−1. If these frequenciesare removed in turn, the power spectrum of the residual data setdisplays some low amplitude peaks at 8.32 and 13.14d−1 (notethat while the former frequency is likely equal toν2, the latterone is formally not consistent withν1).
The April 2005 SPM echelle spectra yield a similar pic-ture: the bulk of the power of the Hα variations is again con-centrated in variations that occur on low-frequency timescales(1.09 and 1.32 d−1, which are also found for the Hei λ 5876 linein the same data set) and affect mainly the wings of the line.Prewhitening the data for these two frequencies yields a high-est peak at 2.51 d−1 as well as a series of aliases ofν1 + 1 andν2 − 1. For Hβ, the SPM data reveal the strongest peaks at 0.01and 0.44 d−1. Both, ν2 and ν1 are clearly detected though andthe blue to red phase differences are about 3π and 7π, though itshould be stressed here that the evolution of the phase constantsis not monotonic in the case of this line.
G. Rauw et al.: Spectroscopic and photometric variability ofthe O9.5 Vp star HD 93521 7
0 10 20 30
0.1
0.2
0.3
0.4
0 10 20 30
0.1
0.2
0.3
0.4
0 10 20 30
0
0.2
0.4
0.6
0.8
1
0 10 20 300
0.2
0.4
0 10 20 300
0.2
0.4
0 10 20 30
0
0.2
0.4
0.6
0.8
1
Fig. 7. Same as Fig. 4 but for the Hα line: February 1997 (left) and OHP April 2005 (right). The power spectra are averaged overthe wavelength domain from 6540 to 6580 Å. The frequencies used for prewhitening are 0.30, 6.94 and 6.26 d−1 for the February1997 data and 1.18, 3.09 and 1.67 d−1 for the April 2005 campaign.
3.2.3. He i λλ5876, 4471
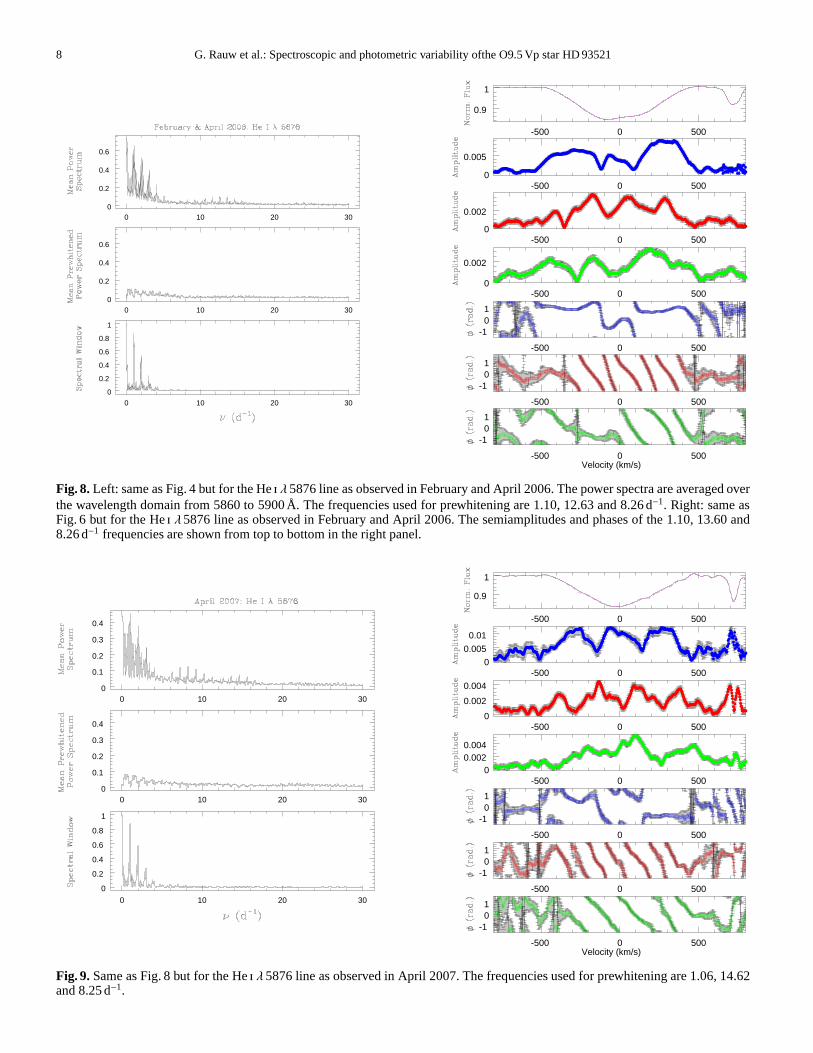
The power spectrum of the OHP 2006 data is dominated by lowfrequencies. When all the OHP data taken in February and April2006 are analysed together, the highest peak is found at 0.02 d−1
(along with its aliases, Fig. 8). Prewhitening the time series forthis frequency and its first harmonics, yields however some arte-facts in the mean line profile (I0(λ) in Eq. 1). Hence, we ratherused the 1-day alias 1.10 d−1. When we prewhiten the data forthe latter frequency, the highest peaks in the new periodogramare found at 12.63 and 8.26 d−1 (= ν2). The former frequency islikely an alias ofν1. Prewhitening the frequencies 1.10, 8.26 and13.60 d−1, we find that the blue to red phase difference amountsto 6π for ν1 (for 12.63 d−1, this becomes≃ 7π). For ν2 we finda phase difference of about 3.5π with the caveat that the phaseprogression is apparently not monotonic for this frequency(seeFig. 8). These results are largely confirmed by the analysis of theHei λ 5876 line in the April 2005 SPM time series. Whilst thevariations in the wings of the line are dominated by two low fre-quencies at 1.08 and 1.30 d−1, ν1 (or its alias at 12.59 d−1) as wellasν2 are detected with a roughly constant amplitude over the en-tire width of the line profile and the blue to red phase differencesamount to∼ 7π and∼ 4.5π for ν1 andν2 respectively.
The SPM echelle spectra also cover the Hei λ 4471 line. Thefrequency content of the power spectrum of the latter essentiallyconfirms the results obtained for the Hei λ 5876 line: a domi-nant peak at 0.08 d−1 (alias of the 1.08 d−1 peak reported above),as well as two pulsation signals found atν1 as well asν2 − 1.The main difference with the above results concerns the blue tored phase differences which, in the case of the Hei λ 4471 line,amount to∼ 5.8π and∼ 3π for ν1 andν2 − 1 respectively.
A similar description applies also to the April 2007 peri-odogram of the Hei λ 5876 time series. Indeed, the highest peakis again found at low frequencies, 1.06 d−1 (along with its aliases,Fig. 9). Prewhitening the time series for this frequency yields
secondary peaks at 8.25 (= ν2) and 14.61 d−1 (likely the ν1 + 1alias). Prewhitening the frequencies 1.06, 8.25 and 14.61 d−1, wefind that the blue to red phase difference amounts to 6.5π forthe 14.61 d−1 frequency (the same result holds if we adoptν1 in-stead). Forν2 we find a phase difference of about 4π (see Fig. 9).
3.3. Photometry
We have analysed the time series of HD 93521 in each of theseven filters of the Geneva system using the Fourier method ofHeck et al. (1985). For each filter, we find that the periodogramindicates significant power at frequencies below about 10 d−1.In all cases, we find that the power spectrum can efficiently beprewhitened with three frequencies (see e.g. Fig. 10).
Some frequencies are found consistently in several filtersthough with different amplitudes. This is the case for 7.90 d−1
(found in six filters out of seven), 0.88 d−1 (detected in four fil-ters) and 2.00 d−1 (detected in three filters). None of the frequen-cies reported here is observed in the April 2005 spectroscopictime series that was obtained in coordination with the photomet-ric campaign.
The U photometry yields somewhat different results frommost other filters: the variations are clearly dominated by the2.00 d−1 frequency, while in most other filters the various fre-quencies appear with similar amplitudes. At first sight, thismight seem surprising because, for OB stars, the signaturesofnon-radial pulsations are usually expected to be quite strong inthe U filter (De Cat et al. 2007). We caution that frequenciesclose to an integer number of d−1 (such as the 2.00 d−1 fre-quency) could actually be artefacts due to the interplay betweenthe sampling of our time series and a few deviating data points.In this respect, we emphasize that theU filter is most heavily af-fected by atmospheric absorption and therefore, the 2.00 d−1 sig-nal could be related to imperfect extinction corrections, at leastin theU filter.
8 G. Rauw et al.: Spectroscopic and photometric variabilityofthe O9.5 Vp star HD 93521
0 10 20 300
0.2
0.4
0.6
0 10 20 300
0.2
0.4
0.6
0 10 20 30
0
0.2
0.4
0.6
0.8
1
-500 0 500
0.9
1
-500 0 5000
0.005
-500 0 5000
0.002
-500 0 5000
0.002
-500 0 500
-101
-500 0 500
-101
-500 0 500
-101
Velocity (km/s)
Fig. 8. Left: same as Fig. 4 but for the Hei λ 5876 line as observed in February and April 2006. The power spectra are averaged overthe wavelength domain from 5860 to 5900 Å. The frequencies used for prewhitening are 1.10, 12.63 and 8.26 d−1. Right: same asFig. 6 but for the Hei λ5876 line as observed in February and April 2006. The semiamplitudes and phases of the 1.10, 13.60 and8.26 d−1 frequencies are shown from top to bottom in the right panel.
0 10 20 300
0.1
0.2
0.3
0.4
0 10 20 300
0.1
0.2
0.3
0.4
0 10 20 30
0
0.2
0.4
0.6
0.8
1
-500 0 500
0.9
1
-500 0 5000
0.005
0.01
-500 0 5000
0.002
0.004
-500 0 5000
0.0020.004
-500 0 500
-101
-500 0 500
-101
-500 0 500
-101
Velocity (km/s)
Fig. 9. Same as Fig. 8 but for the Hei λ 5876 line as observed in April 2007. The frequencies used forprewhitening are 1.06, 14.62and 8.25 d−1.
G. Rauw et al.: Spectroscopic and photometric variability ofthe O9.5 Vp star HD 93521 9
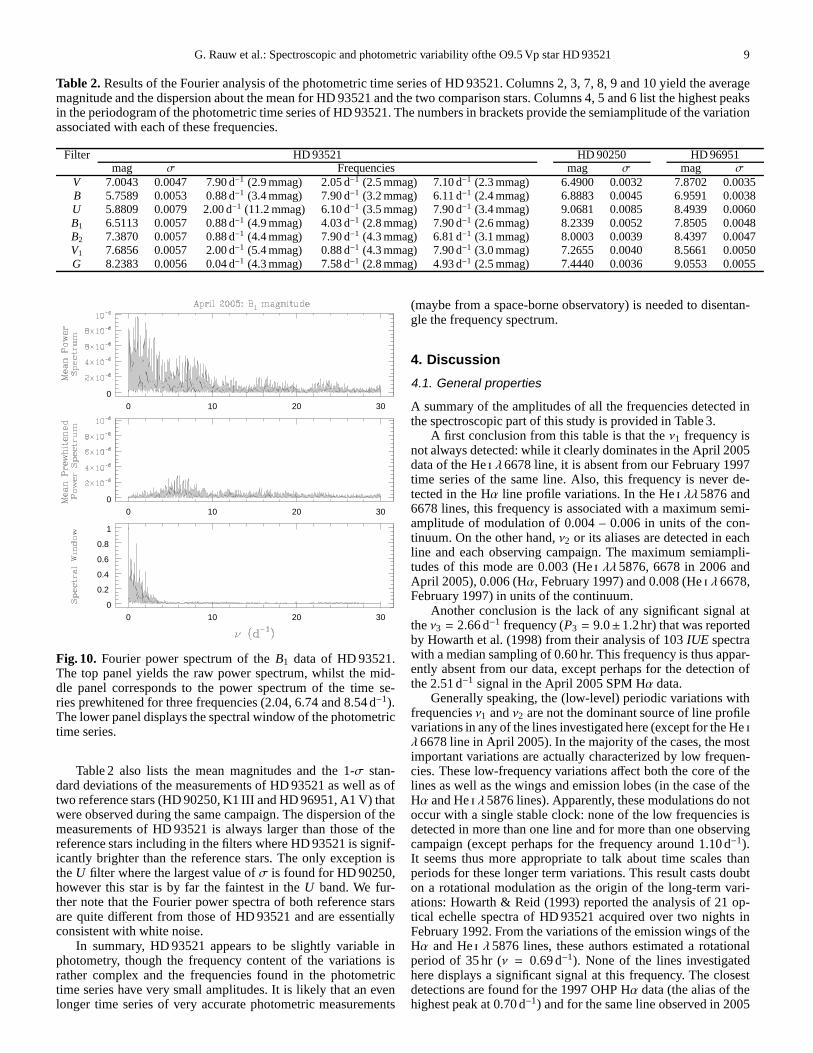
Table 2. Results of the Fourier analysis of the photometric time series of HD 93521. Columns 2, 3, 7, 8, 9 and 10 yield the averagemagnitude and the dispersion about the mean for HD 93521 and the two comparison stars. Columns 4, 5 and 6 list the highest peaksin the periodogram of the photometric time series of HD 93521. The numbers in brackets provide the semiamplitude of the variationassociated with each of these frequencies.
Filter HD 93521 HD 90250 HD 96951mag σ Frequencies mag σ mag σ
V 7.0043 0.0047 7.90 d−1 (2.9 mmag) 2.05 d−1 (2.5 mmag) 7.10 d−1 (2.3 mmag) 6.4900 0.0032 7.8702 0.0035B 5.7589 0.0053 0.88 d−1 (3.4 mmag) 7.90 d−1 (3.2 mmag) 6.11 d−1 (2.4 mmag) 6.8883 0.0045 6.9591 0.0038U 5.8809 0.0079 2.00 d−1 (11.2 mmag) 6.10 d−1 (3.5 mmag) 7.90 d−1 (3.4 mmag) 9.0681 0.0085 8.4939 0.0060B1 6.5113 0.0057 0.88 d−1 (4.9 mmag) 4.03 d−1 (2.8 mmag) 7.90 d−1 (2.6 mmag) 8.2339 0.0052 7.8505 0.0048B2 7.3870 0.0057 0.88 d−1 (4.4 mmag) 7.90 d−1 (4.3 mmag) 6.81 d−1 (3.1 mmag) 8.0003 0.0039 8.4397 0.0047V1 7.6856 0.0057 2.00 d−1 (5.4 mmag) 0.88 d−1 (4.3 mmag) 7.90 d−1 (3.0 mmag) 7.2655 0.0040 8.5661 0.0050G 8.2383 0.0056 0.04 d−1 (4.3 mmag) 7.58 d−1 (2.8 mmag) 4.93 d−1 (2.5 mmag) 7.4440 0.0036 9.0553 0.0055
0 10 20 30
0
0 10 20 30
0
0 10 20 30
0
0.2
0.4
0.6
0.8
1
Fig. 10. Fourier power spectrum of theB1 data of HD 93521.The top panel yields the raw power spectrum, whilst the mid-dle panel corresponds to the power spectrum of the time se-ries prewhitened for three frequencies (2.04, 6.74 and 8.54d−1).The lower panel displays the spectral window of the photometrictime series.
Table 2 also lists the mean magnitudes and the 1-σ stan-dard deviations of the measurements of HD 93521 as well as oftwo reference stars (HD 90250, K1 III and HD 96951, A1 V) thatwere observed during the same campaign. The dispersion of themeasurements of HD 93521 is always larger than those of thereference stars including in the filters where HD 93521 is signif-icantly brighter than the reference stars. The only exception istheU filter where the largest value ofσ is found for HD 90250,however this star is by far the faintest in theU band. We fur-ther note that the Fourier power spectra of both reference starsare quite different from those of HD 93521 and are essentiallyconsistent with white noise.
In summary, HD 93521 appears to be slightly variable inphotometry, though the frequency content of the variationsisrather complex and the frequencies found in the photometrictime series have very small amplitudes. It is likely that an evenlonger time series of very accurate photometric measurements
(maybe from a space-borne observatory) is needed to disentan-gle the frequency spectrum.
4. Discussion
4.1. General properties
A summary of the amplitudes of all the frequencies detected inthe spectroscopic part of this study is provided in Table 3.
A first conclusion from this table is that theν1 frequency isnot always detected: while it clearly dominates in the April2005data of the Hei λ6678 line, it is absent from our February 1997time series of the same line. Also, this frequency is never de-tected in the Hα line profile variations. In the Hei λλ 5876 and6678 lines, this frequency is associated with a maximum semi-amplitude of modulation of 0.004 – 0.006 in units of the con-tinuum. On the other hand,ν2 or its aliases are detected in eachline and each observing campaign. The maximum semiampli-tudes of this mode are 0.003 (Hei λλ 5876, 6678 in 2006 andApril 2005), 0.006 (Hα, February 1997) and 0.008 (Hei λ 6678,February 1997) in units of the continuum.
Another conclusion is the lack of any significant signal attheν3 = 2.66 d−1 frequency (P3 = 9.0±1.2hr) that was reportedby Howarth et al. (1998) from their analysis of 103IUE spectrawith a median sampling of 0.60 hr. This frequency is thus appar-ently absent from our data, except perhaps for the detectionofthe 2.51 d−1 signal in the April 2005 SPM Hα data.
Generally speaking, the (low-level) periodic variations withfrequenciesν1 andν2 are not the dominant source of line profilevariations in any of the lines investigated here (except forthe Heiλ 6678 line in April 2005). In the majority of the cases, the mostimportant variations are actually characterized by low frequen-cies. These low-frequency variations affect both the core of thelines as well as the wings and emission lobes (in the case of theHα and Hei λ 5876 lines). Apparently, these modulations do notoccur with a single stable clock: none of the low frequenciesisdetected in more than one line and for more than one observingcampaign (except perhaps for the frequency around 1.10 d−1).It seems thus more appropriate to talk about time scales thanperiods for these longer term variations. This result castsdoubton a rotational modulation as the origin of the long-term vari-ations: Howarth & Reid (1993) reported the analysis of 21 op-tical echelle spectra of HD 93521 acquired over two nights inFebruary 1992. From the variations of the emission wings of theHα and Hei λ 5876 lines, these authors estimated a rotationalperiod of 35 hr (ν = 0.69 d−1). None of the lines investigatedhere displays a significant signal at this frequency. The closestdetections are found for the 1997 OHP Hα data (the alias of thehighest peak at 0.70 d−1) and for the same line observed in 2005
10 G. Rauw et al.: Spectroscopic and photometric variability ofthe O9.5 Vp star HD 93521
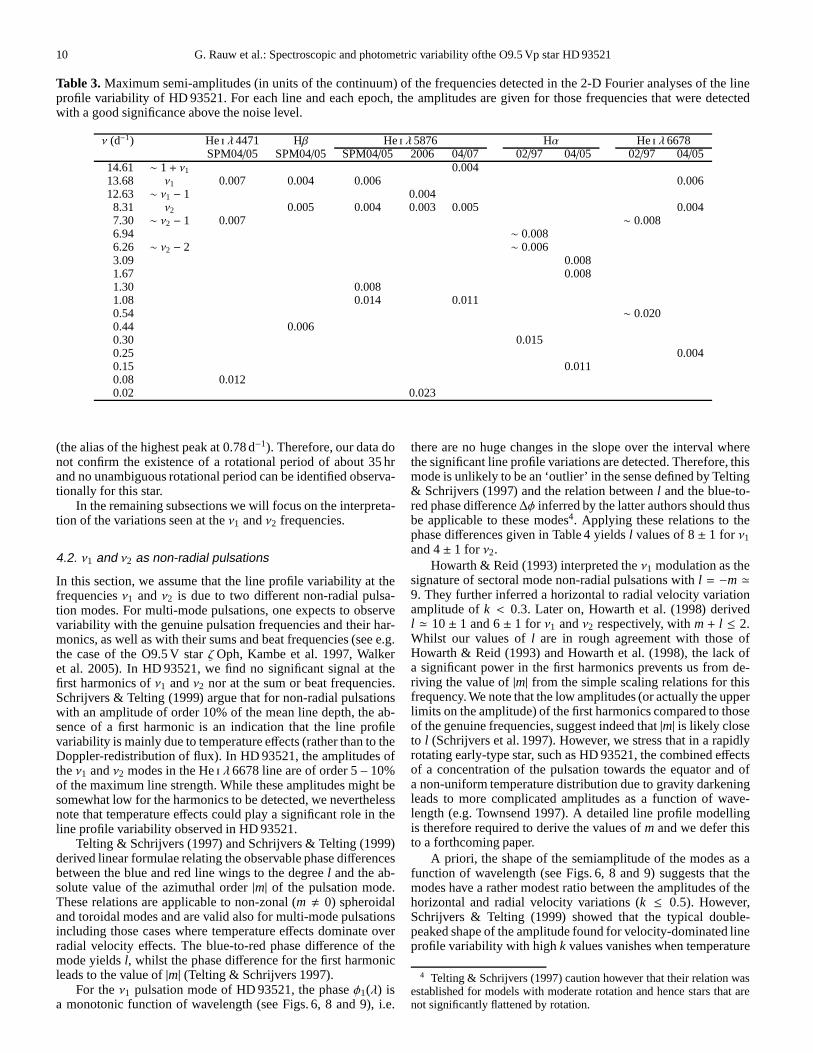
Table 3. Maximum semi-amplitudes (in units of the continuum) of the frequencies detected in the 2-D Fourier analyses of the lineprofile variability of HD 93521. For each line and each epoch,the amplitudes are given for those frequencies that were detectedwith a good significance above the noise level.
ν (d−1) Hei λ4471 Hβ Hei λ5876 Hα Hei λ6678SPM04/05 SPM04/05 SPM04/05 2006 04/07 02/97 04/05 02/97 04/05
14.61 ∼ 1+ ν1 0.00413.68 ν1 0.007 0.004 0.006 0.00612.63 ∼ ν1 − 1 0.0048.31 ν2 0.005 0.004 0.003 0.005 0.0047.30 ∼ ν2 − 1 0.007 ∼ 0.0086.94 ∼ 0.0086.26 ∼ ν2 − 2 ∼ 0.0063.09 0.0081.67 0.0081.30 0.0081.08 0.014 0.0110.54 ∼ 0.0200.44 0.0060.30 0.0150.25 0.0040.15 0.0110.08 0.0120.02 0.023
(the alias of the highest peak at 0.78 d−1). Therefore, our data donot confirm the existence of a rotational period of about 35 hrand no unambiguous rotational period can be identified observa-tionally for this star.
In the remaining subsections we will focus on the interpreta-tion of the variations seen at theν1 andν2 frequencies.
4.2. ν1 and ν2 as non-radial pulsations
In this section, we assume that the line profile variability at thefrequenciesν1 andν2 is due to two different non-radial pulsa-tion modes. For multi-mode pulsations, one expects to observevariability with the genuine pulsation frequencies and their har-monics, as well as with their sums and beat frequencies (see e.g.the case of the O9.5 V starζOph, Kambe et al. 1997, Walkeret al. 2005). In HD 93521, we find no significant signal at thefirst harmonics ofν1 andν2 nor at the sum or beat frequencies.Schrijvers & Telting (1999) argue that for non-radial pulsationswith an amplitude of order 10% of the mean line depth, the ab-sence of a first harmonic is an indication that the line profilevariability is mainly due to temperature effects (rather than to theDoppler-redistribution of flux). In HD 93521, the amplitudes oftheν1 andν2 modes in the Hei λ 6678 line are of order 5 – 10%of the maximum line strength. While these amplitudes might besomewhat low for the harmonics to be detected, we neverthelessnote that temperature effects could play a significant role in theline profile variability observed in HD 93521.
Telting & Schrijvers (1997) and Schrijvers & Telting (1999)derived linear formulae relating the observable phase differencesbetween the blue and red line wings to the degreel and the ab-solute value of the azimuthal order|m| of the pulsation mode.These relations are applicable to non-zonal (m , 0) spheroidaland toroidal modes and are valid also for multi-mode pulsationsincluding those cases where temperature effects dominate overradial velocity effects. The blue-to-red phase difference of themode yieldsl, whilst the phase difference for the first harmonicleads to the value of|m| (Telting & Schrijvers 1997).
For theν1 pulsation mode of HD 93521, the phaseφ1(λ) isa monotonic function of wavelength (see Figs. 6, 8 and 9), i.e.
there are no huge changes in the slope over the interval wherethe significant line profile variations are detected. Therefore, thismode is unlikely to be an ‘outlier’ in the sense defined by Telting& Schrijvers (1997) and the relation betweenl and the blue-to-red phase difference∆φ inferred by the latter authors should thusbe applicable to these modes4. Applying these relations to thephase differences given in Table 4 yieldsl values of 8± 1 for ν1and 4± 1 for ν2.
Howarth & Reid (1993) interpreted theν1 modulation as thesignature of sectoral mode non-radial pulsations withl = −m ≃9. They further inferred a horizontal to radial velocity variationamplitude ofk < 0.3. Later on, Howarth et al. (1998) derivedl ≃ 10± 1 and 6± 1 for ν1 andν2 respectively, withm + l ≤ 2.Whilst our values ofl are in rough agreement with those ofHowarth & Reid (1993) and Howarth et al. (1998), the lack ofa significant power in the first harmonics prevents us from de-riving the value of|m| from the simple scaling relations for thisfrequency. We note that the low amplitudes (or actually the upperlimits on the amplitude) of the first harmonics compared to thoseof the genuine frequencies, suggest indeed that|m| is likely closeto l (Schrijvers et al. 1997). However, we stress that in a rapidlyrotating early-type star, such as HD 93521, the combined effectsof a concentration of the pulsation towards the equator and ofa non-uniform temperature distribution due to gravity darkeningleads to more complicated amplitudes as a function of wave-length (e.g. Townsend 1997). A detailed line profile modellingis therefore required to derive the values ofm and we defer thisto a forthcoming paper.
A priori, the shape of the semiamplitude of the modes as afunction of wavelength (see Figs. 6, 8 and 9) suggests that themodes have a rather modest ratio between the amplitudes of thehorizontal and radial velocity variations (k ≤ 0.5). However,Schrijvers & Telting (1999) showed that the typical double-peaked shape of the amplitude found for velocity-dominatedlineprofile variability with highk values vanishes when temperature
4 Telting & Schrijvers (1997) caution however that their relation wasestablished for models with moderate rotation and hence stars that arenot significantly flattened by rotation.
G. Rauw et al.: Spectroscopic and photometric variability ofthe O9.5 Vp star HD 93521 11
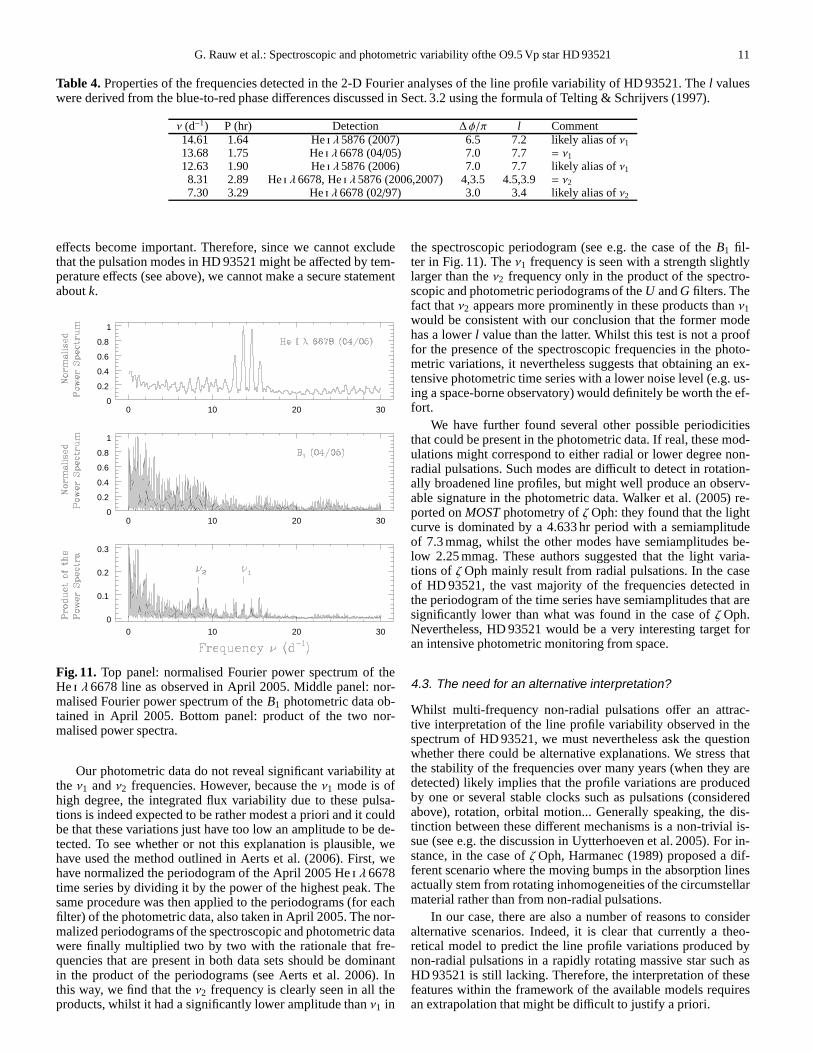
Table 4. Properties of the frequencies detected in the 2-D Fourier analyses of the line profile variability of HD 93521. Thel valueswere derived from the blue-to-red phase differences discussed in Sect. 3.2 using the formula of Telting &Schrijvers (1997).
ν (d−1) P (hr) Detection ∆φ/π l Comment14.61 1.64 Hei λ5876 (2007) 6.5 7.2 likely alias ofν113.68 1.75 Hei λ6678 (04/05) 7.0 7.7 = ν112.63 1.90 Hei λ5876 (2006) 7.0 7.7 likely alias ofν18.31 2.89 Hei λ6678, Hei λ5876 (2006,2007) 4,3.5 4.5,3.9= ν27.30 3.29 Hei λ6678 (02/97) 3.0 3.4 likely alias ofν2
effects become important. Therefore, since we cannot excludethat the pulsation modes in HD 93521 might be affected by tem-perature effects (see above), we cannot make a secure statementaboutk.
0 10 20 300
0.2
0.4
0.6
0.8
1
0 10 20 300
0.2
0.4
0.6
0.8
1
0 10 20 30
0
0.1
0.2
0.3
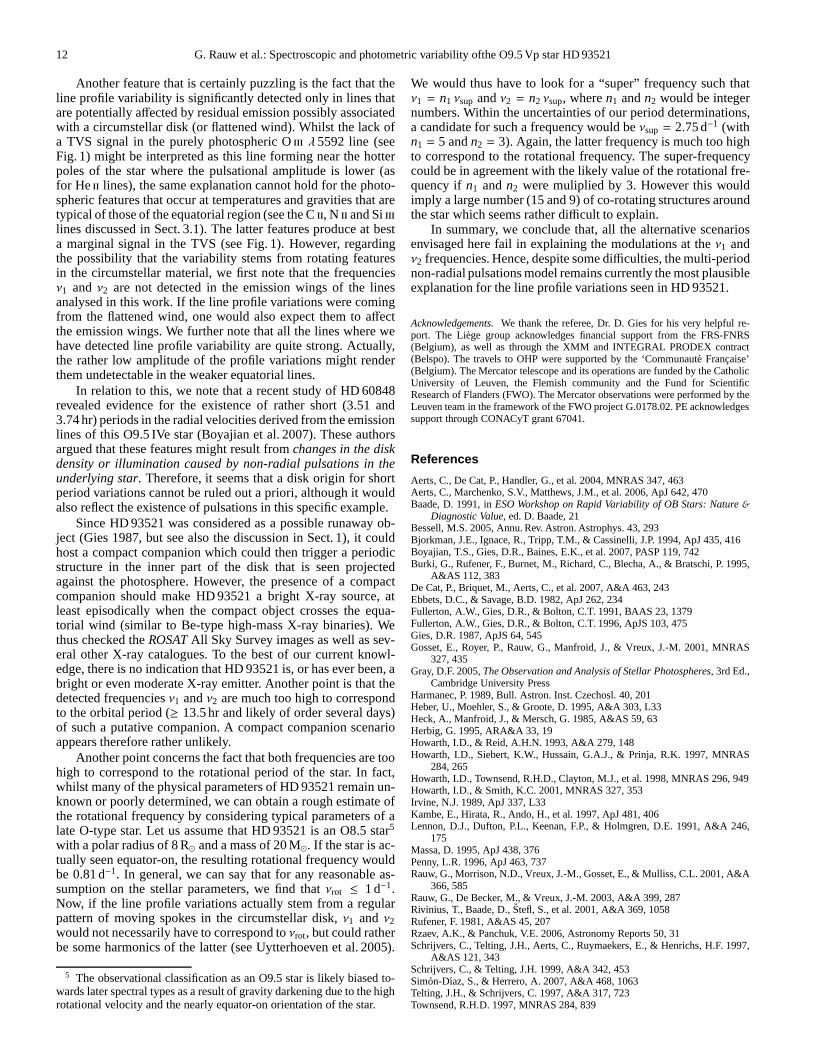
Fig. 11. Top panel: normalised Fourier power spectrum of theHei λ 6678 line as observed in April 2005. Middle panel: nor-malised Fourier power spectrum of theB1 photometric data ob-tained in April 2005. Bottom panel: product of the two nor-malised power spectra.
Our photometric data do not reveal significant variability atthe ν1 andν2 frequencies. However, because theν1 mode is ofhigh degree, the integrated flux variability due to these pulsa-tions is indeed expected to be rather modest a priori and it couldbe that these variations just have too low an amplitude to be de-tected. To see whether or not this explanation is plausible,wehave used the method outlined in Aerts et al. (2006). First, wehave normalized the periodogram of the April 2005 Hei λ 6678time series by dividing it by the power of the highest peak. Thesame procedure was then applied to the periodograms (for eachfilter) of the photometric data, also taken in April 2005. Thenor-malized periodograms of the spectroscopic and photometricdatawere finally multiplied two by two with the rationale that fre-quencies that are present in both data sets should be dominantin the product of the periodograms (see Aerts et al. 2006). Inthis way, we find that theν2 frequency is clearly seen in all theproducts, whilst it had a significantly lower amplitude thanν1 in
the spectroscopic periodogram (see e.g. the case of theB1 fil-ter in Fig. 11). Theν1 frequency is seen with a strength slightlylarger than theν2 frequency only in the product of the spectro-scopic and photometric periodograms of theU andG filters. Thefact thatν2 appears more prominently in these products thanν1would be consistent with our conclusion that the former modehas a lowerl value than the latter. Whilst this test is not a prooffor the presence of the spectroscopic frequencies in the photo-metric variations, it nevertheless suggests that obtaining an ex-tensive photometric time series with a lower noise level (e.g. us-ing a space-borne observatory) would definitely be worth theef-fort.
We have further found several other possible periodicitiesthat could be present in the photometric data. If real, thesemod-ulations might correspond to either radial or lower degree non-radial pulsations. Such modes are difficult to detect in rotation-ally broadened line profiles, but might well produce an observ-able signature in the photometric data. Walker et al. (2005)re-ported onMOST photometry ofζOph: they found that the lightcurve is dominated by a 4.633 hr period with a semiamplitudeof 7.3 mmag, whilst the other modes have semiamplitudes be-low 2.25 mmag. These authors suggested that the light varia-tions of ζOph mainly result from radial pulsations. In the caseof HD 93521, the vast majority of the frequencies detected inthe periodogram of the time series have semiamplitudes thataresignificantly lower than what was found in the case ofζOph.Nevertheless, HD 93521 would be a very interesting target foran intensive photometric monitoring from space.
4.3. The need for an alternative interpretation?
Whilst multi-frequency non-radial pulsations offer an attrac-tive interpretation of the line profile variability observed in thespectrum of HD 93521, we must nevertheless ask the questionwhether there could be alternative explanations. We stressthatthe stability of the frequencies over many years (when they aredetected) likely implies that the profile variations are producedby one or several stable clocks such as pulsations (consideredabove), rotation, orbital motion... Generally speaking, the dis-tinction between these different mechanisms is a non-trivial is-sue (see e.g. the discussion in Uytterhoeven et al. 2005). For in-stance, in the case ofζOph, Harmanec (1989) proposed a dif-ferent scenario where the moving bumps in the absorption linesactually stem from rotating inhomogeneities of the circumstellarmaterial rather than from non-radial pulsations.
In our case, there are also a number of reasons to consideralternative scenarios. Indeed, it is clear that currently atheo-retical model to predict the line profile variations produced bynon-radial pulsations in a rapidly rotating massive star such asHD 93521 is still lacking. Therefore, the interpretation ofthesefeatures within the framework of the available models requiresan extrapolation that might be difficult to justify a priori.
12 G. Rauw et al.: Spectroscopic and photometric variability ofthe O9.5 Vp star HD 93521
Another feature that is certainly puzzling is the fact that theline profile variability is significantly detected only in lines thatare potentially affected by residual emission possibly associatedwith a circumstellar disk (or flattened wind). Whilst the lack ofa TVS signal in the purely photospheric Oiii λ 5592 line (seeFig. 1) might be interpreted as this line forming near the hotterpoles of the star where the pulsational amplitude is lower (asfor Heii lines), the same explanation cannot hold for the photo-spheric features that occur at temperatures and gravities that aretypical of those of the equatorial region (see the Cii, N ii and Siiiilines discussed in Sect. 3.1). The latter features produce at besta marginal signal in the TVS (see Fig. 1). However, regardingthe possibility that the variability stems from rotating featuresin the circumstellar material, we first note that the frequenciesν1 and ν2 are not detected in the emission wings of the linesanalysed in this work. If the line profile variations were comingfrom the flattened wind, one would also expect them to affectthe emission wings. We further note that all the lines where wehave detected line profile variability are quite strong. Actually,the rather low amplitude of the profile variations might renderthem undetectable in the weaker equatorial lines.
In relation to this, we note that a recent study of HD 60848revealed evidence for the existence of rather short (3.51 and3.74 hr) periods in the radial velocities derived from the emissionlines of this O9.5 IVe star (Boyajian et al. 2007). These authorsargued that these features might result fromchanges in the diskdensity or illumination caused by non-radial pulsations in theunderlying star. Therefore, it seems that a disk origin for shortperiod variations cannot be ruled out a priori, although it wouldalso reflect the existence of pulsations in this specific example.
Since HD 93521 was considered as a possible runaway ob-ject (Gies 1987, but see also the discussion in Sect. 1), it couldhost a compact companion which could then trigger a periodicstructure in the inner part of the disk that is seen projectedagainst the photosphere. However, the presence of a compactcompanion should make HD 93521 a bright X-ray source, atleast episodically when the compact object crosses the equa-torial wind (similar to Be-type high-mass X-ray binaries).Wethus checked theROSAT All Sky Survey images as well as sev-eral other X-ray catalogues. To the best of our current knowl-edge, there is no indication that HD 93521 is, or has ever been, abright or even moderate X-ray emitter. Another point is thatthedetected frequenciesν1 andν2 are much too high to correspondto the orbital period (≥ 13.5 hr and likely of order several days)of such a putative companion. A compact companion scenarioappears therefore rather unlikely.
Another point concerns the fact that both frequencies are toohigh to correspond to the rotational period of the star. In fact,whilst many of the physical parameters of HD 93521 remain un-known or poorly determined, we can obtain a rough estimate ofthe rotational frequency by considering typical parameters of alate O-type star. Let us assume that HD 93521 is an O8.5 star5
with a polar radius of 8 R⊙ and a mass of 20 M⊙. If the star is ac-tually seen equator-on, the resulting rotational frequency wouldbe 0.81 d−1. In general, we can say that for any reasonable as-sumption on the stellar parameters, we find thatνrot ≤ 1 d−1.Now, if the line profile variations actually stem from a regularpattern of moving spokes in the circumstellar disk,ν1 and ν2would not necessarily have to correspond toνrot, but could ratherbe some harmonics of the latter (see Uytterhoeven et al. 2005).
5 The observational classification as an O9.5 star is likely biased to-wards later spectral types as a result of gravity darkening due to the highrotational velocity and the nearly equator-on orientationof the star.
We would thus have to look for a “super” frequency such thatν1 = n1 νsup andν2 = n2 νsup, wheren1 andn2 would be integernumbers. Within the uncertainties of our period determinations,a candidate for such a frequency would beνsup = 2.75 d−1 (withn1 = 5 andn2 = 3). Again, the latter frequency is much too highto correspond to the rotational frequency. The super-frequencycould be in agreement with the likely value of the rotationalfre-quency ifn1 andn2 were muliplied by 3. However this wouldimply a large number (15 and 9) of co-rotating structures aroundthe star which seems rather difficult to explain.
In summary, we conclude that, all the alternative scenariosenvisaged here fail in explaining the modulations at theν1 andν2 frequencies. Hence, despite some difficulties, the multi-periodnon-radial pulsations model remains currently the most plausibleexplanation for the line profile variations seen in HD 93521.
Acknowledgements. We thank the referee, Dr. D. Gies for his very helpful re-port. The Liege group acknowledges financial support from the FRS-FNRS(Belgium), as well as through the XMM and INTEGRAL PRODEX contract(Belspo). The travels to OHP were supported by the ‘Communaute Francaise’(Belgium). The Mercator telescope and its operations are funded by the CatholicUniversity of Leuven, the Flemish community and the Fund forScientificResearch of Flanders (FWO). The Mercator observations wereperformed by theLeuven team in the framework of the FWO project G.0178.02. PEacknowledgessupport through CONACyT grant 67041.
References
Aerts, C., De Cat, P., Handler, G., et al. 2004, MNRAS 347, 463Aerts, C., Marchenko, S.V., Matthews, J.M., et al. 2006, ApJ642, 470Baade, D. 1991, inESO Workshop on Rapid Variability of OB Stars: Nature &
Diagnostic Value, ed. D. Baade, 21Bessell, M.S. 2005, Annu. Rev. Astron. Astrophys. 43, 293Bjorkman, J.E., Ignace, R., Tripp, T.M., & Cassinelli, J.P.1994, ApJ 435, 416Boyajian, T.S., Gies, D.R., Baines, E.K., et al. 2007, PASP 119, 742Burki, G., Rufener, F., Burnet, M., Richard, C., Blecha, A.,& Bratschi, P. 1995,
A&AS 112, 383De Cat, P., Briquet, M., Aerts, C., et al. 2007, A&A 463, 243Ebbets, D.C., & Savage, B.D. 1982, ApJ 262, 234Fullerton, A.W., Gies, D.R., & Bolton, C.T. 1991, BAAS 23, 1379Fullerton, A.W., Gies, D.R., & Bolton, C.T. 1996, ApJS 103, 475Gies, D.R. 1987, ApJS 64, 545Gosset, E., Royer, P., Rauw, G., Manfroid, J., & Vreux, J.-M.2001, MNRAS
327, 435Gray, D.F. 2005,The Observation and Analysis of Stellar Photospheres, 3rd Ed.,
Cambridge University PressHarmanec, P. 1989, Bull. Astron. Inst. Czechosl. 40, 201Heber, U., Moehler, S., & Groote, D. 1995, A&A 303, L33Heck, A., Manfroid, J., & Mersch, G. 1985, A&AS 59, 63Herbig, G. 1995, ARA&A 33, 19Howarth, I.D., & Reid, A.H.N. 1993, A&A 279, 148Howarth, I.D., Siebert, K.W., Hussain, G.A.J., & Prinja, R.K. 1997, MNRAS
284, 265Howarth, I.D., Townsend, R.H.D., Clayton, M.J., et al. 1998, MNRAS 296, 949Howarth, I.D., & Smith, K.C. 2001, MNRAS 327, 353Irvine, N.J. 1989, ApJ 337, L33Kambe, E., Hirata, R., Ando, H., et al. 1997, ApJ 481, 406Lennon, D.J., Dufton, P.L., Keenan, F.P., & Holmgren, D.E. 1991, A&A 246,
175Massa, D. 1995, ApJ 438, 376Penny, L.R. 1996, ApJ 463, 737Rauw, G., Morrison, N.D., Vreux, J.-M., Gosset, E., & Mulliss, C.L. 2001, A&A
366, 585Rauw, G., De Becker, M., & Vreux, J.-M. 2003, A&A 399, 287Rivinius, T., Baade, D.,Stefl, S., et al. 2001, A&A 369, 1058Rufener, F. 1981, A&AS 45, 207Rzaev, A.K., & Panchuk, V.E. 2006, Astronomy Reports 50, 31Schrijvers, C., Telting, J.H., Aerts, C., Ruymaekers, E., &Henrichs, H.F. 1997,
A&AS 121, 343Schrijvers, C., & Telting, J.H. 1999, A&A 342, 453Simon-Dıaz, S., & Herrero, A. 2007, A&A 468, 1063Telting, J.H., & Schrijvers, C. 1997, A&A 317, 723Townsend, R.H.D. 1997, MNRAS 284, 839

G. Rauw et al.: Spectroscopic and photometric variability ofthe O9.5 Vp star HD 93521 13
Townsend, R.H.D., Owocki, S.P., & Howarth, I.D. 2004, MNRAS350, 189Uytterhoeven, K., Briquet, M., Aerts, C., Telting, J.H., Harmanec, P., Lefever,
K., & Cuypers, J. 2005, A&A 432, 955Walborn, N.R. 1980, ApJS 44, 535Walker, G.A.H., Kuschnig, R., Matthews, J.M., et al. 2005, ApJ 623, L145Zima, W. 2006, A&A 455, 227
List of Objects‘HD 93521’ on page 1


