Embed Size (px)
Citation preview

Spectroscopical and mechanicalcharacterization of normal and
thalassemic red blood cells by RamanTweezers
Anna Chiara De Luca, 1,2 Giulia Rusciano, 1,2∗ Rosanna Ciancia, 3
Vincenzo Martinelli, 3 Giuseppe Pesce, 1,4 Bruno Rotoli, 3 LaraSelvaggi, 1 Antonio Sasso, 1,2
1 Dipartimento di Scienze Fisiche, Universita di Napoli “Federico II”, ComplessoUniversitario Monte S. Angelo, Via Cinthia, 80126 Napoli, Italy
2 CNISM - Consorzio Nazionale Interuniversitario per le Scienze Fisiche della Materia - Sededi Napoli
3 Hematology Unit, Biochemistry and Medical Biotechnology DepartmentUniversita degli Studi di Napoli Federico II, Napoli, Italy
4 CNR - Coherentia - Unita di Napoli
∗Corresponding author: [email protected]
Abstract: In this work, the effects of thalassemia, a blood disease quitediffuse in the Mediterranean sea region, have been investigated at singlecell level using a Raman Tweezers system. By resonant excitation ofhemoglobin Raman bands, we have examined the oxygenation capabilityof β -thalassemic erythrocytes. A reduction of this fundamental erythrocytefunction has been found. The measurements have been performed on asignificant number of red blood cells; the relative statistical analysis ispresented. Moreover, the response to photo-induced oxidative stress ofdiseased cells with respect to the normal ones has been analyzed. Finally,the deformability of thalassemic erythrocytes has been quantified bymeasuring the membrane shear modulus by using a double-trap system:the measurements have revealed an increase in membrane rigidity of morethan 40%, giving evidence that the genetic defect associated to thalassemia,which manly relies on hemoglobin structure, also strongly affects the ery-throcyte mechanical properties. Our results demonstrate that the developedset-up may have potential for the monitoring of blood diseases and theirresponse to drug therapies.
© 2008 Optical Society of America
OCIS codes: (170.4520) Optical confinement and manipulation; (170.5660) Raman Spec-troscopy; (170.1470) Blood or tissue constituent monitoring.
References and links1. A. Ashkin, J. M. Dziedzic, J. E. Bjorkholm and S. Chu, “Observation of a single-beam gradient force optical trap
for dielectric particles,” Opt. Lett. 11, 288–290 (1986).2. A. Ashkin and J. M. Dziedzic, “Optical trapping and manipulation of virus and bacteria,” Science 235, 1517–
1520 (1987).
#91619 - $15.00 USD Received 15 Jan 2008; revised 25 Feb 2008; accepted 2 Mar 2008; published 19 May 2008
(C) 2008 OSA 26 May 2008 / Vol. 16, No. 11 / OPTICS EXPRESS 7943

3. K. Svoboda, C. F. Schmidt, D. Branton and S. M. Block, “Conformation and elasticity of the isolated red bloodcell membrane skeleton,” Biophys. J. 63, 784–793 (1992).
4. R. Petry, M. Schmitt and J. Popp, “Raman spectroscopy - a prospective tool in the life sciences,” Chem. Phys.Chem. 4, 15–30 (2003).
5. P. J. Lambert, A. G. Whitman, O. F. Dyson and S. M. Akula, “Raman spectroscopy: the gateway into tomorrow’svirology,” J. Virol. 3, 1–8 (2006).
6. C. M. Harris, “Raman revisited,” Anal Chem. 74, 433A–438A (2002).7. M. Dekker, Infrared and Raman spectroscopy of biological materials, (H.U. Gremlich and B. Yan, New York,
2001).8. J. M. Salter, “The effect of radiation trapping of high intensity scattered radiation on multiphoton ionization rates
and resonance fluorescence,” J. Phys. B: Atom. Molec. Phys. 12, L763–L767 (1979).9. Y. Liu, G. J. Sonek, M. K. Berns, K. Konig and B. J. Brock, “Two-photon fluorescence excitation in continuous-
wave infrared optical tweezers,” Opt. Lett. 20, 2246–2248 (1995).10. M. P. Houlne, C. M. Sjostrom, R. H. Uibel, J. A. Kleimeyer and J. M. Harris, “Confocal Raman Microscopy for
Monitoring Chemical Reactions on Single Optically Trapped, Solid-Phase Support Particles,” Anal. Chem. 74,4311–4319 (2002).
11. J. C. Carls, G. Monaivais and J. R. Brock, “Time-resolved Raman Spectroscopy from reacting optically levitatedmicrodroplets,” Appl. Opt. 29, 2913–2918 (1990).
12. M. Lankers, J. Popp and W. Kiefer, “Raman and Fluorescence Spectra of Single Optically-Trapped Microdropletsin Emulsionsby,” Appl. Spectrosc. 48, 1166–1168 (1994).
13. K. Ajito, “Combined Near-Infrared Raman Microprobe and Laser Trapping System: Application to the Analysisof a Single Organic Microdroplet in Water,” Appl. Spectrosc. 52, 339–342 (1998).
14. K. Ajito and K. Torimitsu, “Near-infrared Raman spectroscopy of single particles,” Trends Anal. Chem. 20,255–262 (2001).
15. G. J. Thomas, “Raman spectroscopy of protein and nucleic acid assemblies,” Annu. Rev. Biophys. Biomol. Struct.28, 1–27 (1999).
16. J. W. Chan, D. S. Taylor, T. Zwerdling, S. M. Lane, K. Ihara and T. Huser, “Micro-Raman spectroscopy detectsindividual neoplastic and normal hematopoietic cells,” Biophys. J. 90, 648–656 (2006).
17. G. Rusciano, A. C. De Luca, G. Pesce and A. Sasso, “Phase-sensitive detection in Raman tweezers,” Appl. Phys.Lett. 89, 261116–261118 (2006).
18. C. M. Creely, G. P. Singh and D. V. Petrov, “Dual wavelength optical tweezers for confocal Raman spectroscopy,”Opt. Commun. 245, 465–470 (2005).
19. D. Cojoc, E. Ferrari, V. Gabin and E. Di Fabrizio, “Multiple optical tweezers for micro Raman spectroscopy,”Proc. SPIE 5930, 59300B1–11 (2005).
20. P. R. T. Jess, V. Garcs-Chvez, D. Smith, M. Mazilu, L. Paterson, A. Riches, C. S. Herrington, W. Sibbett andK. Dholakia, “Dual beam fibre trap for Raman micro-spectroscopy of single cells,” Opt. Express 14, 5779–5791(2006).
21. G. P. Singh, G. Volpe, C. M. Creely, H. Grotsch, I. M. Geli and D. Petrov, “The lag phase and G1 phase of asingle yeast cell monitored by Raman microspectroscopy,” J. Raman Spectrosc. 37, 858–864 (2006).
22. C. Creely, G. Volpe, G. Singh, M. Soler and D. Petrov, “Raman imaging of floating cells,” Opt. Express 13,6105–6110 (2005).
23. C. Xie, M. A. Dinno and Y.-Q. Li, “Near-infrared Raman spectroscopy of single optically trapped biologicalcells,” Opt. Lett. 27, 249–251 (2002).
24. C. Xie and Y.-Q. Li, “Confocal micro-Raman spectroscopy of single biological cells using optical trapping andshifted excitation difference techniques,” J. Appl. Phys. 93, 2982–2986 (2003).
25. C. Xie, C. Goodman, M. Dinno and Y.-Q. Li, “Real-time Raman spectroscopy of optically trapped living cellsand organelles,” Opt. Express 12, 6208–6214 (2004).
26. C. Xie, D. Chen and Y.-Q. Li, “Raman sorting and identification of single living micro-organisms with opticaltweezers,” Opt. Lett. 30, 1800–1802 (2005).
27. T. G. Spiro and X-Y. Li, Biological Application of Raman Spectroscopy, (Wiley, New York, 1988).28. H. Brunner, A. Mayer and H. Sussner, “Resonance Raman Scattering on the heam group of the oxy- and deoxy-
haemogloin,” J. Mol. Biol. 70, 153–156 (1972).29. B. R. Wood, B. Tait and D. McNaughton, “Micro-Raman characterization of the R to T state transition of
haemoglobin within a single living erythrocyte,” Biochim. Biophys. Acta 1539, 58–70 (2001).30. B. R. Wood, P. Caspers, G. J. Pupples, S. Pandiancherri and D. McNaughton, “Resonance Raman Spectroscopy
of red blood cell using near-infrared laser excitation,” Anal. Bioanal. Chem. 387, 1691–1703 (2007).31. K. Ramser, K. Logg, M. Gokor, M. Kall and D. Hanstorp, “Resonance Raman spectroscopy of optically trapped
functional erythrocytes,” J. Biomed. Opt. 9, 593–600 (2004).32. B. R. Wood and D. McNaughton, “Raman excitation wavelength investigation of single red blood cell in vivo,”
J. Raman Spectrosc. 33, 517–523 (2002).33. I. P. Torres Filho, J. Terner, R. N. Pittman, L. G. Somera and K. R. Ward, “Hemoglobin oxygen saturation
measurements using resonance Raman intravital microscopy,” Am. J. Physiol. Heart Circ. Physiol. 289, 488–495
#91619 - $15.00 USD Received 15 Jan 2008; revised 25 Feb 2008; accepted 2 Mar 2008; published 19 May 2008
(C) 2008 OSA 26 May 2008 / Vol. 16, No. 11 / OPTICS EXPRESS 7944

(2004).34. K. Ramser, J. Enger, M. Gokor, D. Hanstorp, K. Logg and M. Kall, “A microfluidic system enabling Raman
measurements of the oxygenation cycle in single optically trapped red blood cells,” Lab Chip 5, 431–436 (2005).35. R. L. McCreery, “Raman Shift Frequency Standards: Polystyrene,”
http://www.chemistry.ohio-state.edu/∼rmccreer/freqcorr/images/poly.html.36. G. Rusciano, A. C. De Luca, G. Pesce and A. Sasso, “Enhancing Raman Tweezers by phase-sensitive detection,”
Anal. Chem. 79, 3708–3715 (2007).37. M. Abe, T. Kitagawa and Y. Kyogoku, “Resonance Raman spectra of octaethylporphyrinato-Ni(II) and
mesodeuterated and 15N substituted derivatives. II. A normal coordinate analysis,” J. Chem. Phys. 69, 4526–4531 (1978).
38. S. Hu, K. M. Smith and T. G. Spiro, “Assignment of Protoheme Resonance Raman Spectrum by Heme Labelingin Myoglobin” J. Am. Chem. Soc. 118, 12638–12646 (1996).
39. I. Kahane, A. Shifter and E. A. Rachmilewitz, “Cross linking of red blood cells membrane proteins induced byoxidative stress in beta-thalassemia,” FEBS Lett. 85, 267–270 (1978).
40. E. A. Rachmilewitz, B. M. Lubin and S. B. Shohet, “Lipid membrane peroxidation in beta-thalassemia,” Blood47, 495–505 (1976).
41. E. Shinar, E. A. Rachmilewitz and S. E. Lux, “Differing erythrocyte membrane skeletal protein defects in alphaand beta thalassemia,” J. Clin. Invest. 83, 404–410 (1989).
42. S. K. Boey, D. H. Boal and D. E. Discher, “Simulations of the erythrocyte cytoskeleton at large deformation. I.Microscopic models,” Biophys. J. 75, 1573–1583 (1998).
43. D. E. Discher, D. H. Boal and S. K. Boey, “Simulations of the erythrocyte cytoskeleton at large deformation. II.Micropipette aspiration,” Biophys. J. 75, 1584–1597 (1998).
44. J. Li, M. Dao, C. T. Lim and S. Suresh, “Spectrin-level modeling of the cytoskeleton and optical tweezers stretch-ing of the erythrocyte,” Biophys. J. 88, 3707–3719 (2005).
45. G. Lenormand, S. Henon, A. Richert and F. Gallet, “Direct measurement of the area expansion and shear moduliof the human red blood cell membrane skeleton,” Biophys. J. 81, 43–56 (2001).
46. S. Henon, G. Lenormand, A. Richert and F. Gallet, “A new determination of the shear modulus of the humanerythrocyte membrane using optical tweezers,” Biophys. J. 76, 1145–1151 (1999).
47. E. A. Evans and N. Mohandas, “Membrane-associated sickle hemoglobin: a major determinant of sickle erythro-cyte rigidity,” Blood 70, 1443–1449 (1987).
48. E. A. Evans, “A new membrane concept applied to the analysis of fluid shear- and micropipette-deformed redblood cells,” Biophys. J. 13, 941–954 (1973).
49. D. J. Weatherall and J. B. Clegg, “Thalassemia revisited,” Cell 29, 7–9 (1982).50. G. Athanasiou, N. Zoubos and Y. Missirlis, “Erytrhrocyte membrane deformability in patients with thalassemia
syndromes,” Nouv. Rev. Fr. Hematol. 33, 15–20 (1991).51. O. Inya-Agha, N. Klauke, T. Davies, G. Smith and J. M. Cooper, “Spectroscopic Probing of Dynamic Changes
during Stimulation and Cell Remodeling in the Single Cardiac Myocyte,” Anal. Chem. 79, 4581–4587 (2007).52. K. Mohanty, S. Mohanty, S. Monajembashi, K. O. O Greulich, “Orientation of erythrocytes in optical trap re-
vealed by confocal fluorescence microscopy,” J. Biomed. Opt. 12, 0605061–0605063 (2007).
1. Introduction
The composition and conformation of biomolecules within a living cell may change in responseto external agents, such as environmental stress or drug administration, or in presence of cellulardisorders. Rapid identification of these changes, at single cell level, is a challenging topic formany biomedical applications, and for the understanding of fundamental cellular processes.
Optical Tweezers (OT) [1] have revealed to be a powerful tool to address this issue. Based onthe use of a strongly focused laser beam, they allow trapping and manipulation of micro-sizedobjects in absence of mechanical contact [2]. Optical trapping allows cell immobilization with-out fixing it to a substrate, avoiding adsorption-induced effects. In addition, it becomes possibleto apply forces and torques in order to investigate, for instance, elasticity and viscoelasticity ofsingle cells or microrganelles [3].
An interesting trait of OT is that they can be combined with spectroscopic techniques, in-cluding absorption, fluorescence, and Raman spectroscopy, in order to extract structural infor-mation about single trapped objects [4-9]. Among these, Raman spectroscopy has been widelyused for the analysis of biological samples in aqueous solution, thanks to the weak Raman ac-tivity of water. Raman spectroscopy is based on the inelastic scattering of radiation; the spectral
#91619 - $15.00 USD Received 15 Jan 2008; revised 25 Feb 2008; accepted 2 Mar 2008; published 19 May 2008
(C) 2008 OSA 26 May 2008 / Vol. 16, No. 11 / OPTICS EXPRESS 7945

features are straightly connected to the fundamental vibrational modes of the bonds of the ana-lyzed chemical species [10-14]. Nowadays, its range of application is very wide, ranging fromthe study of protein or nucleic acid [15] to the comparison between normal and neoplastic cells[16].
The combination of an Optical Tweezers with a Raman System (Raman Tweezers, RT) al-lows getting spectra coming from a single particle instead from an ensemble average [17]. Inthis way, heterogeneity can be exalted, and information about composition and distribution ofspecific chemical species can be obtained [18-26].
Several Raman based techniques have been developed to enhance the intensity and improvethe spatial resolution with respect to the basic method. In particular, Resonance Raman Spec-troscopy (RRS) occurs when the excitation wavelength matches to an electronic transition ofthe molecule so that vibrational modes associated with the excited electronic state are greatlyenhanced. This kind of analysis is particularly useful for investigation of biologically relevantmetalloporphyrin complexes, which, due to the presence of large aromatic rings, present ab-sorption bands in the visible region [27]. RRS has been, in fact, widely used to investigatehuman erythrocytes, also at single cell level.
Erythrocytes, also referred as red blood cells (RBCs), perform the most important blood dutyand play an essential role in human respiratory function. They consist mainly of hemoglobin(Hb), a globular protein with an embedded porphyrin (heme group), which constitutes the Hbprosthetic component. Each group contains an iron atom, which temporarily links to oxygenmolecules in the lungs and release them throughout the body. The high symmetry and the chro-mophoric structure of the heme result in strong enhancement of the Raman Scattering usinglaser wavelengths close to the heme electronic absorption bands [28-31]. The occurrence ofresonance Raman scattering from the Hb prostheic group allows the investigation of Hb withinerythrocytes without interference by other RBC component scattering [32-34]. This is a quiteinteresting issue for the characterization of Hb-related blood diseases, such as thalassemias.Thalassemia is a disease of RBC inherited as a semidominant trait, quite diffuse in the pop-ulations of the Mediterranean sea. In thalassemia, the genetic defect results in reduced rateof synthesis of one of the globin chains; they are classified according to which chain of theglobin molecule is affected: in α-thalassemia, the production of α globin is deficient, whilein β -thalassemia the production of β globin is defective. As a consequence, α/β chain ratiois imbalanced, leading to an excess of the normal chain, which may be more injurious to thecell than the defect of the affected chain. Indeed, free globin chains bind to the cell membrane,damaging it and rendering the cell more vulnerable to mechanical injuries. β -thalassemia is themost common of this disease; its incidence can be as high as 1 in 10 in some Mediterraneanareas.
In this work we present the results of the characterization of RBC from β -thalassemic pa-tients obtained by using an OT system integrated with a Raman probe. In particular, we com-pare the Raman spectra of single thalassemic RBCs (t-RBCs) with those obtained from healthysubjects, relating the observed differences to the analyzed disease. We also investigate photo-induced effects caused by the laser radiations used for both trapping and Raman excitation.Finally, we study the mechanical response of normal and thalassemic cells by monitoring thedeformation induced by a double-trap system. We think that this work can have significantapplications for the characterization of RBC with functional alterations and for a better under-standing of the biology of thalassemic RBCs.
#91619 - $15.00 USD Received 15 Jan 2008; revised 25 Feb 2008; accepted 2 Mar 2008; published 19 May 2008
(C) 2008 OSA 26 May 2008 / Vol. 16, No. 11 / OPTICS EXPRESS 7946

Fig. 1. Experimental set-up of the combined Optical Tweezers and Raman Spectrometer:L, lens; M, mirror; DM, dichroic mirror; GM, galvomirror; NF, notch filter.
2. Materials and methods
2.1. Experimental set-up
Figure 1 illustrates the main components of our experimental set-up which essentially con-sists of an Optical Tweezers system combined with a Raman spectrometer. The trapping laserwas given by a Nd:YAG laser (1064 nm; Laser Quantum, Ventus 1064), emitting a maximumpower of 3 W. It was tightly focused into the sample by an Olympus oil-immersion infinitycorrected objective lens (100X, 1.4 N.A.). A telescopic system (lenses L 1 and L2 in Fig. 1),placed at a proper distance from the objective entrance pupil, guaranteed a constant couplingof the trapping beam into the microscope. Resonance Raman spectra of RBCs were excited bya frequency-doubled Nd-YVO laser (532 nm; Spectra Physics Millennia Xs). It was mixed tothe trapping beam through a dichroic mirror, reflecting near-IR radiation and being transparentto visible radiation. Back scattered light from the sample, collected and collimated by the samefocusing objective, followed back the same path as the incident Raman probe, reaching finallyan holographic notch filter. This last reflected the Rayleigh scattered radiation while provideda good transmission of the inelastic scattered Raman light. The so filtered radiation was fo-cused onto the entrance slit (set at an aperture of 50 μm) of the spectrometer (TRIAX 180,Jobin-Yvon), equipped with a 1800 lines/mm holographic grating. Finally, the Raman radia-tion was detected by using a front-illuminated charge-coupled device (Pixis 1024, PrincetonInstruments, 1024 × 1024 pixels), thermoelectrically cooled at -70 oC and placed at the spec-trometer exit. The detector was interfaced to a personal computer, where spectra were storedand analyzed. To precisely assign a wave number to each individual detector pixel, we used atrapped polystyrene latex beads (SERVA Electrophoresis), whose Raman peaks positions areaccurately known [35]. Calibration points distributed over the whole spectral region of interestwere fitted by a straight line. The final spectral resolution was 2 cm−1, as estimated from thepolystyrene spectrum by measuring the FWHM of the 1001.4 cm−1 peak.
#91619 - $15.00 USD Received 15 Jan 2008; revised 25 Feb 2008; accepted 2 Mar 2008; published 19 May 2008
(C) 2008 OSA 26 May 2008 / Vol. 16, No. 11 / OPTICS EXPRESS 7947

Fig. 2. A: Sketch of the stretching procedure used for the present investigation. B: Sameframes of a video recorded during the stretching of a normal RBC.
The light from a LED, focused on the sample by a 10X objective, was used to illuminatethe sample; an image of the trapped cell was obtained by using a CCD camera, coupled to themicroscope.
The sample chamber was constituted by two 150 μm glass coverslips (Knittel Glasser, thick-ness no.1), sealed with parafilm stripes which also act as ∼ 100 μm spacer. The chamber wasplaced on a translational stage, providing the sample movement (micrometer translator New-port, HR-13, step size: 2 μm, travel: 13 mm). RBCs were trapped at a distance of about 4 μmfrom the lower coverslip. At this distance, the optical aberrations are reduced and the Ramancollection efficiency is maximized [36].
For the mechanical characterization of RBCs, a double-trap system was created by applyinga square voltage signal at a frequency of 1 kHz to a galvomirror (Cambridge Technology In-corporated, mod. 6220), placed on the optical path of the trapping beam. In such a way, the twooptical traps shared the beam power and their relative distance was controlled by the voltagesignal amplitude.
A sketch of our stretching mechanism is illustrated in Fig. 2(A), while in the part (B) ofthe same figure some frames of a recorded video are shown. When the voltage applied to thegalvomirror is zero, we have a conventional single trap: the RBC reaches a trapped positionand floats slightly around it. As the distance between the two traps is increased, the RBC firstlystarts orientating along the axis passing through the center of the two traps. After the RBC isfully aligned, it begins to be stretched. RBC elongation was extracted by hand, using an imagesoftware (NHI ImageJ). In particular, we recorded 20 images for each erythrocyte elongation.From each image we estimated the major axis of the RBC shape and computed the averagelength over all the 20 frames.
#91619 - $15.00 USD Received 15 Jan 2008; revised 25 Feb 2008; accepted 2 Mar 2008; published 19 May 2008
(C) 2008 OSA 26 May 2008 / Vol. 16, No. 11 / OPTICS EXPRESS 7948

2.2. Sample preparation
Fresh blood was obtained by fingerprint needle prick. Control samples were drown from sixnormal adults. All thalassemic consenting (n=6) subjects showed typical pathological featuressuch as reduced MCV (red cell mean corpuscular volume) and elevated HbA2 electrophoresisfraction; serum ferritin was normal in all of them.
Samples were prepared according to the following procedure: blood (5 μ l) anticoagulated byK-EDTA, was diluted in 10 ml of isotonic aqueous NaCl solution and 0.5 ml of human albumin(used as membrane protection). Few microliters of this solution were transferred, within fewminutes, in a home-made chamber.
3. Results and discussion
3.1. Resonant Raman spectroscopy.
Fig. 3. Upper part: Typical Raman spectrum of an healthy RBC, obtained with an integra-tion time of 10 s. The solid line corresponds to a fitting with 14 Lorentzian profiles, whilethe dashed lines indicate the deconvoluted curves. Lower part: Residual obtained as thedifference between the experimental and the best-fit spectrum.
Figure 3 shows a typical Raman spectrum, between 1100 and 1750 cm−1, of a single opti-cally trapped functional erythrocyte from a healthy volunteer. It was obtained with an excitationpower of 0.2 mW and an integration time of 10 s. The contribution due to the buffer solution,taken by removing the RBC from the trap, was subtracted. No averaging was performed, inorder to minimize the exposition time to the Raman probe and, hence, to reduce photo-inducedeffects. The obtained Raman bands are due to the resonantly enhanced hemoglobin contribu-tion; in particular, enhancement of the inelastic scattering comes from the coupling of Ramanexcitation with the porphyrin macrocycle Q band. Although the relative intensity of the differ-ent Raman bands are strongly affected by the excitation wavelength [32], numerous spectralfeatures can be clearly identified, according to their spectral positions. Band assignment, re-ported in Table 1, follows the work by Abe et al. [37] and the successive work of Wood et al.[32]. For a better estimation of both spectral position and intensity of the observed Raman fea-tures, the spectral region between 1100 and 1750 cm−1 was fitted with 14 Lorentzian profiles,
#91619 - $15.00 USD Received 15 Jan 2008; revised 25 Feb 2008; accepted 2 Mar 2008; published 19 May 2008
(C) 2008 OSA 26 May 2008 / Vol. 16, No. 11 / OPTICS EXPRESS 7949
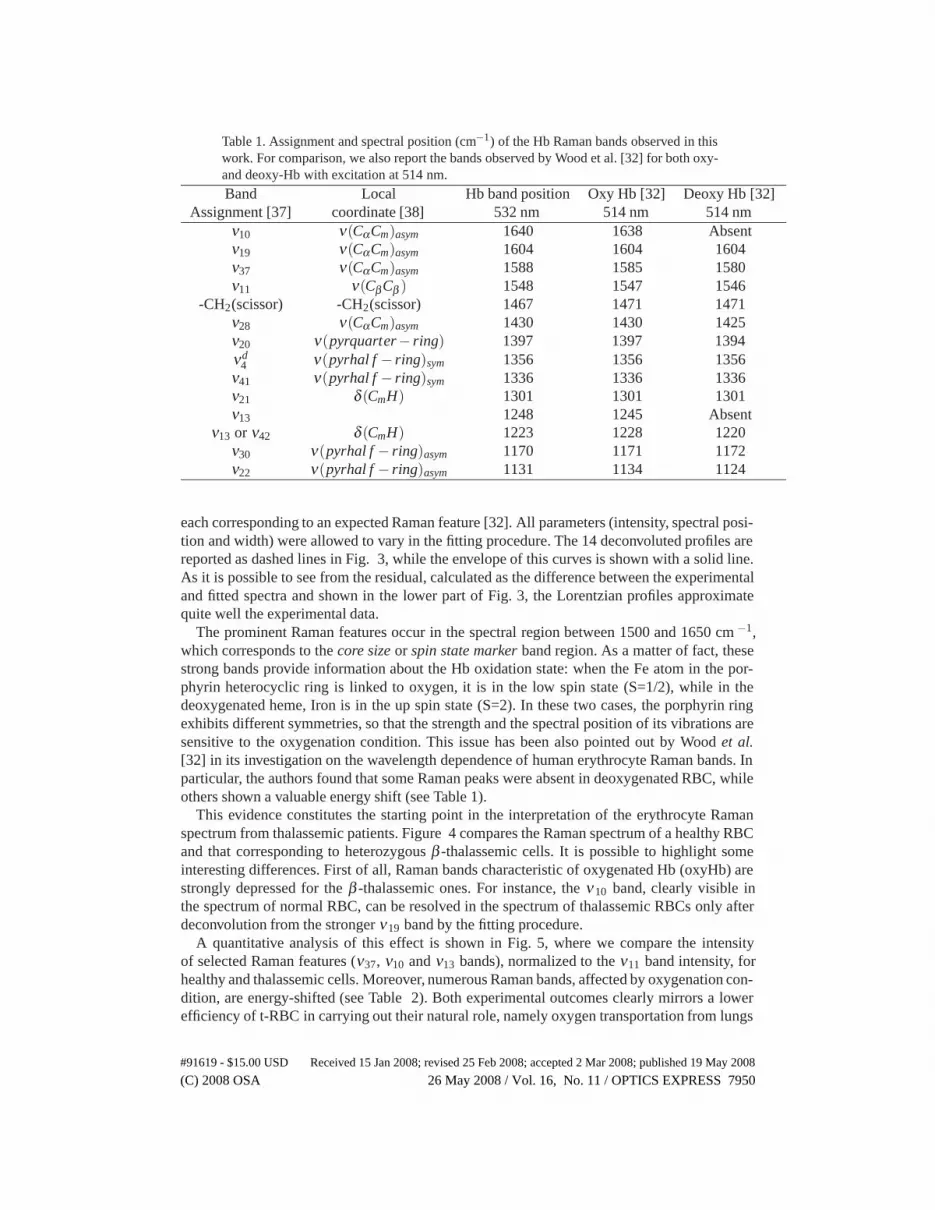
Table 1. Assignment and spectral position (cm−1) of the Hb Raman bands observed in thiswork. For comparison, we also report the bands observed by Wood et al. [32] for both oxy-and deoxy-Hb with excitation at 514 nm.
Band Local Hb band position Oxy Hb [32] Deoxy Hb [32]Assignment [37] coordinate [38] 532 nm 514 nm 514 nm
ν10 ν(CαCm)asym 1640 1638 Absentν19 ν(CαCm)asym 1604 1604 1604ν37 ν(CαCm)asym 1588 1585 1580ν11 ν(CβCβ ) 1548 1547 1546
-CH2(scissor) -CH2(scissor) 1467 1471 1471ν28 ν(CαCm)asym 1430 1430 1425ν20 ν(pyrquarter− ring) 1397 1397 1394νd
4 ν(pyrhal f − ring)sym 1356 1356 1356ν41 ν(pyrhal f − ring)sym 1336 1336 1336ν21 δ (CmH) 1301 1301 1301ν13 1248 1245 Absent
ν13 or ν42 δ (CmH) 1223 1228 1220ν30 ν(pyrhal f − ring)asym 1170 1171 1172ν22 ν(pyrhal f − ring)asym 1131 1134 1124
each corresponding to an expected Raman feature [32]. All parameters (intensity, spectral posi-tion and width) were allowed to vary in the fitting procedure. The 14 deconvoluted profiles arereported as dashed lines in Fig. 3, while the envelope of this curves is shown with a solid line.As it is possible to see from the residual, calculated as the difference between the experimentaland fitted spectra and shown in the lower part of Fig. 3, the Lorentzian profiles approximatequite well the experimental data.
The prominent Raman features occur in the spectral region between 1500 and 1650 cm −1,which corresponds to the core size or spin state marker band region. As a matter of fact, thesestrong bands provide information about the Hb oxidation state: when the Fe atom in the por-phyrin heterocyclic ring is linked to oxygen, it is in the low spin state (S=1/2), while in thedeoxygenated heme, Iron is in the up spin state (S=2). In these two cases, the porphyrin ringexhibits different symmetries, so that the strength and the spectral position of its vibrations aresensitive to the oxygenation condition. This issue has been also pointed out by Wood et al.[32] in its investigation on the wavelength dependence of human erythrocyte Raman bands. Inparticular, the authors found that some Raman peaks were absent in deoxygenated RBC, whileothers shown a valuable energy shift (see Table 1).
This evidence constitutes the starting point in the interpretation of the erythrocyte Ramanspectrum from thalassemic patients. Figure 4 compares the Raman spectrum of a healthy RBCand that corresponding to heterozygous β -thalassemic cells. It is possible to highlight someinteresting differences. First of all, Raman bands characteristic of oxygenated Hb (oxyHb) arestrongly depressed for the β -thalassemic ones. For instance, the ν 10 band, clearly visible inthe spectrum of normal RBC, can be resolved in the spectrum of thalassemic RBCs only afterdeconvolution from the stronger ν19 band by the fitting procedure.
A quantitative analysis of this effect is shown in Fig. 5, where we compare the intensityof selected Raman features (ν37, ν10 and ν13 bands), normalized to the ν11 band intensity, forhealthy and thalassemic cells. Moreover, numerous Raman bands, affected by oxygenation con-dition, are energy-shifted (see Table 2). Both experimental outcomes clearly mirrors a lowerefficiency of t-RBC in carrying out their natural role, namely oxygen transportation from lungs
#91619 - $15.00 USD Received 15 Jan 2008; revised 25 Feb 2008; accepted 2 Mar 2008; published 19 May 2008
(C) 2008 OSA 26 May 2008 / Vol. 16, No. 11 / OPTICS EXPRESS 7950

to all the organism. To test the reproducibility of these results, we performed a statistical analy-sis on RBCs, collected from normal individuals and heterozygous thalassemic patients. Foreach sample we performed the Raman analysis described above, estimating the ratio betweenthe intensity of the ν37 and that of the ν11 bands (R = Iν37/Iν11).
Fig. 4. Comparison between the Raman spectra of normal and β -thalassemic RBC. Thearrows indicate the spectral features affected by intensity changes, while the dashed lineshighlight the observed energy shift.
Fig. 5. Trends of the relative intensity for selected Raman peaks (ν37, ν10 and ν13) corre-sponding to the two types of cells (see text for details).
#91619 - $15.00 USD Received 15 Jan 2008; revised 25 Feb 2008; accepted 2 Mar 2008; published 19 May 2008
(C) 2008 OSA 26 May 2008 / Vol. 16, No. 11 / OPTICS EXPRESS 7951

Table 2. Observed wavenumber (cm−1) relative to 4 Raman peaks for normal and β -thalassemic RBCs.
Band Assignment Normal β -thalassemicν37 1588 1581ν28 1430 1426
ν13 or ν42 1223 1215ν22 1131 1125
In Fig. 6(A), we report the statistical distributions of the ratio R corresponding to a normaland a thalassemic donor. Each distribution is relative to 300 spectra. Overlapped to them, wealso show the fits with a Gaussian curve. This analysis was repeated for 6 volunteers for eachkind of cells (see Fig. 6(B)). From this investigation, two interesting features emerge. First ofall, the distributions are well separated; more precisely, they are not overlapping within threestandard deviations, as evidenced by the horizontal bars, which show the weighted-mean andthe standard deviation for the normal and the thalassemic cells.
In addition, all t-RBCs distributions present a much wider spread around their mean valueswith respect to that of healthy RBCs. The wider distribution found for diseased RBCs clearlymirror the higher heterogeneity of t-RBCs, which can be also observed in the dimension andshape of these erythrocytes. We think that these experimental outcomes provide an interestingstarting point to explore the application of a Raman Tweezers system in the clinical diagnosisof Hb-related blood disorders.
3.2. Photo-induced effects.
During our experiments a particular care was put in order to reduce photo damages inducedby the trap and Raman lasers. Indeed, more generally, when biological samples are exposedto laser radiation it is important to be aware of possible photo-induced effects. These last havebeen investigated for normal RBC exposed to visible and IR radiation [32]. In general, it hasbeen established [32] that exposition to high-power radiation in the green region leads to proteindenaturation and Hb transfer into the metHb state, in which the oxygen is irreversibly bound tothe heme. In our study we extended this investigation to β -thalassemic erythrocytes. We firstanalyzed the effects of exposition of both normal and thalassemic RBC to radiation at 1064 nm,which corresponds to the wavelength of our trapping laser. At this purpose, a single erythrocytewas placed in the optical trap for different time intervals, ranging between 20 and 300 s; at theend of each interval, we monitored RBC vitality by recording its Raman spectrum for 3 s. Toavoid the superposition of effects induced by the Raman probe, the RBC was changed aftereach measurement. The power of the IR beam was taken fixed at 15 mW, while the Ramanprobe power was 0.2 mW.
In Fig. 7 we report the intensity of the ν11 peak at 1548 cm−1, normalized at the maximumvalue (IMAX
Raman), for healthy and β -thalassemic RBCs. The latter Raman feature is the strongerone for the two kinds of cells and its relative intensity is not affected by Hb met transition.For each trapping time we repeated ten measurements using distinct cells. The points plottedin Fig. 7 represent the average values while the error bars are the standard deviations. As it canbe seen, the normalized Raman intensity changes by 12 % for normal cells and 17 % for thethalassemic ones on a period of 300 s. In addition, we observed that the relative intensities ofthe different peaks in the Raman spectra were not affected. This indicates that, at power levelused in our experiment, the photo-damage by IR laser trapping is quite low.
The photo-induced effects at 532 nm are, instead, much stronger. Figure 8 shows the inten-sity of the same Raman feature (ν11) as a function of exposure time to the Raman probe, at
#91619 - $15.00 USD Received 15 Jan 2008; revised 25 Feb 2008; accepted 2 Mar 2008; published 19 May 2008
(C) 2008 OSA 26 May 2008 / Vol. 16, No. 11 / OPTICS EXPRESS 7952

Fig. 6. A: Statistical distributions of the ratio R = Iν37/Iν11 obtained by analyzing 300 RBCsfrom a single normal (pink histogram) and thalassemic (blue histogram) donor. The fittingof these distributions with Gaussian profile is also shown. B: Gaussian profiles obtainedby fitting the experimental distributions relative to 6 normal (Hi) and 6 thalassemic (Ti)volunteers. The weighted-mean and the standard deviation for the two kinds of cells areevidenced by horizontal bars.
a power of 0.3 mW (the trapping laser power was kept at 15 mW). Again, the measurementswere done trapping one fresh cell and exposing it to 532 nm radiation for a time varying from3 to 150 s. As for Fig. 7, the measurements were normalized to the intensity of the maximumRaman signal, observed at t=3 s.
As it can be observed in Fig. 8, the photo-damage is different for the two kinds of cells. Foran exposure time of about 80 s, the reduction of the Raman signal is ∼50 % for normal cellsand ∼80 % for β -thalassemic cells. Therefore, our investigation shows that thalassemic RBCsare more sensitive to photo-oxydation.
This result confirms a more general trend of thalassemic RBCs to be sensitive to oxidantstress [39, 40]. From a medical point of view, this may be attributed to an excessive oxidationof the unstable free globin chains and the subsequent release of oxygen radicals, that mightdamage the cell membrane [41]. This information has to be taken into account in all opticalanalysis of t-RBCs.
Another evidence of the photo-damage is represented by the modification of the whole Ra-man spectrum. In Fig. 9 are compared the spectra for normal RBC obtained at 10 and 150 sexposure time, respectively. Both spectra were normalized to the highest Raman peak. As it canbe seen, for long exposure a background appears and the relative bands intensities are modi-fied. In particular, cellular photo-damage leads to spectral changing in the spin-sensitive region,where an increase of the Raman ν37 band is observed, indicating irreversible Hb transition to
#91619 - $15.00 USD Received 15 Jan 2008; revised 25 Feb 2008; accepted 2 Mar 2008; published 19 May 2008
(C) 2008 OSA 26 May 2008 / Vol. 16, No. 11 / OPTICS EXPRESS 7953

Fig. 7. Intensity of the Raman ν11 band, as function of the exposure-time to the trappingradiation for normal (•) and β -thalassemic (◦) RBCs. The intensity values are normalizedto the value at t=20 s.
Fig. 8. Intensity of the Raman ν11 band, as function of the exposure-time to the Ramanprobe for normal (•) and β -thalassemic (◦) RBCs. The intensity values are normalized tothe value at t=3 s.
the met state. Similar effects have been already reported for healthy erythrocytes exposed toradiation at 514 nm and they have been attributed to protein denaturation, resulting in heme
#91619 - $15.00 USD Received 15 Jan 2008; revised 25 Feb 2008; accepted 2 Mar 2008; published 19 May 2008
(C) 2008 OSA 26 May 2008 / Vol. 16, No. 11 / OPTICS EXPRESS 7954

Fig. 9. The Raman spectra of a normal RBC exposed to 532 nm radiation for 10 and 150 s.Solid lines are the best fit lineshape convolutions.
aggregation within the cell [30].
3.3. Mechanical response to applied stress.
The deformation capability of RBC is mainly due to the elasticity of its membrane. Thislast is made of a lipidic bilayer, covering a protein network essentially composed of spectrintetrameres linked by actin and protein 4.1 to form complex junctions. The mechanical prop-erties of such structure has been largely investigated from both theoretical [41-43] and exper-imental [44-46] points of view. In the first case, the studies were devoted to develop, throughcomputational simulations, reliable models for the architecture of the spectrin network, ableto simulate the erythrocyte mechanical properties. In the second case, the investigations reliedon the measurement of cellular distortion in response to an applied mechanical stress. Thisissue has been addressed by using many different experimental techniques, including mainlymicropipette aspiration [48]. This last is based on the creation of a protrusion from the cellularmembrane, which is drawn into the pipette. The relation between the protrusion extension andthe pressure gives the shear elastic modulus. Recently, Henon et al. [46] have measured thisparameter for normal human erythrocytes by using an Optical Tweezers system: in this case,calibrated forces were applied via small silica beads bound to the RBC membrane. The neces-sity to use such beads arises from the need to exert known forces, in order to obtain an absolutemeasurement of the RBC shear modulus. Indeed, an absolute force calibration requires trappingof objects of well known shape, size, and composition. Similar measurements have been alsoperformed by Lenormand et al. [45] on the free spectrin skeleton, extracted from the membraneof a RBC .
In the present work we characterize the mechanical response of t-RBCs compared to healthyones. It is important to underline that, although thalassemic syndromes concern mainly a geneticdefect in hemoglobin synthesis, precipitation of free globin chains leads to various membranedysfunctions [49]. This is also proven by the presence of defects in morphology and shape ofRBC affected by this disease.
#91619 - $15.00 USD Received 15 Jan 2008; revised 25 Feb 2008; accepted 2 Mar 2008; published 19 May 2008
(C) 2008 OSA 26 May 2008 / Vol. 16, No. 11 / OPTICS EXPRESS 7955

Our investigation was performed by stretching single erythrocytes by using a double OpticalTweezers system. Due to the comparative character of this investigation, it was not necessaryto exert the mechanical stretching by using microbeads as handles. Of course, this simplifiesthe measurement procedure, avoiding the difficulty to obtain RBCs with microbeads adherentto the membrane in a proper relative position [45].
Fig. 10. Response to applied stretching for normal and abnormal RBCs.
In Fig. 10 we report the RBC elongation as function of the trapping beam power for healthyand thalassemic RBCs. Each value results from an average of 25 measurements performed ondifferent cells. The error bars correspond to the standard deviation. The data plotted in Fig. 10reveal a quite different mechanical response of normal cell with respect to t-RBCs. From alinear fit of the experimental data, it was possible to estimate the ratio of the shear modulus kfor the two kinds of cells. This results to be: kn/kβ =0.68±0.05.
If we assume kn=2.5±0.4 pN/μm, as found by Henon et al. [46], we obtain k β =3.7±0.9pN/μm. Previous measurements on β -thalassemic cells, performed with standard micropipetteaspiration, brought out an elastic shear modulus in beta-thalassemia 33 % [50] higher than thenormal one, against the 48% found here.
Some consideration can be done to explain this difference. First of all, as already pointed outin the ref. [46], since the two methods (double-trap and micropipette) do not operate in the samedeformation regime, they are not expected to lead to the same result. Moreover, in micropipetteaspiration measurements the friction force between the cellular membrane and the glass pipettewall may have a significant role in force balance.
Finally, in more than 10 % of the total measurements in β thalassemic cells, we observed anevident damage to RBCs by applying strong deformation. In such cases, the stretching causeda membrane fragmentation and a consequent cell death. In all the other cases, the vitality ofnormal cells was not affected, as also proved by Raman measurements performed before andafter application of the mechanical stress.
#91619 - $15.00 USD Received 15 Jan 2008; revised 25 Feb 2008; accepted 2 Mar 2008; published 19 May 2008
(C) 2008 OSA 26 May 2008 / Vol. 16, No. 11 / OPTICS EXPRESS 7956

4. Conclusions
This paper reports the characterization of heterozygous thalassemic red blood cells, at singlecell level, by using a Raman Tweezers system. The study has been performed by analyzing theresonantly enhanced inelastic photons scattering from hemoglobin. Moreover, we have inves-tigated the cellular response to mechanical stress, by using a double-trap system. Some sig-nificant difference in the functionality of these cells with respect to normal erythrocytes havebeen highlighted. In particular, the oxygenation capability of Hb has revealed to be reduced inβ thalassemic RBCs. The two types of cells also present a different response to photo-inducedoxidative stress. We have also measured the membrane shear modulus for thalassemic erythro-cytes, which have revealed to be higher than 40 % with respect to healthy cells; this resultindicates an even more pronounced rigidity with respect to that measured with conventionaltechnique based on micropipette aspiration. Our results confirm medical predictions regard-ing thalassemia, such as the reduced oxygenation capability of t-RBCs and their higher rigid-ity. Moreover they provide an interesting starting point to explore the application of a RamanTweezers system in the analysis of others blood disorders. Unlike the traditional diagnostictools, our approach is able to provide with the same apparatus both chemical and mechanicalproperties, even at single RBC level. That allows to extol heterogeneity, which is instead hiddenby bulk-based techniques.
It is also worth to be noted that a combined Raman Spectroscopy and double trap systemopens new opportunities to study the protein rearrangement in cellular membrane under me-chanical stress conditions. We think that this is a intriguing subject, which is, as far as weknow, still poorly investigated [51]. At this purpose, it is useful to observe that it is possibleto have at the very same time RBCs fluorescence microscopy imaging, to determine the cel-lular change in shape under mechanical stress application [52]. Such measurements on RBCscould provide new insight on the interaction of membrane proteins, such as spectrin and actin.Improvements in our experimental set-up are in progress to reach this goal.
Acknowledgments
The authors are grateful to Andrea Latini (Crisel Instruments, spa) for assistance with the CCDcamera and to Prof. P. Russo for the critical reading of this manuscript.
#91619 - $15.00 USD Received 15 Jan 2008; revised 25 Feb 2008; accepted 2 Mar 2008; published 19 May 2008
(C) 2008 OSA 26 May 2008 / Vol. 16, No. 11 / OPTICS EXPRESS 7957