Embed Size (px)
Citation preview

Stereoscopic Vision in the Absence of the LateralOccipital CortexJenny C. A. Read1*, Graeme P. Phillipson2, Ignacio Serrano-Pedraza1, A. David Milner3, Andrew J. Parker4
1 Institute of Neuroscience, Newcastle University, Newcastle upon Tyne, United Kingdom, 2 Institute of Adaptive and Neural Computation, School of Informatics,
Edinburgh University, Edinburgh, United Kingdom, 3 Department of Psychology, Durham University, Durham, United Kingdom, 4 Department of Physiology, Anatomy and
Genetics, Oxford University, Oxford, United Kingdom
Abstract
Both dorsal and ventral cortical visual streams contain neurons sensitive to binocular disparities, but the two streams mayunderlie different aspects of stereoscopic vision. Here we investigate stereopsis in the neurological patient D.F., whoseventral stream, specifically lateral occipital cortex, has been damaged bilaterally, causing profound visual form agnosia.Despite her severe damage to cortical visual areas, we report that DF’s stereo vision is strikingly unimpaired. She is betterthan many control observers at using binocular disparity to judge whether an isolated object appears near or far, and toresolve ambiguous structure-from-motion. DF is, however, poor at using relative disparity between features at differentlocations across the visual field. This may stem from a difficulty in identifying the surface boundaries where relative disparityis available. We suggest that the ventral processing stream may play a critical role in enabling healthy observers to extractfine depth information from relative disparities within one surface or between surfaces located in different parts of thevisual field.
Citation: Read JCA, Phillipson GP, Serrano-Pedraza I, Milner AD, Parker AJ (2010) Stereoscopic Vision in the Absence of the Lateral Occipital Cortex. PLoS ONE 5(9):e12608. doi:10.1371/journal.pone.0012608
Editor: Chris I. Baker, National Institute of Mental Health, United States of America
Received June 17, 2010; Accepted August 12, 2010; Published September 7, 2010
Copyright: � 2010 Read et al. This is an open-access article distributed under the terms of the Creative Commons Attribution License, which permitsunrestricted use, distribution, and reproduction in any medium, provided the original author and source are credited.
Funding: Royal Society (royalsociety.org): University Research Fellowship UF041260 to JCAR. MRC (www.mrc.ac.uk): New Investigator Award G0601566 to JCAR,grant G0401090 to ADM and grant G0700399 to AJP and others. Wellcome Trust (www.wellcome.ac.uk): grant G0700399 to AJP. EPSRC (www.epsrc.ac.uk):Neuroinformatics Doctoral Training Centre studentship to GPP. The funders had no role in study design, data collection and analysis, decision to publish, orpreparation of the manuscript.
Competing Interests: The authors have declared that no competing interests exist.
* E-mail: [email protected]
Introduction
Humans use the different viewpoints provided by their two eyes
to produce a vivid percept of the world in depth. A distinctive
feature of stereoscopic perception is that we are far better at
judging the relative disparity between two features than judging
the absolute depth of an isolated feature [1]. For example, in
Figure 1A, the eyes are directed at point a, so the retinal images of
point b lie further from the fovea in the right eye than in the left.
This difference between the retinal images of point b is called an
absolute disparity. If the absolute disparity is large enough, we will
perceive b as closer to us than the fixation point, even if b is
presented in isolation. However, our sensitivity to the depth of b is
greatly enhanced if points a and b are simultaneously visible, so
that we can directly compare the relative disparity between the two
points. In a complex scene, one can distinguish many different
sorts of relative disparity [2]: e.g. relative disparity within a surface
(Figure 1B), between adjacent surfaces (Figure 1C), and between
surfaces viewed transparently (Figure 1D).
The cortical pathways underlying our sensitivity to these various
forms of relative disparity are unclear. Area V2 contains neurons
tuned to adjacent-surface relative disparity [3–5], and the
proportion of such neurons increases along the ventral stream
[6–8]. However, dorsal areas V3A and the caudal intraparietal
sulcus CIPS are also strongly activated by adjacent-surface relative
disparity [9]. Human fMRI reveals no difference in the response of
V1 and V2 to the relative disparity between transparent surfaces;
the ventral stream responds to both absolute and transparent-
surface relative disparity while dorsal areas respond mainly to
absolute disparity [10].
One particular stimulus that has revealed intriguing differences
between the ventral and dorsal streams is the anti-correlated
random-dot stereogram, in which the colours of black and white
dots are switched over in one eye with respect to the other. Such a
stimulus does not correspond to any real physical surface, so a system
designed to detect the depths of real surfaces should not respond to it
[11], and in accordance with this expectation, neither humans nor
monkeys can discriminate depth in such stimuli [12–15]. A naı̈ve
disparity detector based on cross-correlating the two eyes’ images will
respond, but with a sign inversion [16]. This signature sign-inversion
is found in V1 [14], in many neurons in MT [17], in disparity filters
deduced from human psychophysics [18], and in rapid vergence
corrections with anti-correlated stimuli [19].
Beyond V1, it has been suggested that ventral and dorsal
streams may differ in their responses to anti-correlated stimuli [2].
Dorsal areas MST [20] and MT [17] contain many neurons which
are tuned to disparity in anti-correlated stimuli, whereas in ventral
areas V4 [21] and IT [22], most neurons are not tuned to anti-
correlated disparity. In fMRI, Bridge & Parker [23] found that the
largest differences in activation between correlated vs anti-
correlated stimuli alternating in depth are found in areas MT
and LO. Preston et al. [24] performed a multi-voxel pattern
analysis to estimate how much information the BOLD signal in
different areas contains about the sign of disparity in correlated
PLoS ONE | www.plosone.org 1 September 2010 | Volume 5 | Issue 9 | e12608

and anti-correlated stimuli. They found that, in ventral areas V3v
and V4, disparity sign could be read out with about the same
accuracy for both correlated and anti-correlated stimuli, whereas
in LO and also in all dorsal areas examined, much greater
accuracy was obtained for correlated stimuli. Thus, all these
different studies agree that the strongest and most reliable
differences between correlated and anti-correlated stimuli are
found in the ventral stream.
These neurophysiological and imaging studies can only reveal
correlations between brain activity and behaviour. Acquired brain
lesions provide one of the few available ways of testing for causal
relationships between brain circuitry and behaviour in humans.
Here we present the first neuropsychological study to investigate the
cortical processing of relative disparity. In 1988, Patient DF suffered
carbon monoxide poisoning, which generated bilateral damage to
the lateral occipital cortex, an important component of the ventral
stream [25,26]. As a result, DF has profound visual form agnosia.
Although she has partial visual experience of the world, she is
unable to recognize objects by shape, or even to report correctly
whether a line or grating is vertical or horizontal [25–27].
The initial description of DF (Milner et al. 1991) reported that
she retains stereo vision (though unable to identify the shape that is
present in depth, and with lower acuity than controls). Beyond
that, however, there has been little systematic study of her depth
perception. Here, we present a detailed examination of DF’s
stereoscopic vision, including all three forms of relative disparity
identified in Figure 1.
Methods
Experimental stimuliThis paper describes a sequence of experiments, designed to
probe different aspects of DF’s stereo vision, carried out on five
occasions over a period of some 15 months. As we learnt more
about DF’s abilities, we adapted the stimuli accordingly and
introduced new stimuli to exclude various interpretations. The
experiments will be described in detail as each is introduced but
they are summarized in Figure 2, with each stimulus given a
numerical identifier. The duration of each stimulus is also specified
in Figure 2. Experiments performed at long (500ms or free
viewing) and short (160ms or 200ms) durations are indicated by
the suffix L or S in Figure 2. Some experiments were performed
with anti-correlated stimuli. These are stimuli in which the
contrast polarity of one eye’s image is inverted, so that black pixels
are replaced with white and vice-versa. These are indicated by the
suffix A added to the stimulus identifier. Figure 3 provides a
timeline showing when DF was tested on each stimulus.
For each stimulus, we initially explained the task to the
participant by presenting a few examples in which we described
the correct response. During data collection, no feedback on
individual trials was provided to participants.
SubjectsPatient DF was aged 53–55 at the times of testing. DF’s brain
damage has been assessed by structural and functional MRI
measurements [25,26]. The principal lesions in visual cortex lie
bilaterally in the lateral occipital region, specifically area LO,
though there is diffuse damage elsewhere, as is typical following
carbon monoxide poisoning. The lateral occipital area is clearly
compromised on structural scans and is not activated functionally
during scans that show a greater activation to coherent, versus
scrambled, visual objects in control subjects [26].
We compared DF’s performance with that of 7 controls: 2
authors (JR, female, aged 35 years at the time of testing; GP, male,
29) and 5 volunteers without previous psychophysical experience, of
similar age to DF: three females, F1 (53), F2, (51), F3 (64), and two
males, M1 (60), M2 (63). DF wore prescription spectacles suitable
for the viewing distance of 90cm, and controls wore their normal
visual correction. Psychophysical experiments were carried out at
Durham, Oxford and Newcastle Universities with the understand-
ing and written consent of each subject, and the study complies with
the Code of Ethics of the World Medical Association (Declaration of
Helsinki). Psychophysics research was approved by internal ethics
committees at each institution where experiments were conducted.
EquipmentAll experiments were programmed using Matlab (The Mathworks,
Natick, MA) with the Psychophysics Toolbox [28,29] running on a
PC. Stereo images were presented in red/blue anaglyph. Except for
Experiment 1.3, stimuli were presented on an Iiyama flat-screen LCD
monitor, 128061024 pixels and 37.5630cm, viewed at 90cm in
normal ambient lighting. 1 pixel subtended 0.02u and the whole
display subtended 23.5u horizontally and 18.9u vertically. In
Experiment 1.3 only, stimuli were presented on a CRT monitor,
128061024 pixels and 30624cm, viewed at 53cm in a dark room.
All our experiments used random-dot patterns. These enable the
binocular disparity depth cue to be isolated from other cues which
signal depth in natural viewing, such as convergence, occlusion, size,
texture etc [30]. The random-dot patterns consisted of equal
numbers of black and white dots on a gray background with the
same mean luminance. The dots were either 7 or 9 arcmin across.
Their density was such that if none of the dots overlapped, they
Figure 1. Different stimulus configurations that give rise torelative disparity. A: Relative disparity between two points. Absolutedisparity of an object = difference in its angular distance from the foveain the two eyes. Here the eyes are looking at point a, so a has zeroabsolute disparity but b has a non-zero value. The relative disparity ofthe two points is equal to the difference in their absolute disparities(equivalent to difference in angles subtended at each point, as shown).B: Relative disparity between different points on a surface. C: Relativedisparity between surfaces, one of which occludes the other. D: Relativedisparity between transparently-visible surfaces, as can occur where anon-opaque surface or structure, such as a picket-fence or tree, partiallyoccludes a more distance surface.doi:10.1371/journal.pone.0012608.g001
Stereopsis Without Area LO
PLoS ONE | www.plosone.org 2 September 2010 | Volume 5 | Issue 9 | e12608

would have occupied 30% of the stimulus area. Anti-aliasing was
used to produce sub-pixel displacements. In between stimuli,
observers converged their eyes on a fixation cross in the plane of
the computer screen. Nonius lines were not used, since this would
add to the complexity of the tasks DF was being asked to carry out,
and since it seemed unlikely that a patient with visual form agnosia
would be able to monitor vergence using Nonius lines.
Data analysisPsychometric functions were fitted with a cumulative Gaussian
scaled to run from 0.5% to 99.5%, i.e. allowing for a 1% lapse rate:
1
2z
1{lð Þ2
erfx{m
sffiffiffi2p
� �ð1Þ
where l = 0.01 is the lapse rate, m is the point of subjective
equivalence, s is the threshold, and x is the metameter, i.e. either
disparity or magnification. The fitted threshold was not significantly
affected by the precise value of the lapse rate, but removing the lapse
rate altogether produced artefactually large thresholds for a few
psychometric functions (see Supporting Information Files S1 and
[31]). Parameters were adjusted, using MATLAB’s FMINSEARCH
function, to maximize the likelihood.
In both the main paper and the Supporting Information, error bars
show the 95% confidence intervals. For psychometric data, these were
calculated using the score confidence interval for simple binomial
statistics [32]. Other error bars were obtained by bootstrap resampling
[33]. First, a new set of simulated psychophysical data was generated
from the original cumulative Gaussian fit [34]. Each set of simulated
data was then analysed in exactly the same way as the original data-
set, in order to produce a different estimate of the quantity of interest
(e.g. threshold, regression gradient). This process was repeated 10,000
times, and the 2.5 and 97.5 percentiles were taken as the end-points of
the 95% confidence interval on the original quantity.
To assess whether DF’s performance differed significantly from
those of controls, we used the techniques developed by Crawford &
Figure 3. Timeline of experiments performed by DF. See Figure 2 for experiment codes. For experiments done at both short and longdurations, the duration is indicated by the suffix S or L. The suffix A indicates the anti-correlated version of the stimulus.doi:10.1371/journal.pone.0012608.g003
Figure 2. Reference list of experiments. The experiments are grouped together according to the type of relative disparity investigated, and eachstimulus is given a numerical identifier. For experiments which were performed at different stimulus durations, the suffix L indicates long duration(either 500ms or until the subject responded) and S indicates short duration (stimulus on-screen for 160ms or 200ms, too briefly for saccades orvergence movements). Figure 3 shows when DF was tested on each stimulus.doi:10.1371/journal.pone.0012608.g002
Stereopsis Without Area LO
PLoS ONE | www.plosone.org 3 September 2010 | Volume 5 | Issue 9 | e12608

Garthwaite [35,36] for the analysis of neuropsychological data with
single cases, and implemented in their computer programs SINGLI-
M.EXE and SINGSLOPE.EXE (available online at http://www.
abdn.ac.uk/,psy086/dept/SingleCaseMethodsComputerPrograms.
HTM).
Results
Experiment 1: Sensitivity to absolute and relativedisparity between frontoparallel surfaces
Experiment 1.1: Depth discrimination of a target disk.
In Experiment 1.1, observers viewed a random-dot stereogram
that depicted a disparate disk, 5.6u in diameter, with a surrounding
reference surface in the plane of the screen (Figure 4Ai). They
reported whether the disk appeared in front of or behind the
screen. This stimulus presents both absolute and relative disparity
to the observer: the absolute disparity of the central disk compared
to the binocular fixation adopted by the subjects (typically the
fixation cross displayed initially), and the relative disparity between
the central disk and the zero-disparity surround. Next, the
experiment was repeated with a featureless, annular gap
between the disk and the reference surface (Figure 4Aii), and
finally, if the subject was still able to do the task, the disk was
presented on a featureless gray background with only the edges of
Figure 4. Experiment 1.1L: Front/back discrimination on a target disk. A: Stimuli: (i) Central disparate disk is contiguous with a zero-disparityrandom-dot reference surface; (ii) central disk separated from reference surface by annulus of width 7u; (iii) no reference surface. In each case, thecentral target was 5.6u in diameter. B: Psychometric functions for patient DF and age-matched control M2, showing percentage ‘‘far’’ judgements as afunction of target disparity, for long stimulus presentations. See Supporting Information File S1 for full data.doi:10.1371/journal.pone.0012608.g004
Stereopsis Without Area LO
PLoS ONE | www.plosone.org 4 September 2010 | Volume 5 | Issue 9 | e12608

the display screen available as a reference for relative depth
(Figure 4Aiii). This stimulus presents the same absolute disparity as
the first, but the information about relative disparity is greatly
reduced. This enables us to quantify the additional sensitivity
contributed by adjacent-surface relative disparity.
Figure 4B shows psychometric functions for patient DF and for
a typical control subject M2, for a stimulus duration of 500ms.
DF’s thresholds are higher than M2’s and, critically, they are
essentially similar for all 3 gaps, whereas M2’s thresholds increase
by an order of magnitude as gap size increases. This is shown in
Figure 5A, where thresholds are plotted on log axes as a function
of gap size (the ‘‘no reference’’ condition is plotted as a gap of
12.5u, which is the smallest gap that completely removes the
reference surface from view, even in the diagonal corner of the
screen).
To quantify this across subjects, we calculated the gradient of a
regression line fitted to log10(threshold) as a function of gap size.
Figure 5B shows this for DF and 7 controls. For each of the 7
controls individually, this gradient was significantly different from
zero: on average, there was a doubling of threshold for every 3uincrease in gap size. In contrast, DF’s gradient was not significantly
different from zero.
To assess whether DF’s gradient differed significantly from the
population of controls, we used the modified independent samples
t-test method [35] for comparing the slope of a patient’s regression
line with those of a sample of controls. For the regression gradients
in Figure 5B, just 0.9% of the healthy population are expected to
have a gradient lower than DF.
DF shows no impairment on an absolute disparity
task. On the absolute disparity task (Figure 4Aiii), DF
performed as well as the controls. This is a demanding task, and
indeed two of the age- and gender-matched controls (F2 and F3)
could not perform it at all, at any disparity. We emphasize that this
is not because these controls lacked stereo vision, since they had no
difficulty with the zero-gap condition, recording thresholds of 0.73
and 0.43 arc min respectively (Supporting Information File S2).
Rather, it reflects the well-known difficulty of basing perceptual
judgements on absolute disparity alone [1,2,37].
We tested whether DF’s threshold on the absolute disparity
condition differed significantly from those of controls [38], using
log-threshold as our performance measure. There was no
significant difference, even under the conservative assumption
that participants F2 and F3 are assigned the worse of DF’s two
thresholds, 8.44 arc min (whereas in fact they could not perform
this task at all even at 22 arc min)..
In estimating the distance to a target, DF places great weight on
binocular vergence information [39]. In theory, she could perform
the absolute disparity task by fixating first on the central target and
then on the edge of the screen, monitoring the change in vergence.
To rule out this strategy, we repeated Experiment 1.1 with a
stimulus duration of 160ms, and obtained the same pattern of
results (Figure 6). Once again, DF showed similar performance to
controls on the absolute-disparity condition; indeed, she per-
formed better than 4/6 controls (DF’s threshold 5.1 arc min;
Controls GP 2.1, M2 3.6, JR 10.7 and F1, F2, F3 unable to
perform the task; see Supporting Information File S2). However,
whereas controls found the task substantially easier when the
reference surface was introduced, DF once again showed no
significant improvement.
In summary, then, DF is not impaired on this very demanding
short-duration, absolute-disparity task, despite her extensive
damage to visual cortical areas. Rather, she appears to have a
specific difficulty in using the relative disparity information
provided by the reference surface to improve her sensitivity.
Experiment 1.2: perceiving disparity away from the
fovea. In Experiment 1.1, the boundary at which relative
disparity is available is around the edge of the central target disk,
at an eccentricity of 2.8u. Thus, perhaps the simplest explanation
for DF’s failure to benefit from the relative disparity provided by
the reference surface would be that DF can perceive disparity only
in the center of her visual field. DF does have a peripheral scotoma
beyond 30u eccentricity [25] but this is too far from the fovea to be
relevant here.
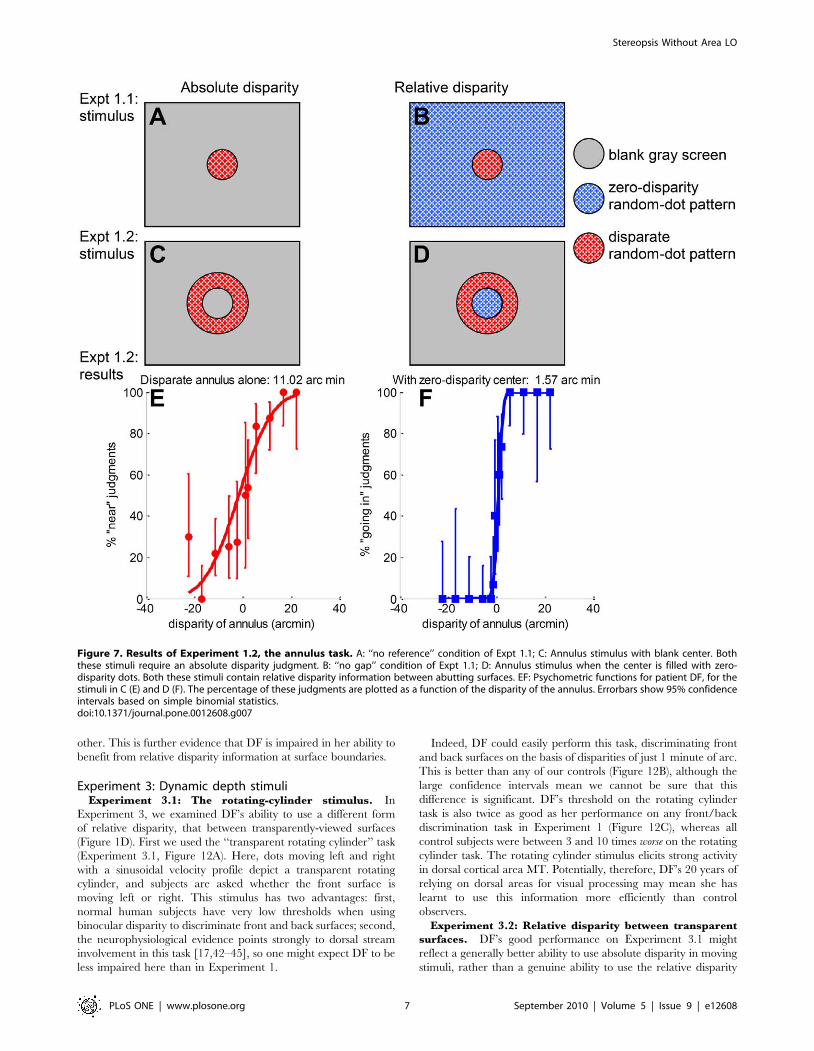
In Experiment 1.2, we asked DF to discriminate the depth sign
of a annulus of random dots presented for 160ms (Figure 7C) with
an inner radius of 2.8u. The center of the annulus was blank gray.
DF had some difficulty in learning to perform this demanding
short-duration, non-foveal absolute-disparity task, but, as Figure 7E
shows, after some practice she was able to perform with a
threshold of 11 arc min. This demonstrates that DF does have
Figure 5. Results of Experiment 1.1L, long stimulus duration. A: Threshold as function of gap size for DF (black squares, gray diamonds) andM2 (red circles), together with regression lines for log threshold as a linear function of gap size. B: Regression gradients (log10 arcmin/deg) for DF(black squares) and 7 controls (colored symbols). For the regressions, the ‘‘no reference’’ condition was taken to be equal to a gap of 12.5u. This is thesmallest annulus width that completely removes the reference surface from view, even in the diagonal corner of the screen. In both panels, the error-bars are 95% confidence intervals generated by bootstrap resampling. The vertical dashed line in panel B demonstrates that the 95% confidenceinterval for DF’s gradient does not overlap the 95% confidence interval of any of the 7 controls. See Supporting Information File S1 for full data.doi:10.1371/journal.pone.0012608.g005
Stereopsis Without Area LO
PLoS ONE | www.plosone.org 5 September 2010 | Volume 5 | Issue 9 | e12608

stereo vision at the eccentricity of the reference surface in
Experiment 1.1, ruling out this potential explanation for her poor
performance on the no-gap condition.
DF shows a weak learning effect with relative disparity.
With a repeat of Experiment 1.2 with zero-disparity dots filling the
center of the annulus (Figure 7D), DF was not only able to perform
the task, but her threshold dropped by an order of magnitude,
from 11 arc min to 1.6 arc min. It appears that DF could now
benefit from the relative disparity information at this boundary.
We therefore next asked DF to perform the target disk task
again, Experiment 1.1S (Figure 4A). DF’s performance on the no-
reference condition was unchanged, but she now showed an
improvement as the reference surface was introduced, bringing her
within the same range as controls. Figure 8 summarises all the
results obtained on Experiment 1.1 for all subjects and testing
sessions, for both long (A) and short (B) durations. The black
squares show DF’s fitted regression gradients measured in Apr 08;
the gray diamond also shows the very similar value obtained in a
brief pilot session with DF in Jan 08. The white diamond in
Figure 8B show DF’s gradient measured in Sep 08, immediately
after Experiment 1.2 (see Supporting Information File S2 for the
full psychometric functions and fitted thresholds). This gradient
falls within the 95% confidence interval of 4/5 controls, putting
DF within the normal range for controls, in contrast to the results
obtained previously.
This training effect did not persist completely. In Apr 09, DF
performed Experiment 1.1S for a fifth time, with the results shown
by the white square in Figure 8B (see also Supporting Information
File S2). It is difficult to say with confidence whether the effect of
the training in Sep 08 persisted unchanged Our best estimate is
that the training continued to have some effect, but that it had
declined over the intervening six months. However, as we shall
demonstrate, this training effect was specific to the exact
configuration on which training was carried out.
Experiment 1.3: top/bottom surfaces. To assess whether
the improvement apparently produced by Experiment 1.2 would
generalize to a different arrangement of surfaces, in March 2009
we tested DF on the stimulus depicted in Figure 9A. Here, random
dots depicted a near surface on the top half of the screen and a far
surface on the bottom half (or vice versa). The task was to say
whether the top or bottom surface was nearer. The surfaces either
directly abutted on another, or were separated by a blank region.
In Figure 9B, DF’s performance is independent of the size of the
gap between the surfaces (gradient not significantly different from
zero), whereas control subjects became much better as the gap size
reduced (individual gradients significantly positive for both control
subjects, bootstrap resampling; full data provided in Supporting
Information File S3). Thus, despite the ephemeral training effects
on DF’s ability to use the relative disparity between adjacent
surfaces, she has a significant impairment compared to the ease
with which control subjects effortlessly, automatically exploit this
information.
Experiment 2: Sensitivity to slant defined by disparityIn Experiment 2, we examined DF’s sensitivity to changes in
disparity across a surface (Figure 1B). Subjects were asked to
discriminate the sign of slant defined by binocular disparity, i.e. to
report which side of a slanted surface appeared closer. We again
compared stimuli with and without relative disparity at surface
boundaries. On the full-screen task (Experiment 2.1, Figure 10A),
the whole screen depicted a slanted surface, as if the surface of the
monitor had been rotated about a vertical axis. On the strip task
(Experiment 2.2, Figure 10B), the slanted region was confined to a
horizontal strip running across the whole screen between 64.8ufrom fixation; the strips at the top and bottom of the screen had
zero disparity. Thus, on the full-screen task, adjacent-surface
relative-disparity information was available only at the edges of the
screen, at least 9.5u from the fixation cross. At such large
eccentricities, this information was of little benefit unless the
stimulus was displayed for long enough to enable observers to
make a saccade to the edge of the monitor. For stimulus
presentations of 160ms, the full-screen stimulus effectively
contained no adjacent-surface relative disparity information. The
strip task, on the other hand, contained adjacent-surface relative-
disparity information within 4.8u of the fovea. Many studies have
shown that slant perception in control observers is greatly
enhanced by such surface boundaries [40,41].
Figure 11A compares thresholds recorded on the two tasks: full-
screen (red bars) and strip (blue), both for stimulus durations of
160ms. On the full-screen task, DF’s threshold is worse than most
control observers’, though better than author JR’s. But the control
subjects all show substantial significant improvements in the strip
condition, whereas DF did not. This is quantified in Figure 11B,
which plots the ratio of thresholds on the full-screen condition to
that on the strip condition. For each of the 5 control observers tested
at 160ms, the threshold on the full-screen task was five times greater
than that on the strip task (geometric mean). In contrast, DF’s
thresholds on the two tasks did not differ significantly from each
Figure 6. Results of Experiment 1.1S, 160ms stimulus duration. As Figure 5, but for stimulus durations too short to allow eye movements. SeeSupporting Information File S1 for full data.doi:10.1371/journal.pone.0012608.g006
Stereopsis Without Area LO
PLoS ONE | www.plosone.org 6 September 2010 | Volume 5 | Issue 9 | e12608
other. This is further evidence that DF is impaired in her ability to
benefit from relative disparity information at surface boundaries.
Experiment 3: Dynamic depth stimuliExperiment 3.1: The rotating-cylinder stimulus. In
Experiment 3, we examined DF’s ability to use a different form
of relative disparity, that between transparently-viewed surfaces
(Figure 1D). First we used the ‘‘transparent rotating cylinder’’ task
(Experiment 3.1, Figure 12A). Here, dots moving left and right
with a sinusoidal velocity profile depict a transparent rotating
cylinder, and subjects are asked whether the front surface is
moving left or right. This stimulus has two advantages: first,
normal human subjects have very low thresholds when using
binocular disparity to discriminate front and back surfaces; second,
the neurophysiological evidence points strongly to dorsal stream
involvement in this task [17,42–45], so one might expect DF to be
less impaired here than in Experiment 1.
Indeed, DF could easily perform this task, discriminating front
and back surfaces on the basis of disparities of just 1 minute of arc.
This is better than any of our controls (Figure 12B), although the
large confidence intervals mean we cannot be sure that this
difference is significant. DF’s threshold on the rotating cylinder
task is also twice as good as her performance on any front/back
discrimination task in Experiment 1 (Figure 12C), whereas all
control subjects were between 3 and 10 times worse on the rotating
cylinder task. The rotating cylinder stimulus elicits strong activity
in dorsal cortical area MT. Potentially, therefore, DF’s 20 years of
relying on dorsal areas for visual processing may mean she has
learnt to use this information more efficiently than control
observers.
Experiment 3.2: Relative disparity between transparent
surfaces. DF’s good performance on Experiment 3.1 might
reflect a generally better ability to use absolute disparity in moving
stimuli, rather than a genuine ability to use the relative disparity
Figure 7. Results of Experiment 1.2, the annulus task. A: ‘‘no reference’’ condition of Expt 1.1; C: Annulus stimulus with blank center. Boththese stimuli require an absolute disparity judgment. B: ‘‘no gap’’ condition of Expt 1.1; D: Annulus stimulus when the center is filled with zero-disparity dots. Both these stimuli contain relative disparity information between abutting surfaces. EF: Psychometric functions for patient DF, for thestimuli in C (E) and D (F). The percentage of these judgments are plotted as a function of the disparity of the annulus. Errorbars show 95% confidenceintervals based on simple binomial statistics.doi:10.1371/journal.pone.0012608.g007
Stereopsis Without Area LO
PLoS ONE | www.plosone.org 7 September 2010 | Volume 5 | Issue 9 | e12608

Figure 8. Experiment 1.1, fitted regression gradients from all control subjects and from DF in different testing sessions. AB: Gradientsof the regression lines are shown for the different subjects/sessions, for long (A) and short (160ms, B) stimulus durations. DF’s data are shown inblack/gray. Filled symbols show results from 3 sessions before she was tested on the annulus task (Experiment 1.2, Figure 7, tested in Sep 08); emptysymbols show results from 2 sessions carried out after this. Control data are shown with colored symbols. The vertical dashed lines mark theseparation between DF’s gradients up till April 2008 and those of controls. The horizontal dashed line in B separates DF’s results after testing withExperiment 1.2 from those obtained before.doi:10.1371/journal.pone.0012608.g008
Figure 9. Experiment 1.3: top/bottom closer. Controls perform worse as gap size increases, whereas DF is unaffected. A: sketch of stimulusgeometry. The top and bottom surfaces always had equal and opposite disparity relative to the fixation point; the task is to say which is closer. Wevaried the relative disparity between the top and bottom surfaces to obtain the relative disparity threshold for 4 different sizes of gap separating thetwo surfaces. The ‘‘surfaces’’ were depicted with black and white random dots on a uniform gray background; the gap region was the same uniformgray. B: Thresholds as a function of gap size for patient DF (black squares) and two controls (red dots, blue diamonds). See Supporting InformationFile S3 for full data.doi:10.1371/journal.pone.0012608.g009
Stereopsis Without Area LO
PLoS ONE | www.plosone.org 8 September 2010 | Volume 5 | Issue 9 | e12608

between transparent moving surfaces. To address this, we
compared DF’s absolute disparity thresholds for an isolated
random-dot plane when the dots were static (Figure 13A) versus
when they had a constant velocity of 2.7u either leftwards or
rightwards (Figure 13B). DF’s threshold was the same whether the
dots were static or moving. However, her threshold improved
greatly when we added a second, transparent plane of dots with
opposite disparity and direction of motion (Figure 13C;
Figure 14B). The fact that DF was able to benefit from the
relative disparity provided by this second plane suggests that it was
the relative disparity, not the motion per se, which enabled her
excellent performance on the rotating cylinder task. That is, DF
can instantly and reliably use relative disparity information
between moving transparent surfaces, in sharp contrast to the
difficulty she experiences in learning to use the relative disparity
between spatially separate surfaces.
Experiment 3.3: Perceiving transparent surfaces.
Curiously, despite this good performance, it transpired that DF
in fact only ever perceived one direction of motion when presented
with two transparent planes of dots moving in opposite directions.
When asked to discriminate such stimuli from a single plane where
all the dots moved with the same velocity (Figure 14), she was able
to guess slightly above chance (64 out of 96, p,0.001) after
practice, while but she always reported phenomenal percepts of
single-direction motion. For any normally-sighted individual, the
difference between one or two planes is obvious: one immediately
perceives either one or two directions of motion. Evidently DF
could still use information about transparent planes defined by
motion and/or disparity to improve her depth discrimination
thresholds – as well as or better than any of the control subjects we
examined – despite being unable to perceive this information
consciously.
Figure 10. Experiment 2: Disparity-defined slant. A random-dot pattern is magnified horizontally in one eye so as to depict a surface slantedabout a vertical axis. A: Experiment 2.1, whole display is slanted. B: Experiment 2.2, only central strip is slanted. C: Psychometric functions and fittedthresholds for patient DF (test session April 2009) and age-matched control M2, for stimulus duration 160ms. Note different axis range for M2, stripcondition. See Supporting Information File S3 for full data.doi:10.1371/journal.pone.0012608.g010
Stereopsis Without Area LO
PLoS ONE | www.plosone.org 9 September 2010 | Volume 5 | Issue 9 | e12608

Anti-correlated random-dot patternsWe tested DF on anti-correlated versions of the target-disk
stimulus of Experiment 1.1 (Figure 4Ai), and the rotating cylinder
of Experiment 3.1 (Figure 12A), using disparities with which she
had performed near-perfectly for correlated stimuli. In both cases,
she performed at chance, just like control observers. Specifically,
on Experiment 1.1L with disparity 622 arc min, DF answered
correctly on 59/60 trials when the stimulus was correlated, and on
20/40 trials when it was anti-correlated. On Experiment 3.1 with
a relative disparity of 45 arc min between the front and back
surfaces of the cylinder, DF answered correctly on 32/32 trials
when the stimulus was correlated, and on 8/16 trials when it was
anti-correlated. Thus, neither DF nor controls can perceptually
discriminate the sign of depth in anti-correlated stimuli, despite the
fact that activity in many cortical areas contains the necessary
information [14,17].
Discussion
DF performs normally on many stereo tasksGiven the extensive damage to several areas of DF’s visual
cortex, perhaps the most surprising finding of the present paper is
how little she is impaired on stereoscopic vision. Previous
investigations have established that DF has functional stereo
vision [25,46], although she was reported to have poorer
stereoacuity than controls. Our results show that DF’s poorer
stereoacuity in the earlier studies reflected the task (a standard
clinical test of the relative disparity between two surfaces), rather
than a general stereo deficit. On discriminating depth in isolated
stimuli, or judging the relative depth between transparent planes,
DF performs as well as controls. For example, on Experiment 1.1,
3 out of 5 age-matched controls with normal stereo vision could
not discriminate the depth sign of a briefly-presented isolated
target for any disparity, while author JR, an experienced stereo
observer twenty years younger than DF, could not match her
threshold. On the rotating cylinder task, DF outperformed all of
the controls we examined. Thus, the particular impairments that
we have been able to record certainly do not reflect a general loss
of stereoacuity or a difficulty in achieving stereoscopic fusion.
DF is impaired in using relative disparity betweendifferent visual-field locations
The major impairment is DF’s ability to exploit relative
disparity between nearby surfaces. Thus, in Experiments 1.1 and
1.3, DF’s performance drops dramatically below that of controls
when the comparison surfaces are close together, because controls
Figure 11. Results of Experiment 2: Disparity-defined slant. A:Magnification thresholds for DF and 5 controls on Experiment 2, in thefull-screen condition (red, 2.1, Figure 7A) and in the strip condition(blue, 2.2, Figure 7B), stimulus duration 160ms. Subject JR’s thresholdon the full-screen task was 5%. B: Ratio of magnification thresholdobtained in the full-screen task to threshold obtained in the strip task.In both cases, error-bars show 95% confidence intervals. See SupportingInformation File S3 for full data.doi:10.1371/journal.pone.0012608.g011
Figure 12. Experiment 3.1: Rotating cylinder. A: sketch of the stimulus. Black and white squares move sinusoidally back and forth across a graybackground, giving the impression of a glass cylinder covered in dots rotating about its own axis. The cylinder was 5.8u wide69.2u high. The cylindercompleted one rotation every 5s, corresponding to an average dot velocity of 2.6u/s. B: Disparity thresholds for DF and 5 controls, i.e. the relativedisparity between the front and back surfaces of the cylinder at which performance is 84% correct. C: Disparity thresholds on the rotating cylindertask expressed as a fraction of smallest threshold obtained on any front/back discrimination task. See Supporting Information File S3 for full data.doi:10.1371/journal.pone.0012608.g012
Stereopsis Without Area LO
PLoS ONE | www.plosone.org 10 September 2010 | Volume 5 | Issue 9 | e12608

are able to judge the relative disparity between surfaces more
accurately than the absolute disparity of either one alone. In the
disparity-defined slant task, the performance of controls improves
when the slant is confined to a central strip (Experiment 2.2S),
because they benefit from the relative-disparity information
available at the strip’s boundary. In contrast, DF shows no such
improvement. Thus, three different stimulus geometries all
indicate that DF has difficulties in using relative disparity at
surface boundaries.
The results of Experiment 1 are consistent with previous
suggestions that the dorsal stream predominantly handles ‘‘coarse’’
stereopsis, e.g. absolute disparity signals representing objects’
locations in 3D space, whereas the ventral stream handles ‘‘fine’’
stereopsis, including relative disparity between adjacent surfaces
[2,47,48].
The firing of dorsal stream neurons contains information about
fine disparities in the visual scene, but whether this information
contributes to perception depends critically both on the stimulus
configuration and on training [44,45,47–49]. It is possible that,
over the 20 years since her lesion, DF has learnt to make
particularly good use of the fine-disparity information available in
V5/MT and other dorsal areas. Since the rotating cylinder
stimulus is especially effective in stimulating V5/MT neurons [42],
a task that demands use of this information may actually benefit
DF.
Possible interpretationsGiven that DF’s major cortical lesion is to the lateral occipital
area LO, we suggest that this brain area may be critical for
achieving the ultra-fine sensitivity that control subjects automat-
ically display on these tasks. DF’s spared ability to use the
relative disparity between transparent surfaces in this way is
consistent with imaging and neurophysiological evidence sug-
gesting that this ability depends upon dorsal areas such as MT
[42,50,51], perhaps because such disparity/motion parallax
information can be important for guiding movements. There is
in fact independent evidence that DF can exploit motion
parallax, as well as stereo information, when reaching to grasp
slanted objects [52,53].
This then raises the question of how precisely area LO enables
controls to exploit relative disparity information at surface
boundaries. Human imaging studies suggest that LO is involved
in the processing of stereo-defined shape, including stereo-defined
boundaries [54–57]. However, DF’s ability to use relative
disparity information after appropriate training suggests that
she has not simply lost the neuronal tissue which computes
relative disparity at surface boundaries, nor the ability to exploit
these signals in principle. Rather, it may be that her lesion makes
it difficult for her to identify the appropriate neuronal signals for
a given relative disparity task. For example, DF may have
difficulty identifying disparity boundaries between surfaces. Her
good performance on transparent stimuli may reflect the fact that
these offer the same relative disparity information widely
throughout the stimulus.
One possibility to consider is that DF’s underlying deficit is in
perceiving, or attending to, both surfaces simultaneously. DF’s
subjective reports certainly indicate that, while aware of
performing more accurately in trial blocks when gap size was
smaller, she had no explicit perceptual awareness that the
reference surround had moved closer. But it has been apparent
Figure 13. Experiment 3.2: front/back discrimination with static vs moving dots. The stimulus was a patch of light and dark dots 4.5uwide62.2u high on a gray background. In (A), the dots were static and all in the same depth plane, with absolute disparity indicated on the horizontalaxis. The red line shows a cumulative Gaussian fitted to the black dots (white dots represent data not used for fitting); the number in the upper rightis the fitted threshold, i.e. the standard deviation of the fitted Gaussian. (B) as (A), except the dots were moving either left or right, with constantspeed 2.7u/s. In (A) and (B), the task was to report whether the plane appeared in front of or behind the screen. (C) as (B), except there was a secondplane of dots with the opposite direction of motion, and opposite disparity. The two planes of dots moved transparently past one another; the totaldot density was thus twice as great in (C) as in (A) and (B). The task in (C) was to report the direction of motion of the front plane. For comparisonwith A and B, the horizontal axis in C, and the threshold, shows the absolute disparity of the leftward-moving plane. The relative disparity betweenthe two planes was twice this.doi:10.1371/journal.pone.0012608.g013
Stereopsis Without Area LO
PLoS ONE | www.plosone.org 11 September 2010 | Volume 5 | Issue 9 | e12608

for many years that DF’s perception and behaviour can be
strongly influenced by stimuli that she cannot consciously
discriminate [25,27,58]. Indeed we have internal evidence of
this within the present study, in that DF was surprisingly unable
to perceive superimposed transparent planes defined by motion
and/or disparity – she invariably saw motion in only one
direction. Yet she was still able to use the relative disparity
between two such planes to improve her depth discrimination
thresholds – as well as or better than our control subjects. This
demonstrates that DF’s difficulty in using relative disparity
information between adjacent surfaces is logically distinct from
any difficulty she may have in perceiving or attending to both
surfaces. In any case, there is also clear independent evidence
from other contexts that DF can combine visual information
from the peripheral visual field with central (target) information
quite efficiently, for example in order to avoid obstacles during
reaching [59].
ConclusionsWe have conducted a detailed, quantitative examination of
stereo vision in patient DF, who has visual agnosia following
cortical damage to predominantly ventral areas. On many stereo
tasks, DF performs as well as controls. However, our tests reveal a
very specific difficulty, namely in the use of relative disparity
between spatially separate locations (Figure 1C). This finding
suggests that ventral stream areas may usually be key in achieving
the enhanced stereo vision that characterizes normal performance
on such tasks.
Figure 14. Experiment 3.3: One (A/C) vs two (B/D) planes, defined by moving dots. Each plane was defined by dots moving with the samespeed and direction, either left or right. Each plane had a disparity of either 0 or 611.2 arc min; in the two-plane stimulus with non-zero disparity, theplanes had opposite disparity (i.e. the relative disparity between the two planes was either 0 or 22.4 arc min. A/B shows a schematic of an examplestimulus on the screen; C/D shows a top-down view of the simulated planes, for each possible stimulus configuration of each type. The number ofdots on each plane was constant, i.e. the total number of dots visible was twice as great in the two-plane stimulus (B). The task was to discriminatethe one-plane stimuli (A/C) from the two-plane (B/D); this could be done either by detecting the number of directions of motion present (one vs two),or using the density cue.doi:10.1371/journal.pone.0012608.g014
Stereopsis Without Area LO
PLoS ONE | www.plosone.org 12 September 2010 | Volume 5 | Issue 9 | e12608

Supporting Information
File S1 Note on fitting psychometric functions.
Found at: doi:10.1371/journal.pone.0012608.s001 (0.20 MB
PDF)
File S2 Psychophysics data from Expt 1.1.
Found at: doi:10.1371/journal.pone.0012608.s002 (0.45 MB
PDF)
File S3 Psychophysics data from Expts 1.3, 2 and 3.1.
Found at: doi:10.1371/journal.pone.0012608.s003 (0.32 MB
PDF)
Acknowledgments
We thank DF and all our control observers for their patience.
Author Contributions
Conceived and designed the experiments: JCAR AJP. Performed the
experiments: JCAR GPP ISP AJP. Analyzed the data: JCAR ISP. Wrote
the paper: JCAR ADM AJP.
References
1. Westheimer G (1979) Cooperative neural processes involved in stereoscopic
acuity. Exp Brain Res 36: 585–597.
2. Parker AJ (2007) Binocular depth perception and the cerebral cortex. Nat Rev
Neurosci 8: 379–391.
3. Thomas OM, Cumming BG, Parker AJ (2002) A specialization for relativedisparity in V2. Nat Neurosci 5: 472–478.
4. Bredfeldt CE, Cumming BG (2006) A simple account of cyclopean edge
responses in macaque V2. J Neurosci 26: 7581–7596.
5. von der Heydt R, Zhou H, Friedman HS (2000) Representation of stereoscopicedges in monkey visual cortex. Vision Res 40: 1955–1967.
6. Umeda K, Tanabe S, Fujita I (2007) Representation of stereoscopic depth based
on relative disparity in macaque area V4. J Neurophysiol 98: 241–252.
7. Janssen P, Vogels R, Orban GA (1999) Macaque inferior temporal neurons areselective for disparity-defined three-dimensional shapes. Proc Natl Acad Sci U S A
96: 8217–8222.
8. Janssen P, Vogels R, Orban GA (2000) Three-dimensional shape coding ininferior temporal cortex. Neuron 27: 385–397.
9. Tsao DY, Vanduffel W, Sasaki Y, Fize D, Knutsen TA, et al. (2003) Stereopsis
activates V3A and caudal intraparietal areas in macaques and humans. Neuron39: 555–568.
10. Neri P, Bridge H, Heeger DJ (2004) Stereoscopic processing of absolute and
relative disparity in human visual cortex. J Neurophysiol 92: 1880–1891.
11. Haefner RM, Cumming BG (2008) Adaptation to natural binocular disparities
in primate V1 explained by a generalized energy model. Neuron 57: 147–158.
12. Cogan AI, Lomakin AJ, Rossi AF (1993) Depth in anticorrelated stereograms:effects of spatial density and interocular delay. Vision Res 33: 1959–1975.
13. Cumming BG, Shapiro SE, Parker A (1998) Disparity detection in anticorrelated
stereograms. Perception 27: 1367–1377.
14. Cumming BG, Parker AJ (1997) Responses of primary visual cortical neurons tobinocular disparity without depth perception. Nature 389: 280–283.
15. Read JCA, Eagle RA (2000) Reversed stereo depth and motion direction with
anti-correlated stimuli. Vision Res 40: 3345–3358.
16. Ohzawa I, DeAngelis GC, Freeman RD (1990) Stereoscopic depth discrimina-tion in the visual cortex: neurons ideally suited as disparity detectors. Science
249: 1037–1041.
17. Krug K, Cumming BG, Parker AJ (2004) Comparing perceptual signals of singleV5/MT neurons in two binocular depth tasks. J Neurophysiol 92: 1586–1596.
18. Neri P, Parker AJ, Blakemore C (1999) Probing the human stereoscopic system
with reverse correlation. Nature 401: 695–698.
19. Masson GS, Busettini C, Miles FA (1997) Vergence eye movements in response
to binocular disparity without depth perception. Nature 389: 283–285.
20. Takemura A, Inoue Y, Kawano K, Quaia C, Miles FA (2001) Single-unitactivity in cortical area MST associated with disparity-vergence eye movements:
evidence for population coding. J Neurophysiol 85: 2245–2266.
21. Tanabe S, Umeda K, Fujita I (2004) Rejection of false matches for binocularcorrespondence in macaque visual cortical area V4. J Neurosci 24: 8170–8180.
22. Janssen P, Vogels R, Liu Y, Orban GA (2003) At least at the level of inferior
temporal cortex, the stereo correspondence problem is solved. Neuron 37:693–701.
23. Bridge H, Parker AJ (2007) Topographical representation of binocular depth in
the human visual cortex using fMRI. J Vis 7: 15 11–14.
24. Preston TJ, Li S, Kourtzi Z, Welchman AE (2008) Multivoxel pattern selectivityfor perceptually relevant binocular disparities in the human brain. J Neurosci 28:
11315–11327.
25. Milner AD, Perrett DI, Johnston RS, Benson PJ, Jordan TR, et al. (1991)Perception and action in ‘visual form agnosia’. Brain 114(Pt 1B): 405–428.
26. James TW, Culham J, Humphrey GK, Milner AD, Goodale MA (2003) Ventral
occipital lesions impair object recognition but not object-directed grasping: anfMRI study. Brain 126: 2463–2475.
27. Goodale MA, Milner AD, Jakobson LS, Carey DP (1991) A neurological
dissociation between perceiving objects and grasping them. Nature 349:154–156.
28. Brainard DH (1997) The Psychophysics Toolbox. Spat Vis 10: 433–436.
29. Pelli DG (1997) The VideoToolbox software for visual psychophysics:
transforming numbers into movies. Spat Vis 10: 437–442.
30. Julesz B (1971) Foundations of cyclopean perception. Chicago: University of
Chicago Press.
31. Wichmann FA, Hill NJ (2001) The psychometric function: I. Fitting, sampling,
and goodness of fit. Percept Psychophys 63: 1293–1313.
32. Wilson EB (1927) Probable inference, the law of succession, and statistical
inference. Journal of the American Statistical Association 22: 209–212.
33. Efron B (1979) Bootstrap methods: another look at the jackknife. Annals of
Statistics 7: 1–26.
34. Wichmann FA, Hill NJ (2001) The psychometric function: II. Bootstrap-based
confidence intervals and sampling. Percept Psychophys 63: 1314–1329.
35. Crawford JR, Garthwaite PH (2004) Statistical methods for single-case studies in
neuropsychology: comparing the slope of a patient’s regression line with those of
a control sample. Cortex 40: 533–548.
36. Crawford JR, Garthwaite PH (2007) Comparison of a single case to a control or
normative sample in neuropsychology: development of a Bayesian approach.
Cogn Neuropsychol 24: 343–372.
37. Erkelens CJ, Collewijn H (1985) Motion perception during dichoptic viewing of
moving random-dot stereograms. Vision Res 25: 583–588.
38. Crawford JR, Garthwaite PH (2002) Investigation of the single case in
neuropsychology: confidence limits on the abnormality of test scores and test
score differences. Neuropsychologia 40: 1196–1208.
39. Mon-Williams M, Tresilian JR, McIntosh RD, Milner AD (2001) Monocular
and binocular distance cues: insights from visual form agnosia I (of III). Exp
Brain Res 139: 127–136.
40. Gillam B, Flagg T, Finlay D (1984) Evidence for disparity change as the primary
stimulus for stereoscopic processing. Percept Psychophys 36: 559–564.
41. Gillam B, Blackburn S, Brooks K (2007) Hinge versus twist: the effects of
‘reference surfaces’ and discontinuities on stereoscopic slant perception.
Perception 36: 596–616.
42. Bradley DC, Chang GC, Andersen RA (1998) Encoding of three-
dimensional structure-from-motion by primate area MT neurons. Nature 392:
714–717.
43. DeAngelis GC, Cumming BG, Newsome WT (1998) Cortical area MT and the
perception of stereoscopic depth. Nature 394: 677–680.
44. Dodd JV, Krug K, Cumming BG, Parker AJ (2001) Perceptually bistable three-
dimensional figures evoke high choice probabilities in cortical area MT.
J Neurosci 21: 4809–4821.
45. Uka T, DeAngelis GC (2004) Contribution of area MT to stereoscopic depth
perception: choice-related response modulations reflect task strategy. Neuron 42:
297–310.
46. Marotta JJ, Behrmann M, Goodale MA (1997) The removal of binocular cues
disrupts the calibration of grasping in patients with visual form agnosia. Exp
Brain Res 116: 113–121.
47. Uka T, DeAngelis GC (2006) Linking neural representation to function in
stereoscopic depth perception: roles of the middle temporal area in coarse versus
fine disparity discrimination. J Neurosci 26: 6791–6802.
48. Roe AW, Parker AJ, Born RT, DeAngelis GC (2007) Disparity channels in early
vision. J Neurosci 27: 11820–11831.
49. Chowdhury SA, DeAngelis GC (2008) Fine discrimination training alters the
causal contribution of macaque area MT to depth perception. Neuron 60:
367–377.
50. Bradley DC, Qian N, Andersen RA (1995) Integration of motion and stereopsis
in middle temporal cortical area of macaques. Nature 373: 609–611.
51. Spang K, Morgan M (2008) Cortical correlates of stereoscopic depth produced
by temporal delay. J Vis 8: 10 11–12.
52. Dijkerman HC, Milner AD, Carey DP (1996) The perception and prehension of
objects oriented in the depth plane. I. Effects of visual form agnosia. Exp Brain
Res 112: 442–451.
53. Dijkerman HC, Milner AD, Carey DP (1999) Motion parallax enables depth
processing for action in a visual form agnosic when binocular vision is
unavailable. Neuropsychologia 37: 1505–1510.
54. Gilaie-Dotan S, Ullman S, Kushnir T, Malach R (2002) Shape-selective stereo
processing in human object-related visual areas. Hum Brain Mapp 15: 67–
79.
Stereopsis Without Area LO
PLoS ONE | www.plosone.org 13 September 2010 | Volume 5 | Issue 9 | e12608

55. Mendola JD, Dale AM, Fischl B, Liu AK, Tootell RB (1999) The representation
of illusory and real contours in human cortical visual areas revealed byfunctional magnetic resonance imaging. J Neurosci 19: 8560–8572.
56. Kourtzi Z, Kanwisher N (2001) Representation of perceived object shape by the
human lateral occipital complex. Science 293: 1506–1509.57. Grill-Spector K, Kourtzi Z, Kanwisher N (2001) The lateral occipital complex
and its role in object recognition. Vision Res 41: 1409–1422.
58. Humphrey GK, Goodale MA, Gurnsey R (1991) Orientation Discrimination in
a Visual Form Agnosic: Evidence from the McCollough Effect Psychological
Science 2: 331–335.
59. Rice NJ, McIntosh RD, Schindler I, Mon-Williams M, Demonet JF, et al. (2006)
Intact automatic avoidance of obstacles in patients with visual form agnosia. Exp
Brain Res 174: 176–188.
Stereopsis Without Area LO
PLoS ONE | www.plosone.org 14 September 2010 | Volume 5 | Issue 9 | e12608


