Embed Size (px)
Citation preview
Ministry of Higher Education and Scientific Research
University of Technology
Computer Engineering and Information Technology Department
DESIGN AND IMPLEMENTATION OF
USER INTERFACE; STRATEGIES FOR
EFFECTIVE HUMAN COMPUTER
INTERFACE
A Thesis Submitted to the Department of
Computer Engineering and Information Technology
University of Technology
In Partial Fulfillment of the Requirements for the Degree of
Master of Science in
Software Engineering
Prepared By:
Muna Dhia Sheet Khattab
Supervised By:
Dr. Mohammed Najim Abdullah
March, 2007 Rabia I, 1428

صدق اهللا العظيم
)سورة العلق(

DEDICATED TO;
My sons
Ahmed and Mohammed
And more so to my
Father and Mother
But most to my husband
Kais
CERTIFICATION
I certify that this thesis entitled Design and Implementation of User
Interface; Strategies for Effective Human Computer Interface was
prepared under my linguistic supervision. Its language was amended to meet
the style of English language.
Signature
Name:
Date:
SUPERVISOR’S CERTIFICATION
I certify that the preparation of this thesis entitled Design and
Implementation of User Interface; Strategies for Effective Human
Computer Interface was made under my supervision by Muna Dhia Sheet
Khattab at the Department of Computer Engineering and Information
Technology in the University of Technology in partial fulfillment of
requirements for the degree of Master of Science in Software Engineering.
Signature
Dr. Mohammed Najim Abdullah
Supervisor
Date: / /2007

ACKNOWLEDGMENT
I am highly indebted to my supervisor Dr. Mohammed Najim
Abdullah for his supervision, guidance and encouragement through this
work.
Next, I would like to express my sincere thanks and gratitude to Prof.
Dr. Munther N. Baker for his assistance in conducting this work.
I also express my gratitude to Eng. Anas Younis who was very helpful
in his suggestions and support through the course of this work.
Finally, I would like to thanks Mr. Nazar AlQuraishi who has
facilitated my obtaining the necessary data for the work.
i
LIST OF ABBREVIATIONS
ADO ActiveX Data Object
COM Component Object Model
CPM-GOMS Cognitive Perceptual Motor Goal Operators
Methods Selection
DB Database
DBMS Database Management System
DCS Distributed Control System
GOMS Goal Operators Methods Selections
GUI Graphical User Interface
HCI Human Computer Interface
HMI Human Machine Interface
IP Internet Protocol
IS Information Systems
LAN Local Area Network
LUCID Logical User- Centered Interaction Design
MDAC Microsoft Data Access Components
MFC Microsoft Foundation Classes
MMI Man Machine Interface
MS Microsoft
NCS National Communication System
NDC National Dispatch center
OAI Object Action Interface
ODBC Open Database Connectivity
OLE Object Linking and Embedding
OLE DB Object Linking and Embedded Database
ii
PC Personal Computer
PLC Programmable Logic Controller
PSN Public Switched Network
RAM Random Access Memory
RTU Remote Terminal Unit
SCADA Supervisory Control and Data Acquisition
SDLC System Development Life Cycle
SQL Structured Query Language
TAG Task Action Grammars
TIB Technical Information Bulletin
UHF Ultra High Frequency
UI User Interface
UIMS User Interface Management System
VHF Very High Frequency
WAN Wide Area Network
iii
ABSTRACT
The study of the strategies for Effective Human Computer Interaction (HCI) is
a powerful primer on how - and why - some products satisfy customers while others
only frustrate them. As computer use became more widespread, the number of
researchers specialized in studying the interaction between people and computers
increased. These researchers deal with the physical, psychological and theoretical
aspects of such interaction.
Many products that require users to interact with them to carry out their tasks
have not necessarily been designed with the users in mind. Typically, they have been
engineered as systems to perform set functions. The aim of this thesis is to redress this
concern by bringing usability into the design process. In essence, it is about
developing interactive products that are easy, effective, and enjoyable to use –from
the users’ perspective.
This thesis shows that the success of any user-interface development depends
on three pillars; guidelines documents and processes, users-interface software tools,
and expert review and usability testing. These three pillars help user-interface
architects to turn good ideas into successful systems. Experience has shown that each
pillar can produce an order-of- magnitude speedup in the process and can facilitate the
creation of excellent systems.
This methodology for effective and interactive human computer interface
design was applied to Iraqi Power Generation Stations, Supervisory Control and Data
Acquisition (SCADA) System and was tested by using real database taken from
AlQurashi Bureau. SEMATIC Window Control Center (WinCC), version 6,
developed by Siemens AG was used to design the SCADA and HCI modules.
Evaluation methods were applied to the developed product such as cognitive
walkthrough, competitive usability testing, and questionnaire for user interaction
satisfaction (QUIS) and finally quality test of the developed product was conducted.
iv
CONTENTS
Title Page
Chapter One
General Introduction
1.1 Introduction 2
1.2 Definition of HCI: 3
1.3 Advantages and applications of HCI 4
1.4 The Importance of HCI 5
1.5 Professionals involved in HCI 6
1.6 SCADA Systems 6
1.7 Literature survey 8
1.7.1 Work related to HCI 8
1.7.2 Work related to SCADA system 10
1.7.3 Work related to usability 12
1.8 Work Objectives 12
1.9 Thesis Outline 12
Chapter Two
HCI Guidelines, Principles and Theories
2.1 Introduction 15
2.2 Guidelines 16
2.2.1 Navigation of the interface 17
2.2.2 Organization of the display 17
v
2.2.3 Recommendations for guidelines documents 18
2.3 Principles 19
2.3.1 Determine users’ skill levels 20
2.3.2 Identify the tasks 21
2.3.3 Choose an interaction styles 22
2.3.4 Use the eight golden rules of interface design 24
2.3.5 Prevent Errors 26
2.4 Theories 26
2.5 Object-Action Interface Model 27
2.5.1 Task hierarchies of objects and actions 27
2.5.2 Interface hierarchies of objects and actions 28
2.5.3 The disappearance of syntax 29
2.6 LUCID Development Methodology 29
Chapter Three
Software Tools, Expert Reviews and Usability Testing
3.1 Introduction 34
3.2 Software-Engineering Tools 34
3.3 Criteria of Finding the Right Design Tool 36
3.4 SIMATIC WinCC HMI 38
3.4.1 WinCC Advanced Features 39
3.4.2 WinCC Traditional HMI Tasks 40
3.5 SCADA Screens 41
3.5.1 Schematic Pages 41
3.5.2 Database Pages 42
3.5.3 Alarm/Event Pages 42
vi
3.5.4 Report Pages 43
3.5.5 Operator Pages 43
3.6 Database Management System 43
3.6.1 SQL Server 44
3.6.2 ActiveX Data Object 44
3.7 Evaluating Interface Designs 45
3.7.1 Expert Reviews 45
3.7.2 Expert-Reviews Report 48
3.8 Usability Definition 49 3.8.1 Usability Testing and Laboratories 49 3.8.2 Limitations of Usability Testing 50
3.9 Survey and Questionnaire 50 3.9.1 Questionnaire for User Interaction Satisfaction (QUIS) 51
3.10 Acceptance Tests 51
3.11 Evaluation during Active Use 52
Chapter Four
Implementation of HCI for SCADA System
4.1 Introduction 54
4.2 Case Study: The Electrical Power Generation System 54
4.3 Communication System 57
4.4 Master station 59
4.5 Electrical Power Generation Station (field data interface devices) 59
4.5.1 Power station specifications 60
4.6 Defining SCADA Modules 62
4.6.1 Graphic Designers 63
vii
4.6.2 Plant Program 65
4.6.3 Report Designer Module 65
4.6.4 Trends Module 66
4.6.5 Alarm Generation Module 67
4.6.6 Achieving Module 69
4.6.7 Data Base Modules 69
4.6.7.1 System database 70
4.6.7.2 Archive Database 70
4.6.7.3 Tag Database 70
4.6.8 Application Module 71
4.6.9 HMI Module 71
4.6.9.1 HMI Main Page 71
4.6.9.2 Navigation Page 72
4.6.9.3 HMI Schematic Pages 74
4.6.9.4 Database Pages 76
4.6.9.5 Alarm/ Event Pages 76
4.6.9.6 HMI Trending Pages 77
4.6.9.7 HMI Report Pages 77
4.6.9.8 HMI System Pages 79
4.6.9.9 HMI Operators Pages 79
Chapter Five
HCI and SCADA System Test
5.1 Introduction 82
5.2 Requirements for the Installation of WinCC 83
5.2.1 Hardware Requirements for the Installation of WinCC 83
viii
5.2.2 Software Requirements for the Installation 84
5.3 Expert Reviews 84
5.3.1 Cognitive walkthrough technique 84
5.4 Usability Testing 85
5.5 Questionnaire for User Interaction Satisfaction (QUIS) 85
5.6 Running the SCADA Product 91
5.7 Developed Product Quality Test 92
Chapter Six
Conclusions and Suggestions for Future Work
6.1 Conclusion 95
6.2 Suggestions for Future Work 97
References 99
Appendix A
SCADA System Functions A-1
Appendix B
Walkthrough and Heuristic Evaluation B-1
Appendix C
Questionnaire for User Interaction Satisfaction C-1
CHAPTER ONE
GENERAL INTRODUCTION
Chapter One; GENERAL INTRODUCTION
2
CHAPTER ONE
GENERAL INTRODUCTION
1.1 Introduction Old computing was about what computers could do; the new
computing is about what users can do [22]. Successful technologies are
those that are in harmony with users’ needs. Researchers and designers
could claim success, but user expectations are higher, applications are more
demanding, and the variety of platforms has grown. In addition to desk top
computers designers must now accommodate web-based services and
mobile devices. At the same time, some innovators provoke us with virtual
and augmented realities, whereas others alluring scenarios for ubiquitous
computing, embedded devices, and tangible user interfaces [3]. Human-
Computer Interaction (HCI) is the study of how people design, implement,
use interactive computer systems, and how computers affect individuals,
organizations, and society. This encompasses not only ease of use but also
new interaction techniques for supporting user tasks, providing better access
to information, and creating more powerful forms of communication. It
involves input and output devices, interaction techniques, how information is
presented and requested, how the computer's actions are controlled and
monitored and all forms of help, documentation, and training. It also
includes tools used to design, build, test, and evaluate user interfaces and the
processes that developers follow when creating interfaces.
Chapter One; GENERAL INTRODUCTION
3
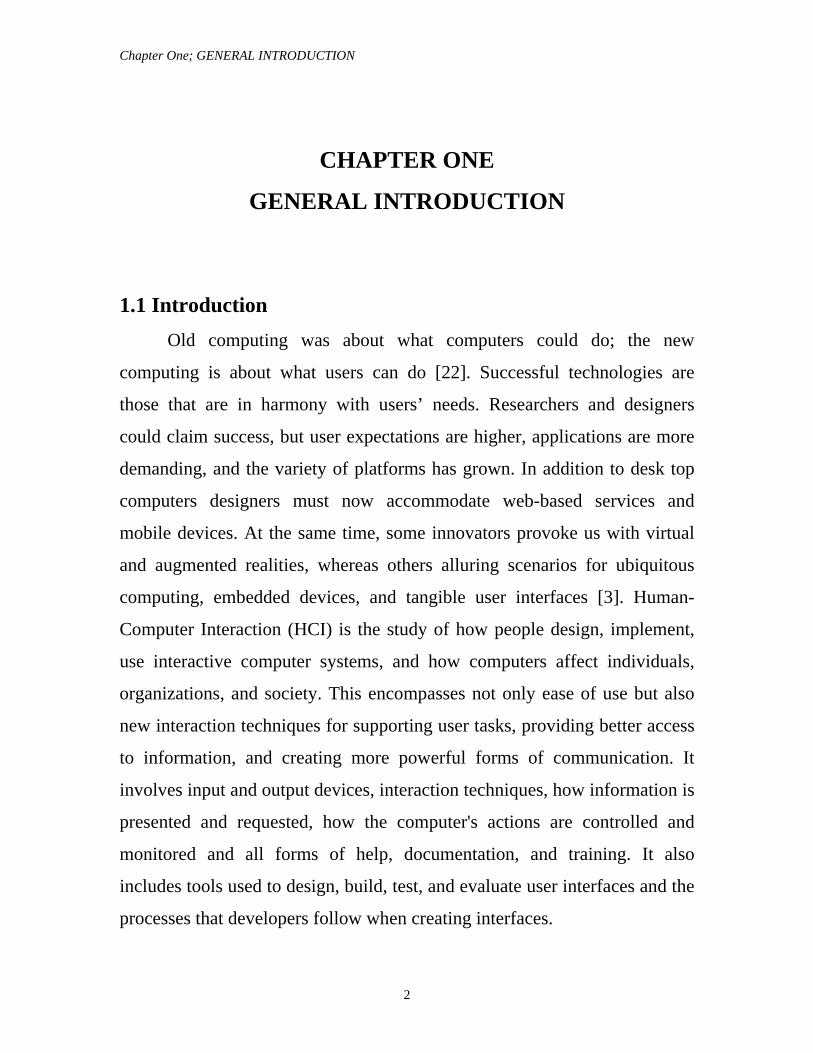
Users expect highly effective and easy-to-learn interfaces, and
developers now realize the crucial role the interface plays. Surveys show that
over 50% of the design and programming effort on projects are devoted to
the user interface portion [40, 52]. Interface design is a major part of HCI,
because there are also well-known catastrophes that have resulted from not
paying enough attention to the human-computer interface [3].
Figure 1.1: The Nature of Human Computer Interaction
1.2 Definition of HCI: There is currently no agreed upon definition of the range of topics
which form the area of human-computer interaction. Yet it is needed to
characterize the field to get the right definition, therefore from a computer
Chapter One; GENERAL INTRODUCTION
4
science perspective, since it’s focus is on interaction and specifically on
interaction between one or more humans and one or more computational
machines, it can be defined as;
“Human-computer interaction is a discipline concerned with the design,
evaluation and implementation of interactive computing systems for
human use and with the study of major phenomena surrounding them.”
[39].
1.3 Advantages and Applications of HCI Human Computer Interaction helps to produce business success
stories and produce intense computation for organizations. Routine
processes and decision support are also affected by HCI for individual user
level as well as communities for globalization and family use. Below is a
brief of such effects [3];
• Organizations
- Success Stories: Microsoft, Linux, Amazon.com, Google.
- Compétition : Netscape vs. Internet Explorer.
- Copyright Infringement Suits: Apple vs. Microsoft (Windows) and
Napster vs. The music industry.
- Mergers: AOL and Time Warner.
- Corporate Takeovers: IBM’s seizure of Lotus.
- Privacy and Security issues: identification theft, medical information,
viruses, spam, pornography, national security.
• Individual User Level
- Routine processes: tax return preparation.
- Decision support: a doctor’s diagnosis and treatment.
Chapter One; GENERAL INTRODUCTION
5
- Education and training: encyclopedias, drill- and practice exercises,
simulations
- Leisure: music and sports information.
• Communities
- Business use: financial planning, publishing applications.
- Industries and professions: web resources for journals, and career
opportunities.
- Family use: entertainment and communication.
- Globalization: language and culture.
1.4 The Importance of HCI Human-Computer Interaction studies a human and a machine in
communication; it draws from supporting knowledge on both the machine
and the human side. On the machine side, techniques in computer graphics,
operating systems, programming languages, and development environments
are relevant. On the human side, communication theory, graphic and
industrial design disciplines, linguistics, social sciences, cognitive
psychology, and human performance are relevant. As well as engineering
and design methods are also relevant. Therefore, the answer to why Human-
Computer Interaction is;
- 40-60% of today’s software consists of user interfaces [22].
- Such interfaces support high interactivity with the user, much end-user
programming
-User interactivity is only going to get more complex: 3D graphics and
virtual reality, augmented reality activities….
- Many usability problems are due to a bad interface design.
Chapter One; GENERAL INTRODUCTION
6
- Users sabotage systems they don’t understand.
- Users make more errors when dealing with systems that are difficult to
use.
- A well-designed user interface can reduce coding costs, interface
problems, life-threatening errors; can also lead to increase sales
…more...
1.5 Professionals Involved in HCI The interdisciplinary design science of Human- Computer Interaction
(HCI) combines knowledge and methods associated with professionals
including:
- Psychologists (including experimental, educational, and industrial
psychologists).
- Computer scientists.
- Instructional and graphic designers.
- Technical writers.
- Human factors and ergonomics experts.
- Anthropologists and sociologists.
1.6 SCADA Systems SCADA is an acronym for Supervisory Control and Data Acquisition.
SCADA systems are used to monitor and control a plant or equipment in
industries such as; energy, oil and gas refining, telecommunications, and
transportation. These systems encompass the transfer of data between a
central host computer and a number of Remote Terminal Units (RTUs)
and/or Programmable Logic Controllers (PLCs), and the central host and the
Chapter One; GENERAL INTRODUCTION
7
operator terminals. A SCADA system gathers information, transfers the
information back to a central site, then alerts the home station that a trip has
occurred, carrying out necessary analysis and control, such as determining if
the trip is critical, and displaying the information in a logical and organized
fashion. These systems consist of:
- One or more field data interface devices, usually RTUs, or PLCs, which
is interfaced to field sensing devices and local control switchboxes and
valve actuators.
- A communications system is used to transfer data between field data
interface devices and control units and the computers in the SCADA
central host. The system can be based on radio, telephone, cable,
satellite, etc., or any combination of these.
- A central host computer server or servers (sometimes called a SCADA
Center, master station, or Master Terminal Unit (MTU).
- A collection of standard and/or custom software [sometimes called
Human Machine Interface (HMI) software or Man Machine Interface
(MMI) software] systems are used to provide the SCADA central host
and operator terminal application, support the communications system,
and monitor and control remotely located field data interface devices.
The SCADA traditional communication systems have made use of the
Public Switched Network (PSN) for monitoring purposes. Today many
systems are monitored using the infrastructure of the corporate Local Area
Network (LAN)/Wide Area Network (WAN). Wireless technologies are
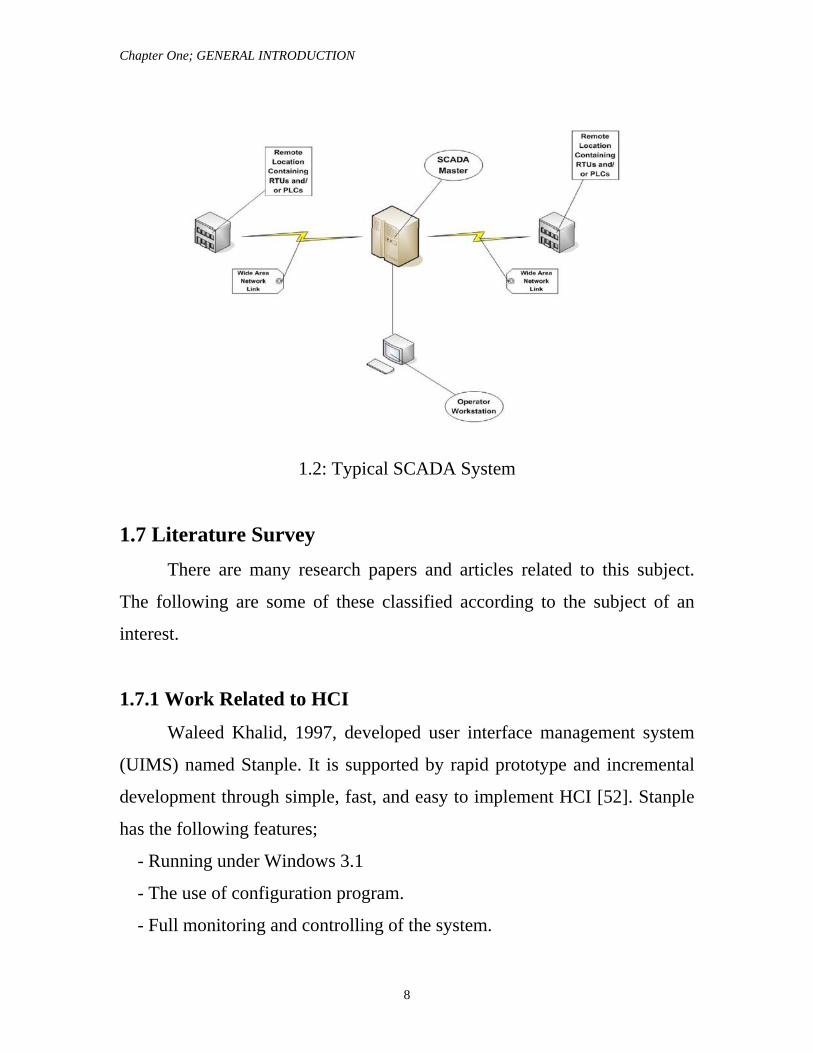
now being widely deployed for purposes of monitoring. Figure 1.2 shows a
typical SCADA system [43].
Chapter One; GENERAL INTRODUCTION
8
1.2: Typical SCADA System
1.7 Literature Survey There are many research papers and articles related to this subject.
The following are some of these classified according to the subject of an
interest.
1.7.1 Work Related to HCI
Waleed Khalid, 1997, developed user interface management system
(UIMS) named Stanple. It is supported by rapid prototype and incremental
development through simple, fast, and easy to implement HCI [52]. Stanple
has the following features;
- Running under Windows 3.1
- The use of configuration program.
- Full monitoring and controlling of the system.
Chapter One; GENERAL INTRODUCTION
9
- Supports schematic and Alarm/Event pages only.
Hadeel Abdul-Ammeer, 2000, developed user interface management
system (UIMS) named HCI Studio [20]. Many concepts of HCI design, like
interface styles, principles to support interface usability, and interface
independence where are studied in her thesis. The studio has the following
features;
- Running under Windows 95, 98, and NT.
- Full graphical features.
- Password protection.
- Arabic HCI.
- On-Line help.
- Flexible and attractive HCI.
- Supporting Schematic and Alarm/Event pages only.
Afrah Thamir Ali, 2005, presented many concepts of high quality
software engineering like modularity, high cohesion and low coupling
studied which are used to enhance HCI quality [1]. The enhanced HCI has
the following features;
- HCI is divided into three separate modules.
- Full visualization of the process.
- Containing all SCADA necessary pages.
- Reusability, Productivity and user satisfaction are achieved.
- Running under windows 2000 operating system.
- Password protection.
Ping Zhang, Jane Carey, Dov Te’eni and Marilyn Tremaine, 2005,
stated that incorporating a human computer (HCI) perspective into the
system’s developed life cycle (SDLC) is necessary for information systems
Chapter One; GENERAL INTRODUCTION
10
(IS) success and, in turn, for the success of businesses to achieve human-
centered IS development approach [39].
1.7.2 Work Related to SCADA System
Suyeong Kim, 1997, developed a prescriptive model of human
intervention based on given probabilistic descriptions of the performance of
a decision aid and the performance of an operator, and cost functions for
consequences of each decision [43]. Work features are:
- The model provides a conceptual basis for a new human-computer
interface to give operators more refined advice on alternative actions
than is given in the current interface.
- The new interfaces guarantee correct human interventions, which results
in the improvement of overall performance.
- The new interface reduces the operator’s decision making time.
Michael P.Wardin, 2004, highlighted security and stability due to
recent failures of critical infrastructure of SCADA systems. The first step
towards achieving these concepts is developing an abstract generic
framework for defining and understanding SCADA systems [32]. The work
features are;
- Matrix approach is provided to understand the system’s features,
functions and capabilities, and how components in the system relate and
interface with each other.
- The variety of open communication protocols have been defined and
described.
Chapter One; GENERAL INTRODUCTION
11
- Two small SCADA systems, using industry standard components and
simulating real word applications, were designed and constructed to
provide context for applying the matrix approach.
Mitsuya Kato, Katsufumi Watahiki, Tatsuyuki Suzuki, 2004,
continued the evolution of networking and PC technologies, enabled better
integration of control center systems and drove down operating costs [31].
Work features:
- Employing low-cost-high performance PC servers.
- Preserving the excellent reliability and processing capabilities of
Hitachi’s existing supervisory control technologies.
- The new comprehensive system combines an integrated control center
system based on PC servers running Linux and substation controller
connected to WANs using IP technology.
National Communications system (NCS) developed technical
information Bulletin (TIB) 04-1 on supervisory control and data acquisition
(SCADA) systems [36]. An overview of SCADA is provided, and security
concerns are addressed and examined. Work features:
- Identifying developing and coordinating proposed standards which either
contributes to the interoperability of functionality of similar
telecommunication systems or to the achievement of the compatible and
efficient interface between computer and telecommunications systems.
- Considerable amount of effort is expended in initiating and pursuing
joint standards development through efforts from appropriate technical
committees of the International Organization for Standardization, the
International Telecommunication Union and Telecommunication
Standardization Sector.
Chapter One; GENERAL INTRODUCTION
12
1.7.3 Work Related to Usability
Xavier Ferre’, Natalia Juristo, Helmut Windl and Larry Constantine,
2001, showed the relationship between usability and the users interface, and
how the usability process follows a design-evaluate-redesign cycle was
discussed [51]. Some management issues mentioned.
Ben Sheiderman, 2003, promoted the idea of multi-layer interface
designs that enable first-time and novice users to begin with a limited set of
features at layer1 [3]. They can remain at layer1, then move up to higher
layers when needed or when they have time to learn future features.
1.8 Work Objectives The objectives of this project are;
- Studying the strategies for the design and implementation of an effective
HCI for SCADA system by:
- Presenting a broad survey of how to develop high-quality user interfaces
for interactive systems.
- Paying greater attention usability issues and promoting further scientific
study of human computer interaction.
1.9 Thesis Outline This chapter provides an introduction to the meaning of Human
Computer Interface and the Supervisory Control and Data Acquisition
systems as well as the main previous studies in this field. Also, chapter two
defines the necessary guidelines, principles and object /action model of HCI.
Chapter One; GENERAL INTRODUCTION
13
Chapter three illustrates the second and third pillars of successful user
interface development (software tools) especially SIMATIC HMI developed
by SIEMENS and (expert review and usability testing), chapter four
describes the development of HCI modules and SCADA modules in terms of
software structure, main functions, algorithms, and graphical appearance.
Chapter five illustrates the tests’ results of the developed HCI modules and
SCADA modules. Finally, chapter six presents conclusions and suggestions
for future work.
CHAPTER TWO
HCI GUIDELINES, PRINCIPLES,
AND THEORIES
Chapter TwO; HCI GUIDELINES, PRINCIPLES, AND THEORIES
15
CHAPTER TWO
HCI GUIDELINES, PRINCIPLES AND THEORIES
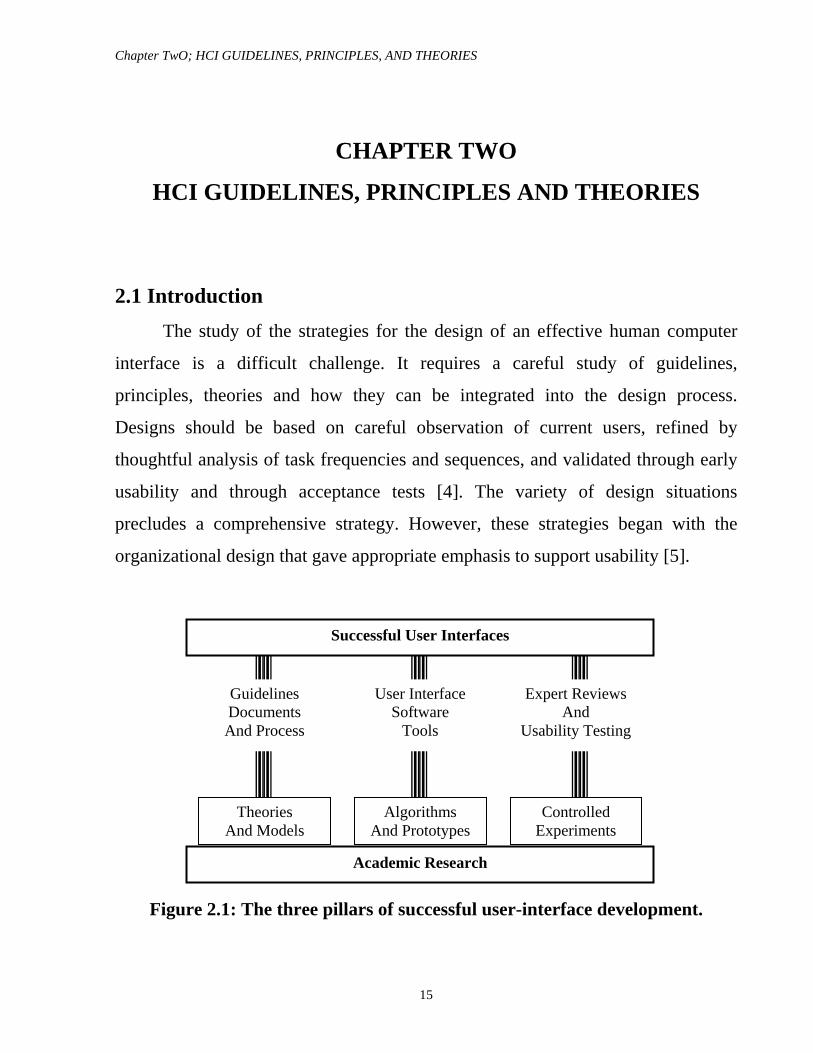
2.1 Introduction The study of the strategies for the design of an effective human computer
interface is a difficult challenge. It requires a careful study of guidelines,
principles, theories and how they can be integrated into the design process.
Designs should be based on careful observation of current users, refined by
thoughtful analysis of task frequencies and sequences, and validated through early
usability and through acceptance tests [4]. The variety of design situations
precludes a comprehensive strategy. However, these strategies began with the
organizational design that gave appropriate emphasis to support usability [5].
Figure 2.1: The three pillars of successful user-interface development.
Successful User Interfaces
Academic Research
Theories And Models
Algorithms And Prototypes
Controlled Experiments
Guidelines Documents And Process
User Interface Software
Tools
Expert Reviews And
Usability Testing
Chapter TwO; HCI GUIDELINES, PRINCIPLES, AND THEORIES
16
There are three pillars of successful users-interface development; guidelines
documents and processes, users-interface software tools, and expert review and
usability testing (Figure2.1) [4]. These three pillars will be described in this
chapter which helps user-interface architects to turn good ideas into successful
systems. Experience has shown that each pillar can produce an order-of-
magnitude speedup in the process and can facilitate the creation of excellent
systems.
Also this chapter shows that the logical User-Centered Interaction Design
(LUCID) methodology which, is a good framework for scheduling.
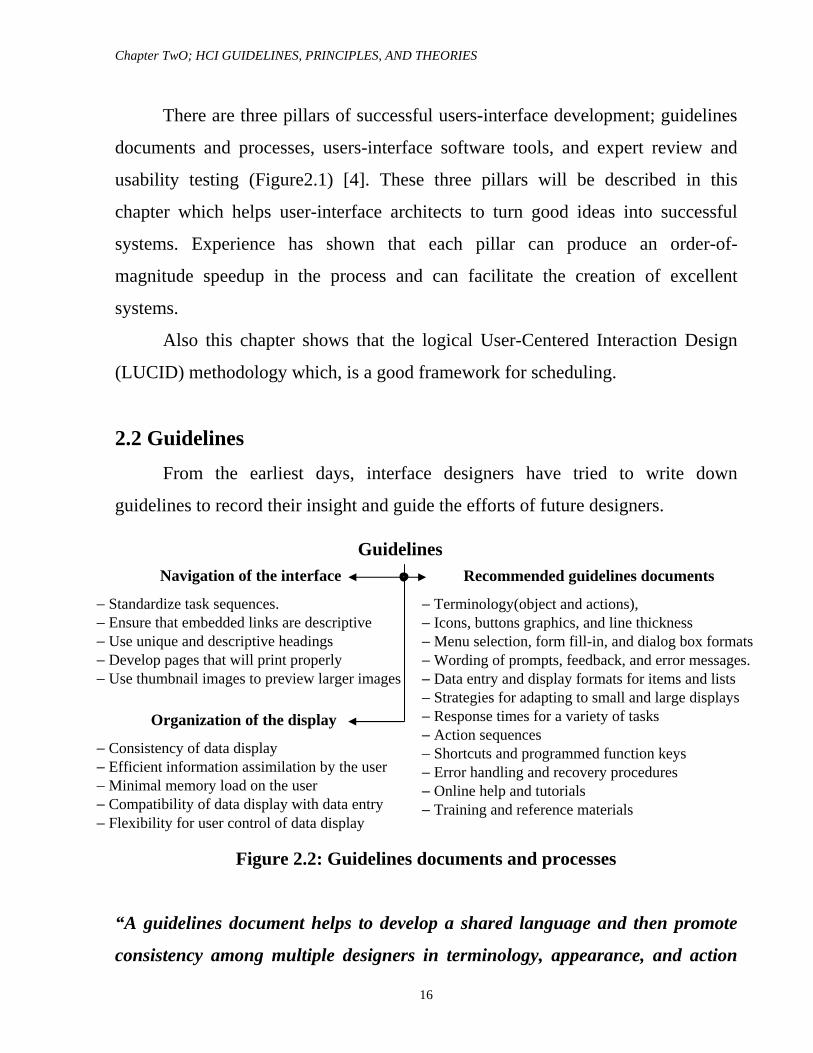
2.2 Guidelines From the earliest days, interface designers have tried to write down
guidelines to record their insight and guide the efforts of future designers.
Figure 2.2: Guidelines documents and processes
“A guidelines document helps to develop a shared language and then promote
consistency among multiple designers in terminology, appearance, and action
Navigation of the interface
− Standardize task sequences. − Ensure that embedded links are descriptive − Use unique and descriptive headings − Develop pages that will print properly − Use thumbnail images to preview larger images
Organization of the display
− Consistency of data display − Efficient information assimilation by the user − Minimal memory load on the user − Compatibility of data display with data entry − Flexibility for user control of data display
Recommended guidelines documents
− Terminology(object and actions), − Icons, buttons graphics, and line thickness − Menu selection, form fill-in, and dialog box formats − Wording of prompts, feedback, and error messages. − Data entry and display formats for items and lists − Strategies for adapting to small and large displays − Response times for a variety of tasks − Action sequences − Shortcuts and programmed function keys − Error handling and recovery procedures − Online help and tutorials − Training and reference materials
Guidelines
Chapter TwO; HCI GUIDELINES, PRINCIPLES, AND THEORIES
17
sequences. It records best practices derived from practical experience or
empirical studies with appropriate examples” [4].
The following sections show selected guidelines depending on action which
can be adopted by agreement among people concerned with interface design.
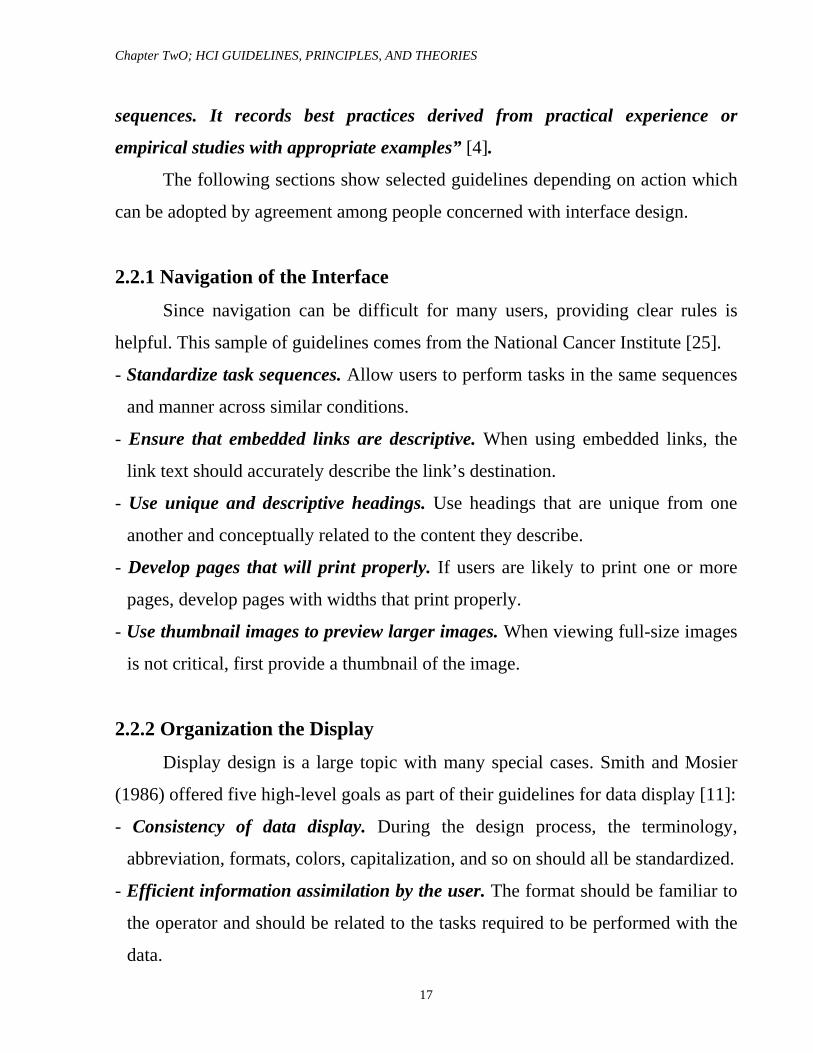
2.2.1 Navigation of the Interface
Since navigation can be difficult for many users, providing clear rules is
helpful. This sample of guidelines comes from the National Cancer Institute [25].
- Standardize task sequences. Allow users to perform tasks in the same sequences
and manner across similar conditions.
- Ensure that embedded links are descriptive. When using embedded links, the
link text should accurately describe the link’s destination.
- Use unique and descriptive headings. Use headings that are unique from one
another and conceptually related to the content they describe.
- Develop pages that will print properly. If users are likely to print one or more
pages, develop pages with widths that print properly.
- Use thumbnail images to preview larger images. When viewing full-size images
is not critical, first provide a thumbnail of the image.
2.2.2 Organization the Display
Display design is a large topic with many special cases. Smith and Mosier
(1986) offered five high-level goals as part of their guidelines for data display [11]:
- Consistency of data display. During the design process, the terminology,
abbreviation, formats, colors, capitalization, and so on should all be standardized.
- Efficient information assimilation by the user. The format should be familiar to
the operator and should be related to the tasks required to be performed with the
data.
Chapter TwO; HCI GUIDELINES, PRINCIPLES, AND THEORIES
18
- Minimal memory load on the user. Users should not be required to remember
information from one screen for use on another screen. Tasks should be arranged
such that completion occurs with few actions, minimize the chance of forgetting
to perform a step. Label and common formats should be provided for novice or
intermittent users.
- Compatibility of data display with data entry. The format of displayed
information should be linked clearly to the format of the data entry. Where
possible and appropriate, the output fields should also act as editable input fields.
- Flexibility for user control of data display. Users should be able to obtain the
information from the display in the form most convenient for the task on which
they are working.
2.2.3 Recommendations for Guidelines Documents
The creation of a guidelines document at the beginning of an implementation
project should focus attention on the interface design and provides an opportunity
for discussion of controversial issues. [4]
Guidelines documents must be living texts that are adapted to change in
needs and refined through experience [14].
Each project has different needs, but guidelines should be considered for:
Terminology(object and actions),abbreviations, and capitalization
Icons, buttons graphics, and line thickness
Menu selection, form fill-in, and dialog box formats
Wording of prompts, feedback, and error messages.
Data entry and display formats for items and lists
Strategies to adapt small and large displays
Response times for a variety of tasks
Action sequences; Direct manipulation click, drag, drop, and gestures
Chapter TwO; HCI GUIDELINES, PRINCIPLES, AND THEORIES
19
Shortcuts and programmed function keys
Error handling and recovery procedures
Online help and tutorials
Training and reference materials
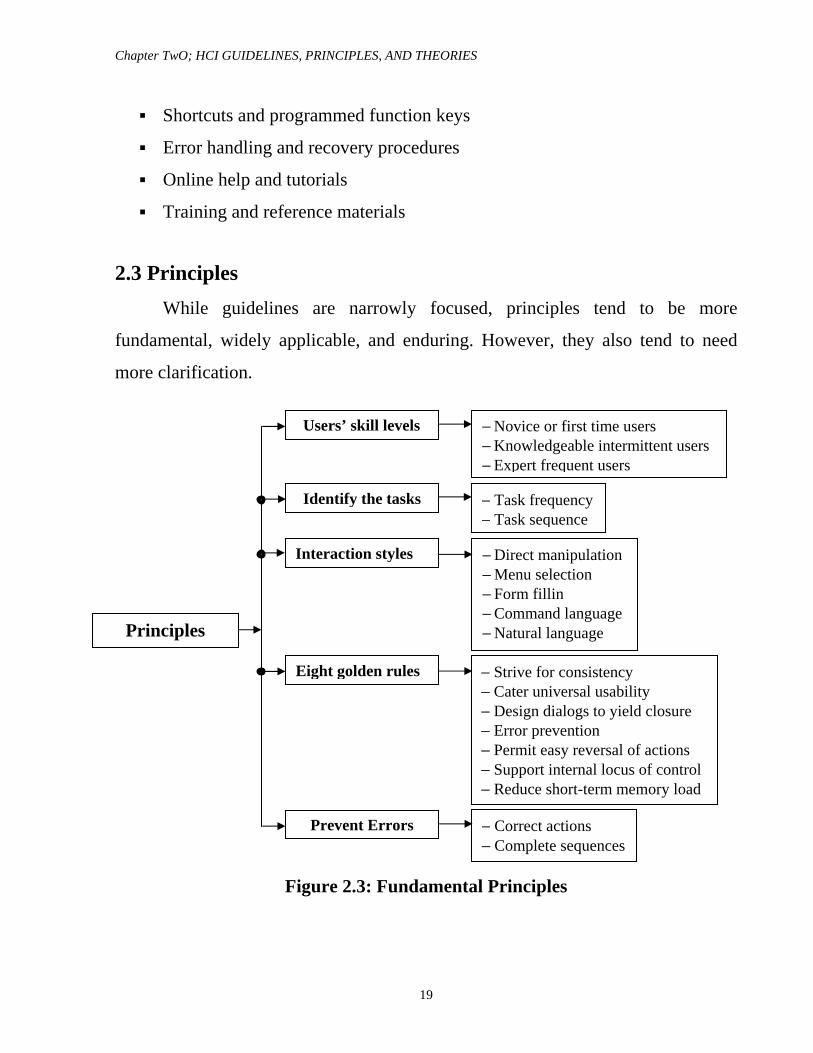
2.3 Principles While guidelines are narrowly focused, principles tend to be more
fundamental, widely applicable, and enduring. However, they also tend to need
more clarification.
Figure 2.3: Fundamental Principles
− Direct manipulation − Menu selection − Form fillin − Command language − Natural language
− Strive for consistency − Cater universal usability − Design dialogs to yield closure − Error prevention − Permit easy reversal of actions − Support internal locus of control − Reduce short-term memory load
− Novice or first time users − Knowledgeable intermittent users −Expert frequent users
− Task frequency − Task sequence
− Correct actions − Complete sequences
Principles
Interaction styles
Eight golden rules
Users’ skill levels
Identify the tasks
Prevent Errors
Chapter TwO; HCI GUIDELINES, PRINCIPLES, AND THEORIES
20
There are differences in users’ background knowledge, training in the use of
the system, frequency of use, and goals as well as in the impact of a user error.
Since no single design could satisfy all these users and situations, successful
designers must characterize their users and the situations in which their products
will be used as precisely and completely as possible [50].
2.3.1 Determine Users’ Skill Levels
All designs should begin with an understanding of the intended users,
including population profiles that reflect age, gender, physical and cognitive
abilities, education, cultural or ethnic background, training, motivation, goals, and
personality.[22]
The process of getting to know the users is never - ending because there is so
much to know and because the users keep changing. Every step in understanding
the users and in recognizing them as individuals with outlooks different from the
designer’s own is likely to be a step closer to a successful design.
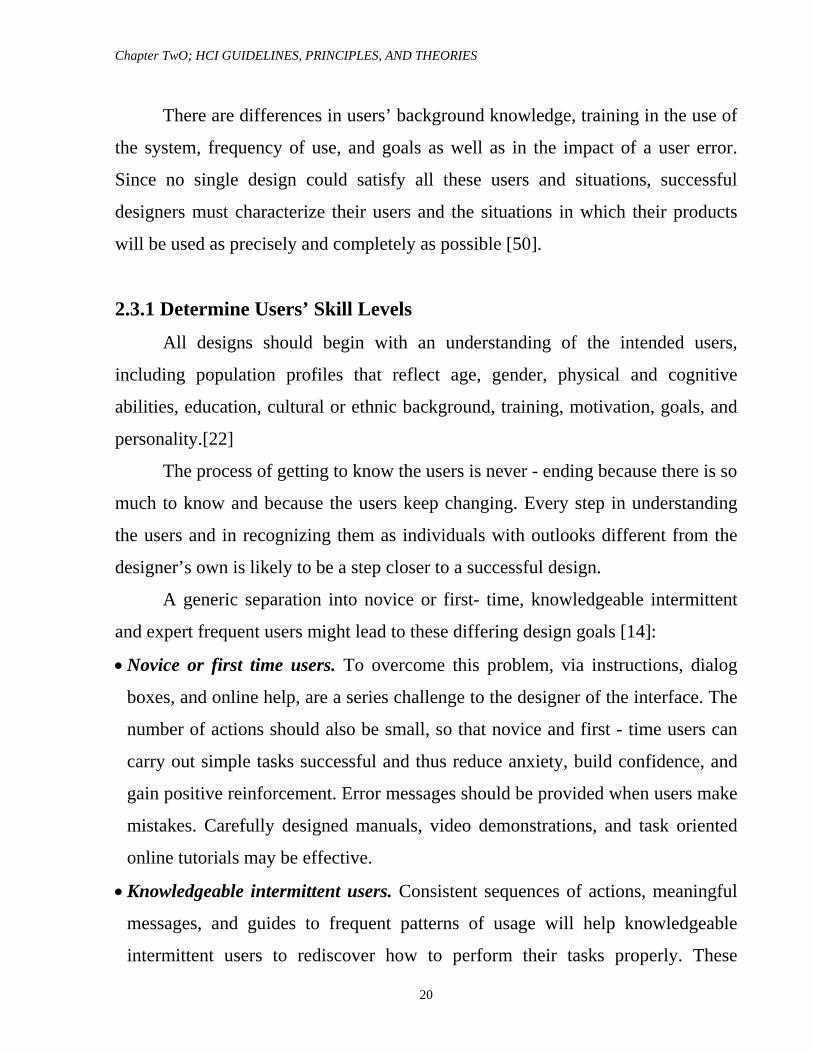
A generic separation into novice or first- time, knowledgeable intermittent
and expert frequent users might lead to these differing design goals [14]:
• Novice or first time users. To overcome this problem, via instructions, dialog
boxes, and online help, are a series challenge to the designer of the interface. The
number of actions should also be small, so that novice and first - time users can
carry out simple tasks successful and thus reduce anxiety, build confidence, and
gain positive reinforcement. Error messages should be provided when users make
mistakes. Carefully designed manuals, video demonstrations, and task oriented
online tutorials may be effective.
• Knowledgeable intermittent users. Consistent sequences of actions, meaningful
messages, and guides to frequent patterns of usage will help knowledgeable
intermittent users to rediscover how to perform their tasks properly. These
Chapter TwO; HCI GUIDELINES, PRINCIPLES, AND THEORIES
21
features will also help novices and some experts, but the major beneficiaries are
knowledgeable intermittent users. Protection from danger is necessary to support
relaxed exploration of features or usage of partially forgotten action sequences.
These users will benefit from context-dependent help to fill in missing pieces of
task or interface knowledge .Well- organized reference manuals are also useful.
• Expert frequent users. Expert power users are thoroughly familiar with task and
interface concepts and seek to get their work done quickly. They demand rapid
response times, brief and non-distracting feedback, and the shortcuts to carry out
actions with just a few keystrokes or selections. Strings of commands, shortcuts
through menus, abbreviations, and other accelerators are requirements.
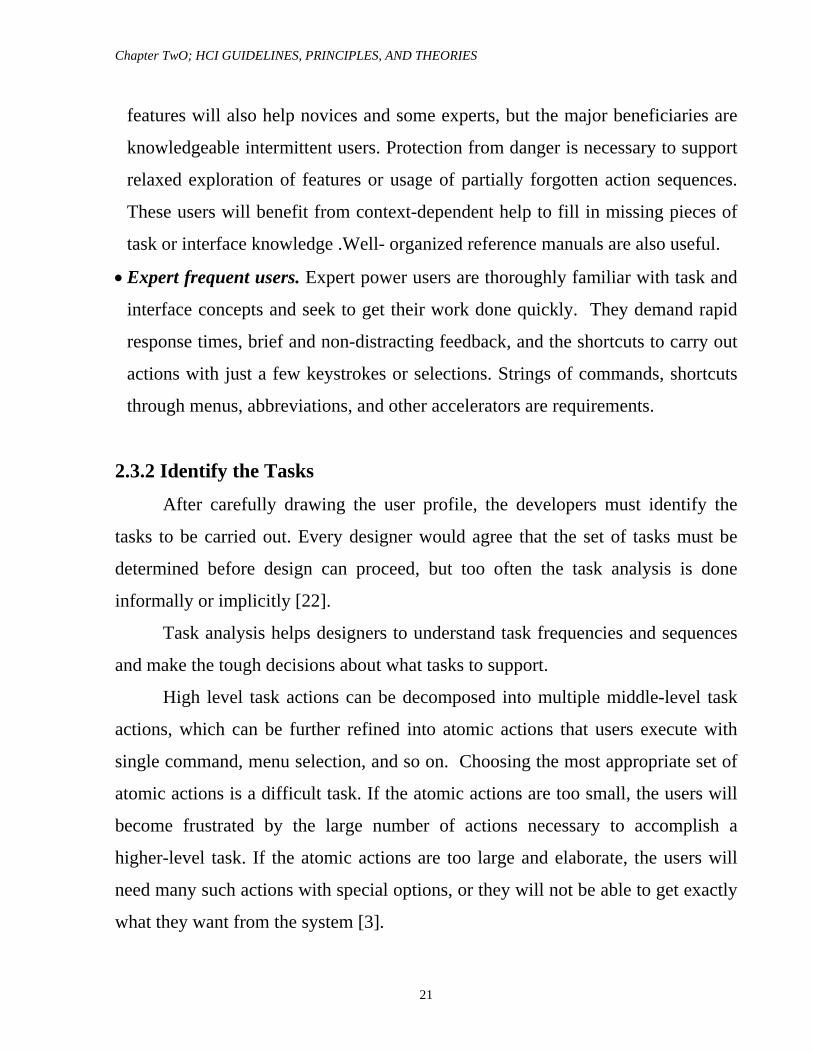
2.3.2 Identify the Tasks
After carefully drawing the user profile, the developers must identify the
tasks to be carried out. Every designer would agree that the set of tasks must be
determined before design can proceed, but too often the task analysis is done
informally or implicitly [22].
Task analysis helps designers to understand task frequencies and sequences
and make the tough decisions about what tasks to support.
High level task actions can be decomposed into multiple middle-level task
actions, which can be further refined into atomic actions that users execute with
single command, menu selection, and so on. Choosing the most appropriate set of
atomic actions is a difficult task. If the atomic actions are too small, the users will
become frustrated by the large number of actions necessary to accomplish a
higher-level task. If the atomic actions are too large and elaborate, the users will
need many such actions with special options, or they will not be able to get exactly
what they want from the system [3].
Chapter TwO; HCI GUIDELINES, PRINCIPLES, AND THEORIES
22
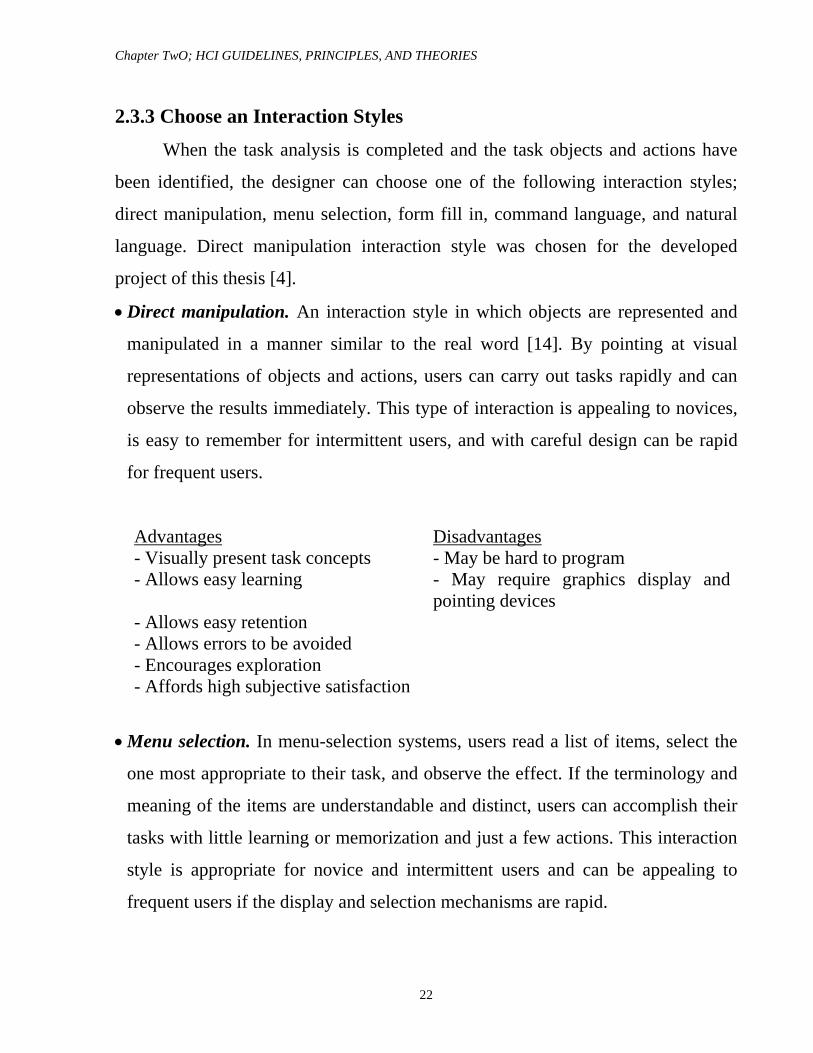
2.3.3 Choose an Interaction Styles
When the task analysis is completed and the task objects and actions have
been identified, the designer can choose one of the following interaction styles;
direct manipulation, menu selection, form fill in, command language, and natural
language. Direct manipulation interaction style was chosen for the developed
project of this thesis [4].
• Direct manipulation. An interaction style in which objects are represented and
manipulated in a manner similar to the real word [14]. By pointing at visual
representations of objects and actions, users can carry out tasks rapidly and can
observe the results immediately. This type of interaction is appealing to novices,
is easy to remember for intermittent users, and with careful design can be rapid
for frequent users.
Advantages Disadvantages - Visually present task concepts - May be hard to program - Allows easy learning - May require graphics display and
pointing devices - Allows easy retention - Allows errors to be avoided - Encourages exploration - Affords high subjective satisfaction
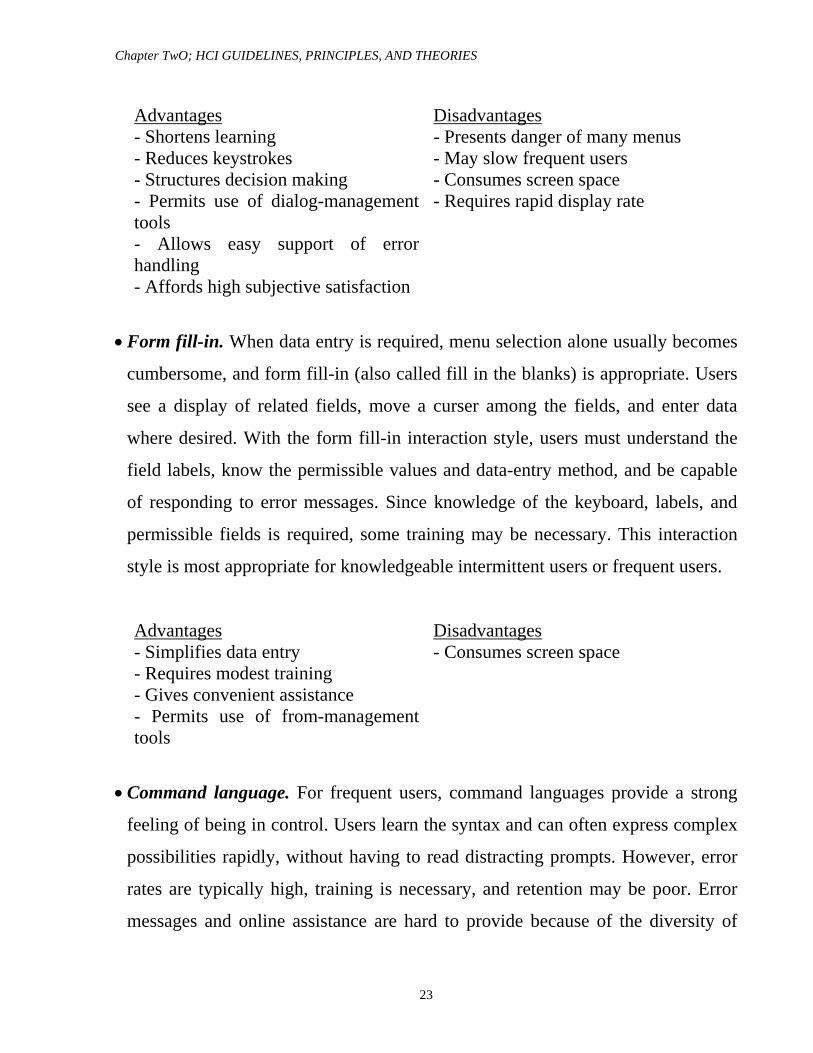
• Menu selection. In menu-selection systems, users read a list of items, select the
one most appropriate to their task, and observe the effect. If the terminology and
meaning of the items are understandable and distinct, users can accomplish their
tasks with little learning or memorization and just a few actions. This interaction
style is appropriate for novice and intermittent users and can be appealing to
frequent users if the display and selection mechanisms are rapid.
Chapter TwO; HCI GUIDELINES, PRINCIPLES, AND THEORIES
23
Advantages Disadvantages - Shortens learning - Presents danger of many menus - Reduces keystrokes - May slow frequent users - Structures decision making - Consumes screen space - Permits use of dialog-management tools
- Requires rapid display rate
- Allows easy support of error handling
- Affords high subjective satisfaction
• Form fill-in. When data entry is required, menu selection alone usually becomes
cumbersome, and form fill-in (also called fill in the blanks) is appropriate. Users
see a display of related fields, move a curser among the fields, and enter data
where desired. With the form fill-in interaction style, users must understand the
field labels, know the permissible values and data-entry method, and be capable
of responding to error messages. Since knowledge of the keyboard, labels, and
permissible fields is required, some training may be necessary. This interaction
style is most appropriate for knowledgeable intermittent users or frequent users.
Advantages Disadvantages - Simplifies data entry - Consumes screen space - Requires modest training - Gives convenient assistance - Permits use of from-management tools
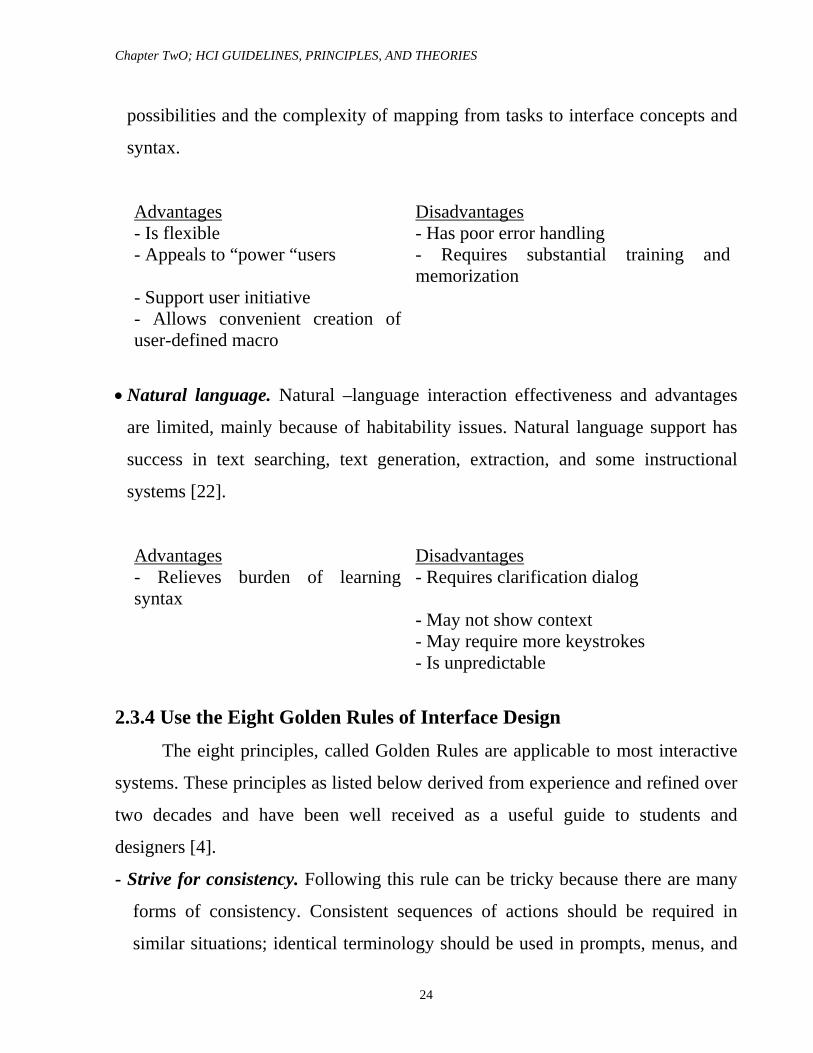
• Command language. For frequent users, command languages provide a strong
feeling of being in control. Users learn the syntax and can often express complex
possibilities rapidly, without having to read distracting prompts. However, error
rates are typically high, training is necessary, and retention may be poor. Error
messages and online assistance are hard to provide because of the diversity of
Chapter TwO; HCI GUIDELINES, PRINCIPLES, AND THEORIES
24
possibilities and the complexity of mapping from tasks to interface concepts and
syntax.
Advantages Disadvantages - Is flexible - Has poor error handling - Appeals to “power “users - Requires substantial training and
memorization - Support user initiative - Allows convenient creation of user-defined macro
• Natural language. Natural –language interaction effectiveness and advantages
are limited, mainly because of habitability issues. Natural language support has
success in text searching, text generation, extraction, and some instructional
systems [22].
Advantages Disadvantages - Relieves burden of learning syntax
- Requires clarification dialog
- May not show context - May require more keystrokes - Is unpredictable
2.3.4 Use the Eight Golden Rules of Interface Design
The eight principles, called Golden Rules are applicable to most interactive
systems. These principles as listed below derived from experience and refined over
two decades and have been well received as a useful guide to students and
designers [4].
- Strive for consistency. Following this rule can be tricky because there are many
forms of consistency. Consistent sequences of actions should be required in
similar situations; identical terminology should be used in prompts, menus, and
Chapter TwO; HCI GUIDELINES, PRINCIPLES, AND THEORIES
25
help screens; and consistent color, layout, capitalization, fonts, and so on should
be employed throughout.
- Cater for universal usability. Recognize the needs of diverse users. Novice-
expert differences, age ranges, disabilities, and technology diversity each
enriches the spectrum of requirements that guide design.
- Offer informative feedback. For every user action, there should be system
feedback. Visual presentation of the objects of interest provides a convenient
environment for showing changes explicitly.
- Design dialogs to yield closure. Sequences of actions should be organized into
groups with a beginning, middle, and end. The informative feedback at the
completion of a group of actions shows the user their activity has completed
successfully.
- Error prevention. Design the system so that users cannot make serious errors. If
the user makes an error, the interface should detect the error and offer a simple
recovery. Incorrect actions should leave the system state unchanged and give the
possibility to restoring the state.
- Permit easy reversal of actions. Actions should be reversible. This feature
relieves from anxiety, since the user knows that errors can be undone, thus
encouraging exploration of unfamiliar options.
- Support internal locus of control. Experienced users strongly desire the sense
that they are in charge of the interface and the interface responds to their actions.
Surprising system actions, tedious sequences of data entries, inability or
difficulty in obtaining necessary information, and inability to produce the action
desired all build anxiety and dissatisfaction.
- Reduce short-term memory load. A famous study suggests that humans can store
only 7 (plus or minus 2) pieces of information in their short term memory.
Chapter TwO; HCI GUIDELINES, PRINCIPLES, AND THEORIES
26
Designers can reduce short term memory load by keeping display simple,
reducing window-motion frequency and sufficient training and on line help [3].
2.3.5 Prevent Errors
One way to reduce the loss in productivity due to errors is to improve the
error messages provided by the interface. Better error messages can raise success
rates in repairing the errors, lowering future error rates, and increasing subjective
satisfaction. Superior error messages are more specific, positive in tone, and
constructive (telling the user what to do, rather than merely reporting the problem).
A more effective approach is to prevent the errors from occurring; this could
be done by two techniques correct actions and complete sequences [4]. Correct
action techniques can be applied by graying out in appropriate actions or allow
selection rather than freestyle typing and offer automatic completion while
complete sequences offer a sequence of steps as a single action.
2.4 Theories A theory, taxonomy or a model is an abstraction of reality; it goes beyond
the specifics of guidelines and builds on the breadth of principles. A good theory
should be understandable; produce similar conclusions for all how use it, and help
to solve specific practical problems.
Some theories are descriptive and explanatory; these theories are helpful to
observe behavior, describe activity, conceive of designs, compare high-level
concepts of two designs, and training. Other theories are predictive [22]; these
theories enable designers to compare proposed designs for execution time or error
rates.
Chapter TwO; HCI GUIDELINES, PRINCIPLES, AND THEORIES
27
A motor-task performance is a way to group theories; these theories are
helpful to predict key stroke or point times. Other theories are perceptual or
cognitive subtasks theories these theories predicting readings times for free text,
lists, or formatted displays one.
A variety of reliable and broadly applicable theories are beginning to emerge
for user interface (levels of analysis theories, stages-of-action models, GOMS and
the keystroke level model, consistency through grammars, widget level theories,
context of use theories) [46].
2.5 Object-Action Interface Model The OAI model is a descriptive and explanatory model that focuses on task
and interface objects and actions. Because the syntactic details are minimal, users
who know the task-domain objects and actions can learn the interface relatively
easily. The OAI model also reflects in the higher level of design with which most
designers deal when they use the widgets in user interface building tools. The
standard widgets have familiar and simple syntax (click, double click, drag, or
drop) and simple forms of feedback (highlighting, scrolling, or movement), leaving
designers free to focus on how these widgets create a business-oriented solution.
The OAI model is in harmony with the common software-engineering
method of object-oriented design [14].
2.5.1 Task Hierarchies of Objects and Actions
The primary way people deal with large and complex problems is to
decompose them into several smaller problems, in a hierarchical manner, until each
sub problem is manageable.
Chapter TwO; HCI GUIDELINES, PRINCIPLES, AND THEORIES
28
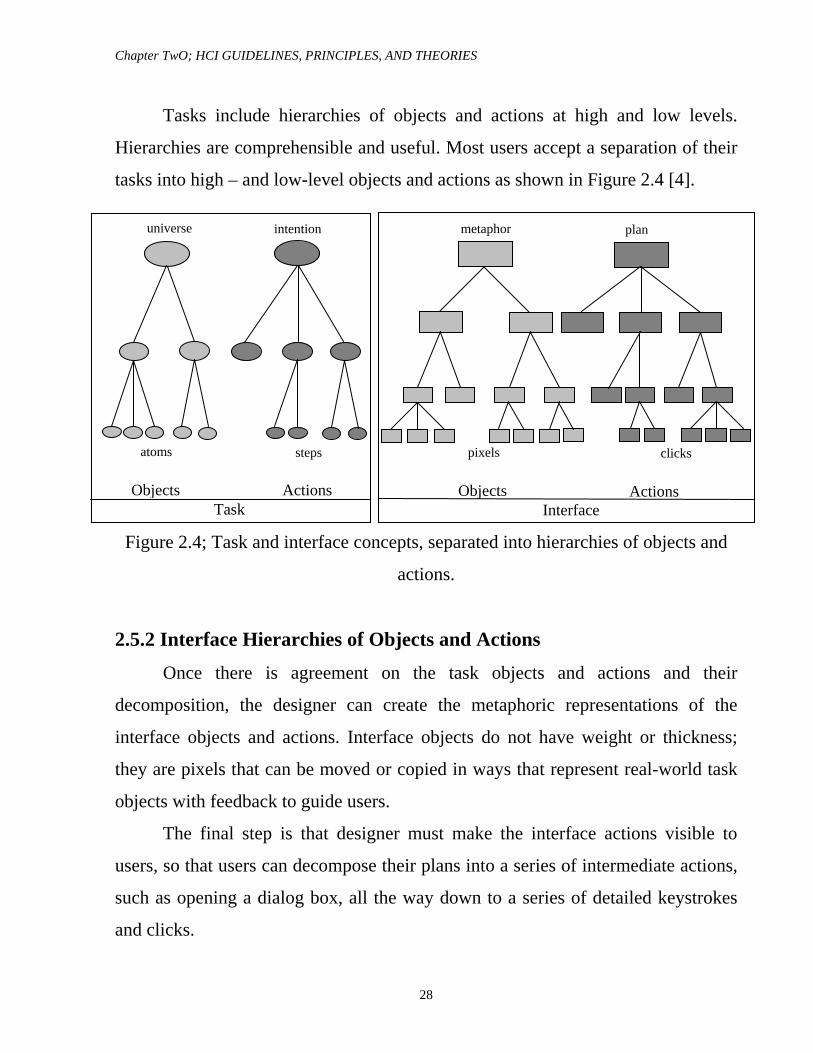
Tasks include hierarchies of objects and actions at high and low levels.
Hierarchies are comprehensible and useful. Most users accept a separation of their
tasks into high – and low-level objects and actions as shown in Figure 2.4 [4].
Figure 2.4; Task and interface concepts, separated into hierarchies of objects and
actions.
2.5.2 Interface Hierarchies of Objects and Actions
Once there is agreement on the task objects and actions and their
decomposition, the designer can create the metaphoric representations of the
interface objects and actions. Interface objects do not have weight or thickness;
they are pixels that can be moved or copied in ways that represent real-world task
objects with feedback to guide users.
The final step is that designer must make the interface actions visible to
users, so that users can decompose their plans into a series of intermediate actions,
such as opening a dialog box, all the way down to a series of detailed keystrokes
and clicks.
Objects Actions Objects Actions
atoms steps pixels clicks
universe intention metaphor plan
Task Interface
Chapter TwO; HCI GUIDELINES, PRINCIPLES, AND THEORIES
29
2.5.3 The Disappearance of Syntax
In the early days of computers, users had to maintain a profusion of device-
dependent details in their human memories, minimizing them is the goal of most
interface designers. Modern direct-manipulation styles support the process of
presenting users with screens filled with familiar objects and actions. Modern user-
interface building tools facilitate the design process by making standard widgets
easily available. Innovative designers may recognize opportunities for novel
widgets that provide a closer match between the screen representation and the
user’s workplace.
2.6 LUCID Development Methodology Successful developers work carefully to understand the business needs and
refine their skills in eliciting accurate requirements from non-technical business
managers.
However, many software development projects fail to achieve their goals.
Some estimates of the failure rate put it as high as 60%. Much of this problem can
be traced to poor communication between developers and the users [4].
In addition, business managers may lack the technical knowledge to
understand proposals made by the developers, dialog is necessary to reduce
confusions about the organizational implications of design decisions.
The Logical User-Centered Interactive Design (LUCID) methodology
identifies six stages to facilitate effective collaboration among teams that includes
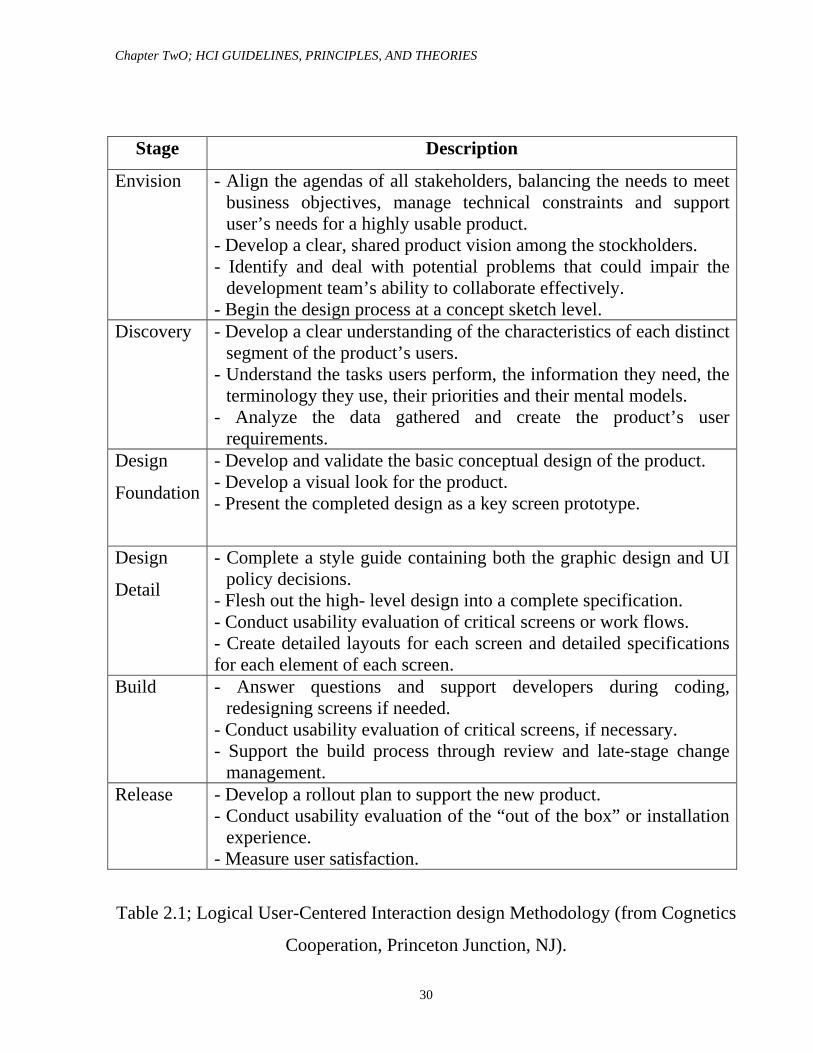
both business and technical participants. These stages are listed in Table 2.1 [4].
Chapter TwO; HCI GUIDELINES, PRINCIPLES, AND THEORIES
30
Stage Description
Envision - Align the agendas of all stakeholders, balancing the needs to meet business objectives, manage technical constraints and support user’s needs for a highly usable product.
- Develop a clear, shared product vision among the stockholders. - Identify and deal with potential problems that could impair the
development team’s ability to collaborate effectively. - Begin the design process at a concept sketch level.
Discovery - Develop a clear understanding of the characteristics of each distinct segment of the product’s users.
- Understand the tasks users perform, the information they need, the terminology they use, their priorities and their mental models.
- Analyze the data gathered and create the product’s user requirements.
Design
Foundation
- Develop and validate the basic conceptual design of the product. - Develop a visual look for the product. - Present the completed design as a key screen prototype.
Design
Detail
- Complete a style guide containing both the graphic design and UI policy decisions.
- Flesh out the high- level design into a complete specification. - Conduct usability evaluation of critical screens or work flows. - Create detailed layouts for each screen and detailed specifications for each element of each screen.
Build - Answer questions and support developers during coding, redesigning screens if needed.
- Conduct usability evaluation of critical screens, if necessary. - Support the build process through review and late-stage change
management. Release - Develop a rollout plan to support the new product.
- Conduct usability evaluation of the “out of the box” or installation experience.
- Measure user satisfaction.
Table 2.1; Logical User-Centered Interaction design Methodology (from Cognetics
Cooperation, Princeton Junction, NJ).
Chapter TwO; HCI GUIDELINES, PRINCIPLES, AND THEORIES
31
As a management strategy, LUCID focuses on user’s needs and
requirements and highlights the role of usability engineering in software
development by focusing on activities, deliverables, and reviews. At each of the
LUCID stages there are specified deliverables and timely feedback through
reviews, for components such as:
- Product definition: high concept for managers and marketers
- Business case: pricing, expected revenues, return on investment, competition
- Resources: duration, effort levels, team members, back up plans.
- Physical environment: ergonomic design, physical installation, communication
lines.
- Technical environment: hardware and software for development and integration.
- Users: multiple communities for interviews, user testing, and marketing.
- Functionality: services provided to users
- Prototype: early paper prototypes, key screens, running prototypes.
- Usability: set measurable goals, conduct tests, refine interface and goals.
- Design guidelines: modify existing guidelines, implement review process.
-Content Material: identify and acquire copy righted text, audio, and video.
- Documentation, training and help: specify, develop, and test paper, video, and
online versions.
The success of the LUCID framework comes from its validation and
refinement in multiple projects. The templates and techniques it provides help
design team structure their activities and deliverables. While LUCID is designed to
promote an orderly process, with iterations within a stage and predictable progress
between stages, the framework will need to be adapted to the realities of specific
projects and organizations. And while the concept of flow from stage to stage is a
useful structure for organizing user-centric design activities, some projects may

Chapter TwO; HCI GUIDELINES, PRINCIPLES, AND THEORIES
32
require the design team to back up and redo earlier stages if elements of the
product concept change dramatically [3,39].

CHAPTER THREE
SOFTWARE TOOLS, EXPERT
REVIEWS AND USABILITY
TESTING
Chapter Three; SOFTWARE TOOLS, EXPERT REVIEWS AND USABILITY TESTING
34
CHAPTER THREE
SOFTWARE TOOLS, EXPERT REVIEWS AND
USABILITY TESTING
3.1 Introduction The demands of modern life require user-interface architects to build
reliable, standard, safe, inexpensive, effective, and widely acceptable user interface
on a predictable schedule. Building and user-interface architects must have simple
and quick methods of sketching to give their clients a way to identify needs and
preferences [8]. They also need precise methods for working out the details with
clients, for coordinating with specialized colleagues, and for telling the
craftspeople what to do[4].
This chapter begins with the software-engineering tools. SIMATIC WinCC
HMI is selected as a software tool. Second the standard SCADA screens or pages
are presented. Then Data Base-Management System is discussed. Finally, a variety
of expert review methods, usability tests, surveys, and acceptance tests are
presented.
3.2 Software-Engineering Tools Software tools are increasingly graphical in their user interfaces, enabling
designers and programmers to build interfaces, rapidly by dragging components
and linking functions together. User interfaces building tools have matured rapidly
in the past few years and have radically changed the nature of software
development [36]. Productivity gains of 50 to 500% about previous methods have
Chapter Three; SOFTWARE TOOLS, EXPERT REVIEWS AND USABILITY TESTING
35
been documented for many standards graphical user interfaces (GUIs)[4]. But,
even as the power tools for established styles improve and gain acceptance, the
need remains for programmers to handcraft novel interface styles.
Experienced programmers sometimes build user interfaces with general-
purpose programming languages such as Java, C#, or C++, but this approach is
giving way to using facilities that are specially tuned to user-interface development
and web access [36]. Choosing among them is sometimes a complex and confusing
task, due to the lack of uniform terminology used to describe the tools and their
features.
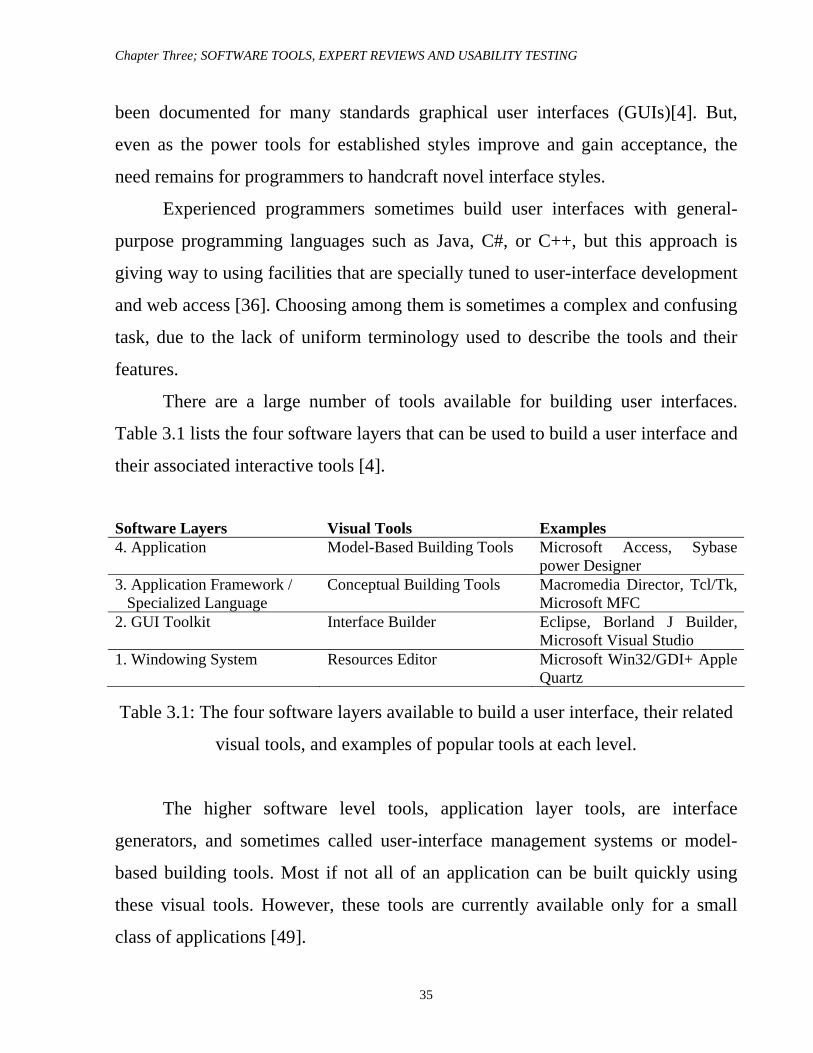
There are a large number of tools available for building user interfaces.
Table 3.1 lists the four software layers that can be used to build a user interface and
their associated interactive tools [4].
Software Layers Visual Tools Examples 4. Application Model-Based Building Tools Microsoft Access, Sybase
power Designer 3. Application Framework / Specialized Language
Conceptual Building Tools Macromedia Director, Tcl/Tk, Microsoft MFC
2. GUI Toolkit Interface Builder Eclipse, Borland J Builder, Microsoft Visual Studio
1. Windowing System Resources Editor Microsoft Win32/GDI+ Apple Quartz
Table 3.1: The four software layers available to build a user interface, their related
visual tools, and examples of popular tools at each level.
The higher software level tools, application layer tools, are interface
generators, and sometimes called user-interface management systems or model-
based building tools. Most if not all of an application can be built quickly using
these visual tools. However, these tools are currently available only for a small
class of applications [49].
Chapter Three; SOFTWARE TOOLS, EXPERT REVIEWS AND USABILITY TESTING
36
Layer three tools include specialized languages or application frameworks.
These are software architectures specially designed for building graphical user
interface (GUIs). Compared to layer four tools, they provide almost no support for
nongraphical part of application. At this layer, a key distinction is how extensively
the software-engineering tool uses convenient visual programming, a relatively
simple scripting language (event or object oriented), or a more powerful general-
purpose programming language [48].
The terminology for GUI toolkits, layer two, varies depending on the
vendor. Popular terms for these toolkits include Rapid Prototype, Rapid
Application Developer, User Interface Builder, and User Interface Development
Environment. This layer provides software libraries and widgets as building blocks
but requires extensive programming to connect these components to each other and
to the non-GUI part of application [4].
The layer one windowing system tools require extensive programming by
experienced software engineers and offer little support from interactive tools [4].
3.3 Criteria of Finding the Right Design Tool The advantages of specialized user interface software tools for designers and
software engineers are large, and the promises of improved tools required that
designers and programmers stay informed of and make fresh choices for each
project. Finding the right tool is a tradeoff between six main criteria [4]:
• Part of the application is built using the tools. Some tools only support
building the presentation part of the application; others also help with low-
level interaction, and some support general programming mechanisms usable
in other parts of the application as well.
• Learning time. The time required to learn the tools varies.
• Building time. The time required to build a user interface using the tool varies.
Chapter Three; SOFTWARE TOOLS, EXPERT REVIEWS AND USABILITY TESTING
37
• Methodology imposed or advised. Some tools strongly impose a methodology
for building the application, such as building the visual part first and
connecting it to the remainder of the application afterwards, whereas other
tools are more flexible.
• Communication with other subsystems. Applications frequently uses
databases, files located on the web, or other resources that, when supported by
the building tool, simplify the development.
• Extensibility and modularity. Applications evolve, and new applications may
want to reuse parts of existing applications. Supporting the evolution and
reuse of software remains a challenge. Level four tools and application
framework inherently promote good software organization, but the others
usually lead to poor extensibility and modularity.
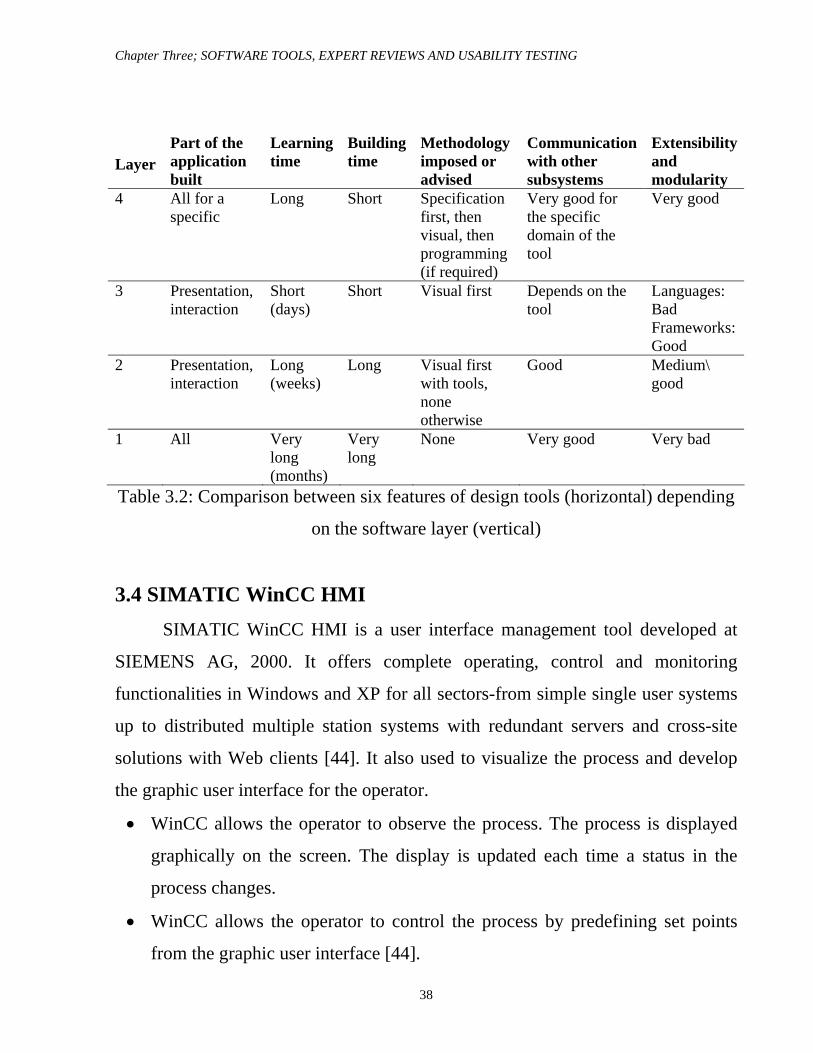
Tool price is an important criteria, because it is usually negligible compared to
the cost of good designers and engineers. Furthermore, there is a growing trend to
distribute free tools suitable for building standard GUIs. Tables 3.2 summarize the
six criteria applied to the software layers [4].
Regardless of the tools used to design the user interface, designing for good
usability has important implications for the quality and complexity of software
development. Separating the user interface from the remainder of the application
has been quite successful and is now standard practice in interactive system
development. This separation makes it easier to make modifications to the user
interface without changing the internals and to maintain multiple views of
application data and facilitates cross-platform development, which makes it easier
to generate interfaces for standard platform families (Windows, Macintosh, and
UNIX) [16].
Chapter Three; SOFTWARE TOOLS, EXPERT REVIEWS AND USABILITY TESTING
38
Layer
Part of the application built
Learning time
Building time
Methodology imposed or advised
Communication with other subsystems
Extensibility and modularity
4 All for a specific
Long Short Specification first, then visual, then programming (if required)
Very good for the specific domain of the tool
Very good
3 Presentation, interaction
Short (days)
Short Visual first Depends on the tool
Languages: Bad Frameworks: Good
2 Presentation, interaction
Long (weeks)
Long Visual first with tools, none otherwise
Good Medium\ good
1 All Very long (months)
Very long
None Very good Very bad
Table 3.2: Comparison between six features of design tools (horizontal) depending
on the software layer (vertical)
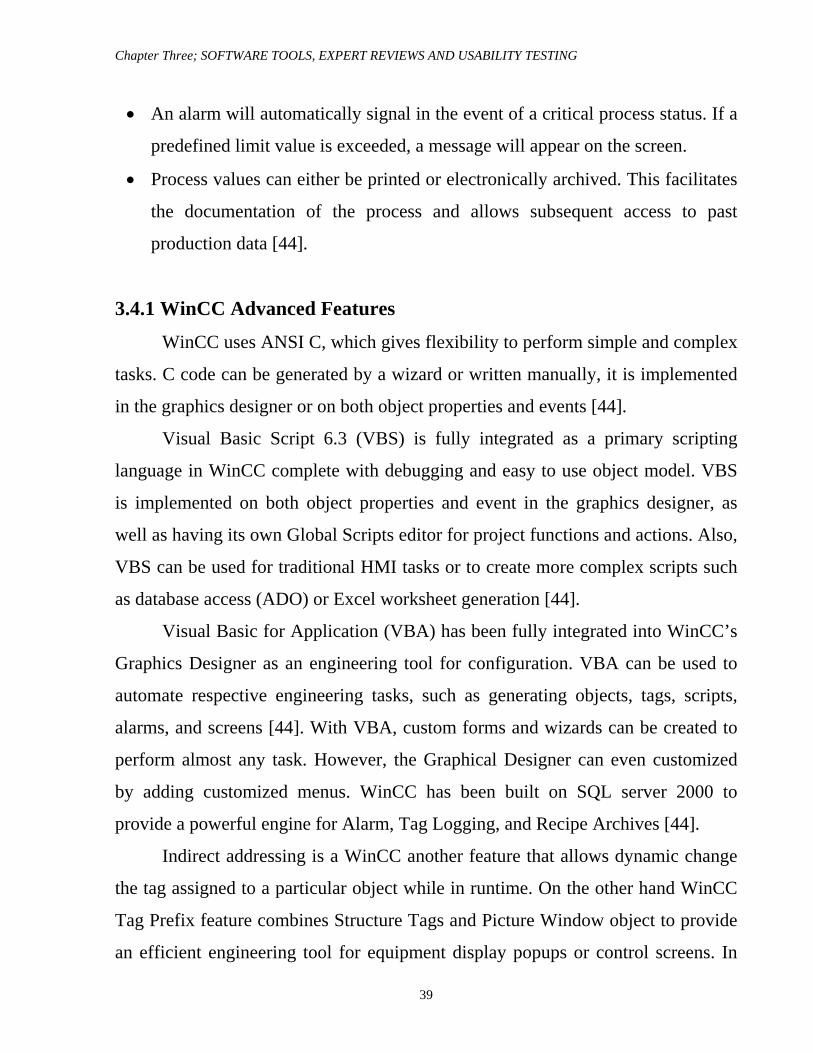
3.4 SIMATIC WinCC HMI SIMATIC WinCC HMI is a user interface management tool developed at
SIEMENS AG, 2000. It offers complete operating, control and monitoring
functionalities in Windows and XP for all sectors-from simple single user systems
up to distributed multiple station systems with redundant servers and cross-site
solutions with Web clients [44]. It also used to visualize the process and develop
the graphic user interface for the operator.
• WinCC allows the operator to observe the process. The process is displayed
graphically on the screen. The display is updated each time a status in the
process changes.
• WinCC allows the operator to control the process by predefining set points
from the graphic user interface [44].
Chapter Three; SOFTWARE TOOLS, EXPERT REVIEWS AND USABILITY TESTING
39
• An alarm will automatically signal in the event of a critical process status. If a
predefined limit value is exceeded, a message will appear on the screen.
• Process values can either be printed or electronically archived. This facilitates
the documentation of the process and allows subsequent access to past
production data [44].
3.4.1 WinCC Advanced Features
WinCC uses ANSI C, which gives flexibility to perform simple and complex
tasks. C code can be generated by a wizard or written manually, it is implemented
in the graphics designer or on both object properties and events [44].
Visual Basic Script 6.3 (VBS) is fully integrated as a primary scripting
language in WinCC complete with debugging and easy to use object model. VBS
is implemented on both object properties and event in the graphics designer, as
well as having its own Global Scripts editor for project functions and actions. Also,
VBS can be used for traditional HMI tasks or to create more complex scripts such
as database access (ADO) or Excel worksheet generation [44].
Visual Basic for Application (VBA) has been fully integrated into WinCC’s
Graphics Designer as an engineering tool for configuration. VBA can be used to
automate respective engineering tasks, such as generating objects, tags, scripts,
alarms, and screens [44]. With VBA, custom forms and wizards can be created to
perform almost any task. However, the Graphical Designer can even customized
by adding customized menus. WinCC has been built on SQL server 2000 to
provide a powerful engine for Alarm, Tag Logging, and Recipe Archives [44].
Indirect addressing is a WinCC another feature that allows dynamic change
the tag assigned to a particular object while in runtime. On the other hand WinCC
Tag Prefix feature combines Structure Tags and Picture Window object to provide
an efficient engineering tool for equipment display popups or control screens. In
Chapter Three; SOFTWARE TOOLS, EXPERT REVIEWS AND USABILITY TESTING
40
runtime, the combination of the structure tag name and the member name on the
object will provide the full I/O name for the object [44].
3.4.2 WinCC Traditional HMI Tasks
WinCC encompasses traditional HMI tasks and many time-saving features
as well. It is allowed to develop quickly and easy to maintain the applications.
WinCC supports the following HMI tasks [44]:
- Graphics: An active X container with thousands of library Symbols and Smart
Objects, VBA, On-line Changes, Panning, Zooming, Layering, Tool Tips
and other features provided with faster development times with more
intuitive interface [44].
- Alarming: Wizard configuration, Alarm Sorting, Alarm Enabling / Disabling and
individual operator comments provide a comprehensive Alarm
Management System. Multiple alarm levels on a single tag provide
simpler alarm development [44].
- Trending: Wizard configuration and independent scaling provide the WinCC user
with a full featured historical and real time trending utility. WinCC’s
trending support exporting data to formats like CSV that make the
information readable by off-line tools such as Microsoft Excel [44].
- Security: WinCC supports levels of security. Operator access to specific screens
or objects on screen can be prohibited. Individual actions such as recipe
download can be password protected as well. When using internet
Browser to view the application, firewall software is supported [44].
- OPC: WinCC can act as an OPC Client and an OPC Server. As an OPC Client,
WinCC can perform HMI tasks for hundreds of third-party control
devices. As an OPC Server, WinCC can provide tag information
upstream to various MES applications.
Chapter Three; SOFTWARE TOOLS, EXPERT REVIEWS AND USABILITY TESTING
41
- Drivers: WinCC supports native channel drivers for the most popular PLC’s.
- Reports: A built in Report Designer supplies templates for creating shift reports,
production reports, alarm reports and others.
- Cross-Reference: WinCC provides a cross-reference utility for quickly searching
and replacing tags during development. The cross-reference utility
includes a built-in project documenter for keeping records on entire
application[44].
- Multi Languages: WinCC supports multiple languages during runtime and
development. Runtime support for any window-based language fonts
enables true Global language capabilities [44].
3.5 SCADA Screens SCADA HCI must be capable of displaying system information in two
formats Tabular and graphical. These two formats are broken into pages (or
screens) in an easy way to explain and understood manner. These pages include
schematic, database, alarm/event, report, and operator pages as described below.
3.5.1 Schematic Pages Schematic Pages give the operator a graphical model of the plant. They
comprise graphical symbols that can be linked to an element to be monitored and controlled [1]. The real-time measurements of the element are displayed next to their graphical symbol. Standard symbols are used in these pages
The state of the point is not written in longhand but is shown as visual effects like color change, shape change, symbol change, and/or flashing. It is of course impossible to display all real-time values of the system on schematic pages, only the most important ones are displayed there [38]. Also it is not possible to address all values that may affect the point state, so even though the point state is known, the cause of putting the point in such a state is unknown.
Chapter Three; SOFTWARE TOOLS, EXPERT REVIEWS AND USABILITY TESTING
42
3.5.2 Database Pages
The same information contained in the schematic pages can be translated into tabular format in database pages. Database pages are so called since the HCI builds the page entirely from system database. System database contains all elements of the system, hence elements that are not displayed in schematic pages can be found in database pages. Moreover, all information related to an element is displayed in these pages [20].
The status of the point is shown through changing the text that mentions that state. Colors and flashing are used also to enhance state visualization.
The database pages do not help the operator to relate points to system configuration, but it does help him to find detailed information about the system. 3.5.3 Alarm/Event Pages
A SCADA system must be able to detect, display, and log system alarms and events. Alarms identify system failures while events identify system changes. The change can be caused by a control operation made by the operators to the plant or an actual state change that occurs in the plant.
Alarm/Event pages display all alarms and events that occur in the system in a tabular format. Every time the system generates an alarm (or event) a message will be added at the bottom of the Table. This message contains useful information about the alarm (or event) like the location of the alarm, the date and time of alarm occurrence, and the type of event that caused the alarm [1]. Colors, flashing, and audible alerts are all used to notify the operators of alarm occurrence.
Alarms and events must be recorded so that operator can review them in the future. This will help the operator to determine which device fails repeatedly, what the most popular alarms are, and what system part should be maintained. Through using Historical pages (of alarms and events) the operator can display all alarms and events that occurred during a certain period of time (usually one day) within a configurable time interval (1 month, 2 months …).

Chapter Three; SOFTWARE TOOLS, EXPERT REVIEWS AND USABILITY TESTING
43
3.5.4 Report Pages As the Alarm/Event pages have their own archive facility and display
information upon request, the SCADA system provides the same facility to analog readings also. Report pages are where the operator can display the analog reading through certain period of time and within a configurable interval. Report pages can be displayed in two different ways [23]: - Report Tables; Report Tables display analog readings versus time in a tabular format. - Trends; Trends display analog readings versus time in a graphical format and via a trending chart. 3.5.5 Operator Pages
Operator Pages contain information related to the operators not to the SCADA system or to the plant. These pages include: - Operator Existence Pages; Operator Existence Pages contain information
about which operator is responsible for monitoring the system and at which time. Only operator’s supervisors can edit the contents of these pages.
- Operator Note Pages; Operator Note Pages contain operator’s notes about the plant and any other useful notes.
3.6 Database Management System
A Data Base-Management System (DBMS) is a collection of interrelated
data and set of programs to access those data. The collection of data, usually
referred to as the database, contains information relevant to an enterprise. The
primary goal of a DBMS is to provide a way to store and retrieve database
information that is both convenient and efficient.
Database systems are designed to manage large bodies of information.
Management of data involves both defining structures for storage of information
and providing mechanisms for the manipulation of information. In addition, the
database system must insure the safety for information stored, despite system
Chapter Three; SOFTWARE TOOLS, EXPERT REVIEWS AND USABILITY TESTING
44
crashes or attempts at unauthorized access. If data are to be shared among several
users, the system must be avoiding possible anomalous results. Any user interface
deals with some kind of database. It is important to expose custom and legacy data
in a standard and more manageable way.
3.6.1 SQL Server
The SQL Server 2000 relational database engine is a modern, highly
scalable, and reliable engine for storing data. The database engine stores data in
tables. Each table represents some object of interest to the plant. Each table has
columns that represent an attribute of the object modeled by the table and rows that
represent a single occurrence of the type of object modeled by the table [45].
Applications can submit Structured Query Language (SQL) statements to the
database engine, which returns the results to the application in the form of a tabular
result set. The specific dialect of SQL supported by SQL Server is called Transact-
SQL.
3.6.2 ActiveX Data Object
ActiveX Data Object (ADO) is the latest in a long series of Microsoft Data
Access Component (MDAC), and it effectively supersedes the old Data Access
Object (DAO) and Remote Data Object (RDO). ActiveX Data Object is
application level interface with a consistent design across many programming
environments. It offers access to Jet data, traditional remote data sources, and new
data sources such as e-mail and file directory systems. ActiveX Data Object is the
recommended programming interface to develop applications that acts as Object
Linking and Embedded Data Base (OLEDB) consumers. Through ADO it is easy
to code but is still slower than OLEDB [1].
Chapter Three; SOFTWARE TOOLS, EXPERT REVIEWS AND USABILITY TESTING
45
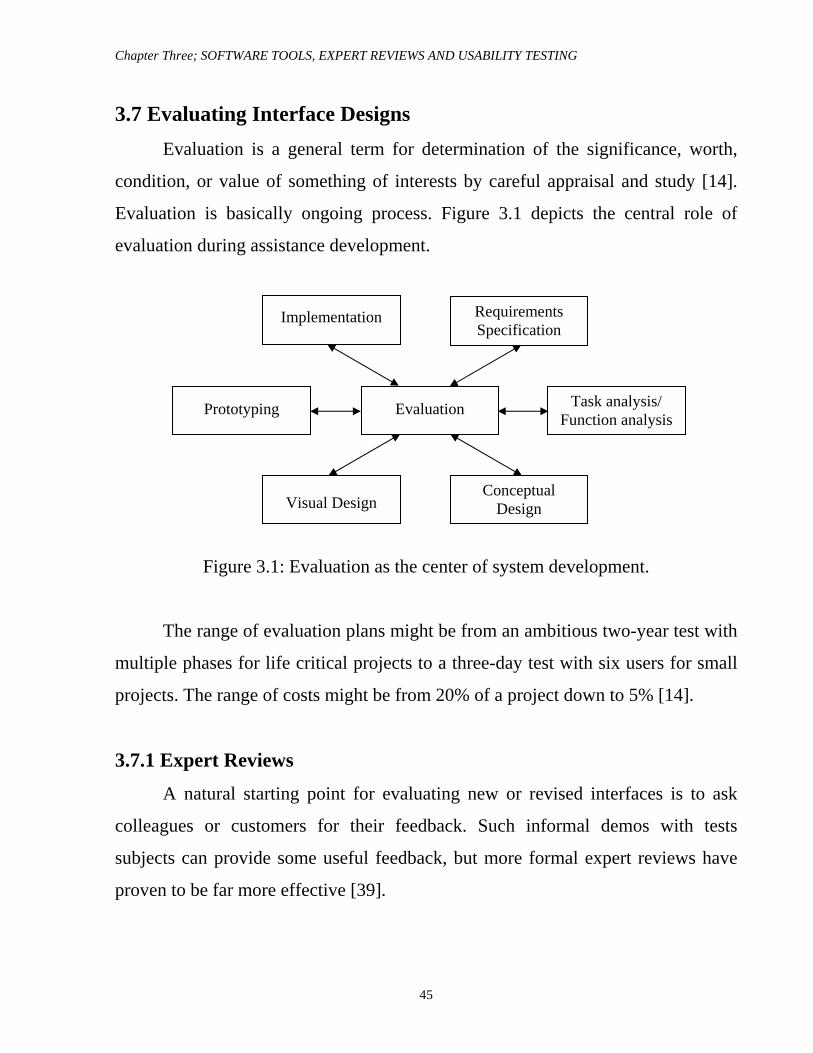
3.7 Evaluating Interface Designs Evaluation is a general term for determination of the significance, worth,
condition, or value of something of interests by careful appraisal and study [14].
Evaluation is basically ongoing process. Figure 3.1 depicts the central role of
evaluation during assistance development.
Figure 3.1: Evaluation as the center of system development.
The range of evaluation plans might be from an ambitious two-year test with
multiple phases for life critical projects to a three-day test with six users for small
projects. The range of costs might be from 20% of a project down to 5% [14].
3.7.1 Expert Reviews
A natural starting point for evaluating new or revised interfaces is to ask
colleagues or customers for their feedback. Such informal demos with tests
subjects can provide some useful feedback, but more formal expert reviews have
proven to be far more effective [39].
Task analysis/ Function analysis
Evaluation
Prototyping
Requirements Specification
Implementation
Conceptual Design
Visual Design
Chapter Three; SOFTWARE TOOLS, EXPERT REVIEWS AND USABILITY TESTING
46
These methods depend on having experts (whose expertise may be in the
application or user-interface domains) available on staff or as consultants. Expert
reviews can then be conducted on short notice and rapidly.
Expert reviews can occur early or late in the design phase. The outcome can
be a formal report with problems identified or recommendations for changes. The
reviewers note possible problems for discussions with the designers but solutions
generally should be left to the designers to produce [4]. Expert reviews usually
take from half a day to one week, although a lengthy training period may be
required to explain the task domain or operational procedures. Different experts
tend to find different problems in an interface, so 3-5 expert reviewers can be
highly productive [4]. There are a variety of expert-review methods from which to
choose: Heuristic evaluation, Guidelines reviews, Consistency inspection,
Cognitive walkthrough, Formal usability inspection.
In this thesis a comparison between these methods has been done which is
shown in Table 3.3 and according to the features which is discussed in the table, a
decision was made to use the cognitive walkthrough evaluation method. The
following is a brief discussion of this method;
− Cognitive walkthrough. The experts simulate users walking through the
interface to carry out typical tasks. High-frequency tasks are a starting point,
but rare critical tasks, such as error recovery, also should be walked through.
Some form of simulating the day in the life of the user should be part of the
expert- review process. Cognitive walkthroughs were developed for inter-
faces that can be learned by exploratory browsing [53], but they are useful
even for interfaces that require substantial training.
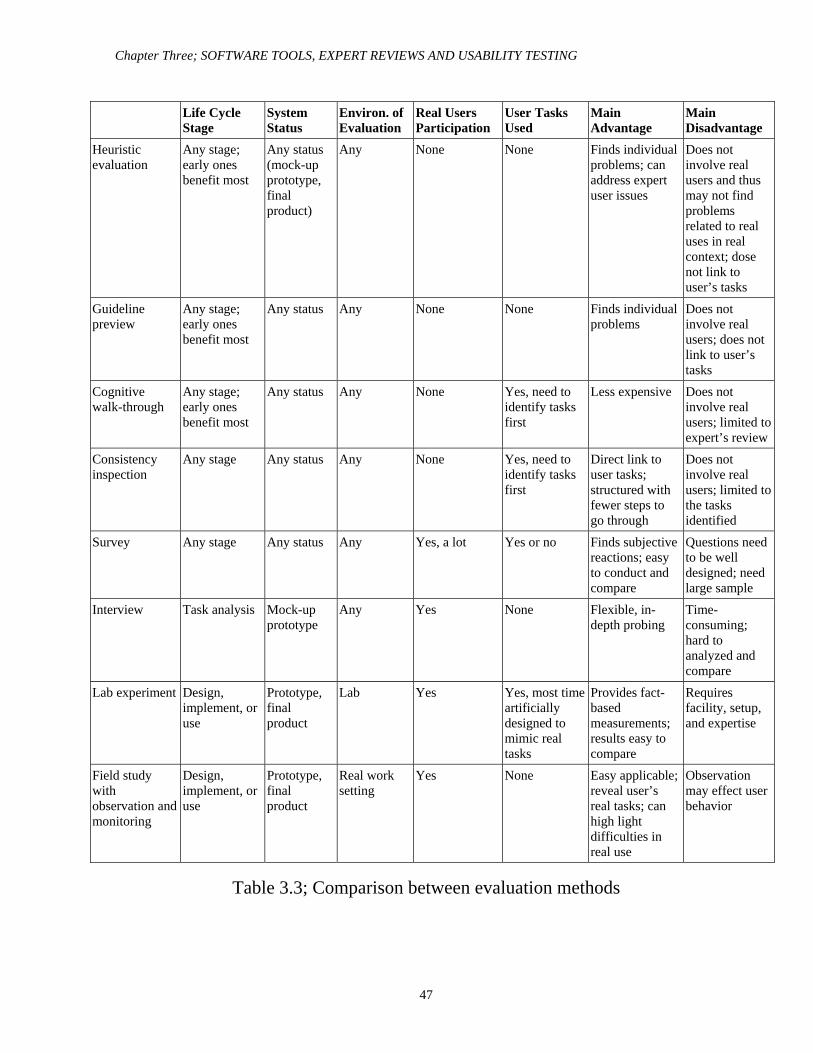
Chapter Three; SOFTWARE TOOLS, EXPERT REVIEWS AND USABILITY TESTING
47
Life Cycle Stage
System Status
Environ. of Evaluation
Real Users Participation
User Tasks Used
Main Advantage
Main Disadvantage
Heuristic evaluation
Any stage; early ones benefit most
Any status (mock-up prototype, final product)
Any None None Finds individual problems; can address expert user issues
Does not involve real users and thus may not find problems related to real uses in real context; dose not link to user’s tasks
Guideline preview
Any stage; early ones benefit most
Any status Any None None Finds individual problems
Does not involve real users; does not link to user’s tasks
Cognitive walk-through
Any stage; early ones benefit most
Any status Any None Yes, need to identify tasks first
Less expensive Does not involve real users; limited to expert’s review
Consistency inspection
Any stage Any status Any None Yes, need to identify tasks first
Direct link to user tasks; structured with fewer steps to go through
Does not involve real users; limited to the tasks identified
Survey Any stage Any status Any Yes, a lot Yes or no Finds subjective reactions; easy to conduct and compare
Questions need to be well designed; need large sample
Interview Task analysis Mock-up prototype
Any Yes None Flexible, in-depth probing
Time-consuming; hard to analyzed and compare
Lab experiment Design, implement, or use
Prototype, final product
Lab Yes Yes, most time artificially designed to mimic real tasks
Provides fact-based measurements; results easy to compare
Requires facility, setup, and expertise
Field study with observation and monitoring
Design, implement, or use
Prototype, final product
Real work setting
Yes None Easy applicable; reveal user’s real tasks; can high light difficulties in real use
Observation may effect user behavior
Table 3.3; Comparison between evaluation methods
Chapter Three; SOFTWARE TOOLS, EXPERT REVIEWS AND USABILITY TESTING
48
An expert might try the walkthrough privately and explore the system, but
there also should be a group meeting with designers, users or managers, to
conduct the walkthrough and provoke discussions. Extensions to cover
website navigation incorporate richer descriptions of users and their goals
plus linguistic analysis program to estimate the similarity of link labels and
destinations [10].
3.7.2 Expert-Reviews Report
An expert review report should be comprehensive, rather than making
comments about specific features, or presenting a random collection of suggested
improvements by [4]:
− Guidelines documents might be used to structure the report, then comment on
novice, intermittent, and expert features and review consistency across all
displays.
− Theory or model, such as object-action interface model (described in section
2.5) might be used to organize the report.
− Recommendations must be ranked by importance and expected effort level so
the organizations are more likely to implement them (or at least the high-
payoff, low-cost ones).
− Experts reviewer should also include required small fixes such as spelling
mistakes, poorly aligned data-entry fields, or inconsistent button placements.
− A final category includes less vital fixes and novel features that can be
addressed in the next version of the interface.
− Experts reviewer may also used software tools to speed their analyses,
especially with large interfaces. These tools usually provide specific
instructions for improvements.
Chapter Three; SOFTWARE TOOLS, EXPERT REVIEWS AND USABILITY TESTING
49
3.8 Usability Definition International Standard Organization (ISO) defines usability as “The extent to
which the product can be used by specified users to achieve specified goals with
effectiveness, efficiency, and satisfaction in a specified context of use” [8], where
product is taken to mean a computerized system with given functionality.
3.8.1 Usability Testing and Laboratories
At each design stage, the interface can be refined iteratively and the
improved version can be tested. It is important to fix quickly even small flaws,
such as spelling errors or inconsistent layout, since they influence user
expectations [51]. Usability testing produced dramatic cost savings thus the
movement towards usability testing stimulate the construction of usability
laboratories. A typical modest usability lab would have two 3 by 3 meter areas, one
for the participants to do their work and another, separated by a half-silvered
mirror, for the testers and observers [22]. Participants should be chosen to
represent the intended user communities. Many variants forms of usability testing
have been tried: Paper mockups, Discount usability testing, Competitive usability
testing, Universal usability testing, Field tests and portable labs, Remote usability
testing, Can- you- break- this test.
In this thesis the decision was made to choose competitive usability testing
form since this testing approach compares a new interface to previous versions or
similar products from competitors. This approach is close to controlled
experimental study, and staff must be careful to construct parallel sets of tasks and
to counterbalance the order of presentation of the interfaces. Within-subjects
designs seem the most powerful, because participant can make comparisons
Chapter Three; SOFTWARE TOOLS, EXPERT REVIEWS AND USABILITY TESTING
50
between the competing interfaces fewer participants are needed, although each is
needed for a longer time period [4].
3.8.2 Limitations of Usability Testing
Usability testing does have at least two series limitations. It emphasizes first-
time usage since usability tests are usually only one to three hours long, it is
difficult to ascertain how performance will be after a week or a month of regular
usage [14]. Also, some believe that realistic test environments are necessary to
evaluate information appliances, and ambient technologies.
3.9 Survey and Questionnaire
Surveys are a well-established technique for collecting demographic data
and users’ opinions. Efforts and skill are needed to insure that questions are clearly
worded and the data collected can be analyzed efficiently [4]. This technique is
familiar, inexpensive and generally acceptable companion for usability tests and
expert reviews. The keys to successful survey are clear goals in advance and
development of focused items that help to attain those goals.
Surveys start by asking for basic demographic information, such as age,
gender, and past experience. This background information is useful in finding out
the range within the sample group.
Survey goals can be tied to the components of the OAI model of interface
design (Section 2.5). That is, users can be asked for their subjective impressions
about specific aspects of the interface, such as the representation of:
• Task domain objects and actions.
• Interface domain metaphors and action handles.
• Syntax of inputs and design of displays.
Chapter Three; SOFTWARE TOOLS, EXPERT REVIEWS AND USABILITY TESTING
51
3.9.1 Questionnaire for User Interaction Satisfaction (QUIS)
This questionnaire technique is based on the early versions of the OAI
model and covers interface details, such as readability of characters and layout of
displays; interface objects, such as meaningfulness of icons; interface actions, such
as shortcuts for frequent users; and task issues, such as appropriate terminology
and screen sequencing [4].
Appendix C contains the long form, which is designed to have two levels of
questions: general and detailed. If participants are willing to respond to every item,
then the long form questionnaire can be used. If participants are not likely to be
patient, then only the general questions in the short form need to be asked.
3.10 Acceptance of the Test Explicit acceptance criteria should be established when the requirements
document is written or when a contract is offered, rather than using the vague and
misleading criterion of “user friendly. Measurable criteria for the user interface can
be established for the following [14]:
• Time for users to learn specific functions
• Speed of task performance
• Rate of error by users
• Users retention of commands over time
• Subjective user satisfaction
In a large system, there may be eight to ten of such tests to carry out on
different components of the interface and with different user communities. Other
criteria, such as subjective satisfaction, output comprehensibility, system response
time, installation procedure, printed documentation, or graphic appeal, may also
considered in the acceptance of the tests of complete commercial products.

Chapter Three; SOFTWARE TOOLS, EXPERT REVIEWS AND USABILITY TESTING
52
After successful acceptance testing, there may be a period of field testing
before national or international distribution.
3.11 Evaluation during Active Use These evaluations happen when the system is released and is used by
targeted users in a real context. The purpose of these evaluations is to better
understand how the system impacts organizational, group, and individual tasks and
activities [22]. Such evaluations can further guide and change the design of future
systems. These evaluation techniques are out of the scope of this thesis.

CHAPTER FOUR
IMPLEMENTATION OF HCI
FOR SCADA SYSTEM
Chapter Four: IMPLEMENTATION OF HCI FOR SCADA SYSTEM
54
CHAPTER FOUR
IMPLEMENTATION OF HCI FOR SCADA SYSTEM
4.1 Introduction Once all aspects of successful human computer interface development have
been specified, a SEMATIC WinCC HMI is used to design and implement human
computer interface and SCADA modules for electrical power generation system.
4.2 Case Study: The Electrical Power Generation System Designing an effective and interactive human computer interface of the
supervisory control and data acquisition system (SCADA) for electrical power
generation stations has been selected as a case study in this thesis. The project
consists of similar twenty six electrical power generation stations distributed in
different sites all over Iraq as shown in Figure 4.1. These stations or sites are
supervised by a master station at Baghdad.
According to the software life cycle, the software requirements must be
defined before starting the design process of human computer interface. The
customer, National Dispatch Center (NDC), request to collect performance and
condition information on essential stations equipments, such as generators, feeders
and fuel, and stores the information for future reference. This time based data will
be used to perform specialized function and provide decision making guidance to
operators, maintains planer and engineering.
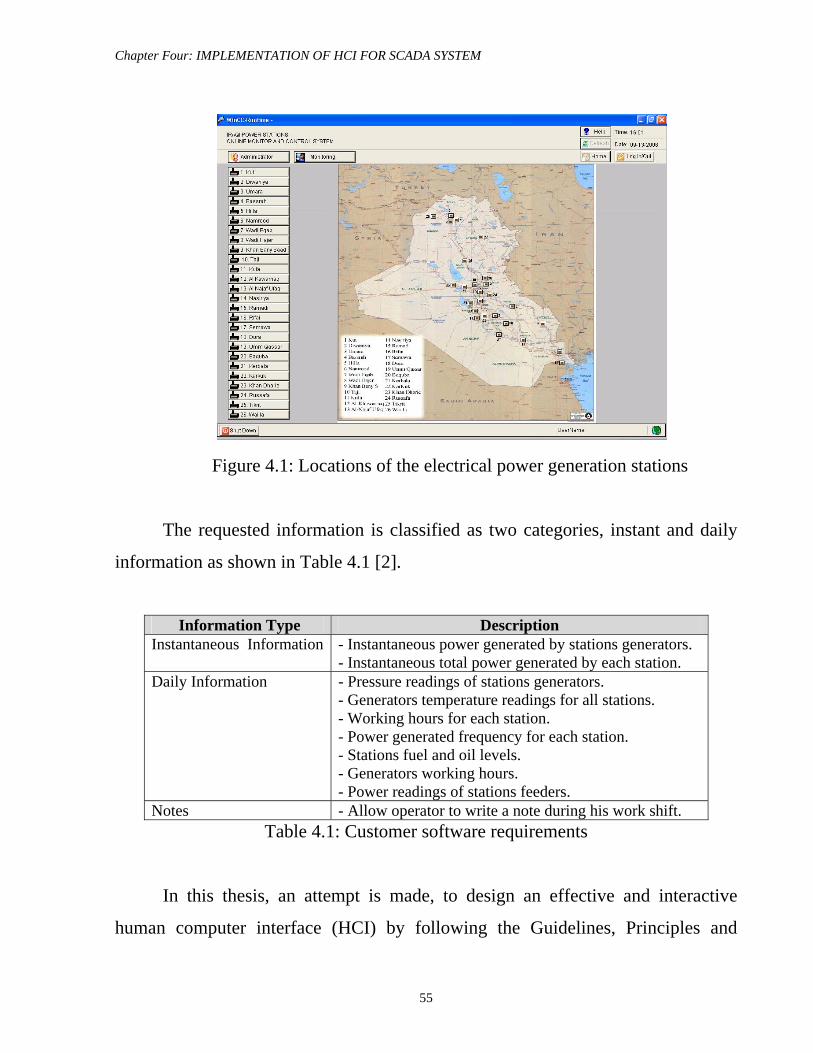
Chapter Four: IMPLEMENTATION OF HCI FOR SCADA SYSTEM
55
Figure 4.1: Locations of the electrical power generation stations
The requested information is classified as two categories, instant and daily
information as shown in Table 4.1 [2].
Information Type Description
Instantaneous Information - Instantaneous power generated by stations generators. - Instantaneous total power generated by each station.
Daily Information - Pressure readings of stations generators. - Generators temperature readings for all stations. - Working hours for each station. - Power generated frequency for each station. - Stations fuel and oil levels. - Generators working hours. - Power readings of stations feeders.
Notes - Allow operator to write a note during his work shift. Table 4.1: Customer software requirements
In this thesis, an attempt is made, to design an effective and interactive
human computer interface (HCI) by following the Guidelines, Principles and
Chapter Four: IMPLEMENTATION OF HCI FOR SCADA SYSTEM
56
Theories stated in Chapter Two. In order to manage the design process the three
pillars shown in Figure 2.1 can help to produce an order of magnitude speedup in
the process and can facilitate the creation of excellent human computer interface.
The second pillar in the figure is the user interface software tools so the
decision is choosing the Simatic WinCC developed by Siemens Company as a user
interface management system (UIMS) to design the case study pages or screens
and thus the resultant HCI possesses standard features that already the Simatic
WinCC have.
An understanding of user’s skills with interfaces and with the application
domain is important as explained in section (2.3.1). For example, a generic
separation into novice or first-time, knowledgeable intermittent and expert frequent
users might lead to insert or omit some features to the user interface design.
Designing for one class is easy; designing for several is much more difficult [4]. In
this case study the users could be classified into two classes, Novice and Expert
frequent users, Novice users are distributed all over the 26 power generation
stations. Those users have low computer skills, intermediate education, so the basic
strategies is to permit a multi-layer (sometimes called level-structured or spiral)
approach to learning [6]. So there are three access levels to the proposed HMI of
the case study, operator, monitor and administrator. The highest level,
administrator, is allowed to the expert frequent users, working at the master station
at Baghdad, who have high computer skills and higher education in electrical,
computer and control engineering. This type of users has all the rights for
monitoring and controlling the plant.
In order to simplify expert frequent user’s job, a monitoring button is added
upon customer request (NDC) to allow a quick revision of the 26 power stations
readings. Also, a home button has been added to the main tool bar in order to allow
the administrator to switch from one station to another.
Chapter Four: IMPLEMENTATION OF HCI FOR SCADA SYSTEM
57
The novice users, operators, are only allowed to log in to the HMI pages or
screens of their stations except report, trend and system pages.
The accessing level privileges are defined by a user name and password in a
logging dialogue box. This logging procedure adds a security feature to the HMI
and protects the system from unauthorized access.
The proposed SCADA Master Station Software should be able to perform the following activities: data receiving, data transmission, data processing, alarm identifying, updating database, communicating with the operator, recording historical data, and detecting hardware and software failures (Appendix A) [36]. Also SCADA HCI should be capable of display the system information in two formats, tabular and graphical. These two formats are broken into pages in an understood manner.
4.3 Communication System The communications network is intended to provide the means by which
data can be transferred between the central host computer servers (master station at
Baghdad) and the field-based RTUs (at the 26 power generation stations). Very
Small Aperture Terminal (VSAT) modems are used to connect the remote sites to
the host, an on-line operation can also be implemented on this technology [2].
Very Small Aperture Terminal (VSAT) technology has advanced to the
point where a much smaller antenna (down to about one meter) can be used for
Ku-band communications. This has resulted in the Ku-band being preferred for
sites with modest communications requirements. VSAT technology is advancing
steadily, and the capital costs have dropped substantially. Continual time-of-use
charges must be considered in the use of satellite communications. Developments
in this area are investigated when making a decision on the use of this technology.
Table 4.2 shows the satellite system advantages and disadvantages [36].
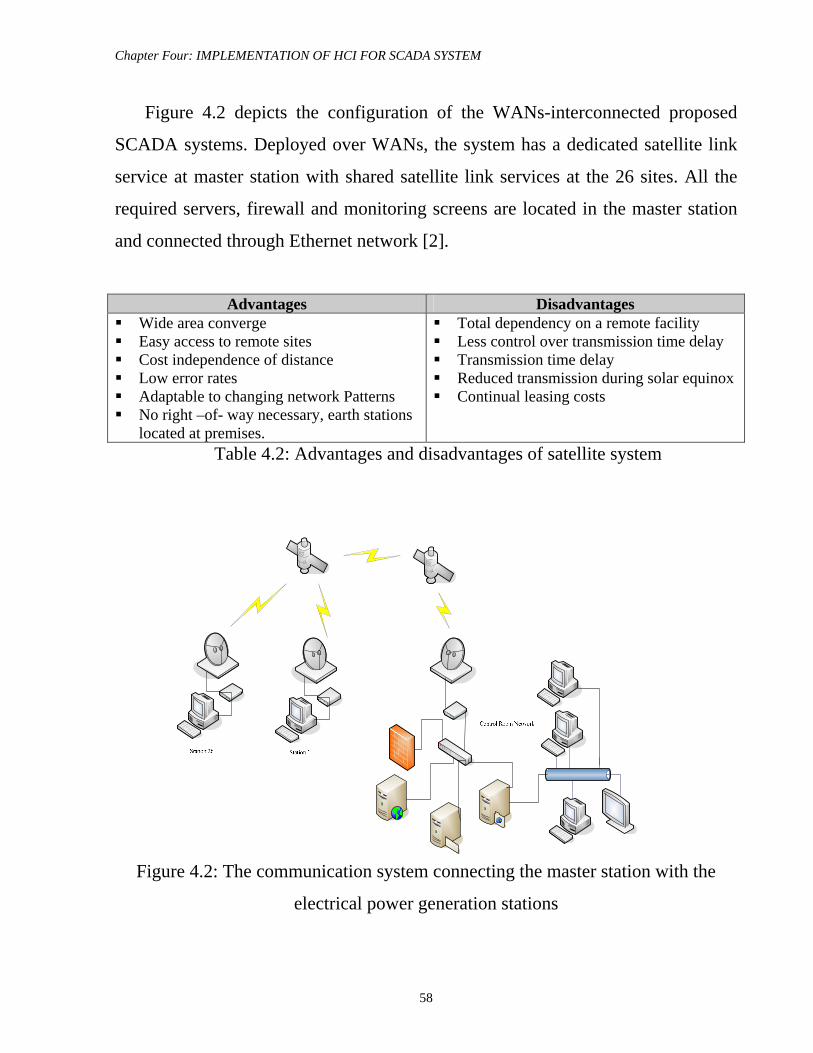
Chapter Four: IMPLEMENTATION OF HCI FOR SCADA SYSTEM
58
Figure 4.2 depicts the configuration of the WANs-interconnected proposed
SCADA systems. Deployed over WANs, the system has a dedicated satellite link
service at master station with shared satellite link services at the 26 sites. All the
required servers, firewall and monitoring screens are located in the master station
and connected through Ethernet network [2].
Advantages Disadvantages
Wide area converge Easy access to remote sites Cost independence of distance Low error rates Adaptable to changing network Patterns No right –of- way necessary, earth stations
located at premises.
Total dependency on a remote facility Less control over transmission time delay Transmission time delay Reduced transmission during solar equinox Continual leasing costs
Table 4.2: Advantages and disadvantages of satellite system
Figure 4.2: The communication system connecting the master station with the
electrical power generation stations
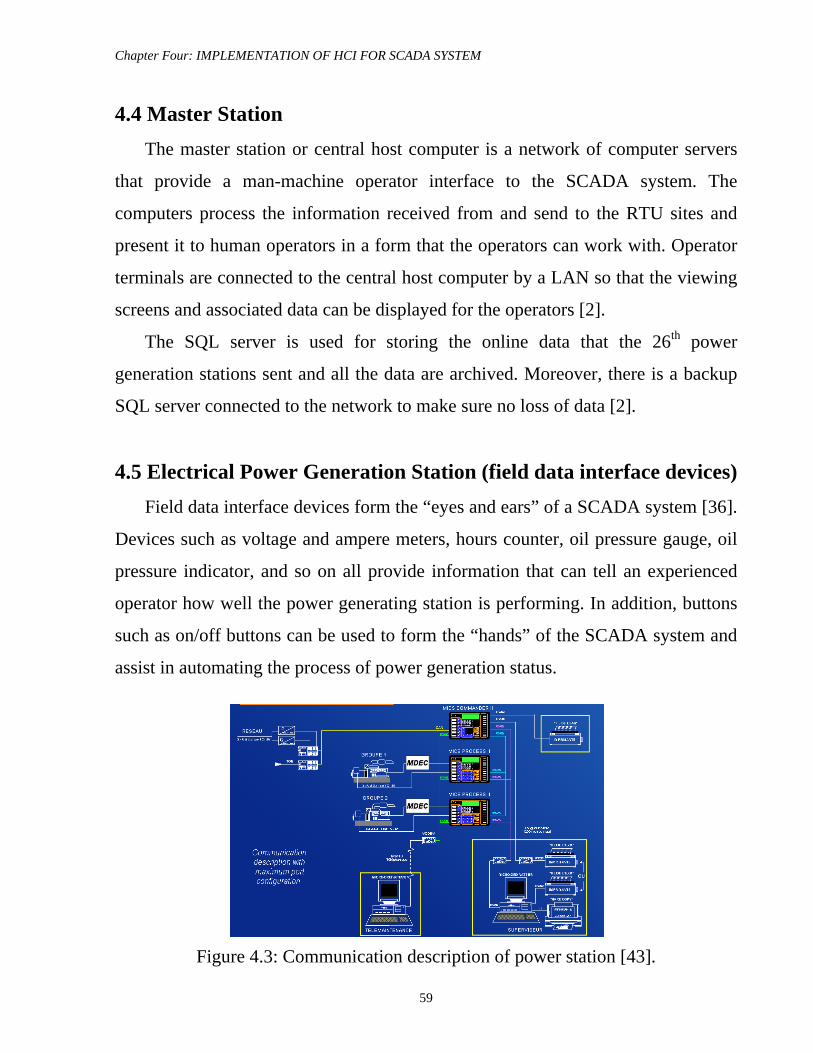
Chapter Four: IMPLEMENTATION OF HCI FOR SCADA SYSTEM
59
4.4 Master Station The master station or central host computer is a network of computer servers
that provide a man-machine operator interface to the SCADA system. The
computers process the information received from and send to the RTU sites and
present it to human operators in a form that the operators can work with. Operator
terminals are connected to the central host computer by a LAN so that the viewing
screens and associated data can be displayed for the operators [2].
The SQL server is used for storing the online data that the 26th power
generation stations sent and all the data are archived. Moreover, there is a backup
SQL server connected to the network to make sure no loss of data [2].
4.5 Electrical Power Generation Station (field data interface devices) Field data interface devices form the “eyes and ears” of a SCADA system [36].
Devices such as voltage and ampere meters, hours counter, oil pressure gauge, oil
pressure indicator, and so on all provide information that can tell an experienced
operator how well the power generating station is performing. In addition, buttons
such as on/off buttons can be used to form the “hands” of the SCADA system and
assist in automating the process of power generation status.
Figure 4.3: Communication description of power station [43].
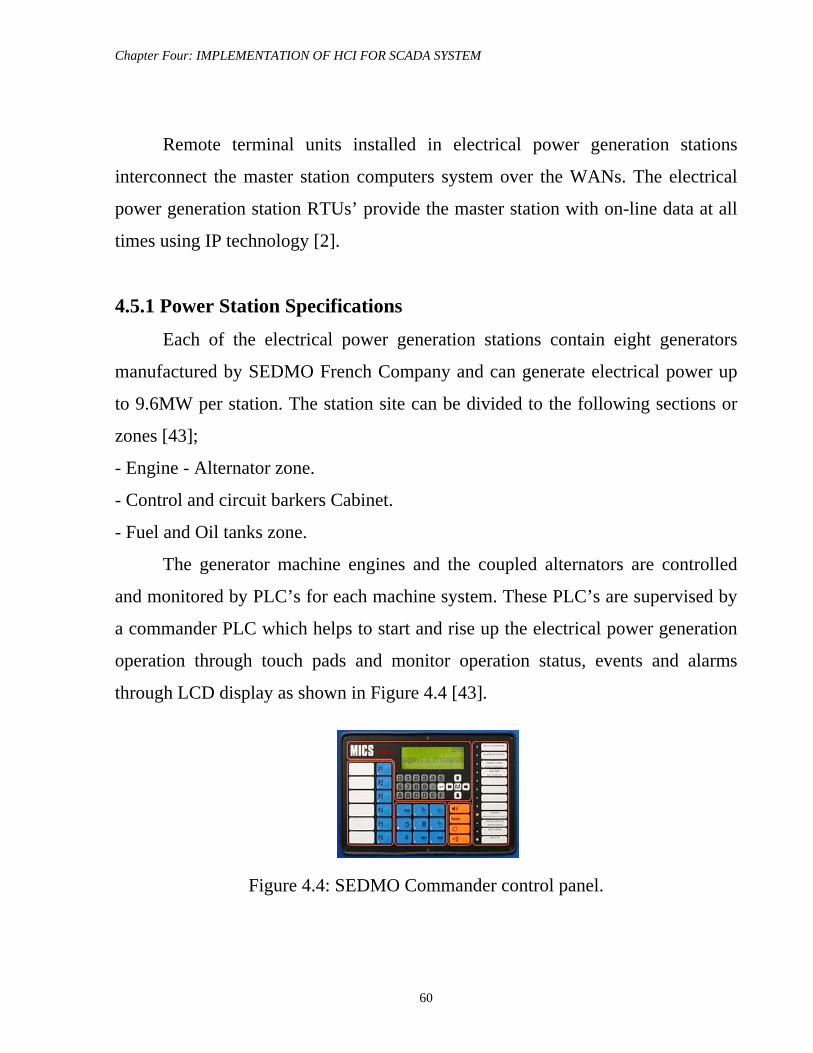
Chapter Four: IMPLEMENTATION OF HCI FOR SCADA SYSTEM
60
Remote terminal units installed in electrical power generation stations
interconnect the master station computers system over the WANs. The electrical
power generation station RTUs’ provide the master station with on-line data at all
times using IP technology [2].
4.5.1 Power Station Specifications
Each of the electrical power generation stations contain eight generators
manufactured by SEDMO French Company and can generate electrical power up
to 9.6MW per station. The station site can be divided to the following sections or
zones [43];
- Engine - Alternator zone.
- Control and circuit barkers Cabinet.
- Fuel and Oil tanks zone.
The generator machine engines and the coupled alternators are controlled
and monitored by PLC’s for each machine system. These PLC’s are supervised by
a commander PLC which helps to start and rise up the electrical power generation
operation through touch pads and monitor operation status, events and alarms
through LCD display as shown in Figure 4.4 [43].
Figure 4.4: SEDMO Commander control panel.
Chapter Four: IMPLEMENTATION OF HCI FOR SCADA SYSTEM
61
Engine Control Unit (ECU), which is connected to the commander control
panel, features the following engine governing and control functions:
- Start sequence control.
- Speed governing.
- Acquisition of a load pulse signal for preparation of load connection.
- Adjustable speed drop.
Engine Control Unit ECU also performs the following monitoring tasks:
- Engine Oil pressure and temperature.
- Engine Coolant temperature.
- CR pressure.
- Nominal speed to allow operation as a 50 Hz generator set (i.e. generator
voltage frequency).
- Engine working hours.
- Transmission of all warnings and alarms to the monitoring and control
system.
- Automatic shutdown in case of limit value violation.
The defects that indicate alarms can be classified as mechanical and electrical
defects. These defects are as follows:
- Mechanical defects:
- Mechanical bearing; Excessive heating of main bearings.
- Abnormal temperature; Excessive heating of alternator housing.
- Vibration; Excessive vibration and noise coming from the machine.
- Electrical defects
- Absence of no-load voltage on start.
- Voltage is too low
- Voltage is too high.
- Voltage oscillation.
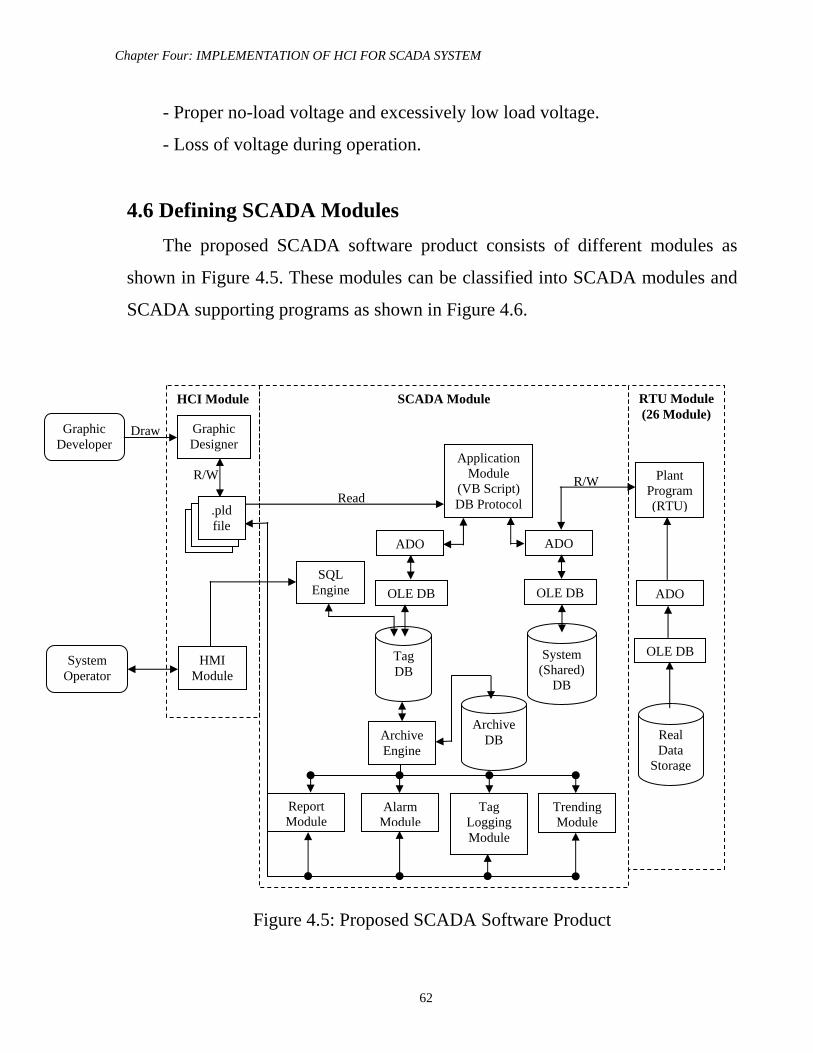
Chapter Four: IMPLEMENTATION OF HCI FOR SCADA SYSTEM
62
- Proper no-load voltage and excessively low load voltage.
- Loss of voltage during operation.
4.6 Defining SCADA Modules The proposed SCADA software product consists of different modules as
shown in Figure 4.5. These modules can be classified into SCADA modules and
SCADA supporting programs as shown in Figure 4.6.
Figure 4.5: Proposed SCADA Software Product
HMI Module
.pld file .pld file
.pld file
Graphic Designer
SQL Engine
Archive Engine
Report Module
Alarm Module
Tag Logging Module
Trending Module
ADO
OLE DB ADO
OLE DB
Plant Program (RTU)
System Operator
Graphic Developer
Tag DB
System (Shared)
DB
Archive DB Real
Data Storage
Application Module
(VB Script) DB Protocol
ADO
OLE DB
HCI Module SCADA Module RTU Module (26 Module)
Draw
R/W
Read R/W
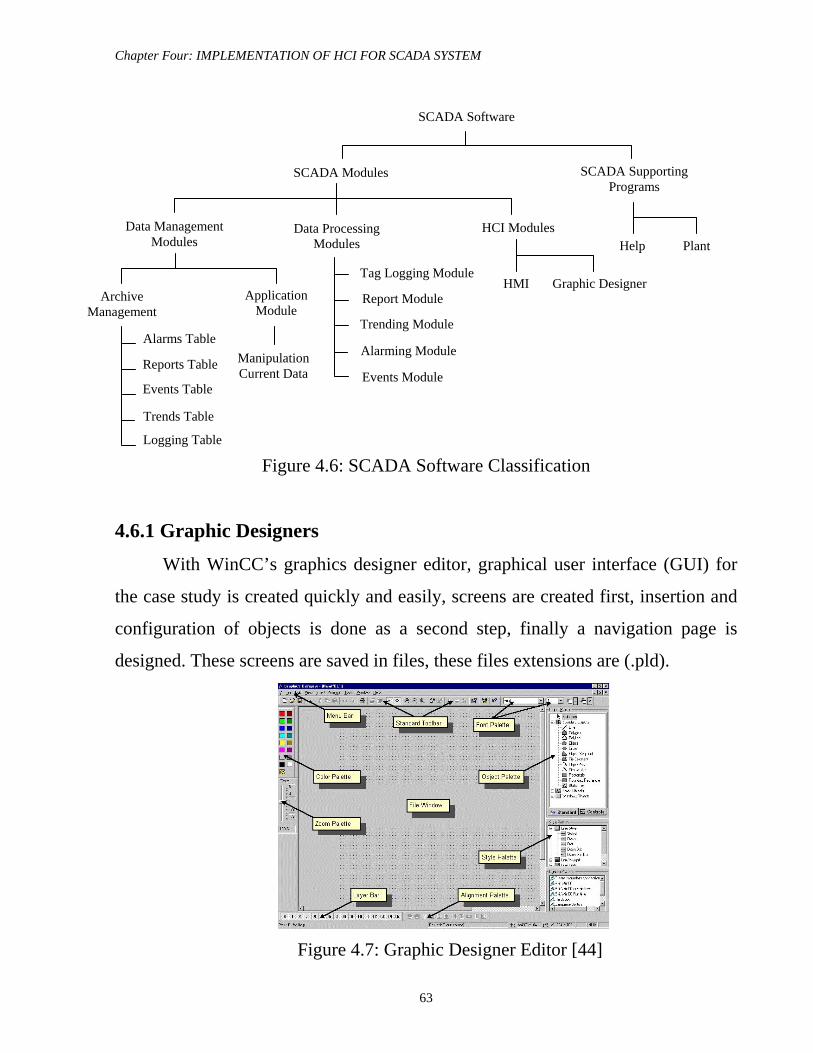
Chapter Four: IMPLEMENTATION OF HCI FOR SCADA SYSTEM
63
Figure 4.6: SCADA Software Classification
4.6.1 Graphic Designers
With WinCC’s graphics designer editor, graphical user interface (GUI) for
the case study is created quickly and easily, screens are created first, insertion and
configuration of objects is done as a second step, finally a navigation page is
designed. These screens are saved in files, these files extensions are (.pld).
Figure 4.7: Graphic Designer Editor [44]
SCADA Software
SCADA Supporting Programs
SCADA Modules
Data Management Modules
Data Processing Modules
HCI Modules Help Plant
HMI Graphic Designer Tag Logging Module
Report Module
Trending Module
Alarming Module
Events Module
Trends Table
Archive Management
Application Module
Alarms Table
Logging Table
Events Table
Reports Table Manipulation Current Data
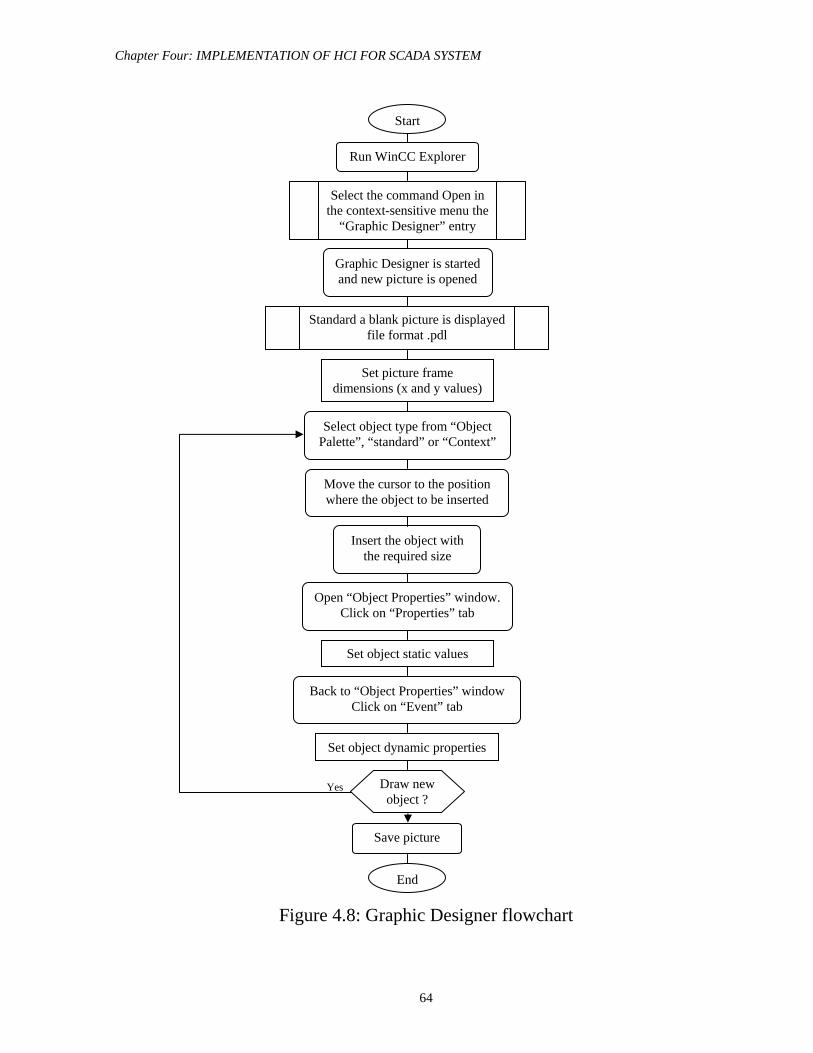
Chapter Four: IMPLEMENTATION OF HCI FOR SCADA SYSTEM
64
Figure 4.8: Graphic Designer flowchart
Run WinCC Explorer
End
Graphic Designer is started and new picture is opened
Select the command Open in the context-sensitive menu the
“Graphic Designer” entry
Standard a blank picture is displayed file format .pdl
Set picture frame dimensions (x and y values)
Select object type from “Object Palette”, “standard” or “Context”
Move the cursor to the position where the object to be inserted
Insert the object with the required size
Open “Object Properties” window. Click on “Properties” tab
Set object static values
Back to “Object Properties” window Click on “Event” tab
Set object dynamic properties
Draw new object ?
Save picture
Start
Yes
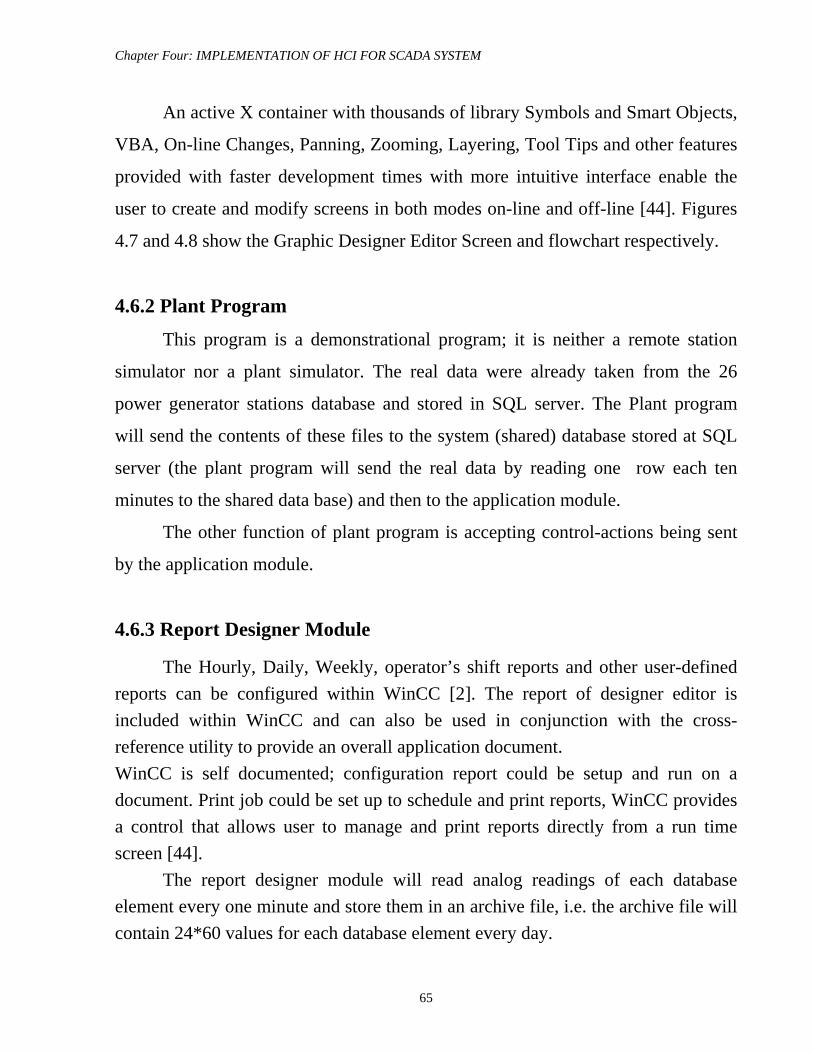
Chapter Four: IMPLEMENTATION OF HCI FOR SCADA SYSTEM
65
An active X container with thousands of library Symbols and Smart Objects,
VBA, On-line Changes, Panning, Zooming, Layering, Tool Tips and other features
provided with faster development times with more intuitive interface enable the
user to create and modify screens in both modes on-line and off-line [44]. Figures
4.7 and 4.8 show the Graphic Designer Editor Screen and flowchart respectively.
4.6.2 Plant Program
This program is a demonstrational program; it is neither a remote station
simulator nor a plant simulator. The real data were already taken from the 26
power generator stations database and stored in SQL server. The Plant program
will send the contents of these files to the system (shared) database stored at SQL
server (the plant program will send the real data by reading one row each ten
minutes to the shared data base) and then to the application module.
The other function of plant program is accepting control-actions being sent
by the application module.
4.6.3 Report Designer Module
The Hourly, Daily, Weekly, operator’s shift reports and other user-defined reports can be configured within WinCC [2]. The report of designer editor is included within WinCC and can also be used in conjunction with the cross-reference utility to provide an overall application document. WinCC is self documented; configuration report could be setup and run on a document. Print job could be set up to schedule and print reports, WinCC provides a control that allows user to manage and print reports directly from a run time screen [44].
The report designer module will read analog readings of each database element every one minute and store them in an archive file, i.e. the archive file will contain 24*60 values for each database element every day.
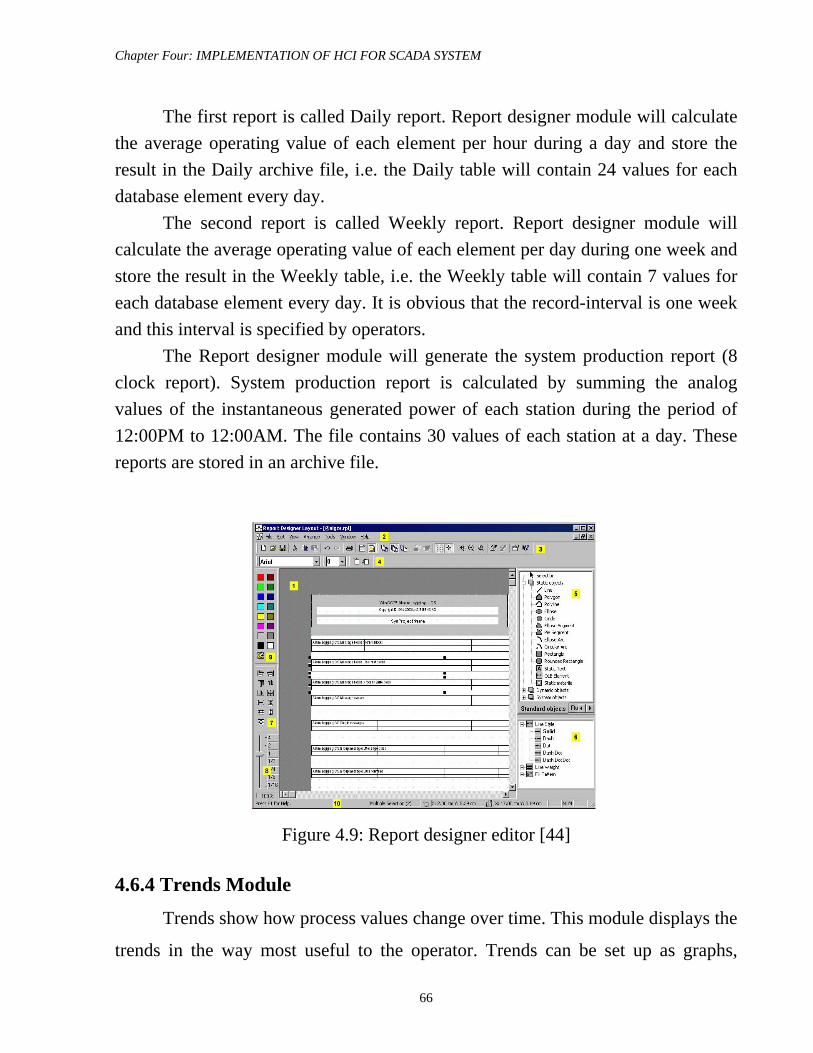
Chapter Four: IMPLEMENTATION OF HCI FOR SCADA SYSTEM
66
The first report is called Daily report. Report designer module will calculate the average operating value of each element per hour during a day and store the result in the Daily archive file, i.e. the Daily table will contain 24 values for each database element every day.
The second report is called Weekly report. Report designer module will calculate the average operating value of each element per day during one week and store the result in the Weekly table, i.e. the Weekly table will contain 7 values for each database element every day. It is obvious that the record-interval is one week and this interval is specified by operators.
The Report designer module will generate the system production report (8 clock report). System production report is calculated by summing the analog values of the instantaneous generated power of each station during the period of 12:00PM to 12:00AM. The file contains 30 values of each station at a day. These reports are stored in an archive file.
Figure 4.9: Report designer editor [44] 4.6.4 Trends Module
Trends show how process values change over time. This module displays the
trends in the way most useful to the operator. Trends can be set up as graphs,
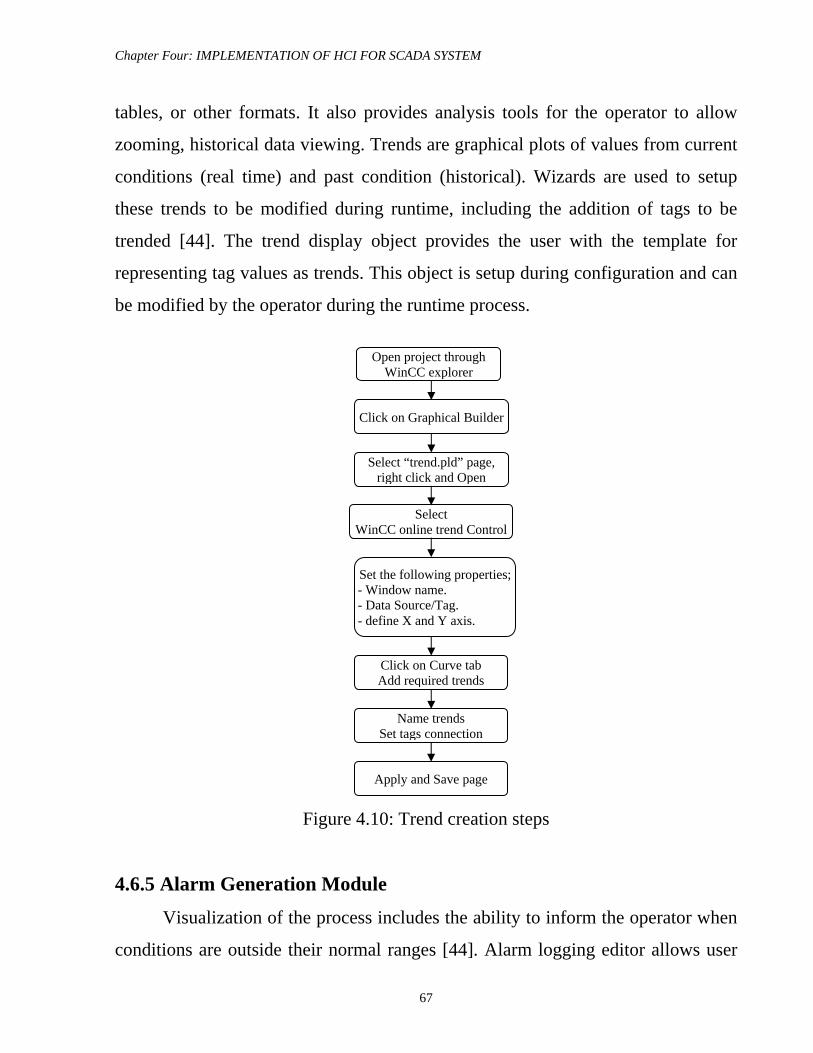
Chapter Four: IMPLEMENTATION OF HCI FOR SCADA SYSTEM
67
tables, or other formats. It also provides analysis tools for the operator to allow
zooming, historical data viewing. Trends are graphical plots of values from current
conditions (real time) and past condition (historical). Wizards are used to setup
these trends to be modified during runtime, including the addition of tags to be
trended [44]. The trend display object provides the user with the template for
representing tag values as trends. This object is setup during configuration and can
be modified by the operator during the runtime process.
Figure 4.10: Trend creation steps
4.6.5 Alarm Generation Module
Visualization of the process includes the ability to inform the operator when
conditions are outside their normal ranges [44]. Alarm logging editor allows user
Open project through WinCC explorer
Click on Graphical Builder
Select “trend.pld” page, right click and Open
Select WinCC online trend Control
Set the following properties;- Window name. - Data Source/Tag. - define X and Y axis.
Click on Curve tab Add required trends
Name trends Set tags connection
Apply and Save page
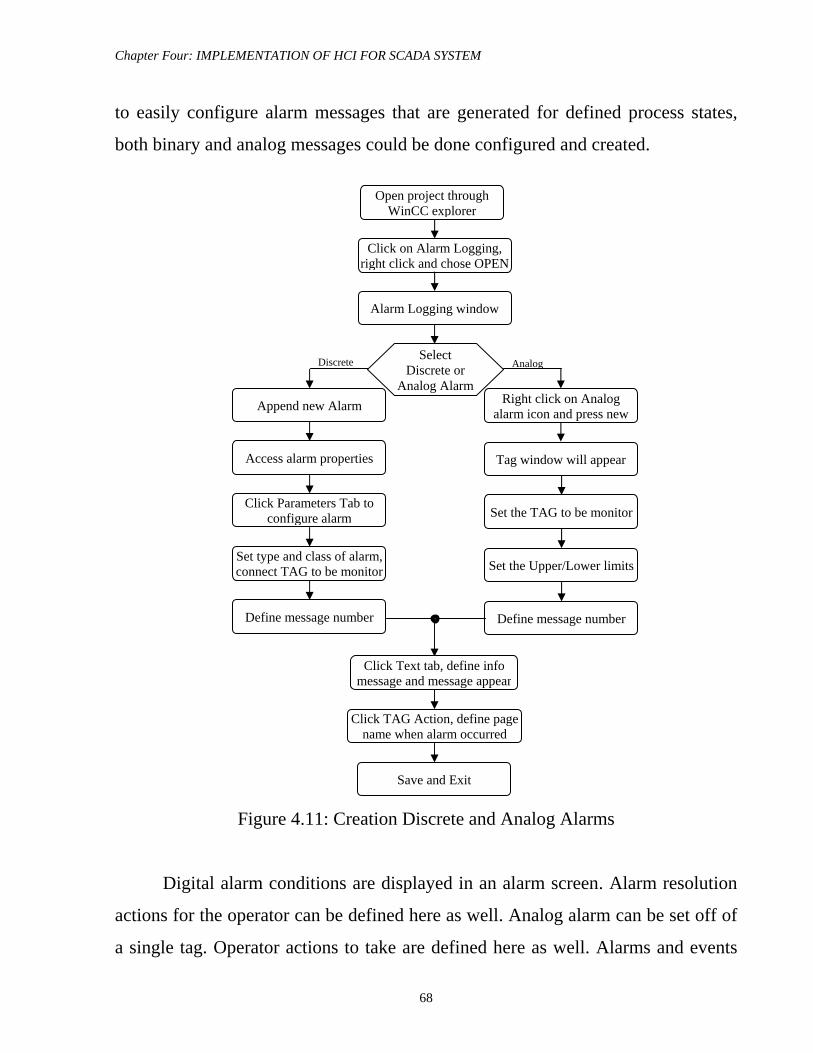
Chapter Four: IMPLEMENTATION OF HCI FOR SCADA SYSTEM
68
to easily configure alarm messages that are generated for defined process states,
both binary and analog messages could be done configured and created.
Figure 4.11: Creation Discrete and Analog Alarms
Digital alarm conditions are displayed in an alarm screen. Alarm resolution
actions for the operator can be defined here as well. Analog alarm can be set off of
a single tag. Operator actions to take are defined here as well. Alarms and events
Open project through WinCC explorer
Click on Alarm Logging, right click and chose OPEN
Alarm Logging window
Append new Alarm
Select Discrete or
Analog Alarm
AnalogDiscrete
Right click on Analog alarm icon and press new
Access alarm properties
Click Parameters Tab to configure alarm
Set type and class of alarm, connect TAG to be monitor
Define message number
Tag window will appear
Set the TAG to be monitor
Set the Upper/Lower limits
Define message number
Click Text tab, define info message and message appear
Click TAG Action, define page name when alarm occurred
Save and Exit
Chapter Four: IMPLEMENTATION OF HCI FOR SCADA SYSTEM
69
are stored in the local SQL server 2000 database. Settings include archive and
segment size, time range, and backup path.
4.6.6 Achieving Module
The basic tasks of the archiving system are to display current process values
at any time. However, displaying the chronological progression of a process value,
e.g. in a diagram or table, need to access to past process values [44]. These values
are stored in process value archives. The process value archiving system consists
of configuration and runtime components. The configuration component of the
archiving system is the Tag Logging editor. In there process value is configured
and archives are compressed, defining acquisition and archiving cycles and selects
the process values to be archived.
The runtime component of the archiving system is responsible for writing
the process values to be archived to the process value archive during runtime. Vice
versa, Tag Logging Runtime is also responsible for reading the archived process
values from the process value archive.
4.6.7 Data Base Modules
The SQL Server 2000 relational database engine is a modern, highly
scalable, highly reliable engine for storing data. The database engine stores data in
tables. Each table represents some object of interest to the plant. Each table has
columns that represent an attribute of the object modeled by the table and rows that
represent a single occurrence of the type of object modeled by the table. There are
three main data base modules in this case study.
Chapter Four: IMPLEMENTATION OF HCI FOR SCADA SYSTEM
70
4.6.7.1 System Database
This module contains the Plant real database gathered from the remote
(PLC) in the 26 power generation stations distributed in different sites all over the
country and demonstrated by the Plant program. The system database contains
three tables. One of the tables has attributes which refer to the readings related to
the station such as; station ID, main positive, main negative, oil and fuel levels, etc.
The attributes of other table are related to the eight generators in the 26th power
stations such as; generators ID’s, power generated readings, generators status and
other related readings, while the third table contains attributes of station number
correlated to the station name.
4.6.7.2 Archive Database
The Archive database is responsible for storing and retrieving historical
database used by other modules like report and trending modules. This module
contains many tables such as: Trending tables, Report tables, Event tables, Alarm
tables and Logging tables.
4.6.7.3 Tag Database
This module contains information received from the application module
each one second or information referred to memory location in system database
All the above modules used SQL server 2000 engine to store and retrieve
information and the mechanisms for the manipulation of information are the same
in all modules as mentioned in chapter three, ADO is application level interface
with a consistent design across many programming environments.
Chapter Four: IMPLEMENTATION OF HCI FOR SCADA SYSTEM
71
4.6.8 Application Module
This module responsibilities are: send/receive data to/from the system
(shared) database, does all necessary calculations on these data, and updates
system database with real-data values.
4.6.9 HMI Module
HMI is a GUI program that is constructed from a window and represents an
HMI page plus several bars; the most important one is an HMI main bar and
navigational bar. HMI displays visually SCADA system on the screen, updates the
screen according to the current values, states and handles all operators’ inputs. For
complete plant visualizations the GUI must communicate efficiently with the plant
elements (stored in system database) by adding drivers and creating tags, tags are
objects that refer to memory location (address) typically found in PLC, once a tag
is defined it contains all the properties relevant to its status, this includes
information obtained from the channel/ driver and memory location. WinCC tags
allow graphics objects, trends, and alarms to be connected directly to relevant
process data. HMI pages are discussed below.
4.6.9.1 HMI Main Page
This is the first page that will be displayed when HMI is first executed, as
shown in Figure 4.1. This page can also be displayed using “Home” command in
the HMI Main bar. In this page allocation of all the 26 power generation stations
which are distributed all over the country is displayed, moreover a menu on the left
hand side of the main page lists the names of the 26 power generation stations, an
operator could choose the station that he want by double clicking either the icon on
the map or the station’s name on the menu list. There are also two buttons on the
left upper corner which enable the user to enter the sites either as a monitor i.e.
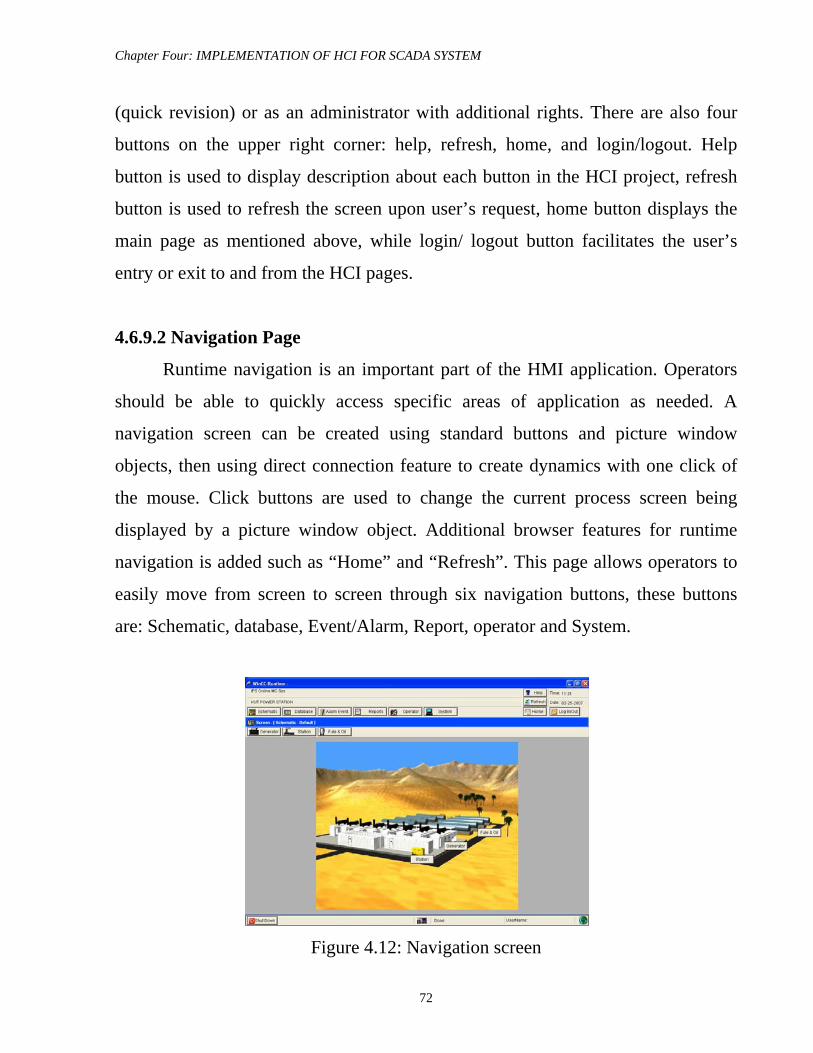
Chapter Four: IMPLEMENTATION OF HCI FOR SCADA SYSTEM
72
(quick revision) or as an administrator with additional rights. There are also four
buttons on the upper right corner: help, refresh, home, and login/logout. Help
button is used to display description about each button in the HCI project, refresh
button is used to refresh the screen upon user’s request, home button displays the
main page as mentioned above, while login/ logout button facilitates the user’s
entry or exit to and from the HCI pages.
4.6.9.2 Navigation Page
Runtime navigation is an important part of the HMI application. Operators
should be able to quickly access specific areas of application as needed. A
navigation screen can be created using standard buttons and picture window
objects, then using direct connection feature to create dynamics with one click of
the mouse. Click buttons are used to change the current process screen being
displayed by a picture window object. Additional browser features for runtime
navigation is added such as “Home” and “Refresh”. This page allows operators to
easily move from screen to screen through six navigation buttons, these buttons
are: Schematic, database, Event/Alarm, Report, operator and System.
Figure 4.12: Navigation screen
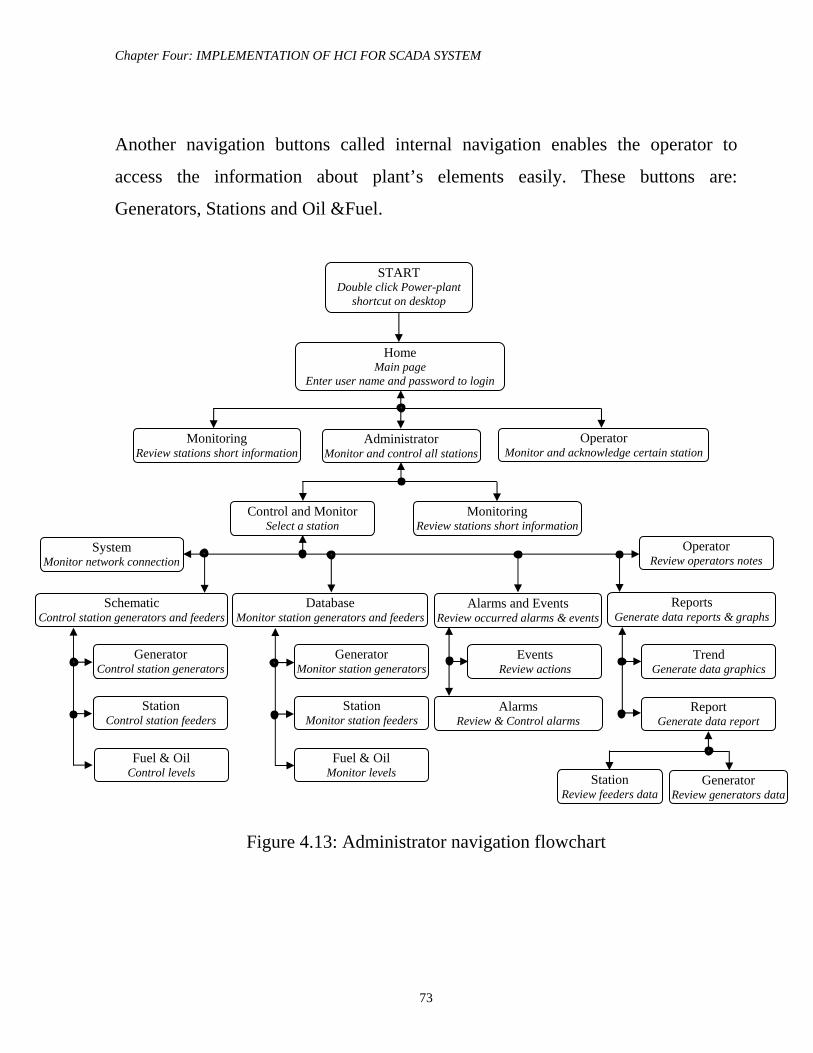
Chapter Four: IMPLEMENTATION OF HCI FOR SCADA SYSTEM
73
Another navigation buttons called internal navigation enables the operator to
access the information about plant’s elements easily. These buttons are:
Generators, Stations and Oil &Fuel.
Figure 4.13: Administrator navigation flowchart
START Double click Power-plant
shortcut on desktop
Monitoring Review stations short information
Administrator Monitor and control all stations
Operator Monitor and acknowledge certain station
Schematic Control station generators and feeders
Database Monitor station generators and feeders
Alarms and Events Review occurred alarms & events
Monitoring Review stations short information
Control and Monitor Select a station
Reports Generate data reports & graphs
Operator Review operators notes
Generator Monitor station generators
Station Monitor station feeders
Fuel & Oil Monitor levels
Generator Control station generators
Station Control station feeders
Fuel & Oil Control levels
Report Generate data report
Trend Generate data graphics
Generator Review generators data
Station Review feeders data
Events Review actions
Alarms Review & Control alarms
System Monitor network connection
Home Main page
Enter user name and password to login
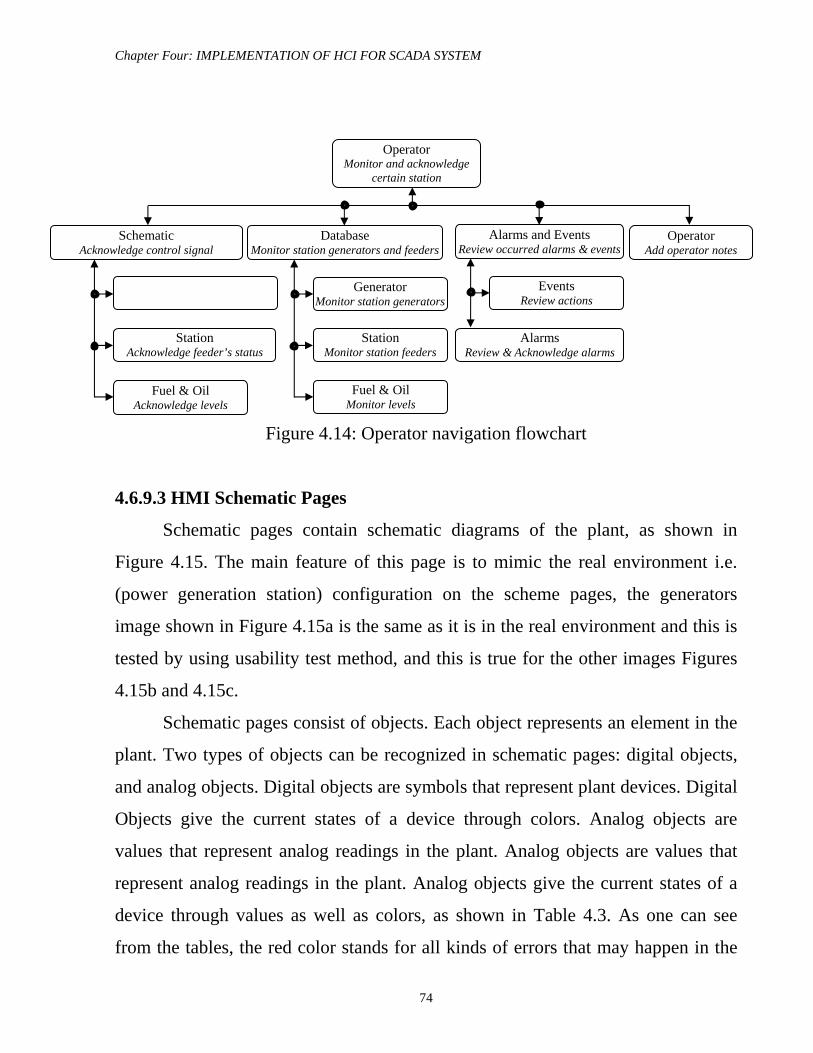
Chapter Four: IMPLEMENTATION OF HCI FOR SCADA SYSTEM
74
Figure 4.14: Operator navigation flowchart
4.6.9.3 HMI Schematic Pages
Schematic pages contain schematic diagrams of the plant, as shown in
Figure 4.15. The main feature of this page is to mimic the real environment i.e.
(power generation station) configuration on the scheme pages, the generators
image shown in Figure 4.15a is the same as it is in the real environment and this is
tested by using usability test method, and this is true for the other images Figures
4.15b and 4.15c.
Schematic pages consist of objects. Each object represents an element in the
plant. Two types of objects can be recognized in schematic pages: digital objects,
and analog objects. Digital objects are symbols that represent plant devices. Digital
Objects give the current states of a device through colors. Analog objects are
values that represent analog readings in the plant. Analog objects are values that
represent analog readings in the plant. Analog objects give the current states of a
device through values as well as colors, as shown in Table 4.3. As one can see
from the tables, the red color stands for all kinds of errors that may happen in the
Operator Monitor and acknowledge
certain station
Schematic Acknowledge control signal
Database Monitor station generators and feeders
Generator Monitor station generators
Station Monitor station feeders
Fuel & Oil Monitor levels
Station Acknowledge feeder’s status
Fuel & Oil Acknowledge levels
Operator Add operator notes
Alarms and Events Review occurred alarms & events
Events Review actions
Alarms Review & Acknowledge alarms
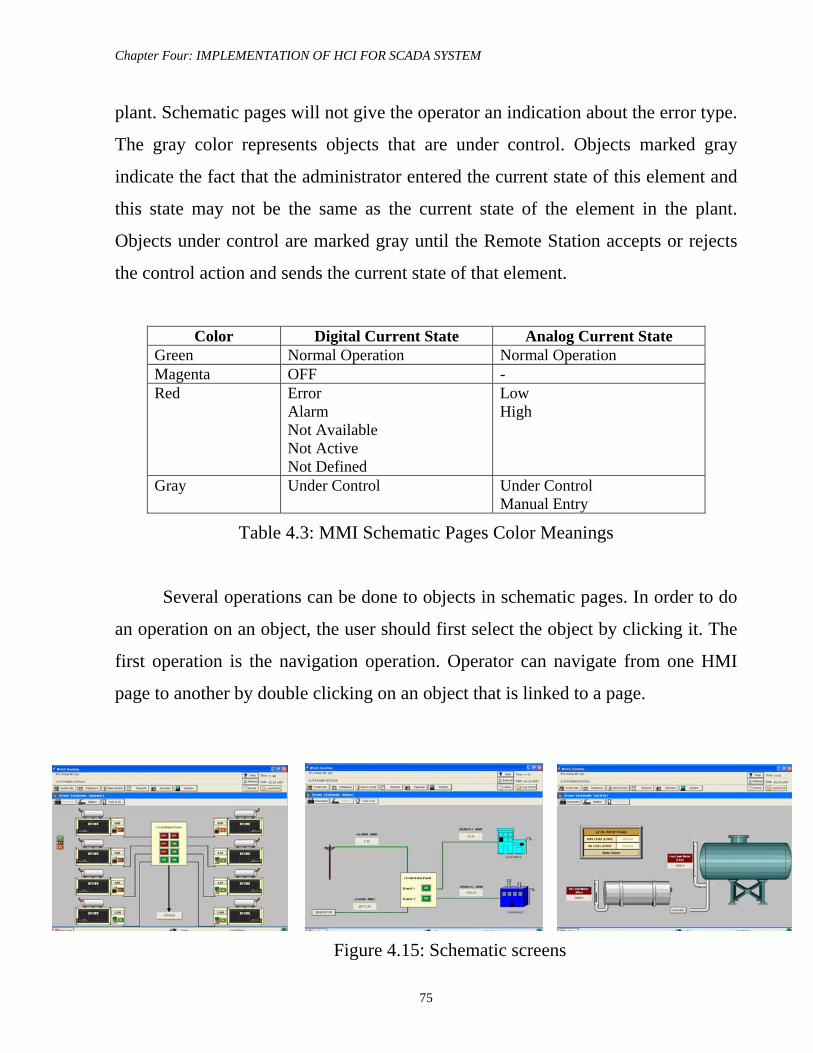
Chapter Four: IMPLEMENTATION OF HCI FOR SCADA SYSTEM
75
plant. Schematic pages will not give the operator an indication about the error type.
The gray color represents objects that are under control. Objects marked gray
indicate the fact that the administrator entered the current state of this element and
this state may not be the same as the current state of the element in the plant.
Objects under control are marked gray until the Remote Station accepts or rejects
the control action and sends the current state of that element.
Color Digital Current State Analog Current State
Green Normal Operation Normal Operation Magenta OFF - Red Error
Alarm Not Available Not Active Not Defined
Low High
Gray Under Control Under Control Manual Entry
Table 4.3: MMI Schematic Pages Color Meanings
Several operations can be done to objects in schematic pages. In order to do
an operation on an object, the user should first select the object by clicking it. The
first operation is the navigation operation. Operator can navigate from one HMI
page to another by double clicking on an object that is linked to a page.
Figure 4.15: Schematic screens
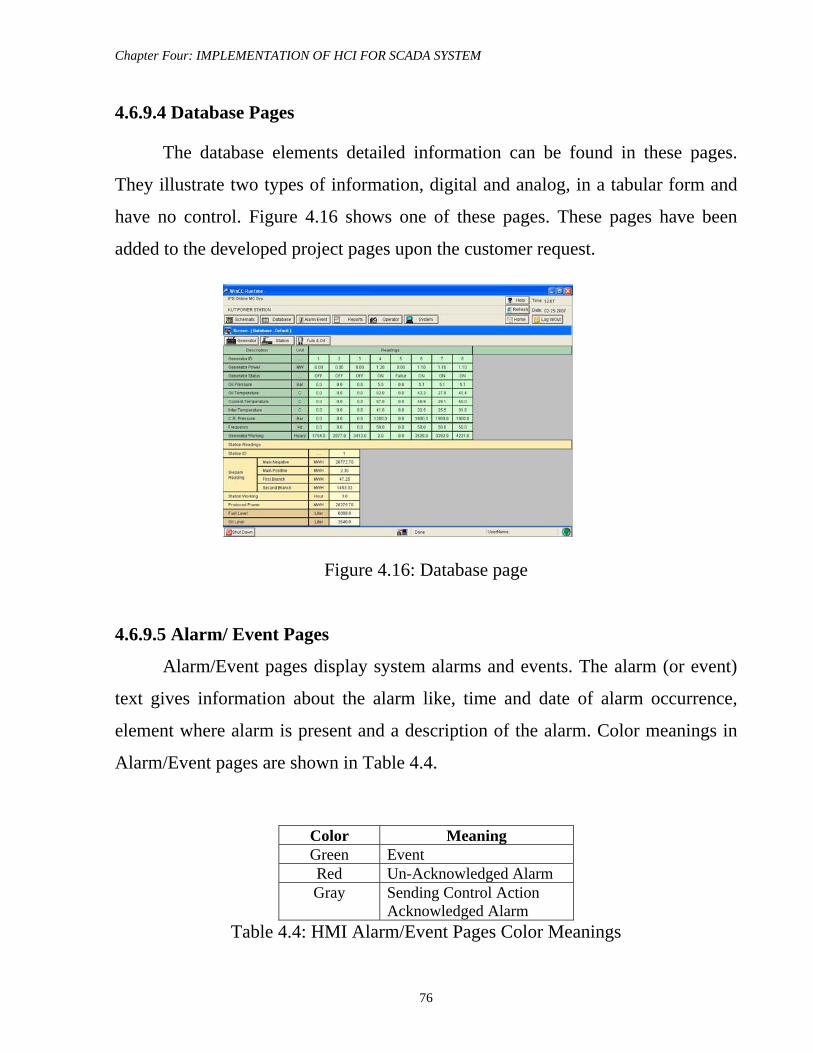
Chapter Four: IMPLEMENTATION OF HCI FOR SCADA SYSTEM
76
4.6.9.4 Database Pages
The database elements detailed information can be found in these pages.
They illustrate two types of information, digital and analog, in a tabular form and
have no control. Figure 4.16 shows one of these pages. These pages have been
added to the developed project pages upon the customer request.
Figure 4.16: Database page
4.6.9.5 Alarm/ Event Pages
Alarm/Event pages display system alarms and events. The alarm (or event)
text gives information about the alarm like, time and date of alarm occurrence,
element where alarm is present and a description of the alarm. Color meanings in
Alarm/Event pages are shown in Table 4.4.
Table 4.4: HMI Alarm/Event Pages Color Meanings
Color Meaning Green Event Red Un-Acknowledged Alarm Gray Sending Control Action
Acknowledged Alarm
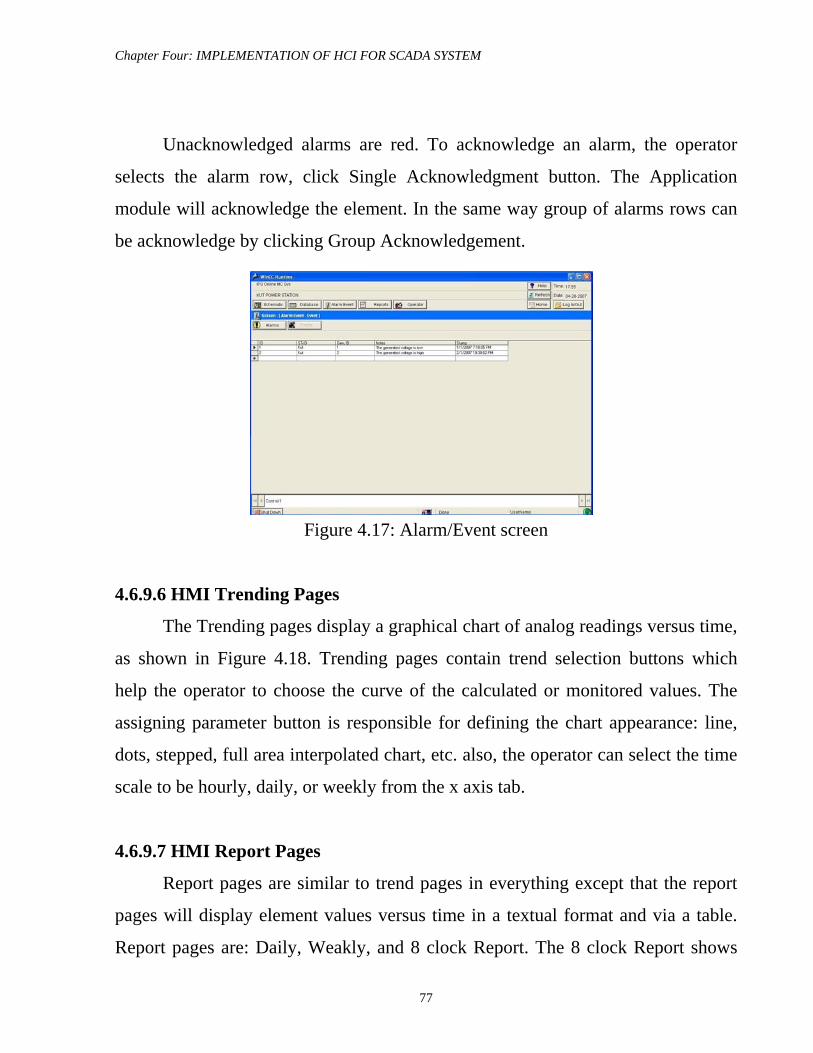
Chapter Four: IMPLEMENTATION OF HCI FOR SCADA SYSTEM
77
Unacknowledged alarms are red. To acknowledge an alarm, the operator
selects the alarm row, click Single Acknowledgment button. The Application
module will acknowledge the element. In the same way group of alarms rows can
be acknowledge by clicking Group Acknowledgement.
Figure 4.17: Alarm/Event screen
4.6.9.6 HMI Trending Pages
The Trending pages display a graphical chart of analog readings versus time,
as shown in Figure 4.18. Trending pages contain trend selection buttons which
help the operator to choose the curve of the calculated or monitored values. The
assigning parameter button is responsible for defining the chart appearance: line,
dots, stepped, full area interpolated chart, etc. also, the operator can select the time
scale to be hourly, daily, or weekly from the x axis tab.
4.6.9.7 HMI Report Pages
Report pages are similar to trend pages in everything except that the report
pages will display element values versus time in a textual format and via a table.
Report pages are: Daily, Weakly, and 8 clock Report. The 8 clock Report shows
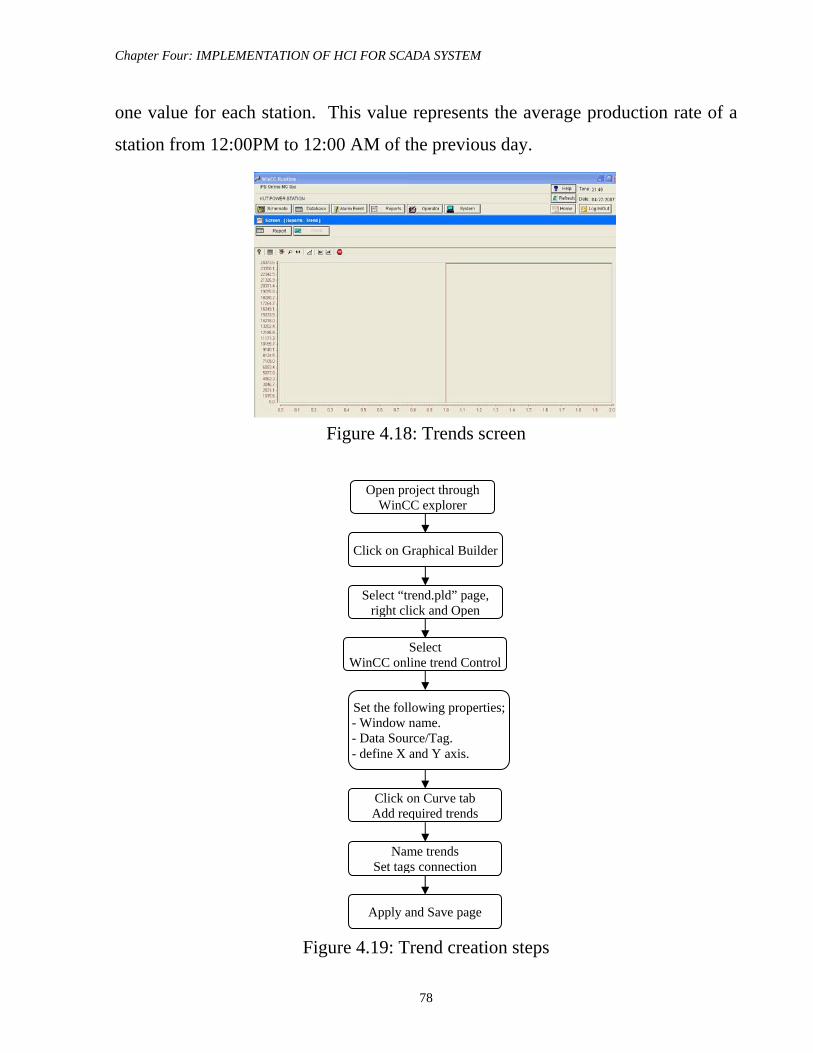
Chapter Four: IMPLEMENTATION OF HCI FOR SCADA SYSTEM
78
one value for each station. This value represents the average production rate of a
station from 12:00PM to 12:00 AM of the previous day.
Figure 4.18: Trends screen
Figure 4.19: Trend creation steps
Open project through WinCC explorer
Click on Graphical Builder
Select “trend.pld” page, right click and Open
Select WinCC online trend Control
Set the following properties;- Window name. - Data Source/Tag. - define X and Y axis.
Click on Curve tab Add required trends
Name trends Set tags connection
Apply and Save page
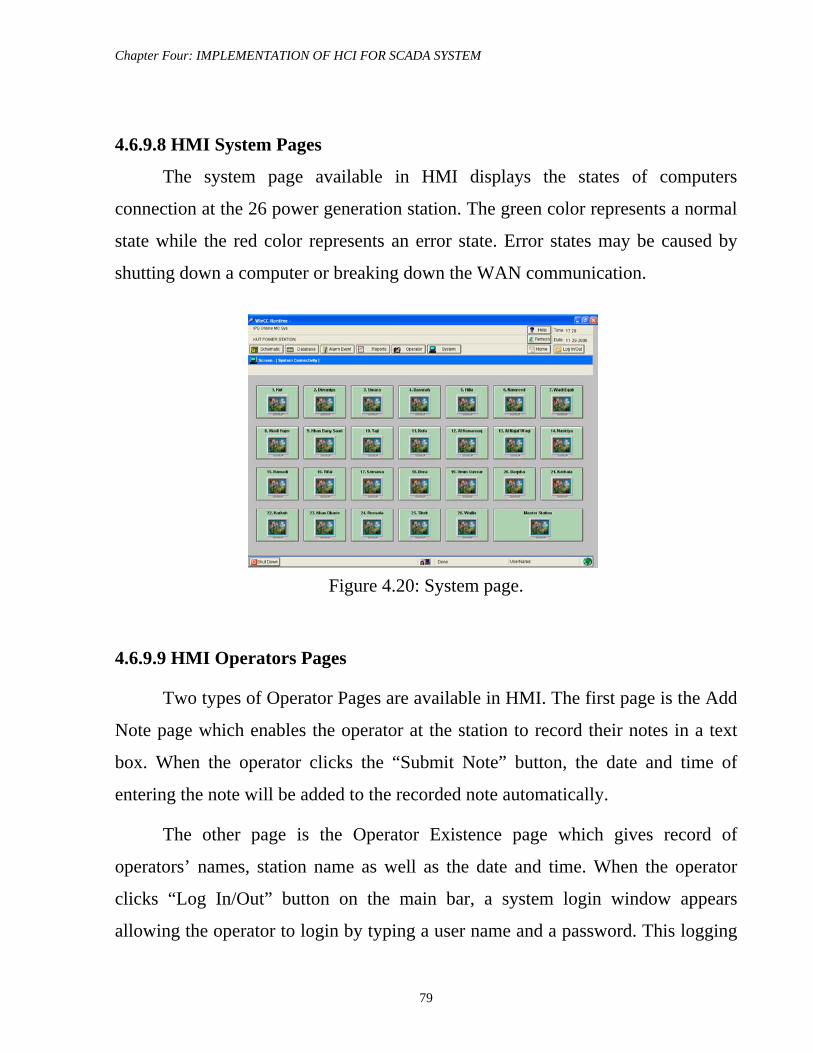
Chapter Four: IMPLEMENTATION OF HCI FOR SCADA SYSTEM
79
4.6.9.8 HMI System Pages
The system page available in HMI displays the states of computers
connection at the 26 power generation station. The green color represents a normal
state while the red color represents an error state. Error states may be caused by
shutting down a computer or breaking down the WAN communication.
Figure 4.20: System page.
4.6.9.9 HMI Operators Pages
Two types of Operator Pages are available in HMI. The first page is the Add
Note page which enables the operator at the station to record their notes in a text
box. When the operator clicks the “Submit Note” button, the date and time of
entering the note will be added to the recorded note automatically.
The other page is the Operator Existence page which gives record of
operators’ names, station name as well as the date and time. When the operator
clicks “Log In/Out” button on the main bar, a system login window appears
allowing the operator to login by typing a user name and a password. This logging
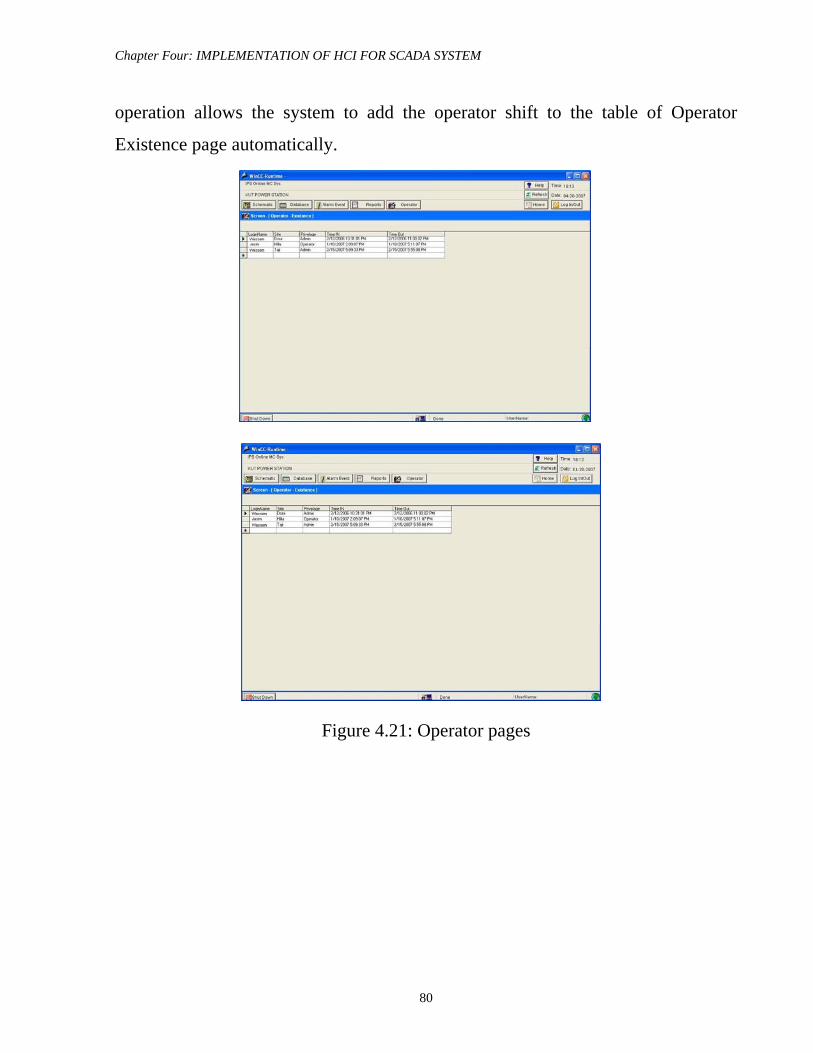
Chapter Four: IMPLEMENTATION OF HCI FOR SCADA SYSTEM
80
operation allows the system to add the operator shift to the table of Operator
Existence page automatically.
Figure 4.21: Operator pages

Chapter Five: HCI AND SCADA SYSTEM TEST
CHAPTER FIVE
HCI AND SCADA SYSTEM
TEST
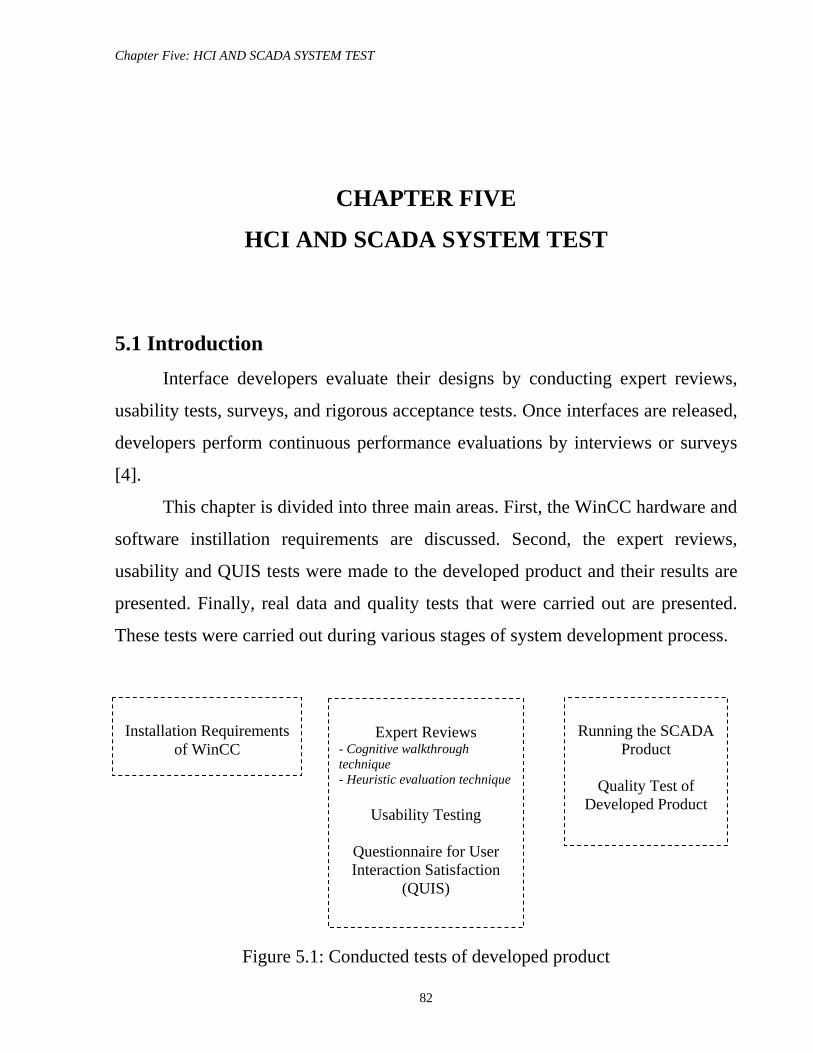
Chapter Five: HCI AND SCADA SYSTEM TEST
82
CHAPTER FIVE
HCI AND SCADA SYSTEM TEST
5.1 Introduction Interface developers evaluate their designs by conducting expert reviews,
usability tests, surveys, and rigorous acceptance tests. Once interfaces are released,
developers perform continuous performance evaluations by interviews or surveys
[4].
This chapter is divided into three main areas. First, the WinCC hardware and
software instillation requirements are discussed. Second, the expert reviews,
usability and QUIS tests were made to the developed product and their results are
presented. Finally, real data and quality tests that were carried out are presented.
These tests were carried out during various stages of system development process.
Figure 5.1: Conducted tests of developed product
Installation Requirements
of WinCC
Expert Reviews
- Cognitive walkthrough technique - Heuristic evaluation technique
Usability Testing
Questionnaire for User Interaction Satisfaction
(QUIS)
Running the SCADA
Product
Quality Test of Developed Product
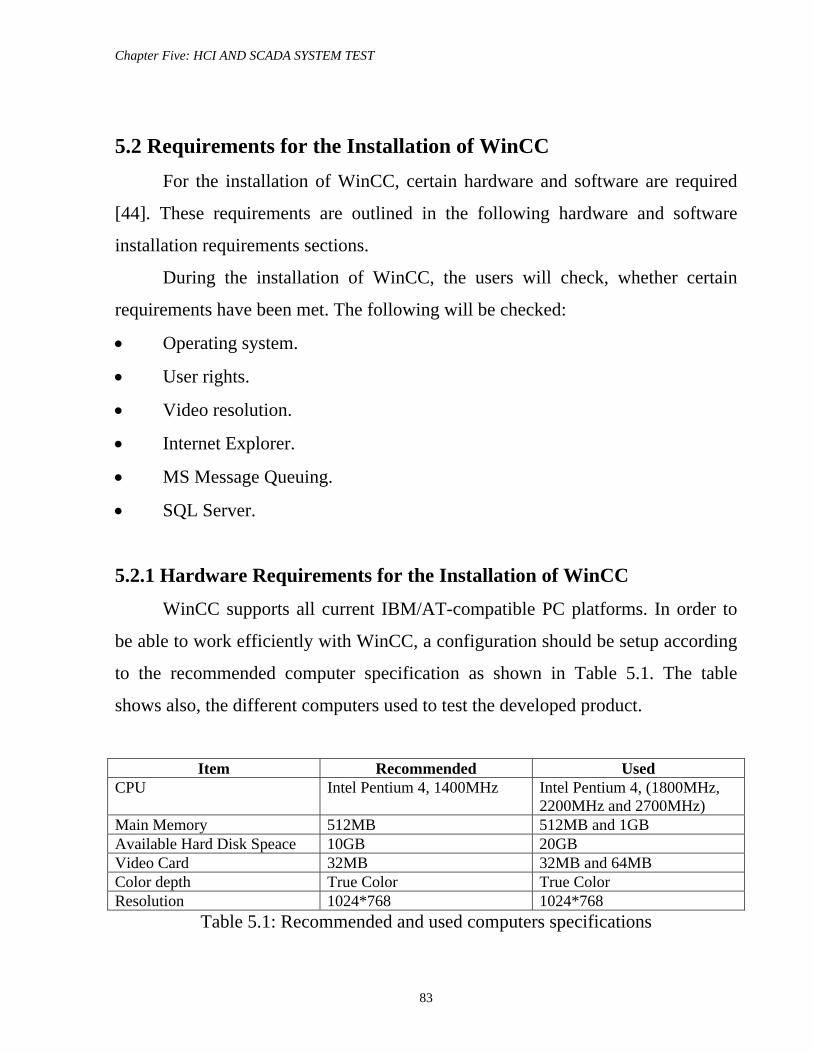
Chapter Five: HCI AND SCADA SYSTEM TEST
83
5.2 Requirements for the Installation of WinCC For the installation of WinCC, certain hardware and software are required
[44]. These requirements are outlined in the following hardware and software
installation requirements sections.
During the installation of WinCC, the users will check, whether certain
requirements have been met. The following will be checked:
• Operating system.
• User rights.
• Video resolution.
• Internet Explorer.
• MS Message Queuing.
• SQL Server.
5.2.1 Hardware Requirements for the Installation of WinCC
WinCC supports all current IBM/AT-compatible PC platforms. In order to
be able to work efficiently with WinCC, a configuration should be setup according
to the recommended computer specification as shown in Table 5.1. The table
shows also, the different computers used to test the developed product.
Item Recommended Used
CPU Intel Pentium 4, 1400MHz Intel Pentium 4, (1800MHz, 2200MHz and 2700MHz)
Main Memory 512MB 512MB and 1GB Available Hard Disk Speace 10GB 20GB Video Card 32MB 32MB and 64MB Color depth True Color True Color Resolution 1024*768 1024*768
Table 5.1: Recommended and used computers specifications
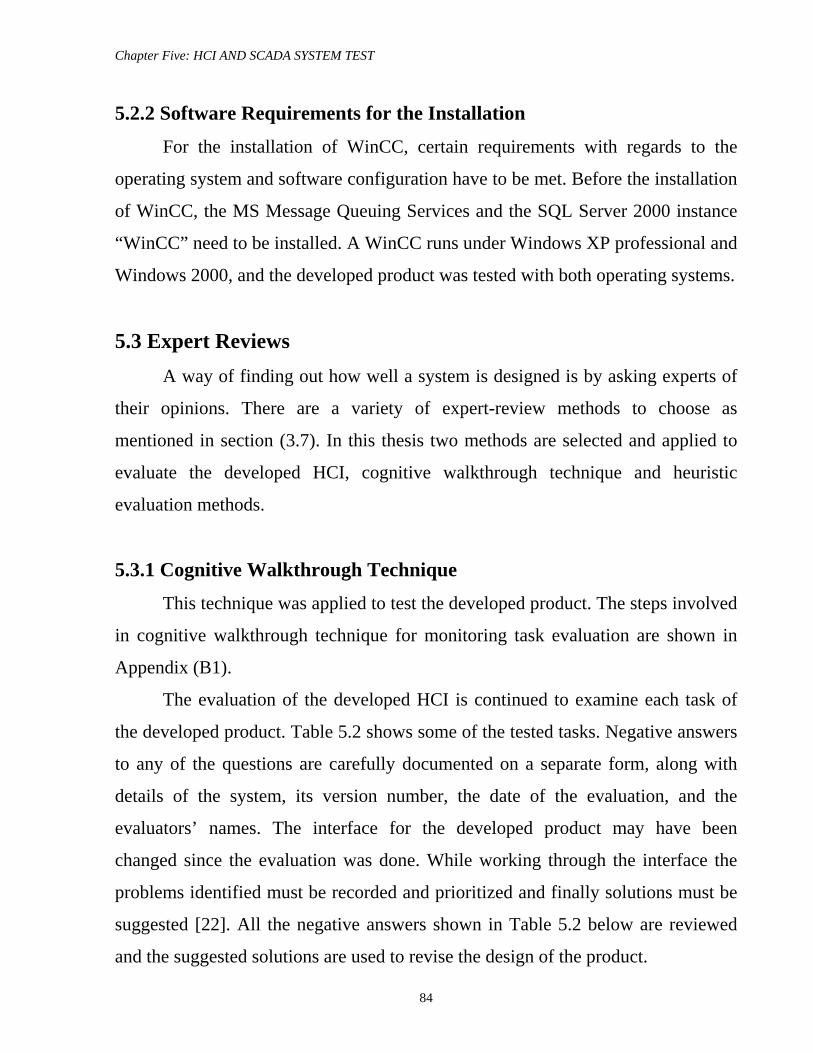
Chapter Five: HCI AND SCADA SYSTEM TEST
84
5.2.2 Software Requirements for the Installation
For the installation of WinCC, certain requirements with regards to the
operating system and software configuration have to be met. Before the installation
of WinCC, the MS Message Queuing Services and the SQL Server 2000 instance
“WinCC” need to be installed. A WinCC runs under Windows XP professional and
Windows 2000, and the developed product was tested with both operating systems.
5.3 Expert Reviews A way of finding out how well a system is designed is by asking experts of
their opinions. There are a variety of expert-review methods to choose as
mentioned in section (3.7). In this thesis two methods are selected and applied to
evaluate the developed HCI, cognitive walkthrough technique and heuristic
evaluation methods.
5.3.1 Cognitive Walkthrough Technique
This technique was applied to test the developed product. The steps involved
in cognitive walkthrough technique for monitoring task evaluation are shown in
Appendix (B1).
The evaluation of the developed HCI is continued to examine each task of
the developed product. Table 5.2 shows some of the tested tasks. Negative answers
to any of the questions are carefully documented on a separate form, along with
details of the system, its version number, the date of the evaluation, and the
evaluators’ names. The interface for the developed product may have been
changed since the evaluation was done. While working through the interface the
problems identified must be recorded and prioritized and finally solutions must be
suggested [22]. All the negative answers shown in Table 5.2 below are reviewed
and the suggested solutions are used to revise the design of the product.
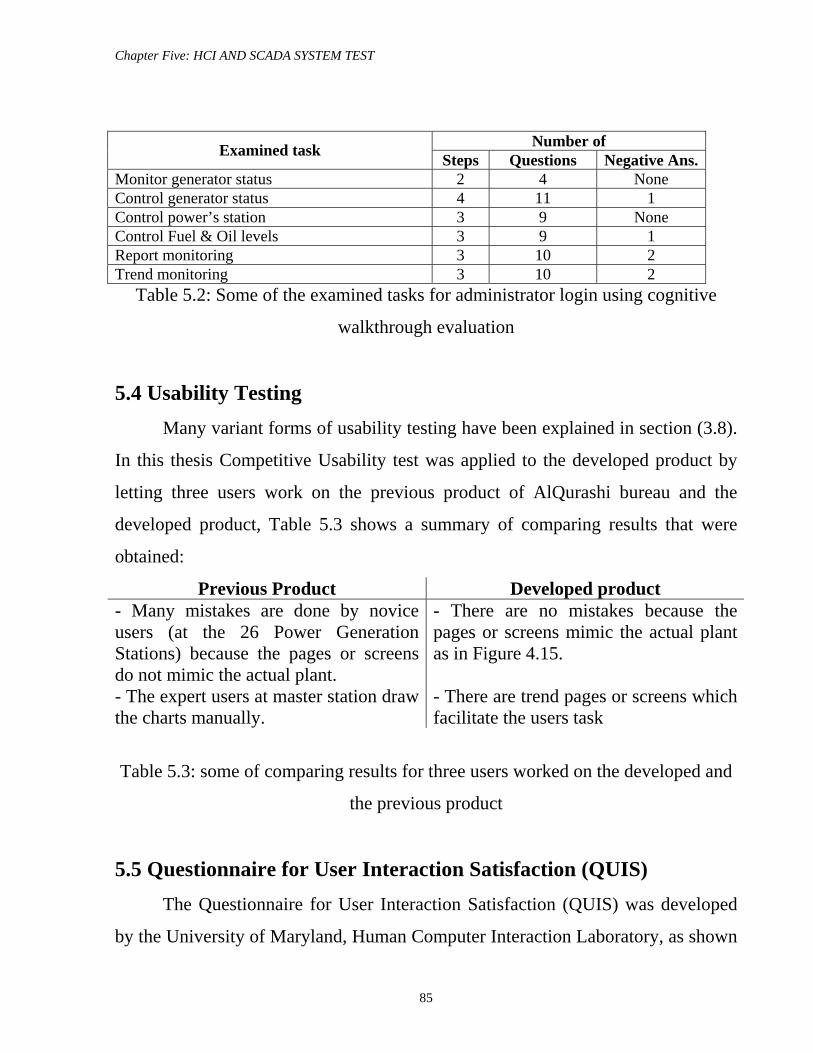
Chapter Five: HCI AND SCADA SYSTEM TEST
85
Number of Examined task Steps Questions Negative Ans.Monitor generator status 2 4 None Control generator status 4 11 1 Control power’s station 3 9 None Control Fuel & Oil levels 3 9 1 Report monitoring 3 10 2 Trend monitoring 3 10 2
Table 5.2: Some of the examined tasks for administrator login using cognitive
walkthrough evaluation
5.4 Usability Testing Many variant forms of usability testing have been explained in section (3.8).
In this thesis Competitive Usability test was applied to the developed product by
letting three users work on the previous product of AlQurashi bureau and the
developed product, Table 5.3 shows a summary of comparing results that were
obtained:
Previous Product Developed product - Many mistakes are done by novice users (at the 26 Power Generation Stations) because the pages or screens do not mimic the actual plant.
- There are no mistakes because the pages or screens mimic the actual plant as in Figure 4.15.
- The expert users at master station draw the charts manually.
- There are trend pages or screens which facilitate the users task
Table 5.3: some of comparing results for three users worked on the developed and
the previous product
5.5 Questionnaire for User Interaction Satisfaction (QUIS) The Questionnaire for User Interaction Satisfaction (QUIS) was developed
by the University of Maryland, Human Computer Interaction Laboratory, as shown
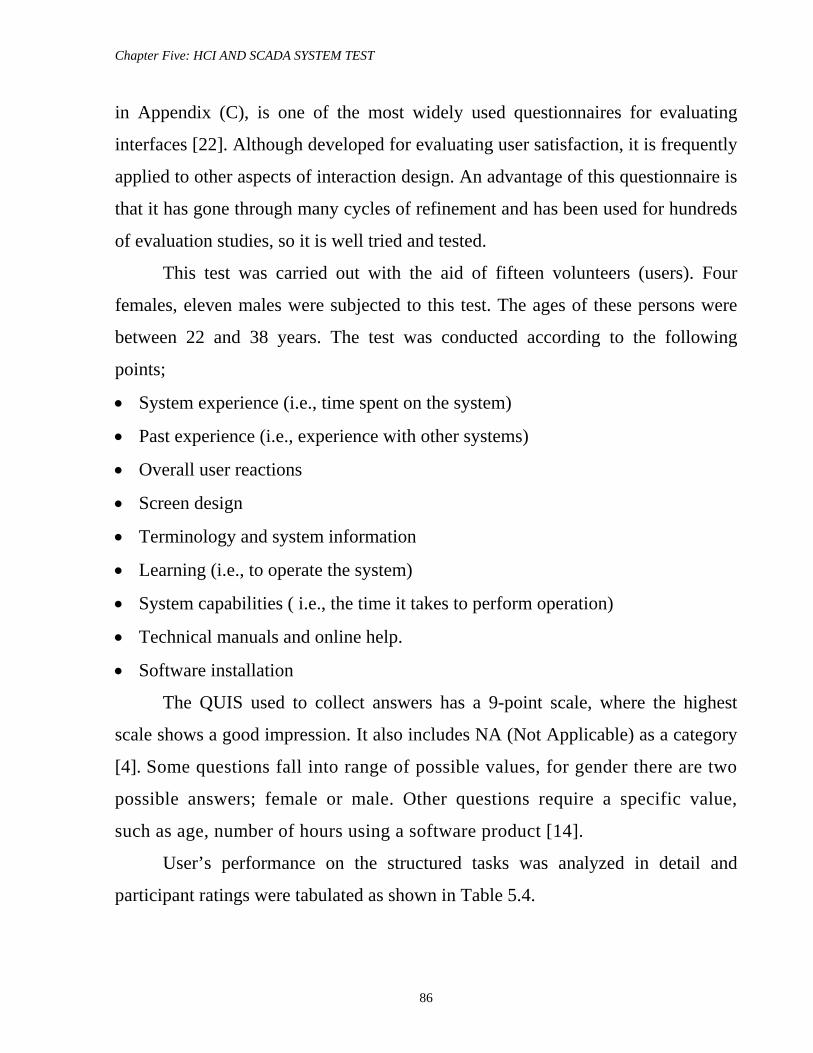
Chapter Five: HCI AND SCADA SYSTEM TEST
86
in Appendix (C), is one of the most widely used questionnaires for evaluating
interfaces [22]. Although developed for evaluating user satisfaction, it is frequently
applied to other aspects of interaction design. An advantage of this questionnaire is
that it has gone through many cycles of refinement and has been used for hundreds
of evaluation studies, so it is well tried and tested.
This test was carried out with the aid of fifteen volunteers (users). Four
females, eleven males were subjected to this test. The ages of these persons were
between 22 and 38 years. The test was conducted according to the following
points;
• System experience (i.e., time spent on the system)
• Past experience (i.e., experience with other systems)
• Overall user reactions
• Screen design
• Terminology and system information
• Learning (i.e., to operate the system)
• System capabilities ( i.e., the time it takes to perform operation)
• Technical manuals and online help.
• Software installation
The QUIS used to collect answers has a 9-point scale, where the highest
scale shows a good impression. It also includes NA (Not Applicable) as a category
[4]. Some questions fall into range of possible values, for gender there are two
possible answers; female or male. Other questions require a specific value,
such as age, number of hours using a software product [14].
User’s performance on the structured tasks was analyzed in detail and
participant ratings were tabulated as shown in Table 5.4.
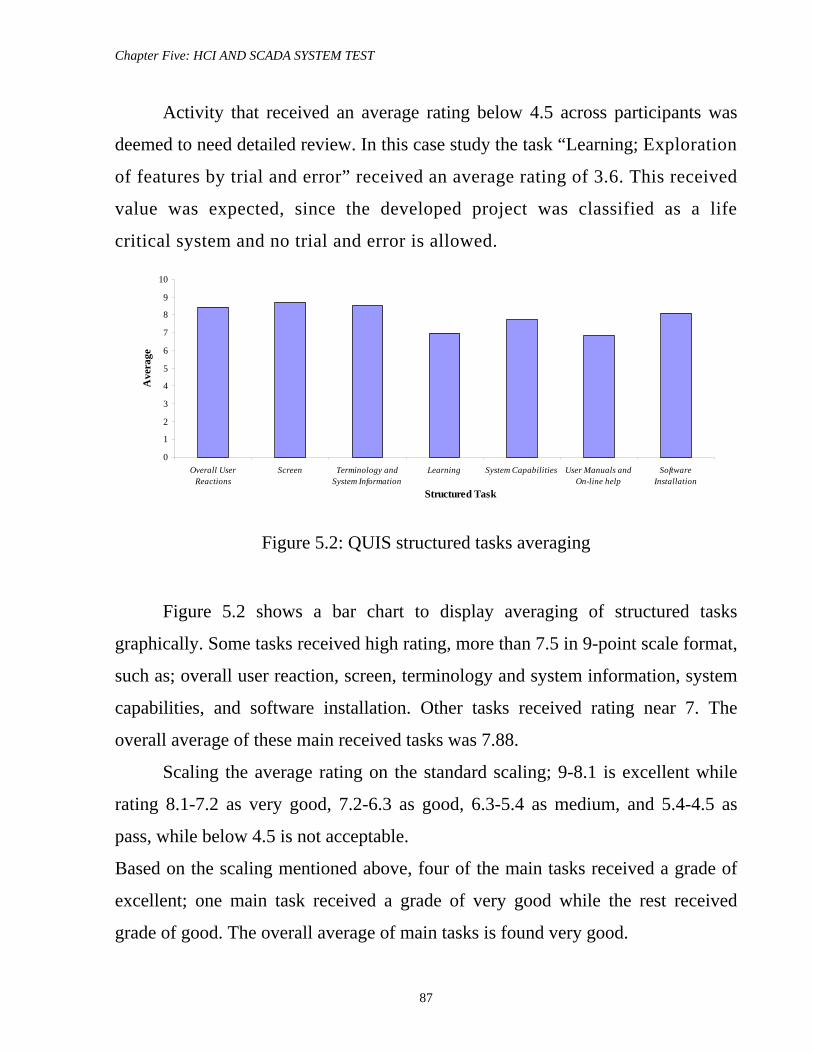
Chapter Five: HCI AND SCADA SYSTEM TEST
87
Activity that received an average rating below 4.5 across participants was
deemed to need detailed review. In this case study the task “Learning; Exploration
of features by trial and error” received an average rating of 3.6. This received
value was expected, since the developed project was classified as a life
critical system and no trial and error is allowed.
0
1
2
3
4
5
6
7
8
9
10
Overall UserReactions
Screen Terminology andSystem Information
Learning System Capabilities User Manuals andOn-line help
SoftwareInstallation
Structured Task
Ave
rage
Figure 5.2: QUIS structured tasks averaging
Figure 5.2 shows a bar chart to display averaging of structured tasks
graphically. Some tasks received high rating, more than 7.5 in 9-point scale format,
such as; overall user reaction, screen, terminology and system information, system
capabilities, and software installation. Other tasks received rating near 7. The
overall average of these main received tasks was 7.88.
Scaling the average rating on the standard scaling; 9-8.1 is excellent while
rating 8.1-7.2 as very good, 7.2-6.3 as good, 6.3-5.4 as medium, and 5.4-4.5 as
pass, while below 4.5 is not acceptable.
Based on the scaling mentioned above, four of the main tasks received a grade of
excellent; one main task received a grade of very good while the rest received
grade of good. The overall average of main tasks is found very good.
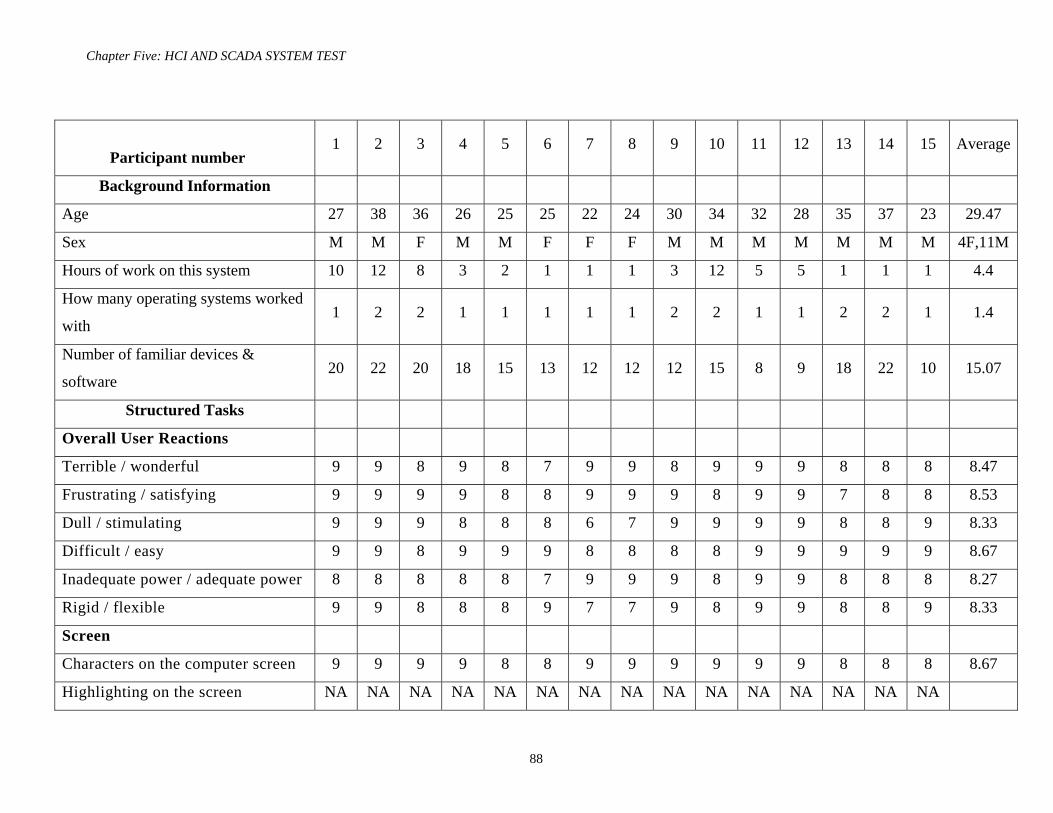
Chapter Five: HCI AND SCADA SYSTEM TEST
88
Participant number 1 2 3 4 5 6 7 8 9 10 11 12 13 14 15 Average
Background Information
Age 27 38 36 26 25 25 22 24 30 34 32 28 35 37 23 29.47
Sex M M F M M F F F M M M M M M M 4F,11M
Hours of work on this system 10 12 8 3 2 1 1 1 3 12 5 5 1 1 1 4.4
How many operating systems worked
with 1 2 2 1 1 1 1 1 2 2 1 1 2 2 1 1.4
Number of familiar devices &
software 20 22 20 18 15 13 12 12 12 15 8 9 18 22 10 15.07
Structured Tasks
Overall User Reactions
Terrible / wonderful 9 9 8 9 8 7 9 9 8 9 9 9 8 8 8 8.47
Frustrating / satisfying 9 9 9 9 8 8 9 9 9 8 9 9 7 8 8 8.53
Dull / stimulating 9 9 9 8 8 8 6 7 9 9 9 9 8 8 9 8.33
Difficult / easy 9 9 8 9 9 9 8 8 8 8 9 9 9 9 9 8.67
Inadequate power / adequate power 8 8 8 8 8 7 9 9 9 8 9 9 8 8 8 8.27
Rigid / flexible 9 9 8 8 8 9 7 7 9 8 9 9 8 8 9 8.33
Screen
Characters on the computer screen 9 9 9 9 8 8 9 9 9 9 9 9 8 8 8 8.67
Highlighting on the screen NA NA NA NA NA NA NA NA NA NA NA NA NA NA NA
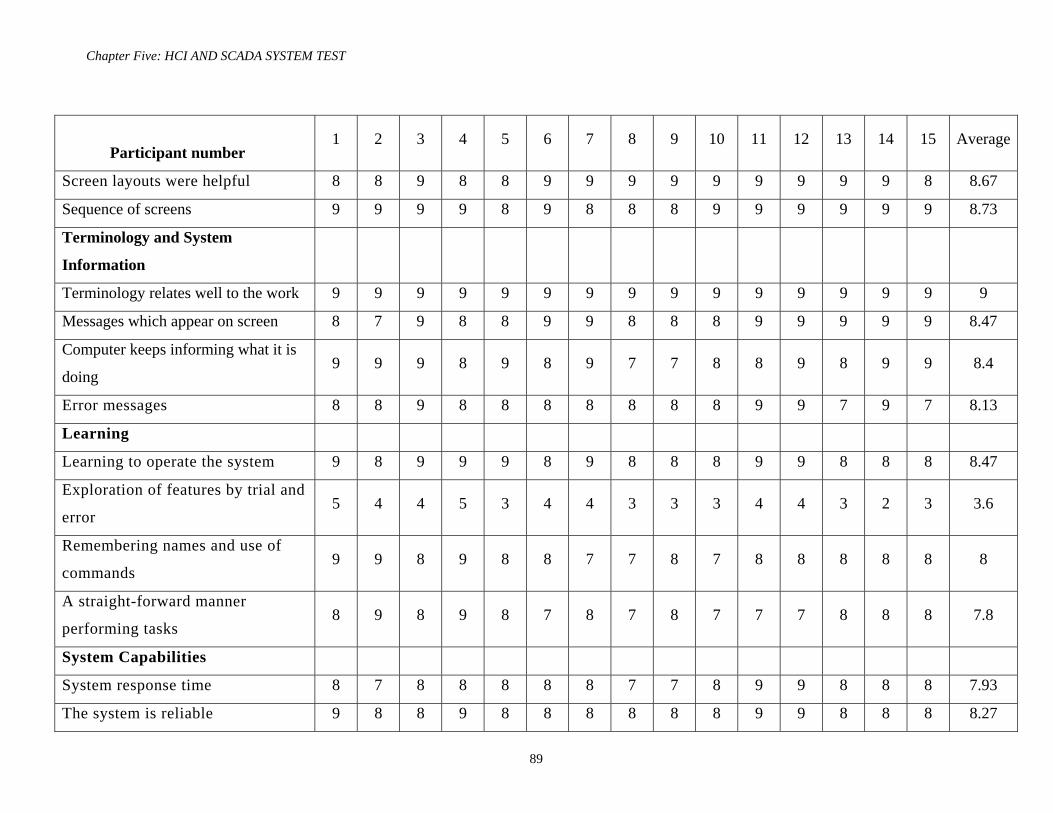
Chapter Five: HCI AND SCADA SYSTEM TEST
89
Participant number 1 2 3 4 5 6 7 8 9 10 11 12 13 14 15 Average
Screen layouts were helpful 8 8 9 8 8 9 9 9 9 9 9 9 9 9 8 8.67
Sequence of screens 9 9 9 9 8 9 8 8 8 9 9 9 9 9 9 8.73
Terminology and System
Information
Terminology relates well to the work 9 9 9 9 9 9 9 9 9 9 9 9 9 9 9 9
Messages which appear on screen 8 7 9 8 8 9 9 8 8 8 9 9 9 9 9 8.47
Computer keeps informing what it is
doing 9 9 9 8 9 8 9 7 7 8 8 9 8 9 9 8.4
Error messages 8 8 9 8 8 8 8 8 8 8 9 9 7 9 7 8.13
Learning
Learning to operate the system 9 8 9 9 9 8 9 8 8 8 9 9 8 8 8 8.47
Exploration of features by trial and
error 5 4 4 5 3 4 4 3 3 3 4 4 3 2 3 3.6
Remembering names and use of
commands 9 9 8 9 8 8 7 7 8 7 8 8 8 8 8 8
A straight-forward manner
performing tasks 8 9 8 9 8 7 8 7 8 7 7 7 8 8 8 7.8
System Capabilities
System response time 8 7 8 8 8 8 8 7 7 8 9 9 8 8 8 7.93
The system is reliable 9 8 8 9 8 8 8 8 8 8 9 9 8 8 8 8.27
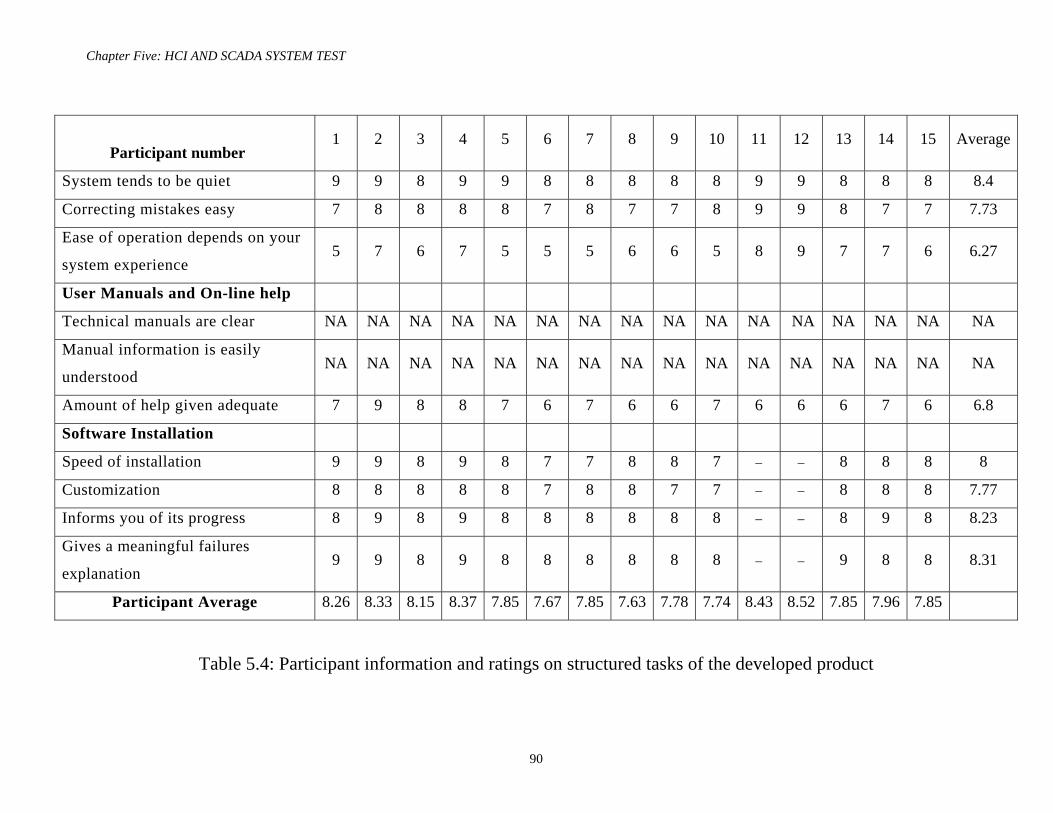
Chapter Five: HCI AND SCADA SYSTEM TEST
90
Participant number 1 2 3 4 5 6 7 8 9 10 11 12 13 14 15 Average
System tends to be quiet 9 9 8 9 9 8 8 8 8 8 9 9 8 8 8 8.4
Correcting mistakes easy 7 8 8 8 8 7 8 7 7 8 9 9 8 7 7 7.73
Ease of operation depends on your
system experience 5 7 6 7 5 5 5 6 6 5 8 9 7 7 6 6.27
User Manuals and On-line help
Technical manuals are clear NA NA NA NA NA NA NA NA NA NA NA NA NA NA NA NA
Manual information is easily
understood NA NA NA NA NA NA NA NA NA NA NA NA NA NA NA NA
Amount of help given adequate 7 9 8 8 7 6 7 6 6 7 6 6 6 7 6 6.8
Software Installation
Speed of installation 9 9 8 9 8 7 7 8 8 7 − − 8 8 8 8
Customization 8 8 8 8 8 7 8 8 7 7 − − 8 8 8 7.77
Informs you of its progress 8 9 8 9 8 8 8 8 8 8 − − 8 9 8 8.23
Gives a meaningful failures
explanation 9 9 8 9 8 8 8 8 8 8 − − 9 8 8 8.31
Participant Average 8.26 8.33 8.15 8.37 7.85 7.67 7.85 7.63 7.78 7.74 8.43 8.52 7.85 7.96 7.85
Table 5.4: Participant information and ratings on structured tasks of the developed product
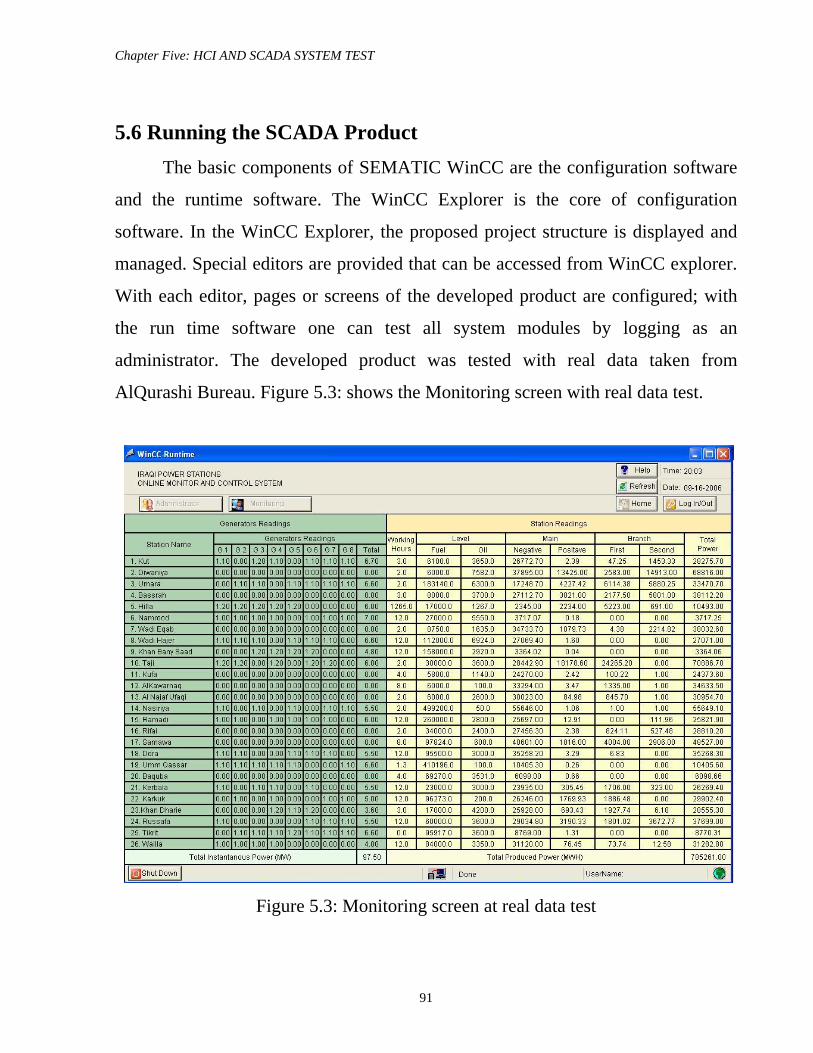
Chapter Five: HCI AND SCADA SYSTEM TEST
91
5.6 Running the SCADA Product The basic components of SEMATIC WinCC are the configuration software
and the runtime software. The WinCC Explorer is the core of configuration
software. In the WinCC Explorer, the proposed project structure is displayed and
managed. Special editors are provided that can be accessed from WinCC explorer.
With each editor, pages or screens of the developed product are configured; with
the run time software one can test all system modules by logging as an
administrator. The developed product was tested with real data taken from
AlQurashi Bureau. Figure 5.3: shows the Monitoring screen with real data test.
Figure 5.3: Monitoring screen at real data test
Chapter Five: HCI AND SCADA SYSTEM TEST
92
The developed product also has the ability to test one module separately as
the steps shown below:
- Run the graphic designer editor, and open the module default page.
- Click on Activate Runtime button located on file menu.
5.7 Developed Product Quality Test The developed SCADA modules were tested to see their general behavior.
The results of the test are as follows:
• The SCADA modules agree with their requirements.
• The SCADA modules are almost error-free.
• The quality of the final HCI software is enhanced significantly due to advanced
SEMANTIC WinCC features, developed by Siemens, such as:
- SEMATIC WinCC consists of four major subsystems (the graphic system,
the alarm system, the archiving system, and the report system).
- WinCC applications can support the visualization, control, and data
management needs of the plant. WinCC’s graphic libraries and wizards
make developing machine control applications a breeze.
- WinCC’s networking capabilities provide instant access to the application
from any location, making WinCC ideal for remote applications.
These WinCC advanced features enhanced the developed project through
enhancing the following factors;
• Modularity: The developed project was created using the four WinCC
subsystems.
Chapter Five: HCI AND SCADA SYSTEM TEST
93
• Expandability: Since the HCI modules are almost independent of each other,
expanding each module to support enhanced features will not have effect on
other modules, leading to increase HCI expandability.
• Modifiability: The interface developed by the SIMANTIC WinCC can be
modified easily.
• Understandability: Understanding completely separated modules are easier than
understanding one huge module.
• Attractiveness: The WinCC Graphical Designer library objects and icon images
are aesthetically pleasing.
• Prevention: The developed product provides some prevention by “graying out”
certain menu. In addition the product supports error handling.
• Structure guidance: the developed product provides button information help,
which explains the buttons functions.
• Rapid prototype to support expert-review and usability- testing processes: The
WinCC graphic designer facilitates rapid prototyping of user interface, since the
designer can try several alternative solutions within a short time. In addition,
the users can give their suggestions about the final product from the early stages
of software life cycle.

CHAPTER SIX
CONCLUSIONS AND SUGGESTIONS FOR FUTURE WORK
Chapter Six: CONCLUSIONS AND SUGGESTION FOR FUTURE WORK
95
CHAPTER SIX
CONCLUSIONS AND SUGGESTIONS FOR FUTURE
WORK
6.1 Conclusions
In this thesis, an attempt is made to study strategies for designing an
effective human computer interaction (HCI). A number of conclusions have
been drawn from this study. These include:
• There are three pillars for successful user-interface development: (i)
guidelines documents and processes; (ii) user’s interface software tools; and
(iii) expert review and usability testing (Figure 2.1). These pillars can help
user interface architects to turn good ideas into successful systems. They are
not guaranteed to work, but experience has shown that each pillar can
produce an order-of-magnitude speedup in the process and can facilitate the
creation of excellent systems.
• Guidelines documents usually record best practices, and are derived from
practical experience or empirical studies with appropriate example, whereas,
principles tend to be more fundamental, widely applicable, and enduring.
However they also tend to need more clarification.
• Both design principles and guidelines emerge from practical experience and
empirical studies. Designers can benefit from reviewing available guidelines
documents before constructing local versions.
Chapter Six: CONCLUSIONS AND SUGGESTION FOR FUTURE WORK
96
• In addition to recording organizational policy, a “guidelines document”
supports consistency, aids the application of tools for user-interface building,
and facilitates training of new designers. It also records results of practice
and experimental testing, and stimulates discussion of user-interface issues.
• Determining user’s skill is one of the most important HCI design principles.
In this thesis, users are classified into novice (or first time) and expert (or
frequent) users, and the basic strategies used -in this thesis- are such that
they permit a multi-layer (sometimes called level-structured or spiral)
approach.
• Bringing usability into the design process is the aim of interaction design. In
essence, it is about developing interactive products that are easy, effective,
and enjoyable to use from the user’s perspective.
• Effective human computer interaction design is multidisciplinary, involving
many inputs from wide reaching disciplines and fields.
• Development methodologies such as LUCID or contextual design (designing
systems with the user in mind) help by offering validated processes with
predictable schedules and meaningful deliverables and hence support
usability.
• Although user interface management system (UIMS) provides increased
support, it also has some constrains.
• Most testing methods will account appropriately for normal usage, but
performance in unpredictable situations with high levels of input is
extremely difficult to test.
• Evaluation is a continuous process, and should occur (i) during the entire
system development process; (ii) after the system is finished; and (iii) during
the period the system is actually used.
Chapter Six: CONCLUSIONS AND SUGGESTION FOR FUTURE WORK
97
• Schedules often dictate when the evaluation ends. Otherwise, evaluation
should be ended when similar patterns of behavior being repeated and no
new things emerging or nothing new to learn.
6.2 Future work • The use of a Web technology feature of the Sematic Win CC software tool
developed by Siemens in the developed project. This will help in supporting
portability, opening the system architecture, utilizing open standards and
protocol such as internet protocol (IP).
• Improving the on-line help of the developed product. This can be achieved
by clear writing, easy understood and helpful technical manual.
• The user interface during active use should be evaluated. This can be
facilitated by interviews or surveys, or by logging users’ performance in a
way that respect their privacy.
• Evaluation and critiquing software tools should be used to capture the
numbers of displays, widgets, or links between displays and users’ patterns
of activity.
REFERENCES
99
REFERENCES
[1] Afrah Thamir Ali,”An Enhanced Approach for Human Computer
Interface”, M Sc. Thesis, Control and Systems Engineering Department,
University of Technology, 2006.
[2] AlQuraishi Bureau, “Communication System and Database”, Technical
Report, Iraq, 2005.
[3] Baumeister, L.,John, B.E., and Byrne,M., “A Comparisons of Tools for
Building GOMS Models” , Pro.CHI 2000 Conference: Human Factors in
Computing Systems, ACM Press, New York (2000).
[4] Ben Shneiderman, Catherine Plaisant,” Designing the User Interface:
Strategies for effective Human Interactive”, Addison Wesley, fourth
edition, 2005.
[5] Ben Shneiderman, “Universal Usability”, Communications of ACM,
May, Vol.43, No.5, 2000.
[6] Ben Shneiderman, “Promoting Universal Usability with Multi Layer
Interface Design”, ACM, 2003.
[7] Benjamin A.C. Forsyth; “Intelligent Support of Interactive Manual
Control: Design, Implement and Evaluation of look- Ahead Haptic
Guidance”; M Sc. Thesis, Computer Science Department, British
Colombia University, 2004.
[8] Bevan, N., “International Standards for HCI and Usability”, International
Journal of Human-Computer Studies, 2001.
[9] Bin Qiu, Hoay Beng Gooi, Yiluliu, Eng Kiat Chan, “Internet Based
SCADA Display System”, IEEE Computer Applications in Power, 2001.
100
[10] Blackmon, M.H., Polson, P.G., Kitajima, M., and Lewis, C., “Design
Methods: Cognitive walkthrough for the web”, Proc. CHI2002: Human
Factors in Computing Systems, ACM, NY, 2002.
[11] Diam and Help, “A Graphical User Interface Framework for Human
Computer Collaboration”, Mistubishi Electric research Laboratories, Inc.,
2004.
[12] Donald A. Norman, “Things that Make us Smart: Defining Human
Attributes in The Age of the Machine”, A William Patrick Book, 1993.
[13] Donald A. Norman” The Design of Everyday Things”, Basic Books,
2002.
[14] Dov Te’eni, Jane Carey, Ping Zhang, “Human Computer Interaction:
Developing Effective Organizational Information Systems”, John Wiley
& Sons, Inc., 2006.
[15] Dourish, Paul, Where the Action Is: The foundation of Embodied
Interaction, MIT Press, Cambridge, MA (2001).
[16] Galitz, Wilbert O., “The Essential Guide to User Interface Design: An
Introduction to GUI Design Principles and Techniques”, Second Edition,
John Wiley & Sons, New York 2003.
[17] Giovanni Guida, Gianfrance Lamperti,” AMMENTH: A Methodology
for Requirements Analysis of Advanced Human System Interfaces”, IEEE
Trans.Vol.30, No.3, May 2000.
[18] Giulio Mori, Fabio Paterno’, Carmen Santoro, “Design and
Development of Multi-device User Interfaces through Multiple Logical
Description”, IEEE Computer Society, 2004.
[19] Greenbaum, Joan and Kyng, Morten, “Design at Work: Cooperative
Design of Computer Systems”, Lawwrenc Erlbaum Associates, Hillsdale,
NJ, 1991.
101
[20] Hadeel Abdul-Ammeer,” Design and Implementation of Human
Computer Interface for Real Time Control System”, M Sc. Thesis,
College of Engineering, University of Baghdad, 2000.
[21] “IEEE Guide for Instrumentation and Control Equipment Grounding in
Generating Stations”, IEEE Power Generating Society, 2004.
[22] Jennifer Preece, Yvonne Rogers, Helen Sharp, “Interaction Design:
beyond human computer interaction”, John Wiley & Sons, Inc. 2002.
[23] Jeremy R.Cooper Stock,” Integrating Communication with interaction:
Computer Vision Challenges for Interactive and Intelligent
Environments”, IEEE 2005.
[24] Jonthan Grudin,” Three faces of Human Computer Interaction”,
Annuals of the History of Computing IEE, 2005.
[25] Koyani, Sanjay J., Bailey, Robert W., Nall, Janice R., and others,
“Research-based Web Design & Usability Guidelines”, Dept of Health &
Human Services, National Institutes of Health 03-5424, National Cancer
Institute, Washington, DC, September, 2003. http://www.usability.gov.
[26] Keahey K., Pappa M.E., Peng Q., Schissel D., Abla G., Araki T.,
Burruss J., Febush E., Lane P., Klasky S., Leggett T., Mccune D.,
Randerson L.,” Grids for Experimental Science: The Virtual Control
Room”‘ Proceedings of the Second International Workshop on challenges
of Large Applications in Distributed Environments IEEE,2004.
[27] Kwang Y. Lee, Mark Perakis, Donald R. Sevcik, N. Iwan Santoso,
Gerhard K. Lausterero,Taria Samad,”Intelligent Distributed Simulation
and Control of Plants”, IEEE Trans. of Energy Conversion,Vol,15No.1,
March, 2000.
[28] Luque J., Escudero J.I., Rodri’guez J.A., Romero M.C.,” IDOLO:
Multimedia Data Deployment on SCADA Systems”, IEEE, 2004.
102
[29]Len Bass, Erik Hardy, Kurt Hoyt, M.Reed Litlle, Jr. Robert Seacord, “
Introduction to the Serpent User Interface Management System”,
Software Engineering Institute, Carnage Mellon University, Pittsburgh,
Pennsylvania, Technical Report, March 1988.
[30] Lukbas Tan, Ken.Taylor, “Mobile SCADA with thin clients- a web
demonstration”, ICITA, 2002.
[31] Mahajan, Rohit and Shniederman, Ben, Visual and Textual Consistency
Checking Tools for Graphical User Interfaces, IEEE Transaction on
Software Engineering, 23, 11 (November 1997).
[32] Michael P. Ward “An Architectural Framework for Describing
Supervisory Control and Data Acquisition (SCADA) Systems” M Sc.
Thesis, Computer Science Department, Naval Postgraduate School, 2004
[33] Mitsuya Kato, Katsufumi Watahiki, Tatsuyuki Suzuki,” Integration of
Supervisory Control and Data Acquisition Systems Connected to Wide
Area Networks”, Hitachi Review Vol.53 (2004), No.3.
[34] Mohammad Dastbaz, “ Designing Interactive Multimedia System”,
McGraw-Hill, 2002.
[35] Myers, Brad A., Hudson, Scott E., and Pausch, Randy, “Past, Present
and future of User interface Software Tools”, ACM Transaction on
Computer-Human Interaction, 2000.
[36] NCS Technical Information Bulletin 04-1,” Supervisory Control and
Data Acquisition (SCADA) Systems, National Communications System,
2004.
[37] Nielsen, Jakob, “Usability Engineering”, Academic Press, NY, 1993.
[38] Olsen, Jr., Dan R., “User Interface Management Systems: Models and
Algrithims”, Morgan Kaufmann Publishers, CA, 1991.
103
[39] Pew, R.W. and Gluck, K.A.(Editors), Modeling Human Behavior with
Integrated Cognitive Architectures: Comparison, Evaluation and
Validation, Lawrence Erlbaum Associates, Mahwah, NJ(2004).
[40] Rajib Mall,”Fundemantals of Software Engineering “; Prentice Hall of
India, 1st Edition, 2003.
[41] Roland L. Boring, Jacqes Hugo, Christain M.Richard, Donald
D.Dudenhoeffer,”SIG-The Role of Human Computer Interaction in Next
Generation Control Rooms”, CHI 2005.
[42] Scott Bricker, Turan Gonan, Len Rubin,” Substation Automation
Technologies and Advantages”, IEEE 2001
[43] SEDMO LTD, “Operation Manual”, 2000
[44] Siemens AG, “Simatic WinCC Ver.6, Step by Step Guide”, 2003
[45] Silberschatz, Korth, Sudarshan,” Database system concept”, McGraw-
Hill, Fifth Edition, 2006
[46]Sidney L.Smith,” Standards versus Guidelines for Designing User
Interface Software”, Journal of Behavior and Information Technology,
Taylor and Francis, Ltd. 1986.
[47] Stephen R. Schach, ”Introduction to Object Oriented Analysis and
Design”, Mc Graw. Hill, 2004.
[48] Suyeong Kim, “Theory of Human Intervention and Design of Human
Computer Interfaces in Supervisory Control: Application to Traffic
Incident Management” Ph.D. Thesis, Mechanical Engineering
Department, Massachusetts Institute of Technology.1997.
[49] Szekely, Pedro, “Retrospective and Challenges for Model-Base
Interface Development”, Proc. Second International Workshop on
Computer-Aided Design of User Interfaces, Belgium, 1996.
104
[50] Thomas K. Landauer,” Research Methods in Human Computer
Interaction”, Elsevier Science Publishers B.V. 1988.
[51] Xavier Ferre’, Natalia juristo, Helmut Windl ,Larry Contantine,”
Usability Basics for Software Developers”, IEEE Software,2001.
[52] Waleed Khalid, “A Man-Machine Interaction Package for Real-Time
Distributed System”, M.Sc. Thesis, University of Baghdad, 1997.
[53] Wharton, Cathleen, Rieman, John, Lewis, Clayton, and Polson, Peter,
“The Cognitive Walkthrough Method: A Practitioner’s Guide”, John
Wiley and Sons, NY, 1994.
APPENDIX A
SCADA SYSTEM FUNCTIONS
A-1
APPENDIX A
SCADA SYSTEM FUNCTIONS
• Data Receiving
SCADA Master Station Software should be able to receive data from the
Remote Station.
• Data Transmission
SCADA Master Station Software should be able to send control actions done
by the operator to the Remote Station.
• Data Processing
SCADA Master Station Software should be able to identify data, normalize
data, convert data format, and do all necessary data calculation on data being
sent/received to/from the Remote Station.
• Alarm Processing
SCADA Master Station Software should be able to detect system changes
and identify abnormal situations.
• Updating Database
Collected data are stored in system database, where information is available
for SCADA Master Station Software modules. The SCADA Master Station
Software should be able to store/retrieve data from system database.
• Communicating with the Operator
The operator should be able to monitor and control the plant through the
SCADA Master Station Software.
• Recording Historical Data

A-2
SCADA Master Station Software should be able to record historical data for
future use by the operator.
• Detecting Failures
SCADA Master Station Software should be able to detect software and
hardware failures happened in the Master Station itself.

APPENDIX B
WALKTHROUGH AND
HEURISTIC EVALUATION

B-2
APPENDIX B
WALKTHROUGH AND HEURISTIC EVALUATION
Walkthrough Technique This testing technique was used to test the most high frequency tasks.
Task: monitor generator’s status.
Typical user’s: Administrator
The steps to complete the task are given below. Note that the interface for
the developed software may have changed since we did our evaluation.
Step 1. Selecting the correct entry i.e. log in as a monitor.
Q. Will users know what to do?
Ans. Yes –they know that they must “monitor the generator’s station.”
Q. Will users see how to do it?
Ans. Yes – they have seen menus before and will know to select the appropriate
item and click it.
Q. Is the dialogue box of log in user name and password not frustrate the users?
Ans. Yes- they used to do this procedure in the previous software.
Step 2. Quick revision to the generator’s status.
Q. Is the monitoring page or screen presented the generator’s readings in an
accurate and effective manner?
Answer.: Yes the related information was presented in tabular form as they used to
present their information at the NDC.
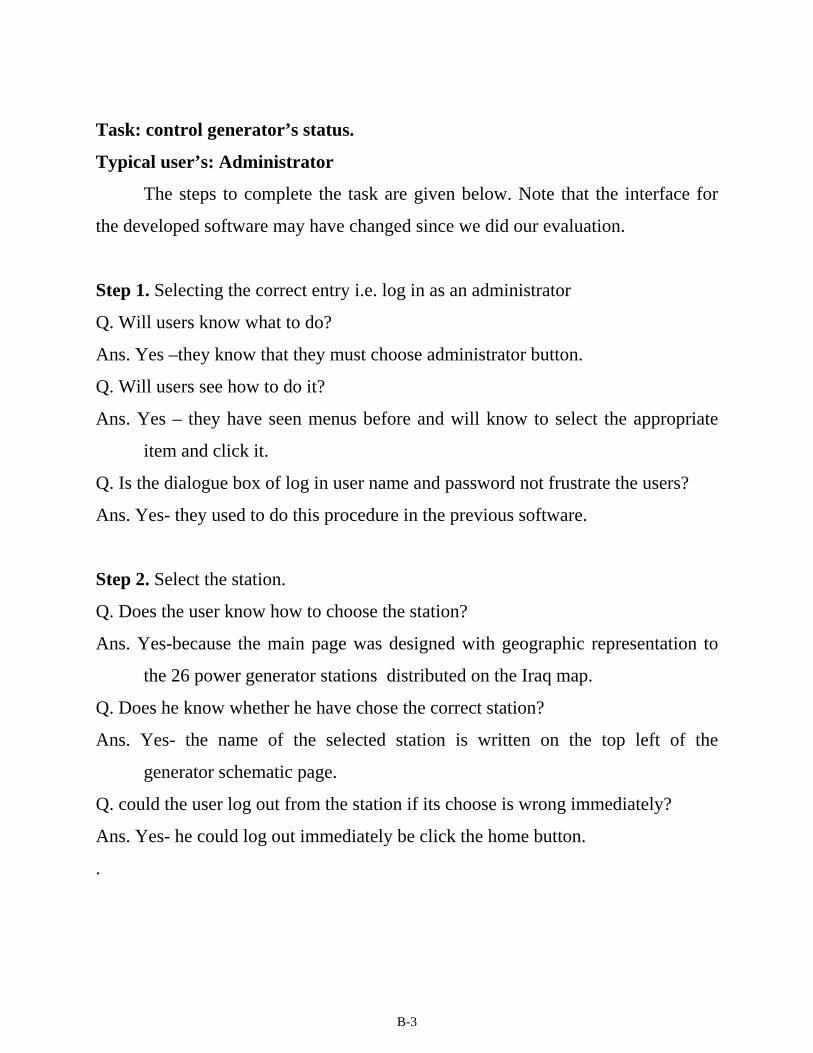
B-3
Task: control generator’s status.
Typical user’s: Administrator
The steps to complete the task are given below. Note that the interface for
the developed software may have changed since we did our evaluation.
Step 1. Selecting the correct entry i.e. log in as an administrator
Q. Will users know what to do?
Ans. Yes –they know that they must choose administrator button.
Q. Will users see how to do it?
Ans. Yes – they have seen menus before and will know to select the appropriate
item and click it.
Q. Is the dialogue box of log in user name and password not frustrate the users?
Ans. Yes- they used to do this procedure in the previous software.
Step 2. Select the station.
Q. Does the user know how to choose the station?
Ans. Yes-because the main page was designed with geographic representation to
the 26 power generator stations distributed on the Iraq map.
Q. Does he know whether he have chose the correct station?
Ans. Yes- the name of the selected station is written on the top left of the
generator schematic page.
Q. could the user log out from the station if its choose is wrong immediately?
Ans. Yes- he could log out immediately be click the home button.
.
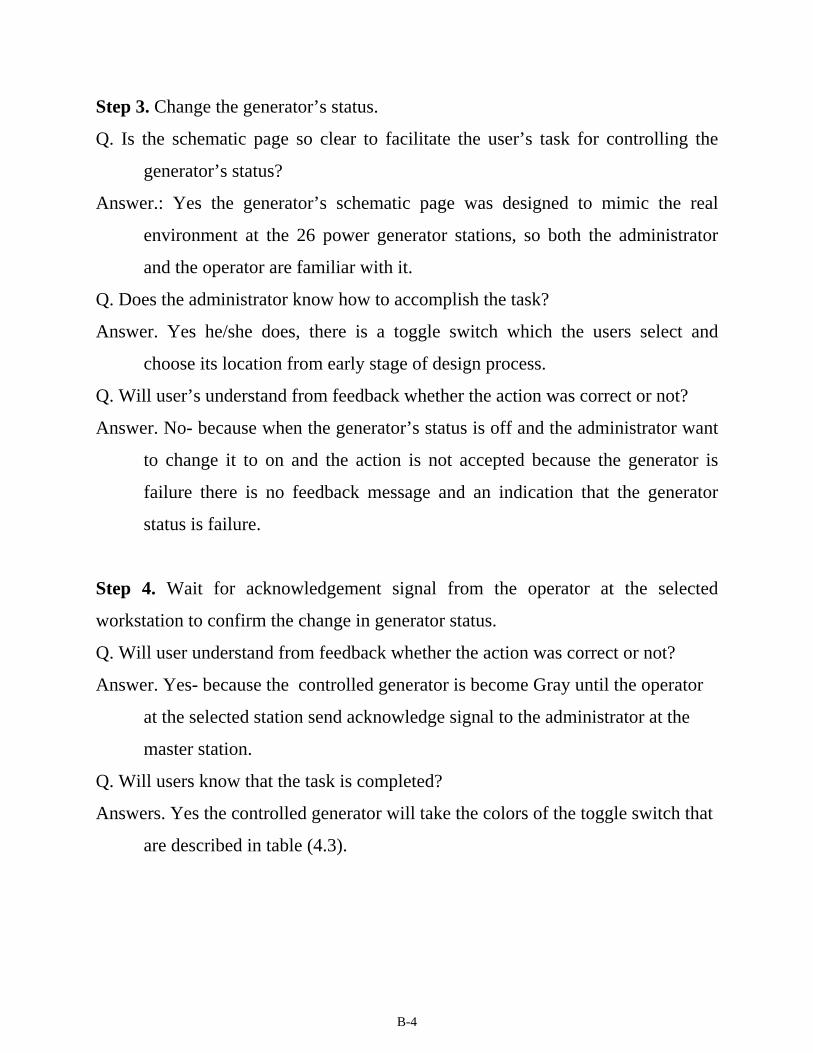
B-4
Step 3. Change the generator’s status.
Q. Is the schematic page so clear to facilitate the user’s task for controlling the
generator’s status?
Answer.: Yes the generator’s schematic page was designed to mimic the real
environment at the 26 power generator stations, so both the administrator
and the operator are familiar with it.
Q. Does the administrator know how to accomplish the task?
Answer. Yes he/she does, there is a toggle switch which the users select and
choose its location from early stage of design process.
Q. Will user’s understand from feedback whether the action was correct or not?
Answer. No- because when the generator’s status is off and the administrator want
to change it to on and the action is not accepted because the generator is
failure there is no feedback message and an indication that the generator
status is failure.
Step 4. Wait for acknowledgement signal from the operator at the selected
workstation to confirm the change in generator status.
Q. Will user understand from feedback whether the action was correct or not?
Answer. Yes- because the controlled generator is become Gray until the operator
at the selected station send acknowledge signal to the administrator at the
master station.
Q. Will users know that the task is completed?
Answers. Yes the controlled generator will take the colors of the toggle switch that
are described in table (4.3).
APPENDIX C
QUESTIONNAIRE FOR USER
INTERACTION
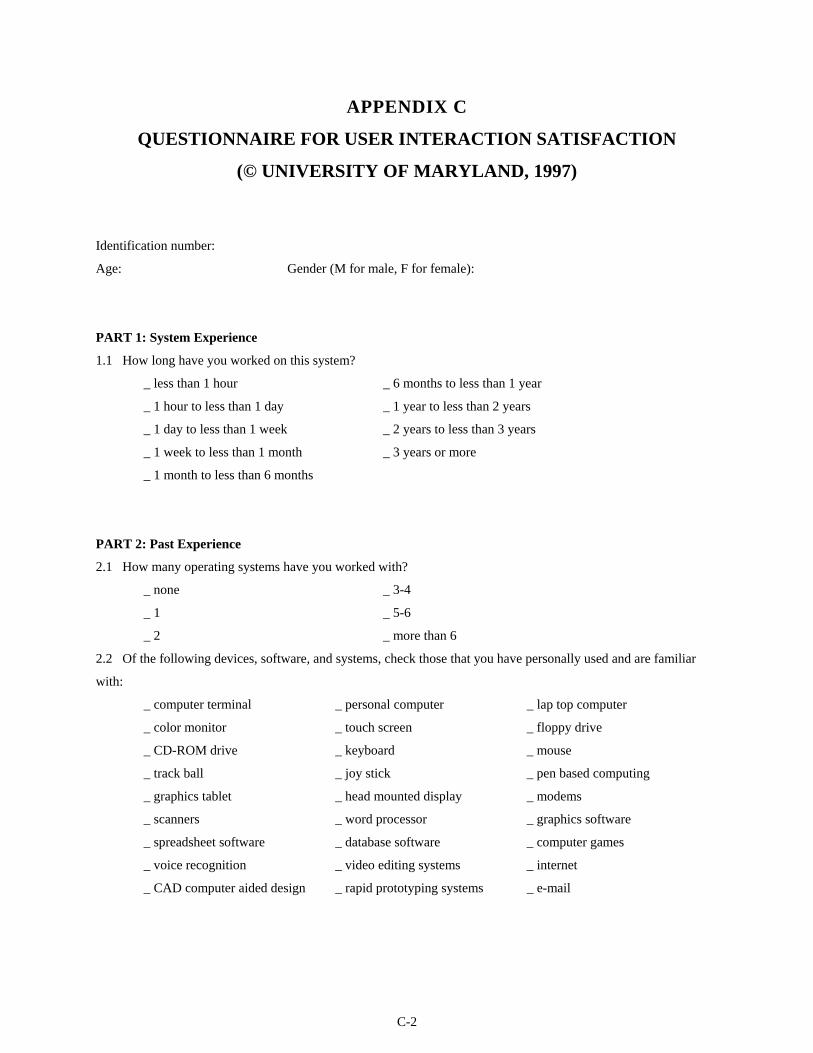
C-2
APPENDIX C
QUESTIONNAIRE FOR USER INTERACTION SATISFACTION
(© UNIVERSITY OF MARYLAND, 1997)
Identification number:
Age: Gender (M for male, F for female):
PART 1: System Experience
1.1 How long have you worked on this system?
_ less than 1 hour _ 6 months to less than 1 year
_ 1 hour to less than 1 day _ 1 year to less than 2 years
_ 1 day to less than 1 week _ 2 years to less than 3 years
_ 1 week to less than 1 month _ 3 years or more
_ 1 month to less than 6 months
PART 2: Past Experience
2.1 How many operating systems have you worked with?
_ none _ 3-4
_ 1 _ 5-6
_ 2 _ more than 6
2.2 Of the following devices, software, and systems, check those that you have personally used and are familiar
with:
_ computer terminal _ personal computer _ lap top computer
_ color monitor _ touch screen _ floppy drive
_ CD-ROM drive _ keyboard _ mouse
_ track ball _ joy stick _ pen based computing
_ graphics tablet _ head mounted display _ modems
_ scanners _ word processor _ graphics software
_ spreadsheet software _ database software _ computer games
_ voice recognition _ video editing systems _ internet
_ CAD computer aided design _ rapid prototyping systems _ e-mail
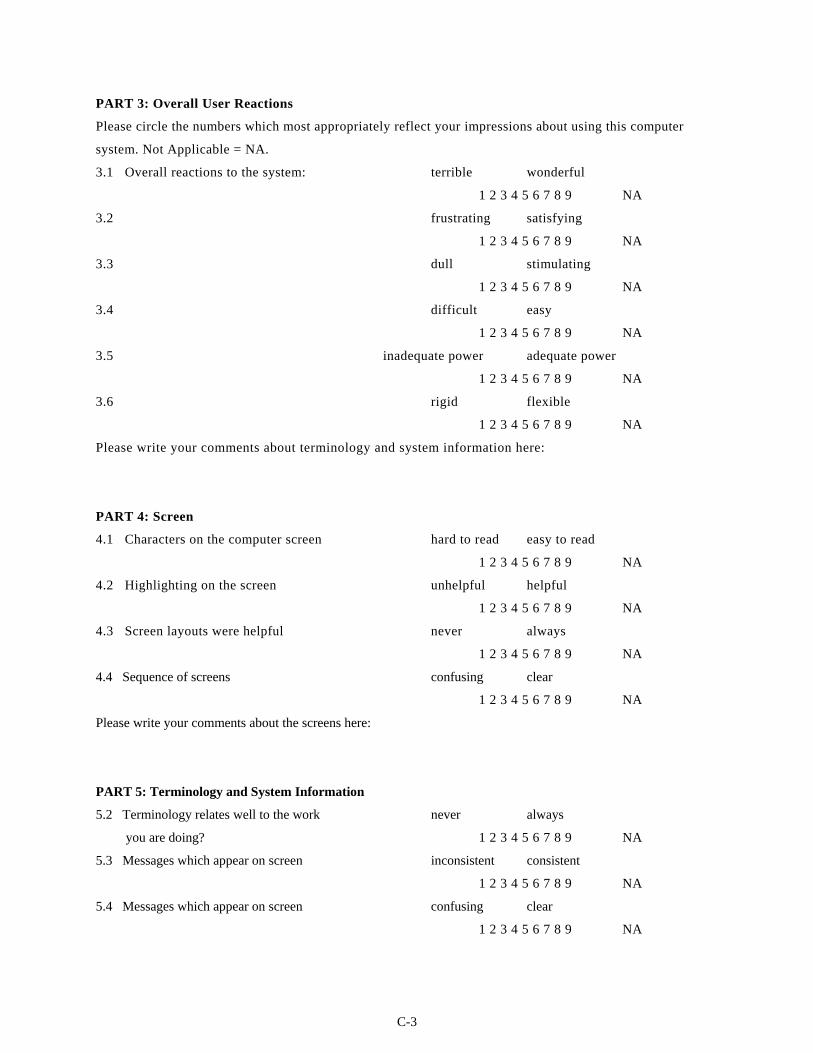
C-3
PART 3: Overall User Reactions
Please circle the numbers which most appropriately reflect your impressions about using this computer
system. Not Applicable = NA.
3.1 Overall reactions to the system: terrible wonderful
1 2 3 4 5 6 7 8 9 NA
3.2 frustrating satisfying
1 2 3 4 5 6 7 8 9 NA
3.3 dull stimulating
1 2 3 4 5 6 7 8 9 NA
3.4 difficult easy
1 2 3 4 5 6 7 8 9 NA
3.5 inadequate power adequate power
1 2 3 4 5 6 7 8 9 NA
3.6 rigid flexible
1 2 3 4 5 6 7 8 9 NA
Please write your comments about terminology and system information here:
PART 4: Screen
4.1 Characters on the computer screen hard to read easy to read
1 2 3 4 5 6 7 8 9 NA
4.2 Highlighting on the screen unhelpful helpful
1 2 3 4 5 6 7 8 9 NA
4.3 Screen layouts were helpful never always
1 2 3 4 5 6 7 8 9 NA
4.4 Sequence of screens confusing clear
1 2 3 4 5 6 7 8 9 NA
Please write your comments about the screens here:
PART 5: Terminology and System Information
5.2 Terminology relates well to the work never always
you are doing? 1 2 3 4 5 6 7 8 9 NA
5.3 Messages which appear on screen inconsistent consistent
1 2 3 4 5 6 7 8 9 NA
5.4 Messages which appear on screen confusing clear
1 2 3 4 5 6 7 8 9 NA
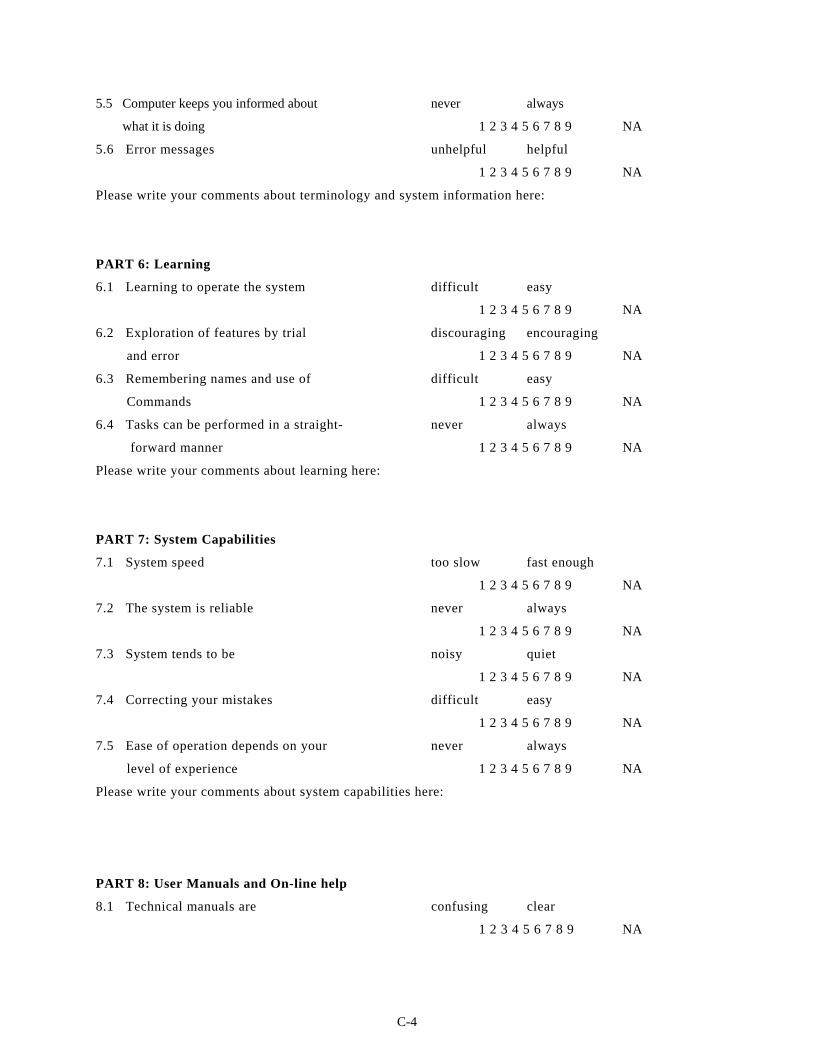
C-4
5.5 Computer keeps you informed about never always
what it is doing 1 2 3 4 5 6 7 8 9 NA
5.6 Error messages unhelpful helpful
1 2 3 4 5 6 7 8 9 NA
Please write your comments about terminology and system information here:
PART 6: Learning
6.1 Learning to operate the system difficult easy
1 2 3 4 5 6 7 8 9 NA
6.2 Exploration of features by trial discouraging encouraging
and error 1 2 3 4 5 6 7 8 9 NA
6.3 Remembering names and use of difficult easy
Commands 1 2 3 4 5 6 7 8 9 NA
6.4 Tasks can be performed in a straight- never always
forward manner 1 2 3 4 5 6 7 8 9 NA
Please write your comments about learning here:
PART 7: System Capabilities
7.1 System speed too slow fast enough
1 2 3 4 5 6 7 8 9 NA
7.2 The system is reliable never always
1 2 3 4 5 6 7 8 9 NA
7.3 System tends to be noisy quiet
1 2 3 4 5 6 7 8 9 NA
7.4 Correcting your mistakes difficult easy
1 2 3 4 5 6 7 8 9 NA
7.5 Ease of operation depends on your never always
level of experience 1 2 3 4 5 6 7 8 9 NA
Please write your comments about system capabilities here:
PART 8: User Manuals and On-line help
8.1 Technical manuals are confusing clear
1 2 3 4 5 6 7 8 9 NA
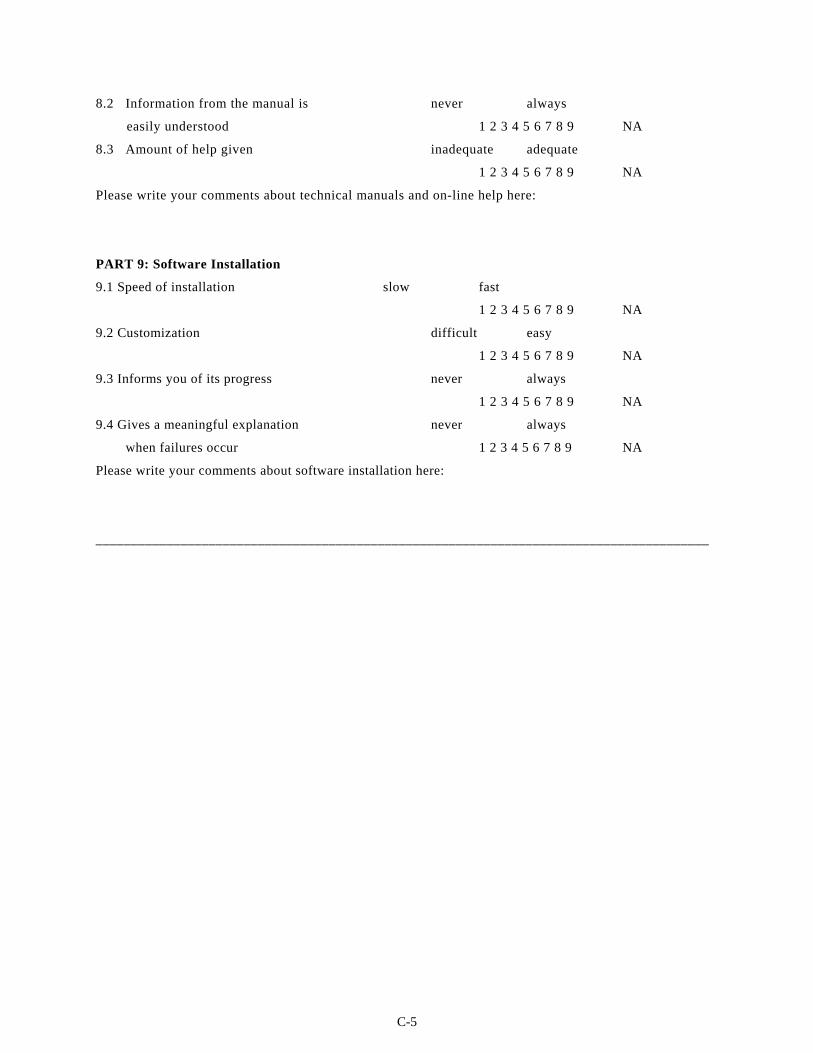
C-5
8.2 Information from the manual is never always
easily understood 1 2 3 4 5 6 7 8 9 NA
8.3 Amount of help given inadequate adequate
1 2 3 4 5 6 7 8 9 NA
Please write your comments about technical manuals and on-line help here:
PART 9: Software Installation
9.1 Speed of installation slow fast
1 2 3 4 5 6 7 8 9 NA
9.2 Customization difficult easy
1 2 3 4 5 6 7 8 9 NA
9.3 Informs you of its progress never always
1 2 3 4 5 6 7 8 9 NA
9.4 Gives a meaningful explanation never always
when failures occur 1 2 3 4 5 6 7 8 9 NA
Please write your comments about software installation here:
_______________________________________________________________________________________

ةــــــــــالصـخـال
الحقيقي السببتعد بداية قوية لمعرفة، مع اإلنسان مؤثرواجهة تخاطب دراسة إستراتيجية تفاعل
. األجهزة والمنتجات واإلعراض عن البعض اآلخروراء إقبال واقتناء المستهلك بعضالذي يكمن
في عدد الباحثين الحاسوب زيادة آبيرةأجهزة مستخدمي أعدادصاحب االتساع الكبير في
الحاسوب وشملت تلك البحوث وأجهزة اإلنسانالمتخصصين في دراسة موضوع التفاعل بين
.لهذا التفاعلة والنفسية والنظرية ئي الفيزيا اآلثاروالدراسات
آثير من المنتجات التي تحتاج إلى تفاعل بين المستخدم والمنتج أثناء استخدامها، لم يؤخذ بنظر
بل إنها صممت على أساس .اجات ومتطلبات المستخدم منذ المراحل األولى للتصميماالعتبار احتي
هدف هذه األطروحة هو إصالح ما تقدم عن إن . أنظمة تقوم بمجموعة معينة من الوظائف والمهام
أي تطوير ،في المراحل األولى للتصميم usabilityطريق إدخال مفهوم صالحية االستعمال
.المستخدمين وممتعه الستخدامها من منظور منتجات سهلة وفعالة
أعمدة يعتمد على ثالثة اإلنسان نجاح أي تصميم لواجهة التخاطب مع إن وجد األطروحةفي هذه
،اإلنسان البرمجية لواجهة التخاطب مع األدوات،للنهج العملي المتبعالتوجيهية الوثائق :رئيسية
تساعد مصمم واجهات " األعمدة الثالثة المذآورة آنفا . صالحية االستخدامواختبار الخبراء تنقيح
األعمدة آل عمود من إنأظهرت التجارب . التخاطب على تحويل األفكار الجيدة إلى نظم ناجحة
. ويسهل بناء أنظمة ممتازةاإلنسان لعملية تصميم واجهات التخاطب مع تعجيل قفزة يقدمالمذآورة
تم تطبيقها للسيطرة الرقابية واستخالص اإلنسانطب مؤثره مع واجهة تخا لتصميم ه المنهجيةهذ
المعلومات لمحطات عراقية لتوليد القدرة الكهربائية وقد تم اختبار هذا المنتج البرمجي عن طريق
ة البرمجياألداة المنتج باستعمالتم برمجة .ن مكتب القريشيم بيانات حقيقية مأخوذة إدخال
)SEMATIC Window Control Center (WinCC), version 6( بشرآة مصنع
Siemens-AG وواجهات التخاطب طرة الرقابية واستخالص المعلومات نظام السيأجزاء لتصميم
التجول والتتبع الذهني لمهام المنتج قيم هذا المنتج البرمجي بطرق وتقنيات مختلفة مثل . اإلنسانمع
Cognitive Walkthrough منافس أوالمقارنة مع منتج سابق واختبار الصالحية ب
Competitive Usability Testing و تم استخدام استبيان لمعرفة رضا المستخدمQUIS
. Quality Test تم اختبار الجودة للمنتج" أخيراو

وزارة التعليم العالي والبحث العلمي
الجامعة التكنولوجية
قسم هندسة الحاسبات ونظم المعلومات
إسرتاتيجية : ستخدمتصميم وتطبيق واجهة امل اإلنسانواجهة التخاطب مع تفاعل ل ةمؤثر
مقدمةطروحةأ المعلوماتتكنولوجيالقسم هندسة الحاسبات و
متطلبات الحصول على شهادة الماجستير في العلوم وهي جزء من
في اختصاص هندسة البرمجيات
إعداد الطالبة منى ضياء شيت خطاب
بأشراف محمد نجم عبد اهللا. د
2007آذار 1428ربيع األول