Embed Size (px)
Citation preview
Strengthening the StitchSUSTAINABILITY REPORT 2017–2018
TAL Apparel Sustainability Report 2017–20182
TAL Apparel is the manufacturing arm of TAL Group, a company that offers a range of innovative products and services across various stages of the apparel supply chain. For example, The Apparel Group (TAG) in the US is active in wholesaling and providing design, merchandising and logistics management services to some of the world’s top brands and retailers.
This report has been prepared in accordance with the GRI Standards: Core Option. The GRI (Global Reporting Initiative) offers the most widely used global framework for sustainability reporting and includes principles and metrics that represent best practice for reporting on social, environmental and economic impacts. Complying to the GRI Standards make sustainability reports like ours globally comparable and relevant.
Should you have any comments, questions or concerns, please contact us via email: [email protected].
Welcome to TAL Apparel
This is TAL Apparel’s fifth biennial sustainability report and is for the period of 2017–2018. This report provides updates to our last report, details sustainability initiatives undertaken in the time period and discusses the opportunities and challenges we experienced. This report exemplifies the core values of TAL Apparel, which are honesty, integrity and commitment to stakeholders.
3
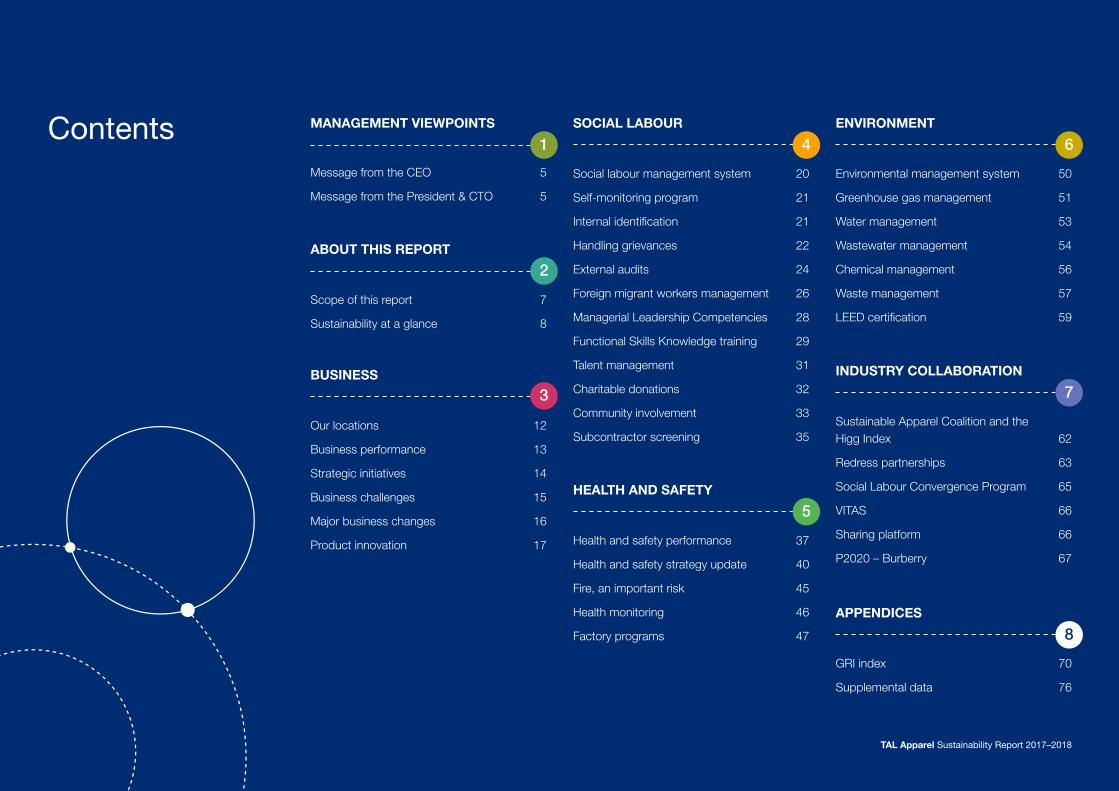
Contents MANAGEMENT VIEWPOINTS
ABOUT THIS REPORT
BUSINESS
SOCIAL LABOUR ENVIRONMENT
INDUSTRY COLLABORATION
HEALTH AND SAFETY
Message from the CEO 5
Message from the President & CTO 5
Scope of this report 7
Sustainability at a glance 8
Our locations 12
Business performance 13
Strategic initiatives 14
Business challenges 15
Major business changes 16
Product innovation 17
Social labour management system 20
Self-monitoring program 21
Internal identification 21
Handling grievances 22
External audits 24
Foreign migrant workers management 26
Managerial Leadership Competencies 28
Functional Skills Knowledge training 29
Talent management 31
Charitable donations 32
Community involvement 33
Subcontractor screening 35
Environmental management system 50
Greenhouse gas management 51
Water management 53
Wastewater management 54
Chemical management 56
Waste management 57
LEED certification 59
Sustainable Apparel Coalition and the Higg Index 62
Redress partnerships 63
Social Labour Convergence Program 65
VITAS 66
Sharing platform 66
P2020 – Burberry 67
Health and safety performance 37
Health and safety strategy update 40
Fire, an important risk 45
Health monitoring 46
Factory programs 47
1 4 6
7
5
2
3
APPENDICES
GRI index 70
Supplemental data 76
8
TAL Apparel Sustainability Report 2017–2018

TAL Apparel Sustainability Report 2017–20184
1
Management viewpoints
TAL Apparel Sustainability Report 2017–20185
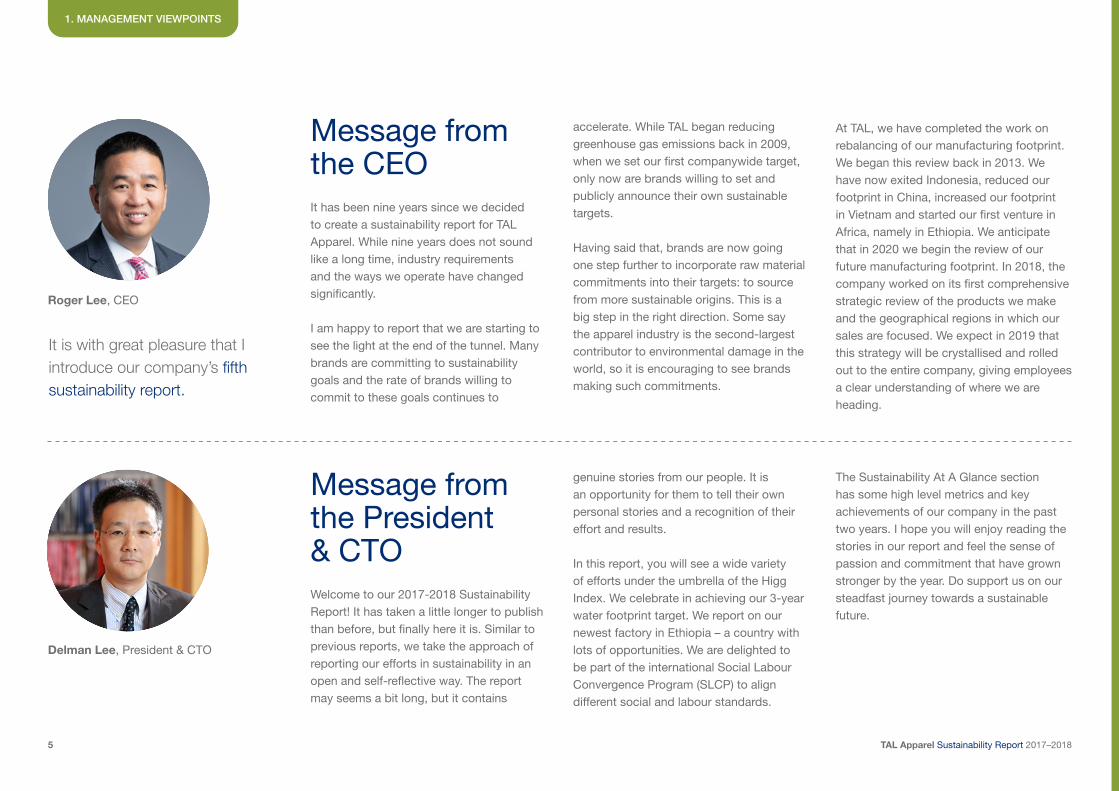
Message from the CEO
1. MANAGEMENT VIEWPOINTS
It has been nine years since we decided to create a sustainability report for TAL Apparel. While nine years does not sound like a long time, industry requirements and the ways we operate have changed significantly.
I am happy to report that we are starting to see the light at the end of the tunnel. Many brands are committing to sustainability goals and the rate of brands willing to commit to these goals continues to
It is with great pleasure that I introduce our company’s fifth sustainability report.
accelerate. While TAL began reducing greenhouse gas emissions back in 2009, when we set our first companywide target, only now are brands willing to set and publicly announce their own sustainable targets.
Having said that, brands are now going one step further to incorporate raw material commitments into their targets: to source from more sustainable origins. This is a big step in the right direction. Some say the apparel industry is the second-largest contributor to environmental damage in the world, so it is encouraging to see brands making such commitments.
Message from the President & CTOWelcome to our 2017-2018 Sustainability Report! It has taken a little longer to publish than before, but finally here it is. Similar to previous reports, we take the approach of reporting our efforts in sustainability in an open and self-reflective way. The report may seems a bit long, but it contains
At TAL, we have completed the work on rebalancing of our manufacturing footprint. We began this review back in 2013. We have now exited Indonesia, reduced our footprint in China, increased our footprint in Vietnam and started our first venture in Africa, namely in Ethiopia. We anticipate that in 2020 we begin the review of our future manufacturing footprint. In 2018, the company worked on its first comprehensive strategic review of the products we make and the geographical regions in which our sales are focused. We expect in 2019 that this strategy will be crystallised and rolled out to the entire company, giving employees a clear understanding of where we are heading.
genuine stories from our people. It is an opportunity for them to tell their own personal stories and a recognition of their effort and results. In this report, you will see a wide variety of efforts under the umbrella of the Higg Index. We celebrate in achieving our 3-year water footprint target. We report on our newest factory in Ethiopia – a country with lots of opportunities. We are delighted to be part of the international Social Labour Convergence Program (SLCP) to align different social and labour standards.
The Sustainability At A Glance section has some high level metrics and key achievements of our company in the past two years. I hope you will enjoy reading the stories in our report and feel the sense of passion and commitment that have grown stronger by the year. Do support us on our steadfast journey towards a sustainable future.
Roger Lee, CEO
Delman Lee, President & CTO
TAL Apparel Sustainability Report 2017–20186
2
About this report
TAL Apparel Sustainability Report 2017–20187
2. ABOUT THIS REPORT
Scope of this report
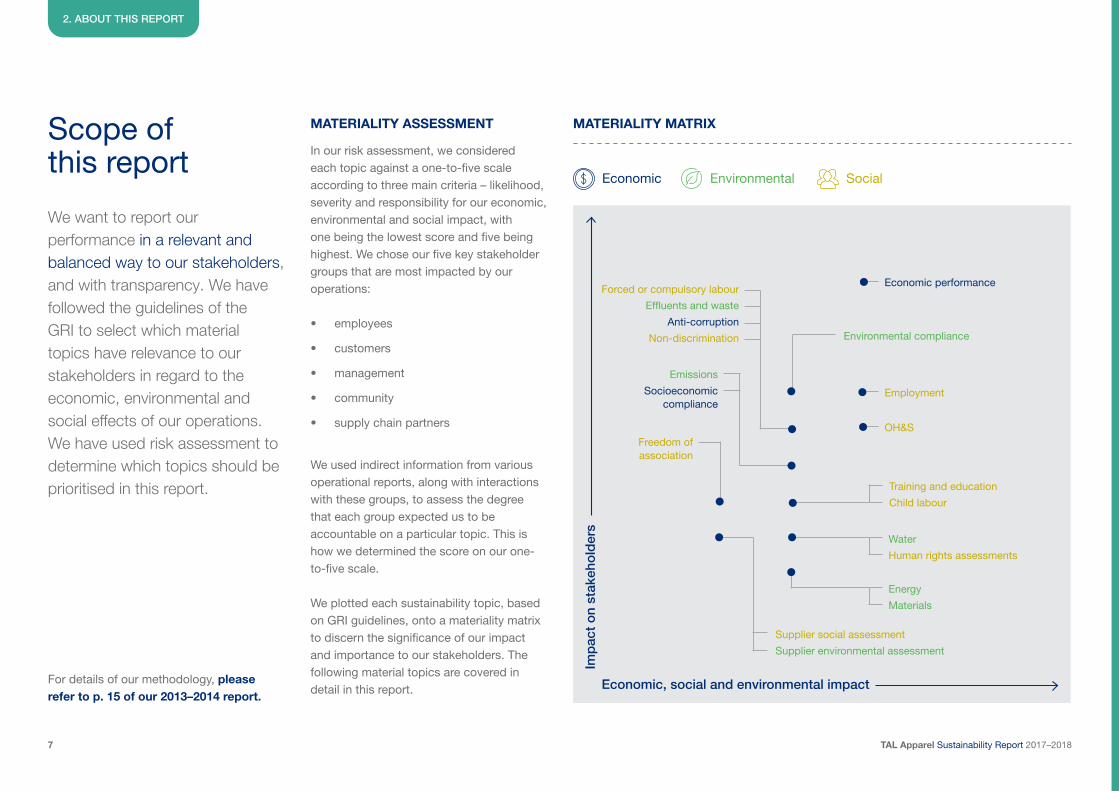
We want to report our performance in a relevant and balanced way to our stakeholders, and with transparency. We have followed the guidelines of the GRI to select which material topics have relevance to our stakeholders in regard to the economic, environmental and social effects of our operations. We have used risk assessment to determine which topics should be prioritised in this report.
In our risk assessment, we considered each topic against a one-to-five scale according to three main criteria – likelihood, severity and responsibility for our economic, environmental and social impact, with one being the lowest score and five being highest. We chose our five key stakeholder groups that are most impacted by our operations:
• employees
• customers
• management
• community
• supply chain partners
We used indirect information from various operational reports, along with interactions with these groups, to assess the degree that each group expected us to be accountable on a particular topic. This is how we determined the score on our one-to-five scale.
We plotted each sustainability topic, based on GRI guidelines, onto a materiality matrix to discern the significance of our impact and importance to our stakeholders. The following material topics are covered in detail in this report.
MATERIALITY ASSESSMENT MATERIALITY MATRIX
For details of our methodology, please refer to p. 15 of our 2013–2014 report.
Forced or compulsory labour
Effluents and waste
Anti-corruption
Non-discrimination
Emissions
Socioeconomic compliance
Freedom of association
Economic performance
Environmental compliance
Employment
OH&S
Training and education
Child labour
Water
Human rights assessments
Energy
Materials
Supplier social assessment
Supplier environmental assessment
Imp
act
on
stak
eho
lder
s
Economic, social and environmental impact
Economic Environmental Social
TAL Apparel Sustainability Report 2017–20188
2. ABOUT THIS REPORT
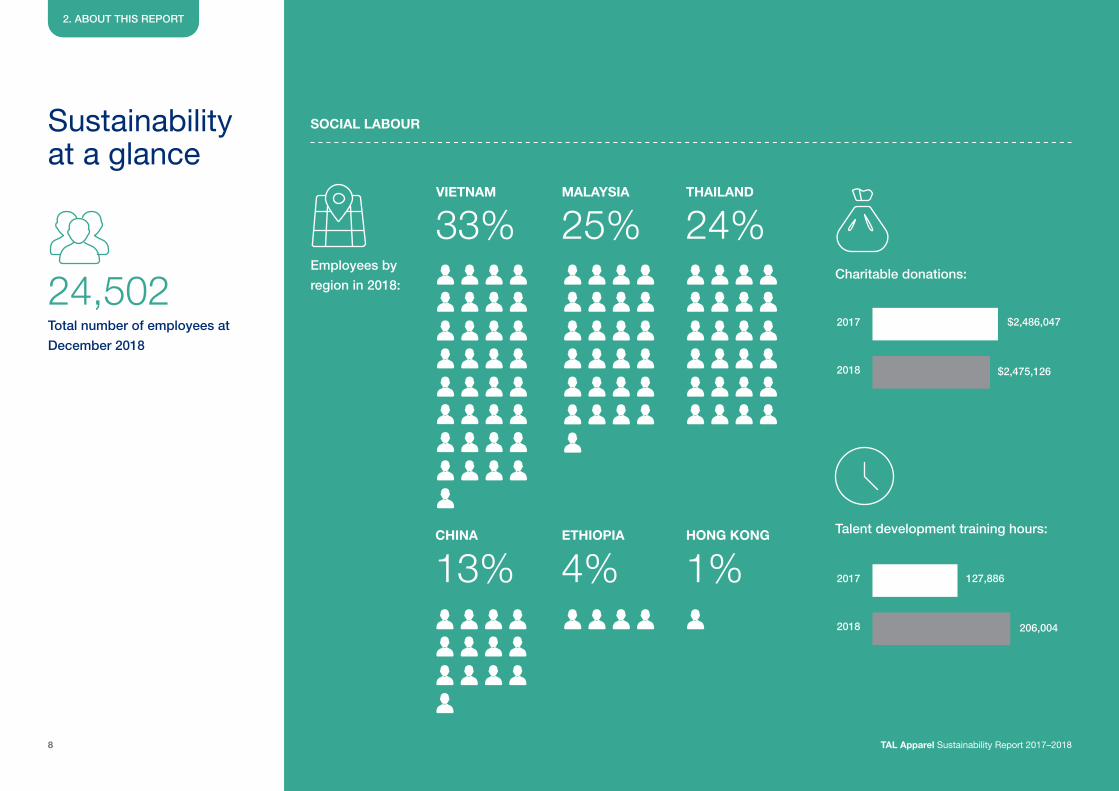
Sustainability at a glance
24,502Total number of employees at
December 2018
CHINA
VIETNAM
ETHIOPIA
MALAYSIA
HONG KONG
THAILAND
Employees by
region in 2018:Charitable donations:
Talent development training hours:
SOCIAL LABOUR
2017
2018
2017
2018
127,886
$2,486,047
206,004
$2,475,126
TAL Apparel Sustainability Report 2017–2018
13%
33%
4%
25%
1%
24%
TAL Apparel Sustainability Report 2017–20189
2. ABOUT THIS REPORT
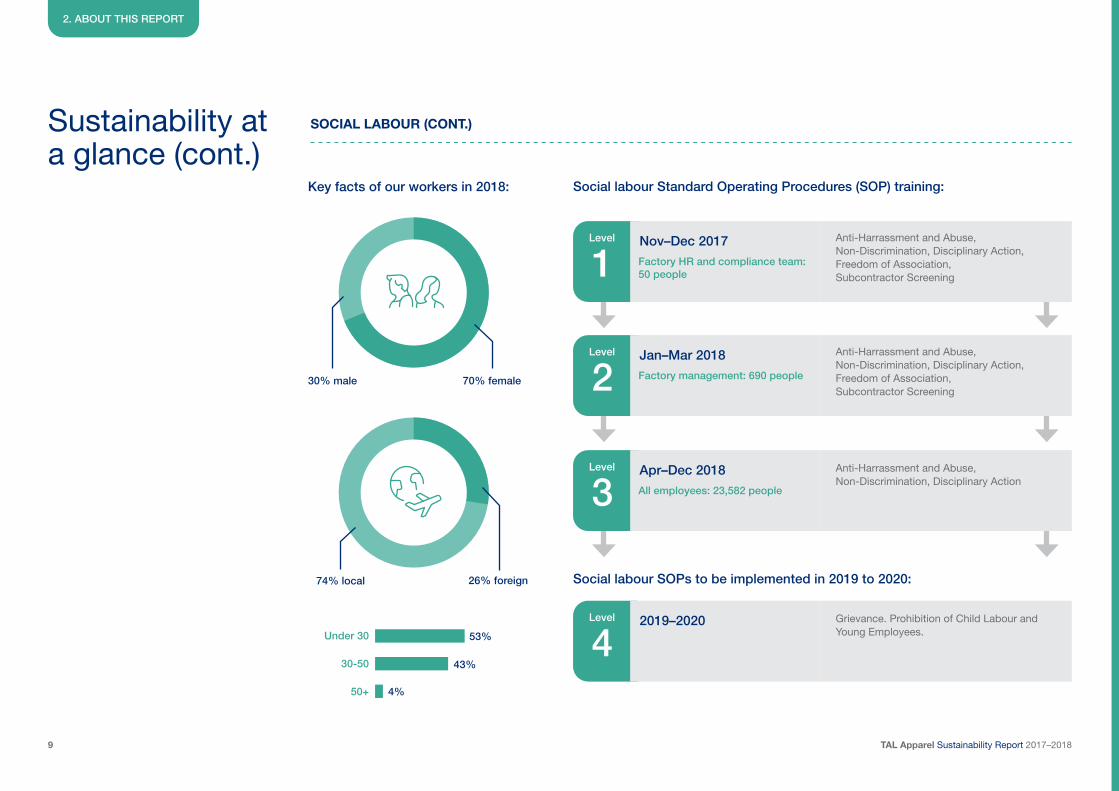
Sustainability at a glance (cont.)
Key facts of our workers in 2018:
SOCIAL LABOUR (CONT.)
Under 30
30-50
50+
53%
70% female
26% foreign
30% male
74% local
43%
4%
Social labour Standard Operating Procedures (SOP) training:
Social labour SOPs to be implemented in 2019 to 2020:
Anti-Harrassment and Abuse, Non-Discrimination, Disciplinary Action, Freedom of Association, Subcontractor Screening
Anti-Harrassment and Abuse, Non-Discrimination, Disciplinary Action
Anti-Harrassment and Abuse, Non-Discrimination, Disciplinary Action, Freedom of Association, Subcontractor Screening
Grievance. Prohibition of Child Labour and Young Employees.
Nov–Dec 2017
Apr–Dec 2018
Jan–Mar 2018
2019–2020
1
3
2
4
Factory HR and compliance team: 50 people
All employees: 23,582 people
Factory management: 690 people
Level
Level
Level
Level
TAL Apparel Sustainability Report 2017–201810
2. ABOUT THIS REPORT
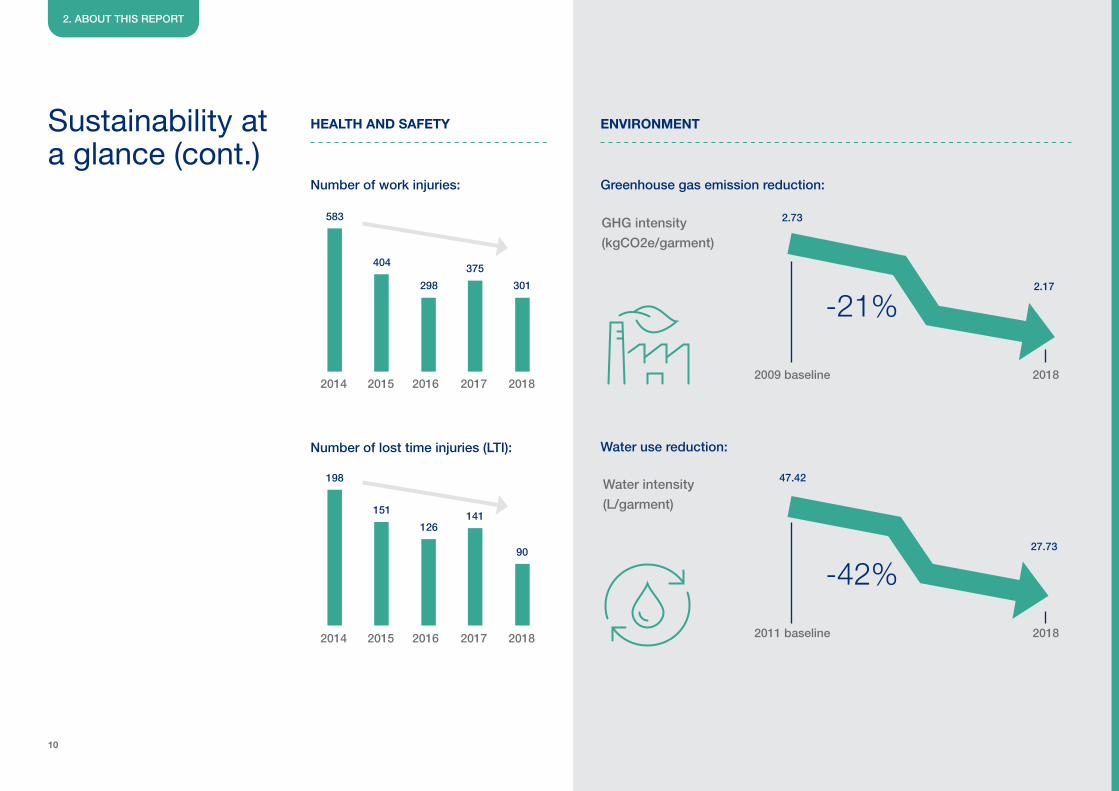
Sustainability at a glance (cont.)
HEALTH AND SAFETY ENVIRONMENT
Number of work injuries: Greenhouse gas emission reduction:
Water use reduction:Number of lost time injuries (LTI):
583
198
404
2.73
-21%
-42%
47.42
2.17
27.73
151
298
126
375
141
301
90
20142009 baseline
2011 baseline
2018
20182014
2015
2015
2017
2017
2016
2016
2018
2018
GHG intensity
(kgCO2e/garment)
Water intensity
(L/garment)

TAL Apparel Sustainability Report 2017–201811
3
Business
TAL Apparel Sustainability Report 2017–201812
3. BUSINESS
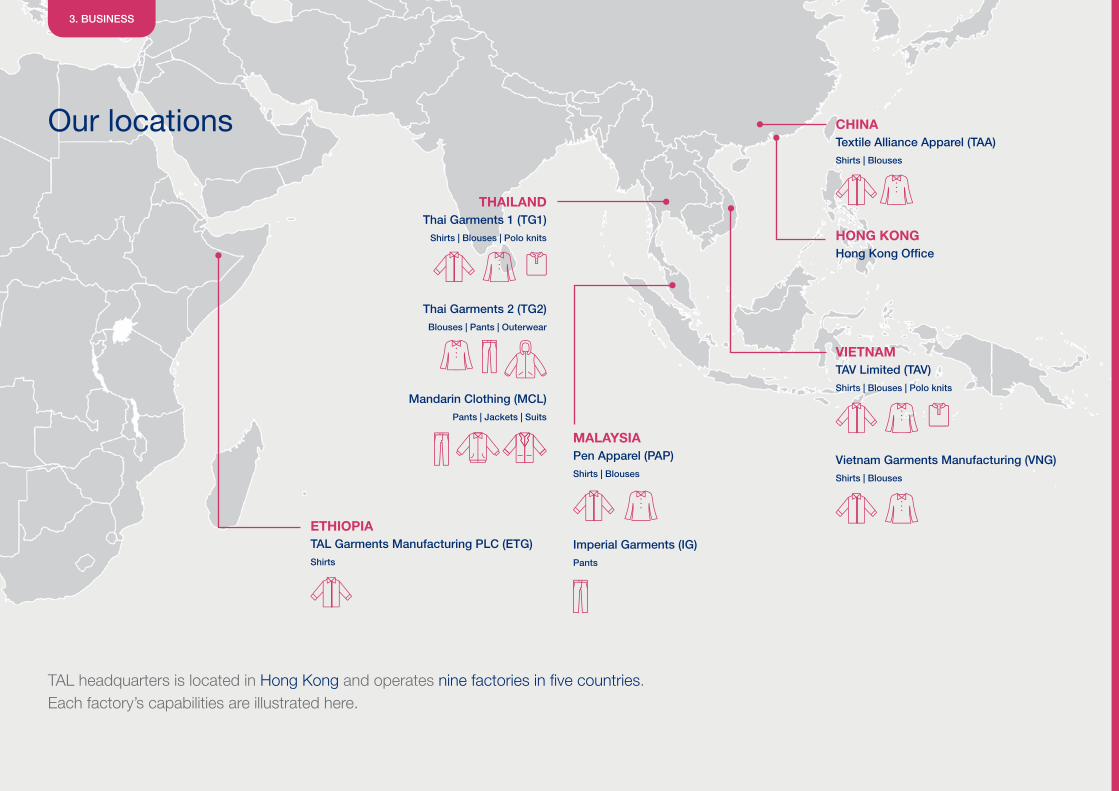
Our locations
TAL headquarters is located in Hong Kong and operates nine factories in five countries. Each factory’s capabilities are illustrated here.
ETHIOPIATAL Garments Manufacturing PLC (ETG)Shirts
THAILANDThai Garments 1 (TG1)
Shirts | Blouses | Polo knits
Thai Garments 2 (TG2) Blouses | Pants | Outerwear
Mandarin Clothing (MCL)Pants | Jackets | Suits
VIETNAMTAV Limited (TAV)Shirts | Blouses | Polo knits
MALAYSIAPen Apparel (PAP)Shirts | Blouses
CHINATextile Alliance Apparel (TAA)Shirts | Blouses
HONG KONGHong Kong Office
Vietnam Garments Manufacturing (VNG) Shirts | Blouses
Imperial Garments (IG) Pants
13
3. BUSINESS
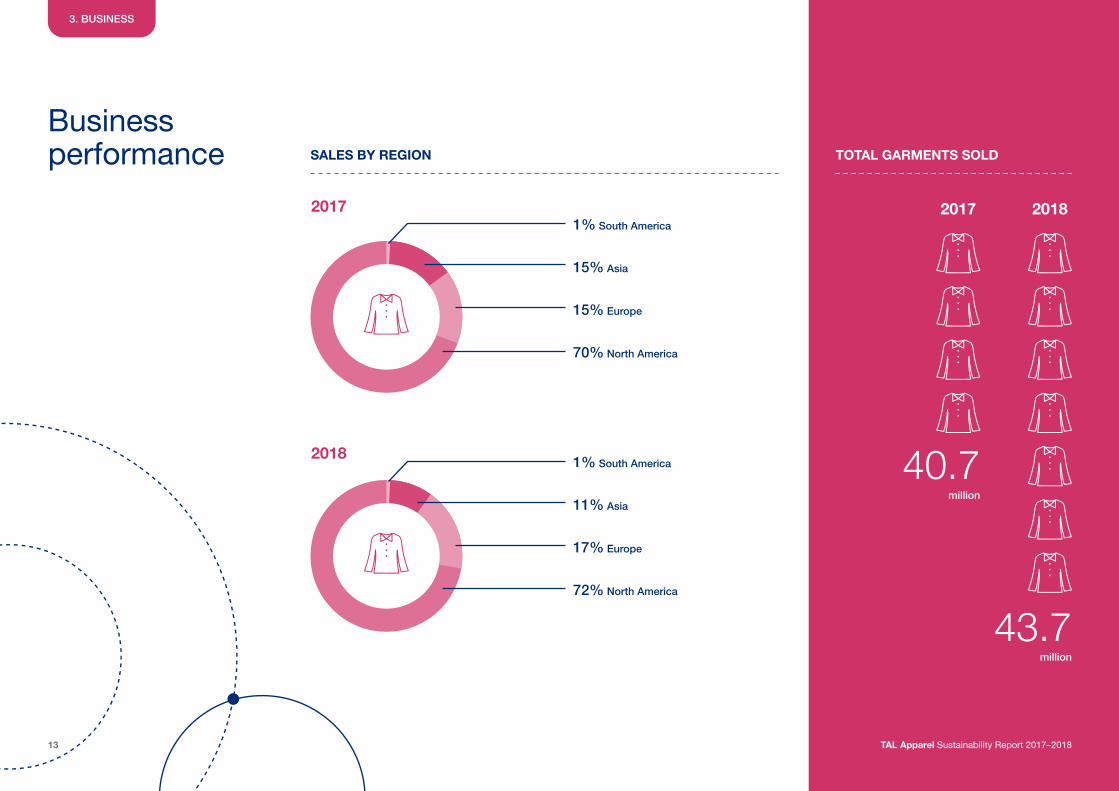
SALES BY REGION TOTAL GARMENTS SOLD
Business performance
1% South America
1% South America
15% Asia
11% Asia
15% Europe
17% Europe
70% North America
72% North America
million
million
43.7
40.7
201820172017
2018
TAL Apparel Sustainability Report 2017–2018
TAL Apparel Sustainability Report 2017–201814
3. BUSINESS
Strategic initiatives
2017 brought a defining moment when TAL ventured out of Asia for the first time, planting our footprint in the African continent. With the opening of our latest factory in Hawassa Industrial Park in Ethiopia, and the retirement of our Indonesian plant, TAL completed the first phase of rebalancing our manufacturing footprint. This marked the commencement of an exciting new chapter. Our work to optimise our manufacturing footprint goes on, as we continue to scan opportunities around the world, in search of better value propositions such as excellent fabric or product expertise, competitive pricing or trade benefits.
Facing a world that is becoming more complex and volatile than ever, as a world-class manufacturer that takes pride in quality, service and customer intimacy, it is important for us to reinforce our fundamentals, while staying curious and agile.
Since 2017, we’ve embarked on a series of cross-functional projects. From factory efficiency improvement to business process reengineering, from product development to customer engagement, each quarter we form project teams, championed by our executive leadership team, to tackle a
In the past few years, as manufacturing costs have continued to soar and new trade agreements have come into place, TAL Apparel has embarked on a manufacturing footprint rebalancing journey.
specific topic of improvement. In the same period, we also commenced a full business strategy review, in which we engaged influential business thought-leaders from both the academic world and the industry to help us imagine future opportunities. While the exploration is ongoing, we look forward to sharing with you more exciting developments in the next report.
TAL Apparel Sustainability Report 2017–201815
Business challenges
3. BUSINESS
The growth was driven by the technology, leisure, travel and services industries. Towards the end of 2018, the promising economic outlook, however, suggested that consumers were worried about the escalation of a trade war between US and China, which led to raising prices as duties on imports increased.
US traditional retail brick and mortar (B&M) continued to face headwinds with reduced footfall in stores. According to research, US online apparel sales grew 18.5% in 2018 over 2017, far greater than total apparel retail sales growth at around 4-5%. Traditional big retail brands continued to struggle with a slight decline in sales while having a higher cost of operation (high fixed cost of B&M stores, alongside increasing variable cost of growing eCommerce business). Digitally Native Vertical Brands (DNVB) like UNTUCKit, Faherty, Stitch Fix, Bonobos, and Vineyard Vines continued to grow at double digits, outpacing the market.
Manufacturing costs were still on the rise. The wage rate increased in all markets with Vietnam having higher inflation (~ 7%) as the manufacturing base moved from China to Vietnam to mitigate the higher duty impact. Minimum wages were increased in China, Indonesia, Thailand and Vietnam. We continue to look for efficiencies and cost-
Overall, the US economy gained momentum in 2017 and 2018, and consumer confidence was the highest since 2000.
saving opportunities to mitigate the impact of wage increases and the inability to pass price inflation on to our customers due to price pressures in US retail.
We continued to invest in sustainability – both in operations and in our products – balancing the three Ps: people, planet and profit.
The main challenge continues to be to deliver against this goal, while managing
cost competitiveness.
TAL Apparel Sustainability Report 2017–201816
Major business changes
3. BUSINESS
Having assessed many countries in South Asia, middle Europe and Africa, Ethiopia resonated with us as a country that shares some of our company’s core values. The country’s ‘growth and transformation plan’, of which the establishment of a vertically integrated textile and garment manufacturing industry is a core driver, aims to create jobs for its millions of young people, combined with a focus on helping to embrace and empower women in the workforce.
Our new factory is located in Hawassa Industrial Park (HIP) in the Southern Nations Nationalities and Peoples’ Region (SNNPR). Many of our sewers have joined us straight from school (Grade 10) or from a subsistence farming background. Many of our staff have come from previous jobs and have a university education, but many others, in particular our operators, are working for the first time in an industrial environment.
HIP boasts an advanced zero-liquid discharge system, as well as being powered by green hydro-electric power. As it becomes fully operational, we are using Ethiopia’s electric-powered train to deliver more and more of our containers to the port in Djibouti. The train is a green alternative to the trucks on which we traditionally rely.
TAL GARMENTS MANUFACTURING PLC OPENING
Situated on Lake Hawassa, we have participated in a ‘Save Lake Hawassa’ project aimed at curbing pollution in these early stages of industrialisation as well as a tree planting program. With a fabric mill, an interlining supplier and a supplier of cartons, labels and other sub-materials all located within metres of our factory, sourcing from our qualified local colleague suppliers will soon reduce both lead time for our customers and carbon emissions from our supply chain.
Despite the distance from Asia, we hold TAL Garments Manufacturing to the same core values: commitment to customers, suppliers and employees, and compliance with the sustainability standards in place throughout TAL. However, given that this is our first experience in Ethiopia and given that this is a newly established industry in Ethiopia, we have faced many organisational, operational, cultural and social issues throughout 2017 and 2018.
We have struggled with the quality of housing and transportation available to our operators and staff. While government sponsored micro-financing schemes have attempted to encourage Hawassa residents to build additional rooms onto their homes to rent to incoming HIP employees, both the quantity and quality of housing facilities falls far short of market requirements. Many employees, coming into Hawassa from the
surrounding areas, end up living in small and shared rooms with only the barest of utilities and sanitation facilities. Areas lacking streetlights and proper policing are a security concern, making our employees targets of a growing criminal element. And little to no city transportation in many areas has led us to providing bus transportation for all of our employees. During sporadic incidents of civil unrest, the entire HIP has been closed. We have continued to pay our employees during these periods as their inability to come to work at these times is not due to causes of their own making. We expect that these challenges will take a few years to solve, leading us to adjust expectations and plans accordingly.
Both 2017 and 2018 were extremely challenging years, but we quadrupled our output in 2018, compared to 2017, and maintained a 100% quality hit rate for all garments shipped from TAL Garments Manufacturing! Our approach has been to grow slowly and focus hard on getting the basics right so that we have a sound foundation for future growth. We said hello to 2019 with an employee headcount of just over 1,000 and a solid business plan to more than double our production output compared to 2018. The close family feeling that comes naturally to Ethiopians is taking root within our ‘home’ at TAL Garments Manufacturing and HIP and as we develop our industrial capacity and capabilities together!
In March 2017 we celebrated the first shipment of men’s dress shirts from our most recently opened factory in Hawassa, Ethiopia.
TAL Garments Manufacturing PLC, also referred to as ETG (Ethiopia TAL Garments) is the outcome of a two-year search to find a location in which to diversify our manufacturing footprint outside of East Asia.
TAL Apparel Sustainability Report 2017–201817
Product innovation
3. BUSINESS
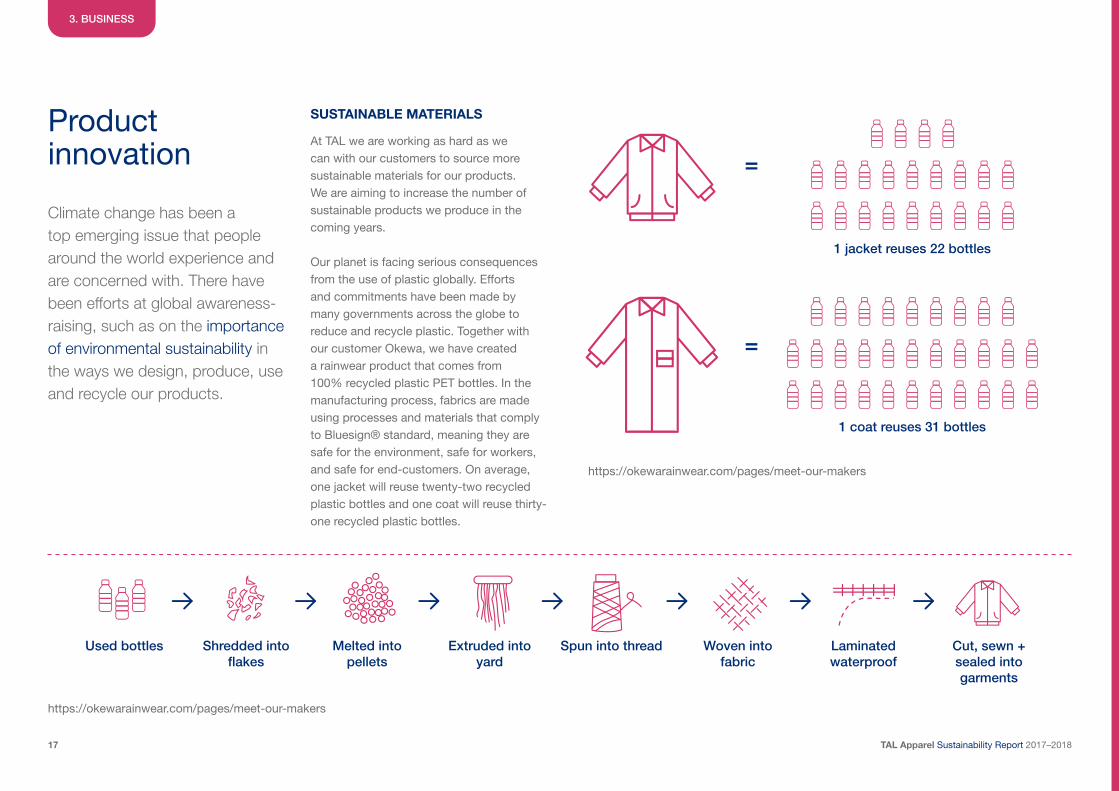
At TAL we are working as hard as we can with our customers to source more sustainable materials for our products. We are aiming to increase the number of sustainable products we produce in the coming years. Our planet is facing serious consequences from the use of plastic globally. Efforts and commitments have been made by many governments across the globe to reduce and recycle plastic. Together with our customer Okewa, we have created a rainwear product that comes from 100% recycled plastic PET bottles. In the manufacturing process, fabrics are made using processes and materials that comply to Bluesign® standard, meaning they are safe for the environment, safe for workers, and safe for end-customers. On average, one jacket will reuse twenty-two recycled plastic bottles and one coat will reuse thirty-one recycled plastic bottles.
https://okewarainwear.com/pages/meet-our-makers
https://okewarainwear.com/pages/meet-our-makers
SUSTAINABLE MATERIALS
Climate change has been a top emerging issue that people around the world experience and are concerned with. There have been efforts at global awareness-raising, such as on the importance of environmental sustainability in the ways we design, produce, use and recycle our products.
1 jacket reuses 22 bottles
=
=
1 coat reuses 31 bottles
Used bottles Shredded into flakes
Melted into pellets
Extruded into yard
Spun into thread Woven into fabric
Laminated waterproof
Cut, sewn + sealed into garments
TAL Apparel Sustainability Report 2017–201818
3. BUSINESS
Product innovation (cont.)
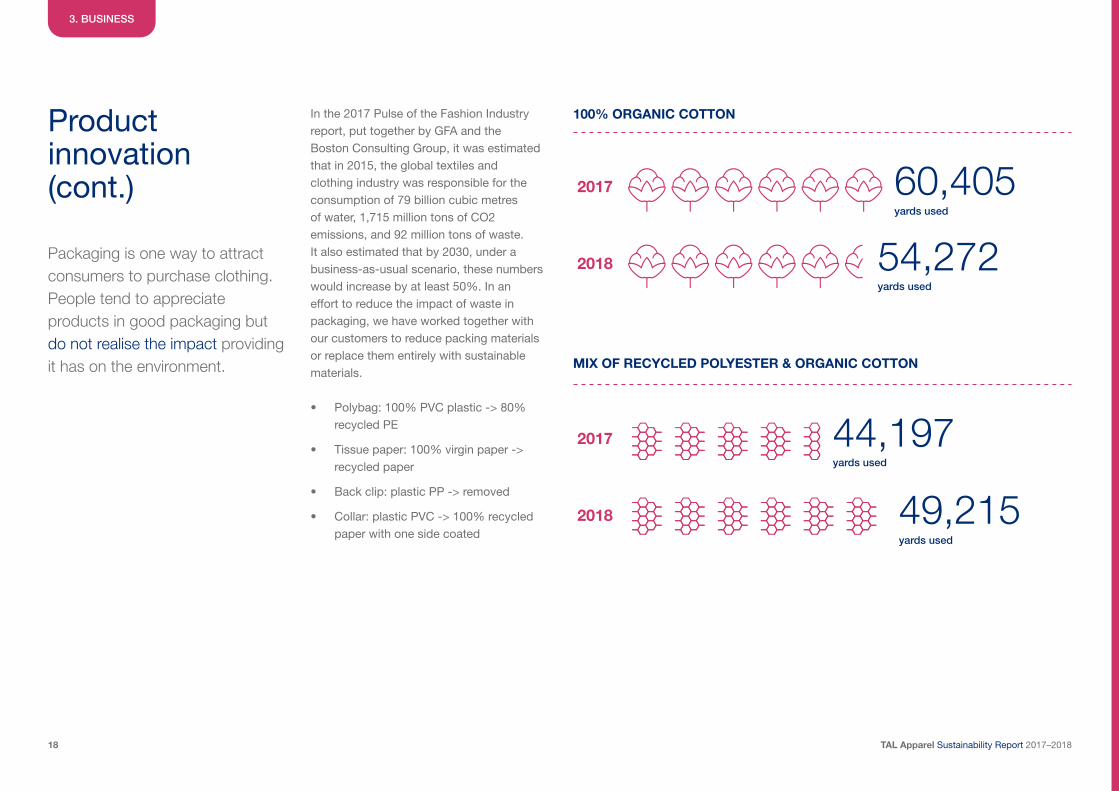
In the 2017 Pulse of the Fashion Industry report, put together by GFA and the Boston Consulting Group, it was estimated that in 2015, the global textiles and clothing industry was responsible for the consumption of 79 billion cubic metres of water, 1,715 million tons of CO2 emissions, and 92 million tons of waste. It also estimated that by 2030, under a business-as-usual scenario, these numbers would increase by at least 50%. In an effort to reduce the impact of waste in packaging, we have worked together with our customers to reduce packing materials or replace them entirely with sustainable materials.
• Polybag: 100% PVC plastic -> 80% recycled PE
• Tissue paper: 100% virgin paper -> recycled paper
• Back clip: plastic PP -> removed
• Collar: plastic PVC -> 100% recycled paper with one side coated
100% ORGANIC COTTON
MIX OF RECYCLED POLYESTER & ORGANIC COTTON
yards used
49,215
2018
2018
2017
2017
yards used
60,405
yards used
54,272
yards used
44,197
Packaging is one way to attract consumers to purchase clothing. People tend to appreciate products in good packaging but do not realise the impact providing it has on the environment.
TAL Apparel Sustainability Report 2017–201819
4
Social labour
TAL Apparel Sustainability Report 2017–201820
4. SOCIAL LABOUR
Social labour management system
At TAL Apparel, we are using the social labour management system as our framework to implement standards in social labour sustainability. The system’s Plan-Do-Check-Act (PDCA) cycle helps us to sustain and continually approve upon the
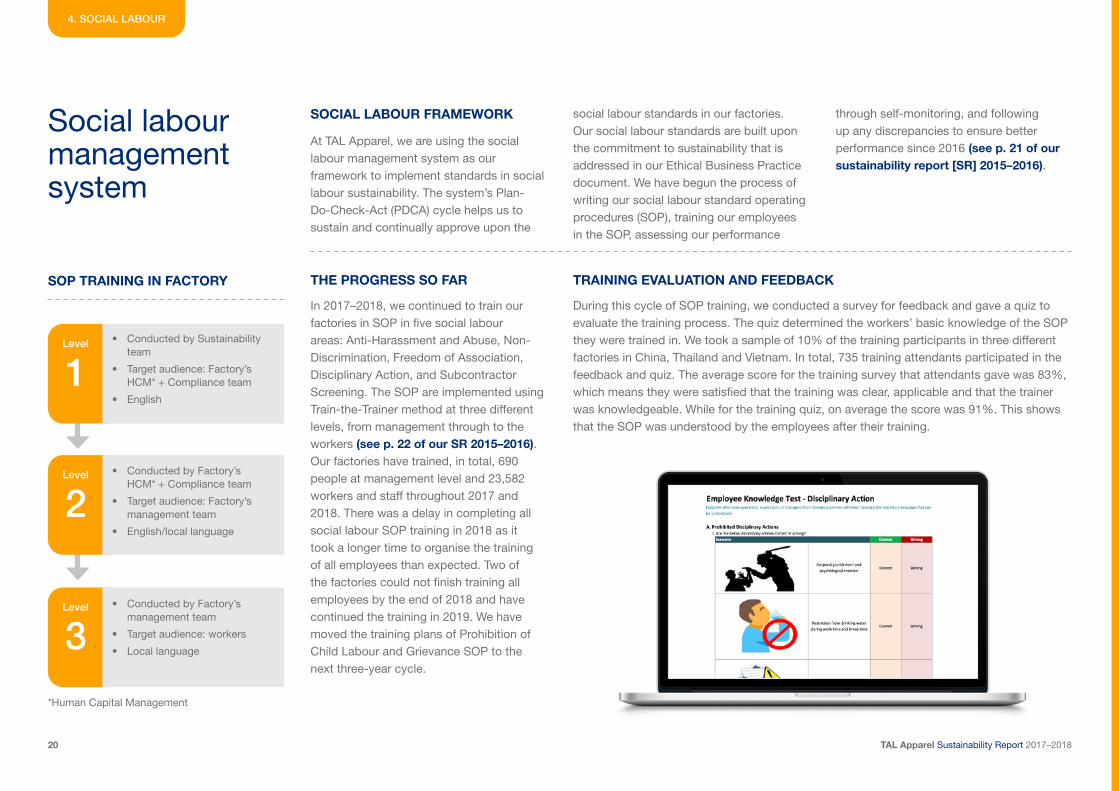
In 2017–2018, we continued to train our factories in SOP in five social labour areas: Anti-Harassment and Abuse, Non-Discrimination, Freedom of Association, Disciplinary Action, and Subcontractor Screening. The SOP are implemented using Train-the-Trainer method at three different levels, from management through to the workers (see p. 22 of our SR 2015–2016). Our factories have trained, in total, 690 people at management level and 23,582 workers and staff throughout 2017 and 2018. There was a delay in completing all social labour SOP training in 2018 as it took a longer time to organise the training of all employees than expected. Two of the factories could not finish training all employees by the end of 2018 and have continued the training in 2019. We have moved the training plans of Prohibition of Child Labour and Grievance SOP to the next three-year cycle.
During this cycle of SOP training, we conducted a survey for feedback and gave a quiz to evaluate the training process. The quiz determined the workers’ basic knowledge of the SOP they were trained in. We took a sample of 10% of the training participants in three different factories in China, Thailand and Vietnam. In total, 735 training attendants participated in the feedback and quiz. The average score for the training survey that attendants gave was 83%, which means they were satisfied that the training was clear, applicable and that the trainer was knowledgeable. While for the training quiz, on average the score was 91%. This shows that the SOP was understood by the employees after their training.
SOCIAL LABOUR FRAMEWORK
THE PROGRESS SO FAR TRAINING EVALUATION AND FEEDBACK
social labour standards in our factories. Our social labour standards are built upon the commitment to sustainability that is addressed in our Ethical Business Practice document. We have begun the process of writing our social labour standard operating procedures (SOP), training our employees in the SOP, assessing our performance
through self-monitoring, and following up any discrepancies to ensure better performance since 2016 (see p. 21 of our sustainability report [SR] 2015–2016).
• Conducted by Sustainability team
• Target audience: Factory’s HCM* + Compliance team
• English
• Conducted by Factory’s HCM* + Compliance team
• Target audience: Factory’s management team
• English/local language
• Conducted by Factory’s management team
• Target audience: workers
• Local language
1
3
2
Level
Level
Level
SOP TRAINING IN FACTORY
*Human Capital Management
TAL Apparel Sustainability Report 2017–201821
4. SOCIAL LABOUR
Self-monitoring program
Factories have been conducting self-monitoring for one topic per month instead of doing a generic social labour self-monitoring checklist each time. In 2017, the sustainability team conducted an audit using the same self-monitoring checklist for all factories. This audit is meant to validate the self-monitoring that the factories have been doing and to check if there is any gap in the results. The results were shared with the factories as part of learning process and to improve upon any discrepancies in the SOP implementation.
Parallel with the communication of more social labour SOP, we are assessing the effectiveness of these SOP communications. In the same year as the SOP training, the factories began to self-monitor on the topics of Anti-Harassment and Abuse, and Disciplinary Action. Each month the factory compliance person conducted an in-depth self-monitoring process through document-checking, worker interviews and factory walkthroughs. The advantage that we have through internal self-monitoring is that we understand our factory practice day-to-day and are able to identify discrepancies or non-compliance factors faster than through an external monitoring process. We want to understand our own social labour performance and we want to improve ourselves, rather than waiting for an external auditor to come and tell us our own issues.
SELF-MONITORING – CORPORATE INTERNAL SOP AUDIT
SELF-MONITORING UPDATE Internal identification
In May 2017, a self-audit of a Malaysian factory found some discrepancies in approved and actual overtime hours. With further employee interviews and investigations by local and divisional sustainability teams, a widespread practice was discovered where workers were asked to do overtime without pay. This issue was raised to the executive committee, and the upper management team of the factory was investigated. Two responsible upper management employees of the factory have since left. The factory reimbursed the workers who had been involved in the incidents that had occurred throughout that year.
We have learnt that the culture of a factory is set by the tone of its management. Management must be a good example of our core values. The blessing of this case is that the issue was discovered by the factory self-audit team.
Self-monitoring has been part of our Social Sustainability program for years. In 2016, adjustments were made to the self-monitoring checklist in order to align it with the SOP that were distributed.
TAL Apparel Sustainability Report 2017–201822
04SOP &
Infrastructure
02SOP &
Infrastructure
• Know their rights
• Know how to communicate grievance
• Know how to receive reply/answer
• Correct attitude/mindset
• Know how to handle/receive
• Know how to solve/answer
• Know who to involve
• Multiple availability channels
• Monitoring systems
• Reliable handling
• Standard in resolving grievance
• Reliable documentation
4. SOCIAL LABOUR
Handling grievances
GRIEVANCE SYSTEM
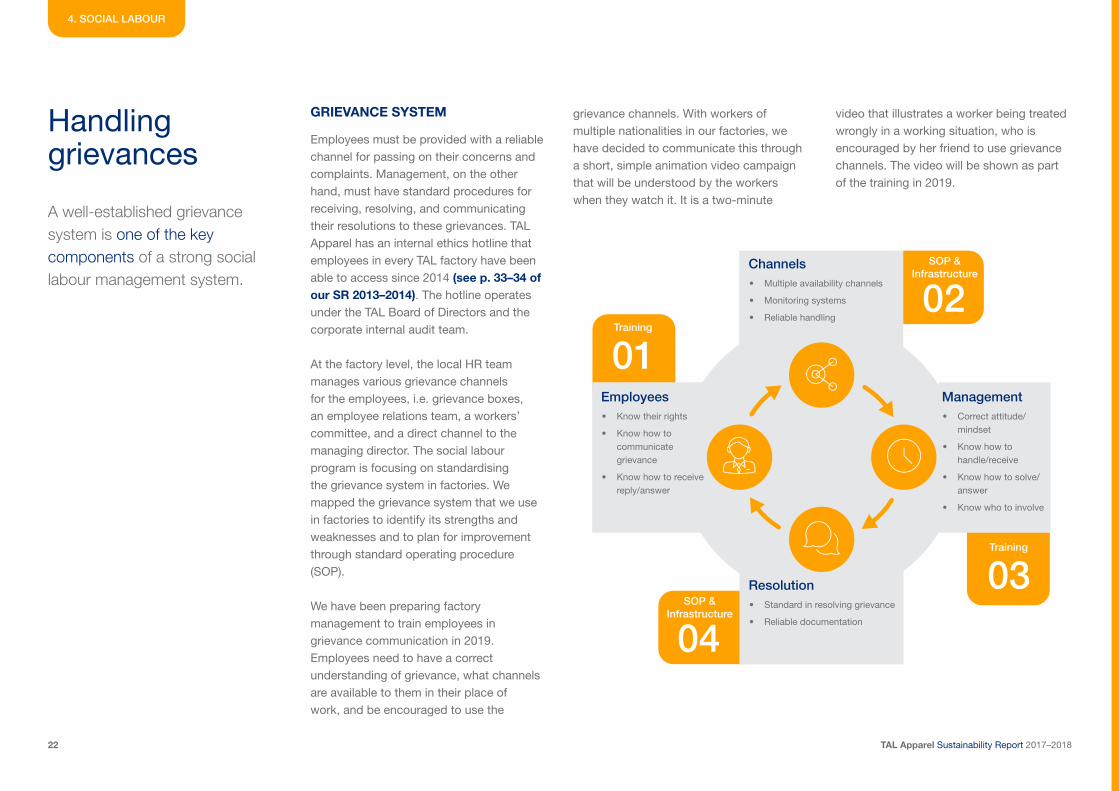
Employees must be provided with a reliable channel for passing on their concerns and complaints. Management, on the other hand, must have standard procedures for receiving, resolving, and communicating their resolutions to these grievances. TAL Apparel has an internal ethics hotline that employees in every TAL factory have been able to access since 2014 (see p. 33–34 of our SR 2013–2014). The hotline operates under the TAL Board of Directors and the corporate internal audit team.
At the factory level, the local HR team manages various grievance channels for the employees, i.e. grievance boxes, an employee relations team, a workers’ committee, and a direct channel to the managing director. The social labour program is focusing on standardising the grievance system in factories. We mapped the grievance system that we use in factories to identify its strengths and weaknesses and to plan for improvement through standard operating procedure (SOP).
We have been preparing factory management to train employees in grievance communication in 2019. Employees need to have a correct understanding of grievance, what channels are available to them in their place of work, and be encouraged to use the
A well-established grievance system is one of the key components of a strong social labour management system.
grievance channels. With workers of multiple nationalities in our factories, we have decided to communicate this through a short, simple animation video campaign that will be understood by the workers when they watch it. It is a two-minute
video that illustrates a worker being treated wrongly in a working situation, who is encouraged by her friend to use grievance channels. The video will be shown as part of the training in 2019.
01
03
Training
Training
Employees Management
Channels
Resolution
TAL Apparel Sustainability Report 2017–201823
4. SOCIAL LABOUR
Handling grievances (cont.)
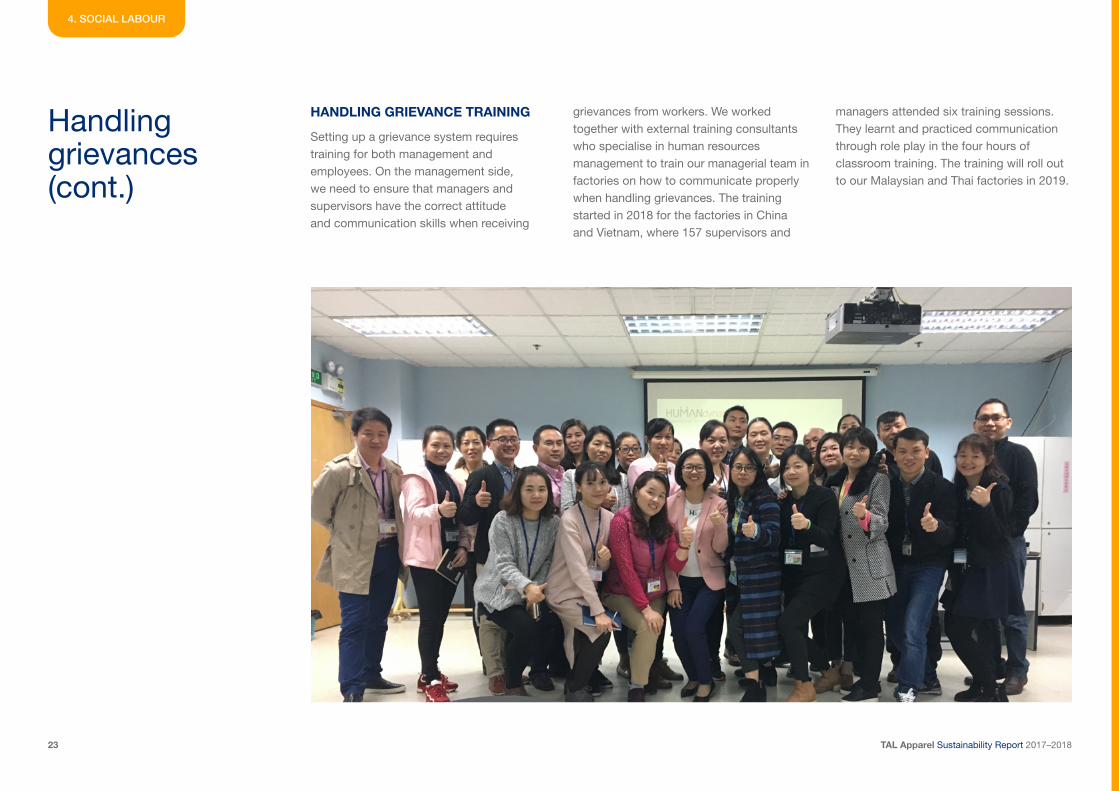
HANDLING GRIEVANCE TRAINING
Setting up a grievance system requires training for both management and employees. On the management side, we need to ensure that managers and supervisors have the correct attitude and communication skills when receiving
grievances from workers. We worked together with external training consultants who specialise in human resources management to train our managerial team in factories on how to communicate properly when handling grievances. The training started in 2018 for the factories in China and Vietnam, where 157 supervisors and
managers attended six training sessions. They learnt and practiced communication through role play in the four hours of classroom training. The training will roll out to our Malaysian and Thai factories in 2019.
TAL Apparel Sustainability Report 2017–201824
4. SOCIAL LABOUR
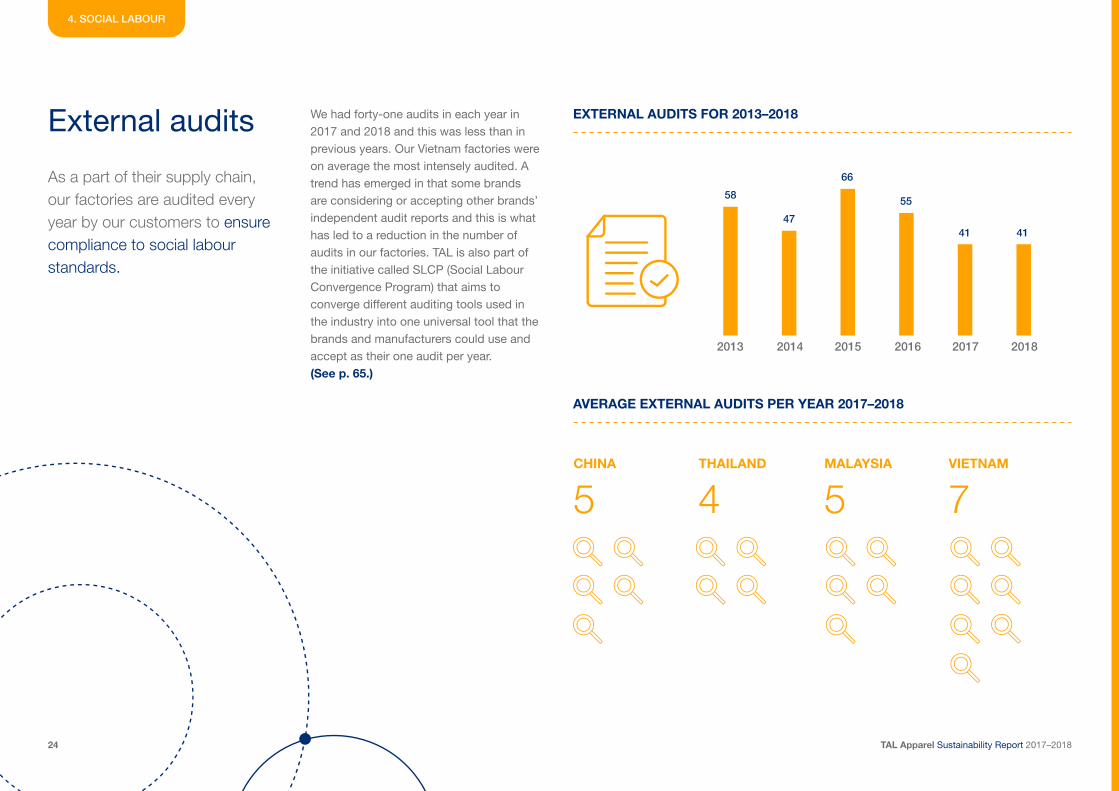
External audits We had forty-one audits in each year in 2017 and 2018 and this was less than in previous years. Our Vietnam factories were on average the most intensely audited. A trend has emerged in that some brands are considering or accepting other brands’ independent audit reports and this is what has led to a reduction in the number of audits in our factories. TAL is also part of the initiative called SLCP (Social Labour Convergence Program) that aims to converge different auditing tools used in the industry into one universal tool that the brands and manufacturers could use and accept as their one audit per year. (See p. 65.)
As a part of their supply chain, our factories are audited every year by our customers to ensure compliance to social labour standards.
EXTERNAL AUDITS FOR 2013–2018
AVERAGE EXTERNAL AUDITS PER YEAR 2017–2018
58
47
66
55
41 41
2013 2014 2015 2016 2017 2018
CHINA THAILAND MALAYSIA VIETNAM
5 4 5 7
TAL Apparel Sustainability Report 2017–201825
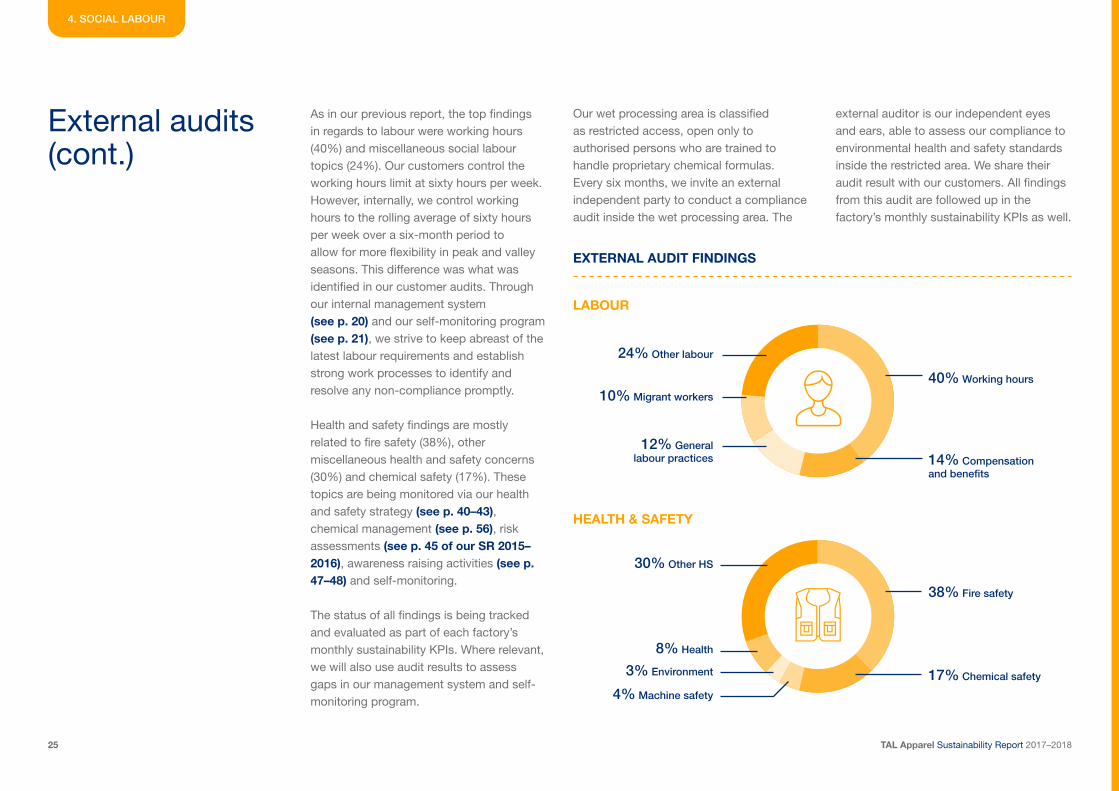
As in our previous report, the top findings in regards to labour were working hours (40%) and miscellaneous social labour topics (24%). Our customers control the working hours limit at sixty hours per week. However, internally, we control working hours to the rolling average of sixty hours per week over a six-month period to allow for more flexibility in peak and valley seasons. This difference was what was identified in our customer audits. Through our internal management system (see p. 20) and our self-monitoring program (see p. 21), we strive to keep abreast of the latest labour requirements and establish strong work processes to identify and resolve any non-compliance promptly.
Health and safety findings are mostly related to fire safety (38%), other miscellaneous health and safety concerns (30%) and chemical safety (17%). These topics are being monitored via our health and safety strategy (see p. 40–43), chemical management (see p. 56), risk assessments (see p. 45 of our SR 2015–2016), awareness raising activities (see p. 47–48) and self-monitoring.
The status of all findings is being tracked and evaluated as part of each factory’s monthly sustainability KPIs. Where relevant, we will also use audit results to assess gaps in our management system and self-monitoring program.
EXTERNAL AUDIT FINDINGS
24% Other labour
30% Other HS
10% Migrant workers
8% Health
12% General labour practices
3% Environment
4% Machine safety
14% Compensation and benefits
17% Chemical safety
40% Working hours
38% Fire safety
External audits (cont.)
Our wet processing area is classified as restricted access, open only to authorised persons who are trained to handle proprietary chemical formulas. Every six months, we invite an external independent party to conduct a compliance audit inside the wet processing area. The
external auditor is our independent eyes and ears, able to assess our compliance to environmental health and safety standards inside the restricted area. We share their audit result with our customers. All findings from this audit are followed up in the factory’s monthly sustainability KPIs as well.
4. SOCIAL LABOUR
LABOUR
HEALTH & SAFETY
TAL Apparel Sustainability Report 2017–201826
4. SOCIAL LABOUR
Foreign migrant workers management
FAIR RECRUITMENT
In the globalised world, the International Labour Organization’s (ILO) recent data shows that 72.7% of the 206.6 million working age migrant population are workers. These migrant workers face numerous hardships in the labour market. Workers on the move can face unfair recruitment and hiring practices, poor working conditions and compromised legal and regulatory environments, which at the end leave them highly vulnerable to exploitation. In 2014, the ILO and other multi-stakeholders launched a global Fair Recruitment Initiative, to help prevent human trafficking and forced labour, to protect the rights of workers from abusive and fraudulent practices during the recruitment and placement process, and to reduce the cost of labour migration and enhance development outcomes for migrant workers and their families.
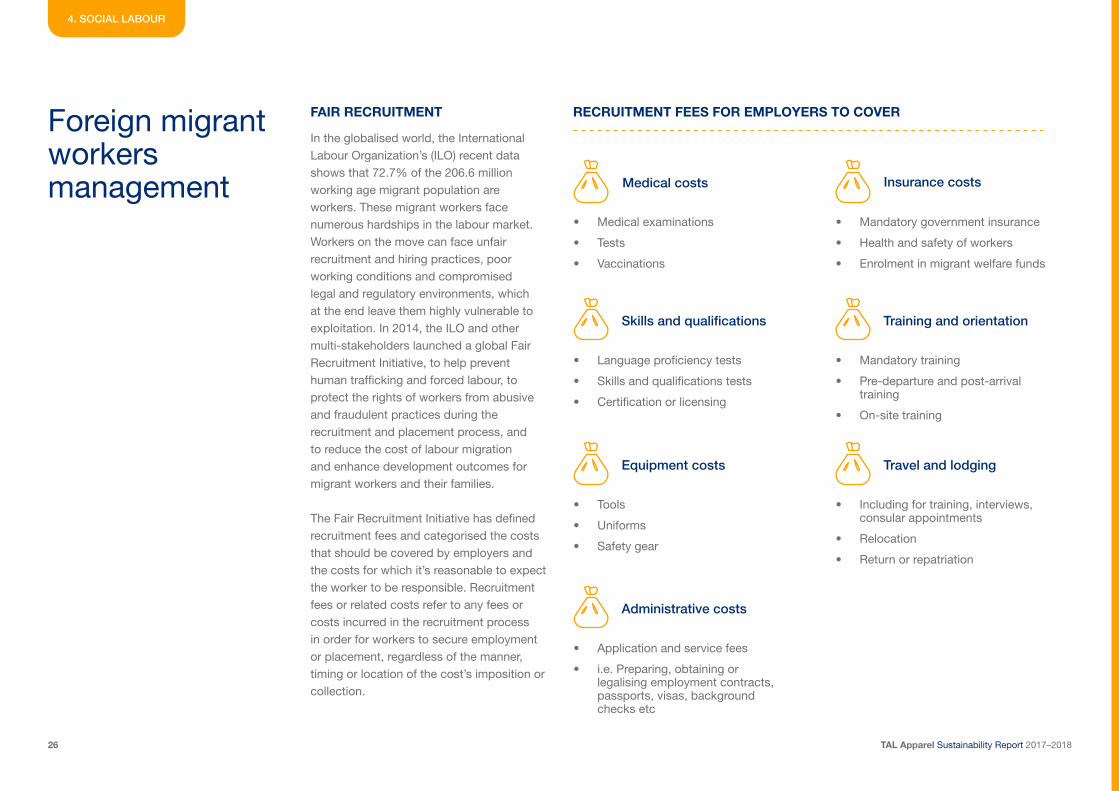
The Fair Recruitment Initiative has defined recruitment fees and categorised the costs that should be covered by employers and the costs for which it’s reasonable to expect the worker to be responsible. Recruitment fees or related costs refer to any fees or costs incurred in the recruitment process in order for workers to secure employment or placement, regardless of the manner, timing or location of the cost’s imposition or collection.
RECRUITMENT FEES FOR EMPLOYERS TO COVER
Medical costs
Skills and qualifications
Equipment costs
Administrative costs
Insurance costs
Training and orientation
Travel and lodging
• Medical examinations
• Tests
• Vaccinations
• Mandatory government insurance
• Health and safety of workers
• Enrolment in migrant welfare funds
• Language proficiency tests
• Skills and qualifications tests
• Certification or licensing
• Tools
• Uniforms
• Safety gear
• Application and service fees
• i.e. Preparing, obtaining or legalising employment contracts, passports, visas, background checks etc
• Mandatory training
• Pre-departure and post-arrival training
• On-site training
• Including for training, interviews, consular appointments
• Relocation
• Return or repatriation
TAL Apparel Sustainability Report 2017–201827
Foreign migrant workers management (cont.)
FOREIGN MIGRANT WORKERS MANAGEMENT IN MALAYSIA
TAL opened its factory in Penang in 1982 and its Ipoh factory in 1986. Due to the shortage of semi-skilled and unskilled labour in Malaysia, in particular in the garment industry, we began recruiting foreign migrant workers in 2000 from Indonesia. We fill the vacancies in which the locals are not interested with foreign migrant workers.
Our primary concern is to ensure our recruitment process and the management of our migrant labour workforce does not induce any form of forced labour. Today, we recruit employees from Indonesia, Myanmar, Nepal and Sri Lanka. The recruitment of Vietnamese employees has naturally slowed down over the years given the economic development in Vietnam. In 2018, we stopped recruiting employees from Bangladesh because of the lack of rigour and transparency of the local Bangladeshi agents as well as their unwillingness to follow our recruitment procedure.
In the past, our foreign migrant employees used to reimburse costs directly to the agent. We have changed the system in order to reduce the risk of agents over-charging recruitment fees. The total of recruitment costs borne by our employees
is paid by our respective factories to the recruiting agent in the first place and the employees then slowly reimburse that cost to the factory with no interest. In the event an employee leaves the company before the total reimbursement takes place, the factory absorbs the totality of the remaining cost.
We continually review our position when it comes to the issue of the recruitment fee of migrant workers. The amount involved in fully paying for the recruitment fee of all migrant workers is not small. We estimate that the total amount involved per year would be US$4.12m.
In light of the Fair Recruitment Initiative, we plan to review and standardise our practice in the group following ILO’s guidelines and continue to work with our customers to progressively improve the situation.
4. SOCIAL LABOUR
TAL Apparel Sustainability Report 2017–201828
Managerial Leadership Competencies (MLC)
4. SOCIAL LABOUR
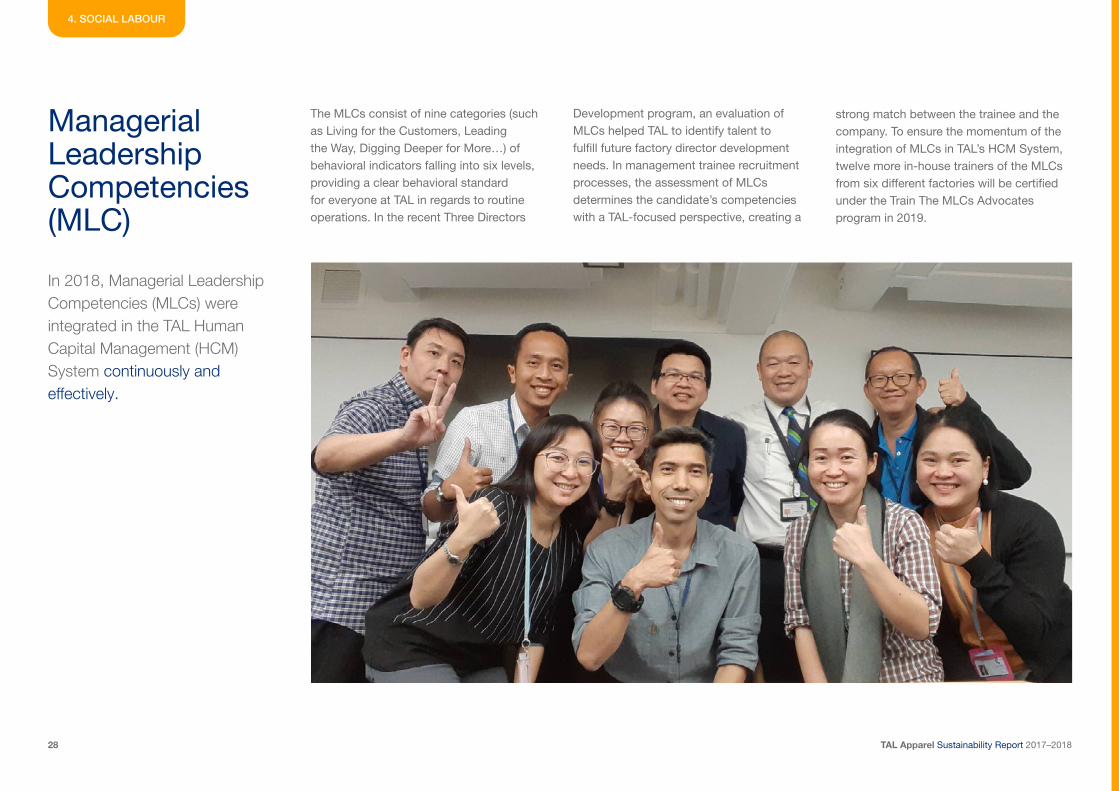
The MLCs consist of nine categories (such as Living for the Customers, Leading the Way, Digging Deeper for More…) of behavioral indicators falling into six levels, providing a clear behavioral standard for everyone at TAL in regards to routine operations. In the recent Three Directors
Development program, an evaluation of MLCs helped TAL to identify talent to fulfill future factory director development needs. In management trainee recruitment processes, the assessment of MLCs determines the candidate’s competencies with a TAL-focused perspective, creating a
strong match between the trainee and the company. To ensure the momentum of the integration of MLCs in TAL’s HCM System, twelve more in-house trainers of the MLCs from six different factories will be certified under the Train The MLCs Advocates program in 2019.
In 2018, Managerial Leadership Competencies (MLCs) were integrated in the TAL Human Capital Management (HCM) System continuously and effectively.
TAL Apparel Sustainability Report 2017–201829
Functional Skills Knowledge training (FSK)
4. SOCIAL LABOUR
Improving the effectiveness of our training and improving our success at sending learners away with favorable attitudes towards the subjects of the programs are aspects we continue to think about, and continually make adjustments to.
IT’S AN ONGOING PROCESS!
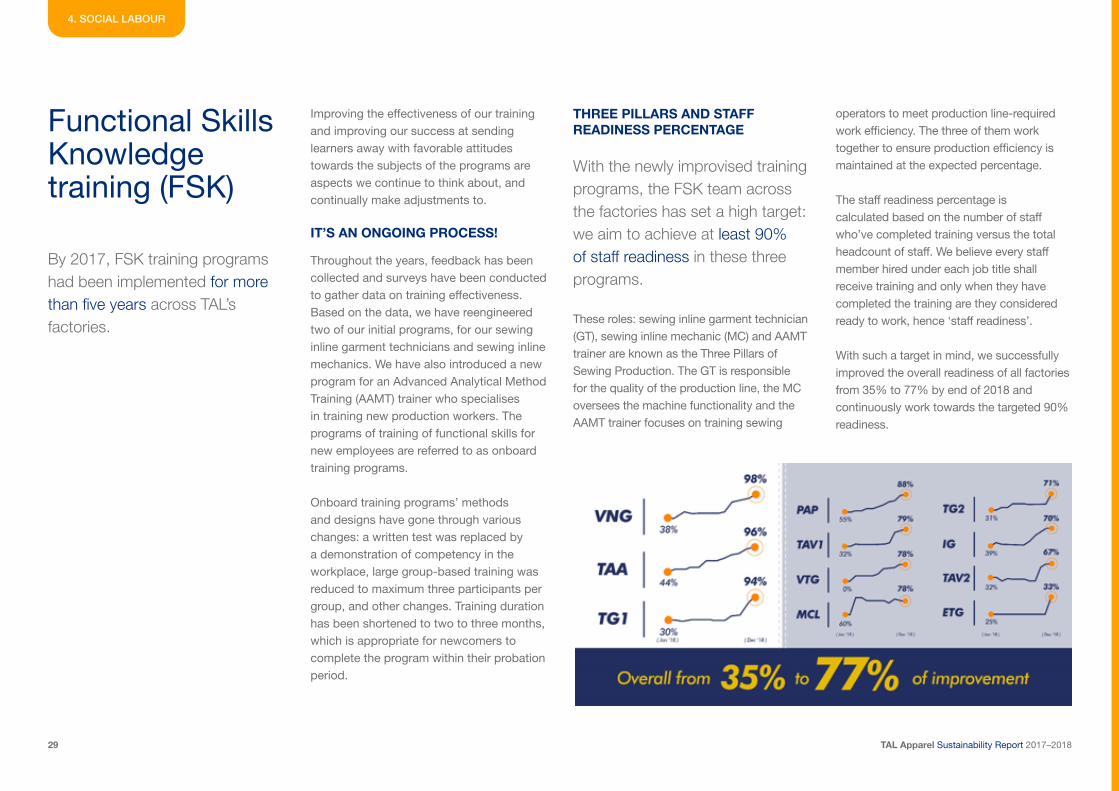
THREE PILLARS AND STAFF READINESS PERCENTAGE
These roles: sewing inline garment technician (GT), sewing inline mechanic (MC) and AAMT trainer are known as the Three Pillars of Sewing Production. The GT is responsible for the quality of the production line, the MC oversees the machine functionality and the AAMT trainer focuses on training sewing
With the newly improvised training programs, the FSK team across the factories has set a high target: we aim to achieve at least 90% of staff readiness in these three programs.
operators to meet production line-required work efficiency. The three of them work together to ensure production efficiency is maintained at the expected percentage.
The staff readiness percentage is calculated based on the number of staff who’ve completed training versus the total headcount of staff. We believe every staff member hired under each job title shall receive training and only when they have completed the training are they considered ready to work, hence ‘staff readiness’.
With such a target in mind, we successfully improved the overall readiness of all factories from 35% to 77% by end of 2018 and continuously work towards the targeted 90% readiness.
By 2017, FSK training programs had been implemented for more than five years across TAL’s factories.
Throughout the years, feedback has been collected and surveys have been conducted to gather data on training effectiveness. Based on the data, we have reengineered two of our initial programs, for our sewing inline garment technicians and sewing inline mechanics. We have also introduced a new program for an Advanced Analytical Method Training (AAMT) trainer who specialises in training new production workers. The programs of training of functional skills for new employees are referred to as onboard training programs.
Onboard training programs’ methods and designs have gone through various changes: a written test was replaced by a demonstration of competency in the workplace, large group-based training was reduced to maximum three participants per group, and other changes. Training duration has been shortened to two to three months, which is appropriate for newcomers to complete the program within their probation period.
TAL Apparel Sustainability Report 2017–201830
Functional Skills Training (FSK) (cont.)
4. SOCIAL LABOUR
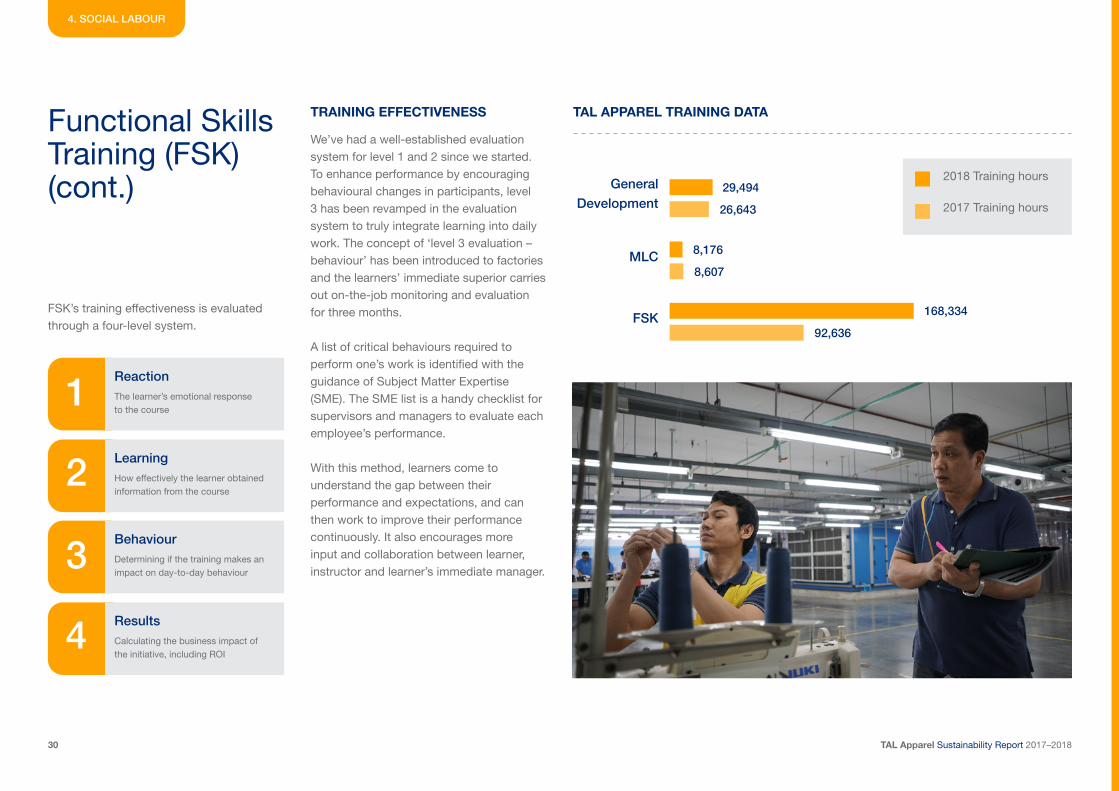
TRAINING EFFECTIVENESS TAL APPAREL TRAINING DATA
FSK’s training effectiveness is evaluated through a four-level system.
The learner’s emotional response to the course
Determining if the training makes an impact on day-to-day behaviour
How effectively the learner obtained information from the course
Calculating the business impact of the initiative, including ROI
We’ve had a well-established evaluation system for level 1 and 2 since we started. To enhance performance by encouraging behavioural changes in participants, level 3 has been revamped in the evaluation system to truly integrate learning into daily work. The concept of ‘level 3 evaluation – behaviour’ has been introduced to factories and the learners’ immediate superior carries out on-the-job monitoring and evaluation for three months.
A list of critical behaviours required to perform one’s work is identified with the guidance of Subject Matter Expertise (SME). The SME list is a handy checklist for supervisors and managers to evaluate each employee’s performance.
With this method, learners come to understand the gap between their performance and expectations, and can then work to improve their performance continuously. It also encourages more input and collaboration between learner, instructor and learner’s immediate manager.
Reaction
Behaviour
1
3
2
4
Learning
Results
29,494
8,176
168,334
26,643
8,607
92,636
2018 Training hours
2017 Training hours
MLC
FSK
General Development
TAL Apparel Sustainability Report 2017–201831
Talent management
4. SOCIAL LABOUR
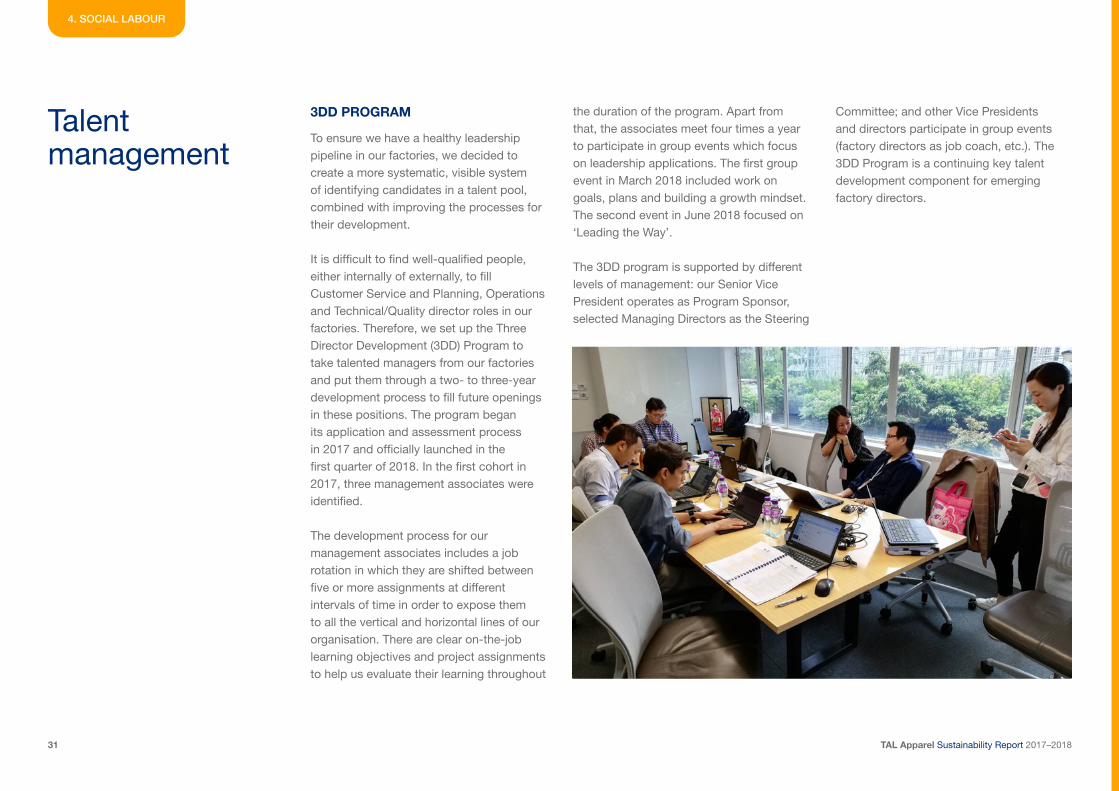
3DD PROGRAM
To ensure we have a healthy leadership pipeline in our factories, we decided to create a more systematic, visible system of identifying candidates in a talent pool, combined with improving the processes for their development.
It is difficult to find well-qualified people, either internally of externally, to fill Customer Service and Planning, Operations and Technical/Quality director roles in our factories. Therefore, we set up the Three Director Development (3DD) Program to take talented managers from our factories and put them through a two- to three-year development process to fill future openings in these positions. The program began its application and assessment process in 2017 and officially launched in the first quarter of 2018. In the first cohort in 2017, three management associates were identified.
The development process for our management associates includes a job rotation in which they are shifted between five or more assignments at different intervals of time in order to expose them to all the vertical and horizontal lines of our organisation. There are clear on-the-job learning objectives and project assignments to help us evaluate their learning throughout
the duration of the program. Apart from that, the associates meet four times a year to participate in group events which focus on leadership applications. The first group event in March 2018 included work on goals, plans and building a growth mindset. The second event in June 2018 focused on ‘Leading the Way’.
The 3DD program is supported by different levels of management: our Senior Vice President operates as Program Sponsor, selected Managing Directors as the Steering
Committee; and other Vice Presidents and directors participate in group events (factory directors as job coach, etc.). The 3DD Program is a continuing key talent development component for emerging factory directors.
TAL Apparel Sustainability Report 2017–201832
Charitable donations
4. SOCIAL LABOUR
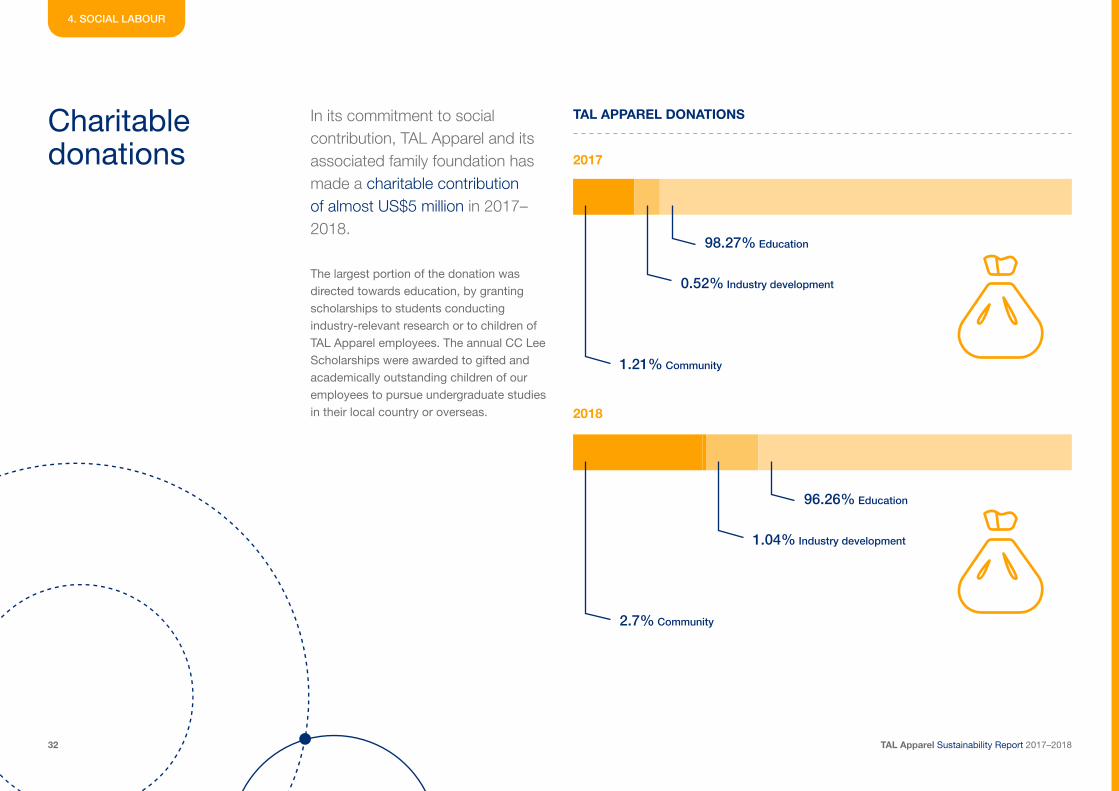
The largest portion of the donation was directed towards education, by granting scholarships to students conducting industry-relevant research or to children of TAL Apparel employees. The annual CC Lee Scholarships were awarded to gifted and academically outstanding children of our employees to pursue undergraduate studies in their local country or overseas.
TAL APPAREL DONATIONSIn its commitment to social contribution, TAL Apparel and its associated family foundation has made a charitable contribution of almost US$5 million in 2017–2018.
2017
2018
0.52% Industry development
1.04% Industry development
98.27% Education
96.26% Education
1.21% Community
2.7% Community
TAL Apparel Sustainability Report 2017–201833
Community involvement
4. SOCIAL LABOUR
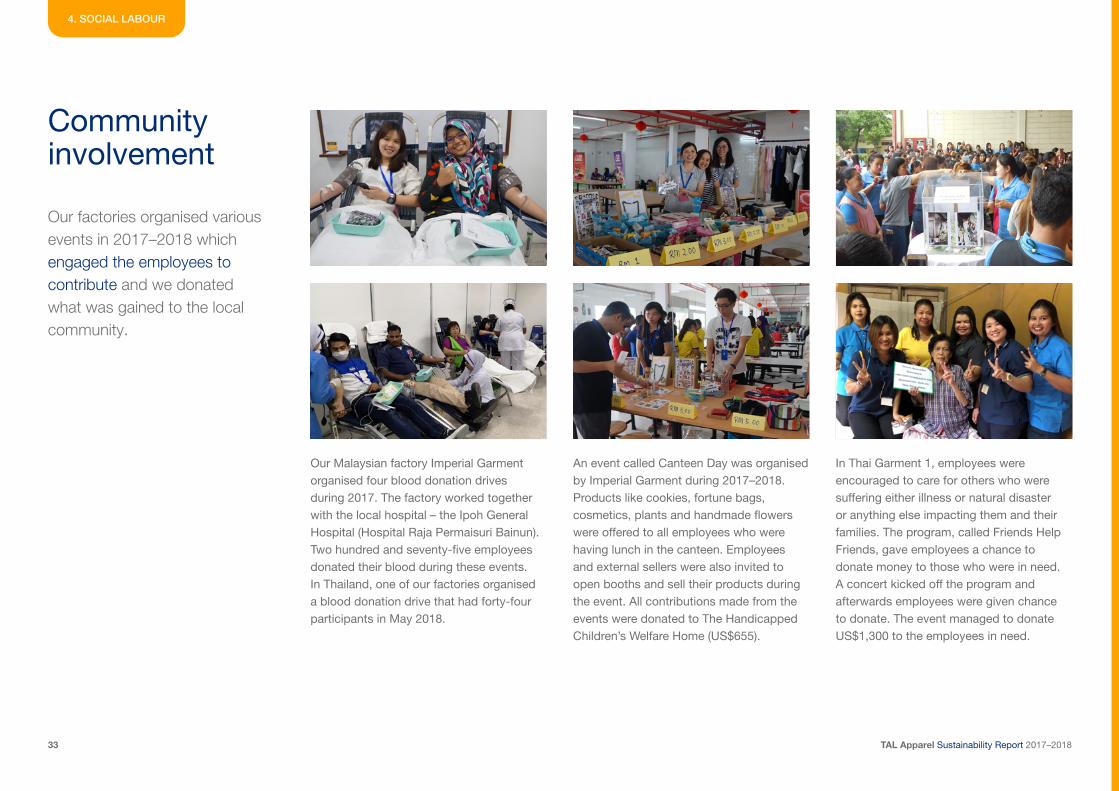
Our factories organised various events in 2017–2018 which engaged the employees to contribute and we donated what was gained to the local community.
Our Malaysian factory Imperial Garment organised four blood donation drives during 2017. The factory worked together with the local hospital – the Ipoh General Hospital (Hospital Raja Permaisuri Bainun). Two hundred and seventy-five employees donated their blood during these events. In Thailand, one of our factories organised a blood donation drive that had forty-four participants in May 2018.
An event called Canteen Day was organised by Imperial Garment during 2017–2018. Products like cookies, fortune bags, cosmetics, plants and handmade flowers were offered to all employees who were having lunch in the canteen. Employees and external sellers were also invited to open booths and sell their products during the event. All contributions made from the events were donated to The Handicapped Children’s Welfare Home (US$655).
In Thai Garment 1, employees were encouraged to care for others who were suffering either illness or natural disaster or anything else impacting them and their families. The program, called Friends Help Friends, gave employees a chance to donate money to those who were in need. A concert kicked off the program and afterwards employees were given chance to donate. The event managed to donate US$1,300 to the employees in need.
TAL Apparel Sustainability Report 2017–201834
Community involvement (cont.)
4. SOCIAL LABOUR
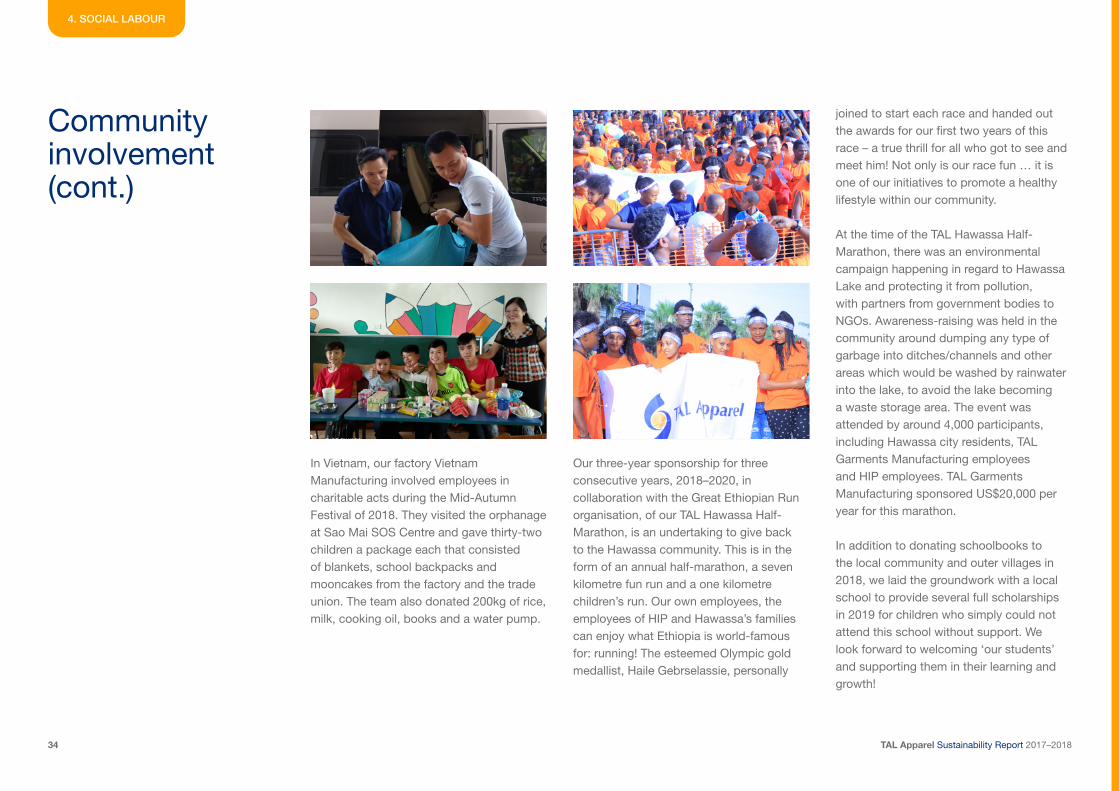
In Vietnam, our factory Vietnam Manufacturing involved employees in charitable acts during the Mid-Autumn Festival of 2018. They visited the orphanage at Sao Mai SOS Centre and gave thirty-two children a package each that consisted of blankets, school backpacks and mooncakes from the factory and the trade union. The team also donated 200kg of rice, milk, cooking oil, books and a water pump.
Our three-year sponsorship for three consecutive years, 2018–2020, in collaboration with the Great Ethiopian Run organisation, of our TAL Hawassa Half-Marathon, is an undertaking to give back to the Hawassa community. This is in the form of an annual half-marathon, a seven kilometre fun run and a one kilometre children’s run. Our own employees, the employees of HIP and Hawassa’s families can enjoy what Ethiopia is world-famous for: running! The esteemed Olympic gold medallist, Haile Gebrselassie, personally
joined to start each race and handed out the awards for our first two years of this race – a true thrill for all who got to see and meet him! Not only is our race fun … it is one of our initiatives to promote a healthy lifestyle within our community.
At the time of the TAL Hawassa Half-Marathon, there was an environmental campaign happening in regard to Hawassa Lake and protecting it from pollution, with partners from government bodies to NGOs. Awareness-raising was held in the community around dumping any type of garbage into ditches/channels and other areas which would be washed by rainwater into the lake, to avoid the lake becoming a waste storage area. The event was attended by around 4,000 participants, including Hawassa city residents, TAL Garments Manufacturing employees and HIP employees. TAL Garments Manufacturing sponsored US$20,000 per year for this marathon.
In addition to donating schoolbooks to the local community and outer villages in 2018, we laid the groundwork with a local school to provide several full scholarships in 2019 for children who simply could not attend this school without support. We look forward to welcoming ‘our students’ and supporting them in their learning and growth!
TAL Apparel Sustainability Report 2017–201835
Subcontractor screening
4. SOCIAL LABOUR
The relevant sustainable products can only be created via a sustainable supply chain that involves the people at every level. As a manufacturer, we are being audited by our brands to ensure compliance to their standards. To maintain the sustainability in the supply chain, we are also ensuring the subcontractors we work with keep to the same compliance standards.
Our factories follow a unified screening process to approve of subcontractors through audits by our factory teams and/or external firms. We aim to only work with subcontractors that strive to follow the same sustainability standards as us. (See our SR 2015–2016, p. 50.)
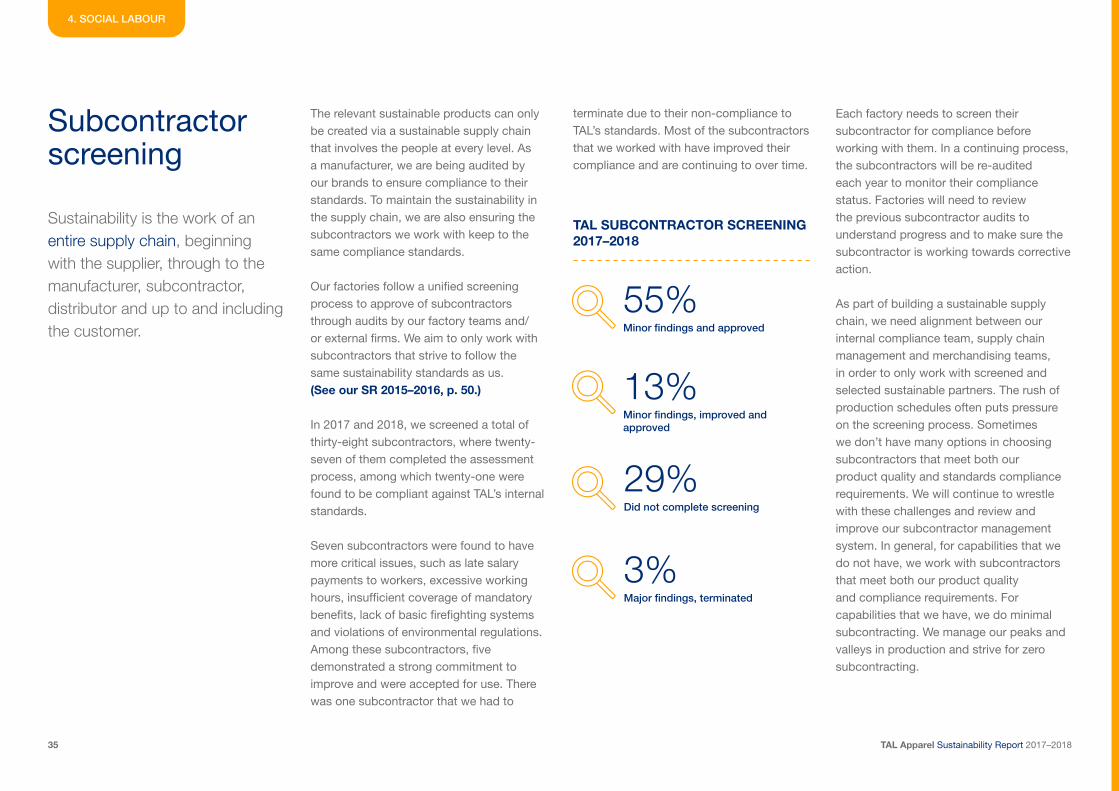
In 2017 and 2018, we screened a total of thirty-eight subcontractors, where twenty-seven of them completed the assessment process, among which twenty-one were found to be compliant against TAL’s internal standards.
Seven subcontractors were found to have more critical issues, such as late salary payments to workers, excessive working hours, insufficient coverage of mandatory benefits, lack of basic firefighting systems and violations of environmental regulations. Among these subcontractors, five demonstrated a strong commitment to improve and were accepted for use. There was one subcontractor that we had to
terminate due to their non-compliance to TAL’s standards. Most of the subcontractors that we worked with have improved their compliance and are continuing to over time.
TAL SUBCONTRACTOR SCREENING 2017–2018
Minor findings and approved
Did not complete screening
Minor findings, improved and approved
Major findings, terminated
55%
29%
13%
3%
Sustainability is the work of an entire supply chain, beginning with the supplier, through to the manufacturer, subcontractor, distributor and up to and including the customer.
Each factory needs to screen their subcontractor for compliance before working with them. In a continuing process, the subcontractors will be re-audited each year to monitor their compliance status. Factories will need to review the previous subcontractor audits to understand progress and to make sure the subcontractor is working towards corrective action.
As part of building a sustainable supply chain, we need alignment between our internal compliance team, supply chain management and merchandising teams, in order to only work with screened and selected sustainable partners. The rush of production schedules often puts pressure on the screening process. Sometimes we don’t have many options in choosing subcontractors that meet both our product quality and standards compliance requirements. We will continue to wrestle with these challenges and review and improve our subcontractor management system. In general, for capabilities that we do not have, we work with subcontractors that meet both our product quality and compliance requirements. For capabilities that we have, we do minimal subcontracting. We manage our peaks and valleys in production and strive for zero subcontracting.
TAL Apparel Sustainability Report 2017–201836
5
Health and safety
TAL Apparel Sustainability Report 2017–201837
Health and safety performance
5. HEALTH AND SAFETY
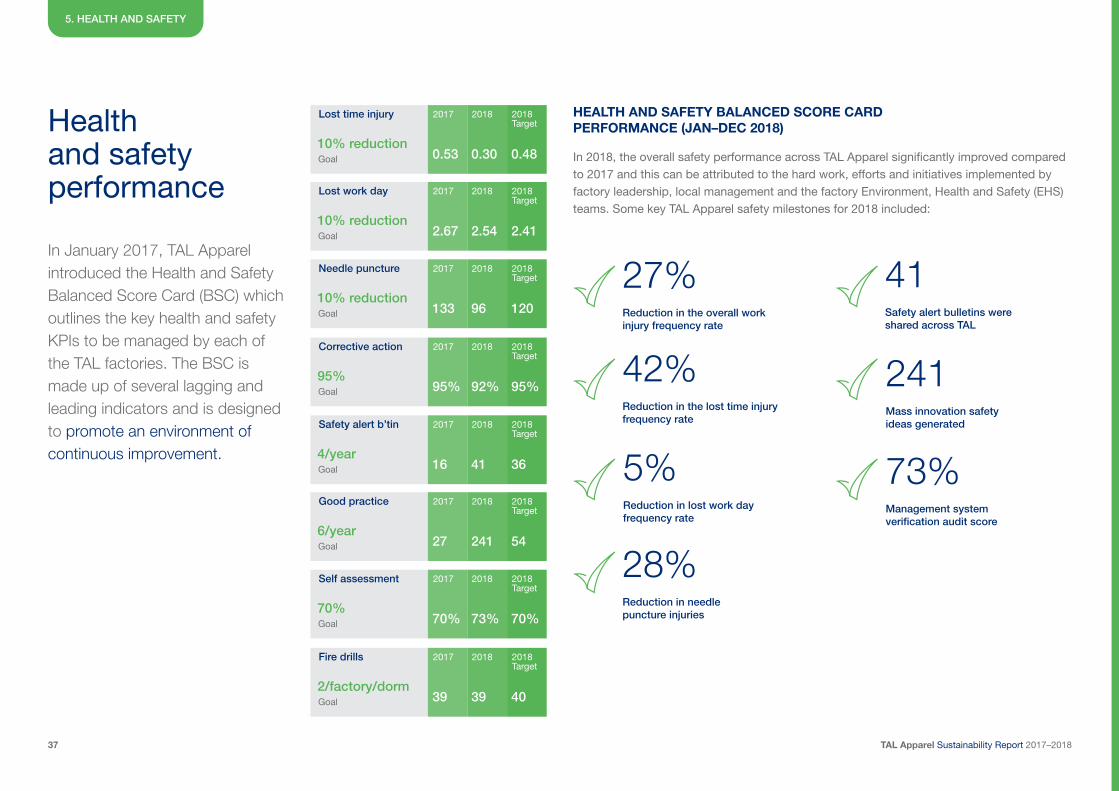
In January 2017, TAL Apparel introduced the Health and Safety Balanced Score Card (BSC) which outlines the key health and safety KPIs to be managed by each of the TAL factories. The BSC is made up of several lagging and leading indicators and is designed to promote an environment of continuous improvement.
HEALTH AND SAFETY BALANCED SCORE CARD PERFORMANCE (JAN–DEC 2018)
In 2018, the overall safety performance across TAL Apparel significantly improved compared to 2017 and this can be attributed to the hard work, efforts and initiatives implemented by factory leadership, local management and the factory Environment, Health and Safety (EHS) teams. Some key TAL Apparel safety milestones for 2018 included:
Reduction in the overall work injury frequency rate
Reduction in lost work day frequency rate
Mass innovation safety ideas generated
Reduction in the lost time injury frequency rate
Safety alert bulletins were shared across TAL
Reduction in needle puncture injuries
Management system verification audit score
27%
5%
24142%
41
28%
73%
Goal
Goal
Goal
Goal
Goal
Goal
Goal
Goal
2017
2017
2017
2017
2017
2017
2017
2017
2018
2018
2018
2018
2018
2018
2018
2018
2018 Target
2018 Target
2018 Target
2018 Target
2018 Target
2018 Target
2018 Target
2018 Target
Lost time injury
Safety alert b’tin
Lost work day
Good practice
Needle puncture
Self assessment
Corrective action
Fire drills
10% reduction
4/year
10% reduction
6/year
10% reduction
70%
95%
2/factory/dorm
0.53
16
2.67
27
133
70%
95%
39
0.30
41
2.54
241
96
73%
92%
39
0.48
36
2.41
54
120
70%
95%
40
TAL Apparel Sustainability Report 2017–201838
Health and safety performance (cont.)
5. HEALTH AND SAFETY
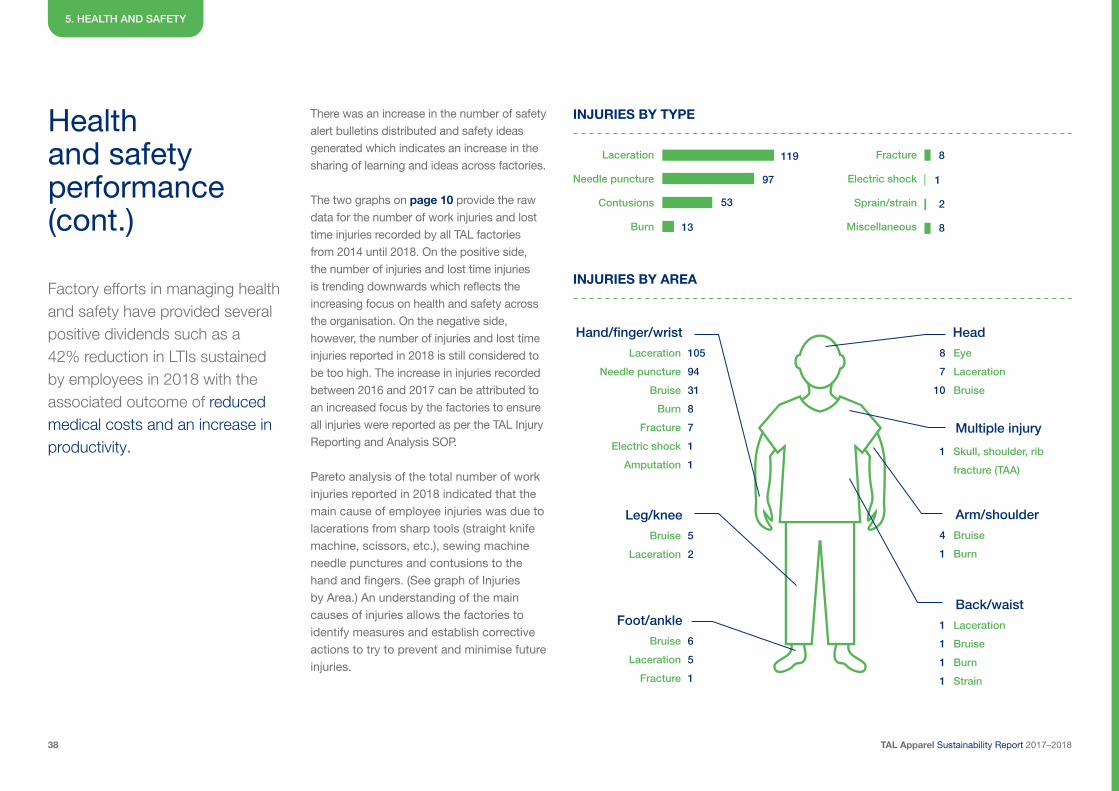
There was an increase in the number of safety alert bulletins distributed and safety ideas generated which indicates an increase in the sharing of learning and ideas across factories.
The two graphs on page 10 provide the raw data for the number of work injuries and lost time injuries recorded by all TAL factories from 2014 until 2018. On the positive side, the number of injuries and lost time injuries is trending downwards which reflects the increasing focus on health and safety across the organisation. On the negative side, however, the number of injuries and lost time injuries reported in 2018 is still considered to be too high. The increase in injuries recorded between 2016 and 2017 can be attributed to an increased focus by the factories to ensure all injuries were reported as per the TAL Injury Reporting and Analysis SOP.
Pareto analysis of the total number of work injuries reported in 2018 indicated that the main cause of employee injuries was due to lacerations from sharp tools (straight knife machine, scissors, etc.), sewing machine needle punctures and contusions to the hand and fingers. (See graph of Injuries by Area.) An understanding of the main causes of injuries allows the factories to identify measures and establish corrective actions to try to prevent and minimise future injuries.
Factory efforts in managing health and safety have provided several positive dividends such as a 42% reduction in LTIs sustained by employees in 2018 with the associated outcome of reduced medical costs and an increase in productivity.
Laceration
Needle puncture
Contusions
Burn
Laceration
Needle puncture
Bruise
Burn
Fracture
Electric shock
Amputation
Eye
Laceration
Bruise
Bruise
Burn
Laceration
Bruise
Burn
Strain
Skull, shoulder, rib
fracture (TAA)
105
94
31
8
7
1
1
8
7
10
4
1
1
1
1
1
1
Fracture
Electric shock
Sprain/strain
Miscellaneous
119
97
53
13
8
1
2
8
INJURIES BY TYPE
INJURIES BY AREA
Hand/finger/wrist Head
Arm/shoulder
Back/waist
Multiple injury
Bruise
Laceration
Fracture
Bruise
Laceration
6
5
1
5
2
Foot/ankle
Leg/knee
TAL Apparel Sustainability Report 2017–201839
Firstly, we need to promote an environment where leadership takes full ownership of health and safety and the level of commitment is maintained and strengthened. Secondly, we need to create an environment where every person in the organisation understands their role and responsibility when it comes to managing safety, and thirdly, we need to introduce programs that promote employee engagement.
Health and safety performance (cont.)
5. HEALTH AND SAFETY
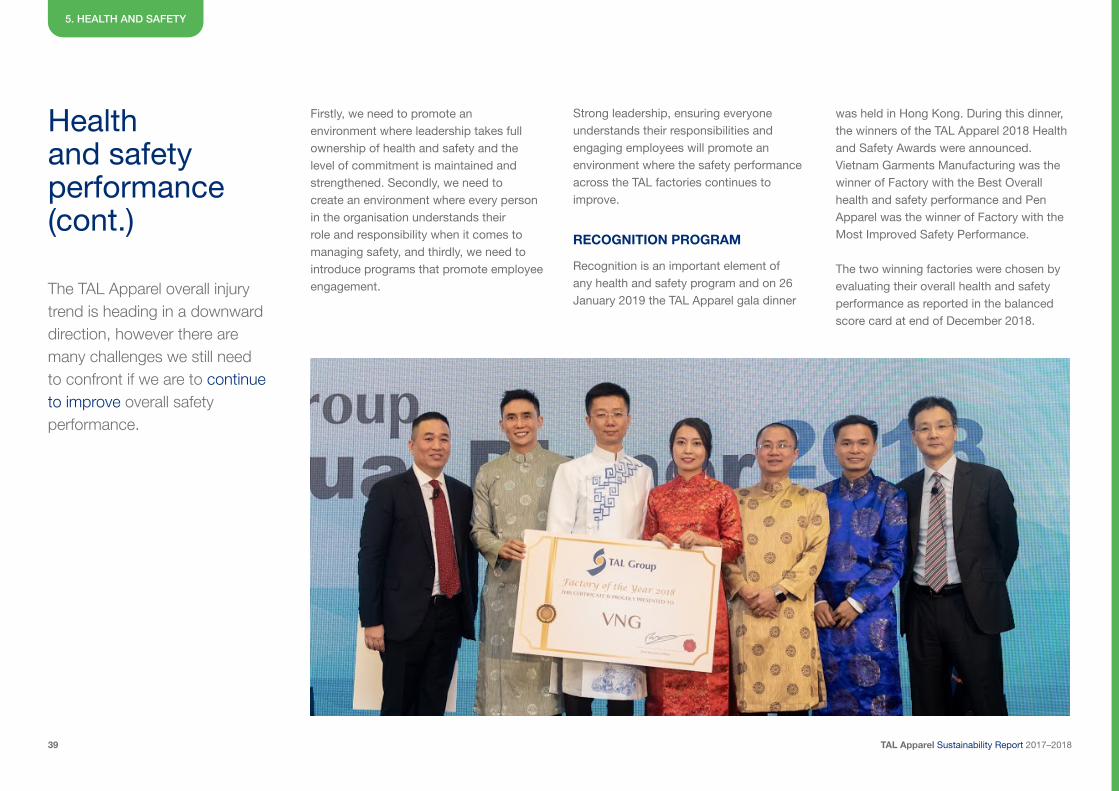
RECOGNITION PROGRAM
Recognition is an important element of any health and safety program and on 26 January 2019 the TAL Apparel gala dinner
was held in Hong Kong. During this dinner, the winners of the TAL Apparel 2018 Health and Safety Awards were announced. Vietnam Garments Manufacturing was the winner of Factory with the Best Overall health and safety performance and Pen Apparel was the winner of Factory with the Most Improved Safety Performance.
The two winning factories were chosen by evaluating their overall health and safety performance as reported in the balanced score card at end of December 2018.
Strong leadership, ensuring everyone understands their responsibilities and engaging employees will promote an environment where the safety performance across the TAL factories continues to improve.
The TAL Apparel overall injury trend is heading in a downward direction, however there are many challenges we still need to confront if we are to continue to improve overall safety performance.
TAL Apparel Sustainability Report 2017–201840
Health and safety strategy update
5. HEALTH AND SAFETY
The TAL Apparel Sustainability Report 2015–2016 (p. 44) provided an overview of the new strategic health and safety direction in which TAL Apparel was heading at the beginning of 2016.
The table below provides the four key pillars considered to be the foundation for the establishment of a strong health and safety system across TAL Apparel – strengthening and developing strong health and safety leadership, strengthening the implementation of the management system, ensuring resources have the necessary skills, and creating engaged employees through involvement in activities. The strategy is now in its third year and the following stories provide an example of some of the activities completed by the factories, implementing key elements of the strategy.
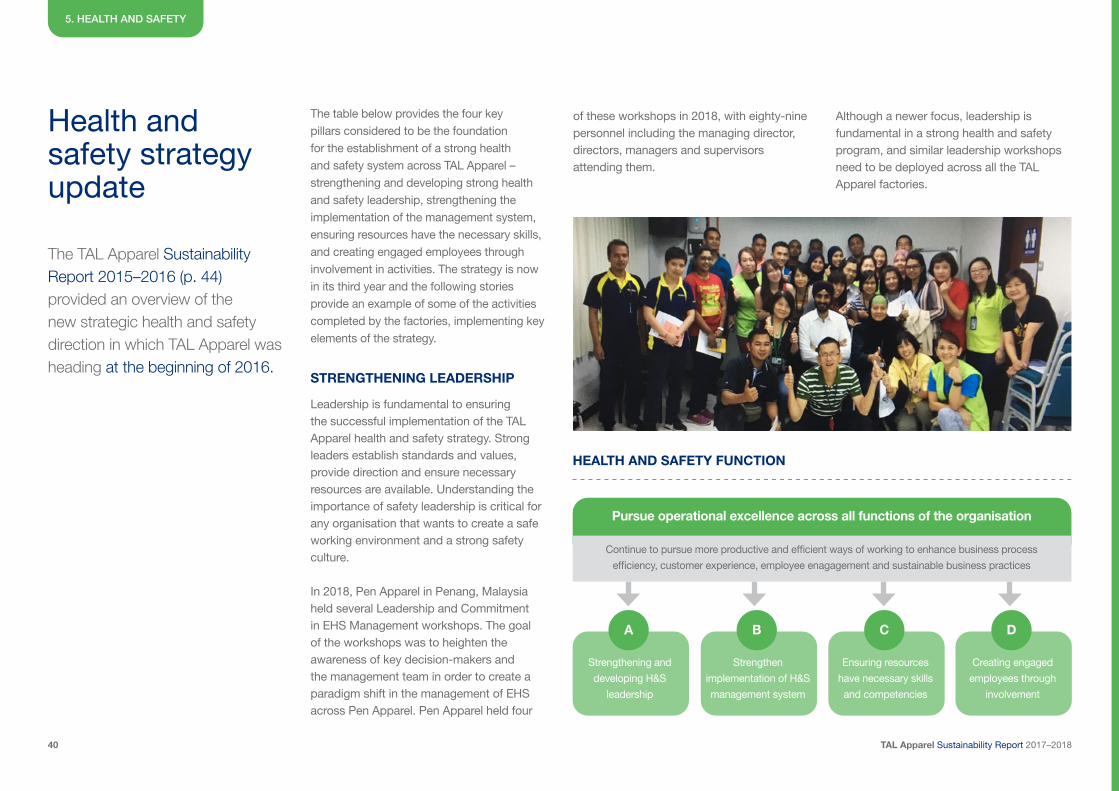
STRENGTHENING LEADERSHIP
Leadership is fundamental to ensuring the successful implementation of the TAL Apparel health and safety strategy. Strong leaders establish standards and values, provide direction and ensure necessary resources are available. Understanding the importance of safety leadership is critical for any organisation that wants to create a safe working environment and a strong safety culture.
In 2018, Pen Apparel in Penang, Malaysia held several Leadership and Commitment in EHS Management workshops. The goal of the workshops was to heighten the awareness of key decision-makers and the management team in order to create a paradigm shift in the management of EHS across Pen Apparel. Pen Apparel held four
of these workshops in 2018, with eighty-nine personnel including the managing director, directors, managers and supervisors attending them.
HEALTH AND SAFETY FUNCTION
Strengthening and
developing H&S
leadership
Strengthen
implementation of H&S
management system
Ensuring resources
have necessary skills
and competencies
Creating engaged
employees through
involvement
A B C D
Pursue operational excellence across all functions of the organisation
Continue to pursue more productive and efficient ways of working to enhance business process
efficiency, customer experience, employee enagagement and sustainable business practices
Although a newer focus, leadership is fundamental in a strong health and safety program, and similar leadership workshops need to be deployed across all the TAL Apparel factories.
TAL Apparel Sustainability Report 2017–201841
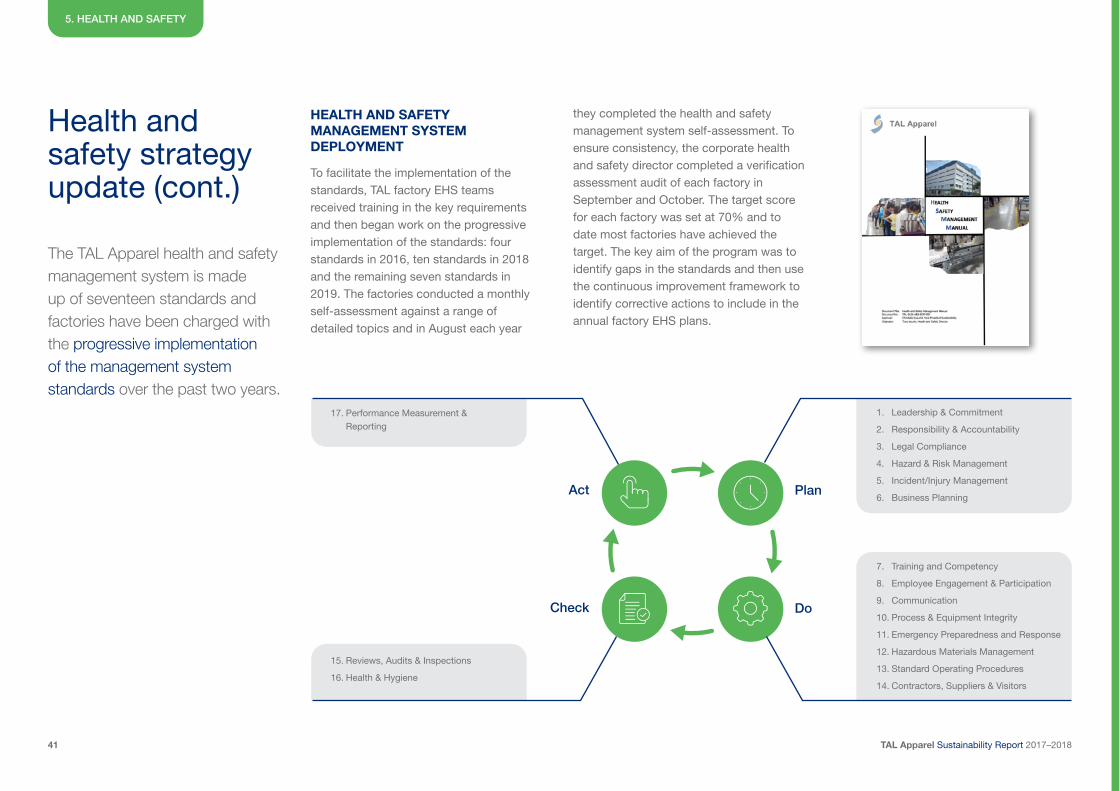
17. Performance Measurement & Reporting
15. Reviews, Audits & Inspections
16. Health & Hygiene
1. Leadership & Commitment
2. Responsibility & Accountability
3. Legal Compliance
4. Hazard & Risk Management
5. Incident/Injury Management
6. Business Planning
7. Training and Competency
8. Employee Engagement & Participation
9. Communication
10. Process & Equipment Integrity
11. Emergency Preparedness and Response
12. Hazardous Materials Management
13. Standard Operating Procedures
14. Contractors, Suppliers & Visitors
Health and safety strategy update (cont.)
5. HEALTH AND SAFETY
HEALTH AND SAFETY MANAGEMENT SYSTEM DEPLOYMENT
To facilitate the implementation of the standards, TAL factory EHS teams received training in the key requirements and then began work on the progressive implementation of the standards: four standards in 2016, ten standards in 2018 and the remaining seven standards in 2019. The factories conducted a monthly self-assessment against a range of detailed topics and in August each year
PlanAct
DoCheck
they completed the health and safety management system self-assessment. To ensure consistency, the corporate health and safety director completed a verification assessment audit of each factory in September and October. The target score for each factory was set at 70% and to date most factories have achieved the target. The key aim of the program was to identify gaps in the standards and then use the continuous improvement framework to identify corrective actions to include in the annual factory EHS plans.
The TAL Apparel health and safety management system is made up of seventeen standards and factories have been charged with the progressive implementation of the management system standards over the past two years.
TAL Apparel Sustainability Report 2017–201842
Health and safety strategy update (cont.)
5. HEALTH AND SAFETY
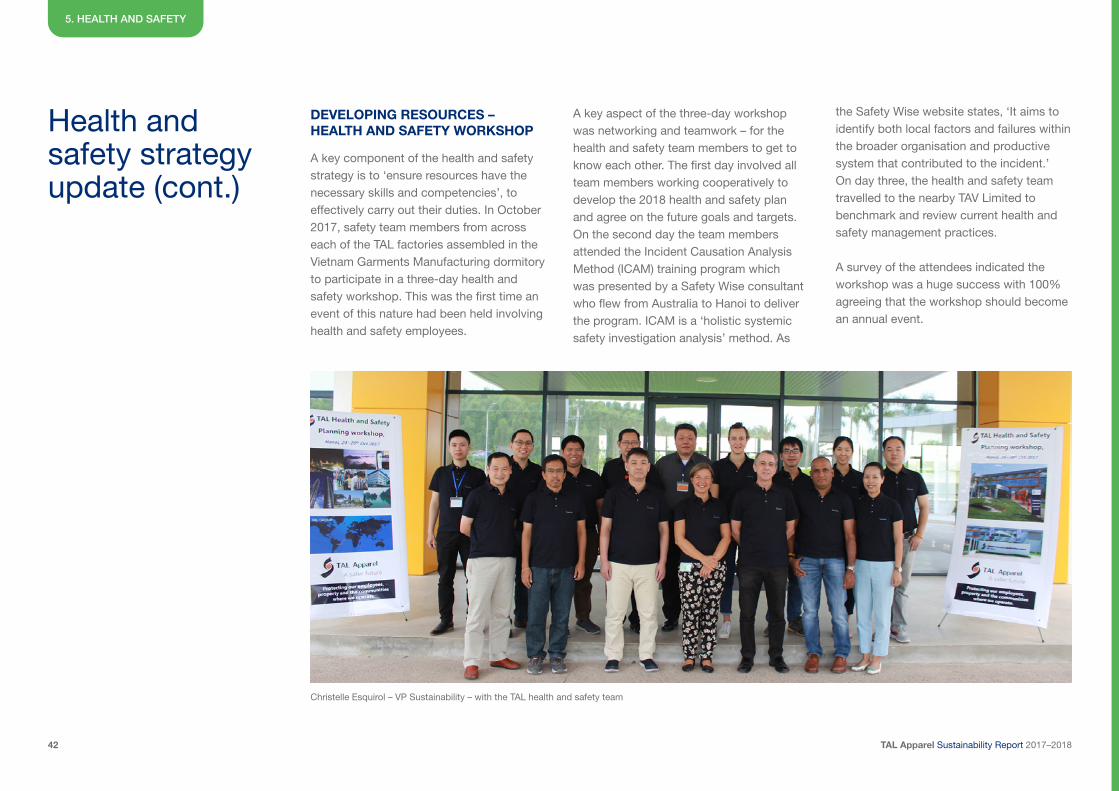
DEVELOPING RESOURCES – HEALTH AND SAFETY WORKSHOP
A key component of the health and safety strategy is to ‘ensure resources have the necessary skills and competencies’, to effectively carry out their duties. In October 2017, safety team members from across each of the TAL factories assembled in the Vietnam Garments Manufacturing dormitory to participate in a three-day health and safety workshop. This was the first time an event of this nature had been held involving health and safety employees.
A key aspect of the three-day workshop was networking and teamwork – for the health and safety team members to get to know each other. The first day involved all team members working cooperatively to develop the 2018 health and safety plan and agree on the future goals and targets. On the second day the team members attended the Incident Causation Analysis Method (ICAM) training program which was presented by a Safety Wise consultant who flew from Australia to Hanoi to deliver the program. ICAM is a ‘holistic systemic safety investigation analysis’ method. As
Christelle Esquirol – VP Sustainability – with the TAL health and safety team
the Safety Wise website states, ‘It aims to identify both local factors and failures within the broader organisation and productive system that contributed to the incident.’ On day three, the health and safety team travelled to the nearby TAV Limited to benchmark and review current health and safety management practices.
A survey of the attendees indicated the workshop was a huge success with 100% agreeing that the workshop should become an annual event.
TAL Apparel Sustainability Report 2017–201843
Health and safety strategy update (cont.)
5. HEALTH AND SAFETY
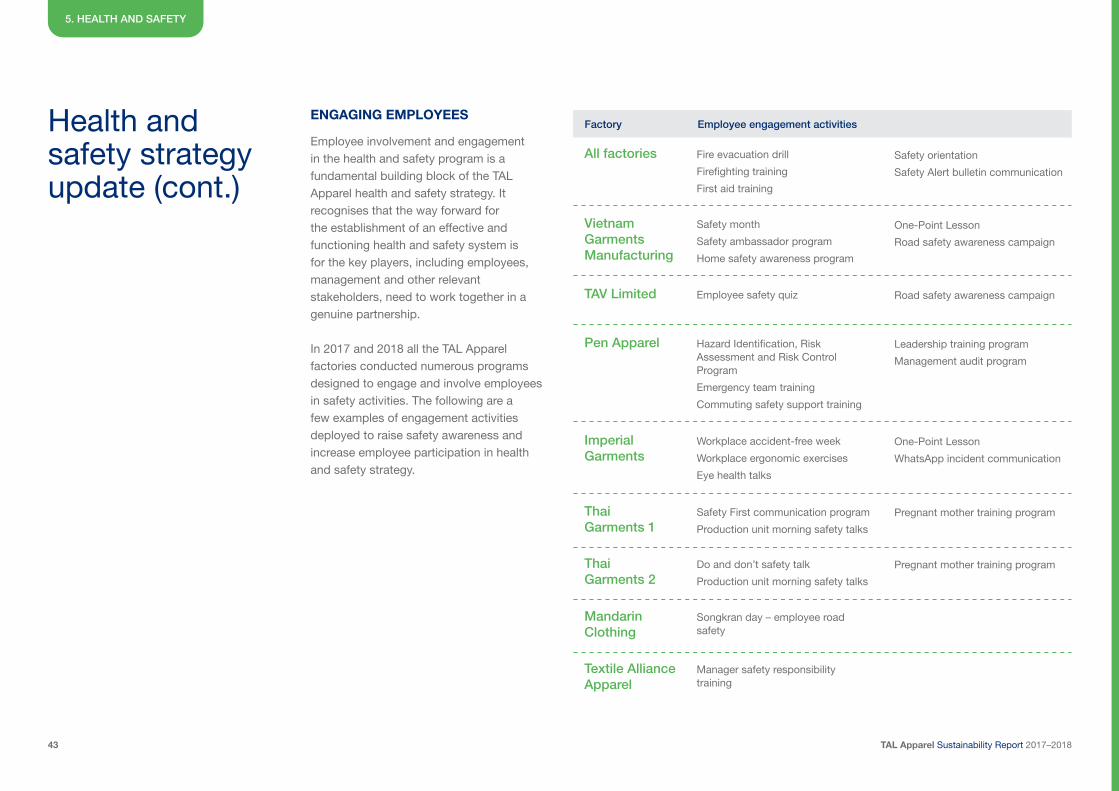
ENGAGING EMPLOYEES
Employee involvement and engagement in the health and safety program is a fundamental building block of the TAL Apparel health and safety strategy. It recognises that the way forward for the establishment of an effective and functioning health and safety system is for the key players, including employees, management and other relevant stakeholders, need to work together in a genuine partnership.
In 2017 and 2018 all the TAL Apparel factories conducted numerous programs designed to engage and involve employees in safety activities. The following are a few examples of engagement activities deployed to raise safety awareness and increase employee participation in health and safety strategy.
Factory Employee engagement activities
All factories
Vietnam Garments Manufacturing
TAV Limited
Pen Apparel
Imperial Garments
Thai Garments 1
Thai Garments 2
Mandarin Clothing
Textile Alliance Apparel
Fire evacuation drill
Firefighting training
First aid training
Safety month
Safety ambassador program
Home safety awareness program
Employee safety quiz
Hazard Identification, Risk Assessment and Risk Control Program
Emergency team training
Commuting safety support training
Workplace accident-free week
Workplace ergonomic exercises
Eye health talks
Safety First communication program
Production unit morning safety talks
Do and don’t safety talk
Production unit morning safety talks
Songkran day – employee road safety
Manager safety responsibility training
Safety orientation
Safety Alert bulletin communication
One-Point Lesson
Road safety awareness campaign
Road safety awareness campaign
Leadership training program
Management audit program
One-Point Lesson
WhatsApp incident communication
Pregnant mother training program
Pregnant mother training program
TAL Apparel Sustainability Report 2017–201844
Health and safety strategy update (cont.)
5. HEALTH AND SAFETY
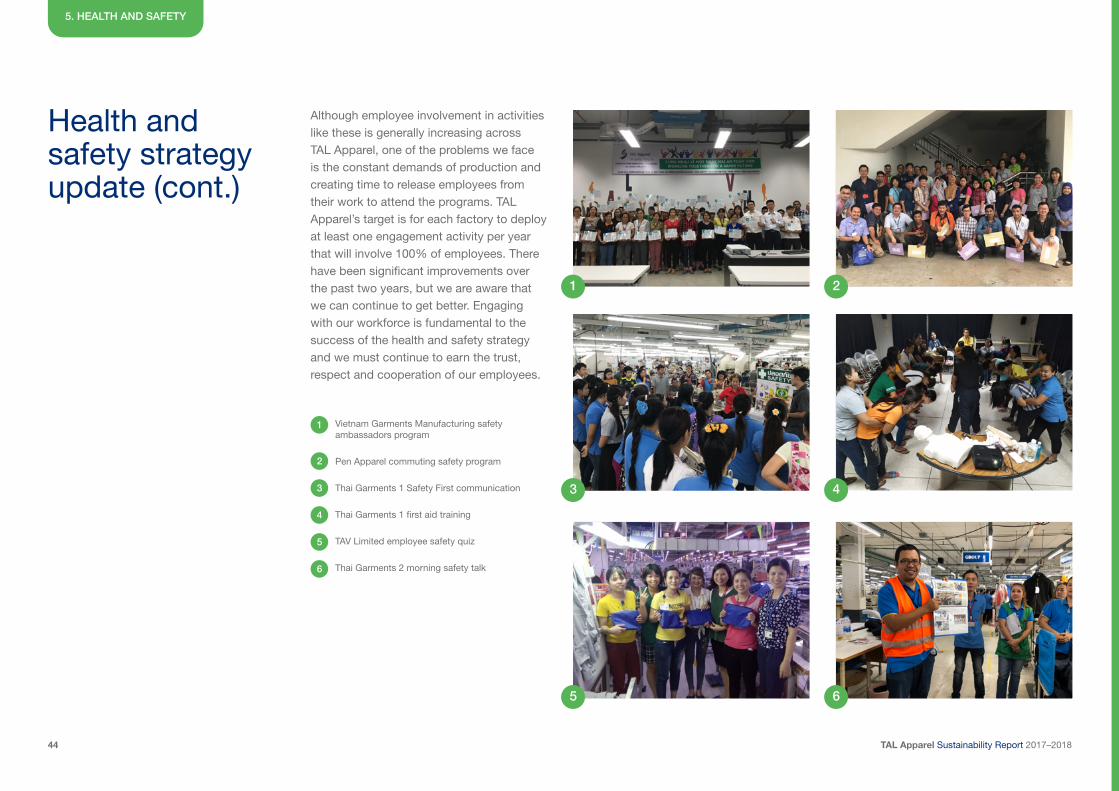
Although employee involvement in activities like these is generally increasing across TAL Apparel, one of the problems we face is the constant demands of production and creating time to release employees from their work to attend the programs. TAL Apparel’s target is for each factory to deploy at least one engagement activity per year that will involve 100% of employees. There have been significant improvements over the past two years, but we are aware that we can continue to get better. Engaging with our workforce is fundamental to the success of the health and safety strategy and we must continue to earn the trust, respect and cooperation of our employees.
Vietnam Garments Manufacturing safety ambassadors program
Pen Apparel commuting safety program
Thai Garments 1 Safety First communication
Thai Garments 1 first aid training
TAV Limited employee safety quiz
Thai Garments 2 morning safety talk
1
1
2
3
4
5
6
3
5
2
4
6
TAL Apparel Sustainability Report 2017–201845
Fire, an important risk
5. HEALTH AND SAFETY
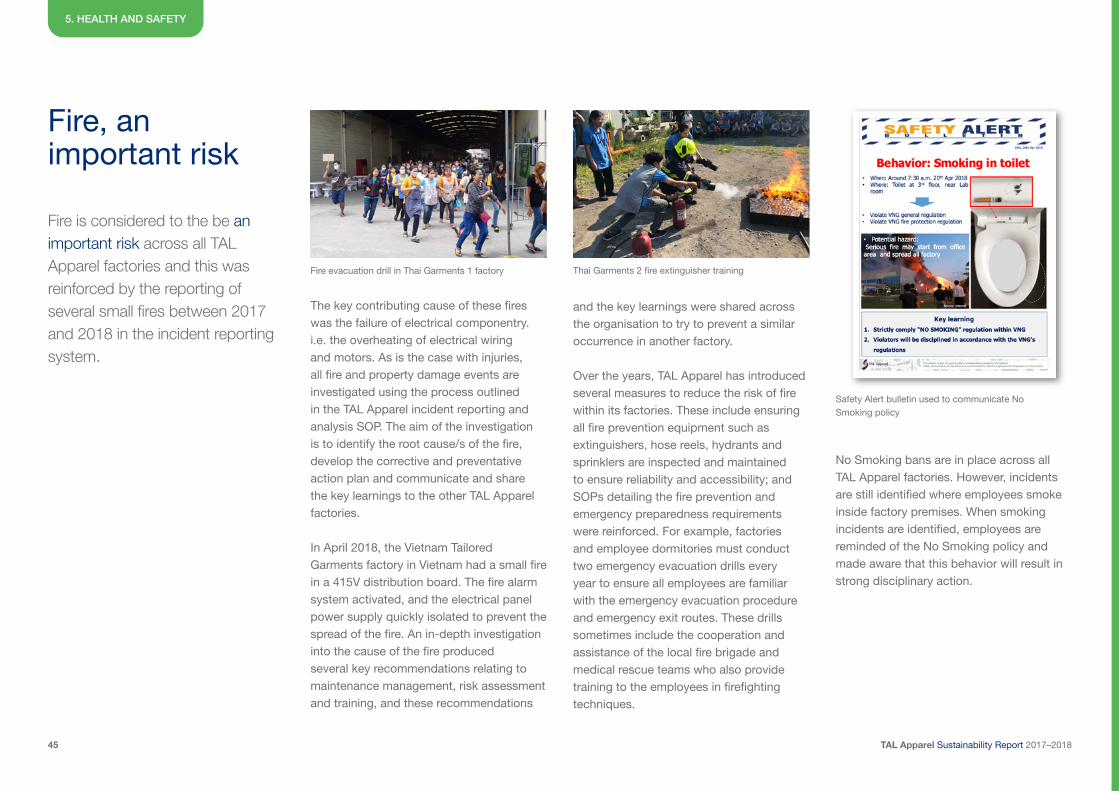
The key contributing cause of these fires was the failure of electrical componentry. i.e. the overheating of electrical wiring and motors. As is the case with injuries, all fire and property damage events are investigated using the process outlined in the TAL Apparel incident reporting and analysis SOP. The aim of the investigation is to identify the root cause/s of the fire, develop the corrective and preventative action plan and communicate and share the key learnings to the other TAL Apparel factories.
In April 2018, the Vietnam Tailored Garments factory in Vietnam had a small fire in a 415V distribution board. The fire alarm system activated, and the electrical panel power supply quickly isolated to prevent the spread of the fire. An in-depth investigation into the cause of the fire produced several key recommendations relating to maintenance management, risk assessment and training, and these recommendations
No Smoking bans are in place across all TAL Apparel factories. However, incidents are still identified where employees smoke inside factory premises. When smoking incidents are identified, employees are reminded of the No Smoking policy and made aware that this behavior will result in strong disciplinary action.
Fire is considered to the be an important risk across all TAL Apparel factories and this was reinforced by the reporting of several small fires between 2017 and 2018 in the incident reporting system.
and the key learnings were shared across the organisation to try to prevent a similar occurrence in another factory.
Over the years, TAL Apparel has introduced several measures to reduce the risk of fire within its factories. These include ensuring all fire prevention equipment such as extinguishers, hose reels, hydrants and sprinklers are inspected and maintained to ensure reliability and accessibility; and SOPs detailing the fire prevention and emergency preparedness requirements were reinforced. For example, factories and employee dormitories must conduct two emergency evacuation drills every year to ensure all employees are familiar with the emergency evacuation procedure and emergency exit routes. These drills sometimes include the cooperation and assistance of the local fire brigade and medical rescue teams who also provide training to the employees in firefighting techniques.
Fire evacuation drill in Thai Garments 1 factory Thai Garments 2 fire extinguisher training
Safety Alert bulletin used to communicate No Smoking policy
TAL Apparel Sustainability Report 2017–201846
Health monitoring
5. HEALTH AND SAFETY
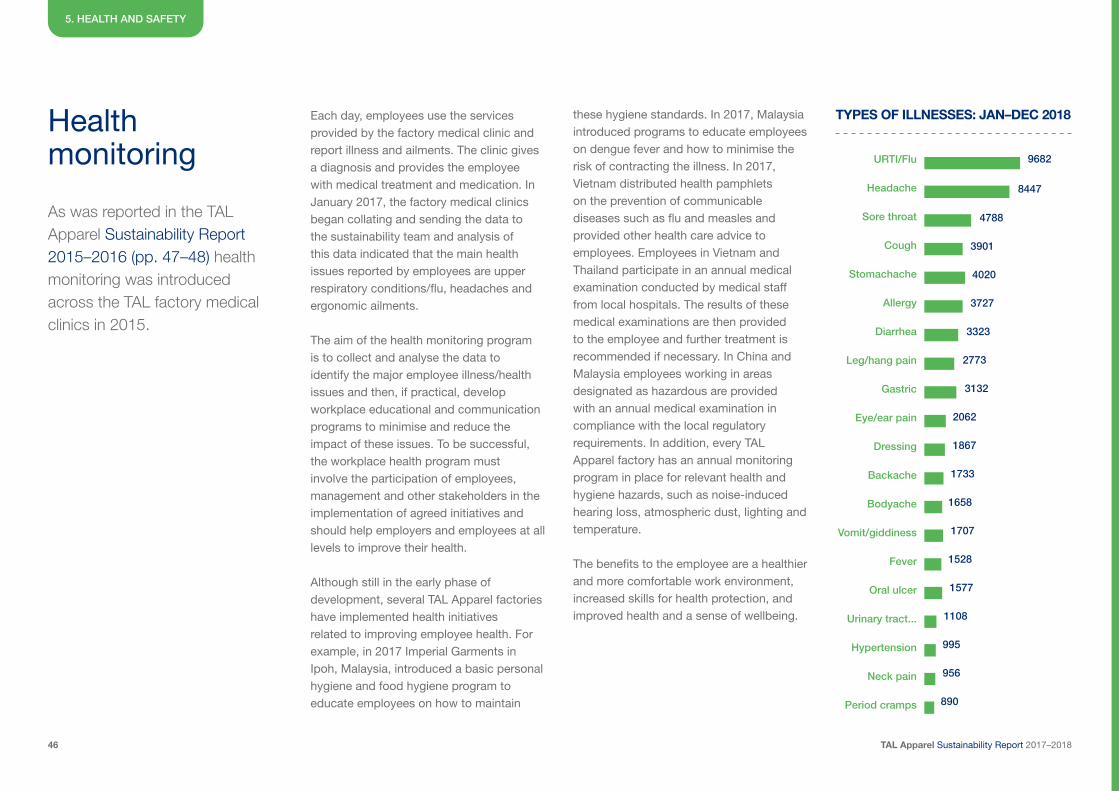
Each day, employees use the services provided by the factory medical clinic and report illness and ailments. The clinic gives a diagnosis and provides the employee with medical treatment and medication. In January 2017, the factory medical clinics began collating and sending the data to the sustainability team and analysis of this data indicated that the main health issues reported by employees are upper respiratory conditions/flu, headaches and ergonomic ailments.
The aim of the health monitoring program is to collect and analyse the data to identify the major employee illness/health issues and then, if practical, develop workplace educational and communication programs to minimise and reduce the impact of these issues. To be successful, the workplace health program must involve the participation of employees, management and other stakeholders in the implementation of agreed initiatives and should help employers and employees at all levels to improve their health.
Although still in the early phase of development, several TAL Apparel factories have implemented health initiatives related to improving employee health. For example, in 2017 Imperial Garments in Ipoh, Malaysia, introduced a basic personal hygiene and food hygiene program to educate employees on how to maintain
these hygiene standards. In 2017, Malaysia introduced programs to educate employees on dengue fever and how to minimise the risk of contracting the illness. In 2017, Vietnam distributed health pamphlets on the prevention of communicable diseases such as flu and measles and provided other health care advice to employees. Employees in Vietnam and Thailand participate in an annual medical examination conducted by medical staff from local hospitals. The results of these medical examinations are then provided to the employee and further treatment is recommended if necessary. In China and Malaysia employees working in areas designated as hazardous are provided with an annual medical examination in compliance with the local regulatory requirements. In addition, every TAL Apparel factory has an annual monitoring program in place for relevant health and hygiene hazards, such as noise-induced hearing loss, atmospheric dust, lighting and temperature.
The benefits to the employee are a healthier and more comfortable work environment, increased skills for health protection, and improved health and a sense of wellbeing.
As was reported in the TAL Apparel Sustainability Report 2015–2016 (pp. 47–48) health monitoring was introduced across the TAL factory medical clinics in 2015.
TYPES OF ILLNESSES: JAN–DEC 2018
URTI/Flu
Headache
Sore throat
Cough
Stomachache
Allergy
Diarrhea
Leg/hang pain
Gastric
Eye/ear pain
Dressing
Backache
Bodyache
Vomit/giddiness
Fever
Oral ulcer
Urinary tract...
Hypertension
Neck pain
Period cramps
9682
8447
4788
3901
4020
3727
3323
2773
3132
2062
1867
1733
1658
1707
1528
1577
1108
995
956
890
TAL Apparel Sustainability Report 2017–201847
Factory programs
5. HEALTH AND SAFETY
VIETNAM – RIDING TO WORK MOTORCYCLE HELMET DONATION PROGRAM
HONDA MOTORCYCLE SAFETY TRAINING
As was reported in the TAL Apparel Sustainability Report 2015–2016 (p. 50), ‘Motorcycles are the family vehicle and the most commonly used mode of transport in Vietnam.’ As a consequence, over 22,000 people die every year on Vietnam’s roads, a significantly higher rate than the global average, according to the World Health Organisation Global Status Report on Road Safety (2015). In Vietnam, road injuries are the number one cause of death for young people aged fifteen to twenty-nine years old.
Riding a motorcycle to and from work daily is considered the number one critical risk that some of our employees in Vietnam face. To address this issue, all Vietnam factories introduced several safety initiatives aimed at attempting to reduce this risk, such as providing personal protective equipment and training and attempting to raise employee awareness of motorcycle safety.
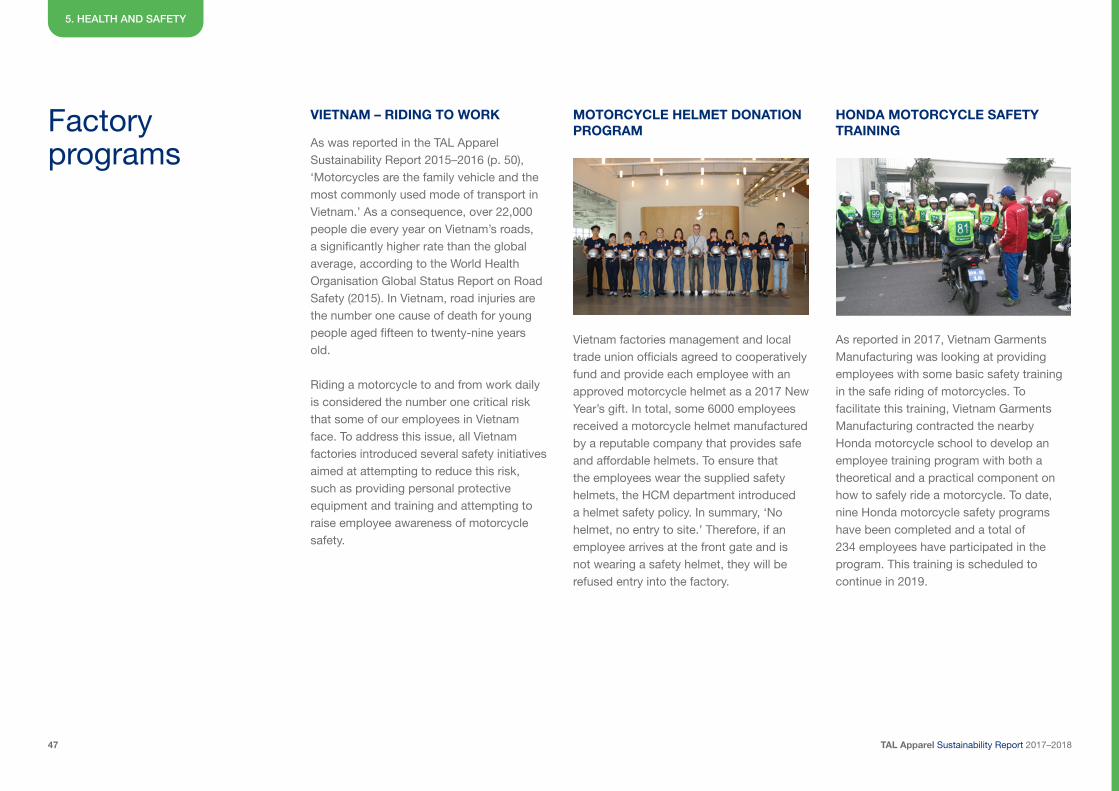
Vietnam factories management and local trade union officials agreed to cooperatively fund and provide each employee with an approved motorcycle helmet as a 2017 New Year’s gift. In total, some 6000 employees received a motorcycle helmet manufactured by a reputable company that provides safe and affordable helmets. To ensure that the employees wear the supplied safety helmets, the HCM department introduced a helmet safety policy. In summary, ‘No helmet, no entry to site.’ Therefore, if an employee arrives at the front gate and is not wearing a safety helmet, they will be refused entry into the factory.
As reported in 2017, Vietnam Garments Manufacturing was looking at providing employees with some basic safety training in the safe riding of motorcycles. To facilitate this training, Vietnam Garments Manufacturing contracted the nearby Honda motorcycle school to develop an employee training program with both a theoretical and a practical component on how to safely ride a motorcycle. To date, nine Honda motorcycle safety programs have been completed and a total of 234 employees have participated in the program. This training is scheduled to continue in 2019.
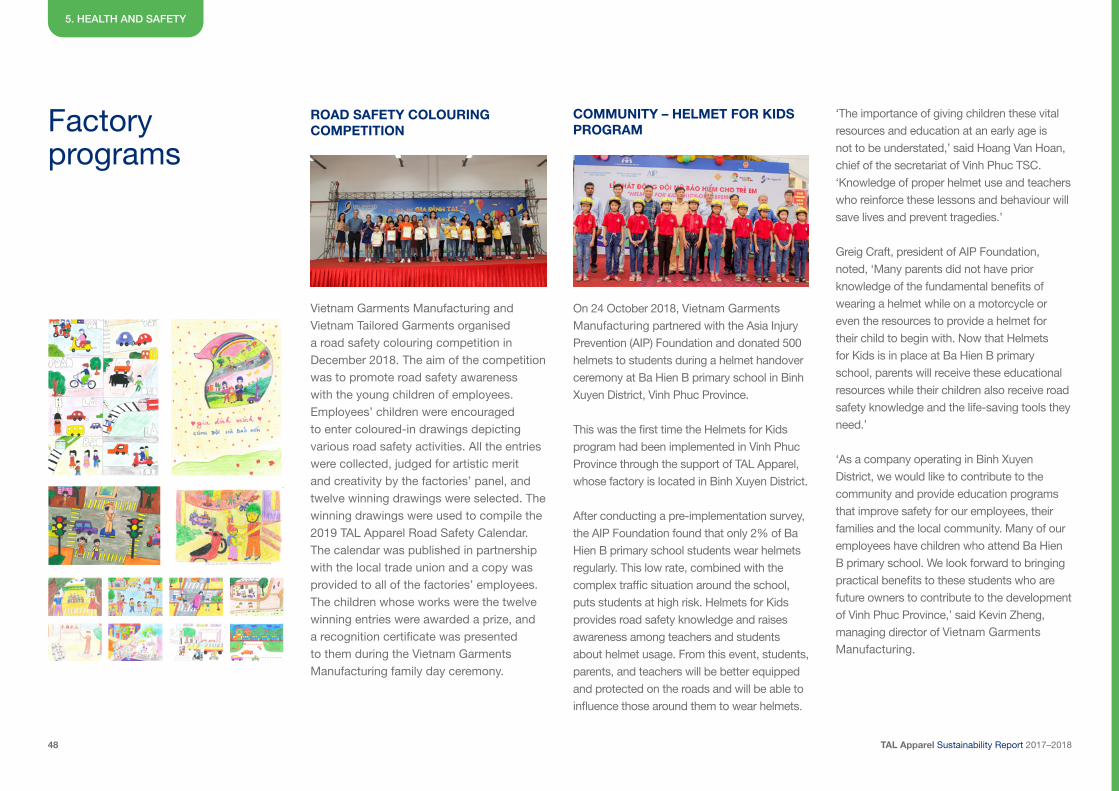
TAL Apparel Sustainability Report 2017–201848
Factory programs
5. HEALTH AND SAFETY
ROAD SAFETY COLOURING COMPETITION
COMMUNITY – HELMET FOR KIDS PROGRAM
Vietnam Garments Manufacturing and Vietnam Tailored Garments organised a road safety colouring competition in December 2018. The aim of the competition was to promote road safety awareness with the young children of employees. Employees’ children were encouraged to enter coloured-in drawings depicting various road safety activities. All the entries were collected, judged for artistic merit and creativity by the factories’ panel, and twelve winning drawings were selected. The winning drawings were used to compile the 2019 TAL Apparel Road Safety Calendar. The calendar was published in partnership with the local trade union and a copy was provided to all of the factories’ employees. The children whose works were the twelve winning entries were awarded a prize, and a recognition certificate was presented to them during the Vietnam Garments Manufacturing family day ceremony.
On 24 October 2018, Vietnam Garments Manufacturing partnered with the Asia Injury Prevention (AIP) Foundation and donated 500 helmets to students during a helmet handover ceremony at Ba Hien B primary school in Binh Xuyen District, Vinh Phuc Province.
This was the first time the Helmets for Kids program had been implemented in Vinh Phuc Province through the support of TAL Apparel, whose factory is located in Binh Xuyen District.
After conducting a pre-implementation survey, the AIP Foundation found that only 2% of Ba Hien B primary school students wear helmets regularly. This low rate, combined with the complex traffic situation around the school, puts students at high risk. Helmets for Kids provides road safety knowledge and raises awareness among teachers and students about helmet usage. From this event, students, parents, and teachers will be better equipped and protected on the roads and will be able to influence those around them to wear helmets.
‘The importance of giving children these vital resources and education at an early age is not to be understated,’ said Hoang Van Hoan, chief of the secretariat of Vinh Phuc TSC. ‘Knowledge of proper helmet use and teachers who reinforce these lessons and behaviour will save lives and prevent tragedies.’
Greig Craft, president of AIP Foundation, noted, ‘Many parents did not have prior knowledge of the fundamental benefits of wearing a helmet while on a motorcycle or even the resources to provide a helmet for their child to begin with. Now that Helmets for Kids is in place at Ba Hien B primary school, parents will receive these educational resources while their children also receive road safety knowledge and the life-saving tools they need.’
‘As a company operating in Binh Xuyen District, we would like to contribute to the community and provide education programs that improve safety for our employees, their families and the local community. Many of our employees have children who attend Ba Hien B primary school. We look forward to bringing practical benefits to these students who are future owners to contribute to the development of Vinh Phuc Province,’ said Kevin Zheng, managing director of Vietnam Garments Manufacturing.
TAL Apparel Sustainability Report 2017–201849
6
Environment
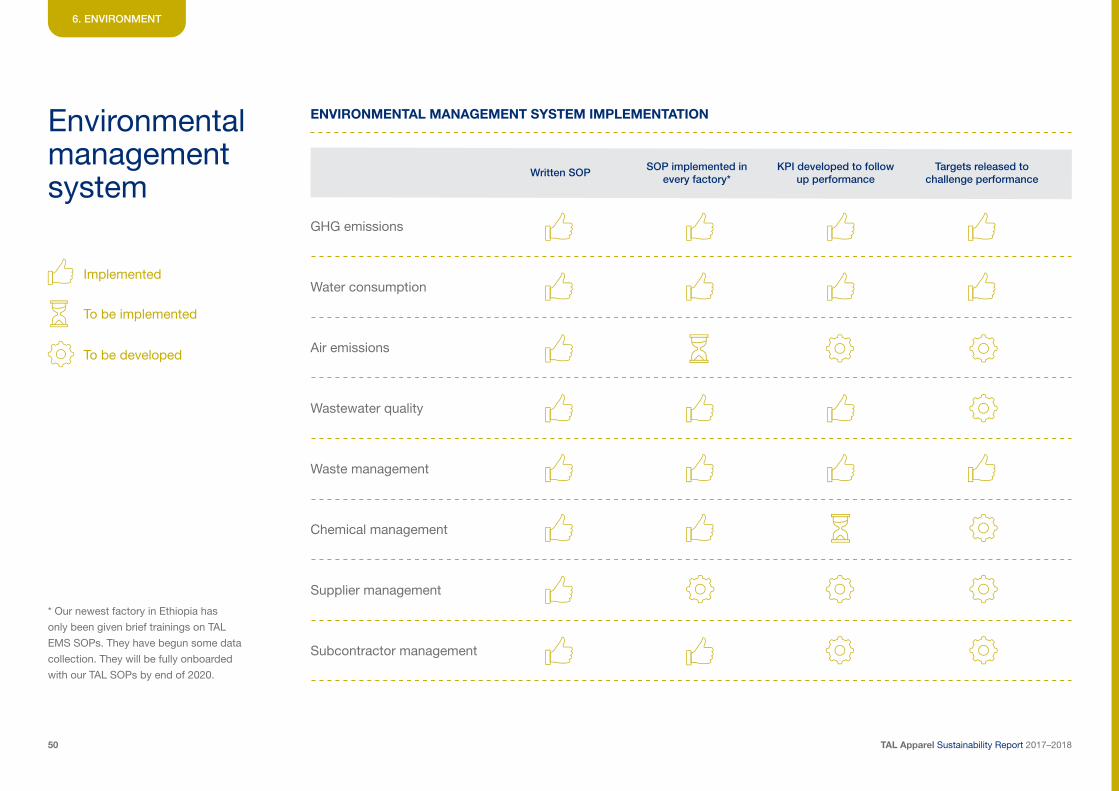
TAL Apparel Sustainability Report 2017–201850
Environmental management system
6. ENVIRONMENT
ENVIRONMENTAL MANAGEMENT SYSTEM IMPLEMENTATION
Written SOP SOP implemented in every factory*
KPI developed to follow up performance
Targets released to challenge performance
GHG emissions
Implemented
To be implemented
To be developed
Water consumption
Air emissions
Wastewater quality
Waste management
Chemical management
Supplier management
Subcontractor management
* Our newest factory in Ethiopia has
only been given brief trainings on TAL
EMS SOPs. They have begun some data
collection. They will be fully onboarded
with our TAL SOPs by end of 2020.
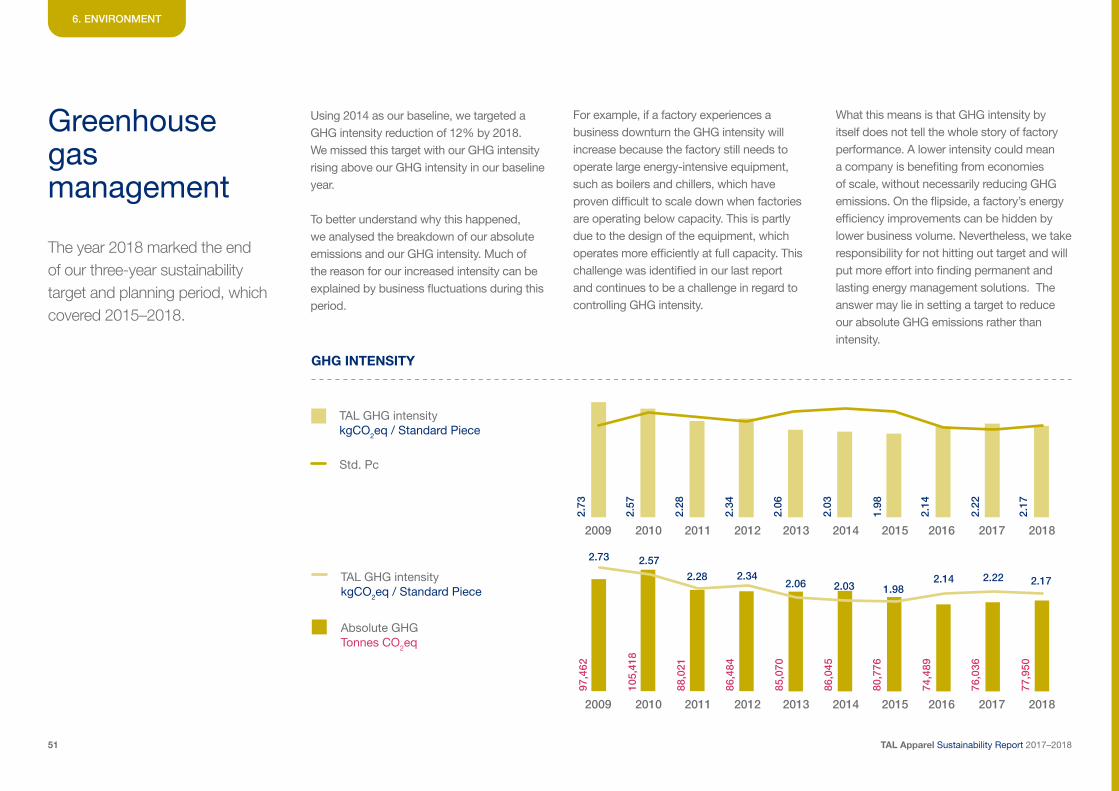
TAL Apparel Sustainability Report 2017–201851
Greenhouse gas management
6. ENVIRONMENT
Using 2014 as our baseline, we targeted a GHG intensity reduction of 12% by 2018. We missed this target with our GHG intensity rising above our GHG intensity in our baseline year.
To better understand why this happened, we analysed the breakdown of our absolute emissions and our GHG intensity. Much of the reason for our increased intensity can be explained by business fluctuations during this period.
For example, if a factory experiences a business downturn the GHG intensity will increase because the factory still needs to operate large energy-intensive equipment, such as boilers and chillers, which have proven difficult to scale down when factories are operating below capacity. This is partly due to the design of the equipment, which operates more efficiently at full capacity. This challenge was identified in our last report and continues to be a challenge in regard to controlling GHG intensity.
The year 2018 marked the end of our three-year sustainability target and planning period, which covered 2015–2018.
2.73 2.57
2.28 2.342.06 2.03
86,0
45
85,0
70
86,4
84
88,0
21
105,
418
97,4
621.98
80,7
76
2.14
74,4
89
2.22
76,0
36
2.17
77,9
50
TAL GHG intensity kgCO2eq / Standard Piece
Absolute GHG Tonnes CO2eq
What this means is that GHG intensity by itself does not tell the whole story of factory performance. A lower intensity could mean a company is benefiting from economies of scale, without necessarily reducing GHG emissions. On the flipside, a factory’s energy efficiency improvements can be hidden by lower business volume. Nevertheless, we take responsibility for not hitting out target and will put more effort into finding permanent and lasting energy management solutions. The answer may lie in setting a target to reduce our absolute GHG emissions rather than intensity.
GHG INTENSITY
2009
2009
2.73
2.57
2.28
2.34
2.06
2.03
1.98
2.14
2.22
2.17
2010
2010
2011
2011
2012
2012
2013
2013
2014
2014
2015
2015
2017
2017
2016
2016
2018
2018
TAL GHG intensity kgCO2eq / Standard Piece
Std. Pc
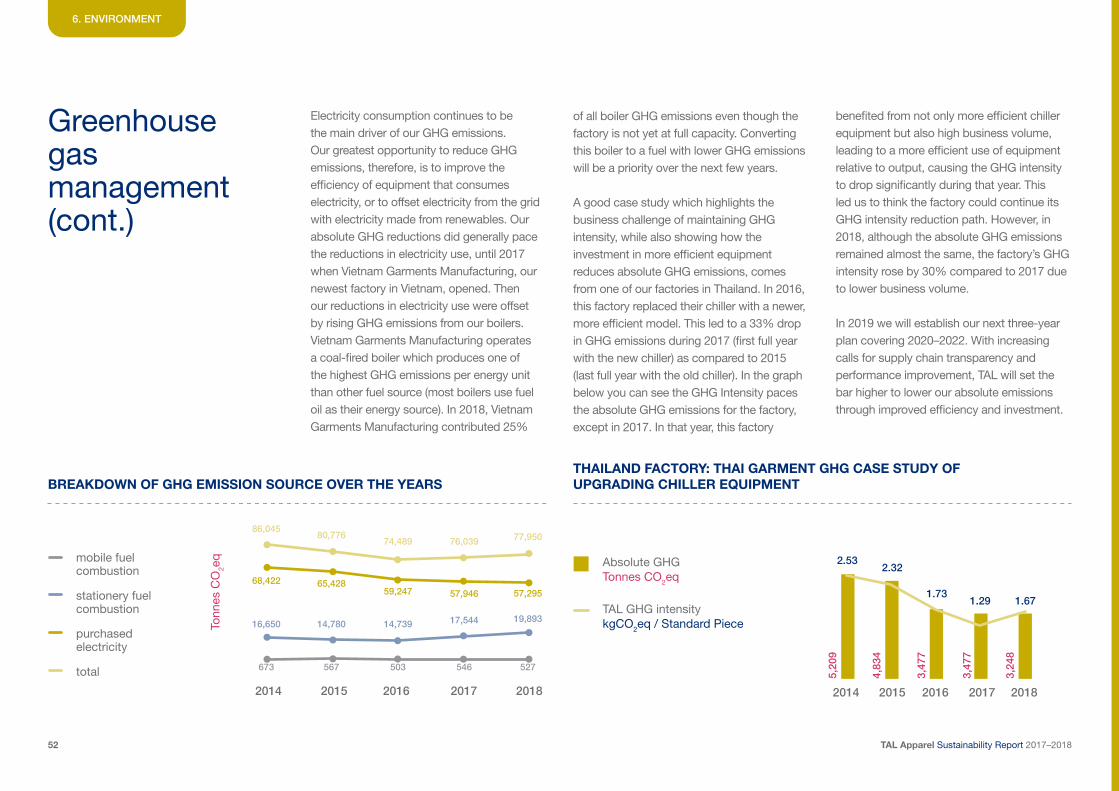
TAL Apparel Sustainability Report 2017–201852
Greenhouse gas management (cont.)
Electricity consumption continues to be the main driver of our GHG emissions. Our greatest opportunity to reduce GHG emissions, therefore, is to improve the efficiency of equipment that consumes electricity, or to offset electricity from the grid with electricity made from renewables. Our absolute GHG reductions did generally pace the reductions in electricity use, until 2017 when Vietnam Garments Manufacturing, our newest factory in Vietnam, opened. Then our reductions in electricity use were offset by rising GHG emissions from our boilers. Vietnam Garments Manufacturing operates a coal-fired boiler which produces one of the highest GHG emissions per energy unit than other fuel source (most boilers use fuel oil as their energy source). In 2018, Vietnam Garments Manufacturing contributed 25%
of all boiler GHG emissions even though the factory is not yet at full capacity. Converting this boiler to a fuel with lower GHG emissions will be a priority over the next few years.
A good case study which highlights the business challenge of maintaining GHG intensity, while also showing how the investment in more efficient equipment reduces absolute GHG emissions, comes from one of our factories in Thailand. In 2016, this factory replaced their chiller with a newer, more efficient model. This led to a 33% drop in GHG emissions during 2017 (first full year with the new chiller) as compared to 2015 (last full year with the old chiller). In the graph below you can see the GHG Intensity paces the absolute GHG emissions for the factory, except in 2017. In that year, this factory
benefited from not only more efficient chiller equipment but also high business volume, leading to a more efficient use of equipment relative to output, causing the GHG intensity to drop significantly during that year. This led us to think the factory could continue its GHG intensity reduction path. However, in 2018, although the absolute GHG emissions remained almost the same, the factory’s GHG intensity rose by 30% compared to 2017 due to lower business volume.
In 2019 we will establish our next three-year plan covering 2020–2022. With increasing calls for supply chain transparency and performance improvement, TAL will set the bar higher to lower our absolute emissions through improved efficiency and investment.
BREAKDOWN OF GHG EMISSION SOURCE OVER THE YEARSTHAILAND FACTORY: THAI GARMENT GHG CASE STUDY OF UPGRADING CHILLER EQUIPMENT
6. ENVIRONMENT
20142014 20152015 20162016 20172017 20182018
Tonn
es C
O2e
qmobile fuel combustion
purchased electricity
stationery fuel combustion
total 5,20
9
2.53
673
16,650
68,422
86,045
567
14,780
65,428
80,776
503
14,739
59,247
74,489
546
17,544
57,946
76,039
527
19,893
57,295
77,950
4,83
4
2.32
3,47
7
1.73
3,47
7
1.29
3,24
8
1.67TAL GHG intensity kgCO2eq / Standard Piece
Absolute GHG Tonnes CO2eq
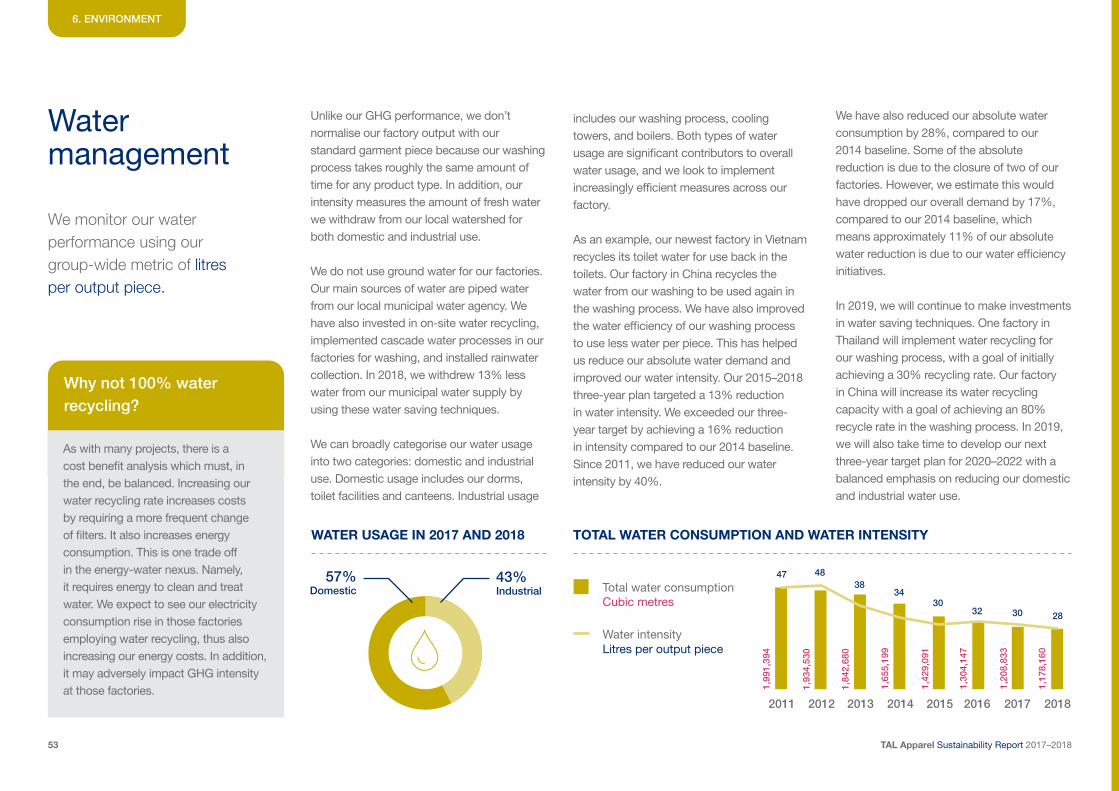
TAL Apparel Sustainability Report 2017–201853
Water management
6. ENVIRONMENT
Unlike our GHG performance, we don’t normalise our factory output with our standard garment piece because our washing process takes roughly the same amount of time for any product type. In addition, our intensity measures the amount of fresh water we withdraw from our local watershed for both domestic and industrial use.
We do not use ground water for our factories. Our main sources of water are piped water from our local municipal water agency. We have also invested in on-site water recycling, implemented cascade water processes in our factories for washing, and installed rainwater collection. In 2018, we withdrew 13% less water from our municipal water supply by using these water saving techniques.
We can broadly categorise our water usage into two categories: domestic and industrial use. Domestic usage includes our dorms, toilet facilities and canteens. Industrial usage
We have also reduced our absolute water consumption by 28%, compared to our 2014 baseline. Some of the absolute reduction is due to the closure of two of our factories. However, we estimate this would have dropped our overall demand by 17%, compared to our 2014 baseline, which means approximately 11% of our absolute water reduction is due to our water efficiency initiatives.
In 2019, we will continue to make investments in water saving techniques. One factory in Thailand will implement water recycling for our washing process, with a goal of initially achieving a 30% recycling rate. Our factory in China will increase its water recycling capacity with a goal of achieving an 80% recycle rate in the washing process. In 2019, we will also take time to develop our next three-year target plan for 2020–2022 with a balanced emphasis on reducing our domestic and industrial water use.
We monitor our water performance using our group-wide metric of litres per output piece.
includes our washing process, cooling towers, and boilers. Both types of water usage are significant contributors to overall water usage, and we look to implement increasingly efficient measures across our factory.
As an example, our newest factory in Vietnam recycles its toilet water for use back in the toilets. Our factory in China recycles the water from our washing to be used again in the washing process. We have also improved the water efficiency of our washing process to use less water per piece. This has helped us reduce our absolute water demand and improved our water intensity. Our 2015–2018 three-year plan targeted a 13% reduction in water intensity. We exceeded our three-year target by achieving a 16% reduction in intensity compared to our 2014 baseline. Since 2011, we have reduced our water intensity by 40%.
WATER USAGE IN 2017 AND 2018 TOTAL WATER CONSUMPTION AND WATER INTENSITY
Why not 100% water recycling?
As with many projects, there is a cost benefit analysis which must, in the end, be balanced. Increasing our water recycling rate increases costs by requiring a more frequent change of filters. It also increases energy consumption. This is one trade off in the energy-water nexus. Namely, it requires energy to clean and treat water. We expect to see our electricity consumption rise in those factories employing water recycling, thus also increasing our energy costs. In addition, it may adversely impact GHG intensity at those factories.
57% Domestic
43% Industrial
1,99
1,39
4
1,93
4,53
0
1,84
2,68
0
1,65
5,19
9
1,42
9,09
1
1,30
4,14
7
1,20
8,83
3
1,17
8,16
0
2011 2012 2013 2014 2015 20172016 2018
47 4838
3430
32 30 28
Water intensityLitres per output piece
Total water consumptionCubic metres
TAL Apparel Sustainability Report 2017–201854
Wastewater management
6. ENVIRONMENT
WASTEWATER UPDATE BIOLOGICAL WASTEWATER TREATMENT
The spirit and passion of innovation are deeply implanted in TAL’s philosophy. The ambition to become a leader in providing cutting-edge garment technology means thinking beyond our products to also encompass the by-products that result from the manufacturing process, for example, wastewater.
As we entered the twenty-first century, water scarcity was already a hot topic and it remains a global challenge today. One that is likely to grow in importance across the world. There are two aspects to water scarcity: quantity and quality. Places with plentiful water could still be water scarce if the water is unsafe to use. It is this latter issue which TAL committed long ago to ambitiously address and ensure water discharged from its factories meets regulatory and industry-best practices. As governments continue to enact and tighten enforcement of water protection regulations, TAL is well positioned to be a leader in wastewater management in the locations we operate.
Early on, TAL chose to use a biological treatment system for its wastewater. Our strong belief is that the chemical treatment of wastewater is not fully sustainable, as the chemicals used often take an additional toll on the environment. We are proud that all our wastewater treatment plants exclusively use biological treatments. Opting for biological treatment is no easy feat and remains a day-to-day challenge for us. Unlike chemical treatment, biological treatment employs bacteria, which digests pollutants by converting them into gas or solid sludge. The efficiency of the process is dependent on a number of conditions. Bacteria can only provide a strong performance within a certain pH, temperature, and dissolved oxygen range, and this is unique to each bacteria population and bacteria species.
In 2018, TAL sponsored an amount of HK$520,000 to collaborate with City University of Hong Kong on wastewater research. The objective of the study is to apply the latest DNA sequencing technology to ascertain the microbiome that will improve control of treatment efficiency and provide greater assurance of treated water quality. In three years’ time, the research will supply answers for questions regarding: what should be the metagenomic
structure of the biological treatment systems? What biological and physical environmental interactions are required for maintaining the diversity of the favoured group of bacteria? Is there any special microorganism present in the samples with a unique metabolic ability that can change the way a conventional biological treatment system can work?
TAL Apparel Sustainability Report 2017–201855
Wastewater management (cont.)
6. ENVIRONMENT
WATER RECYCLING
TAL is also committed to reducing its demand for freshwater. Throughout 2017–2018, TAL planned and began implementing an industrial and domestic wastewater reclamation project for toilet flushing and wet process usage. Two water reclamation projects designed in 2018 are to be implemented in 2019, and will reduce freshwater demand. These two projects will contribute to saving around 6,500m3 water per month. This is equivalent to the amount of water needed to support 65,000 people, according to the UN document, ‘The Human Right to Water and Sanitation’.
TAL also invested in a research project in collaboration with Hong Kong Polytechnic University on the advancement of filtration systems. The current most effective membrane filter in the market for handling dissolved solids is polyamide coating membrane. The disadvantage of using the filter is that it consumes a high amount of electrical energy. The research team from the university discovered the replacement solution by applying a graphene coating membrane that can serve the same function as polyamide membrane but with a lower energy consumption to complete the treatment. Although this research is in a very early stage, TAL is excited about the possibility of lowering our energy use, while continuing our path towards increased usage of recycled water.
PERFORMANCE MONITORING AND IMPROVEMENT
During 2018, TAL introduced its wastewater treatment system performance KPI. The aim for the KPI is to allow the factory management to easily understand the wastewater performance against regulatory requirements and industry standards (such as the ZDHC – Zero Discharge of Hazardous Chemicals). The tool helps build a competitive and learning environment where each factory within TAL’s group can see the performance of their peers and can learn from each other when common issues occur.
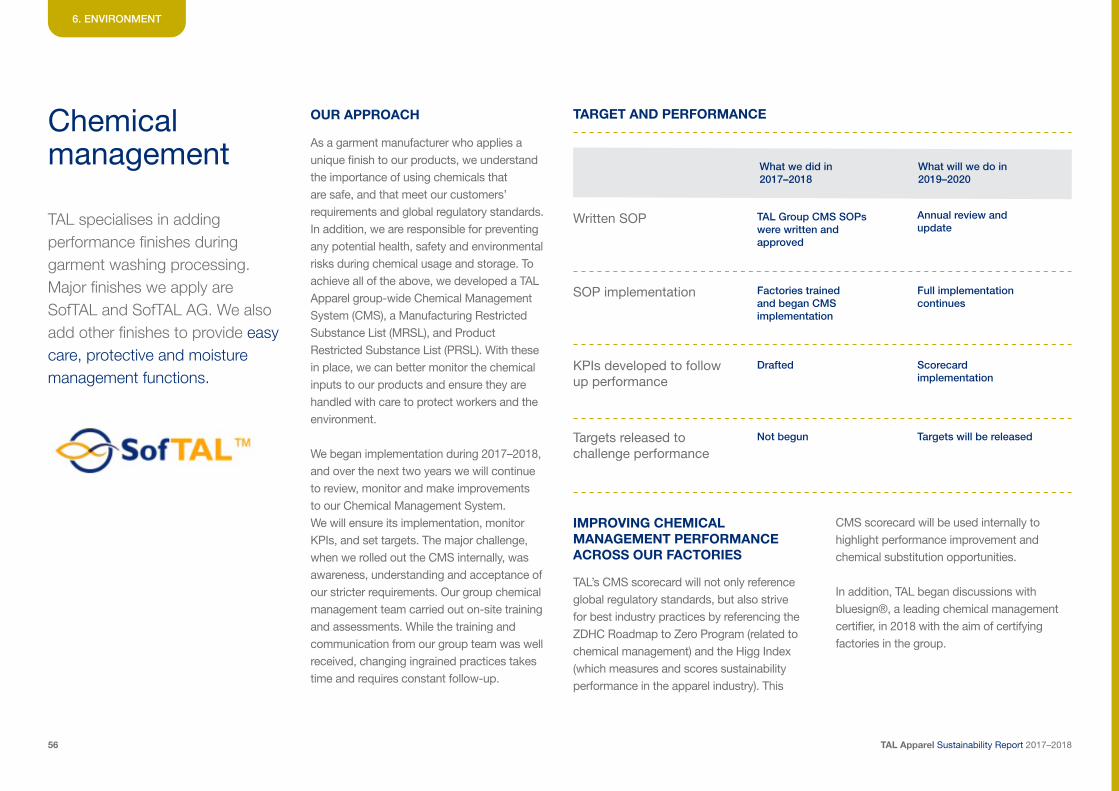
TAL Apparel Sustainability Report 2017–201856
Chemical management
6. ENVIRONMENT
OUR APPROACH
IMPROVING CHEMICAL MANAGEMENT PERFORMANCE ACROSS OUR FACTORIES
As a garment manufacturer who applies a unique finish to our products, we understand the importance of using chemicals that are safe, and that meet our customers’ requirements and global regulatory standards. In addition, we are responsible for preventing any potential health, safety and environmental risks during chemical usage and storage. To achieve all of the above, we developed a TAL Apparel group-wide Chemical Management System (CMS), a Manufacturing Restricted Substance List (MRSL), and Product Restricted Substance List (PRSL). With these in place, we can better monitor the chemical inputs to our products and ensure they are handled with care to protect workers and the environment.
We began implementation during 2017–2018, and over the next two years we will continue to review, monitor and make improvements to our Chemical Management System. We will ensure its implementation, monitor KPIs, and set targets. The major challenge, when we rolled out the CMS internally, was awareness, understanding and acceptance of our stricter requirements. Our group chemical management team carried out on-site training and assessments. While the training and communication from our group team was well received, changing ingrained practices takes time and requires constant follow-up.
TAL’s CMS scorecard will not only reference global regulatory standards, but also strive for best industry practices by referencing the ZDHC Roadmap to Zero Program (related to chemical management) and the Higg Index (which measures and scores sustainability performance in the apparel industry). This
TAL specialises in adding performance finishes during garment washing processing. Major finishes we apply are SofTAL and SofTAL AG. We also add other finishes to provide easy care, protective and moisture management functions.
TARGET AND PERFORMANCE
What we did in 2017–2018
What will we do in 2019–2020
Written SOP
SOP implementation
KPIs developed to follow up performance
TAL Group CMS SOPs were written and approved
Annual review and update
Factories trained and began CMS implementation
Full implementation continues
Drafted Scorecard implementation
Not begun Targets will be releasedTargets released to challenge performance
CMS scorecard will be used internally to highlight performance improvement and chemical substitution opportunities.
In addition, TAL began discussions with bluesign®, a leading chemical management certifier, in 2018 with the aim of certifying factories in the group.
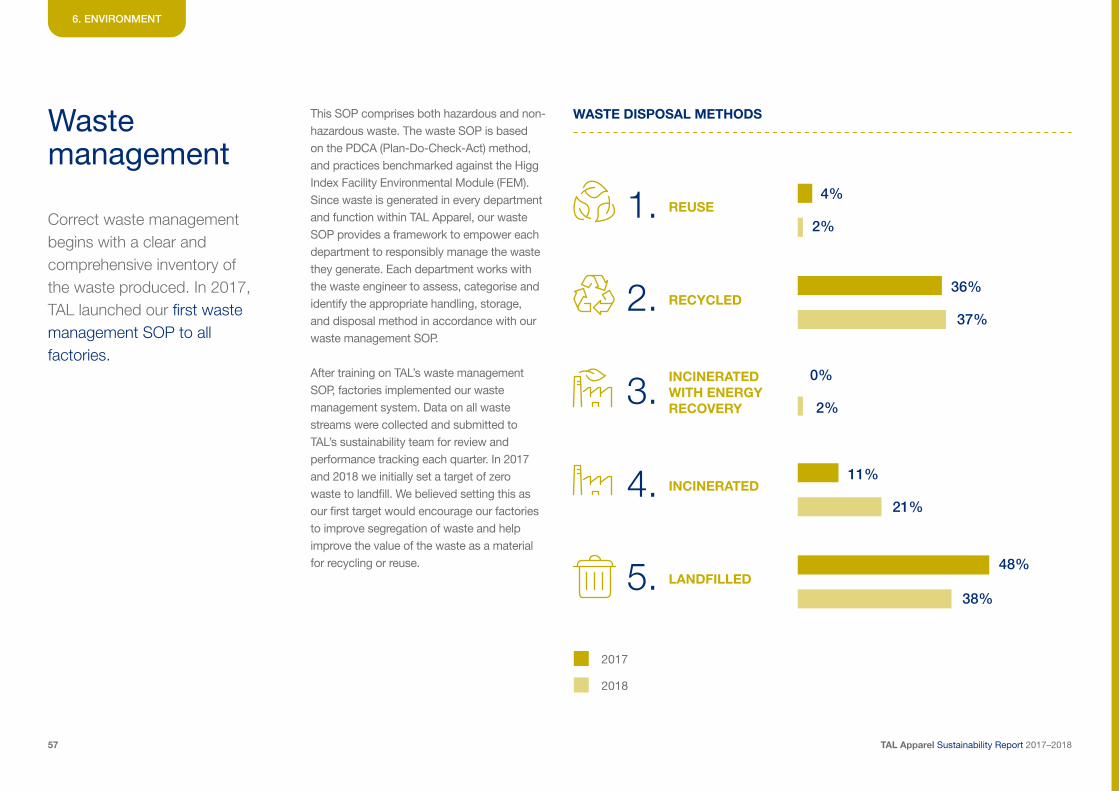
TAL Apparel Sustainability Report 2017–201857
Waste management
6. ENVIRONMENT
This SOP comprises both hazardous and non-hazardous waste. The waste SOP is based on the PDCA (Plan-Do-Check-Act) method, and practices benchmarked against the Higg Index Facility Environmental Module (FEM). Since waste is generated in every department and function within TAL Apparel, our waste SOP provides a framework to empower each department to responsibly manage the waste they generate. Each department works with the waste engineer to assess, categorise and identify the appropriate handling, storage, and disposal method in accordance with our waste management SOP.
After training on TAL’s waste management SOP, factories implemented our waste management system. Data on all waste streams were collected and submitted to TAL’s sustainability team for review and performance tracking each quarter. In 2017 and 2018 we initially set a target of zero waste to landfill. We believed setting this as our first target would encourage our factories to improve segregation of waste and help improve the value of the waste as a material for recycling or reuse.
Correct waste management begins with a clear and comprehensive inventory of the waste produced. In 2017, TAL launched our first waste management SOP to all factories.
WASTE DISPOSAL METHODS
4%
36%
0%
11%
48%
38%
2%
37%
2%
21%
REUSE1.
RECYCLED2.
INCINERATED WITH ENERGY RECOVERY
3.
INCINERATED4.
LANDFILLED5.
2017
2018
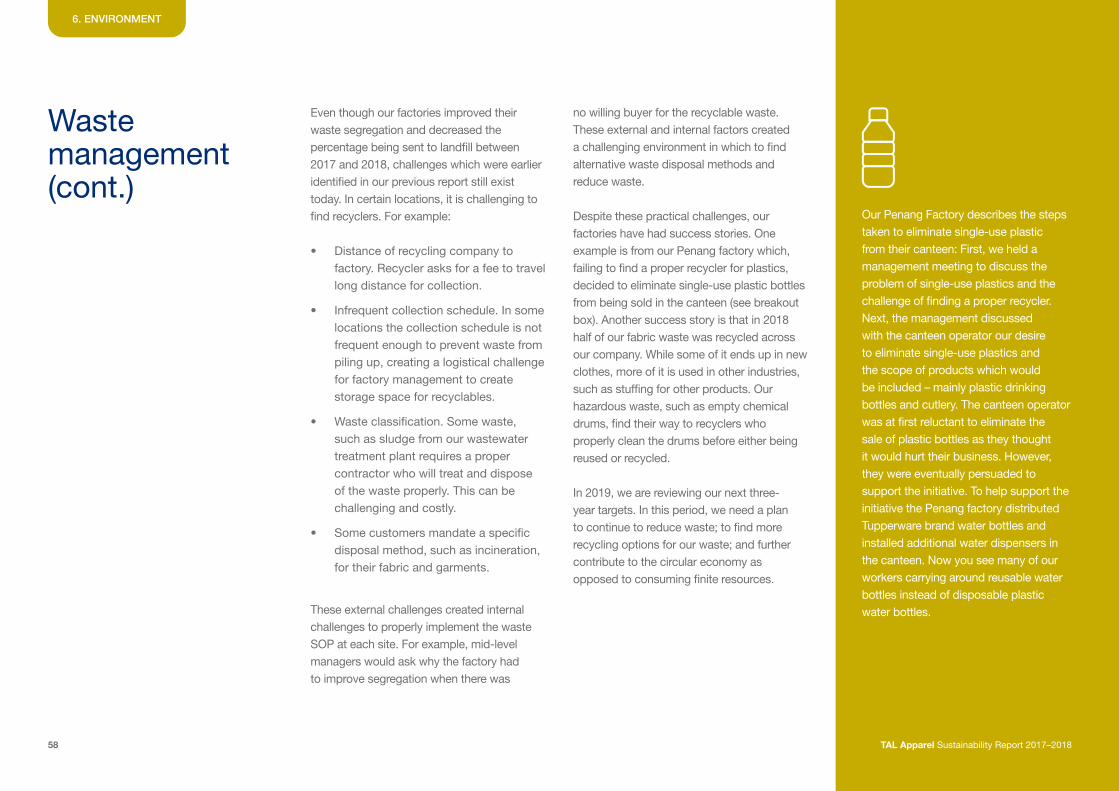
58
Even though our factories improved their waste segregation and decreased the percentage being sent to landfill between 2017 and 2018, challenges which were earlier identified in our previous report still exist today. In certain locations, it is challenging to find recyclers. For example:
• Distance of recycling company to factory. Recycler asks for a fee to travel long distance for collection.
• Infrequent collection schedule. In some locations the collection schedule is not frequent enough to prevent waste from piling up, creating a logistical challenge for factory management to create storage space for recyclables.
• Waste classification. Some waste, such as sludge from our wastewater treatment plant requires a proper contractor who will treat and dispose of the waste properly. This can be challenging and costly.
• Some customers mandate a specific disposal method, such as incineration, for their fabric and garments.
These external challenges created internal challenges to properly implement the waste SOP at each site. For example, mid-level managers would ask why the factory had to improve segregation when there was
no willing buyer for the recyclable waste. These external and internal factors created a challenging environment in which to find alternative waste disposal methods and reduce waste.
Despite these practical challenges, our factories have had success stories. One example is from our Penang factory which, failing to find a proper recycler for plastics, decided to eliminate single-use plastic bottles from being sold in the canteen (see breakout box). Another success story is that in 2018 half of our fabric waste was recycled across our company. While some of it ends up in new clothes, more of it is used in other industries, such as stuffing for other products. Our hazardous waste, such as empty chemical drums, find their way to recyclers who properly clean the drums before either being reused or recycled.
In 2019, we are reviewing our next three-year targets. In this period, we need a plan to continue to reduce waste; to find more recycling options for our waste; and further contribute to the circular economy as opposed to consuming finite resources.
Waste management (cont.)
6. ENVIRONMENT
Our Penang Factory describes the steps taken to eliminate single-use plastic from their canteen: First, we held a management meeting to discuss the problem of single-use plastics and the challenge of finding a proper recycler. Next, the management discussed with the canteen operator our desire to eliminate single-use plastics and the scope of products which would be included – mainly plastic drinking bottles and cutlery. The canteen operator was at first reluctant to eliminate the sale of plastic bottles as they thought it would hurt their business. However, they were eventually persuaded to support the initiative. To help support the initiative the Penang factory distributed Tupperware brand water bottles and installed additional water dispensers in the canteen. Now you see many of our workers carrying around reusable water bottles instead of disposable plastic water bottles.
TAL Apparel Sustainability Report 2017–2018
TAL Apparel Sustainability Report 2017–201859
LEED certification
6. ENVIRONMENT
RENOVATION OF TAL APPAREL HK OFFICE
In renovating TAL’s Hong Kong office, not only were we striving for improved aesthetics, space optimisation and budget control, we were also aiming at creating a comfortable work environment that is good for people and the earth. We followed LEED, Leadership in Energy and Environmental Design, a green building certification program operating under the United States Green Building Council (USGBC). With collaborative efforts from different parties, both internal and external, TAL achieved LEED platinum level in 2016 and 2017 for Phase I (3/F) and Phase II (4/F to 8/F) respectively.
One of the challenging aspects of the renovation was that the design of our showroom was entirely different from our office workstations. While aesthetics was of paramount importance, we also had to uphold the sustainability values. The false ceiling of the whole office was removed to allow a more spacious and brighter environment. We aimed to keep a clean ceiling in the showroom while air-conditioners or fresh air ducts had to be installed to allow sufficient airflow. A win-win solution was finally found by building a platform and installing fresh air ducts within it. The clothes hanging racks were fixed onto this, instead of the original plan to have them attached to the floor. The fresh air system enabled a lower humidity, and thus the
temperature did not need to be lowered while we were still feeling comfortable.
It is TAL’s strategy to integrate environmentally friendly features into our business, which would reduce environmental impact, and we believe that this would improve our performance in the long run, too.
VIETNAM GARMENTS MANUFACTURING CERTIFICATION
TAL’s latest garment factory in Vietnam, Vietnam Garments Manufacturing (VNG), acquired LEED gold standard certification in 2017. The certification was awarded for meeting the LEED requirements in the building design and construction phase. Some examples of VNG’s LEED features during the design and construction phase, are:
• Improved building energy performance by 29% (from LEED baseline)
• Used zero chlorofluorocarbon (CFC)-based refrigerants
• Reduced potable water use by 50% through water-conserving fixtures
• Diverted 75% of construction debris from disposal in landfills and incineration facilities
• Designed natural ventilation systems to improve indoor air quality
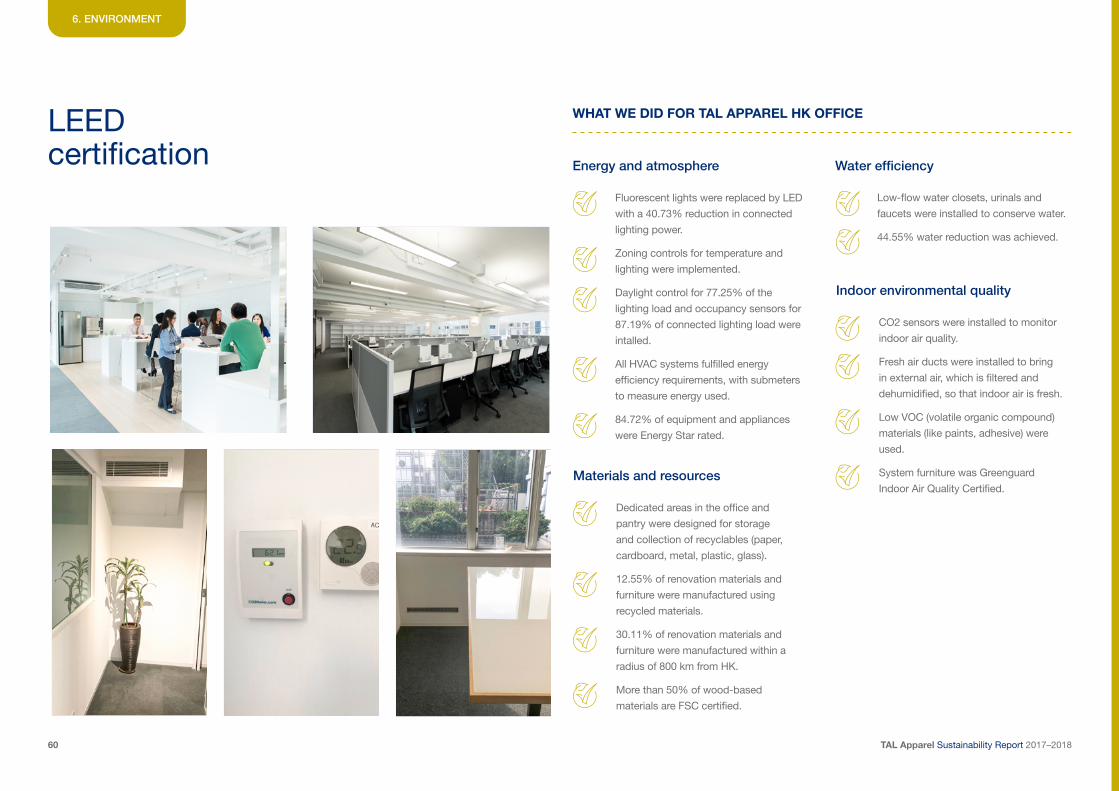
TAL Apparel Sustainability Report 2017–201860
LEED certification
6. ENVIRONMENT
Energy and atmosphere Water efficiency
Materials and resources
Indoor environmental quality
Fluorescent lights were replaced by LED
with a 40.73% reduction in connected
lighting power.
Zoning controls for temperature and
lighting were implemented.
Daylight control for 77.25% of the
lighting load and occupancy sensors for
87.19% of connected lighting load were
intalled.
All HVAC systems fulfilled energy
efficiency requirements, with submeters
to measure energy used.
84.72% of equipment and appliances
were Energy Star rated.
Low-flow water closets, urinals and
faucets were installed to conserve water.
44.55% water reduction was achieved.
Dedicated areas in the office and
pantry were designed for storage
and collection of recyclables (paper,
cardboard, metal, plastic, glass).
12.55% of renovation materials and
furniture were manufactured using
recycled materials.
30.11% of renovation materials and
furniture were manufactured within a
radius of 800 km from HK.
More than 50% of wood-based
materials are FSC certified.
CO2 sensors were installed to monitor
indoor air quality.
Fresh air ducts were installed to bring
in external air, which is filtered and
dehumidified, so that indoor air is fresh.
Low VOC (volatile organic compound)
materials (like paints, adhesive) were
used.
System furniture was Greenguard
Indoor Air Quality Certified.
WHAT WE DID FOR TAL APPAREL HK OFFICE

TAL Apparel Sustainability Report 2017–201861
7
Industry collaboration
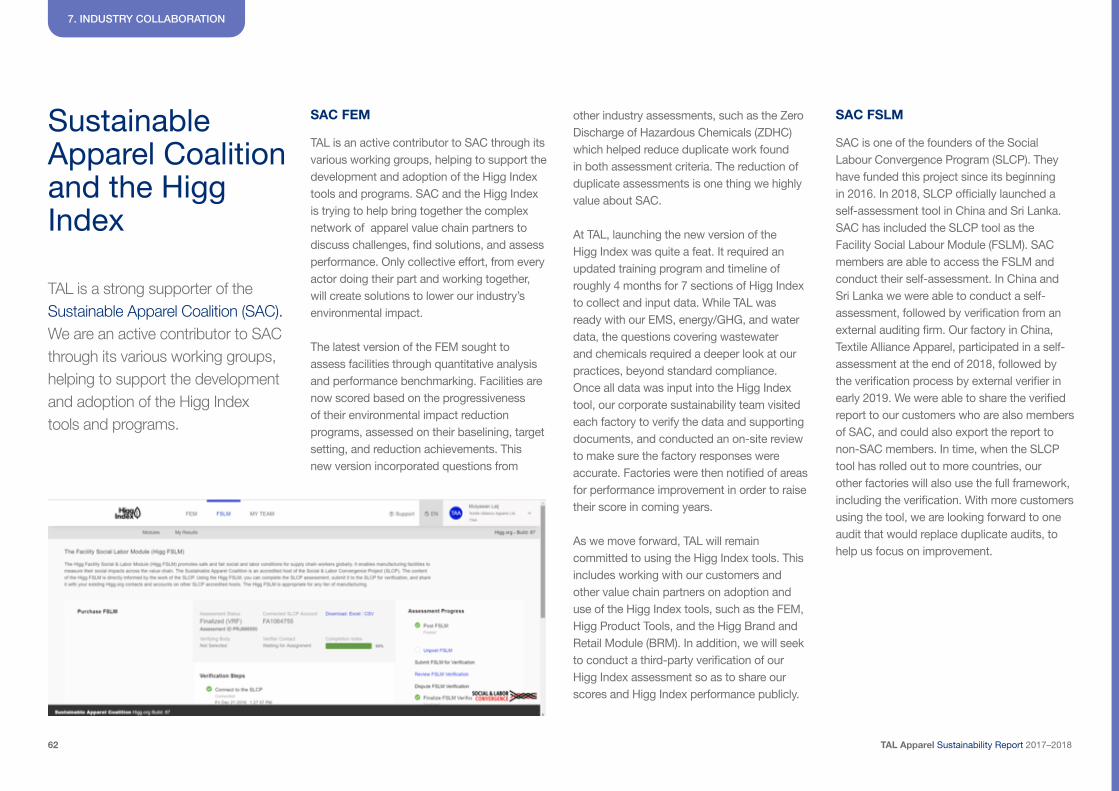
TAL Apparel Sustainability Report 2017–201862
Sustainable Apparel Coalition and the Higg Index
7. INDUSTRY COLLABORATION
SAC FEM SAC FSLM
TAL is an active contributor to SAC through its various working groups, helping to support the development and adoption of the Higg Index tools and programs. SAC and the Higg Index is trying to help bring together the complex network of apparel value chain partners to discuss challenges, find solutions, and assess performance. Only collective effort, from every actor doing their part and working together, will create solutions to lower our industry’s environmental impact.
The latest version of the FEM sought to assess facilities through quantitative analysis and performance benchmarking. Facilities are now scored based on the progressiveness of their environmental impact reduction programs, assessed on their baselining, target setting, and reduction achievements. This new version incorporated questions from
SAC is one of the founders of the Social Labour Convergence Program (SLCP). They have funded this project since its beginning in 2016. In 2018, SLCP officially launched a self-assessment tool in China and Sri Lanka. SAC has included the SLCP tool as the Facility Social Labour Module (FSLM). SAC members are able to access the FSLM and conduct their self-assessment. In China and Sri Lanka we were able to conduct a self-assessment, followed by verification from an external auditing firm. Our factory in China, Textile Alliance Apparel, participated in a self-assessment at the end of 2018, followed by the verification process by external verifier in early 2019. We were able to share the verified report to our customers who are also members of SAC, and could also export the report to non-SAC members. In time, when the SLCP tool has rolled out to more countries, our other factories will also use the full framework, including the verification. With more customers using the tool, we are looking forward to one audit that would replace duplicate audits, to help us focus on improvement.
other industry assessments, such as the Zero Discharge of Hazardous Chemicals (ZDHC) which helped reduce duplicate work found in both assessment criteria. The reduction of duplicate assessments is one thing we highly value about SAC.
At TAL, launching the new version of the Higg Index was quite a feat. It required an updated training program and timeline of roughly 4 months for 7 sections of Higg Index to collect and input data. While TAL was ready with our EMS, energy/GHG, and water data, the questions covering wastewater and chemicals required a deeper look at our practices, beyond standard compliance. Once all data was input into the Higg Index tool, our corporate sustainability team visited each factory to verify the data and supporting documents, and conducted an on-site review to make sure the factory responses were accurate. Factories were then notified of areas for performance improvement in order to raise their score in coming years.
As we move forward, TAL will remain committed to using the Higg Index tools. This includes working with our customers and other value chain partners on adoption and use of the Higg Index tools, such as the FEM, Higg Product Tools, and the Higg Brand and Retail Module (BRM). In addition, we will seek to conduct a third-party verification of our Higg Index assessment so as to share our scores and Higg Index performance publicly.
TAL is a strong supporter of the Sustainable Apparel Coalition (SAC). We are an active contributor to SAC through its various working groups, helping to support the development and adoption of the Higg Index tools and programs.
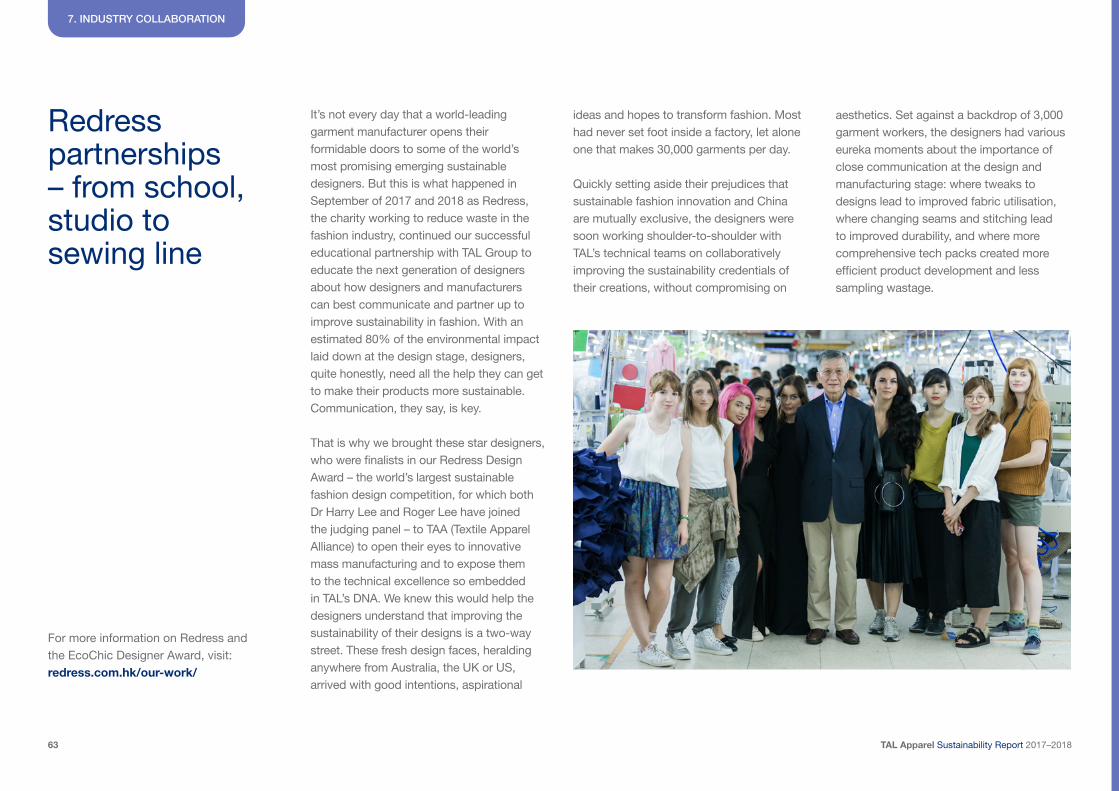
TAL Apparel Sustainability Report 2017–201863
Redress partnerships – from school, studio to sewing line
7. INDUSTRY COLLABORATION
It’s not every day that a world-leading garment manufacturer opens their formidable doors to some of the world’s most promising emerging sustainable designers. But this is what happened in September of 2017 and 2018 as Redress, the charity working to reduce waste in the fashion industry, continued our successful educational partnership with TAL Group to educate the next generation of designers about how designers and manufacturers can best communicate and partner up to improve sustainability in fashion. With an estimated 80% of the environmental impact laid down at the design stage, designers, quite honestly, need all the help they can get to make their products more sustainable. Communication, they say, is key.
That is why we brought these star designers, who were finalists in our Redress Design Award – the world’s largest sustainable fashion design competition, for which both Dr Harry Lee and Roger Lee have joined the judging panel – to TAA (Textile Apparel Alliance) to open their eyes to innovative mass manufacturing and to expose them to the technical excellence so embedded in TAL’s DNA. We knew this would help the designers understand that improving the sustainability of their designs is a two-way street. These fresh design faces, heralding anywhere from Australia, the UK or US, arrived with good intentions, aspirational
ideas and hopes to transform fashion. Most had never set foot inside a factory, let alone one that makes 30,000 garments per day.
Quickly setting aside their prejudices that sustainable fashion innovation and China are mutually exclusive, the designers were soon working shoulder-to-shoulder with TAL’s technical teams on collaboratively improving the sustainability credentials of their creations, without compromising on
For more information on Redress and the EcoChic Designer Award, visit: redress.com.hk/our-work/
aesthetics. Set against a backdrop of 3,000 garment workers, the designers had various eureka moments about the importance of close communication at the design and manufacturing stage: where tweaks to designs lead to improved fabric utilisation, where changing seams and stitching lead to improved durability, and where more comprehensive tech packs created more efficient product development and less sampling wastage.
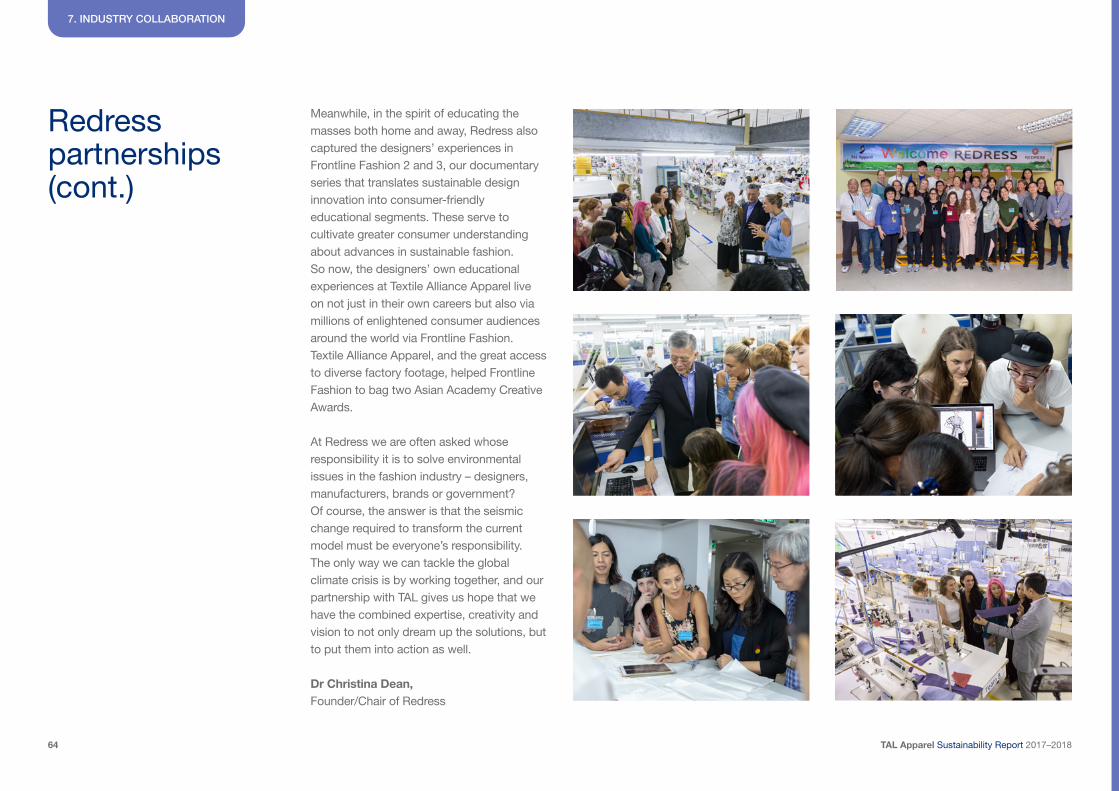
TAL Apparel Sustainability Report 2017–201864
Redress partnerships (cont.)
7. INDUSTRY COLLABORATION
Meanwhile, in the spirit of educating the masses both home and away, Redress also captured the designers’ experiences in Frontline Fashion 2 and 3, our documentary series that translates sustainable design innovation into consumer-friendly educational segments. These serve to cultivate greater consumer understanding about advances in sustainable fashion. So now, the designers’ own educational experiences at Textile Alliance Apparel live on not just in their own careers but also via millions of enlightened consumer audiences around the world via Frontline Fashion. Textile Alliance Apparel, and the great access to diverse factory footage, helped Frontline Fashion to bag two Asian Academy Creative Awards.
At Redress we are often asked whose responsibility it is to solve environmental issues in the fashion industry – designers, manufacturers, brands or government? Of course, the answer is that the seismic change required to transform the current model must be everyone’s responsibility. The only way we can tackle the global climate crisis is by working together, and our partnership with TAL gives us hope that we have the combined expertise, creativity and vision to not only dream up the solutions, but to put them into action as well.
Dr Christina Dean, Founder/Chair of Redress
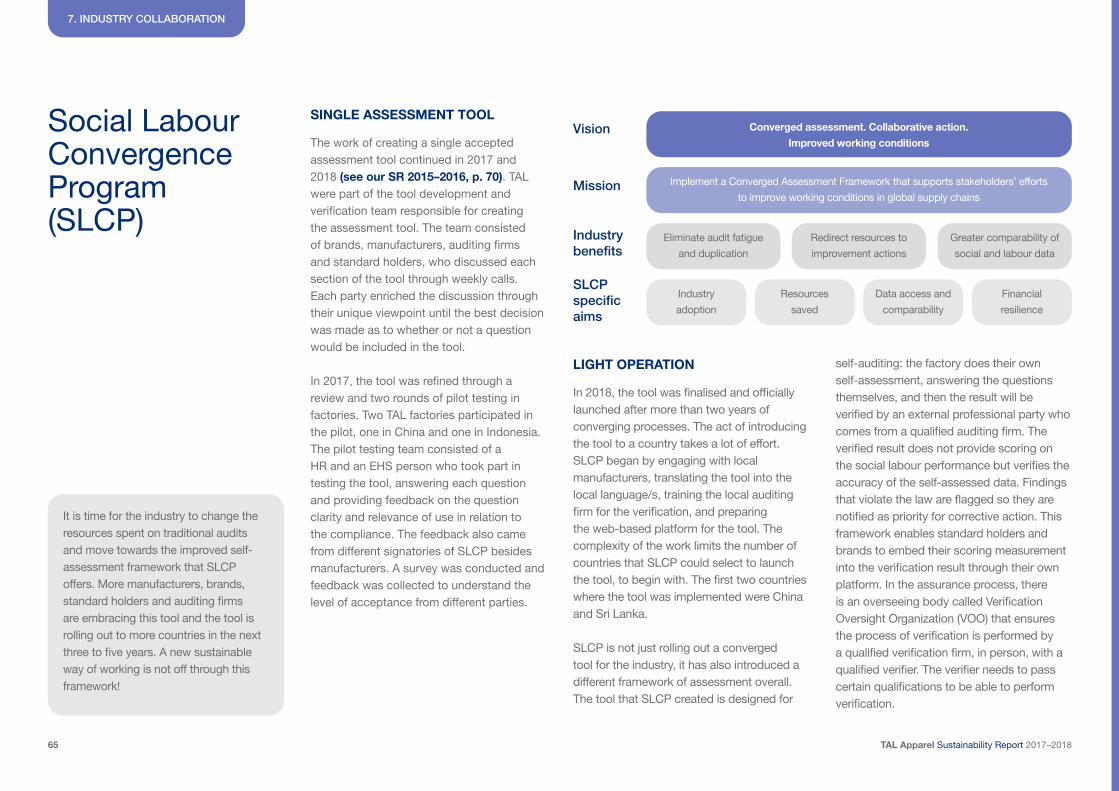
TAL Apparel Sustainability Report 2017–201865
Social Labour Convergence Program (SLCP)
7. INDUSTRY COLLABORATION
SINGLE ASSESSMENT TOOL
LIGHT OPERATION
The work of creating a single accepted assessment tool continued in 2017 and 2018 (see our SR 2015–2016, p. 70). TAL were part of the tool development and verification team responsible for creating the assessment tool. The team consisted of brands, manufacturers, auditing firms and standard holders, who discussed each section of the tool through weekly calls. Each party enriched the discussion through their unique viewpoint until the best decision was made as to whether or not a question would be included in the tool.
In 2017, the tool was refined through a review and two rounds of pilot testing in factories. Two TAL factories participated in the pilot, one in China and one in Indonesia. The pilot testing team consisted of a HR and an EHS person who took part in testing the tool, answering each question and providing feedback on the question clarity and relevance of use in relation to the compliance. The feedback also came from different signatories of SLCP besides manufacturers. A survey was conducted and feedback was collected to understand the level of acceptance from different parties.
In 2018, the tool was finalised and officially launched after more than two years of converging processes. The act of introducing the tool to a country takes a lot of effort. SLCP began by engaging with local manufacturers, translating the tool into the local language/s, training the local auditing firm for the verification, and preparing the web-based platform for the tool. The complexity of the work limits the number of countries that SLCP could select to launch the tool, to begin with. The first two countries where the tool was implemented were China and Sri Lanka.
SLCP is not just rolling out a converged tool for the industry, it has also introduced a different framework of assessment overall. The tool that SLCP created is designed for
It is time for the industry to change the resources spent on traditional audits and move towards the improved self-assessment framework that SLCP offers. More manufacturers, brands, standard holders and auditing firms are embracing this tool and the tool is rolling out to more countries in the next three to five years. A new sustainable way of working is not off through this framework!
self-auditing: the factory does their own self-assessment, answering the questions themselves, and then the result will be verified by an external professional party who comes from a qualified auditing firm. The verified result does not provide scoring on the social labour performance but verifies the accuracy of the self-assessed data. Findings that violate the law are flagged so they are notified as priority for corrective action. This framework enables standard holders and brands to embed their scoring measurement into the verification result through their own platform. In the assurance process, there is an overseeing body called Verification Oversight Organization (VOO) that ensures the process of verification is performed by a qualified verification firm, in person, with a qualified verifier. The verifier needs to pass certain qualifications to be able to perform verification.
Converged assessment. Collaborative action.
Improved working conditions
Implement a Converged Assessment Framework that supports stakeholders’ efforts
to improve working conditions in global supply chains
Eliminate audit fatigue
and duplication
Industry
adoption
Redirect resources to
improvement actions
Resources
saved
Greater comparability of
social and labour data
Data access and
comparability
Financial
resilience
Vision
Mission
Industry benefits
SLCP specific aims
TAL Apparel Sustainability Report 2017–201866
VITAS
7. INDUSTRY COLLABORATION
Since 2018, TAL has been working with the Vietnam Textile and Apparel Association (VITAS), the Sustainable Apparel Coalition (SAC), the Vietnamese government, large international buyers, and a number of NGOs to encourage the apparel industry to adopt the Higg Index Facility Environment Module (FEM). Our target is to brand Vietnam as ‘the sustainable supplier of choice’ to the industry.
TAL has set up and led a sustainability committee with members from the stakeholders above to drive awareness of Higg Index requirements and how adopting the FEM will help VITAS members grow their business while supporting Vietnam’s commitments to the UN’s Sustainable Development Goals and the Paris Agreement.
Aligning so many stakeholders with a range of diversified interests and agendas has not been easy. However, we are making progress. Vietnam currently has more than 600 factories using the Higg Index and we believe we can double that in the next three years!
‘People, the planet and profit’ is an essential component of TAL’s core values and, as such, supporting sustainability in the industry and the community at large is important to TAL.
Transparency is one of our core values at TAL. In the area of sustainability, we aim to build an equal partner relationship instead of transactional auditing with our customer.
Sharing platform We share our sustainability performance and program to our customers to engage them in our sustainability efforts. In the past we were using Fair Factories Clearinghouse (FFC) as a sharing platform for our self-monitoring reports and our external audit reports. Duplicative audits were reduced through this sharing platform and consistent reviews were enabled through the posted self-monitoring reports. Our customers no longer have an interest in reviewing our reports in this particular platform, due to changes in the industry. Therefore, we are looking to subscribe to another platform where more brands will be engaged in sharing and reviewing our sustainability program and self-monitoring reports.
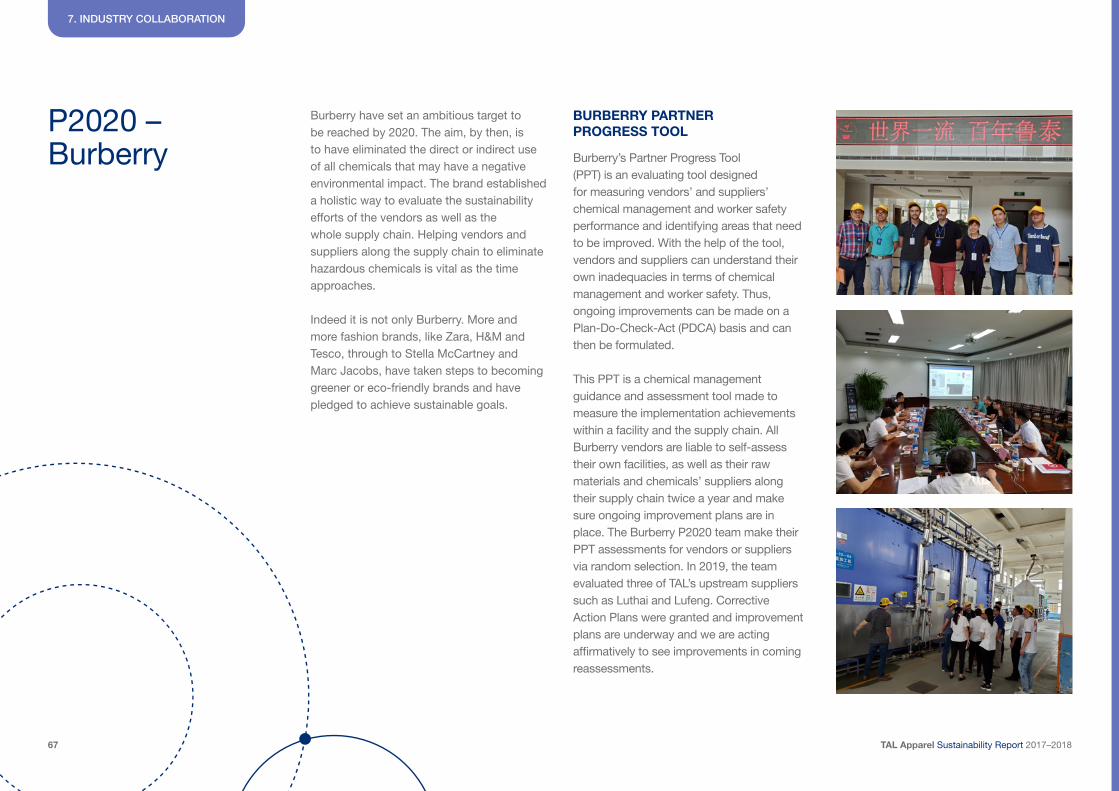
TAL Apparel Sustainability Report 2017–201867
P2020 – Burberry
7. INDUSTRY COLLABORATION
Burberry have set an ambitious target to be reached by 2020. The aim, by then, is to have eliminated the direct or indirect use of all chemicals that may have a negative environmental impact. The brand established a holistic way to evaluate the sustainability efforts of the vendors as well as the whole supply chain. Helping vendors and suppliers along the supply chain to eliminate hazardous chemicals is vital as the time approaches.
Indeed it is not only Burberry. More and more fashion brands, like Zara, H&M and Tesco, through to Stella McCartney and Marc Jacobs, have taken steps to becoming greener or eco-friendly brands and have pledged to achieve sustainable goals.
BURBERRY PARTNER PROGRESS TOOL
Burberry’s Partner Progress Tool (PPT) is an evaluating tool designed for measuring vendors’ and suppliers’ chemical management and worker safety performance and identifying areas that need to be improved. With the help of the tool, vendors and suppliers can understand their own inadequacies in terms of chemical management and worker safety. Thus, ongoing improvements can be made on a Plan-Do-Check-Act (PDCA) basis and can then be formulated.
This PPT is a chemical management guidance and assessment tool made to measure the implementation achievements within a facility and the supply chain. All Burberry vendors are liable to self-assess their own facilities, as well as their raw materials and chemicals’ suppliers along their supply chain twice a year and make sure ongoing improvement plans are in place. The Burberry P2020 team make their PPT assessments for vendors or suppliers via random selection. In 2019, the team evaluated three of TAL’s upstream suppliers such as Luthai and Lufeng. Corrective Action Plans were granted and improvement plans are underway and we are acting affirmatively to see improvements in coming reassessments.
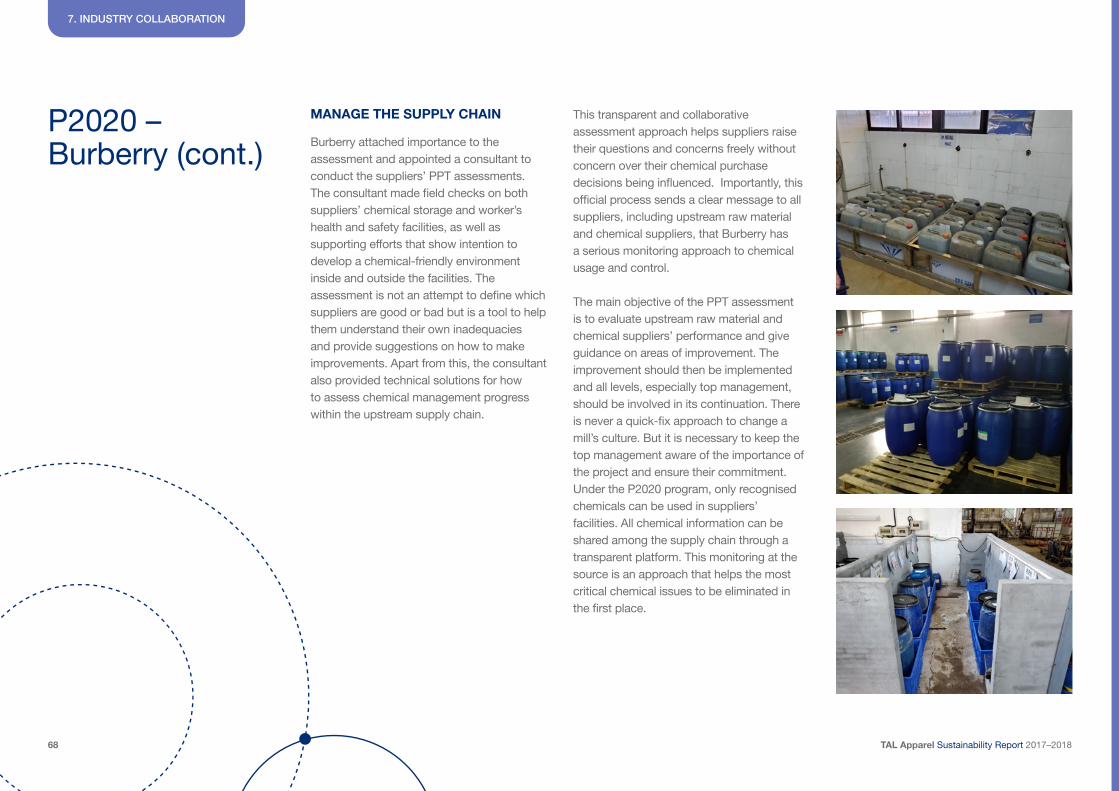
TAL Apparel Sustainability Report 2017–201868
MANAGE THE SUPPLY CHAIN
Burberry attached importance to the assessment and appointed a consultant to conduct the suppliers’ PPT assessments. The consultant made field checks on both suppliers’ chemical storage and worker’s health and safety facilities, as well as supporting efforts that show intention to develop a chemical-friendly environment inside and outside the facilities. The assessment is not an attempt to define which suppliers are good or bad but is a tool to help them understand their own inadequacies and provide suggestions on how to make improvements. Apart from this, the consultant also provided technical solutions for how to assess chemical management progress within the upstream supply chain.
P2020 – Burberry (cont.)
7. INDUSTRY COLLABORATION
This transparent and collaborative assessment approach helps suppliers raise their questions and concerns freely without concern over their chemical purchase decisions being influenced. Importantly, this official process sends a clear message to all suppliers, including upstream raw material and chemical suppliers, that Burberry has a serious monitoring approach to chemical usage and control.
The main objective of the PPT assessment is to evaluate upstream raw material and chemical suppliers’ performance and give guidance on areas of improvement. The improvement should then be implemented and all levels, especially top management, should be involved in its continuation. There is never a quick-fix approach to change a mill’s culture. But it is necessary to keep the top management aware of the importance of the project and ensure their commitment. Under the P2020 program, only recognised chemicals can be used in suppliers’ facilities. All chemical information can be shared among the supply chain through a transparent platform. This monitoring at the source is an approach that helps the most critical chemical issues to be eliminated in the first place.
TAL Apparel Sustainability Report 2017–201869
8
Appendices
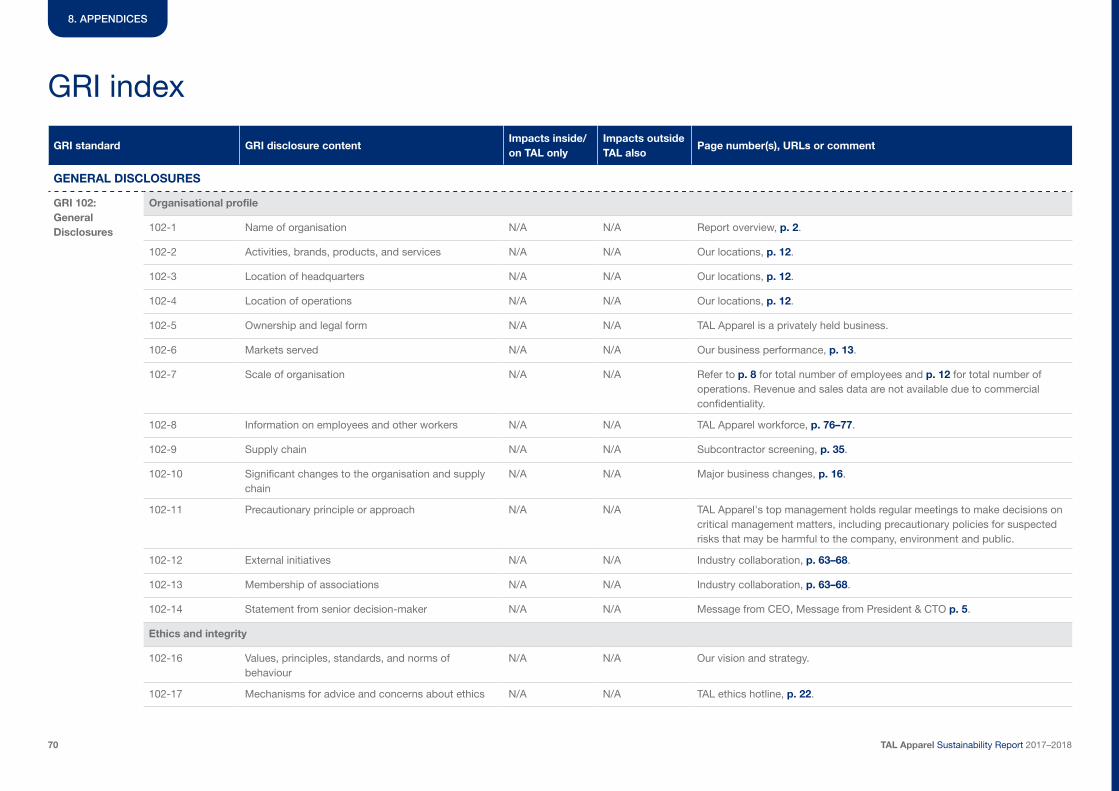
TAL Apparel Sustainability Report 2017–201870
8. APPENDICES
GRI standard GRI disclosure contentImpacts inside/on TAL only
Impacts outside TAL also
Page number(s), URLs or comment
GENERAL DISCLOSURES
GRI 102: General Disclosures
Organisational profile
102-1 Name of organisation N/A N/A Report overview, p. 2.
102-2 Activities, brands, products, and services N/A N/A Our locations, p. 12.
102-3 Location of headquarters N/A N/A Our locations, p. 12.
102-4 Location of operations N/A N/A Our locations, p. 12.
102-5 Ownership and legal form N/A N/A TAL Apparel is a privately held business.
102-6 Markets served N/A N/A Our business performance, p. 13.
102-7 Scale of organisation N/A N/A Refer to p. 8 for total number of employees and p. 12 for total number of operations. Revenue and sales data are not available due to commercial confidentiality.
102-8 Information on employees and other workers N/A N/A TAL Apparel workforce, p. 76–77.
102-9 Supply chain N/A N/A Subcontractor screening, p. 35.
102-10 Significant changes to the organisation and supply chain
N/A N/A Major business changes, p. 16.
102-11 Precautionary principle or approach N/A N/A TAL Apparel's top management holds regular meetings to make decisions on critical management matters, including precautionary policies for suspected risks that may be harmful to the company, environment and public.
102-12 External initiatives N/A N/A Industry collaboration, p. 63–68.
102-13 Membership of associations N/A N/A Industry collaboration, p. 63–68.
102-14 Statement from senior decision-maker N/A N/A Message from CEO, Message from President & CTO p. 5.
Ethics and integrity
102-16 Values, principles, standards, and norms of behaviour
N/A N/A Our vision and strategy.
102-17 Mechanisms for advice and concerns about ethics N/A N/A TAL ethics hotline, p. 22.
GRI index
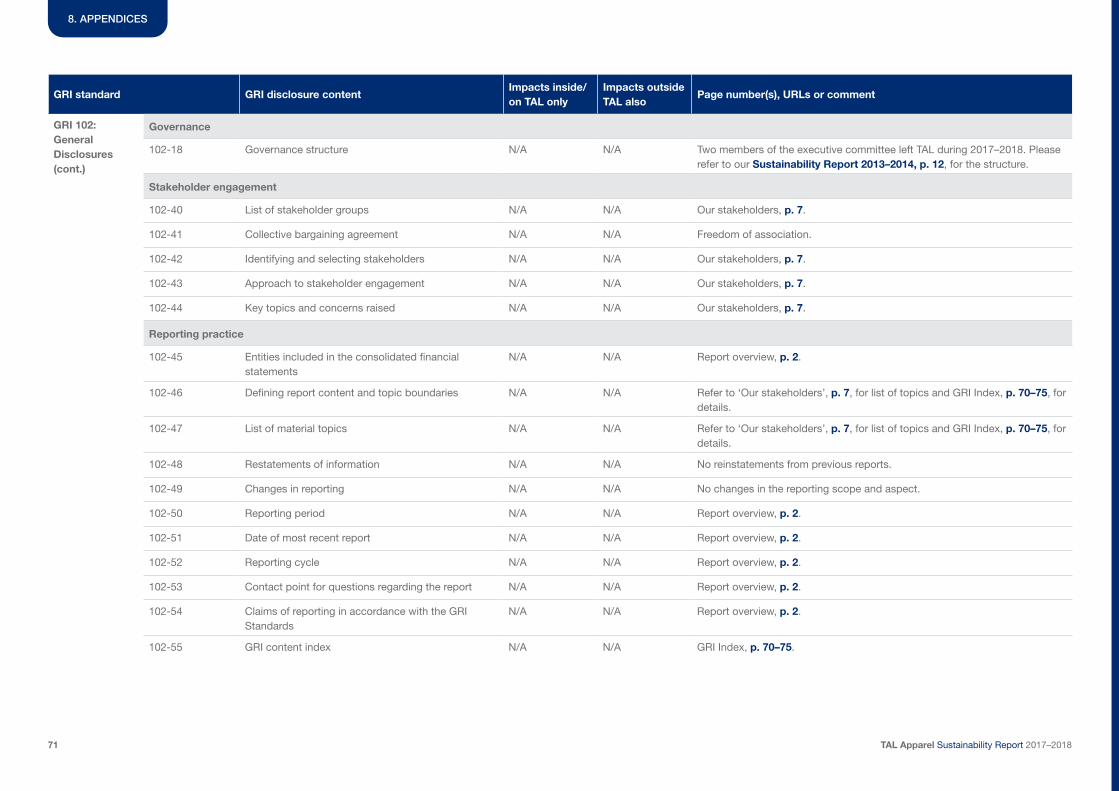
TAL Apparel Sustainability Report 2017–201871
GRI standard GRI disclosure contentImpacts inside/on TAL only
Impacts outside TAL also
Page number(s), URLs or comment
GRI 102: General Disclosures (cont.)
Governance
102-18 Governance structure N/A N/A Two members of the executive committee left TAL during 2017–2018. Please refer to our Sustainability Report 2013–2014, p. 12, for the structure.
Stakeholder engagement
102-40 List of stakeholder groups N/A N/A Our stakeholders, p. 7.
102-41 Collective bargaining agreement N/A N/A Freedom of association.
102-42 Identifying and selecting stakeholders N/A N/A Our stakeholders, p. 7.
102-43 Approach to stakeholder engagement N/A N/A Our stakeholders, p. 7.
102-44 Key topics and concerns raised N/A N/A Our stakeholders, p. 7.
Reporting practice
102-45 Entities included in the consolidated financial statements
N/A N/A Report overview, p. 2.
102-46 Defining report content and topic boundaries N/A N/A Refer to ‘Our stakeholders’, p. 7, for list of topics and GRI Index, p. 70–75, for details.
102-47 List of material topics N/A N/A Refer to ‘Our stakeholders’, p. 7, for list of topics and GRI Index, p. 70–75, for details.
102-48 Restatements of information N/A N/A No reinstatements from previous reports.
102-49 Changes in reporting N/A N/A No changes in the reporting scope and aspect.
102-50 Reporting period N/A N/A Report overview, p. 2.
102-51 Date of most recent report N/A N/A Report overview, p. 2.
102-52 Reporting cycle N/A N/A Report overview, p. 2.
102-53 Contact point for questions regarding the report N/A N/A Report overview, p. 2.
102-54 Claims of reporting in accordance with the GRI Standards
N/A N/A Report overview, p. 2.
102-55 GRI content index N/A N/A GRI Index, p. 70–75.
8. APPENDICES
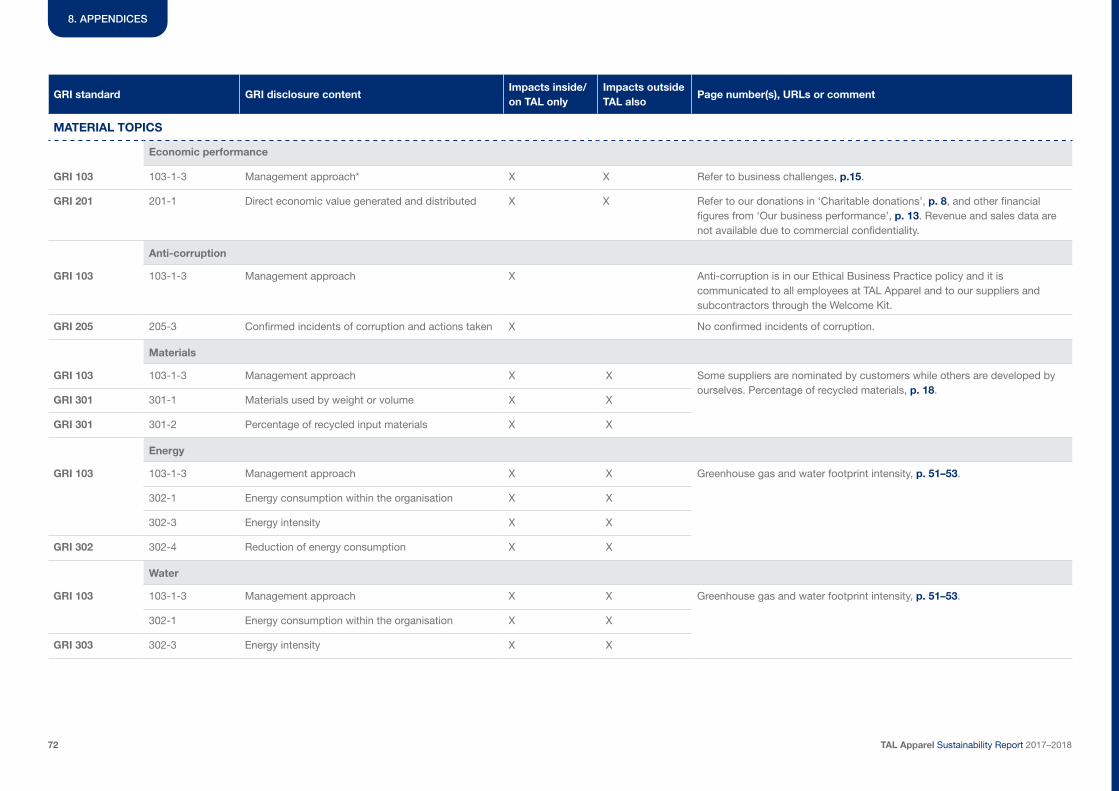
TAL Apparel Sustainability Report 2017–201872
GRI standard GRI disclosure contentImpacts inside/on TAL only
Impacts outside TAL also
Page number(s), URLs or comment
MATERIAL TOPICS
Economic performance
GRI 103 103-1-3 Management approach* X X Refer to business challenges, p.15.
GRI 201 201-1 Direct economic value generated and distributed X X Refer to our donations in ‘Charitable donations’, p. 8, and other financial figures from ‘Our business performance’, p. 13. Revenue and sales data are not available due to commercial confidentiality.
Anti-corruption
GRI 103 103-1-3 Management approach X Anti-corruption is in our Ethical Business Practice policy and it is communicated to all employees at TAL Apparel and to our suppliers and subcontractors through the Welcome Kit.
GRI 205 205-3 Confirmed incidents of corruption and actions taken X No confirmed incidents of corruption.
Materials
GRI 103 103-1-3 Management approach X X Some suppliers are nominated by customers while others are developed by ourselves. Percentage of recycled materials, p. 18.
GRI 301 301-1 Materials used by weight or volume X X
GRI 301 301-2 Percentage of recycled input materials X X
Energy
GRI 103 103-1-3 Management approach X X Greenhouse gas and water footprint intensity, p. 51–53.
302-1 Energy consumption within the organisation X X
302-3 Energy intensity X X
GRI 302 302-4 Reduction of energy consumption X X
Water
GRI 103 103-1-3 Management approach X X Greenhouse gas and water footprint intensity, p. 51–53.
302-1 Energy consumption within the organisation X X
GRI 303 302-3 Energy intensity X X
8. APPENDICES
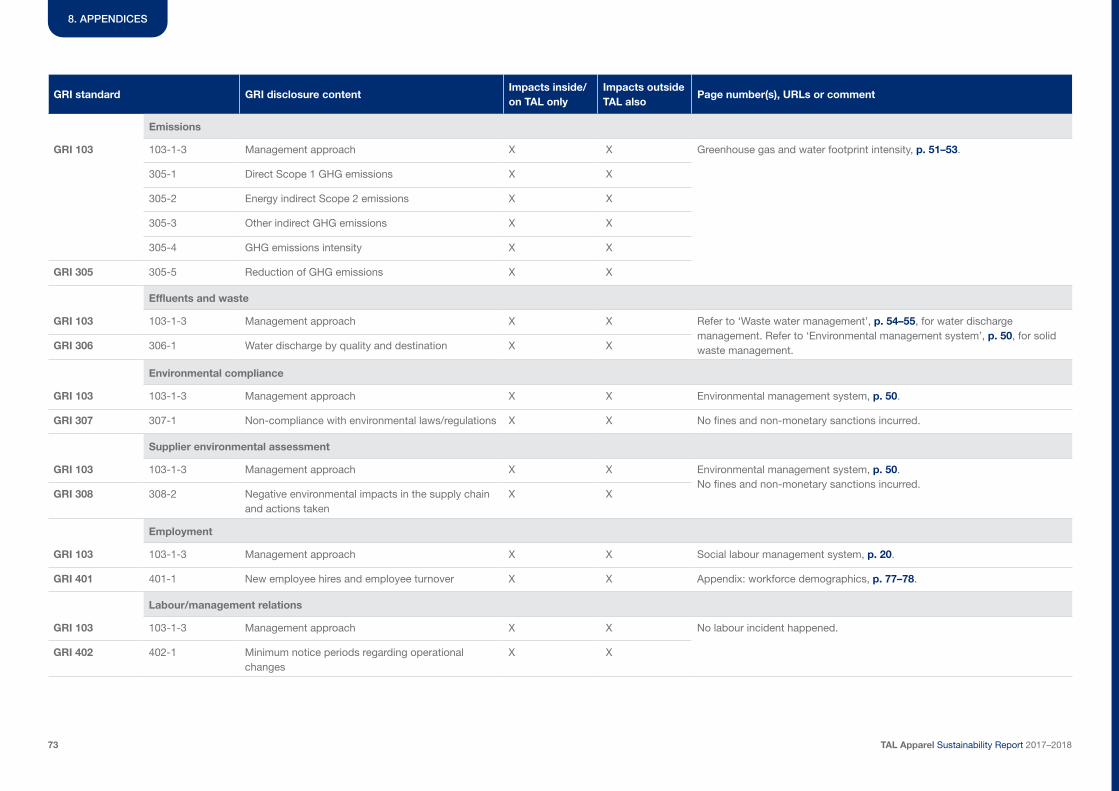
TAL Apparel Sustainability Report 2017–201873
GRI standard GRI disclosure contentImpacts inside/on TAL only
Impacts outside TAL also
Page number(s), URLs or comment
Emissions
GRI 103 103-1-3 Management approach X X Greenhouse gas and water footprint intensity, p. 51–53.
305-1 Direct Scope 1 GHG emissions X X
305-2 Energy indirect Scope 2 emissions X X
305-3 Other indirect GHG emissions X X
305-4 GHG emissions intensity X X
GRI 305 305-5 Reduction of GHG emissions X X
Effluents and waste
GRI 103 103-1-3 Management approach X X Refer to ‘Waste water management’, p. 54–55, for water discharge management. Refer to ‘Environmental management system’, p. 50, for solid waste management.GRI 306 306-1 Water discharge by quality and destination X X
Environmental compliance
GRI 103 103-1-3 Management approach X X Environmental management system, p. 50.
GRI 307 307-1 Non-compliance with environmental laws/regulations X X No fines and non-monetary sanctions incurred.
Supplier environmental assessment
GRI 103 103-1-3 Management approach X X Environmental management system, p. 50.No fines and non-monetary sanctions incurred.
GRI 308 308-2 Negative environmental impacts in the supply chain and actions taken
X X
Employment
GRI 103 103-1-3 Management approach X X Social labour management system, p. 20.
GRI 401 401-1 New employee hires and employee turnover X X Appendix: workforce demographics, p. 77–78.
Labour/management relations
GRI 103 103-1-3 Management approach X X No labour incident happened.
GRI 402 402-1 Minimum notice periods regarding operational changes
X X
8. APPENDICES

TAL Apparel Sustainability Report 2017–201874
GRI standard GRI disclosure contentImpacts inside/on TAL only
Impacts outside TAL also
Page number(s), URLs or comment
Occupational health and safety
GRI 103 103-1-3 Management approach X X Health and safety strategy, p. 40–44.
GRI 403 403-2 Types of injury and rates of injury, occupational diseases, lost days, and absenteeism, and number of work-related fatalities
X X Update on health and safety performance, p. 37–39. Occupational disease rate (ODR) and absentee rate (AR), injury data breakdown by region and gender are unavailable due to lack of information.
Training and education
GRI 103 103-1-3 Management approach X Managerial Leadership Competencies, p. 28; Functional Skilled Training, p. 29–30.No formal transition assistance programs for employees who retire or are terminated.
GRI 404 404-2 Programs for upgrading employee skills and transition assistance programs
X
Diversity and equal opportunity
GRI 103 103-1-3 Management approach X Two members of the executive committee left TAL during 2017–2018. Please refer to our Sustainability Report 2013–2014, p. 80, for the diversity metrics. For the diversity of our managerial, non-managerial and operator employees, see p. 77–78.
GRI 405 405-1 Diversity of governance bodies and employees X
Non-discrimination
GRI 103 103-1-3 Management approach X X Non-discrimination is regulated as part of the social labour management system and is monitored as part of the self-monitoring program, p. 21. Subcontractors are screened on this topic as well, p. 35. GRI 406 406-1 Incidents of discrimination and corrective actions
takenX X
Freedom of Association and collective bargaining
GRI 103 103-1-3 Management approach X X Freedom of Association is regulated as part of the social labour management system and is monitored as part of the self-monitoring program, p. 21.
GRI 407 407-1 Operations and suppliers in which the right to freedom of association and collective bargaining may be at risk
X X
Child labour
GRI 103 103-1-3 Management approach X X Child labour is regulated as part of the social labour management system and is monitored as part of the self-monitoring program, p. 21. Subcontractors are screened on this topic as well, p. 35. GRI 408 408-1 Operations and suppliers at significant risk for
incidents of child labourX X
8. APPENDICES
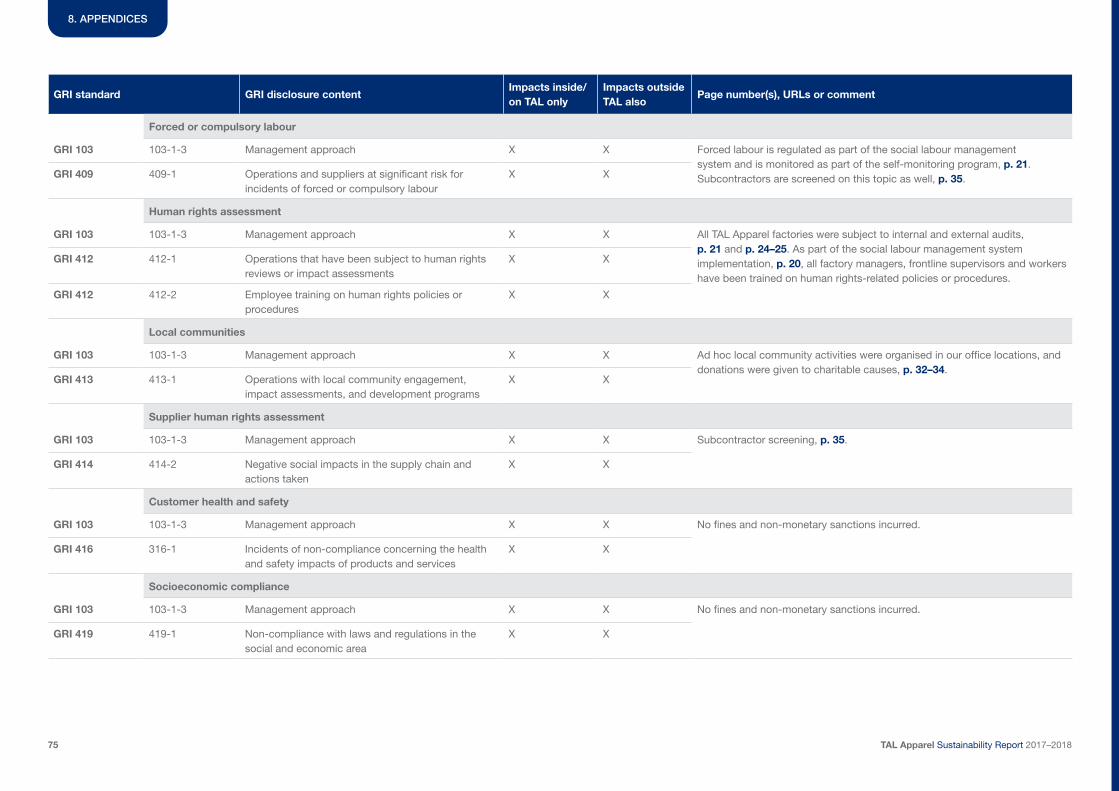
TAL Apparel Sustainability Report 2017–201875
GRI standard GRI disclosure contentImpacts inside/on TAL only
Impacts outside TAL also
Page number(s), URLs or comment
Forced or compulsory labour
GRI 103 103-1-3 Management approach X X Forced labour is regulated as part of the social labour management system and is monitored as part of the self-monitoring program, p. 21. Subcontractors are screened on this topic as well, p. 35. GRI 409 409-1 Operations and suppliers at significant risk for
incidents of forced or compulsory labourX X
Human rights assessment
GRI 103 103-1-3 Management approach X X All TAL Apparel factories were subject to internal and external audits, p. 21 and p. 24–25. As part of the social labour management system implementation, p. 20, all factory managers, frontline supervisors and workers have been trained on human rights-related policies or procedures.
GRI 412 412-1 Operations that have been subject to human rights reviews or impact assessments
X X
GRI 412 412-2 Employee training on human rights policies or procedures
X X
Local communities
GRI 103 103-1-3 Management approach X X Ad hoc local community activities were organised in our office locations, and donations were given to charitable causes, p. 32–34.
GRI 413 413-1 Operations with local community engagement, impact assessments, and development programs
X X
Supplier human rights assessment
GRI 103 103-1-3 Management approach X X Subcontractor screening, p. 35.
GRI 414 414-2 Negative social impacts in the supply chain and actions taken
X X
Customer health and safety
GRI 103 103-1-3 Management approach X X No fines and non-monetary sanctions incurred.
GRI 416 316-1 Incidents of non-compliance concerning the health and safety impacts of products and services
X X
Socioeconomic compliance
GRI 103 103-1-3 Management approach X X No fines and non-monetary sanctions incurred.
GRI 419 419-1 Non-compliance with laws and regulations in the social and economic area
X X
8. APPENDICES
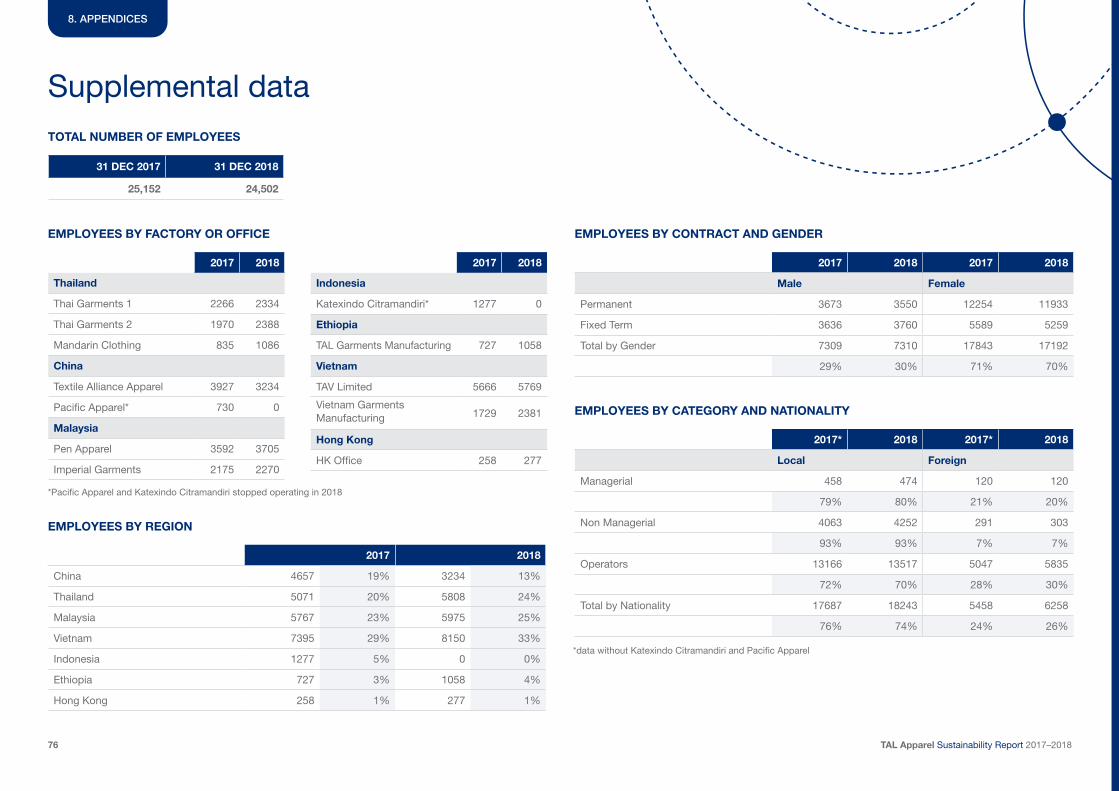
TAL Apparel Sustainability Report 2017–201876
8. APPENDICES
Supplemental data
31 DEC 2017 31 DEC 2018
25,152 24,502
2017 2018
Thailand
Thai Garments 1 2266 2334
Thai Garments 2 1970 2388
Mandarin Clothing 835 1086
China
Textile Alliance Apparel 3927 3234
Pacific Apparel* 730 0
Malaysia
Pen Apparel 3592 3705
Imperial Garments 2175 2270
2017 2018
Indonesia
Katexindo Citramandiri* 1277 0
Ethiopia
TAL Garments Manufacturing 727 1058
Vietnam
TAV Limited 5666 5769
Vietnam Garments Manufacturing 1729 2381
Hong Kong
HK Office 258 277
2017 2018
China 4657 19% 3234 13%
Thailand 5071 20% 5808 24%
Malaysia 5767 23% 5975 25%
Vietnam 7395 29% 8150 33%
Indonesia 1277 5% 0 0%
Ethiopia 727 3% 1058 4%
Hong Kong 258 1% 277 1%
2017 2018 2017 2018
Male Female
Permanent 3673 3550 12254 11933
Fixed Term 3636 3760 5589 5259
Total by Gender 7309 7310 17843 17192
29% 30% 71% 70%
2017* 2018 2017* 2018
Local Foreign
Managerial 458 474 120 120
79% 80% 21% 20%
Non Managerial 4063 4252 291 303
93% 93% 7% 7%
Operators 13166 13517 5047 5835
72% 70% 28% 30%
Total by Nationality 17687 18243 5458 6258
76% 74% 24% 26%
TOTAL NUMBER OF EMPLOYEES
EMPLOYEES BY FACTORY OR OFFICE
EMPLOYEES BY REGION
EMPLOYEES BY CONTRACT AND GENDER
EMPLOYEES BY CATEGORY AND NATIONALITY
*data without Katexindo Citramandiri and Pacific Apparel
*Pacific Apparel and Katexindo Citramandiri stopped operating in 2018
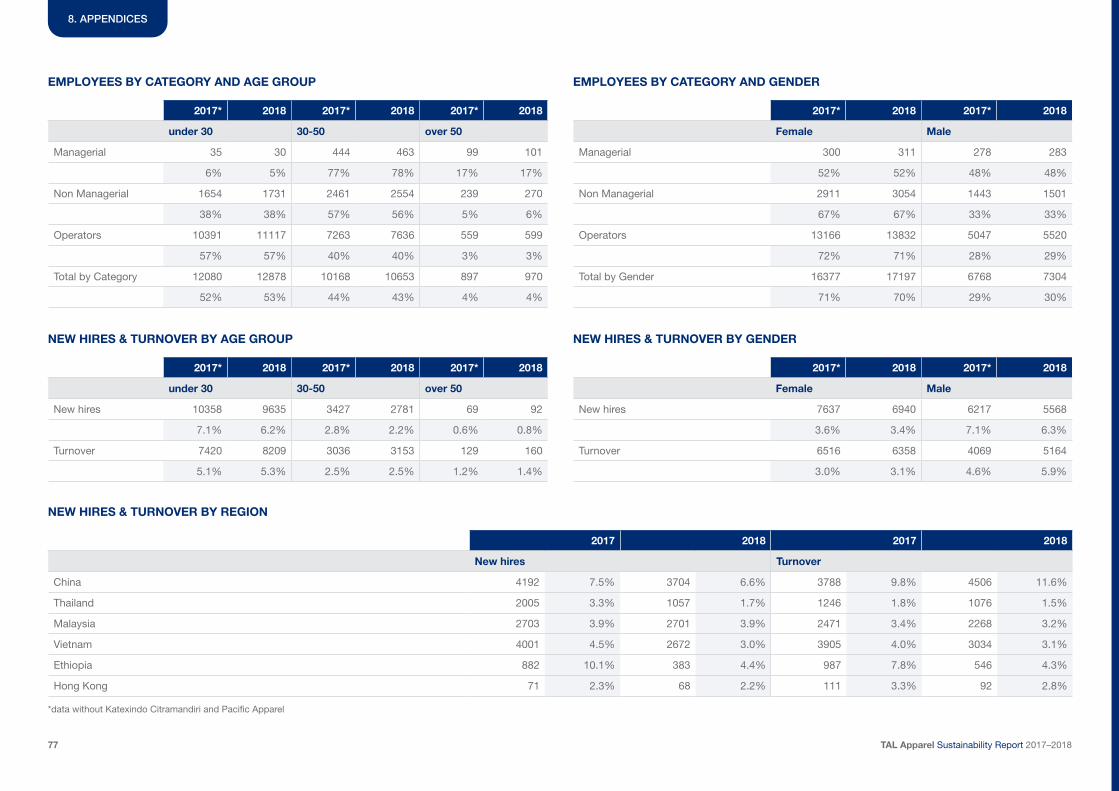
TAL Apparel Sustainability Report 2017–201877
8. APPENDICES
2017* 2018 2017* 2018 2017* 2018
under 30 30-50 over 50
Managerial 35 30 444 463 99 101
6% 5% 77% 78% 17% 17%
Non Managerial 1654 1731 2461 2554 239 270
38% 38% 57% 56% 5% 6%
Operators 10391 11117 7263 7636 559 599
57% 57% 40% 40% 3% 3%
Total by Category 12080 12878 10168 10653 897 970
52% 53% 44% 43% 4% 4%
2017* 2018 2017* 2018 2017* 2018
under 30 30-50 over 50
New hires 10358 9635 3427 2781 69 92
7.1% 6.2% 2.8% 2.2% 0.6% 0.8%
Turnover 7420 8209 3036 3153 129 160
5.1% 5.3% 2.5% 2.5% 1.2% 1.4%
2017* 2018 2017* 2018
Female Male
Managerial 300 311 278 283
52% 52% 48% 48%
Non Managerial 2911 3054 1443 1501
67% 67% 33% 33%
Operators 13166 13832 5047 5520
72% 71% 28% 29%
Total by Gender 16377 17197 6768 7304
71% 70% 29% 30%
2017* 2018 2017* 2018
Female Male
New hires 7637 6940 6217 5568
3.6% 3.4% 7.1% 6.3%
Turnover 6516 6358 4069 5164
3.0% 3.1% 4.6% 5.9%
EMPLOYEES BY CATEGORY AND AGE GROUP
NEW HIRES & TURNOVER BY AGE GROUP
EMPLOYEES BY CATEGORY AND GENDER
NEW HIRES & TURNOVER BY GENDER
*data without Katexindo Citramandiri and Pacific Apparel
2017 2018 2017 2018
New hires Turnover
China 4192 7.5% 3704 6.6% 3788 9.8% 4506 11.6%
Thailand 2005 3.3% 1057 1.7% 1246 1.8% 1076 1.5%
Malaysia 2703 3.9% 2701 3.9% 2471 3.4% 2268 3.2%
Vietnam 4001 4.5% 2672 3.0% 3905 4.0% 3034 3.1%
Ethiopia 882 10.1% 383 4.4% 987 7.8% 546 4.3%
Hong Kong 71 2.3% 68 2.2% 111 3.3% 92 2.8%
NEW HIRES & TURNOVER BY REGION
TAL Apparel Sustainability Report 2017–201878
5/F, TAL Building49 Austin Road, KolwoonHong Kong