Embed Size (px)
Citation preview
Research article
Received: 7 September 2012 Revised: 17 December 2012 Accepted: 20 December 2012 Published online in Wiley Online Library
(wileyonlinelibrary.com) DOI 10.1002/jms.3160
Structural characterization of flavonoidglycosides from leaves of wheat (Triticumaestivum L.) using LC/MS/MS profiling of thetarget compoundsAnna Wojakowska,a Juliusz Perkowski,b Tomasz Góralc andMaciej Stobieckia*
The aim of this study was to present integrated mass spectrometric methods for the structural characterization and identificationof flavonoid glycoconjugates. During the liquid chromatography/mass spectrometry analyses, TriVersa NanoMate chip-based
system with nanoelectrospray ionization and fraction collection was combined to a quadrupole time-of-flight mass spectrometer.In the extract samples prepared from green leaves of wheat plantlets, 41 flavonoid derivatives were recognized. Part of the targetnatural products had the full structure being characterized after the registration ofmass spectra, wherem/z values for protonated[M+H]+ and deprotonatedmolecules [M�H]�were annotated. MS2 and pseudo-MS3 experiments were performed for [M+H]+ or[M�H]� and aglycone ions (Y0+/�-type), respectively. It should be underlined that pseudo-MS3 mass spectra were registered foraglycone product ions in the mass spectra of O-glycosides present in the extract samples. In many cases, only tentative structuralidentification of aglycones was possible, mainly because of the presence of numerous C-monoglycoside or C-diglycoside in thesamples. Acylation of the sugar moiety and/or methylation of the aglycone in the flavonoid glycosides under study was observed.The existence of isobaric and/or isomeric compounds was demonstrated in the extract studied. The collision-induced dissociationmass spectra registered for C,O-diglycosides and C,C-diglycosides did not permit to draw complete structural conclusions aboutthe compounds studied. For the investigated class of natural products, unambiguous classification of sugar moieties linked tothe aglycones from the recorded mass spectra was not possible. Registration of the positive and negative ion mass spectradid not lead to the precise conclusion about the glycosylation position at C-6 or C-8, andO-40 orO-7 atoms. It was possible, onthe basis of the collected MS2 spectra, to differentiate between O-glycosides and C-glycosides present in the samples analyzed.Copyright © 2013 John Wiley & Sons, Ltd.
Supporting information may be found in the version of this article.
Keywords: collision-induced dissociation; electrospray ionization; flavonoid C-glycoconjugates and/or O-glycoconjugates; liquidchromatography/mass spectrometry; secondary metabolite profiling; structural characterization; wheat
* Correspondence to: Maciej Stobiecki, Institute of Bioorganic Chemistry,Polish Academy of Sciences, Noskowskiego 12/14, 61-704 Poznań, Poland.E-mail: [email protected]
a Institute of Bioorganic Chemistry, Polish Academy of Sciences, Noskowskiego12/14, 61-704 Poznań, Poland
b Department of Chemistry, Poznań University of Life Sciences, Wojska Polskiego75, 60-625 Poznań, Poland
c Department of Plant Pathology, Plant Breeding and Acclimatization Institute – NRI,Radzików, 05-870 Błonie, Poland
329
Introduction
Flavonoids and their glycoconjugates constitute an importantclass of secondary metabolites present in the plant kingdom.There are over 8000 known different natural products belongingto this class of metabolites.[1] Interestingly, polyphenols and theirderivatives create a group of natural products representing awide range of biological roles or activities.[2–8]
Possibilities of profiling and structural analysis of flavonoidconjugates were reported in various reviews.[1,9–15] Experimentalpapers described applications of different liquid chromatography/mass spectrometry systems (LC/MS), where various methodicalapproaches were used for gaining structural information abouttarget natural products during the analyses of extract samples withthe complicated composition. When electrospray ionization (ESI) ofthe LC eluate is applied, the principal methodology is based on theapplication of collision-induced dissociation (CID) in tandem MSexperiments for obtaining information about masses of aglyconeand sugars. In well-defined ionization conditions and properlychosen energy of CID experiments, it is possible to obtain good-quality product ion mass spectra that bear interesting structural
J. Mass Spectrom. 2013, 48, 329–339
data. Information about the identification of the flavonoidglycosides based on the registered CID mass spectra of productions is widely described.[13–22] The published papers presentedmainly examples of structural MS analyses concerned with the sizeof sugar rings and substitution pattern of sugars on an aglycone orplacement of an interglycosidic bond.[12–15] Additionally, in LC/MSsystems with a triple quadruple or quadrupole time-of-flight(q-ToF) analyzer, it is possible to obtain pseudo-MS3 spectra foraglycone ions in the glycosides and comparison of the product
Copyright © 2013 John Wiley & Sons, Ltd.
A. Wojakowska et al.
330
ion spectra with the standards.[20,21] It should be underlinedthat these data are accessible with ion trap and orbitrap massspectrometers in regular MS3 experiments.[22] Moreover, post-column addition of cations to the LC eluate prior to ESI ionizationhelps gain an amount of structural information because of theappearance of newproduct ions inmass spectra.[23,24] The applicationof medium-resolution analyzers [about 15 000 full width at halfmaximum (FWHM)] in themass spectrometers enables the registra-tion of m/z values of ions with accuracy up to the fourth decimalpoint, and it allows to achieve, for masses of protonated or depro-tonated molecules above 200Da, an accuracy better than 5ppm.On the basis of accurate m/z values, it is possible to differentiateisobaric compounds present in the studied extract samples. Forexample, these were acylated with substituted aromatic acidmolecule flavone diglycosides and flavone triglycoside.[25,26]
Profiling of flavonoid glycoconjugates and other phenolicnatural products with LC/MS methods in the samples obtainedfrom wheat plant leaves or grains was reported earlier.[27–31]
We were able to detect O-glycosides or C-glycosides, mixed O,C-diglycosides and C,C-diglycosides in the studied samples fromwheat plants. In this paper, we describe our strategy, whereCID-MS2 and pseudo-MS3 experiments combined with informationabout the accurate mass of protonated/deprotonated moleculespermits to conduct profiling and, to some extent, the structuralanalysis of flavonoid glycoconjugates present in a complicatedmixture. The attempts were undertaken to obtain maximumstructural information about sugar classes and sizes and theirsubstitution on aglycones. The recognition of acylated flavonoidglycosides with aromatic acids present in the samples of wheatleaf extracts was achieved. Pre-concentration of the wheatextract samples with solid-phase extraction (SPE) on reversed-phase (RP) C18 column was applied for the elimination of matrixcompounds present in the samples in order to improve thesignal-to-noise ratio.
Experimental
Plant material
Plant material was obtained from winter wheat (Triticum aestivumL. var. Legenda); this variety is present on the Polish National Listof Varieties and is grown in Poland in commercial fields.Plant material was collected from young seedlings. Pre-
germinated healthy kernels were sown in germination trays.Seedlings were cultivated in the growth chamber with a 16-hphotoperiod at 15 �C for 10 days. Next, seedling leaves werecollected to 4-ml cryogenic vials, and about ten leaves were cutfor single samples. Immediately, the plant material was frozen inliquid nitrogen and next kept in a �80 �C freezer for analysis.
Extraction of phenolic secondarymetabolites from plant tissues
For the structural elucidation of flavonoid glycoconjugates, thefrozen plant material (600mg fresh weight) was homogenizedin the ball mill from Retsch, model 400 (Dusseldorf, Germany).The plant material was suspended in 4ml of 80% MeOH, andthe suspension was placed in an ultrasonic bath for 30min. Theextract was centrifuged, and the supernatant was transferredto new screw-cupped tubes. The solvent was evaporated in avacuum concentrator, Savant SPD 121P (Thermo ElectronCorporation, Waltham, MA, USA); during this procedure, the tubeswere placed in a tray rotating in vacuum at room temperature.
wileyonlinelibrary.com/journal/jms Copyright © 2013 Jo
Dried extract samples were dissolved in water (1.5ml) andsubjected to SPE on RP C-18 silica gel (300mg) from Baker (Omaha,NE, USA). Next SPE column was washed with 2ml of H2O, andthe adsorbed target natural products were eluted with 2ml ofmethanol. The sample solution after SPE was evaporated todryness (vacuum concentrator) and dissolved in 600ml of 80%MeOH and immediately subjected to the LC/MS analyses.
Liquid chromatography/mass spectrometry
LC/MS analyses of plant extracts were performed with WatersAcquity UPLC system (Milford, MA, USA) connected to a massspectrometer Model micrOTOF-Q from Bruker Daltonics (Bremen,Germany) combined with TriVersa NanoMate system fromAdvion (Ithaca NY, USA).
The analyses were carried out using Poroshell 120 EC-C18columns (2.1� 100mm, granulation of 2.7 mm, Agilent). Theinjection volume to the LC/MS system of the sample solutionwas 5ml. Chromatographic separation was performed at a0.6ml/min flow rate by using mixtures of two solvents: A(99.5% H2O/0.5% formic acid v/v) and B (99.5% acetonitrile/0.5% formic acid v/v) with a 2 : 1 split of the column effluent,so 0.2ml/min was delivered to the ESI ion source. The elutionsteps were as follows: 0–5min linear gradient from 10% to 30% ofB, 5–12min isocratic at 30% of B, 12–13min linear gradient from30–95% of B and 13–15min isocratic at 95% of B. After returningto the initial conditions, the equilibration was achieved after 4min.
The ESI source of the micrOToF-Q mass spectrometer operatedat a voltage of +4.5 kV in the positive ion mode and �4.5 kV inthe negative ion mode, with an ion transfer energy of 7 eV,during MS and MS/MS experiments run in both polarization.Nebulization with nitrogen was performed at 1.2 bar and drygas flow of 8.0 l/min at a temperature of 220 �C. The instrumentwas operated using the micrOTOF control program ver. 2.3, anddata were analyzed using the Bruker Data Analysis ver. 4 package.The system was calibrated externally using a calibration mixturecontaining sodium formate clusters. Additional internal calibrationwas performed for every run by injection of the calibration mixtureby using the diverter valve during the LC separation. All calcula-tions of m/z values were performed with the enhanced quadraticalgorithm with the accuracy of at least 5 ppm.
Flavonoid conjugates were detected by comparison of the exactmolecular masses and fragmentation pathways of the precursor[M+H]+ or [M�H]� ions recorded during CID MS/MS experimentswith those obtained for standards and data from the literature.The targeted MS/MS experiments were performed using a collisionenergy ramp of 15 to 30 eV (positive ion mode) and 25 to 30 eV(negative ion), unless otherwise stated. For the pseudo-MS3 experi-ments, ionization energy [in-source CID (ISCID)] was increasedfrom 0 to 80 or 85eV in the positive and negative ion modes,respectively. During the experiments, the collision energy wasbetween 20 and 25 eV, in order to achieve high fragmentation ofprotonated and deprotonated molecules ([M+H]+ and [M�H]�).The instrument was operated at a resolution higher than 15 000FWHM. The spectra were recorded in the targeted mode withinthe m/z range of 50–1100, and metabolite profiles were registeredin the positive and negative ion modes. For identification of thecompounds, the instrument operated in the MS, CID MS/MS andpseudo-MS3 modes and single-ion chromatograms for exactmasses of [M+H]+ or [M�H]� ions (�0.005Da) were recorded; thisaccuracy corresponds – in the mass range between 400 and1000 amu – between 12 and 5ppm.
hn Wiley & Sons, Ltd. J. Mass Spectrom. 2013, 48, 329–339
Secondary metabolite profiles in wheat leaves
A chip-based nano-ESI source (TriVersa NanoMate system)coupled to the q-ToF analyzer was used in the LC/MS fractioncollection mode for a more effective separation of the isomericflavonoid compounds. The NanoMate source was operated inthe positive ionization mode with an HD_A_384 chip with a sprayvoltage of 1.7 kV. A spray sensing was used in order to preventblockage of the nozzle. In the cases when the spray currentdropped for more than 30 s below 2nA or was above 7000 nA,the robot was moved to the next nozzle (maximum two timesfor injection). The eluent flow was split in front of the NanoMate,at 86.7ml/min to the fraction collector and 0.099 ml/min to thenano-ESI source. The LC fractions were collected every 10 s into384 well plates (twin.tec Eppendorf) and cooled at 4 �C. Afterfractionation of the UPLC eluate, the plate with the collectedfractions was sealed to prevent evaporation. Off-line injectionof the fractions was performed with the aforementionedparameters of q-ToF.
Results and discussion
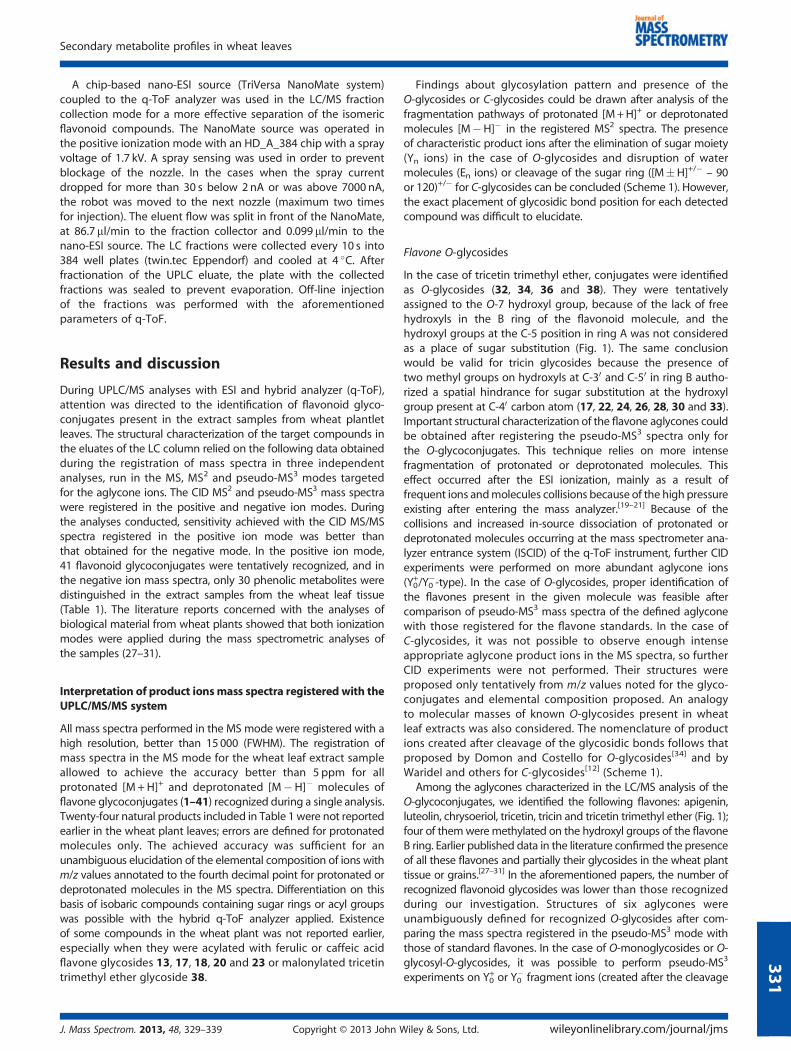
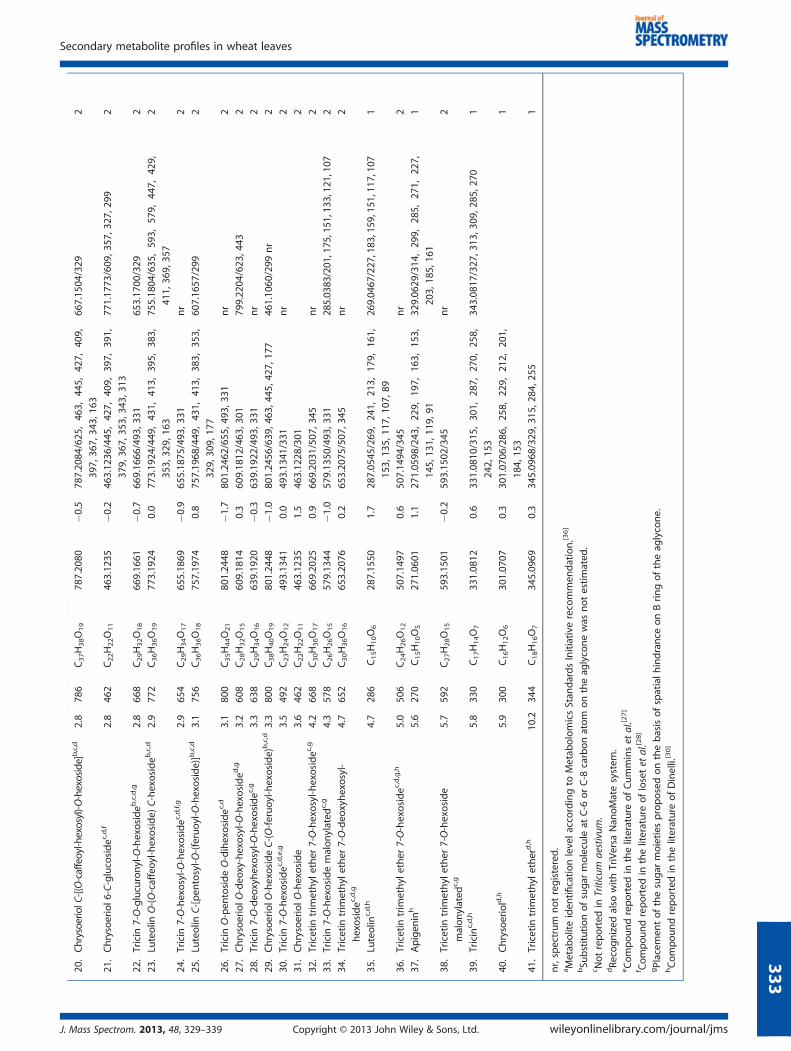
During UPLC/MS analyses with ESI and hybrid analyzer (q-ToF),attention was directed to the identification of flavonoid glyco-conjugates present in the extract samples from wheat plantletleaves. The structural characterization of the target compounds inthe eluates of the LC column relied on the following data obtainedduring the registration of mass spectra in three independentanalyses, run in the MS, MS2 and pseudo-MS3 modes targetedfor the aglycone ions. The CID MS2 and pseudo-MS3 mass spectrawere registered in the positive and negative ion modes. Duringthe analyses conducted, sensitivity achieved with the CID MS/MSspectra registered in the positive ion mode was better thanthat obtained for the negative mode. In the positive ion mode,41 flavonoid glycoconjugates were tentatively recognized, and inthe negative ion mass spectra, only 30 phenolic metabolites weredistinguished in the extract samples from the wheat leaf tissue(Table 1). The literature reports concerned with the analyses ofbiological material from wheat plants showed that both ionizationmodes were applied during the mass spectrometric analyses ofthe samples (27–31).
331
Interpretation of product ionsmass spectra registered with theUPLC/MS/MS system
All mass spectra performed in the MS mode were registered with ahigh resolution, better than 15000 (FWHM). The registration ofmass spectra in the MS mode for the wheat leaf extract sampleallowed to achieve the accuracy better than 5 ppm for allprotonated [M+H]+ and deprotonated [M�H]� molecules offlavone glycoconjugates (1–41) recognized during a single analysis.Twenty-four natural products included in Table 1 were not reportedearlier in the wheat plant leaves; errors are defined for protonatedmolecules only. The achieved accuracy was sufficient for anunambiguous elucidation of the elemental composition of ions withm/z values annotated to the fourth decimal point for protonated ordeprotonated molecules in the MS spectra. Differentiation on thisbasis of isobaric compounds containing sugar rings or acyl groupswas possible with the hybrid q-ToF analyzer applied. Existenceof some compounds in the wheat plant was not reported earlier,especially when they were acylated with ferulic or caffeic acidflavone glycosides 13, 17, 18, 20 and 23 or malonylated tricetintrimethyl ether glycoside 38.
J. Mass Spectrom. 2013, 48, 329–339 Copyright © 2013 John W
Findings about glycosylation pattern and presence of theO-glycosides or C-glycosides could be drawn after analysis of thefragmentation pathways of protonated [M+H]+ or deprotonatedmolecules [M�H]� in the registered MS2 spectra. The presenceof characteristic product ions after the elimination of sugar moiety(Yn ions) in the case of O-glycosides and disruption of watermolecules (En ions) or cleavage of the sugar ring ([M�H]+/� – 90or 120)+/� for C-glycosides can be concluded (Scheme 1). However,the exact placement of glycosidic bond position for each detectedcompound was difficult to elucidate.
Flavone O-glycosides
In the case of tricetin trimethyl ether, conjugates were identifiedas O-glycosides (32, 34, 36 and 38). They were tentativelyassigned to the O-7 hydroxyl group, because of the lack of freehydroxyls in the B ring of the flavonoid molecule, and thehydroxyl groups at the C-5 position in ring A was not consideredas a place of sugar substitution (Fig. 1). The same conclusionwould be valid for tricin glycosides because the presence oftwo methyl groups on hydroxyls at C-30 and C-50 in ring B autho-rized a spatial hindrance for sugar substitution at the hydroxylgroup present at C-40 carbon atom (17, 22, 24, 26, 28, 30 and 33).Important structural characterization of the flavone aglycones couldbe obtained after registering the pseudo-MS3 spectra only forthe O-glycoconjugates. This technique relies on more intensefragmentation of protonated or deprotonated molecules. Thiseffect occurred after the ESI ionization, mainly as a result offrequent ions andmolecules collisions because of the high pressureexisting after entering the mass analyzer.[19–21] Because of thecollisions and increased in-source dissociation of protonated ordeprotonated molecules occurring at the mass spectrometer ana-lyzer entrance system (ISCID) of the q-ToF instrument, further CIDexperiments were performed on more abundant aglycone ions(Y0
+/Y0�-type). In the case of O-glycosides, proper identification of
the flavones present in the given molecule was feasible aftercomparison of pseudo-MS3 mass spectra of the defined aglyconewith those registered for the flavone standards. In the case ofC-glycosides, it was not possible to observe enough intenseappropriate aglycone product ions in the MS spectra, so furtherCID experiments were not performed. Their structures wereproposed only tentatively from m/z values noted for the glyco-conjugates and elemental composition proposed. An analogyto molecular masses of known O-glycosides present in wheatleaf extracts was also considered. The nomenclature of productions created after cleavage of the glycosidic bonds follows thatproposed by Domon and Costello for O-glycosides[34] and byWaridel and others for C-glycosides[12] (Scheme 1).
Among the aglycones characterized in the LC/MS analysis of theO-glycoconjugates, we identified the following flavones: apigenin,luteolin, chrysoeriol, tricetin, tricin and tricetin trimethyl ether (Fig. 1);four of themweremethylated on the hydroxyl groups of the flavoneB ring. Earlier published data in the literature confirmed the presenceof all these flavones and partially their glycosides in the wheat planttissue or grains.[27–31] In the aforementioned papers, the number ofrecognized flavonoid glycosides was lower than those recognizedduring our investigation. Structures of six aglycones wereunambiguously defined for recognized O-glycosides after com-paring the mass spectra registered in the pseudo-MS3 mode withthose of standard flavones. In the case of O-monoglycosides or O-glycosyl-O-glycosides, it was possible to perform pseudo-MS3
experiments on Y0+ or Y0
� fragment ions (created after the cleavage
iley & Sons, Ltd. wileyonlinelibrary.com/journal/jms
Table
1.Flavones
andtheirglycoconjugates
iden
tified
inwheat(Triticum
aestivum
L.)leaf
extract.
No
Compound
R t(m
in)MW
Elem
ental
composition
[M+H]+
m/z
calculated
Error
(ppm)
[M+H]+ob
served
/product
ions(m
/z)
[M�H]�
observed
/product
ions(m
/z)
Metab
olite
iden
tification
levela
1.Lu
teolin
O,C,-trihexoside(I)
b,c
0.9
772
C33H40O21
773.21
35�0
.1773.2136/611,593,575,545,491,449
771.19
71/609
,519
,489
3
2.Lu
teolin
O,C,C-trihexoside(II)b,c,d
1.2
772
C33H40O21
773.21
35�0
.5773.2139/611,593,491,431,381,209
771.19
74/609
,383
3
3.Lu
teolin
6-C-hexosyl-O-hexosided
,e1.2
610
C27H30O16
611.16
070.0
611.1607/593,575,545,515,491,461,
431,413,395,383,353,329,299
609.14
92/447
,429
,357
,327
3
4.Luteolin
C-he
xosyl-O
-hexosideO-deoxyhexosideb
,c,d
1.3
756
C33H40O20
757.21
860.4
757.21
83/611
,59
3,49
1,44
9,43
1,
413,
383,
353,
329
nr
3
5.Lu
teolin
6-C-hexosideO-hexosideb
,d,e
1.5
610
C27H30O16
611.16
071.1
611.16
00/449
,43
1,41
3,39
5,38
3,
353,
329,
299,
287
609.14
71/447
,42
9,41
1,39
3,38
7,
369,
357,
327,
297
2
6.Tricetin
6-C-hexosided
,e1.5
464
C21H20O12
465.10
28�0
.446
5.10
30/447
,42
9,41
1,39
9,39
3,
381,
369,
345,
315
463.08
71/385
,37
3,35
5,34
3,30
1,
193,
165,
149
2
7.Lu
teolin
C-hexoside,C-pen
tosideb
,d,f
1.7
580
C26H28O15
581.15
01�0
.558
1.15
04/563
,54
5,52
7,51
5,50
9,
497,
485,
473,
463,
461,
455,
449,
443,
437,
425,
413,
407,
395,
365,
353,
341,
323,
311
579.13
34/561
,54
3,51
9,50
1,48
9,
471,
459,
441,
429,
411,
399,
369,
339,
327
3
8.Lu
teolin
O-hexosideC-hexosideb
,d1.8
610
C27H30O16
611.16
070.5
611.16
04/449
,43
1,39
5,38
3,37
7,
365,
353,
329,
299
609.1492/591,531,
489,
429,
411,
393,
369,
357,
351,
327593.1508/
473,431
3
9.Lu
teolin
C-hexosideO-deo
xyhexosideb
,d1.9
594
C27H30O15
595.16
571.0
595.16
51/449
,43
1,41
3,39
5,38
3,
353,
329,
299
563,
1408
/545
,50
3,48
5,47
3,45
5,
443,
425,
413,
383,
353
2
10.Apigen
inC-hexosideC-pen
tosideb
,d,e
2.0
564
C26H28O14
565.15
520.7
565.15
48/547
,529
,511
623.16
19/503
,461
,371
,341
2
11.ChrysoeriolC
-hexosideO-hexosideb
,d2.0
624
C28H32O16
625.17
631.9
625.1751/607,589,559,529,505,463,
445,427,409,397,367,343,313
447.09
33/429
,39
9,36
9,35
7,33
9,
327,
311,
297
2
12.Lu
teolin
6-C-glucosided
,e,f
2.1
448
C21H20O11
449.10
78�0
.444
9.10
80/431
,41
3,39
5,37
7,36
5,
353,
329,
299
771.17
57/651
,609
,429
,401
2
13.Lu
teolin
C-[(O-caffeoyl-hexosyl)-O-hexoside]
b,c,d
2.2
772
C36H36O19
773.19
24�0
.177
3.19
25/611
,44
9,43
1,41
3,39
5,
383,
365,
353,
329,
163
593.15
04/575
,50
3,48
5,47
3,44
3,
413,
383,
357
2
14.luteolin
C-deo
xyhexosyl-O
-hexosideb
,c,d
2.2
594
C27H30O15
595.16
572.9
595.16
40/577
,55
9,54
1,51
1,49
9,
487,
475,
457,
433,
415,
397,
367,
355,
337,
313
623.16
21/443
,383
,341
,323
nr
2
15ChrysoeriolO
-hexosideC-hexosideb
,d,f
2.5
624
C28H32O16
625.17
630.5
625.17
60/463
,44
5,42
7,40
9,39
7,
367,
343,
313
813.20
90/483
,329
2
16.Apigen
in6-C-glucosided
,f2.5
432
C21H20O10
433.11
290.7
433.11
26/415
,39
7,37
9,34
9,33
7,
313,
283
741.16
69/579
,429
2
17.Tricin7-O-[(O-feruo
yl-deoxyhexosyl)-O-hexoside]
c,d,g
2.6
814
C39H42O19
815.23
932.5
815.2373/669,493,331,177
743.1814/
581,449,431
607.16
57/487
,461
,443
,2
18.Lu
teolin
O-(O-caffeoyl-pen
toside)
C-hexosideb
,c,d
2.7
742
C35H34O18
743.18
180.5
395,
383,
353,
329,
295,
163
428,407,383,371,365,353,341,323
2
19.ChrysoeriolO
-deo
xyhexoside-C-hexosideb
,c,d
2.7
608
C28H32O15
609.18
140.0
609.18
14/463
,44
5,42
7,40
9,39
7,
391,
379,
367.35
3,34
3,31
3
785.19
32/665
,60
9,42
946
1.16
60/
383,
371,
353,
341,
311,
298
2
A. Wojakowska et al.
332
wileyonlinelibrary.com/journal/jms Copyright © 2013 John Wiley & Sons, Ltd. J. Mass Spectrom. 2013, 48, 329–339
[M+H]+ob
served
/product
ions(m
/z)
[M�H]�
observed
/
product
ions(m
/z)
Metab
olite
iden
tification
levela
20.Chrysoerio
lC-[(O-caffeoyl-h
exosyl)-O
-hexoside]b,c,d
2.8
786
C37H38O19
787.20
80�0
.578
7.20
84/625
,46
3,44
5,42
7,40
9,
397,
367,
343,
163
667.15
04/329
2
21.Chrysoeriol6
-C-glucosidec
,d,f
2.8
462
C22H22O11
463.12
35�0
.246
3.12
36/445
,42
7,40
9,39
7,39
1,
379,
367,
353,
343,
313
771.17
73/609
,357
,327
,299
2
22.Tricin
7-O-glucuronyl-O-hexosideb
,c,d,g
2.8
668
C29H32O18
669.16
61�0
.766
9.16
66/493
,331
653.17
00/329
2
23.Lu
teolin
O-(O-caffeoyl-hexoside)
C-hexosideb
,c,d
2.9
772
C36H36O19
773.19
240.0
773.19
24/449
,43
1,41
3,39
5,38
3,
353,
329,
163
755.18
04/635
,59
3,57
9,44
7,42
9,
411,36
9,35
7
2
24.Tricin
7-O-hexosyl-O
-hexosidec
,d,f,g
2.9
654
C29H34O17
655.18
69�0
.965
5.18
75/493
,331
nr
2
25.Lu
teolin
C-[pen
tosyl-O
-(feruoyl-O-hexoside)]b,c,d
3.1
756
C36H36O18
757.19
740.8
757.19
68/449
,43
1,41
3,38
3,35
3,
329,
309,
177
607.16
57/299
2
26.Tricin
O-pen
tosideO-dihexosidec
,d3.1
800
C35H44O21
801.24
48�1
.780
1.24
62/655
,493
,331
nr
2
27.ChrysoeriolO
-deo
xy-hexosyl-O
-hexosided
,g3.2
608
C28H32O15
609.18
140.3
609.18
12/463
,301
799.22
04/623
,443
2
28.Tricin
7-O-deo
xyhexosyl-O
-hexosidec
,g3.3
638
C29H34O16
639.19
20�0
.363
9.19
22/493
,331
nr
2
29.ChrysoeriolO
-hexosideC-(O-feruoyl-hexoside)
b,c,d
3.3
800
C38H40O19
801.24
48�1
.080
1.24
56/639
,463
,445
,427
,177
461.10
60/299
nr
2
30.Tricin
7-O-hexosidec
,d,e,g
3.5
492
C23H24O12
493.13
410.0
493.13
41/331
nr
2
31.ChrysoeriolO
-hexoside
3.6
462
C22H22O11
463.12
351.5
463.12
28/301
2
32.Tricetin
trim
ethylether
7-O-hexosyl-h
exosidec
,g4.2
668
C30H36O17
669.20
250.9
669.20
31/507
,345
nr
2
33.Tricin
7-O-hexosidemalonylated
c,g
4.3
578
C26H26O15
579.13
44�1
.057
9.13
50/493
,331
285.0383/201,175,151,133,121,107
2
34.Tricetin
trim
ethylether
7-O-deo
xyhexosyl-
hexosidec
,d,g
4.7
652
C30H36O16
653.20
760.2
653.20
75/507
,345
nr
2
35.Lu
teolin
c,d,h
4.7
286
C15H10O6
287.15
501.7
287.05
45/269
,24
1,21
3,17
9,16
1,
153,
135,
117,
107,
89
269.0467/227,183,159,151,117,107
1
36.Tricetin
trim
ethylether
7-O-hexosidec
,d,g,h
5.0
506
C24H26O12
507.14
970.6
507.14
94/345
nr
2
37.Apigen
inh
5.6
270
C15H10O5
271.06
011.1
271.05
98/243
,22
9,19
7,16
3,15
3,
145,
131,
119,
91
329.06
29/314
,29
9,28
5,27
1,22
7,
203,18
5,16
1
1
38.Tricetin
trim
ethylether
7-O-hexoside
malonylated
c,g
5.7
592
C27H28O15
593.15
01�0
.259
3.15
02/345
nr
2
39.Tricin
c,d,h
5.8
330
C17H14O7
331.08
120.6
331.08
10/315
,30
1,28
7,27
0,25
8,
242,
153
343.08
17/327
,313
,309
,285
,270
1
40.Chrysoeriold,h
5.9
300
C16H12O6
301.07
070.3
301.07
06/286
,25
8,22
9,21
2,20
1,
184,
153
1
41.Tricetin
trim
ethylether
d,h
10.2
344
C18H16O7
345.09
690.3
345.09
68/329
,315
,284
,255
1
nr,spectrum
notregistered.
aMetab
oliteiden
tificationlevela
ccordingto
Metab
olomicsStan
dardsInitiative
recommen
dation.[3
6]
bSu
bstitutionofsugar
molecule
atC-6
orC-8
carbon
atom
ontheag
lyconewas
notestimated
.c Not
reported
inTriticum
aestivum
.dRe
cognized
also
withTriVersa
Nan
oMatesystem
.eCompoundreported
intheliterature
ofCumminset
al.[2
7]
f Compoundreported
intheliterature
ofIosetet
al.[2
8]
gPlacem
entofthesugar
moietiesproposedonthebasisofspatialh
indrance
onBringoftheag
lycone.
hCompoundreported
intheliterature
ofDinelli.[30]
Secondary metabolite profiles in wheat leaves
J. Mass Spectrom. 2013, 48, 329–339 Copyright © 2013 John Wiley & Sons, Ltd. wileyonlinelibrary.com/journal/jms
333
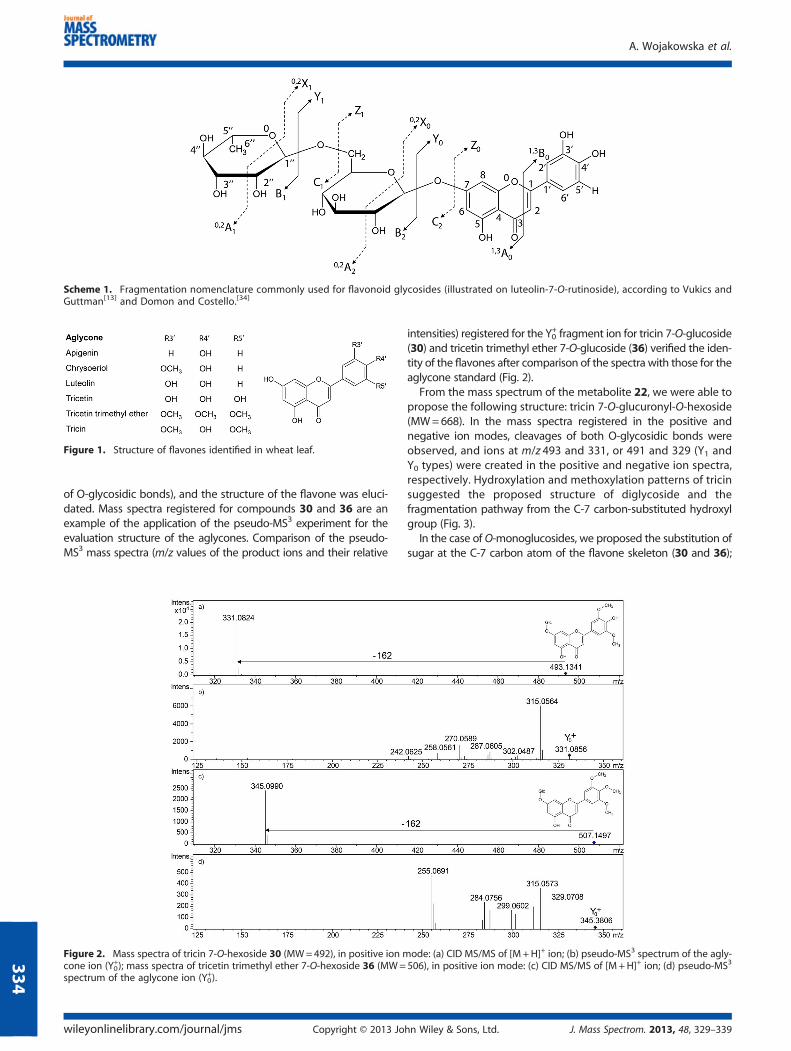
Scheme 1. Fragmentation nomenclature commonly used for flavonoid glycosides (illustrated on luteolin-7-O-rutinoside), according to Vukics andGuttman[13] and Domon and Costello.[34]
Figure 1. Structure of flavones identified in wheat leaf.
A. Wojakowska et al.
334
of O-glycosidic bonds), and the structure of the flavone was eluci-dated. Mass spectra registered for compounds 30 and 36 are anexample of the application of the pseudo-MS3 experiment for theevaluation structure of the aglycones. Comparison of the pseudo-MS3 mass spectra (m/z values of the product ions and their relative
Figure 2. Mass spectra of tricin 7-O-hexoside 30 (MW=492), in positive ion mcone ion (Y0
+); mass spectra of tricetin trimethyl ether 7-O-hexoside 36 (MW=spectrum of the aglycone ion (Y0
+).
wileyonlinelibrary.com/journal/jms Copyright © 2013 Jo
intensities) registered for the Y0+ fragment ion for tricin 7-O-glucoside
(30) and tricetin trimethyl ether 7-O-glucoside (36) verified the iden-tity of the flavones after comparison of the spectra with those for theaglycone standard (Fig. 2).
From the mass spectrum of the metabolite 22, we were able topropose the following structure: tricin 7-O-glucuronyl-O-hexoside(MW=668). In the mass spectra registered in the positive andnegative ion modes, cleavages of both O-glycosidic bonds wereobserved, and ions at m/z 493 and 331, or 491 and 329 (Y1 andY0 types) were created in the positive and negative ion spectra,respectively. Hydroxylation and methoxylation patterns of tricinsuggested the proposed structure of diglycoside and thefragmentation pathway from the C-7 carbon-substituted hydroxylgroup (Fig. 3).
In the case of O-monoglucosides, we proposed the substitution ofsugar at the C-7 carbon atom of the flavone skeleton (30 and 36);
ode: (a) CID MS/MS of [M+H]+ ion; (b) pseudo-MS3 spectrum of the agly-506), in positive ion mode: (c) CID MS/MS of [M+H]+ ion; (d) pseudo-MS3
hn Wiley & Sons, Ltd. J. Mass Spectrom. 2013, 48, 329–339
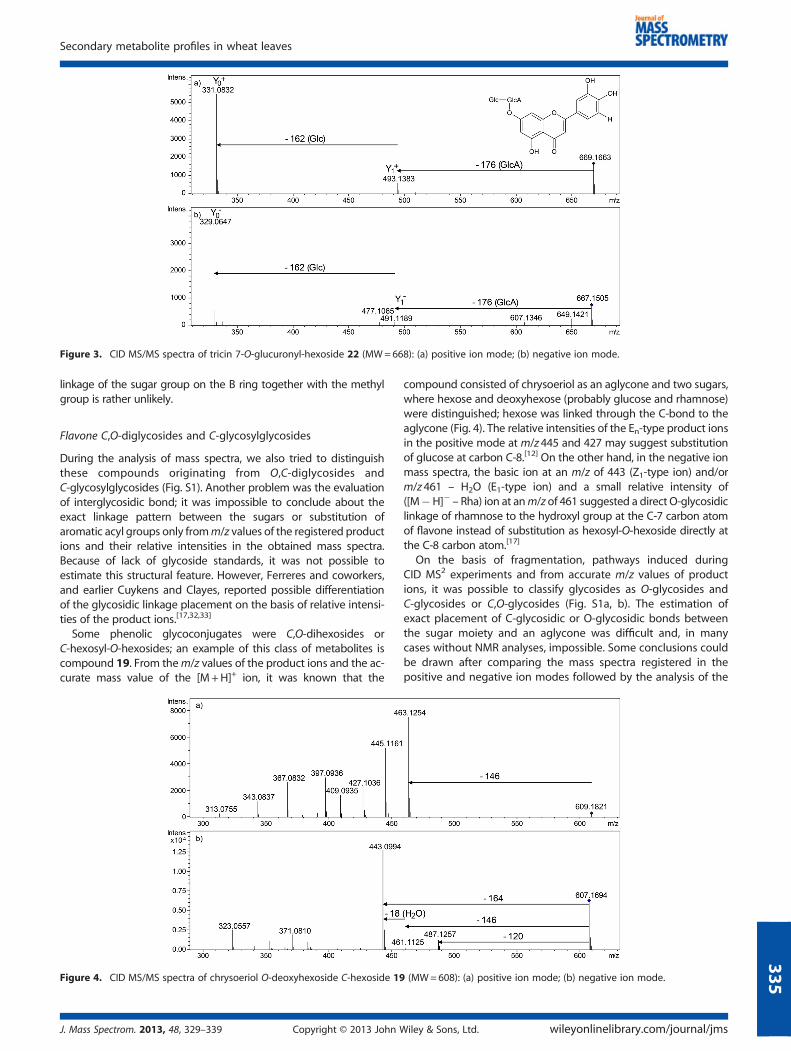
Figure 3. CID MS/MS spectra of tricin 7-O-glucuronyl-hexoside 22 (MW=668): (a) positive ion mode; (b) negative ion mode.
Secondary metabolite profiles in wheat leaves
linkage of the sugar group on the B ring together with the methylgroup is rather unlikely.
Flavone C,O-diglycosides and C-glycosylglycosides
During the analysis of mass spectra, we also tried to distinguishthese compounds originating from O,C-diglycosides andC-glycosylglycosides (Fig. S1). Another problem was the evaluationof interglycosidic bond; it was impossible to conclude about theexact linkage pattern between the sugars or substitution ofaromatic acyl groups only fromm/z values of the registered productions and their relative intensities in the obtained mass spectra.Because of lack of glycoside standards, it was not possible toestimate this structural feature. However, Ferreres and coworkers,and earlier Cuykens and Clayes, reported possible differentiationof the glycosidic linkage placement on the basis of relative intensi-ties of the product ions.[17,32,33]
Some phenolic glycoconjugates were C,O-dihexosides orC-hexosyl-O-hexosides; an example of this class of metabolites iscompound 19. From them/z values of the product ions and the ac-curate mass value of the [M+H]+ ion, it was known that the
Figure 4. CID MS/MS spectra of chrysoeriol O-deoxyhexoside C-hexoside 19
J. Mass Spectrom. 2013, 48, 329–339 Copyright © 2013 John W
compound consisted of chrysoeriol as an aglycone and two sugars,where hexose and deoxyhexose (probably glucose and rhamnose)were distinguished; hexose was linked through the C-bond to theaglycone (Fig. 4). The relative intensities of the En-type product ionsin the positive mode at m/z 445 and 427 may suggest substitutionof glucose at carbon C-8.[12] On the other hand, in the negative ionmass spectra, the basic ion at an m/z of 443 (Z1-type ion) and/orm/z 461 – H2O (E1-type ion) and a small relative intensity of([M�H]� – Rha) ion at anm/z of 461 suggested a direct O-glycosidiclinkage of rhamnose to the hydroxyl group at the C-7 carbon atomof flavone instead of substitution as hexosyl-O-hexoside directly atthe C-8 carbon atom.[17]
On the basis of fragmentation, pathways induced duringCID MS2 experiments and from accurate m/z values of productions, it was possible to classify glycosides as O-glycosides andC-glycosides or C,O-glycosides (Fig. S1a, b). The estimation ofexact placement of C-glycosidic or O-glycosidic bonds betweenthe sugar moiety and an aglycone was difficult and, in manycases without NMR analyses, impossible. Some conclusions couldbe drawn after comparing the mass spectra registered in thepositive and negative ion modes followed by the analysis of the
(MW=608): (a) positive ion mode; (b) negative ion mode.
iley & Sons, Ltd. wileyonlinelibrary.com/journal/jms
335
A. Wojakowska et al.
336
literature data.[10,12,14,22,27–33] The information concerned withthe structural features of the target compounds drawn frompositive and negative mode mass spectra were complementary.On the other hand, in the case of C-glycosides of flavonoids,better fragmentation was observed because of the presence ofproduct ions of En-type and ions created after cleavage of thesugar ring (Scheme 1). The sugar part of the glycoconjugatesconstituted hexose, deoxyhexose or pentose.In the single-ion chromatogram of the accurate mass of
611.1607Da corresponding to the luteolin dihexosides (elementalcomposition – C27H31O16), recorded in the positive and negativeion modes, three peaks were observed, corresponding tocompounds 3, 5 and 8 (Fig. S1a, b). In three CID MS/MS spectraregistered in the positive ionmode (Fig. S1a2–a3), there was unclearevidence about the substitution pattern of both hexoses in theluteolin molecule. From all three mass spectra registered in thepositive ion mode, it was obvious that a minimum one sugar ringwas linked through the C-glycosidic bond, because of the presenceY1+ ion (m/z 449) and (m/z 449 – En) product ions atm/z 431, 413 and
395 produced from [M+H]+. However, information obtained fromthe negative ion mass spectra was that, in the first step, O-linkedsugars were eliminated and Y1
� and Z1� ions of different relative
intensities were observed (Fig. S1b). Only for isomer 3 (Rt = 1.2min),the CID MS/MS spectrum showed the presence of a series ofproduct ions obtained after the elimination of the water molecule(En-type ions) from the [M+H]+ ion (Fig. S1a2). In this situation, aseries of ions atm/z593, 575 and 557were created after consecutivewater molecule elimination from [M+H]+, and next the dehydratedhexose from these En
+ ions was possible to cleave (ions at m/z431,413 and 395). Moreover, the product ion of low intensity atm/z449 ([M+H]+ – 162) was also observed. This one was probablycreated after the cleavage of the O-glycosidic bond between twohexoses. On the other hand, in the negative product ion, the massspectra recorded an ion at m/z447 with a high abundance only forone isomeric compound 3 (Fig. S1b2). This ion was created afterthe rupture of O-glycosidic bond between hexoses. In the spectra,the isomers 3, 5 and 8, and Z1-type ions were also observed atm/z429 ([M�H]� – 180). Their relative intensities were differentonly in the spectrum of compound 8; it was themain ion in themassspectrum (Fig. S1b4). Placement of the C-glycosidic bond on thebasis of data available was not authorized. Compounds 5 and 8wereprobably glycosylated C-6 or C-8, respectively. The second sugar unitwas attached to the hydroxyl group, most probably at the C-7, notC-40, carbon atom. On the basis of the information obtained fromthemass spectra, it was not possible to characterize structurally bothcompounds studied.In wheat, the presence of glucose and galactose or glucuronic
acid, rhamnose or arabinose was reported.[27–31] Moreover, theseluteolin triglycosides were isomeric compounds with differentpatterns of sugar molecules substitution. From the product ionsobserved in the mass spectra, we suggested that, in compound1, one sugar is bonded to the hydroxyl group at the C-7 carbonatom, and two others are substituted as hexosyl-O-hexoside tothe carbon atom at the C-6 or C-8 position. In the secondcompound 2, all sugars are substituted to different carbons inthe molecule C-6, C-8 carbons and C-7 via oxygen atom.
Acylated flavone glycosides
In the negative spectra of malonylated glycosides, the intenseelimination of carbon dioxide from protonated molecules[M�H–CO2]
� was observed. This effect might create problems
wileyonlinelibrary.com/journal/jms Copyright © 2013 Jo
with the proper interpretation of the product ion mass spectrabecause of lack of intense signals from deprotonated mole-cules, so careful control of collision energy during experimentsis necessary.
In some cases, isobaric compounds containing an aromaticacid as an acyl group substituted in the sugar ring were recog-nized. In the registered profiles, monoglycosides, diglycosidesand triglycosides of flavones were detected. For example, luteolindiglycoside (13) was acylated with the aromatic acid molecule;this was an isobaric natural product, which corresponds to themolecular masses of triglycosides (1, 2). It was possible to differ-entiate the presence of the aromatic group, instead of the sugarmoiety, on the basis of elemental composition of protonated ordeprotonated molecules – 13, 17, 18, 20, 23, 25 and 29(Figs S2–S5). The rule observed in the positive ion mode CIDmass spectra of the analyzed compound acylated with phenyl-propenoid acid was registration in the MS2 mass spectrum ofthe product ion with m/z value corresponding to the mass ofthe acid residue; there were ions at m/z 163 and 177. These ionsoriginated from caffeic and ferulic acid residues, respectively. Inthe mass spectra registered in the negative polarity, the productions created from aromatic acids were not observed.
In the figures presented in the supporting information, thereare mass spectra of four compounds containing an aromatic acylgroup (13, 20, 25 and 29). Differentiation between the acyland sugar moieties was, in every case, possible on the basis ofaccurate masses of the registered protonated or deprotonatedmolecules (Figs S2–S5). The mass spectra of acylated compoundsin the supporting information were registered for metaboliteswith one sugar linked to the aglycone moiety with theC-glycosidic bond and the second with the O-glycosidic bondvia the C-substituted sugar moiety 13, 20 and 25. There wasone exception: For compound 29 in C-monoglycoside, the secondsugar molecule was substituted directly to the hydroxyl group onthe flavone skeleton at the C-7 carbon atom (Fig. S5). The relativeintensities of product ions registered in CID mass spectra of allcompounds in the positive mode were quite similar. On the otherhand, in the negative mode, they varied substantially, and themain reason was different glycosylation patterns and varioussubstitutions of acyl group. The common feature of CID massspectra registered in the positive ion mode was that product ionscharacteristic for cleavage bonds in C-bonded sugar (En-type ions)appeared in the second step of fragmentation after the elimina-tion of O-linked sugar moiety. In the case of the C-substitutedsugars, the relative intensities of the product ions created afterthe cleavage of one sugar moiety and acyl group did not suggestsubstitution of hexose at the C-6 or C-8 position. Placement ofthe second sugar on the aglycone moiety at the C-7 carbon orO-bonded to the sugar linked to the aglycone moiety with theC-glucosidic bond is not clear. The Z1-type product ion (at m/z443or 429 for negative ions and m/z 445 or 431 for positive ions)presented different relative intensities; it may suggest presence ofthe O-glycosidic bond in the studied molecules.[15] Data obtainedfrom positive and negative CID mass spectra did not permit to drawconsistent conclusions about the complete substitution pattern forall acylated natural products (Figs S2–S5). For compound 13, it wasdifficult to propose the placement of the C-bonded sugar. Therelative intensity of the Z1 product ion (negative ionmode) providedevidence of the linkage between both hexoses (Fig. S2). Thiscompound had the following proposed structure: luteolinC-[(O-caffeoyl-hexosyl)-O-hexoside]. In the first step of fragmen-tation in the positive ion mode, cleavage of aromatic acyl was
hn Wiley & Sons, Ltd. J. Mass Spectrom. 2013, 48, 329–339
Secondary metabolite profiles in wheat leaves
observed on the basis of mass difference, and it was estimatedas the caffeoyl group. In this spectrum, ion at m/z 163 was alsoobserved, which corresponded to the elemental composition(C9H9O4), which suggested the protonated caffeoyl residue. Othertwo ions of high intensities at m/z 449 (Y1 ion) and m/z 431(Z1 ion) were also observed. However, these ions at m/z 431 andnext at m/z 413 or 395 would also be created after consecutiveelimination of water molecules (En-type ion) from the Y1
+ ion atm/z 449. On the other hand, in the negative ion mode, amongothers, strong ions were recognized atm/z 357 and 327 becauseof the rupture of hexose ring (glucose), which is substituted withthe C-glycosidic bond linked directly to the aglycone moiety. Inthe negative ion mode, the fragments created after the cleavageof the O-glycosidic bond were not observed at m/z 447,which corresponded to the ion created after the cleavage ofthe glycosidic bond between sugars (Fig. S2). The mass spectraof the natural product acylated with ferulic acid was luteolin-C,O-diglycoside (hexose and pentose, MW= 756) 25; differencesbetween the m/z values of product ions permitted to elucidatethe size of sugars and the acyl group; the relative intensities ofproduct ions did not give structural information. The positiveproduct ion MS2 spectrum demonstrated that the feruloyl groupis probably substituted at the hexose ring linked through the Cbond to the aglycone moiety (Fig. S3). However, in the negativeion mass spectra, the proposed structure was not confirmed.In the negative ion spectrum, the Z1-type ion was observed atm/z 429. It was created after an earlier elimination of the feruoylgroup and rupture of the neutral pentose. According to theinformation from the literature, we suggest substitution ofpentose with the O-glycosidic bond to hexose and later throughthe C-carbon atom of the aglycone skeleton.[15] Two other meta-bolites acylated with caffeic and ferulic acid had various patternsof glycosylation; these were chrysoeriol C-[(O-caffeoyl-hexosyl)-O-hexoside] (20) and chrysoeriol O-hexoside C-(O-feruoyl-hexoside) (29). The mass spectra registered in the positiveion mode for 20 and 29 differed in the presence of the ion atm/z 639 created after the elimination in the first step of thehexose residue (Figs S4 and S5). A different order of the frag-mentation pathway was also allowed; see the ions at m/z 625and 445 created after the elimination of the feruoyl group andlater, hexose. In the negative mode, the elimination of the ferulic
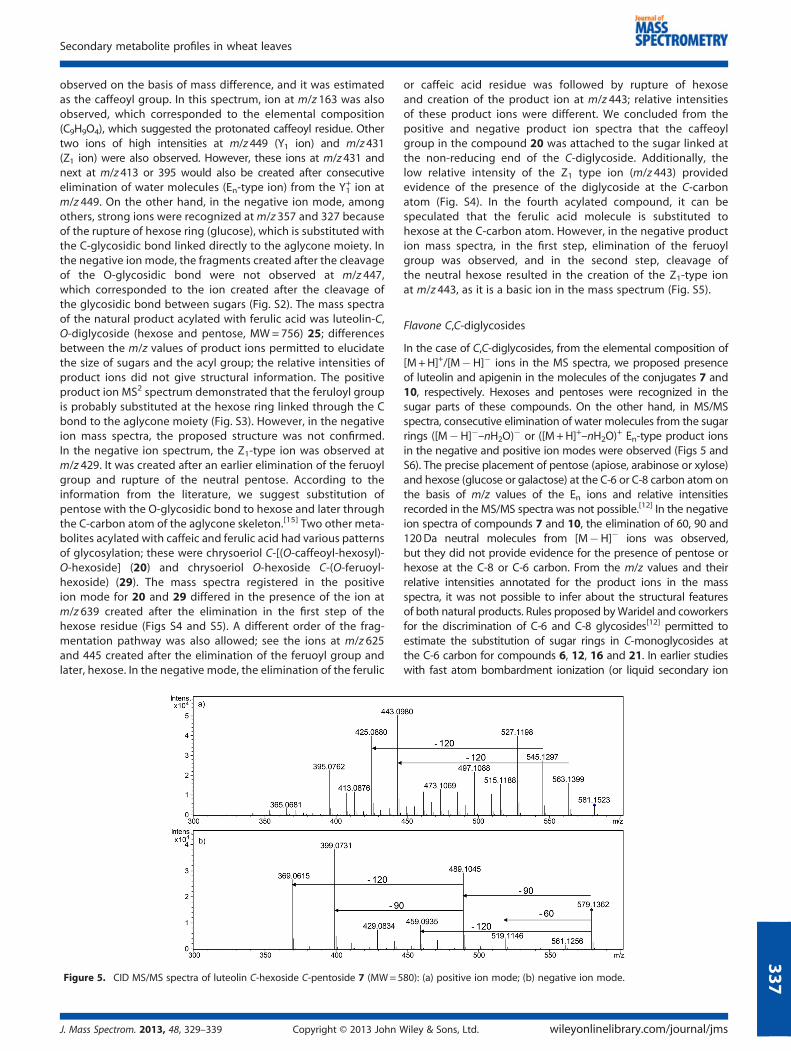
igure 5. CID MS/MS spectra of luteolin C-hexoside C-pentoside 7 (MW=580): (a) positive ion mode; (b) negative ion mode.
337
FJ. Mass Spectrom. 2013, 48, 329–339 Copyright © 2013 John W
or caffeic acid residue was followed by rupture of hexoseand creation of the product ion at m/z 443; relative intensitiesof these product ions were different. We concluded from thepositive and negative product ion spectra that the caffeoylgroup in the compound 20 was attached to the sugar linked atthe non-reducing end of the C-diglycoside. Additionally, thelow relative intensity of the Z1 type ion (m/z 443) providedevidence of the presence of the diglycoside at the C-carbonatom (Fig. S4). In the fourth acylated compound, it can bespeculated that the ferulic acid molecule is substituted tohexose at the C-carbon atom. However, in the negative production mass spectra, in the first step, elimination of the feruoylgroup was observed, and in the second step, cleavage ofthe neutral hexose resulted in the creation of the Z1-type ionat m/z 443, as it is a basic ion in the mass spectrum (Fig. S5).
Flavone C,C-diglycosides
In the case of C,C-diglycosides, from the elemental composition of[M+H]+/[M�H]� ions in the MS spectra, we proposed presenceof luteolin and apigenin in the molecules of the conjugates 7 and10, respectively. Hexoses and pentoses were recognized in thesugar parts of these compounds. On the other hand, in MS/MSspectra, consecutive elimination of water molecules from the sugarrings ([M�H]�–nH2O)
� or ([M+H]+–nH2O)+ En-type product ions
in the negative and positive ion modes were observed (Figs 5 andS6). The precise placement of pentose (apiose, arabinose or xylose)and hexose (glucose or galactose) at the C-6 or C-8 carbon atom onthe basis of m/z values of the En ions and relative intensitiesrecorded in the MS/MS spectra was not possible.[12] In the negativeion spectra of compounds 7 and 10, the elimination of 60, 90 and120Da neutral molecules from [M�H]� ions was observed,but they did not provide evidence for the presence of pentose orhexose at the C-8 or C-6 carbon. From the m/z values and theirrelative intensities annotated for the product ions in the massspectra, it was not possible to infer about the structural featuresof both natural products. Rules proposed byWaridel and coworkersfor the discrimination of C-6 and C-8 glycosides[12] permitted toestimate the substitution of sugar rings in C-monoglycosides atthe C-6 carbon for compounds 6, 12, 16 and 21. In earlier studieswith fast atom bombardment ionization (or liquid secondary ion
iley & Sons, Ltd. wileyonlinelibrary.com/journal/jms
A. Wojakowska et al.
338
MS), where mass spectrometers with electromagnetic sectoranalyzers and high-energy collisions were used, more completestructural information would be obtained.[35] Relative intensities offragments obtained after cleavage of sugar moieties [M+H – 90]+
and [M+H – 120]+, which were observed in the mass spectraregistered with q-ToF analyzers, did not bring information aboutsugar substitution.
Interpretation of product ion mass spectra registered with chip-based nanoelectrospray system (TriVersa NanoMate system)
TriVersa NanoMate system from Advion was used in two differentways. In the first case, it was used as the nanoelectrospray sourcewith split flow from normal UPLC column applied for separationcomponents of the analyzed sample and registration of the CIDmass spectra; the split flow delivered to the nano-ESI sourcewas 0.099 ml/min. No differences in the relative intensities ofproduct ions registered in the MS2 mass spectra recorded aftersplitting LC eluate to nano-ESI source were registered. Amongothers, it was observed for tricin 7-O-hexosyl-O-hexoside 24(Fig. S7a, b) and luteolin O-(O-caffeoyl-hexoside) C-hexoside 23(Fig. S8a, b). During the analysis, the same collision energy wasapplied. In the second approach, during the UPLC/MS run,additional fractionation of the LC column eluate was performed.Fractions of 10ml volume each were collected. In the next step,nano-ESI CID MS/MS experiments with controlled variable collisionenergies (from 15 to 35 eV) in the positive ion mode on the consec-utive fractions were performed, with a flow of 0.099ml/min;fragmentation was reproducible. The recorded mass spectra wereaveraged from 60 to about 100 scans. The spray achieved in thepositive ion mode for the solutions obtained after fractionation inTriVersa NanoMate was stable without the addition of isopropanol.The content of acetonitrile in the liquid phase was at least 10% afterfractionation procedure of the LC column eluate into the wells.After UPLC separation of the studied sample, the relative intensi-
ties registered for the product ions were different from those for themass spectra obtained with normal and nano-ESI source (Figs S7cand S8c). The information about C-glycosylation or O-glycosylationwas achieved, also presence of the acyl group was possible toelucidate from m/z values of the product ions recorded. However,signal-to-noise ratio due to the presence of matrix substances waslower in the case of the nano-ESI source than in the mass spectraregistered during direct analysis of LC column eluate with normalESI source. In the mass spectrometer equipped with a q-ToFanalyzer, only MS2 spectra for protonated ions could be recorded,whereas in depth spectral trees, which can be obtained with iontrap–orbitrap instruments, these could not be generated.[36] Duringour studies, the mass spectra registered with Triversa NanoMatewere only recorded in the positive ion mode.
Conclusions
Monocotyledonous plants possess very complicated profiles offlavonoid glycoconjugates, whereO-glycosylated and C-glycosylatedflavonoids are present. During LC/MS analyses of extracts fromwheat plant leaves, it was possible to propose the elementalcomposition for molecules of the recognized compounds afterthe application of mass analyzer with a resolution better than15 000 FWHM. It enabled the inferences concerning the presencein the molecules of aromatic acyl groups instead of sugar rings.However, increased resolution of at least 40 000 would permit to
wileyonlinelibrary.com/journal/jms Copyright © 2013 Jo
obtain better product ions annotation accuracy for productions registered during MS2 experiments. When analyses wereperformed in positive and negative ion modes, the distinction ofC-glycosides and O-glycosides was possible. From the mass differ-ences between the Yn-type ions, the size of sugar rings wasestimated, but the identification of type of hexose, pentose ordeoxyhexose was not allowed. Unambiguous conclusions aboutthe sugar substitution pattern at the defined carbon atom of theflavonoid molecule were difficult from the data collected in themass spectra registered. Co-elution of many target metabolitesand their differences in abundances preclude the effective applica-tion of the MS mode of analysis only for the identificationprocedure of the natural products studied. It was necessary to usethe CID MS/MS techniques for the differentiation of the naturalproducts present.
Acylated with aliphatic or aromatic acids, flavonoid glycoconju-gates is better to analyze in the positive ion mode because ofpossible intensive fragmentation in the negative ions mass spectraof themalonyl group in deprotonatedmolecules of the compoundsor lack of product ions originating from the aromatic residuecreated after cleavage of the group from the [M�H]� ions.
During this project, 24 flavonoid C-glycoconjugates andO-glycoconjugates were recognized the first time in the wheatplant leaf (Table 1). Full structural characterization of these naturalproducts directed to sugar identification and placement of theirsubstitution was impossible on the basis of structural featuresrecorded in CID MS2 or MS3 spectra. This type of analysis requiresregistration of MS2 and MS3 spectra in positive and negative ionmodes. However, it should be underlined that in positive ionmode,we were able to recognize higher number of targeted naturalproducts. On the other hand, spectra registered in both polaritieswere submitting supplementary data about structural features ofthe compounds studied.
The elemental composition of the analyzed molecules permittedto make some conclusion about structures of studied molecules.For structural characterization of phenolic glycoconjugates, thetargeted mode of analyses was necessary, and control of energeticparameters during CID experiments was also very important.Ramping of the collision energy enables the registration in CIDmass spectra product ions of proper relative intensities. After fullNMR, structural characterization of the consecutive naturalproducts and registration of collision-induced mass spectra withcontrolled energetic parameters will make it possible to post themass spectra in one of existing databases of natural productsmass spectra. This proposed strategy would be compatible withthat described by the Chemical Analysis Working Group in theMetabolomics Standards Initiative.[37]
Acknowledgements
This work was partly supported by the National Science Centerin Poland (project no. UMO2011/01/N/NZ2/00025 and NCN2704/B/P01/2011/40) and a research grant from the Institute ofBioorganic Chemistry PAS (no. 501 0901). A. W. is grateful forthe scholarship funded within the project from Sub-measure8.2.2 Human Capital Operational Program, co-financed by theEuropean Union Fund.
Supporting information
Supporting information may be found in the version of thisarticle.
hn Wiley & Sons, Ltd. J. Mass Spectrom. 2013, 48, 329–339
Secondary metabolite profiles in wheat leaves
References[1] O.M. Andersen, K.R. Markham. Flavonoids Chemistry, Biochemistry and
Applications. CRC Press Taylor & Francis Group: Boca Raton, 2006.[2] L.G. Laundry, C.C. Chapple, R.L. Last. Arabidopsis mutants lacking
phenolic sun screens exhibit enhanced ultraviolet-B injury oxidativedamage. Plant Physiol. 1995, 109, 1159–1166.
[3] R.A. Dixon, N.L. Paiva. Stress-induced phenylpropanoid metabolism.Plant Cell 1995, 7, 1085–1097.
[4] D. Treutter. Significance of flavonoids in plant resistance: a review.Environ. Chem. Lett. 2006, 4, 147–157.
[5] N. Hounsome, B. Hounsom, D. Tomos, G. Edwards-Jones. Plantmetabolites and nutritional quality of vegetables. J. Food Sci. 2008,73, R48–R65.
[6] D.F. Birt, S. Hendric, W. Wang. Dietary agents in cancer prevention:flavonoids and isoflavonoids. Pharmacol. Ther. 2001, 90, 157–77.
[7] L. Korkina, V. Kostyuk, C. De Luca, S. Pastore. Plant phenylpropanoidsas emerging anti-inflammatory agents. Mini-Rev. Med. Chem. 2011,11, 823–835.
[8] Q. Zhao, R.A. Dixon. Transcriptional networks for lignin biosynthesis:more complex than we thought? Trends Plant Sci. 2011, 16, 227–233.
[9] J.K. Prasain, C.C. Wang, S. Barnes. Mass spectrometric methods forthe determination of flavonoids in biological samples. Free RadicalBiol. Med. 2004, 37, 1324–1350.
[10] M. Stobiecki, P. Kachlicki. In The Science of Flavonoids, E. Grotevold(Eds). Springer Science and Business Media, Inc.: New York, 2006,47–69.
[11] R. March, J. Brodbelt. Analysis of flavonoids: tandem mass spectrom-etry, computational methods, and NMR. J. Mass Spectrom. 2008, 43,1581–1617.
[12] P. Waridel, J.L. Wolfender, K. Ndjoko, K.R. Hobby, H.J. Major,K. Hostettmann. Evaluation of quadrupole time of flight tandemmass spectrometry and ion trap multiple-stage mass spectrometryfor differentiation of C-glycosidic flavonoid isomers. J. Chromatog. A2001, 926, 29–41.
[13] V. Vukics, A. Guttman. Structural characterization of flavonoidglycosides by multi-stage mass spectrometry. Mass Spectrom. Rev.2010, 29, 1–16.
[14] B. Abad-García, S. Garmón-Lobato, L.A. Berrueta, B. Galloand,F. Vicente. New features on the fragmentation and differentiationof C-glycosidic flavone isomers by positive electrospray ionizationand triple quadrupole mass spectrometry. Rapid Commun. MassSpectrom. 2008, 22, 1834–1842.
[15] B. Abad-García, S. Garmón-Lobato, L.A. Berrueta, B. Galloand,F. Vicente. Practical guidelines for characterization of O-diglycosylflavonoid isomers by triple quadrupole MS and their applicationsfor identification of some fruit juices flavonoids. J. Mass. Spectrom.2009, 44, 1017–1025.
[16] R.J. Hughes, T.R. Croley, C.D. Metcalfe, R.E. March. A tandem massspectrometric study of selected characteristic flavonoids. Int. J. MassSpectrom. 2001, 210, 371–385.
[17] F. Ferreres, R. Llorach, A. Gil-Izquierdo. Characterization of theinterglycosidic linkage in di-, tri-, tetra- and pentaglycosylatedflavonoids and differentiation of positional isomers by liquidchromatography/electrospray ionization tandem mass spectrometry.J. Mass Spectrom. 2004, 39, 312–321.
[18] R.E. March, X.S. Miao, C.D. Metcalfe, M. Stobiecki, Ł. Marczak. A frag-mentation study of an isoflavone glycoside, genistein-7-O-glucoside,using quadrupole time of flight mass spectrometry at high massresolution. Int. J. Mass Spectrom. 2004, 232, 171–183.
[19] P. Kachlicki, J. Einhorn, D. Muth, L. Kerhoas, M. Stobiecki. Evaluationof glycosylation and malonylation patterns in flavonoid glycosidesduring LC/MS/MS metabolite profiling. J. Mass Spectrom. 2008, 43,572–586.
J. Mass Spectrom. 2013, 48, 329–339 Copyright © 2013 John W
[20] G.C. Justin, C.M. Borges, M.N.H. Florencio. Electrospray ionizationtandem mass spectrometry fragmentation of protonated flavoneand flavonol aglycones: a re-examination. Rapid Commun. MassSpectrom. 2009, 23, 237–248.
[21] L. Abranko, J.F. Garcia-Reye, A. Molina-Diaz. In-source fragmentationand accurate mass analysis of multiclass flavonoid conjugates beelectrospray ionization time of flight mass spectrometry. J. MassSpectrom. 2011, 46, 478–488.
[22] J.J.J. van der Hooft, J. Vervoort, R.J. Bino, J. Beekwilder, R.C.H. de Vos.Polyphenol identification based on systematic and robust high-resolu-tion accurate mass spectrometry fragmentation. Anal. Chem. 2011, 83,409–416.
[23] M. Pikulski, J.S. Brodbelt. Differentiation of flavonoid glycosideisomers by using metal complexation and electrospray ionizationmass spectrometry. J. Am. Soc. Mass. Spectrom. 2003, 14, 1437–1453.
[24] M. Stobiecki, A. Skirycz, L. Kerhoas, P. Kachlicki, D. Muth, J. Einhorn,B. Mueller-Roeber. Profiling of phenolic glycosidic conjugates in leavesof Arabidopsis thaliana using LC/MS. Metabolomics 2006, 2, 197–219.
[25] Ł. Marczak, M. Stobiecki, M. Jasińsk, W. Oleszek, P. Kachlicki. Frag-mentation pathways of acylated flavonoid diglucuronides fromleaves of Medicago truncatula. Phytochem. Anal. 2010, 21, 224–233.
[26] A. Staszków, B. Swarcewicz, J. Banasiak, D. Muth, M. Jasiński,M. Stobiecki. LC/MS profiling of flavonoid glycoconjugatesisolated from hairy roots, suspension root cell cultures and seedlingroots of Medicago truncatula. Metabolomics 2011, 7, 604–613.
[27] I. Cummins, M. Brazier-Hicks, M. Stobiecki, R. Frański, R. Edwards.Selective disruption of wheat secondary metabolism by herbicidesafeners. Phytochemistry 2006, 67, 1722–1730.
[28] J.R. Ioset, B. Urbaniak, K. Ndjoko-Ioset, J. Wirth, F. Martin,W. Gruissem, K. Hostettmann, C. Sautter. Flavonoid profilingamong wild type and related GM wheat varieties. Plant Mol. Biol.2007, 65, 645–654.
[29] Q. Liu, Y. Qiu, T. Beta. Comparison of antioxidant activities of differentcolored wheat grains and analysis of phenolic compounds. J. Agr. FoodChem. 2010, 58, 9235–9241.
[30] G. Dinelli, A. Segura-Carretero, R. Di Silvestro, I. Marotti, D. Arraez-Roman,S. Benedettelli, L. Ghiselli, A. Fernadez-Gutierrez. Profiles of phenoliccompounds in modern and old common wheat varieties determinedby liquid chromatography coupled with time-of-flight mass spectrome-try. J. Chromatogr. A 2011, 1218, 7670–7681.
[31] A. Moheb, R.K. Ibrahim, R. Roy, F. Sarhan. Changes in wheat leafphenolome in response to cold acclimation. Phytochemistry 2011,72, 2294–2307.
[32] F. Cuyckens, M. Claeys. Mass spectrometry in structural analysis offlavonoids. J. Mass Spectrom. 2004, 39, 1–15.
[33] Y.L. Ma, F. Cuyckens, H. van den Heuvel, M. Claeys. Mass spectrometricmethods for the characterisation and differentiation of isomericO-diglycosyl flavonoids. Phytochem. Anal. 2001, 12, 159–165.
[34] B. Domon, C.E. Costello. A systematic nomenclature for carbohydratefragmentations in FAB MS/MS spectra of glycoconjugates. Glycoconj.J. 1988, 5, 397–409.
[35] M. Becchi, D. Fraisse. Fast atom bombardment and fast atombombardment collision-activated dissociation/mass-analysed ionkinetic energy analysis of C-glycosidic flavonoids. Biol. Mass.Spectrom. 1989, 18, 122–130.
[36] J.J.J. van der Hooft, J. Vervoort, R.J. Bino, R.C.H. de Vos. Spectral treesas a robust annotation tool in LC/MS/MS based metabolomics.Metabolomics 2012, 8, 691–703.
[37] L.W. Sumner, A. Amberg, D. Barett, M.H. Bealle, R. Beger, C.A.Daykin, T.W-M. Fan, O. Fiehn, R. Goodacre, J.L. Griffin, T.Hankemeier, N. Hardy, J. Harnly, R. Higashi, J. Kopka, A.N. Lane, J.C.Lindon, P. Mariott, A.W. Nicholls, M.D. Reilly, J.J. Thaden, M.R. Viant.Proposed minimum reporting standards for chemical analysis.Metabolomics 2007, 3, 211–221.
iley & Sons, Ltd. wileyonlinelibrary.com/journal/jms
339


![[Stimulation and inhibition of the sodium pump by cardiac glycosides]](https://img.pdfslide.net/doc/110x75/635fe76d87d94554380e1932/stimulation-and-inhibition-of-the-sodium-pump-by-cardiac-glycosides.jpg)


