Embed Size (px)
Citation preview

Structural, dielectric and magnetic properties of nickel substituted cobalt ferritenanoparticles: Effect of nickel concentrationNinad B. Velhal, Narayan D. Patil, Abhijeet R. Shelke, Nishad G. Deshpande, and Vijaya R. Puri Citation: AIP Advances 5, 097166 (2015); doi: 10.1063/1.4931908 View online: http://dx.doi.org/10.1063/1.4931908 View Table of Contents: http://scitation.aip.org/content/aip/journal/adva/5/9?ver=pdfcov Published by the AIP Publishing Articles you may be interested in Multiferroic Ni0.6Zn0.4Fe2O4-BaTiO3 nanostructures: Magnetoelectric coupling, dielectric, and fluorescence J. Appl. Phys. 116, 124103 (2014); 10.1063/1.4896118 Size dependent magnetic and dielectric properties of nano CoFe2O4 prepared by a salt assisted gel-combustion method J. Appl. Phys. 113, 194101 (2013); 10.1063/1.4804946 Nanocrystalline Ni-Al ferrites for high frequency applications AIP Conf. Proc. 1512, 408 (2013); 10.1063/1.4791084 Magnetic and electrical properties of In doped cobalt ferrite nanoparticles J. Appl. Phys. 112, 084321 (2012); 10.1063/1.4759436 Investigation of structural, dielectric, and magnetic properties of hard and soft mixed ferrite composites J. Appl. Phys. 112, 054323 (2012); 10.1063/1.4752030
All article content, except where otherwise noted, is licensed under a Creative Commons Attribution 3.0 Unported license. See:
http://creativecommons.org/licenses/by/3.0/ Downloaded to IP: 14.139.121.212 On: Thu, 24 Sep 2015 02:43:11

AIP ADVANCES 5, 097166 (2015)
Structural, dielectric and magnetic properties of nickelsubstituted cobalt ferrite nanoparticles: Effect of nickelconcentration
Ninad B. Velhal,1 Narayan D. Patil,1 Abhijeet R. Shelke,2Nishad G. Deshpande,2 and Vijaya R. Puri1,a1Thick and Thin Film Device Laboratory, Department of Physics, Shivaji University,Kolhapur-416004 India2q-Spin Tech and Nanomaterials laboratory, Department of Physics, Shivaji University,Kolhapur-416004 India
(Received 8 August 2015; accepted 14 September 2015; published online 23 September 2015)
Nickel substituted cobalt ferrite nanoparticles with composition Co1−xNixFe2O4(0.0≤x≤1.0) was synthesized using simple, low temperature auto combustion method.The X-ray diffraction patterns reveal the formation of cubic phase spinel structure. Thecrystallite size varies from 30-44 nm with the nickel content. Porous and agglomeratedmorphology of the bulk sample was displayed in the scanning electron microscopy.Micro Raman spectroscopy reveals continuous shift of Eg and Eg(2) stokes line up to0.8 Ni substitution. The dispersion behavior of the dielectric constant with frequencyand the semicircle nature of the impedance spectra show the cobalt nickel ferrite tohave high resistance. The ferromagnetic nature is observed in all the samples, however,the maximum saturation magnetization was achieved by the 0.4 Ni substituted cobaltferrite, which is up to the 92.87 emu/gm at 30K. C 2015 Author(s). All article content,except where otherwise noted, is licensed under a Creative Commons Attribution 3.0Unported License. [http://dx.doi.org/10.1063/1.4931908]
I. INTRODUCTION
Spinel ferrite is the class of oxide materials with remarkable electrical and magnetic properties,which have been investigated and applied during the last few decades. Amongst all inverse spinel fer-rites, the nickel substituted cobalt ferrite has been extensively studied in view of their good chemicaland thermal stability, high electrical resistivity, magnetic anisotropy, high coercivity and moderatesaturation magnetization, various exchange interactions and super-paramagnetism etc. In additionto these, they exhibit ferrimagnetism, originating from the magnetic moment of anti-parallel spinsbetween Fe3+ ions at tetrahedral sites and Co2+ or Ni2+ ions at octahedral sites.1 Due to the mag-netic properties, ferrite have various applications in numerous fields including microwave devices,2
recording media,3 magnetic fluids,4 gas sensors,5 high density information storage,6 ferro-fluids7 andcatalysts.8
Literature contains several physical as well as chemical method to synthesize the spinel ferriteslike solid-state reaction,9 high energy ball milling,10 sol–gel,11 hydrothermal synthesis,12 chemicalco-precipitation,13 combustion synthesis,14 micro-emulsion15 and microwave hydrothermal.16 The struc-tural, transport and magnetic properties of the CoFe2O4 are strongly dependent on the synthesismethod, crystallite size etc.17 The ferromagnetic behavior of the cobalt ferrite is observed with tran-sition temperature around 790K which crystallize in the Co1−δFeδO4 tetrahedral A-site coordinationand CoδFe1−δO4 octahedral B-site coordination where, δ- represents the degree of inversion and whenδ = 1, the inverse spinel structure is formed and when δ = 0, the normal spinel structure is possiblewhich is observed in the mixed spinel structure. The value of the δ also depends on the thermal treat-ment during the synthesis and the crystallite size. Junior et al.18 have synthesized the series of inverse
aCorresponding Author: Dr. Vijaya Puri Email: [email protected]
2158-3226/2015/5(9)/097166/11 5, 097166-1 ©Author(s) 2015
All article content, except where otherwise noted, is licensed under a Creative Commons Attribution 3.0 Unported license. See:
http://creativecommons.org/licenses/by/3.0/ Downloaded to IP: 14.139.121.212 On: Thu, 24 Sep 2015 02:43:11

097166-2 Velhal et al. AIP Advances 5, 097166 (2015)
spinel ferrite by using the auto combustion method and observed that the crystallite size increasesfrom 19 to 32 nm as Co content increases.
The practical application in the field of the magnetic recordings, video as well as audio requirescomparatively large value of the magnetic moment. Tailhades et al.19 tried to substitute Cu into theCoFe2O4 to increase the magnetization but found cation migration during annealing. Reports are alsoavailable on Al as well as Ti substituted CoFe2O4 by Sol-Gel methods with saturation magnetizationof 72.1 and 62.6 emu/gm respectively.20 Comparitively, all these reports show low values of magneti-zation as well as mismatch to the synthesized particle size. Ni is a ferromagnetic metal which magne-tizes easily even at room temperature, hence to increase the magnetization value of the CoFe2O4, anattempt has been made to substitute the divalent Ni into the CoFe2O4.Singhal et al.21 have preparedthe nanoparticles of the series of Ni substituted CoFe2O4 by using the aerosol chemical route. Theyfound that as the concentration of Ni into CoFe2O4 matrix increases, particle size decreases and thesaturation magnetization decreases.
The auto combustion method is widely used for the synthesis of a variety of mixed-metal ox-ide nanoparticles without intermediate decomposition. Another fact behind the utilization of autocombustion method is that it maintains high stoichiometry of the product and hence it is easy tocontrol the particle size of the product. Moreover this method offers a number of advantages over theother methods such as, excellent mixing of starting materials, chemical homogeneity and purity in thefinal product, molecular level mixing and tendency of partially hydrolyzed species to form extendednetworks, which lowers the crystallization temperature.22
This paper reports the structural, morphological, dielectric and temperature dependent magneticproperties of Ni substituted cobalt ferrite synthesized via low temperature auto combustion method.
II. EXPERIMENTAL
A. Preparation of Co1−xNixFe2O4 nanoparticles
The nanoparticles of Co1−xNixFe2O4 (0≤x≤1) were synthesized by the auto combustion tech-nique. All the ingredients used for the synthesis were AR grade with 99 % purity. During the synthesis,Fe(NO3)3·9H2O, Co(NO3)2·6H2O, Ni(NO3)2·6H2O were used as the oxidizing agent while citric acidas fuel. All the metal nitrates and citric acid were weighed in desired stoichiometric proportions anddissolved separately in a minimum amount of double distilled water. After the complete dissolution,the metal nitrates were mixed together to maintain the Co/Fe ratio of 1:2. Then, aqueous solution ofmetal nitrate and citric acid was mixed together in the molar ratio of 1:2. Afterward, entire solutionwas kept with constant stirring at 80◦C on a magnetic stirrer. Ammonia was used to maintain the PH
of the solution to about 7. Due to the continuous evaporation of water, the solution becomes viscousand finally, brownish gel was formed. The gel was held at the ignition temperature of 300◦C, whereself-propagating combustion reaction occurred to form a fluffy mass. These masses were crushed andthe resultant material was annealed at 800◦C in a muffle furnace for 8 h. For the pellet formation,the powder was mixed with 3 wt% polyvinyl alcohol and pressed under the hydraulic pressure of10 tones. Further, the pellets were sintered at 450 ◦C for 4 h to remove the excess binder. Fig. 1 showsthe flow chart of the auto combustion technique.
B. Instruments
The D2 phaser X-ray diffractometer was used for phase determination of samples with 0.02 stepin the 2θ range of 20-80o. To know the modes of vibration, the sample was characterized with Micro-Raman spectroscopy using the LabRam HR800 UV Raman microscope (Horiba Jobin-Yvon, France)with 80 cm focal length and 0.5 cm spectral resolution at 10% of 10mw laser power in the range100-1200 cm−1. The FT-IR spectra were recorded using Perkin spectrofluorometer in 400-2000 cm−1
range to confirm the metal oxide bonding present in the materials. The surface morphological studywas done using the scanning electron microscope (SEM, JEOL-JSM-6360). The dielectric propertieswere measured using the Keithley 6514 electrometer and LCR meter (HP 4284-A). The magnetic
All article content, except where otherwise noted, is licensed under a Creative Commons Attribution 3.0 Unported license. See:
http://creativecommons.org/licenses/by/3.0/ Downloaded to IP: 14.139.121.212 On: Thu, 24 Sep 2015 02:43:11

097166-3 Velhal et al. AIP Advances 5, 097166 (2015)
FIG. 1. Flow chart of sol gel-auto combustion technique.
properties were studied using SQUID (Quantum design model MPMS3) at the temperature of 30Kand 300K.
III. RESULTS AND DISCUSSIONS
A. X-ray Diffraction Study (XRD)
The X-ray diffraction (XRD) patterns of Co1−xNixFe2O4 (x = 0.0, 0.2, 0.4, 0.6, 0.8 and 1.0) areshown in Fig. 2. XRD pattern confirms that the Co1−xNixFe2O4 crystallize in cubic spinel structureof Fd3m space group. The prominent Bragg reflections can be indexed as (220), (311), (222), (400),(422), (511), (440) and (620) planes of face centered cubic spinel type structure. The small reflectionappears at 33o is mainly due to the formation of α-Fe2O3 phase (JCPDS No. 01-1030)23 whereas thepeak observed at 51o is of the NiFe2O4.24 The formation of NiFe2O4 is occurred due to the reactionoccurred between Ni and Fe2O3 to form NiFe2O4. No other impurity phases are observed in all thediffraction patterns. All the reflections are in good agreement with the JCPDS card no.22-1086 and10-0325. Also the peak position of the XRD patterns does not alter after partial the substitution of Niinto the CoFe2O4. This is due to the comparatively same scattering factor of Co and Ni, as they areneighboring element in the periodic table and hence atomic positions are unchanged. This also givesthe small reflection at 51o for 0.2 and 0.4 substitution of Ni. The small shift in the XRD patterns isobserved at higher 2θ angle, when the Ni content in the product increases. This can be explained bythe fact that the ionic radius (0.072 nm) of Ni2+ ions is smaller than that (0.074 nm) of Co2+ ions,25
which corresponds to lower lattice parameter and lattice volume with the decrease in crystallite size.The average crystallite size was calculated from line broadening of XRD pattern (inset of fig. 2) usingthe Scherrer formula (Eq.(1)).The obtained crystallite size is in the range of 31-44 nm. The maximumcrystallite size of 44 nm for the 0.4 Ni substitution was obtained.
D =0.9λβCosθ
(1)
Where D is the crystallite size (nm), β is the broadening of diffraction peaks measured at half-maximum intensity (radians) and λ= the wavelength of Cu-Kα.
The lattice constant and cell volume of Co1−xNixFe2O4 nanoparticles has been determined fromequation (2) and (3):
All article content, except where otherwise noted, is licensed under a Creative Commons Attribution 3.0 Unported license. See:
http://creativecommons.org/licenses/by/3.0/ Downloaded to IP: 14.139.121.212 On: Thu, 24 Sep 2015 02:43:11

097166-4 Velhal et al. AIP Advances 5, 097166 (2015)
FIG. 2. X-ray diffraction patterns of Co1−xNixFe2O4.
a = dhkl
√h2 + k2 + l2 (2)
V = a3 (3)
The crystallite size, lattice parameter and cell volume of Ni substituted cobalt ferrite was calculated forthe different compositions and is summarized in Table I. From Table I it is seen that as Ni content in-creases in the CoFe2O4 the lattice constant increases up to the 0.2 substitution of Ni thereafter it remainconstant. This is due to the transfer of Co2+ ions from octahedral sites to tetrahedral sites because ofthe increased concentration of the Ni ions. It can also be seen from Fig. 2 that the Bragg peak positionsfor the Ni2+ substituted ferrite are shifted a little to the right of the pure cobalt ferrite sample.
B. Scanning Electron Microscopy (SEM)
Fig. 3 shows the scanning electron micrographs of Co1−xNixFe2O4 (x= 0.0 to 1.0). The grains arerandomly distributed and agglomerated due to the ignition of fuel during the reaction. The particlesare separated as the crystallite size increases by the substitution. The clearly separated porous bunchof Ni substituted CoFe2O4 are observed at 0.4 Ni doping with maximum crystallite size 44 nm. Theporosity of this sample helps in avoiding the distortion losses and well separated particle improves thetransportation properties. Further substitution of Ni agglomeration becomes more due to the decreaseof the crystallite size.
C. Micro Raman Spectroscopy
Fig. 4 shows the Raman spectra of Co1−xNixFe2O4. All the Raman bands are consistent withthose reported for other cubic inverse spinel ferrite structures, which belong to the Oh
7 (Fd-3m) space
TABLE I. Crystallite size, lattice constant, cell volume and X-ray density.
Sample NameCrystallite Size (nm)
DLattice Constant
aCell Volume
a3
CoFe2O4 39 8.36 589.34Co0.8Ni0.2Fe2O4 42 8.38 581.29Co0.6Ni0.4Fe2O4 44 8.34 581.29Co0.4Ni0.6Fe2O4 30 8.34 581.29Co0.2Ni0.8Fe2O4 31 8.34 581.29NiFe2O4 39 8.34 581.29
All article content, except where otherwise noted, is licensed under a Creative Commons Attribution 3.0 Unported license. See:
http://creativecommons.org/licenses/by/3.0/ Downloaded to IP: 14.139.121.212 On: Thu, 24 Sep 2015 02:43:11

097166-5 Velhal et al. AIP Advances 5, 097166 (2015)
FIG. 3. SEM images of Co1−xNixFe2O4.
group. According to group theory the spinel structure gives rise to 39 normal modes, among which5 are Raman active. All five Raman peaks seem asymmetric, or even dissociated. Deconvolution ofspectrum demonstrates that each peak can be presented like a doublet (Fig. 4), which is a characteristicof the inverse spinel structure.26 The two most intense Raman bands were observed at 482 cm−1 (Eg)and 701 cm−1 (A1g) are the characteristic modes of spinel ferrite. The low-frequency mode at 482 cm−1
is assigned as the vibrations of the octahedral sublattice, whereas the high energy phonon mode at701 cm−1 originates from vibrations of the tetrahedral sublattice.27 The position of the lower frequencymode observed at 212, 226, 247, 295, 333, 413, are in accordance with the Graves28 et al., Lazarevicet al.29 and Valdes-Solıs et al.30 It appears that most of these modes are closer to those of Fe2O3 whichhas seven Raman modes at 226, 245, 293, 298, 413, 500, and 612 cm−1. This is not surprising becausethe samples cannot be readily produced as single phases because of the proximity of the Fe3O4-Fe2O3
phase boundary.31
FIG. 4. Micro-Raman spectrum of Co1−xNixFe2O4.
All article content, except where otherwise noted, is licensed under a Creative Commons Attribution 3.0 Unported license. See:
http://creativecommons.org/licenses/by/3.0/ Downloaded to IP: 14.139.121.212 On: Thu, 24 Sep 2015 02:43:11

097166-6 Velhal et al. AIP Advances 5, 097166 (2015)
FIG. 5. FT-IR Spectrum of Co1−xNixFe2O4.
D. Fourier Transform-Infrared Spectroscopy (FT-IR)
The FT-IR spectra recorded in the range of 400-2000 cm−1 is shown in Fig.5. The infrared bandsof solids are usually assigned to vibration of ions in the crystal lattice. Two main broad metal-oxygenbands are seen in the IR spectra (Fig. 5) of all spinels, and ferrites in particular. The high frequencyband (υ1) is generally attributed at 550-600 cm−1 while the lower frequency band occurred at 385-450 cm−1.32 The main difference is the position of stretching modes for Fe and Ni (Co) is due todifferent bonding strength of Fe-O and Ni-O Fe-O bonds are stronger since iron is trivalent and Co-Oor Ni-O weaker since these cations are divalent. Herein broad band observed at 591 cm−1 is mainly dueto Fe-O stretching, whereas the band observed at lower range 402 cm−1 is attributed due to Co/Ni-Ostretching vibration.
IV. DIELECTRIC PROPERTIES
A. Dielectric dispersion
The dielectric constant was calculated using the relation,
ε′ =cptε0A
(4)
Where Cp is the capacitance, t is the thickness of pellet, A is area of cross section, and εo is thepermittivity of free space (8.85 x 10⁻¹⁴ F/m).
ε′′ = ε′ tan δ (5)
Where tanδ is the dielectric loss factor, the energy dissipated in the form of heat when field is appliedto the sample
From the values of real and imaginary part of dielectric constant and loss tangent, AC conductivityof the sample can be calculated using the equation (4) and (5)
σAC = 2π f ε0ε′ tan δ (6)
The variation of dielectric constant (ε′) with frequency shows the dispersion relation (Fig. 6). It is seenthat, the dielectric constant exhibits an inverse dependence on frequency. The dielectric constant de-creases continuously with increasing frequency. At lower frequency, the dielectric constant decreasewith frequency and then it remains constant at high values. This dispersive behavior is similar to
All article content, except where otherwise noted, is licensed under a Creative Commons Attribution 3.0 Unported license. See:
http://creativecommons.org/licenses/by/3.0/ Downloaded to IP: 14.139.121.212 On: Thu, 24 Sep 2015 02:43:11

097166-7 Velhal et al. AIP Advances 5, 097166 (2015)
FIG. 6. Variation of room temperature dielectric constant with frequency of Co1−xNixFe2O4.
the conduction process in the ferrite. The incorporation of Ni into the CoFe2O4 shows the noticeableeffect. For 0.4 Ni substitution, the dielectric constant shows lower value than other compositions.The sample exhibits the polydispersibe behavior and hence the resistance due to the grain reduceswhich increase the magnetization. In the case of other samples the interior grains shows the deviatedsemicircle and hence the magnetization is decreased.33 The exchange of Fe2+↔ Fe3+ gives the localdisplacement of electrons in the direction of applied electric field, which induces the polarization inferrites and magnitude of exchange depends on the concentration of Fe2+/Fe3+ ion pairs present at Bsite for the given ferrite.34 Such types of behavior is reported earlier by Patil et al.35 The dispersionoccurring in the lower frequency regime is attributed due to Maxwell-Wagner type interfacial polari-zation and is in agreement with Koop’s phenomenological theory.36 However, at higher frequencies,the dielectric constant remains constant due to electronic polarization. In electronic polarization, elec-tric dipoles are unable to follow the fast variation of applied alternating electric field resulting in lowdielectric constant.37 Therefore, as the Ni content increases the dielectric constant of ferrite decreasescontinuously and remains constant at the higher frequencies.
Fig. 7 depicts the variation of loss tangent with frequency at room temperature. This shows thesimilar kind of dispersion relation. At lower frequency the value of tanδ is high and it decreases contin-uously with frequency. Here also the 0.4 Ni substituted cobalt ferrite shows the highest loss tangentvalue of 4.93 at low frequency. The high value of loss tangent corresponds to high resistivity grainboundaries within the material. Therefore, more energy is required for electron exchange betweenFe3+ and Fe2+ ions resulting into high energy loss. At the higher frequency small amount of energyis required for electron exchange between Fe3+ and Fe2+ ions resulting into small value of energyloss and hence low value of electrical resistivity. This gives the idea about the conduction mechanismwithin the ferrites.
The impedance spectra of Co1−xNixFe2O4 plotted at room temperature is shown in Fig. 8. It showsincomplete semicircles which may be due to the high resistance exhibited by the ferrites. The diameterof the circle is observed to decrease with the increasing Ni content, exhibiting the relaxation processduring the conduction of electrical charges within the ferrites.
B. AC Conductivity
The AC conductivity (σac) was calculated using the relation
σac = ε′εoω tan δ (7)
Where ω = 2πf and is the angular frequency tan δ is the dielectric loss tangent.
All article content, except where otherwise noted, is licensed under a Creative Commons Attribution 3.0 Unported license. See:
http://creativecommons.org/licenses/by/3.0/ Downloaded to IP: 14.139.121.212 On: Thu, 24 Sep 2015 02:43:11

097166-8 Velhal et al. AIP Advances 5, 097166 (2015)
FIG. 7. Variation of loss tangent with frequency of Co1−xNixFe2O4.
To understand the conduction mechanism and the type of polarons responsible for conduction,the variation of AC conductivity as a function of frequency is represented in Fig. 9. From fig. it is seenthat AC conductivity increases linearly with the frequency. This linear increase in AC conductivity isrelated with conduction by electron exchange between the ions of same element but different valen-cies. At lower frequencies the grain boundaries are more active and hence the hopping of Fe2+ and Fe3+
ions is less at lower frequencies also Co1−xNixFe2O4 ferrites has cubic close pack structure with cationsat octahedral (B) site and tetrahedral (A) site. The exchange of electric charge between A-B sites ismore important as compared to B-B exchange. On the application of AC field, the conductive grainsbecome more active thereby promoting the hopping between Fe2+ and Fe3+ ions, thereby increasingthe hopping conduction. A gradual increase in conductivity was observed with frequency.38 It is wellknown that AC conductivity in disordered solids is directly proportional to frequency. Usually ACconductivity can be represented as,
σAC = σ0(T) + σ(ω,T) (8)
FIG. 8. Variation of room temperature complex impedance spectra of Co1−xNixFe2O4.
All article content, except where otherwise noted, is licensed under a Creative Commons Attribution 3.0 Unported license. See:
http://creativecommons.org/licenses/by/3.0/ Downloaded to IP: 14.139.121.212 On: Thu, 24 Sep 2015 02:43:11

097166-9 Velhal et al. AIP Advances 5, 097166 (2015)
FIG. 9. Variation of AC conductivity with respect to frequency of Co1−xNixFe2O4.
This is the combination of frequency independent term σ0(T) called as DC conductivity and frequencydependent term σ(ω, T) called as AC conductivity due to hopping of electrons at octahedral site. Theplot of AC conductivity is linear, indicating that conduction is due to small polarons. The frequencydependent conduction is attributed to small polarons, as reported by David A. et al.39
V. MAGNETIC PROPERTIES
The field and temperature dependent magnetic properties of the Co1−xNixFe2O4(x = 0.0, 0.2,0.4, 0.6, 0.8, 1.0) was measured using SQUID from Quantum design model MPMS3 at 30K and300K. Fig. 10 illustrates low temperature isothermal hysteresis loops (a) and room temperatureisothermal hysteresis loops (b) of Co1−xNixFe2O4 respectively. All the M(H) curves were measured inthe range of approximately−50 to+50kOe. All the samples exhibited typical ferromagnetic behaviorTable II depicts the variation of saturation magnetization (Ms), remanent magnetization (Mr), coercivefield (Hc) and the loop squareness (Mr/Ms) with Ni substitution at 30K and 300K. The maximumMr/Ms value is found to be 0.67 indicating the enhanced contribution from cubic anisotropy (higherorder terms of magneto crystalline anisotropy) at lower temperatures. Hence a large coercivity andthe saturation magnetization can be expected at lower temperatures.40 The saturation magnetizationand remanent magnetization increases by substitution of Ni up to the 0.4 this is due to increase in
FIG. 10. (a) M-H curve of Co1−xNixFe2O4 at 30K and (b) M-H curve of Co1−xNixFe2O4 at 300K.
All article content, except where otherwise noted, is licensed under a Creative Commons Attribution 3.0 Unported license. See:
http://creativecommons.org/licenses/by/3.0/ Downloaded to IP: 14.139.121.212 On: Thu, 24 Sep 2015 02:43:11
097166-10 Velhal et al. AIP Advances 5, 097166 (2015)
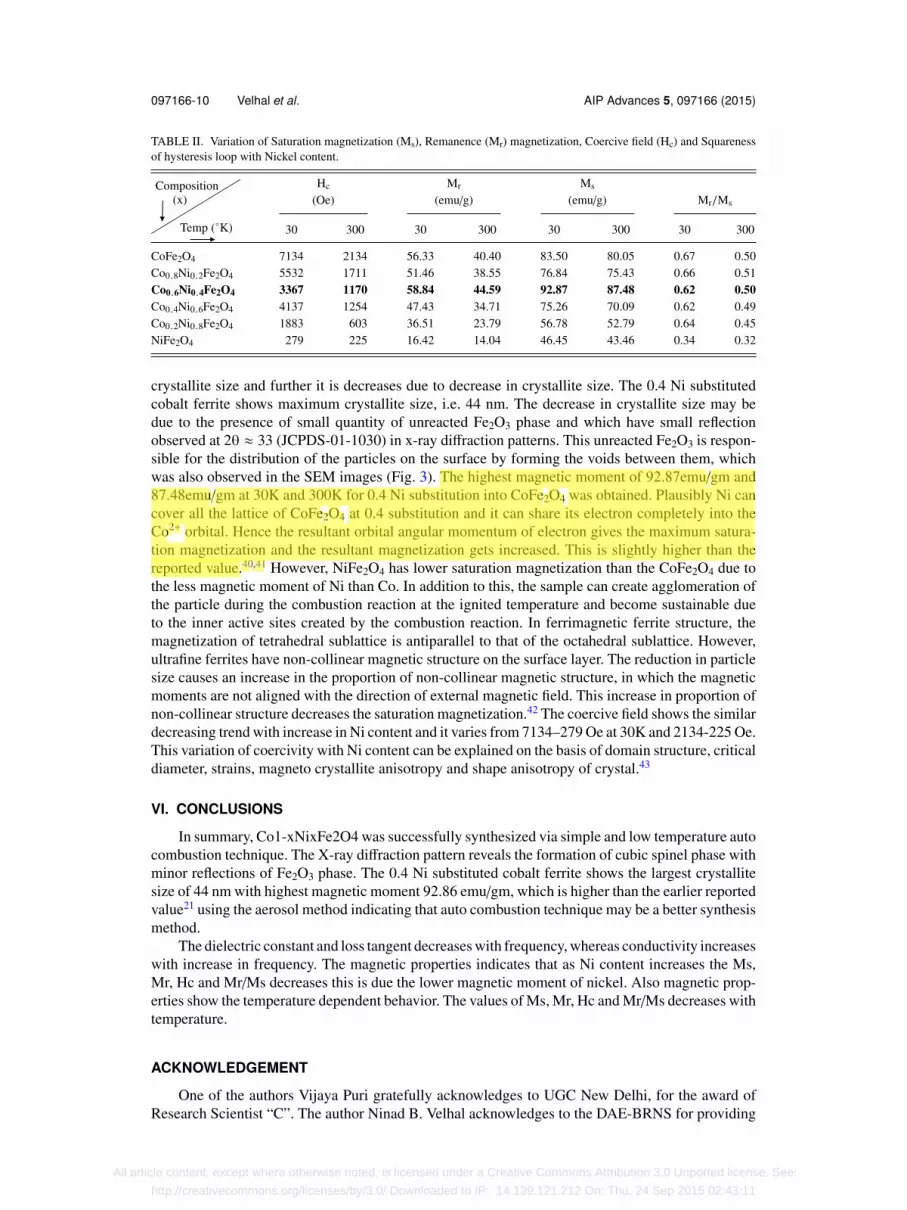
TABLE II. Variation of Saturation magnetization (Ms), Remanence (Mr) magnetization, Coercive field (Hc) and Squarenessof hysteresis loop with Nickel content.
Hc
(Oe)Mr
(emu/g)Ms
(emu/g) Mr/Ms
30 300 30 300 30 300 30 300
CoFe2O4 7134 2134 56.33 40.40 83.50 80.05 0.67 0.50Co0.8Ni0.2Fe2O4 5532 1711 51.46 38.55 76.84 75.43 0.66 0.51Co0.6Ni0.4Fe2O4 3367 1170 58.84 44.59 92.87 87.48 0.62 0.50Co0.4Ni0.6Fe2O4 4137 1254 47.43 34.71 75.26 70.09 0.62 0.49Co0.2Ni0.8Fe2O4 1883 603 36.51 23.79 56.78 52.79 0.64 0.45NiFe2O4 279 225 16.42 14.04 46.45 43.46 0.34 0.32
crystallite size and further it is decreases due to decrease in crystallite size. The 0.4 Ni substitutedcobalt ferrite shows maximum crystallite size, i.e. 44 nm. The decrease in crystallite size may bedue to the presence of small quantity of unreacted Fe2O3 phase and which have small reflectionobserved at 2θ ≈ 33 (JCPDS-01-1030) in x-ray diffraction patterns. This unreacted Fe2O3 is respon-sible for the distribution of the particles on the surface by forming the voids between them, whichwas also observed in the SEM images (Fig. 3). The highest magnetic moment of 92.87emu/gm and87.48emu/gm at 30K and 300K for 0.4 Ni substitution into CoFe2O4 was obtained. Plausibly Ni cancover all the lattice of CoFe2O4 at 0.4 substitution and it can share its electron completely into theCo2+ orbital. Hence the resultant orbital angular momentum of electron gives the maximum satura-tion magnetization and the resultant magnetization gets increased. This is slightly higher than thereported value.40,41 However, NiFe2O4 has lower saturation magnetization than the CoFe2O4 due tothe less magnetic moment of Ni than Co. In addition to this, the sample can create agglomeration ofthe particle during the combustion reaction at the ignited temperature and become sustainable dueto the inner active sites created by the combustion reaction. In ferrimagnetic ferrite structure, themagnetization of tetrahedral sublattice is antiparallel to that of the octahedral sublattice. However,ultrafine ferrites have non-collinear magnetic structure on the surface layer. The reduction in particlesize causes an increase in the proportion of non-collinear magnetic structure, in which the magneticmoments are not aligned with the direction of external magnetic field. This increase in proportion ofnon-collinear structure decreases the saturation magnetization.42 The coercive field shows the similardecreasing trend with increase in Ni content and it varies from 7134–279 Oe at 30K and 2134-225 Oe.This variation of coercivity with Ni content can be explained on the basis of domain structure, criticaldiameter, strains, magneto crystallite anisotropy and shape anisotropy of crystal.43
VI. CONCLUSIONS
In summary, Co1-xNixFe2O4 was successfully synthesized via simple and low temperature autocombustion technique. The X-ray diffraction pattern reveals the formation of cubic spinel phase withminor reflections of Fe2O3 phase. The 0.4 Ni substituted cobalt ferrite shows the largest crystallitesize of 44 nm with highest magnetic moment 92.86 emu/gm, which is higher than the earlier reportedvalue21 using the aerosol method indicating that auto combustion technique may be a better synthesismethod.
The dielectric constant and loss tangent decreases with frequency, whereas conductivity increaseswith increase in frequency. The magnetic properties indicates that as Ni content increases the Ms,Mr, Hc and Mr/Ms decreases this is due the lower magnetic moment of nickel. Also magnetic prop-erties show the temperature dependent behavior. The values of Ms, Mr, Hc and Mr/Ms decreases withtemperature.
ACKNOWLEDGEMENT
One of the authors Vijaya Puri gratefully acknowledges to UGC New Delhi, for the award ofResearch Scientist “C”. The author Ninad B. Velhal acknowledges to the DAE-BRNS for providing
All article content, except where otherwise noted, is licensed under a Creative Commons Attribution 3.0 Unported license. See:
http://creativecommons.org/licenses/by/3.0/ Downloaded to IP: 14.139.121.212 On: Thu, 24 Sep 2015 02:43:11

097166-11 Velhal et al. AIP Advances 5, 097166 (2015)
the JRF under the project no. [2012/34/36/BRNS/1034]. All authors gratefully acknowledge KBSI,Gwangju-center for providing Micro Raman facility. NGD is thankful to DST for awarding DST-INSPIRE Faculty Award [IFA-PH-61/01/08/2013] for financial assistance.1 M.J. Iqbal and Z. Ahmad, J. Power Sources 179, 763 (2008).2 M.N. Ashiq, M.J. Iqbal, and I.H. Gul, J. Alloys Compd. 487, 341 (2009).3 D.S. Jung and Y.C. Kang, J. Magn. Magn. Mater. 321, 619 (2009).4 J. Huo and M. Wei, Mater. Lett. 63, 1183 (2009).5 L. Chen, H. Dai, Y. Shen, and J. Bai, J. Alloys Compd. 491, 33 (2010).6 Y. Köseoglu, a. Baykal, F. Gözüak, and H. Kavas, Polyhedron 28, 2887 (2009).7 M.H. Sousa, E. Hasmonay, J. Depeyrot, F. a. Tourinho, J.C. Bacri, E. Dubois, R. Perzynski, and Y.L. Raikher, J. Magn.
Magn. Mater. 242-245, 572 (2002).8 C. Ramankutty and S. Sugunan, Appl. Catal. A Gen. 218, 39 (2001).9 D.-H. Chen and X.-R. He, Mater. Res. Bull. 36, 1369 (2001).
10 S.K. Pradhan, S. Bid, M. Gateshki, and V. Petkov, Mater. Chem. Phys. 93, 224 (2005).11 M. Atif, M. Nadeem, R. Grössinger, and R.S. Turtelli, J. Alloys Compd. 509, 5720 (2011).12 J. Zhang, J. Shi, and M. Gong, J. Solid State Chem. 182, 2135 (2009).13 I. Ali, M.U. Islam, M. Ishaque, H.M. Khan, M. Naeem Ashiq, and M.U. Rana, J. Magn. Magn. Mater. 324, 3773 (2012).14 M.H. Yousefi, S. Manouchehri, a. Arab, M. Mozaffari, G.R. Amiri, and J. Amighian, Mater. Res. Bull. 45, 1792 (2010).15 X. Gao, Y. Du, X. Liu, P. Xu, and X. Han, Mater. Res. Bull. 46, 643 (2011).16 S. Verma, P. a. Joy, Y.B. Khollam, H.S. Potdar, and S.B. Deshpande, Mater. Lett. 58, 1092 (2004).17 K.E. Mooney, J.A. Nelson, and M.J. Wagner, 3155 (2004).18 A. Franco, E. Celma de Oliveira Lima, M. a. Novak, and P.R. Wells, J. Magn. Magn. Mater. 308, 198 (2007).19 P. Tailhades, C. Villette, a. Rousset, G.U. Kulkarni, K.R. Kannan, C.N.R. Rao, and M. Lenglet, J. Solid State Chem. 63, 56
(1998).20 K.P. Chae, J.-G. Lee, H. Su Kweon, and Y. Bae Lee, J. Magn. Magn. Mater. 283, 103 (2004).21 S. Singhal, J. Singh, S.K. Barthwal, and K. Chandra, J. Solid State Chem. 178, 3183 (2005).22 D.S. Mathew and R.S. Juang, Chem. Eng. J. 129, 51 (2007).23 S. V Ganachari, V.K. Joshi, R. Bhat, and R. Deshpande, Int. J. Sci. Res. Vol. 01, 77 (2012).24 O.M. Lemine, I. Ghiloufi, M. Bououdina, L. Khezami, M.O. M’hamed, and a. T. Hassan, J. Alloys Compd. 588, 592 (2014).25 L. Kumar, P. Kumar, A. Narayan, and M. Kar, Int. Nano Lett. 3, 8 (2013).26 A. Ahlawat and V.G. Sathe, J. Raman Spectrosc. 42, 1087 (2011).27 W. Liu, Y. Chan, J. Cai, C. Leung, C. Mak, K. Wong, F. Zhang, X. Wu, and X.D. Qi, J. Appl. Phys. 112 (2012).28 P. R. Graves, C. Johnston, and J. J. Campaniello, Mat. Res. Bull. 23, 1651 (1988).29 Z. Z. Lazarfvic, C. Jovalekic, A. Milutinovic, M.J. Romecevic, and N. Romecevic, Acta Phys. Pol A 121, 682 (2012).30 T. Valdés-Solís, P. Tartaj, G. Marbán, and a B. Fuertes, Nanotechnology 18, 145603 (2007).31 R. Gupta, a. Sood, P. Metcalf, and J. Honig, Phys. Rev. B 65, 1 (2002).32 T. Ramesh, R.S. Shinde, and S.R. Murthy, J. Magn. Magn. Mater. 345, 276 (2013).33 P. Kour, P. Kumar, S.K. Sinha, and M. Kar, Solid State Commun. 190, 33 (2014).34 K.A. Hossain, S. Akther, and D.K. Saha, 37, 73 (2013).35 N.D. Patil, N.B. Velhal, N.L. Tarwar, and V.R. Puri, 3, 73 (2014).36 C.G. Koops, Phys. Rev. 83, 121 (1951).37 K. B, N.S.N. K. Permar, and A. Sharma, Res. J. Mater. Sci. 1, 7 (2013).38 R.C. Kambale, P. a Shaikh, C.H. Bhosale, K.Y. Rajpure, and Y.D. Kolekar, Smart Mater. Struct. 18, 085014 (2009).39 D. Adler and J. Feinleib, Phys. Rev. B 1693, 3112 (1970).40 P. Puliová, J. Kovác, a. Voigt, and P. Raschman, J. Magn. Magn. Mater. 341, 93 (2013).41 Z. Karimi, Y. Mohammadifar, H. Shokrollahi, S.K. Asl, G. Yousefi, and L. Karimi, J. Magn. Magn. Mater. 361, 150 (2014).42 S. Xavier, S. Thankachan, B.P. Jacob, and E.M. Mohammed, 2013, (2013).43 K. Nejati and R. Zabihi, Chem. Cent. J. 6, 23 (2012).
All article content, except where otherwise noted, is licensed under a Creative Commons Attribution 3.0 Unported license. See:
http://creativecommons.org/licenses/by/3.0/ Downloaded to IP: 14.139.121.212 On: Thu, 24 Sep 2015 02:43:11


