Embed Size (px)
Citation preview

PHYSICAL REVIEW E DECEMBER 2000VOLUME 62, NUMBER 6
Structure and dynamics of fluorescently labeled complex fluidsby Fourier imaging correlation spectroscopy
Tyler J. Grassman, Michelle K. Knowles, and Andrew H. Marcus*Materials Science Institute and Department of Chemistry, University of Oregon, Eugene, Oregon 97403
~Received 10 July 2000!
We present a method of Fourier imaging correlation spectroscopy~FICS! that performs phase-sensitivemeasurements of modulated optical signals from fluorescently labeled complex fluids. FICS experiments probethe time-dependent trajectory of a spatial Fourier component of the fluid particle density at a specified wavenumberk, and provide a direct route to the intermediate scattering function. The FICS approach overcomessignal sensitivity problems associated with dynamic light scattering, while offering a means to acquire time-dependent information about spatial distributions of fluorescent particles, superior in efficiency to direct im-aging methods. We describe the instrumental setup necessary to perform FICS experiments, and outline thetheory that establishes the connection between FICS observables and statistical mechanical quantities describ-ing liquid state dynamics. Test measurements on monolayer suspensions of rhodamine labeled polystyrenespheres are detailed.
PACS number~s!: 82.70.Dd, 87.64.2t, 87.15.Ya, 87.16.2b
tarerzete-mrecee
e
onpoala
en
b
r-ntteri-nnosord
ho
nse-ndentns
a-nce
theiduseongom-e
fluid
ime-om-
r-ntsf anousces
rp-thatonalu-cu-i-
isr byestua-es
I. INTRODUCTION
The dynamics of complex fluids is an area of fundamenimportance and technological relevance. Macromoleculamesoscopic translational motion is important in many diffent kinds of soft-matter systems ranging from self-organiblock-copolymer films to protein transport through the inrior of live biological cells. Traditionally, experimental information about the structure of polymer, colloid, and biomebrane materials is obtained by light scattering from ordearrangements of atoms, molecules, or larger scatteringters @1#. The dynamics of these systems is studied by pforming dynamic light scattering~DLS! measurements of thfluctuations of the scattered light intensity@2,3#. Such experi-ments reveal the existence of multiexponential relaxatithat arise from complex interactions between fluid comnents occurring over a range of spatial and temporal sc@4#. Nevertheless, the dynamics of many intriguing soft mterials have been left unexplored due to a lack of sufficilight scattering contrast.
Investigations of complex fluids are also constrainedthe fact that many systems appear naturally~and commer-cially! in the form of membranes or thin films. The propeties of thin-film materials are often dramatically differefrom those of the bulk, and these changes are thoughoccur as a consequence of subtle differences in the unding microscopic dynamics@5#. Because the volumes assocated with thin-film materials are extremely small, experimetal methods for characterizing mesoscopic translatiomotion require a high degree of signal sensitivity. The msensitive techniques are based on measurements of flucently labeled substituents in which emission signals aretected against a dark background. Fluorescence met
*Author to whom correspondence should be sent. Email [email protected]
PRE 621063-651X/2000/62~6!/8245~13!/$15.00
lor-d-
-dn-r-
s-es-t
y
toly-
-altes-e-ds
have undergone a resurgence in recent years, as a coquence of technological innovations in optical imaging adetection methodology. State-of-the-art imaging equipmis capable of visualizing spatial chromophore distributiofrom ultralow fluorescence signals, in some cases fromsingle isolated molecule@6#. Direct visualization methods offer additional advantages over conventional fluorescespectroscopies in that it is possible to measuredistributionsof physical quantities~such as particle positions! rather thanjust their mean values. In light of these breakthroughs,application of single-molecule microscopy to complex fludynamics might seem readily attainable. However, becachromophore photobleaching prevents the recording of lparticle trajectories, very few experiments have been accplished that actually directly visualize the relatively largspatial and temporal scales necessary to study complexdynamics.
Here we present an approach to the measurement of tdependent spatial distributions of chromophore-labeled cplex fluids, Fourier imaging correlation spectroscopy~FICS!.FICS retains the wave number selectivity of DLS while ovecoming its sensitivity problems by performing measuremeof modulated fluorescence signals from the intersection ointerference excitation fringe pattern with a heterogenedistribution of chromophores. Conventional fluorescencorrelation spectroscopy~FCS!, developed almost 30 yearago by Magde, Elson, and Webb@7#, was originally recog-nized for its sensitivity based on changes in optical absotion coefficients and fluorescence quantum yields. Sincetime FCS has been successfully used to study translatidiffusion, chemical kinetic rate constants, rotational diffsion coefficients, flow rates, molecular weights, and molelar aggregation@8#. All of the above mentioned FCS experments require a model dependent interpretation, whichbased on the assumption that density fluctuations occudiffusion. The wave number selectivity of FICS eliminatthe model dependence from the analysis of density fluctions detected in these measurements.s:
8245 ©2000 The American Physical Society
s
lesn-a-
inw
eths
ng
-thhesoro-io
lythecur-
ar-a
ingingver,re,slythen-es-re-
ing
ente
lyta-r,u-
a-de-llyicle
usiso--ivee-
nsed
to
eallyfef-
ud-totheataex-
atdy-
Sin
all
asigth
etiv
8246 PRE 62GRASSMAN, KNOWLES, AND MARCUS
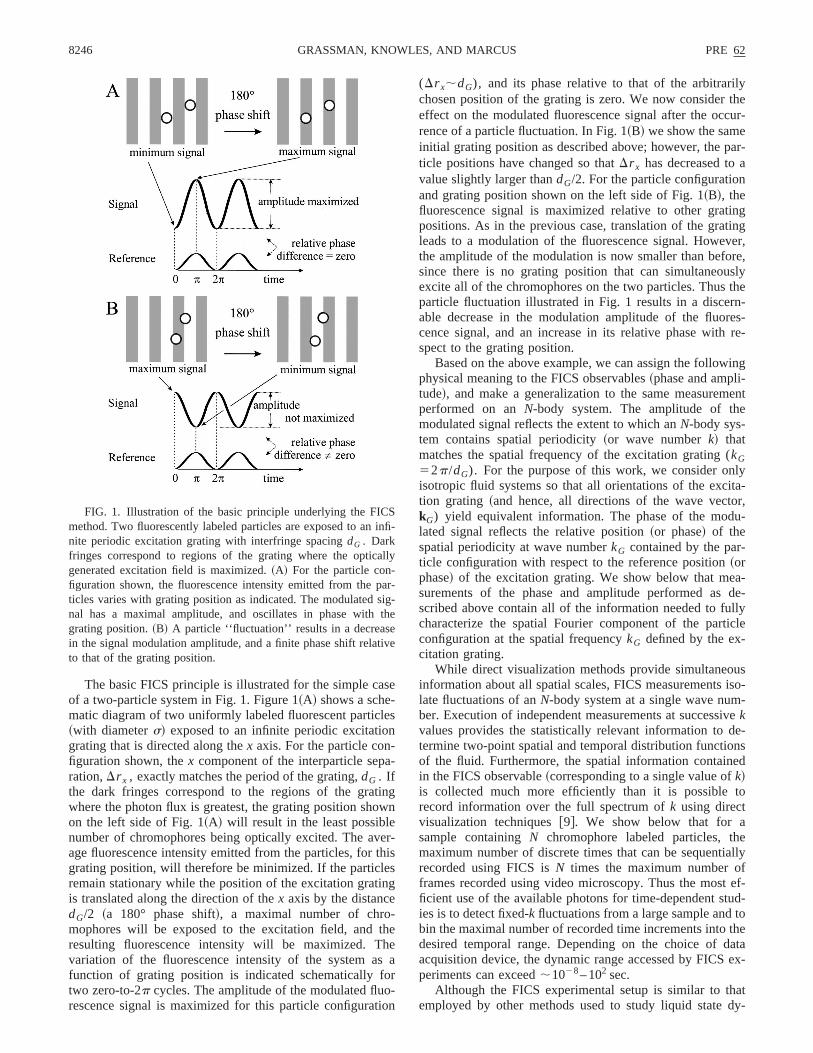
The basic FICS principle is illustrated for the simple caof a two-particle system in Fig. 1. Figure 1~A! shows a sche-matic diagram of two uniformly labeled fluorescent partic~with diameters! exposed to an infinite periodic excitatiograting that is directed along thex axis. For the particle configuration shown, thex component of the interparticle sepration,Dr x , exactly matches the period of the grating,dG . Ifthe dark fringes correspond to the regions of the gratwhere the photon flux is greatest, the grating position shoon the left side of Fig. 1~A! will result in the least possiblenumber of chromophores being optically excited. The avage fluorescence intensity emitted from the particles, forgrating position, will therefore be minimized. If the particleremain stationary while the position of the excitation gratiis translated along the direction of thex axis by the distancedG/2 ~a 180° phase shift!, a maximal number of chromophores will be exposed to the excitation field, andresulting fluorescence intensity will be maximized. Tvariation of the fluorescence intensity of the system afunction of grating position is indicated schematically ftwo zero-to-2p cycles. The amplitude of the modulated flurescence signal is maximized for this particle configurat
FIG. 1. Illustration of the basic principle underlying the FICmethod. Two fluorescently labeled particles are exposed to annite periodic excitation grating with interfringe spacingdG . Darkfringes correspond to regions of the grating where the opticgenerated excitation field is maximized.~A! For the particle con-figuration shown, the fluorescence intensity emitted from the pticles varies with grating position as indicated. The modulatednal has a maximal amplitude, and oscillates in phase withgrating position.~B! A particle ‘‘fluctuation’’ results in a decreasin the signal modulation amplitude, and a finite phase shift relato that of the grating position.
e
gn
r-is
e
a
n
(Dr x;dG), and its phase relative to that of the arbitrarichosen position of the grating is zero. We now considereffect on the modulated fluorescence signal after the ocrence of a particle fluctuation. In Fig. 1~B! we show the sameinitial grating position as described above; however, the pticle positions have changed so thatDr x has decreased tovalue slightly larger thandG/2. For the particle configurationand grating position shown on the left side of Fig. 1~B!, thefluorescence signal is maximized relative to other gratpositions. As in the previous case, translation of the gratleads to a modulation of the fluorescence signal. Howethe amplitude of the modulation is now smaller than befosince there is no grating position that can simultaneouexcite all of the chromophores on the two particles. Thusparticle fluctuation illustrated in Fig. 1 results in a discerable decrease in the modulation amplitude of the fluorcence signal, and an increase in its relative phase withspect to the grating position.
Based on the above example, we can assign the followphysical meaning to the FICS observables~phase and ampli-tude!, and make a generalization to the same measuremperformed on anN-body system. The amplitude of thmodulated signal reflects the extent to which anN-body sys-tem contains spatial periodicity~or wave numberk! thatmatches the spatial frequency of the excitation grating (kG52p/dG). For the purpose of this work, we consider onisotropic fluid systems so that all orientations of the excition grating ~and hence, all directions of the wave vectokG) yield equivalent information. The phase of the modlated signal reflects the relative position~or phase! of thespatial periodicity at wave numberkG contained by the par-ticle configuration with respect to the reference position~orphase! of the excitation grating. We show below that mesurements of the phase and amplitude performed asscribed above contain all of the information needed to fucharacterize the spatial Fourier component of the partconfiguration at the spatial frequencykG defined by the ex-citation grating.
While direct visualization methods provide simultaneoinformation about all spatial scales, FICS measurementslate fluctuations of anN-body system at a single wave number. Execution of independent measurements at successkvalues provides the statistically relevant information to dtermine two-point spatial and temporal distribution functioof the fluid. Furthermore, the spatial information containin the FICS observable~corresponding to a single value ofk!is collected much more efficiently than it is possiblerecord information over the full spectrum ofk using directvisualization techniques@9#. We show below that for asample containingN chromophore labeled particles, thmaximum number of discrete times that can be sequentirecorded using FICS isN times the maximum number oframes recorded using video microscopy. Thus the mostficient use of the available photons for time-dependent sties is to detect fixed-k fluctuations from a large sample andbin the maximal number of recorded time increments intodesired temporal range. Depending on the choice of dacquisition device, the dynamic range accessed by FICSperiments can exceed;1028– 102 sec.
Although the FICS experimental setup is similar to themployed by other methods used to study liquid state
fi-
y
r--e
e

risthletyad
iee
ivebe
n-ioioe
h
oth
ex
o
uthd
ye
pllegeo-M
-
inin
aye
ero-
rgea
g-
iclere-
fi-e
ticle
ted
edtheally
ac-o-ig-
re-en-
aso-e-
ced
ingges
q.ierfe
ruc-is
ere-inop-
-for-
in
(e.
PRE 62 8247STRUCTURE AND DYNAMICS OF FLUORESCENTLY . . .
namics@10–12#, the focus of past work has been to detemine the bulk diffusion coefficient. To our knowledge, thpaper is the first full report of a fluorescence observabledirectly probes the time-dependent trajectory of a compspatial Fourier component of the fluid particle densiC(k,t), and thereby provides a direct route to the informtion necessary to construct a comprehensive statisticalscription of the fluid dynamics. While real-space trajectorcontain all of the dynamical information that characterizthe 6N degrees of freedom of anN-body system with nointernal degrees of freedom, taken as a whole this informtion is overwhelmingly complex, and requires extensanalysis to establish a microscopic picture of the fluid’shavior @13#. A more directly informative~and physicallymeaningful! description of the dynamics is obtained by cosidering statistically averaged time-dependent distributfunctions. In particular, the van Hove space-time correlatfunction G(r ,t) is the conditional probability that a particlcan be found at positionr at time t, given that either thesame or a different particle was previously at positionr 50at time t50 @14#. It is a straightforward exercise, thougnumerically intensive, to calculateG(r ,t) from a completeset of particle trajectories. In addition to the advantagegreater dynamic range discussed above, the FICS meprovides a direct route to this same distribution.
In this work, we study the dynamics of a model complfluid system, Rhodamine-labeled 1-mm poly~styrene! colloi-dal particles confined to monolayer suspensions, using bdigital video fluorescence microscopy~DVFM! and FICS.We demonstrate that FICS data provide a more direct roto the same statistically relevant information yielded byDVFM data, although the former is more easily obtaineThe FICS method holds promise as a new tool to studwide range of problems where fluorescence signals aretremely low such as intracellular transport in live cells@15#and polymer dynamics in ultrathin films.
II. THEORY AND BACKGROUND INFORMATION
A. Microscopic trajectories and statistical distributionfunctions
Digital video microscopy~DVM ! @16,17# is an establishedmethod that has been successfully used to study comfluid dynamics. When used to image fluorescently labeparticles, DVFM has both advantages and disadvantaThe strength of DVFM is that it provides detailed micrscopic dynamical information. The observable in a DVFexperiment is a complete set of two-dimensionalN particletrajectories r1(t), from which we construct the timedependent microscopic density
C~r ,t !5(i 51
N
d@r2r i~ t !#. ~2.1!
In Eq. ~2.1!, the indexi enumerates theN ‘‘particle’’ posi-tions r i(t) in the fluid at timet. The choice of definition fora particle depends on the nature of the complex fluid bestudied. For example, the positions may account for theternal structure of a fluid of anisotropic objects, or it msimply identify their centers of mass. The minimum tim
-
atx,-e-ss
a-
-
nn
fod
th
tee.ax-
exds.
g-
interval is determined by the experimental sampling timbetween consecutive configurations. The experimental pcedure is to image a representative area of theN-particlesample onto the detector face of a high resolution chacoupled device~CCD! video camera. The CCD detector istwo-dimensional array of single-element detectors~or pix-els!. The CCD records the locations of each particle by reistering a threshold number of incident photons« on at leastN separate pixels of the array. The data record of partpositions is then transferred to a storage device, whichquires a finite dead time~typically on the order of tens omilliseconds!, before the process is repeated. The main limtation of DVFM is that the trajectory is ended when thchromophores in the sample are degraded. If each parabsorbs and re-emits an average total ofV photons before itis photobleached, the maximum number of frames collecby the CCD isi CCD;NV/N«5V/«.
In FICS experiments, information is acquired at a fixvalue of k using a single-element detector. In this case,maximum number of time channels that can be sequentirecorded from anN particle sample isi FICS;NV/«5N3 i CCD. Of course, both FICS and DVFM measurementstually measure relatively small fluctuations of the total phtocurrent signal. However, this consideration does not snificantly affect our estimates ofi CCD and i FICS.
To test the principles of FICS, we performed measuments on model systems consisting of monolayer suspsions of rhodamine labeled poly~styrene! spheres~particlediameter,s51 mm) confined between the glass walls ofthin capillary cell. The rhodamine chromophores are renantly excited atlex5532 nm, and their fluorescence is dtected atlem5605 nm. Figure 2~A! displays a digitized fluo-rescence image of a dense colloid suspension with reduareal density,r* 5Ns2/A50.51 (N'4160 particles con-tained by a areaA'7850mm2). The x and y axes are or-thogonal real-space coordinates. The process of transformthe information contained in a sequence of digitized imainto the time-dependent density profile described by E~2.1! is given by a prescription outlined by Crocker and Gr@16#. Figure 2~B! displays a particle trajectory consisting o20 consecutive particle configurations with an interframtime step of 33 msec. The trajectory data indicates that sttural relaxation of local particle environments occur on thtime scale~0.66 sec!. Furthermore, over a range of timscales (0.033 sec,t,16 sec), particles appear to be seggated into two populations; those oscillating withpseudohexagonally ordered local domains, and those ‘‘hping’’ among adjacent sites within stringlike channels@18#.
The spatial information contained in a single digitized image is equivalent to that contained by the Fourier transmation of the spatial particle density@Eq. ~2.1!#,
C~k,t !5E d3r exp~2 ik•r !C~r ,t !, ~2.2!
where C(k,t)5uCu exp@ia# is a complex number. Figure2~C! displays the Fourier transform of the image shownFig. 2~A! multiplied by its complex conjugate, where thexand y axes are orthogonal reciprocal-space coordinateskxandky), and the origin is placed at the center of the fram

a
eons
g.c-l
-
y
te
n-
of
in
e-
ies
nse-
pro-
to
-in
u
imr-
i-ci
m
8248 PRE 62GRASSMAN, KNOWLES, AND MARCUS
This operation, averaged over all thermodynamicallylowed particle configurations, defines thestatic structure fac-tor @14#
S~k!5^C* ~k,t !C~k,t !&. ~2.3!
As mentioned previously, in this work we consider homogneous isotropic fluids, so that the spatial correlation functidefined in this section depend only on the magnitudek5uku and r 5ur u, and not on the directions ofk and r . ThusS(k) is independent of the orientation ofk, and a one-dimensional plot@averaged over the in-plane angle of Fi2~C!# is sufficient to describe its functional form. The struture exhibited byS(k) is indicative of the important spatiafrequencies that make up the image shown in Fig. 2~A!. Thefirst peak inS(k) is most pronounced, and corresponds tovalue of k;2p/Dr , whereDr is the average spacing between neighboring particles in the fluid.
A statistical description of the fluid structure is given bthe static pair distribution function,g(r ), which is the en-semble average probability of finding two particles separaby the distancer. It is obtained fromS(k) by Fourier trans-formation @14#,
g~r !51
~2p!3^C& E d3k exp~ ik•r !@S~k!21#, ~2.4!
FIG. 2. ~A! Fluorescence micrograph of a dense monolayer spension of rhodamine labeled polystyrene spheres~diameter,s51 mm, reduced areal densityr* 5Ns2/A50.51) that are opti-cally excited by a uniform excitation profile.~B! Particle trajectoryconsisting of 20 consecutive configurations with an interframe tstep of 33 msec.~C! Two-dimensional static structure function coresponding to the image shown in~A!. ~D! When the particles areexcited by an interference fringe pattern (dG54.0mm), the result-ing image is composed of a Fourier component withkG52pdG
21,in addition to a band of low-k spatial components. In FICS experments, the fringe pattern is swept across the sample with veloyG and angular frequencyvG5kGyG(550 kHz).
l-
-s
a
d
where^C& is the average fluid density. In principle,g(r ) canbe obtained by numerically Fourier transforming experimetal data provided a sufficiently wide range ofk is sampled.From a practical standpoint, however, measurements ofS(k)are more often compared to the inverse Fourier transformtheoretical models ofg(r ).
Dynamical information about the fluid is containedtime-dependent generalizations ofS(k) @14#. In particular,the intermediate scattering function is the two-point timcorrelation function of the Fourier components,C(k,t),
F~k,t!5^C* ~k,t !C~k,t1t!&, ~2.5!
where the zero-time limitF(k,t50)5S(k). Roughly speak-ing, the decay time ofF(k,t) at a particular value ofk isgiven by t05@D0k2#21, which is the time required for anunhindered particle to diffuse~with diffusion coefficientD0)the distancek21. Figure 3 displays the functionF(k,t), cal-culated from Fourier decomposition of particle trajectoraccording to Eq.~2.5!, for the two-dimensional fluid previ-ously described in Figs. 2~A!, 2~B!, and 2~C!. Relaxations atthe wave numberkmax corresponding to the first peak inS(k)have a complicated multiexponential form. Our observatioof particle trajectories indicate that this multiexponential bhavior results from the presence of spatially segregatedcesses. On the time scale of this measurement~;3 sec!, thereremains a residual correlation of structure atkmax, while nosuch structure persists at higher wave numbers.
The real-space dynamical distribution function, relatedF(k,t), is defined for an isotropic system by@14#
G~r ,t!51
~2p!3 E d3k exp~ ik•r !F~k,t!
5^C~r 8,t !C~r 81r ,t1t!&/^C&. ~2.6!
The van Hove functionG(r ,t) is the microscopic densitydensity time-correlation function previously described
s-
e
ty
FIG. 3. The intermediate scattering function computed froDVFM trajectory data according to Eq.~2.5!, and corresponding tothe dense monolayer colloidal suspension shown in Fig. 2.

th
h
lt
or
t
rm
tgbo
-tsagt
h
inof
rt,
ae
me-
ledten-rn
themsnce
ms
of
i-ser
ialn.
h
illu-o-
atialtua-theinwntsns
ity-
tern
n at
e
to
tioth
PRE 62 8249STRUCTURE AND DYNAMICS OF FLUORESCENTLY . . .
Sec. I. The van Hove function separates into two terms,‘‘self’’ and ‘‘distinct’’ parts: G(r ,t)5GS(r ,t)1Gd(r ,t),where
Gs~r ,t!51
N K (i 51
N
d@r1r i~ t !2r i~ t1t!#L ,
~2.7!
Gd~r ,t!51
N K (iÞ j
N
( d@r1r j~ t !2r i~ t1t!#L ,
with GS(r ,0)5d(r ) and Gd(r ,0)5^C&g(r ). In Figs. 4~A!and 4~B!, we present calculations of the self-part and tdistinct part of the van Hove function, according to Eq.~2.7!,for the same dense colloidal fluid described in Figs. 2 andThe self-part,GS(r ,t), is the time-dependent conditionaprobability density that a particle suffers a displacemenr5ur (t)2r (0)u during a time intervalt1t. From our data wesee thatGS(r ,t) is a single-mode Gaussian distribution fthe shortest t sampled ~33 msec!. For 0.033 sec,t,16 sec, the hopping processes observed in the particlejectory lead to a non-Gaussian tail inGS(r ,t) at large dis-tances, until the distribution regains a Gaussian form fot.16 sec. On this long time scale, the fluid appears dynacally homogeneous. The distinct partGd(r ,t) is the condi-tional probability density of finding a particle at timet1t adistancer away from another particle at timet. The decay ofGd(r ,t) at the value ofr 5r max corresponding to the firspeak ofg(r ), describes the conditional probability of findina pair of particles initially separated by the nearest-neighspacing at this same interparticle separation a timet later.The data shown in Fig. 4~B! indicate that this quantity decays with a multiexponential form. For time incremenlonger thant;2 sec, the nearest-neighbor relaxation appeto plateau indicating a structural retardation on this lenscale. Structural changes corresponding to the second~and
FIG. 4. The self-part and distinct part of the van Hove timspace correlation function@~A! and ~B!, respectively#. Both func-tions are computed from DVFM trajectory data correspondingthe dense monolayer colloidal suspension shown in Fig. 2. Bfunctions are computed according to Eq.~2.7!. The inset in~A!shows the non-Gaussian tails in the self-displacement distribufunctions that result from dynamic heterogeneity occurring onindicated time and length scales.
e
e
3.
ra-
i-
r
rsh
higher order! peaks ofg(r ), however, are arrested on mucshorter time scales (0,t,132 msec).
The detailed real-space distribution functions displayedFig. 4 can, in principle, be obtained by Fourier inversionthe intermediate scattering functionF(k,t). Similarly toG(r ,t),F(k,t) separates into a self-part and a distinct paeach directly related to its real-space counterpart.FS(r ,t)can be measured separately fromF(k,t) by performing ex-periments on ‘‘tagged’’ particles that are surrounded byfluid of ‘‘untagged,’’ but otherwise identical, particles. Wshow below thatF(k,t) @and similarly, FS(k,t)# can bemeasured quite accurately by performing separate tidependent measurements as a function ofk.
B. Fourier imaging correlation spectroscopy
In FICS experiments, the motion of chromophore labespecies is detected as slow fluctuations in fluorescence insity from the intersection of an oscillatory excitation patte~an optically generated grating! with a microscopically het-erogeneous density of chromophores,C(r ,t). In the experi-ments reported here, the excitation pattern is created byphase interference of two linearly polarized laser beabrought to a focus at the sample plane of a fluorescemicroscope. The period of the fringe pattern,dG , depends onthe intersection anglew between the two beams@19#, and canbe varied continuously from tens of microns tolex/2n,
dG5lex
2n sin~w/2!, ~2.8!
wheren ~51.38; see Sec. III B below! is the relative refrac-tive index of the dielectric interface upon which the beaare incident.
Figure 2~D! displays the resulting fluorescence imagethe same dense colloidal suspension shown in Fig. 2~A! afterit is illuminated by an excitation fringe pattern withdG54.0mm. The size of the Gaussian envelope of the illumnated region is determined by the waist of the crossed labeams at their focus,w5100mm. At any instant in time, theoscillatory excitation profile picks out a small set of spatFourier components of the labeled particle distributioThere is a primary component at wave numberkG5ukGu52pdG
21, in addition to auku50 component associated witthe mean fluorescent light level, and a band of small-k con-tributions associated with the Gaussian envelope of theminated region. Temporal fluctuations in the integrated flurescence intensity reflect the growth and decay of the spFourier components represented by the image. Slow fluctions of the chromophore distribution corresponding tosmall-k spatial components arise from particles movingand out of the illuminated sample region, and from slodrifts in the alignment of the laser spots. Other componeof the signal include low frequency mechanical vibratioand detector electronic noise.
Fluctuations of the signal due solely to number densfluctuations at wave numberkG are selectively measured using the lock-in detection method@20#. A frequency generatoris used to modulate the phase of the excitation fringe patfrom 0 to 2p at the angular frequencyvG ~550 kHz!. Thepattern is thus swept across the illuminated sample regio
-
oth
ne
e-th
eeeelc
tion-
red
unnp
eion
o-e
e of
r ofa
ea-the
a-nts
ory
d
r
oron
8250 PRE 62GRASSMAN, KNOWLES, AND MARCUS
a velocity, yG(5vG /kG), greater than that with which aparticle can travel the distance 2pkG
21. The resulting inte-grated fluorescence intensity that emerges from the imagalso modulated at the frequencyvG . A schematic representation of the modulated fluorescence signal, relative tophase of the excitation grating, is shown in Fig. 5~A!. Theillustration shows fluctuations of greatly exaggerated spand amplitude. Because the continuous and periodic swing of the pattern by the distancedG induces the signamodulation, this part of the signal is sensitive to density flutuations on this same length scale. The lock-in detecmethod~explained below! determines the signal modulatioat precisely the frequencyvG , and ignores all signal contributions at other frequencies (vÞvG). Thus all componentsto the signal that are not correlated with the modulation fquency~including noise and density fluctuations corresponing to kÞkG) are excluded from the measurement.
The physical meaning of the modulated signal can bederstood if we consider the total instantaneous fluoresceintensity I G(t), which is proportional to the spatial overlaof the oscillatory excitation profile,I ex(r ), and the time-dependent density of labeled species,C(r ,t):
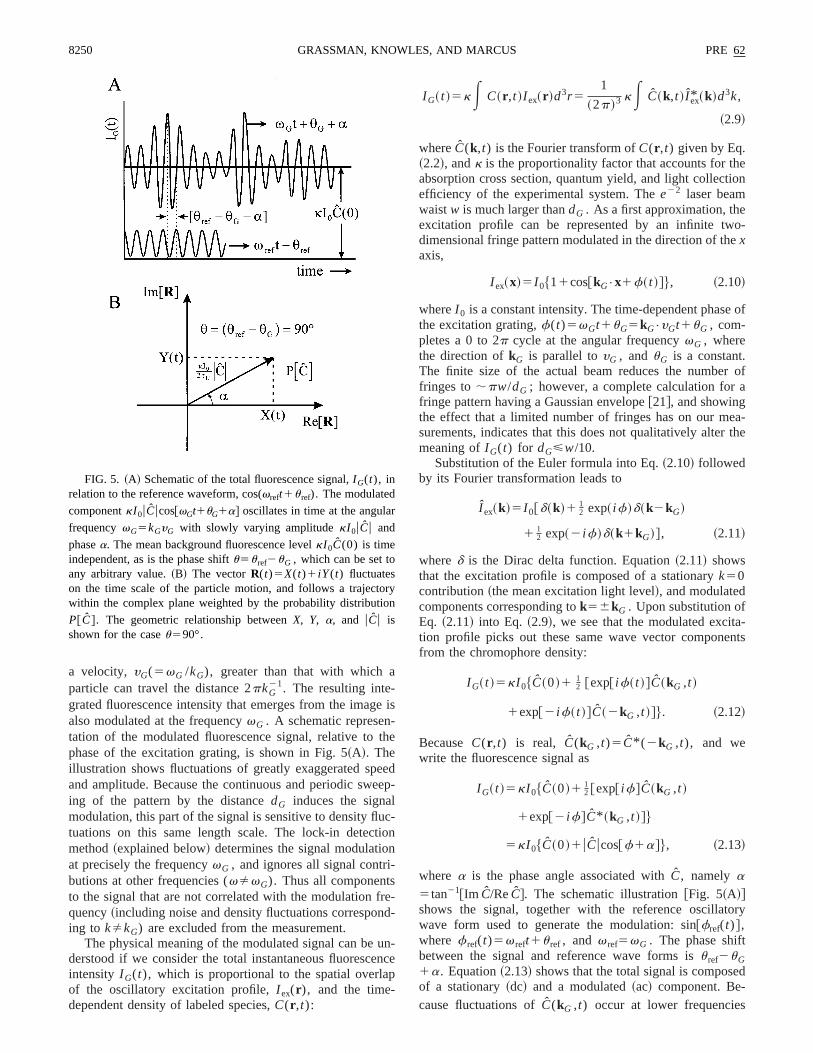
FIG. 5. ~A! Schematic of the total fluorescence signal,I G(t), inrelation to the reference waveform, cos(vreft1u ref). The modulated
componentkI 0uCucos@vGt1uG1a# oscillates in time at the angula
frequencyvG5kGyG with slowly varying amplitudekI 0uCu and
phasea. The mean background fluorescence levelkI 0C(0) is timeindependent, as is the phase shiftu5u ref2uG , which can be set toany arbitrary value.~B! The vectorR(t)5X(t)1 iY(t) fluctuateson the time scale of the particle motion, and follows a trajectwithin the complex plane weighted by the probability distributi
P@C#. The geometric relationship betweenX, Y, a, and uCu isshown for the caseu590°.
is
e
dp-
-n
--
-ce
I G~ t !5kE C~r ,t !I ex~r !d3r 51
~2p!3 kE C~k,t ! I ex* ~k!d3k,
~2.9!
whereC(k,t) is the Fourier transform ofC(r ,t) given by Eq.~2.2!, andk is the proportionality factor that accounts for thabsorption cross section, quantum yield, and light collectefficiency of the experimental system. Thee22 laser beamwaistw is much larger thandG . As a first approximation, theexcitation profile can be represented by an infinite twdimensional fringe pattern modulated in the direction of thxaxis,
I ex~x!5I 0$11cos@kG•x1f~ t !#%, ~2.10!
whereI 0 is a constant intensity. The time-dependent phasthe excitation grating,f(t)5vGt1uG5kG•yGt1uG , com-pletes a 0 to 2p cycle at the angular frequencyvG , wherethe direction ofkG is parallel toyG , anduG is a constant.The finite size of the actual beam reduces the numbefringes to;pw/dG ; however, a complete calculation forfringe pattern having a Gaussian envelope@21#, and showingthe effect that a limited number of fringes has on our msurements, indicates that this does not qualitatively altermeaning ofI G(t) for dG<w/10.
Substitution of the Euler formula into Eq.~2.10! followedby its Fourier transformation leads to
I ex~k!5I 0@d~k!1 12 exp~ if!d~k2kG!
1 12 exp~2 if!d~k1kG!#, ~2.11!
whered is the Dirac delta function. Equation~2.11! showsthat the excitation profile is composed of a stationaryk50contribution~the mean excitation light level!, and modulatedcomponents corresponding tok56kG . Upon substitution ofEq. ~2.11! into Eq. ~2.9!, we see that the modulated excittion profile picks out these same wave vector componefrom the chromophore density:
I G~ t !5kI 0$C~0!1 12 @exp@ if~ t !#C~kG ,t !
1exp@2 if~ t !#C~2kG ,t !#%. ~2.12!
BecauseC(r ,t) is real, C(kG ,t)5C* (2kG ,t), and wewrite the fluorescence signal as
I G~ t !5kI 0$C~0!1 12 @exp@ if#C~kG ,t !
1exp@2 if#C* ~kG ,t !#%
5kI 0$C~0!1uCucos@f1a#%, ~2.13!
where a is the phase angle associated withC, namely a
5tan21@Im C/ReC#. The schematic illustration@Fig. 5~A!#shows the signal, together with the reference oscillatwave form used to generate the modulation: sin@fref(t)#,where f ref(t)5v reft1u ref , and v ref5vG . The phase shiftbetween the signal and reference wave forms isu ref2uG1a. Equation~2.13! shows that the total signal is composeof a stationary~dc! and a modulated~ac! component. Be-cause fluctuations ofC(kG ,t) occur at lower frequencies
y
dutsonaly-to
-
cto
o
heouc
lu
o-
thef
edesert,
uch
po-
s ofe-
nsnts
e
ion
PRE 62 8251STRUCTURE AND DYNAMICS OF FLUORESCENTLY . . .
than the modulation, the lock-in amplifier is used to demolate the signal into slowly varying complex componenX(t) and Y(t), defined by the phase sensitive detectimethod@20#. This is accomplished by multiplying the sign@Eq. ~2.13!# by the reference wave form, shifted b0°@sin(fref)# and 90°@cos(fref)#, respectively, and then employing a low-pass filter. This is operationally equivalentperforming the integrals
X~ t !51
tL1E
2`
t
dsIG~s!sin@f ref~s!#exp@2~ t2s!/tLI #,
~2.14!
Y~ t !51
tLIE
2`
t
ds IG~s!cos@f ref~s!#exp@2~ t2s!/tLI #,
where the lock-in time constant,tLI , and u ref , are experi-mentally adjustable, ands is the dummy variable of integration. Upon substitution of Eq.~2.13! into Eq. ~2.14!, we seethat the integrands contain the products
uCucos@vGs1uG1a#sin@v refs1u ref#,~2.15!
uCucos@vGs1uG1a#cos@v refs1u ref#,
for X(t) and Y(t), respectively. Using the trigonometriidentities, we see that the integrands contain both oscillasum- and difference-frequency terms:
1
2uCu$sin@~vG1v ref!s1uG1u ref1a#
2sin@~vG2v ref!s1uG2u ref1a#%,~2.16!
1
2uCu$cos@~vG1v ref!s1uG1u ref1a#
1cos@~vG2v ref!s1uG2u ref1a#%,
for X(t) and Y(t), respectively. WhentLI is set to a valuemuch smaller than the timescale of the fluctuationsC(kG ,t), the integration described by Eq.~2.14! has the ef-fect of removing all of the time-varying components of tsignal, while the stationary components remain. Sincereference and signal wave forms have the same frequen(vG5v ref), the sum-frequency terms in Eq.~2.16! are re-moved and the difference frequency terms survive. Evation of Eq. ~2.14! leads to
X~ t !5kI 0
2tLI$Re@C#sinu2Im@C#cosu%
5kI 0
2tLIuCusin~u2a!,
~2.17!
Y~ t !5kI 0
2tLI$Re@C#cosu1Im@C#sinu%
5kI 0
2tLIuCucos~u2a!,
-,
ry
f
ries
a-
where the phase shiftu5u ref2uG is the constant~and rela-tively short! time lag associated with the detection of flurescence after it has been emitted from the sample.u can beset to any arbitrary value by adjustingu ref .
Equation~2.17! shows that eachX andY is a function ofthe particle coordinates through its relationship toC(kG ,t),and may therefore be considered a dynamical variable ofN particle system@14#. The real and imaginary parts oC(kG ,t) can be isolated separately inX andY, if u is chosento be an integer multiple of 90° or zero. Since the excitstate lifetime of the rhodamine chromophores used in thstudies are;1029 sec, and the electronic delays are shouG'0. Thus the phase shift can be arbitrarily adjusted sthat u590°. Under these circumstances,X(t)5kI 0 Re@C#/2tLI and Y(t)5kI 0 Im@C#/2tLI . Figure 5~B!shows a schematic representation of the complex comnents of the demodulated signal for the caseu590°. Fluc-tuations of the vectorR(t)@5X(t)1 iY(t)# in the complexplane result as a direct consequence of the fluctuationC(kG ,t). The trajectory ofR can be used to construct thprobability distributionP@C#, and therefore all of the timecorrelation functions associated withC(kG ,t).
The temporal and spatial two-point correlation functioof the complex fluid can be determined from measuremeof X(t) and Y(t) without explicit knowledge of the phasanglesu and a. Using the definition ofF(k,t) @Eq. ~2.5!#and C(kG ,t)5Re@C#1iIm@C#,
F~k,t!5^Re@C~k,t !#Re@C~k,t1t!#&
1^Im@C~k,t !#Im@C~k,t1t!#&. ~2.18!
In Eq. ~2.18!, we have used the fact that the functionC(k,t)has the property of even time-reversal symmetry@14#. Thetime-correlation function of the dynamical variableX(t) @Eq.~2.17!# has the form
^X~ t !X~ t1t!&5k2I 0
2
4tLI2 ^$Re@C~k,t !#Re@C~k,t1t!#sin2 u
1Im@C~k,t !#Im@C~k,t1t!#cos2 u%&.
~2.19!
A similar expression describes the time-correlation functfor the variableY(t):
^Y~ t !Y~ t1t!&5k2I 0
2
4tLI2 ^$Re@C~k,t !#Re@C~k,t1t!#cos2 u
1Im@C~k,t !#Im@C~k,t1t!#sin2 u%&.
~2.20!
Comparison of Eqs.~2.18!, ~2.19!, and~2.20! shows that
F~k,t!54tLI
2
k2I 02 $^X~ t !X~ t1t!&1^Y~ t !Y~ t1t!&%.
~2.21!

ar
taide
sethrns, aele
ah
ed
h
ictetw
side
rehe
ed
-
ffi-d
al-
asetal
sityed
ing
theig-
n
ac-re-er-
intotalceder-W
edrs
mea-
nataea-the
on
8252 PRE 62GRASSMAN, KNOWLES, AND MARCUS
Thus an analysis of the trajectories of the dynamical vablesX and Y via Eq. ~2.21! provide a direct route to theintermediate scattering function, which is a fundamenquantity of interest to the theoretical description of liqustate dynamics. The static structure function is simply tht50 limit of Eq. ~2.21!:
S~k!54tLI
2
k2I 02 $^X2&1^Y2&%. ~2.22!
III. EXPERIMENTAL SYSTEM
A. Instrumentation
In Fig. 6 we show a schematic of the FICS apparatus uin our studies. The instrument is designed to operate in eidirect visualization or FICS mode. The sample chambe~acapillary cell used to prepare thin-film colloidal suspensio!is held at the sample plane of a fluorescence microscopeplaced at the focus of two intersecting laser beams. Thecitation source is the continuous wave frequency douboutput of a Spectra Physics Nd:YAG~yttrium aluminum gar-net! laser (lex5532 nm); its output power~measured justbefore sample incidence! is typically set below 0.1 mW tominimize photodegradation during data acquisition~;1min!. The laser beam is divided into two optical paths byFresnel-rhomb prism and a polarizing beam splitter. TtransmittedS-polarization component of the beam is rotat90° using a periscope to match theP polarization of thereflected beam. The transmitted beam is passed througelectro-optic phase modulator~Conoptics!, and then focusedonto the sample using a long focal length lens (f 540 cm).The second beam is reflected by a corner cube mirror, whis mounted onto a translation stage, before it is directhrough an identical lens to the sample chamber. The
FIG. 6. Schematic illustration of the Fourier imaging correlatispectroscopy~FICS! apparatus. See text for explanation.
i-
l
der
ndx-d
e
an
hdo
beams produce an intensity interference fringe pattern inthe sample, with adjustable spatial perioddG , as describedby Eq. ~2.10!.
The modulated fluorescence signalI G(t) is collected us-ing a fused silica oil-immersion objective~Leica, Plan Fluo-tar, 1003, Na51.3) and eyepiece~Zeiss, 53!. The imagedepth-of-field is limited by placing an adjustable apertu~;50 mm! at the focal plane conjugate to the sample. Tsignal is coupled into a multimode optical fiber~3M!. Theemission from the transmitting end of the fiber is imagonto a thermoelectrically cooled photomultiplier tube~PMT,Hamamatsu, R3896! operating in current mode after filtration by an interference band-pass filter~CVI Laser, centralwavelength 605 nm, bandwidth 10 nm, transmission eciency 90%! and an excitation barrier filter. The modulatesignal output of the PMT is detected using a digital duphase lock-in amplifier~Stanford Research Systems! that isreferenced to the signal wave form used to drive the phmodulator. A computer, which controls an analog-to-digidata acquisition board~National Instruments!, separatelyrecords ~i! the average background fluorescence intenkI 0C(0), ~ii ! the complex components of the demodulatsignal,X(t) andY(t); and ~iii ! the laser excitation power.
In practice, the mean fluorescence intensity, after becorrected for drifts in laser power~less than61%!, is used tonormalize the demodulated signal, effectively removinginfluence of photodegradation. The ability to detect this snal is determined by the signal-to-background ratio,S/B,defined by
S
B5
kI 0^C2&1/2
kI 0C~0!5
$^X2&1^Y2&%1/2
kI 0C~0!5F1
2VC~0!G21/2
,
~3.1!
where V is the excitation volume. In our experiments odense colloid suspensions (r* 50.52)V>9400mm3 andC(0)>0.45 particles/mm3, so thatS/B;0.02. Typically, foreach experiment, 32 000 data points are collected at anquisition frequency of 512 Hz. Individual data sets arepeated;10 times, cross-checked for consistency, and avaged together. Under these conditions we foundS/B;2%.The extent of photodegradation over the duration of a 10-mtest measurement represents less than 1% loss of thefluorescence signal. To determine the effects of laser induphotodamage on our measurements we perform powdependent studies. Laser excitation intensities up to 10 mresult in identical autocorrelation functions to those obtainusing 0.1 mW. Thus, at the relatively low excitation poweused in these studies, photodamage does not affect oursurements of colloidal thin-film dynamics.
Time-correlation functions of theX andY trajectories arecomputed by averaging overtmax time origins according to
^A~ t !A~ t1t!&51
tmax(
t051
tmax
A~ t0!A~ t01t!, ~3.2!
where A5X,Y. Averages of the resulting autocorrelatiofunctions are constructed from at least ten individual dsets. The decay time of the autocorrelation function is a msure of the time required for a labeled particle to move

ffraez20
ic
rie
latereledndt o
ize0o
s-li-pee
s-ed
rre
peeb
ro
een
ged,
plero-
nc.icles
ter
nst
le
ur
py
enternceather-
l-o-
themar-ife-
ne-
n-assdinetheo-
eeasshis
llydiess
mpen-ese
thr-
r-
PRE 62 8253STRUCTURE AND DYNAMICS OF FLUORESCENTLY . . .
distancekG21. The upper limit to the temporal resolution o
FICS measurements is determined by the modulationquency. Essentially ten cycles of the reference oscillatornecessary to determine a single data point. For the expments presented here, a modulation frequency of 50 kHused, corresponding to an instrument time resolution ofmsec.
When running in direct visualization mode, microscopinformation is obtained by recording sequenced imagesthe sample plane via DVFM. This allows a direct compason to be made between the time-correlation functions msured by the FICS method and the same quantities calcufrom the microscopic particle trajectories via statistical mchanics@15,17,22#. Fluorescence images of the sample acollected using a charge-coupled device digital video cam~Cohu, Inc.!. The frame speed of the CCD is adjustabimages are acquired at a rate ranging between 10 ansec21. The shutter speed of the CCD is 1/100 of a secoThe analog camera output is sent directly to the video pora Silicon Graphics Indy~SGI! workstation. The SGI framegrabber supplied with the workstation is used to digit6403480 square pixel frames. A typical run consists of 12frames in sequence, corresponding to roughly 60 Mbytedata. Image processing procedures are implemented uIDL ~Research Systems, Inc.!, a programming language optimized for visual data analysis. The pixel length is cabrated by imaging a transmission electron microsco~TEM! grid of known scale. The aspect ratio was determinto be 160.1 and the calibrated pixel dimension was 1pix50.111160.0015mm. The inset in Fig. 6 shows a fluorecence image of a typical particle configuration illuminatby a stationary excitation fringe pattern withdG54.0mm.To assess the accuracy of our pixel calibration, we compaDVFM measurements of the fringe spacing with the corsponding values obtained using Eq.~2.8!. The results ofthese measurements are shown in Fig. 7. The two indedent measurements ofdG are in excellent agreement, and wcan therefore compare the FICS method’s ability to prodensity fluctuations of known spatial scale to known micscopic information.
FIG. 7. Calibration curve showing the relationship betweenfringe spacingdG of the excitation grating and the angle of intesection w between the two incident laser beams. Comparisonmade between the values ofdG obtained from the measured intesection angles@calculated using Eq.~2.8!, and shown as the solidline# and digital video analysis of grating images~filled circles! likethat shown in the inset of Fig. 6.
e-reri-is0
of-a-ed-era;30.f
0f
ing
edl
ed-
n-
e-
B. Sample preparation
The system we have studied consists of 1-mm-diameterrhodamine labeled polystyrene particles confined betwthe closely spaced walls of an adjustable capillary cell~;1.5mm!. Because the particles surfaces are negatively charparticle-particle interactions~and sample behavior! isstrongly sensitive to counterion concentration and sampreparation conditions. For this reason, we employ a repducible and consistent sample preparation protocol.
Colloid samples are obtained from Molecular Probes, Ias aqueous suspensions containing 2% solids. The partare washed free of any surfactant impurities by dialysis~twodays! followed by repeated sedimentation in purified wa~Nanopure system, 18 MW, with a 0.2-mm filter!. The par-ticles are then resuspended in aqueous 20-mM sodium decylsulfide ~an ionic surfactant to stabilize the particles agaiaggregation! and 100-mM sodium azide~an antibiotic to pre-vent microorganisms from proliferating inside the sampchamber!.
A schematic diagram of the capillary cell used in oexperiments is shown in Figs. 8~A! and 8~B!. A glass win-dow ~1/8-in. thickness! and No. 1 microscope cover sli~0.18-mm thickness! are held a fixed distance apart bspring-loaded stainless steel plates. The laser beamsthrough an aperture in the top plate, while the fluorescesignal is collected by a microscope objective held benethe bottom plate. The glass surfaces are cleaned by immsion in 1-M HCl followed by treatment with an octadecysilicone coating~Glassclad 18, United Chemical Technolgies, Inc.!. A small quantity of colloid suspension~;50–75mL! is placed into the sample reservoir whose bottom isglass coverslip. A narrow strip of closed-cell PVC foa~McMaster-Carr! serves as a compressible water-tight brier, preventing solvent evaporation during the average ltime of a sample~;5 days!. The glass window is slowlylowered into the sample reservoir by retracting three kimatically mounted motorized micrometers~Picomotor, NewFocus, Inc.!. The micrometers are remotely and indepedently adjusted until the inner wall spacing between the glwindow and coverslip reach;1.5mm. Samples are observeby running the instrument in visualization mode to determif a monolayer suspension is formed. This is true whenparticle centers clearly lie in a plane, and out-of-plane mtion is suppressed.
The relative refractive index of the dielectric interfac@used in Eq.~2.8!# for this thin-film geometry is an averagthat accounts for the octadecyl coating at the inner glsurface and the presence of the colloid suspension. Tvalue for n(51.385) was previously used to successfudescribe evanescent wave dynamic light scattering stuperformed on similarly prepared thin-film colloid system@17#.
IV. RESULTS AND DISCUSSION
In Fig. 9~A! we show a typical raw data set taken froFICS measurements performed on dilute monolayer sussions (r* 50.02) of Rhodamine labeled colloidal spherwith dG51.0mm. At low density, the mean interparticlseparation is large,@L5(r* /s2)21/2;7.1mm#, and the sys-
e
is

ntsrimle
ic
gng
su
m
h-
re-th
ed
fo
dhte
m-itan
asion
re
Linerity.
tedgr-cesticlesian
nts
s toons
8254 PRE 62GRASSMAN, KNOWLES, AND MARCUS
tem behaves like a superposition of non-interacting Browian particles fordG,L. The signal trajectory shown consisof 2000 sequential points each separated by 2 msec. Fopurpose of clarity, line segments connecting adjacent tpoints have been omitted. We observe that the phase angaspans the entire range between zero and 2p. Furthermore, thestatic distribution is well fit to a two-dimensional symmetrGaussian function of theX and Y coordinates. Table I liststhe second moments of Gaussian fits to data correspondinexperiments performed at successively increasing frispacings. We note that the distributions are [email protected].,^X2&>^Y2&# and thatS(k)}^X2&1^Y2&, according to Eq.~2.22!, is independent of the fringe spacing fors<dG<L.We can see that this is an expected result for a dilutepension of particles if we consider the form forS(k) written
FIG. 8. Schematic diagram of the experimental capillary cellthin-film colloidal suspensions.~A! Top view. ~B! Side view. Aglass window and a glass microscope coverslip are mountespring-loaded, parallel, stainless steel plates; their surfaces area fixed distance apart. Motorized micrometers are used to remocontrol the inner wall spacing with submicron precision. A copressible water-tight barrier prevents solvent evaporation. Exction beams enter through the top of the cell, while fluorescencetransmitted excitation is collected with a microscope objective~notshown! at the bottom.
-
thee
toe
s-
as an explicit function of particle positions that follows frosubstitution of Eqs.~2.1! and ~2.2! into Eq. ~2.3! @3#:
S~k!5N21(i
(j
^exp@ ik•~r i2r j !#&. ~4.1!
Since all of our measurements are in the microscopic higkregime (kL@1), the cross terms in Eq.~4.1! do not contrib-ute to the overall sum leaving only the self-terms. Thissults in S(k)51 for a dilute suspension, in agreement wiour observations.
In Fig. 9~B! we show calculations@according to Eq.~2.21!# of the intermediate scattering function construct
r
toeldly
a-d
FIG. 9. ~A! Demodulated fluorescence trajectory taken fromFICS measurement performed on a dilute monolayer suspen(r* 50.02) of rhodamine B labeled colloidal spheres (s51 mm),with dG51.0mm. The phase shiftu5u ref2uG has been adjusted to90°, so that theX andY components of the demodulated signal a
proportional to the real and imaginary parts ofC, respectively.2000 sequential points, each separated by 2 msec, are shown.segments connecting adjacent points have been omitted for cla
The stationary distribution of points defines the probabilityP@C#from which spatial and temporal correlation functions are calcula@Eqs.~2.21! and~2.22!#. ~B! The normalized intermediate scatterinfunction, F(k,t)/S(k), calculated from FICS measurements peformed at five different fringe spacings corresponding to distansmaller than the average separation between neighboring par(L57.2mm). The data are single exponential in time and Gaussin k. Solid lines are plots of Eq.~4.4! with DS50.3mm2 sec21.
TABLE I. Gaussian fit parameters for fluctuation measureme
of P@C# for a dilute monolayer colloid suspension (r* 50.02).Amplitudes and inverse time constants of single-exponential fitthe corresponding normalized intermediate scattering functi@F(k,t)/S(k)5A0 exp(2b0t)#.
Fringe spacing,dG(mm)
Wave number,kG(mm21)
^X2&~V!
^Y2&~V! A0 b0(sec21)
0.99 6.34 1.36 1.35 0.96 12.11.03 6.10 1.48 1.49 1.02 11.21.26 4.99 2.06 2.09 1.03 7.41.62 3.88 1.63 1.58 1.01 4.41.96 3.21 1.72 1.68 1.02 3.0

ekeut
Es
t-
cstoisom
inith
t
a
ithm
teayn
nav
e
trathr
he-te
’’ll
entsto
ve.
er-
there-Fig.nd
re-
ensi-se
theflu-
als,and
cleCSro-
hanter-lyom-
nts
f
PRE 62 8255STRUCTURE AND DYNAMICS OF FLUORESCENTLY . . .
from five of the trajectory data sets listed in Table I. Unddilute conditions, the intermediate scattering function taon a simplified form that can be understood if we substitEqs. ~2.1! and ~2.2! into Eq. ~2.5!, and writeF(k,t) as anexplicit function of particles positions:
F~k,t!5N21(i
(j
^exp$ ik•@r i~ t !2r j~ t1t!#%&.
~4.2!
For the same reason as explained in our treatment of~4.1!, the conditionkL@1 implies that only the self-termcontribute to Eq.~4.2!, which reduces to@2#
FS~k,t!5^exp$ ik•@r ~ t !2r ~ t1t!#%&. ~4.3!
In Eq. ~4.3!, FS(k,t) is the self-part of the intermediate scatering function. Equation~4.3! is further simplified by mak-ing use of the Gaussian model for single particle motion@2#.The Gaussian model makes use of the fact that the time sassociated with observation of the particle displacementlarge compared to the relaxation time of the velocity aucorrelation function of the local particle positions. In thcase,@r (t)2r (t1t)# may be treated as a Gaussian randvariable that leads Eq.~4.3! to take the following form fortwo dimensions:
FS~k,t!5exp@2k2Dst#, ~4.4!
whereDS is the self-diffusion coefficient. The data shownFig. 9~B! decay in time as a single exponential and wwave number as a Gaussian, in precise agreement withtheoretical prediction. The solid lines in Fig. 9~B! correspondto Eq.~4.4!, with DS5331029 cm2 sec21. This value for theself-diffusion coefficient is in excellent agreement with thof the free diffusion coefficient,D050.707kBT/6pha53.131029, calculated from the Stokes-Einstein equation wthe necessary correction to account for the hydrodynafriction due to the effect of the cell walls@23#.
When measurements are performed on a dense systhe dynamics are complicated by multi-exponential decthat vary withk. Figure 10~A! displays a direct comparisoof F(k,t)/S(k) determined from FICS data~solid curves!and from DVFM data~circles! as a function of time for thesame dense monolayer colloidal suspension (r* 50.51) pre-viously described in Figs. 2, 3, and 4. FICS measuremewere performed on this system at several different wnumbers, and are listed in Table II. In Fig. 10~A!, decays areshown for three different wave numbers. The FICS data wconstructed according to Eq.~2.21!, while the microscopydata were calculated by Fourier inversion of the particlejectories as described in Sec. II A. Agreement betweentwo independent measurements of the intermediate scattefunction is excellent. For the highest value ofk shown (dG50.86mm), the decay is nearly single exponential. As twave number is decreased~or with decreasing fringe spacing! the decays begin to exhibit multiexponential characThis result is consistent with the interpretation that thedG50.86mm measurement is primarily sensitive to the ‘‘freemotion experienced by particles before they undergo co
rse
q.
aleis-
he
t
ic
m,s
tse
re
-e
ing
r.
i-
sions with their nearest neighbors, while the measuremcorresponding to larger fringe spacings are sensitiveparticle-particle interactions.
Figure 10~B! displays a direct comparison ofS(k) deter-mined from FICS data~filled circles! and from DVFM data~solid curves! for the same dense sample described aboThe FICS data were constructed according to Eq.~2.22!,while the microscopy data were calculated by Fourier invsion of the particle positions according to Eq.~2.3!. Agree-ment between the two independent measurements ofstatic structure factor is very good. The data points corsponding to the three time-dependent decays shown in10~A! is also indicated. We note that the nonexponential arelatively slow relaxation atkG56.4mm21 corresponds to awave number near the first peak ofS(k). Our previous ob-servations using video microscopy~Figs. 2–4! indicate thatthe relaxations for this system are highly complex andtarded near the peak ofS(k). The results shown in Fig. 10demonstrate that our FICS measurements are equally stive to the dynamical and structural behavior of this denquasi-two-dimensional fluid.
V. CONCLUSIONS
We have presented an experimental approach to studystructure and dynamics of fluorescently labeled complexids. Fourier imaging correlation spectroscopy~FICS! isbased on the detection of modulated fluorescence signand measures temporal fluctuations of both the phaseamplitude of a spatial Fourier component of the partinumber density. The phase and amplitude sensitivity of FIarises from the sweeping of a patterned photo-excitation pfile across the particle density at a much greater velocity tthe speed at which an average particle can travel the infringe spacing. The ability of the FICS method to directprobe both phase and amplitude of the complex Fourier c
FIG. 10. Comparison between FICS and DVFM measuremeperformed on a dense monolayer suspension (r* 50.51). ~A! Thenormalized intermediate scattering functionF(k,t)/S(k) is calcu-lated according to Eq.~2.21! for the FICS data~solid curves!. TheDVFM data ~open circles! are produced by Fourier inversion oparticle trajectories as described in Sec. II A.~B! The static struc-ture functionS(k) is calculated according to Eq.~2.22! for the FICSdata~filled circles!, while the DVFM data~solid curve! are calcu-lated by Fourier inversion of the particle coordinates.

rthe
8256 PRE 62GRASSMAN, KNOWLES, AND MARCUS
TABLE II. Gaussian fit parameters for fluctuation measurements ofP@C# for a concentrated monolayecolloid suspension (r* 50.52). Amplitudes and inverse time constants of double-exponential fits tocorresponding normalized intermediate scattering functions@F(k,t)/S(k)5A0 exp(2b0t)1A1 exp(2b1t)#.
Fringespacing,dG~mm!
Wavenumber,kG
~mm21!^X2&~V!
^Y2&~V! A0
b0
~sec21! A1
b1
~sec21!
0.87 7.22 1.31 1.32 0.13 2.33 0.77 5.610.90 6.96 1.68 1.66 0.66 3.28 0.23 16.60.98 6.42 2.17 2.15 0.45 2.26 0.46 8.411.08 5.82 1.98 1.97 0.52 2.46 0.43 8.231.12 5.61 1.26 1.25 0.50 3.05 0.44 9.781.37 4.57 1.14 1.16 0.52 3.07 0.45 8.401.50 4.19 0.85 0.82 0.49 2.54 0.47 8.57
ecoena-.
gtivudyaresdtte
irtatamatid
ri-ut
oe
esthere
-fu
aniooC
inrm
ri-g toom-ered.
y’’mer
atethe
intheter-sere-
le,ficle
est-in
er
mi-nalinattheandilythee.n-
nc-ncee to
, anto
as-ec-uley
ponent is similar in spirit to dynamic light scattering~DLS!experiments in which heterodyne optical mixing techniquare employed to measure the scattered electric field-fieldrelation function@2#. Although we do not make use of thphase information obtained in the measurements presehere, FICS measurements performed simultaneously at mvalues ofk yield, in principle, all of the necessary information to determine the time-dependent microscopic densityclear advantage of the FICS method over light scatterinthe promising application of an ultrasensitive phase-selecdetection method to study systems that readily fluoresceder optical excitation. Thus, FICS is ideally suited to stusystems under low-signal conditions. Although the most eily realized experiments are carried out at visible optical fquencies, analogous studies at much higher frequenciepossible. Furthermore, the FICS method may be extendestudy excited state polarization, adsorption, Raman scaing, two-photon fluorescence, and four-wave mixing.
In comparison to direct visualization methods to acquthe same information, FICS experiments have both imporadvantages and limitations. While microscopy simulneously records information on all spatial scales with a liited dynamic range, FICS measures spatial informationsingle wave number at a time, and over a comparatively wdynamic range (1028– 102 sec). In essence, imaging expements are many single-particle measurements carried oparallel, while FICS experiments probe the time coursecollective fluctuations from anN-body system. Because thlength of a fluorescence trajectory from anN-body system islimited by photobleaching, the FICS method can accmuch longer time series by making more efficient use ofavailable photons emitted from the sample. Imaging expments are capable of providing the real-space timdependent density,C(r ,t). It is straightforward, although numerically intensive, to calculate the statistically meaningtime and space distribution functions fromC(r ,t). We havefocused on the van Hove correlation functionG(r ,t) as afundamental characterization of real-space distributions,its Fourier transform—the intermediate scattering functF(k,t)—for reciprocal-space distributions. These same crelation functions are measured equally well using the FImethod, with its superior dynamic range.
In spite of the advantages of FICS to probe two-pospatial and temporal distributions of complex fluids, theremains an important limitation to this approach when co
sr-
tedny
Aisen-
s--aretor-
ent--ae
inf
sei--
l
dnr-S
te-
pared to direct visualization techniques. Microscopy expements reveal information about the system correspondinall spatial scales at one instant in time. In many dense cplex fluids, there exist temporal and spatial regimes whthe motions of neighboring particles are highly correlateThis gives rise to the so-called ‘‘dynamic heterogeneitoften observed in densely crowded systems such as polymelts @24#, colloid suspension@18#, and supercooled fluids@25#. When experimentally probed on these intermeditime and length scales, the system appears to not satisfycondition of ergodicity. That is, constituent particles existmore than one local environment, or dynamical state, andmembers of these separate populations do not readily inconvert. The superposition of dynamical behavior from theseparate populations results in complex nonexponentiallaxations of the time-correlation functions. As an exampwe refer to Fig. 2~B!, in which the dynamic heterogeneity othe system we have studied is apparent from the parttrajectory~see the discussion in Sec. II A!. Since the ‘‘hop-ping’’ processes occur on the length scale of the nearneighbor spacing, the resulting nonexponential relaxationthe functionF(k,t) is most pronounced at the wave numbkmax, corresponding to this spatial frequency~see Fig. 3!.Nevertheless, it is not possible to infer the detailed dynacal picture conveyed by microscopy data from the functioform of F(k,t) alone. Variations of the FICS approach,which spatial information is simultaneously determinedmore than one wave number at a time, should providenecessary information to compute higher-order spatialtemporal distribution functions. Such information may easidentify the signatures of dynamic heterogeneity withoutnecessity of measuring the full spatial distribution at onc
The FICS method’s ability to accurately characterize noexponential relaxations of the intermediate scattering fution is an important advantage over alternate fluorescedetection methods. The closest comparison can be madfluorescence recovery after photobleaching~FRAP! wherefor the case of a patterned photoexcitation bleach pulseartificially imposed spatial heterogeneity is introduced inthe system as an initial condition@10#. The relaxation of thebleached pattern is subsequently read out and analyzedsuming a diffusive transport model to determine the colltive diffusion coefficient. FRAP experiments are powerffor the determination of transport coefficients; however, thare not capable of determiningF(k,t) and S(k), since the

gw
ntya
io-o
ci-
tion-ct.ner,ns.
PRE 62 8257STRUCTURE AND DYNAMICS OF FLUORESCENTLY . . .
Fourier components corresponding to the natural lenscales of the system are not directly measured. Thus,expect the FICS approach to provide useful experimeinformation about the spatial and temporal scaling of dnamical properties for systems that have not been amento study by other methods.
Because of its low excitation power requirements, FICSideally suited for studying the dynamics of intracellular mtion. We have recently applied FICS to study the detailsmitochondrial translocation in live cells@15#.
e,
su
,
xiele
.
uix
the
al-ble
s
f
ACKNOWLEDGMENTS
This work was supported by grants from the National Sence Foundation~Nos. CHE-9876334 and CHE-9808049!,the M. J. Murdock Charitable Trust~No. 98181! and theAmerican Chemical Society Petroleum Research Founda~No. 34285-G7!. We thank Dr. Mark E. Schmidt for his scientific contributions during the initial stages of this projeWe also thank Robert Mazo, Stephen Gregory, John ToJeff Cina, and Marina Guenza for many useful discussio
-
J.
,
C..
C.
-
ev.
-
m.
@1# P. M. Chaikin and T. C. Lubensky,Principles of CondensedMatter Physics ~Cambridge University Press, Cambridg1995!.
@2# B. J. Berne and R. Pecora,Dynamic Light Scattering~Krieger,Malabar, 1976!.
@3# P. N. Pusey and R. J. A. Tough, inDynamic Light Scattering:Applications of Photon Correlation Spectroscopy, edited by R.Pecora~Plenum, New York, 1985!.
@4# There are a number of excellent articles that discuss thisject in the two volume series entitledLiquids, Freezing and theGlass Transition, Les Houches 1989, edited by J. P. HansenD. Levesque and J. Zinn-Justin~Elsevier, Amsterdam, 1989!.
@5# S. Granick, Phys. Today52 ~7!, 26 ~1999!.@6# X. S. Xie and J. K. Trautman, Annu. Rev. Phys. Chem.49, 441
~1998!.@7# D. Magde, E. L. Elson, and W. W. Webb, Phys. Rev. Lett.29,
705 ~1972!; E. L. Elson and D. Magde, Biopolymers13, 1~1974!; D. Magde, E. L. Elson, and W. W. Webb,ibid. 13, 29~1974!.
@8# For a review, see N. L. Thompson inTopics in FluorescenceSpectroscopy, Vol. I: Techniques, edited by J. R. Lakowicz~Plenum, New York, 1991!, and references therein.
@9# Most commercial digital CCD cameras are limited to a mamum frame acquisition rate of;30 Hz. Intensified cameras arcapable of KHz acquisition frequencies, but require sampwith high signal intensities.
@10# J. Davoust, P. F. Devaux, and L. Leger, EMBO J.1, 1233~1982!.
@11# R. L. Hanson, X. R. Zhu, and J. M. Harris, Anal. Chem.70,1281 ~1998!.
@12# M. Hattori, H. Shimizu, and H. Yokoyama, Rev. Sci. Instrum67, 4064~1996!.
@13# This point is often used to justify the central problems of eqlibrium and nonequilibrium statistical mechanics. See for e
b-
-
s
--
ample, T. L. Hill, Statistical Mechanics: Principles and Selected Applications~Dover, New York, 1987!, p. 2.
@14# J. P. Hansen and I. R. McDonald,Theory of Simple Liquids~Academic, London, 1986!.
@15# D. Margineantu, R. A. Capaldi, and A. H. Marcus, Biophys.79, 1833~2000!.
@16# J. Crocker and D. G. Grier, J. Colloid Interface Sci.179, 298~1996!.
@17# A. H. Marcus, B. Lin, and S. A. Rice, Phys. Rev. E53, 1765~1996!.
@18# A. H. Marcus, J. Schofield, and S. A. Rice, Phys. Rev. E60,5725 ~1999!; W. Kob, C. Donati, S. J. Plimpton, P. H. Pooleand S. C. Glotzer, Phys. Rev. Lett.79, 2827~1997!; C. Donati,J. F. Douglas, W. Kob, S. J. Plimpton, P. H. Poole, and S.Glotzer,ibid. 80, 2338~1998!; E. R. Weeks, J. C. Crocker, AC. Levitt, A. Schofield, and D. A. Weitz, Science287, 627~2000!; W. K. Kegel and A. von Blaaderen,ibid. 287, 290~2000!; T. B. Schroder, S. Sastry, J. C. Dyre, and S.Glotzer, J. Chem. Phys.112, 9834 ~2000!; B. Doliwa and A.Heuer, Phys. Rev. E61, 6898~2000!.
@19# G. R. Fleming,Chemical Applications of Ultrafast Spectroscopy ~Oxford University Press, New York, 1986!.
@20# P. Horowitz and W. Hill,The Art of Electronics~CambridgeUniversity Press, New York, 1986!.
@21# K. V. Adair, P. Tekavec, and A. H. Marcus~unpublished!.@22# M. K. Knowles, T. J. Grassman, and A. H. Marcus, Phys. R
Lett. 85, 2837~2000!.@23# J. Happel and H. Brenner,Low Reynold’s Number Hydrody
namics~Kluwer, Dordrecht, 1963!.@24# M. T. Cicerone and M. D. Ediger, J. Chem. Phys.104, 7210
~1996!; 103, 5684~1995!.@25# M. D. Ediger, C. A. Angell, and S. R. Nagel, J. Phys. Che
100, 13 200~1996!.


![Biologically stable [18F]-labeled benzylfluoride derivatives](https://img.pdfslide.net/doc/110x75/634b0a65e2b881b8bf01abb5/biologically-stable-18f-labeled-benzylfluoride-derivatives.jpg)


