Embed Size (px)
Citation preview
Technical Assistance Consultant’s Report
This consultant’s report does not necessarily reflect the views of ADB or the Government concerned, and ADB and the Government cannot be held liable for its contents. (For project preparatory technical assistance: All the views expressed herein may not be incorporated into the proposed project’s design.
PUBLIC
Project Number: 51031-001 May 2022
People’s Republic of China: Study of Clean Energy Supply for the Rural Areas in the Greater Beijing–Tianjin–Hebei Region
Prepared by Consultant Team
Team leader: Fang Fang
For Ministry of Agriculture and Rural Affairs

CURRENCY EQUIVALENTS (as of 18 April 2022)
Currency Unit – yuan (CNY)CNY1.00 = $0.157
$1.00 = CNY6.372
ABBREVIATIONS
ADB – Asian Development BankBTH – Beijing–Tianjin–HebeiCO2 – carbon dioxidePRC – People’s Republic of ChinaMARA – Ministry of Agriculture and Rural AffairsNOx – nitrogen oxideTA – technical assistanceSO2 – sulfur dioxide
NOTE (i) In this report, "$" refers to US dollars.

CONTENTS Page
I. Executive Summary .................................................................................................................................. 1
II. Overview ..................................................................................................................................................... 4
A. Project Details ................................................................................................................................................ 4
B. Rationality and scope .................................................................................................................................... 4
C. Expected impact, outcome and output ....................................................................................................... 5
III. Implementation .......................................................................................................................................... 6
A. Inception phase .............................................................................................................................................. 6
1. Activities ...................................................................................................................................................... 6
2. Research results ........................................................................................................................................ 6
3. Outcome ..................................................................................................................................................... 7
B. Baseline survey phase .................................................................................................................................. 8
1. Activities ...................................................................................................................................................... 8
2. Research results ........................................................................................................................................ 8
3. Outcome ..................................................................................................................................................... 9
C. Final report development phase .................................................................................................................. 9
1. Activities ...................................................................................................................................................... 9
2. Research results ...................................................................................................................................... 11
IV. Conclusion ............................................................................................................................................... 13
A. Project Output ............................................................................................................................................. 13
B. Outcomes and impacts ............................................................................................................................... 13
Annexes ............................................................................................................................................................ 15
Annex 1: Rural Energy Consumption Status and Structure Analysis in Greater Beijing–Tianjin–Hebei Region
Annex 2: Study Report on Clean Energy Supply for Rural Areas in the Greater Beijing–Tianjin–Hebei Region

1
I. EXECUTIVE SUMMARY
1. The greater Beijing–Tianjin–Hebei (BTH) region as a major metropolitan area representsone of the three strongest growth poles in the national economy. It includes eight provinces, citiesand autonomous regions. These are Beijing, Tianjin, Hebei, Henan, Liaoning, Shandong, Shanxiand Inner Mongolia. It has a land area accounting to more than 10% of the national total, an arableland about 25% of the national total and a population more than 25% of the national total. It isalso grappling with the most serious air pollution in the country. In addition, 45% of its populationare living in the rural areas, significantly higher than the national average. Historically, local ruralresidents have used “scattered coals” (or “loose coals”, in Chinese “Sanmei” referring to coalsused for small boilers, domestic heating, hotels or restaurants instead of power plants or otherindustrial users) for cooking and heating and thus contributed to serious air pollution and broughtsubstantial stress on the local ecosystem and public health. As the greater BTH region is highlyrelevant to the core issue that the People’s Republic of China (PRC) is grappling with andrepresentative of the serious situation, the project selects the greater BTH region in the researchof energy consumption structure and consumer behaviors. The Project impacts are hugelypossible to scale up across the country.
2. This project was initiated under the cooperation framework of the Ministry of Agricultureand Rural Affairs (MARA) and the Asian Development Bank (ADB), and is implemented by theRural Energy and Environment Agency (REEA) under the MARA. Through research and analysisof the current situation, structure and potential of rural energy consumption in the BTH region,proposes the best energy consumption structure, consumption mode, spatial pattern andnecessary supporting policies, develop a safe, clean, efficient and sustainable energy productionand consumption scheme, actively explores practical paths for the realization of the PRC's carbonpeak carbon neutral goal, and provides replicable and replicable experience and practices.
3. The main outputs of the project as follows: (i) Undertake research to obtain a sounderunderstanding of the current situation and structure of rural energy consumption in BTH. Theexpert group needs to identify the main factors affecting the energy consumption behaviors in therural areas and develop a corresponding report by the end of 2019; (ii) Submit a report on thestatus and structure of rural energy consumption in the BTH region. Before the end of 2019, theexpert group needs to prepare a report on the impact of rural energy consumption on air quality;(iii) Put forward a clean energy supply plan for the rural areas. Through comparing energy supplytechnologies of various pilot cities in this region, the project will submit a clean energy supplyproposal for rural areas. At the end of 2019, the expert group will implement at least three cleanenergy pilots; (iv) Provide clean energy recommendations to the government. By the end of 2019the expert group, based on the evaluation of the potential clean energy market in the pilot citiesand cost-benefit analysis, will make policy recommendations to the government regarding thedevelopment of clean energy. The project will convene a clean energy seminar and engage expertgroups and relevant stakeholders including government officials, financial institutions, and theprivate sector.
4. In this project, the expert team analyzed the current status of rural energy developmentand utilization of wind, solar, geothermal, biomass, coal, electricity, and natural gas in the greaterBTH region and surrounding areas, evaluated the potential of clean energy development andutilization of wind, solar, geothermal and biomass, and provided fundamental for proposing cleanenergy supply solutions in the region. In the report, the expert team analyzed the current situationand characteristics of rural energy consumption, the structure of rural energy consumption andthe impact factors of rural energy consumption, and studied and evaluated the impact of rural
2
energy consumption on the environment, including the main pollution factors and their emissions and the analysis of differences in pollutant emissions in different regions
5. This report assesses existing rural clean energy policies. In this study, the expert teamcategorized and studied the existing policies, distinguished into four major categories of policies:Plans, Restrictions, Incentives, and Taxation and subsidies, and conducted research andevaluation at different levels from the central to local levels. A comprehensive assessment of ruralclean energy development policies in and around the greater BTH region was conducted with thecombination of quantitative and qualitative analysis in four aspects: effectiveness, feasibility,suitability and operability, suggesting that the existing policies have played a positive role inpromoting rural clean energy development, but there are also some issues in the process of policyformulation and implementation. (1) Fragmentation of policies. The lack of coordination betweenrelevant policies, the existence of multiple management, blurred responsibilities, insufficientinterface between policies, resulting in policy fragmentation and policy system is still incomplete,weak economic incentives, and poor policy stability; (2) Lack of details in implementation. Fromthe implementation level, the lack of supporting local policies and regulations, especially theimplementation of detailed policies, many key measures face difficulties in implementation andoperation; and (3) Lack of granularity in the provision of subsidies. The subsidy method is simpleand extensive, and the fine technical standards are not incorporated into the subsidy basis. Themain body of the subsidy is still project based, which is easy to cause the phenomenon of focusingon construction and neglecting management.
6. The TA expert team investigated and analyzed eight major technical models for thedevelopment and utilization of rural clean energy in greater BTH region and surrounding areas,mainly the mature technical models that have been popularized and applied: “Coal-to-Electricity”,“Coal-to-Gas”, Solar Thermal Energy System, Centralized Energy Supply System Using GasifiedBiomass, Centralized Heating System Using Direct Burning of Straw Bales, Anaerobic DigestionBiogas Production System, The Rural Households’ Clean Cooking & Heating Appliances Solution,and Energy Efficient Buildings. The team evaluated and analyzed each technology model from 6aspects. (1) Technical descriptions and characteristics; (2) Promotion and application of technicalmodels; (3) Case study; (4) Technical and economic evaluation; (5) Financing analysis; and (6)The areas suitable for application. This report also analyzes foreign rural renewable energydevelopment trends and policies, summarizes good practices of renewable energy developmentin foreign rural areas, and analyzes successful cases such as the American rural solar revolution,Danish electric heat pump district heating, Japanese agricultural and solar photovoltaic systems,and the Australian Kidston Clean Energy Center.
7. In this study, to explore the rural energy supply model in and around the greater BTHregion, Yangxin County in Shandong Province, Shangdang District in Changzhi City in ShanxiProvince, and Xiliangwa Township in Anping County in Hebei Province were selected to carry outpilot projects of rural clean energy supply, and summarized rural clean energy supply technologymodels. In Yangxin, the demonstration project has improved the clean energy supply andoptimized the rural energy consumption structure. 98,700 rural households have benefited fromclean heating accounting for 85% of the total; almost all public facilities have adopted biomassheating with an area of more than 1 million m2 being served. In respect to the rural energyconsumption structure, clean energy takes up 94% and renewable energy 46%. In ShangtangDistrict, Changzhi City, Shanxi Province, the demonstration of "coal to electricity" technologymodel with air source heat pump heating was carried out, and the percentage of clean energy intotal rural energy consumption has reached 92%, solving the problem of coal heating fossil energyreplacement for farmers and realizing their clean energy needs. In Xiliangwa Township, AnpingCounty, Hebei Province, a demonstration of the Anaerobic Digestion Biogas Production System
3
was carried out. In the rural energy consumption system, clean energy consumption accounted for 94% and renewable energy consumption accounted for 46%, all from Bio-natural gas is used for cooking and heating energy consumption by farmers.
8. During the TA implementation period, four workshops were held with MARA and ADB todiscuss clean energy development and utilization in agricultural villages with key stakeholdersand policy makers in BTH and neighboring provinces and regions such as Shandong, Shanxi,Henan, and Inner Mongolia, etc. The results of the TA were well received. The key stakeholdersand policy makers from the provinces and regions suggested that the study report should clarifythe priorities for clean energy development and utilization in rural areas in the 14th Five-Year Plan,and try to develop into major projects to be used as reference for drafting the 14th Five-Year Planin energy saving and emission reduction in agriculture and rural areas. The key project proposalsin the Study Report have been reflected in the national 14th Five-Year Plan. In addition, theconsultant team also actively participated in the consulting service of the "Top Ten Technologiesfor Energy Conservation and Emission Reduction in Agriculture and Rural Areas" issued by theMARA. The major projects and policy recommendations proposed in the study played an activerole in the drafting process of the 14th Five-Year Plan for energy conservation and emissionreduction in agriculture and rural areas.
4
II. OVERVIEW
9. This report is a deliverable under the Policy and Advisory TA project “Clean Energy Supply for Rural Areas in the Greater Beijing–Tianjin–Hebei Region” (TA 9403), funded by ADB, Ministry of Agriculture and Rural Affairs, Agro-ecology Implemented with Resource Protection Terminus. TA is implemented in close cooperation with the Government of the PRC) through the Agro-ecology and Resource Protection General Station of the MARA. A. Project Details
Project Title: TA 9403-PRC:Clean Energy Supply for Rural Areas in the Greater Beijing-Tianjin-Hebei Region
Project ID: 51031-001
Executing Agency: Ministry of Agriculture and Rural Affairs
Consultant: Expert Team
Leader: Fang Fang
Completion Date: 30 November 2021
Previous Reports: (1) Baseline Survey Report (2) Research Report
B. Rationality and scope
10. On 22 September 2020, President Xi Jinping announced in his speech at the general debate of the 75th United Nations General Assembly that China will increase its “Nationally Determined Contribution” and strive towards the peaking of CO2 emissions by 2030 and neutrality by 2060. The energy structure, energy efficiency and energy consumption behaviors effectively play a central role in achieving the goal of carbon peaking and carbon neutrality. The PRC has developed a three-step approach to carbon reduction in the energy sector. Specifically, these three steps involve realizing carbon peaking in the 2021–2030 period, rapidly reducing carbon emissions in the 2031–2045 period and achieving carbon neutrality by deep decarbonization in the 2046–2060 period. A suite of strategies has emerged and constitute the new paradigm the PRC is shifting towards: further promoting energy efficiency, accelerating adjustments to the energy structure, optimizing energy consumption methods, enhancing energy efficiency and making greater use of clean energy such as hydro, wind, solar and nuclear power. 11. The greater BTH region is a major metropolitan area in the PRC, and the air pollution in the region is severe. 45% of the population are living in the rural areas; significantly higher than the national average. Historically local rural residents have used “scattered coals” (or “loose coals”, in Chinese “Sanmei” referring to coals used for small boilers, domestic heating, hotels or restaurants instead of power plants or other industrial users) for cooking and heating and thus contributed to serious air pollution and brought substantial stress on the local ecosystem and public health.
5
12. This project starts with rural energy consumption in the greater BTH region. Through theanalysis of the current situation, structure and potential of rural energy consumption in the region,proposed the best energy consumption structure, consumption mode, spatial pattern andnecessary supporting policies, develop a safe, clean, efficient and sustainable energy productionand consumption scheme, and actively explore practical paths for the realization of the PRC’scarbon peak carbon peak and carbon neutrality goal, and provide replicable and scalableexperience and practices. This project selects the greater BTH region and its surrounding ruralenergy consumption structure and consumption patterns for research, which is highly relevantand representative. The research results of the project can easily be promoted and applied inother regions in the PRC.
C. Expected impact, outcome and output
13. The expected impacts of the project are consistent with clean energy development and airquality improvement in greater BTH region and surrounding areas. The main project outcomesare based on the analysis of the current status and potential of rural clean energy supply in greaterBTH region and surrounding areas, scientific evaluation of the effects of existing policies, and theproposal of appropriate rural clean supply models. Specifically, the following specific outputs areexpected to be achieved.
Output 1: Undertake research to obtain a sounder understanding of the current situation and structure of rural energy consumption in greater BTH region. Output 2: Submit a report on the status and structure of rural energy consumption in the BTH region. Output 3: Put forward a clean energy supply plan for the rural areas. Through comparing energy supply technologies of various pilot cities in this region, the project will submit a clean energy supply proposal for rural areas. At the end of 2019, the expert group will implement at least three clean energy pilots. Output 4: Provide clean energy recommendations to the government. By the end of 2019 the expert group, based on the evaluation of the potential clean energy market in the pilot cities and cost-benefit analysis, will make policy recommendations to the government regarding the development of clean energy. The project will convene a clean energy seminar and engage expert groups and relevant stakeholders including government officials, financial institutions, and the private sector.
6
III. IMPLEMENTATION
14. The TA is implemented in 3 main phases to support the production and delivery of project results:
Inception phase – develop workplan Baseline Survey phase – conduct baseline survey, draft research reports Final report development phase – Draft Final Report and Final Report
15. The following describes the main activities, research results, recommendations, and outputs of the different project phases. A. Inception phase
1. Activities
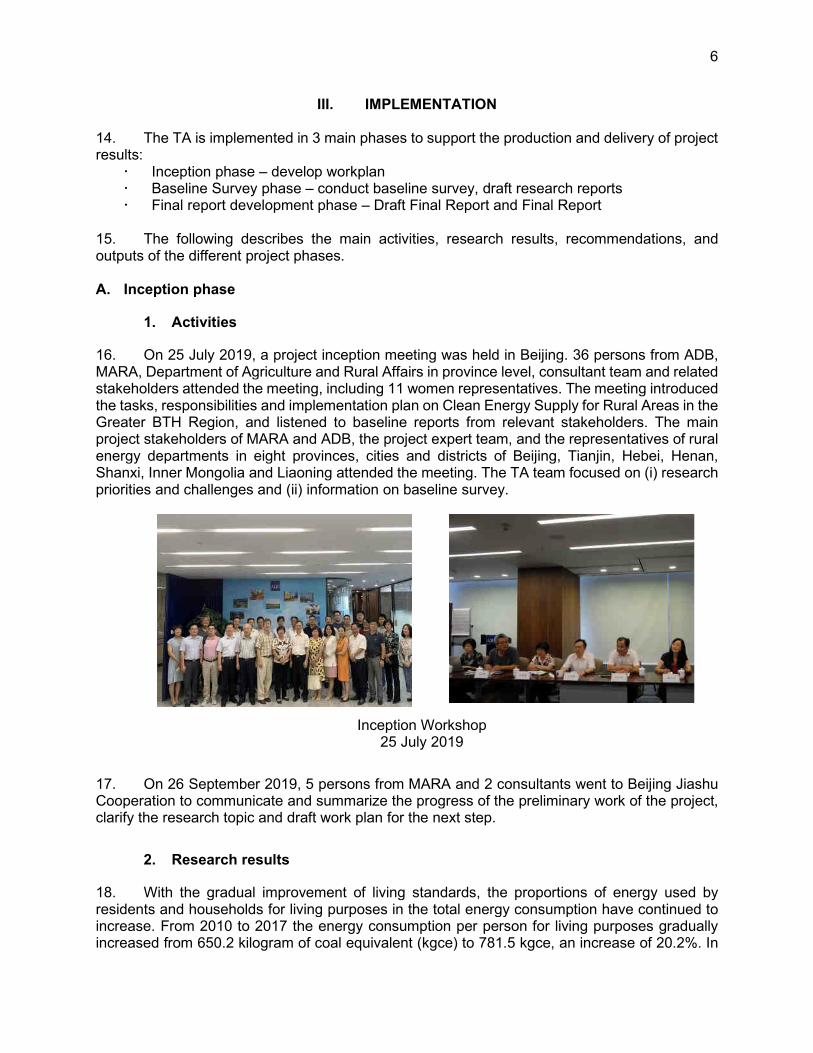
16. On 25 July 2019, a project inception meeting was held in Beijing. 36 persons from ADB, MARA, Department of Agriculture and Rural Affairs in province level, consultant team and related stakeholders attended the meeting, including 11 women representatives. The meeting introduced the tasks, responsibilities and implementation plan on Clean Energy Supply for Rural Areas in the Greater BTH Region, and listened to baseline reports from relevant stakeholders. The main project stakeholders of MARA and ADB, the project expert team, and the representatives of rural energy departments in eight provinces, cities and districts of Beijing, Tianjin, Hebei, Henan, Shanxi, Inner Mongolia and Liaoning attended the meeting. The TA team focused on (i) research priorities and challenges and (ii) information on baseline survey.
Inception Workshop 25 July 2019
17. On 26 September 2019, 5 persons from MARA and 2 consultants went to Beijing Jiashu Cooperation to communicate and summarize the progress of the preliminary work of the project, clarify the research topic and draft work plan for the next step.
2. Research results
18. With the gradual improvement of living standards, the proportions of energy used by residents and households for living purposes in the total energy consumption have continued to increase. From 2010 to 2017 the energy consumption per person for living purposes gradually increased from 650.2 kilogram of coal equivalent (kgce) to 781.5 kgce, an increase of 20.2%. In
7
order to effectively control air pollution, the PRC undertook in-depth research into the air pollution control history and the related evolutionary process in developed countries before it promulgated and implemented a number of policies. Top priority has been given to the control of coal-burning to drive air quality improvement. The overall strategy strives to build a clean energy supply system based on electricity and natural gas and ultimately realize an optimal and balanced energy structure with effective measures to reduce pollutant emissions. In the northern rural areas of the PRC, heating has been the most energy-consuming activity for households, accounting for about 65% to 70% of their total energy consumption. Unlike cities rural areas do not have a sound basis for building large-scale central heating facilities as a result of the scattered farmer houses, low population density and underdeveloped local economies. Historically, rural areas relied heavily on firewood, scattered coal and outdated heating equipment which resulted in huge energy consumption and grim pollution problems. 19. Since 2013, the national and local governments have introduced a great number of policies and measures to increase financial support for and use of local clean energy resources and in particular renewables. They launched clean energy heating projects and fueled the rise of clean heating as a share of the total energy consumption. The number of blue-sky days was increased, people's living standard heightened and great results were achieved. During the "13th Five-Year Development Plan" period, the northern clean heating pilots were scaled up from the initial batch of 12 cities to 43 cities in 2019. In the first year of the "14th Five-Year Development Plan", 20 additional cities were added to the pilot and thus the clean heating practices and financial subsidies were expanded to cover all of the provinces or regions in the northwest, north and northeast of China. As of the end of 2020, the greater BTH region and the Fenwei Plain completed the retrofitting of 25 million homes and theoretically reduced the use of 45 million tons of scattered coal. As a result, the plain area (non-mountainous) of Beijing city has set up a heating system with zero coal reliance. The aggregated coverage of clean heating among the 2+26 cities reached 72%. The urban areas realized 96% clean heating, the counties and urban fringes 75% and the rural areas 43%. The development and utilization of rural clean energy includes wind energy, solar energy, geothermal energy, biomass energy, electric energy, natural gas, etc., as well as the centralized and clean utilization of coal. 20. The tasks of the expert team mainly include: (1) Research on clean energy resources and development potential of greater BTH region and surrounding rural areas; (2) Research on the current situation and environmental impact of energy consumption in greater BTH region and surrounding rural areas; and (3) Collection and systematic analysis on policies related to the development and utilization of rural clean energy from national and local levels. 21. Through numbers of discussions with key stakeholders, the term of reference of TA has been developed.
3. Outcome
22. The consultant team submitted the work plan as the first deliverable outcome. 23. The work plan has been submitted to ADB in December of 2019.
8
B. Baseline survey phase
1. Activities
24. During the baseline survey phase, the expert team are responsible for: (1) selecting thesurvey indicators of rural energy consumption; (2) analyzing the influencing factors of rural energyconsumption; and (3) collecting and analyzing relevant policies for the development and utilizationof rural clean energy from the national and local levels.
25. Beijing Jiashu Technology Consulting Co., Ltd. undertakes specific research activities.The research mainly uses sociological and statistical theory, and adopts qualitative andquantitative research methods. The specific application of the research method is as follows:
(1) Through literature research method, selecting relevant indicators of rural energy useand designing questionnaires.(2) Revising the content of the questionnaire by group discussions and expert surveys.(3) To obtain first-hand information from rural areas with field visits and questionnaires.(4) To understand the residents' intuitive views on rural energy use and their acceptanceof clean energy through field observation.(5) Collected and summarize the current situation of energy consumption and energyconsumption structure of rural residents in greater BTH region, as well as the factorsand data affecting rural residents' energy consumption, to provide data support for thesubsequent in-depth study.
26. In order to gain a multi-perspective, multi-dimensional and in-depth understanding of ruralenergy use in the greater BTH region, the following seven paths were designed to investigate andanalyze typical villages and households in different regions, conduct field surveys andquestionnaire on the current energy situation and factors affecting energy use in rural areas inand around greater BTH region to analyze the current situation and structure of rural energy usecorrectly and sort out the barriers affecting rural energy use.
(1) Research and analysis of typical villages.(2) Research and analysis of typical income farming households.(3) Research and analysis of typical energy-consuming farm households.(4) Research and analysis of farm households with different demographic structures.(5) Research and analysis of rural households with different building structures.(6) Research and analysis of the relationship between rural energy infrastructure andenergy consumption of rural households.(7) Research and analysis of the relationship between the development and utilizationof local clean energy resources and energy consumption of rural households.
2. Research results
27. The consultant team used the field survey results of Jingjia Shu Technology ConsultingCo., which shows the rural energy consumption from 1992 to 2017 in greater BTH region firstincreased before it went on a decline. From 1992 to 2015, it was an upward trend peaking at176,045 tonne of coal equivalent (tce) in 2015. Afterwards, the total consumption decreased to94,723 tce in 2017 mainly attributable to the replacement of traditional fuels (straw and firewood)by high-grade energy sources (natural gas and electricity) with a significantly higher energyefficiency.
28. The main factors affecting the structure of rural energy consumption are householdincome, commodity energy prices, energy accessibility, farmers' living habits and farmers' literacy.
9
The higher the household income of farmers, the higher the consumption of commodity energy such as electricity and natural gas, and conversely, the higher the proportion of biomass energy consumption such as straw. In rural areas with good economic conditions, such as the suburbs of large cities like Beijing and Tianjin, the consumption of commodity energy such as electricity and natural gas is significantly higher than in other regions, and the consumption of biomass energy such as straw is significantly lower than in others, while the higher the price of commodity energy, the more widely biomass and solar energy are used. In addition, the rural energy structure is closely related to the availability of local energy resources, farmers' living habits and literacy. For example, coal consumption is significantly higher in coal-rich areas such as Shanxi than in other areas, and the higher the literacy of farmers, the higher the degree of acceptance of commodity energy such as electricity and natural gas, and the proportion of biomass energy consumption such as straw will be significantly lower.
29. It is the burning of traditional biomass energy and a particular type of commodity energycoal that mostly harm the environment. The direct burning of straw and firewood generateshazardous chemicals including carbon monoxide (CO), carbon dioxide (CO2) and sulfur dioxide(SO2) along with suspended particles and severely damages the local air and water quality. Withregards to coal, its excessive use produces large quantities of SO2, CO2, nitrogen oxide (NOx)and smokes and deteriorates the ecological environment. The greater BTH region consumesabout 60 million tons of scattered coals annually in the rural areas of which 90% are low qualitycoals. They contribute to 15% of SO2 emissions and 23% of flue gas emissions in the region.Consequently, a huge amount of energy is wasted and the particulate matter less than 2.5 inmicrometers (PM2.5) concentration in winter increased by 50%. In 2017 coals, straw and firewoodadded up to more than 60% of the rural energy consumption in this region.
3. Outcome
30. The research report was submitted, including the results of field surveys in greater BTHregion and Shandong, Inner Mongolia, Shanxi, Liaoning, and Henan, the current status and trendsof five key energy-intensive industries in the greater BTH region, detailed information onadvanced energy-saving and emission reduction technologies, and detailed information on theREACH framework.
31. Field Survey Report submitted to the ADB on February 2020.
C. Final report development phase
1. Activities
32. In this phase, the TA team is responsible for (1) developing the outline of the study; (2)assessing and analyzing the clean energy development potential in greater BTH region andsurrounding areas; (3) analyzing the current situation and environmental impact of rural energyconsumption in greater BTH region and surrounding areas; (4) completing the assessment ofexisting rural-related energy policies; (5) assessing and analyzing the technical model of ruralclean energy development and utilization in greater BTH region; and (6) summarizing typicalsuccessful cases of rural clean energy supply in foreign countries.
33. Based on the potential of clean energy development in greater BTH region andsurrounding areas, combined with the current situation of local rural energy consumption,research on rural clean energy supply solutions in greater BTH region and surrounding areas,and select three areas in Yangxin County, Shandong Province, Xi Liangwa Township, Anping
10
County, Hebei Province, and Shangdang District, Changzhi City, Shanxi Province, to carry out pilot demonstrations of rural clean energy supply.
34. During this phase, the expert team held eight meetings to further collect opinions fromexperts and stakeholders
35. On 12 February 2020, an expert group meeting was held, the outline of the research reportwas formulated, and the opinions of the expert team were solicited;
36. On 14 February 2020, the outline of the report was determined and tasks were assignedto individual;
37. On 17 February 2020, an expert group meeting was held to further clarify the tasks of theexperts and determined the report submission deadline;
38. On 27 May 2020, the ADB provided feedback on the first draft of the research report;
39. On 3 June 2020, MARA, ADB and the leader of the expert group held a meeting toexchange suggestions for revisions to the first draft of the research report;
40. On 8 June 2020, the expert group held a meeting to discuss the responsibilities for therevision of the report;
41. On 24 March 2021, a project communication and coordination meeting was held, whereall parties exchanged information on the progress on project indicators, and made suggestionson report revisions, selection of project demonstration areas, and training arrangements;
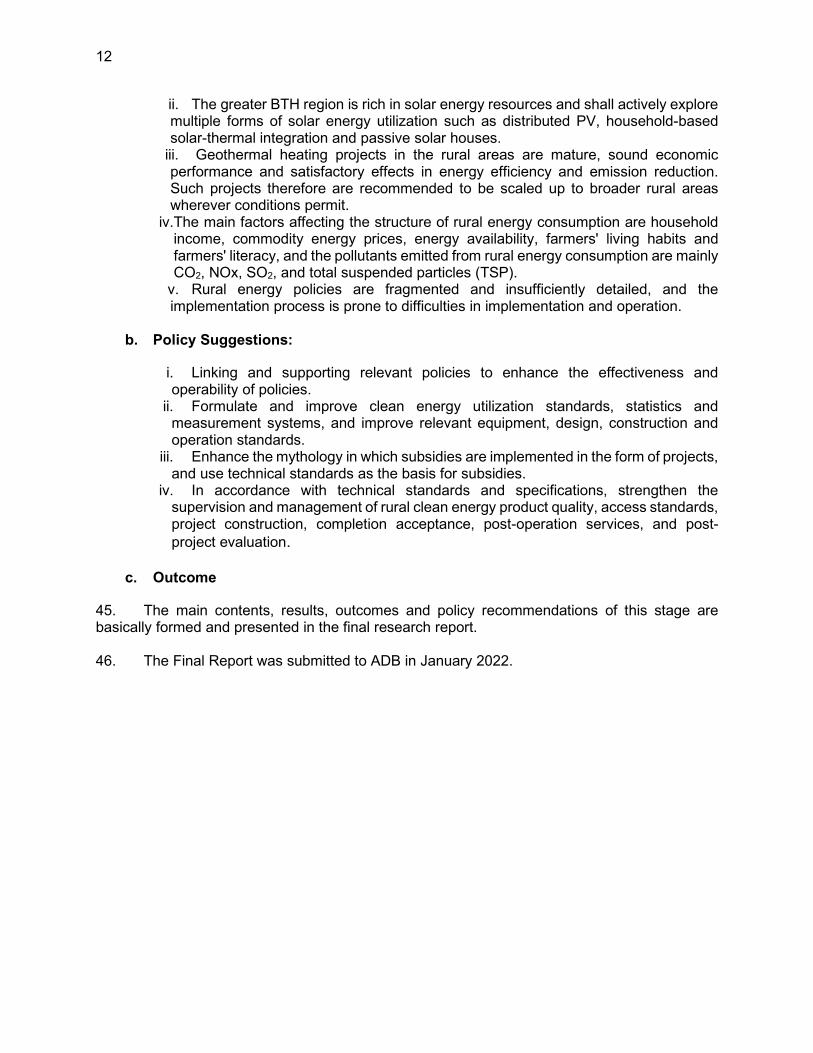
42. On 29 November 2021, REEA, MARA held a project report review meeting and projectoutcome summary meeting. The leaders and experts of the Science, Technology and EducationDepartment of MARA highly affirmed the research report. MARA representative indicated that itwill promote the typical models and cases formed by the project to be promoted and appliednationwide.
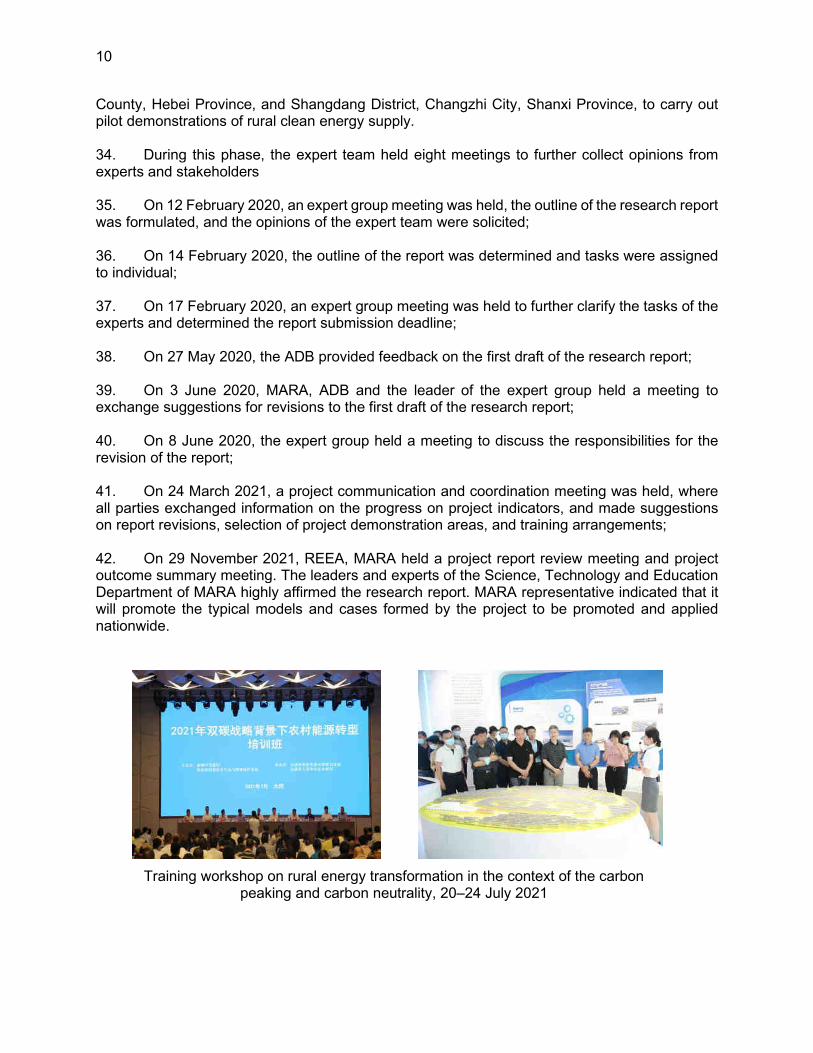
Training workshop on rural energy transformation in the context of the carbon peaking and carbon neutrality, 20–24 July 2021
11
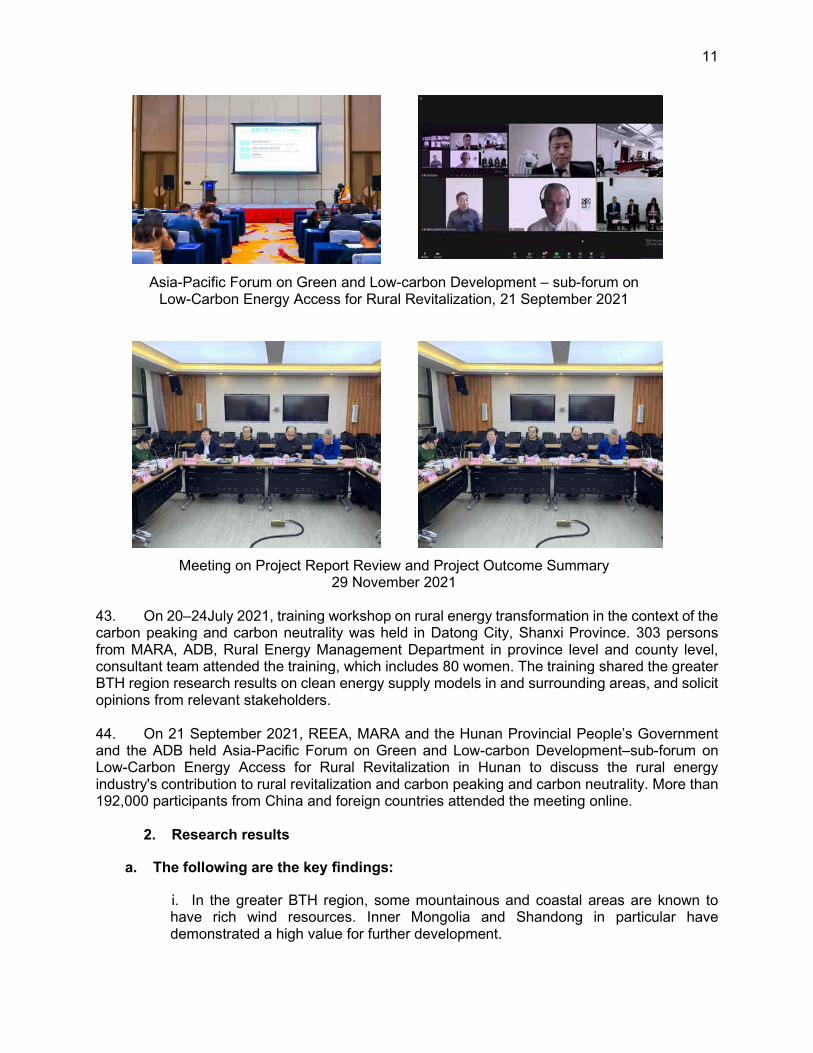
Asia-Pacific Forum on Green and Low-carbon Development – sub-forum on Low-Carbon Energy Access for Rural Revitalization, 21 September 2021
Meeting on Project Report Review and Project Outcome Summary 29 November 2021
43. On 20–24July 2021, training workshop on rural energy transformation in the context of thecarbon peaking and carbon neutrality was held in Datong City, Shanxi Province. 303 personsfrom MARA, ADB, Rural Energy Management Department in province level and county level,consultant team attended the training, which includes 80 women. The training shared the greaterBTH region research results on clean energy supply models in and surrounding areas, and solicitopinions from relevant stakeholders.
44. On 21 September 2021, REEA, MARA and the Hunan Provincial People’s Governmentand the ADB held Asia-Pacific Forum on Green and Low-carbon Development–sub-forum onLow-Carbon Energy Access for Rural Revitalization in Hunan to discuss the rural energyindustry's contribution to rural revitalization and carbon peaking and carbon neutrality. More than192,000 participants from China and foreign countries attended the meeting online.
2. Research results
a. The following are the key findings:
i. In the greater BTH region, some mountainous and coastal areas are known tohave rich wind resources. Inner Mongolia and Shandong in particular havedemonstrated a high value for further development.
12
ii. The greater BTH region is rich in solar energy resources and shall actively explore multiple forms of solar energy utilization such as distributed PV, household-based solar-thermal integration and passive solar houses.
iii. Geothermal heating projects in the rural areas are mature, sound economic performance and satisfactory effects in energy efficiency and emission reduction. Such projects therefore are recommended to be scaled up to broader rural areas wherever conditions permit.
iv.The main factors affecting the structure of rural energy consumption are household income, commodity energy prices, energy availability, farmers' living habits and farmers' literacy, and the pollutants emitted from rural energy consumption are mainly CO2, NOx, SO2, and total suspended particles (TSP).
v. Rural energy policies are fragmented and insufficiently detailed, and the implementation process is prone to difficulties in implementation and operation.
b. Policy Suggestions:
i. Linking and supporting relevant policies to enhance the effectiveness and operability of policies.
ii. Formulate and improve clean energy utilization standards, statistics and measurement systems, and improve relevant equipment, design, construction and operation standards.
iii. Enhance the mythology in which subsidies are implemented in the form of projects, and use technical standards as the basis for subsidies.
iv. In accordance with technical standards and specifications, strengthen the supervision and management of rural clean energy product quality, access standards, project construction, completion acceptance, post-operation services, and post-project evaluation.
c. Outcome
45. The main contents, results, outcomes and policy recommendations of this stage are basically formed and presented in the final research report. 46. The Final Report was submitted to ADB in January 2022.
13
IV. CONCLUSION
A. Project Output
47. The output of TA is (i) to investigate and evaluate the current situation of rural energy ingreater BTH region and surrounding areas and the main factors affecting rural energyconsumption; (ii) to analyze and evaluate the effect and existing problems of rural energy policyimplementation; (iii) to analyze and summarize the main technical models of clean energy supplyof rural energy consumption; (iv) research and analyze rural clean energy supply solutions ingreater BTH region and surrounding areas, and carried out pilot demonstrations; and (v) cleanenergy development proposals.
i. Baseline Survey reportii. Draft of the research reportiii. Research report
B. Outcomes and impacts
48. The results of TA are highly consistent with the PRC government's latest CO2 reductionand air quality improvement strategy.
49. On 22 September 2020, President Xi Jinping announced in his speech at the generaldebate of the 75th United Nations General Assembly, promising that China will adopt more activepolicies and measures to meet the peaking of CO2 emissions by 2030 and neutrality by 2060.
50. National and local’s 14th five-year plans (2021–2025) and action plans for peaking of CO2
emissions by 2030 are currently under draft. The insights and recommendations presented in theTA are timely and can be used by policymakers and local governments to design appropriatemilestones and supportive policies.
51. The key outcomes and impacts of TA include:i. TA suggested to refer to the developed countries to clean energy subsidies to
consumers as the main body of subsidies, and gradually change the way to implementsubsidies in the form of projects, the technical standards as the basis for subsidies.The suggestion has been adopted. At present, MARA and Ministry of Finance haveadopted the form of subsidies based on technical standards in the national strawcomprehensive utilization projects.ii. TA suggested to develop and improve clean energy utilization standards, statisticsand measurement systems, and to improve related equipment, design, constructionand operation standards. The suggestion has been adopted. Currently, the ChinaAssociation of Rural Energy Industry is working on organizing the development ofrelevant technical standards and specifications.iii. TA proposed to implement rural clean energy alternative projects, the activedevelopment and use of solar energy, the steady development of geothermal energy,the development and use of biomass energy, has been reflected in "Top TenTechnologies for Energy Conservation and Emission Reduction in Agriculture andRural Areas " issued by MARA.iv. TA starts with rural energy consumption in greater BTH region, and through theanalysis of the current situation, structure and potential of rural energy consumption inthe region, proposed the best energy consumption structure, consumption mode,spatial pattern and necessary support policies, and constructs safe, clean, efficient,and sustainable clean energy production and consumption programs will provide the

14
PRC with replicable and scalable experience and practices to achieve carbon peaking and carbon neutrality.

15
ANNEXES
Annex 1: Rural Energy Consumption Status and Structure Analysis in Greater Beijing–Tianjin–Hebei Region Annex 2: Study Report on Clean Energy Supply for Rural Areas in the Greater Beijing–Tianjin–Hebei Region
Under TA-9403 PRC: Study of Clean Energy Supply for the Rural Areas in the GreaterBeijing-Tianjin-Hebei Region-Consulting Firm (Survey) (51031-001)
Rural Energy Consumption Status and Structure Analysis in GreaterBeijing-Tianjin-Hebei Region
Final Report
Sponsored bySustainable Infrastructure Division, East Asia Department
Asian Development Bank
Executed byBeijing Jiashu Technology Consulting Co., Ltd.
2019

Contents
Acknowledgement....................................................................................................................1
Abbreviations............................................................................................................................3
Glossary.....................................................................................................................................3
I Project Overview...............................................................................................................4
II Greater BTH Region Overview......................................................................................5
III Methodology..................................................................................................................14
i Research Methods......................................................................................................14
ii Technology Roadmap Selection of Research Indicators.................................... 14
IV Data Analysis................................................................................................................23
i Data Analysis of heating............................................................................................23
ii Cooking........................................................................................................................55
iii Rural Residential Travel...........................................................................................70
iv Daily Energy Consumption......................................................................................72
V Discussion......................................................................................................................73
i Energy Consumption Per Capita..............................................................................73
ii Energy Choice and Income......................................................................................74
iii Energy Choice and Available Energy.................................................................... 75
iv Energy Consumption of Poverty-stricken Households and Solitary FemaleHousehold...........................................................................................................................76
VI Conclusion.....................................................................................................................78
1
Acknowledgement
A mere line of appreciation would hardly meet the end of justice in pledging oursincere gratitude to East Asian Department, Asian Development Bank for sponsoringthe study on “Rural Energy Consumption Status and Structure Analysis in the GreaterBeijing-Tianjin-Hebei (BTH) Region”.
District and block officials in the eight studied provinces,
Kou Kecheng, Xiong County Development and Reform Commission,
Liu Lixin, Shangdu City Development and Reform Commission,
Zhang Guangchuan, Shanghe County Development and Reform Commission,
Sang Ligang, Changzhi City Development and Reform Commission,
Wang Guiping, Changzhi City Development and Reform Commission,
Sun Shili, Daxing District, Beijing,
Guo Xianhong Puyang, City Environmental Protection Agency,are thanked for providing data and field support.
The Field Study Team Composition:
Lu Jinzhen, Project Director,
Sun Yuezheng, Project Coordinator,
Jiang Kangle, Project Coordinator,
Chong Yuxuan, Project Coordinator,
Li Jixian, Project Coordinator,
Wang Peng, Project Coordinator,
Yu Bo, Project Coordinator,
Zhang Wanyue, Project Coordinator,
Wu Chenggang, Support Staff,all of whom are thanked for their fearless endeavors to complete tasks in securitysensitive study area.
Special thanks are duly owed to
Hong Miao, Senior Energy Expert/Team Leader
An Zhang, Geographic Information System Expert
Guangxi Yang, Energy Expert
Huijuan Wang, Sociologist
Min Wang, Project Coordinator/Surveyor

2
Wei Han, Project Coordinator/SurveyorZhong Li, Energy Efficiency Expertwhose sincere efforts ensured the study to reach its logical conclusion. It is placed onrecord that without their professional generosity it would have been impossible tobring out this study report.
All the villagers and experts are also thanked for giving us their valuable time andproviding views on different aspects of the program implementation at the grassroots.
(Guangxi Yang)Vice PresidentBeijing Jiashu Technology Consulting Co., Ltd.Beijing, ChinaJanuary 2019
3
Abbreviations
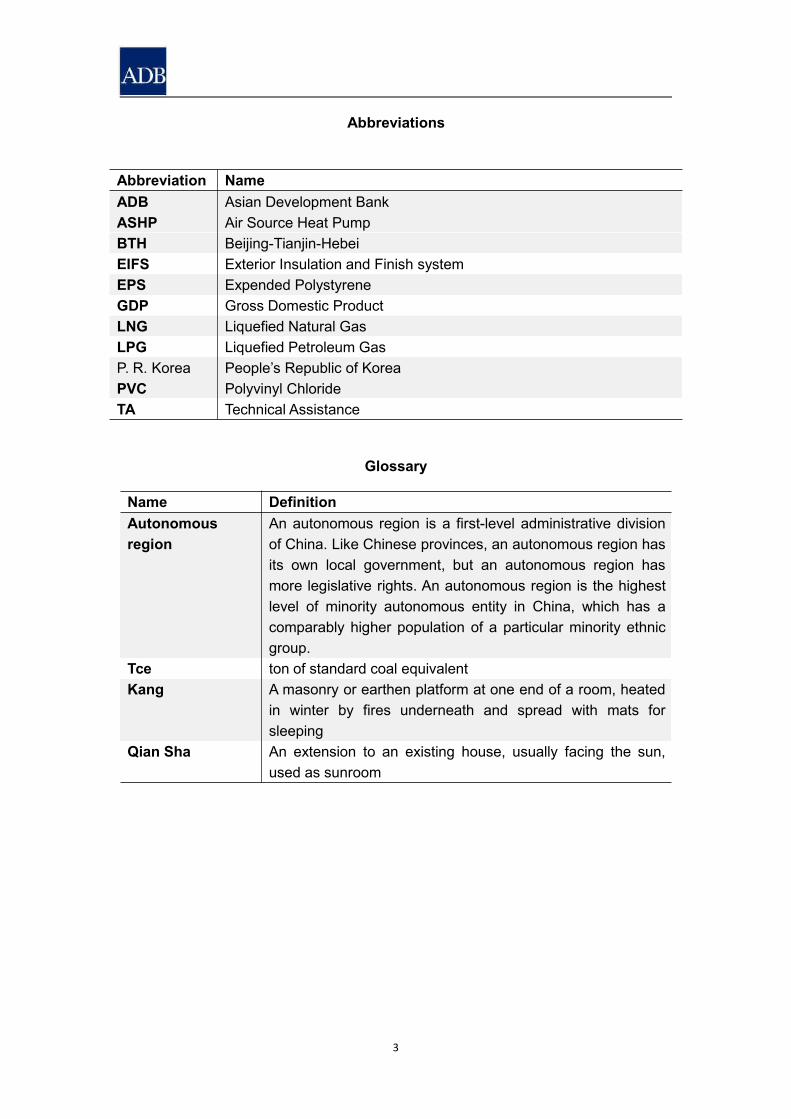
Abbreviation NameADB Asian Development BankASHP Air Source Heat PumpBTH Beijing-Tianjin-HebeiEIFS Exterior Insulation and Finish systemEPS Expended PolystyreneGDP Gross Domestic ProductLNG Liquefied Natural GasLPG Liquefied Petroleum GasP. R. Korea People’s Republic of KoreaPVC Polyvinyl ChlorideTA Technical Assistance
Glossary
Name DefinitionAutonomousregion
An autonomous region is a first-level administrative divisionof China. Like Chinese provinces, an autonomous region hasits own local government, but an autonomous region hasmore legislative rights. An autonomous region is the highestlevel of minority autonomous entity in China, which has acomparably higher population of a particular minority ethnicgroup.
Tce ton of standard coal equivalentKang A masonry or earthen platform at one end of a room, heated
in winter by fires underneath and spread with mats forsleeping
Qian Sha An extension to an existing house, usually facing the sun,used as sunroom
4
I Project Overview
1 The greater BTH region is the main economic center in China, contributing toone third of GDP, but it is also the area with most serious air and water pollution. Theproblems of insufficient ecological security capacity, shortage of water resources,serious environmental pollution, and excessive consumption of resources and energyneed to be resolved1. With the development of economy in the greater BTH region,the rural economy and living standards have improved significantly. The total energyfor daily life has increased, and the demand for commercial energy has alsoincreased rapidly, and the consumption of non-clean energy has grown significantly,which aggravates the air pollution and enhances difficulty of pollution control.
2 To find out and evaluate the status and structure of energy consumption inRural Areas and their impact on the air quality, and increase the rural clean energysupply in the greater BTH region, Rural Energy and Environment Agency of Ministryof Agriculture and Rural Affairs of the People’s Republic of China (hereafter referred toas “Environment Agency”), as the leading organization, and the Asian DevelopmentBank (ADB), technical assistance (TA) provider, had planned to conduct the fieldsurvey in rural areas of eight selected cities and provinces (Beijing, Tianjin, Henan,Hebei, Shandong, Inner Mongolia, and Liaoning) in the greater BTH region. JiashuConsulting is the executing agency of the field work in choosing a reasonablemethodology, designing a scientific technology roadmap, making a feasible plan, andsetting up professional experts to collect statistical data and questionnaire and surveyresults, which can develop the data sheet of status and structure of energyconsumption in rural areas and establish a rural energy consumption baseline.
1 From: http://www.china-nengyuan.com/news/113450.html,2017-08-28
5
II Greater BTH Region Overview
3 The greater BTH region refers to the areas of Beijing Municipality, TianjinMunicipality and Hebei Province, including part of Shanxi Province, Inner MongoliaAutonomous Region, Shandong Province, Liaoning Province and Henan Province.The greater BTH region has the most serious air pollution in China.
4 Currently, the complex air quality problem in the greater BTH region has drawnwide public concern. As the energy use in the rural areas is an important part ofregional energy consumption, the field survey of energy use in the rural area of thegreater BTH region is of great significance to reveal and analyze the basic informationof regional energy use structure and clean energy supply model. The basicinformation of each region is introduced as follows.
Beijing:
5 Beijing is the capital of the People’s Republic of China (PRC), the nation’scenters for politics, culture, international exchanges, innovation, and technology, andan integrated transportation hub. The city is governed as a municipality under thedirect administration of central government. Beijing is situated at the northern tip ofthe roughly triangular North China Plain. Yanshan Mountain to the north, Beijing issurrounded by Hebei Province with the exception of neighboring Tianjin Municipalityto the southeast. In 2017, Beijing has a total of 21.707 million permanent residents,and its GDP was ¥2.8 trillion. In 2016, 2.309 million people have a rural householdregistration in Beijing, of which 1.969 million are permanent residents. Of all residentswith rural household registration, 2.019 million people live in local townships andtowns, 274,000 people live outside local townships and towns but in the city, and15,000 people live in other provinces and countries. The disposable income per capitafor rural residents in Beijing in 2016 is ¥22,310; the disposable income per capita forthe 20% rural residents with low income is ¥9,359.
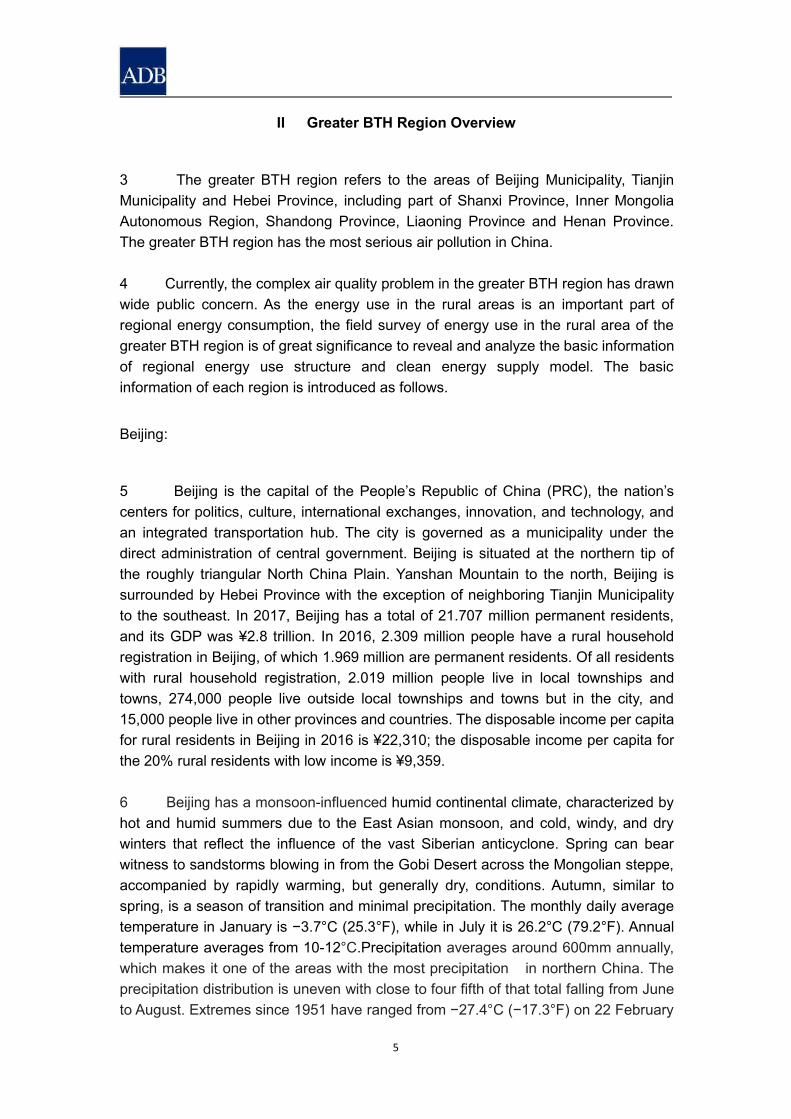
6 Beijing has a monsoon-influenced humid continental climate, characterized byhot and humid summers due to the East Asian monsoon, and cold, windy, and drywinters that reflect the influence of the vast Siberian anticyclone. Spring can bearwitness to sandstorms blowing in from the Gobi Desert across the Mongolian steppe,accompanied by rapidly warming, but generally dry, conditions. Autumn, similar tospring, is a season of transition and minimal precipitation. The monthly daily averagetemperature in January is −3.7°C (25.3°F), while in July it is 26.2°C (79.2°F). Annualtemperature averages from 10-12°C.Precipitation averages around 600mm annually,which makes it one of the areas with the most precipitation in northern China. Theprecipitation distribution is uneven with close to four fifth of that total falling from Juneto August. Extremes since 1951 have ranged from −27.4°C (−17.3°F) on 22 February
6
1966 to 41.9°C (107.4°F) on 24 July 1999 (unofficial record of 42.6 °C (108.7°F) wasset on 15 June 1942).
Figure 1 Geographical Location and Annual Temperature Chart, Source: State Bureauof Surveying and Mapping and Windgrid Weather Platform
Tianjin:
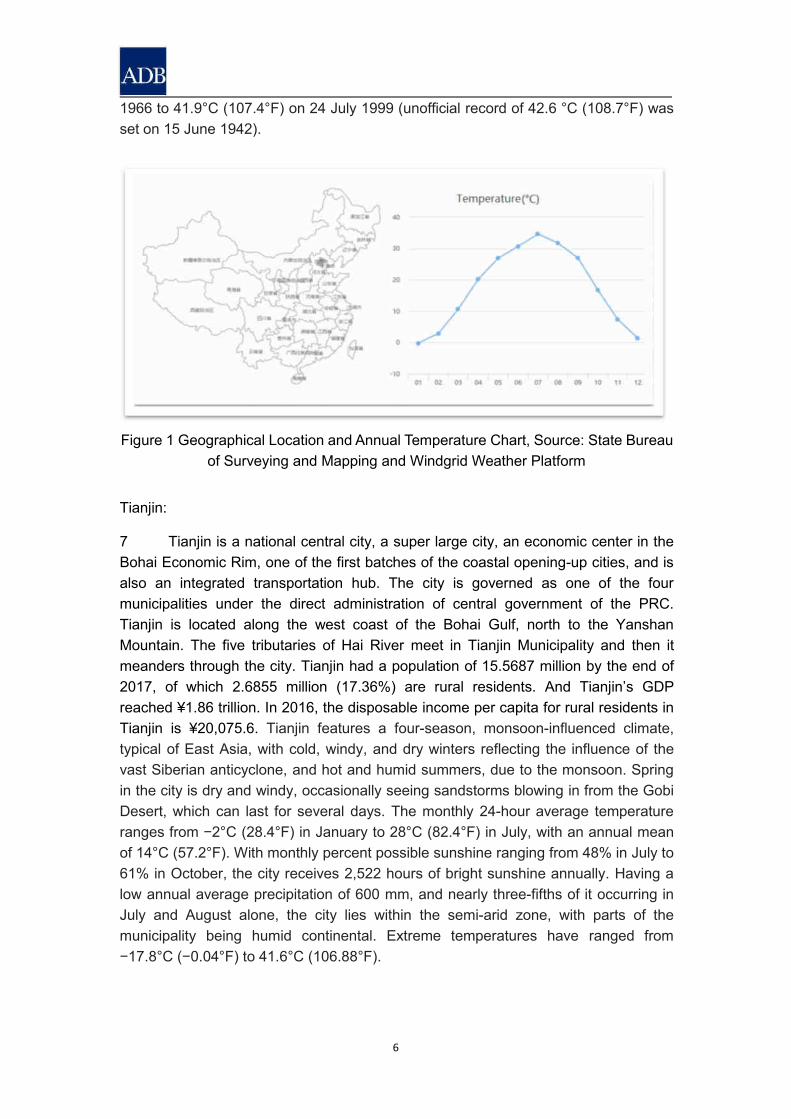
7 Tianjin is a national central city, a super large city, an economic center in theBohai Economic Rim, one of the first batches of the coastal opening-up cities, and isalso an integrated transportation hub. The city is governed as one of the fourmunicipalities under the direct administration of central government of the PRC.Tianjin is located along the west coast of the Bohai Gulf, north to the YanshanMountain. The five tributaries of Hai River meet in Tianjin Municipality and then itmeanders through the city. Tianjin had a population of 15.5687 million by the end of2017, of which 2.6855 million (17.36%) are rural residents. And Tianjin’s GDPreached ¥1.86 trillion. In 2016, the disposable income per capita for rural residents inTianjin is ¥20,075.6. Tianjin features a four-season, monsoon-influenced climate,typical of East Asia, with cold, windy, and dry winters reflecting the influence of thevast Siberian anticyclone, and hot and humid summers, due to the monsoon. Springin the city is dry and windy, occasionally seeing sandstorms blowing in from the GobiDesert, which can last for several days. The monthly 24-hour average temperatureranges from −2°C (28.4°F) in January to 28°C (82.4°F) in July, with an annual meanof 14°C (57.2°F). With monthly percent possible sunshine ranging from 48% in July to61% in October, the city receives 2,522 hours of bright sunshine annually. Having alow annual average precipitation of 600 mm, and nearly three-fifths of it occurring inJuly and August alone, the city lies within the semi-arid zone, with parts of themunicipality being humid continental. Extreme temperatures have ranged from−17.8°C (−0.04°F) to 41.6°C (106.88°F).
7
Figure 2 Geographical Location and Annual Temperature Chart, Source: State Bureauof Surveying and Mapping and Windgrid Weather Platform
Hebei Province:
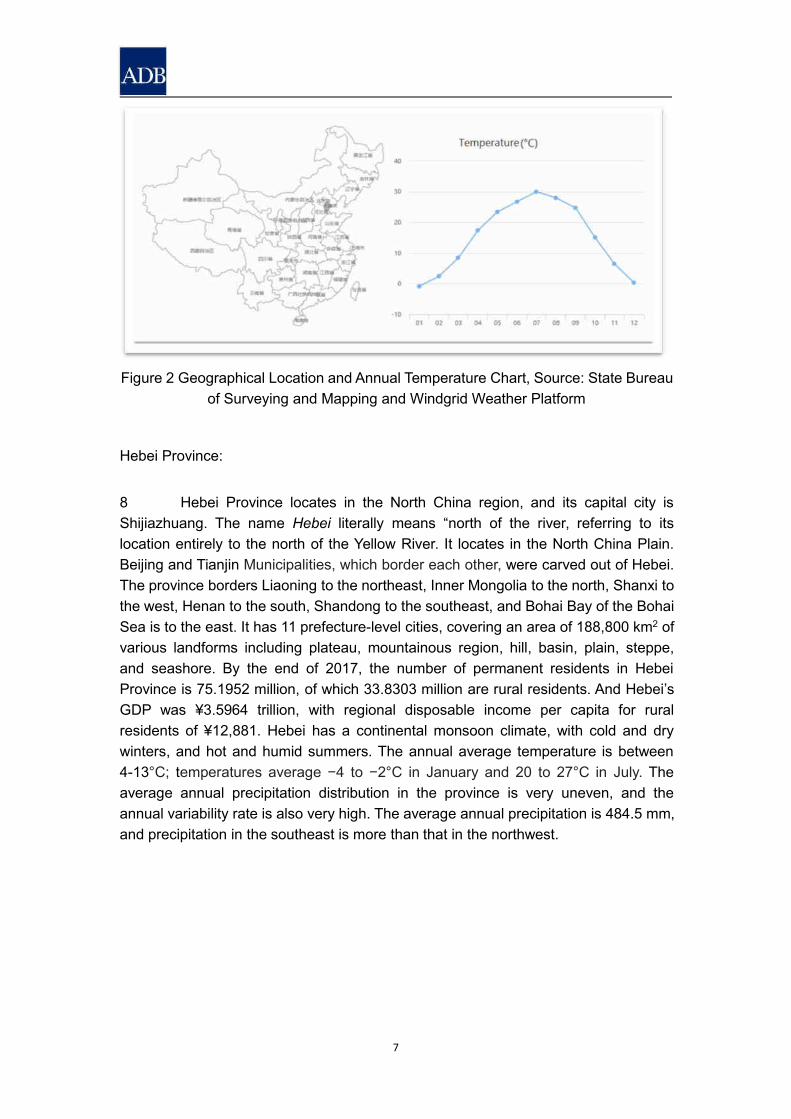
8 Hebei Province locates in the North China region, and its capital city isShijiazhuang. The name Hebei literally means “north of the river, referring to itslocation entirely to the north of the Yellow River. It locates in the North China Plain.Beijing and Tianjin Municipalities, which border each other, were carved out of Hebei.The province borders Liaoning to the northeast, Inner Mongolia to the north, Shanxi tothe west, Henan to the south, Shandong to the southeast, and Bohai Bay of the BohaiSea is to the east. It has 11 prefecture-level cities, covering an area of 188,800 km2 ofvarious landforms including plateau, mountainous region, hill, basin, plain, steppe,and seashore. By the end of 2017, the number of permanent residents in HebeiProvince is 75.1952 million, of which 33.8303 million are rural residents. And Hebei’sGDP was ¥3.5964 trillion, with regional disposable income per capita for ruralresidents of ¥12,881. Hebei has a continental monsoon climate, with cold and drywinters, and hot and humid summers. The annual average temperature is between4-13°C; temperatures average −4 to −2°C in January and 20 to 27°C in July. Theaverage annual precipitation distribution in the province is very uneven, and theannual variability rate is also very high. The average annual precipitation is 484.5 mm,and precipitation in the southeast is more than that in the northwest.
8
Figure 3 Geographical Location and Annual Temperature Chart, Source: State Bureauof Surveying and Mapping and Windgrid Weather Platform
Henan Province:
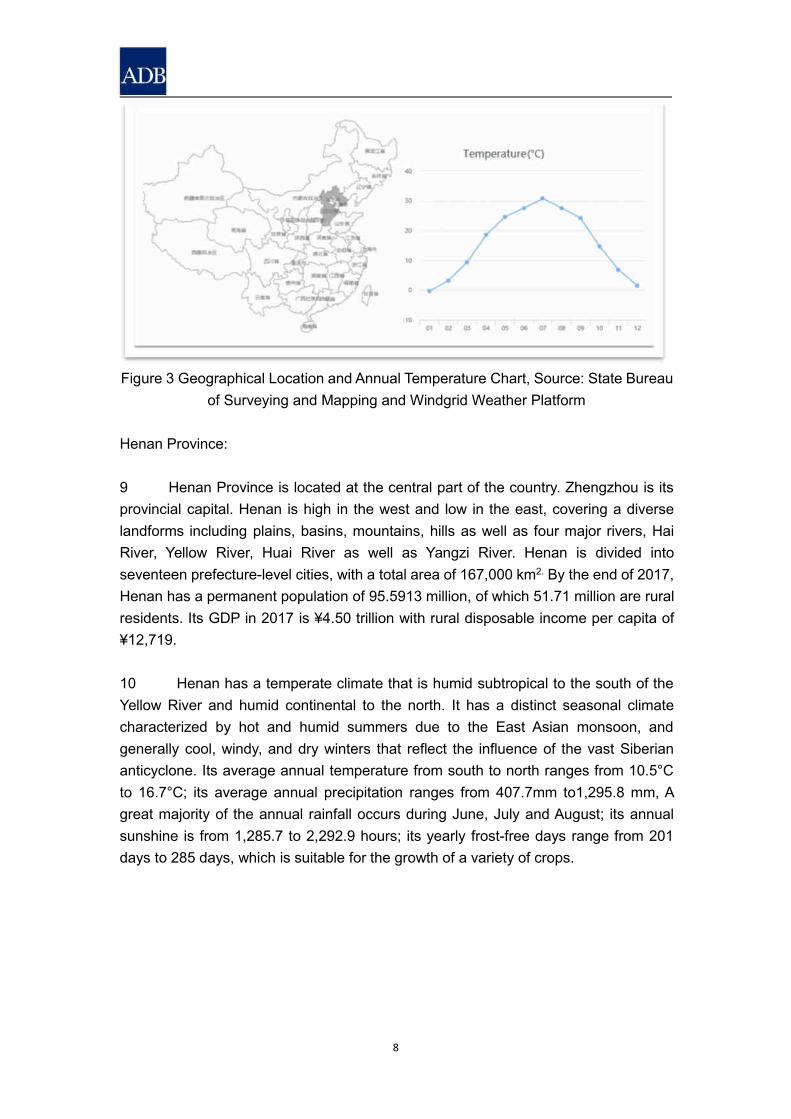
9 Henan Province is located at the central part of the country. Zhengzhou is itsprovincial capital. Henan is high in the west and low in the east, covering a diverselandforms including plains, basins, mountains, hills as well as four major rivers, HaiRiver, Yellow River, Huai River as well as Yangzi River. Henan is divided intoseventeen prefecture-level cities, with a total area of 167,000 km2. By the end of 2017,Henan has a permanent population of 95.5913 million, of which 51.71 million are ruralresidents. Its GDP in 2017 is ¥4.50 trillion with rural disposable income per capita of¥12,719.
10 Henan has a temperate climate that is humid subtropical to the south of theYellow River and humid continental to the north. It has a distinct seasonal climatecharacterized by hot and humid summers due to the East Asian monsoon, andgenerally cool, windy, and dry winters that reflect the influence of the vast Siberiananticyclone. Its average annual temperature from south to north ranges from 10.5°Cto 16.7°C; its average annual precipitation ranges from 407.7mm to1,295.8 mm, Agreat majority of the annual rainfall occurs during June, July and August; its annualsunshine is from 1,285.7 to 2,292.9 hours; its yearly frost-free days range from 201days to 285 days, which is suitable for the growth of a variety of crops.
9
Figure 4 Geographical Location and Annual Temperature Chart, Source: StateBureau of Surveying and Mapping and Windgrid Weather Platform
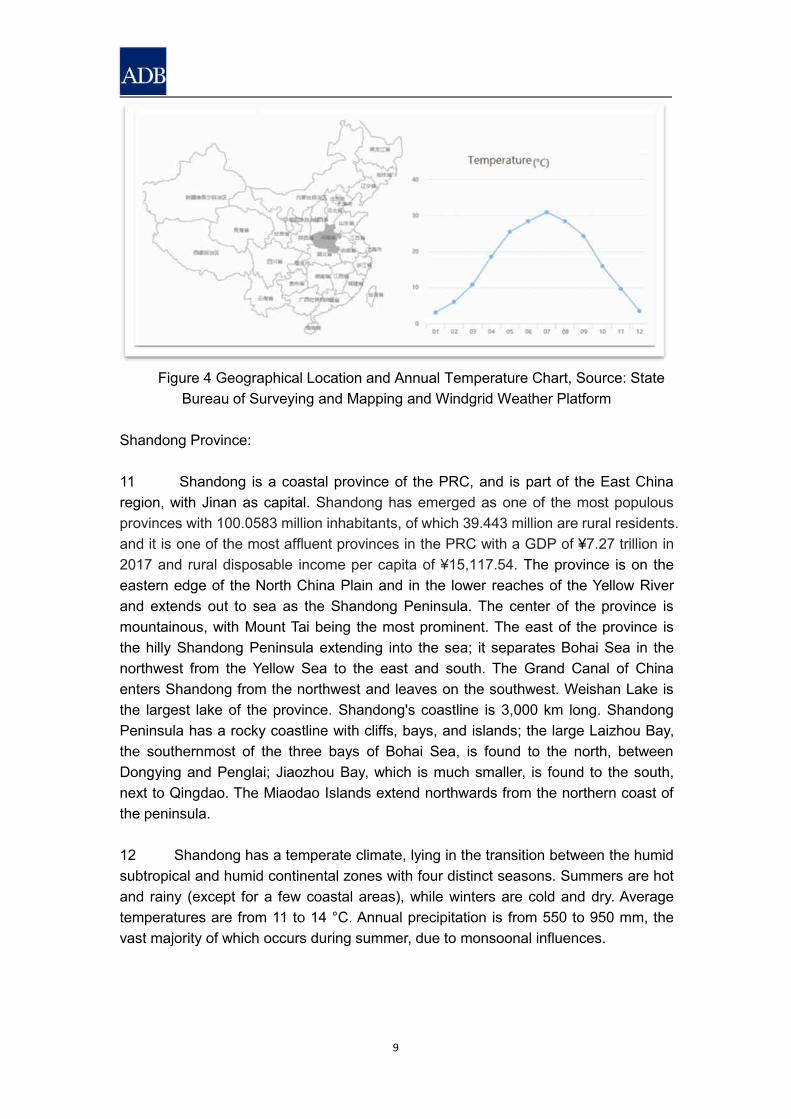
Shandong Province:
11 Shandong is a coastal province of the PRC, and is part of the East Chinaregion, with Jinan as capital. Shandong has emerged as one of the most populousprovinces with 100.0583 million inhabitants, of which 39.443 million are rural residents.and it is one of the most affluent provinces in the PRC with a GDP of ¥7.27 trillion in2017 and rural disposable income per capita of ¥15,117.54. The province is on theeastern edge of the North China Plain and in the lower reaches of the Yellow Riverand extends out to sea as the Shandong Peninsula. The center of the province ismountainous, with Mount Tai being the most prominent. The east of the province isthe hilly Shandong Peninsula extending into the sea; it separates Bohai Sea in thenorthwest from the Yellow Sea to the east and south. The Grand Canal of Chinaenters Shandong from the northwest and leaves on the southwest. Weishan Lake isthe largest lake of the province. Shandong's coastline is 3,000 km long. ShandongPeninsula has a rocky coastline with cliffs, bays, and islands; the large Laizhou Bay,the southernmost of the three bays of Bohai Sea, is found to the north, betweenDongying and Penglai; Jiaozhou Bay, which is much smaller, is found to the south,next to Qingdao. The Miaodao Islands extend northwards from the northern coast ofthe peninsula.
12 Shandong has a temperate climate, lying in the transition between the humidsubtropical and humid continental zones with four distinct seasons. Summers are hotand rainy (except for a few coastal areas), while winters are cold and dry. Averagetemperatures are from 11 to 14 °C. Annual precipitation is from 550 to 950 mm, thevast majority of which occurs during summer, due to monsoonal influences.
10
Figure 5 Geographical Location and Annual Temperature Chart, Source: StateBureau of Surveying and Mapping and Windgrid Weather Platform
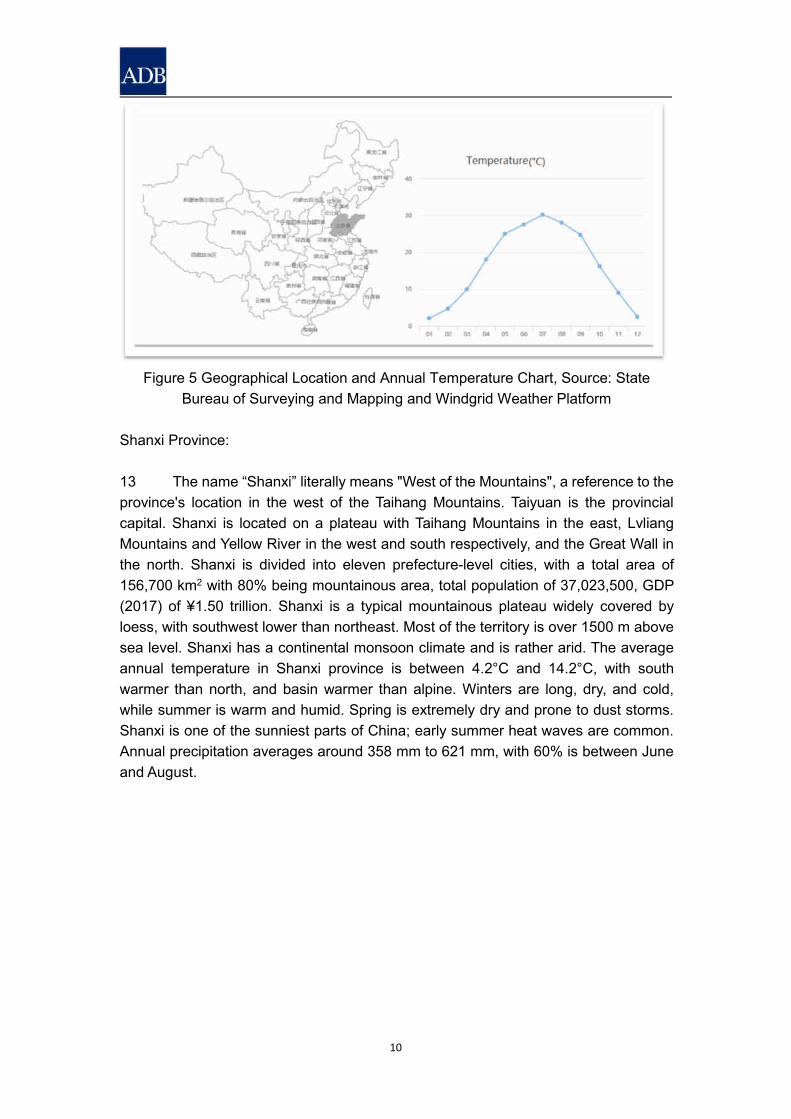
Shanxi Province:
13 The name “Shanxi” literally means "West of the Mountains", a reference to theprovince's location in the west of the Taihang Mountains. Taiyuan is the provincialcapital. Shanxi is located on a plateau with Taihang Mountains in the east, LvliangMountains and Yellow River in the west and south respectively, and the Great Wall inthe north. Shanxi is divided into eleven prefecture-level cities, with a total area of156,700 km2 with 80% being mountainous area, total population of 37,023,500, GDP(2017) of ¥1.50 trillion. Shanxi is a typical mountainous plateau widely covered byloess, with southwest lower than northeast. Most of the territory is over 1500 m abovesea level. Shanxi has a continental monsoon climate and is rather arid. The averageannual temperature in Shanxi province is between 4.2°C and 14.2°C, with southwarmer than north, and basin warmer than alpine. Winters are long, dry, and cold,while summer is warm and humid. Spring is extremely dry and prone to dust storms.Shanxi is one of the sunniest parts of China; early summer heat waves are common.Annual precipitation averages around 358 mm to 621 mm, with 60% is between Juneand August.
11
Figure 6 Geographical Location and Annual Temperature Chart, Source: StateBureau of Surveying and Mapping and Windgrid Weather Platform
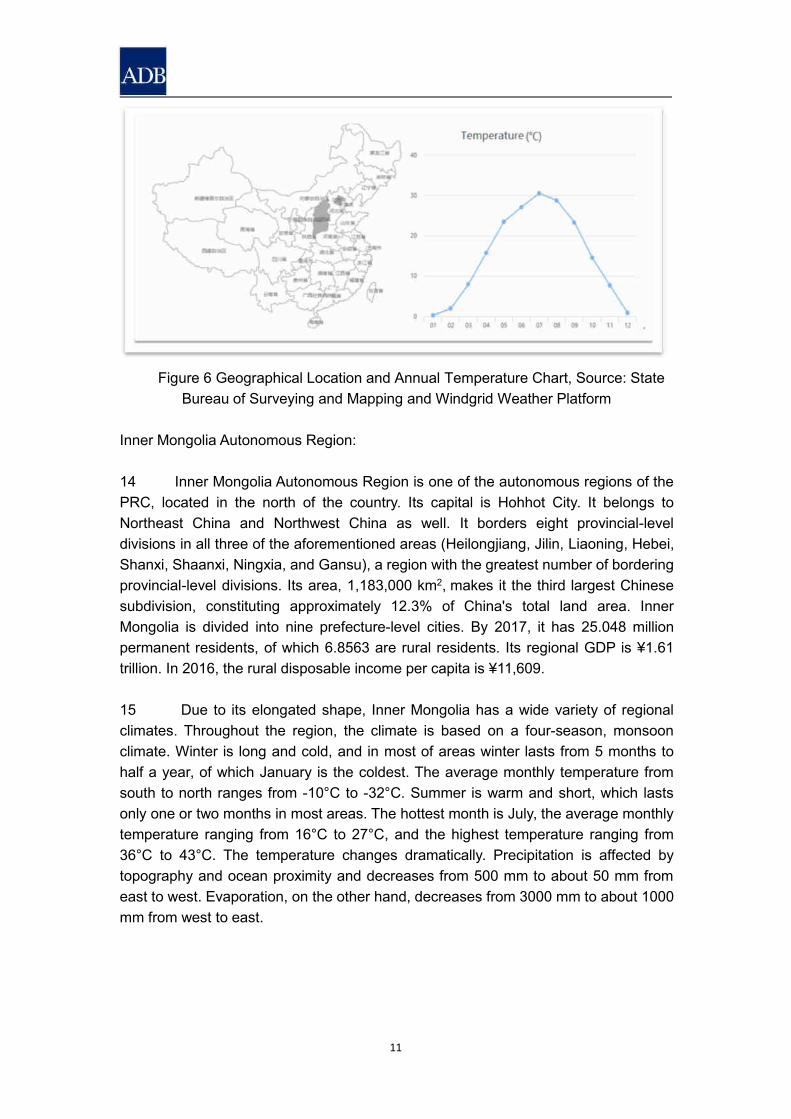
Inner Mongolia Autonomous Region:
14 Inner Mongolia Autonomous Region is one of the autonomous regions of thePRC, located in the north of the country. Its capital is Hohhot City. It belongs toNortheast China and Northwest China as well. It borders eight provincial-leveldivisions in all three of the aforementioned areas (Heilongjiang, Jilin, Liaoning, Hebei,Shanxi, Shaanxi, Ningxia, and Gansu), a region with the greatest number of borderingprovincial-level divisions. Its area, 1,183,000 km2, makes it the third largest Chinesesubdivision, constituting approximately 12.3% of China's total land area. InnerMongolia is divided into nine prefecture-level cities. By 2017, it has 25.048 millionpermanent residents, of which 6.8563 are rural residents. Its regional GDP is ¥1.61trillion. In 2016, the rural disposable income per capita is ¥11,609.
15 Due to its elongated shape, Inner Mongolia has a wide variety of regionalclimates. Throughout the region, the climate is based on a four-season, monsoonclimate. Winter is long and cold, and in most of areas winter lasts from 5 months tohalf a year, of which January is the coldest. The average monthly temperature fromsouth to north ranges from -10°C to -32°C. Summer is warm and short, which lastsonly one or two months in most areas. The hottest month is July, the average monthlytemperature ranging from 16°C to 27°C, and the highest temperature ranging from36°C to 43°C. The temperature changes dramatically. Precipitation is affected bytopography and ocean proximity and decreases from 500 mm to about 50 mm fromeast to west. Evaporation, on the other hand, decreases from 3000 mm to about 1000mm from west to east.
12
Figure 7 Geographical Location and Annual Temperature Chart, Source: StateBureau of Surveying and Mapping and Windgrid Weather Platform
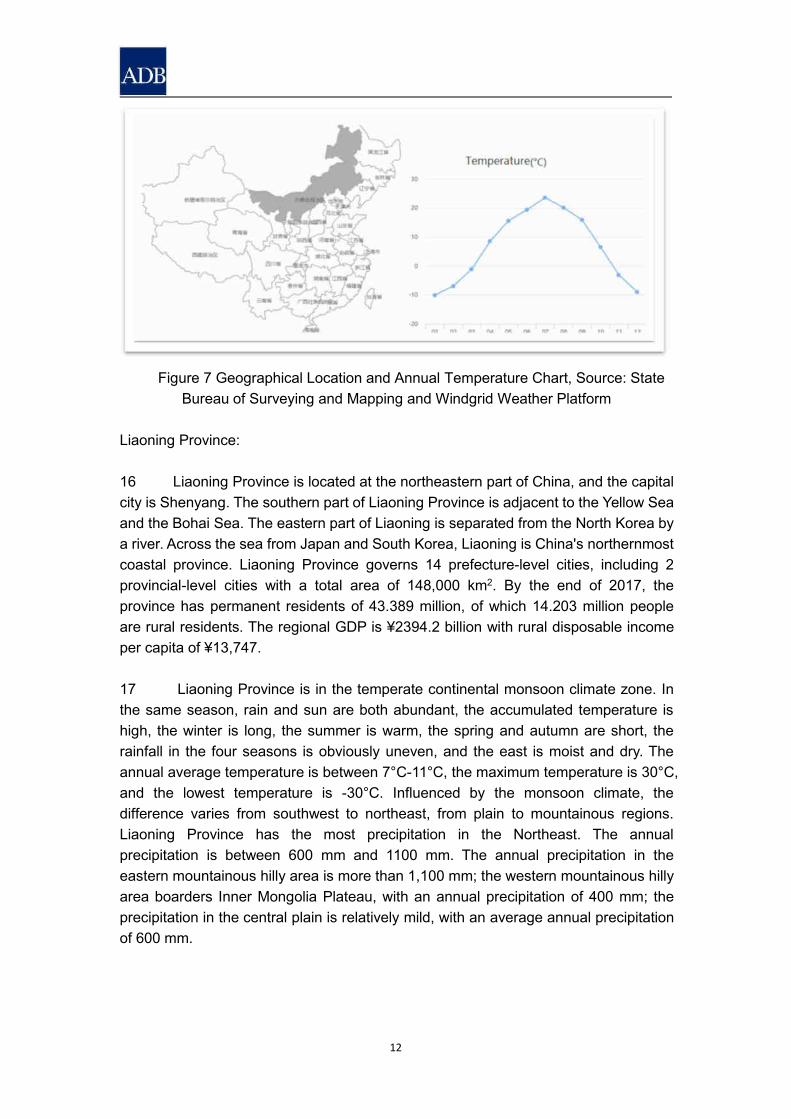
Liaoning Province:
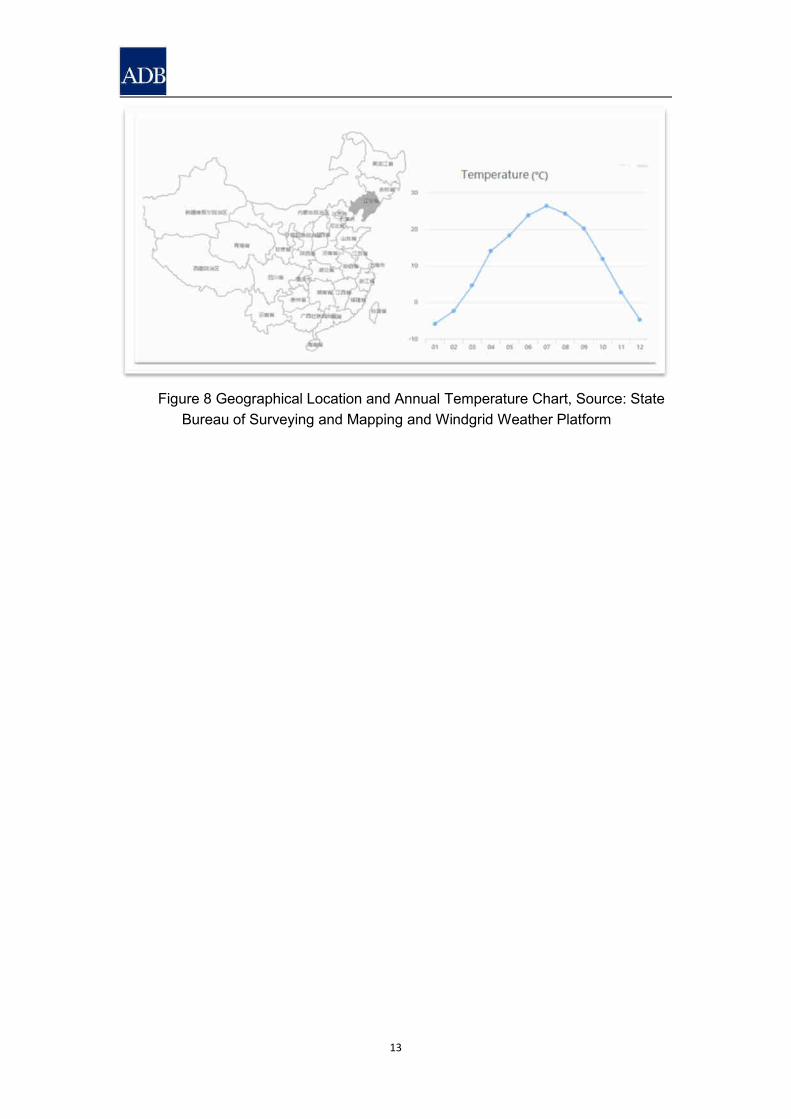
16 Liaoning Province is located at the northeastern part of China, and the capitalcity is Shenyang. The southern part of Liaoning Province is adjacent to the Yellow Seaand the Bohai Sea. The eastern part of Liaoning is separated from the North Korea bya river. Across the sea from Japan and South Korea, Liaoning is China's northernmostcoastal province. Liaoning Province governs 14 prefecture-level cities, including 2provincial-level cities with a total area of 148,000 km2. By the end of 2017, theprovince has permanent residents of 43.389 million, of which 14.203 million peopleare rural residents. The regional GDP is ¥2394.2 billion with rural disposable incomeper capita of ¥13,747.
17 Liaoning Province is in the temperate continental monsoon climate zone. Inthe same season, rain and sun are both abundant, the accumulated temperature ishigh, the winter is long, the summer is warm, the spring and autumn are short, therainfall in the four seasons is obviously uneven, and the east is moist and dry. Theannual average temperature is between 7°C-11°C, the maximum temperature is 30°C,and the lowest temperature is -30°C. Influenced by the monsoon climate, thedifference varies from southwest to northeast, from plain to mountainous regions.Liaoning Province has the most precipitation in the Northeast. The annualprecipitation is between 600 mm and 1100 mm. The annual precipitation in theeastern mountainous hilly area is more than 1,100 mm; the western mountainous hillyarea boarders Inner Mongolia Plateau, with an annual precipitation of 400 mm; theprecipitation in the central plain is relatively mild, with an average annual precipitationof 600 mm.
13
Figure 8 Geographical Location and Annual Temperature Chart, Source: StateBureau of Surveying and Mapping and Windgrid Weather Platform
14
III Methodology
i Research Methods
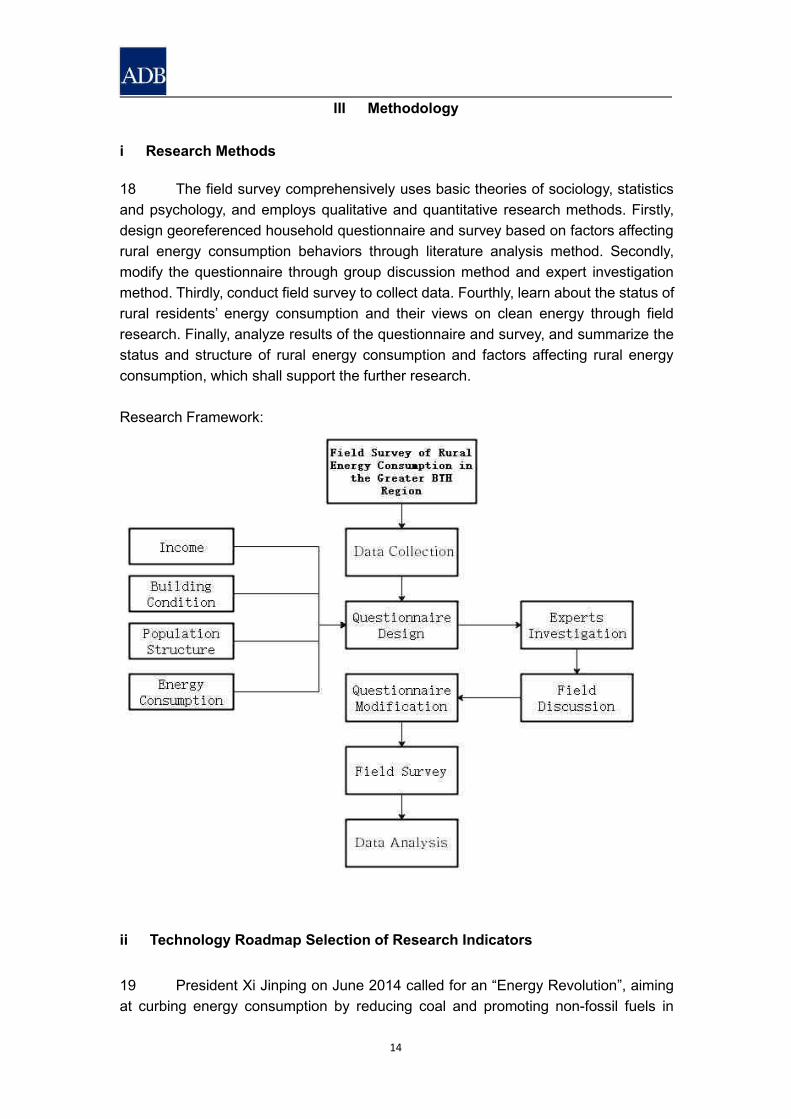
18 The field survey comprehensively uses basic theories of sociology, statisticsand psychology, and employs qualitative and quantitative research methods. Firstly,design georeferenced household questionnaire and survey based on factors affectingrural energy consumption behaviors through literature analysis method. Secondly,modify the questionnaire through group discussion method and expert investigationmethod. Thirdly, conduct field survey to collect data. Fourthly, learn about the status ofrural residents’ energy consumption and their views on clean energy through fieldresearch. Finally, analyze results of the questionnaire and survey, and summarize thestatus and structure of rural energy consumption and factors affecting rural energyconsumption, which shall support the further research.
Research Framework:
ii Technology Roadmap Selection of Research Indicators
19 President Xi Jinping on June 2014 called for an “Energy Revolution”, aimingat curbing energy consumption by reducing coal and promoting non-fossil fuels in
15
China’s primary energy consumption basket while enhancing energy efficiencymeasures. Consequently, the National Development and Reform Commissionreleased the “Energy Revolution Strategy” on April 25, 2017, which sets out the keytargets and strategies of Chinese energy sector by 2030. This strategy is a pathwayunder the 13th Five Year Plan for Energy (2016-2020), with an objective “to make theskies blue again”, as pledged by Chinese Premier Li Keqiang.
20 China also increases the direct use of renewables in end-use sectors, viabioenergy in industry, solar thermal for heating and biofuels for transport. The energyutilization in China rural area is too complicated to deal with1. China has been relyingon bioenergy for quite a long history. Typical bioenergy includes wood and crop straw.Since Reform and Opening Up to the outside world and industrialization, Chinesegovernment has been working on poverty relief (including energy poverty relief).Therefore, rural areas gained access to bulk coal, electricity, running water andnatural gas. Although living standards of rural residents has been improved greatly,rural infrastructure still lagged. In the context of combating environmental pollutionand shortage of available energy, Chinese government has been experimenting withvarious technology roadmaps for rural clean energy consumption, especially ofheating and cooking, which includes coal to electricity, coal to gas, biogas, biomass,solar energy, wind etc. Due to unsustainable energy supply or technological barriersand various different rural conditions, no single solution will be effective for all.
21 In 2017, air quality has improved significantly in the greater BTH region, butan overzealous program to ban coal heating and switch to gas ran into trouble earlierin December. Severe shortages of natural gas left thousands of rural peopleshuddering in the cold, sending prices of domestic liquefied natural gas (LNG) to athree-year high2. China’s Ministry of Ecology and Environment was forced to makeconcessions as early as December, saying in a notice it would allow cities to continueburning coal for heating purposes if the required gas could not be supplied. However,even with a supply glut of natural gas globally due to mega-projects coming online,infrastructure constraints — such as slow pipeline construction — within the countrystill limit gas use. The government must guarantee gas in key areas by diverting thesupply from domestic gas-production regions.
22 Hence, rural energy is a systematic problem, concerning a multitude offactors of society, economy, culture, population, resource availability, building,urbanization, energy consumption behaviour as well as rural energy status andstructures. The primary task of the project is to undertake questionnaire and fieldsurvey on status and structure of energy consumption in rural areas to analyze rural
1 Gong Hao, Luo Zuoxian, He Zheng, Liang Haijun, Yan Xiaohui, Wang Bocun. Promote Clean WinterHeating and Speed up Rural Energy Revolution [J]. Green Petroleum and Petrochemicals, 2017, 2(04):6-10.2 Dai Baohua, Luo Zuoxian, Gong Hao. Some Considerations about Northern Geothermal HeatingIndustrial Development Strategy amid Gas Shortage [J]. Petroleum & Petrochemical Today, 2018, 26(05):1-7.
16
energy efficiency and pollution reduction, so as to further determine a reasonableenergy demand and supply system and establish a rural energy consumptionbaseline. To realize above-mentioned targets, seven technical routes are adopted inmethodology:
23 To deeply understand the rural energy consumption from multiple angles anddimensions in the greater BTH region, the field survey plans to employ the followingseven technology roadmaps to conduct and analyze the status and structure of therural energy consumption and summarize the general factors affecting rural energyconsumption.
Technology Roadmap 1: Typical Village Analysis
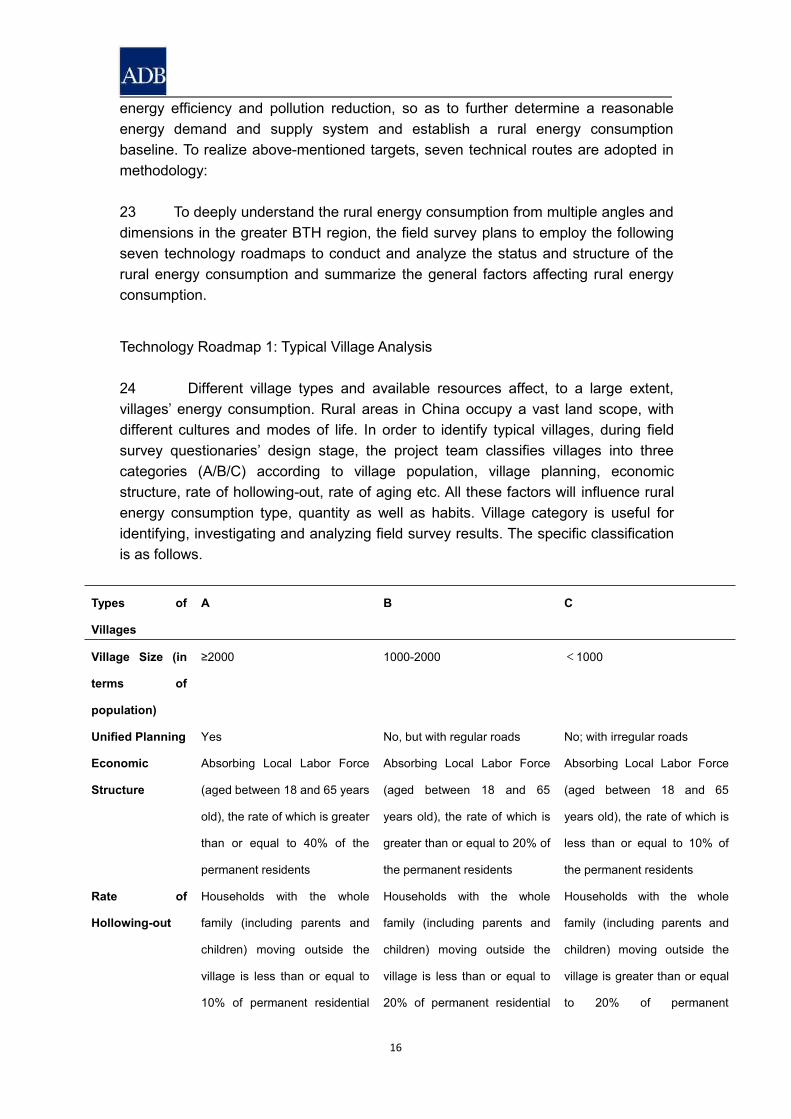
24 Different village types and available resources affect, to a large extent,villages’ energy consumption. Rural areas in China occupy a vast land scope, withdifferent cultures and modes of life. In order to identify typical villages, during fieldsurvey questionaries’ design stage, the project team classifies villages into threecategories (A/B/C) according to village population, village planning, economicstructure, rate of hollowing-out, rate of aging etc. All these factors will influence ruralenergy consumption type, quantity as well as habits. Village category is useful foridentifying, investigating and analyzing field survey results. The specific classificationis as follows.
Types of
Villages
A B C
Village Size (in
terms of
population)
≥2000 1000-2000 <1000
Unified Planning Yes No, but with regular roads No; with irregular roads
Economic
Structure
Absorbing Local Labor Force
(aged between 18 and 65 years
old), the rate of which is greater
than or equal to 40% of the
permanent residents
Absorbing Local Labor Force
(aged between 18 and 65
years old), the rate of which is
greater than or equal to 20% of
the permanent residents
Absorbing Local Labor Force
(aged between 18 and 65
years old), the rate of which is
less than or equal to 10% of
the permanent residents
Rate of
Hollowing-out
Households with the whole
family (including parents and
children) moving outside the
village is less than or equal to
10% of permanent residential
Households with the whole
family (including parents and
children) moving outside the
village is less than or equal to
20% of permanent residential
Households with the whole
family (including parents and
children) moving outside the
village is greater than or equal
to 20% of permanent
17
households;
Households with migrate father
or mother working outside for
more than or equal to 70% of a
whole year are less than or
equal to 40% of permanent
residential households
households;
Households with migrate father
or mother working outside for
more than or equal to 70% of a
whole year are less than or
equal to 60% of permanent
residential households
residential households;
Households with migrate father
or mother working outside for
more than or equal to 70% of a
whole year are greater than or
equal to 60% of permanent
residential households
Aging Population of senior citizens
aging above 65 years old
occupies less than or equal to
10% of permanent residents
Population of senior citizens
aging above 65 years old
occupies more than or equal to
20% of permanent residents
Population of senior citizens
aging above 65 years old
occupies more than or equal to
30% of permanent residents
Figure 9 Basic Information of Village
Technology Roadmap 2: Typical Household Analysis
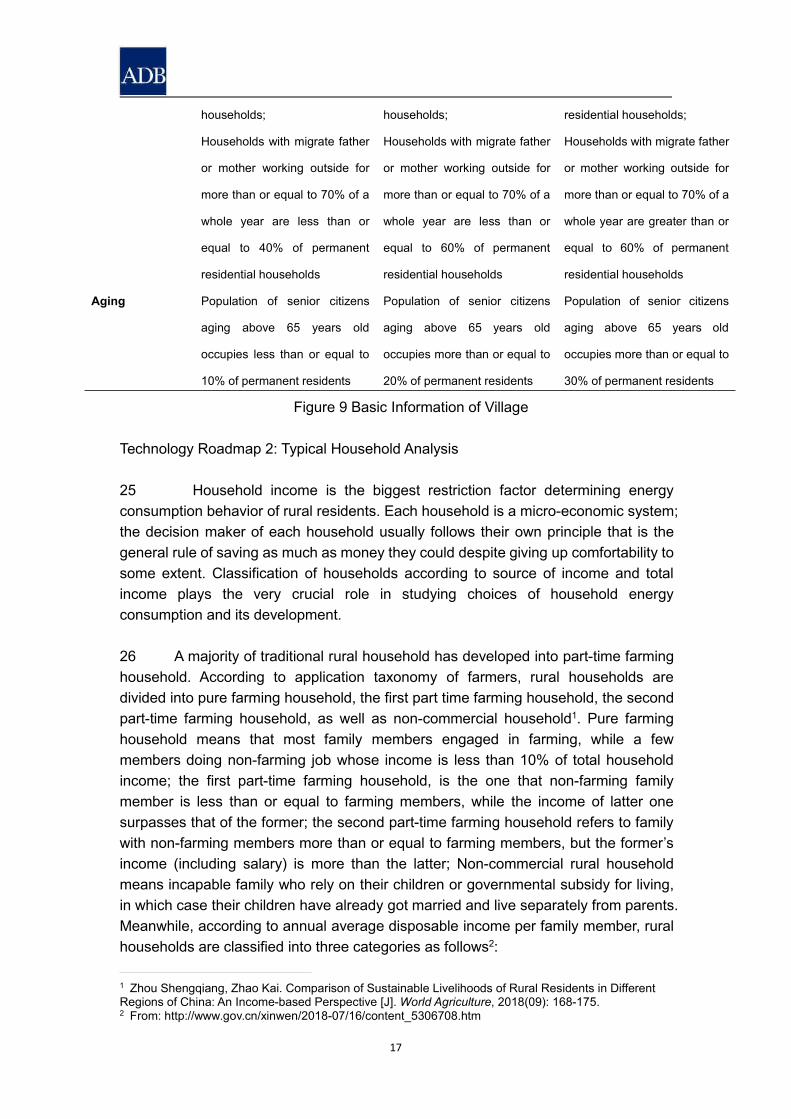
25 Household income is the biggest restriction factor determining energyconsumption behavior of rural residents. Each household is a micro-economic system;the decision maker of each household usually follows their own principle that is thegeneral rule of saving as much as money they could despite giving up comfortability tosome extent. Classification of households according to source of income and totalincome plays the very crucial role in studying choices of household energyconsumption and its development.
26 A majority of traditional rural household has developed into part-time farminghousehold. According to application taxonomy of farmers, rural households aredivided into pure farming household, the first part time farming household, the secondpart-time farming household, as well as non-commercial household1. Pure farminghousehold means that most family members engaged in farming, while a fewmembers doing non-farming job whose income is less than 10% of total householdincome; the first part-time farming household, is the one that non-farming familymember is less than or equal to farming members, while the income of latter onesurpasses that of the former; the second part-time farming household refers to familywith non-farming members more than or equal to farming members, but the former’sincome (including salary) is more than the latter; Non-commercial rural householdmeans incapable family who rely on their children or governmental subsidy for living,in which case their children have already got married and live separately from parents.Meanwhile, according to annual average disposable income per family member, ruralhouseholds are classified into three categories as follows2:
1 Zhou Shengqiang, Zhao Kai. Comparison of Sustainable Livelihoods of Rural Residents in DifferentRegions of China: An Income-based Perspective [J].World Agriculture, 2018(09): 168-175.2 From: http://www.gov.cn/xinwen/2018-07/16/content_5306708.htm
18
Classification of
Income of Rural
Residents
A B C
Disposable Income
Per Capita of Rural
Residents
≥11000 >3300;<11000 ≤3300
Figure 10 Classification of Average Income of Rural Residents
(Unit: CNY)
Technology Roadmap 3: Analysis of Field Survey on Typical Rural Residents ofDifferent Types of Energy Consumption
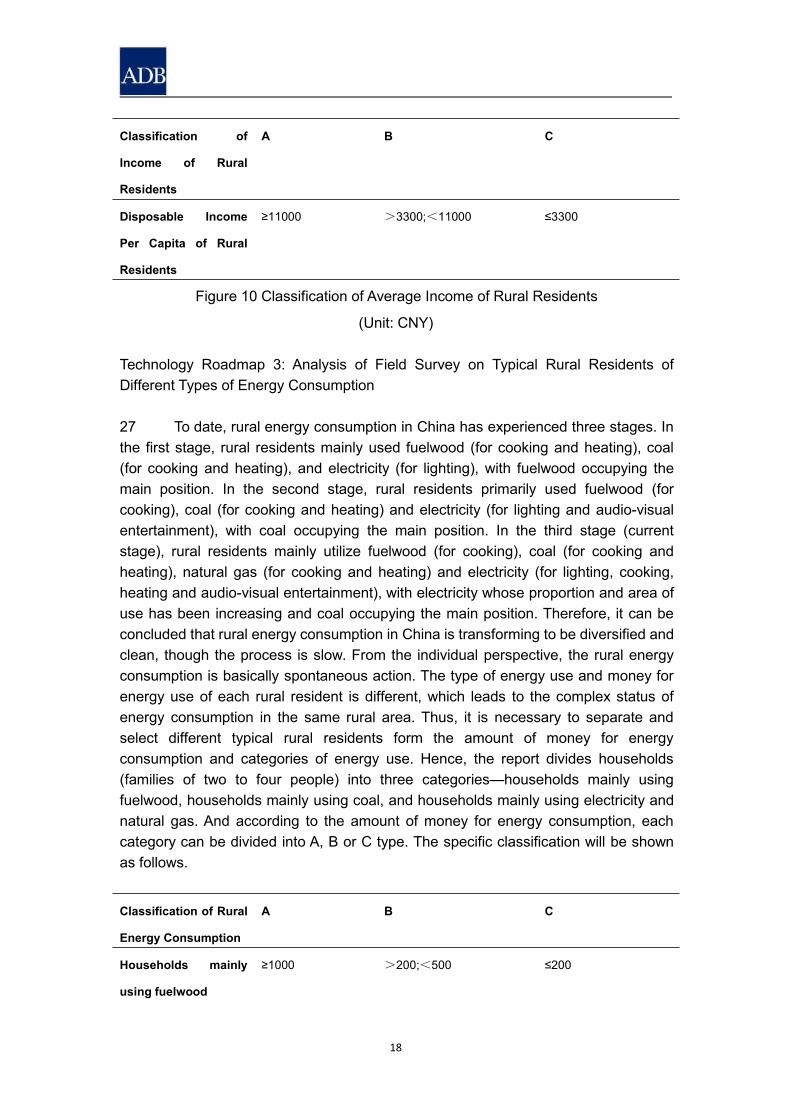
27 To date, rural energy consumption in China has experienced three stages. Inthe first stage, rural residents mainly used fuelwood (for cooking and heating), coal(for cooking and heating), and electricity (for lighting), with fuelwood occupying themain position. In the second stage, rural residents primarily used fuelwood (forcooking), coal (for cooking and heating) and electricity (for lighting and audio-visualentertainment), with coal occupying the main position. In the third stage (currentstage), rural residents mainly utilize fuelwood (for cooking), coal (for cooking andheating), natural gas (for cooking and heating) and electricity (for lighting, cooking,heating and audio-visual entertainment), with electricity whose proportion and area ofuse has been increasing and coal occupying the main position. Therefore, it can beconcluded that rural energy consumption in China is transforming to be diversified andclean, though the process is slow. From the individual perspective, the rural energyconsumption is basically spontaneous action. The type of energy use and money forenergy use of each rural resident is different, which leads to the complex status ofenergy consumption in the same rural area. Thus, it is necessary to separate andselect different typical rural residents form the amount of money for energyconsumption and categories of energy use. Hence, the report divides households(families of two to four people) into three categories—households mainly usingfuelwood, households mainly using coal, and households mainly using electricity andnatural gas. And according to the amount of money for energy consumption, eachcategory can be divided into A, B or C type. The specific classification will be shownas follows.
Classification of Rural
Energy Consumption
A B C
Households mainly
using fuelwood
≥1000 >200;<500 ≤200
19
Households mainly
using coal
≥2000 >1000;<2000 ≤1000
Households mainly
using electricity and
natural gas
≥3000 >1500;<3000 ≤1500
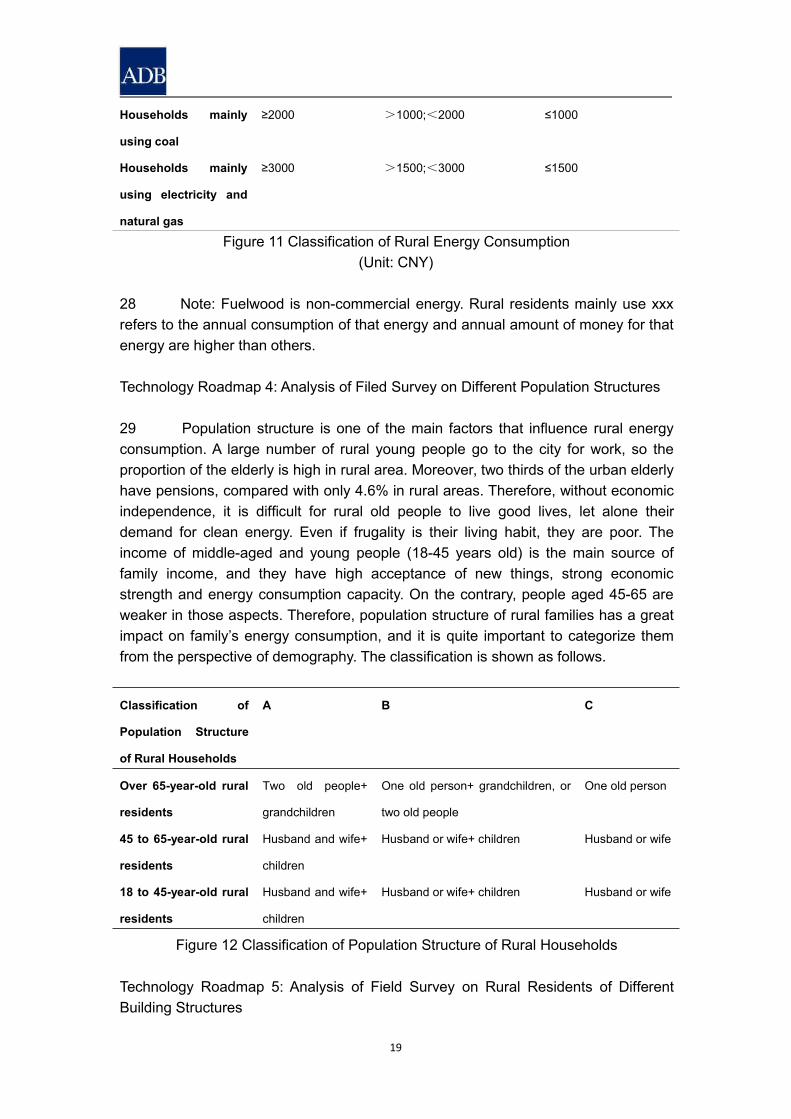
Figure 11 Classification of Rural Energy Consumption(Unit: CNY)
28 Note: Fuelwood is non-commercial energy. Rural residents mainly use xxxrefers to the annual consumption of that energy and annual amount of money for thatenergy are higher than others.
Technology Roadmap 4: Analysis of Filed Survey on Different Population Structures
29 Population structure is one of the main factors that influence rural energyconsumption. A large number of rural young people go to the city for work, so theproportion of the elderly is high in rural area. Moreover, two thirds of the urban elderlyhave pensions, compared with only 4.6% in rural areas. Therefore, without economicindependence, it is difficult for rural old people to live good lives, let alone theirdemand for clean energy. Even if frugality is their living habit, they are poor. Theincome of middle-aged and young people (18-45 years old) is the main source offamily income, and they have high acceptance of new things, strong economicstrength and energy consumption capacity. On the contrary, people aged 45-65 areweaker in those aspects. Therefore, population structure of rural families has a greatimpact on family’s energy consumption, and it is quite important to categorize themfrom the perspective of demography. The classification is shown as follows.
Classification of
Population Structure
of Rural Households
A B C
Over 65-year-old rural
residents
Two old people+
grandchildren
One old person+ grandchildren, or
two old people
One old person
45 to 65-year-old rural
residents
Husband and wife+
children
Husband or wife+ children Husband or wife
18 to 45-year-old rural
residents
Husband and wife+
children
Husband or wife+ children Husband or wife
Figure 12 Classification of Population Structure of Rural Households
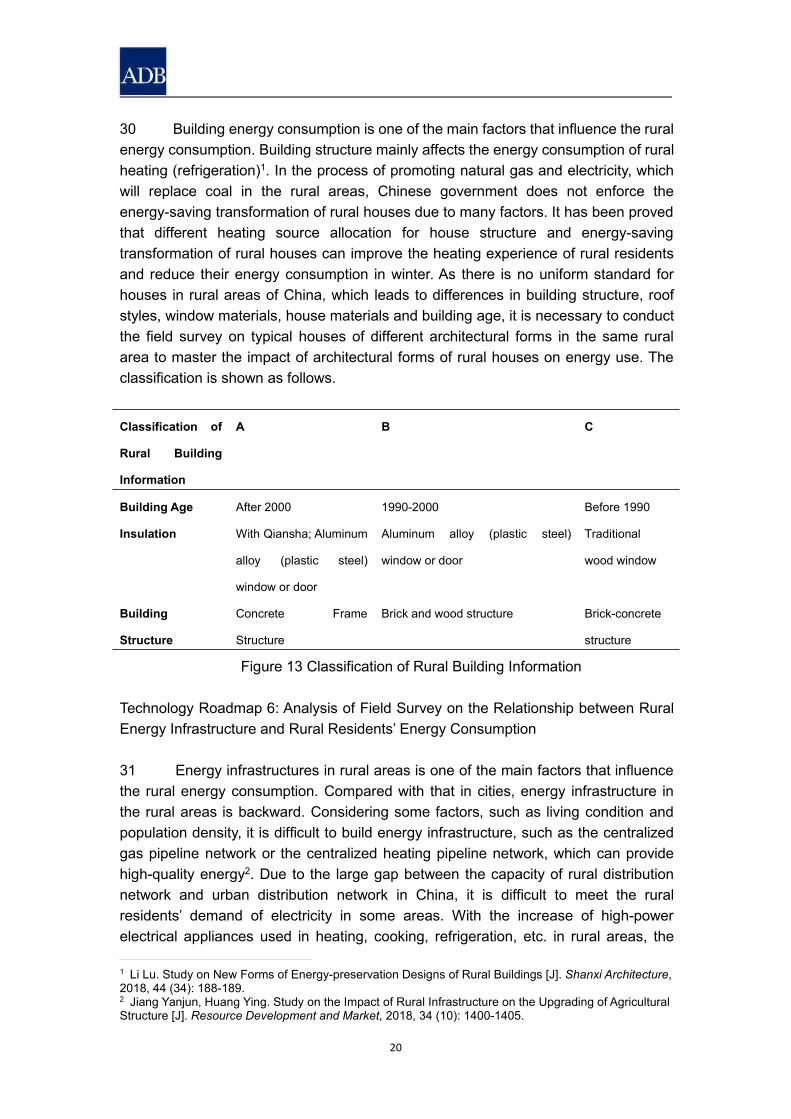
Technology Roadmap 5: Analysis of Field Survey on Rural Residents of DifferentBuilding Structures
20
30 Building energy consumption is one of the main factors that influence the ruralenergy consumption. Building structure mainly affects the energy consumption of ruralheating (refrigeration)1. In the process of promoting natural gas and electricity, whichwill replace coal in the rural areas, Chinese government does not enforce theenergy-saving transformation of rural houses due to many factors. It has been provedthat different heating source allocation for house structure and energy-savingtransformation of rural houses can improve the heating experience of rural residentsand reduce their energy consumption in winter. As there is no uniform standard forhouses in rural areas of China, which leads to differences in building structure, roofstyles, window materials, house materials and building age, it is necessary to conductthe field survey on typical houses of different architectural forms in the same ruralarea to master the impact of architectural forms of rural houses on energy use. Theclassification is shown as follows.
Classification of
Rural Building
Information
A B C
Building Age After 2000 1990-2000 Before 1990
Insulation With Qiansha; Aluminum
alloy (plastic steel)
window or door
Aluminum alloy (plastic steel)
window or door
Traditional
wood window
Building
Structure
Concrete Frame
Structure
Brick and wood structure Brick-concrete
structure
Figure 13 Classification of Rural Building Information
Technology Roadmap 6: Analysis of Field Survey on the Relationship between RuralEnergy Infrastructure and Rural Residents’ Energy Consumption
31 Energy infrastructures in rural areas is one of the main factors that influencethe rural energy consumption. Compared with that in cities, energy infrastructure inthe rural areas is backward. Considering some factors, such as living condition andpopulation density, it is difficult to build energy infrastructure, such as the centralizedgas pipeline network or the centralized heating pipeline network, which can providehigh-quality energy2. Due to the large gap between the capacity of rural distributionnetwork and urban distribution network in China, it is difficult to meet the ruralresidents’ demand of electricity in some areas. With the increase of high-powerelectrical appliances used in heating, cooking, refrigeration, etc. in rural areas, the
1 Li Lu. Study on New Forms of Energy-preservation Designs of Rural Buildings [J]. Shanxi Architecture,2018, 44 (34): 188-189.2 Jiang Yanjun, Huang Ying. Study on the Impact of Rural Infrastructure on the Upgrading of AgriculturalStructure [J]. Resource Development and Market, 2018, 34 (10): 1400-1405.
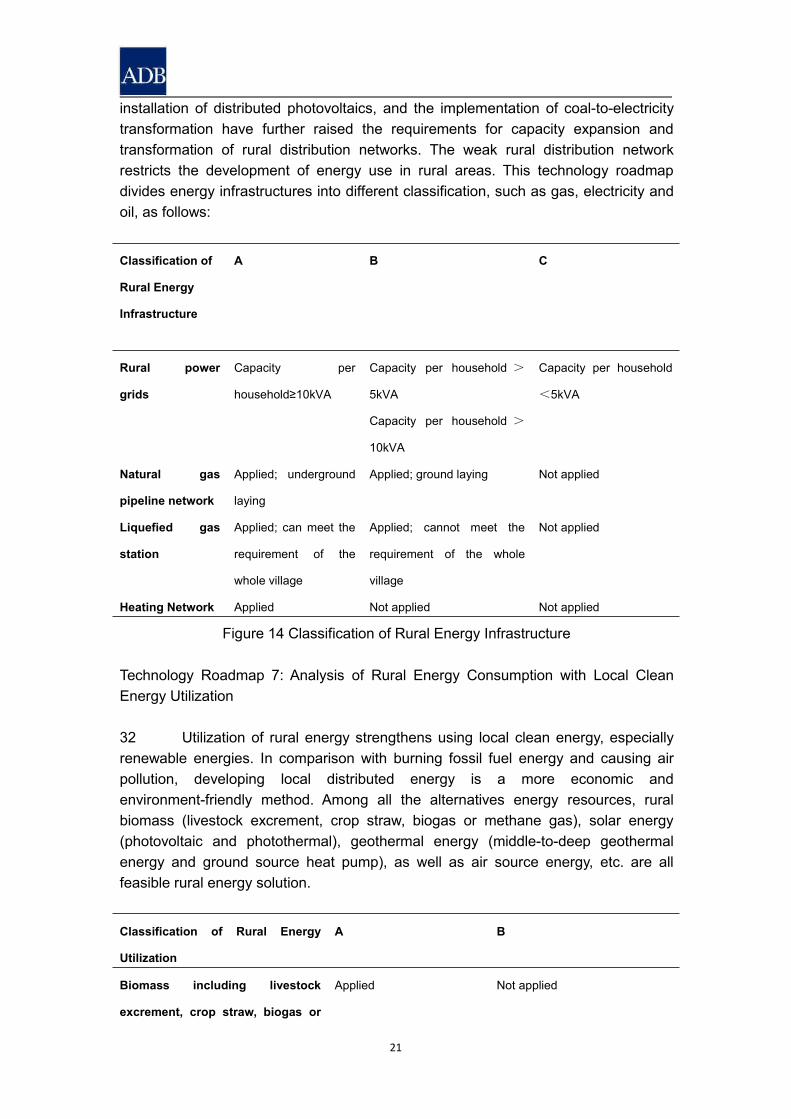
21
installation of distributed photovoltaics, and the implementation of coal-to-electricitytransformation have further raised the requirements for capacity expansion andtransformation of rural distribution networks. The weak rural distribution networkrestricts the development of energy use in rural areas. This technology roadmapdivides energy infrastructures into different classification, such as gas, electricity andoil, as follows:
Classification of
Rural Energy
Infrastructure
A B C
Rural power
grids
Capacity per
household≥10kVA
Capacity per household >
5kVA
Capacity per household >
10kVA
Capacity per household
<5kVA
Natural gas
pipeline network
Applied; underground
laying
Applied; ground laying Not applied
Liquefied gas
station
Applied; can meet the
requirement of the
whole village
Applied; cannot meet the
requirement of the whole
village
Not applied
Heating Network Applied Not applied Not applied
Figure 14 Classification of Rural Energy Infrastructure
Technology Roadmap 7: Analysis of Rural Energy Consumption with Local CleanEnergy Utilization
32 Utilization of rural energy strengthens using local clean energy, especiallyrenewable energies. In comparison with burning fossil fuel energy and causing airpollution, developing local distributed energy is a more economic andenvironment-friendly method. Among all the alternatives energy resources, ruralbiomass (livestock excrement, crop straw, biogas or methane gas), solar energy(photovoltaic and photothermal), geothermal energy (middle-to-deep geothermalenergy and ground source heat pump), as well as air source energy, etc. are allfeasible rural energy solution.
Classification of Rural Energy
Utilization
A B
Biomass including livestock
excrement, crop straw, biogas or
Applied Not applied
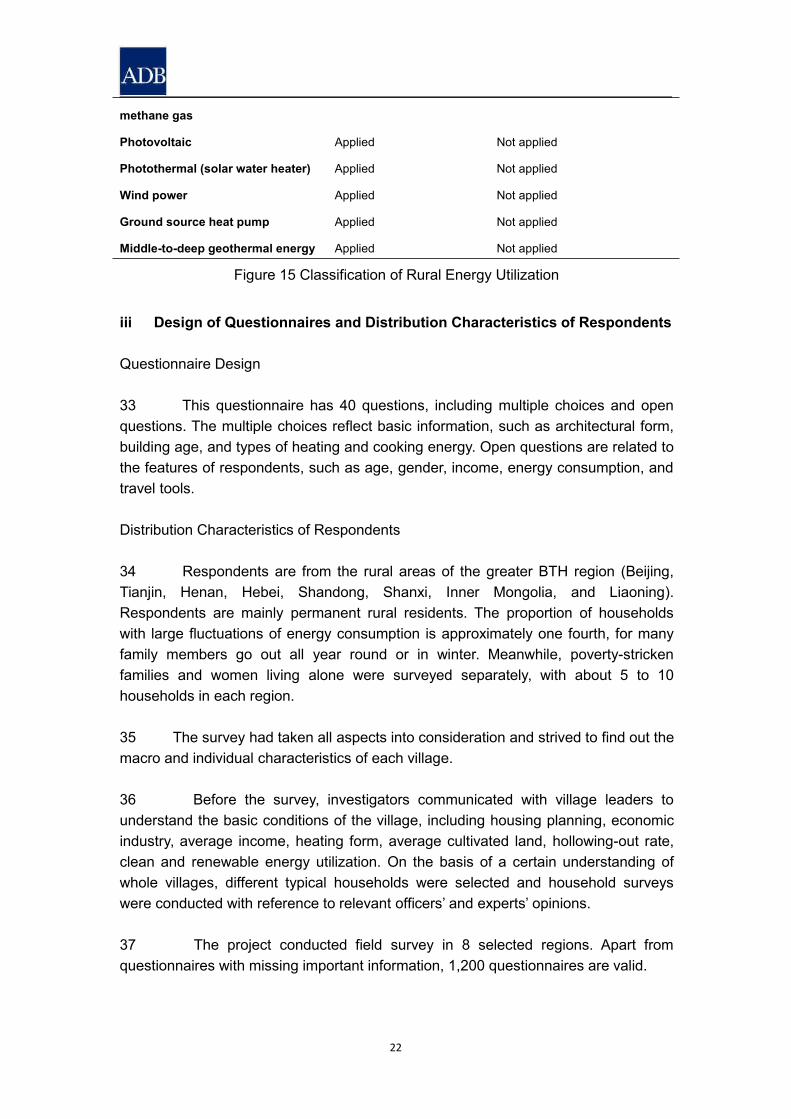
22
methane gas
Photovoltaic Applied Not applied
Photothermal (solar water heater) Applied Not applied
Wind power Applied Not applied
Ground source heat pump Applied Not applied
Middle-to-deep geothermal energy Applied Not applied
Figure 15 Classification of Rural Energy Utilization
iii Design of Questionnaires and Distribution Characteristics of Respondents
Questionnaire Design
33 This questionnaire has 40 questions, including multiple choices and openquestions. The multiple choices reflect basic information, such as architectural form,building age, and types of heating and cooking energy. Open questions are related tothe features of respondents, such as age, gender, income, energy consumption, andtravel tools.
Distribution Characteristics of Respondents
34 Respondents are from the rural areas of the greater BTH region (Beijing,Tianjin, Henan, Hebei, Shandong, Shanxi, Inner Mongolia, and Liaoning).Respondents are mainly permanent rural residents. The proportion of householdswith large fluctuations of energy consumption is approximately one fourth, for manyfamily members go out all year round or in winter. Meanwhile, poverty-strickenfamilies and women living alone were surveyed separately, with about 5 to 10households in each region.
35 The survey had taken all aspects into consideration and strived to find out themacro and individual characteristics of each village.
36 Before the survey, investigators communicated with village leaders tounderstand the basic conditions of the village, including housing planning, economicindustry, average income, heating form, average cultivated land, hollowing-out rate,clean and renewable energy utilization. On the basis of a certain understanding ofwhole villages, different typical households were selected and household surveyswere conducted with reference to relevant officers’ and experts’ opinions.
37 The project conducted field survey in 8 selected regions. Apart fromquestionnaires with missing important information, 1,200 questionnaires are valid.
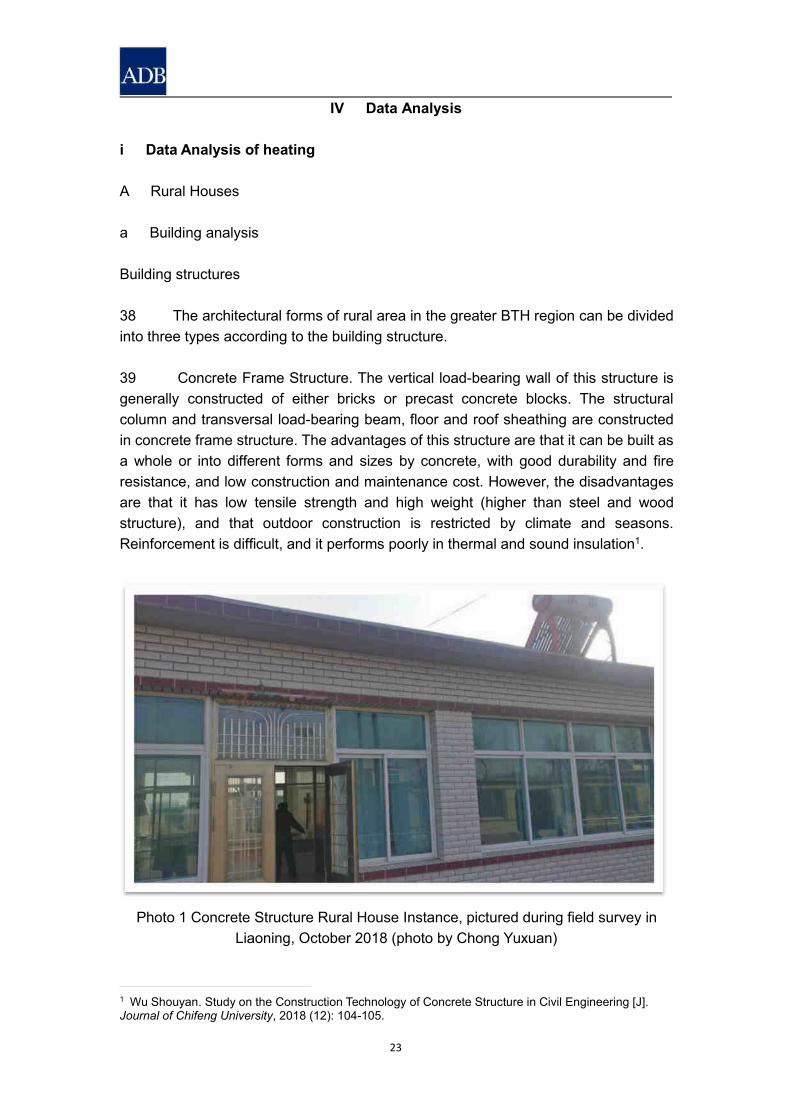
23
IV Data Analysis
i Data Analysis of heating
A Rural Houses
a Building analysis
Building structures
38 The architectural forms of rural area in the greater BTH region can be dividedinto three types according to the building structure.
39 Concrete Frame Structure. The vertical load-bearing wall of this structure isgenerally constructed of either bricks or precast concrete blocks. The structuralcolumn and transversal load-bearing beam, floor and roof sheathing are constructedin concrete frame structure. The advantages of this structure are that it can be built asa whole or into different forms and sizes by concrete, with good durability and fireresistance, and low construction and maintenance cost. However, the disadvantagesare that it has low tensile strength and high weight (higher than steel and woodstructure), and that outdoor construction is restricted by climate and seasons.Reinforcement is difficult, and it performs poorly in thermal and sound insulation1.
Photo 1 Concrete Structure Rural House Instance, pictured during field survey inLiaoning, October 2018 (photo by Chong Yuxuan)
1 Wu Shouyan. Study on the Construction Technology of Concrete Structure in Civil Engineering [J].Journal of Chifeng University, 2018 (12): 104-105.
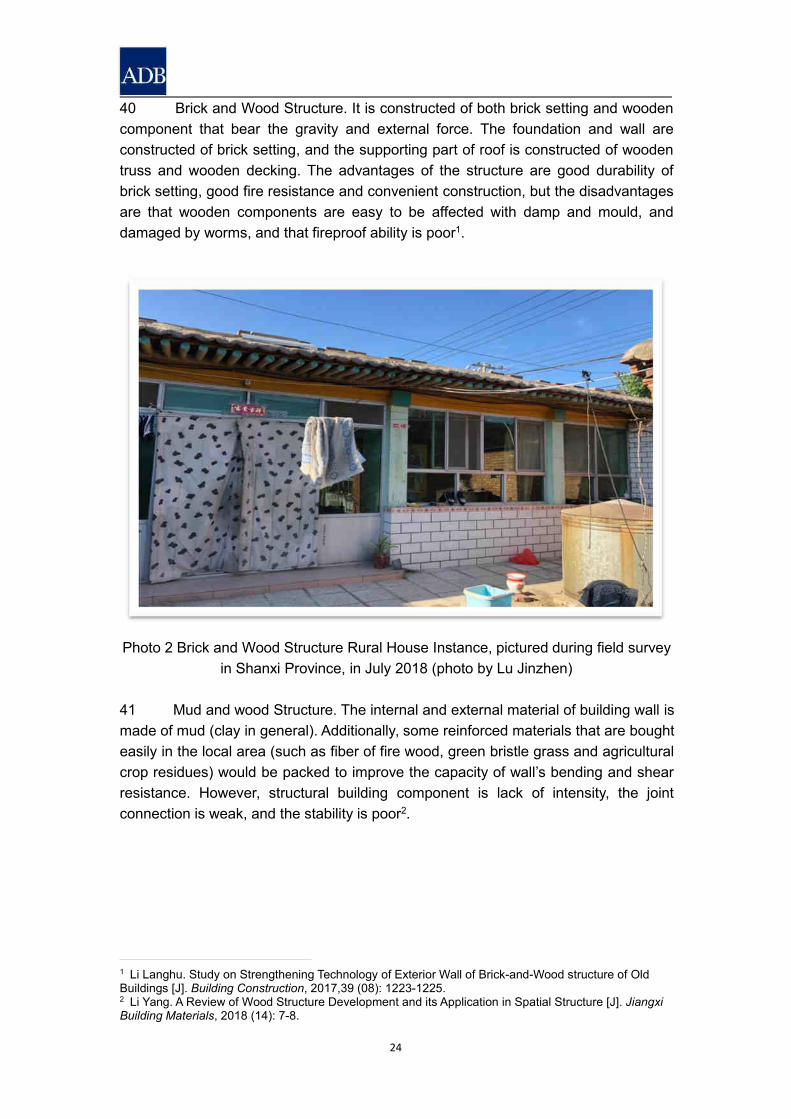
24
40 Brick and Wood Structure. It is constructed of both brick setting and woodencomponent that bear the gravity and external force. The foundation and wall areconstructed of brick setting, and the supporting part of roof is constructed of woodentruss and wooden decking. The advantages of the structure are good durability ofbrick setting, good fire resistance and convenient construction, but the disadvantagesare that wooden components are easy to be affected with damp and mould, anddamaged by worms, and that fireproof ability is poor1.
Photo 2 Brick and Wood Structure Rural House Instance, pictured during field surveyin Shanxi Province, in July 2018 (photo by Lu Jinzhen)
41 Mud and wood Structure. The internal and external material of building wall ismade of mud (clay in general). Additionally, some reinforced materials that are boughteasily in the local area (such as fiber of fire wood, green bristle grass and agriculturalcrop residues) would be packed to improve the capacity of wall’s bending and shearresistance. However, structural building component is lack of intensity, the jointconnection is weak, and the stability is poor2.
1 Li Langhu. Study on Strengthening Technology of Exterior Wall of Brick-and-Wood structure of OldBuildings [J]. Building Construction, 2017,39 (08): 1223-1225.2 Li Yang. A Review of Wood Structure Development and its Application in Spatial Structure [J]. JiangxiBuilding Materials, 2018 (14): 7-8.
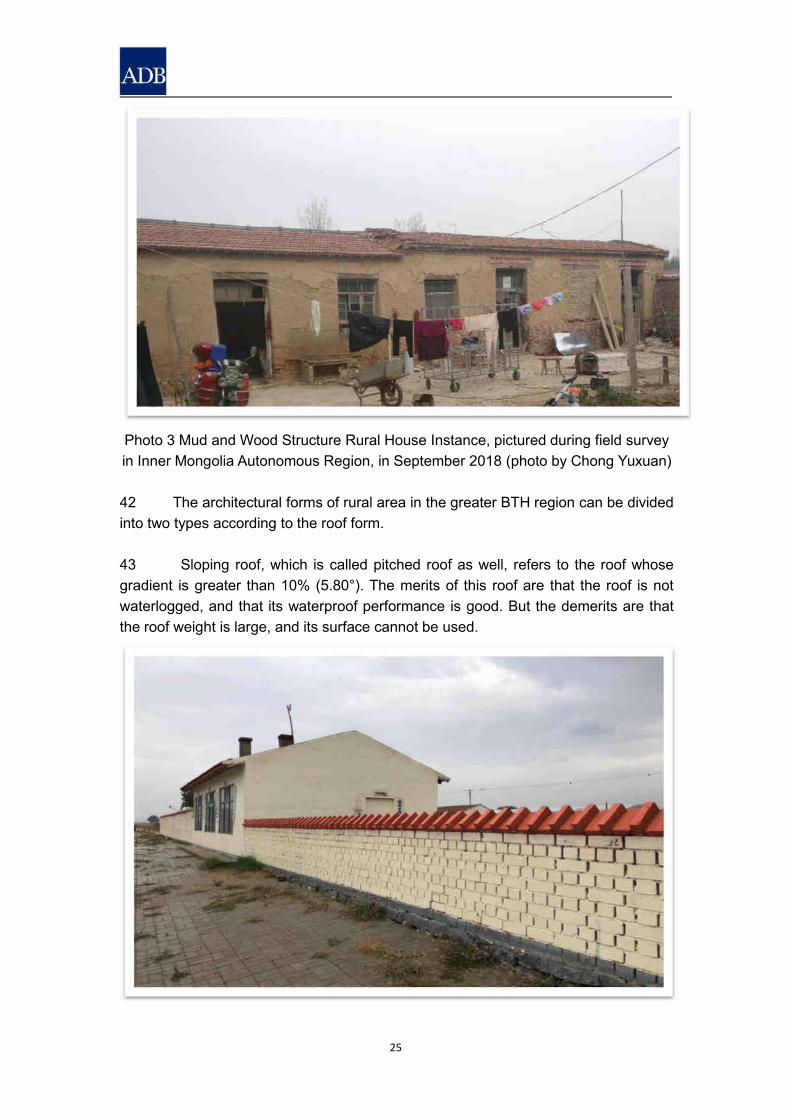
25
Photo 3 Mud and Wood Structure Rural House Instance, pictured during field surveyin Inner Mongolia Autonomous Region, in September 2018 (photo by Chong Yuxuan)
42 The architectural forms of rural area in the greater BTH region can be dividedinto two types according to the roof form.
43 Sloping roof, which is called pitched roof as well, refers to the roof whosegradient is greater than 10% (5.80°). The merits of this roof are that the roof is notwaterlogged, and that its waterproof performance is good. But the demerits are thatthe roof weight is large, and its surface cannot be used.
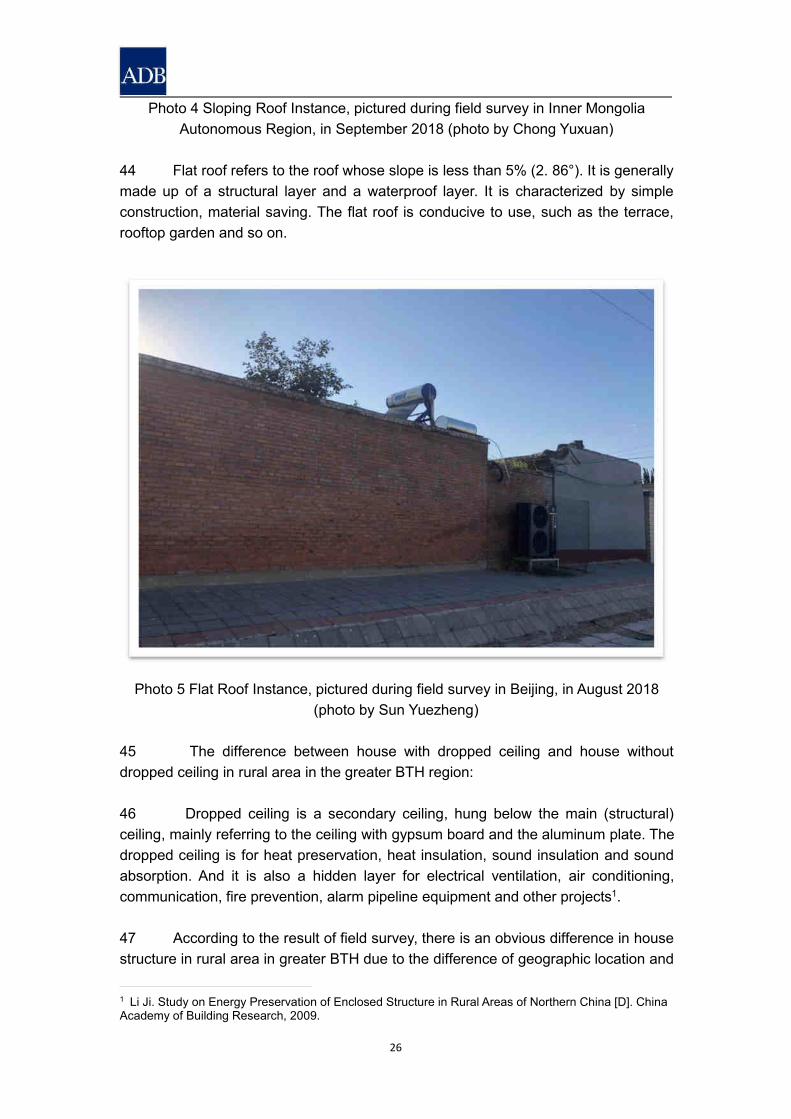
26
Photo 4 Sloping Roof Instance, pictured during field survey in Inner MongoliaAutonomous Region, in September 2018 (photo by Chong Yuxuan)
44 Flat roof refers to the roof whose slope is less than 5% (2. 86°). It is generallymade up of a structural layer and a waterproof layer. It is characterized by simpleconstruction, material saving. The flat roof is conducive to use, such as the terrace,rooftop garden and so on.
Photo 5 Flat Roof Instance, pictured during field survey in Beijing, in August 2018(photo by Sun Yuezheng)
45 The difference between house with dropped ceiling and house withoutdropped ceiling in rural area in the greater BTH region:
46 Dropped ceiling is a secondary ceiling, hung below the main (structural)ceiling, mainly referring to the ceiling with gypsum board and the aluminum plate. Thedropped ceiling is for heat preservation, heat insulation, sound insulation and soundabsorption. And it is also a hidden layer for electrical ventilation, air conditioning,communication, fire prevention, alarm pipeline equipment and other projects1.
47 According to the result of field survey, there is an obvious difference in housestructure in rural area in greater BTH due to the difference of geographic location and
1 Li Ji. Study on Energy Preservation of Enclosed Structure in Rural Areas of Northern China [D]. ChinaAcademy of Building Research, 2009.
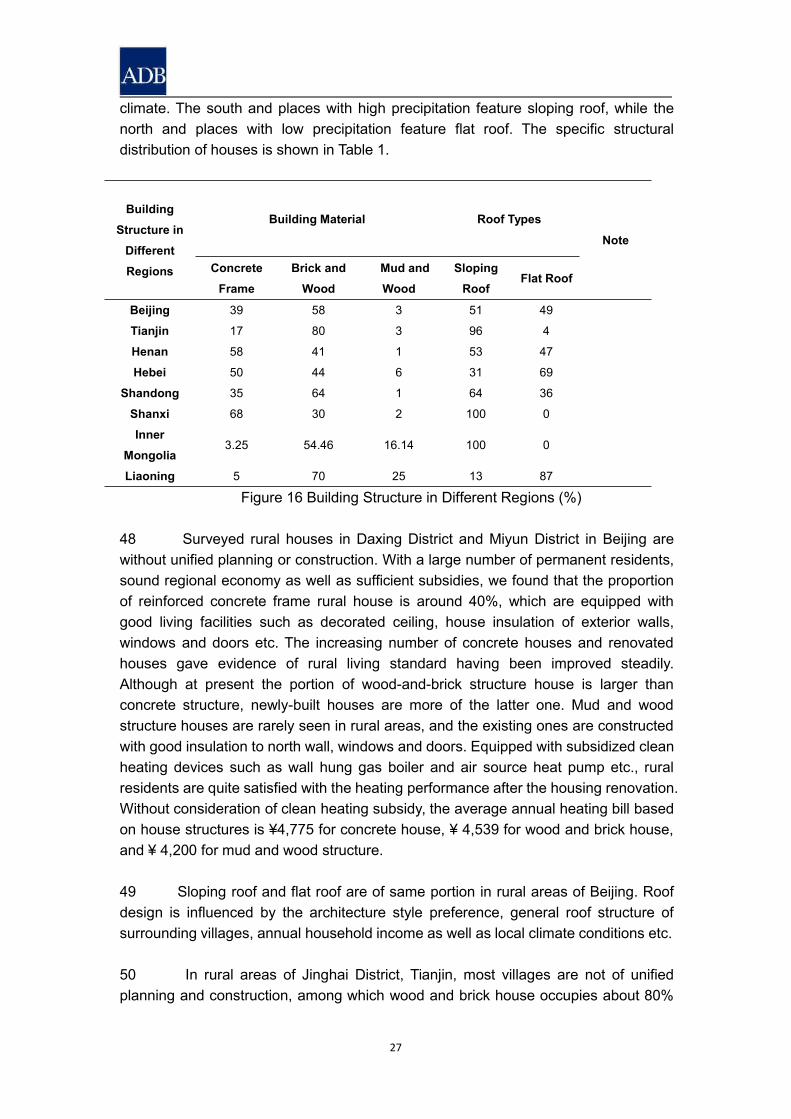
27
climate. The south and places with high precipitation feature sloping roof, while thenorth and places with low precipitation feature flat roof. The specific structuraldistribution of houses is shown in Table 1.
BuildingStructure in
DifferentRegions
Building Material Roof TypesNote
ConcreteFrame
Brick andWood
Mud andWood
SlopingRoof
Flat Roof
Beijing 39 58 3 51 49
Tianjin 17 80 3 96 4
Henan 58 41 1 53 47
Hebei 50 44 6 31 69
Shandong 35 64 1 64 36
Shanxi 68 30 2 100 0
InnerMongolia
3.25 54.46 16.14 100 0
Liaoning 5 70 25 13 87
Figure 16 Building Structure in Different Regions (%)
48 Surveyed rural houses in Daxing District and Miyun District in Beijing arewithout unified planning or construction. With a large number of permanent residents,sound regional economy as well as sufficient subsidies, we found that the proportionof reinforced concrete frame rural house is around 40%, which are equipped withgood living facilities such as decorated ceiling, house insulation of exterior walls,windows and doors etc. The increasing number of concrete houses and renovatedhouses gave evidence of rural living standard having been improved steadily.Although at present the portion of wood-and-brick structure house is larger thanconcrete structure, newly-built houses are more of the latter one. Mud and woodstructure houses are rarely seen in rural areas, and the existing ones are constructedwith good insulation to north wall, windows and doors. Equipped with subsidized cleanheating devices such as wall hung gas boiler and air source heat pump etc., ruralresidents are quite satisfied with the heating performance after the housing renovation.Without consideration of clean heating subsidy, the average annual heating bill basedon house structures is ¥4,775 for concrete house, ¥ 4,539 for wood and brick house,and ¥ 4,200 for mud and wood structure.
49 Sloping roof and flat roof are of same portion in rural areas of Beijing. Roofdesign is influenced by the architecture style preference, general roof structure ofsurrounding villages, annual household income as well as local climate conditions etc.
50 In rural areas of Jinghai District, Tianjin, most villages are not of unifiedplanning and construction, among which wood and brick house occupies about 80%
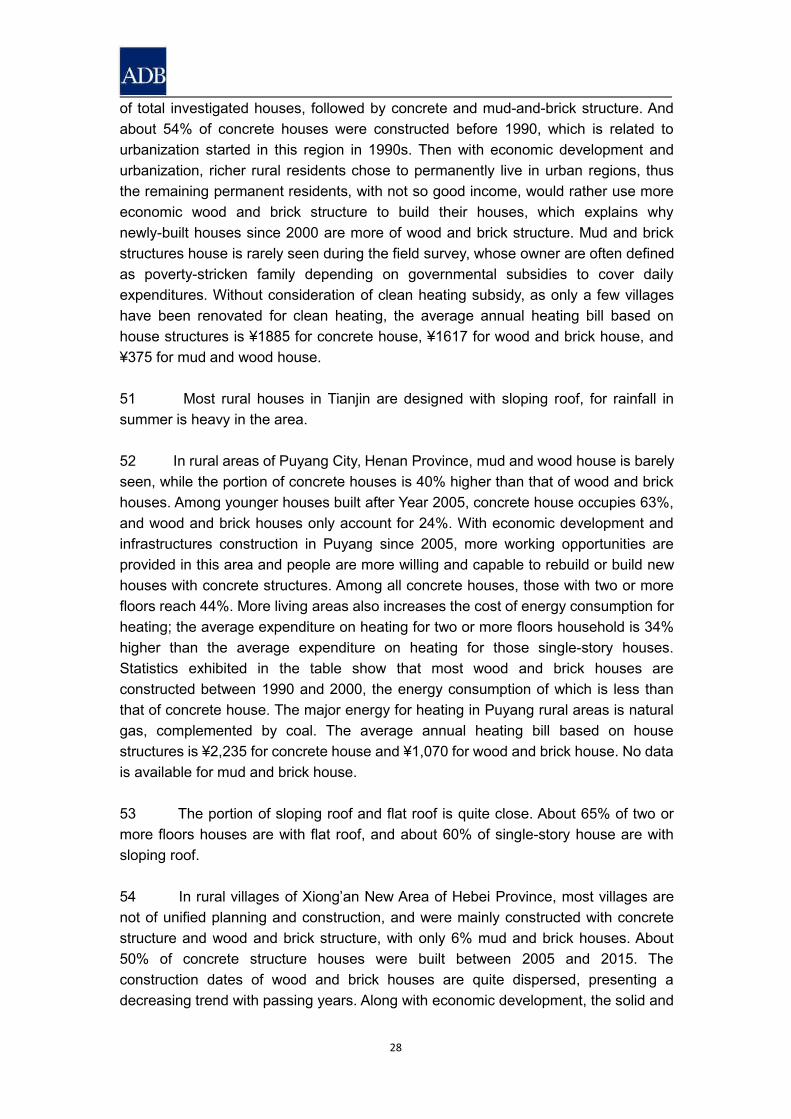
28
of total investigated houses, followed by concrete and mud-and-brick structure. Andabout 54% of concrete houses were constructed before 1990, which is related tourbanization started in this region in 1990s. Then with economic development andurbanization, richer rural residents chose to permanently live in urban regions, thusthe remaining permanent residents, with not so good income, would rather use moreeconomic wood and brick structure to build their houses, which explains whynewly-built houses since 2000 are more of wood and brick structure. Mud and brickstructures house is rarely seen during the field survey, whose owner are often definedas poverty-stricken family depending on governmental subsidies to cover dailyexpenditures. Without consideration of clean heating subsidy, as only a few villageshave been renovated for clean heating, the average annual heating bill based onhouse structures is ¥1885 for concrete house, ¥1617 for wood and brick house, and¥375 for mud and wood house.
51 Most rural houses in Tianjin are designed with sloping roof, for rainfall insummer is heavy in the area.
52 In rural areas of Puyang City, Henan Province, mud and wood house is barelyseen, while the portion of concrete houses is 40% higher than that of wood and brickhouses. Among younger houses built after Year 2005, concrete house occupies 63%,and wood and brick houses only account for 24%. With economic development andinfrastructures construction in Puyang since 2005, more working opportunities areprovided in this area and people are more willing and capable to rebuild or build newhouses with concrete structures. Among all concrete houses, those with two or morefloors reach 44%. More living areas also increases the cost of energy consumption forheating; the average expenditure on heating for two or more floors household is 34%higher than the average expenditure on heating for those single-story houses.Statistics exhibited in the table show that most wood and brick houses areconstructed between 1990 and 2000, the energy consumption of which is less thanthat of concrete house. The major energy for heating in Puyang rural areas is naturalgas, complemented by coal. The average annual heating bill based on housestructures is ¥2,235 for concrete house and ¥1,070 for wood and brick house. No datais available for mud and brick house.
53 The portion of sloping roof and flat roof is quite close. About 65% of two ormore floors houses are with flat roof, and about 60% of single-story house are withsloping roof.
54 In rural villages of Xiong’an New Area of Hebei Province, most villages arenot of unified planning and construction, and were mainly constructed with concretestructure and wood and brick structure, with only 6% mud and brick houses. About50% of concrete structure houses were built between 2005 and 2015. Theconstruction dates of wood and brick houses are quite dispersed, presenting adecreasing trend with passing years. Along with economic development, the solid and
29
easily constructed concrete structure has become more popular. Old houses with mudand brick structures were built before 1980 with un-renovated living facilities. Mostrural residents in this region mainly use natural gas for heating, while residents in oldhouses still use coal for heating. Without consideration of clean heating subsidy, theaverage annual heating bill based on house structures is ¥2,442 for concrete house,¥2,047 for wood and brick house, and ¥900 for mud and brick house.
55 Roof design is also affected by building materials. 85.3% of concrete structurehouses are constructed with sloping roof; 51.5% of wood and brick structure housesare with sloping roof; 55.6% of mud and brick structure houses are with sloping roof.Since 2005, both architecture design and materials have changed.
56 In rural area of Jinan City, Shandong Province, concrete structure houseoccupies 35%; wood and brick structure occupy 64%; and civil structure occupies lessthan 1%. About 45% of concrete structure house were built after 2015, among which54% are with two stories. The construction dates of wood and brick structure houseare evenly distributed in three periods, with 26% constructed between 1990 and 2000,28% constructed between 2000 and 2005, and 50% constructed between 2005 and2015. The portion of concrete structure is increasing in newly built houses year byyear. And the number of newly built wood and brick structure house has witnessedgradual increase. It is estimated that there would be more newly built concretestructure house in the future. Coal is the main energy for heating in rural areas inShandong, complemented by electronic devices. The average annual heating billbased on house structures is ¥1,380 for concrete house, ¥960 for wood and brickhouse. No data are available for mud and brick house.
57 Sloping roof occupies 64% of total rural households investigated in Shandong,and flat roof occupies 36%. Over 95% of wood-and-brick structure and mud and brickstructure houses have been designed with sloping roof, and nearly all the concretestructure house have been constructed with flat roof.
58 In the surveyed rural areas of Changzhi City, Shanxi Province, concretestructure houses occupy 68%, with wood and brick structure houses accounting for30% and mud and brick structure houses accounting for 2%. About 70% of concretestructure houses were built after 2005 and 94% concrete structure houses areconstructed with two or more stories. Although with larger floor area, the living area ismainly on the ground floor, the second floor is mainly used for storage of corns andother things. More than 50% of wood and brick structure house were built between1980 and 2000, also most of which were built with two stories. Most single-story ruralhouses have around 100 square meters open space in the yard for storage of cornsand raising poultry. In this area, electricity is the major energy for heating. Withoutconsideration of clean heating subsidy, the average annual heating bill based onhouse structures is ¥3,000 for concrete house, ¥1,950 for wood and brick house, and¥850 for mud and brick house.
30
59 Due to rural living habits and traditional architecture style, sloping roof iscommonly seen in rural areas of Shanxi Province.
60 In surveyed rural areas of Ulanqab City, Inner Mongolia Autonomous Region,most rural houses are of wood and brick structure, accounting for 54.46%. Concretestructure house occupies 3.25% and mud-and-brick structure house occupies 16.14%.Among investigated wood and brick structure houses, 77% were of unified planningand construction or renovation in 2013. The unified houses were constructed withfloor area of 42.8 m2 and living area of 39.6 m2, and the comparatively small livingarea help to decrease overall energy consumption, especially for heating. 80% ofconcrete structure houses were built after 2005, most of which were constructed byrural residents themselves with larger floor area and living area. Compared with woodand brick structure, the average floor area of concrete structure house is 16% largerthan that of wood and brick structure; the average living area is 24% larger than thatof wood and brick structure. The investigated mud and brick structure houses were allbuilt before 1990, whose owners are generally over 60 years old. Coal is the majorenergy for heating in winter. The average annual heating bill based on housestructures is ¥2,350 for concrete house, ¥1,958 for wood and brick house, and ¥1,433for mud and brick house.
61 In rural areas of Ulanqab, all houses were designed with sloping roof fordrainage purpose, as Ulanqab features a cold semi-arid climate. Divided by DaqingMountain, its front area is warm and humid while back area is windy. More than half ofthe annual precipitation of around 150mm to 450 mm falls in July, August andSeptember. Another reason is policy-guided that unified planning and construction ispart of local poverty alleviation program. The unified slope roof structure hadultimately curbed the usage of solar water heater, with less than 10% of houses in theinvestigated area having solar water heater.
62 In rural areas of Jinzhou City, Liaoning Province, about half of rural houseswere built with wood and brick structure, followed by concrete structure andmud-and-brick structure. Concrete structure houses were mainly constructed after2000. But newly built concrete structure houses in recent five years only account for11% of the total investigated concrete houses, which is evidence that the populationof permanent residents in rural areas of this region is getting less. Wood and brickstructure houses were mainly constructed between 1990 and 2015. Local residentsprefer wood and brick structure over others. The old mud and brick structure houseswere built between 1980 and 2005, and now their conditions are not good for livingand they need renovation.
63 Crop straw and coal is the major energy for heating. The average annualheating bill based on house structures is ¥1,213 for concrete house, ¥1,248 for woodand brick house, and ¥1,612 for mud and brick house.
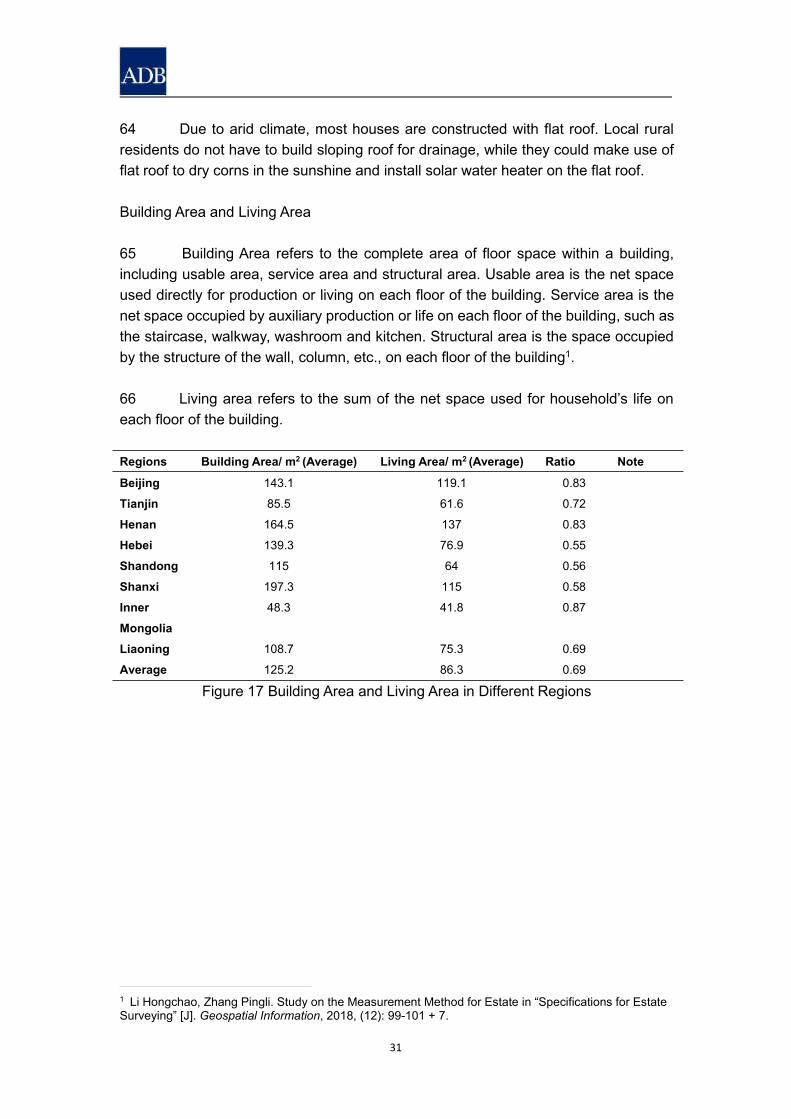
31
64 Due to arid climate, most houses are constructed with flat roof. Local ruralresidents do not have to build sloping roof for drainage, while they could make use offlat roof to dry corns in the sunshine and install solar water heater on the flat roof.
Building Area and Living Area
65 Building Area refers to the complete area of floor space within a building,including usable area, service area and structural area. Usable area is the net spaceused directly for production or living on each floor of the building. Service area is thenet space occupied by auxiliary production or life on each floor of the building, such asthe staircase, walkway, washroom and kitchen. Structural area is the space occupiedby the structure of the wall, column, etc., on each floor of the building1.
66 Living area refers to the sum of the net space used for household’s life oneach floor of the building.
Regions Building Area/ m2 (Average) Living Area/ m2 (Average) Ratio NoteBeijing 143.1 119.1 0.83
Tianjin 85.5 61.6 0.72
Henan 164.5 137 0.83
Hebei 139.3 76.9 0.55
Shandong 115 64 0.56
Shanxi 197.3 115 0.58
InnerMongolia
48.3 41.8 0.87
Liaoning 108.7 75.3 0.69
Average 125.2 86.3 0.69
Figure 17 Building Area and Living Area in Different Regions
1 Li Hongchao, Zhang Pingli. Study on the Measurement Method for Estate in “Specifications for EstateSurveying” [J]. Geospatial Information, 2018, (12): 99-101 + 7.
32
Additional Information:
The Influence of Houses on Heating
1. The Influence of Building Material on Heating
According to published document, Thermal Conductivity per meter is 1.28W/m·K fornormal concrete wall, 0.39-0.42W/m·K for dry brick wall, 0.52-1.67W/m·K for earthwall (water content between 2% and 10%). Field survey showed that most ruralhouses in greater BTH region use dry brick wall and wooden structure, which is betterfor keeping warm1.
2. The Influence of Roof Structure and Dropped Ceiling on Heating
As the topmost building component of the building’s perimeter structure, roof isimportant for building energy efficiency. The thermal insulation of building mainlydepends on the materials used, but the slope of roof also has an effect on roomtemperature. The room area becomes larger as the slope increases, and the amountof solar radiation received by the building grows as the room area increases2.
From the perspective of energy conservation, the thermal insulation of roof has agreater impact on energy consumption than the slope of roof. Therefore, consideringenergy conservation, the thermal insulation of the roof material is prioritized. Inaddition, on the premise of the same roof material, the scope of roof is analyzed.
In winter, the scope of roof has little impact on the indoor temperature variation, andthe energy consumption is the lowest between the slope of twenty to thirty-degree. Insummer, indoor temperature has little relevance to the scope of roof as well, but theenergy consumption increases as the slope rises. Yet such rises is slow between theslope of fifteen to twenty-five degree. As far as energy consumption variation in thewhole year is concerned, the energy consumption grows with the increase of theslope of roof, but such growth is slow in the slope between fifteen to thirty degrees.Thus, from the above analysis, the roof slope is optimal in slope of twenty to thirtydegree on the premise of the same roof material3.
3. Ratio of Living Area and Building Area
Field Survey showed that in greater BTH region the ratio of building area and livingarea is between 56% and 87%. Smaller living area costs less heating energy in winter.
1 Huang Shanyan. Study on the Measurement Method and Influencing Factors of Thermal Conductivityof Building Materials [J]. Sichuan Building Materials, 2018,44 (07): 19-20.2 Xu Qitai. Research on Adaptation of Rural House Roof [D]. Harbin Institute of Technology, 2010.3 Dong Xinlu. Research on Energy-efficiency Strategy for Envelop Enclosure of Rural House in SevereCold Area of Northeast [D]. Harbin Institute of Technology, 2014.
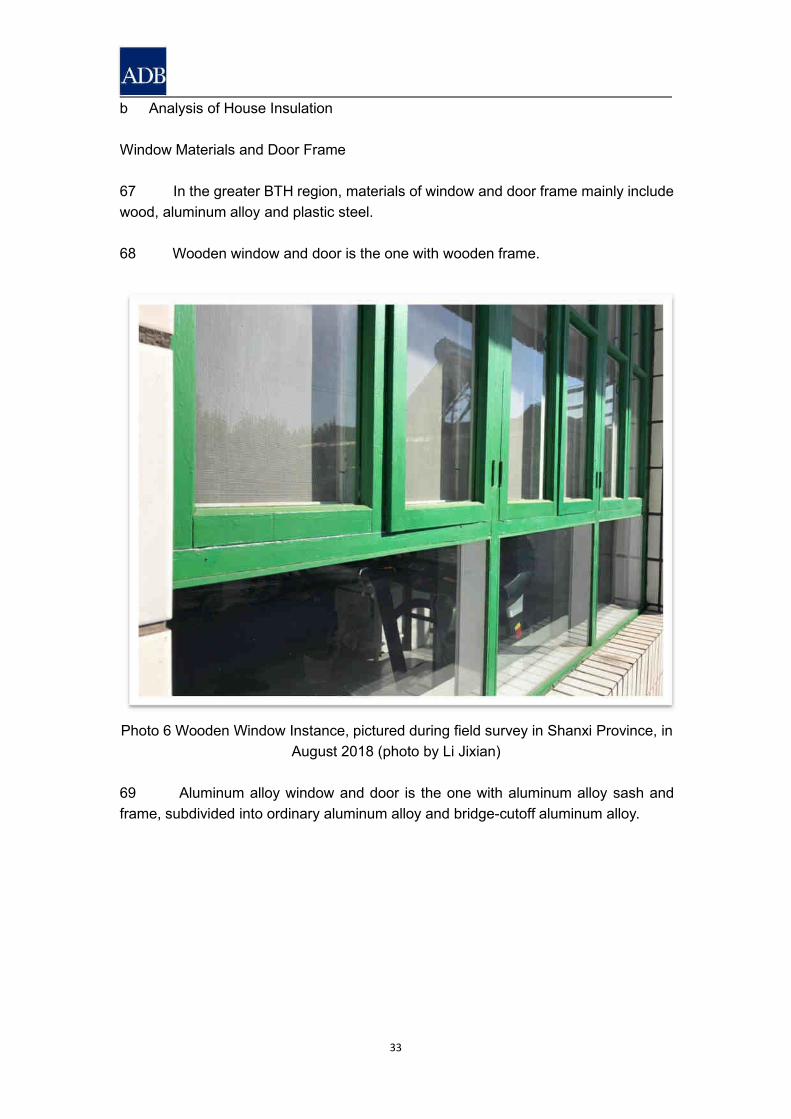
33
b Analysis of House Insulation
Window Materials and Door Frame
67 In the greater BTH region, materials of window and door frame mainly includewood, aluminum alloy and plastic steel.
68 Wooden window and door is the one with wooden frame.
Photo 6 Wooden Window Instance, pictured during field survey in Shanxi Province, inAugust 2018 (photo by Li Jixian)
69 Aluminum alloy window and door is the one with aluminum alloy sash andframe, subdivided into ordinary aluminum alloy and bridge-cutoff aluminum alloy.
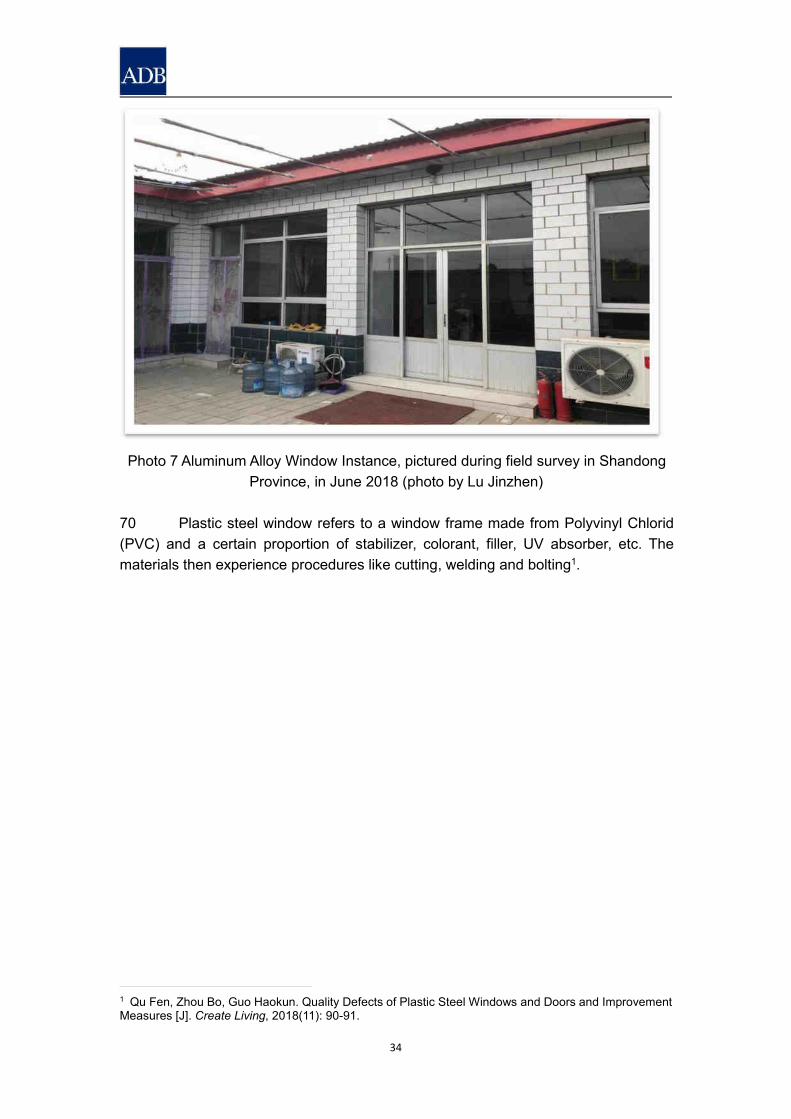
34
Photo 7 Aluminum Alloy Window Instance, pictured during field survey in ShandongProvince, in June 2018 (photo by Lu Jinzhen)
70 Plastic steel window refers to a window frame made from Polyvinyl Chlorid(PVC) and a certain proportion of stabilizer, colorant, filler, UV absorber, etc. Thematerials then experience procedures like cutting, welding and bolting1.
1 Qu Fen, Zhou Bo, Guo Haokun. Quality Defects of Plastic Steel Windows and Doors and ImprovementMeasures [J]. Create Living, 2018(11): 90-91.
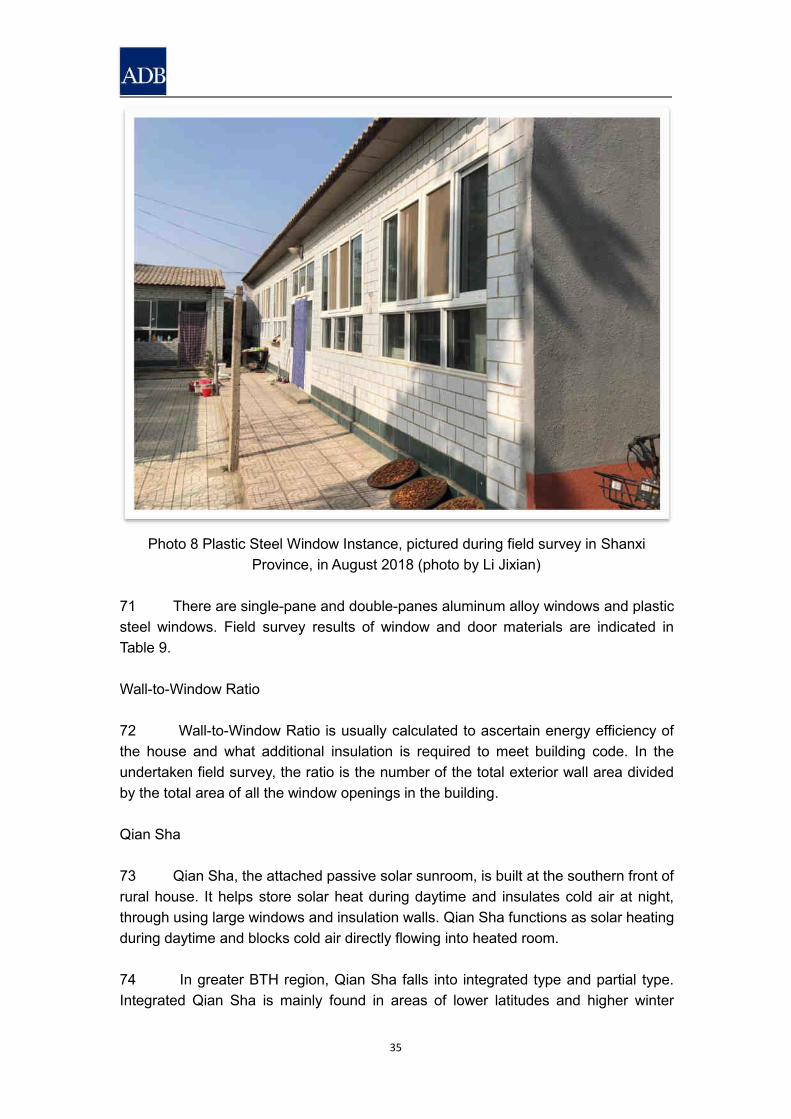
35
Photo 8 Plastic Steel Window Instance, pictured during field survey in ShanxiProvince, in August 2018 (photo by Li Jixian)
71 There are single-pane and double-panes aluminum alloy windows and plasticsteel windows. Field survey results of window and door materials are indicated inTable 9.
Wall-to-Window Ratio
72 Wall-to-Window Ratio is usually calculated to ascertain energy efficiency ofthe house and what additional insulation is required to meet building code. In theundertaken field survey, the ratio is the number of the total exterior wall area dividedby the total area of all the window openings in the building.
Qian Sha
73 Qian Sha, the attached passive solar sunroom, is built at the southern front ofrural house. It helps store solar heat during daytime and insulates cold air at night,through using large windows and insulation walls. Qian Sha functions as solar heatingduring daytime and blocks cold air directly flowing into heated room.
74 In greater BTH region, Qian Sha falls into integrated type and partial type.Integrated Qian Sha is mainly found in areas of lower latitudes and higher winter
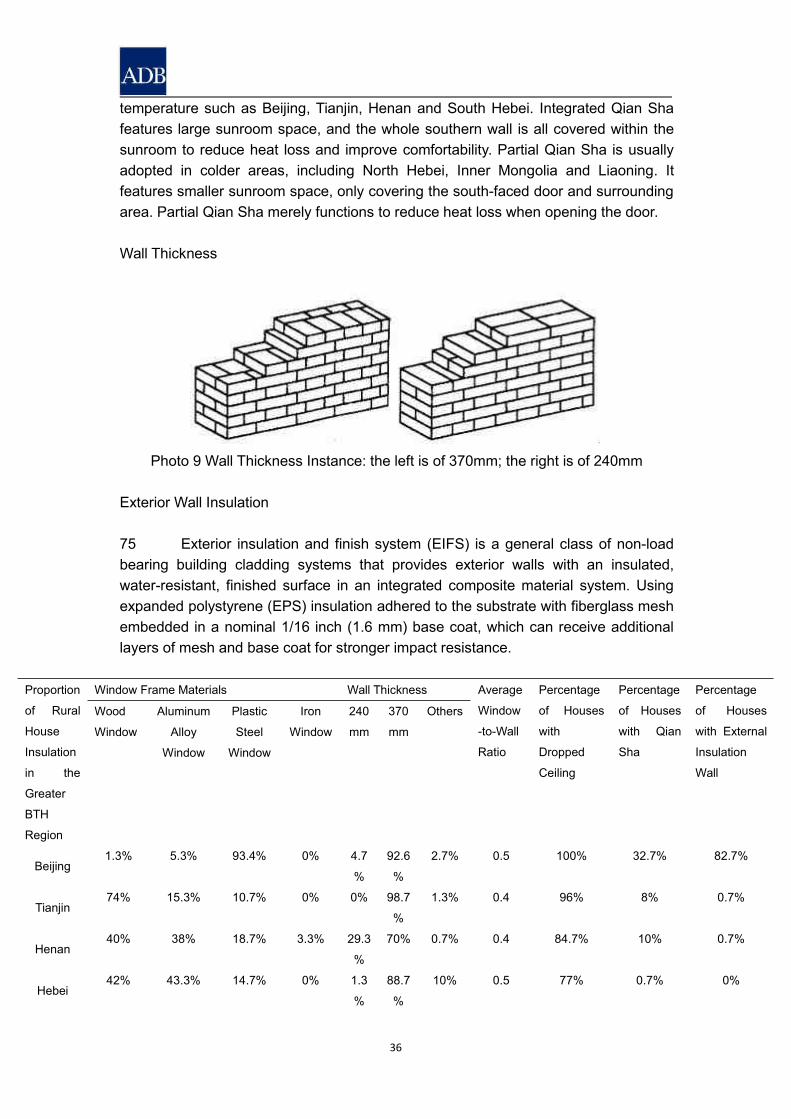
36
temperature such as Beijing, Tianjin, Henan and South Hebei. Integrated Qian Shafeatures large sunroom space, and the whole southern wall is all covered within thesunroom to reduce heat loss and improve comfortability. Partial Qian Sha is usuallyadopted in colder areas, including North Hebei, Inner Mongolia and Liaoning. Itfeatures smaller sunroom space, only covering the south-faced door and surroundingarea. Partial Qian Sha merely functions to reduce heat loss when opening the door.
Wall Thickness
Photo 9 Wall Thickness Instance: the left is of 370mm; the right is of 240mm
Exterior Wall Insulation
75 Exterior insulation and finish system (EIFS) is a general class of non-loadbearing building cladding systems that provides exterior walls with an insulated,water-resistant, finished surface in an integrated composite material system. Usingexpanded polystyrene (EPS) insulation adhered to the substrate with fiberglass meshembedded in a nominal 1/16 inch (1.6 mm) base coat, which can receive additionallayers of mesh and base coat for stronger impact resistance.
Proportion
of Rural
House
Insulation
in the
Greater
BTH
Region
Window Frame Materials Wall Thickness Average
Window
-to-Wall
Ratio
Percentage
of Houses
with
Dropped
Ceiling
Percentage
of Houses
with Qian
Sha
Percentage
of Houses
with External
Insulation
Wall
Wood
Window
Aluminum
Alloy
Window
Plastic
Steel
Window
Iron
Window
240
mm
370
mm
Others
Beijing1.3% 5.3% 93.4% 0% 4.7
%
92.6
%
2.7% 0.5 100% 32.7% 82.7%
Tianjin74% 15.3% 10.7% 0% 0% 98.7
%
1.3% 0.4 96% 8% 0.7%
Henan40% 38% 18.7% 3.3% 29.3
%
70% 0.7% 0.4 84.7% 10% 0.7%
Hebei42% 43.3% 14.7% 0% 1.3
%
88.7
%
10% 0.5 77% 0.7% 0%
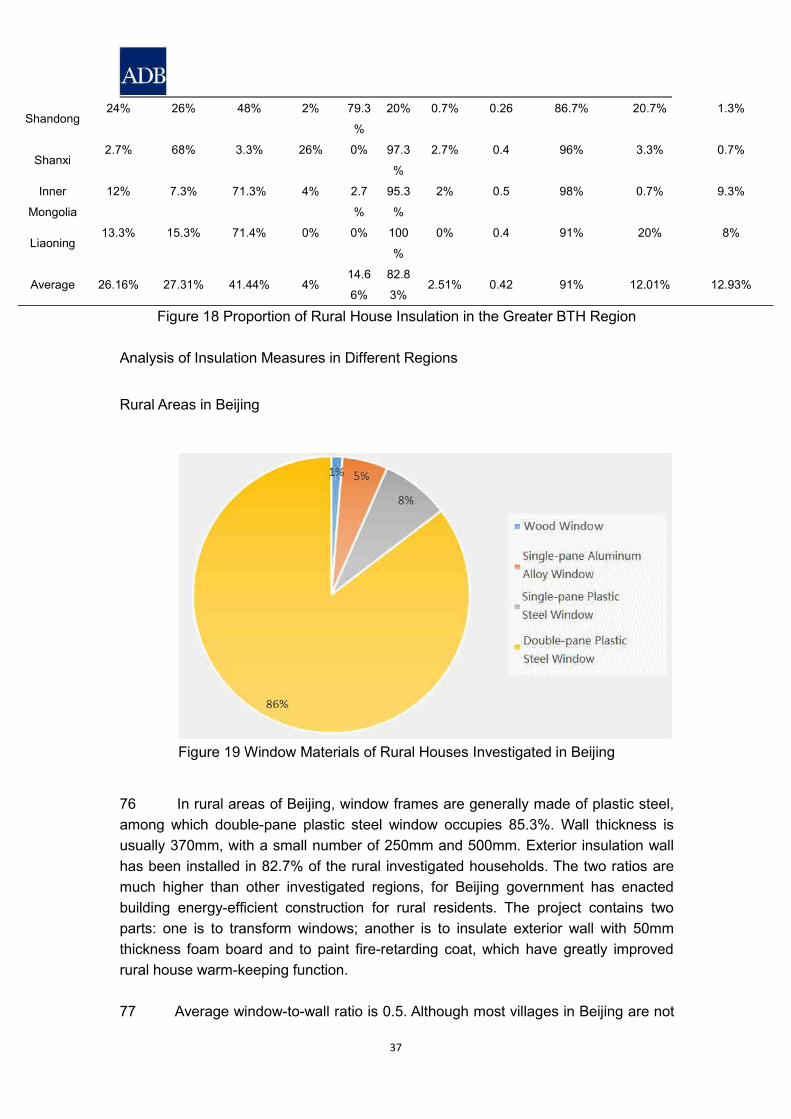
37
Shandong24% 26% 48% 2% 79.3
%
20% 0.7% 0.26 86.7% 20.7% 1.3%
Shanxi2.7% 68% 3.3% 26% 0% 97.3
%
2.7% 0.4 96% 3.3% 0.7%
Inner
Mongolia
12% 7.3% 71.3% 4% 2.7
%
95.3
%
2% 0.5 98% 0.7% 9.3%
Liaoning13.3% 15.3% 71.4% 0% 0% 100
%
0% 0.4 91% 20% 8%
Average 26.16% 27.31% 41.44% 4%14.6
6%
82.8
3%2.51% 0.42 91% 12.01% 12.93%
Figure 18 Proportion of Rural House Insulation in the Greater BTH Region
Analysis of Insulation Measures in Different Regions
Rural Areas in Beijing
Figure 19 Window Materials of Rural Houses Investigated in Beijing
76 In rural areas of Beijing, window frames are generally made of plastic steel,among which double-pane plastic steel window occupies 85.3%. Wall thickness isusually 370mm, with a small number of 250mm and 500mm. Exterior insulation wallhas been installed in 82.7% of the rural investigated households. The two ratios aremuch higher than other investigated regions, for Beijing government has enactedbuilding energy-efficient construction for rural residents. The project contains twoparts: one is to transform windows; another is to insulate exterior wall with 50mmthickness foam board and to paint fire-retarding coat, which have greatly improvedrural house warm-keeping function.
77 Average window-to-wall ratio is 0.5. Although most villages in Beijing are not
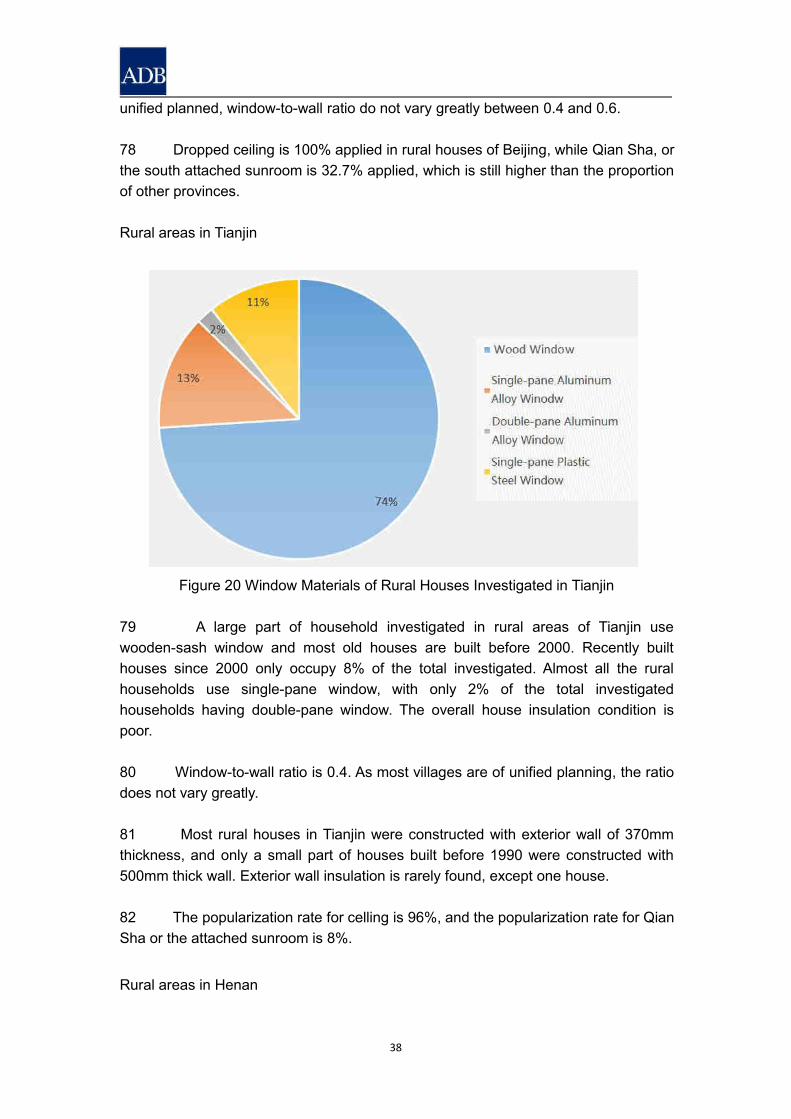
38
unified planned, window-to-wall ratio do not vary greatly between 0.4 and 0.6.
78 Dropped ceiling is 100% applied in rural houses of Beijing, while Qian Sha, orthe south attached sunroom is 32.7% applied, which is still higher than the proportionof other provinces.
Rural areas in Tianjin
Figure 20 Window Materials of Rural Houses Investigated in Tianjin
79 A large part of household investigated in rural areas of Tianjin usewooden-sash window and most old houses are built before 2000. Recently builthouses since 2000 only occupy 8% of the total investigated. Almost all the ruralhouseholds use single-pane window, with only 2% of the total investigatedhouseholds having double-pane window. The overall house insulation condition ispoor.
80 Window-to-wall ratio is 0.4. As most villages are of unified planning, the ratiodoes not vary greatly.
81 Most rural houses in Tianjin were constructed with exterior wall of 370mmthickness, and only a small part of houses built before 1990 were constructed with500mm thick wall. Exterior wall insulation is rarely found, except one house.
82 The popularization rate for celling is 96%, and the popularization rate for QianSha or the attached sunroom is 8%.
Rural areas in Henan
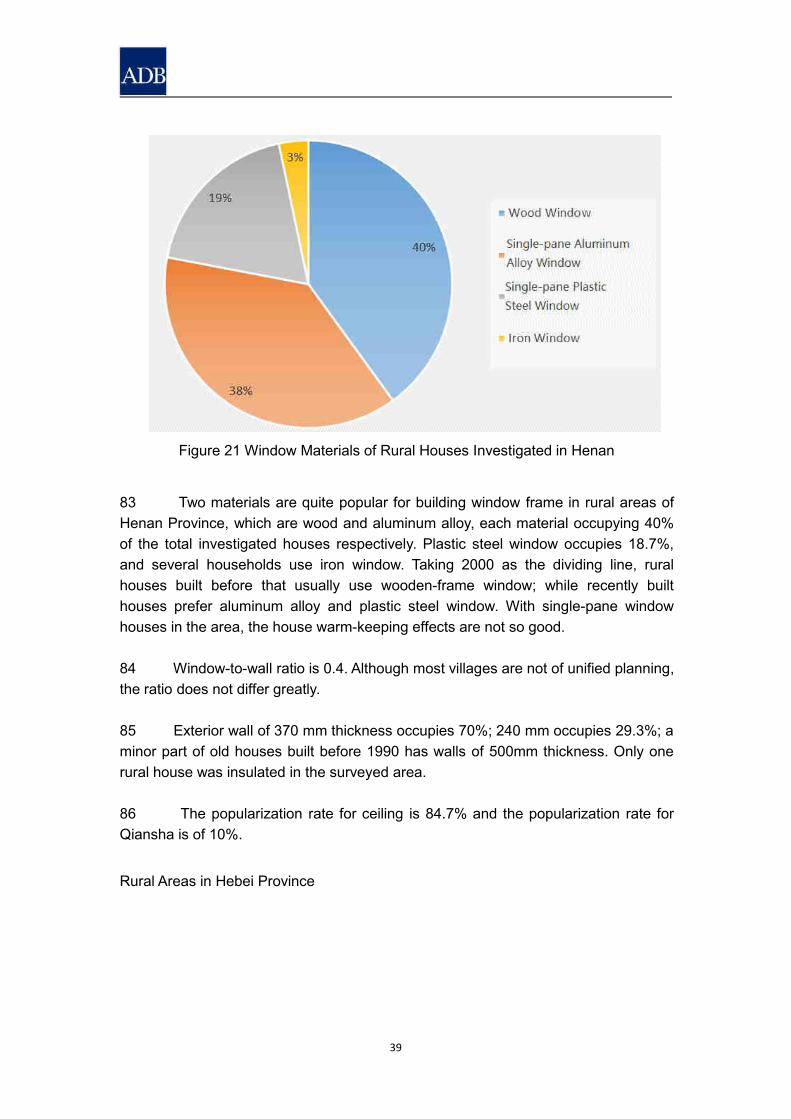
39
Figure 21 Window Materials of Rural Houses Investigated in Henan
83 Two materials are quite popular for building window frame in rural areas ofHenan Province, which are wood and aluminum alloy, each material occupying 40%of the total investigated houses respectively. Plastic steel window occupies 18.7%,and several households use iron window. Taking 2000 as the dividing line, ruralhouses built before that usually use wooden-frame window; while recently builthouses prefer aluminum alloy and plastic steel window. With single-pane windowhouses in the area, the house warm-keeping effects are not so good.
84 Window-to-wall ratio is 0.4. Although most villages are not of unified planning,the ratio does not differ greatly.
85 Exterior wall of 370 mm thickness occupies 70%; 240 mm occupies 29.3%; aminor part of old houses built before 1990 has walls of 500mm thickness. Only onerural house was insulated in the surveyed area.
86 The popularization rate for ceiling is 84.7% and the popularization rate forQiansha is of 10%.
Rural Areas in Hebei Province
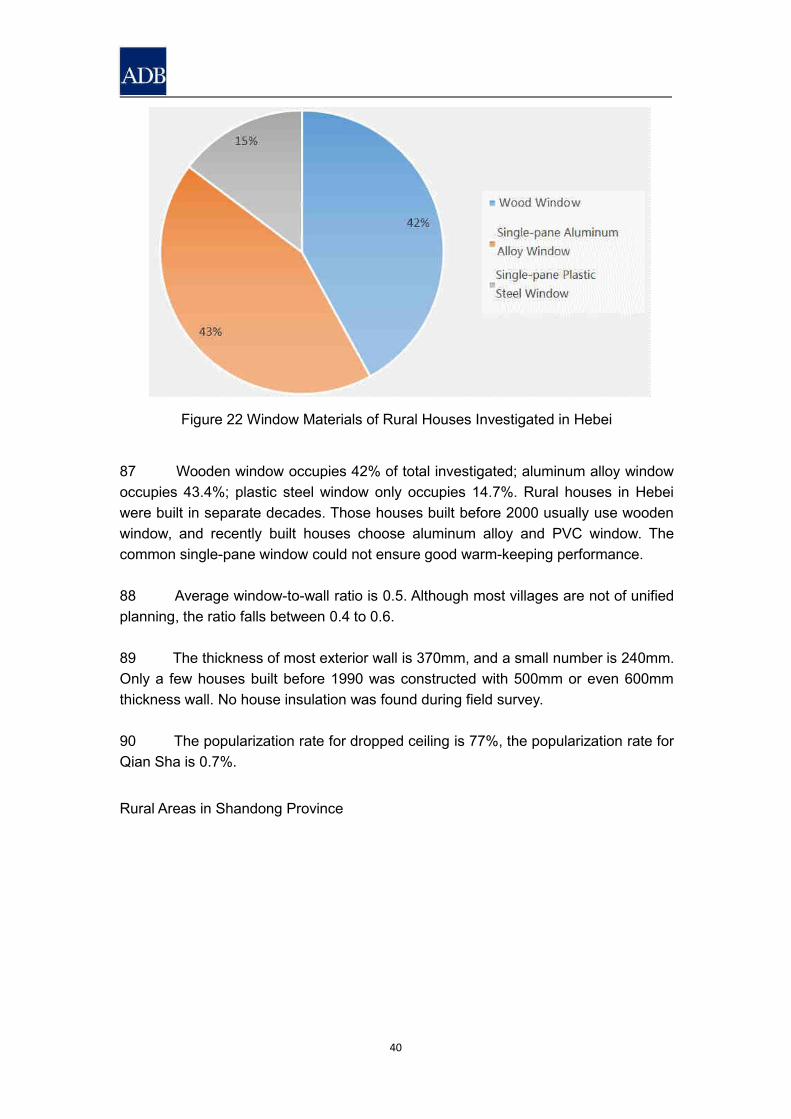
40
Figure 22 Window Materials of Rural Houses Investigated in Hebei
87 Wooden window occupies 42% of total investigated; aluminum alloy windowoccupies 43.4%; plastic steel window only occupies 14.7%. Rural houses in Hebeiwere built in separate decades. Those houses built before 2000 usually use woodenwindow, and recently built houses choose aluminum alloy and PVC window. Thecommon single-pane window could not ensure good warm-keeping performance.
88 Average window-to-wall ratio is 0.5. Although most villages are not of unifiedplanning, the ratio falls between 0.4 to 0.6.
89 The thickness of most exterior wall is 370mm, and a small number is 240mm.Only a few houses built before 1990 was constructed with 500mm or even 600mmthickness wall. No house insulation was found during field survey.
90 The popularization rate for dropped ceiling is 77%, the popularization rate forQian Sha is 0.7%.
Rural Areas in Shandong Province
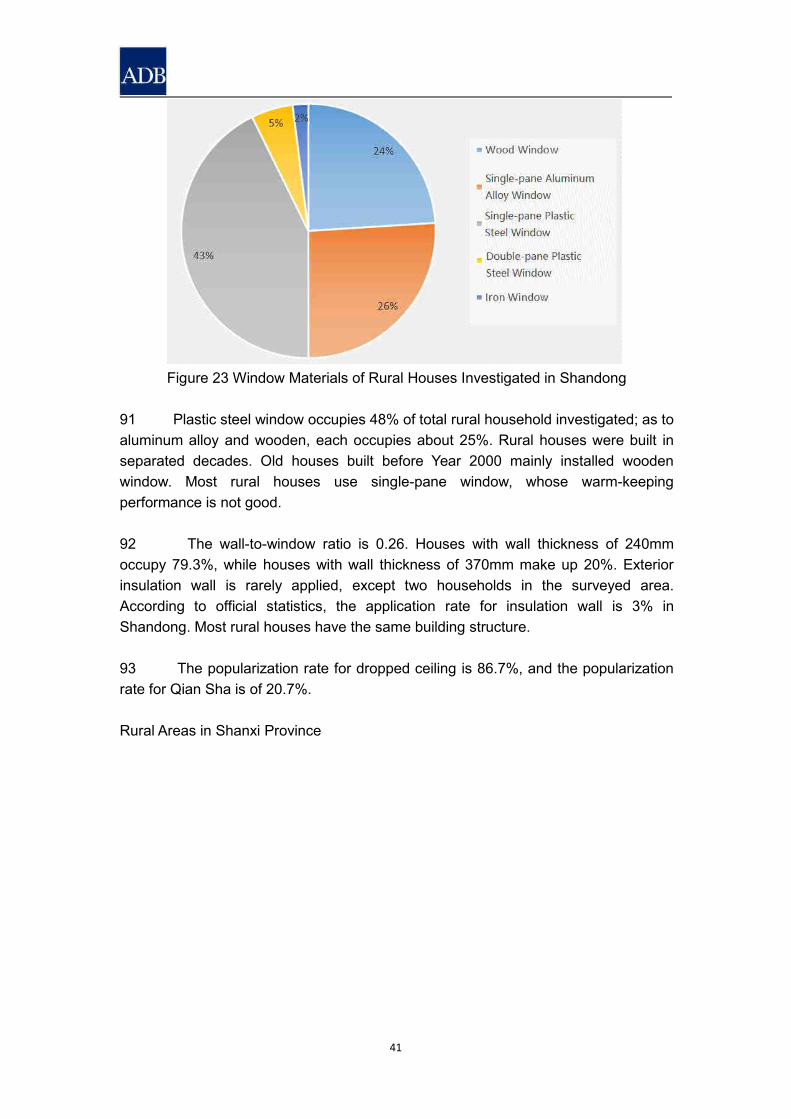
41
Figure 23 Window Materials of Rural Houses Investigated in Shandong
91 Plastic steel window occupies 48% of total rural household investigated; as toaluminum alloy and wooden, each occupies about 25%. Rural houses were built inseparated decades. Old houses built before Year 2000 mainly installed woodenwindow. Most rural houses use single-pane window, whose warm-keepingperformance is not good.
92 The wall-to-window ratio is 0.26. Houses with wall thickness of 240mmoccupy 79.3%, while houses with wall thickness of 370mm make up 20%. Exteriorinsulation wall is rarely applied, except two households in the surveyed area.According to official statistics, the application rate for insulation wall is 3% inShandong. Most rural houses have the same building structure.
93 The popularization rate for dropped ceiling is 86.7%, and the popularizationrate for Qian Sha is of 20.7%.
Rural Areas in Shanxi Province
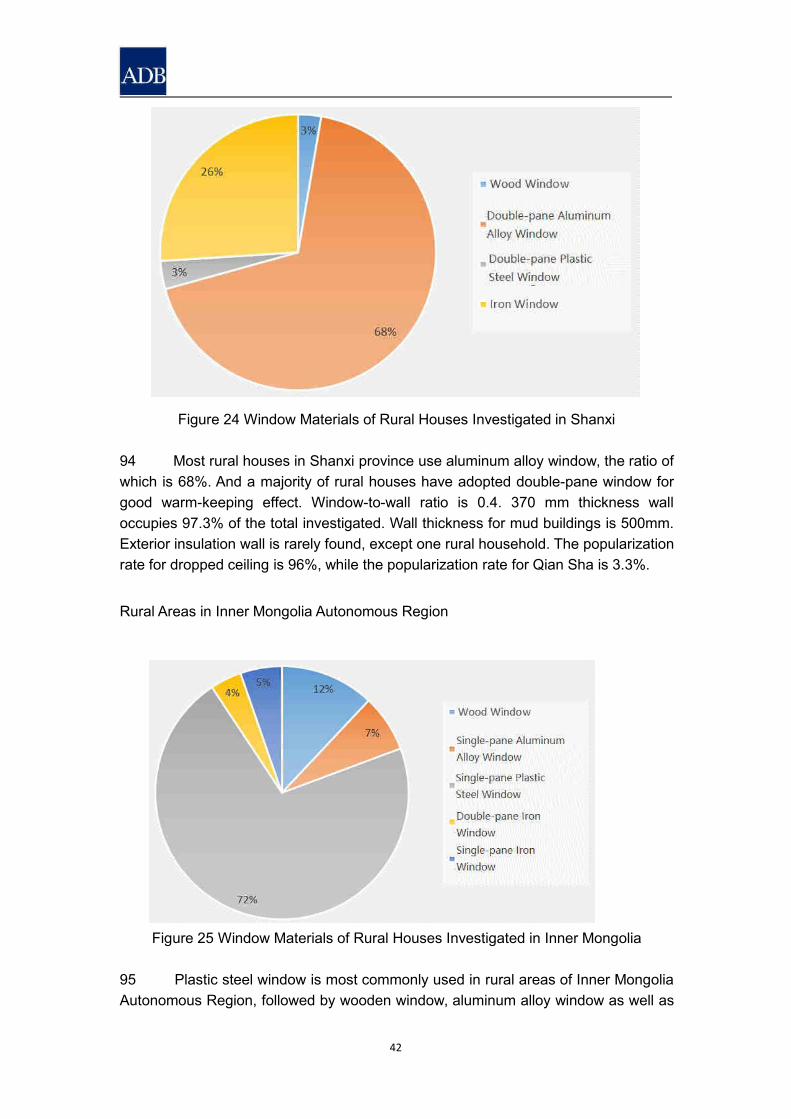
42
Figure 24 Window Materials of Rural Houses Investigated in Shanxi
94 Most rural houses in Shanxi province use aluminum alloy window, the ratio ofwhich is 68%. And a majority of rural houses have adopted double-pane window forgood warm-keeping effect. Window-to-wall ratio is 0.4. 370 mm thickness walloccupies 97.3% of the total investigated. Wall thickness for mud buildings is 500mm.Exterior insulation wall is rarely found, except one rural household. The popularizationrate for dropped ceiling is 96%, while the popularization rate for Qian Sha is 3.3%.
Rural Areas in Inner Mongolia Autonomous Region
Figure 25 Window Materials of Rural Houses Investigated in Inner Mongolia
95 Plastic steel window is most commonly used in rural areas of Inner MongoliaAutonomous Region, followed by wooden window, aluminum alloy window as well as
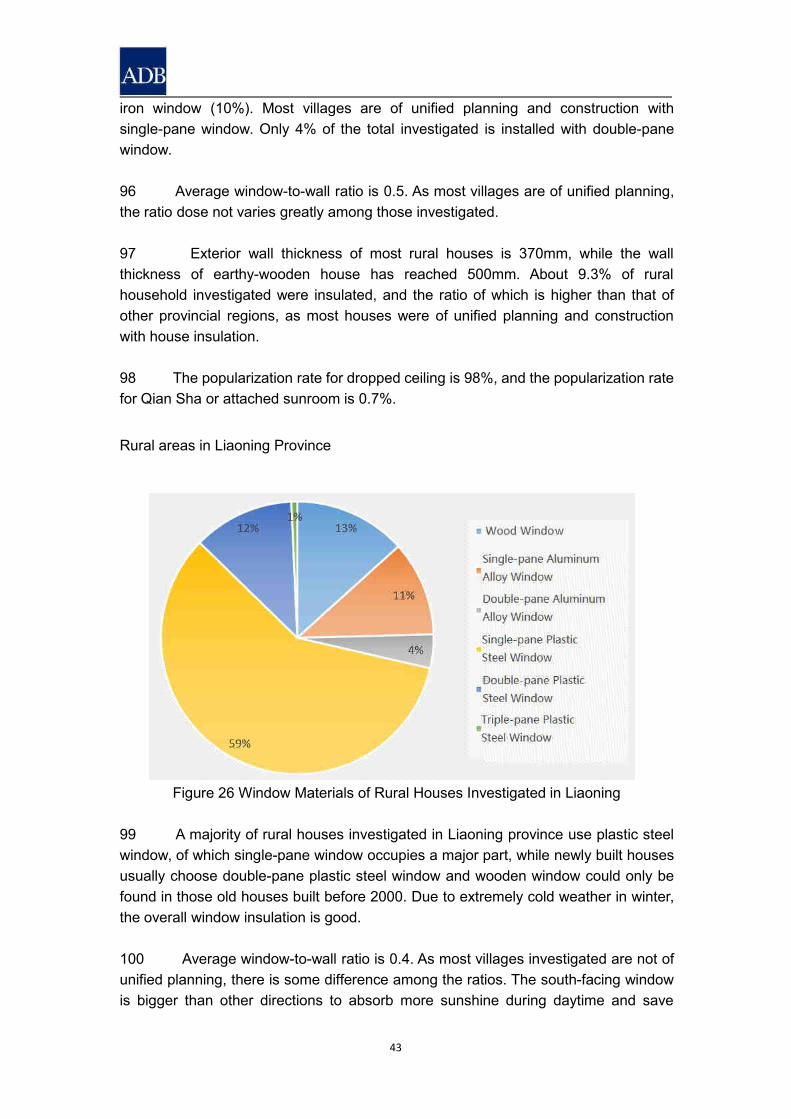
43
iron window (10%). Most villages are of unified planning and construction withsingle-pane window. Only 4% of the total investigated is installed with double-panewindow.
96 Average window-to-wall ratio is 0.5. As most villages are of unified planning,the ratio dose not varies greatly among those investigated.
97 Exterior wall thickness of most rural houses is 370mm, while the wallthickness of earthy-wooden house has reached 500mm. About 9.3% of ruralhousehold investigated were insulated, and the ratio of which is higher than that ofother provincial regions, as most houses were of unified planning and constructionwith house insulation.
98 The popularization rate for dropped ceiling is 98%, and the popularization ratefor Qian Sha or attached sunroom is 0.7%.
Rural areas in Liaoning Province
Figure 26 Window Materials of Rural Houses Investigated in Liaoning
99 A majority of rural houses investigated in Liaoning province use plastic steelwindow, of which single-pane window occupies a major part, while newly built housesusually choose double-pane plastic steel window and wooden window could only befound in those old houses built before 2000. Due to extremely cold weather in winter,the overall window insulation is good.
100 Average window-to-wall ratio is 0.4. As most villages investigated are not ofunified planning, there is some difference among the ratios. The south-facing windowis bigger than other directions to absorb more sunshine during daytime and save
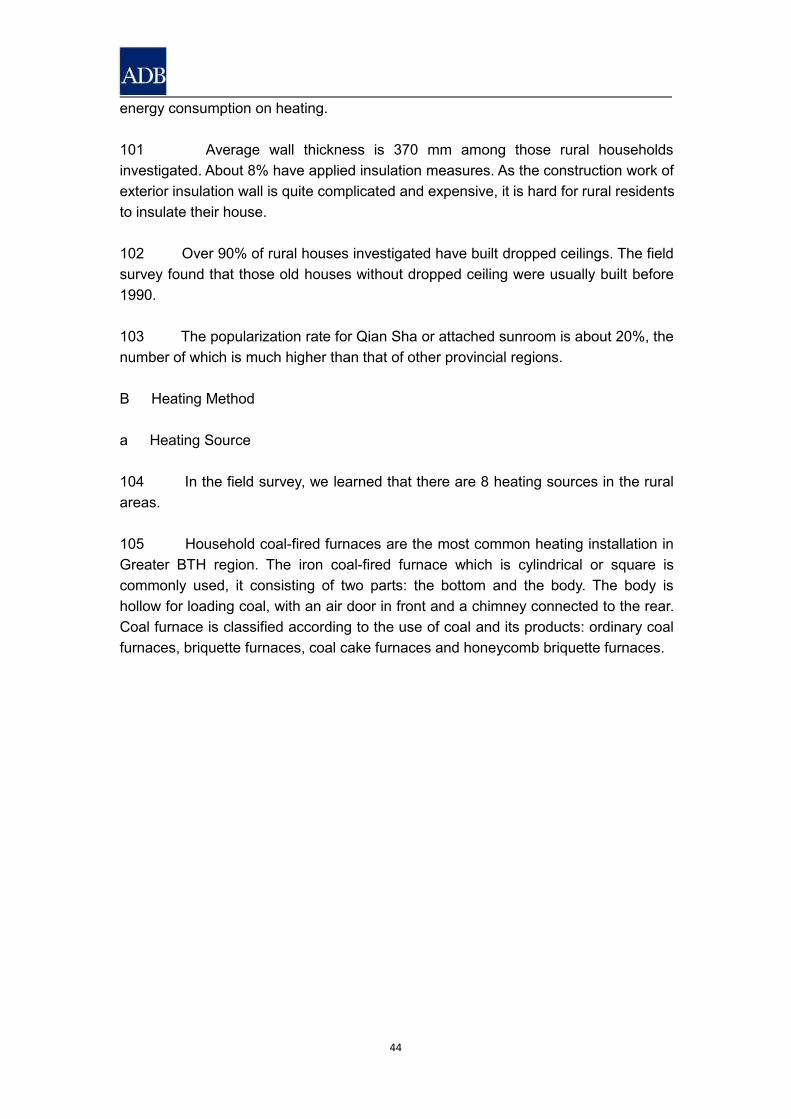
44
energy consumption on heating.
101 Average wall thickness is 370 mm among those rural householdsinvestigated. About 8% have applied insulation measures. As the construction work ofexterior insulation wall is quite complicated and expensive, it is hard for rural residentsto insulate their house.
102 Over 90% of rural houses investigated have built dropped ceilings. The fieldsurvey found that those old houses without dropped ceiling were usually built before1990.
103 The popularization rate for Qian Sha or attached sunroom is about 20%, thenumber of which is much higher than that of other provincial regions.
B Heating Method
a Heating Source
104 In the field survey, we learned that there are 8 heating sources in the ruralareas.
105 Household coal-fired furnaces are the most common heating installation inGreater BTH region. The iron coal-fired furnace which is cylindrical or square iscommonly used, it consisting of two parts: the bottom and the body. The body ishollow for loading coal, with an air door in front and a chimney connected to the rear.Coal furnace is classified according to the use of coal and its products: ordinary coalfurnaces, briquette furnaces, coal cake furnaces and honeycomb briquette furnaces.
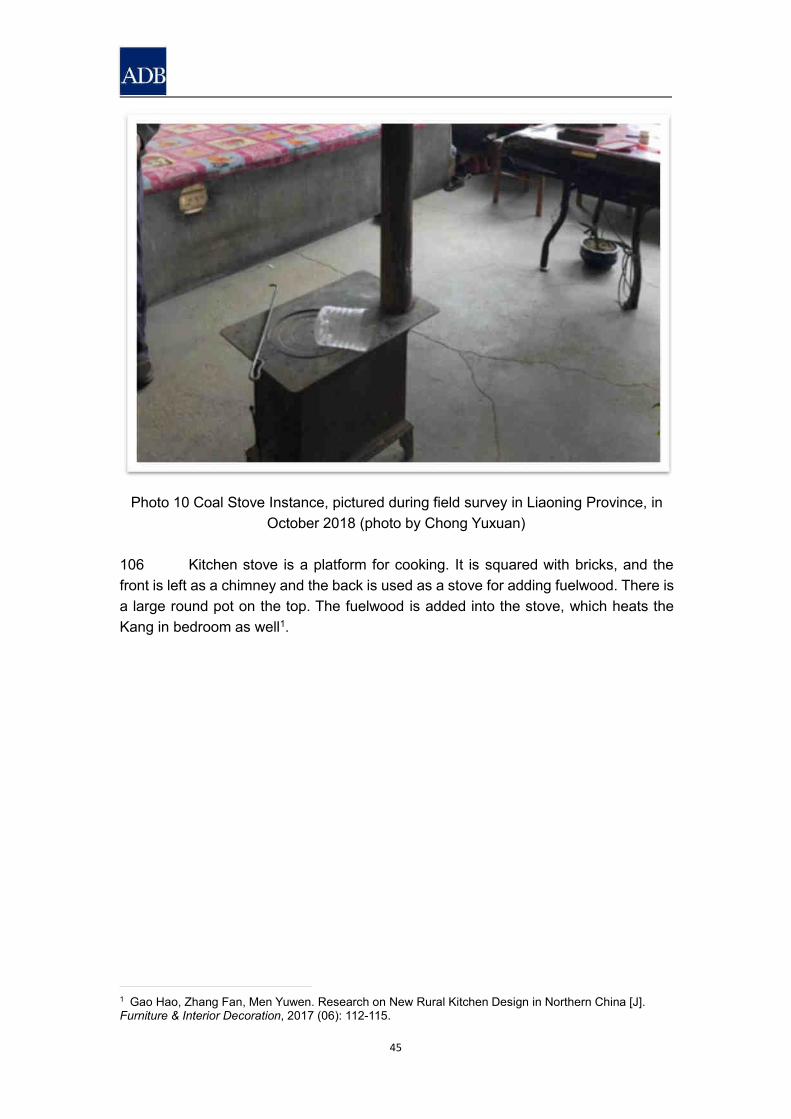
45
Photo 10 Coal Stove Instance, pictured during field survey in Liaoning Province, inOctober 2018 (photo by Chong Yuxuan)
106 Kitchen stove is a platform for cooking. It is squared with bricks, and thefront is left as a chimney and the back is used as a stove for adding fuelwood. There isa large round pot on the top. The fuelwood is added into the stove, which heats theKang in bedroom as well1.
1 Gao Hao, Zhang Fan, Men Yuwen. Research on New Rural Kitchen Design in Northern China [J].Furniture & Interior Decoration, 2017 (06): 112-115.
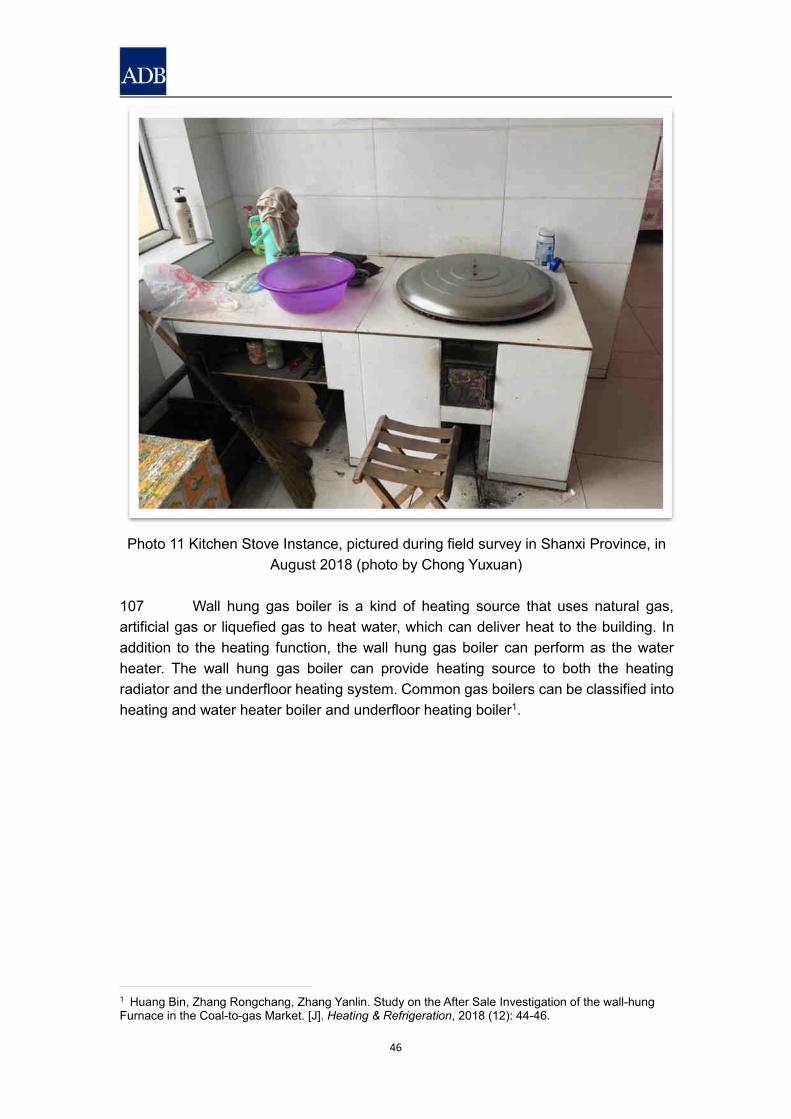
46
Photo 11 Kitchen Stove Instance, pictured during field survey in Shanxi Province, inAugust 2018 (photo by Chong Yuxuan)
107 Wall hung gas boiler is a kind of heating source that uses natural gas,artificial gas or liquefied gas to heat water, which can deliver heat to the building. Inaddition to the heating function, the wall hung gas boiler can perform as the waterheater. The wall hung gas boiler can provide heating source to both the heatingradiator and the underfloor heating system. Common gas boilers can be classified intoheating and water heater boiler and underfloor heating boiler1.
1 Huang Bin, Zhang Rongchang, Zhang Yanlin. Study on the After Sale Investigation of the wall-hungFurnace in the Coal-to-gas Market. [J]. Heating & Refrigeration, 2018 (12): 44-46.
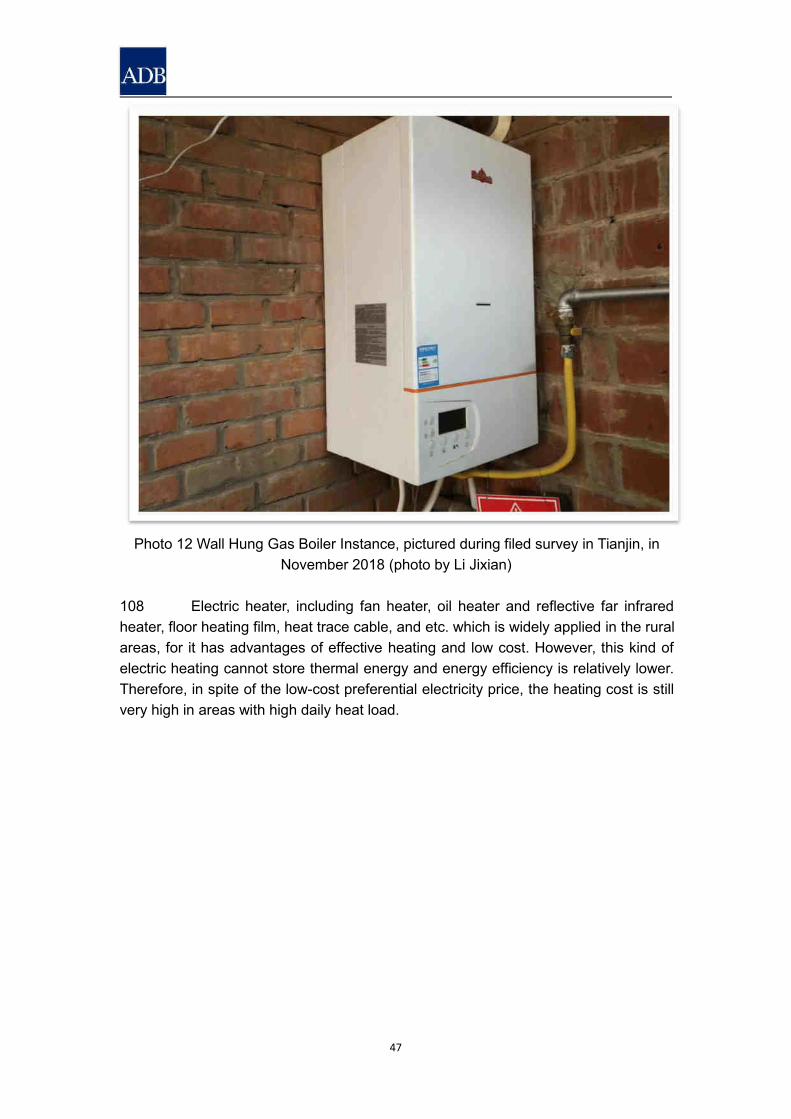
47
Photo 12 Wall Hung Gas Boiler Instance, pictured during filed survey in Tianjin, inNovember 2018 (photo by Li Jixian)
108 Electric heater, including fan heater, oil heater and reflective far infraredheater, floor heating film, heat trace cable, and etc. which is widely applied in the ruralareas, for it has advantages of effective heating and low cost. However, this kind ofelectric heating cannot store thermal energy and energy efficiency is relatively lower.Therefore, in spite of the low-cost preferential electricity price, the heating cost is stillvery high in areas with high daily heat load.
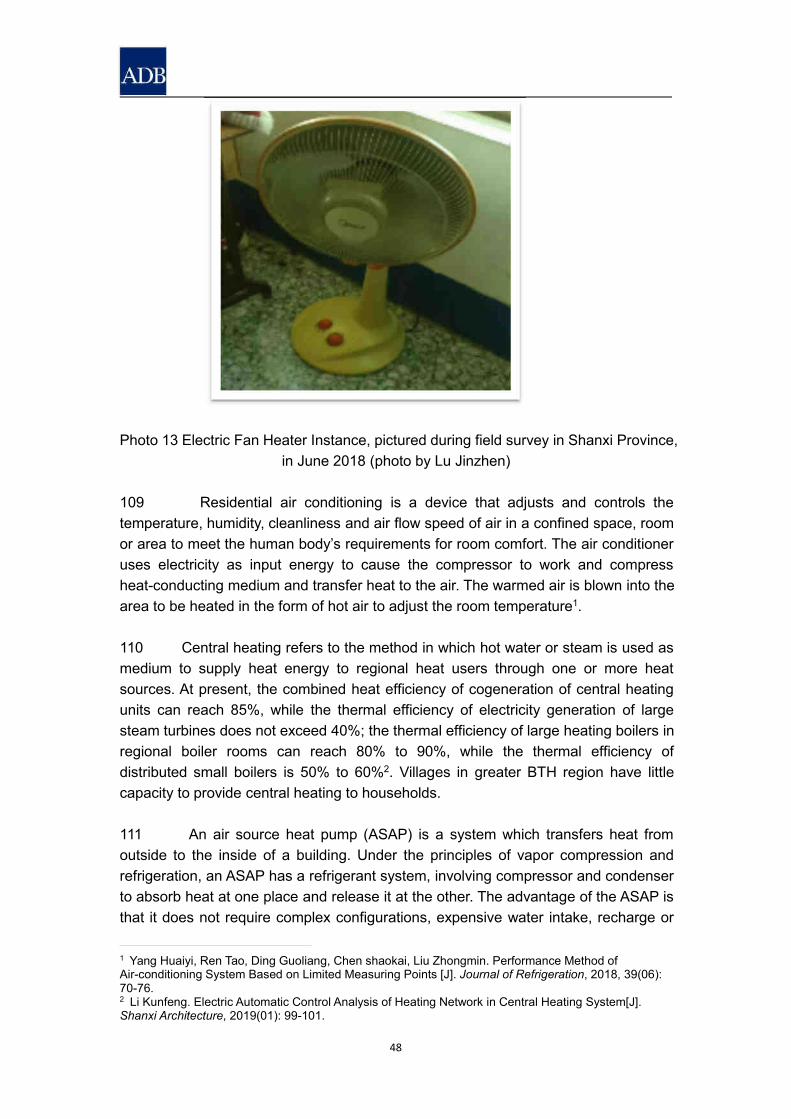
48
Photo 13 Electric Fan Heater Instance, pictured during field survey in Shanxi Province,in June 2018 (photo by Lu Jinzhen)
109 Residential air conditioning is a device that adjusts and controls thetemperature, humidity, cleanliness and air flow speed of air in a confined space, roomor area to meet the human body’s requirements for room comfort. The air conditioneruses electricity as input energy to cause the compressor to work and compressheat-conducting medium and transfer heat to the air. The warmed air is blown into thearea to be heated in the form of hot air to adjust the room temperature1.
110 Central heating refers to the method in which hot water or steam is used asmedium to supply heat energy to regional heat users through one or more heatsources. At present, the combined heat efficiency of cogeneration of central heatingunits can reach 85%, while the thermal efficiency of electricity generation of largesteam turbines does not exceed 40%; the thermal efficiency of large heating boilers inregional boiler rooms can reach 80% to 90%, while the thermal efficiency ofdistributed small boilers is 50% to 60%2. Villages in greater BTH region have littlecapacity to provide central heating to households.
111 An air source heat pump (ASAP) is a system which transfers heat fromoutside to the inside of a building. Under the principles of vapor compression andrefrigeration, an ASAP has a refrigerant system, involving compressor and condenserto absorb heat at one place and release it at the other. The advantage of the ASAP isthat it does not require complex configurations, expensive water intake, recharge or
1 Yang Huaiyi, Ren Tao, Ding Guoliang, Chen shaokai, Liu Zhongmin. Performance Method ofAir-conditioning System Based on Limited Measuring Points [J]. Journal of Refrigeration, 2018, 39(06):70-76.2 Li Kunfeng. Electric Automatic Control Analysis of Heating Network in Central Heating System[J].Shanxi Architecture, 2019(01): 99-101.
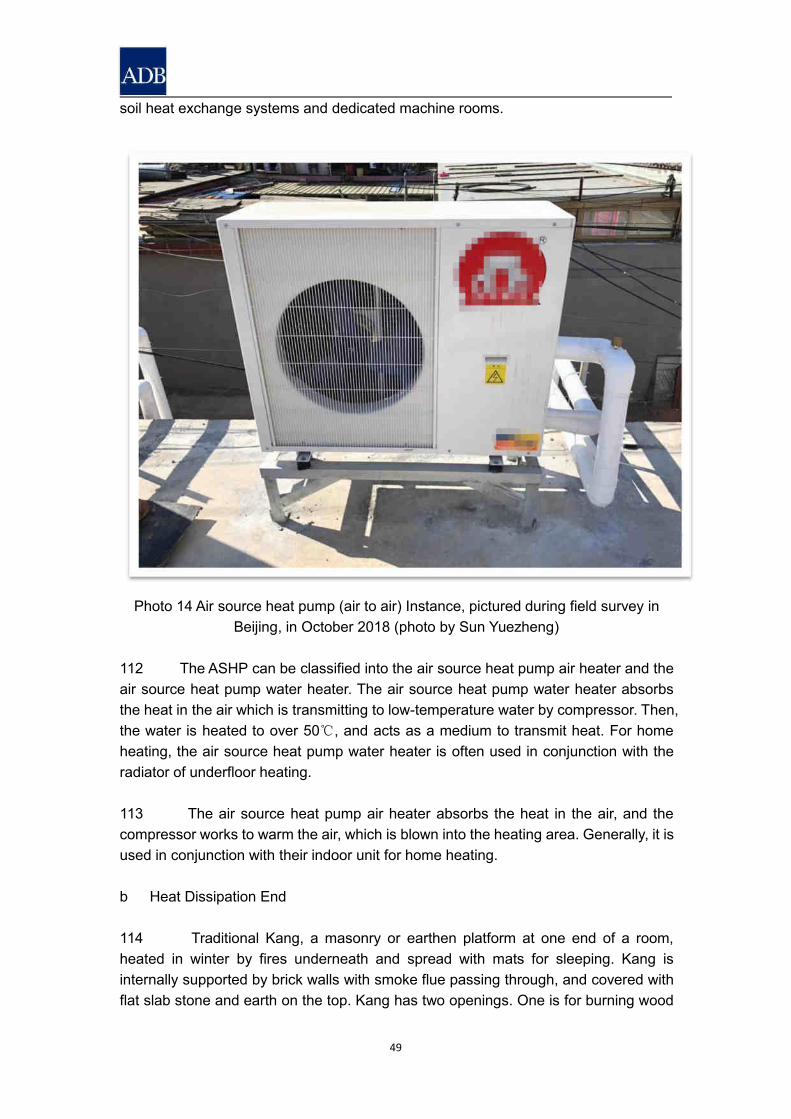
49
soil heat exchange systems and dedicated machine rooms.
Photo 14 Air source heat pump (air to air) Instance, pictured during field survey inBeijing, in October 2018 (photo by Sun Yuezheng)
112 The ASHP can be classified into the air source heat pump air heater and theair source heat pump water heater. The air source heat pump water heater absorbsthe heat in the air which is transmitting to low-temperature water by compressor. Then,the water is heated to over 50℃, and acts as a medium to transmit heat. For homeheating, the air source heat pump water heater is often used in conjunction with theradiator of underfloor heating.
113 The air source heat pump air heater absorbs the heat in the air, and thecompressor works to warm the air, which is blown into the heating area. Generally, it isused in conjunction with their indoor unit for home heating.
b Heat Dissipation End
114 Traditional Kang, a masonry or earthen platform at one end of a room,heated in winter by fires underneath and spread with mats for sleeping. Kang isinternally supported by brick walls with smoke flue passing through, and covered withflat slab stone and earth on the top. Kang has two openings. One is for burning wood
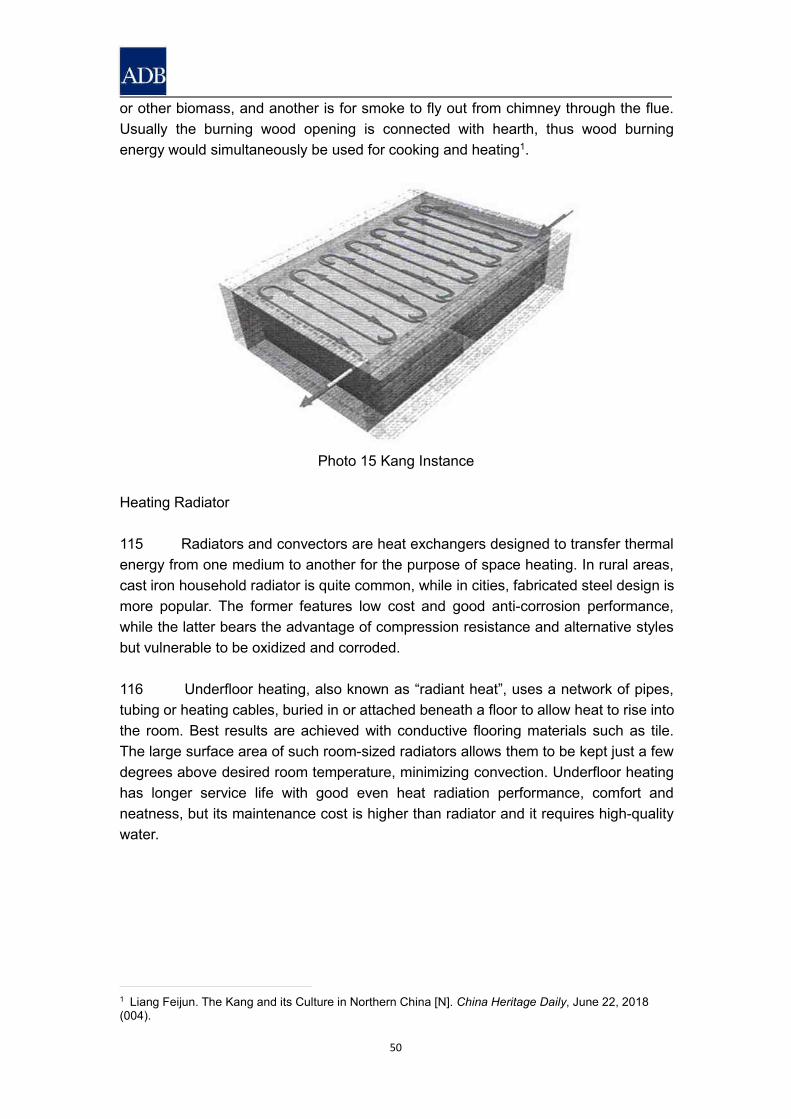
50
or other biomass, and another is for smoke to fly out from chimney through the flue.Usually the burning wood opening is connected with hearth, thus wood burningenergy would simultaneously be used for cooking and heating1.
Photo 15 Kang Instance
Heating Radiator
115 Radiators and convectors are heat exchangers designed to transfer thermalenergy from one medium to another for the purpose of space heating. In rural areas,cast iron household radiator is quite common, while in cities, fabricated steel design ismore popular. The former features low cost and good anti-corrosion performance,while the latter bears the advantage of compression resistance and alternative stylesbut vulnerable to be oxidized and corroded.
116 Underfloor heating, also known as “radiant heat”, uses a network of pipes,tubing or heating cables, buried in or attached beneath a floor to allow heat to rise intothe room. Best results are achieved with conductive flooring materials such as tile.The large surface area of such room-sized radiators allows them to be kept just a fewdegrees above desired room temperature, minimizing convection. Underfloor heatinghas longer service life with good even heat radiation performance, comfort andneatness, but its maintenance cost is higher than radiator and it requires high-qualitywater.
1 Liang Feijun. The Kang and its Culture in Northern China [N]. China Heritage Daily, June 22, 2018(004).
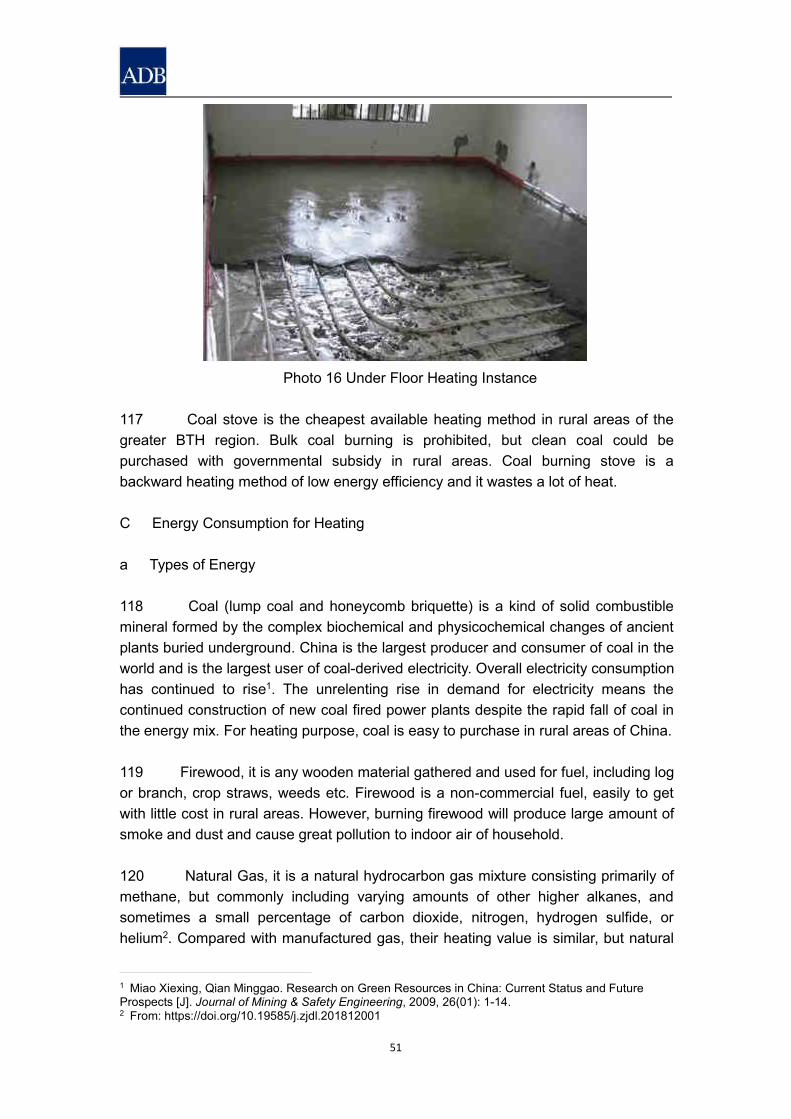
51
Photo 16 Under Floor Heating Instance
117 Coal stove is the cheapest available heating method in rural areas of thegreater BTH region. Bulk coal burning is prohibited, but clean coal could bepurchased with governmental subsidy in rural areas. Coal burning stove is abackward heating method of low energy efficiency and it wastes a lot of heat.
C Energy Consumption for Heating
a Types of Energy
118 Coal (lump coal and honeycomb briquette) is a kind of solid combustiblemineral formed by the complex biochemical and physicochemical changes of ancientplants buried underground. China is the largest producer and consumer of coal in theworld and is the largest user of coal-derived electricity. Overall electricity consumptionhas continued to rise1. The unrelenting rise in demand for electricity means thecontinued construction of new coal fired power plants despite the rapid fall of coal inthe energy mix. For heating purpose, coal is easy to purchase in rural areas of China.
119 Firewood, it is any wooden material gathered and used for fuel, including logor branch, crop straws, weeds etc. Firewood is a non-commercial fuel, easily to getwith little cost in rural areas. However, burning firewood will produce large amount ofsmoke and dust and cause great pollution to indoor air of household.
120 Natural Gas, it is a natural hydrocarbon gas mixture consisting primarily ofmethane, but commonly including varying amounts of other higher alkanes, andsometimes a small percentage of carbon dioxide, nitrogen, hydrogen sulfide, orhelium2. Compared with manufactured gas, their heating value is similar, but natural
1 Miao Xiexing, Qian Minggao. Research on Green Resources in China: Current Status and FutureProspects [J]. Journal of Mining & Safety Engineering, 2009, 26(01): 1-14.2 From: https://doi.org/10.19585/j.zjdl.201812001
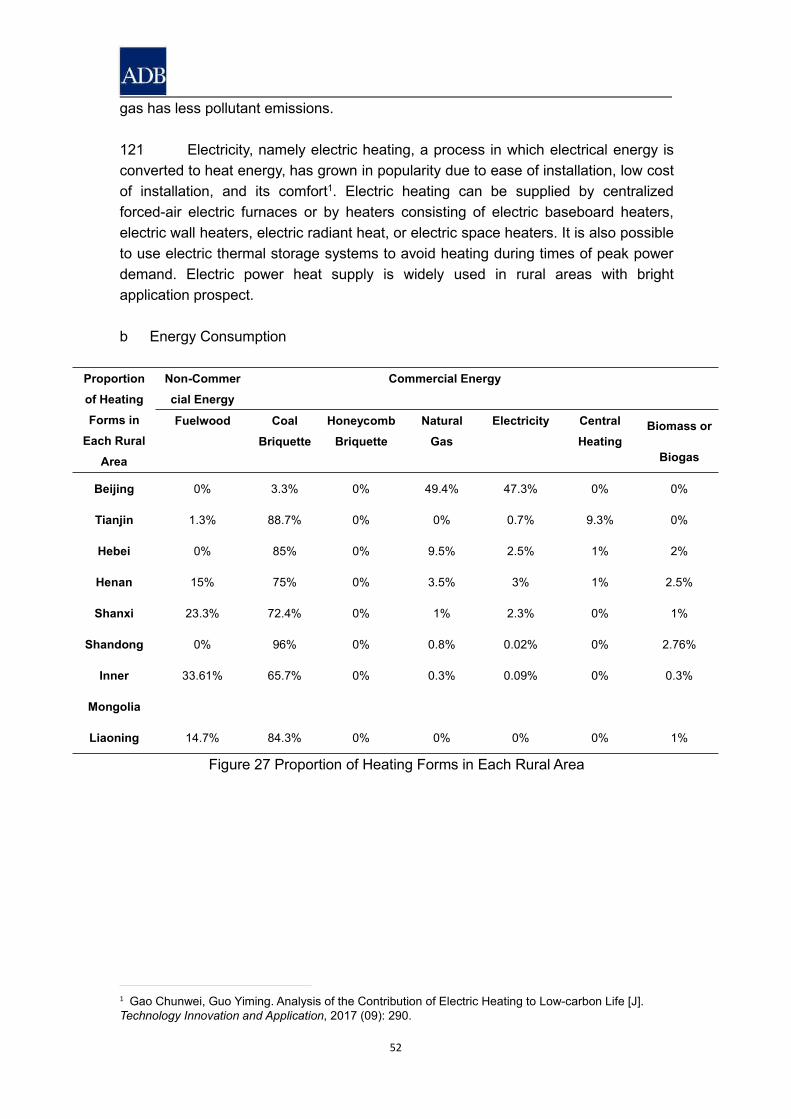
52
gas has less pollutant emissions.
121 Electricity, namely electric heating, a process in which electrical energy isconverted to heat energy, has grown in popularity due to ease of installation, low costof installation, and its comfort1. Electric heating can be supplied by centralizedforced-air electric furnaces or by heaters consisting of electric baseboard heaters,electric wall heaters, electric radiant heat, or electric space heaters. It is also possibleto use electric thermal storage systems to avoid heating during times of peak powerdemand. Electric power heat supply is widely used in rural areas with brightapplication prospect.
b Energy Consumption
Proportionof HeatingForms in
Each RuralArea
Non-Commercial Energy
Commercial Energy
Fuelwood CoalBriquette
HoneycombBriquette
NaturalGas
Electricity CentralHeating
Biomass or
Biogas
Beijing 0% 3.3% 0% 49.4% 47.3% 0% 0%
Tianjin 1.3% 88.7% 0% 0% 0.7% 9.3% 0%
Hebei 0% 85% 0% 9.5% 2.5% 1% 2%
Henan 15% 75% 0% 3.5% 3% 1% 2.5%
Shanxi 23.3% 72.4% 0% 1% 2.3% 0% 1%
Shandong 0% 96% 0% 0.8% 0.02% 0% 2.76%
Inner
Mongolia
33.61% 65.7% 0% 0.3% 0.09% 0% 0.3%
Liaoning 14.7% 84.3% 0% 0% 0% 0% 1%
Figure 27 Proportion of Heating Forms in Each Rural Area
1 Gao Chunwei, Guo Yiming. Analysis of the Contribution of Electric Heating to Low-carbon Life [J].Technology Innovation and Application, 2017 (09): 290.
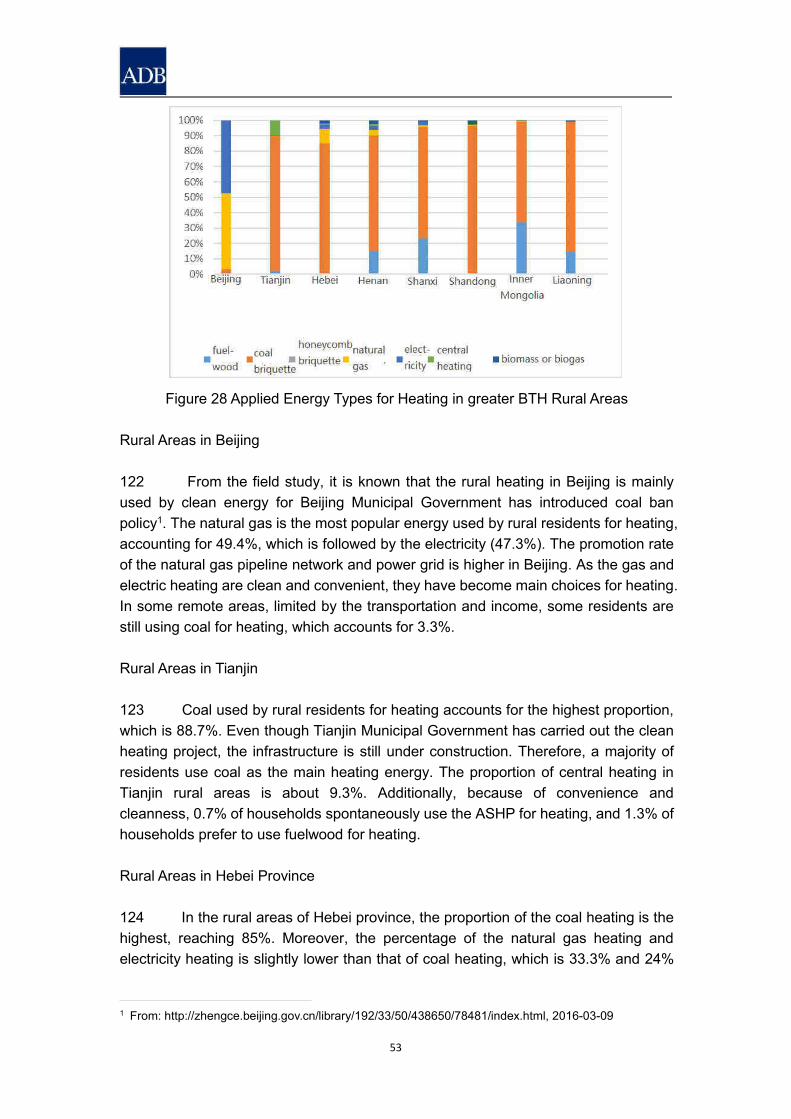
53
Figure 28 Applied Energy Types for Heating in greater BTH Rural Areas
Rural Areas in Beijing
122 From the field study, it is known that the rural heating in Beijing is mainlyused by clean energy for Beijing Municipal Government has introduced coal banpolicy1. The natural gas is the most popular energy used by rural residents for heating,accounting for 49.4%, which is followed by the electricity (47.3%). The promotion rateof the natural gas pipeline network and power grid is higher in Beijing. As the gas andelectric heating are clean and convenient, they have become main choices for heating.In some remote areas, limited by the transportation and income, some residents arestill using coal for heating, which accounts for 3.3%.
Rural Areas in Tianjin
123 Coal used by rural residents for heating accounts for the highest proportion,which is 88.7%. Even though Tianjin Municipal Government has carried out the cleanheating project, the infrastructure is still under construction. Therefore, a majority ofresidents use coal as the main heating energy. The proportion of central heating inTianjin rural areas is about 9.3%. Additionally, because of convenience andcleanness, 0.7% of households spontaneously use the ASHP for heating, and 1.3% ofhouseholds prefer to use fuelwood for heating.
Rural Areas in Hebei Province
124 In the rural areas of Hebei province, the proportion of the coal heating is thehighest, reaching 85%. Moreover, the percentage of the natural gas heating andelectricity heating is slightly lower than that of coal heating, which is 33.3% and 24%
1 From: http://zhengce.beijing.gov.cn/library/192/33/50/438650/78481/index.html, 2016-03-09
54
respectively. Only 1% of rural residents choose biomass or biogas as the heatingsource.
Rural Areas in Henan Province
125 According to results of the field survey in Henan Province, 75% of thehouseholds use coal for heating; 15% use firewood for heating; 3% use electricity forheating; 3.5% use gas for heating.
Rural Areas in Shanxi Province
126 Households using coal for heating in the surveyed rural areas of ShanxiProvince occupy 72.5%, which is followed by the proportion of households usingfirewood and crop straws for heating, approximately 23.3%. And 2.3% of thehouseholds use electricity for heating.
Rural Areas in Shandong Province
127 In Shandong, the percentage of the coal used by rural residents for heatingis 96%, as the clean heating project had not been carried out when the survey wasconducted. Therefore, the household mainly uses the original heating method. As theclean heating project carries out, the proportion of the coal will drop significantly.Moreover, households who use biomass and biogas for heating take up about 2.76%of the total.
Rural Areas in Inner Mongolia Autonomous Region
128 According to survey results of Inner Mongolia Autonomous Region, 65.7% ofthe households using coal for heating, and 33.61% use firewood for heating. Othertypes of heating are rarely adopted in the region. The reason for this phenomenon isthat rural residents have developed the habit of using coal and firewood and that newtypes of heating are still in promotion.
Rural Areas in Liaoning Province
129 Compared with other regions, the proportion of households using fuelwoodfor heating is about 14.7%, which is relatively higher than the other seven regions.This is because the large amount of corn is planted in Liaoning with abundantagricultural crop straws. Among the types of heating energy used by rural residents inLiaoning, the proportion of coal is the highest, approximately reaching 84.3%, which isrelated to the convenient acquisition, low price and high fuel value of coal.
c Energy Price
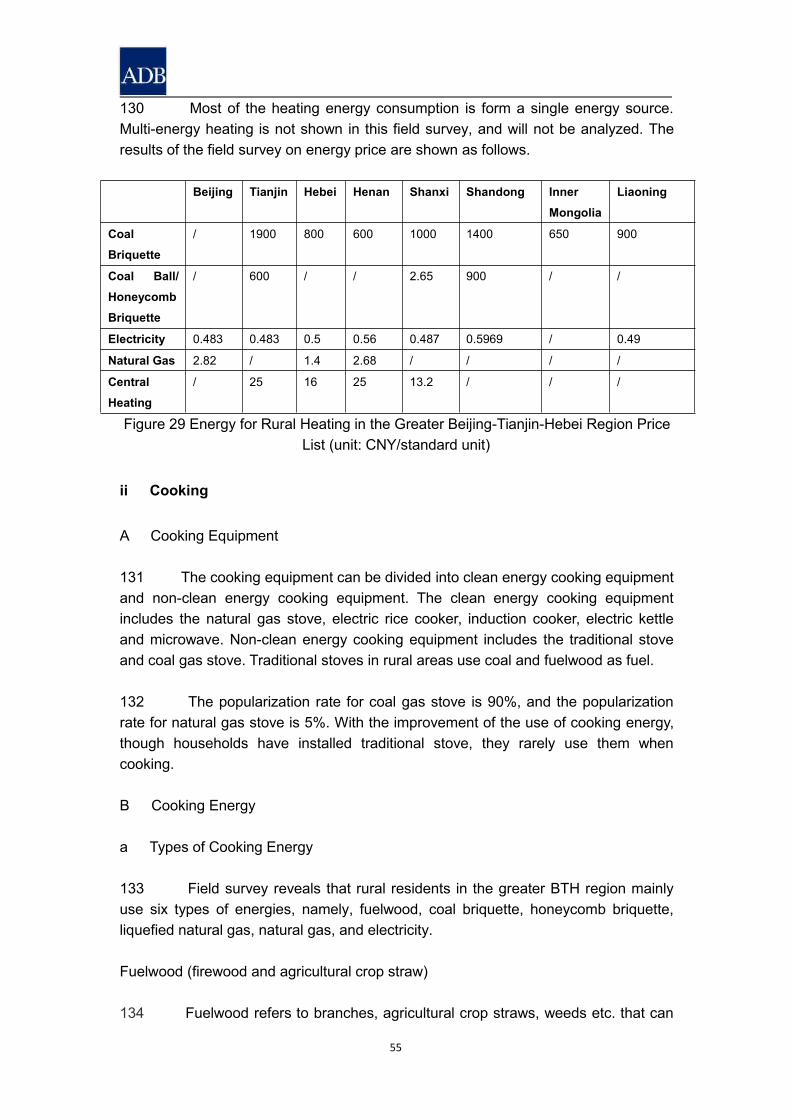
55
130 Most of the heating energy consumption is form a single energy source.Multi-energy heating is not shown in this field survey, and will not be analyzed. Theresults of the field survey on energy price are shown as follows.
Beijing Tianjin Hebei Henan Shanxi Shandong InnerMongolia
Liaoning
CoalBriquette
/ 1900 800 600 1000 1400 650 900
Coal Ball/HoneycombBriquette
/ 600 / / 2.65 900 / /
Electricity 0.483 0.483 0.5 0.56 0.487 0.5969 / 0.49
Natural Gas 2.82 / 1.4 2.68 / / / /
CentralHeating
/ 25 16 25 13.2 / / /
Figure 29 Energy for Rural Heating in the Greater Beijing-Tianjin-Hebei Region PriceList (unit: CNY/standard unit)
ii Cooking
A Cooking Equipment
131 The cooking equipment can be divided into clean energy cooking equipmentand non-clean energy cooking equipment. The clean energy cooking equipmentincludes the natural gas stove, electric rice cooker, induction cooker, electric kettleand microwave. Non-clean energy cooking equipment includes the traditional stoveand coal gas stove. Traditional stoves in rural areas use coal and fuelwood as fuel.
132 The popularization rate for coal gas stove is 90%, and the popularizationrate for natural gas stove is 5%. With the improvement of the use of cooking energy,though households have installed traditional stove, they rarely use them whencooking.
B Cooking Energy
a Types of Cooking Energy
133 Field survey reveals that rural residents in the greater BTH region mainlyuse six types of energies, namely, fuelwood, coal briquette, honeycomb briquette,liquefied natural gas, natural gas, and electricity.
Fuelwood (firewood and agricultural crop straw)
134 Fuelwood refers to branches, agricultural crop straws, weeds etc. that can
56
burn to provide heat. The fuelwood is a kind of non-commercial energy with featuresof easy acquisition, large reserves and barely no cost. However, the fuelwoodproduces large amount of smoke and dust, which pollute the air heavily.
Coal Briquette
135 China is one of the countries with richest coal resources in the world, whichfeatures large reserves, wide distribution, diversity, and good quality. Therefore, coalaccounts for a large proportion of China’s energy consumption. As a relativelylow-cost energy, coal has a high popularization rate in rural areas of China.
136 In this filed survey, apart from municipalities and provinces that haveintroduced the policy of banning coal, coal is still the main energy in other provinces ofthe greater BTH region.
Honeycomb Briquette
137 Honeycomb briquette is a large briquette that are processed into ahoneycomb and burned as the fuel in a honeycomb coal furnace. This type of coalhas a large contact with air, which is easy to burn and has higher combustionefficiency. Due to the added clay and its shape of the honeycomb, the strength isenhanced, and the structure is stable. It is easier to handle than coal briquette andagricultural crop straws.
Liquefied Natural Gas
138 Liquefied Natural gas (LNG) is flammable hydrocarbon gas with no colorliquefied through pressurization1. LNG has the main components of petroleum,including propane, butane, propylene and butylene, which are typical hydrocarboncompounds and have the biggest feature—flammability. The hydrocarboncomponents contained in LNG have extremely low flash points and spontaneousignition points which are liable to cause combustion. It has the advantages of beingeffective and clean2.
139 Natural gas refers to natural gases occurring in nature, including gasesformed by various natural processes in the atmosphere, hydrosphere and lithosphere(oilfield gas, condensate field gas, mud volcanic gas, coalbed methane andorganisms). The general definition of “natural gas” is narrow, from the energy’s pointof view, which refers to a mixture of hydrocarbons and non-hydrocarbon gasescontained in the formation3.
1 Huang Fan. Analysis on the Current Status and Future Prospect of LNG in China [J]. Natural GasTechnology, 2007(01): 68-71+92.2 Yang Qiang, Zhang Yong. Market Analysis and Marketing Strategy of Liquefied Petroleum Gas [J].Chinese and Foreign Entrepreneurs, 2018 (19): 77.3 Zou Caineng, Zhao Qun, Zhang Guosheng, Xiong Bo. Energy Revolution: from a Fossil Energy Era to
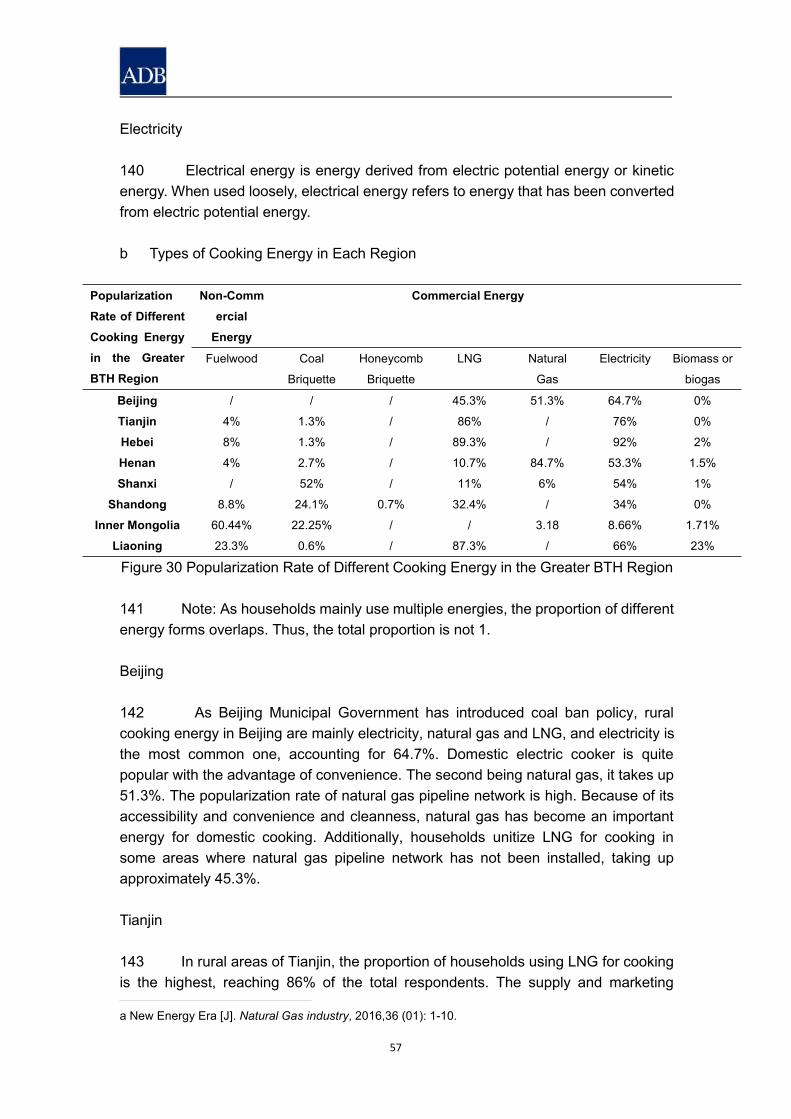
57
Electricity
140 Electrical energy is energy derived from electric potential energy or kineticenergy. When used loosely, electrical energy refers to energy that has been convertedfrom electric potential energy.
b Types of Cooking Energy in Each Region
PopularizationRate of DifferentCooking Energyin the GreaterBTH Region
Non-Commercial
Energy
Commercial Energy
Fuelwood Coal
Briquette
Honeycomb
Briquette
LNG Natural
Gas
Electricity Biomass or
biogas
Beijing / / / 45.3% 51.3% 64.7% 0%
Tianjin 4% 1.3% / 86% / 76% 0%
Hebei 8% 1.3% / 89.3% / 92% 2%
Henan 4% 2.7% / 10.7% 84.7% 53.3% 1.5%
Shanxi / 52% / 11% 6% 54% 1%
Shandong 8.8% 24.1% 0.7% 32.4% / 34% 0%
Inner Mongolia 60.44% 22.25% / / 3.18 8.66% 1.71%
Liaoning 23.3% 0.6% / 87.3% / 66% 23%
Figure 30 Popularization Rate of Different Cooking Energy in the Greater BTH Region
141 Note: As households mainly use multiple energies, the proportion of differentenergy forms overlaps. Thus, the total proportion is not 1.
Beijing
142 As Beijing Municipal Government has introduced coal ban policy, ruralcooking energy in Beijing are mainly electricity, natural gas and LNG, and electricity isthe most common one, accounting for 64.7%. Domestic electric cooker is quitepopular with the advantage of convenience. The second being natural gas, it takes up51.3%. The popularization rate of natural gas pipeline network is high. Because of itsaccessibility and convenience and cleanness, natural gas has become an importantenergy for domestic cooking. Additionally, households unitize LNG for cooking insome areas where natural gas pipeline network has not been installed, taking upapproximately 45.3%.
Tianjin
143 In rural areas of Tianjin, the proportion of households using LNG for cookingis the highest, reaching 86% of the total respondents. The supply and marketing
a New Energy Era [J]. Natural Gas industry, 2016,36 (01): 1-10.
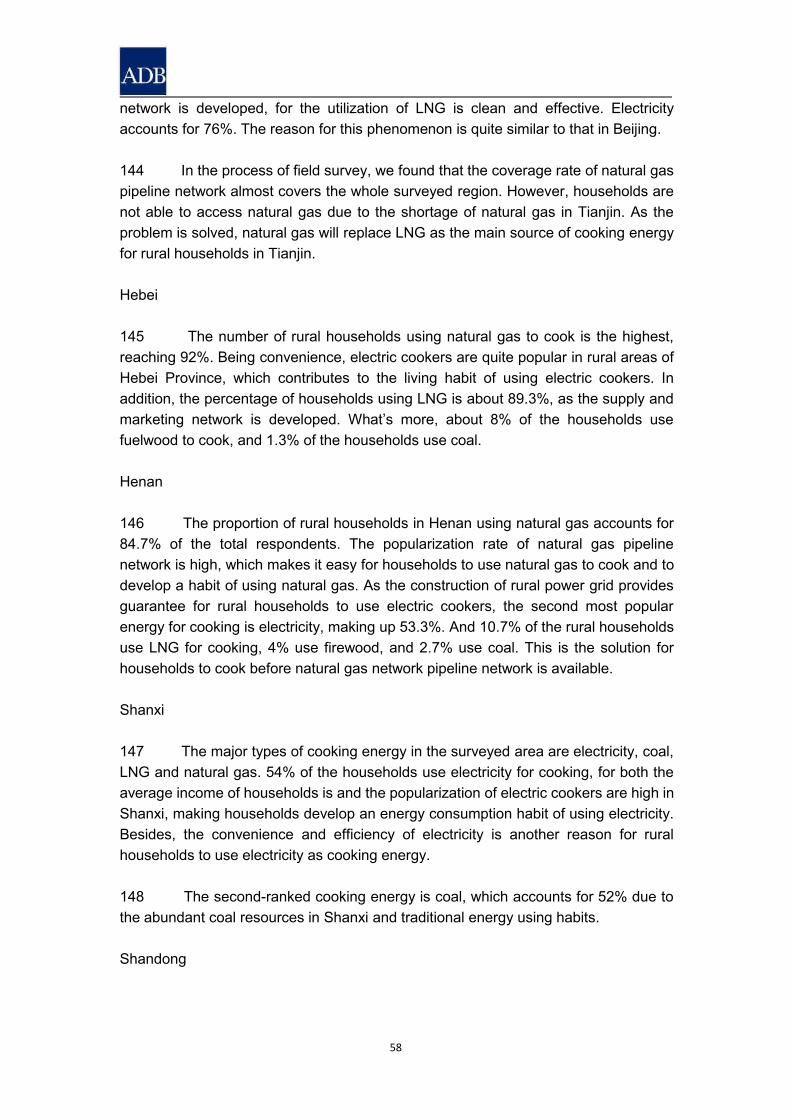
58
network is developed, for the utilization of LNG is clean and effective. Electricityaccounts for 76%. The reason for this phenomenon is quite similar to that in Beijing.
144 In the process of field survey, we found that the coverage rate of natural gaspipeline network almost covers the whole surveyed region. However, households arenot able to access natural gas due to the shortage of natural gas in Tianjin. As theproblem is solved, natural gas will replace LNG as the main source of cooking energyfor rural households in Tianjin.
Hebei
145 The number of rural households using natural gas to cook is the highest,reaching 92%. Being convenience, electric cookers are quite popular in rural areas ofHebei Province, which contributes to the living habit of using electric cookers. Inaddition, the percentage of households using LNG is about 89.3%, as the supply andmarketing network is developed. What’s more, about 8% of the households usefuelwood to cook, and 1.3% of the households use coal.
Henan
146 The proportion of rural households in Henan using natural gas accounts for84.7% of the total respondents. The popularization rate of natural gas pipelinenetwork is high, which makes it easy for households to use natural gas to cook and todevelop a habit of using natural gas. As the construction of rural power grid providesguarantee for rural households to use electric cookers, the second most popularenergy for cooking is electricity, making up 53.3%. And 10.7% of the rural householdsuse LNG for cooking, 4% use firewood, and 2.7% use coal. This is the solution forhouseholds to cook before natural gas network pipeline network is available.
Shanxi
147 The major types of cooking energy in the surveyed area are electricity, coal,LNG and natural gas. 54% of the households use electricity for cooking, for both theaverage income of households is and the popularization of electric cookers are high inShanxi, making households develop an energy consumption habit of using electricity.Besides, the convenience and efficiency of electricity is another reason for ruralhouseholds to use electricity as cooking energy.
148 The second-ranked cooking energy is coal, which accounts for 52% due tothe abundant coal resources in Shanxi and traditional energy using habits.
Shandong
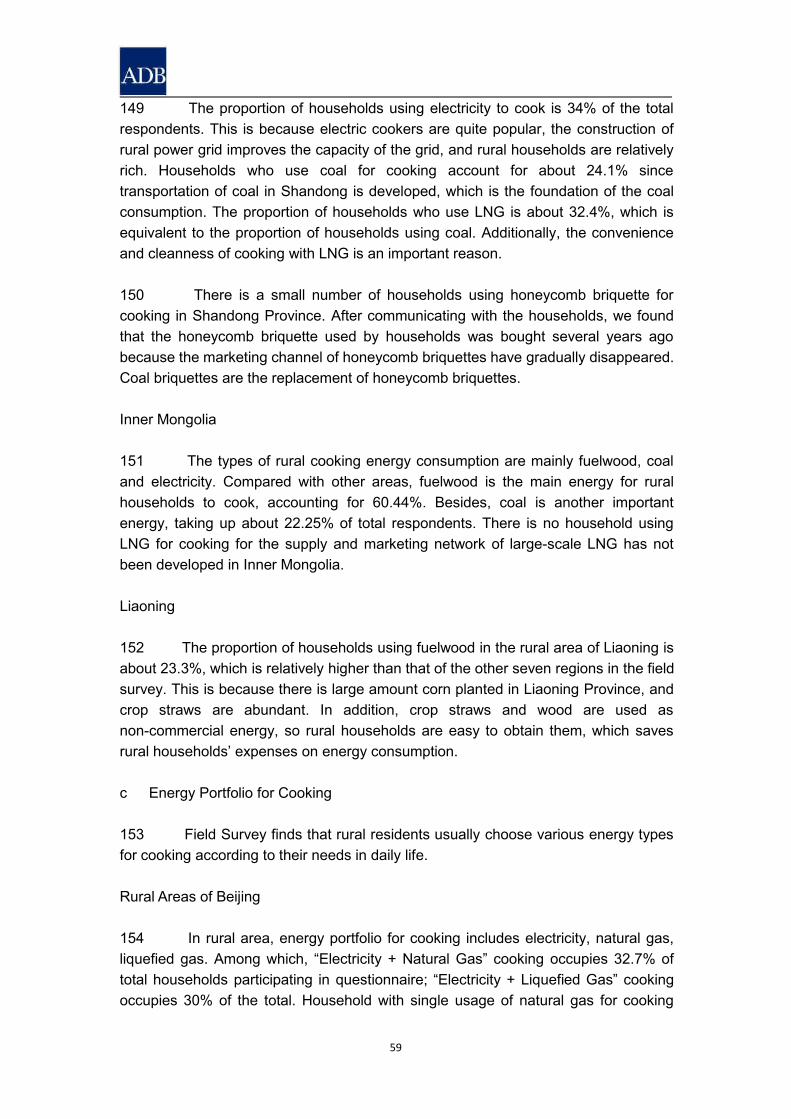
59
149 The proportion of households using electricity to cook is 34% of the totalrespondents. This is because electric cookers are quite popular, the construction ofrural power grid improves the capacity of the grid, and rural households are relativelyrich. Households who use coal for cooking account for about 24.1% sincetransportation of coal in Shandong is developed, which is the foundation of the coalconsumption. The proportion of households who use LNG is about 32.4%, which isequivalent to the proportion of households using coal. Additionally, the convenienceand cleanness of cooking with LNG is an important reason.
150 There is a small number of households using honeycomb briquette forcooking in Shandong Province. After communicating with the households, we foundthat the honeycomb briquette used by households was bought several years agobecause the marketing channel of honeycomb briquettes have gradually disappeared.Coal briquettes are the replacement of honeycomb briquettes.
Inner Mongolia
151 The types of rural cooking energy consumption are mainly fuelwood, coaland electricity. Compared with other areas, fuelwood is the main energy for ruralhouseholds to cook, accounting for 60.44%. Besides, coal is another importantenergy, taking up about 22.25% of total respondents. There is no household usingLNG for cooking for the supply and marketing network of large-scale LNG has notbeen developed in Inner Mongolia.
Liaoning
152 The proportion of households using fuelwood in the rural area of Liaoning isabout 23.3%, which is relatively higher than that of the other seven regions in the fieldsurvey. This is because there is large amount corn planted in Liaoning Province, andcrop straws are abundant. In addition, crop straws and wood are used asnon-commercial energy, so rural households are easy to obtain them, which savesrural households’ expenses on energy consumption.
c Energy Portfolio for Cooking
153 Field Survey finds that rural residents usually choose various energy typesfor cooking according to their needs in daily life.
Rural Areas of Beijing
154 In rural area, energy portfolio for cooking includes electricity, natural gas,liquefied gas. Among which, “Electricity + Natural Gas” cooking occupies 32.7% oftotal households participating in questionnaire; “Electricity + Liquefied Gas” cookingoccupies 30% of the total. Household with single usage of natural gas for cooking
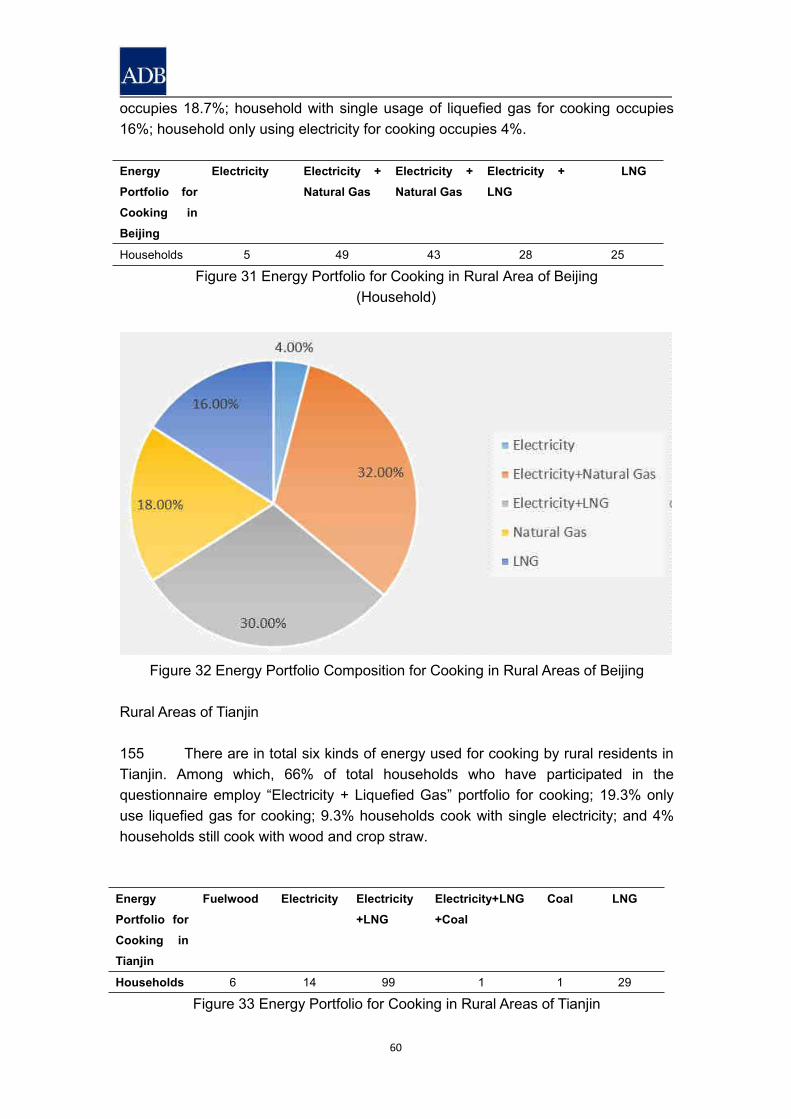
60
occupies 18.7%; household with single usage of liquefied gas for cooking occupies16%; household only using electricity for cooking occupies 4%.
EnergyPortfolio forCooking inBeijing
Electricity Electricity +Natural Gas
Electricity +Natural Gas
Electricity +LNG
LNG
Households 5 49 43 28 25
Figure 31 Energy Portfolio for Cooking in Rural Area of Beijing(Household)
Figure 32 Energy Portfolio Composition for Cooking in Rural Areas of Beijing
Rural Areas of Tianjin
155 There are in total six kinds of energy used for cooking by rural residents inTianjin. Among which, 66% of total households who have participated in thequestionnaire employ “Electricity + Liquefied Gas” portfolio for cooking; 19.3% onlyuse liquefied gas for cooking; 9.3% households cook with single electricity; and 4%households still cook with wood and crop straw.
Figure 33 Energy Portfolio for Cooking in Rural Areas of Tianjin
EnergyPortfolio forCooking inTianjin
Fuelwood Electricity Electricity+LNG
Electricity+LNG+Coal
Coal LNG
Households 6 14 99 1 1 29
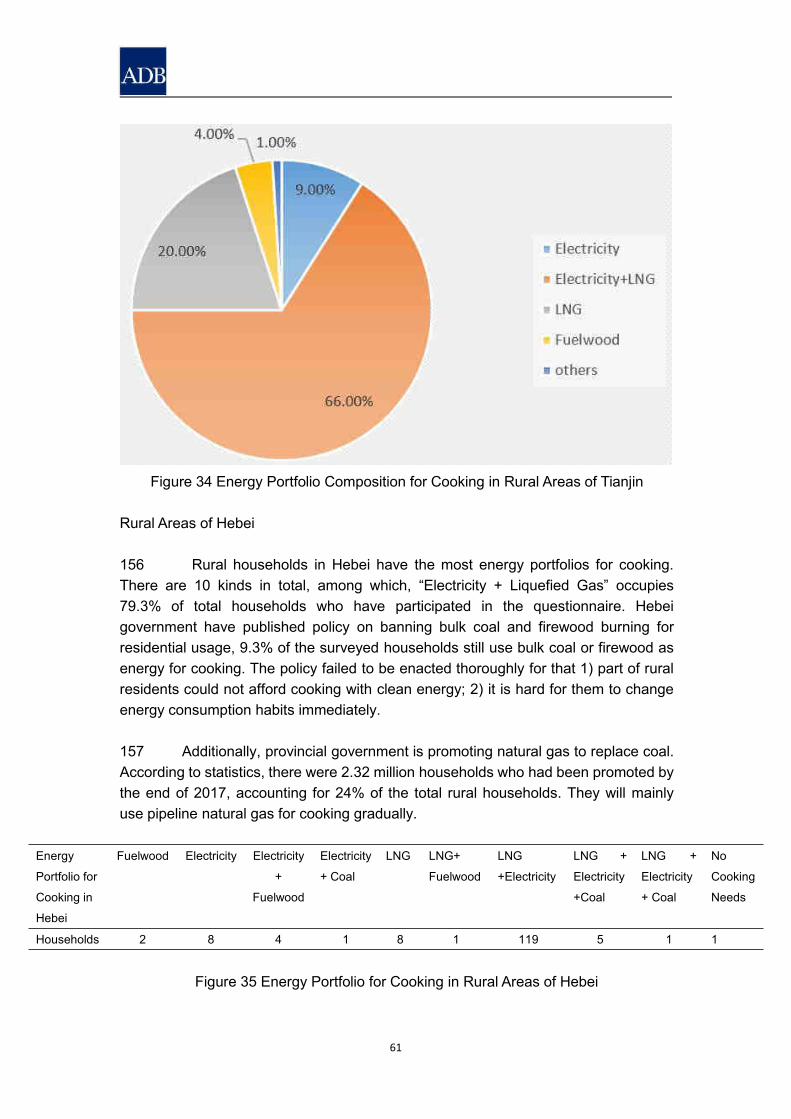
61
Figure 34 Energy Portfolio Composition for Cooking in Rural Areas of Tianjin
Rural Areas of Hebei
156 Rural households in Hebei have the most energy portfolios for cooking.There are 10 kinds in total, among which, “Electricity + Liquefied Gas” occupies79.3% of total households who have participated in the questionnaire. Hebeigovernment have published policy on banning bulk coal and firewood burning forresidential usage, 9.3% of the surveyed households still use bulk coal or firewood asenergy for cooking. The policy failed to be enacted thoroughly for that 1) part of ruralresidents could not afford cooking with clean energy; 2) it is hard for them to changeenergy consumption habits immediately.
157 Additionally, provincial government is promoting natural gas to replace coal.According to statistics, there were 2.32 million households who had been promoted bythe end of 2017, accounting for 24% of the total rural households. They will mainlyuse pipeline natural gas for cooking gradually.
Energy
Portfolio for
Cooking in
Hebei
Fuelwood Electricity Electricity
+
Fuelwood
Electricity
+ Coal
LNG LNG+
Fuelwood
LNG
+Electricity
LNG +
Electricity
+Coal
LNG +
Electricity
+ Coal
No
Cooking
Needs
Households 2 8 4 1 8 1 119 5 1 1
Figure 35 Energy Portfolio for Cooking in Rural Areas of Hebei
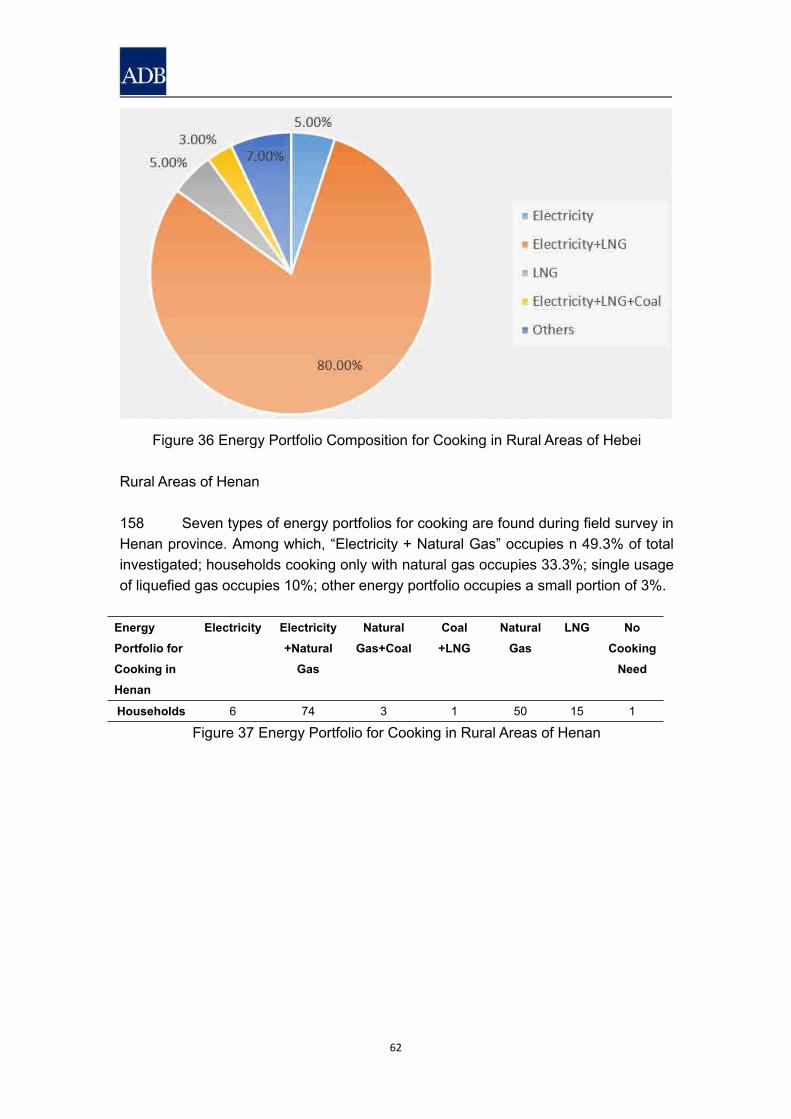
62
Figure 36 Energy Portfolio Composition for Cooking in Rural Areas of Hebei
Rural Areas of Henan
158 Seven types of energy portfolios for cooking are found during field survey inHenan province. Among which, “Electricity + Natural Gas” occupies n 49.3% of totalinvestigated; households cooking only with natural gas occupies 33.3%; single usageof liquefied gas occupies 10%; other energy portfolio occupies a small portion of 3%.
EnergyPortfolio forCooking inHenan
Electricity Electricity+Natural
Gas
NaturalGas+Coal
Coal+LNG
NaturalGas
LNG NoCooking
Need
Households 6 74 3 1 50 15 1
Figure 37 Energy Portfolio for Cooking in Rural Areas of Henan
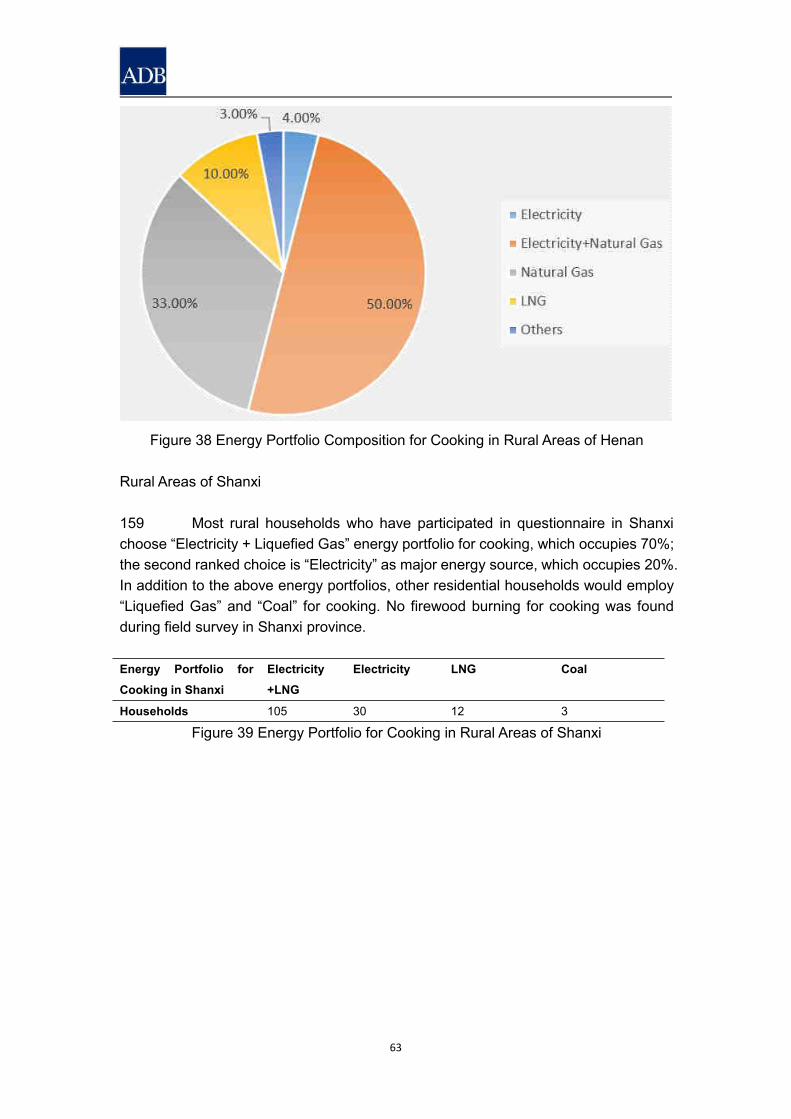
63
Figure 38 Energy Portfolio Composition for Cooking in Rural Areas of Henan
Rural Areas of Shanxi
159 Most rural households who have participated in questionnaire in Shanxichoose “Electricity + Liquefied Gas” energy portfolio for cooking, which occupies 70%;the second ranked choice is “Electricity” as major energy source, which occupies 20%.In addition to the above energy portfolios, other residential households would employ“Liquefied Gas” and “Coal” for cooking. No firewood burning for cooking was foundduring field survey in Shanxi province.
Energy Portfolio forCooking in Shanxi
Electricity+LNG
Electricity LNG Coal
Households 105 30 12 3
Figure 39 Energy Portfolio for Cooking in Rural Areas of Shanxi
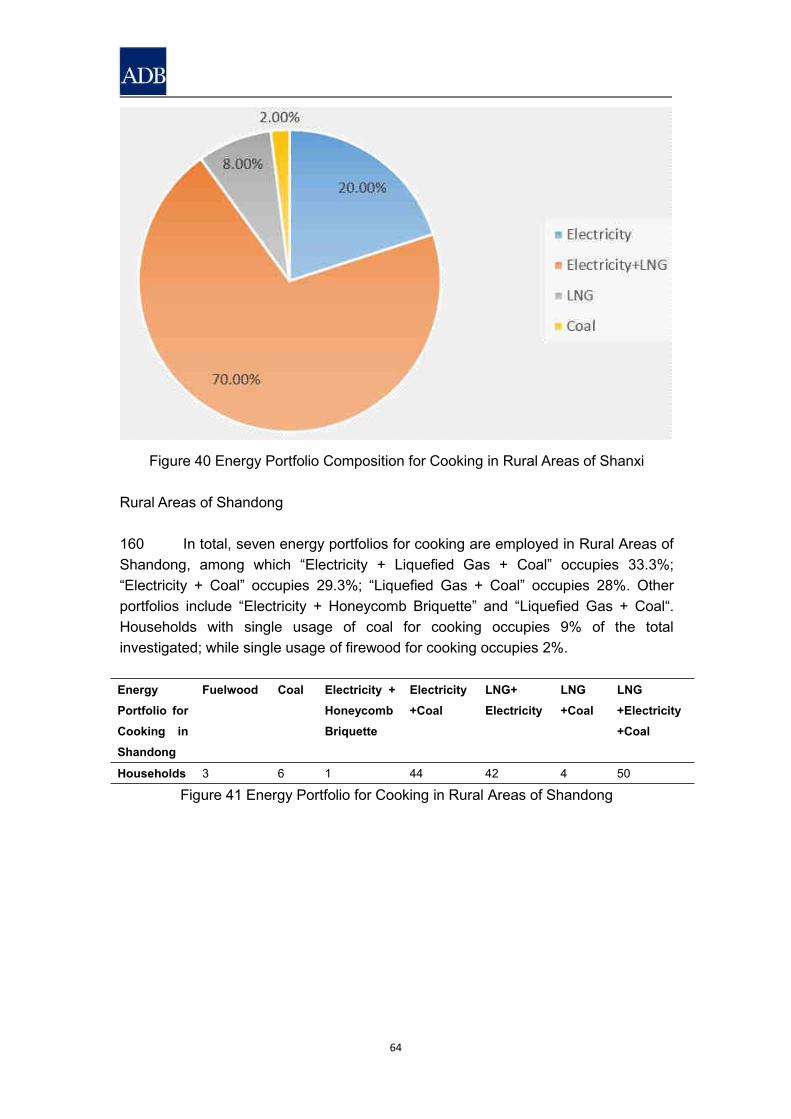
64
Figure 40 Energy Portfolio Composition for Cooking in Rural Areas of Shanxi
Rural Areas of Shandong
160 In total, seven energy portfolios for cooking are employed in Rural Areas ofShandong, among which “Electricity + Liquefied Gas + Coal” occupies 33.3%;“Electricity + Coal” occupies 29.3%; “Liquefied Gas + Coal” occupies 28%. Otherportfolios include “Electricity + Honeycomb Briquette” and “Liquefied Gas + Coal“.Households with single usage of coal for cooking occupies 9% of the totalinvestigated; while single usage of firewood for cooking occupies 2%.
EnergyPortfolio forCooking inShandong
Fuelwood Coal Electricity +HoneycombBriquette
Electricity+Coal
LNG+Electricity
LNG+Coal
LNG+Electricity+Coal
Households 3 6 1 44 42 4 50
Figure 41 Energy Portfolio for Cooking in Rural Areas of Shandong
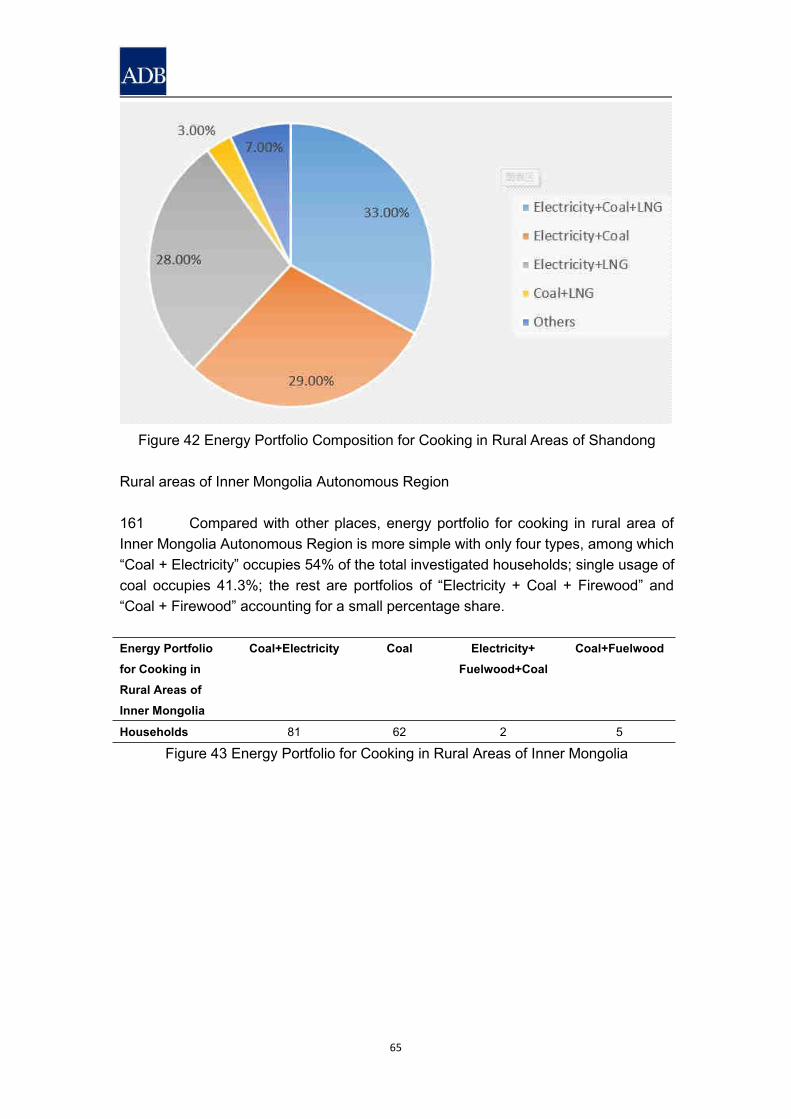
65
Figure 42 Energy Portfolio Composition for Cooking in Rural Areas of Shandong
Rural areas of Inner Mongolia Autonomous Region
161 Compared with other places, energy portfolio for cooking in rural area ofInner Mongolia Autonomous Region is more simple with only four types, among which“Coal + Electricity” occupies 54% of the total investigated households; single usage ofcoal occupies 41.3%; the rest are portfolios of “Electricity + Coal + Firewood” and“Coal + Firewood” accounting for a small percentage share.
Energy Portfoliofor Cooking inRural Areas ofInner Mongolia
Coal+Electricity Coal Electricity+Fuelwood+Coal
Coal+Fuelwood
Households 81 62 2 5
Figure 43 Energy Portfolio for Cooking in Rural Areas of Inner Mongolia
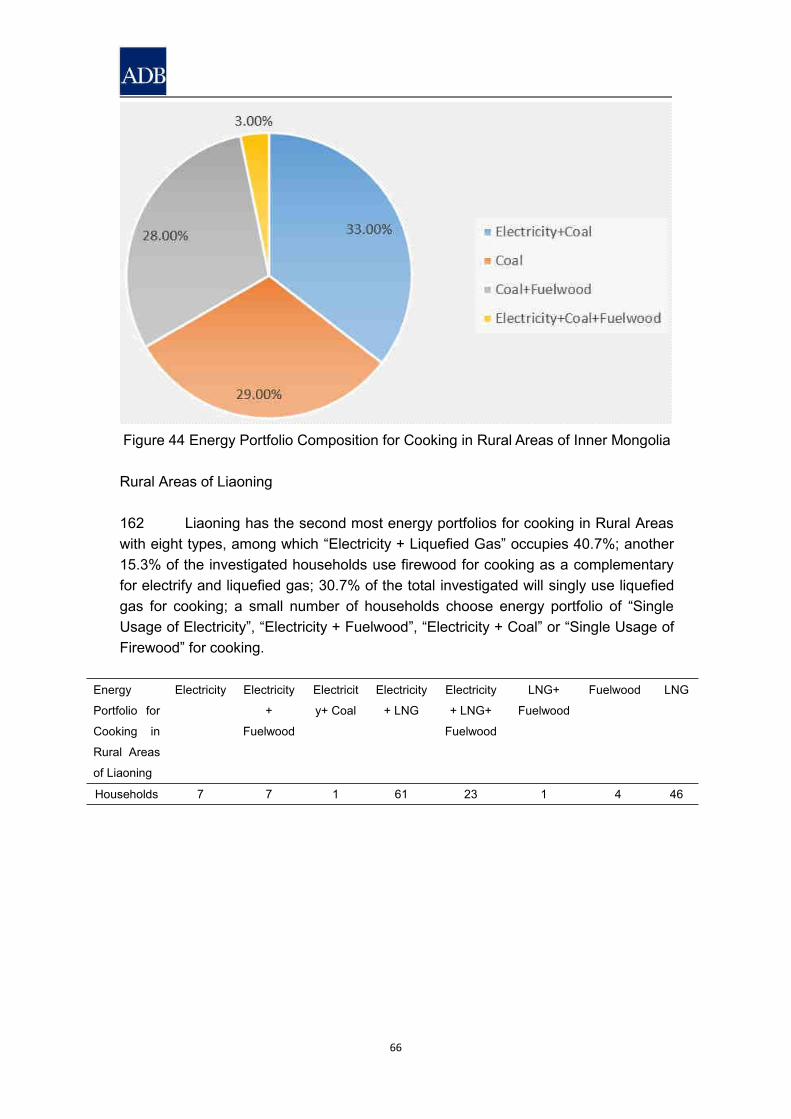
66
Figure 44 Energy Portfolio Composition for Cooking in Rural Areas of Inner Mongolia
Rural Areas of Liaoning
162 Liaoning has the second most energy portfolios for cooking in Rural Areaswith eight types, among which “Electricity + Liquefied Gas” occupies 40.7%; another15.3% of the investigated households use firewood for cooking as a complementaryfor electrify and liquefied gas; 30.7% of the total investigated will singly use liquefiedgas for cooking; a small number of households choose energy portfolio of “SingleUsage of Electricity”, “Electricity + Fuelwood”, “Electricity + Coal” or “Single Usage ofFirewood” for cooking.
Energy
Portfolio for
Cooking in
Rural Areas
of Liaoning
Electricity Electricity
+
Fuelwood
Electricit
y+ Coal
Electricity
+ LNG
Electricity
+ LNG+
Fuelwood
LNG+
Fuelwood
Fuelwood LNG
Households 7 7 1 61 23 1 4 46
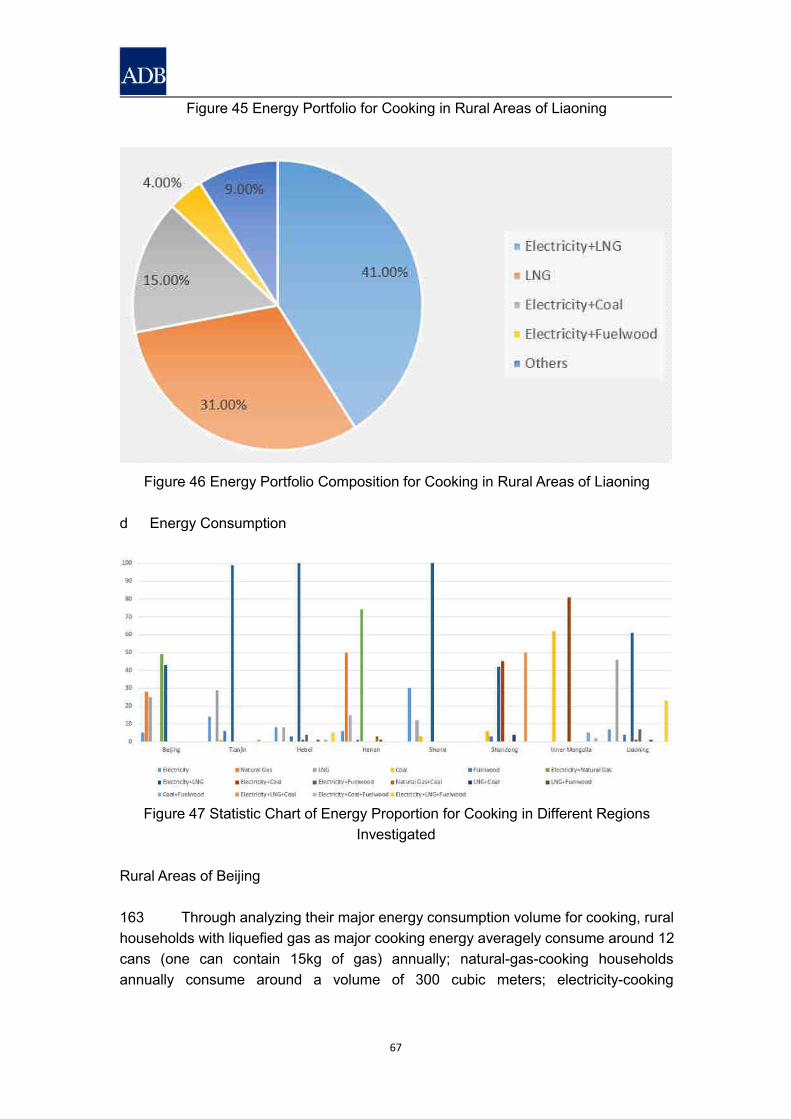
67
Figure 45 Energy Portfolio for Cooking in Rural Areas of Liaoning
Figure 46 Energy Portfolio Composition for Cooking in Rural Areas of Liaoning
d Energy Consumption
Figure 47 Statistic Chart of Energy Proportion for Cooking in Different RegionsInvestigated
Rural Areas of Beijing
163 Through analyzing their major energy consumption volume for cooking, ruralhouseholds with liquefied gas as major cooking energy averagely consume around 12cans (one can contain 15kg of gas) annually; natural-gas-cooking householdsannually consume around a volume of 300 cubic meters; electricity-cooking
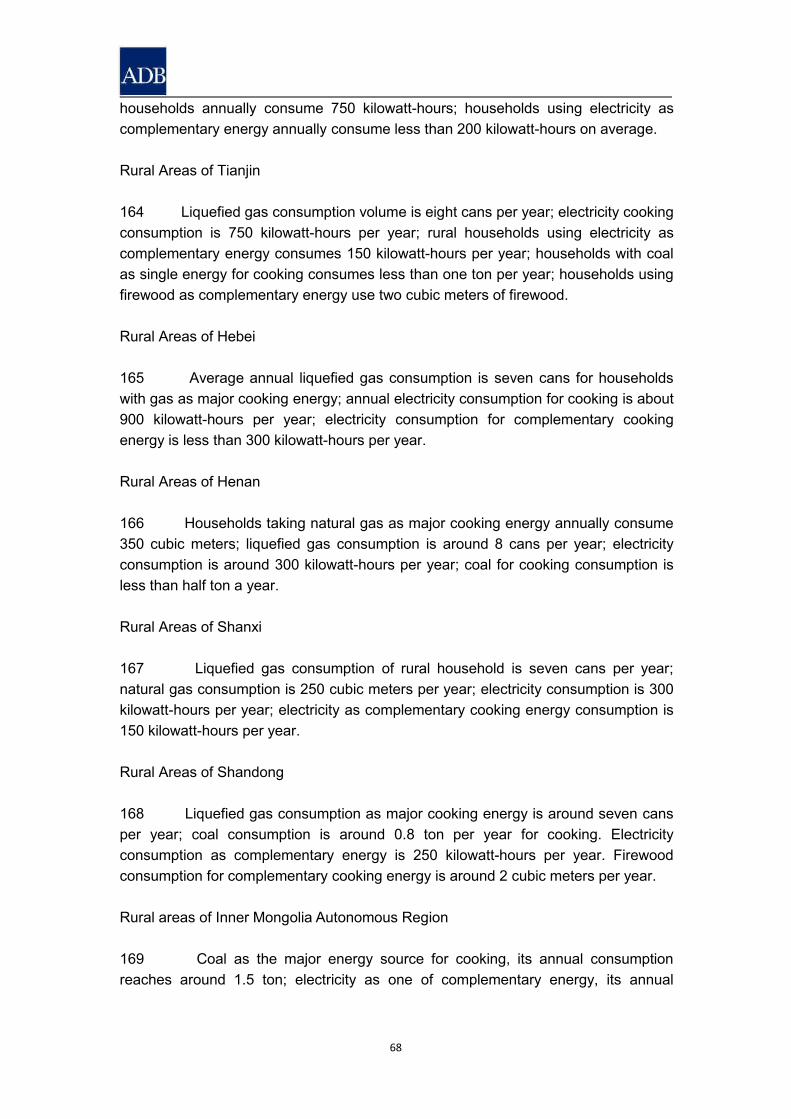
68
households annually consume 750 kilowatt-hours; households using electricity ascomplementary energy annually consume less than 200 kilowatt-hours on average.
Rural Areas of Tianjin
164 Liquefied gas consumption volume is eight cans per year; electricity cookingconsumption is 750 kilowatt-hours per year; rural households using electricity ascomplementary energy consumes 150 kilowatt-hours per year; households with coalas single energy for cooking consumes less than one ton per year; households usingfirewood as complementary energy use two cubic meters of firewood.
Rural Areas of Hebei
165 Average annual liquefied gas consumption is seven cans for householdswith gas as major cooking energy; annual electricity consumption for cooking is about900 kilowatt-hours per year; electricity consumption for complementary cookingenergy is less than 300 kilowatt-hours per year.
Rural Areas of Henan
166 Households taking natural gas as major cooking energy annually consume350 cubic meters; liquefied gas consumption is around 8 cans per year; electricityconsumption is around 300 kilowatt-hours per year; coal for cooking consumption isless than half ton a year.
Rural Areas of Shanxi
167 Liquefied gas consumption of rural household is seven cans per year;natural gas consumption is 250 cubic meters per year; electricity consumption is 300kilowatt-hours per year; electricity as complementary cooking energy consumption is150 kilowatt-hours per year.
Rural Areas of Shandong
168 Liquefied gas consumption as major cooking energy is around seven cansper year; coal consumption is around 0.8 ton per year for cooking. Electricityconsumption as complementary energy is 250 kilowatt-hours per year. Firewoodconsumption for complementary cooking energy is around 2 cubic meters per year.
Rural areas of Inner Mongolia Autonomous Region
169 Coal as the major energy source for cooking, its annual consumptionreaches around 1.5 ton; electricity as one of complementary energy, its annual
69
consumption is about 100 kilowatt-hours; firewood as another complementary energy,its annual consumption is around 3 cubic meters.
Rural Areas of Liaoning
170 Liquefied gas consumption is about 4 cans per year for household using gasas dominant cooking energy; firewood as the dominant cooking energy, annualconsumption volume is about 3 cubic meters; electricity consumption is about 200kilowatt-hours for household mainly using electronic devices for cooking; electricity asthe complementary energy, its consumption is around 80 kilowatt-hours per year.
e Energy Price for Cooking
Rural Areas of Beijing
171 Liquefied gas price is tiered, with first six cans priced ¥55 per can, and ¥110per can for excess ones within one year; gas is ¥2.8 per cubic meter; electricity is¥0.48 per kilowatt-hour. Energy consumption for cooking averagely requires ¥1,500each year, accounting for 20% of rural household total energy expenses. The ratio of20% is relatively low compared with that of other places, because Coal to Electricity orCoal to Gas transformation have been enacted in rural Beijing, and household have topay higher price for heating.
Rural Areas of Tianjin
172 Liquefied gas price is ¥110 per can; electricity is ¥0.48 per kilowatt-hour;coal for cooking is ¥600 per ton. Energy consumption for cooking averagely requires¥1,300 each year, accounting for 30% of rural household total energy expenses.Although with higher price of unsubsidized liquefied gas price, average total energyconsumption for cooking is lower than that of rural area in Beijing. Thus, the highexpenditure on liquefied gas lies in the high price in Tianjin, rather than the amount ofliquefied gas consumed in Tianjin.
Rural Areas of Hebei
173 Liquefied gas is ¥100 per can; electricity is ¥0.52 per kilowatt-hour forordinary hours, ¥0.55 for peak hours, and ¥0.3 for valley hours. Energy consumptionfor cooking averagely require ¥900 each year, accounting for 25% of rural householdtotal energy expenses, while energy consumption in winter for heating occupies alarge part of their total energy expenses.
Rural Areas of Henan
174 Natural gas is ¥2.68 per cubic meter; electricity is ¥0.586 per kilowatt-hour;
70
liquefied gas price is ¥120 per can. Energy consumption for cooking averagelyrequires ¥1,000 each year, accounting for 25% of rural household total energyexpenses. Rural household generally use electricity or natural gas as heating energy,thus raising the total energy expenses.
Rural Areas of Shanxi
175 Natural gas is ¥2.28 per cubic meters; electricity is ¥0.55 per kilowatt-hour;liquefied gas is ¥120 per can. Energy consumption for cooking averagely requires¥900 each year, accounting for 30% of rural household total energy expenses. Ruralhousehold in Shanxi prefer using electricity and gas as major cooking energy.
Rural Areas of Shandong
176 Liquefied gas is ¥110 per can; electricity is ¥0.6 per kilowatt-hour; coal is¥ 900 per ton. Energy consumption for cooking averagely requires ¥900 each year,accounting for 35% of rural household total energy expenses. The ratio of 35% is thesecond highest among eight rural areas in greater BTH region. Cooking energyconsumption occupies a comparatively large part of their total energy expenses.
Rural areas of Inner Mongolia Autonomous Region
177 As two major energies for cooking, coal is ¥650 per ton; electricity is ¥0.5 perkilowatt-hour. A small number of rural house use non-commercial firewood forcooking. Energy consumption for cooking averagely requires ¥1,000 each year,accounting for 45% of rural household total energy expenses. Energy consumptionstructure in Inner Mongolia Autonomous Region lacks variety. In addition, it is rathercold in winter. Hence, heating and cooking occupies most part of total energyexpenses.
Rural Areas of Liaoning
178 Liquefied gas is ¥105 per can; electricity is ¥0.49 per kilowatt-hour. Energyconsumption for cooking averagely requires ¥500 each year, accounting for 20% ofrural household total energy expenses. The ratio of 20% is the lowest among the eightinvestigated regions. Field survey revealed that there were large quantities of corn inthe farmland, which produced rich bioenergy resources. Their energy consumptionbehavior is prone to selecting more cheap or economic energies.
iii Rural Residential Travel
179 Rural residents in the greater BTH region usually use electric-chargedcycles as travel tools. Nearly all the rural families have at least one electric cycle.
71
Even those family already having a car, they would also buy electric cycles, for thatsome rural lane is quite narrow and electric cycle is more convenient and economic.Electric bicycle occupies 70% and other electric tricycle and domestic small electricvehicle occupy 30%.
180 Electric-charged cycles are favored by residents in rural areas for their lowcost, convenience and environmentally friendly functions. During the investigation, itwas found that each household had at least one electric cycle in addition to familieswith all or most members being too old to travel. Even if some families have cars,there are electric cycles as well. The relatively narrow roads in rural areas are also thereason why the more flexible electric cycles are popular in rural areas.
181 Cars are not as common as electric cycles in the greater BTH rural area,with only 5%, because car is much more expensive and the cheapest car is over 10times the price of electric cycle.
Comparison of Travel Energy Consumption
182 The battery capacity of typical electric bicycle is 20Ah, and its motor is a 48Vbrushless motor whose speech can reach 30km/h. And theoretically, the cruisingdistance can reach 80km1. In other words, with 1 kW·h of electricity, it can run up to80km. Electricity charges ¥0.48 per kW·h. Generally, a car may cost 8 to 9 liters ofgasoline for 100 km, and the price of 92# of LNG is about 6 to 7 yuan per liter. 1 kW·hof electricity, is equivalent to 123.03g of coal. 1 liter of 92# of LNG is equivalent to1.08kg coal. At the same distance, the energy consumption of a car is 56 times that ofthe electric vehicle. The price an electric bicycle costs is much lower than the price acar costs for short distance in rural areas.
183 Vehicle exhausts heavily pollute the environment, but the electric bicycle ispowered by the electricity without any exhaust. Therefore, riding electric bicycle ismore environmental-friendly.
184 The field survey result shows that the family’s environmental awareness andbehavior are different. Most residents ride electric bicycles in daily life because oflower price and convenience rather than to reduce fossil energy consumption.Households who bought cars need to travel or work. Therefore, rural residents’ travelequipment in the greater BTH region depends on income and social environment, andclean travel is a passive choice rather than subjective consciousness.
1 Chen Senkai, Lian Liling, Huang Zhenze, Liang Jingzhi, Lan Shiyou, Zhu Jiangting. Study on theTesting Method for Energy Consumption of Wheel Motor for E-bike[J]. Electronics Quality, 2018(02): 1-2.

72
iv Daily Energy Consumption
185 In the surveyed area, each household has one or two electricity meters (onefor household, one for farming). Therefore, it’s difficult to distinguish life andentertainment energy (mainly electricity) from cooking electricity, heating electricity,and agricultural electricity. Such differences will be discussed latter in “EnergyConsumption Per Capita”.
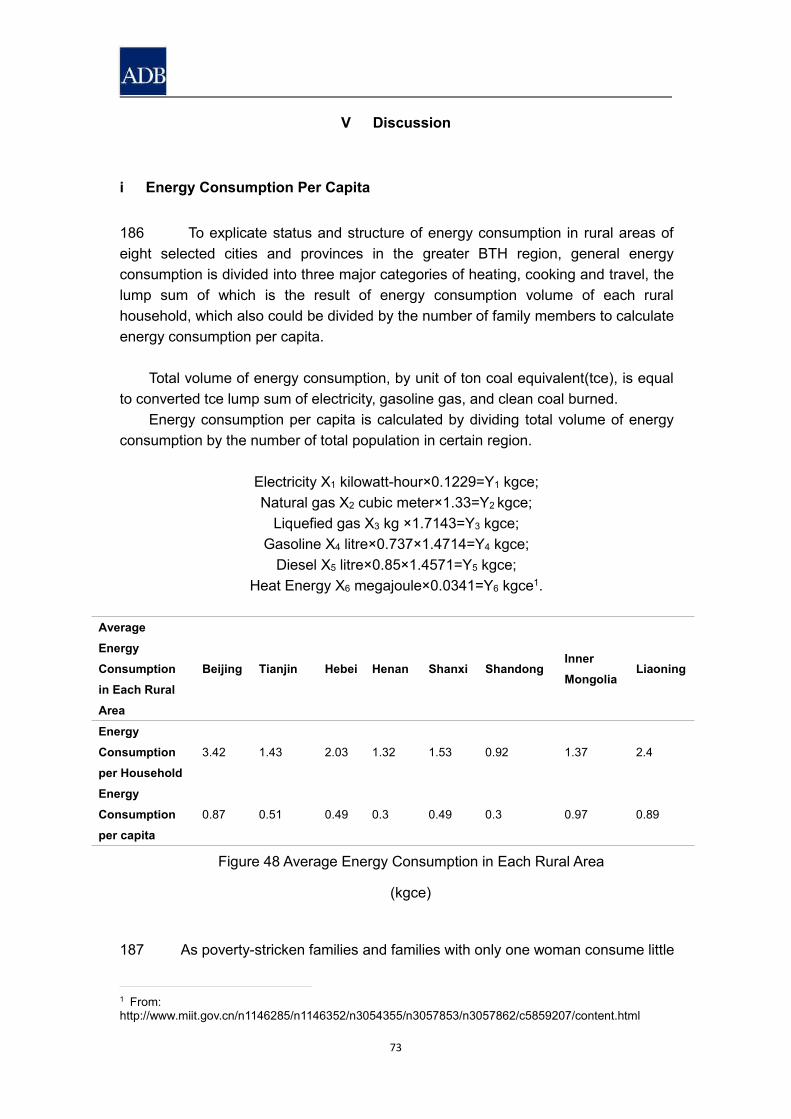
73
V Discussion
i Energy Consumption Per Capita
186 To explicate status and structure of energy consumption in rural areas ofeight selected cities and provinces in the greater BTH region, general energyconsumption is divided into three major categories of heating, cooking and travel, thelump sum of which is the result of energy consumption volume of each ruralhousehold, which also could be divided by the number of family members to calculateenergy consumption per capita.
Total volume of energy consumption, by unit of ton coal equivalent(tce), is equalto converted tce lump sum of electricity, gasoline gas, and clean coal burned.
Energy consumption per capita is calculated by dividing total volume of energyconsumption by the number of total population in certain region.
Electricity X1 kilowatt-hour×0.1229=Y1 kgce;Natural gas X2 cubic meter×1.33=Y2 kgce;Liquefied gas X3 kg ×1.7143=Y3 kgce;
Gasoline X4 litre×0.737×1.4714=Y4 kgce;Diesel X5 litre×0.85×1.4571=Y5 kgce;
Heat Energy X6 megajoule×0.0341=Y6 kgce1.
AverageEnergyConsumptionin Each RuralArea
Beijing Tianjin Hebei Henan Shanxi ShandongInnerMongolia
Liaoning
EnergyConsumptionper Household
3.42 1.43 2.03 1.32 1.53 0.92 1.37 2.4
EnergyConsumptionper capita
0.87 0.51 0.49 0.3 0.49 0.3 0.97 0.89
Figure 48 Average Energy Consumption in Each Rural Area
(kgce)
187 As poverty-stricken families and families with only one woman consume little
1 From:http://www.miit.gov.cn/n1146285/n1146352/n3054355/n3057853/n3057862/c5859207/content.html
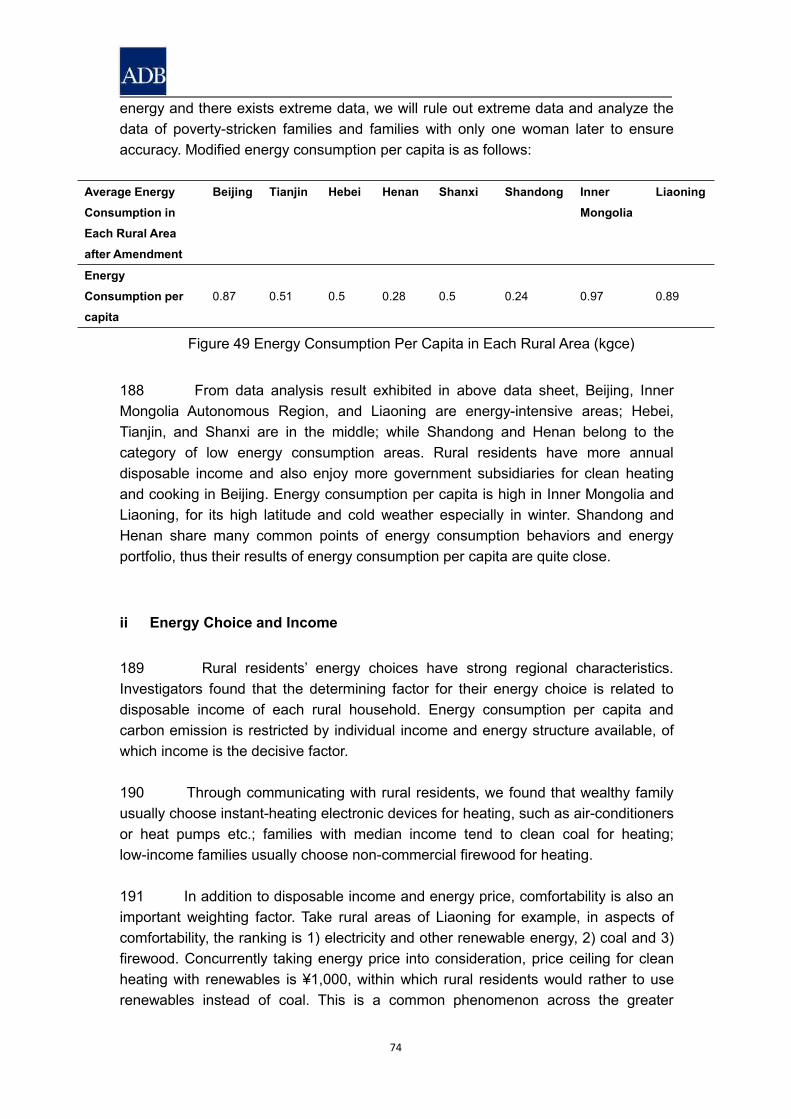
74
energy and there exists extreme data, we will rule out extreme data and analyze thedata of poverty-stricken families and families with only one woman later to ensureaccuracy. Modified energy consumption per capita is as follows:
Average EnergyConsumption inEach Rural Areaafter Amendment
Beijing Tianjin Hebei Henan Shanxi Shandong InnerMongolia
Liaoning
EnergyConsumption percapita
0.87 0.51 0.5 0.28 0.5 0.24 0.97 0.89
Figure 49 Energy Consumption Per Capita in Each Rural Area (kgce)
188 From data analysis result exhibited in above data sheet, Beijing, InnerMongolia Autonomous Region, and Liaoning are energy-intensive areas; Hebei,Tianjin, and Shanxi are in the middle; while Shandong and Henan belong to thecategory of low energy consumption areas. Rural residents have more annualdisposable income and also enjoy more government subsidiaries for clean heatingand cooking in Beijing. Energy consumption per capita is high in Inner Mongolia andLiaoning, for its high latitude and cold weather especially in winter. Shandong andHenan share many common points of energy consumption behaviors and energyportfolio, thus their results of energy consumption per capita are quite close.
ii Energy Choice and Income
189 Rural residents’ energy choices have strong regional characteristics.Investigators found that the determining factor for their energy choice is related todisposable income of each rural household. Energy consumption per capita andcarbon emission is restricted by individual income and energy structure available, ofwhich income is the decisive factor.
190 Through communicating with rural residents, we found that wealthy familyusually choose instant-heating electronic devices for heating, such as air-conditionersor heat pumps etc.; families with median income tend to clean coal for heating;low-income families usually choose non-commercial firewood for heating.
191 In addition to disposable income and energy price, comfortability is also animportant weighting factor. Take rural areas of Liaoning for example, in aspects ofcomfortability, the ranking is 1) electricity and other renewable energy, 2) coal and 3)firewood. Concurrently taking energy price into consideration, price ceiling for cleanheating with renewables is ¥1,000, within which rural residents would rather to userenewables instead of coal. This is a common phenomenon across the greater
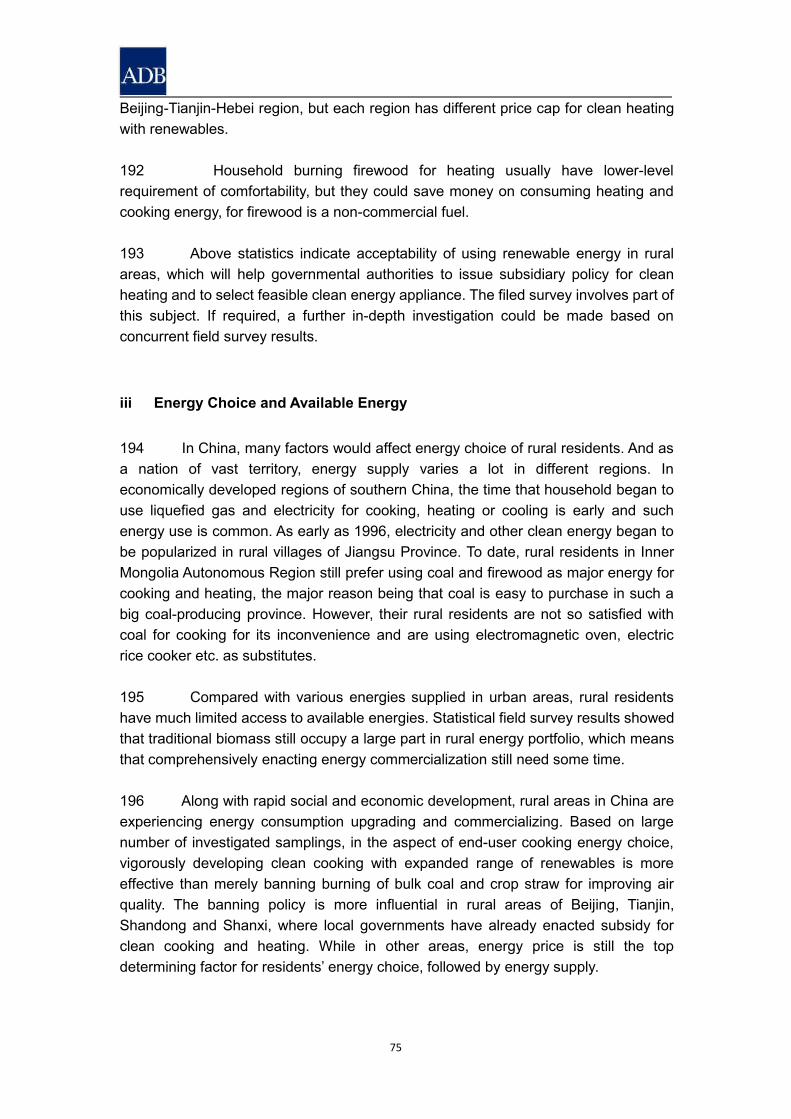
75
Beijing-Tianjin-Hebei region, but each region has different price cap for clean heatingwith renewables.
192 Household burning firewood for heating usually have lower-levelrequirement of comfortability, but they could save money on consuming heating andcooking energy, for firewood is a non-commercial fuel.
193 Above statistics indicate acceptability of using renewable energy in ruralareas, which will help governmental authorities to issue subsidiary policy for cleanheating and to select feasible clean energy appliance. The filed survey involves part ofthis subject. If required, a further in-depth investigation could be made based onconcurrent field survey results.
iii Energy Choice and Available Energy
194 In China, many factors would affect energy choice of rural residents. And asa nation of vast territory, energy supply varies a lot in different regions. Ineconomically developed regions of southern China, the time that household began touse liquefied gas and electricity for cooking, heating or cooling is early and suchenergy use is common. As early as 1996, electricity and other clean energy began tobe popularized in rural villages of Jiangsu Province. To date, rural residents in InnerMongolia Autonomous Region still prefer using coal and firewood as major energy forcooking and heating, the major reason being that coal is easy to purchase in such abig coal-producing province. However, their rural residents are not so satisfied withcoal for cooking for its inconvenience and are using electromagnetic oven, electricrice cooker etc. as substitutes.
195 Compared with various energies supplied in urban areas, rural residentshave much limited access to available energies. Statistical field survey results showedthat traditional biomass still occupy a large part in rural energy portfolio, which meansthat comprehensively enacting energy commercialization still need some time.
196 Along with rapid social and economic development, rural areas in China areexperiencing energy consumption upgrading and commercializing. Based on largenumber of investigated samplings, in the aspect of end-user cooking energy choice,vigorously developing clean cooking with expanded range of renewables is moreeffective than merely banning burning of bulk coal and crop straw for improving airquality. The banning policy is more influential in rural areas of Beijing, Tianjin,Shandong and Shanxi, where local governments have already enacted subsidy forclean cooking and heating. While in other areas, energy price is still the topdetermining factor for residents’ energy choice, followed by energy supply.
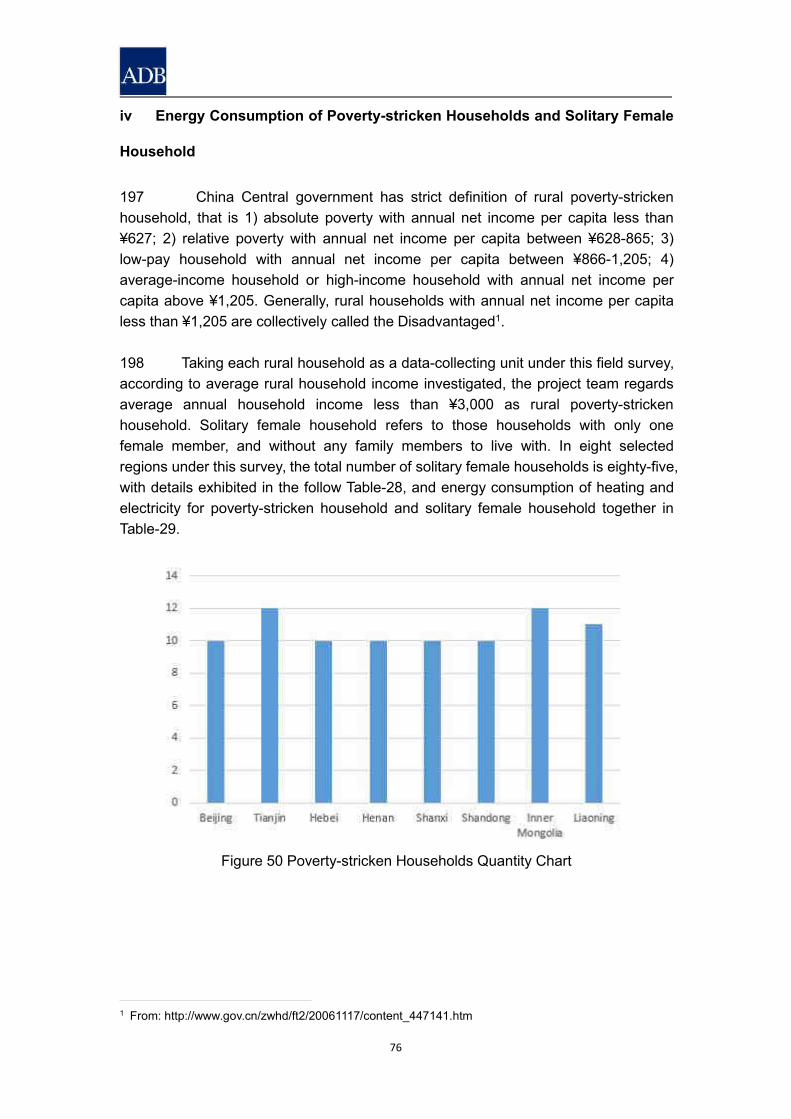
76
iv Energy Consumption of Poverty-stricken Households and Solitary Female
Household
197 China Central government has strict definition of rural poverty-strickenhousehold, that is 1) absolute poverty with annual net income per capita less than¥627; 2) relative poverty with annual net income per capita between ¥628-865; 3)low-pay household with annual net income per capita between ¥866-1,205; 4)average-income household or high-income household with annual net income percapita above ¥1,205. Generally, rural households with annual net income per capitaless than ¥1,205 are collectively called the Disadvantaged1.
198 Taking each rural household as a data-collecting unit under this field survey,according to average rural household income investigated, the project team regardsaverage annual household income less than ¥3,000 as rural poverty-strickenhousehold. Solitary female household refers to those households with only onefemale member, and without any family members to live with. In eight selectedregions under this survey, the total number of solitary female households is eighty-five,with details exhibited in the follow Table-28, and energy consumption of heating andelectricity for poverty-stricken household and solitary female household together inTable-29.
Figure 50 Poverty-stricken Households Quantity Chart
1 From: http://www.gov.cn/zwhd/ft2/20061117/content_447141.htm
77
Figure 51 Heating Cost Portfolio (unit: Yuan)
199 Observed from data analysis result, the energy cost for heating for mostpoverty-stricken households and solitary female households is within ¥1,000, andnearly one third of poverty-stricken households only burn firewood for heating. Tworeasons could explain that: 1) low income, a majority of them merely live ongovernmental subsidy, and are unable to afford commercial fuels; 2) ideology: likeUncle Zhang, who is a beneficiary of five governmental guarantees, he could get amonthly subsidy of ¥1,200, but he wants to save as much as he could. His annualelectricity bill is about ¥100. In his earthen house, he was warmed by burning firewoodcollected in the farmland. The subsidy each identified poverty-stricken family could getvaries according to regional policy, but residents’ living principle is the same, which isto save money wherever and whenever possible.
78
VI Conclusion
200 The report draws the following conclusions by analyzing the level, structureand influencing factors of energy consumption.
201 Rural households in the greater BTH region have diversified ways of energyconsumption, including electricity, gas, coal and fuelwood. As Chinese governmentvigorously promotes the rural clean energy use and the income of rural residents isincreasing, the consumption of coal and fuelwood has gradually decreased, evenranks the back burner.
202 Rural heating and cooking are the main factors contributing to air pollution.Rural cooking, lighting and entertainment are the normal energy consumption, butheating is incremental energy consumption, which is the primary factor causing airpollution. In rural areas of Beijing, Tianjin, Hebei, Shanxi, Shandong and Henan wherethe policy dominates, heating and cooking are mainly based on clean energy, such asnatural gas and electricity, accounting for approximately 60%. In Liaoning and InnerMongolia with less policies, coal and fuelwood are mainly used for rural heating andcooking, taking up about 80%. Therefore, it is quite necessary to advance rural cleanenergy policy in greater BTH region, which should be precise to make sure thesustainability.
203 Infrastructure construction has a great impact on rural clean energy use,such as rural power grid reliability transformation, gas pipeline network laying,liquefied gas station layout, traffic road facilities, etc., which directly determinewhether the energy consumption structure of rural residents can be upgraded.However, the infrastructure transformation should first consider the rural developmenttrend and avoid a large number of effortless investments caused by rural hollowingout or relocation.
204 The long-term outflow of young adults and the aging tendency in rural areasmainly hinder the rural clean energy transformation.
205 Rural biomass resources are abundant, but the clean utilization rate isextremely limited, and there is an urgent need for innovative ideas.
206 Rural residents are accustomed to traditional energy, so it is quite necessaryto strengthen clean energy education. In the past, the backward energy consumptionmodel had a strong inertia effect on the energy consumption of rural residents. Forexample, “cooking needs to use open fire”, “warm Kang with burning coal iscomfortable” are deeply rooted among rural residents. Therefore, in the process ofpromoting clean energy, apart from giving some subsidies. it is particularly important

79
to conduct universal education.
\
Under TA-9403 PRC: Study of Clean Energy Supply for the Rural Areas in the Greater Beijing-Tianjin-Hebei Region-Consulting Firm (Survey) (51031-001)
May 2022
Study Report on Clean Energy Supply for Rural Areas in the Greater Beijing-Tianjin-Hebei Region (GBTH Region)
Table of Contents
Chapter 1: Project Overview ............................................................................................. 1
1.1 Project Background ......................................................................................... 1
1.2 Project Areas .................................................................................................... 2
1.3 Expected Outputs of the Project ..................................................................... 4
Chapter 2: Energy Resources Availability and Development Potential in Rural GBTH 5
2.1 Status-quo of Clean Energy Uses in the Rural Areas .................................... 5
2.1.1 Use of wind ................................................................................................. 6
2.1.2 Use of solar energy ..................................................................................... 7
2.1.3 Use of geothermal energy ........................................................................... 9
2.1.4 Use of biomass ......................................................................................... 12
2.1.5 Use of clean coal ....................................................................................... 13
2.1.6 Use of electricity ........................................................................................ 14
2.1.7 Use of natural gas ..................................................................................... 15
2.2 Potential of Rural Clean Energy Development ............................................. 16
2.2.1 Wind .......................................................................................................... 16
2.2.2 Solar energy .............................................................................................. 20
2.2.3 Geothermal ............................................................................................... 26
2.2.4 Biomass .................................................................................................... 31
Chapter 3: The Energy Consumption Status Quo in the GBTH and Its Environmental
Impact ............................................................................................................ 37
3.1 The Status Quo of Rural Energy Consumption ............................................ 37
3.1.1 Changes in rural energy consumption in GBTH ......................................... 37
3.1.2 The characteristics of rural energy consumption by region ........................ 38
3.2 Analysis of the Rural Energy Consumption Structure................................. 39
3.2.1 Types of energy consumed in rural areas .................................................. 39
3.2.2 Analysis of the different rural energy types ................................................ 39
3.2.3 Analysis of the different energy consumption structures of different regions ..
................................................................................................................. 40
3.2.4 Major factors affecting the energy consumption structure in the rural areas ..
................................................................................................................. 41
3.3 The Environmental Impact of Rural Energy Consumption .......................... 41

3.3.1 Emission factors for major pollutants ......................................................... 42
3.3.2 The measurement of major pollutant emissions ........................................ 42
3.3.3 Differences in pollutant emissions across provinces/regions ..................... 43
3.3.4 Differences in pollutant emissions across provinces/regions ..................... 44
Chapter 4: Evaluation of Policies for Developing Clean Energy in the GBTH Region 47
4.1 Policy Type: Plans .......................................................................................... 47
4.2 Policy Type: Restrictions ............................................................................... 47
4.3 Policy Type: Incentives .................................................................................. 49
4.4 Policy Type: Taxation and Subsidies ............................................................ 51
4.5 Overall Evaluation .......................................................................................... 53
4.5.1 Evaluation of effectiveness ........................................................................ 53
4.5.2 Evaluation of feasibility .............................................................................. 53
4.5.3 Evaluation of suitability .............................................................................. 54
4.5.4 Evaluation of operability ............................................................................ 55
4.6 Existing Issues ............................................................................................... 56
4.6.1 Fragmentation of policies .......................................................................... 56
4.6.2 Lack of details in implementation ............................................................... 56
4.6.3 Lack of granularity (specificity) in the provision of subsidies to different
places ........................................................................................................ 56
Chapter 5: Technical Models of Clean Energy Consumption in the GBTH Region .... 57
5.1 Technical Models of “Coal-to-Electricity” Projects in Rural Areas ............. 57
5.1.1 Technical descriptions and characteristics ................................................. 57
5.1.2 “Coal-to-electricity” projects and their implementation ............................... 58
5.1.3 Case studies of coal-to-electricity projects ................................................. 60
5.1.4 Technical and economic evaluation ........................................................... 63
5.1.5 Financing requirements analysis ............................................................... 64
5.1.6 Areas suitable for “coal-to-electricity” application ....................................... 64
5.2 Technical Models of “Coal-to-Gas” Projects in Rural Areas ....................... 65
5.2.1 Technical descriptions and characteristics ................................................. 65
5.2.2 The “coal-to-gas” projects and their implementation .................................. 65
5.2.3 Case study ................................................................................................ 67
5.2.4 Technical and economic evaluation ........................................................... 67
5.2.5 Financing requirements analysis ............................................................... 68
5.2.6 The areas suitable for application .............................................................. 68
5.3 Solar Thermal Energy Systems ..................................................................... 69
5.3.1 Technical descriptions and characteristics ................................................. 69
5.3.2 Supply models and applications of solar thermal energy ........................... 69
5.3.3 Case studies ............................................................................................. 72
5.3.4 Technical and economic evaluation ........................................................... 74
5.3.5 Financing analysis ..................................................................................... 75
5.3.6 Areas suitable for solar heating application ............................................... 75
5.4 Centralized Energy Supply Systems Using Gasified Biomass ................... 75
5.4.1 Technical descriptions and characteristics ................................................. 75
5.4.2 Centralized energy supply model using biomass gasification, and its
application ................................................................................................. 76
5.4.3 Case study ................................................................................................ 77
5.4.4 Technical and economic evaluation ........................................................... 77
5.4.5 Financing analysis ..................................................................................... 78
5.4.6 Areas suitable for application..................................................................... 78
5.5 Centralized Heating Systems Using Direct Burning of Straw Bales ........... 79
5.5.1 Technical descriptions and characteristics ................................................. 79
5.5.2 Centralized heating systems using direct burning of straw bales and its
application ................................................................................................. 80
5.5.3 Case study ................................................................................................ 81
5.5.4 Technical and economic evaluation ........................................................... 81
5.5.5 Financing analysis ..................................................................................... 82
5.5.6 Areas suitable for application of straw bale heating systems ..................... 83
5.6 The Anaerobic Digestion Biogas Production System ................................. 83
5.6.1 Technical descriptions and characteristics ................................................. 83
5.6.2 Anaerobic digestion biogas production technology and its application ....... 83
5.6.3 Case studies ............................................................................................. 84
5.6.4 Technical and economic evaluation ........................................................... 86
5.6.5 Areas suitable for application..................................................................... 86
5.7 Clean Cooking and Heating Appliances Solutions for Rural Households . 86
5.7.1 Technical descriptions and characteristics .......................................... 86
5.7.2 Technical model of “matching fuel with the cooking/heating appliances” and
its application ............................................................................................ 87
5.7.3 Case Studies of “cooking and heating appliances with matching fuels”
................................................................................................................. 88
5.7.4 Technical and economic evaluation ...................................................... 89
5.7.5 Areas suitable for application ................................................................ 91
5.8 Energy-Efficient Buildings in Rural Areas .................................................... 92
5.8.1 Technical composition and characteristics ................................................. 92
5.8.2 Technical descriptions and applications .................................................... 92
5.8.3 Case studies ............................................................................................. 94
5.8.4 Technical and economic evaluation ........................................................... 94
5.8.5 Areas suitable for application..................................................................... 95
Chapter 6: International Best Practices for Rural Clean Energy Supply ..................... 97
6.1 Trends and Policies of Rural Renewable Energy Development in the Developed Countries ...................................................................................... 97
6.1.1 Rural renewable energy trends .................................................................. 99
6.1.2 Rural Renewable Energy Policies ........................................................... 119
6.2 International Good/Best Practices for Renewable Energy Development in Rural Areas ................................................................................................... 122
6.2.1 Good Practices for Development of Grid-Interconnected Solar, Wind or
Biomass Electricity Systems .................................................................... 122
6.2.2 Good Practices for Development of non-Grid Connected Solar, Biomass,
and Wind Energy Systems ...................................................................... 128
6.2.3 Good Practice for Development of Renewable Energy Space and Process
Heat Systems .......................................................................................... 133
6.2.4 Good Practice for Use of Renewable Energy for Fuels Production .......... 136
6.2.5 Good Practice for Energy Efficiency Deployment in Rural Areas ............. 139
6.2.6 Good Practice in Providing Information, Financing Services, and Other
Support for Rural Renewables. ................................................................ 141
6.3 Case Studies of Successful Rural Renewable Energy Systems ............... 142
6.3.1 “A Solar Revolution in Rural America” ..................................................... 142
6.3.2 Electric Heat Pump District Heating in Denmark ...................................... 146
6.3.3 Kidston Clean Energy Hub ...................................................................... 148
6.3.4 Agriculture and Solar PV Systems in Japan ............................................ 149
6.4 Conclusions .................................................................................................. 152
Chapter 7: Pilot Projects of Clean Energy Supply in Rural Areas of GBTH .............. 156
7.1 Clean Energy Supply in Rural Areas of Yangxin County, Shandong Province ........................................................................................................ 156
7.1.1 Basic conditions ...................................................................................... 156
7.1.2 Analysis of rural energy endowments and energy consumption .............. 157
7.1.3 The implementation of clean energy supply in rural areas ....................... 159
7.1.4 Project impacts ........................................................................................ 161
7.2 Clean Energy Supply in Xiliangwa Township, Anping County, Hebei Province ........................................................................................................ 163
7.2.1 Basic conditions ...................................................................................... 163
7.2.2 Analysis of rural energy resource endowment and consumption in Anping
County ..................................................................................................... 163
7.2.3 Major clean energy supply projects in rural Xiliangwa ............................. 166
7.2.4 Project impacts ........................................................................................ 168
7.3 Clean Energy Supply In Rural Areas Of Shangdang District, Changzhi City, Shanxi Province ........................................................................................... 169
7.3.1 Basic conditions ...................................................................................... 169
7.3.2 Analysis of energy resource endowment and consumption in Shangdang.....
............................................................................................................... 170
7.3.3 Clean energy supply development and implementation in Shangdang .... 172
7.3.4 Project impacts ........................................................................................ 173
Chapter 8: Recommendations ...................................................................................... 175
8.1 Greater Policy Support ................................................................................ 175
8.2 Expand Financing Channels ........................................................................ 176
8.3 Implement Rural Clean Energy Replacement Projects .............................. 176
8.4 Implement Rural Building Retrofitting Projects for Higher Energy Efficiency ..................................................................................................................... 177
8.5 Drive Clean Energy-oriented Industrial Upgrading .................................... 177
Table of Figures
Figure 2-1: Distribution of Chinese geothermal resources ................................................... 26
Figure 3-1: The Status Quo of Rural Domestic Energy Consumption in GBTH ................... 38
Figure 3-2: Shares of Different Regions /Provinces in the GBTH Rural Domestic Energy Consumption ................................................................................................ 39
Figure 3-3: The Rural Domestic Energy Consumption Structure in GBTH ........................... 40
Figure 3-4: The Pollutant Emissions from Rural Domestic Energy Consumption in GBTH .. 44
Figure 3-5: The Contribution Rates to SO2 Emissions by Different Types of Energy in GBTH .................................................................................................................... 44
Figure 3-6: The Contribution Rates to NOx Emissions by Different Types of Energy in GBTH .................................................................................................................... 45
Figure 3-7: The Contribution Rates to TSP Emissions by Different Types of Energy in GBTH .................................................................................................................... 45
Figure 5-1: The Technical Roadmap of “Coal-to-electricity” Projects ................................... 58
Figure 5-2: The heating process in ASHP households ........................................................ 60
Figure 5-3: Gas supply infrastructure in “coal-to-gas” projects ............................................ 66
Figure 5-4: Technical Roadmap of “Solar Energy + Heat Pumps” Approach to Rural Heating .................................................................................................................... 70
Figure 5-5: ” Technical Roadmap for “Solar Energy + Biomass Boilers” Approach to Rural Heating ........................................................................................................ 71
Figure 5-6: Technical Roadmap for “Solar Energy + Gas Boilers” Systems ........................ 71
Figure 5-7: Technical Route of Biomass Gasification Co-generation Model ........................ 77
Figure 5-8: Technical Process for Centralized Heating Systems Using Direct Burning of Straw Bales ............................................................................................................ 80
Figure 5-9: Technical Elements and Co-products of of Anaerobic Digestion Biogas Production.................................................................................................... 84
Figure 6-1: Solar Thermal (left) and Wood Pellet Boiler (right) Systems Used as an Industrial Facility in Austria ........................................................................................ 101
Figure 6-2: Thermal Energy Storage System .................................................................... 102
Figure 6-3: Anaerobic Lagoon with Gas Collecting Cover in North Carolina, USA ............. 104
Figure 6-4: Biomass-fed, Syngas-producing Gasifier with Biochar as a Co-product .......... 105
Figure 6-5: Example of an Industrial Wood Chipper .......................................................... 106
Figure 6-6: Wood Pellet Fuel ............................................................................................. 107
Figure 6-7: Diagram of Typical Pelleting Process .............................................................. 108
Figure 6-8: Wind Turbines on Agricultural Land in Sherman County, Oregon (USA) ......... 109
Figure 6-9: “Solar Sharing” System Combining Agriculture and Solar PV in Japan (Source, Japan for Sustainability, 2014) ................................................................... 110
Figure 6-10: Comparison of Different Electricity Storage Technologies ............................. 116
Figure 6-11: Green Ammonia Production and End-uses (from Kakish, 2020) ................... 119
Figure 6-12: Kubota Autonomous Electric Tractor ............................................................. 127
Figure 6-13: Example of Greenhouses in Rural Hebei (Google Earth Pro image) ............. 133
Figure 6-14: Levelized Cost of Heat Versus Annual Heat Demand for a Renewable and Fossil Technologies (from ARENA, 2019) ............................................................ 135
Figure 6-15: Volume Targets for Renewable Fuels by Type and Year in the United States138
Figure 6-16: Implementation Status of Solar PV Systems at Rural Cooperative Utilities Before and After SUNDA Project (from NRECA, 2018) ......................................... 143
Figure 6-17: Cumulative Solar PV Deployment at Rural Cooperative Utilities Before and After SUNDA Project (from NRECA, 2018) ......................................................... 144
Figure 6-18: Contribution of Fossil Fuels and Clean Energy to Total Employment in US Midwestern States, 2017 (Figure from NRDC, 2018) ................................. 146
Figure 6-19: Annual District Heat Production By Fuel in Aarhus, Denmark ....................... 148
Figure 6-20: Plan for the Kidston Clean Energy Hub ......................................................... 148
Figure 6-21: Solar PV Mounting Frame Allowing Access by Tractors to Tend Crops......... 150
Figure 6-22: Solar PV Panels on Rice Fields in Kamisu City, Ibaraki Prefecture, Japan .... 151
Figure 7-1: Jurisdictions within Yangxin County ................................................................ 156
Figure 7-2: The rural energy consumption structure in Yangxin County (2016) ................. 158
Figure 7-3: Domestic energy consumption structure in rural areas of Yangxin County (2020) .................................................................................................................. 162
Figure 7-4: Structure of Rural Residential Energy Consumption in Xiliangwa Township (2016) .................................................................................................................. 165
Figure 7-5: Biomass Development and Utilization Projects in in Xiliangwa Township ........ 166
Figure 7-6: Daily Energy Use Structure of Rural Xiliangwa Township (2020) .................... 168
Figure 7-7: An Ecological Recycling Model of Multi-production of Gas, Electricity, Heat, and Fertilizer for Biomass Utilization ................................................................. 169
Figure 7-8: Rural Energy Consumption Structure in Shangdang District (2016) ................ 171
Figure 7-9: Shangdang Rural Energy Consumption Structure (2020) ................................ 174
Table of Tables
Table 2-1: Benefits achieved at different project scales in Henan PV project ........................ 8
Table 2-2: The reserves of wind energy at a hub height of 70m in GBTH (≥ 300 W/m2) ..... 16
Table 2-3: Classification of solar energy resources ............................................................. 21
Table 1-4: The status of Agricultural waste resources in Hebei Province ............................ 56
Table 3-1: Rural Domestic Energy Consumption Structures across Provinces/regions in GBTH (2017) ............................................................................................... 41
Table 3-2: The Pollutant Emission Factors of Rural Domestic Energy Consumption (g/kgce) .................................................................................................................... 42
Table 3-3: SO2 Emission Factors in Different Jurisdictions of BTH and Its Surrounding Areas (g/kgce) ........................................................................................................ 42
Table 3-4: Pollutant Emissions from Rural Domestic Energy Consumption in GBTH (ten thousand tons) ............................................................................................. 43
Table 5-1: System Parameters of Different “Coal-to-electricity” Options in Beijing Rural Areas .................................................................................................................... 61
Table 5-2: Cost Analysis of Household Electricity Consumption of Using Different Technical Options ........................................................................................................ 62
Table 5-3: Technical evaluation of traditional and different “coal-to-electricity” heating options .................................................................................................................... 63
Table 5-4: Technical evaluation of “coal-to-gas” projects .................................................... 68
Table 5-5: Economic Analysis of Models of “Solar Energy + Multiple Supplementary Energy” in Hebei ....................................................................................................... 73
Table 5-6: Cost comparison between solar heating and other heating options .................... 74
Table 5-7: Evaluation Results of the Biomass Gasification Centralized Energy Supply Model .................................................................................................................... 78
Table 5-8: Technical and Economic Evaluation of Three Types of Boilers on a Per ton per hour (0.7 MW) Capacity Basis ...................................................................... 82
Table 5-9: Comparison of Costs and Environmental Performance of Alternative Heating Facilities ....................................................................................................... 91
Table 5-10: Comparison of heat transfer coefficients with different building envelopes and different qualities of doors and windows ....................................................... 95
Table 6-1: Attributes Supporting or Impeding Rural Renewable Energy Development ........ 98
Table 6-2: Types of Mini-grids and their Attributes ............................................................ 114
Table 6-3: Stakeholder Roles in Independent Mini-grid Development and Operation ........ 130
Table 6-4: Stakeholder Activities and Benefits Associated with Quality Assurance Framework Applications to Independent Mini-grids ....................................................... 130
Table 7-1: Major design parameters for BMF boilers ...................................................... 160
Table 7-2: Gas Equipment Investment at the Customer End in Xiliangwa Township Project .................................................................................................................. 167
Table 7-3: Overview of the Biomass Bale Direct Combustion Heating Technology Campaign .................................................................................................................. 173

Chapter 1: Project Overview The "14th Five-Year Plan" will be remembered in the future as representing a point of departure for China’s journey towards the building of a modern socialist country in an all-encompassing manner. While starting a new stage of development with a commitment to new concepts and a new development paradigm, China will unswervingly drive high-quality development as an approach to achieving its mid-to-long term development blueprint. On September 22, 2020, President Xi Jinping announced in his speech at the General Debate of the 75th United Nations General Assembly that China will increase its “Nationally Determined Contribution” to addressing global climate change and will strive towards the reaching peak national CO2 emissions by 2030, and to reaching carbon neutrality in its economy by 2060. On December 12, 2020, General Secretary Xi Jinping delivered a crucial speech titled "Building on Past Achievements and Launching a New Journey for Global Climate Actions”. During this speech, he pointed out that by 2030, China's CO2 emissions per unit of GDP will have dropped by more than 65% from 2005 levels; non-fossil energy will account for about 25% of primary energy consumption; forest stocks will have increased by 6 billion m³ relative to 2005, and the total installed capacity of wind and solar power will reach more than 1.2 billion kilowatts (kW). The socio-economic development of a society proves to be highly correlated with its energy sector. The energy structure, energy efficiency and energy consumption behaviors of a society play a central role in allowing the achievement of the goals of reaching peak carbon emissions, and ultimately carbon neutrality. China has developed a three-step approach to carbon reduction in the energy sector. Specifically, these three steps involve realizing peak carbon emissions in the 2021-2030 period, rapidly reducing carbon emissions in the 2031–2045 period, and achieving carbon neutrality by deep decarbonization in the 2046–2060 period.1 A suite of strategies has emerged and constitute the new paradigm China is shifting towards: further promoting energy efficiency, accelerating adjustments to the national energy supply structure, optimizing energy consumption methods, enhancing energy efficiency, and making greater use of clean energy such as hydro, wind, solar and nuclear power. This project focuses on rural energy consumption in the Greater Beijing-Tianjin-Hebei Region (the GBTH Region) and undertakes research to analyze the current status, structure, and future potential for rural energy consumption in the region. Based on the analysis undertaken, the project has proposed optimal energy consumption structures, patterns, and spatial layout for the rural energy sector in GBTH, as well as identifying needed supporting policies to promote the changes identified. The project has also resulted in the development of a safe, clean, efficient and sustainable energy production and consumption plan for the region, has explored practical paths for the China’s realization of its peak carbon and carbon neutrality goals, and has provided experience and practices that will be scalable and replicable in rural areas across China.
1.1 Project Background
China is the world's most populous country with a high level of energy consumption, imports or energy resources, and production of energy forms and industrial goods. In 2018, China’s total energy production reached 3.77 billion tonnes of coal equivalent (tce), of which raw coal output was 3.68 billion tons, crude oil 190 million tons and natural gas 160.27 billion m³. In the same year, China’s total energy consumption reached 4.64 billion tce (3.3 tce in per capita terms) of which coal consumption accounted for 59.0%, down by 1.4 percentage point from the previous year. Clean energy forms such as natural gas, hydro, nuclear and wind
1 Chinese Energy Development in the New Times(White Cover),Dec.21, 2020.
2
accounted for 22.1% of total national consumption in 2018, up by 1.3 percentage points from 2017.2 In recent years, China’s economy has gradually shifted towards a paradigm featuring low energy consumption and clean energy production. Although the nation’s total energy consumption is still very large, the growth rate of energy use dropped from 4.8%/year during the “Twelfth Five-Year Plan” (2011–2015) period to 3.3% in the “Thirteenth Five-Year Plan” period (2016–2020). The consumption structure also continued to be improved. Given China’s resource endowments, coal still represents the largest volume of energy consumed but its share in total national consumption has drastically fallen from 94.4% in 1953 to 57.7% in 2019. Clean energy forms, such as natural gas, hydro, nuclear power and wind power, accounted for 23.4% of total consumption in 2019, with other forms of non-fossil energy, including wood and other biomass, accounting for 15.3% of the national total. Carbon emissions per unit of GDP as of 2019 had fallen by about 48.1% compared with 2005 levels, and energy efficiency significantly improved during that period.3 China has become the world's largest powerhouse in terms of the installed capacities of hydro, wind and solar power. The Greater Beijing-Tianjin-Hebei region (the GBTH region), which includes several major metropolitan areas, represents one of the three strongest growth poles in the national economy. GBTH includes 8 provinces, cities and autonomous regions. These jurisdictions are the municipalities of Beijing and Tianjin, Hebei, Henan, Liaoning, Shandong, and Shanxi provinces, and the Inner Mongolia autonomous region. GBTH has a land area accounting for more than 10% of the national total, includes about 25% of the China’s arable land, and is home to more than 25% of the total national population. GBTH is also grappling with the most serious air pollution situation in the country. Despite being home to some of China’s largest cities, 41% of the population of GBTH were living in the rural areas as of 2017. Historically, local rural residents have used “scattered coal” (or “loose coal”, in Chinese “Sanmei”). Scattered coal refers to coal that is often low-cost and low quality, including being high in ash and/or sulfur, and is used in rural areas of GBTH in small boilers, domestic heating stoves and furnaces, and hotel and restaurants stoves and heaters. Scattered coal is typically lower in quality than coal types used in power plants and by other industrial users. The use of scattered coal for cooking and heating in GBTH has contributed to serious air pollution and substantially stressed local ecosystems and public health in GBTH. As the GBTH region is highly relevant to the core carbon emissions and local air pollutant issues that China as a whole is grappling with and thus representative of serious environmental problems in China, the project has selected the GBTH region as the subject for research on energy consumption structures and consumer behavior. The lessons and options for rural clean energy development identified under the Project are expected to provide excellent models that can be scaled up for application across the country. 1.2 Project Areas Overviews of the GBTH jurisdictions are as follows. Beijing had a permanent population of 21.707 million as of 2017, of which 2.309 million people lived in the rural areas of the municipality. Its GDP was 2.80 trillion yuan with annual per capita disposable income of rural residents being 24,240 yuan. Beijing is located in a typical warm temperate belt with a semi-humid continental monsoon climate. It is hot and rainy in the summer and cold and dry in the winter, with relatively short spring and autumn days. The annual average temperature is 10-12 °C, with the lowest on record -27.4°C and the
2 Statistical Bulletin of National Economic and Social Development 2018. 3 State Council Information Office of PRC, 2020.
3
highest 42℃. The annual average precipitation is more than 600 mm but is distributed unevenly across the seasons. 80 percent of Beijing’s annual rainfall happens in the summer months from June to August. Tianjin had a permanent population of 15.5687 million as of 2017, of which 2.685 million lived in rural areas. Tianjin’s GDP is 1.86 trillion yuan and the average annual disposable income of its rural residents was 20,076 yuan. Tianjin is located in a warm temperate belt with a semi-humid continental monsoon climate that has four distinct seasons. It is windy and dry in the spring and hot and rainy in summer. In the winter the prevailing winds tends to be from the northwest, with low temperatures, and low precipitation characteristic of the winter season. The annual average temperature in Tianjin is 14℃ with July being the hottest month, having an average monthly temperature of 28°C and January being the coldest month reporting an average monthly temperature of -2°C. The average annual precipitation in Tianjin, like in Beijing, is around 600 mm. Hebei Province had a permanent population of 75.2 million, of which 33.83 million lived in the rural areas in 2017. Its regional GDP was 3.60 trillion yuan and the per capita disposable income of rural residents in Hebei was 12,881 yuan. Hebei is located in the temperate belt with a continental monsoon climate and four distinct seasons. It is cold in winter with little snow, and hot and rainy in summer. Hebei reports an annual average temperature band between 4°C and 13°C, with January temperatures ranging from -4°C to 2°C and July temperatures from 20°C to 27°C. The annual precipitation in Hebei is 484.5 mm and is unevenly distributed across the seasons. Shanxi Province had a permanent 2017 population of 37.02 million of which 15.08 million lived in rural areas. Its GDP was 1.50 trillion yuan, with the annual per capita disposable income of rural residents being 13,432 yuan. Shanxi Province is located in a temperate belt with a continental monsoon climate and four distinct seasons. In this region, rain and heat often appear together, sunshine is abundant, and there is a great temperature divergence between winter and summer and between day and night. The annual average temperature is between 4.2°C and 14.2°C, incrementally rising from the north to the south and from the mountains to the basin. Annual precipitation in Shanxi is between 358 mm and 621 mm and is unevenly distributed across the seasons. Precipitation is relatively concentrated in the period of June to August, which accounts for 60% of the annual total. The Inner Mongolia Autonomous Region had a permanent population of 25.048 million as of 2017, of which 6.8563 million lived in rural areas. Its regional GDP was 1.61 trillion yuan, with the average annual per capita disposable income of rural residents being 12,600 yuan. The Inner Mongolia Autonomous Region is located in a typical mid-temperate belt with a monsoon climate featuring low and uneven precipitation and large temperature divergences between summer and winter. Winter is long and cold, lasting for more than 5 months in most areas. In the coldest month of the year, January, the Inner Mongolia Autonomous Region experiences monthly temperature ranging from -10°C to -32°C from the south to the north. Summer is warm but short, being only 1 to 2 months long in most areas. The amount of annual precipitation in the Region is affected greatly by the local terrain and the distance to the sea in the East, decreasing from 500 mm to about 50 mm from the east to the west. Liaoning Province has 14 prefecture-level cities under its jurisdiction. Of its permanent population of 43.689 million (as of 2017), 14.203 million people lived in rural areas. The regional GDP is 2.39 trillion yuan, with the per capita disposable income of rural residents averaging 28,000 yuan annually. Liaoning is located in the temperate belt with a continental monsoon climate. Rain and heat often appear in the same season, and sunshine is abundant with high summer temperatures. In this region, there are four distinct seasons and unevenly distributed precipitation, with the eastern part of the province having more rainfall than the west. The annual average temperature ranges from 7 to 11°C, with the highest maximum
4
temperatures hitting 30°C and the lowest minimums down to -30°C. The annual precipitation averages between 600-1100 mm. Shandong Province has 15 prefecture-level cities under its jurisdiction. Of its permanent population of 100.583 million (as of 2017), 39.4433 million people lived in the rural areas. The GDP was 7.27 trillion yuan, with the per capita annual income of rural residents being 15118 yuan. Shandong Province is located in a warm temperate belt with a monsoon climate. Precipitation is concentrated in summer with high humidity. Spring and autumn periods are short, while winter and summer are long. The annual average temperature ranges between 11 and -14°C. The average annual precipitation is between 550-950 mm. Henan Province has 17 provincial cities under its jurisdiction. Of its 2017 permanent population of 95.5913 million, 51.71 million people lived in rural areas. Its GDP was 4.50 trillion yuan with the average annual per capita disposable income of farmers being 12,719 yuan. Most of the province is located in the warm temperate belt, with the southern parts of the province stretching into the subtropical zone. Given its continental monsoon climate, there are four distinct seasons in Henan. In summer it is rainy and hot. Weather in Henan is capricious and meteorological disasters happen frequently. The annual average temperature ranges from 10.5 to 16.7°C and the average annual precipitation varies from 407.7 to 1295.8 mm across the province.
1.3 Expected Outputs of the Project4
The expected project outputs as of the time of the project outset were as follows:
Output 1: Undertake research to obtain a sounder understanding of the current situation and structure of rural energy consumption in the GBTH. The expert group (project team) was tasked with identifying the main factors affecting energy consumption behavior in the rural areas of the region and develop a corresponding report on regional energy consumption by the end of 2019. Output 2: Submit a report on the status and structure of rural energy consumption in the BTH region. Before the end of 2019, the expert group was to have prepared a report on the impact of rural energy consumption on air quality. Output 3: Put forward a clean energy supply plan for the rural areas. By comparing the application of energy supply technologies in various pilot cities in this region, the project was tasked with developing a clean energy supply proposal for rural areas in China. As of the end of 2019, the expert group was to have implemented at least three clean energy pilots. Output 4: Provide clean energy recommendations to the government. By the end of 2019 the expert group, based on the evaluation of the potential clean energy market in the pilot cities and cost-benefit analysis, was to provide policy recommendations to the government regarding the development of clean energy in rural areas. The project was tasked with convening a clean energy seminar and engaging expert groups and relevant stakeholders including government officials, financial institutions, and the private sector.5
4 From ADB Technical Assistance Report. 5 During the implementation of the research project, the project completion date was extended four times. The first extension was on October 17, 2018, when the completion date was extended from October 23, 2018 to December 31. The second extension occurred on December 18, 2018 when the completion date was extended from December 31, 2018 to June 30, 2019. The third extension was on June 3, 2019, when the completion date was extended from June 30, 2019 to November 30, 2020. The fourth extension was issued on November 3, 2020, when the completion date was extended from November 30, 2020 to November 30, 2021. These extensions postponed the completion date for the four outputs above to December 31, 2021.
5
Chapter 2: Energy Resources Availability and Development Potential in Rural GBTH
2.1 Status-quo of Clean Energy Uses in the Rural Areas
Energy supplies provide a crucial foundation for socio-economic development. With the gradual improvement of living standards in China, the fractions of China’s overall energy use consumed by residents and households for living purposes have continued to increase. From 2010 to 2017 the energy consumption per person for living purposes increased from 650.2 kgce (kilograms of coal equivalent) to 781.5 kgce annually, an increase of 20.2%. In order to effectively control air pollution, China undertook in-depth research into the evolution of air pollution control regulations and standards in developed countries before it promulgated and implemented a number of domestic policies. Among the policies developed, top priority has been given to the control of coal-burning to drive air quality improvement. The overall strategy for air pollution reduction in China strives to build a clean energy supply system based on electricity and natural gas, and ultimately to realize an optimal and balanced energy structure that utilizes effective measures to reduce pollutant emissions. In the northern rural areas of China, space heating has typically been the most energy-consuming activity for households, accounting for about 65% to 70% of total annual household energy consumption. Unlike in cities, rural areas do not have a sound economic basis for the building large-scale central heating facilities because of the dominance of scattered farmhouses, low population densities, and underdeveloped local economies. Historically, rural areas have relied heavily on firewood, scattered coal, and outdated heating equipment for space heating, which has resulted in significant energy consumption and grim air pollution problems. The main issues associated with current rural heating practices in GBTH and similar regions in China include: 1. Rampant use of low-quality coals. Scattered coal for civilian use is mainly composed of
bituminous coal, lignite coal, and anthracite coal. Bituminous coal in particular makes up a large proportion of rural coal use in GBTH. Most of the coal consumed is low-quality, high-sulfur and high-volatile content scattered coal.
2. Low efficiency and high emissions of traditional cooking and heating appliances. Compared with modern high-efficiency and clean-burning technologies, traditional appliances have thermal efficiencies at least 10% lower and generate excessive emissions of particulate matter, sulfur dioxide and NOx (nitrogen oxides).
3. A low proportion of electric and gas-fired heating. Only a small share of rural areas have completed the retrofitting of their home heating and cooking equipment to use of electricity and gas, due to the constraints of limited access to power or gas pipelines, or due to the high cost of those energy forms relative to coal and biomass fuels. The overwhelming majority of the rural areas in China are consequently not ready to adopt electricity and gas heating technologies.
4. Poor insulation. Rural houses are mostly one level brick-concrete structures with no insulation in the walls or around doors and windows. The heat loss is these types of dwellings is as high as 2.5 times that of Energy Efficient buildings in urban areas.
Since 2013, national and local governments in China have introduced a large number of policies and measures to increase financial support for the use of local clean energy resources and in particular, renewable forms of energy. Governmental entities have launched clean energy heating projects and fueled the rise of clean heating as a share of the total
6
energy consumption. The number of blue-sky days has increased as a results of these measures, and residents’ living standards have been raised. During the "13th Five-Year Development Plan" period, the implementation of northern clean heating pilot projects were scaled up from the initial batch of 12 cities to 43 cities in 2019. In the first year of the "14th Five-Year Development Plan" (2021), 20 additional cities were added to the pilot, and thus the promotion of clean heating practices and provision of financial subsidies were expanded to cover all of the provinces and regions in the northwest, north and northeast of China. As of the end of 2020, programs in the GBTH Region and the Fenwei Plain had completed the retrofitting of 25 million homes and are estimated to have reduced the use of scattered coal by 45 million tons annually. As a result of the programs, the plain (non-mountainous) area of Beijing city has set up a heating system with zero coal reliance. The aggregated coverage of clean heating among the “2+26” cities (Beijing, Tianjin, and cities in surrounding areas) reached 72%. Through the program, the proportion of clean heating in urban areas rose to 96%, with clean heating in the counties and urban fringes rising to 75% and to 43% in the rural areas. The pilot clean heating program forcefully promoted the adoption of clean heating, fostered local livelihoods by creating clean energy jobs, changed the local way of life, cleaned the air and improved the standard of living of local residents. Many clean energy resources are available in the rural areas of GBTH, including wind, solar, geothermal, and biomass resources, as well as electric power to replace the use of polluting fuels in some end-uses, Natural gas, where distribution is available, may constitute a clean energy resource for rural areas, and the centralized clean use of coal is also defined as a clean energy source for the purposes of this study. The example of projects in which for each of these resources were used to contribute to rural energy needs are described below.
2.1.1 Use of wind
(1) Wind powered heating Wind powered heating systems have been used in the Inner Mongolia Autonomous Region. In recent years Inner Mongolia has taken active measures to implement pilot projects of wind powered heating. For example, the region has introduced a local power tariff structure that adopts variable charges for the peak and off-peak hours. Due, however, to constraints such as the large scale of investment needed for wind power and heating devices, high operating costs, and the difficulty in dispatching wind power with the grid, this model’s overall economic performance has failed to attract much enthusiasm from either the public or private sector, and thus no substantial scaleup has happened to date6. (2) Wind power generation Wind power projects often find their output lacking a ready market at times due to imbalances between load and generation. Wind power systems in China in recent years have faced challenges in selling their output due both to the lack of cross-provincial power transmission and lack of accessible electricity demand during periods when wind power output is high. In addition, as a result of its intermittent nature, wind power has a high volatility in terms of the timing of its output, and thus dispatching wind power across the grid can present a huge challenge. Curtailment of generation—turning generation off when the wind is blowing due to lack of accessible markets for wind power output—is another serious issue. At present, the national government has drastically reduced subsidies to the wind power industry such that wind generators must directly compete against all other power forms in order to access the grid. Few wind power generators have reported strong economic results, and this experience has hampered the flow of additional investments into the sector.
6 Self-evaluation repor of clean heating t in Inner Mongolia Autonomous Region,2019.
7
2.1.2 Use of solar energy
(1) Use of solar thermal energy Solar heating has been implemented in the Inner Mongolia Autonomous Region. Inner Mongolia is endowed with rich solar energy resources, second only to the Qinghai-Tibet Plateau in China in terms of average annual solar energy per unit area. The whole Inner Mongolia region has been vigorously promoting heating powered by renewable energy resources. By the end of 2018, there were 7861 passive solar buildings covering a construction area of 710,000 m2. 7 From 2015 to 2017 Hohhot City launched a demonstration project using information resources, expertise, and technologies from the Inner Mongolia Key Technology Transformation and Application Program of Clean Energy Models in the Rural and Pastoral Areas. This project piloted the integration of three heating technologies, namely biomass heating appliances, suspended kang bed-stoves (a type of platform bed made of bricks and clay and heated by the flue of an adjacent stove that is common in northern China, and similar to the Korean ondol system8) and solar powered greenhouses in 200 rural households in Saihan District (Gejilao Village, Genbao Village), Tuoketuo County (Sangai Village) and Lin County (Xiaonangou Village). The technologies installed under the project proved to significantly increase energy efficiency by being effective in preserving heat in winter, allowing multiple energy resources to be used together to meet heating needs, and reducing costs. Tremendous economic, social, and ecological benefits have been shown. The integrated model has emerged as one of the most economical and effective technical solutions for providing rural household heating in the region. The households participating in the project were required to keep room temperatures at and above 16°C during the heating period in winter. Through controlled experiments, the project concluded that the demonstration households saved 3 tons of coal per year on average compared to the groups not receiving the pilot technologies (control groups). The investment breakdown per household for the heating technologies was as follows: 1,500 yuan for an energy-efficient heating appliance, 700 yuan for a kang bed stove, and 8,000 yuan for a solar powered house, with the total investment being 10,200 yuan. The coal saving per year averaged around 3 tons per household. At an average price of 650 yuan per ton of coal, the economic benefit of the investment is estimated at 1950 yuan/year, meaning that the investment in the system could be recovered in about 5 years. 9 Solar heating was explored in a project in Liaoning Province. Wangshilan Village, of Shenyang City, Liaoning Province explored a solar heating model by putting together resources from various available incentive and initiative programs including the rural energy development drive, the ecological civilization initiative, the integrated urban-rural development program, the high-efficiency agroecology program, and the rural tourism development incentive. Improvements in the energy and ecology sectors were fostered at the same time under these projects. The Wangshilan Village built 450 suspended kang beds, supported 52 households to install solar panels, set up 2 solar greenhouses and installed 260 solar powered streetlamps, 160 solar water heaters and 110 solar powered insecticidal lamps. Drawing on the expertise accumulated from existing installations, the village carried out a pilot that allows multiple heating models to work together. In the daytime solar energy collectors and heating radiators are used to heat up rooms while at night energy-efficient
7 Self-evaluation Report of Clean Heating in Inner Mongolia Autonomous Region. 8 See, for example, Junwei Su, Juan Li, Xilian Luo, Chuck Wah Yu, and Zhaolin Gu (2019), “Experimental evaluation of a capillary heating bed driven by an air source heat pump and solar energy”, Indoor and Built Environment, October, 2019, 1–13, available as https://www.researchgate.net/profile/Xilian-Luo/publication/336264120_Experimental_evaluation_of_a_capillary_heating_bed_driven_by_an_air_source_heat_pump_and_solar_energy/links/5e63a94b299bf1744f671c01/Experimental-evaluation-of-a-capillary-heating-bed-driven-by-an-air-source-heat-pump-and-solar-energy.pdf?origin=publication_detail. 9 “Research on Integrated Model of Rural Clean Energy Heating Technology in Winter in Hohhot”.
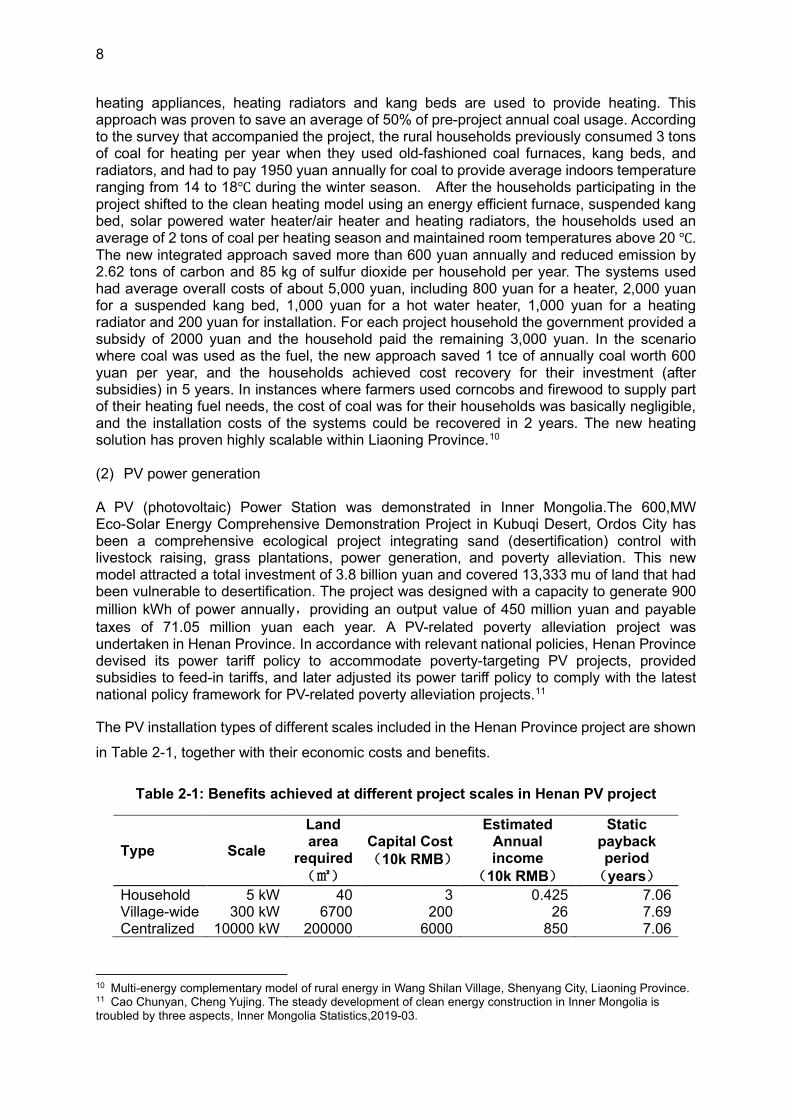
8
heating appliances, heating radiators and kang beds are used to provide heating. This approach was proven to save an average of 50% of pre-project annual coal usage. According to the survey that accompanied the project, the rural households previously consumed 3 tons of coal for heating per year when they used old-fashioned coal furnaces, kang beds, and radiators, and had to pay 1950 yuan annually for coal to provide average indoors temperature ranging from 14 to 18℃ during the winter season. After the households participating in the project shifted to the clean heating model using an energy efficient furnace, suspended kang bed, solar powered water heater/air heater and heating radiators, the households used an average of 2 tons of coal per heating season and maintained room temperatures above 20 ℃. The new integrated approach saved more than 600 yuan annually and reduced emission by 2.62 tons of carbon and 85 kg of sulfur dioxide per household per year. The systems used had average overall costs of about 5,000 yuan, including 800 yuan for a heater, 2,000 yuan for a suspended kang bed, 1,000 yuan for a hot water heater, 1,000 yuan for a heating radiator and 200 yuan for installation. For each project household the government provided a subsidy of 2000 yuan and the household paid the remaining 3,000 yuan. In the scenario where coal was used as the fuel, the new approach saved 1 tce of annually coal worth 600 yuan per year, and the households achieved cost recovery for their investment (after subsidies) in 5 years. In instances where farmers used corncobs and firewood to supply part of their heating fuel needs, the cost of coal was for their households was basically negligible, and the installation costs of the systems could be recovered in 2 years. The new heating solution has proven highly scalable within Liaoning Province.10 (2) PV power generation
A PV (photovoltaic) Power Station was demonstrated in Inner Mongolia.The 600,MW Eco-Solar Energy Comprehensive Demonstration Project in Kubuqi Desert, Ordos City has been a comprehensive ecological project integrating sand (desertification) control with livestock raising, grass plantations, power generation, and poverty alleviation. This new model attracted a total investment of 3.8 billion yuan and covered 13,333 mu of land that had been vulnerable to desertification. The project was designed with a capacity to generate 900 million kWh of power annually,providing an output value of 450 million yuan and payable taxes of 71.05 million yuan each year. A PV-related poverty alleviation project was undertaken in Henan Province. In accordance with relevant national policies, Henan Province devised its power tariff policy to accommodate poverty-targeting PV projects, provided subsidies to feed-in tariffs, and later adjusted its power tariff policy to comply with the latest national policy framework for PV-related poverty alleviation projects.11
The PV installation types of different scales included in the Henan Province project are shown
in Table 2-1, together with their economic costs and benefits.
Table 2-1: Benefits achieved at different project scales in Henan PV project
Type Scale
Land area
required
(㎡)
Capital Cost
(10k RMB)
Estimated Annual income
(10k RMB)
Static payback period
(years)
Household 5 kW 40 3 0.425 7.06 Village-wide 300 kW 6700 200 26 7.69 Centralized 10000 kW 200000 6000 850 7.06
10 Multi-energy complementary model of rural energy in Wang Shilan Village, Shenyang City, Liaoning Province. 11 Cao Chunyan, Cheng Yujing. The steady development of clean energy construction in Inner Mongolia is troubled by three aspects, Inner Mongolia Statistics,2019-03.
9
Photovoltaic Village in Jiangsu’s Lianyungang. This PV power generation project in Qingnan Village, Qinghu Town, Donghai County, Lianyungang City is the first of its kind in China. It is a rooftop distributed photovoltaic power generation project implemented by the Jiangsu Provincial Commission of Economy and Information Technology. The purpose is to promote the use of solar PV panels in rural areas, stimulate industrial application and ultimately alleviate poverty. It has a total installed capacity 381.22kW and involves 129 households to install 12 solar panels on their roofs each. These households consume the generated solar power for their own uses first and can also sell the excess power back to the grid. Since it was put into operation and connected to the grid on January 15, 2014, this model has been operating safely for 7 years and the photovoltaic power station has brought nearly 2.3-million-yuan income to the village12.
2.1.3 Use of geothermal energy (1) Heating by using mid-to-high depth geothermal energy Hebei Province is endowed with abundant geothermal energy that can be used to provide heating. Xiong County (Xiongxian) is located in the central part of the province, 108 km from Beijing to the north, 100 km from Tianjin to the east and 70 km from Baoding to the west. It borders Bazhou City to the east, Renqiu City and Wen'an County across the Daqing River to the south and southeast, Anxin County across Baiyang Lake (Baiyangdian) to the southwest, Rongcheng County to the west, Gaobeidian City to the northwest, and Gu’an County to the northeast. Xiong County measures 26 km from east to west, 25.5 km from north to south. and covers a land area of 524 km2. As of 2012 it had a population of approximately 600,000. Xiong County is rich in natural resources and sits atop a geothermal field estimated at 320 km2 with an estimated volume of 821.78 × 10⁸ m3. Given that this geothermal reservoir sits at shallow depth and has a large volume, high reservoir temperatures, and excellent water quality, Xiong County was designated in 1989 as a national demonstration area for the comprehensive development and use of mid-to-low temperature geothermal resources. In 2010 the County was named "Hometown of Hot Springs in China" by the Ministry of Land and Resources. By the end of 2017 Xiong County had drilled 82 geothermal wells and installed 42 heat exchange stations with a heating capacity of 5.3 million m2 of building floorspace.13 Using geothermal energy alone, the County successfully provided central heating sufficient to cover the whole county. In 2016 Xiong County also implemented the country's first rural "coal-for-geothermal" pilot project in Shaxinzhuang Village, as described below14. Shaxinzhuang Village is located at the northern end of Xiong County. It has a total heated area of about 80,000 m2 with most of its residential properties being rural cottages. Here households mainly use radiators for heating. The rich geothermal resources available in the village provide a good economic opportunity to replace coal and other fuels with geothermal heat. The pilot project used mid-to-high depth geothermal fluids as the heating source and adopted the technical process of direct heat exchange with plate heat exchangers to provide heating in winter. It expanded the original geothermal station by using two existing geothermal wells (one production well and the other a recharge well) in the community of Dongfanghongjiayuan. After retrofitting the total heating capacity rose to 5200 kW and is sufficient to provide heating for the total 80,000 m2 village building area. The investment in the system totaled 5,260,200 yuan, including 5,103,100 yuan for civil works. After the project
12 https://mp.weixin.qq.com/s/CRO2Lcl_RHaJ-iRNtYww_Q. 13 At least part of the Xiong County geothermal project is included in a CDM (Clean Development Mechanisms) entry to the United Nations Framework Convention on Climate Change (UNFCCC). See, for example, “Project 9279: Xiong County Geothermal Space Heating Project”, registered 31 December 2012, and available as https://cdm.unfccc.int/Projects/DB/ReConsultCert1356612886.47/view. 14 "Guide to Coal Treatment and Clean Heating -- Based on Beijing-Tianjin-Hebei Clean Energy Transformation Project Research Technical Case Set" 2017Clean Air Innovation Center, Beijing Academy of Environmental Protection Science, 2017.
10
was put in operation the only expense incurred has been the outlays for electric power to run the pumps moving geothermal and heat-exchange fluids. The cost of the system was estimated to be 5 yuan/m2 heated-year inclusive of power and labor expenses. The project achieved strong energy efficiency and emission-reduction effects. Compared with centralized heating using coal-fired boilers, the new technical solution can save 1,629 tce annually and reduces emissions by 4008 tons of CO2, 55.85 tons of sulfur dioxide and 17.43 tons of NOx in each heating season. Shandong Province has developed a new countryside mid-to-high depth geothermal heating project. The heating project in Wenchangyuan Community, Yuncheng County covers an area of 260,000 m2, and its thermal reservoir is located in an Ordovician limestone geological stratum that has geothermal water temperatures in the 52-55℃ range. The project investment was 20 million yuan and the heating fee charged to participants is 19 yuan/m2 of heated area. The Government provided subsidies for the system amounting to 5000 yuan per household. With annual unit operating costs of 12 yuan/m2, the project realized an internal rate of return of 11%/yr with a payback period of 7.5 years15. The Longju Community’s mid-to-high depth geothermal energy heating project was put into operation in November 2015 and provides heat for a building area of 150,000 m2. The project’s thermal reservoir is located in sandstones of the Dongying Formation. With the use of a well for extracting geothermal fluids and a recharge well, the project maintains the water temperature at 76°C and a circulated water volume of 70 m³/h. Developed with an investment of 11.25 million yuan, the project can charge a heating fee of 21 yuan/m2, which translates into an internal rate of return of 14.69% and a payback period of 8 years16. (2) Shallow geothermal heating Electrically driven ground coupled heat pumps (GCHPs) can be used to develop shallow geothermal energy resources in-situ, and the potential of the technology to provide heating in GBTH is closely related to the local resource availability. A GCHP installation in Beijing, at Luojiafen Village, is located in the middle of Shangzhuang Town, in the northern new zone of Beijing’s Haidian District, and provides heat for 108 cottages. From 2009 to 2013, Luojiafen Village was awarded a number of honourable titles such as "Civilized Ecological Village in Suburban Beijing" and "Capital’s Civilized Village". The original energy supply to the Village consisted of liquefied petroleum gas (LPG) used for cooking, with coal-fired heating appliances. In 2015 this combination was changed to use a model of LPG for cooking and electric energy storage appliances for heating. Every household had 3 to 7 electric heating radiators and was served with power distributed at 18 kW. Electricity costs each heating season ranged from 5,000 to 12,000 yuan per household and were thus beyond the local residents’ affordability. In 2017 the village installed a GCHP (small ground source heat pumps) system to provide heating, cooling, and hot water for domestic uses. 390 sets of heat pumps and 347 vertical collector pipes were installed. The electricity cost after the installation was significantly reduced. For example, the No.26 household of Mr. Zhang XX has a living space of 293.22 m2 in total. Before the use of the geothermal energy system the household paid about 7000 yuan for electric power in each annual heating season (up to 1750 yuan/month). After adopting heat pump systems the cost fell to about 650 yuan per month, which is equivalent to 9 yuan per square meter for each heating season17.
15 The field survey data of the Project "Geothermal Industry helps clean Heating in Rural Areas" of The Chinese Academy of Engineering. 16 The field survey data of the Project "Geothermal Industry helps clean Heating in Rural Areas" of The Chinese Academy of Engineering. 17 Data from the typical project of Beijing shallow ground source heat pump.
11
A GCHP application adopted in Hebei Province, Xiwanggezhuang, Boye County provided heating for 226 farmers covering a total living space of about 16,000 m2. Each project household (with an area ≤70 m2) was equipped with two single U-tube heat exchangers installed with an effective depth of 80 m, a 7.5 kW electric motor and three concealed vertical fan coil units. This rural retrofit project was identified as a demonstration application of “Introducing Shallow Geothermal Energy to Provide Heating for the Rural Households of Hebei Province” and was listed as a typical case of “Nationwide Residue Heat Use and Shallow Geothermal Heating Initiative” by the National Development and Reform Commission. The investment was 17,000 yuan per household of which the government invested 15,700 yuan/household and the farmers contributed 1300 yuan/household. The unit’s COP (coefficient of performance) was 3.5, the power tariff was 0.52 yuan/kWh, and the government subsidies for electricity use were 1200 yuan per household. When the equipment was used for 12 hours (9 hours at night and 3 hours during the day), the operating cost was 22.9 yuan/ m2 of heated area before the subsidy and 5.8 yuan/ m2 after the subsidy18. The AEON International Mall in Changping District, Beijing has a total construction area of 156,000 m2. The area requiring heating and cooling is 81,000 m2. A GSHP has been installed at a cost of 350 yuan per square meter of building space conditioned. Underneath a green field near the mall, 1060 underground heat exchangers were installed with an effective heat exchange length of 123 meters each. The operating cost of the system in the heating season is 19.7 yuan/m2 and the full cost including annualized capital costs is 31.4 yuan/m2. This project was given a national renewable energy subsidy of 10 million yuan and has been working well for 8 years19. A shallow geothermal heating system was installed in Tianjin. Given that Tianjin has abundant shallow geothermal resources, from 2009 to 2010 the Ministry of Land and Resources and Tianjin Municipality jointly launched the "Tianjin Shallow Geothermal Energy Development Pilot Project" to further tap the potential of using shallow geothermal energy in Tianjin. The project achieved many outcomes. First, the project identified the distribution pattern and occurrence conditions of shallow geothermal energy in Tianjin. The available resources are estimated at 1,748 trillion kJ (kilojoules). The total space needing heating in winter in the city is 1.34 billion m2 and the area needing cooling in the summer is 1.26 billion m2. Secondly, the project completed a development and utilization plan for shallow geothermal resources in Tianjin, identified aquifers and reasonable locations for buried pipes for GCHP systems, and set out a reasonable scale for planned development and utilization of geothermal resources. Thirdly, the project implemented 10 demonstration facilities with a total heated (and cooled) area of 1 million m2. Fourthly, the project established a dynamic monitoring network in Tianjin consisting of 11 dynamic monitoring stations, 1 testing center and 1 experimental base20. As of May 2010, there were 174 shallow geothermal energy development projects in Tianjin with a total service area of 2,947,900 m2 of conditioned space. These projects included a total of 132 GCHP systems accounting for 75.86% of the total installed ground source heat pump (GSHP) systems. The GCHP service space is 1.8327 million m2, equivalent to 62.17% of the total space in the service area. In addition, there are 42 GSHP systems producing hot water accounting for 24.14% of the total GSHP systems. Their service area is 1.1152 million m2, accounting for 37.83% of the total space. The systems are mainly used for heating and cooling of buildings such as enterprises and public institutions, shopping malls, exhibition
18 The field survey data of the Project "Geothermal Industry helps clean Heating in Rural Areas" of The Chinese Academy of Engineering. 19 "Guide to Coal Treatment and Clean Heating -- Based on Beijing-Tianjin-Hebei Clean Energy Transformation Project Research Technical Case Set" 2017Clean Air Innovation Center, Beijing Academy of Environmental Protection Science, 2017. 20 Song Meiyu, Lin Li,Wang Ping, etc.A brief analysis of the results of the pilot work of exploitation and utilization of shallow geothermal energy in Tianjin,, Groundwater journal,2012,01.
12
halls, schools and hospitals.21 2.1.4 Use of biomass
Use of biomass for heating in Shanxi Province
(1) Direct-fired boilers that use straw as a fuel for central heating applications have been used in Shanxi Province. The Lifang Heating Station in Changzhi County was put into trial operation in April 2017 to provide heating for 1,169 households and public buildings with a total building space of 120,000 m2. The station was set up with two 6 t/h (tons per hour) biomass boilers and one 4 t/h direct-fired heating unit. The systems required a total investment of 23.1 million yuan of which 14.3 million yuan came from public finances to support purchase and installation of heating units and heat network construction, and 5.5 million yuan were provided by the farmers households’ self-financing (about 5,000 yuan per household on average) for radiators and installation. The heating charge is 2.55 yuan/m2 per month or an average of 1020 yuan per heating season (for a household with a heated area of 100 m2), which is 1680 yuan less than coal-fired solution (3 tons of coal/year at 900 yuan/t = 2700 yuan/year). The total annual cost incurred by the heating business was 1.67 million yuan (inclusive of fuel, labor, electricity, land, and other costs). Of those costs, 1.19 million yuan was recovered from resident fees and another 800,000 yuan granted by government as subsidies (80 yuan per mu of land) thus generating a total revenue of 1.99 million yuan. This solution faces a pronounced disadvantage as it is heavily reliant on government subsidies and is subject to high fuel storage and transportation costs. In theory, five heating stations would need at least 50,000 mu of straw-producing land to supply the required biomass fuel, and this requirement may affect the scalability of straw-fired systems. (2) Boilers that use biomass molded briquette fuel (BMF) to provide central heating have been tested. Niusi Township, Qin County introduced three biomass fuel-burning boilers to supply heat to 301 households in three villages with a total building space of 25,400 m2. The total required investment was 1.34 million yuan. The heating fee for the system is 3.5 yuan/m2 per month. Each household, based on an average floor area of 100 m2 and a heating season of 4 months, would therefore be required to pay 1400 yuan annually. The three boilers use an average of 5.5 t of biomass fuel per day at an average cost of 1130 yuan per ton, thus incurring a daily average fuel cost of about 6215 yuan. The monthly electricity cost for the system is 3000 yuan. A worker's average monthly salary is 3000 yuan/person, with an assumption of an average of two workers on staff at the heating plant. In summary, then, during a heating season of four months, the fuel cost for the system is 745,800 yuan, electricity costs are 12,000 yuan, and labor costs are 24,000 yuan, therefore generating an overall heating cost of 781,800 yuan to run the system each year. Each household is charged 3.5 yuan/m2 per month and the collectable fee-based revenue is 3.5 * 25,400 m2 * 4 months﹦355,600 yuan annually. As a result, the gap between operating costs and income for the system is 425,600 yuan. The high running cost of the system has proven to be a pronounced disadvantage for this technology. The processing of straw incurs additional costs for electricity and labor, pushing up the operating costs, and therefore heating providers using BMF boilers badly need government subsidies. The current expectation is that with increased BMF market development the costs of BMF systems can be reduced. (3) Another system in Shanxi Province used co-generation of fuel gas and biochar to provide central heating. Weizi Town, Lucheng City introduced the approach of using straw, sawdust and corncobs to form briquettes as input for the cogeneration of fuel gas and biochar. Biomass briquettes molded through an extrusion process are fed into as gasifier to produce biochar and fuel gas. The gas is then purified, pressure-regulated and transported through
21 Song Meiyu, Lin Li,Wang Ping, etc.A brief analysis of the results of the pilot work of exploitation and utilization of shallow geothermal energy in Tianjin,, Groundwater journal,2012,01.
13
pipelines to a gas-burning hot water boiler. The project has invested in 22 production lines totaling 100 meters, a gas storage tank that can hold up to 2000 m³ of carbon monoxide-rich fuel gas, and 7 smart boilers that use biomass-derived gas. The system provides central heating for 4 commercial/institutional entities and 240 households with a total building space of 55,000 m2. The total investment in the system was 6.5 million yuan. For the households connected to the system, based on a heating fee of 4 yuan/m2 per month, an average heated space of 100 m2 per households, and a heating season of 4 months, households will need to pay 1600 yuan each on average. When the boilers are running at full load, the cost per heating season is 24 * 55,000 m2 = 1.32 million yuan. If compared with the fee revenue which is 4 yuan/ m2·month * 55,000 * 4 = 880,000 yuan per heating season, the system appears to incur a loss. The biochar output of the system, however, is about 1000 tons annually, and can be sold on the market for 1.5 million yuan. As a result, the system ends up with a total average annual profit of 1.06 million yuan. In addition, the system needs 20,000 mu of land to produce adequate straw every year to fuel the system. This economic model for this fuel gas/biochar system relies on the realization of a charcoal production business and a market for biochar, and cannot easily be replicated and scaled up. With regards to how to use the by-product of straw gas in the non-heating seasons, the business has no clear idea yet. 2.1.5 Use of clean coal
Shanxi Province has used high-quality honeycomb briquettes for clean heating. In 2018 the Jincheng Municipal Party Committee and Municipal Government promoted a municipality-wide initiative to use high-quality briquettes for central heating. These systems met the needs of more than 300,000 rural residents to have a clean and warm winter and achieved a "win-win" outcome among the government, public and the environment. This method was identified by the China Association of Rural Energy Industry (CAREI) as a "Jincheng Model" and recommended for dissemination in the rest of China22. From the perspective of environmental protection, this solution prevents secondary pollution that may be caused at the place of consumption by the remaking, loading, unloading and transportation processes for moving raw coal as honeycomb briquetting makes finished products by wrapping coal briquettes in plastic packaging at the place of origin and supplies these well-sealed, ready-to-use products to the villages. In terms of economic performance, the clean honeycomb briquettes are truly affordable as they are cheaper by over 20% than the clean briquette products that area available, 30% cheaper than low-emissions semi-coke coal, and 40% cheaper than anthracite coal types. Even if the government withdraws its subsidies, the ordinary residents can still afford them. In addition, the heating and cooking appliances needed to use honeycomb briquettes cost only 200 - 800 yuan for each household set, and thus there is no need for government subsidies for household equipment. This reduces the financial burden on the government and thus makes the system more "affordable and sustainable". In terms of emissions, the clean-burning attributes of Jincheng anthracite means that use of this type of coal is able to meet national emission standards even when it is directly burned and emitted without additional processes, such as fuel pre-treatment or emissions controls. When the anthracite is mixed with high-quality coal slime based on a scientific formula, the briquettes made from these ingredients perform much better than the national standard GB34170-2017 briquettes, fully complying with the relevant environment requirements. In terms of quality assurance, these briquettes are produced and packaged at the mining area with the raw materials directly supplied by coal mines, thus preventing adulteration of raw materials. In addition, market regulatory authorities conduct regular sampling of briquettes to protect the rights and interests of consumers. With no need to add any other materials to the briquette, the anthracite-based product has lower ash content and higher heating value. The briquette is fully combustible and not adhesive. In terms of sustainability of the resource for briquetting, Jincheng reports a total of 29.3 billion
22 Jincheng Experience, Bulletin of Shanxi Energy Bureau.
14
tons of proven reserves of anthracite with the potential to produce more than 50 million tons of high-quality anthracite coal every year. The supply of coal for the process is thus well guaranteed. The clean use of coal in principle advocates centralized utilization and coordinated management to effectively control the emission of pollutants. Within a specific period and in a specific location, however, clean coal heating can provide high security of supply and is transitional in nature along the path to a low-carbon future. Society, instead of selecting technical solutions based on the fuel types, can put greater attention to the actual emissions, refrain from using an arbitrary one-size-for-all approach, and plan for sustainable emissions reduction in the long run. The use of honeycomb briquettes is thus a transitional approach to address the current need for clean heating in rural areas and serves the fundamental interests of the people. 2.1.6 Use of electricity Air source heat pumps (ASHP) are used for central heating in Beijing. Since May 2016 11 administrative districts of Beijing have launched "coal-to-electricity" projects using ASHP. These projects all went through stages of bidding and tendering, project implementation, equipment installation, and commissioning. In the year 2016 alone, 663 villages implemented "coal-to-electricity" projects to provide heating for 227,000 households. Among these projects, 574 villages with a total of 198,000 rural households adopted the ASHP model. The subsequent 2016-2017 heating season ran smoothly and stably with no major incidents or large-scale failures, thus demonstrating the feasibility and reliability of the ASHP system as a solution to rural household needs for clean heating. With regards to the amount of power the ASHP uses, researchers undertook field visits and found that on top of the major factors such as the efficiency of end-use equipment, heat pump performance, and user behavior, another factor is at play that significantly determines the power consumption of heat pumps in winter. The extent to which rural houses were insulated proved to be a major factor in system performance. For the houses that had not completed or had not done any energy-efficiency renovations, their electricity consumption was about 23% higher than the houses that had completed comprehensive energy efficiency retrofitting (covering three exterior walls and external windows). 23 Based on actual operation data from users of ASHP systems using underfloor heating in Fangshan District, Tongzhou District, Fengtai District, Shunyi District and Changping District of Beijing, researchers estimated that the indoor temperature in these areas averaged 19.6℃, the coefficient of performance of the heat pump system averaged 2.63, and the operating cost of the systems were 13.3 to 20.7 yuan per m2 of conditioned space. For those households using ASHP and hot air blowers, their indoor temperature averaged 18.4 ℃ and the operating cost ranged from 14 to -22.6 yuan/m2. 24 An additional ASHP heating project was carried out in Dong-ma-ge-zhuang Town, Mentougou District, Beijing. The project adopted a low-ambient-temperature heat pump system (with a split layout) with the evaporator installed outdoors and the condenser indoors. The heating end use consisted of "underfloor heating + fan coil unit”. This solution was formally put into use in 2016 and met the heating needs of 140 farm households and covered a total heated area of 18,000 m2. On average the heated area of each household in the project is 70 m2 and the investment for each household amounted to 24,000 yuan, of which the government paid 23,500 yuan and the residents paid 500 yuan. The system uses a 5 horsepower (hp, or 3.675 kW) power unit and pays a power tariff of 0.4883 yuan/kWh for electricity used during peak hours and 0.3 yuan/kWh for off-peak electricity use. With
24 Best Practice Cases of Clean Heating in the North of China
15
subsidies included, the peak rate is 0.2883 yuan/kWh, and the off-peak rate is 0.1 yuan/kWh. Assuming 12 running hours per day for the ASHP equipment, the pre-subsidyoperating cost totalled 36.9 yuan/m2 if all use was on-peak. If peak/off-peak rates were applied, the operating cost was 26.2 yuan/m2 and if peak/off-peak rates were applied with subsidies, the operating cost was 11.1 yuan/ m2. 25 An ASHP project in Jingjiawu Village, Daxing District, Beijing covered a heated area of 120 m2 per household with an investment of 23000 yuan per household, of which 20700 yuan was paid by the government and 2300 yuan by residents. For each household, the system COP of the 7 hp units used is 1.8, the input power is 6.2 kW, the heating capacity is 12 kW, the peak electricity price was 0.4883 yuan/kWh, the off-peak power tariff was 0.3 yuan/kWh, and the off-peak tariff after subsidies was 0.1 yuan/kWh. When the equipment is used for 12 hours, the operating cost before subsidy is 36.3 yuan/ m2 if on-peak tariffs are assumed, the operating cost assuming the off-peak tariff is 25.8 yuan/ m2, and the operating cost assuming an off-peak tariff with a subsidy is 14.7 yuan/ m2. 26 2.1.7 Use of natural gas According to Beijing's "14th Five-Year Plan" for gas planning, 552 villages with about 220,000 households will undergo the coal-to-gas retrofitting. A village in Tongzhou, Beijing (with 1,100 villagers) conducted a survey on the use of gas wall-mounted boilers in 2017. Two examples follow. In household A, the heated area is 82 m2 and the gas consumed is 800 m³ annually. In household B, the heated area is 200 m2, and the gas consumed is 2200 m³ annually. The investment breakdown for these systems was as follows: a wall-mounted boiler costed 7,300 yuan of which 1,320 yuan was paid by the household, gas is priced at 2.36 yuan/m³ and the operating cost of the system was 27.53 yuan/m2 per year., Including the depreciated initial investment, the full operating cost was 33.62 yuan/m2 per year. This technical solution is costly but the user experience has been very positive27. Hebei Province has also implemented a wall-mounted gas boiler pilot project. The project is in Nanshazikou Village, Xiong County, Hebei Province and provides heating for 476 households. The heated space of each household is 100 m2 and the heating load for rural housing averages 120W/m2. The required investment amounted to an average of 4150 yuan per household, of which a government subsidy covered 2700 yuan and each household paid 1450 yuan out of its own pocket. Natural gas in the Village was priced for 2.45 yuan/m³ and government provided 1200 yuan subsidy per household. The wall-mounted gas boilers have a combustion efficiency of 90%. For every 12 hours’ operation the equipment operating cost before the subsidy was 48.9 yuan/m2 of heated space, and the operating cost after the subsidy was 36.9 yuan/ m2. 28 A Shandong Province pilot project for wall-mounted gas boilers for central heating carried out in Rentian Village, Lijin County, Dongying City, Shandong Province provides heating for 130 households with an average of 61.8 m2 heated area for each household and an average heating load of 120 W/m2. Natural gas was priced at 2.16 yuan/m³ and the gas costs to the
25 The field survey data of the Project "Geothermal Industry helps clean Heating in Rural Areas" of The Chinese Academy of Engineering. 26The field survey data of the Project "Geothermal Industry helps clean Heating in Rural Areas" of The Chinese Academy of Engineering. 27 "Guide to Coal Treatment and Clean Heating -- Based on Beijing-Tianjin-Hebei Clean Energy Transformation Project Research Technical Case Set" 2017Clean Air Innovation Center, Beijing Academy of Environmental Protection Science, 2017. 28 The field survey data of the Project "Geothermal Industry helps clean Heating in Rural Areas" of The Chinese Academy of Engineering.
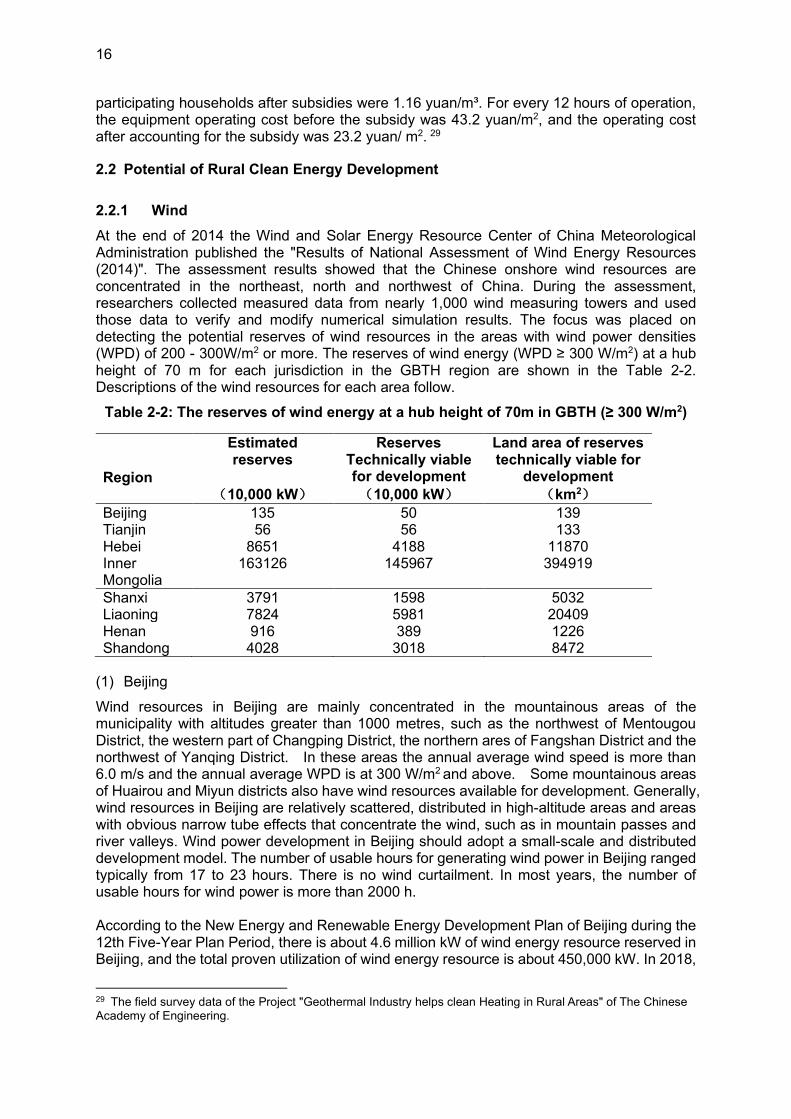
16
participating households after subsidies were 1.16 yuan/m³. For every 12 hours of operation, the equipment operating cost before the subsidy was 43.2 yuan/m2, and the operating cost after accounting for the subsidy was 23.2 yuan/ m2. 29
2.2 Potential of Rural Clean Energy Development
2.2.1 Wind
At the end of 2014 the Wind and Solar Energy Resource Center of China Meteorological Administration published the "Results of National Assessment of Wind Energy Resources (2014)". The assessment results showed that the Chinese onshore wind resources are concentrated in the northeast, north and northwest of China. During the assessment, researchers collected measured data from nearly 1,000 wind measuring towers and used those data to verify and modify numerical simulation results. The focus was placed on detecting the potential reserves of wind resources in the areas with wind power densities (WPD) of 200 - 300W/m2 or more. The reserves of wind energy (WPD ≥ 300 W/m2) at a hub height of 70 m for each jurisdiction in the GBTH region are shown in the Table 2-2. Descriptions of the wind resources for each area follow.
Table 2-2: The reserves of wind energy at a hub height of 70m in GBTH (≥ 300 W/m2)
Region
Estimated reserves
(10,000 kW)
Reserves Technically viable for development
(10,000 kW)
Land area of reserves technically viable for
development
(km2)
Beijing 135 50 139 Tianjin 56 56 133 Hebei 8651 4188 11870 Inner Mongolia
163126 145967 394919
Shanxi 3791 1598 5032 Liaoning 7824 5981 20409 Henan 916 389 1226 Shandong 4028 3018 8472
(1) Beijing
Wind resources in Beijing are mainly concentrated in the mountainous areas of the municipality with altitudes greater than 1000 metres, such as the northwest of Mentougou District, the western part of Changping District, the northern ares of Fangshan District and the northwest of Yanqing District. In these areas the annual average wind speed is more than 6.0 m/s and the annual average WPD is at 300 W/m2 and above. Some mountainous areas of Huairou and Miyun districts also have wind resources available for development. Generally, wind resources in Beijing are relatively scattered, distributed in high-altitude areas and areas with obvious narrow tube effects that concentrate the wind, such as in mountain passes and river valleys. Wind power development in Beijing should adopt a small-scale and distributed development model. The number of usable hours for generating wind power in Beijing ranged typically from 17 to 23 hours. There is no wind curtailment. In most years, the number of usable hours for wind power is more than 2000 h. According to the New Energy and Renewable Energy Development Plan of Beijing during the 12th Five-Year Plan Period, there is about 4.6 million kW of wind energy resource reserved in Beijing, and the total proven utilization of wind energy resource is about 450,000 kW. In 2018,
29 The field survey data of the Project "Geothermal Industry helps clean Heating in Rural Areas" of The Chinese Academy of Engineering.
17
the total installed capacity of wind power in the city was 190,000 kW, and the annual power generation was 350 million kWh. 30 (2) Tianjin Tianjin’s local wind energy data shows an uneven distribution of wind resources, with its coastal areas having abundant wind while the hinterland have significantly less generation potential. The annual average WPD decreases from the coastal areas to the hinterland areas. The three coastal areas of Han’gu (Yanchang), Tanggu and Dagang report the average highest WPD in the range of 104.2-117.9 W/m2. The annual average wind speed in this area is relatively high, typically in the 4.3-4.4 m/s band with a high frequency of the 3 m/s winds and a substantial number of effective hours ranging from 5599 to 6604 hours per year. Most of the wind is from the northwest. In conclusion the areas suitable for large-scale wind farm development are Han’gu, Tanggu and Dagang districts in the eastern coastal areas. A strip of territory 10-13 km wide in the northeast-southwest direction across the three districts along the western coastline of the Bohai Bay is most suitable for wind power development (where the annual average wind power density is equal to or greater than 100 W/m2 over an area of 948.37 km2. Since the Binhai New Area was incorporated into the national strategic framework of development, Tianjin’s coastal economy has generated remarkable growth momentum with increasingly robust development activities along the coastline. Such large-scale construction not only makes land resources increasingly tight, but also affects the existing onshore wind fields. It is therefore worthwhile to consider setting up wind turbines in combination with tide breakwaters to form a coastal wind power belt. At the same time offshore wind farms can be set up in line with the offshore resource development plan. (3) Hebei Province Hebei Province is located on the eastern coast of Eurasia at mid-latitude and in the eastern part of China. It has a temperate continental monsoon climate characterized by the semi-humid and semi-arid weather. It is endowed with rich wind resources. mainly distributed in Zhangjiakou, Chengde Bashang, Qinhuangdao, Tangshan, Cangzhou coastal areas and Taihang and the Yanshan Mountains. Zhangjiakou, Chengde Bashang and the coastal areas of Tangshan and Cangzhou have each developed wind generation capacity of over one million kW. Combined, the technical exploitation amount of these areas can reached over 80 million kW of which 70 million kW is from onshore wind fields and 10 million kW is from offshore.
30 <Development Report of Beijing Energy in 2019> Beijing Municipal Development and Reform Commission, Beijing Municipal Bureau of Statistics, etc.
18
(4) Based on the "13th Five-Year Plan for the Renewable Energy Development in Hebei Province", Hebei Province continued its coordinated and large-scale development of wind power by placing equal emphasis on centralized and decentralized power development and giving support to both outbound power transmission and local consumption. The provincial government has made commitments to devise quality plans for the Zhangjiakou million-kilowatt wind power base (Phase III) and Chengde million-kilowatt wind power base (Phase II and III), to actively coordinate and promote project construction and related supporting work, steadily facilitate coastal wind power construction, and encourage Qinhuangdao, Baoding, Hengshui, Cangzhou and other regions to carry out low speed wind power construction projects. By June 2020, installed capacity of wind power had reached 16.53 millionkW in Hebei province.31 Inner Mongolia is an area with extremely rich wind resources. Different measurement methods, however, have yielded different estimates of wind power reserves for Inner Mongolia. One key measurement used by the Wind and Solar Energy Resource Center of the China Meteorological Administration in recent years is the technically exploitable wind at the height of 70 m, which makes great sense from a practical perspective given the typical hub height of wind power deployed in many areas of China. According to the latest data released by this Center, the wind resource reserves of Inner Mongolia are about 1.5 billion kW, ranking first in the country among provinces and autonomous regions, while Xinjiang and Gansu ranked second and third with their 400 million kW and 240 million kW estimated capacities, respectively. This ranking shows Inner Mongolia’s distinctly abundant wind resources. Inner Mongolia’s annual average wind speeds and average WPD both rank the first in the country. Its annual average wind speed reaches 6.4 m/s and it is also the only province in the country in which the annual average WPD has exceeded 300W/m2 for many years. According to the regional classification of wind resources in China by the Chinese meteorological community, Inner Mongolia has the largest wind potential in China and remains as the most strategic location for national wind development and development of power transmission infrastructure. In the central region of Inner Mongolia, the average annual wind speed is relatively high, and wind resources are abundant, expansive and contiguous. Based on measurements of annual average WPD and the distribution of WPD, the north of Bayannaoer, Baotou and Ulanqab are the key wind-rich areas in the western part of the Inner Mongolia, while the south and the southeast of Xilingol League, most of Chifeng City, the north of Tongliao city, the Xing'an League and the central-to-south of Hulunbuir City are the wind-rich areas in the eastern part of Inner Mongolia. (5) Shanxi Province Shanxi Province is located on the Loess Plateau with a great number of mountains and valleys. The ground air flow is greatly affected by the undulating terrain, and thus wind resources are relatively abundant primarily adjacent to the coastal areas in the southeast of China, and in Inner Mongolia, the Gansu Corridor, and the Northeast and Northwest of China. Shanxi Province’s wind resources are suitable for seasonal development. In terms of the geographical distribution of wind in the province, the area north of Guanchen Mountain, the northern section of the Lvliang Mountain Range, and the area north of Hengshan Mountain are the high-value areas. The areas of Shenchi and Pinglu (where the average annual wind speed is over 4 m/s) and Wutaishan Mountain (where the mountain top has the highest annual average wind speed, at 9.3 m/s in Shanxi Province) represent the greatest abundance
31 Hebei's installed capacity of wind power and solar power exceeded 30 million kW repored by the Xinhua News Agency.https://www.360kuai.com/pc/9f52c6a0fdd2c17d6?cota=3&kuai_so=1&sign=360_57c3bbd1&refer_scene=so_1.
19
of wind resources in the province. There the effective average WPD is above 150W/m2 and the effective wind speeds occur more than 4000 hours per year. In the south, the Lingchuan, Yangcheng, Yuanqu and Ruicheng areas all lie along the same direction as the prevailing wind during the summer monsoon season and also have certain development value based on their from 300 to470W/m2 wind potential. The areas in (5) Shanxi Province with annual average wind speeds of 7.5 m/s at 70 meters height include the southeastern mountainous area of Hunyuan County, the border of Guangling County and Lingqiu County, the border of Tianzhen County and Hebei Province, the border of Fanzhi County and Wutai County, the border of Daixian County and Wutai County, the border of Daixian County and Shanyin County, the northwest area of Yuanping City, the vicinity of Pandaoliang in Ningwu County, the border of Shenchi County and Ningwu County, the southeast area of Wuzhai County, and other areas. The areas with an annual average wind speed of 7.0 m/s at 70 meters height include: Limin Town in Shuocheng District, Xiamujiao Township and Baitang Township in Pinglu District, Laba Township, Maying Township and Yujing Town in Shanyin County, Baimashi Township in Yingxian County, Niuxinbao Township in Youyu County, and other areas. The “Thirteenth Five-Year Plan for Comprehensive Energy Development of Shanxi Province” stipulated that Shanxi Province encourages the rational deployment of off-grid energy and distributed energy supplies with storage capacity from resources such as wind, solar and small hydro in rural and remote areas. (6) Liaoning According to available data the areas with an annual average WPD of more than 150 W/m2 in Liaoning Province are mainly distributed in the hilly northern areas and the coastal area with an area of about 2,100 km2. The areas with WPD of 100 - 150 W/m2 are mainly distributed in the coastal areas and the central plain covering a land area of 5900 km2. The areas with WPD of 50 ~ 100 W/ m2 are mainly distributed across the entire coastal area and the central plain, with a land area of about 77,100 km2. Eastern Liaoning and western Liaoning have an average annual WPD less than 50 W/m2 covering a land area of 63,000 km2. In summary the total onshore reserves of wind resources at the height of 10 m in the province are 89 million kW. Since the province has about 2,100 km2 with annual average WPD greater than 150 W/m2, it is reasonable to conclude that there are 2,100 km2 of land suitable for technical development with a potential of at least 2,515,100 kW. The areas rich in wind energy resources in Liaoning Province are mainly concentrated in three areas, one is the hilly areas near and north of the 42°N line in Changtu, Kangping, Faku, Zhangwu, Fuxin, Beipiao, Chaoyang and Jianping counties; the second is the coastal zone around the Bohai Sea; the third is the coastal zone on the northern coast of the Yellow Sea. (7) Henan Henan Province is designated as Grade IV for wind resources utilization given its overall unexceptional and unevenly distributed wind resources. Its top five areas for wind development are: (1) the plateau area on both sides of the Yellow River in the northwest of Henan; (2) the transition zone between the Taihang Mountains and adjacent plains in the north of Henan; (3) the Nanyang Basin and Pingdingshan pass area; (4) Funiu Mountain in the southwest of Henan; and (5) the Dabie Mountains in southern Henan. Among them, the eastern part of Funiu Mountain has the most abundant wind resources with an annual average wind speed ranging between 5.2 m/s and 7.1 m/s; the southwestern part of Funiu Mountain and Dabie Mountain also have significant resources, with an annual average wind speed of 5.7 m/s to 7.0 m/s; the Taihang Mountains and areas along the Yellow River Plain
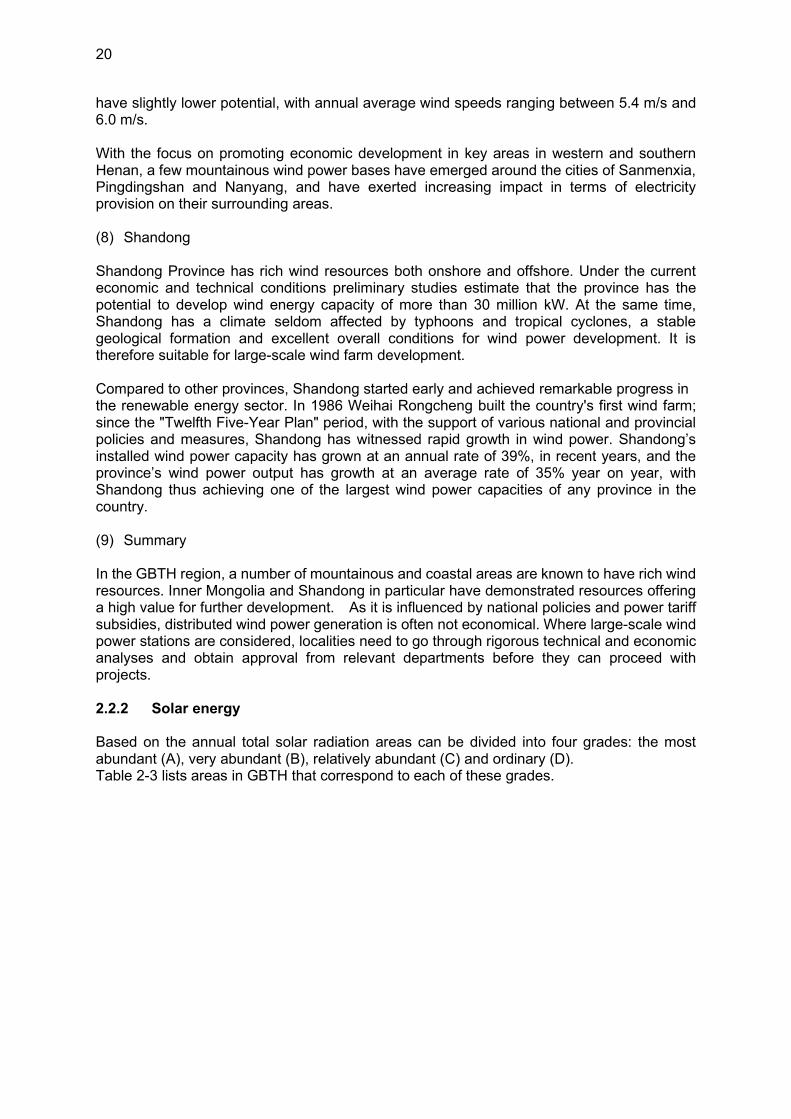
20
have slightly lower potential, with annual average wind speeds ranging between 5.4 m/s and 6.0 m/s. With the focus on promoting economic development in key areas in western and southern Henan, a few mountainous wind power bases have emerged around the cities of Sanmenxia, Pingdingshan and Nanyang, and have exerted increasing impact in terms of electricity provision on their surrounding areas. (8) Shandong Shandong Province has rich wind resources both onshore and offshore. Under the current economic and technical conditions preliminary studies estimate that the province has the potential to develop wind energy capacity of more than 30 million kW. At the same time, Shandong has a climate seldom affected by typhoons and tropical cyclones, a stable geological formation and excellent overall conditions for wind power development. It is therefore suitable for large-scale wind farm development. Compared to other provinces, Shandong started early and achieved remarkable progress in the renewable energy sector. In 1986 Weihai Rongcheng built the country's first wind farm; since the "Twelfth Five-Year Plan" period, with the support of various national and provincial policies and measures, Shandong has witnessed rapid growth in wind power. Shandong’s installed wind power capacity has grown at an annual rate of 39%, in recent years, and the province’s wind power output has growth at an average rate of 35% year on year, with Shandong thus achieving one of the largest wind power capacities of any province in the country. (9) Summary In the GBTH region, a number of mountainous and coastal areas are known to have rich wind resources. Inner Mongolia and Shandong in particular have demonstrated resources offering a high value for further development. As it is influenced by national policies and power tariff subsidies, distributed wind power generation is often not economical. Where large-scale wind power stations are considered, localities need to go through rigorous technical and economic analyses and obtain approval from relevant departments before they can proceed with projects. 2.2.2 Solar energy
Based on the annual total solar radiation areas can be divided into four grades: the most abundant (A), very abundant (B), relatively abundant (C) and ordinary (D). Table 2-3 lists areas in GBTH that correspond to each of these grades.
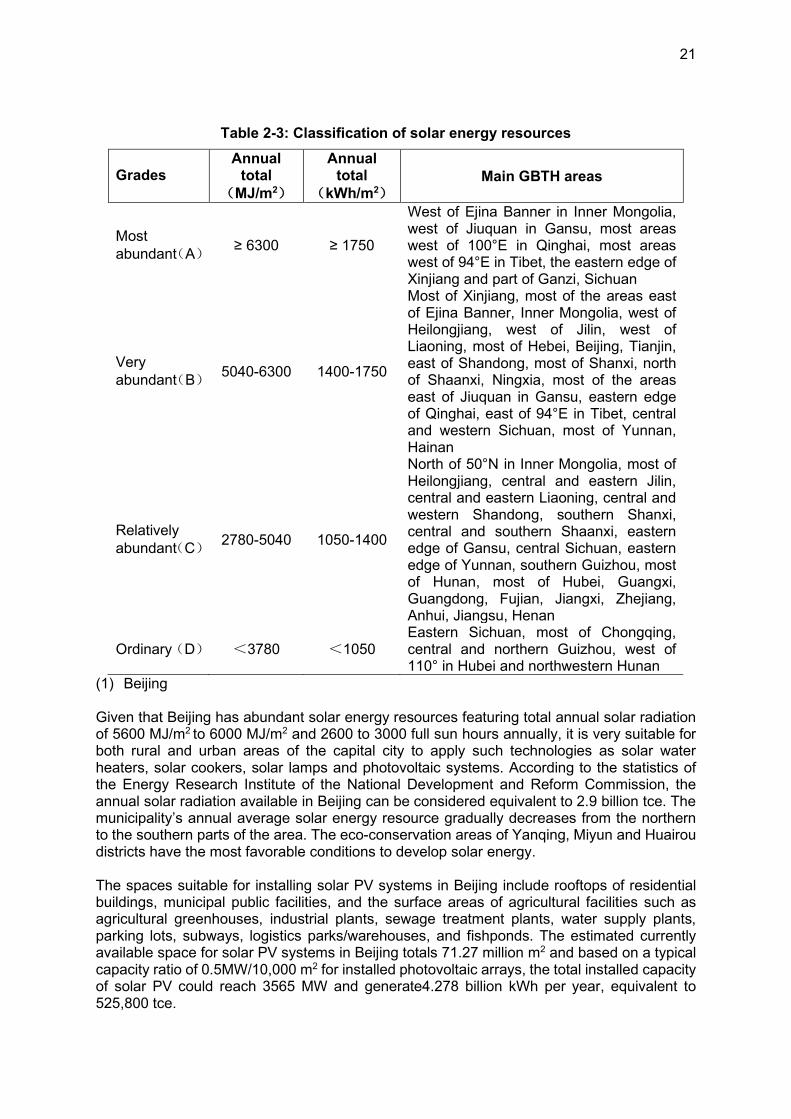
21
Table 2-3: Classification of solar energy resources
Grades Annual
total
(MJ/m2)
Annual total
(kWh/m2) Main GBTH areas
Most abundant(A)
≥ 6300 ≥ 1750
West of Ejina Banner in Inner Mongolia, west of Jiuquan in Gansu, most areas west of 100°E in Qinghai, most areas west of 94°E in Tibet, the eastern edge of Xinjiang and part of Ganzi, Sichuan
Very abundant(B)
5040-6300 1400-1750
Most of Xinjiang, most of the areas east of Ejina Banner, Inner Mongolia, west of Heilongjiang, west of Jilin, west of Liaoning, most of Hebei, Beijing, Tianjin, east of Shandong, most of Shanxi, north of Shaanxi, Ningxia, most of the areas east of Jiuquan in Gansu, eastern edge of Qinghai, east of 94°E in Tibet, central and western Sichuan, most of Yunnan, Hainan
Relatively abundant(C)
2780-5040 1050-1400
North of 50°N in Inner Mongolia, most of Heilongjiang, central and eastern Jilin, central and eastern Liaoning, central and western Shandong, southern Shanxi, central and southern Shaanxi, eastern edge of Gansu, central Sichuan, eastern edge of Yunnan, southern Guizhou, most of Hunan, most of Hubei, Guangxi, Guangdong, Fujian, Jiangxi, Zhejiang, Anhui, Jiangsu, Henan
Ordinary(D) <3780 <1050 Eastern Sichuan, most of Chongqing, central and northern Guizhou, west of 110° in Hubei and northwestern Hunan
(1) Beijing Given that Beijing has abundant solar energy resources featuring total annual solar radiation of 5600 MJ/m2 to 6000 MJ/m2 and 2600 to 3000 full sun hours annually, it is very suitable for both rural and urban areas of the capital city to apply such technologies as solar water heaters, solar cookers, solar lamps and photovoltaic systems. According to the statistics of the Energy Research Institute of the National Development and Reform Commission, the annual solar radiation available in Beijing can be considered equivalent to 2.9 billion tce. The municipality’s annual average solar energy resource gradually decreases from the northern to the southern parts of the area. The eco-conservation areas of Yanqing, Miyun and Huairou districts have the most favorable conditions to develop solar energy. The spaces suitable for installing solar PV systems in Beijing include rooftops of residential buildings, municipal public facilities, and the surface areas of agricultural facilities such as agricultural greenhouses, industrial plants, sewage treatment plants, water supply plants, parking lots, subways, logistics parks/warehouses, and fishponds. The estimated currently available space for solar PV systems in Beijing totals 71.27 million m2 and based on a typical capacity ratio of 0.5MW/10,000 m2 for installed photovoltaic arrays, the total installed capacity of solar PV could reach 3565 MW and generate4.278 billion kWh per year, equivalent to 525,800 tce.
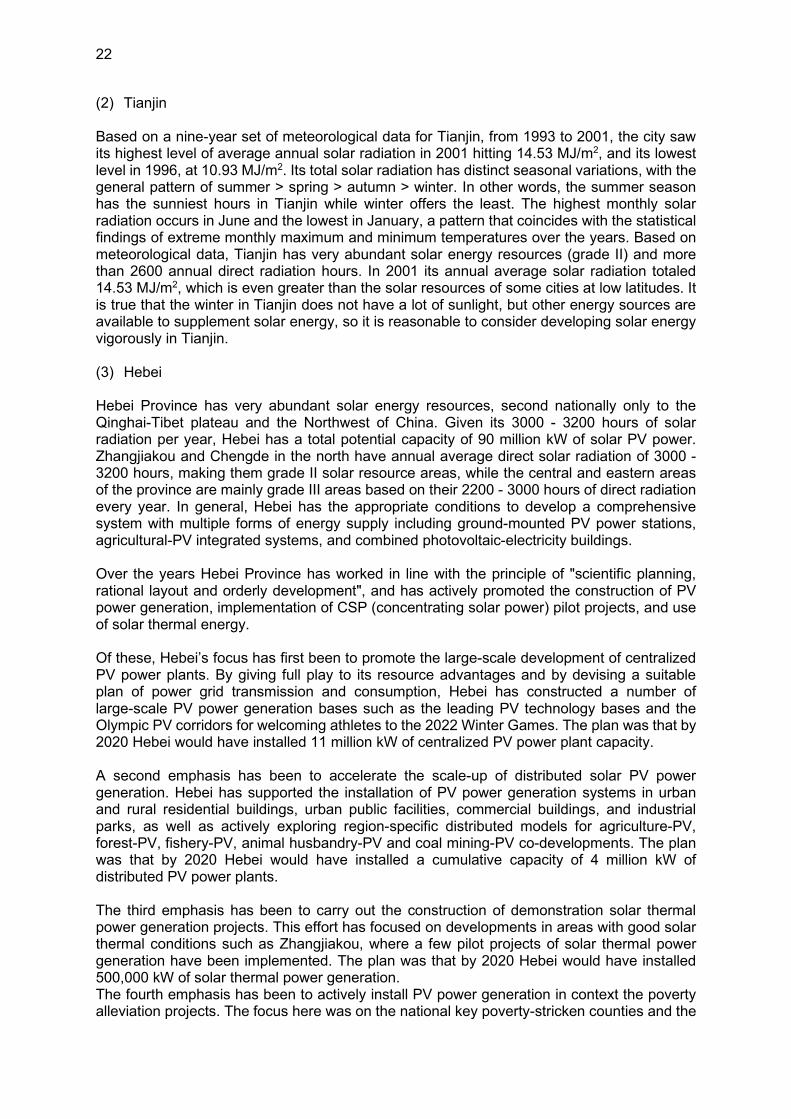
22
(2) Tianjin Based on a nine-year set of meteorological data for Tianjin, from 1993 to 2001, the city saw its highest level of average annual solar radiation in 2001 hitting 14.53 MJ/m2, and its lowest level in 1996, at 10.93 MJ/m2. Its total solar radiation has distinct seasonal variations, with the general pattern of summer > spring > autumn > winter. In other words, the summer season has the sunniest hours in Tianjin while winter offers the least. The highest monthly solar radiation occurs in June and the lowest in January, a pattern that coincides with the statistical findings of extreme monthly maximum and minimum temperatures over the years. Based on meteorological data, Tianjin has very abundant solar energy resources (grade II) and more than 2600 annual direct radiation hours. In 2001 its annual average solar radiation totaled 14.53 MJ/m2, which is even greater than the solar resources of some cities at low latitudes. It is true that the winter in Tianjin does not have a lot of sunlight, but other energy sources are available to supplement solar energy, so it is reasonable to consider developing solar energy vigorously in Tianjin. (3) Hebei Hebei Province has very abundant solar energy resources, second nationally only to the Qinghai-Tibet plateau and the Northwest of China. Given its 3000 - 3200 hours of solar radiation per year, Hebei has a total potential capacity of 90 million kW of solar PV power. Zhangjiakou and Chengde in the north have annual average direct solar radiation of 3000 - 3200 hours, making them grade II solar resource areas, while the central and eastern areas of the province are mainly grade III areas based on their 2200 - 3000 hours of direct radiation every year. In general, Hebei has the appropriate conditions to develop a comprehensive system with multiple forms of energy supply including ground-mounted PV power stations, agricultural-PV integrated systems, and combined photovoltaic-electricity buildings. Over the years Hebei Province has worked in line with the principle of "scientific planning, rational layout and orderly development", and has actively promoted the construction of PV power generation, implementation of CSP (concentrating solar power) pilot projects, and use of solar thermal energy. Of these, Hebei’s focus has first been to promote the large-scale development of centralized PV power plants. By giving full play to its resource advantages and by devising a suitable plan of power grid transmission and consumption, Hebei has constructed a number of large-scale PV power generation bases such as the leading PV technology bases and the Olympic PV corridors for welcoming athletes to the 2022 Winter Games. The plan was that by 2020 Hebei would have installed 11 million kW of centralized PV power plant capacity. A second emphasis has been to accelerate the scale-up of distributed solar PV power generation. Hebei has supported the installation of PV power generation systems in urban and rural residential buildings, urban public facilities, commercial buildings, and industrial parks, as well as actively exploring region-specific distributed models for agriculture-PV, forest-PV, fishery-PV, animal husbandry-PV and coal mining-PV co-developments. The plan was that by 2020 Hebei would have installed a cumulative capacity of 4 million kW of distributed PV power plants. The third emphasis has been to carry out the construction of demonstration solar thermal power generation projects. This effort has focused on developments in areas with good solar thermal conditions such as Zhangjiakou, where a few pilot projects of solar thermal power generation have been implemented. The plan was that by 2020 Hebei would have installed 500,000 kW of solar thermal power generation. The fourth emphasis has been to actively install PV power generation in context the poverty alleviation projects. The focus here was on the national key poverty-stricken counties and the
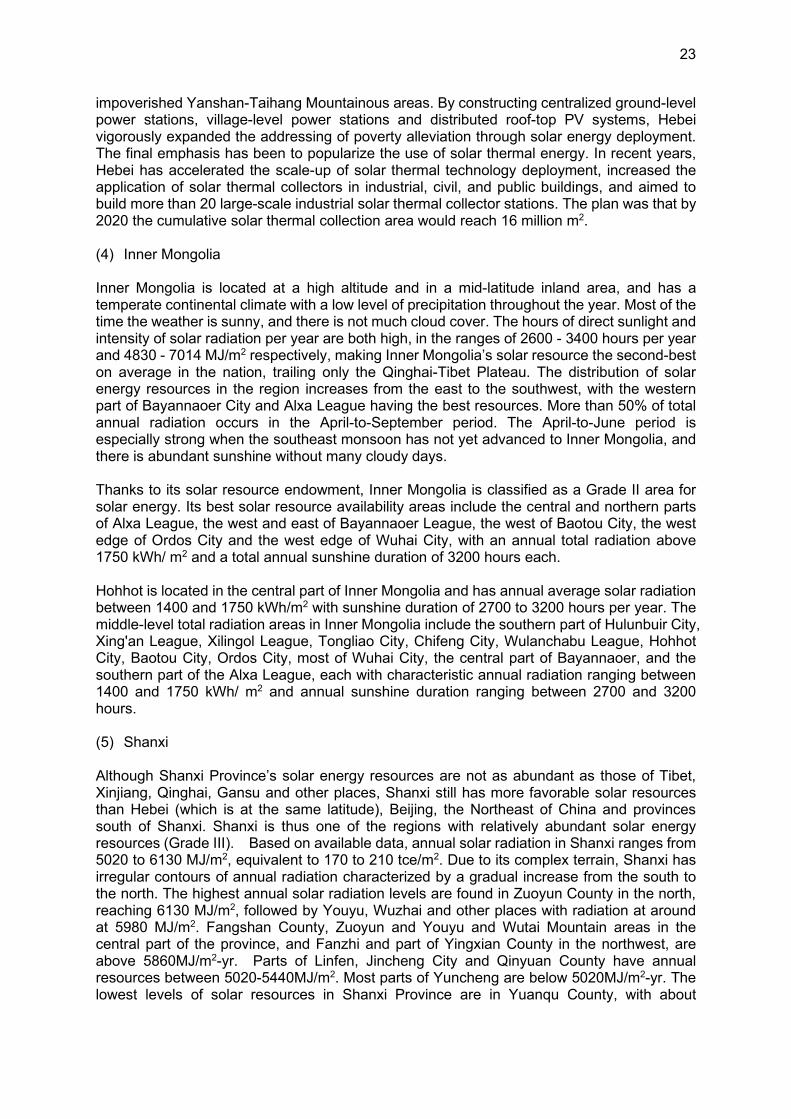
23
impoverished Yanshan-Taihang Mountainous areas. By constructing centralized ground-level power stations, village-level power stations and distributed roof-top PV systems, Hebei vigorously expanded the addressing of poverty alleviation through solar energy deployment. The final emphasis has been to popularize the use of solar thermal energy. In recent years, Hebei has accelerated the scale-up of solar thermal technology deployment, increased the application of solar thermal collectors in industrial, civil, and public buildings, and aimed to build more than 20 large-scale industrial solar thermal collector stations. The plan was that by 2020 the cumulative solar thermal collection area would reach 16 million m2. (4) Inner Mongolia Inner Mongolia is located at a high altitude and in a mid-latitude inland area, and has a temperate continental climate with a low level of precipitation throughout the year. Most of the time the weather is sunny, and there is not much cloud cover. The hours of direct sunlight and intensity of solar radiation per year are both high, in the ranges of 2600 - 3400 hours per year and 4830 - 7014 MJ/m2 respectively, making Inner Mongolia’s solar resource the second-best on average in the nation, trailing only the Qinghai-Tibet Plateau. The distribution of solar energy resources in the region increases from the east to the southwest, with the western part of Bayannaoer City and Alxa League having the best resources. More than 50% of total annual radiation occurs in the April-to-September period. The April-to-June period is especially strong when the southeast monsoon has not yet advanced to Inner Mongolia, and there is abundant sunshine without many cloudy days. Thanks to its solar resource endowment, Inner Mongolia is classified as a Grade II area for solar energy. Its best solar resource availability areas include the central and northern parts of Alxa League, the west and east of Bayannaoer League, the west of Baotou City, the west edge of Ordos City and the west edge of Wuhai City, with an annual total radiation above 1750 kWh/ m2 and a total annual sunshine duration of 3200 hours each. Hohhot is located in the central part of Inner Mongolia and has annual average solar radiation between 1400 and 1750 kWh/m2 with sunshine duration of 2700 to 3200 hours per year. The middle-level total radiation areas in Inner Mongolia include the southern part of Hulunbuir City, Xing'an League, Xilingol League, Tongliao City, Chifeng City, Wulanchabu League, Hohhot City, Baotou City, Ordos City, most of Wuhai City, the central part of Bayannaoer, and the southern part of the Alxa League, each with characteristic annual radiation ranging between 1400 and 1750 kWh/ m2 and annual sunshine duration ranging between 2700 and 3200 hours. (5) Shanxi Although Shanxi Province’s solar energy resources are not as abundant as those of Tibet, Xinjiang, Qinghai, Gansu and other places, Shanxi still has more favorable solar resources than Hebei (which is at the same latitude), Beijing, the Northeast of China and provinces south of Shanxi. Shanxi is thus one of the regions with relatively abundant solar energy resources (Grade III). Based on available data, annual solar radiation in Shanxi ranges from 5020 to 6130 MJ/m2, equivalent to 170 to 210 tce/m2. Due to its complex terrain, Shanxi has irregular contours of annual radiation characterized by a gradual increase from the south to the north. The highest annual solar radiation levels are found in Zuoyun County in the north, reaching 6130 MJ/m2, followed by Youyu, Wuzhai and other places with radiation at around at 5980 MJ/m2. Fangshan County, Zuoyun and Youyu and Wutai Mountain areas in the central part of the province, and Fanzhi and part of Yingxian County in the northwest, are above 5860MJ/m2-yr. Parts of Linfen, Jincheng City and Qinyuan County have annual resources between 5020-5440MJ/m2. Most parts of Yuncheng are below 5020MJ/m2-yr. The lowest levels of solar resources in Shanxi Province are in Yuanqu County, with about
24
4840MJ/m2 of solar radiation every year. In sum, 60% of Shanxi Province has an annual solar radiation of 5440 to 5720 MJ/m2. According to its “Thirteenth Five-Year Plan for Comprehensive Energy Development”, Shanxi Province encourages the vigorous development of renewable energy resources such as solar, wind, biomass, and geothermal energy, and encourages the use of distributed energy supply systems such as wind power, photovoltaic power and small hydropower in conjunction with development of energy storage capacities in rural and remote areas. Shanxi also strives to foster development of “green energy” counties, townships, and villages. The potential for development of clean energy sources in rural areas of Shanxi is huge. (6) Liaoning Liaoning Province has an average annual solar radiation of 4950 MJ/m2, with the annual resource in different locations ranging from 4500 MJ/m2 to 5421 MJ/m2 across its territory. Solar radiation in Liaoning is unevenly distributed, with the northwest having the most and the east having the least. Most areas in the province have a relatively abundant (Grade III or higher) solar resource, and the west has very abundant solar resources (Grade II). The radiation distribution pattern is similar to the distribution of sunshine duration. The annual average sunshine duration is 2547 hours, ranging from 2125 to 2910 hours across the province. The west and north of the province stand above 2800 hours while the east mountainous areas have the least sunny days, generally below 2500 hours annually. In terms of solar variability, the province shows an increasing trend from its northwest to its southeast. In other words, the areas with the most solar resources have the least variability (such as the northwest areas of Liaoning). Most areas in the province are classified as being stable with their stability values less than 1.5, indicating favorable conditions for solar energy development. The longest continuous period of “no sunshine radiation” in the province varies 3 to 16 days, while most areas have less than 6 days of continuous days of no sunshine radiation. The spatial distribution of days with no sunshine thus shows an increasing trend from the northwest to the southeast. In general, western Liaoning is offers the best solar resource and has the greatest potential for solar energy utilization. Liaoning Province has proposed to develop distributed energy as a future pathway to supply energy to its rural areas. The distributed energy proposal is about enabling each village and township to have their own system of energy supply and meet their demand for power by using a combination of solar, biomass and wind energy. Such solutions avoid the need for additional construction of long-distance power transmission and allow fossil fuels to play a supplementary role to secure grid stability. This is the chosen direction for the future rural energy development of the province. Liaoning Province has been exploring the comprehensive utilization of solar energy in households. Demonstration and promotion of advanced solar-energy-integrated energy-efficient building technologies, integrated solar photovoltaic power generation, solar hot water and heat storage systems, and the solar heating room technology have been shown to greatly improve the living conditions of farmers, increased their incomes, and reduced expenses. Using idle rooftops to promote household solar PV power generation, the average household installs PV systems with capacities of 5 kW and a construction investment of about 40,000 yuan. There are three models for financing these systems: one in which farmers supply all the investment funds and are provided with an annual power generation subsidy is about 6,000 yuan; and another in which systems are purchased in cooperation with enterprises, where the enterprise undertakes 80% of the construction costs and the provincial government and farmers pay 10% of the remaining costs each. During the operation of the enterprise-based power generation systems, subsidies are given to farmers every year and farmers can recover part of their investment costs in 4 to 5 years. After the
25
enterprise recovers its investment costs the system ownership is transferred to the farmers. In the third model of financing, all investments are supplied by enterprises, and the enterprises give farmers 500 yuan per year. (7) Henan Given that its solar energy resources are moderately above the national average, Henan Province is rated as a Grade III solar resource region. Its annual average total solar radiation ranges between 4300 and 5000 MJ/m2, and its photovoltaic equivalent full-load utilization range from 900 to 1100 hours per year. The spatial distribution of solar radiation decreases from the north to the south, indicating a distinct association with latitude instead of longitude. Most of the high solar radiation areas are along the Yellow River in the central part of Henan, while Nanyang Basin and Mount Dabie in the south are low in terms of solar radiation levels. The annual provincial average total solar radiation 4800 MJ/m2 can be used as a measurement standard (a lateral line across Shenqiu, Xiping, Baofeng and Lushi) and divides the province into two parts- the north and the south. To the north of this line there are three relatively high-value areas: the first is the northeastern Henan, including Nanle County and Puyang County, where the annual average solar radiation is above 4900 MJ/m2; the second area includes Jiaozuo, Luoyang, Zhengzhou, Kaifeng, Xinxiang and other places in the central province along the Yellow River; the third area is near Yucheng in the eastern province. There are two relatively low-solar areas south of this line where the annual average solar radiation is below 4600 MJ/ m2: the first is the southwest area of Nanyang Basin including Xichuan, Neixiang and Dengzhou; the second area is the northeast part of Zhumadian and to the south of Mount Dabie in Xinyang. Given its solar resource availability and industrial characteristics, Henan Province has actively explored an integrated approach combining photovoltaic power generation with agriculture, livestock raising and ecological management activities. It built a 125 MW PV power station to support modern ecological agricultural greenhouses in Neihuang, thus providing a project with a high demonstrative value for the use of PV power in promoting efficient agricultural production. The province has continued to expand the scale of solar thermal utilization and has built a number of centralized solar water heating systems. In 2018 Henan’s solar power generation reached 8,377.19 million kWh, up by 88.87% year on year. In 2018 the utilization area of solar water heaters in the rural areas of Henan reached 6,389,200 m2 and the area of solar houses exceeded 20,400 m2. (8) Shandong Shandong Province has relatively abundant solar energy resources and most of its areas are rated Grade III. More than two-thirds of the province has an annual solar duration longer than 2200 hours, ranging between 2099 and 2813 hours by location. Shandong’s annual total radiation ranges between 4600 and 5600 MJ/m2. Most of its peninsula, most of the northwestern region and part of the central region have relatively abundant solar resources and are classified as Grade III, while its southwest, most of its southeast and part of its northwest have less solar resources and are rated Grade IV. Shandong Province has been leading the country in solar thermal energy utilization, with its scale of solar thermal use significantly greater than that of the other provinces. Since the "Twelfth Five-Year Plan Period”, with national and provincial policies and measures supporting solar power deployment, Shandong has achieved astounding development characterized by an annual growth of 134% in installed PV capacity and of 150% in power generation respectively. By the end of 2018, the province's cumulative installed capacity of PV power was 13.6122 million kW, ranking first in the country, among which 6.4792 million kW was from central PV power stations and 7.133 million kW was from distributed PV capacity.
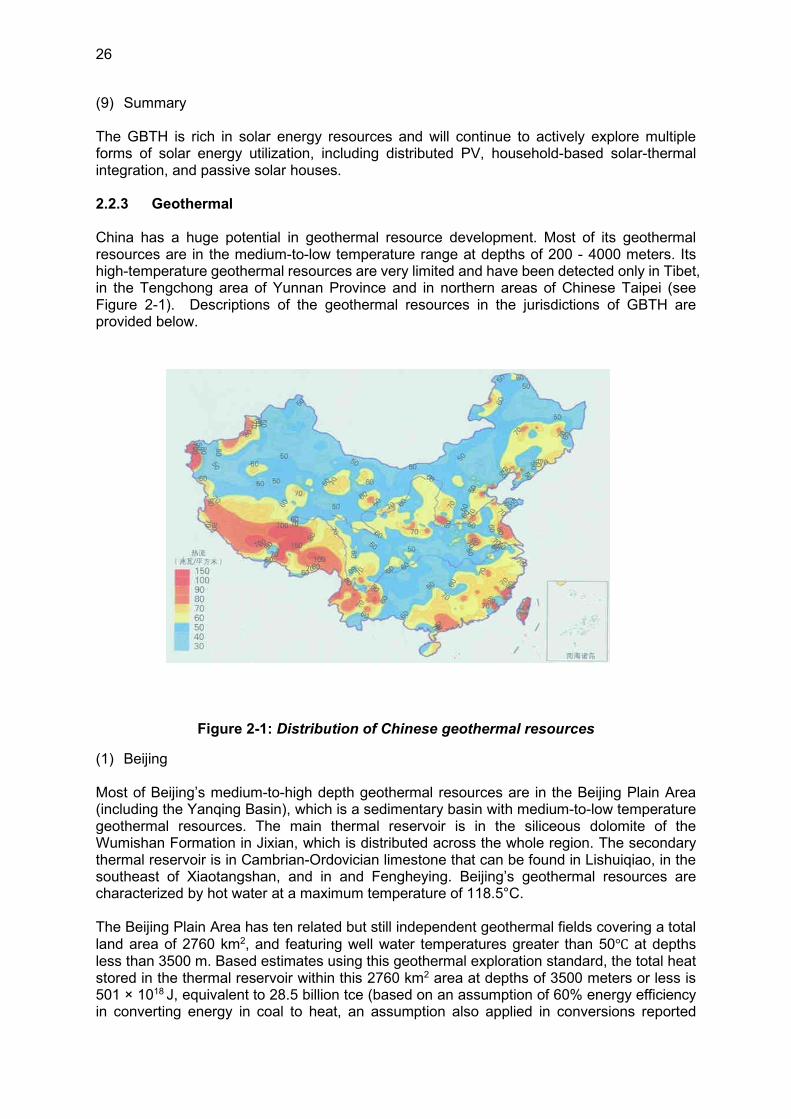
26
(9) Summary The GBTH is rich in solar energy resources and will continue to actively explore multiple forms of solar energy utilization, including distributed PV, household-based solar-thermal integration, and passive solar houses. 2.2.3 Geothermal China has a huge potential in geothermal resource development. Most of its geothermal resources are in the medium-to-low temperature range at depths of 200 - 4000 meters. Its high-temperature geothermal resources are very limited and have been detected only in Tibet, in the Tengchong area of Yunnan Province and in northern areas of Chinese Taipei (see Figure 2-1). Descriptions of the geothermal resources in the jurisdictions of GBTH are provided below.
Figure 2-1: Distribution of Chinese geothermal resources
(1) Beijing Most of Beijing’s medium-to-high depth geothermal resources are in the Beijing Plain Area (including the Yanqing Basin), which is a sedimentary basin with medium-to-low temperature geothermal resources. The main thermal reservoir is in the siliceous dolomite of the Wumishan Formation in Jixian, which is distributed across the whole region. The secondary thermal reservoir is in Cambrian-Ordovician limestone that can be found in Lishuiqiao, in the southeast of Xiaotangshan, and in and Fengheying. Beijing’s geothermal resources are characterized by hot water at a maximum temperature of 118.5°C. The Beijing Plain Area has ten related but still independent geothermal fields covering a total land area of 2760 km2, and featuring well water temperatures greater than 50℃ at depths less than 3500 m. Based estimates using this geothermal exploration standard, the total heat stored in the thermal reservoir within this 2760 km2 area at depths of 3500 meters or less is 501 × 1018 J, equivalent to 28.5 billion tce (based on an assumption of 60% energy efficiency in converting energy in coal to heat, an assumption also applied in conversions reported
27
below). The total volume of geothermal water here is 17.973 billion m³, storing 3772 × 1015 J of heat, equivalent to the heat generated by 215 million tce. Beijing has abundant reserves of shallow geothermal resources with an estimated heat capacity of 1.34×10¹⁵ kJ, equivalent to 7.14×10¹⁰ tce. Its available capacity in using the groundwater heat pump systems is 18.34 × 10¹³ kW in winter and 3.58 × 10¹³ kJ in summer. Beijing’s available capacity in using ground-coupled heat pump systems is 23.86 × 10¹³ kJ in winter and 4.16 × 10¹³ kJ in summer. With regards to the feasibility of installing groundwater-source heat pumps, Beijing’s “suitable” land area totals 840.62 km2, moderately suitable area totals 1235.04 km2, and ordinary land area totals 4234.65 km2. With regards to the use of ground-coupled heat pumps, the land area that can generate strong economic performance totals 3272.21 km2, the land area with ordinary economic performance 2284.8 km2, and the land area with poor economic performance 1378.99 km2. As of 2017, the city was using geothermal energy and heat pumps to condition a total building space of 52 million m2. Beijing is now in a transition phase from its initial group of standalone small-scale projects to development of regional large-scale demonstration projects such as Yanqing District’s Sanlihe Project. Some of the of the villages in the area have installed ground source heat pumps. (2) Tianjin As a result of its rich geothermal resources, Tianjin has been a leader in developing and utilizing this clean energy source. The scale, development level and management expertise for geothermal development in Tianjin all rank among the best in the country. The local geothermal resources have been widely used in heating, hot water for shower, hot spring-related physiotherapy, tourism, agricultural plantations, livestock raising and industrial production. The use of geothermal energy in Tianjin has already produced significant economic, social and environmental benefits, and geothermal has become an important part of the city's energy structure. The active role of geothermal development in energy conservation and emissions reduction has further facilitated the city’s movement towards its “Beautiful Tianjin” goal. In recent years, Dongli Lake Tourist Resort, Beijing-Tianjin New Town and Tuanbo New Town have each been granted honorable titles such as "Hometown of Hot Springs in China" or "City of Hot Springs" by the Ministry of Land and Resources. In 2010, Tianjin was named the "Hot Spring Capital of China" by the Ministry of Land and Resources. In 2018, Tianjin's geothermal central heating area reached 33.02 million m2, ranking first in the country. Space heated with geothermal energyaccounts for 6.7% of the total central heating area in Tianjin, playing a crucial role in improving the atmospheric environment in the city during the winter. With support from the central and municipal governments and assistance of the United Nations Development Program, as of 2016, Tianjin had surveyed and evaluated eight geothermal fields (Wanglanzhuang, Shanlingzi, Binhai, Wuqing, Panzhuang-Lutai, Ninghe-Han’gu, Wanjia Wharf and Zhouliangzhuang) and submitted its development proposals to the mineral resource management bodies. These submissions contain a total of 76.066 million m³/year (above 25°C) recoverable geothermal fluid, of which there 52.0 million m³/year are from the Neogene thermal storage area and 24.1 million m³/year are from rock thermal storage. The available thermal energy is 1.30×10¹⁶ J/year, equivalent to 443,000 tce/year (100% conversion efficiency). Tianjin is very rich in shallow geothermal energy resources. Its total administrative area of 11920 km2, with the exception of the northern mountainous area of 775 km2, is covered with loose sedimentary layers mainly consisting of clay, silty clay and sedimentary clay, and the
28
lithology of the aquifer consists mainly of fine sand and partly of coarse sand. The potential for development of shallow geothermal energy resources in Tianjin is huge. If these resources can be used scientifically and rationally, they will surely provide another secure source of energy for the further development of the Binhai New Area and of Tianjin as a whole. Since 2000, shallow geothermal energy development has picked up speed. Among the possible technological solutions, ground coupled heat pumps have been demonstrated to have distinct advantages as being energy efficient, environmentally friendly, reliable and consuming no groundwater, and the use of these systems has thus experienced rapid growth since 2003.
(3) Hebei
Hebei Province has a vast area endowed with geothermal energy resources. These are mainly at medium and low temperatures and at shallow depths, distributed in the Yanshan and Taihang Mountains’ fold belts as well as the Yuxian-Yangyuan, Zhaochuan, Huailai and other inter-mountain rift basins and in the Hebei Plain’s subsidence belt. The available shallow geothermal energy resources are equivalent to 285 million tce per year, out of which 11 million tce are recoverable. In addition, Hebei’s medium-to-low depth geothermal resources are equivalent to 23.52 billion tce, out of which 4.97 billion tce are recoverable. Following the "13th Provincial Five-Year Plan for Renewable Energy Development", Hebei has formulated a scientific plan to develop its geothermal energy resources to support heating, cooling, crop plantations, livestock raising, hot spring tourism and other activities. Key emphasis has been placed on the development of geothermal heating to increase the fossil-to-geothermal substitution ratio. To develop geothermal heating, Hebei devised an “Action Plan to Build New Towns, New Energy and New Lifestyles” while implementing other nationwide initiatives including eliminating coal-fired boilers and promoting new models of urbanization. Given its geothermal heating potential, Hebei has placed a particular focus on developing the shallow geothermal resources in the plain areas such as Shijiazhuang, Baoding, Handan and Xingtai for central heating and cooling. Hebei also has placed priority on exploiting the medium-to-high depth geothermal resources in Baoding, Shijiazhuang, Langfang, Zhangjiakou, and other areas for central heating, and has developed a high capacity to use geothermal energy to replace coal-fired boilers at a large scale. Hebei has also made efforts to foster the comprehensive development of geothermal energy. In the areas with favorable conditions, such as Baoding, Chengde and Langfang, Hebei has developed multiple models for the application of geothermal energy in agricultural plantations and livestock raising and is seeking to build one or two demonstrative geothermal greenhouse bases. To make better use of its advantageous location (being part of the greater Beijing-Tianjin area), Hebei has given priority to geothermal tourism development in Shijiazhuang, Zhangjiakou, Qinhuangdao, Chengde, Baoding and other cities. By 2020, the province had used geothermal energy to cover 30,000 mu of land for agricultural plantations, 3,200 mu of land for stock raising, and had received 60 million tourist visits/year.
(4) Inner Mongolia
The Inner Mongolia Autonomous Region has uplifted mountain-type geothermal resources (shallow geothermal energy and thermal mineral water belts) and sedimentary basin-type geothermal resources. Across the whole region, the area west of the Hetao Basin has particularly favorable geothermal resources and has great potential for geothermal development.
29
Inner Mongolia’s geothermal resources are mainly composed of convective geothermal resources in mountainous areas and conduction geothermal resources in the plains. The convective geothermal resources are mainly distributed across geothermal fields in Aershan, Hexigten Banner, Aohan Banner, Ningcheng County and Liangcheng County. The related resource estimates for these areas are based on existing survey data. Given that geothermal exploitation in the fields has been going on for a long time, the Aershan thermal field has experienced lowered groundwater levels. Other than Aershan, however, all of the geothermal fields previously surveyed have had little change in their ground water levels. This stability serves as a strong guarantee for a stable level of geothermal output as these resources are tapped. Despite the fact that Inner Mongolia is rich in geothermal resources, the development and utilization of geothermal energy there are still in the initial stages and are unlikely to be scaled up in a short period of time. In other words, the coal-dominated energy structure in Inner Mongolia may remain unchanged for a long time. From a strategic point of view, geothermal energy will stay as remain as an auxiliary source of new energy for Inner Mongolia, relative to wind and solar power. On a micro level, geothermal can play significant roles in the local areas where geothermal resources and heat needs are well matched. In those situations, the prospects for local geothermal development are bright. In the long run, Inner Mongolia shall implement geothermal based on the principle of developing "small-scale and distributed geothermal resources with measures well-suited to the local conditions and seeking comprehensive utilization". Geothermal resources development represents a new opportunity. It must be exploited rationally and sustainably so that the temperature, water volume and pressure can remain stable for a long time and thus secure broader prospects for the comprehensive use of underground hot water.
(5) Shanxi
Shanxi has rich geothermal resources mainly distributed in its five major basins of Datong, Xinzhou, Taiyuan, Linfen and Yuncheng. These basins cover 32 counties including Xinjiang, Linyi, Xiaxian, Xiangfen, Quwo, Taiyuan, Qingxu, Xinzhou, Dingxiang, Yuanping, Yanggao, Tianzhen and Hunyuan. The temperature of the geothermal reservoir in Shanxi is mainly in the 20-40℃ range, and few places have geothermal waters at a higher temperature than 61℃. The total amount of recoverable geothermal resource is estimated to be 1.41 × 10¹⁷ kJ, equivalent to 4.8 × 10⁹ tce, and ranking 15th in the country. According to its “Thirteenth Five-Year Plan for Comprehensive Energy Development”, Shanxi Province encourages vigorous development of solar, wind, biomass, geothermal and other renewable energy resources, seeks to gradually scale up the use of solar energy and geothermal energy equipment, promotes household use of solar hot water, and employs rural biogas and geothermal energy sources for heating.
(6) Liaoning
Liaoning Province has widely distributed and rich Geothermal resources. As of 2020, 79 geothermal fields have been discovered out of which more than 40 have been developed. Based on the geothermal reservoirs identified and surveyed to date, Liaoning’s geothermal resources rank eighth in the country and first among the provinces and regions of in Northeast China. Liaoning’s geothermal fields are distributed across all of the 14 cities in the province. Among them, 42 fields have water reservoir temperatures between 20℃ and 40℃, 23 fields have temperatures between 40℃ and 60℃, 11 fields have temperatures between 60℃ and 90℃ and three fields have temperatures higher than 90℃. 47 fields are convective geothermal sites that are directly exposed to the surface in the form of hot springs or show obvious ground temperature anomalies in mountainous areas in the east and west of
30
Liaoning. 32 fields are conductive geothermal fields (wells) in sedimentary basins mainly distributed in the Lower Liaohe Plain, Shenbei, Jinzhou, Fuxin, Chaoyang, Dalian and Benxi. Given that Liaoning Province began development of its shallow geothermal energy resource a fairly long time ago, it has put in place some large-scale geothermal heating projects in urban areas, but there are few cases of geothermal heating in the rural areas of the province.
(7) Henan
Henan Province has abundant shallow geothermal energy resources and a land area of 109,000 km2 suitable for the installation of ground source heat pumps (using groundwater or group-coupled heat exchangers), which represents 65.32% of the total area of the province. The shallow geothermal resources are mainly distributed in the eastern plain and the western and southern intermountain basins. The areas of Henan suitable for groundwater heat exchange are mainly in the Yellow River’ alluvial plain in the east, Shahe’s alluvial plain, and the central positions of the Jiyuan, Luoyang, Sanmenxia and Nanyang basins. These areas have a total land area of 36,000 km2, accounting for 32.59% of the total GSHP (relatively) suitable area, and equivalent to 21.4% of the province's total land area. Except for the bedrock mountainous areas in the west and southwest and the areas in Luoyang City where the shallow strata are dominated by pebbles, most other areas are suitable for installing ground-coupled heat pump systems. The medium-to-high depth geothermal resources in Henan are mainly distributed in the sedimentary basins, with some resources in the uplifted mountains in the form of belts (dots). The geothermal resources in sedimentary basins are concentrated in the Cenozoic formations around Dongming’s Fault and Kaifeng’s Sunken Section, specifically from the east section of Zhengzhou to the Fanxian-Taiqian section around Heze County’s Uplift. The hot water resources in these areas are abundant. Another belt with relatively abundant hot water resources lies between Jiyuan in the western section of Kaifeng and the Lingsan faulted basin area. Many other areas have ordinary recoverable resources. In the areas around Yongcheng, hot water resources are scarce. Structural geothermal resources are mainly concentrated in the uplifted bedrock mountainous areas in the west of the province, and normally are exposed at the surface as hot springs. After Henan Province completed its surveys and exploration of key geothermal areas, a number of geothermal demonstration projects were built in Zhengzhou, Luoyang, Nanyang, Puyang and other cities to provide central heating. As of the end of the "Twelfth Five-Year Plan", the building space using ground source heat pumps for heating and cooling totaled 35 million m2, thus reaching a significant scale.
(8) Shandong
There are geothermal resources in all of the 17 cities in Shandong Province. These resources are characterized by wide distribution, abundant reserves and favorable conditions for development and utilization. The local geothermal resources are in three main types: shallow geothermal resources, hydrothermal resources and hot dry rock. According to preliminary estimates, if heat pump technologies are applied, the exchangeable amount of shallow geothermal energy from depth less than 200 meters in winter and summer are 3.85 ×10¹⁷ kJ, equivalent to 13.14 billion tce, which is equivalent to 40% of the province’s coal reserves and is 87 times the total annual coal output from the province. The plain area of northwestern Shandong in particular has huge geothermal potential. The secondary areas for shallow geothermal development include the central-southern parts and most of the eastern part of the province. The province has 4.21 × 10¹⁷ kJ hydrothermal resources, equivalent to 14.373 billion tce. The northwestern part of the province contributes two-thirds of the total.
31
Hot dry rock resources remain in the stage of exploration and preliminary research worldwide with no mature development of utilization technologies demonstrated as of yet, thus hot dry rock resource remain an important category of untapped reserves. By the end of 2018, the total building area using shallow geothermal heating (and cooling) in Shandong reached 75 million m2, and the area using hydrothermal heating was 34 million m2. The same period also witnessed rapid development of the geothermal equipment manufacturing industry in Shandong Province and in China generally. Up to 2020, Shandong has more than 50 ground source heat pump manufacturers and more than 300 businesses providing ground source heat pump system integration services, and these manufacturers and businesses held more than 500 valid patents on GSHP technologies. The Shandong Provincial Department of Housing and Urban-Rural Development issued the "Notice on Strengthening the Project Management of Ground Source Heat Pump Systems", which stipulates that all the new, renovated and expanded residential quarters and public buildings that meet the conditions to install ground source heat pumps should give priority to the application and installation of soil source (ground-coupled) heat pumps and surface water sources (including sewage, industrial wastes and residual heat, rivers, lakes, etc.) heat pump systems.
(9) Summary
Given the Greater Beijing-Tianjin-Hebei Region has an uneven distribution of medium-to-high depth geothermal resources, it is suggested to prioritize development in the areas with abundant resources or relatively abundant resources. In this region shallow geothermal resources are rich and widely distributed. Geothermal heating projects in rural areas have been widely implemented and have generated mature technical solutions, sound economic performance and satisfactory effects in energy efficiency improvement and emission reduction. Such projects should therefore be scaled up to broader rural areas wherever conditions permit.
2.2.4 Biomass
(1) Beijing
According to the statistics of the Energy Conservation and Environmental Protection Center of the Beijing Municipal Development and Reform Commission, the total output of biomass from Beijing’s suburbs is nearly 27 million tons per year which includes: ① 4.39 million tons of biomass from agriculture and forestry including 2.257 million tons of straw and 2.133 million tons of firewood; ② 19.6 million tons of animal manure from stock raising of which 7.42 million tons are solid manure and 12.18 million tons are liquid slurry; ③ 2 million tons of the rural household domestic waste and waste timber from wood processing sites; and ④nearly one million tons of all other biomass resources combined. As rural areas of Beijing have a substantial potential for the development of biomass energy resources, it is recommended that the municipal government identify key development directions for its biomass resources and thus overcome the existing challenges to biomass utilization, such as the scattered locations of biomass that makes the large-scale collection and centralized treatment of biomass resources difficult and costly. At present only small-scale biogas digesters in the suburban counties of the municipality are operating well. As to how to run existing centralized treatment plants efficiently and effectively, Beijing has yet to come up with a solution to transport the scattered input materials to the central facility while keeping the potential pollution related to collection, transport, and processing of
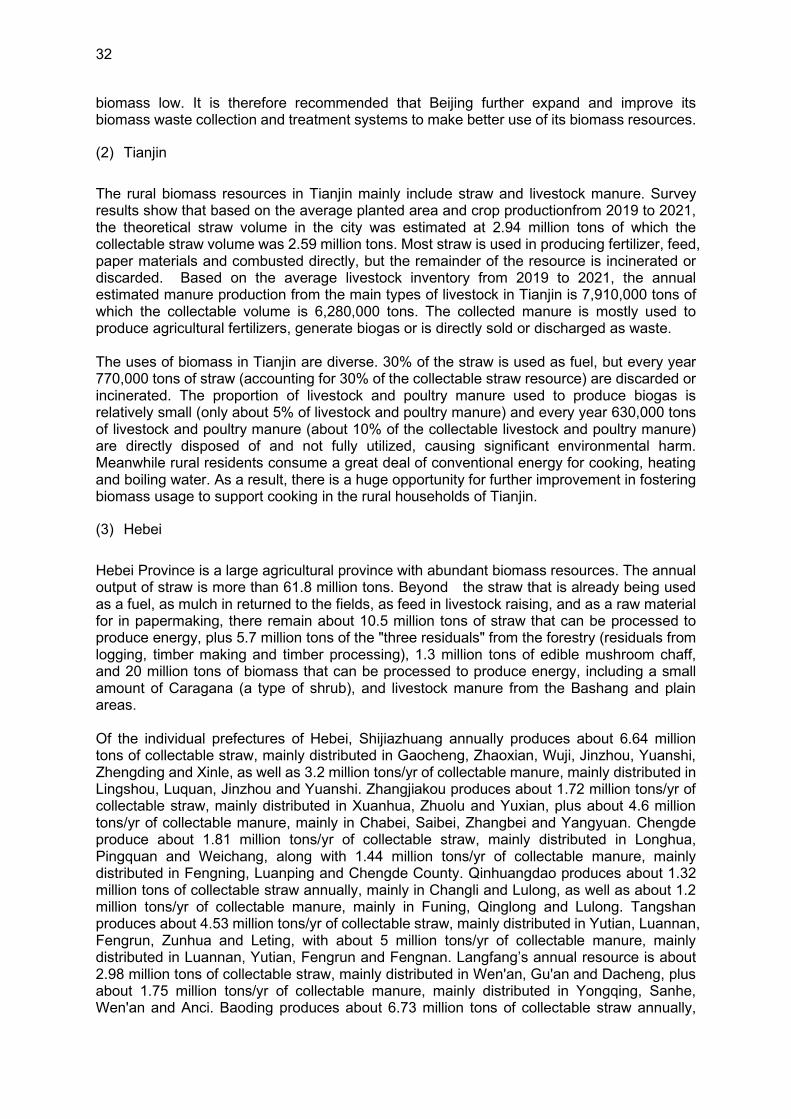
32
biomass low. It is therefore recommended that Beijing further expand and improve its biomass waste collection and treatment systems to make better use of its biomass resources.
(2) Tianjin
The rural biomass resources in Tianjin mainly include straw and livestock manure. Survey results show that based on the average planted area and crop productionfrom 2019 to 2021, the theoretical straw volume in the city was estimated at 2.94 million tons of which the collectable straw volume was 2.59 million tons. Most straw is used in producing fertilizer, feed, paper materials and combusted directly, but the remainder of the resource is incinerated or discarded. Based on the average livestock inventory from 2019 to 2021, the annual estimated manure production from the main types of livestock in Tianjin is 7,910,000 tons of which the collectable volume is 6,280,000 tons. The collected manure is mostly used to produce agricultural fertilizers, generate biogas or is directly sold or discharged as waste. The uses of biomass in Tianjin are diverse. 30% of the straw is used as fuel, but every year 770,000 tons of straw (accounting for 30% of the collectable straw resource) are discarded or incinerated. The proportion of livestock and poultry manure used to produce biogas is relatively small (only about 5% of livestock and poultry manure) and every year 630,000 tons of livestock and poultry manure (about 10% of the collectable livestock and poultry manure) are directly disposed of and not fully utilized, causing significant environmental harm. Meanwhile rural residents consume a great deal of conventional energy for cooking, heating and boiling water. As a result, there is a huge opportunity for further improvement in fostering biomass usage to support cooking in the rural households of Tianjin.
(3) Hebei
Hebei Province is a large agricultural province with abundant biomass resources. The annual output of straw is more than 61.8 million tons. Beyond the straw that is already being used as a fuel, as mulch in returned to the fields, as feed in livestock raising, and as a raw material for in papermaking, there remain about 10.5 million tons of straw that can be processed to produce energy, plus 5.7 million tons of the "three residuals" from the forestry (residuals from logging, timber making and timber processing), 1.3 million tons of edible mushroom chaff, and 20 million tons of biomass that can be processed to produce energy, including a small amount of Caragana (a type of shrub), and livestock manure from the Bashang and plain areas. Of the individual prefectures of Hebei, Shijiazhuang annually produces about 6.64 million tons of collectable straw, mainly distributed in Gaocheng, Zhaoxian, Wuji, Jinzhou, Yuanshi, Zhengding and Xinle, as well as 3.2 million tons/yr of collectable manure, mainly distributed in Lingshou, Luquan, Jinzhou and Yuanshi. Zhangjiakou produces about 1.72 million tons/yr of collectable straw, mainly distributed in Xuanhua, Zhuolu and Yuxian, plus about 4.6 million tons/yr of collectable manure, mainly in Chabei, Saibei, Zhangbei and Yangyuan. Chengde produce about 1.81 million tons/yr of collectable straw, mainly distributed in Longhua, Pingquan and Weichang, along with 1.44 million tons/yr of collectable manure, mainly distributed in Fengning, Luanping and Chengde County. Qinhuangdao produces about 1.32 million tons of collectable straw annually, mainly in Changli and Lulong, as well as about 1.2 million tons/yr of collectable manure, mainly in Funing, Qinglong and Lulong. Tangshan produces about 4.53 million tons/yr of collectable straw, mainly distributed in Yutian, Luannan, Fengrun, Zunhua and Leting, with about 5 million tons/yr of collectable manure, mainly distributed in Luannan, Yutian, Fengrun and Fengnan. Langfang’s annual resource is about 2.98 million tons of collectable straw, mainly distributed in Wen'an, Gu'an and Dacheng, plus about 1.75 million tons/yr of collectable manure, mainly distributed in Yongqing, Sanhe, Wen'an and Anci. Baoding produces about 6.73 million tons of collectable straw annually,
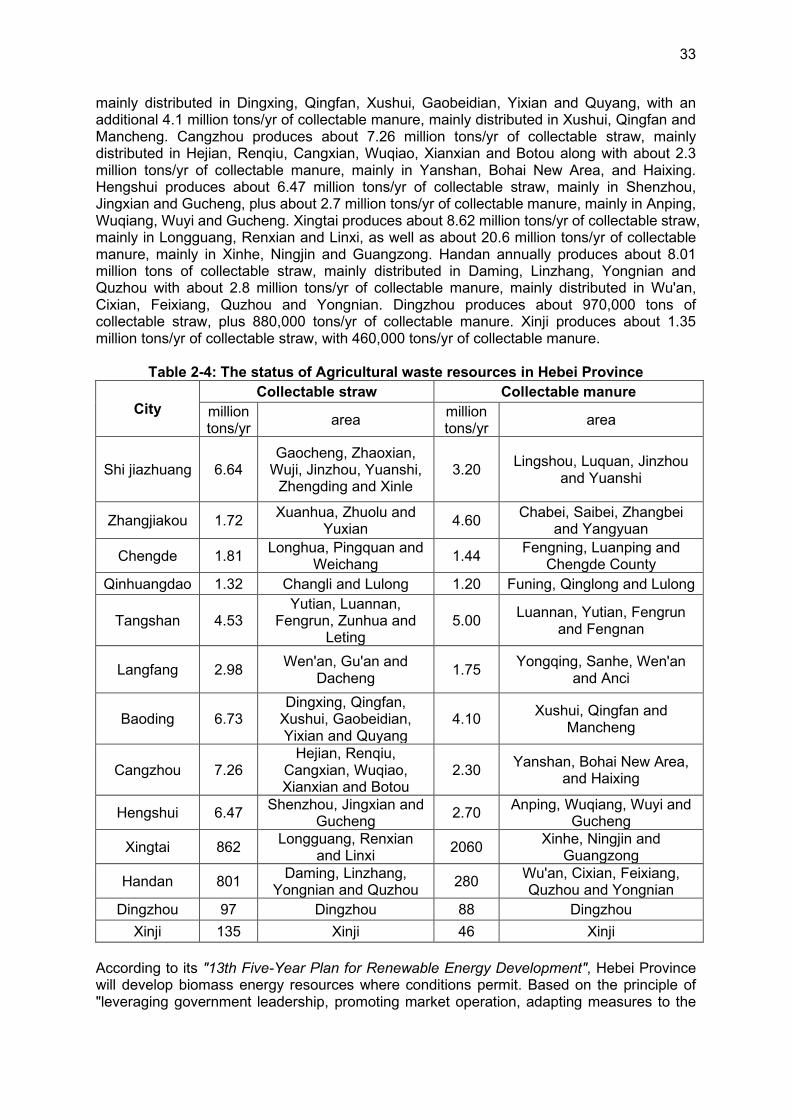
33
mainly distributed in Dingxing, Qingfan, Xushui, Gaobeidian, Yixian and Quyang, with an additional 4.1 million tons/yr of collectable manure, mainly distributed in Xushui, Qingfan and Mancheng. Cangzhou produces about 7.26 million tons/yr of collectable straw, mainly distributed in Hejian, Renqiu, Cangxian, Wuqiao, Xianxian and Botou along with about 2.3 million tons/yr of collectable manure, mainly in Yanshan, Bohai New Area, and Haixing. Hengshui produces about 6.47 million tons/yr of collectable straw, mainly in Shenzhou, Jingxian and Gucheng, plus about 2.7 million tons/yr of collectable manure, mainly in Anping, Wuqiang, Wuyi and Gucheng. Xingtai produces about 8.62 million tons/yr of collectable straw, mainly in Longguang, Renxian and Linxi, as well as about 20.6 million tons/yr of collectable manure, mainly in Xinhe, Ningjin and Guangzong. Handan annually produces about 8.01 million tons of collectable straw, mainly distributed in Daming, Linzhang, Yongnian and Quzhou with about 2.8 million tons/yr of collectable manure, mainly distributed in Wu'an, Cixian, Feixiang, Quzhou and Yongnian. Dingzhou produces about 970,000 tons of collectable straw, plus 880,000 tons/yr of collectable manure. Xinji produces about 1.35 million tons/yr of collectable straw, with 460,000 tons/yr of collectable manure.
Table 2-4: The status of Agricultural waste resources in Hebei Province
City Collectable straw Collectable manure
million tons/yr
area million tons/yr
area
Shi jiazhuang 6.64 Gaocheng, Zhaoxian,
Wuji, Jinzhou, Yuanshi, Zhengding and Xinle
3.20 Lingshou, Luquan, Jinzhou
and Yuanshi
Zhangjiakou 1.72 Xuanhua, Zhuolu and
Yuxian 4.60
Chabei, Saibei, Zhangbei and Yangyuan
Chengde 1.81 Longhua, Pingquan and
Weichang 1.44
Fengning, Luanping and Chengde County
Qinhuangdao 1.32 Changli and Lulong 1.20 Funing, Qinglong and Lulong
Tangshan 4.53 Yutian, Luannan,
Fengrun, Zunhua and Leting
5.00 Luannan, Yutian, Fengrun
and Fengnan
Langfang 2.98 Wen'an, Gu'an and
Dacheng 1.75
Yongqing, Sanhe, Wen'an and Anci
Baoding 6.73 Dingxing, Qingfan,
Xushui, Gaobeidian, Yixian and Quyang
4.10 Xushui, Qingfan and
Mancheng
Cangzhou 7.26 Hejian, Renqiu,
Cangxian, Wuqiao, Xianxian and Botou
2.30 Yanshan, Bohai New Area,
and Haixing
Hengshui 6.47 Shenzhou, Jingxian and
Gucheng 2.70
Anping, Wuqiang, Wuyi and Gucheng
Xingtai 862 Longguang, Renxian
and Linxi 2060
Xinhe, Ningjin and Guangzong
Handan 801 Daming, Linzhang,
Yongnian and Quzhou 280
Wu'an, Cixian, Feixiang, Quzhou and Yongnian
Dingzhou 97 Dingzhou 88 Dingzhou
Xinji 135 Xinji 46 Xinji According to its "13th Five-Year Plan for Renewable Energy Development", Hebei Province will develop biomass energy resources where conditions permit. Based on the principle of "leveraging government leadership, promoting market operation, adapting measures to the
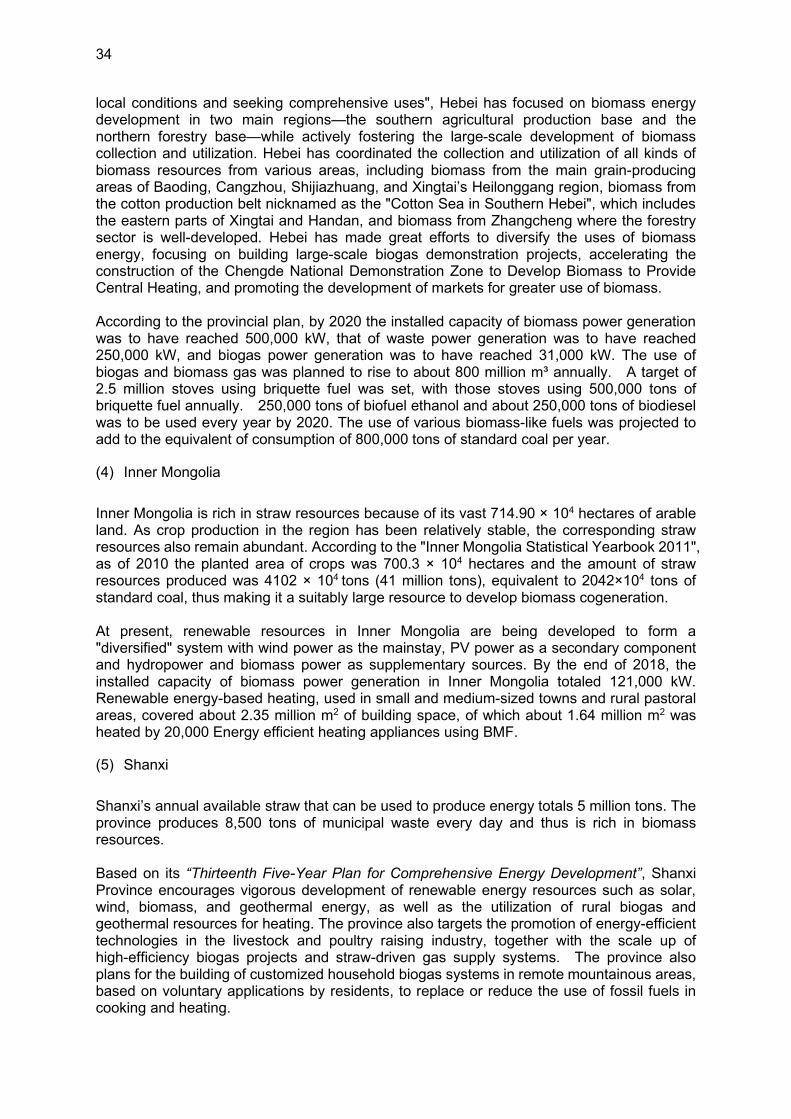
34
local conditions and seeking comprehensive uses", Hebei has focused on biomass energy development in two main regions—the southern agricultural production base and the northern forestry base—while actively fostering the large-scale development of biomass collection and utilization. Hebei has coordinated the collection and utilization of all kinds of biomass resources from various areas, including biomass from the main grain-producing areas of Baoding, Cangzhou, Shijiazhuang, and Xingtai’s Heilonggang region, biomass from the cotton production belt nicknamed as the "Cotton Sea in Southern Hebei", which includes the eastern parts of Xingtai and Handan, and biomass from Zhangcheng where the forestry sector is well-developed. Hebei has made great efforts to diversify the uses of biomass energy, focusing on building large-scale biogas demonstration projects, accelerating the construction of the Chengde National Demonstration Zone to Develop Biomass to Provide Central Heating, and promoting the development of markets for greater use of biomass. According to the provincial plan, by 2020 the installed capacity of biomass power generation was to have reached 500,000 kW, that of waste power generation was to have reached 250,000 kW, and biogas power generation was to have reached 31,000 kW. The use of biogas and biomass gas was planned to rise to about 800 million m³ annually. A target of 2.5 million stoves using briquette fuel was set, with those stoves using 500,000 tons of briquette fuel annually. 250,000 tons of biofuel ethanol and about 250,000 tons of biodiesel was to be used every year by 2020. The use of various biomass-like fuels was projected to add to the equivalent of consumption of 800,000 tons of standard coal per year.
(4) Inner Mongolia
Inner Mongolia is rich in straw resources because of its vast 714.90 × 10⁴ hectares of arable land. As crop production in the region has been relatively stable, the corresponding straw resources also remain abundant. According to the "Inner Mongolia Statistical Yearbook 2011", as of 2010 the planted area of crops was 700.3 × 10⁴ hectares and the amount of straw resources produced was 4102 × 104 tons (41 million tons), equivalent to 2042×104 tons of standard coal, thus making it a suitably large resource to develop biomass cogeneration. At present, renewable resources in Inner Mongolia are being developed to form a "diversified" system with wind power as the mainstay, PV power as a secondary component and hydropower and biomass power as supplementary sources. By the end of 2018, the installed capacity of biomass power generation in Inner Mongolia totaled 121,000 kW. Renewable energy-based heating, used in small and medium-sized towns and rural pastoral areas, covered about 2.35 million m2 of building space, of which about 1.64 million m2 was heated by 20,000 Energy efficient heating appliances using BMF.
(5) Shanxi
Shanxi’s annual available straw that can be used to produce energy totals 5 million tons. The province produces 8,500 tons of municipal waste every day and thus is rich in biomass resources. Based on its “Thirteenth Five-Year Plan for Comprehensive Energy Development”, Shanxi Province encourages vigorous development of renewable energy resources such as solar, wind, biomass, and geothermal energy, as well as the utilization of rural biogas and geothermal resources for heating. The province also targets the promotion of energy-efficient technologies in the livestock and poultry raising industry, together with the scale up of high-efficiency biogas projects and straw-driven gas supply systems. The province also plans for the building of customized household biogas systems in remote mountainous areas, based on voluntary applications by residents, to replace or reduce the use of fossil fuels in cooking and heating.
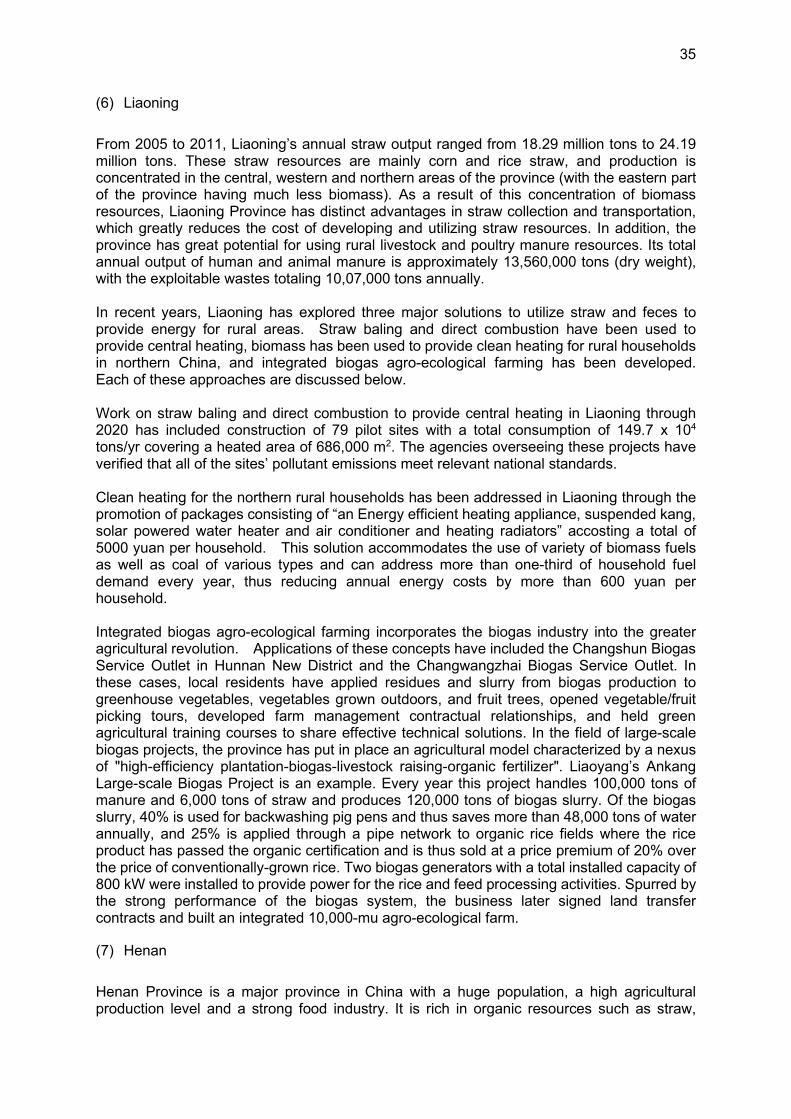
35
(6) Liaoning
From 2005 to 2011, Liaoning’s annual straw output ranged from 18.29 million tons to 24.19 million tons. These straw resources are mainly corn and rice straw, and production is concentrated in the central, western and northern areas of the province (with the eastern part of the province having much less biomass). As a result of this concentration of biomass resources, Liaoning Province has distinct advantages in straw collection and transportation, which greatly reduces the cost of developing and utilizing straw resources. In addition, the province has great potential for using rural livestock and poultry manure resources. Its total annual output of human and animal manure is approximately 13,560,000 tons (dry weight), with the exploitable wastes totaling 10,07,000 tons annually. In recent years, Liaoning has explored three major solutions to utilize straw and feces to provide energy for rural areas. Straw baling and direct combustion have been used to provide central heating, biomass has been used to provide clean heating for rural households in northern China, and integrated biogas agro-ecological farming has been developed. Each of these approaches are discussed below. Work on straw baling and direct combustion to provide central heating in Liaoning through 2020 has included construction of 79 pilot sites with a total consumption of 149.7 x 10⁴ tons/yr covering a heated area of 686,000 m2. The agencies overseeing these projects have verified that all of the sites’ pollutant emissions meet relevant national standards. Clean heating for the northern rural households has been addressed in Liaoning through the promotion of packages consisting of “an Energy efficient heating appliance, suspended kang, solar powered water heater and air conditioner and heating radiators” accosting a total of 5000 yuan per household. This solution accommodates the use of variety of biomass fuels as well as coal of various types and can address more than one-third of household fuel demand every year, thus reducing annual energy costs by more than 600 yuan per household. Integrated biogas agro-ecological farming incorporates the biogas industry into the greater agricultural revolution. Applications of these concepts have included the Changshun Biogas Service Outlet in Hunnan New District and the Changwangzhai Biogas Service Outlet. In these cases, local residents have applied residues and slurry from biogas production to greenhouse vegetables, vegetables grown outdoors, and fruit trees, opened vegetable/fruit picking tours, developed farm management contractual relationships, and held green agricultural training courses to share effective technical solutions. In the field of large-scale biogas projects, the province has put in place an agricultural model characterized by a nexus of "high-efficiency plantation-biogas-livestock raising-organic fertilizer". Liaoyang’s Ankang Large-scale Biogas Project is an example. Every year this project handles 100,000 tons of manure and 6,000 tons of straw and produces 120,000 tons of biogas slurry. Of the biogas slurry, 40% is used for backwashing pig pens and thus saves more than 48,000 tons of water annually, and 25% is applied through a pipe network to organic rice fields where the rice product has passed the organic certification and is thus sold at a price premium of 20% over the price of conventionally-grown rice. Two biogas generators with a total installed capacity of 800 kW were installed to provide power for the rice and feed processing activities. Spurred by the strong performance of the biogas system, the business later signed land transfer contracts and built an integrated 10,000-mu agro-ecological farm.
(7) Henan
Henan Province is a major province in China with a huge population, a high agricultural production level and a strong food industry. It is rich in organic resources such as straw,
36
livestock and poultry manure, municipal solid waste, and industrial organic waste. In 2015, the province produced an estimated 101.5 million tons of straw, of which 82 million tons were collectable. The comprehensive use of various types of straw reached 69.7 million tons, indicating an actual utilization rate of 85%. Of the straw used, 33.28 million tons were used as fertilizer, 20.11 million tons were used as feed, and only 4.232 million tons were used as fuel. Given the amount of straw used as fuel only accounted for 5% of the total collectable straw, a large potential use of straw for biomass energy exists in Henan, which could serve as a solid foundation for the future development of agricultural and forestry biomass energy. Henan Province has a large population and naturally generates a large amount of domestic waste. With increasingly improved living standards, Henan has managed to set up a garbage collection, transportation and treatment system that covers both urban and rural areas. It is estimated that by the end of the 13th five-year period, Henan will report a significant increase in the amount transported garbage, and the use of waste incineration to generate power holds great potential for further development.
(8) Shandong
Shandong Province is a major agricultural and forestry province with a large amount of biomass resources. According to available statistics, the province's annual production of straw, forest residues, livestock and poultry manure, waste and other biomass resources are equivalent to about 147 million tce. After considering factors such as the losses in biomass collection and transportation and other existing uses of these residues, the province's biomass resources available for energy generation are estimated to be equivalent to about 45 million tce annually. By the end of 2018, the cumulative grid-connected installed capacity of biomass power generation in Shandong Province was 2.6291 million kW, ranking first in the country. Among the total power generated, agricultural and forestry biomass power generation contributed 1.479 million kW, waste power generation 1.075 million kW, and biogas 75,000 kW.
37
Chapter 3: The Energy Consumption Status Quo in the GBTH and Its Environmental
Impact Located between 31°N to 43°N, the GBTH region has a typical temperate monsoon climate characterized by cold winter days. This climate makes the region a key area for central heating in China. Its dense rural population, intense energy consumption and massive pollutant emissions necessitate a rigorous analysis on the status quo, structure and characteristics of the rural energy consumption in this region with the purpose of establishing a scientific and rational future energy consumption mix and ultimately deploying energy supply and demand technologies resulting in the improvement of local air quality.
3.1 The Status Quo of Rural Energy Consumption
Energy in the rural areas is not only a vital resource that secures agricultural production and farmers’ livelihood, but also serves as the material basis for the building of an all-around well-off society. Rural energy consumption can be divided into two types depending on their purposes. Domestic energy consumption refers to the energy consumed in daily household activities such as cooking, heating and lighting. The required resources for these end uses include traditional biomass energy (firewood and straw), renewable energy (biogas and solar energy) and commodity energy (coal, electricity, natural gas, coal gas and liquified petroleum gas (LPG)). Production energy consumption refers to the energy consumed in agricultural activities such as planting, livestock raising and the pretreating of farm products in the place of origin. The required resources for these activities include commodity energy (coal, coke, refined oil and electricity) and non-commodity energy (straw and firewood). The discussion of rural energy consumption below is focused on domestic energy consumption.
3.1.1 Changes in rural energy consumption in GBTH
Overall rural energy consumption in GBTH during the period 1992 to 2017 did not grow smoothly, but showed a general trend of increasing until 2015, and then declining significantly (see Figure 3-1). Total rural consumption reached a near peak in 2006, then changed relatively little before peaking at 176.045 Mtce (million tons of coal equivalent) in 2015. After 2017 total rural consumption decreased rapidly to 94.723 Mtce in 2017, with the rapid decline mainly attributable to the replacement of traditional fuels (straw and firewood) by high-grade energy sources (natural gas and electricity) that met end-uses such as heating, cooking, and agricultural goods processing with a significantly higher energy efficiency.
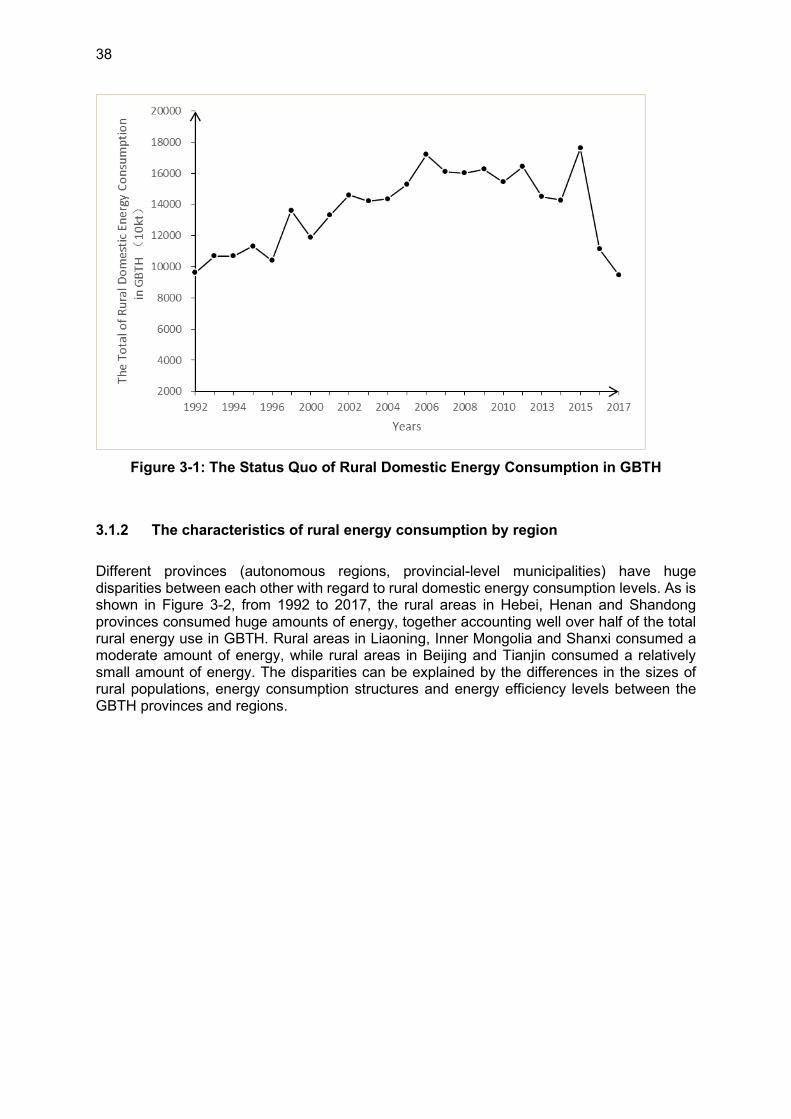
38
Figure 3-1: The Status Quo of Rural Domestic Energy Consumption in GBTH
3.1.2 The characteristics of rural energy consumption by region
Different provinces (autonomous regions, provincial-level municipalities) have huge disparities between each other with regard to rural domestic energy consumption levels. As is shown in Figure 3-2, from 1992 to 2017, the rural areas in Hebei, Henan and Shandong provinces consumed huge amounts of energy, together accounting well over half of the total rural energy use in GBTH. Rural areas in Liaoning, Inner Mongolia and Shanxi consumed a moderate amount of energy, while rural areas in Beijing and Tianjin consumed a relatively small amount of energy. The disparities can be explained by the differences in the sizes of rural populations, energy consumption structures and energy efficiency levels between the GBTH provinces and regions.
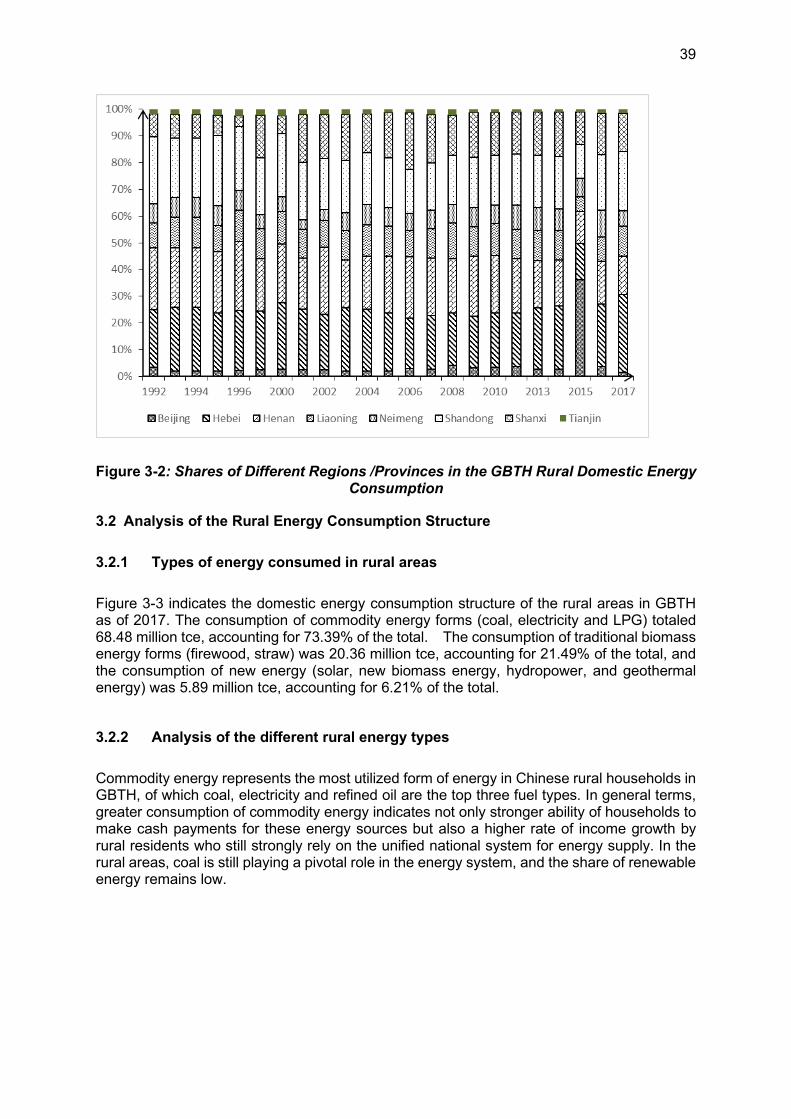
39
Figure 3-2: Shares of Different Regions /Provinces in the GBTH Rural Domestic Energy Consumption
3.2 Analysis of the Rural Energy Consumption Structure
3.2.1 Types of energy consumed in rural areas
Figure 3-3 indicates the domestic energy consumption structure of the rural areas in GBTH as of 2017. The consumption of commodity energy forms (coal, electricity and LPG) totaled 68.48 million tce, accounting for 73.39% of the total. The consumption of traditional biomass energy forms (firewood, straw) was 20.36 million tce, accounting for 21.49% of the total, and the consumption of new energy (solar, new biomass energy, hydropower, and geothermal energy) was 5.89 million tce, accounting for 6.21% of the total.
3.2.2 Analysis of the different rural energy types
Commodity energy represents the most utilized form of energy in Chinese rural households in GBTH, of which coal, electricity and refined oil are the top three fuel types. In general terms, greater consumption of commodity energy indicates not only stronger ability of households to make cash payments for these energy sources but also a higher rate of income growth by rural residents who still strongly rely on the unified national system for energy supply. In the rural areas, coal is still playing a pivotal role in the energy system, and the share of renewable energy remains low.
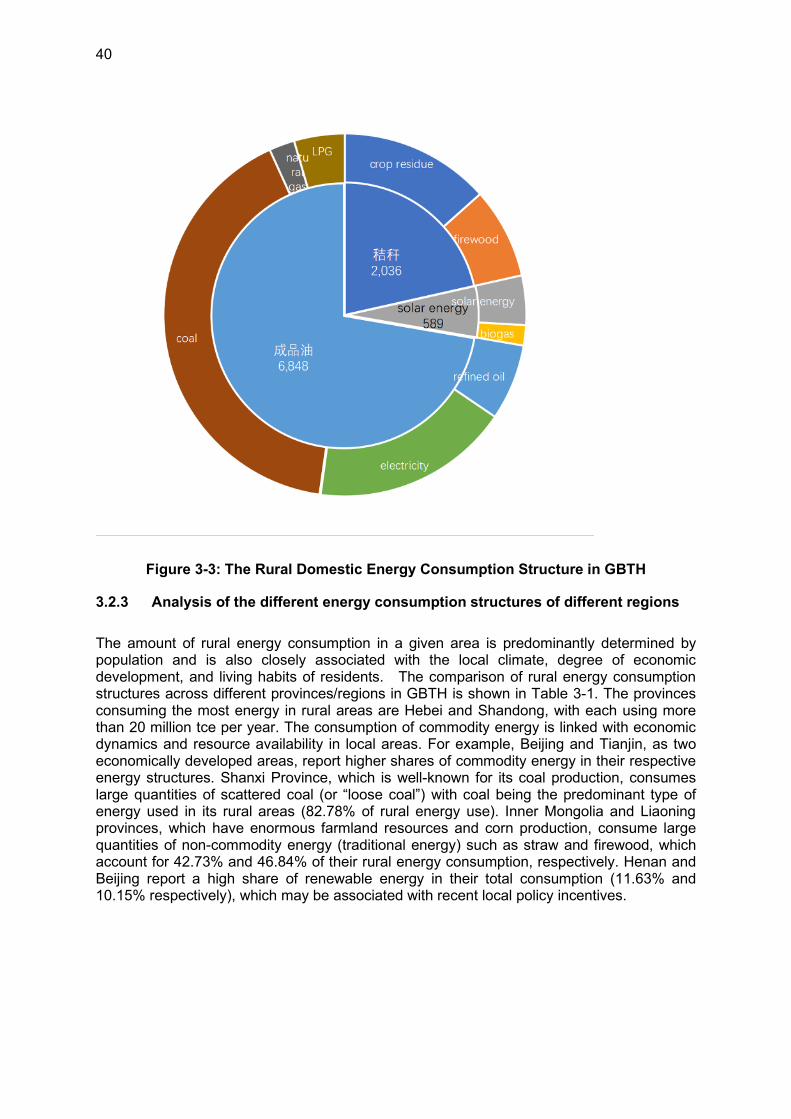
40
Figure 3-3: The Rural Domestic Energy Consumption Structure in GBTH
3.2.3 Analysis of the different energy consumption structures of different regions
The amount of rural energy consumption in a given area is predominantly determined by population and is also closely associated with the local climate, degree of economic development, and living habits of residents. The comparison of rural energy consumption structures across different provinces/regions in GBTH is shown in Table 3-1. The provinces consuming the most energy in rural areas are Hebei and Shandong, with each using more than 20 million tce per year. The consumption of commodity energy is linked with economic dynamics and resource availability in local areas. For example, Beijing and Tianjin, as two economically developed areas, report higher shares of commodity energy in their respective energy structures. Shanxi Province, which is well-known for its coal production, consumes large quantities of scattered coal (or “loose coal”) with coal being the predominant type of energy used in its rural areas (82.78% of rural energy use). Inner Mongolia and Liaoning provinces, which have enormous farmland resources and corn production, consume large quantities of non-commodity energy (traditional energy) such as straw and firewood, which account for 42.73% and 46.84% of their rural energy consumption, respectively. Henan and Beijing report a high share of renewable energy in their total consumption (11.63% and 10.15% respectively), which may be associated with recent local policy incentives.
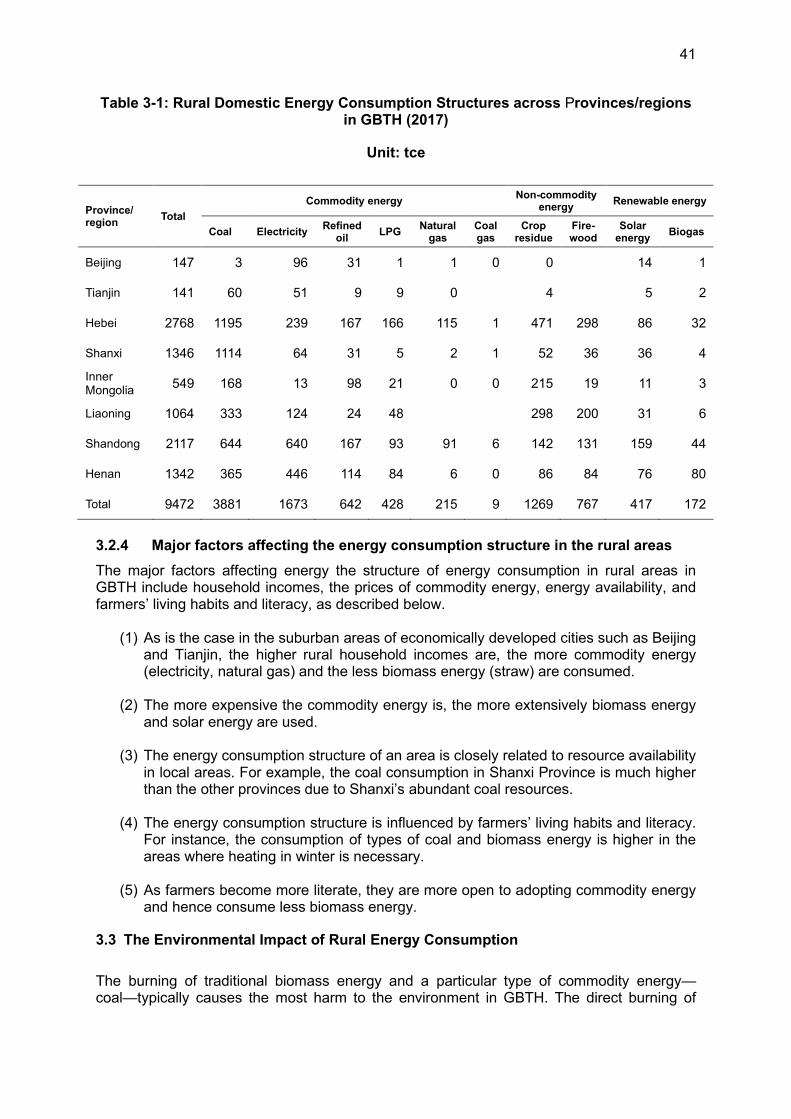
41
Table 3-1: Rural Domestic Energy Consumption Structures across Provinces/regions in GBTH (2017)
Unit: tce
Province/ region
Total
Commodity energy Non-commodity
energy Renewable energy
Coal Electricity Refined
oil LPG
Natural gas
Coal gas
Crop residue
Fire-wood
Solar energy
Biogas
Beijing 147 3 96 31 1 1 0 0 14 1
Tianjin 141 60 51 9 9 0 4 5 2
Hebei 2768 1195 239 167 166 115 1 471 298 86 32
Shanxi 1346 1114 64 31 5 2 1 52 36 36 4
Inner Mongolia 549 168 13 98 21 0 0 215 19 11 3
Liaoning 1064 333 124 24 48 298 200 31 6
Shandong 2117 644 640 167 93 91 6 142 131 159 44
Henan 1342 365 446 114 84 6 0 86 84 76 80
Total 9472 3881 1673 642 428 215 9 1269 767 417 172
3.2.4 Major factors affecting the energy consumption structure in the rural areas
The major factors affecting energy the structure of energy consumption in rural areas in GBTH include household incomes, the prices of commodity energy, energy availability, and farmers’ living habits and literacy, as described below.
(1) As is the case in the suburban areas of economically developed cities such as Beijing and Tianjin, the higher rural household incomes are, the more commodity energy (electricity, natural gas) and the less biomass energy (straw) are consumed.
(2) The more expensive the commodity energy is, the more extensively biomass energy and solar energy are used.
(3) The energy consumption structure of an area is closely related to resource availability in local areas. For example, the coal consumption in Shanxi Province is much higher than the other provinces due to Shanxi’s abundant coal resources.
(4) The energy consumption structure is influenced by farmers’ living habits and literacy. For instance, the consumption of types of coal and biomass energy is higher in the areas where heating in winter is necessary.
(5) As farmers become more literate, they are more open to adopting commodity energy and hence consume less biomass energy.
3.3 The Environmental Impact of Rural Energy Consumption
The burning of traditional biomass energy and a particular type of commodity energy— coal—typically causes the most harm to the environment in GBTH. The direct burning of
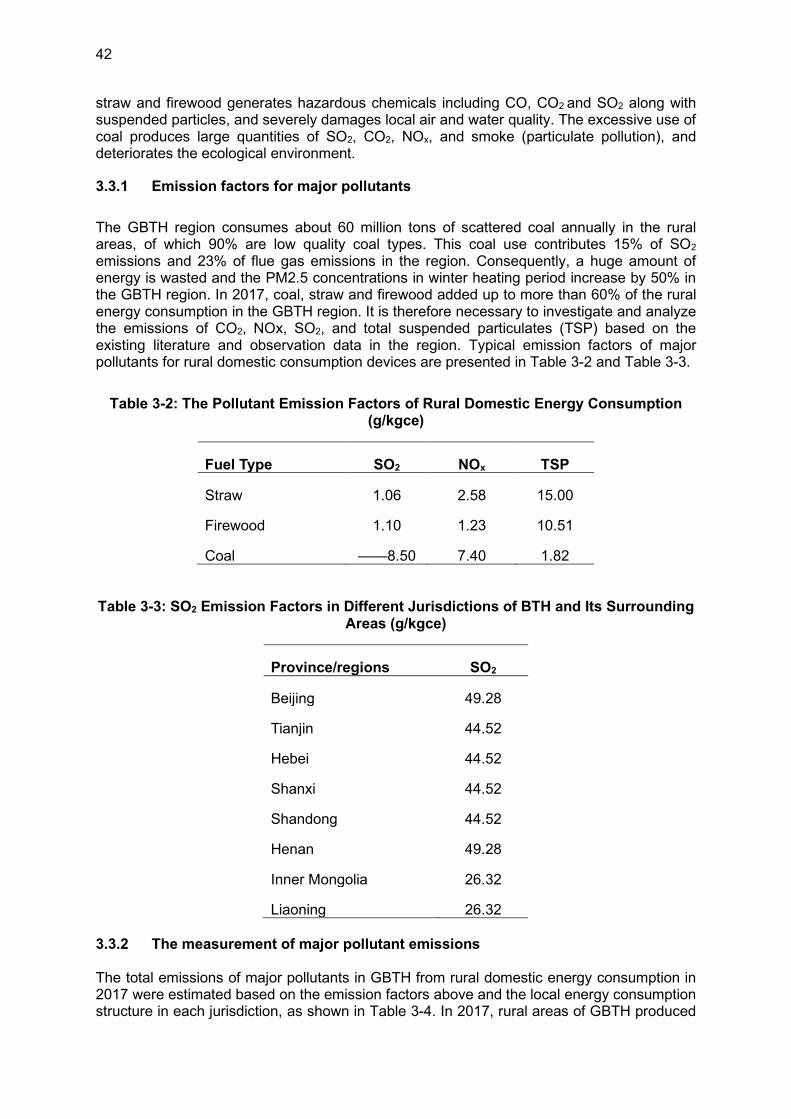
42
straw and firewood generates hazardous chemicals including CO, CO2 and SO2 along with suspended particles, and severely damages local air and water quality. The excessive use of coal produces large quantities of SO2, CO2, NOx, and smoke (particulate pollution), and deteriorates the ecological environment.
3.3.1 Emission factors for major pollutants
The GBTH region consumes about 60 million tons of scattered coal annually in the rural areas, of which 90% are low quality coal types. This coal use contributes 15% of SO2
emissions and 23% of flue gas emissions in the region. Consequently, a huge amount of energy is wasted and the PM2.5 concentrations in winter heating period increase by 50% in the GBTH region. In 2017, coal, straw and firewood added up to more than 60% of the rural energy consumption in the GBTH region. It is therefore necessary to investigate and analyze the emissions of CO2, NOx, SO2, and total suspended particulates (TSP) based on the existing literature and observation data in the region. Typical emission factors of major pollutants for rural domestic consumption devices are presented in Table 3-2 and Table 3-3.
Table 3-2: The Pollutant Emission Factors of Rural Domestic Energy Consumption (g/kgce)
Fuel Type SO2 NOx TSP
Straw 1.06 2.58 15.00
Firewood 1.10 1.23 10.51
Coal ——8.50 7.40 1.82
Table 3-3: SO2 Emission Factors in Different Jurisdictions of BTH and Its Surrounding Areas (g/kgce)
Province/regions SO2
Beijing 49.28
Tianjin 44.52
Hebei 44.52
Shanxi 44.52
Shandong 44.52
Henan 49.28
Inner Mongolia 26.32
Liaoning 26.32 3.3.2 The measurement of major pollutant emissions The total emissions of major pollutants in GBTH from rural domestic energy consumption in 2017 were estimated based on the emission factors above and the local energy consumption structure in each jurisdiction, as shown in Table 3-4. In 2017, rural areas of GBTH produced
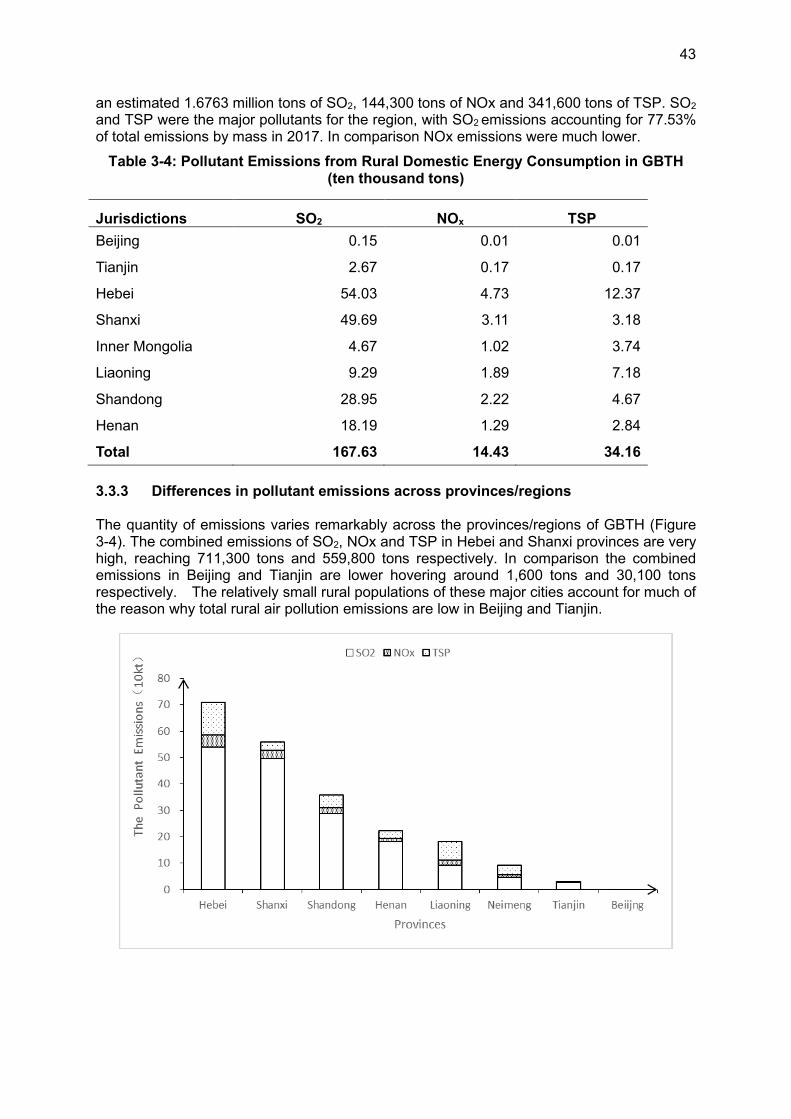
43
an estimated 1.6763 million tons of SO2, 144,300 tons of NOx and 341,600 tons of TSP. SO2 and TSP were the major pollutants for the region, with SO2 emissions accounting for 77.53% of total emissions by mass in 2017. In comparison NOx emissions were much lower.
Table 3-4: Pollutant Emissions from Rural Domestic Energy Consumption in GBTH (ten thousand tons)
Jurisdictions SO2 NOx TSP
Beijing 0.15 0.01 0.01
Tianjin 2.67 0.17 0.17
Hebei 54.03 4.73 12.37
Shanxi 49.69 3.11 3.18
Inner Mongolia 4.67 1.02 3.74
Liaoning 9.29 1.89 7.18
Shandong 28.95 2.22 4.67
Henan 18.19 1.29 2.84
Total 167.63 14.43 34.16
3.3.3 Differences in pollutant emissions across provinces/regions The quantity of emissions varies remarkably across the provinces/regions of GBTH (Figure 3-4). The combined emissions of SO2, NOx and TSP in Hebei and Shanxi provinces are very high, reaching 711,300 tons and 559,800 tons respectively. In comparison the combined emissions in Beijing and Tianjin are lower hovering around 1,600 tons and 30,100 tons respectively. The relatively small rural populations of these major cities account for much of the reason why total rural air pollution emissions are low in Beijing and Tianjin.
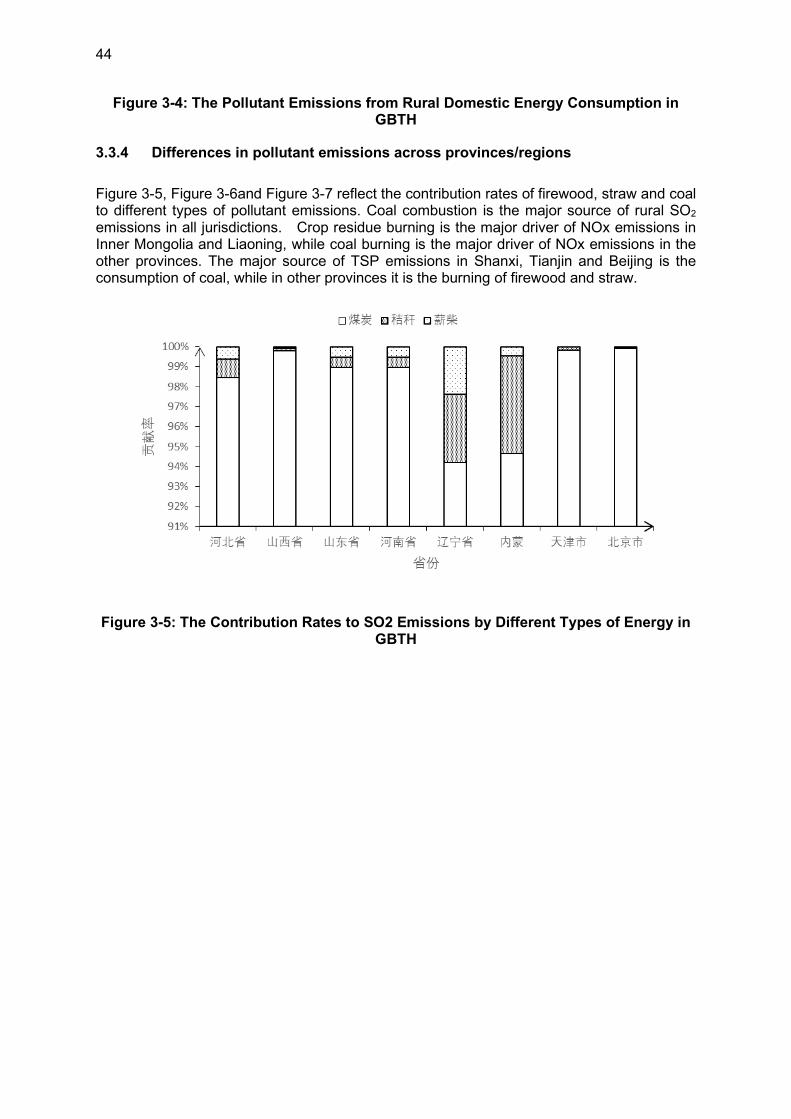
44
Figure 3-4: The Pollutant Emissions from Rural Domestic Energy Consumption in GBTH
3.3.4 Differences in pollutant emissions across provinces/regions
Figure 3-5, Figure 3-6and Figure 3-7 reflect the contribution rates of firewood, straw and coal to different types of pollutant emissions. Coal combustion is the major source of rural SO2 emissions in all jurisdictions. Crop residue burning is the major driver of NOx emissions in Inner Mongolia and Liaoning, while coal burning is the major driver of NOx emissions in the other provinces. The major source of TSP emissions in Shanxi, Tianjin and Beijing is the consumption of coal, while in other provinces it is the burning of firewood and straw.
Figure 3-5: The Contribution Rates to SO2 Emissions by Different Types of Energy in GBTH
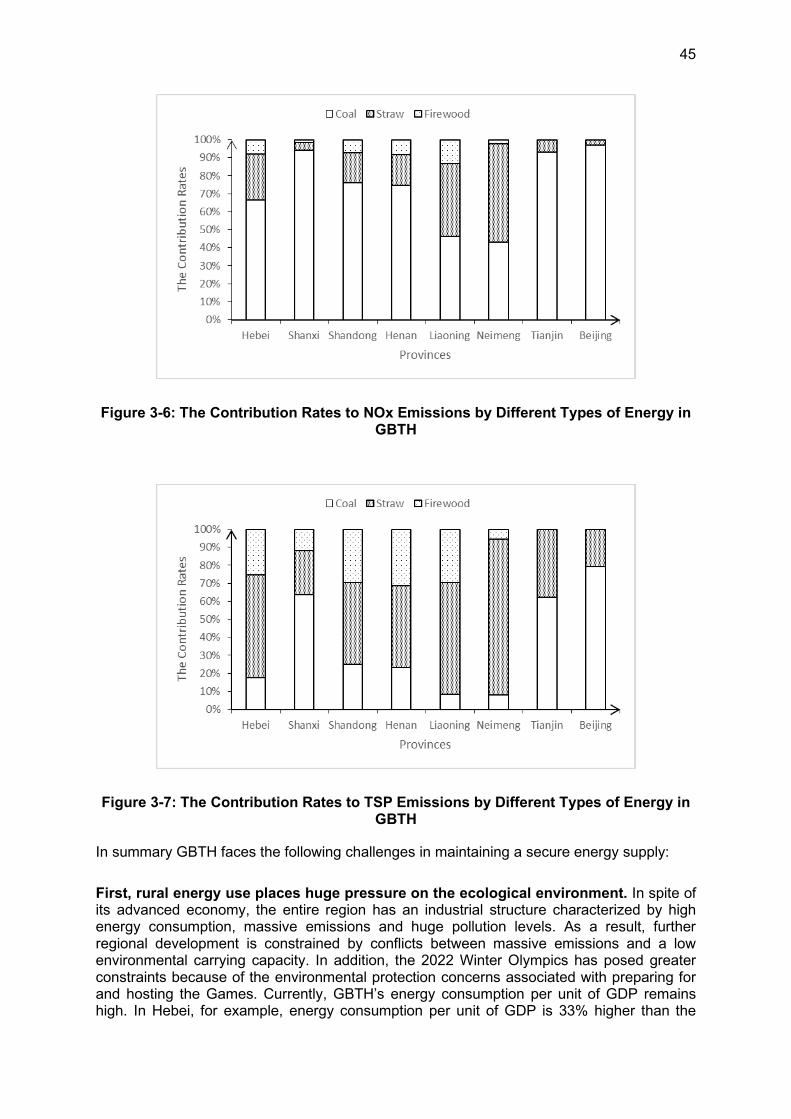
45
Figure 3-6: The Contribution Rates to NOx Emissions by Different Types of Energy in GBTH
Figure 3-7: The Contribution Rates to TSP Emissions by Different Types of Energy in GBTH
In summary GBTH faces the following challenges in maintaining a secure energy supply:
First, rural energy use places huge pressure on the ecological environment. In spite of its advanced economy, the entire region has an industrial structure characterized by high energy consumption, massive emissions and huge pollution levels. As a result, further regional development is constrained by conflicts between massive emissions and a low environmental carrying capacity. In addition, the 2022 Winter Olympics has posed greater constraints because of the environmental protection concerns associated with preparing for and hosting the Games. Currently, GBTH’s energy consumption per unit of GDP remains high. In Hebei, for example, energy consumption per unit of GDP is 33% higher than the
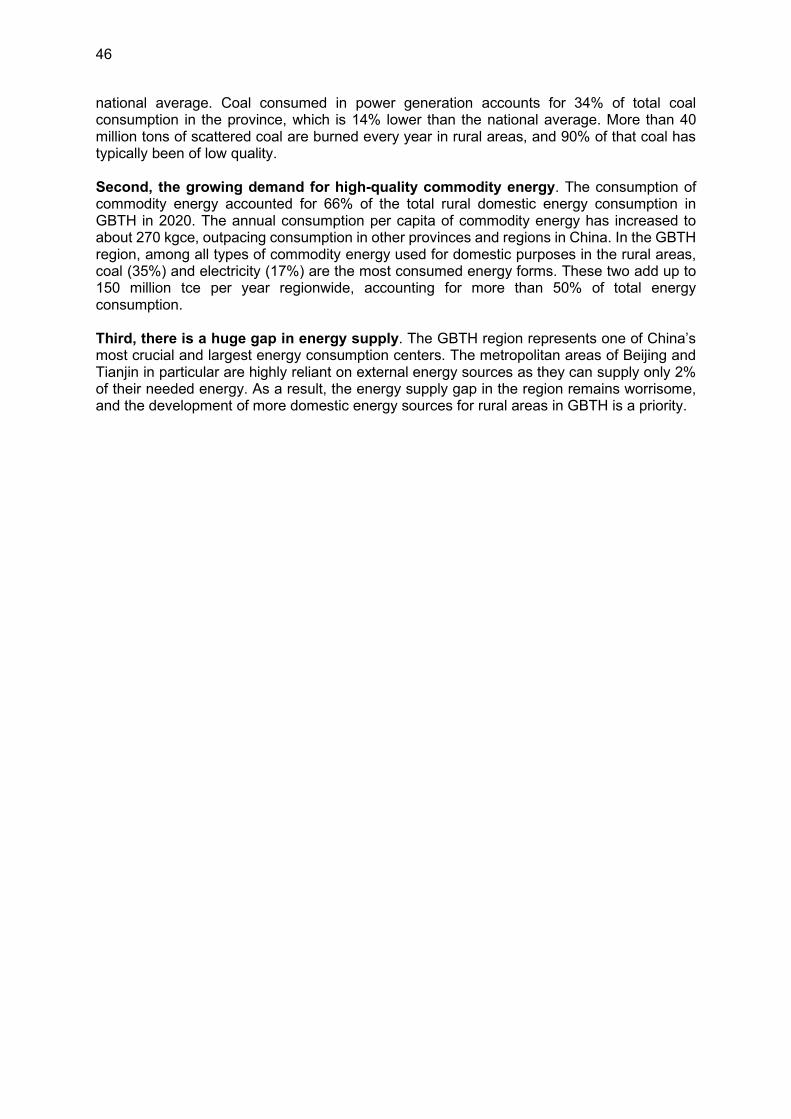
46
national average. Coal consumed in power generation accounts for 34% of total coal consumption in the province, which is 14% lower than the national average. More than 40 million tons of scattered coal are burned every year in rural areas, and 90% of that coal has typically been of low quality. Second, the growing demand for high-quality commodity energy. The consumption of commodity energy accounted for 66% of the total rural domestic energy consumption in GBTH in 2020. The annual consumption per capita of commodity energy has increased to about 270 kgce, outpacing consumption in other provinces and regions in China. In the GBTH region, among all types of commodity energy used for domestic purposes in the rural areas, coal (35%) and electricity (17%) are the most consumed energy forms. These two add up to 150 million tce per year regionwide, accounting for more than 50% of total energy consumption. Third, there is a huge gap in energy supply. The GBTH region represents one of China’s most crucial and largest energy consumption centers. The metropolitan areas of Beijing and Tianjin in particular are highly reliant on external energy sources as they can supply only 2% of their needed energy. As a result, the energy supply gap in the region remains worrisome, and the development of more domestic energy sources for rural areas in GBTH is a priority.
47
Chapter 4: Evaluation of Policies for Developing Clean Energy in the GBTH Region Development of renewable energy sources has become a key pathway for China to realize its energy transition and to mitigate climate change. Since the enactment of The Renewable Energy Law in 2006, China has made remarkable progress in developing renewable energy. Renewable energy as a share of the overall national energy mix, however, remains small, and China is faced with many challenges in its journey towards sustainable development. The GBTH is an economically developed region where the industrial structure is characterized by high energy consumption, high emissions and heavy pollution levels. Consequently, further growth in GBTH is severely restrained by its huge pollutant emissions and its limited environmental carrying capacity. In recent years, the region has introduced many rural energy policies and measures designed to gradually shift towards a green development direction that underlines air pollution control, mitigates greenhouse gas emissions, strives to enhance climate change mitigation and adaptation capabilities, explicitly sets a goal of adjusting and optimizing the regional energy structure, and vigorously develops clean energy. Through fiscal support, price subsidies, government procurement and tax incentives, the region has forcefully advanced the “coal-to-gas” and “coal-to-electricity” transition to reduce uncontrolled coal combustion, encouraged the utilization of renewable energy sources like solar, biomass, geothermal and aerothermal (air-source heat pump) energies, and promoted new heating models in the rural areas of northern China where multiple energy sources can coexist and supplement each other.
4.1 Policy Type: Plans
Since the enactment of The Renewable Energy Law, China has released and implemented a series of development plans including the Medium and Long Term Development Plan for Renewable Energy, the Twelfth Five-Year Plan for Renewable Energy Development, the Twelfth Five-Year Comprehensive Work Plan for Energy Efficiency and Emission Reduction and the Agricultural Biomass Energy Industry Development Plan (2007-2015), outlining national support for the development of renewable energy with specified goals and expectation with regards to the share of renewable energy in the overall energy system. In December 2016, General Secretary Xi Jinping, during the 14th Meeting of the Central Leading Group for Financial and Economic Affairs, stressed that “all the six issues including the promotion of clean heating in winter in northern China are important issues. They have a significant bearing on the living conditions of the general public and thus to satisfy the public needs in these areas holds tremendous value and demonstrates our attitudes of ’for the people and by the people’. Promoting clean heating in northern China is not only significant to ensure a warm indoor environment in winter, but also integral to the campaign to reduce smog and crucial to the effort to revolutionize energy production and consumption and the rural lifestyle. In accordance with the guiding principle that transition programs should be mainly implemented by enterprises, guided by the government, and affordable for residents, natural gas or electricity should be applied where suitable to raise the share of clean heating as much as possible.32”
4.2 Policy Type: Restrictions
A summary of national and GBTH provincial policies restricting coal use is provided below.
In September 2013, the State Council issued Air Pollution Prevention and Control Action Plan (hereinafter referred to as the “Ten Measures to Improve Air Quality”), which explicitly set up the goals to reduce the use of or replace small coal-fired boilers, accelerate the shift in the
32 http://tv.cctv.com/2016/12/21/VIDELRRBDthhgIPNQWszXYPR161221.shtml
48
energy structure toward cleaner fuels, increase the supply of natural gas and other clean energy forms, and advance the construction of centralized heating, “coal-to-gas” and “coal-to-electricity” projects. In areas that cannot be served by natural gas transmission networks, electricity, new energy forms, or clean coal should be used for rural heating, and the use of energy-efficient and environmentally friendly boilers should be promoted. In addition, the utilization of natural gas should be optimized, and priority should be given to residential demand or coal replacement needs when newly increased supplies of natural gas are allocated. In February 2017, the National Development and Reform Commission (NDRC) and three other governmental bodies jointly issued the 2017 Work Plan for Air Pollution Prevention and Control in the Greater Beijing-Tianjin-Hebei (GBTH) Region, which identifies the “2+26” cities as the first to implement clean heating planning in China’s northern regions. The Work Plan aims to comprehensively strengthen treatment of coal used by residents and small businesses in villages, cities, urban fringes, and rural areas, complete the construction of “no-coal zones” in Beijing, Tianjin, Langfang and Baoding, replace coal with natural gas or electricity in other cities, and increase the exploitation of industrial low-grade waste heat and geothermal energy. In June 2018, the NDRC issued the Three-Year Action Plan for Winning the Blue Sky War, which set clear targets including huge reductions of total emissions of major air pollutants, coordination in reducing emissions of greenhouse gases, decreasing the number of days with heavy air pollution and providing marked improvements in air quality. By the heating season of 2020, in the plains areas in GBTH and the Fenwei Plain, loose coal was to have been substituted for by cleaner fuels in daily household consumption, including for winter heating. In September 2013, the Beijing Government published the Implementation Plan of Coal Reduction and Replacement in Rural Beijing for Clean Air 2013 and the Clean Air Action Plan of Beijing (2013-2017), which proposed a series of projects and measures for rural areas including using high-quality coal, promoting switching from coal to electricity, utilizing solar thermal energy and biogas energy, and providing incentives for coal use reduction and replacement. In August 2018, the People’s Government of Tianjin Municipality released the Three-Year Operation Plan for Winning the Blue-Sky War (2018-2020), which set up goals to eliminate the practices of burning loose coal for heating by urban and rural residents except in the mountainous areas where conditions are poor or in houses that are scheduled to be demolished soon (and thus where investments in new heating systems are impractical). To do so, the municipality, through establishment of new combined heat and power (CHP) plants, and switching coal-fired heating to use electricity, gas, or other systems, is promoting replacement of loose coal use with clean energy in the remaining 756,000 rural households that used loose coal as of 2018 in a steady and orderly manner. For those without access to clean heating options, supplies of low-emissions anthracitic coal were to be guaranteed. In September 2016, the People’s Government of Hebei Province formulated Guiding Opinions on Accelerating the Coal for Electricity/Gas Shift to Build the No-coal Zones of Baoding and Langfang, proposing that the areas in Baoding and Langfang east of the Beijing-Kunming Expressway and north of the Rongcheng-Wuhai Expressway that border Beijing and Tianjin, as well as all of Sanhe City, the Dachang Hui Autonomous County and Xianghe County, be designated as “No-coal Zones.” The Guiding Opinions required that by the end of October 2017, except for the use of coal for power generation, central heating and as raw material in the coal chemical industry, coal use should be “eliminated” In those areas. “No-coal Zones” cover 18 counties, cities and districts in Baoding and Langfang, including one urban built-up area and 14 counties’ built-up areas. The Guiding Opinions also laid out

49
policies for subsidizing pipelines, equipment, and operation costs of “coal-to-electricity” and “coal-to-gas” projects in the "No-coal Zones.” In April 2017, the People's Government of Hebei Province published the Special Implementation Plan for the Treatment of Loose Coal in Rural Areas of Hebei Province, specifying that by 2020 pollution caused by burning loose coal in the province’s countryside should be fundamentally addressed, with total emissions reduced by more than 90% compared to 2015. “Elimination” of loose coal use should be basically achieved in rural areas in the plains, and the total amount of loose coal used in the remote mountainous regions should be limited to less than 8 million tons per year. Over 70% of the floor area of rural households was targeted to be heated by clean energy, more than 20% of which will be connected to central heating systems. Six million households were to undergo “coal-to-gas” and “coal-to-electricity” substitution, and about 300,000 households were to have switched to the use of multi-source heating systems powered by renewable energy and other fuels. In October 2018, the People’s Government of Liaoning Province released the Three-Year Action Plan for Winning the Blue Sky War (2018-2020), pledging to promote clean heating. The most suitable heating options were to be chosen based on the actual circumstances among electricity, natural gas, coal, or thermal energy to secure a safe and warm indoor environment in winter for the residents. The Action Plan laid out clean heating coverage targets of 40% of households for 2018, 44% for 2019, and 49% for 2020, respectively. In April 2017, the People’s Government of Shanxi Province issued the 2017 Air Pollution Prevention and Control Action Plan, setting the target of “elimination” of fuel coal use in “4+2” cities, namely, Taiyuan, Yangquan, Changzhi, Jincheng, Linfen and Jinzhong. Central heating system coverage in the cities (including county seats) of the province was set to exceed 90% of households and other buildings by the end of 2017. In July 2018, 14 government departments of Shanxi, including its provincial DRC (Development and Reform Commission), jointly issued the Three-Year Action Plan for Winning the Blue Sky War and the Implementation Plan for Clean Heating in Winter, setting targets to markedly reduce of total emissions of major air pollutants, and specifying plans for greater coordination in the reduction of emissions of greenhouse gases and in improvement of air quality. In August 2018, the General Office of the People’s Government of Shandong Province issued Circular on the Work Plan for Coal Consumption Reduction and Replacement (2018-2020), setting the target that by 2020, the province’s total coal consumption should be limited to 368.34 million tons and its clean heating coverage should exceed 70% of households.
4.3 Policy Type: Incentives
A summary of recent policies offering incentives for clean energy use at the national and GBTH provincial levels is provided below. In October 2015, the NDRC and the Ministry of Housing and Urban-Rural Development (MOHURD) jointly issued the Implementation Plan for Projects Utilizing Waste Heat for Residential Heating, encouraging and guiding heating projects to take advantage of low-grade industrial waste heat. This represented the first time that a clear signal was sent by the central government for regarding the use of industrial waste heat. In May 2017, the Ministry of Finance and three other government departments jointly issued the Circular on the Use of Central Public Finance to Support the Clean Heating Pilot Projects in Northern China, promising financial support to accelerate the clean transformation of heat
50
sources in pilot cities, to retrofit coal-fired heating facilities, to promote the use of heat pumps, gas boilers, electric boilers and decentralized electric (gas) heating, and to build new heating models that allow geothermal, aerothermal, solar, biomass, and other renewable energy sources to complement each other in ways that best suit local conditions. Priority will be given to pilot project in the “2+26” cities, with 3-year pilot demonstration periods. The amount of central financial awards and subsidies to be provided was to depend on the size of pilot cites, with an annual 1 billion yuan for municipalities that report directly to the central government, an annual 700 million yuan for provincial capitals, and 500 million yuan per year for prefecture-level cities. In December 2017, the NDRC issued the Plan for Clean Heating during Winter in Northern China (2017-2021), which for the first time specified “clean heating” and proposed measures such as clean thermal sources, efficient transmission, and distribution pipeline systems (heating transmission networks), and energy-efficient buildings (users) to make winter heating cleaner and to reduce air pollutant emissions in the north. In July 2018, the Ministry of Finance, the Ministry of Ecology and Environment, the Ministry of Housing and Urban-Rural Development, and National Energy Administration issued the Circula on Expanding the Use of Central Public Finance to Support the Clean Heating Pilot Projects in Northern China. During the three-year demonstration period, the clean heating coverage in the urban areas of pilot cities is scheduled to reach 100%, and in plains areas, the use of loose coal for heating will be phased out. Energy efficiency standards will be implemented in new residential buildings, and will be increased by another 30% beyond the basis offset by the current national building energy efficiency standards, . All existing buildings in urban areas worthy of being renovated and over 80% of such buildings in the urban-rural continuum and in counties under the jurisdiction of the pilot cities will undergo retrofitting for higher energy efficiency. Financial support by the central government for clean heating pilot programs was extended to Zhangjiakou and cities on the Fenwei Plain, in addition to existing funding for heating measures in the original “2+26” cities. Energy efficiency improvements on buildings in these areas are vital to the success of the air pollution prevention and control initiatives in GBTH. In June 2014, Beijing Municipality issued the 2014 Implementation Plan for Coal Reduction and Replacement in Rural Beijing for Clean Air, proposing to reduce and replace a total of 1.5 million tons of coal consumption annually. Grid transformation and upgrading was scheduled to enhance power supply capacities to benefit 100,000 rural households. A goal of accomplishing a “coal-to-electricity” shift for heating in 50,000 rural households was also set up, as well as a target to complete kitchen coal-to-gas retrofitting in 400,000 rural households. In September 2018, the People’s Government of Inner Mongolia Autonomous Region issued the Implementation Plan for the Three-Year Action Plan for Winning the Blue Sky War, proposing to promote clean heating in winter and to transform the “urban villages” and “shantytowns” to reduce pollution from uncontrolled heating stoves and promote improved living standards. In October 2017, the People’s Government of Liaoning Province issued the Three-Year Revolving Plan for Promoting Clean Heating (2018-2020), which prioritized the development of central heating in towns and cities and required the accelerated implementation of various types of decentralized clean heating systems in places that were not able to access central heating. In the rural areas, under the Plan, priority should be given to geothermal, biomass, solar and other clean energy forms for space heating. Where gas and electricity supplies permit, heating using natural gas or electricity can be promoted. Central heating coverage was also to be expanded to the extent economically reasonable.
51
In November 2016, the People’s Government of Shandong Province issued the Implementation Opinions on Promoting Heating in Rural Areas, proposing to adjust and optimize the energy mix used in the heating of homes and other buildings in rural areas, to promote green and clean energy use for heating, and to encourage the development of rural pilot heating projects through clean coal substitution, or by “coal to electricity” or “coal to gas” shifts. In October 2017, the Department of Ecology and Environment of Shandong Province and four other government organizations jointly issued the Implementation Opinions on Promoting Clean Heating in Cities and Towns throughout the Province and Deepening the Heating Metering Reform, laying out targets to achieve full coverage of clean heating systems in the counties (cities) with a population of 200,000 or more by 2019, and to achieve almost full coverage in all other counties by 2020. In May 2018, the Henan Provincial DRC issued the 2018 Work Plan of Replacing Coal with Electricity and Natural Gas in Heating, aiming to complete energy source substitution in the heating of 1 million households. Based on this plan, great efforts shall be made to replace coal with electricity in heating and in application of heat pumps driven by geothermal, water, or air sources is to be promoted. New heating models such as the combination of air heat pumps and electric storage boilers were to be given priority. A number of decentralized electric heating projects were to be constructed. Decentralized electric heating systems were to be developed in buildings of various types based on local heating conditions and heating resources and infrastructure available, with possible technologies including carbon crystal heating panels, graphene electric heating films, carbon fiber heaters, and air-source heat pumps/air conditioners.
4.4 Policy Type: Taxation and Subsidies
A summary of recent policies focusing on taxation and subsidies for clean energy use at the national and GBTH provincial levels follows. The Renewable Energy Law, a national law, stipulates that preferential loans and taxation policies should be provided to encourage the development of renewable energy resources and technologies. To implement The Renewable Energy Law, a succession of management measures for funds and subsidies have been issued including Measures for the Management of Special Funds for Renewable Energy Development, Interim Management Measures for the Collection and Disposal of Renewable Energy Development Funds, Trial Measures for the Management of Prices and Cost Sharing in Renewable Energy Electricity Generation, Scheme for Tariff Subsidy and Quota Trading of Power Generated from Renewable Energy Sources, and Interim Measures for the Management of Fiscal Subsidies for Application of Solar Photovoltaic in Buildings. The MOF (Ministry of Finance) and other governmental bodies have promulgated a number of tax incentives relevant to clean energy development and implementation, such as the Notice on Further Improving the Feed-in Tariff Policy for Power Generated from Solar Photovoltaic, the Notice on Improving the Price Policies for Photovoltaic Power Generation, the Notice on Using Price Leverage to Promote the Healthy Development of the Photovoltaic Industry, and the Notice on Adjusting the Surcharge Standard of Renewable Energy Tariff. Regional government authorities considered the actual conditions in their jurisdictions and formulated local investment and subsidy policies for “coal-to-gas” and “coal-to-electricity” shifts, and for the “clean winter heating” and “Blue Sky War” initiatives. Those governments also established cross-sector funding mechanisms to quickly increase clean energy supplies for rural areas to ensure the achievement of the policy targets.
52
In October 2015, the Beijing Government issued the Opinions on Perfecting Coal-to-gas and Coal-to-electricity Switch Policies for the Urban Residents in Beijing, specifying the details of subsidy policies corresponding to retrofitting heating systems during the period from 2015 to 2017. In March 2016, the Beijing Government issued the 2016 Work Plan for the Coal-to-clean-energy Transition and Coal Reduction and Replacement in Rural Beijing laying out the target of eliminating coal burning in 400 villages and specifying subsidy policies to provide incentives for installation and operation of clean heating equipment. In February 2017, the Beijing Government issued the 2017 Implementation Plan for Clean Heating in the Winter of Rural Areas, establishing the goal of completing the coal-to-clean-energy transition for the households of 700 villages by 31 October 2017. Another task to be simultaneously undertaken was the substitution of clean energy for coal in 1,400 village committee buildings and rural community centers, and in agricultural facilities with 790,000 square meters (79 hectares) or more of seed cultivation greenhouse. For central heating projects driven by air-source heat pumps, geothermal energy and solar energy, their heat storage facilities were to receive fiscal support to cover 50% of the total installed cost, while the central heating projects driven by gas and electricity received fiscal support to cover 30% of costs. In April 2018, the General Office of Beijing Government issued the 2018 Work Plan for Clean Winter Heating in Rural Beijing, setting the target to substitute clean energy for coal in the households of 450 villages. Also a part of the Plan was a goal to replace coal with clean energy in 450 village committees’ and rural community activity centers and for agricultural facilities associated with seed cultivation fields greater than 53,800 square meters, basically eliminating the use of coal from the villages in the plain areas of Beijing. In November 2017, the Tianjin Government issued the Work Plan for Clean Winter Heating for Tianjin’s Residents and the Allocation Plan of Central Public Finance and Subsidies for Clean Winter Heating to comprehensively promote clean heating for residents and to phase out the use of loose coal in households except in mountainous areas and other places without access to clean heating resources or infrastructure, with anthracitic coal to be used in those areas. In July 2018, Hebei Provincial Government issued the 2018 Work Plan for Clean Winter Heating in Hebei Province, laying out the targets of increasing central heating capacity by 64 million square meters of building space and eliminating 263 coal-fired heating boilers with a total capacity of 2,584 t/h, thus bringing clean heating coverage to 98.8%. The Plan encourages the use of various energy sources such as gas, electricity, solar energy, oil and thermal energy, based on where the use of each is most suitable, promoting the steady growth of gas and fast growth of electricity as substitutes for the use of coal and traditional biomass heating, and supporting the active piloting of photovoltaic+, photoelectric+ and geothermal energy technologies. In April 2016, the Shanxi Provincial Government issued Notice on the Implementation Plan for the Pilot Projects of Coal-to-electricity Switch for Urban and Rural Heating, aiming to gradually replace traditional coal-fired boilers with an increasing proportion of electricity in heat end-uses through pilot projects. The Notice identifies Datong, Taiyuan, Pingyao Ancient City of Jinzhong, and highway service areas (toll management office areas) as the “coal-to-electricity” pilot areas for 2016. In September 2018, nine governmental bodies of the Inner Mongolia Autonomous Region, including the provincial DRC and the Department of Finance, issued the Implementation Plan for Clean Heating in Winter in the Inner Mongolia Autonomous Region, setting a goal of
53
accelerating the promotion of central heating driven by clean coal and gradually eliminating decentralized coal-fired boilers.The Plan also indicates that distributed gas-supply projects should be built to develop gas heating in an orderly manner with such options as the gas-fired combined heat and power (CHP) systems, gas boilers, natural gas-fired distributed electricity generation and wall-hung gas boilers used as needed to best adapt to local conditions. The Plan promotes solar heating systems in residential and public buildings in small and medium-sized towns where conditions are suitable and supports the installation and use of solar water heaters by residents in rural areas and small towns. 4.5 Overall Evaluation In recent years, all the levels of governments from central to local have introduced both restrictions on coal use and supportive policies for clean energy development, thus effectively promoting the development of clean energy and targeting the prevention and control of air pollution. This study, through quantitative and qualitative analysis provides in the following a comprehensive assessment of rural clean energy policies in the GBTH Region based on four aspects: policy effectiveness, feasibility, suitability, and operability.
4.5.1 Evaluation of effectiveness
The effectiveness of clean energy policy instruments is primarily manifested by how much they contribute to achieving the objectives of energy security and environmental protection. To be more specific, in this case, the former is judged by the extent to which the policies raise capacities to develop and utilize renewable energy, spur technological change, increase supplies of clean energy, and promote the development of clean energy industries; while the latter is evaluated by how much the policies assist in reducing carbon emissions and improve the atmospheric environment. Two categories of clean energy policies have been introduced by all levels of government in the GBTH region: incentives for clean energy and restrictions on coal use. The Air Pollution Prevention and Control Action Plan and the 2017 Work Plan for Air Pollution Prevention and Control in the Greater Beijing-Tianjin-Hebei (GBTH) Region established targets to comprehensively address the use of small coal-fired boilers, reduce pollutant emissions, accelerate the shift in energy infrastructure, increase supplies of natural gas and other clean energy forms, and advance the construction of central heating, “coal-to-gas” and “coal-to-electricity” projects. In areas not served by natural gas transmission networks, policies promoted shifts to electricity, new energy forms, or clean coal for heating, as well as encouraging the use of energy-efficient and environmentally friendly boilers. Uses of natural gas were to be optimized and gas supplies were to be increased. Provinces have also issued their respective clean winter heating work plans laying out clear restrictions on coal use and targets for fuel and technology substitution. These policy tools have been very effective in promoting the development and use of solar, biomass and other clean energy sources, and in advancing “coal-to-gas” and “coal-to-electricity” fuel switching projects. What needs to be emphasized, however, is that increased supplies of natural gas, coal gas, and coalbed methane should first be used for residential purposes or as a substitute for direct coal combustion. Deployment of technological measures for efficient energy utilization, for instance, gas-fired distributed generation projects, have not achieved the best possible results due to not sufficiently considering local conditions, especially local resource endowments and living habits. Some measures are even carried out in a “one-size-fits-all” style, resulting, in many cases, in poorly targeted implementation.
4.5.2 Evaluation of feasibility
The feasibility of a policy instrument mainly means that it can be effectively executed and produce the desired results. Policies, including Air Pollution Prevention and Control Action Plan and the Three-Year Action Plan for Winning the Blue Sky War issued by the State
54
Council, the Implementation Plan for Projects Utilizing Waste Heat for Residential Heating, the 2017 Work Plan for Air Pollution Prevention and Control in the Greater Beijing-Tianjin-Hebei (GBTH) Region, the Notice on the Launch of the Clean Winter Heating Pilot in Northern China with Financial Support by the Central Government, and Clean Heating in Winter in Northern China (2017-2021) issued by the NDRC, the MOF, and the MOHURD cover both restrictions and incentives, requiring significant reductions of total emissions of major air pollutants, laying out clear tasks for the treatment of loose coal fuels in rural areas, directing the designation of “no-coal zones”, and clearly supporting accelerated transitions of heat sources towards cleaner energy forms in the pilot cities. The policies also introduced measures to retrofit coal-fired heating facilities, promote heat pumps, gas boilers, electric boilers, and decentralized electric (gas) heating, and build new and decentralized heating modes in which geothermal, aerothermal, solar, biomass, and other renewable energy sources complement each other to best suit local conditions. Beijing, Tianjin, Henan, Shandong, and other provinces have issued action implementation plans for coal use reduction and replacement to help clean the air in the rural areas. These jurisdictions have devised projects and measures that promote the use of higher quality coal, coal-to-electricity switching, utilization of solar thermal and biogas energy and incentives for coal use reduction and replacement. Judging from the outcomes, these policies have been well implemented in recent years as a result of the government taking bold steps. From a technological point of view, mature and applicable products have been selected for use in transitional or pilot projects, and when proven practical and efficient, have been placed into broader utilization. Overall, these measures have been significantly effective in reducing the total emissions of major air pollutants and in promoting the development and use of clean energy.
4.5.3 Evaluation of suitability
Suitability of policies mainly refers to whether the conditions or scopes of implementation of policies are suitable for the situations in which they are applied. Enforcing policies that suit local circumstances is an important guarantee for policy suitability. The GBTH Region covers eight provinces, autonomous region and municipalities, namely, Beijing, Tianjin, Hebei, Shanxi, Inner Mongolia, Liaoning, Henan, and Shandong, spanning across a vast land area and encompassing a set of immensely diverse resource endowments, economic conditions, production methods, and living habits. Although the central policies developed for the region are more focused on “macro” guidance, laying out general targets and requirements, their implementation must cater to the distinct and detailed needs of different areas for clean energy development. As a result, the supporting measures issued by local governments emphasize the technicalities of implementation and are more centered on the promotion and application of technical products. In terms of suitability, the policies issued by the central and local governments, including the Air Pollution Prevention and Control Action Plan and the Three-Year Action Plan for Winning the Blue Sky War put forward the targets of reducing the concentration of respirable particulate matter (RPM) by more than 10% by 2017 compared with 2012, in cities at and above the prefecture level, and increasing the number of days with good air quality year by year. Under these targets, concentration levels of fine particulate matter in GBTH, the Yangtze River Delta, and Pearl River Delta are to fall by about 25%, 20%, and 15% respectively, and the annual average concentration of fine particulate matter in Beijing is to be limited at about 60 micrograms/m3. The above indicators have high suitability and can be well implemented. Certain weaknesses, however, exist in the actual execution of these otherwise supportive policies. At present, with rural laborers flowing into the cities to find jobs, those left behind in rural areas are mostly children and the elderly, which might cause possible safety hazards when clean energy is used locally. An issue that should also be considered is the need to laying of pipelines in order to expand the use industrial waste heat and natural gas, and to provide transmission lines to allow sufficient electricity generated using clean energy to reach the rural households and ensure uninterrupted supplies. The initial investment and operating costs of clean energy systems, including required subsidies
55
for heating equipment, electricity, and gas, are significantly higher than the costs for traditional heating approaches, and thus clean energy projects mostly depend on government support rather than on market actors. Changes in heating methods as a result of “coal-to-electricity” switching will greatly raise regional electricity loads, requiring significant expansion of regional grid capacities. Infrastructure such as power lines and substations in rural areas will all need to be upgraded. These initiatives require large amounts of capital investment, but the lack of financial support measures, especially the limited access to credit by SMEs (small and medium enterprises) and rural households, makes it difficult to advance the required infrastructure scale-ups and upgrades.
4.5.4 Evaluation of operability
A policy is only as good as its implementation. Operability, as the basis of implementation, mainly refers to whether policy targets can be actualized. The policies introduced in the GBTH Region are operable in specifying the following measures: gradually replacing old heating practices of burning loose coal with clean energy forms and technologies, shutting down and eliminating coal-fired boilers and furnaces that do not meet environmental protection, energy consumption and safety standards; outlawing small-scale coal-fired boilers; restricting the use of biomass fuels; continuing to control total coal consumption in key areas; and closing down loose coal sales markets in accordance with the law. Restrictions on loose coal heating and bans on small boilers can help to reduce the emissions of air pollutants and bring opportunities for clean energy implementation. Heating with coal in rural areas, however, is closely connected with the structure of local housing and local living habits and follows age-old practices across generations. A blanket restriction on coal would cause strong resistance among some rural residents, making actual policy implementation difficult. The shutdown of a large number of small-scale boilers and restrictions on loose coal heating will interrupt the local heating processes. seriously affecting the daily lives of local residents. Clean coal, which is much more expensive than loose coal but typically provides worse combustion results, is not welcomed by rural people. Compared with restrictive policies, supportive policies have boosted the vigorous promotion of clean energy. Localities have encouraged the orderly development of hydropower, the safe and efficient growth of nuclear power, the optimized layout of wind and solar energy, and the advancement of biomass and geothermal energy consistent with the local conditions. Localities also have promoted the development of biomass cogeneration, BMF-fueled boilers, and biogas use in counties where resources for such systems are easily available and accessible. Direct subsidies have been provided to finance purchase and operation of clean heating equipment and to help centralized heating projects, both of which have helped rural households and enterprises to accomplish the “coal-to-clean-energy” transition. Higher volumes of gas and electricity supplies have been guaranteed to be available in order to promote the “gas-for-coal” and “electricity-for-coal” transitions. Grid upgrades for the “electricity-for-coal” projects in rural areas have been accelerated, gas pipeline networks improved, and peak shaving facilities optimized. In regions where clean energy resources are less available, clean coal has been actively promoted as a guarantee of energy supply. Energy efficiency standards for buildings have been raised according to local conditions, and green buildings have been more strongly promoted so that under policy guidance, the areas and cities where conditions permit can fully implement green building standards in new buildings. Government funds have been leveraged to draw private capital into the clean heating industry; players participating in coal reduction and replacement projects are rewarded instead of subsidized. These policies have made up for the weaknesses of policies restricting the use of coal and traditional biomass fuels. The policies have reduced the cost of clean coal, electricity, and gas, addressed the disruptions in regional heating, greatly increased the proportion of clean energy in rural heating, improved energy utilization efficiencies, and alleviated rural environmental pollution.
56
4.6 Existing Issues
In recent years, the Chinese government has gradually stepped up its policy and financial support for clean energy development in rural areas and has introduced successive laws and regulations such as The Renewable Energy Law and the Medium and Long Term Development Plan for Renewable Energy. NDRC and MOF have implemented supporting policies with regards to direct subsidies, special fund subsidies and interest subsidies on bank loans, thus effectively promoting clean energy development in rural areas. But still some challenges remain in the policy development and implementation processes.
4.6.1 Fragmentation of policies
China’s management of clean energy development in rural areas involves multiple governmental bodies, including NDRC, MOF, Ministry of Agriculture and Rural Affairs to name just a few. Lack of coordination between these bodies has resulted in overlapping policies without continuity and a fragmented and incomplete policy system. Meanwhile, the policies offer weak economic incentives and are not stable enough to form a long-term mechanism to support the sustainable development of renewable energy.
4.6.2 Lack of details in implementation
Policies for developing clean energy in rural areas require strategy, foresight, and operability. The government at the central level has specifically formulated laws and regulations such as The Renewable Energy Law and the Medium and Long Term Development Plan for Renewable Energy, establishing provisions for the development of clean energy in the rural areas. But with regards to the implementation of these policies, there is a lack of operable local supporting measures and regulations, and especially of detailed implementation instructions. As a result, many critical policy measures are difficult to implement and enforce. Although developed countries mostly subsidize consumers to promote clean energy, China provides most of its rural energy subsidies during the implementation of specific projects. The level of subsidies is mainly decided based on some macro performance indicators covering the whole industrial chain, such as production volumes or consumption volumes, rather than using detailed technical performance standards to define subsidies. This kind of crude fiscal support has caused regions and enterprises to swarm in to apply for project funding when available,but has not always been effective in promoting the best projects for specific locations.
4.6.3 Lack of granularity (specificity) in the provision of subsidies to different
places
At present, the central government determines levels of subsidies based on the administrative ranking of a recipient area. In other words, two pilot cities, if at the same level of government ranking, would receive the same amount of financial support from the central government. In fact, among cities with the same administrative ranking, there can be vast divergences in the retrofitting workload, suitable technical solutions, level of economic development and other characteristics. As a result, the financial support a household has access to may vary considerably depending on which pilot city the household is located in or near.
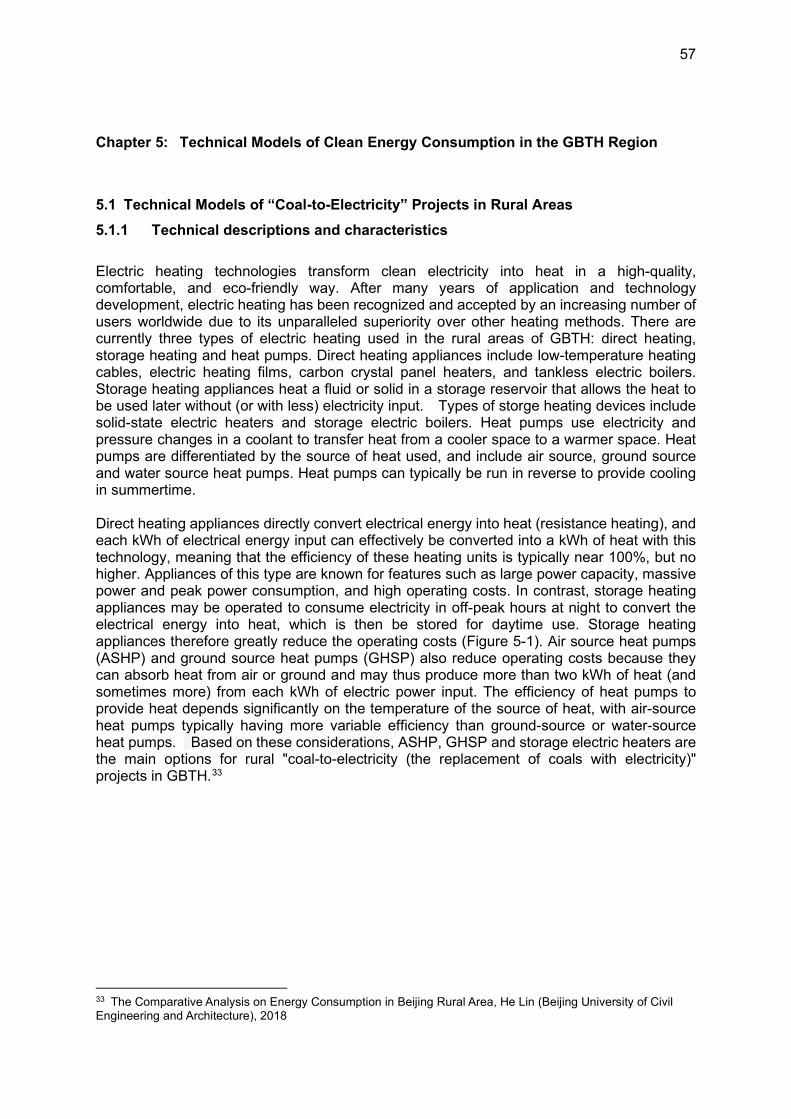
57
Chapter 5: Technical Models of Clean Energy Consumption in the GBTH Region
5.1 Technical Models of “Coal-to-Electricity” Projects in Rural Areas
5.1.1 Technical descriptions and characteristics
Electric heating technologies transform clean electricity into heat in a high-quality, comfortable, and eco-friendly way. After many years of application and technology development, electric heating has been recognized and accepted by an increasing number of users worldwide due to its unparalleled superiority over other heating methods. There are currently three types of electric heating used in the rural areas of GBTH: direct heating, storage heating and heat pumps. Direct heating appliances include low-temperature heating cables, electric heating films, carbon crystal panel heaters, and tankless electric boilers. Storage heating appliances heat a fluid or solid in a storage reservoir that allows the heat to be used later without (or with less) electricity input. Types of storge heating devices include solid-state electric heaters and storage electric boilers. Heat pumps use electricity and pressure changes in a coolant to transfer heat from a cooler space to a warmer space. Heat pumps are differentiated by the source of heat used, and include air source, ground source and water source heat pumps. Heat pumps can typically be run in reverse to provide cooling in summertime. Direct heating appliances directly convert electrical energy into heat (resistance heating), and each kWh of electrical energy input can effectively be converted into a kWh of heat with this technology, meaning that the efficiency of these heating units is typically near 100%, but no higher. Appliances of this type are known for features such as large power capacity, massive power and peak power consumption, and high operating costs. In contrast, storage heating appliances may be operated to consume electricity in off-peak hours at night to convert the electrical energy into heat, which is then be stored for daytime use. Storage heating appliances therefore greatly reduce the operating costs (Figure 5-1). Air source heat pumps (ASHP) and ground source heat pumps (GHSP) also reduce operating costs because they can absorb heat from air or ground and may thus produce more than two kWh of heat (and sometimes more) from each kWh of electric power input. The efficiency of heat pumps to provide heat depends significantly on the temperature of the source of heat, with air-source heat pumps typically having more variable efficiency than ground-source or water-source heat pumps. Based on these considerations, ASHP, GHSP and storage electric heaters are the main options for rural "coal-to-electricity (the replacement of coals with electricity)" projects in GBTH.33
33 The Comparative Analysis on Energy Consumption in Beijing Rural Area, He Lin (Beijing University of Civil Engineering and Architecture), 2018
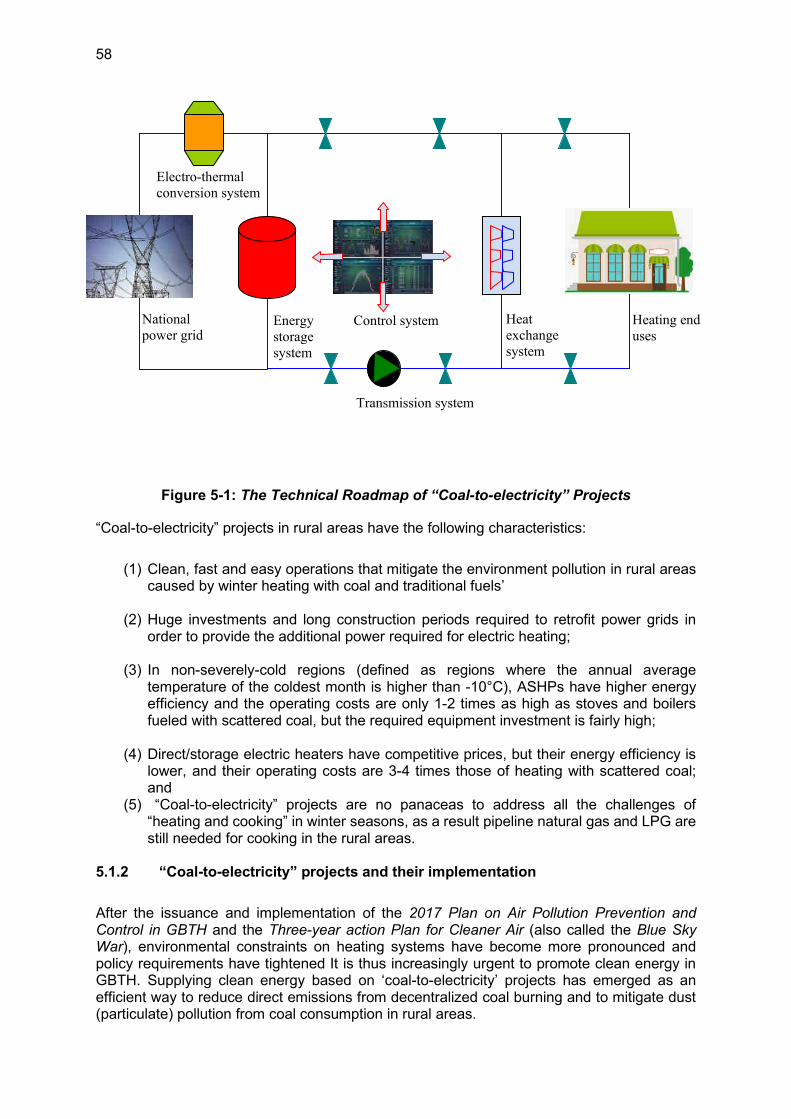
58
Figure 5-1: The Technical Roadmap of “Coal-to-electricity” Projects
“Coal-to-electricity” projects in rural areas have the following characteristics:
(1) Clean, fast and easy operations that mitigate the environment pollution in rural areas caused by winter heating with coal and traditional fuels’
(2) Huge investments and long construction periods required to retrofit power grids in order to provide the additional power required for electric heating;
(3) In non-severely-cold regions (defined as regions where the annual average temperature of the coldest month is higher than -10°C), ASHPs have higher energy efficiency and the operating costs are only 1-2 times as high as stoves and boilers fueled with scattered coal, but the required equipment investment is fairly high;
(4) Direct/storage electric heaters have competitive prices, but their energy efficiency is lower, and their operating costs are 3-4 times those of heating with scattered coal; and
(5) “Coal-to-electricity” projects are no panaceas to address all the challenges of “heating and cooking” in winter seasons, as a result pipeline natural gas and LPG are still needed for cooking in the rural areas.
5.1.2 “Coal-to-electricity” projects and their implementation
After the issuance and implementation of the 2017 Plan on Air Pollution Prevention and Control in GBTH and the Three-year action Plan for Cleaner Air (also called the Blue Sky War), environmental constraints on heating systems have become more pronounced and policy requirements have tightened It is thus increasingly urgent to promote clean energy in GBTH. Supplying clean energy based on ‘coal-to-electricity’ projects has emerged as an efficient way to reduce direct emissions from decentralized coal burning and to mitigate dust (particulate) pollution from coal consumption in rural areas.
National
power grid Energy
storage
system
Control system Heat
exchange
system
Heating end
uses
Transmission system
Electro-thermal
conversion system
59
Based on the principle of “being guided by the government and implemented by power grid enterprises and affordable for the ordinary residents”, projects were kicked off to upgrade power distribution and transmission lines in the region to benefit consumers in all types of buildings. For example, public buildings, including the buildings of businesses and public institutions that do not have access to central heating services or have been newly constructed may adopt building central heating systems using storage electric boilers or storage heat pumps. Households may adopt one or a combination of multiple domestic heating methods in the winter, such as the domestic-use heat pumps, storage/direct electric heaters, or carbon crystal panels. In terms of operation of heating systems, the power tariffs charged to consumers are generally market-based. Instead of tiered pricing, peak/off-peak pricing is used in the winter season in GBTH. In addition, electricity tariffs and household appliances are subsidized. All of these measures are intended to promote “coal-to-electricity” projects, tackle the root cause of pollution from “scattered coal” use, and seek to build a clean, low-carbon, safe and efficient energy system. Since the 13th Five-year Plan was issued, the State Grid Corporation of China has promoted 18,000 clean heating projects covering a building area of 500 million m2 More than 3000 decentralized heating projects have been implemented in schools and public facilities that adopted of carbon crystal panels and electric heating films, with an area of nearly 10 million m2 renovated. 150,000 projects have been implemented to promote electric boiler use in Northern China, covering a building floor area of 430 million m2, and achieving the target of using 580 billion kWh of electricity annually to replace coal-fired heating. Nearly 2 million households in 6000 villages in GBTH have benefited from the “coal-to-electricity” projects, and more than 100 million m2 of heated area has been renovated. In Beijing, most of the clean energy retrofitting projects are “coal-to-electricity” projects. In 2016, for example, among 227,000 renovated households in 663 villages, 199,000 households (87.62%) in 574 villages replaced coal use for heating with electricity. Also, Wuqing District in Tianjin constructed a “coal-free” district through the low-voltage retrofitting of 114,300 households in 352 villages. In total, the district reduced coal consumption by 218,000 tons annually and CO2 emissions by 566,800 tons/yr. ASHPs (air source heat pump) have received wide recognition among all of the “coal-to-electricity” projects implemented. For instance, of the projects conducted in 2016 in Beijing, 2139 rural households adopted GSHPs; 44,300 rural households adopted storage electric heaters, and 151,000 rural households adopted ASHPs, accounting for a dominant 76.28% of the total systems installed. Through 2020, ASHPs have been installed in cumulative 700,000 rural households in Beijing. ASHP is an energy conservation appliance that uses a working fluid under pressure to carry heat flow from a low-temperature source—in this case, outdoor air—to a higher-temperature reservoir—in this case the indoor space being heated. Flexible and easy to apply, ASHPs are compatible with various heating end uses. As such, the technology is suitable for heating in scattered rural houses and in multi-level buildings. For scattered rural houses in regions with poor heating infrastructure, the combination of “ASHP + radiators” or “ASHP + floor heating” may be adopted. By selecting the right parameters for heat pumps, the outlet water temperature can be set at 50℃ in winters and 10℃ in summers to adjust the indoor temperature to desired levels in any season(Figure 5-2). Multi-level row houses in rural areas may adopt a combination of “ASHP + solar energy” or “ASHP + biomass boilers” to take full advantage of dual heat sources and dual heating end uses. Although solar energy or biomass energy alone may bring challenges of intermittent heat availability and lack of capability to provide summer cooling, AHSPs can be a source of stable heating energy and help stabilize indoor temperatures at 20℃ in winter.
60
Figure 5-2: The heating process in ASHP households
5.1.3 Case studies of coal-to-electricity projects
Comparative analysis has been conducted on the households participating in “coal-to-electricity” retrofit projects in Beijing. Three main heating options have been adopted in these projects: ASHPs, GSHPs and storage electric heaters. The capital investments required mainly included the external power grid upgrades, village power grid upgrades, and household renovation.34
(1) Determination of electricity consumption indicators
Data on coal-to-electricity implementation as provided in the Inspection and Evaluation Report of Clean Energy Appliances Used in “Coal-to-Electricity” Projects in the Beijing Rural Areas in 2016 Heating Seasons compiled by the former Beijing Commission of Rural Affairs, are presented in Table 5-1.
34 The Comparative Analysis on Energy Consumption in Beijing Rural Area, He Lin (Beijing University of Civil Engineering and Architecture), 2018
Floor heating pipes
radiators
Air
heaters
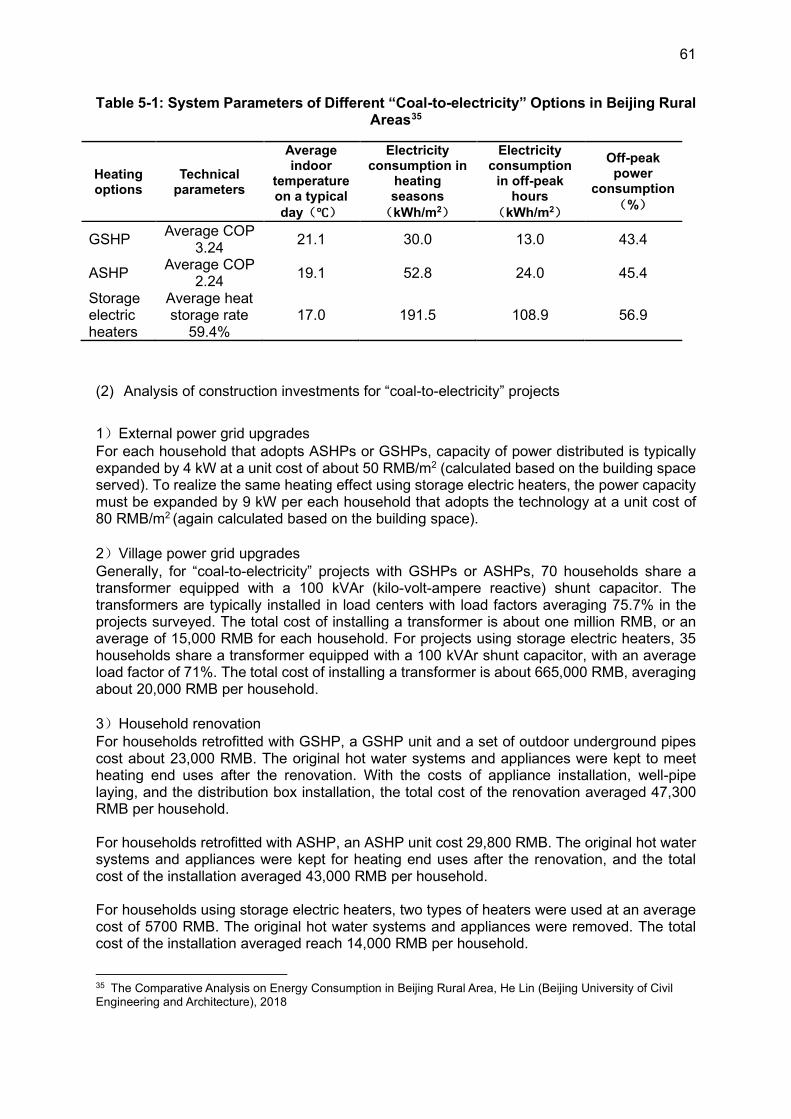
61
Table 5-1: System Parameters of Different “Coal-to-electricity” Options in Beijing Rural Areas35
Heating options
Technical parameters
Average indoor
temperature on a typical
day(℃)
Electricity consumption in
heating seasons
(kWh/m2)
Electricity consumption
in off-peak hours
(kWh/m2)
Off-peak power
consumption
(%)
GSHP Average COP
3.24 21.1 30.0 13.0 43.4
ASHP Average COP
2.24 19.1 52.8 24.0 45.4
Storage electric heaters
Average heat storage rate
59.4% 17.0 191.5 108.9 56.9
(2) Analysis of construction investments for “coal-to-electricity” projects
1)External power grid upgrades For each household that adopts ASHPs or GSHPs, capacity of power distributed is typically expanded by 4 kW at a unit cost of about 50 RMB/m2 (calculated based on the building space served). To realize the same heating effect using storage electric heaters, the power capacity must be expanded by 9 kW per each household that adopts the technology at a unit cost of 80 RMB/m2 (again calculated based on the building space). 2)Village power grid upgrades Generally, for “coal-to-electricity” projects with GSHPs or ASHPs, 70 households share a transformer equipped with a 100 kVAr (kilo-volt-ampere reactive) shunt capacitor. The transformers are typically installed in load centers with load factors averaging 75.7% in the projects surveyed. The total cost of installing a transformer is about one million RMB, or an average of 15,000 RMB for each household. For projects using storage electric heaters, 35 households share a transformer equipped with a 100 kVAr shunt capacitor, with an average load factor of 71%. The total cost of installing a transformer is about 665,000 RMB, averaging about 20,000 RMB per household. 3)Household renovation For households retrofitted with GSHP, a GSHP unit and a set of outdoor underground pipes cost about 23,000 RMB. The original hot water systems and appliances were kept to meet heating end uses after the renovation. With the costs of appliance installation, well-pipe laying, and the distribution box installation, the total cost of the renovation averaged 47,300 RMB per household. For households retrofitted with ASHP, an ASHP unit cost 29,800 RMB. The original hot water systems and appliances were kept for heating end uses after the renovation, and the total cost of the installation averaged 43,000 RMB per household. For households using storage electric heaters, two types of heaters were used at an average cost of 5700 RMB. The original hot water systems and appliances were removed. The total cost of the installation averaged reach 14,000 RMB per household.
35 The Comparative Analysis on Energy Consumption in Beijing Rural Area, He Lin (Beijing University of Civil Engineering and Architecture), 2018
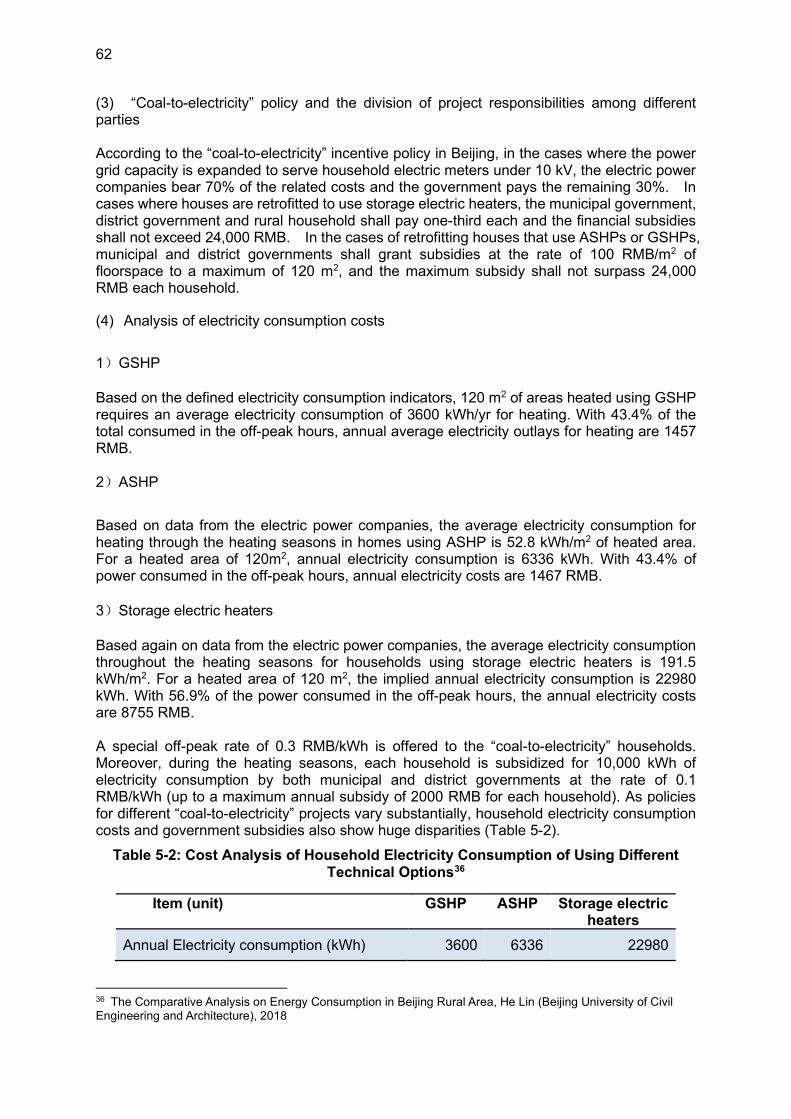
62
(3) “Coal-to-electricity” policy and the division of project responsibilities among different parties According to the “coal-to-electricity” incentive policy in Beijing, in the cases where the power grid capacity is expanded to serve household electric meters under 10 kV, the electric power companies bear 70% of the related costs and the government pays the remaining 30%. In cases where houses are retrofitted to use storage electric heaters, the municipal government, district government and rural household shall pay one-third each and the financial subsidies shall not exceed 24,000 RMB. In the cases of retrofitting houses that use ASHPs or GSHPs, municipal and district governments shall grant subsidies at the rate of 100 RMB/m2 of floorspace to a maximum of 120 m2, and the maximum subsidy shall not surpass 24,000 RMB each household.
(4) Analysis of electricity consumption costs
1)GSHP Based on the defined electricity consumption indicators, 120 m2 of areas heated using GSHP requires an average electricity consumption of 3600 kWh/yr for heating. With 43.4% of the total consumed in the off-peak hours, annual average electricity outlays for heating are 1457 RMB.
2)ASHP
Based on data from the electric power companies, the average electricity consumption for heating through the heating seasons in homes using ASHP is 52.8 kWh/m2 of heated area. For a heated area of 120m2, annual electricity consumption is 6336 kWh. With 43.4% of power consumed in the off-peak hours, annual electricity costs are 1467 RMB. 3)Storage electric heaters Based again on data from the electric power companies, the average electricity consumption throughout the heating seasons for households using storage electric heaters is 191.5 kWh/m2. For a heated area of 120 m2, the implied annual electricity consumption is 22980 kWh. With 56.9% of the power consumed in the off-peak hours, the annual electricity costs are 8755 RMB. A special off-peak rate of 0.3 RMB/kWh is offered to the “coal-to-electricity” households. Moreover, during the heating seasons, each household is subsidized for 10,000 kWh of electricity consumption by both municipal and district governments at the rate of 0.1 RMB/kWh (up to a maximum annual subsidy of 2000 RMB for each household). As policies for different “coal-to-electricity” projects vary substantially, household electricity consumption costs and government subsidies also show huge disparities (Table 5-2).
Table 5-2: Cost Analysis of Household Electricity Consumption of Using Different Technical Options36
Item (unit) GSHP ASHP Storage electric heaters
Annual Electricity consumption (kWh) 3600 6336 22980
36 The Comparative Analysis on Energy Consumption in Beijing Rural Area, He Lin (Beijing University of Civil Engineering and Architecture), 2018
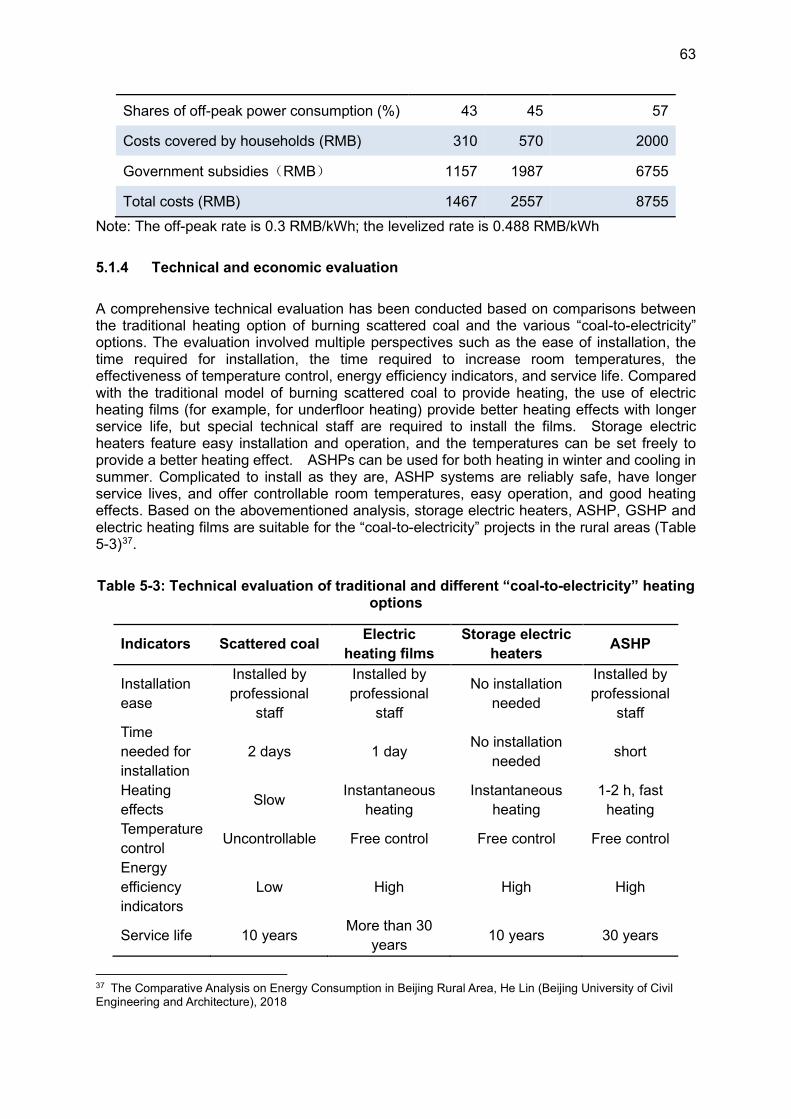
63
Shares of off-peak power consumption (%) 43 45 57
Costs covered by households (RMB) 310 570 2000
Government subsidies(RMB) 1157 1987 6755
Total costs (RMB) 1467 2557 8755
Note: The off-peak rate is 0.3 RMB/kWh; the levelized rate is 0.488 RMB/kWh
5.1.4 Technical and economic evaluation
A comprehensive technical evaluation has been conducted based on comparisons between the traditional heating option of burning scattered coal and the various “coal-to-electricity” options. The evaluation involved multiple perspectives such as the ease of installation, the time required for installation, the time required to increase room temperatures, the effectiveness of temperature control, energy efficiency indicators, and service life. Compared with the traditional model of burning scattered coal to provide heating, the use of electric heating films (for example, for underfloor heating) provide better heating effects with longer service life, but special technical staff are required to install the films. Storage electric heaters feature easy installation and operation, and the temperatures can be set freely to provide a better heating effect. ASHPs can be used for both heating in winter and cooling in summer. Complicated to install as they are, ASHP systems are reliably safe, have longer service lives, and offer controllable room temperatures, easy operation, and good heating effects. Based on the abovementioned analysis, storage electric heaters, ASHP, GSHP and electric heating films are suitable for the “coal-to-electricity” projects in the rural areas (Table 5-3)37.
Table 5-3: Technical evaluation of traditional and different “coal-to-electricity” heating options
Indicators Scattered coal Electric
heating films
Storage electric
heaters ASHP
Installation ease
Installed by professional
staff
Installed by professional
staff
No installation needed
Installed by professional
staff Time needed for installation
2 days 1 day No installation
needed short
Heating effects
Slow Instantaneous
heating Instantaneous
heating 1-2 h, fast
heating Temperature control
Uncontrollable Free control Free control Free control
Energy efficiency indicators
Low High High High
Service life 10 years More than 30
years 10 years 30 years
37 The Comparative Analysis on Energy Consumption in Beijing Rural Area, He Lin (Beijing University of Civil Engineering and Architecture), 2018
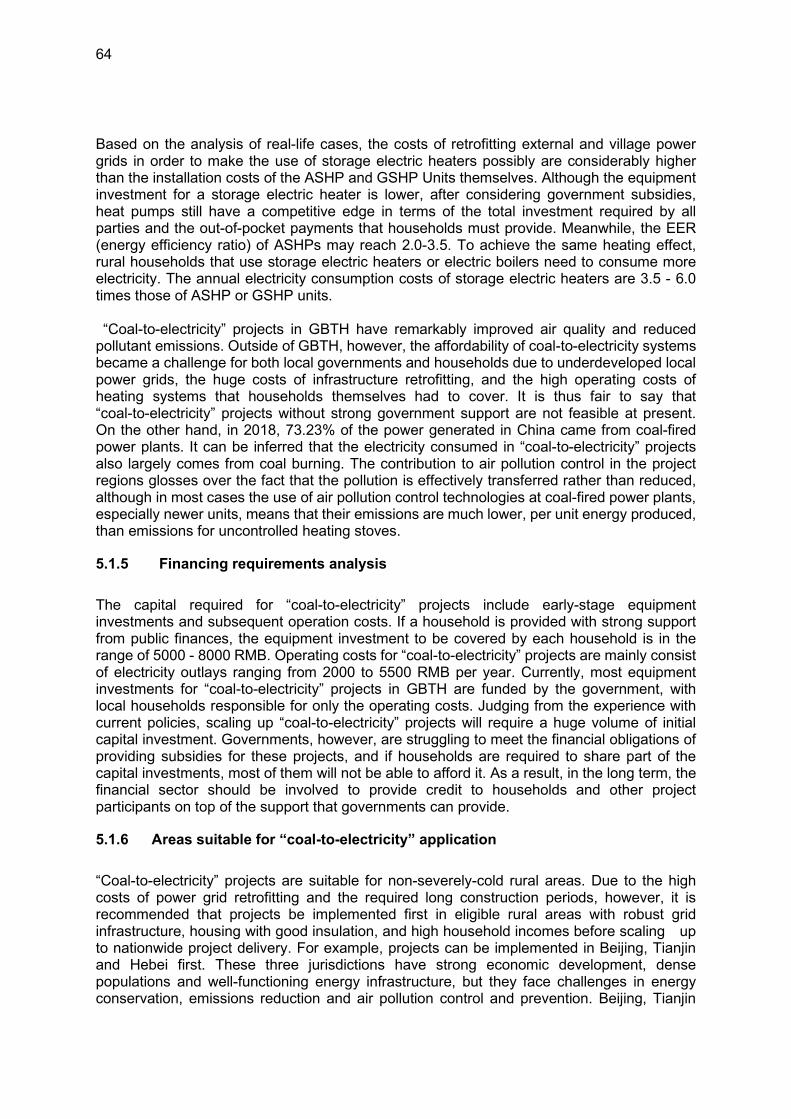
64
Based on the analysis of real-life cases, the costs of retrofitting external and village power grids in order to make the use of storage electric heaters possibly are considerably higher than the installation costs of the ASHP and GSHP Units themselves. Although the equipment investment for a storage electric heater is lower, after considering government subsidies, heat pumps still have a competitive edge in terms of the total investment required by all parties and the out-of-pocket payments that households must provide. Meanwhile, the EER (energy efficiency ratio) of ASHPs may reach 2.0-3.5. To achieve the same heating effect, rural households that use storage electric heaters or electric boilers need to consume more electricity. The annual electricity consumption costs of storage electric heaters are 3.5 - 6.0 times those of ASHP or GSHP units. “Coal-to-electricity” projects in GBTH have remarkably improved air quality and reduced pollutant emissions. Outside of GBTH, however, the affordability of coal-to-electricity systems became a challenge for both local governments and households due to underdeveloped local power grids, the huge costs of infrastructure retrofitting, and the high operating costs of heating systems that households themselves had to cover. It is thus fair to say that “coal-to-electricity” projects without strong government support are not feasible at present. On the other hand, in 2018, 73.23% of the power generated in China came from coal-fired power plants. It can be inferred that the electricity consumed in “coal-to-electricity” projects also largely comes from coal burning. The contribution to air pollution control in the project regions glosses over the fact that the pollution is effectively transferred rather than reduced, although in most cases the use of air pollution control technologies at coal-fired power plants, especially newer units, means that their emissions are much lower, per unit energy produced, than emissions for uncontrolled heating stoves.
5.1.5 Financing requirements analysis
The capital required for “coal-to-electricity” projects include early-stage equipment investments and subsequent operation costs. If a household is provided with strong support from public finances, the equipment investment to be covered by each household is in the range of 5000 - 8000 RMB. Operating costs for “coal-to-electricity” projects are mainly consist of electricity outlays ranging from 2000 to 5500 RMB per year. Currently, most equipment investments for “coal-to-electricity” projects in GBTH are funded by the government, with local households responsible for only the operating costs. Judging from the experience with current policies, scaling up “coal-to-electricity” projects will require a huge volume of initial capital investment. Governments, however, are struggling to meet the financial obligations of providing subsidies for these projects, and if households are required to share part of the capital investments, most of them will not be able to afford it. As a result, in the long term, the financial sector should be involved to provide credit to households and other project participants on top of the support that governments can provide.
5.1.6 Areas suitable for “coal-to-electricity” application
“Coal-to-electricity” projects are suitable for non-severely-cold rural areas. Due to the high costs of power grid retrofitting and the required long construction periods, however, it is recommended that projects be implemented first in eligible rural areas with robust grid infrastructure, housing with good insulation, and high household incomes before scaling up to nationwide project delivery. For example, projects can be implemented in Beijing, Tianjin and Hebei first. These three jurisdictions have strong economic development, dense populations and well-functioning energy infrastructure, but they face challenges in energy conservation, emissions reduction and air pollution control and prevention. Beijing, Tianjin
65
and Hebei are therefore ideal for implementing “coal-to-electricity” projects first, with similar projects then promoted to Inner Mongolia, Liaoning and other jurisdictions in Northern China.
5.2 Technical Models of “Coal-to-Gas” Projects in Rural Areas
5.2.1 Technical descriptions and characteristics
“Coal-to-gas” projects in rural areas replace coal use with natural gas use to facilitate the consumption of clean energy for cooking and heating (with wall-hung gas boilers). The byproducts of gas consumption are CO2 and water, and only a small amount of CO and NOx will be produced in cases of incomplete combustion and when nitrogen from the air is oxidized during combustion. “Coal-to-gas” projects therefore reduce pollutant emissions and have less impact on air quality than coal-fired heating. There are three options for “coal-to-gas” projects: piped natural gas (PNG), compressed natural gas (CNG) and liquified natural gas (LNG). The construction work required for “coal-to-gas” projects includes developing the gas supply pipelines and facilities, village pipelines and household pipelines. Gas supply pipelines and facilities include gas supply pipelines, CNG stations or LNG stations, and pressure regulator valves and boxes. The elements of village pipeline systems include outlet low-pressure pipelines from regulator boxes, buried pipelines, overhead pipelines and gas meters. Household pipeline elements include outlet pipelines from gas meters, buried or overhead pipelines in the courtyards of homes, and gas-consuming cooking appliances. Gas from upstream pipelines is de-pressurized in the regulator box, transported to household gas meters through low-pressure pipelines in the village, and consumed in gas stoves or wall-hung boilers in homes after metering. “Coal-to-gas” projects in rural areas have the following characteristics: (1) high efficiency, low energy consumption, convenient and clean; (2) mature technology and equipment, easy operations with low failure rates; (3) compared with “coal-to-electricity” projects, “coal-to-gas” projects satisfy both heating and cooking needs, thus are more suitable for real-life scenarios in rural areas; (4) large investments are needed for infrastructure construction and purchasing heating appliances; (5) high operating costs, typically two to three times those of scattered/loose coal heating stoves.
5.2.2 The “coal-to-gas” projects and their implementation
In recent years, China has accelerated the promotion of “coal-to-gas” projects to mitigate air pollution and optimize the structure of energy consumption. Various measures, such as the construction of “areas free of scattered coal burning” and the expansion of natural gas imports, have been implemented to promote natural gas use and reduce coal consumption. In addition to satisfying heating and hot water demands in rural areas, natural gas also caters to Chinese cooking habits and is a better choice to meet the needs of Chinese daily life, relative to “coal-to-electricity” solutions. The clean energy used in “coal-to-gas” projects represents market segment of the gas industry in China where there have typically been distinct environmental incentive policies and energy price fluctuations. When “coal-to-gas” projects are implemented in rural areas, household demand conditions must be considered to determine the suitable options for system deployment and application strategies. The gas companies are responsible for supplying gas and for collecting corresponding charges. As a result, for geographically scattered rural households, wall-hung gas boilers are used together with radiators or floor heating pipes to provide heating and hot water in winter. In addition, gas is supplied to different areas during different hours of the day based on the different household demands. In rural public buildings with floorspace over 200 m2, direct-fired heaters or gas engine heat
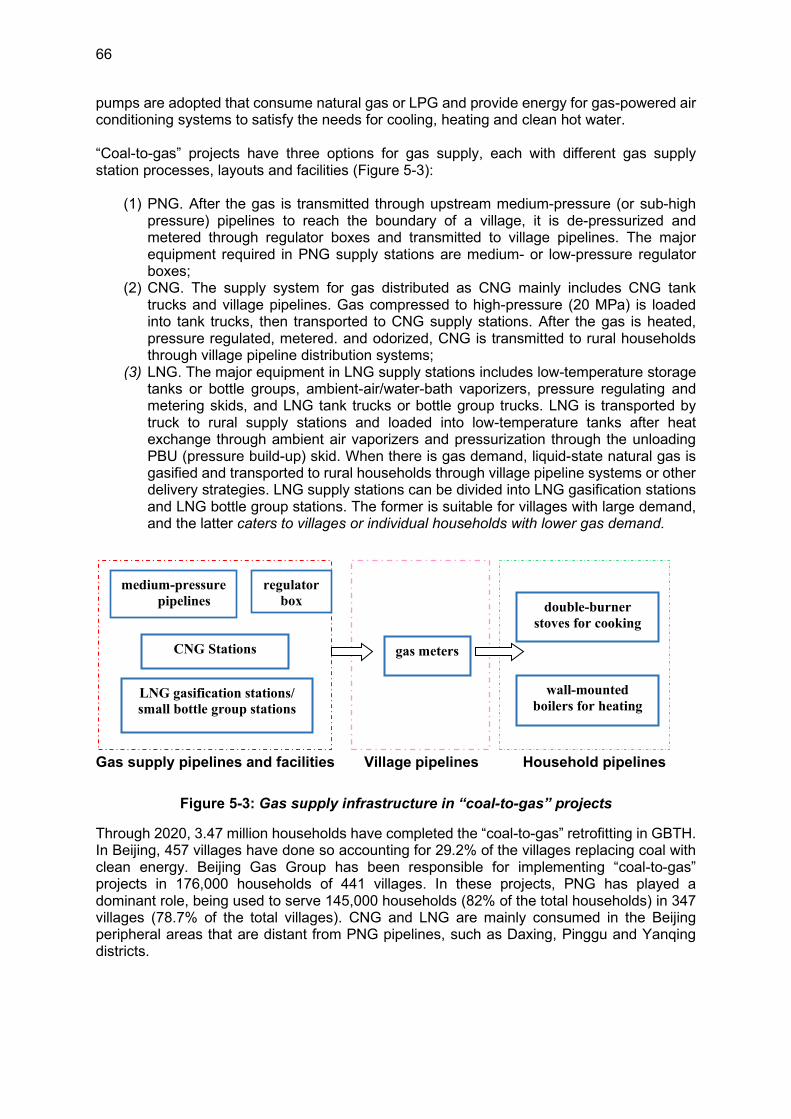
66
pumps are adopted that consume natural gas or LPG and provide energy for gas-powered air conditioning systems to satisfy the needs for cooling, heating and clean hot water. “Coal-to-gas” projects have three options for gas supply, each with different gas supply station processes, layouts and facilities (Figure 5-3):
(1) PNG. After the gas is transmitted through upstream medium-pressure (or sub-high pressure) pipelines to reach the boundary of a village, it is de-pressurized and metered through regulator boxes and transmitted to village pipelines. The major equipment required in PNG supply stations are medium- or low-pressure regulator boxes;
(2) CNG. The supply system for gas distributed as CNG mainly includes CNG tank trucks and village pipelines. Gas compressed to high-pressure (20 MPa) is loaded into tank trucks, then transported to CNG supply stations. After the gas is heated, pressure regulated, metered. and odorized, CNG is transmitted to rural households through village pipeline distribution systems;
(3) LNG. The major equipment in LNG supply stations includes low-temperature storage tanks or bottle groups, ambient-air/water-bath vaporizers, pressure regulating and metering skids, and LNG tank trucks or bottle group trucks. LNG is transported by truck to rural supply stations and loaded into low-temperature tanks after heat exchange through ambient air vaporizers and pressurization through the unloading PBU (pressure build-up) skid. When there is gas demand, liquid-state natural gas is gasified and transported to rural households through village pipeline systems or other delivery strategies. LNG supply stations can be divided into LNG gasification stations and LNG bottle group stations. The former is suitable for villages with large demand, and the latter caters to villages or individual households with lower gas demand.
Gas supply pipelines and facilities Village pipelines Household pipelines
Figure 5-3: Gas supply infrastructure in “coal-to-gas” projects
Through 2020, 3.47 million households have completed the “coal-to-gas” retrofitting in GBTH. In Beijing, 457 villages have done so accounting for 29.2% of the villages replacing coal with clean energy. Beijing Gas Group has been responsible for implementing “coal-to-gas” projects in 176,000 households of 441 villages. In these projects, PNG has played a dominant role, being used to serve 145,000 households (82% of the total households) in 347 villages (78.7% of the total villages). CNG and LNG are mainly consumed in the Beijing peripheral areas that are distant from PNG pipelines, such as Daxing, Pinggu and Yanqing districts.
regulator
box medium-pressure
pipelines
CNG Stations
LNG gasification stations/
small bottle group stations
gas meters
double-burner
stoves for cooking
wall-mounted
boilers for heating
67
5.2.3 Case study
Based on investment estimates for Beijing “coal-to-gas” projects, investments in village pipelines and household pipelines are estimated to be 11,000 RMB and 15,000 RMB per household respectively. For gas supply pipelines and facilities, construction investments for PNG projects are dependent on the condition and location relative to the project area of the original pipeline to which the project is connected and the length of new pipelines required to connect a new village. These investments have averaged 11,600 RMB per household connected. As CNG is transported by tank trucks after pressurization, construction investments are not as large as for PNG and have averaged about 8000 RMB per household. Gas supply investments for LNG projects have averaged 16,400 RMB per household and are closely related to the type and size of supply stations. In the case of gasification stations, as the gas supplied to consumers increases, more investments are required in equipment, civil engineering and fire safety facilities. Currently in Beijing, gas companies bear 70% of the investment costs of gas supply pipelines, village pipelines, regulating stations and gas meters, and the remaining 30% are covered by the government in the form of fixed-asset investments. Regarding the wall-hung gas boilers used in each household, the Beijing municipal government, district government and rural households split the costs equally, with government subsidies not exceeding 24,000 RMB per household. The financing needs to be borne by the rural households participating in “coal-to-gas” projects therefore are almost the same regardless of the technical supply option being used.38 During the heating season, rural households’ gas consumption per unit floor area in Beijing is typically 9.9 to 10.8 m3/m2 annually. That is to say, for a typical heated area of 120 m2, the annual gas consumption is 1,188 - 1,296 m3/yr. A unified household rate is applicable for PNG consumption. The price of CNG out of the supply station (before being transported via pipelines) is 2.46 RMB/m3. Including delivery costs of 0.5 RMB/m3 and administration costs of 0.2 RMB/m3, the final sales price of CNG is 3.16R MB/m3. The procurement price of LNG is 2.5 RMB/m3. Including delivery costs of 0.5 RMB/m3 and administration costs of 0.66 RMB/m3, the final sales price to consumers is set at 4 RMB/ m3. If gas supply to users in an area is considerable, the sales price can be reduced to 3.6 RMB/m3 through cost saving. Overall, the cost of gas from LNG to consumers is highest, and the final cost of gas to consumers for gas derived from PNG is the lowest. Considering government subsidies, however, the gas costs borne by rural households across all three options are basically the same.39
5.2.4 Technical and economic evaluation
Increasing natural gas consumption is an inevitable choice to adjust China’s energy structure in the short- and medium-term. Therefore, “coal-to-gas” projects in the rural areas are crucial for the development of gas facilities, the promotion of equalized access to energy services, and the broader use of clean and low-carbon energy. First, natural gas caters to various daily demands including cooking and clean heating in the rural areas and is therefore conducive to upgrading the rural energy consumption structure. The ways to consume natural gas in the rural areas are just as convenient and comfortable as in urban areas (Table 5-4). Second, natural gas consumption is eco-friendly and generates lower pollutants than use of coal or traditional biomass fuels. Throughout the life cycle, the combustion of natural gas only produces CO2 and a little NOx, with little or no emissions of sulfides and particulates. Third, the overall energy efficiency of heating or cooking with natural gas is high. In winter, the overall energy efficiency of wall-hung gas boilers can exceed 90%, and the efficiency for more technically advanced wall-hung condensing boilers may approach 100%. Fourth,
38 The Comparative Analysis on Energy Consumption in Beijing Rural Area, He Lin (Beijing University of Civil Engineering and Architecture), 2018 39 The Comparative Analysis on Energy Consumption in Beijing Rural Area, He Lin (Beijing University of Civil Engineering and Architecture), 2018
68
natural gas technology is mature. Wall-hung gas boilers, for example, have been in use both domestically and overseas for almost 100 years, and have been proven to provide good heating performance regardless of outdoor temperatures.
Table 5-4: Technical evaluation of “coal-to-gas” projects40
Indicators Scattered coal
burning Wall-hung gas boilers
Ease of Installation Installed by technicians
Installed by technicians
Time needed for installation
2 days 1 day and needs to be compatible with end-user heating equipment
Heating effects Temperature slow
rise 1-2 hours
Temperature control Uncontrollable Free control
Energy efficiency ratings
Low High
Service life 10 years 10 years
Raw material availability
Easy Gas pipelines required
Since the increase in gas demand in recent years in China has been moderate, existing national gas supplies remain sufficient to meet rural gas demand even after the implementation of “coal-to-gas” projects. The initial investments required for “coal-to-gas” projects are generally high (generally following the pattern of costs of CNG exceeding those of LNG, which exceed those of PNG). In regard to investments in appliances and other heating system elements by households, the cost of heating appliances ranges from 6,000 to 10,000 RMB per household with very low ongoing costs for operating and maintenance of gas heating systems. Household energy consumption has been subsidized by the government, resulting in actual out-of-pocket expenditures for “coal-to-gas” project participants averaging 3000 RMB per household.
5.2.5 Financing requirements analysis
The financing needs of “coal-to-gas” projects include outlays for early-stage equipment investments and subsequent operating costs. The early-stage investments in equipment average 10,000 RMB per rural household, while operating costs mainly consist of gas charges and are about 3000 RMB per household per heating season. Currently in the GBTH region, governments are responsible for bearing the construction costs of “coal-to-gas” projects and rural households cover the operating costs. To scale up “coal-to-gas” projects, government input, commercial credit support, and rural household investment will all be needed.
5.2.6 The areas suitable for application
The rural areas suitable for implementing “coal-to-gas” projects are those with insufficient clean energy resources, such as biomass and solar energy, that could alternatively be used to provide heating energy, but with sound economic conditions and strong infrastructure that guarantees stable gas supplies. Beijing and Tianjin or any of the medium-to-large cities are examples. These cities are making huge efforts to build their urban fringes into “areas free of
40 The Comparative Analysis on Energy Consumption in Beijing Rural Area, He Lin (Beijing University of Civil Engineering and Architecture), 2018
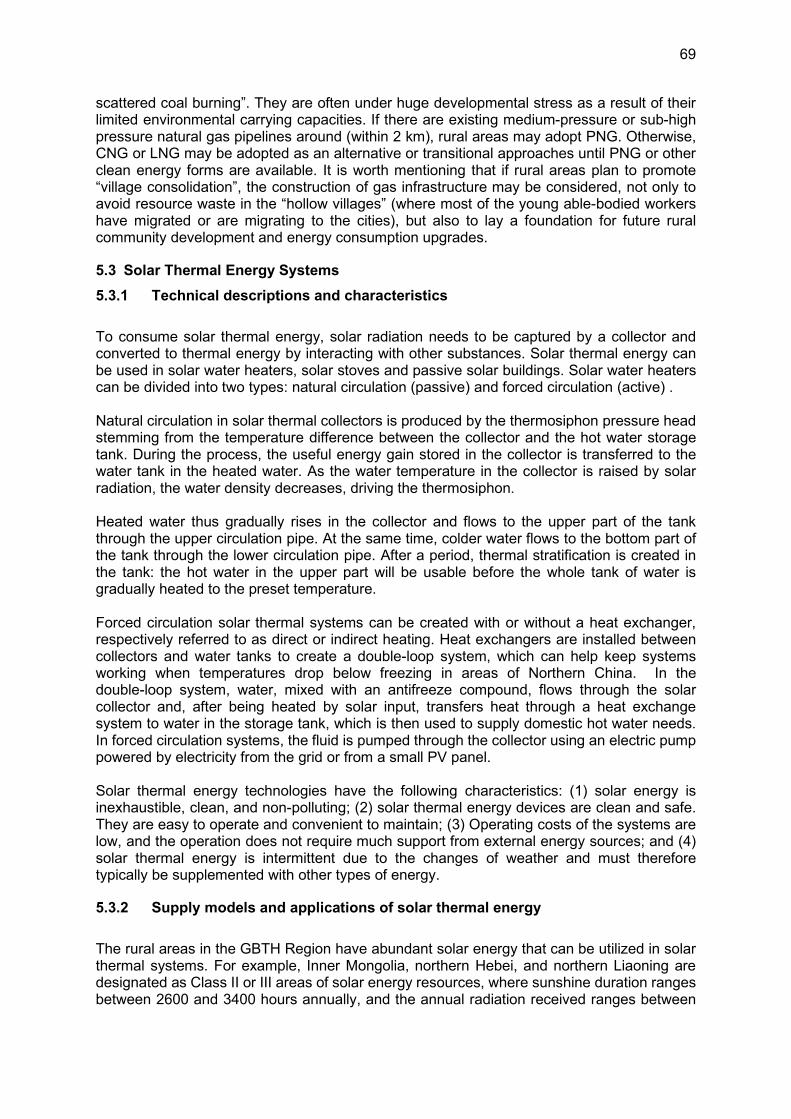
69
scattered coal burning”. They are often under huge developmental stress as a result of their limited environmental carrying capacities. If there are existing medium-pressure or sub-high pressure natural gas pipelines around (within 2 km), rural areas may adopt PNG. Otherwise, CNG or LNG may be adopted as an alternative or transitional approaches until PNG or other clean energy forms are available. It is worth mentioning that if rural areas plan to promote “village consolidation”, the construction of gas infrastructure may be considered, not only to avoid resource waste in the “hollow villages” (where most of the young able-bodied workers have migrated or are migrating to the cities), but also to lay a foundation for future rural community development and energy consumption upgrades.
5.3 Solar Thermal Energy Systems
5.3.1 Technical descriptions and characteristics
To consume solar thermal energy, solar radiation needs to be captured by a collector and converted to thermal energy by interacting with other substances. Solar thermal energy can be used in solar water heaters, solar stoves and passive solar buildings. Solar water heaters can be divided into two types: natural circulation (passive) and forced circulation (active) . Natural circulation in solar thermal collectors is produced by the thermosiphon pressure head stemming from the temperature difference between the collector and the hot water storage tank. During the process, the useful energy gain stored in the collector is transferred to the water tank in the heated water. As the water temperature in the collector is raised by solar radiation, the water density decreases, driving the thermosiphon. Heated water thus gradually rises in the collector and flows to the upper part of the tank through the upper circulation pipe. At the same time, colder water flows to the bottom part of the tank through the lower circulation pipe. After a period, thermal stratification is created in the tank: the hot water in the upper part will be usable before the whole tank of water is gradually heated to the preset temperature. Forced circulation solar thermal systems can be created with or without a heat exchanger, respectively referred to as direct or indirect heating. Heat exchangers are installed between collectors and water tanks to create a double-loop system, which can help keep systems working when temperatures drop below freezing in areas of Northern China. In the double-loop system, water, mixed with an antifreeze compound, flows through the solar collector and, after being heated by solar input, transfers heat through a heat exchange system to water in the storage tank, which is then used to supply domestic hot water needs. In forced circulation systems, the fluid is pumped through the collector using an electric pump powered by electricity from the grid or from a small PV panel. Solar thermal energy technologies have the following characteristics: (1) solar energy is inexhaustible, clean, and non-polluting; (2) solar thermal energy devices are clean and safe. They are easy to operate and convenient to maintain; (3) Operating costs of the systems are low, and the operation does not require much support from external energy sources; and (4) solar thermal energy is intermittent due to the changes of weather and must therefore typically be supplemented with other types of energy.
5.3.2 Supply models and applications of solar thermal energy
The rural areas in the GBTH Region have abundant solar energy that can be utilized in solar thermal systems. For example, Inner Mongolia, northern Hebei, and northern Liaoning are designated as Class II or III areas of solar energy resources, where sunshine duration ranges between 2600 and 3400 hours annually, and the annual radiation received ranges between
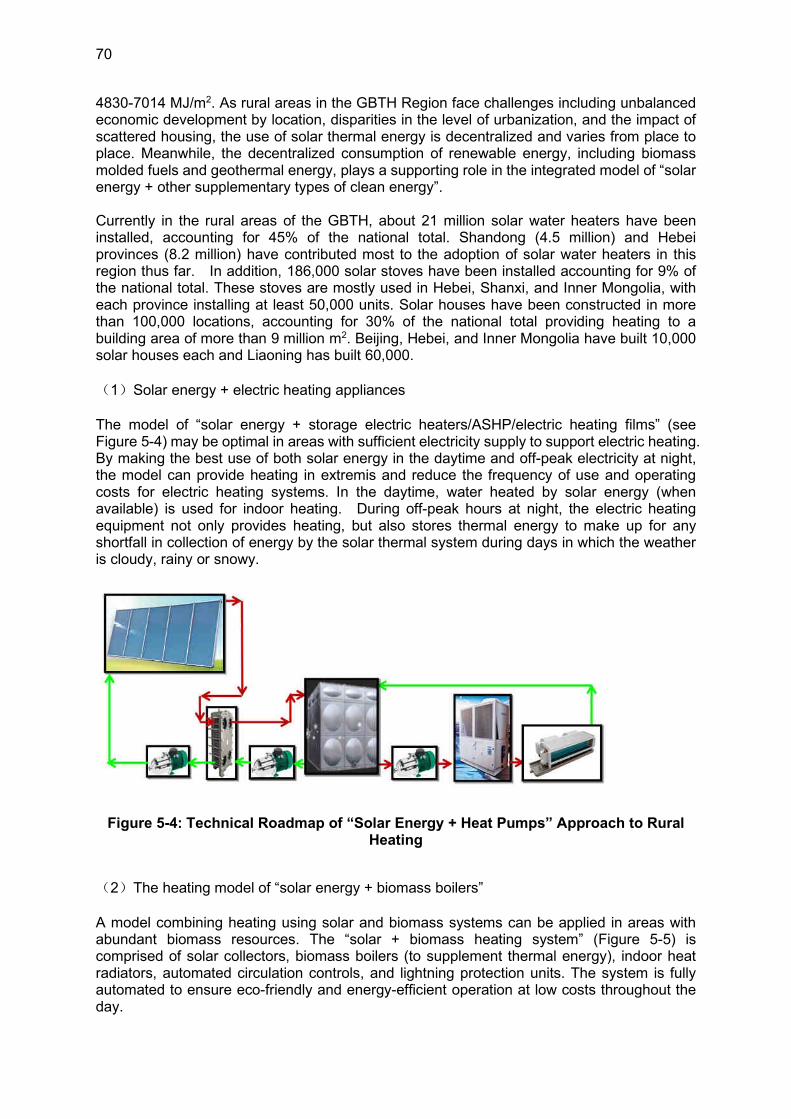
70
4830-7014 MJ/m2. As rural areas in the GBTH Region face challenges including unbalanced economic development by location, disparities in the level of urbanization, and the impact of scattered housing, the use of solar thermal energy is decentralized and varies from place to place. Meanwhile, the decentralized consumption of renewable energy, including biomass molded fuels and geothermal energy, plays a supporting role in the integrated model of “solar energy + other supplementary types of clean energy”. Currently in the rural areas of the GBTH, about 21 million solar water heaters have been installed, accounting for 45% of the national total. Shandong (4.5 million) and Hebei provinces (8.2 million) have contributed most to the adoption of solar water heaters in this region thus far. In addition, 186,000 solar stoves have been installed accounting for 9% of the national total. These stoves are mostly used in Hebei, Shanxi, and Inner Mongolia, with each province installing at least 50,000 units. Solar houses have been constructed in more than 100,000 locations, accounting for 30% of the national total providing heating to a building area of more than 9 million m2. Beijing, Hebei, and Inner Mongolia have built 10,000 solar houses each and Liaoning has built 60,000. (1)Solar energy + electric heating appliances The model of “solar energy + storage electric heaters/ASHP/electric heating films” (see Figure 5-4) may be optimal in areas with sufficient electricity supply to support electric heating. By making the best use of both solar energy in the daytime and off-peak electricity at night, the model can provide heating in extremis and reduce the frequency of use and operating costs for electric heating systems. In the daytime, water heated by solar energy (when available) is used for indoor heating. During off-peak hours at night, the electric heating equipment not only provides heating, but also stores thermal energy to make up for any shortfall in collection of energy by the solar thermal system during days in which the weather is cloudy, rainy or snowy.
Figure 5-4: Technical Roadmap of “Solar Energy + Heat Pumps” Approach to Rural Heating
(2)The heating model of “solar energy + biomass boilers” A model combining heating using solar and biomass systems can be applied in areas with abundant biomass resources. The “solar + biomass heating system” (Figure 5-5) is comprised of solar collectors, biomass boilers (to supplement thermal energy), indoor heat radiators, automated circulation controls, and lightning protection units. The system is fully automated to ensure eco-friendly and energy-efficient operation at low costs throughout the day.
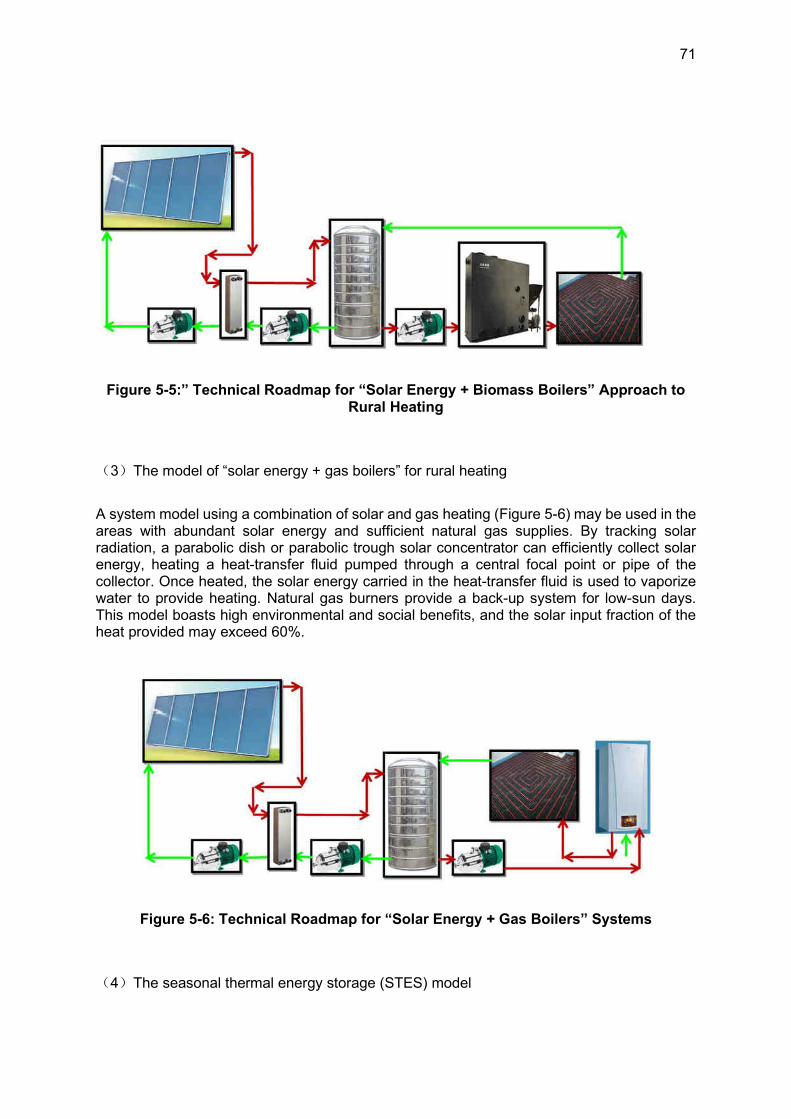
71
Figure 5-5:” Technical Roadmap for “Solar Energy + Biomass Boilers” Approach to Rural Heating
(3)The model of “solar energy + gas boilers” for rural heating
A system model using a combination of solar and gas heating (Figure 5-6) may be used in the areas with abundant solar energy and sufficient natural gas supplies. By tracking solar radiation, a parabolic dish or parabolic trough solar concentrator can efficiently collect solar energy, heating a heat-transfer fluid pumped through a central focal point or pipe of the collector. Once heated, the solar energy carried in the heat-transfer fluid is used to vaporize water to provide heating. Natural gas burners provide a back-up system for low-sun days. This model boasts high environmental and social benefits, and the solar input fraction of the heat provided may exceed 60%.
Figure 5-6: Technical Roadmap for “Solar Energy + Gas Boilers” Systems
(4)The seasonal thermal energy storage (STES) model
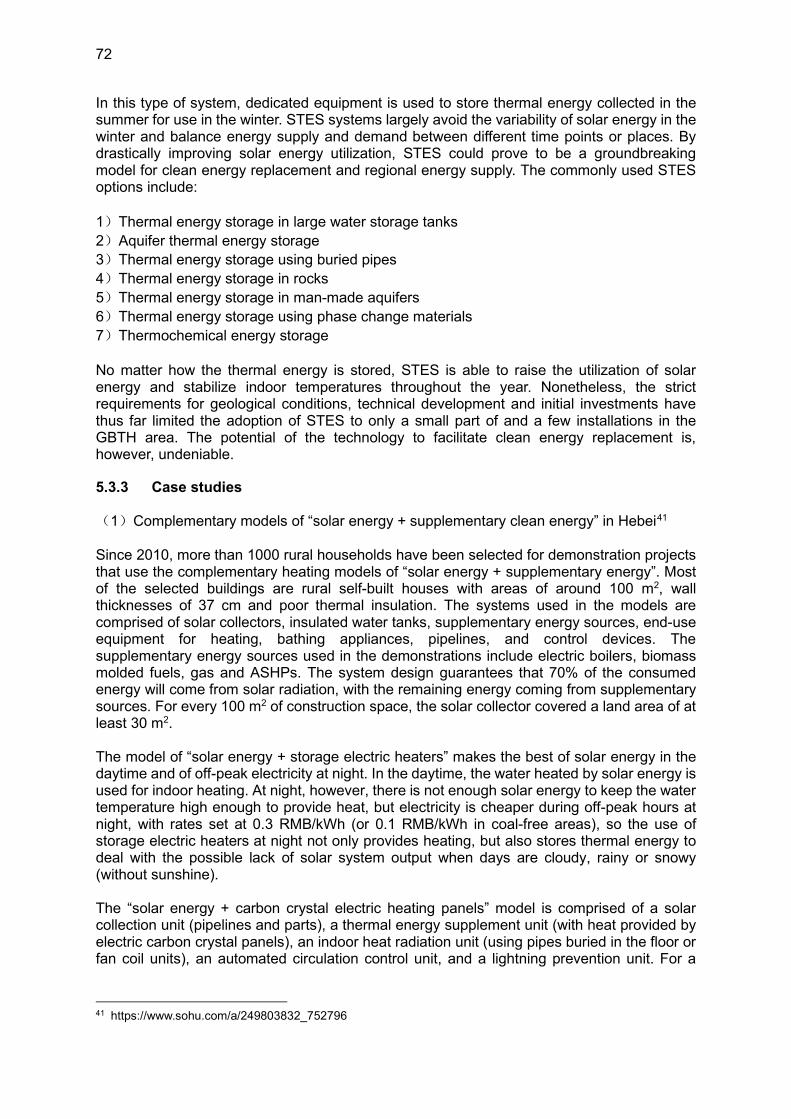
72
In this type of system, dedicated equipment is used to store thermal energy collected in the summer for use in the winter. STES systems largely avoid the variability of solar energy in the winter and balance energy supply and demand between different time points or places. By drastically improving solar energy utilization, STES could prove to be a groundbreaking model for clean energy replacement and regional energy supply. The commonly used STES options include: 1)Thermal energy storage in large water storage tanks 2)Aquifer thermal energy storage 3)Thermal energy storage using buried pipes 4)Thermal energy storage in rocks 5)Thermal energy storage in man-made aquifers 6)Thermal energy storage using phase change materials 7)Thermochemical energy storage No matter how the thermal energy is stored, STES is able to raise the utilization of solar energy and stabilize indoor temperatures throughout the year. Nonetheless, the strict requirements for geological conditions, technical development and initial investments have thus far limited the adoption of STES to only a small part of and a few installations in the GBTH area. The potential of the technology to facilitate clean energy replacement is, however, undeniable.
5.3.3 Case studies
(1)Complementary models of “solar energy + supplementary clean energy” in Hebei41
Since 2010, more than 1000 rural households have been selected for demonstration projects that use the complementary heating models of “solar energy + supplementary energy”. Most of the selected buildings are rural self-built houses with areas of around 100 m2, wall thicknesses of 37 cm and poor thermal insulation. The systems used in the models are comprised of solar collectors, insulated water tanks, supplementary energy sources, end-use equipment for heating, bathing appliances, pipelines, and control devices. The supplementary energy sources used in the demonstrations include electric boilers, biomass molded fuels, gas and ASHPs. The system design guarantees that 70% of the consumed energy will come from solar radiation, with the remaining energy coming from supplementary sources. For every 100 m2 of construction space, the solar collector covered a land area of at least 30 m2. The model of “solar energy + storage electric heaters” makes the best of solar energy in the daytime and of off-peak electricity at night. In the daytime, the water heated by solar energy is used for indoor heating. At night, however, there is not enough solar energy to keep the water temperature high enough to provide heat, but electricity is cheaper during off-peak hours at night, with rates set at 0.3 RMB/kWh (or 0.1 RMB/kWh in coal-free areas), so the use of storage electric heaters at night not only provides heating, but also stores thermal energy to deal with the possible lack of solar system output when days are cloudy, rainy or snowy (without sunshine). The “solar energy + carbon crystal electric heating panels” model is comprised of a solar collection unit (pipelines and parts), a thermal energy supplement unit (with heat provided by electric carbon crystal panels), an indoor heat radiation unit (using pipes buried in the floor or fan coil units), an automated circulation control unit, and a lightning prevention unit. For a
41 https://www.sohu.com/a/249803832_752796
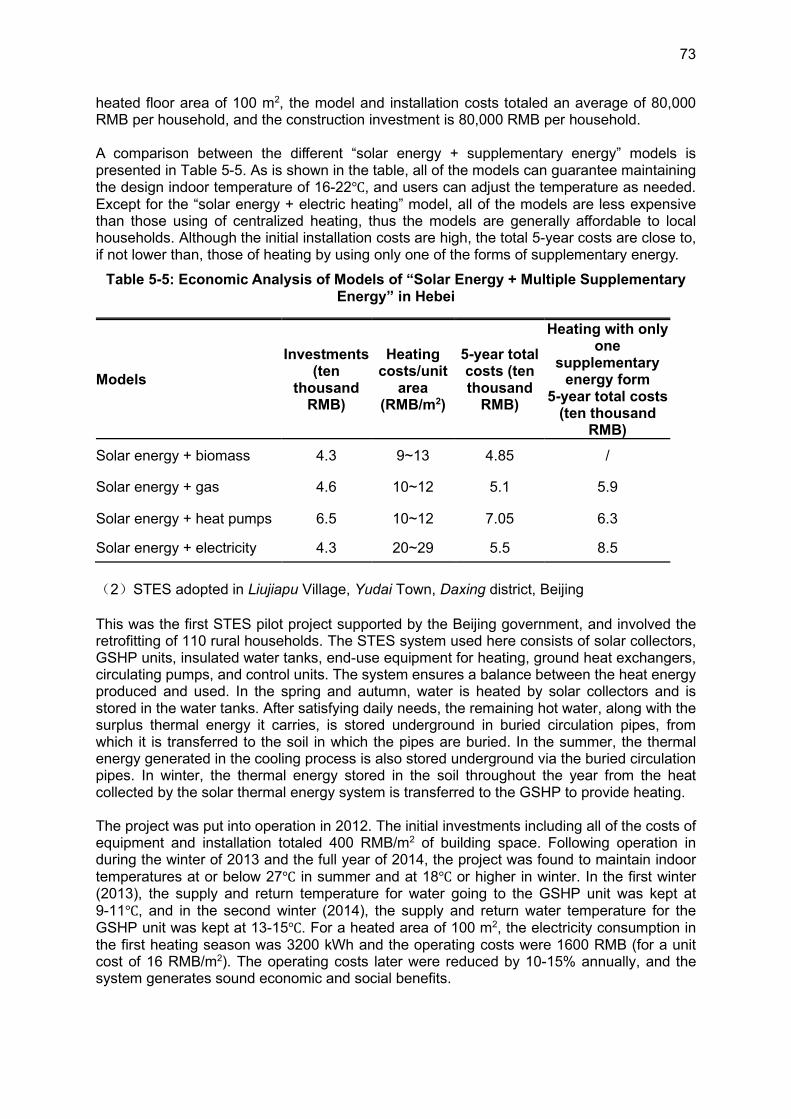
73
heated floor area of 100 m2, the model and installation costs totaled an average of 80,000 RMB per household, and the construction investment is 80,000 RMB per household. A comparison between the different “solar energy + supplementary energy” models is presented in Table 5-5. As is shown in the table, all of the models can guarantee maintaining the design indoor temperature of 16-22℃, and users can adjust the temperature as needed. Except for the “solar energy + electric heating” model, all of the models are less expensive than those using of centralized heating, thus the models are generally affordable to local households. Although the initial installation costs are high, the total 5-year costs are close to, if not lower than, those of heating by using only one of the forms of supplementary energy.
Table 5-5: Economic Analysis of Models of “Solar Energy + Multiple Supplementary Energy” in Hebei
Models
Investments (ten
thousand RMB)
Heating costs/unit
area (RMB/m2)
5-year total costs (ten thousand
RMB)
Heating with only one
supplementary energy form
5-year total costs (ten thousand
RMB)
Solar energy + biomass 4.3 9~13 4.85 /
Solar energy + gas 4.6 10~12 5.1 5.9
Solar energy + heat pumps 6.5 10~12 7.05 6.3
Solar energy + electricity 4.3 20~29 5.5 8.5
(2)STES adopted in Liujiapu Village, Yudai Town, Daxing district, Beijing This was the first STES pilot project supported by the Beijing government, and involved the retrofitting of 110 rural households. The STES system used here consists of solar collectors, GSHP units, insulated water tanks, end-use equipment for heating, ground heat exchangers, circulating pumps, and control units. The system ensures a balance between the heat energy produced and used. In the spring and autumn, water is heated by solar collectors and is stored in the water tanks. After satisfying daily needs, the remaining hot water, along with the surplus thermal energy it carries, is stored underground in buried circulation pipes, from which it is transferred to the soil in which the pipes are buried. In the summer, the thermal energy generated in the cooling process is also stored underground via the buried circulation pipes. In winter, the thermal energy stored in the soil throughout the year from the heat collected by the solar thermal energy system is transferred to the GSHP to provide heating. The project was put into operation in 2012. The initial investments including all of the costs of equipment and installation totaled 400 RMB/m2 of building space. Following operation in during the winter of 2013 and the full year of 2014, the project was found to maintain indoor temperatures at or below 27℃ in summer and at 18℃ or higher in winter. In the first winter (2013), the supply and return temperature for water going to the GSHP unit was kept at 9-11℃, and in the second winter (2014), the supply and return water temperature for the GSHP unit was kept at 13-15℃. For a heated area of 100 m2, the electricity consumption in the first heating season was 3200 kWh and the operating costs were 1600 RMB (for a unit cost of 16 RMB/m2). The operating costs later were reduced by 10-15% annually, and the system generates sound economic and social benefits.
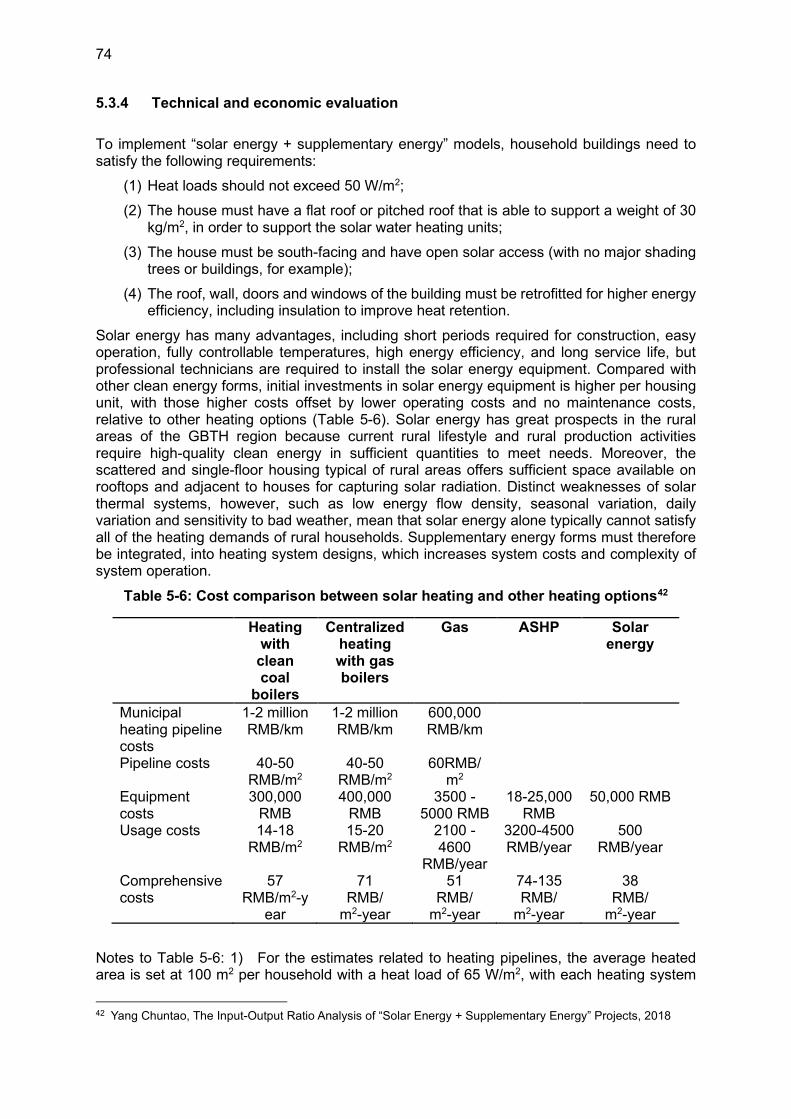
74
5.3.4 Technical and economic evaluation
To implement “solar energy + supplementary energy” models, household buildings need to satisfy the following requirements:
(1) Heat loads should not exceed 50 W/m2;
(2) The house must have a flat roof or pitched roof that is able to support a weight of 30 kg/m2, in order to support the solar water heating units;
(3) The house must be south-facing and have open solar access (with no major shading trees or buildings, for example);
(4) The roof, wall, doors and windows of the building must be retrofitted for higher energy efficiency, including insulation to improve heat retention.
Solar energy has many advantages, including short periods required for construction, easy operation, fully controllable temperatures, high energy efficiency, and long service life, but professional technicians are required to install the solar energy equipment. Compared with other clean energy forms, initial investments in solar energy equipment is higher per housing unit, with those higher costs offset by lower operating costs and no maintenance costs, relative to other heating options (Table 5-6). Solar energy has great prospects in the rural areas of the GBTH region because current rural lifestyle and rural production activities require high-quality clean energy in sufficient quantities to meet needs. Moreover, the scattered and single-floor housing typical of rural areas offers sufficient space available on rooftops and adjacent to houses for capturing solar radiation. Distinct weaknesses of solar thermal systems, however, such as low energy flow density, seasonal variation, daily variation and sensitivity to bad weather, mean that solar energy alone typically cannot satisfy all of the heating demands of rural households. Supplementary energy forms must therefore be integrated, into heating system designs, which increases system costs and complexity of system operation.
Table 5-6: Cost comparison between solar heating and other heating options42
Heating with clean coal
boilers
Centralized heating with gas boilers
Gas ASHP Solar energy
Municipal heating pipeline costs
1-2 million RMB/km
1-2 million RMB/km
600,000 RMB/km
Pipeline costs 40-50 RMB/m2
40-50 RMB/m2
60RMB/ m2
Equipment costs
300,000 RMB
400,000 RMB
3500 - 5000 RMB
18-25,000 RMB
50,000 RMB
Usage costs 14-18 RMB/m2
15-20 RMB/m2
2100 - 4600
RMB/year
3200-4500 RMB/year
500 RMB/year
Comprehensive costs
57 RMB/m2-y
ear
71 RMB/
m2-year
51 RMB/
m2-year
74-135 RMB/
m2-year
38 RMB/
m2-year
Notes to Table 5-6: 1) For the estimates related to heating pipelines, the average heated area is set at 100 m2 per household with a heat load of 65 W/m2, with each heating system
42 Yang Chuntao, The Input-Output Ratio Analysis of “Solar Energy + Supplementary Energy” Projects, 2018
75
covering 25,000 m2 (250 households) and using low-temperature heating (65/50℃); 2) Gas boilers are rated at 24/26 kW with a required gas flow rate of 2.6 m3/h and a total air flow volume of 1000 m3/h, a pipe size of DN150, and unit costs 500,000 RMB/km; 3) electricity supply of 10 kW per household, with electrical loads of 0.1 MW for 10 households, local power distribution networks at 10kV, and unit costs for electricity distribution of 800,000 RMB/km; 4) the costs of municipal pipeline construction includes fixed-asset investments in pipelines connected with municipal heat supply systems, as well as the pipelines between heating plants and households. The time frame for equipment depreciation is 12 years. The service life of gas boilers and heat pumps is assumed to be the same as for other domestic appliances, at 10 years. The time frame for the depreciation of solar energy equipment is 15 years, and the indoor end-use heating appliances used are the same across all types of heating systems.
5.3.5 Financing analysis
Rural households are unable to afford the required initial capital investment in solar energy equipment, but are able to cover the operating costs of the systems. As a result, to promote solar energy use, governments need to bear the majority of equipment costsso that rural households can be left responsible only for system operating and maintenance costs.
5.3.6 Areas suitable for solar heating application
In the rural areas of Inner Mongolia, northern Hebei and Liaoning, parts of Shandong, Shanxi and Henan provinces, solar energy models are applicable because these areas are endowed with abundant solar energy resources. Considering the potential land area requirements for solar energy systems, as well as the renewable energy resource distribution and types of resources, plus local energy development requirements and environmental constraints, the appropriate “solar energy + supplementary clean energy” models can be integrated with energy systems serving other rural sectors such as farming, agricultural plantations, livestock raising, aquaculture and forestry.
5.4 Centralized Energy Supply Systems Using Gasified Biomass
5.4.1 Technical descriptions and characteristics
Gasification is a process that converts biomass cellulose, under specific thermodynamic (temperature and pressure) conditions and through pyrolysis, oxidation and reduction, into combustible gases including carbon monoxide, hydrogen, and low molecular-weight hydrocarbons. In general, for woody and herbaceous biomass feed materials, the gasification process is carried out under atmospheric pressure (and this report deals with atmospheric pressure gasification technologies only). Atmospheric pressure gasification is carried out in a 0.1-0.12 MPa environment. Typically, the combustible gases generated have a gross calorific value in the range of 4-12 MJ/m3. A gas supply system that adopts using biomass pyrolysis gasification usually comprises a gasifier, a filter, an odorizer, a storage tank, a pressure regulator and other equipment. After biomass is fed into the gasifier (types include fixed bed gasifiers, fluidized bed gasifiers, and entrained flow gasifiers), its carbonaceous components are converted at a high temperature and either without a gasification agent present or with the injection of oxygen, steam, hydrogen, or other gasification agents, into combustible gases through thermochemical reactions. When the resulting producer gas passes through the purifier, impurities such as tar, ash, carbon particulates and water are removed. The cooled, filtered and odorized gas then goes through a gas compressor and into a pressurized tank or other storage device. When residents need fuel for cooking or heating, gas in the storage tank is depressurized as it flows through a pressure regulator and is delivered to households through a low-pressure gas transmission and distribution network.
76
Biomass gasification technologies have the following characteristics:
(1) They not only reduce pollution from disposal of straw and other wastes, but also increases the supply of high-grade energy (gas) by extracting value from what used to be waste. (2) They limit the production of NOX and produce clean, non-polluting gas that is convenient and efficient for rural residents to use. (3) There is a substantial supply of biomass resources that can be utilized, the use of which is in line with China’s “more gas, less coal” energy development strategy. Generally, one ton of straw can be converted into 1,000 to 2,000 m3 of combustible gas. (4) The technology can serve flexible and diversified end-uses. It can be used to supply heat, gas and electricity, and it can also be used in the production of end energy products such as liquid synthetic fuels and hydrogen. (5) Producer gas has a high calorific value and burns cleanly at high temperatures, neatly addressing some of the problems of poor performance of direct biomass combustion. (6) Seasonality in the supply of straw and other biomass feedstock and high storage costs have inhibited the promotion and application of biomass gasification technologies to some extent.
5.4.2 Centralized energy supply model using biomass gasification, and its
application
It is estimated that more than 900 million tons of crop straw is produced in China annually with an overall utilization rate of more than 80%. Still, huge quantities of straw are discarded or burned in the fields, causing serious impacts on local air quality. Biomass gasification technologies offer multiple advantages for addressing rural energy needs. A key input material for biomass gasification—straw—is abundantly available. Gasifier operators can obtain feedstocks from nearby crop fields and deliver gas to users close by. The adaptability and flexibility of the technology also makes it an excellent solution for peak regulation in a system with multiple complementary energy forms. Due to policy, technology, and market restrictions, however, this model has not yet been widely applied, the of projects carried out in China through 2020 numbering only around 800. Among these existing projects, a total of 528 projects are located in Beijing, Tianjin, Hebei and the surrounding areas, accounting for about 65% of the national total and supplying gas to more than 55,000 households. Liaoning Province is home to the most completed projects, at about 256, or more than one third of the national total. Only about 45% of the completed biomass gasification projects are in actual operation. Most of these use rice husks and rice hulls as feedstocks and generate low financial benefits on average. At present, the most widely used biomass gasification processes in rural areas are used in co-generation. Generally, centralized gas supply systems are built by larger villages or townships. The core of the system is the biomass gasification facility, with supporting equipment such as generator sets and heat supply pipeline systems. When commercialized, the system can produce multiple energy forms and products such as gas, electricity, heat and fertilizer in one integrated process, utilizing a production cycle of “biomass waste–pyrolysis gasification–gas-liquid separation–the supply of gas, power and heat–biochar fertilizer–wood vinegar liquid fertilizer–crop production,” thus providing financial and ecological benefits and promoting the establishment of regional agroecology (see Figure 5-7).
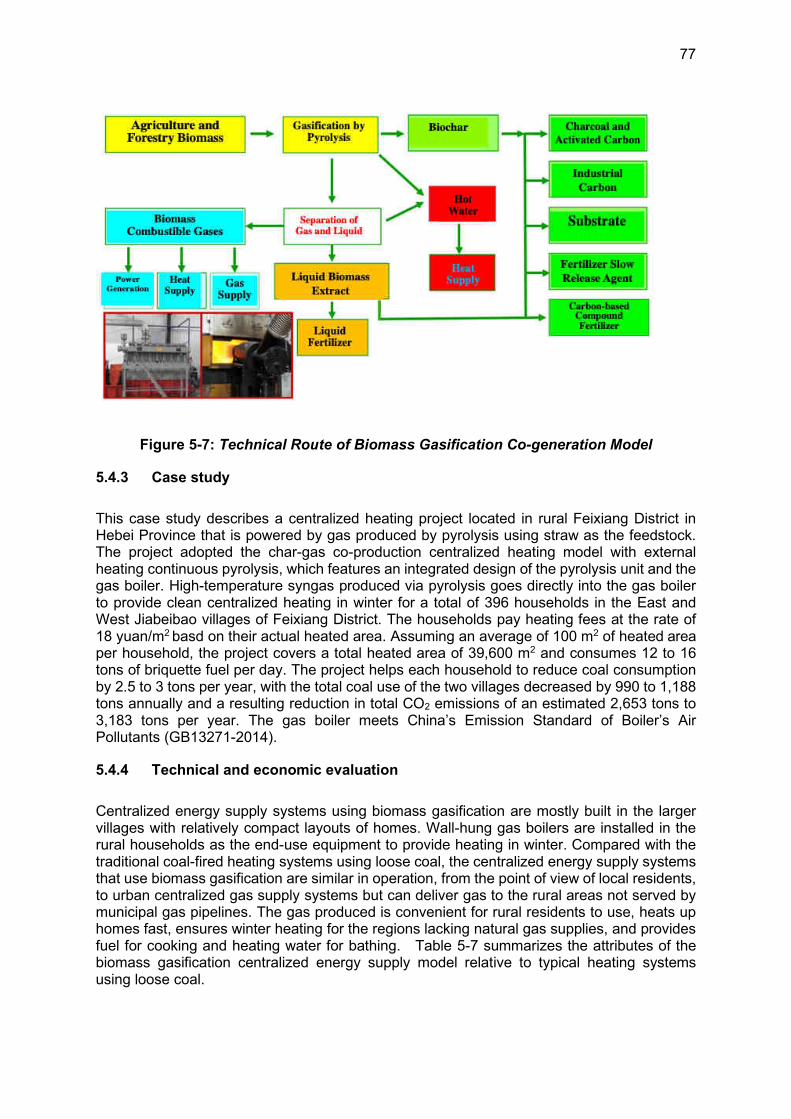
77
Figure 5-7: Technical Route of Biomass Gasification Co-generation Model
5.4.3 Case study
This case study describes a centralized heating project located in rural Feixiang District in Hebei Province that is powered by gas produced by pyrolysis using straw as the feedstock. The project adopted the char-gas co-production centralized heating model with external heating continuous pyrolysis, which features an integrated design of the pyrolysis unit and the gas boiler. High-temperature syngas produced via pyrolysis goes directly into the gas boiler to provide clean centralized heating in winter for a total of 396 households in the East and West Jiabeibao villages of Feixiang District. The households pay heating fees at the rate of 18 yuan/m2 basd on their actual heated area. Assuming an average of 100 m2 of heated area per household, the project covers a total heated area of 39,600 m2 and consumes 12 to 16 tons of briquette fuel per day. The project helps each household to reduce coal consumption by 2.5 to 3 tons per year, with the total coal use of the two villages decreased by 990 to 1,188 tons annually and a resulting reduction in total CO2 emissions of an estimated 2,653 tons to 3,183 tons per year. The gas boiler meets China’s Emission Standard of Boiler’s Air Pollutants (GB13271-2014).
5.4.4 Technical and economic evaluation
Centralized energy supply systems using biomass gasification are mostly built in the larger villages with relatively compact layouts of homes. Wall-hung gas boilers are installed in the rural households as the end-use equipment to provide heating in winter. Compared with the traditional coal-fired heating systems using loose coal, the centralized energy supply systems that use biomass gasification are similar in operation, from the point of view of local residents, to urban centralized gas supply systems but can deliver gas to the rural areas not served by municipal gas pipelines. The gas produced is convenient for rural residents to use, heats up homes fast, ensures winter heating for the regions lacking natural gas supplies, and provides fuel for cooking and heating water for bathing. Table 5-7 summarizes the attributes of the biomass gasification centralized energy supply model relative to typical heating systems using loose coal.
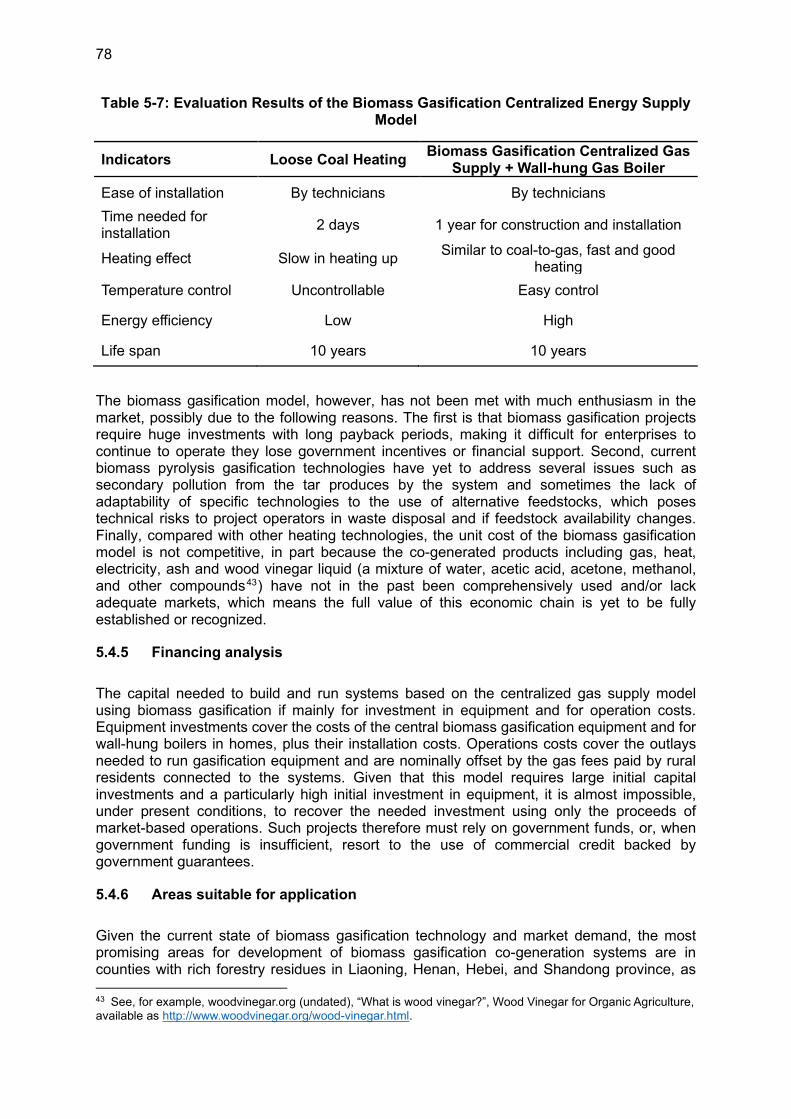
78
Table 5-7: Evaluation Results of the Biomass Gasification Centralized Energy Supply Model
Indicators Loose Coal Heating Biomass Gasification Centralized Gas
Supply + Wall-hung Gas Boiler
Ease of installation By technicians By technicians
Time needed for installation
2 days 1 year for construction and installation
Heating effect Slow in heating up Similar to coal-to-gas, fast and good
heating
Temperature control Uncontrollable Easy control
Energy efficiency Low High
Life span 10 years 10 years
The biomass gasification model, however, has not been met with much enthusiasm in the market, possibly due to the following reasons. The first is that biomass gasification projects require huge investments with long payback periods, making it difficult for enterprises to continue to operate they lose government incentives or financial support. Second, current biomass pyrolysis gasification technologies have yet to address several issues such as secondary pollution from the tar produces by the system and sometimes the lack of adaptability of specific technologies to the use of alternative feedstocks, which poses technical risks to project operators in waste disposal and if feedstock availability changes. Finally, compared with other heating technologies, the unit cost of the biomass gasification model is not competitive, in part because the co-generated products including gas, heat, electricity, ash and wood vinegar liquid (a mixture of water, acetic acid, acetone, methanol, and other compounds43) have not in the past been comprehensively used and/or lack adequate markets, which means the full value of this economic chain is yet to be fully established or recognized.
5.4.5 Financing analysis
The capital needed to build and run systems based on the centralized gas supply model using biomass gasification if mainly for investment in equipment and for operation costs. Equipment investments cover the costs of the central biomass gasification equipment and for wall-hung boilers in homes, plus their installation costs. Operations costs cover the outlays needed to run gasification equipment and are nominally offset by the gas fees paid by rural residents connected to the systems. Given that this model requires large initial capital investments and a particularly high initial investment in equipment, it is almost impossible, under present conditions, to recover the needed investment using only the proceeds of market-based operations. Such projects therefore must rely on government funds, or, when government funding is insufficient, resort to the use of commercial credit backed by government guarantees.
5.4.6 Areas suitable for application
Given the current state of biomass gasification technology and market demand, the most promising areas for development of biomass gasification co-generation systems are in counties with rich forestry residues in Liaoning, Henan, Hebei, and Shandong province, as
43 See, for example, woodvinegar.org (undated), “What is wood vinegar?”, Wood Vinegar for Organic Agriculture, available as http://www.woodvinegar.org/wood-vinegar.html.
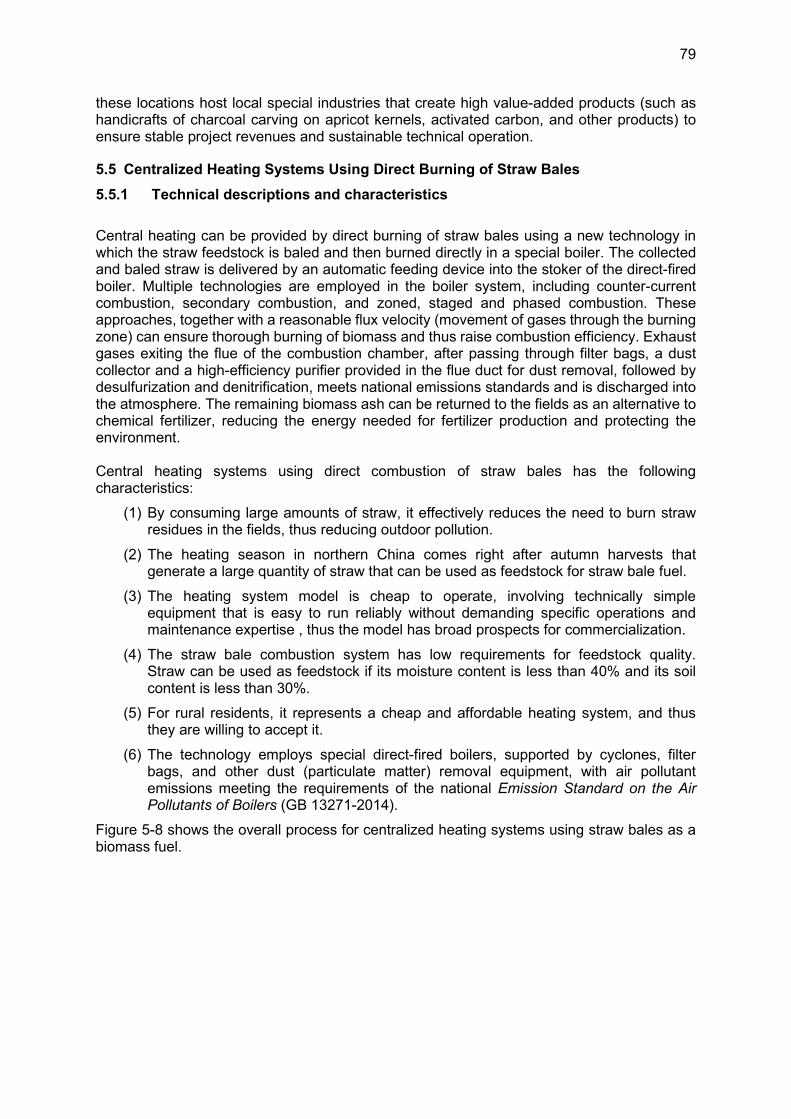
79
these locations host local special industries that create high value-added products (such as handicrafts of charcoal carving on apricot kernels, activated carbon, and other products) to ensure stable project revenues and sustainable technical operation.
5.5 Centralized Heating Systems Using Direct Burning of Straw Bales
5.5.1 Technical descriptions and characteristics
Central heating can be provided by direct burning of straw bales using a new technology in which the straw feedstock is baled and then burned directly in a special boiler. The collected and baled straw is delivered by an automatic feeding device into the stoker of the direct-fired boiler. Multiple technologies are employed in the boiler system, including counter-current combustion, secondary combustion, and zoned, staged and phased combustion. These approaches, together with a reasonable flux velocity (movement of gases through the burning zone) can ensure thorough burning of biomass and thus raise combustion efficiency. Exhaust gases exiting the flue of the combustion chamber, after passing through filter bags, a dust collector and a high-efficiency purifier provided in the flue duct for dust removal, followed by desulfurization and denitrification, meets national emissions standards and is discharged into the atmosphere. The remaining biomass ash can be returned to the fields as an alternative to chemical fertilizer, reducing the energy needed for fertilizer production and protecting the environment. Central heating systems using direct combustion of straw bales has the following characteristics:
(1) By consuming large amounts of straw, it effectively reduces the need to burn straw residues in the fields, thus reducing outdoor pollution.
(2) The heating season in northern China comes right after autumn harvests that generate a large quantity of straw that can be used as feedstock for straw bale fuel.
(3) The heating system model is cheap to operate, involving technically simple equipment that is easy to run reliably without demanding specific operations and maintenance expertise , thus the model has broad prospects for commercialization.
(4) The straw bale combustion system has low requirements for feedstock quality. Straw can be used as feedstock if its moisture content is less than 40% and its soil content is less than 30%.
(5) For rural residents, it represents a cheap and affordable heating system, and thus they are willing to accept it.
(6) The technology employs special direct-fired boilers, supported by cyclones, filter bags, and other dust (particulate matter) removal equipment, with air pollutant emissions meeting the requirements of the national Emission Standard on the Air Pollutants of Boilers (GB 13271-2014).
Figure 5-8 shows the overall process for centralized heating systems using straw bales as a biomass fuel.
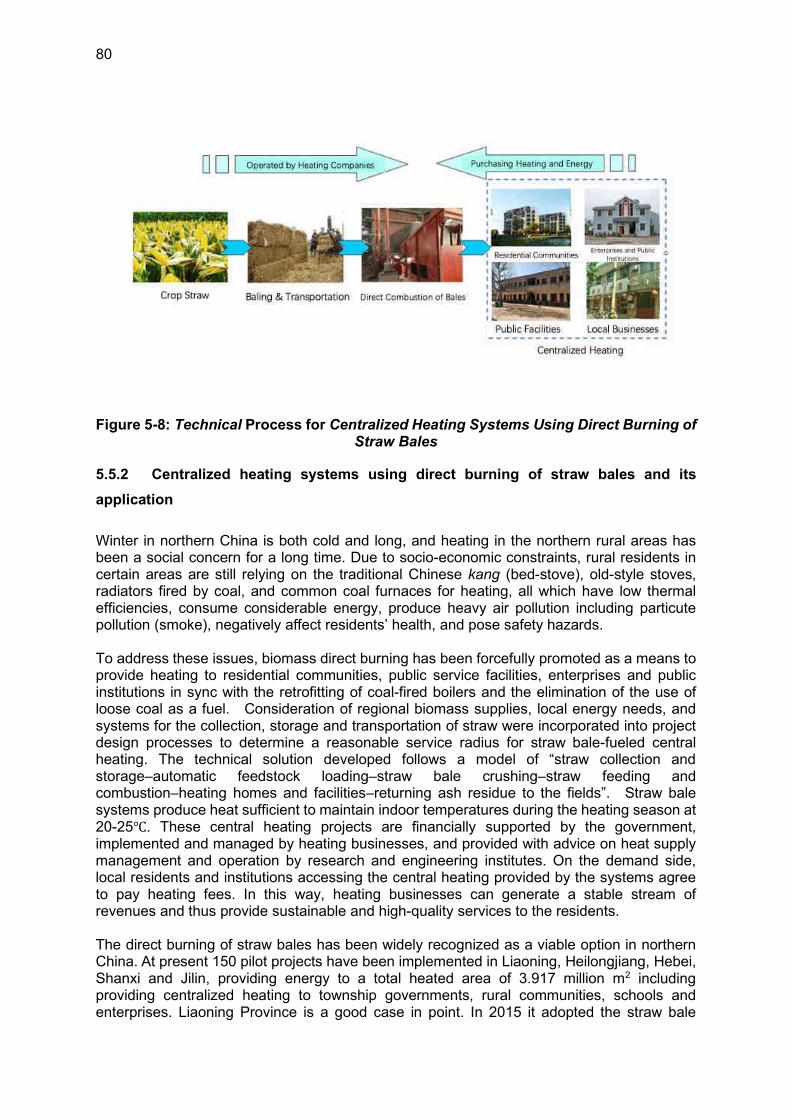
80
Figure 5-8: Technical Process for Centralized Heating Systems Using Direct Burning of Straw Bales
5.5.2 Centralized heating systems using direct burning of straw bales and its
application
Winter in northern China is both cold and long, and heating in the northern rural areas has been a social concern for a long time. Due to socio-economic constraints, rural residents in certain areas are still relying on the traditional Chinese kang (bed-stove), old-style stoves, radiators fired by coal, and common coal furnaces for heating, all which have low thermal efficiencies, consume considerable energy, produce heavy air pollution including particute pollution (smoke), negatively affect residents’ health, and pose safety hazards. To address these issues, biomass direct burning has been forcefully promoted as a means to provide heating to residential communities, public service facilities, enterprises and public institutions in sync with the retrofitting of coal-fired boilers and the elimination of the use of loose coal as a fuel. Consideration of regional biomass supplies, local energy needs, and systems for the collection, storage and transportation of straw were incorporated into project design processes to determine a reasonable service radius for straw bale-fueled central heating. The technical solution developed follows a model of “straw collection and storage–automatic feedstock loading–straw bale crushing–straw feeding and combustion–heating homes and facilities–returning ash residue to the fields”. Straw bale systems produce heat sufficient to maintain indoor temperatures during the heating season at 20-25℃. These central heating projects are financially supported by the government, implemented and managed by heating businesses, and provided with advice on heat supply management and operation by research and engineering institutes. On the demand side, local residents and institutions accessing the central heating provided by the systems agree to pay heating fees. In this way, heating businesses can generate a stable stream of revenues and thus provide sustainable and high-quality services to the residents. The direct burning of straw bales has been widely recognized as a viable option in northern China. At present 150 pilot projects have been implemented in Liaoning, Heilongjiang, Hebei, Shanxi and Jilin, providing energy to a total heated area of 3.917 million m2 including providing centralized heating to township governments, rural communities, schools and enterprises. Liaoning Province is a good case in point. In 2015 it adopted the straw bale
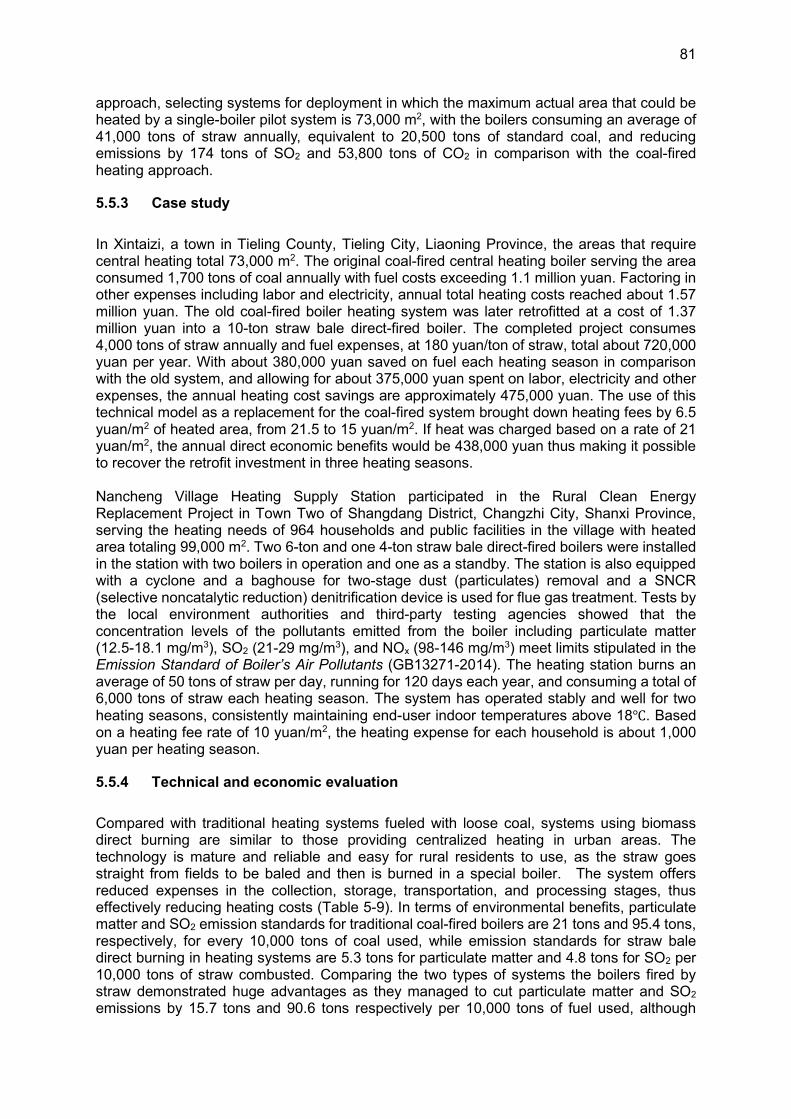
81
approach, selecting systems for deployment in which the maximum actual area that could be heated by a single-boiler pilot system is 73,000 m2, with the boilers consuming an average of 41,000 tons of straw annually, equivalent to 20,500 tons of standard coal, and reducing emissions by 174 tons of SO2 and 53,800 tons of CO2 in comparison with the coal-fired heating approach.
5.5.3 Case study
In Xintaizi, a town in Tieling County, Tieling City, Liaoning Province, the areas that require central heating total 73,000 m2. The original coal-fired central heating boiler serving the area consumed 1,700 tons of coal annually with fuel costs exceeding 1.1 million yuan. Factoring in other expenses including labor and electricity, annual total heating costs reached about 1.57 million yuan. The old coal-fired boiler heating system was later retrofitted at a cost of 1.37 million yuan into a 10-ton straw bale direct-fired boiler. The completed project consumes 4,000 tons of straw annually and fuel expenses, at 180 yuan/ton of straw, total about 720,000 yuan per year. With about 380,000 yuan saved on fuel each heating season in comparison with the old system, and allowing for about 375,000 yuan spent on labor, electricity and other expenses, the annual heating cost savings are approximately 475,000 yuan. The use of this technical model as a replacement for the coal-fired system brought down heating fees by 6.5 yuan/m2 of heated area, from 21.5 to 15 yuan/m2. If heat was charged based on a rate of 21 yuan/m2, the annual direct economic benefits would be 438,000 yuan thus making it possible to recover the retrofit investment in three heating seasons. Nancheng Village Heating Supply Station participated in the Rural Clean Energy Replacement Project in Town Two of Shangdang District, Changzhi City, Shanxi Province, serving the heating needs of 964 households and public facilities in the village with heated area totaling 99,000 m2. Two 6-ton and one 4-ton straw bale direct-fired boilers were installed in the station with two boilers in operation and one as a standby. The station is also equipped with a cyclone and a baghouse for two-stage dust (particulates) removal and a SNCR (selective noncatalytic reduction) denitrification device is used for flue gas treatment. Tests by the local environment authorities and third-party testing agencies showed that the concentration levels of the pollutants emitted from the boiler including particulate matter (12.5-18.1 mg/m3), SO2 (21-29 mg/m3), and NOx (98-146 mg/m3) meet limits stipulated in the Emission Standard of Boiler’s Air Pollutants (GB13271-2014). The heating station burns an average of 50 tons of straw per day, running for 120 days each year, and consuming a total of 6,000 tons of straw each heating season. The system has operated stably and well for two heating seasons, consistently maintaining end-user indoor temperatures above 18℃. Based on a heating fee rate of 10 yuan/m2, the heating expense for each household is about 1,000 yuan per heating season.
5.5.4 Technical and economic evaluation
Compared with traditional heating systems fueled with loose coal, systems using biomass direct burning are similar to those providing centralized heating in urban areas. The technology is mature and reliable and easy for rural residents to use, as the straw goes straight from fields to be baled and then is burned in a special boiler. The system offers reduced expenses in the collection, storage, transportation, and processing stages, thus effectively reducing heating costs (Table 5-9). In terms of environmental benefits, particulate matter and SO2 emission standards for traditional coal-fired boilers are 21 tons and 95.4 tons, respectively, for every 10,000 tons of coal used, while emission standards for straw bale direct burning in heating systems are 5.3 tons for particulate matter and 4.8 tons for SO2 per 10,000 tons of straw combusted. Comparing the two types of systems the boilers fired by straw demonstrated huge advantages as they managed to cut particulate matter and SO2 emissions by 15.7 tons and 90.6 tons respectively per 10,000 tons of fuel used, although
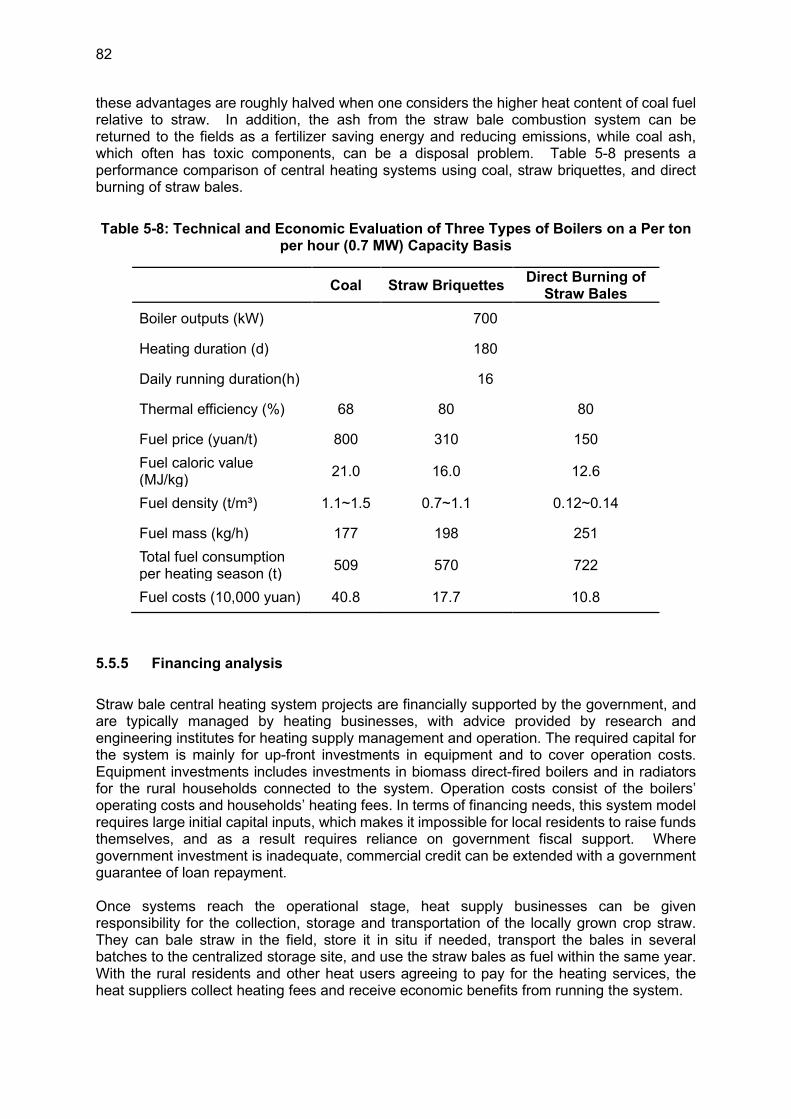
82
these advantages are roughly halved when one considers the higher heat content of coal fuel relative to straw. In addition, the ash from the straw bale combustion system can be returned to the fields as a fertilizer saving energy and reducing emissions, while coal ash, which often has toxic components, can be a disposal problem. Table 5-8 presents a performance comparison of central heating systems using coal, straw briquettes, and direct burning of straw bales.
Table 5-8: Technical and Economic Evaluation of Three Types of Boilers on a Per ton per hour (0.7 MW) Capacity Basis
Coal Straw Briquettes Direct Burning of
Straw Bales
Boiler outputs (kW) 700
Heating duration (d) 180
Daily running duration(h) 16
Thermal efficiency (%) 68 80 80
Fuel price (yuan/t) 800 310 150
Fuel caloric value (MJ/kg)
21.0 16.0 12.6
Fuel density (t/m³) 1.1~1.5 0.7~1.1 0.12~0.14
Fuel mass (kg/h) 177 198 251
Total fuel consumption per heating season (t)
509 570 722
Fuel costs (10,000 yuan) 40.8 17.7 10.8
5.5.5 Financing analysis
Straw bale central heating system projects are financially supported by the government, and are typically managed by heating businesses, with advice provided by research and engineering institutes for heating supply management and operation. The required capital for the system is mainly for up-front investments in equipment and to cover operation costs. Equipment investments includes investments in biomass direct-fired boilers and in radiators for the rural households connected to the system. Operation costs consist of the boilers’ operating costs and households’ heating fees. In terms of financing needs, this system model requires large initial capital inputs, which makes it impossible for local residents to raise funds themselves, and as a result requires reliance on government fiscal support. Where government investment is inadequate, commercial credit can be extended with a government guarantee of loan repayment. Once systems reach the operational stage, heat supply businesses can be given responsibility for the collection, storage and transportation of the locally grown crop straw. They can bale straw in the field, store it in situ if needed, transport the bales in several batches to the centralized storage site, and use the straw bales as fuel within the same year. With the rural residents and other heat users agreeing to pay for the heating services, the heat suppliers collect heating fees and receive economic benefits from running the system.
83
5.5.6 Areas suitable for application of straw bale heating systems
The model of centralized heating system using biomass direct burning is applicable to rural townships and villages with major crop farms. Most of the rural areas in Liaoning and Henan, as well as parts in Shandong and Hebei, are thus suitable for these systems. These regions have abundant and easily obtainable crop straw and are heavy consumers of energy for winter heating, but have relatively scarce local coal resources, which places high pressures on electricity supplies. The application of straw bale heating as a technical solution can effectively conserve energy and reduce emissions in the fields and villages, increase the utilization rate of straw, and ease pressure on regional energy supplies.
5.6 The Anaerobic Digestion Biogas Production System
5.6.1 Technical descriptions and characteristics
Anaerobic digestion (AD) for biogas production is a technology recognized around the world for its effectiveness treating organic waste and is suitable for utilizing biodegradable organic materials with high moisture contents. In AD systems, organic wastes such as straw, manure and household wastes, after simple sorting or pre-treatment, are introduced into the anaerobic digester and are converted by microorganisms under suitable concentration, temperature, pH, and other conditions into biogas that has methane, the key constituent of natural gas, as its primary component. Biogas is typically composed of 50-70% methane (CH4) and 30-50% of carbon dioxide (CO2), with a lower calorific value of 21-23 MJ/m3. After being desulfurized by a tower scrubber and going through a gas-liquid separator, the biogas is stored in a tank and can be injected into existing natural gas distribution systems or into biogas distribution systems to be provided to local rural households to support fuel household energy needs and productive activities. The technology can help to meet rural energy demand and at the same time helps to alleviate rural nonpoint source pollution associated with coal combustion and with waste disposal. Biogas systems have the following characteristics:
1) Rich sources of feedstocks: Livestock and poultry manure, crop straw, domestic sewage, food waste and processed agricultural waste can all be used for AD.
2) Significant energy and environmental benefits: The technology not only produces clean energy, but also enables treatment of crop straw and animal manure while reducing disposal needs.
3) Diversified utilization of end products: The purified biogas can be injected into the gas distribution system, used to provide heat and/or generate electricity, used power vehicles, compressed to be stored in tanks for use when and where needed.
4) The use of AD can help to build integrated farm systems combining stock raising and crop cultivation, thus promoting the sustainable development of green agriculture.
5) AD represents a mature technology with well-developed equipment readily available in China in many sizes and configurations, and a history of stable operation.
5.6.2 Anaerobic digestion biogas production technology and its application
At present, China’s AD biogas production technology is mostly applied in the low-polluting treatment of organic wastes such as livestock and poultry manure, straw, and domestic waste. In Europe, North America, and other regions, on the other hand, such projects are mostly implemented to produce clean energy. Generally, large-scale biogas projects are equipped
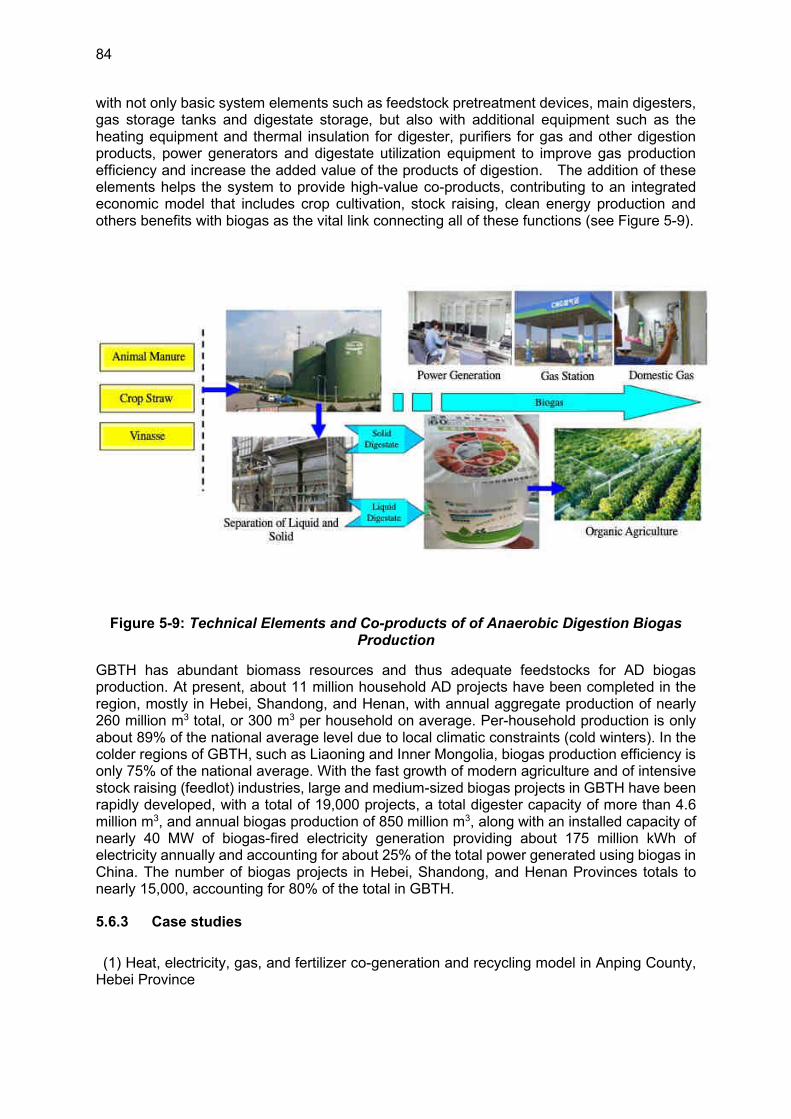
84
with not only basic system elements such as feedstock pretreatment devices, main digesters, gas storage tanks and digestate storage, but also with additional equipment such as the heating equipment and thermal insulation for digester, purifiers for gas and other digestion products, power generators and digestate utilization equipment to improve gas production efficiency and increase the added value of the products of digestion. The addition of these elements helps the system to provide high-value co-products, contributing to an integrated economic model that includes crop cultivation, stock raising, clean energy production and others benefits with biogas as the vital link connecting all of these functions (see Figure 5-9).
Figure 5-9: Technical Elements and Co-products of of Anaerobic Digestion Biogas Production
GBTH has abundant biomass resources and thus adequate feedstocks for AD biogas production. At present, about 11 million household AD projects have been completed in the region, mostly in Hebei, Shandong, and Henan, with annual aggregate production of nearly 260 million m3 total, or 300 m3 per household on average. Per-household production is only about 89% of the national average level due to local climatic constraints (cold winters). In the colder regions of GBTH, such as Liaoning and Inner Mongolia, biogas production efficiency is only 75% of the national average. With the fast growth of modern agriculture and of intensive stock raising (feedlot) industries, large and medium-sized biogas projects in GBTH have been rapidly developed, with a total of 19,000 projects, a total digester capacity of more than 4.6 million m3, and annual biogas production of 850 million m3, along with an installed capacity of nearly 40 MW of biogas-fired electricity generation providing about 175 million kWh of electricity annually and accounting for about 25% of the total power generated using biogas in China. The number of biogas projects in Hebei, Shandong, and Henan Provinces totals to nearly 15,000, accounting for 80% of the total in GBTH.
5.6.3 Case studies
(1) Heat, electricity, gas, and fertilizer co-generation and recycling model in Anping County, Hebei Province
85
Jing’an Bioenergy Technology Ltd. in Anping County, Hebei Province specializes in biogas and natural gas treatment. The company carries out county-wide comprehensive treatment of wastes produced from agricultural production and stock raising, including as crop straw and livestock and poultry manures. Using AD biogas production, biomass power generation, urban central heating, organic fertilizer production and other activities, Jing’an Bioenergy has established a co-generation and recycling system that produces heat, electricity, gas and fertilizer.
This project has invested more than 96 million yuan in the following systems:
1) A 2 MW biogas power generation project that annually processes 300,000 tons of animal manure, produces 6.57 million m3 of biogas, generates 15.12 million kWh of electricity, turns out 50,000 tons of bio-organic fertilizer and 200,000 tons of liquid fertilizer, and treats the manure of 100,000 stock pigs.
2) A renewable natural gas project of six completely mixed digesters with a total volume of 30,000 m3 that can utilizes 70,000 tons of corn stover, treats 100,000 tons of manure per year, produces an average of 11.52 million m3 of biogas (including 6.36 million m3 of purified methane) annually, and provides gas for heating and cooking for 8,595 households in the surrounding areas. Gas is distributed to users through the 182 km of medium and low-pressure gas transmission pipelines laid out as a part of the project.
3) A biomass combined heat and power (CHP) project that consumes about 280,000 tons of straw, generates 240 million kWh of power, and supplies 550,000 GJ of heat each year. The project replaces the use for heating of 100,000 tons of standard coal annually, cutting CO2 emissions by about 260,000 tons/yr. The biomass direct-fired power plant, using mostly waste straw and orchard residue as its feedstocks, generates and sells power to the grid. The company has obtained a special permit from the government to supply waste heat to residents living in the county seat, covering a total building area of 1.3 million m2. The ash produced during power generation is utilized by a fertilizer plant to produce bio-organic fertilizer.
(2) An integrated farming model enabled by biogas projects in Zhengding County, Hebei Province
Zhengding County in Hebei Province introduced a modern information management system to manage the existing household biogas digesters and large and medium-sized biogas projects in the county and explored an integrated farming system by engaging a third-party agency to develop a fertilizer business and support the provision of biogas. The intelligent biogas management system, developed with 200 yuan of government funding per household, enables measurable, monitorable and verifiable biogas consumption metering. The government uses the metering results to determine the level of subsidies paid to the management station, which is a cooperative organization of biomass system owners. The management station provides an innovative package of biogas management services, and members of the station pay fees to the station and enjoy access to the services. The company also runs a comprehensive biogas digestate project, with medium to large-sized biogas projects serving 400 to 1500 households or having volumes a 1000 m3 as the typical unit served, collects feedstock and recovers liquid and solid digestate that after processing is made into marketable organic fertilizers.
A processing plant with an annual digestate fertilizer output of 5,000 tons has been built and has been added to the government procurement supplier list. Its products have been used on more than 50,000 mu of farmland. The revenues generated from digestate fertilizer sales reached 3 million yuan per year based on a fertilizer price of 600 yuan per ton. The “all-inclusive” service package used in this project has raised the utilization rate of biogas to
86
90% and each household’s average annual gas consumption to 240 m3 Annually. This model has fully restored the gas-producing function of existing biogas projects, reduced the use of coal and other conventional energy sources, saved energy, and cut air pollutant emissions in rural areas. Annual biogas consumption through the project reached 360,000 m2, saving more than 250 tons/year of standard coal and reducing annual CO2 emissions by over 640 tons. Digestates produced by the biogas systems have been comprehensively utilized, addressing a key source rural nonpoint source pollution, reducing the use of chemical fertilizers and pesticides and improving the income of farmers.
5.6.4 Technical and economic evaluation
The development and utilization of AD biogas production technologies bring relatively low financial benefits but strong benefits in reducing environmental externalities. The construction of a biogas project often requires a large initial capital investment that requires a long payback period and offers a low internal rate of return. At present, the main financial benefits of most biogas projects are manifested by cost savings with little marketable output and basically no cash flow generated from products. Therefore, the benefits that have typically generated in the biogas projects are more reflected in the forms of clean energy and public goods provided, and these outputs are not marketable or a difficult to price, thus leaving their financial benefits hard to gauge
Under-utilization of biogas, digestate and digestate products has hampered the development of AD biogas systems in rural areas of China and has hindered full exploitation of the potential benefits from AD systems. In developing and utilizing the AD technology, efforts should be made to incorporating the processing of biogas co-products and the comprehensive utilization of digestate to build complete economic chains utilizing all of the AD system outputs and pollution control advantages for maximum financial and social benefit.
5.6.5 Areas suitable for application
Biomass AD technology is suitable for areas with developed crop cultivation and stock raising activities, especially those areas with rich resources of crop straw and livestock and poultry manure. Large-scale utilization of biomass will help to diversify the energy forms available, improve regional energy consumption structures, and build integrated farming models that leverage the crop cultivation and stock raising industries to consume AD residues/co-products.
5.7 Clean Cooking and Heating Appliances Solutions for Rural Households
5.7.1 Technical descriptions and characteristics
Clean cooking and heating appliances in rural homes mainly refer to the furnaces, stoves, kang and other energy-utilizing devices for cooking and heating in the rural households that are designed and built or manufactured according to the scientific combustion and thermodynamic principles. Compared with traditional appliances, clean appliances feature redesigned internal structures with transformed combustion chambers, air inlets, grates, supplemented insulation materials and waste heat utilization devices. When the fuel used has the specifications that a heating or cooking appliance was designed for, thermal efficiencies of fuel use (conversion of fuel energy to heat) can be as high as 70% or more. Clean cooking and heating appliances have the following characteristics:
(1) They are suitable for use with different fuels, such as biomass and coal, and can help utilize waste straw thus mitigate heavily-polluting burning of straw in the agricultural
87
fields, which is often used as a disposal method in the absence of other uses for straw.
(2) The appliances emit lower levels of SO2 and zero net CO2 when burning biomass fuel.
(3) Clean appliances suit the energy use habits of rural residents and can meet their heating and cooking needs at the same time.
(4) The supply chain for processed biomass fuels for clean rural appliances includes biomass waste collection, storage, and transportation, the production of briquette fuel, finished fuel transport and marketing, and the purchase and consumption of fuel by rural end-users.
(5) The quality of biomass fuel varies significantly, and the incorrect consumption of some types of biomass fuel (use under inappropriate conditions or in the wrong type of appliance) could cause indoor environmental pollution.
5.7.2 Technical model of “matching fuel with the cooking/heating appliances” and its application
A technical model for matching rural heating and cooking fuels with appropriate appliances was proposed by the Energy Efficient Cooking/heating Appliance Expert Committee of the China Association of Rural Energy Industry (CAREI) after many years of research and practical testing. The rationale for development of the model was that the characteristics of air pollutants emitted by heating or cooking appliances are determined by the combination of appliance performance and fuel properties. Only by matching suitable fuels with energy-efficient and environmentally friendly appliances can the concentration of air pollutants in flue gases be minimized. There are no flue gas-treating components in traditional cooking or heating appliances, making it impossible to control air pollutants once they have been formed during appliance operation. In comparison, clean cooking and heating appliances with matching fuels are not only equipped with flue gas treatment devices, but also offer substantial financial and environmental benefits. Testing has proved that thermal efficiency of clean cooking and heating appliances with matching fuels can reach more than 75% while that of the traditional appliances is only about 40%.
According to the Cooking/Heating Appliance Energy Efficiency Improvement Plan (2016-2020) proposed by CAREI, by 2020, China was to have disseminated 30 million energy-efficient and environmentally friendly cooking/heating appliances, replaced 30 million traditional units, and increased the thermal efficiency of rural cooking and heating in participating households by an average of 20 percentage points, saving 30 million tons of coal and reducing emissions by 78 million tons of CO2, 255,333 tons of SO2, 48,000 tons of NOX and 405,333 tons of particulate matter annually.44
In recent years, clean cooking and heating appliances have been widely promoted in the GBTH region. More than 16 million units of all types of clean cooking and heating appliances have been sold in this region, accounting for over 50% of the national total. More specifically,
44 Take bituminous coal now commonly used in rural areas as an example. Supposing a heated building area of 100 m2, heating stoves for an average household consume 3 tons of coal with a 40% thermal efficiency in one heating season. When the thermal efficiency is increased by 20 percentage points to 60%, equivalent to 1.0 ton of coal saved for each household.
88
the cooking and heating appliances applied in Liaoning, Shandong, and Hebei use biogas while the appliances widely used in Shanxi and Henan use clean coal.
5.7.3 Case Studies of “cooking and heating appliances with matching fuels”45
(1) “Clean coal + special heating appliance” project in Hegouzhang Village, Leling City, Shandong Province
Hegouzhang is a village with more than 100 households. Its average temperature range in January is -7℃~3℃, and for four months every year its villagers need heating. Most of them live in concrete bungalows with no insulation in the outer walls of the houses. The residents used to rely on coal-fired cooking and heating appliances, with 60% of the residents using traditional coal fired boiler for space heatingpriced between 800 and 1,000 yuan each, and 20% of households, because of their limited financial resources, heated their homes with traditional low-efficiency coal-fired stoves appliances priced at 80 to 150 yuan each. In 2016, to improve air quality, the local government vigorously promoted the use of clean cooking and heating appliances and clean coal products. Residents were given a 400-yuan subsidy for each energy efficient appliance purchased and a 200-yuan subsidy for each ton of clean coal they bought (the market price of clean coal is typically about 740 yuan/ton).
20 households in the village adopted the solution of “clean coal + special heating appliance.” The special heating appliances adopted are characterized by being convenient to use, easy to ignite, fast to raise room temperatures, and providing good heating effects. The appliances produce no odor and can maintain the indoor temperatures at 18~20℃. Based on the assumption of 150 m2 of heated area per household, a family, after switching to efficient and clean cooking and heating appliances and using matching clean coal as a fuel, consumes less than 2 tons of coal per heating season, spending about 1,500 yuan, and reducing SO2 emissions by more than 70%, NOX emissions by more than 50%, and soot (particulate) emissions by more than 80%.
(2) “Honeycomb coal + special heating appliance” project in Fuxing Ying, Xincheng District, Hohhot, Inner Mongolia
In Fuxingying, Xincheng District, winter temperatures are typically between -5℃~-15℃ and the annual heating season lasts 5 months. Most residents live in brick-and-tile structure bungalows with no thermal insulation in the outer walls, and with a small heated area of 20~30 m2. Locals typically have heated homes with homemade cooking and heating appliances fired with loose coal, and those with lower incomes burned firewood. In 2017, Hohhot City distributed 10,000 free clean cooking and heating appliances and 20,000 tons of square honeycomb coal briquettes to the residents of Fuxingying in a program utilizing government subsidies. The heating appliances provided are easy to use and provides stable combustion. Based on a heated area of 100 m2 per household, the adoption of the heating appliance reduces pollutant emissions and indoor odors and raises the thermal efficiency of coal briquette use to more than 80%, which can save about 1,500 yuan per household in heating expenses in one heating season.
(3) “Anthracite + special heating appliance” project in Tianjin
In 2014, Tianjin Municipality introduced its Implementation Plan for the Promotion of Advanced Household Cooking and Heating Appliances (anthracite cooking and heating appliances) in the Rural Areas of Tianjin. With the benefit of strong policy support, Jinghai
45 Research Report on Clean Heating in Northern Rural Areas (2018), Expert Panel of Clean Heating and Cooking Appliances for Civil Uses, China Rural Energy Industry Association.
89
County, Jinnan District and Beichen District successfully promoted the uptake of 30,000 clean cooking-heating appliances with a total power rating of about 400 MW and using about 100,000 tons of clean coal annually. The conversion to these appliances yielded an increase of 18% in the average thermal efficiency for cooking and heating appliances in the region, and a reduction of 21,000 tons per year of standard coal use.
(4) “BMF + special heating appliance” project in Chifeng City, Inner Mongolia
In 2015, Banlagou Village in Longchang Town, Bairin Left Banner, Chifeng City initiated a phased promotion across the village and installed 198 clean stove-style heating appliances. A biomass pellet mill was also set up to turn agricultural and animal waste into clean fuel. The wastes used to be burned in the fields. The biomass stoves can be used to heat homes, cook meals and keep the kang warm at the same time. When the stove is in use, hot flue gas pass through the kang and warm it, raising the overall thermal efficiency of the system above 80%. This heating system heats up fast and works well. When a villager purchases a biomass heating appliance at an average price of 350 yuan, he or she can receive 150 yuan as a government subsidy and can exchange the straw grown on 1 mu of field area for half a ton of BMF. The heating appliance can keep indoor temperatures at about 20℃ in winter. Before adopting the BMF stove, an average farming or herding family would typically consume 4 tons of straw and firewood for cooking, heating the kang, and boiling water each year. With the clean heating appliance, each household can cut its annual CO2 emissions by 1.5 tons. In a household that previously burned about 4 tons of coal per year, the use of the clean heating appliance reduced annual CO2 emissions by 1 ton and SO2 emissions by 0.05 ton. In each household, the BMF used in the stove annually is derived from 8 tons of straw and agricultural and herding waste, saving each household about 2,000 yuan in heating expenses (avoided costs for purchasing coal) every year. (5) The “Semi-coke + special boiler centralized heating” project in a middle school in Taiyuan, Shanxi Province
A middle school in Taiyuan, Shanxi has a heated area of 28,000 m2. The original heating system cost 31 yuan/m2 to operate, or a total of about 900,000 yuan each heating season. After adopting a 2-ton special semi-coke46 boiler for heating, the school consumed 120 tons of semi coke annually with fuel and operations costs totaling about 200,000 yuan in each heating season. The use of the semi-coke technology has not only helped to recover the project’s equipment investments in the very first year, but also saved more than 400,000 yuan compared with a typical central heating approach and has shown remarkable outcomes with respect to energy efficiency improvement and emissions reduction.
5.7.4 Technical and economic evaluation
The thermal efficiency of traditional cooking and heating appliances used in rural areas is typically only 30%-50%, and usually fails to meet emission standards, causing a huge waste of resources and seriously affecting local air quality. Most clean appliances used in rural
46 Semi-coke is a product made from coking coal that has “high fixed carbon, high specific resistivity, high chemical activity, low ash, low sulfur, low phosphorus and low moisture” (Coalician Carbon & Coke Co.,Ltd (2021), ,” Difference between Met Coke and Semi Coke”, dated October 25, 2021, and available as https://www.linkedin.com/pulse/difference-between-met-coke-semi-coalician-carbon-coke-co-ltd/?trk=organization-update-content_share-article) and is thus similar to anthracitic coal. Based on at least one study, Semi-coke offers lower emissions than bituminous or anthracite coal when burned in household stoves. See Qing Li, Xinghua Li, Jingkun Jiang, Lei Duan, Su Ge, Qi Zhang, Jianguo Deng, Shuxiao Wang, and Jiming Hao (2016), “Semi-coke briquettes: towards reducing emissions of primary PM2.5, particulate carbon and carbon monoxide from household coal combustion in China”, Scientific Reports, Volume 6, Article number: 19306, available as https://www.nature.com/articles/srep19306.
90
households apply the technology of reverse combustion—where air flow to the stove is managed so that tit is opposite to the direction of propagation of the flame, resulting in very efficient combustion—or a combination of forward and reverse combustion. These advanced stoves can use a wide variety of fuels and can burn continuously for a long time on one feeding of fuel. Thorough combustion of the fuel ensures high thermal efficiency and low emissions of harmful pollutants. At present, the average thermal efficiency of clean appliances used in rural households has reached 80.8%, with concentrations of particulate matter in flue gas of less than 30 mg/m3, concentrations of SO2 less than 10 mg/m3, NOX less than 150 mg/m3 and CO less than 0.10%, thus meeting the requirements of newly revised energy industry standards. These standards include “Technical Requirements for Clean Heating Appliances” (NB/T 34006 version filed for approval) and special emission limits for air pollutants of boilers in key areas as mandated in the national “Boiler Air Pollutant Emission Standards” (GB 13271-2014). In addition, the user costs of clean appliances in rural areas are significantly lower than those of heating with electricity or natural gas (see Table 5-9).
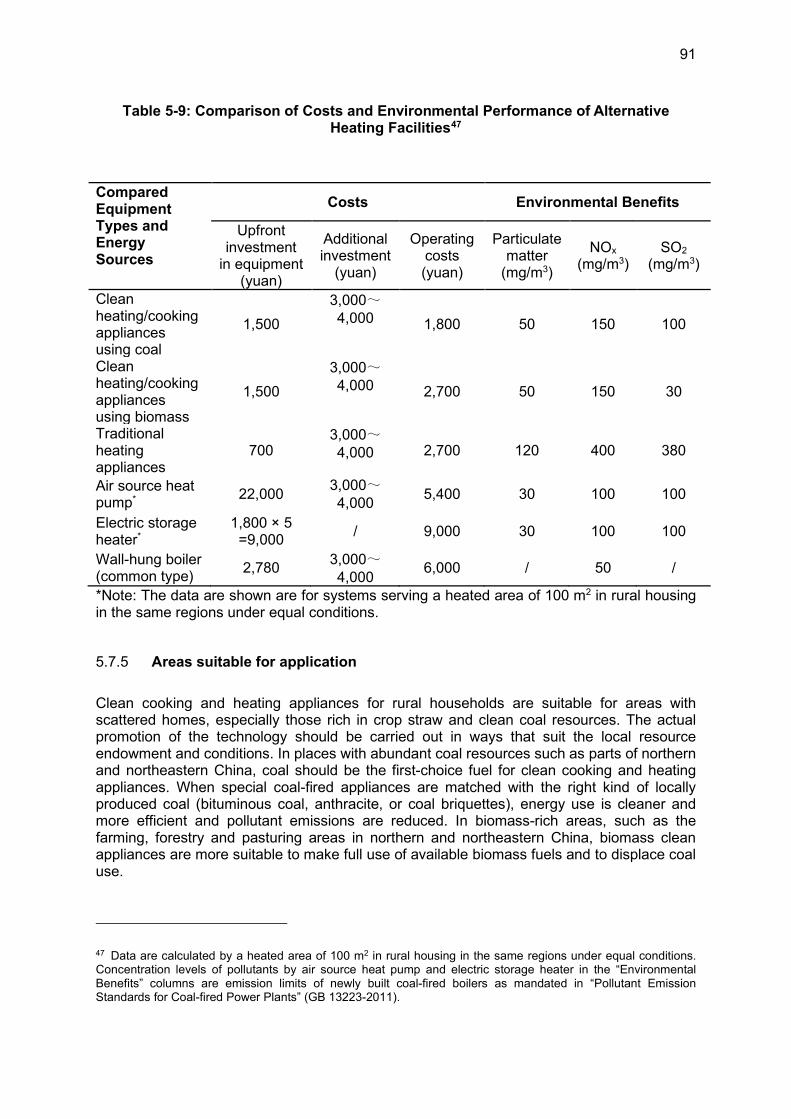
91
Table 5-9: Comparison of Costs and Environmental Performance of Alternative Heating Facilities47
*Note: The data are shown are for systems serving a heated area of 100 m2 in rural housing in the same regions under equal conditions.
5.7.5 Areas suitable for application
Clean cooking and heating appliances for rural households are suitable for areas with scattered homes, especially those rich in crop straw and clean coal resources. The actual promotion of the technology should be carried out in ways that suit the local resource endowment and conditions. In places with abundant coal resources such as parts of northern and northeastern China, coal should be the first-choice fuel for clean cooking and heating appliances. When special coal-fired appliances are matched with the right kind of locally produced coal (bituminous coal, anthracite, or coal briquettes), energy use is cleaner and more efficient and pollutant emissions are reduced. In biomass-rich areas, such as the farming, forestry and pasturing areas in northern and northeastern China, biomass clean appliances are more suitable to make full use of available biomass fuels and to displace coal use.
47 Data are calculated by a heated area of 100 m2 in rural housing in the same regions under equal conditions. Concentration levels of pollutants by air source heat pump and electric storage heater in the “Environmental Benefits” columns are emission limits of newly built coal-fired boilers as mandated in “Pollutant Emission Standards for Coal-fired Power Plants” (GB 13223-2011).
Compared Equipment Types and Energy Sources
Costs Environmental Benefits
Upfront investment
in equipment (yuan)
Additional investment
(yuan)
Operating costs (yuan)
Particulate matter
(mg/m3)
NOx
(mg/m3) SO2
(mg/m3)
Clean heating/cooking appliances using coal
1,500
3,000~4,000 1,800 50 150 100
Clean heating/cooking appliances using biomass
1,500
3,000~4,000 2,700 50 150 30
Traditional heating appliances
700 3,000~4,000 2,700 120 400 380
Air source heat pump*
22,000 3,000~4,000
5,400 30 100 100
Electric storage heater*
1,800 × 5 =9,000
/ 9,000 30 100 100
Wall-hung boiler (common type)
2,780 3,000~4,000
6,000 / 50 /
92
5.8 Energy-Efficient Buildings in Rural Areas
5.8.1 Technical composition and characteristics
Enhancement of rural building energy efficiency is focused on two aspects: thermal insulation of the building envelope and improvements in the building layout. The former mainly refers to installing appropriate thermal insulation measures for the building envelope (exterior walls, doors, windows, roof, and floor) to achieve the purpose of energy conservation. The thermal performance of the building envelope must meet the requirements specified in the relevant local specifications for building energy conservation, which vary by region in China. Meanwhile, the structural form of the building envelope is determined based on the consideration of factors such as local climate zones, resource endowment, residents’ living habits and state of economic development. As to the building layout, the key is to select appropriate structural forms, building materials and equipment and meet the requirements of structural safety, economic applicability, ventilation, daylighting, and sunshine conditions as specified in relevant national specifications and as appropriate for the local area. This technical models of building energy efficiency improvement and efficient homes build in a given rural area have the following characteristics: (1) They follow requirements for energy, land, water and materials conservation, and promote the application of water-saving equipment and energy efficient lamps; (2) The buildings constructed under the models are appropriate, economical, safe and aesthetic. In terms of architectural design, they have simple and regular layouts and there are no excessive concave or convex elements of the building in terms of their floor layouts or vertical profiles; (3) The models respect villagers’ working patterns and living habits, are able to meet their needs for productive and household activities, and provide guidance to create hygienic, scientific and comfortable lifestyles; (4) The models clearly separate spaces such as the bedrooms from other living spaces and separates the kitchen and dining spaces from the bathrooms. It ensures at least two south-facing bedrooms and direct lighting and natural ventilation in the kitchen and in the bathrooms; and (5) The models are suitable for the context of the particular village or town, reflect local features, and stays consistent with the form and patterns of the surrounding natural and built environment.
5.8.2 Technical descriptions and applications
Energy consumption in buildings affects energy security, social stability, and sustainable economic development. The development of energy-efficient building technologies in China needs to take into account the characteristics of building energy consumption and the urbanization level of a given area. Measures need to be taken to strengthen heat retention and air tightness through house renovation to reduce the demand for heating and realize energy conservation in buildings. At present, China’s national energy consumption in buildings is about 750 million tce annually. Energy consumption. In Rural buildings emits 1.3 billion tons of carbon emissions per year. Rural and urban buildings together account for 20% to 25% of China’s total energy
93
consumption. Beijing, Hebei, Liaoning, and other regions have continued to promote energy efficient buildings in recent years, enabling average building heat losses to be lowered to less than 15% and average energy consumption to be lowered to 53 kWh/m2. Several types of building energy efficiency measures have been applied in China, as described below.
(1) New building materials
Compared with traditional thermal insulation approaches, the energy-efficient building model adopts new building materials to insulate the building envelope. Cement blockwork that uses new thermal insulation reduces the thickness of the blocks, increases the thickness of the thermal insulation material layer, and incorporates thermal insulation materials with low thermal conductivity, light weight and low water absorption to fill the interior of the walls and blocks (as applicable) to improve the thermal insulation effect.
(2) Integrated wall structure
The model takes expanded polystyrene board as the insulation layer. The wall is built through the process of formwork and grouting, and is composed of rock wool boards with a structure that consists of expanded metal rib lath mesh and a metal keel so as to avoid thermal bridging effects in the walls. This structure has high strength, good seismic performance, light weight and can be constructed rapidly.
(3) Passive solar thermal storage wall
For rural detached houses, the building envelope itself can provide heat absorption, storage and release through the use of passive solar energy technologies. Solar thermal storage walls can adopt Trombe wall structures. Trombe walls are composed of 3 mm common white glass panels, a 105 mm thick air interlayer, aluminum alloy venetian blinds, and solid brick walls. These walls absorb solar energy to provide heating and use the wall to provide shading. A new Trombe wall technology has recently been developed in which the inside of the wall is hollow and consists of heating, heat storage and fresh air ventilation modules. When solar radiation is strong during the daytime, the ventilator is be turned on and outdoor fresh air enters the fresh air module. After being preheated by the heating module, the air is sent indoors through the air supply outlet. Meanwhile, the fan for the heat storage module is be turned on and the interlayer air enters the heat storage module through the air return inlet and is sent back to the rooftop heat storage layer after being heated.
(4) Thermal insulation technology for doors and windows
When it comes to the energy efficiency of a building, door and window materials and their cross-section forms are important factors that may affect the thermal insulation performance of the entire building. In northern China in particular, appropriate doors and windows should be selected so as to improve the building energy efficiency, including: (i) using PVC windows and glass fiber reinforced plastic windows to reduce heat loss to the outdoors in winter, use casement windows and apply sealing strips (weatherstripping) to improve the air tightness of doors and windows; (ii) hang thermal insulation curtains,reduce the ventilation rate (the rate at which outside air enters the building), and decrease heating loads; (iii) install double-glazed windows in most locations in GBTH, with even triple-glazed windows often appropriate in the severe cold areas of Northeast China, to enhance the thermal insulation effect by taking advantage of the layers of air or, in better units, an inert insulating gas, between window panels; and (iv) adding a foyer to the building to keep out wind and rain and effectively reduce the penetration of cold air caused by people coming in and out of the house.
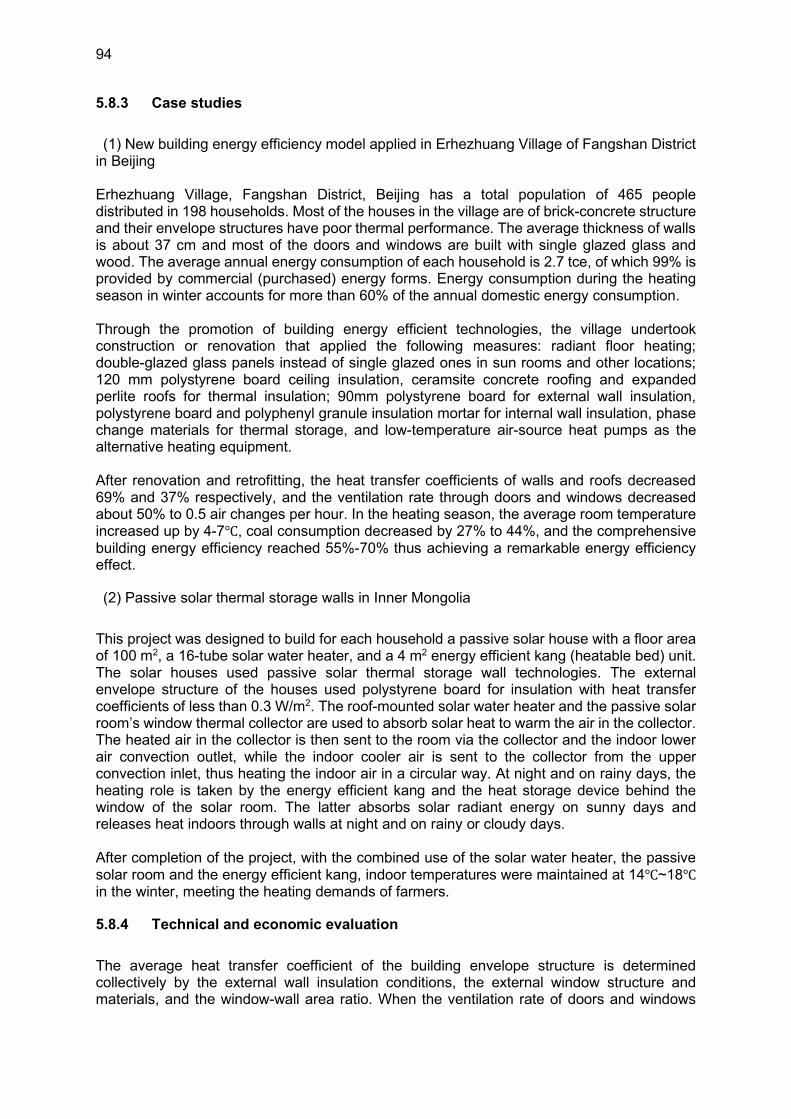
94
5.8.3 Case studies
(1) New building energy efficiency model applied in Erhezhuang Village of Fangshan District in Beijing Erhezhuang Village, Fangshan District, Beijing has a total population of 465 people distributed in 198 households. Most of the houses in the village are of brick-concrete structure and their envelope structures have poor thermal performance. The average thickness of walls is about 37 cm and most of the doors and windows are built with single glazed glass and wood. The average annual energy consumption of each household is 2.7 tce, of which 99% is provided by commercial (purchased) energy forms. Energy consumption during the heating season in winter accounts for more than 60% of the annual domestic energy consumption. Through the promotion of building energy efficient technologies, the village undertook construction or renovation that applied the following measures: radiant floor heating; double-glazed glass panels instead of single glazed ones in sun rooms and other locations; 120 mm polystyrene board ceiling insulation, ceramsite concrete roofing and expanded perlite roofs for thermal insulation; 90mm polystyrene board for external wall insulation, polystyrene board and polyphenyl granule insulation mortar for internal wall insulation, phase change materials for thermal storage, and low-temperature air-source heat pumps as the alternative heating equipment. After renovation and retrofitting, the heat transfer coefficients of walls and roofs decreased 69% and 37% respectively, and the ventilation rate through doors and windows decreased about 50% to 0.5 air changes per hour. In the heating season, the average room temperature increased up by 4-7℃, coal consumption decreased by 27% to 44%, and the comprehensive building energy efficiency reached 55%-70% thus achieving a remarkable energy efficiency effect.
(2) Passive solar thermal storage walls in Inner Mongolia
This project was designed to build for each household a passive solar house with a floor area of 100 m2, a 16-tube solar water heater, and a 4 m2 energy efficient kang (heatable bed) unit. The solar houses used passive solar thermal storage wall technologies. The external envelope structure of the houses used polystyrene board for insulation with heat transfer coefficients of less than 0.3 W/m2. The roof-mounted solar water heater and the passive solar room’s window thermal collector are used to absorb solar heat to warm the air in the collector. The heated air in the collector is then sent to the room via the collector and the indoor lower air convection outlet, while the indoor cooler air is sent to the collector from the upper convection inlet, thus heating the indoor air in a circular way. At night and on rainy days, the heating role is taken by the energy efficient kang and the heat storage device behind the window of the solar room. The latter absorbs solar radiant energy on sunny days and releases heat indoors through walls at night and on rainy or cloudy days. After completion of the project, with the combined use of the solar water heater, the passive solar room and the energy efficient kang, indoor temperatures were maintained at 14℃~18℃ in the winter, meeting the heating demands of farmers.
5.8.4 Technical and economic evaluation
The average heat transfer coefficient of the building envelope structure is determined collectively by the external wall insulation conditions, the external window structure and materials, and the window-wall area ratio. When the ventilation rate of doors and windows
95
increases from 0.5 to 1.5 air changes per hour, seasonal heat demand will increase by 0.15-0.2 GJ per m2 of floorspace. Using building energy efficiency technologies, the heat transfer coefficients of rural building envelopes can be reduced to less than 0.4 W/(m2-K), and the air leakage rate of doors and windows can be reduced to less than 0.5 air change per hour. Table 5-10 compare heat transfer coefficients for different building technologies.
Table 5-10: Comparison of heat transfer coefficients with different building envelopes and different qualities of doors and windows
Building Type Heat transfer
coefficient W/(m2-K)
Structure of doors and windows
Ventilation rate (air
changes/hr) Traditional brick-concrete structure
1-1.5 Poor exterior windows and air tightness
1-1.5
100 mm concrete slab and monolayer steel window
2 New doors and windows with building energy efficient technology
< 0.5
Modern urban buildings 0.7-1.2 New building energy efficient technology
0.4
The average heat demand for buildings in northern China in winter is 0.33 GJ/(m2-yr). With Beijing, Tianjin, and Hebei as example, for a building that meets the 50% energy-saving target, the heat demand will increase by 5%-6.5% if the indoor temperature rises by 1℃. Given that Beijing, Tianjin, Hebei, and their surrounding rural areas are mostly located in the northern cold areas, housing envelope insulation technologies have the greatest energy-saving potential and should be applied before applying other energy-efficient heating technologies, as the application of insulation can reduce the actual operation costs of heating technologies significantly. There are about 320,000 villages and towns in northern China. If 50% of the residential buildings applied building energy efficiency technologies, more than 50 million tons of coal could be saved every year, thus reducing the annual emissions of carbon dioxide by more than 200 million tons, or by 10% of annual the total carbon emissions from buildings in the nation. From the perspective of financing needs, the initial one-off capital investments for the promotion of building energy efficiency technologies are typically so high that ordinary farmers are not able to afford their share of the costs. Rural households therefore must typically reply on the government to provide investment funds or subsidies. The households with houses that meet target energy efficiency standards after construction or renovation are eligible to receive a subsidy to cover 50% of the additional cost involved. For example, if the energy efficiency renovation cost is about 8,000 yuan, then the farmer can receive a subsidy of about 4,000 yuan. The total subsidy for the northern rural areas could exceed 300 billion yuan if building energy efficiency technologies are widely adopted, but could annually save more than 40 million tce of energy and reduce CO2 emissions by 160 million tons.
5.8.5 Areas suitable for application
Rural building energy efficiency technologies are suitable (or can be readily adapted) for essentially all of the vast rural areas in China, but are particularly applicable in the severe cold and cold areas requiring winter heating in North, Northwest and Northeast China. The promotion and application of these technologies can reduce energy demand, raise energy efficiency effectively and improve the living standards of rural residents.

96
97
Chapter 6: International Best Practices for Rural Clean Energy Supply
6.1 Trends and Policies of Rural Renewable Energy Development in the Developed
Countries
As many countries become increasingly industrialized and urban, rural areas have found themselves in transition. In some countries, issues in rural areas include reduced population as young people move to cities to seek economic opportunities, encroachment of urban areas, and a reduction in available services as populations decrease. The GBTH region has experienced these trends as well in recent decades. Policymakers in many countries have identified these issues and started to address them via renewable energy systems. As an example, a 2011 report by the Organization for Economic Cooperation and Development (OECD) notes that renewable energy can provide rural communities with benefits that include:48
• Providing new sources of revenue, thus increasing the tax base to provide services for rural communities and providing an additional income stream for farmers and other landholders to help stabilize incomes as the prices of rural commodities and inputs fluctuate from year to year.
• Providing new job and business opportunities, especially when many actors are involved, and renewable energy activities are embedded in the local economy. Renewable energy can create valuable direct and indirect job opportunities for rural residents in areas where there may be otherwise limited employment opportunities, and where jobs and residents have been emigrating to rural areas.
• Spawning innovations in products, practices and policies in rural areas as renewable energy systems are implemented, and challenges associated with local implementation are addressed.
• Provide capacity building and community empowerment through training and experience gained by local actors in developing renewable energy systems.
• Providing affordable energy by providing rural regions, particularly in remote areas, with the opportunity to produce their own energy through rural systems, rather than transporting or transmitting forms of energy from outside the area. Sources of reliable and inexpensive energy can provide the foundation for further rural economic development even outsider of the renewable energy sector.
Distilling a number of case studies, the OECD summarizes some of the attributes of rural settings that can either support—making deployment more feasible and attractive—or impede—making deployment more difficult or unlikely—the implementation of renewable energy (RE) systems. Their results are provided in Table 6-1.
48 OECD (2011), Linking Renewable Energy to Rural Development: Executive Summary, Brief for Policy Makers, available as https://www.oecd.org/regional/regional-policy/Renewable-rural-energy-summary.pdf. Text of full study can be read at https://read.oecd-ilibrary.org/urban-rural-and-regional-development/linking-renewable-energy-to-rural-development_9789264180444-en#page1.
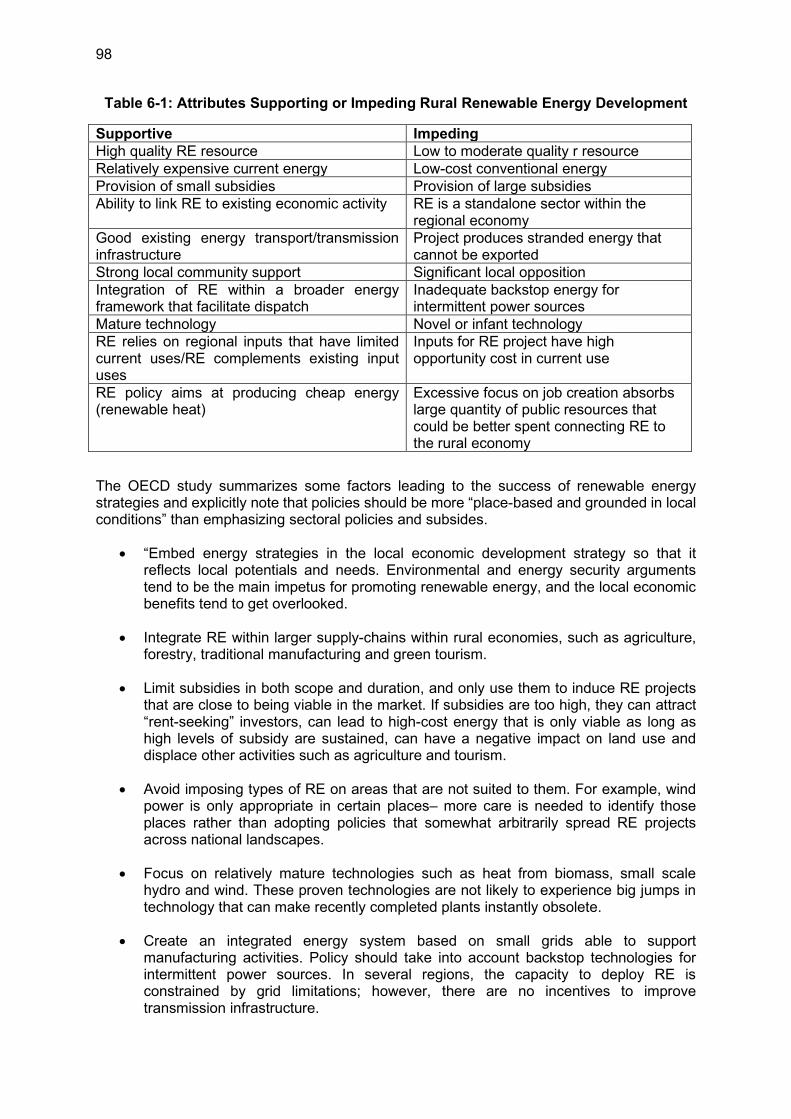
98
Table 6-1: Attributes Supporting or Impeding Rural Renewable Energy Development
Supportive Impeding High quality RE resource Low to moderate quality r resource Relatively expensive current energy Low-cost conventional energy Provision of small subsidies Provision of large subsidies Ability to link RE to existing economic activity RE is a standalone sector within the
regional economy Good existing energy transport/transmission infrastructure
Project produces stranded energy that cannot be exported
Strong local community support Significant local opposition Integration of RE within a broader energy framework that facilitate dispatch
Inadequate backstop energy for intermittent power sources
Mature technology Novel or infant technology RE relies on regional inputs that have limited current uses/RE complements existing input uses
Inputs for RE project have high opportunity cost in current use
RE policy aims at producing cheap energy (renewable heat)
Excessive focus on job creation absorbs large quantity of public resources that could be better spent connecting RE to the rural economy
The OECD study summarizes some factors leading to the success of renewable energy strategies and explicitly note that policies should be more “place-based and grounded in local conditions” than emphasizing sectoral policies and subsides.
• “Embed energy strategies in the local economic development strategy so that it reflects local potentials and needs. Environmental and energy security arguments tend to be the main impetus for promoting renewable energy, and the local economic benefits tend to get overlooked.
• Integrate RE within larger supply-chains within rural economies, such as agriculture, forestry, traditional manufacturing and green tourism.
• Limit subsidies in both scope and duration, and only use them to induce RE projects that are close to being viable in the market. If subsidies are too high, they can attract “rent-seeking” investors, can lead to high-cost energy that is only viable as long as high levels of subsidy are sustained, can have a negative impact on land use and displace other activities such as agriculture and tourism.
• Avoid imposing types of RE on areas that are not suited to them. For example, wind power is only appropriate in certain places– more care is needed to identify those places rather than adopting policies that somewhat arbitrarily spread RE projects across national landscapes.
• Focus on relatively mature technologies such as heat from biomass, small scale hydro and wind. These proven technologies are not likely to experience big jumps in technology that can make recently completed plants instantly obsolete.
• Create an integrated energy system based on small grids able to support manufacturing activities. Policy should take into account backstop technologies for intermittent power sources. In several regions, the capacity to deploy RE is constrained by grid limitations; however, there are no incentives to improve transmission infrastructure.
99
• Recognize that RE competes with other sectors for inputs, particularly land. Poor siting can adversely affect local residents and disrupt tourism, which is typically a much larger source of income and employment.
• Assess potential projects using investment criteria, and not on the basis of short-term subsidy levels.
• Ensure local social acceptance by ensuring clear benefits to local communities and engaging them in the process: this is crucial, as local opposition can slow construction and may increase the difficulty of subsequent efforts to introduce RE projects. ”49
Some of these factors are fully applicable to the current and future situation in GBTH, and some are likely less applicable. Consideration needs to be given to the local context. For example, solar photovoltaic prices have fallen, and solar technology has evolved so quickly, for example—in large part due to China’s leadership in PV manufacturing—that solar should certainly be included among the “mature technologies” listed. And Chinese national and provincial authorities tend to prefer, have access to, and use planning and policy approaches that may not be as available in the OECD. As such some of these findings, and the additional “lessons” described below, will need to be interpreted and adapted for use, as appropriate, in the GBTH context, which is also a moving target due to ongoing demographic, economic, technical, social, and cultural evolution.
6.1.1 Rural renewable energy trends
Although situations in rural areas can and do vary substantially by country, rural areas often share a number of attributes with respect to opportunities and considerations for renewable energy deployment. Among these shared attributes are:50
• Better opportunities for deployment of renewable energy relative to rural areas, due to the availability of open space for wind and solar energy deployment, and of biomass resources from agriculture and forestry.
• Lower income, and higher rates of poverty, on average, than urban areas.
• Relatively low, and often declining, rural populations as rural residents move to the cities in search of economic opportunity.
• Relatedly, needs for new local economic opportunities in order help persuade young people to remain, rather than moving to urban areas.
• For farmers and others dependent on natural resources, incomes that fluctuate from year to year due to changes in output due to varying weather conditions, episodic pests and diseases, changes in commodity prices for products and inputs, and other factors.
• A variety of energy end-uses ranging from applications similar to those found in urban areas—electricity, sometimes natural gas, and quite often LPG for residential and public/commercial use, as well as gasoline and diesel for transportation use—but also requirements for, for example, fuel for agricultural equipment and fuel and heat for
49 OECD (2011), ibid. 50 See, for example, United States Department of Agriculture (USDA, 2011), Renewable Power Opportunities for Rural Communities, dated April 2011, and available as https://www.usda.gov/oce/reports/energy/RenewablePowerOpportunities-Final.pdf.
100
agricultural, fisheries, and forest product processing and for other distinctly rural industries.
• Requirements for inorganic fertilizer (ammonium compounds and urea, for example) that are typically delivered from factories elsewhere in the country and/or imported from other nations.
• For electricity and sometimes natural gas, rural utility service is often provided by cooperative or municipal utilities, particularly in the United States, which have different characteristics in terms of investment needs, sources of investment funds, and business strategies relative to the often “investor-owned” (owned by those holding publicly traded stocks in the companies) utilities that often provide electricity and/or gas service.
In some cases, of course, there will be key differences between the situations in the rural areas of GBTH (and particularly Hebei) and those in developed countries, but it can be argued that many, if not all, of these differences are narrowing and will continue to narrow considerably as economic development, increases in rural productivity, and urbanization in GBTH continues.
With these general attributes of rural areas in mind, trends in renewable energy deployment in rural areas of North America, Europe, and other areas are discussed below are. Included are discussions of trends in deployment of non-electricity renewable energy systems as well as of three types of renewable electrical energy systems: those that are designed mostly to provide power for the central grid (such as wind and solar installations sharing space with agriculture), those designed to provide power to a rural area with a grid connection, and those designed to provide stand-alone power for a rural area. The presentations of non-electricity renewable energy trends include discussions of district heating system/thermal storage system deployment, biomass use as a source of heat and fuels, and renewable electricity as a source of hydrogen for use as a fuel in the transport or other sectors, and of ammonia for use as a fuel in transport or other sectors or as fertilizer. In some cases, these trends are well-established, whereas in other cases they are in early stages of development. It is important, however, in the context of this report, to consider both types of trends, as policies for rural energy development, as for the energy sector overall, must be guided by a comprehensive review of options for not only the short- and medium-terms, but for the long term as well.
(1) Non-electric Rural Renewable Energy Systems
In addition to electricity, rural renewable energy systems can provide heat, gaseous fuels, liquid fuels, and solid fuels for use in homes and businesses, for agricultural, forestry, and fisheries use, and for the transport sector.
Heat
Heat in the form of outputs from biomass and wood-fired boilers and furnaces, and from combined heat and power plants fired with renewable fuels, has been a feature of rural industries for many years. Agricultural and forestry products plants have used heat raised from biomass and wood combustion for use in food processing facilities, lumber drying kilns, pulp and paper mills, and other uses for decades, in some cases since the 1800s. Although not new, the use of these fuels to produce heat both for traditional rural industries and agriculture, using modern and efficient equipment, and for modern rural district heating systems are an option where biomass waste and/or wood fuels are available. Using these fuels, modern boiler and heat distribution systems, ideally accompanied by building energy
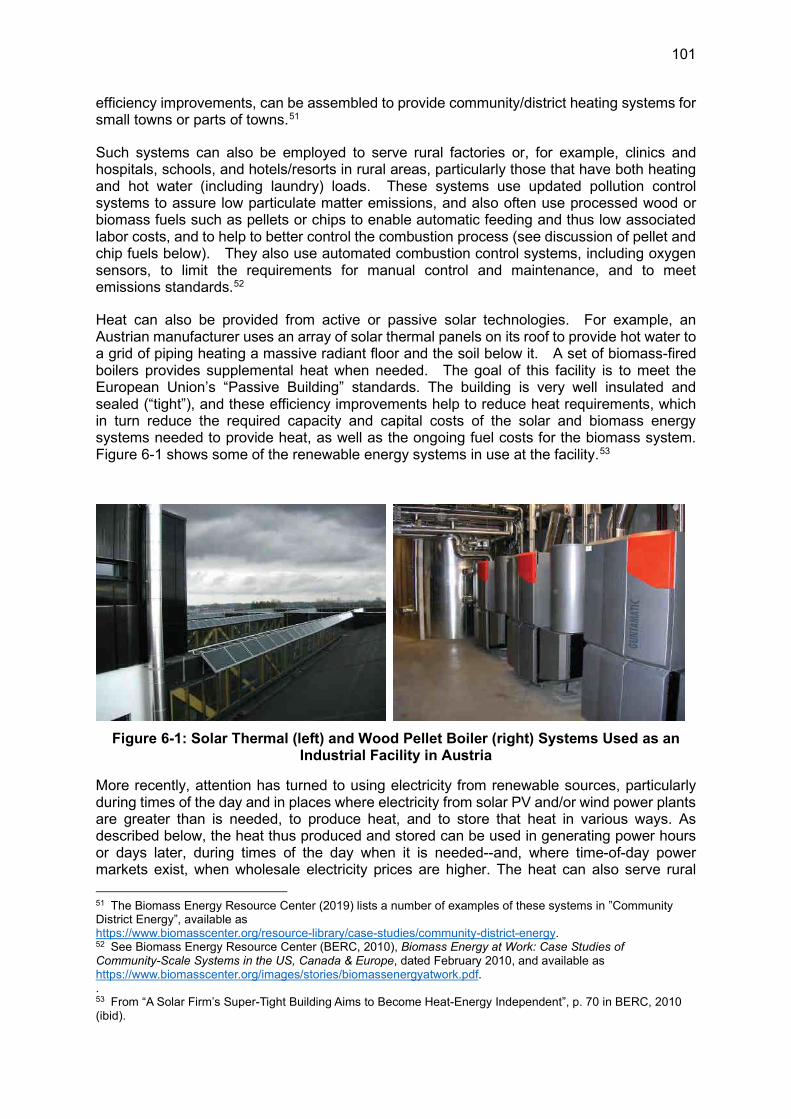
101
efficiency improvements, can be assembled to provide community/district heating systems for small towns or parts of towns.51
Such systems can also be employed to serve rural factories or, for example, clinics and hospitals, schools, and hotels/resorts in rural areas, particularly those that have both heating and hot water (including laundry) loads. These systems use updated pollution control systems to assure low particulate matter emissions, and also often use processed wood or biomass fuels such as pellets or chips to enable automatic feeding and thus low associated labor costs, and to help to better control the combustion process (see discussion of pellet and chip fuels below). They also use automated combustion control systems, including oxygen sensors, to limit the requirements for manual control and maintenance, and to meet emissions standards.52
Heat can also be provided from active or passive solar technologies. For example, an Austrian manufacturer uses an array of solar thermal panels on its roof to provide hot water to a grid of piping heating a massive radiant floor and the soil below it. A set of biomass-fired boilers provides supplemental heat when needed. The goal of this facility is to meet the European Union’s “Passive Building” standards. The building is very well insulated and sealed (“tight”), and these efficiency improvements help to reduce heat requirements, which in turn reduce the required capacity and capital costs of the solar and biomass energy systems needed to provide heat, as well as the ongoing fuel costs for the biomass system. Figure 6-1 shows some of the renewable energy systems in use at the facility.53
Figure 6-1: Solar Thermal (left) and Wood Pellet Boiler (right) Systems Used as an Industrial Facility in Austria
More recently, attention has turned to using electricity from renewable sources, particularly during times of the day and in places where electricity from solar PV and/or wind power plants are greater than is needed, to produce heat, and to store that heat in various ways. As described below, the heat thus produced and stored can be used in generating power hours or days later, during times of the day when it is needed--and, where time-of-day power markets exist, when wholesale electricity prices are higher. The heat can also serve rural
51 The Biomass Energy Resource Center (2019) lists a number of examples of these systems in ”Community District Energy”, available as https://www.biomasscenter.org/resource-library/case-studies/community-district-energy. 52 See Biomass Energy Resource Center (BERC, 2010), Biomass Energy at Work: Case Studies of Community-Scale Systems in the US, Canada & Europe, dated February 2010, and available as https://www.biomasscenter.org/images/stories/biomassenergyatwork.pdf. . 53 From “A Solar Firm’s Super-Tight Building Aims to Become Heat-Energy Independent”, p. 70 in BERC, 2010 (ibid).
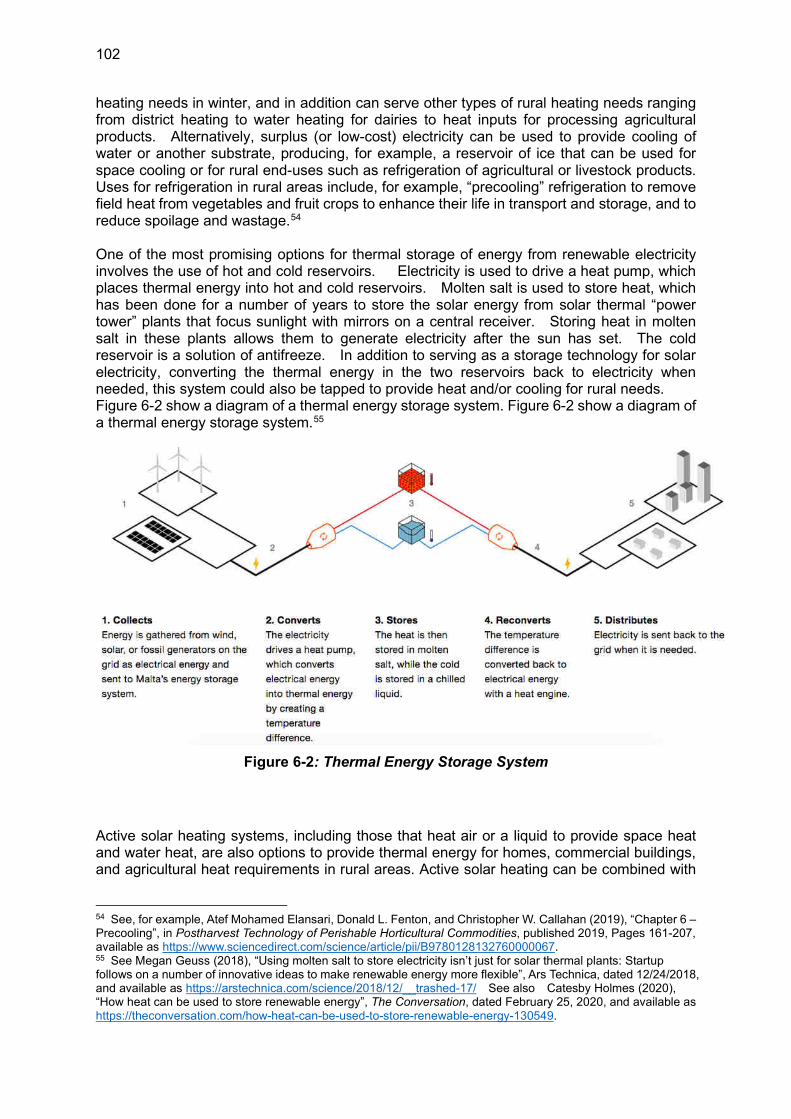
102
heating needs in winter, and in addition can serve other types of rural heating needs ranging from district heating to water heating for dairies to heat inputs for processing agricultural products. Alternatively, surplus (or low-cost) electricity can be used to provide cooling of water or another substrate, producing, for example, a reservoir of ice that can be used for space cooling or for rural end-uses such as refrigeration of agricultural or livestock products. Uses for refrigeration in rural areas include, for example, “precooling” refrigeration to remove field heat from vegetables and fruit crops to enhance their life in transport and storage, and to reduce spoilage and wastage.54 One of the most promising options for thermal storage of energy from renewable electricity involves the use of hot and cold reservoirs. Electricity is used to drive a heat pump, which places thermal energy into hot and cold reservoirs. Molten salt is used to store heat, which has been done for a number of years to store the solar energy from solar thermal “power tower” plants that focus sunlight with mirrors on a central receiver. Storing heat in molten salt in these plants allows them to generate electricity after the sun has set. The cold reservoir is a solution of antifreeze. In addition to serving as a storage technology for solar electricity, converting the thermal energy in the two reservoirs back to electricity when needed, this system could also be tapped to provide heat and/or cooling for rural needs. Figure 6-2 show a diagram of a thermal energy storage system. Figure 6-2 show a diagram of a thermal energy storage system.55
Figure 6-2: Thermal Energy Storage System
Active solar heating systems, including those that heat air or a liquid to provide space heat and water heat, are also options to provide thermal energy for homes, commercial buildings, and agricultural heat requirements in rural areas. Active solar heating can be combined with
54 See, for example, Atef Mohamed Elansari, Donald L. Fenton, and Christopher W. Callahan (2019), “Chapter 6 – Precooling”, in Postharvest Technology of Perishable Horticultural Commodities, published 2019, Pages 161-207, available as https://www.sciencedirect.com/science/article/pii/B9780128132760000067. 55 See Megan Geuss (2018), “Using molten salt to store electricity isn’t just for solar thermal plants: Startup follows on a number of innovative ideas to make renewable energy more flexible”, Ars Technica, dated 12/24/2018, and available as https://arstechnica.com/science/2018/12/__trashed-17/ See also Catesby Holmes (2020), “How heat can be used to store renewable energy”, The Conversation, dated February 25, 2020, and available as https://theconversation.com/how-heat-can-be-used-to-store-renewable-energy-130549.
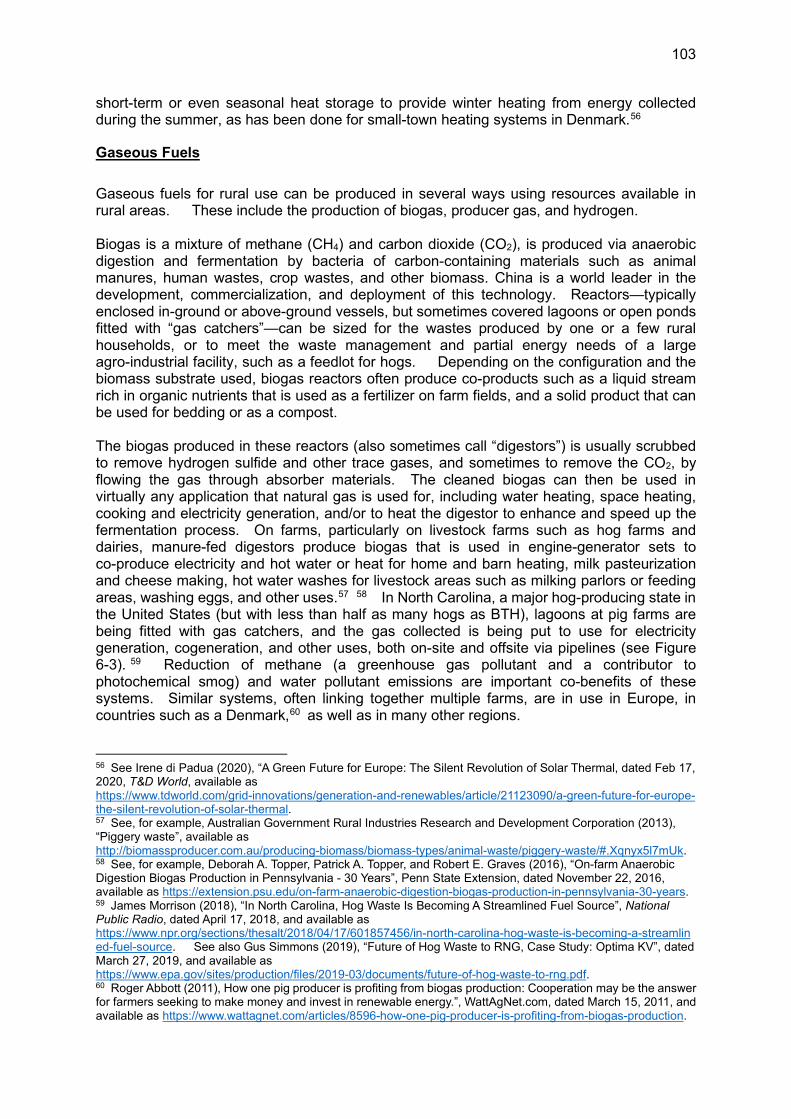
103
short-term or even seasonal heat storage to provide winter heating from energy collected during the summer, as has been done for small-town heating systems in Denmark.56
Gaseous Fuels
Gaseous fuels for rural use can be produced in several ways using resources available in rural areas. These include the production of biogas, producer gas, and hydrogen. Biogas is a mixture of methane (CH4) and carbon dioxide (CO2), is produced via anaerobic digestion and fermentation by bacteria of carbon-containing materials such as animal manures, human wastes, crop wastes, and other biomass. China is a world leader in the development, commercialization, and deployment of this technology. Reactors—typically enclosed in-ground or above-ground vessels, but sometimes covered lagoons or open ponds fitted with “gas catchers”—can be sized for the wastes produced by one or a few rural households, or to meet the waste management and partial energy needs of a large agro-industrial facility, such as a feedlot for hogs. Depending on the configuration and the biomass substrate used, biogas reactors often produce co-products such as a liquid stream rich in organic nutrients that is used as a fertilizer on farm fields, and a solid product that can be used for bedding or as a compost. The biogas produced in these reactors (also sometimes call “digestors”) is usually scrubbed to remove hydrogen sulfide and other trace gases, and sometimes to remove the CO2, by flowing the gas through absorber materials. The cleaned biogas can then be used in virtually any application that natural gas is used for, including water heating, space heating, cooking and electricity generation, and/or to heat the digestor to enhance and speed up the fermentation process. On farms, particularly on livestock farms such as hog farms and dairies, manure-fed digestors produce biogas that is used in engine-generator sets to co-produce electricity and hot water or heat for home and barn heating, milk pasteurization and cheese making, hot water washes for livestock areas such as milking parlors or feeding areas, washing eggs, and other uses.57 58 In North Carolina, a major hog-producing state in the United States (but with less than half as many hogs as BTH), lagoons at pig farms are being fitted with gas catchers, and the gas collected is being put to use for electricity generation, cogeneration, and other uses, both on-site and offsite via pipelines (see Figure 6-3). 59 Reduction of methane (a greenhouse gas pollutant and a contributor to photochemical smog) and water pollutant emissions are important co-benefits of these systems. Similar systems, often linking together multiple farms, are in use in Europe, in countries such as a Denmark,60 as well as in many other regions.
56 See Irene di Padua (2020), “A Green Future for Europe: The Silent Revolution of Solar Thermal, dated Feb 17, 2020, T&D World, available as https://www.tdworld.com/grid-innovations/generation-and-renewables/article/21123090/a-green-future-for-europe-the-silent-revolution-of-solar-thermal. 57 See, for example, Australian Government Rural Industries Research and Development Corporation (2013), “Piggery waste”, available as http://biomassproducer.com.au/producing-biomass/biomass-types/animal-waste/piggery-waste/#.Xqnyx5l7mUk. 58 See, for example, Deborah A. Topper, Patrick A. Topper, and Robert E. Graves (2016), “On-farm Anaerobic Digestion Biogas Production in Pennsylvania - 30 Years”, Penn State Extension, dated November 22, 2016, available as https://extension.psu.edu/on-farm-anaerobic-digestion-biogas-production-in-pennsylvania-30-years. 59 James Morrison (2018), “In North Carolina, Hog Waste Is Becoming A Streamlined Fuel Source”, National Public Radio, dated April 17, 2018, and available as https://www.npr.org/sections/thesalt/2018/04/17/601857456/in-north-carolina-hog-waste-is-becoming-a-streamlined-fuel-source. See also Gus Simmons (2019), “Future of Hog Waste to RNG, Case Study: Optima KV”, dated March 27, 2019, and available as https://www.epa.gov/sites/production/files/2019-03/documents/future-of-hog-waste-to-rng.pdf. 60 Roger Abbott (2011), How one pig producer is profiting from biogas production: Cooperation may be the answer for farmers seeking to make money and invest in renewable energy.”, WattAgNet.com, dated March 15, 2011, and available as https://www.wattagnet.com/articles/8596-how-one-pig-producer-is-profiting-from-biogas-production.
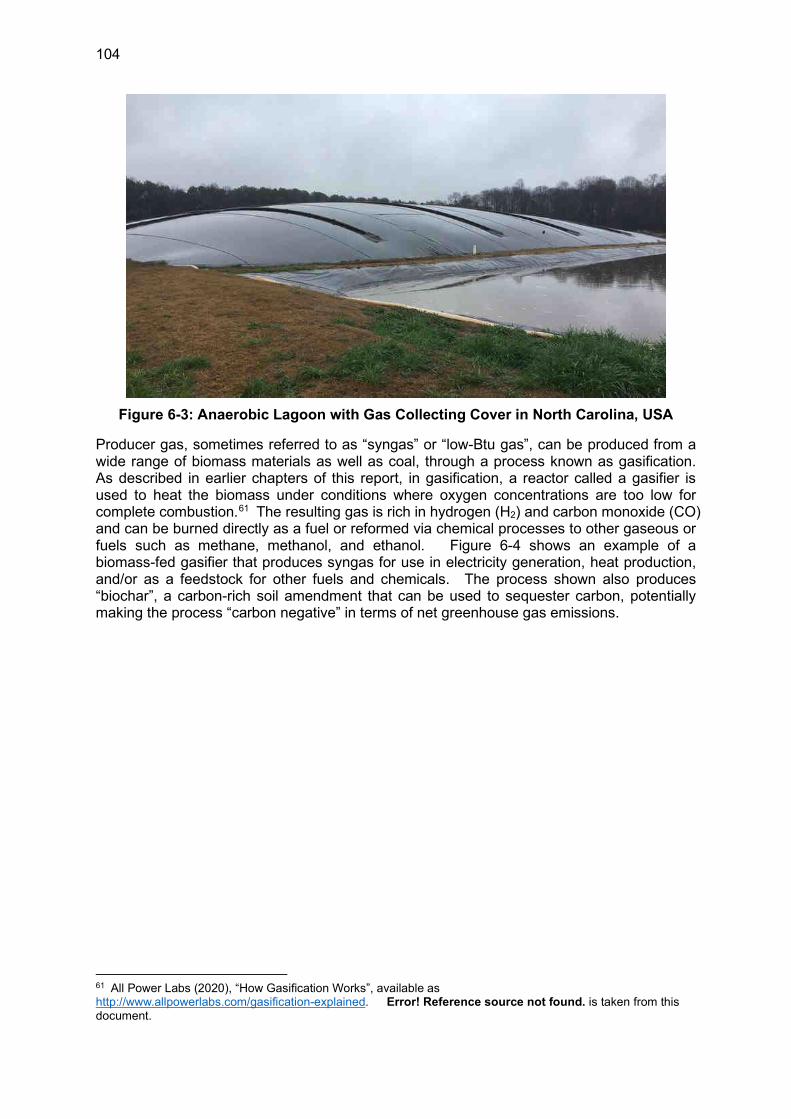
104
Figure 6-3: Anaerobic Lagoon with Gas Collecting Cover in North Carolina, USA
Producer gas, sometimes referred to as “syngas” or “low-Btu gas”, can be produced from a wide range of biomass materials as well as coal, through a process known as gasification. As described in earlier chapters of this report, in gasification, a reactor called a gasifier is used to heat the biomass under conditions where oxygen concentrations are too low for complete combustion.61 The resulting gas is rich in hydrogen (H2) and carbon monoxide (CO) and can be burned directly as a fuel or reformed via chemical processes to other gaseous or fuels such as methane, methanol, and ethanol. Figure 6-4 shows an example of a biomass-fed gasifier that produces syngas for use in electricity generation, heat production, and/or as a feedstock for other fuels and chemicals. The process shown also produces “biochar”, a carbon-rich soil amendment that can be used to sequester carbon, potentially making the process “carbon negative” in terms of net greenhouse gas emissions.
61 All Power Labs (2020), “How Gasification Works”, available as http://www.allpowerlabs.com/gasification-explained. Error! Reference source not found. is taken from this document.
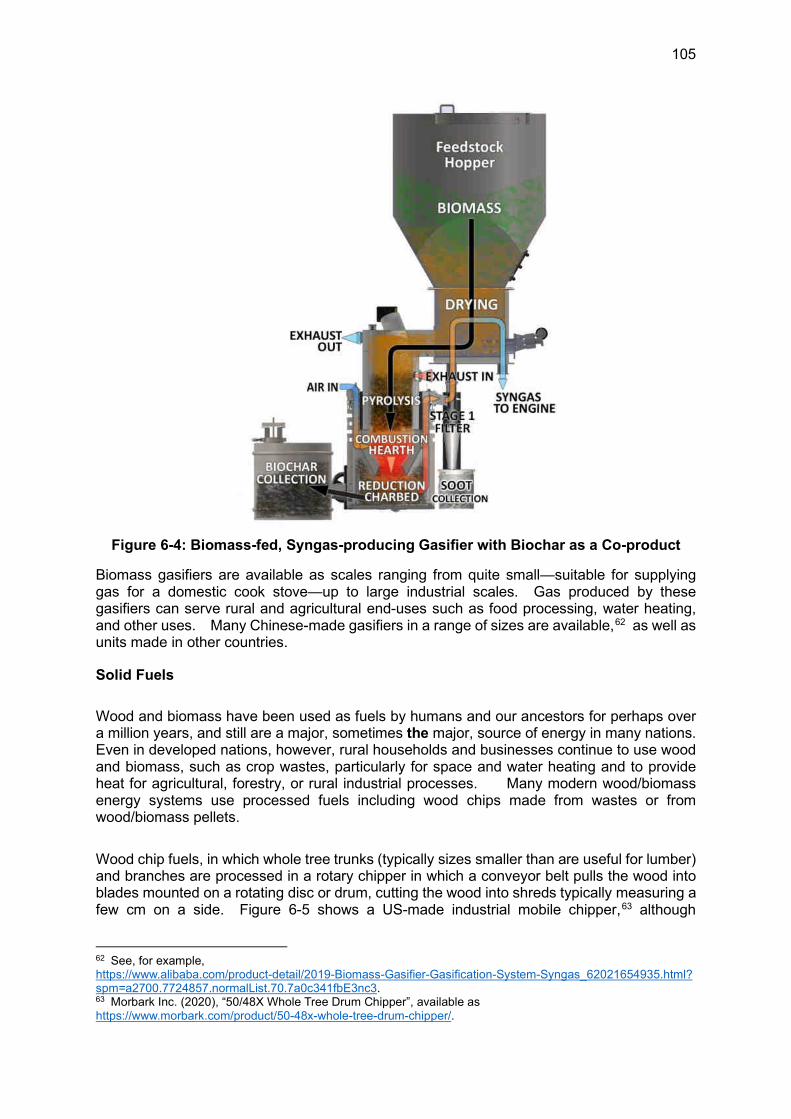
105
Figure 6-4: Biomass-fed, Syngas-producing Gasifier with Biochar as a Co-product
Biomass gasifiers are available as scales ranging from quite small—suitable for supplying gas for a domestic cook stove—up to large industrial scales. Gas produced by these gasifiers can serve rural and agricultural end-uses such as food processing, water heating, and other uses. Many Chinese-made gasifiers in a range of sizes are available,62 as well as units made in other countries.
Solid Fuels
Wood and biomass have been used as fuels by humans and our ancestors for perhaps over a million years, and still are a major, sometimes the major, source of energy in many nations. Even in developed nations, however, rural households and businesses continue to use wood and biomass, such as crop wastes, particularly for space and water heating and to provide heat for agricultural, forestry, or rural industrial processes. Many modern wood/biomass energy systems use processed fuels including wood chips made from wastes or from wood/biomass pellets.
Wood chip fuels, in which whole tree trunks (typically sizes smaller than are useful for lumber) and branches are processed in a rotary chipper in which a conveyor belt pulls the wood into blades mounted on a rotating disc or drum, cutting the wood into shreds typically measuring a few cm on a side. Figure 6-5 shows a US-made industrial mobile chipper,63 although
62 See, for example, https://www.alibaba.com/product-detail/2019-Biomass-Gasifier-Gasification-System-Syngas_62021654935.html?spm=a2700.7724857.normalList.70.7a0c341fbE3nc3. 63 Morbark Inc. (2020), “50/48X Whole Tree Drum Chipper”, available as https://www.morbark.com/product/50-48x-whole-tree-drum-chipper/.
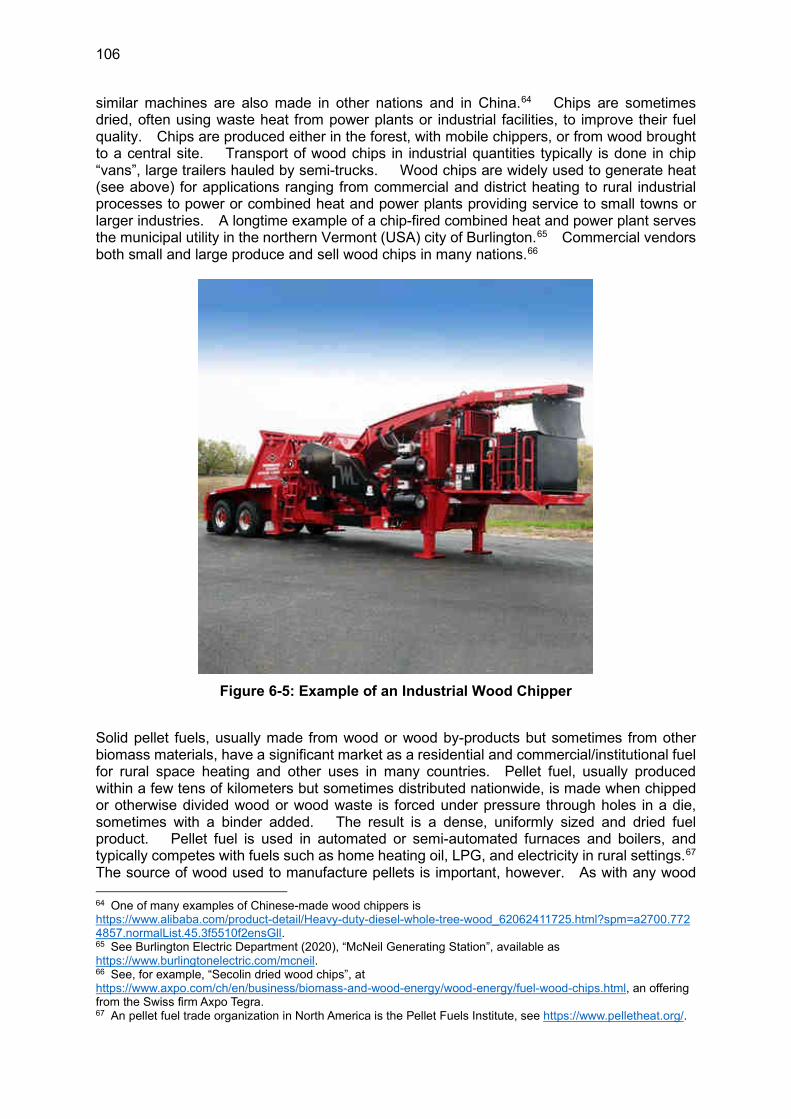
106
similar machines are also made in other nations and in China.64 Chips are sometimes dried, often using waste heat from power plants or industrial facilities, to improve their fuel quality. Chips are produced either in the forest, with mobile chippers, or from wood brought to a central site. Transport of wood chips in industrial quantities typically is done in chip “vans”, large trailers hauled by semi-trucks. Wood chips are widely used to generate heat (see above) for applications ranging from commercial and district heating to rural industrial processes to power or combined heat and power plants providing service to small towns or larger industries. A longtime example of a chip-fired combined heat and power plant serves the municipal utility in the northern Vermont (USA) city of Burlington.65 Commercial vendors both small and large produce and sell wood chips in many nations.66
Figure 6-5: Example of an Industrial Wood Chipper
Solid pellet fuels, usually made from wood or wood by-products but sometimes from other biomass materials, have a significant market as a residential and commercial/institutional fuel for rural space heating and other uses in many countries. Pellet fuel, usually produced within a few tens of kilometers but sometimes distributed nationwide, is made when chipped or otherwise divided wood or wood waste is forced under pressure through holes in a die, sometimes with a binder added. The result is a dense, uniformly sized and dried fuel product. Pellet fuel is used in automated or semi-automated furnaces and boilers, and typically competes with fuels such as home heating oil, LPG, and electricity in rural settings.67 The source of wood used to manufacture pellets is important, however. As with any wood
64 One of many examples of Chinese-made wood chippers is https://www.alibaba.com/product-detail/Heavy-duty-diesel-whole-tree-wood_62062411725.html?spm=a2700.7724857.normalList.45.3f5510f2ensGll. 65 See Burlington Electric Department (2020), “McNeil Generating Station”, available as https://www.burlingtonelectric.com/mcneil. 66 See, for example, “Secolin dried wood chips”, at https://www.axpo.com/ch/en/business/biomass-and-wood-energy/wood-energy/fuel-wood-chips.html, an offering from the Swiss firm Axpo Tegra. 67 An pellet fuel trade organization in North America is the Pellet Fuels Institute, see https://www.pelletheat.org/.
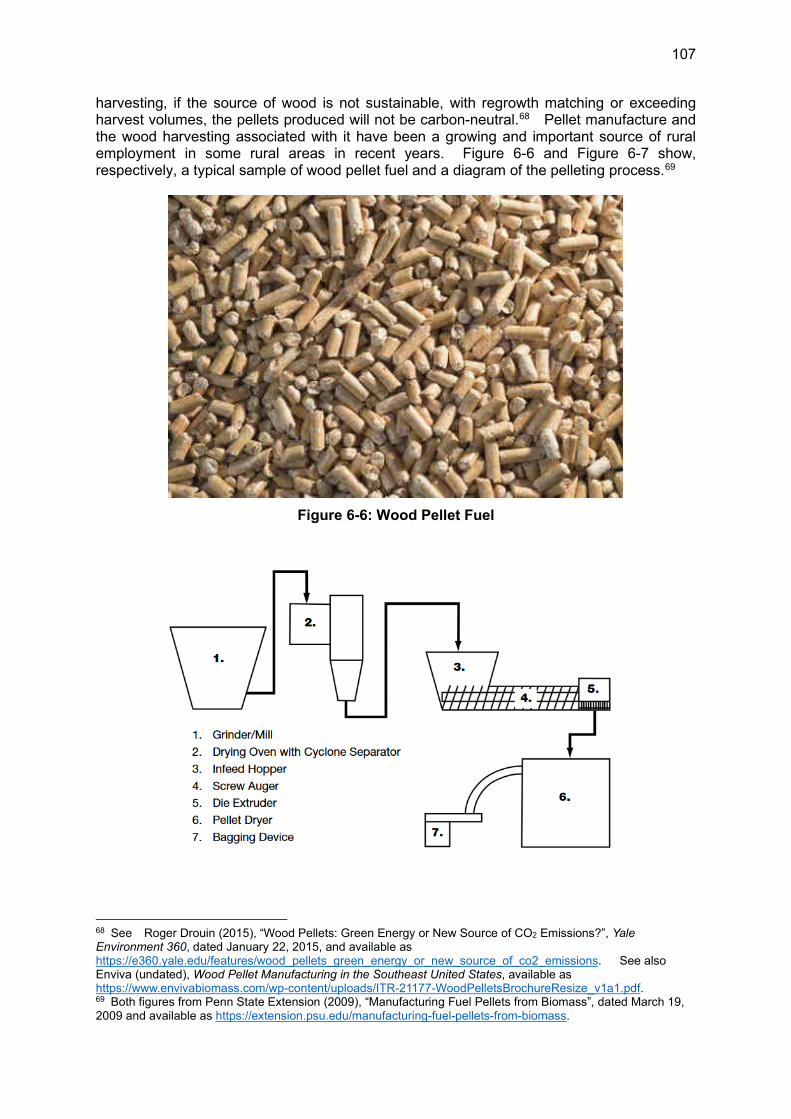
107
harvesting, if the source of wood is not sustainable, with regrowth matching or exceeding harvest volumes, the pellets produced will not be carbon-neutral.68 Pellet manufacture and the wood harvesting associated with it have been a growing and important source of rural employment in some rural areas in recent years. Figure 6-6 and Figure 6-7 show, respectively, a typical sample of wood pellet fuel and a diagram of the pelleting process.69
Figure 6-6: Wood Pellet Fuel
68 See Roger Drouin (2015), “Wood Pellets: Green Energy or New Source of CO2 Emissions?”, Yale Environment 360, dated January 22, 2015, and available as https://e360.yale.edu/features/wood_pellets_green_energy_or_new_source_of_co2_emissions. See also Enviva (undated), Wood Pellet Manufacturing in the Southeast United States, available as https://www.envivabiomass.com/wp-content/uploads/ITR-21177-WoodPelletsBrochureResize_v1a1.pdf. 69 Both figures from Penn State Extension (2009), “Manufacturing Fuel Pellets from Biomass”, dated March 19, 2009 and available as https://extension.psu.edu/manufacturing-fuel-pellets-from-biomass.
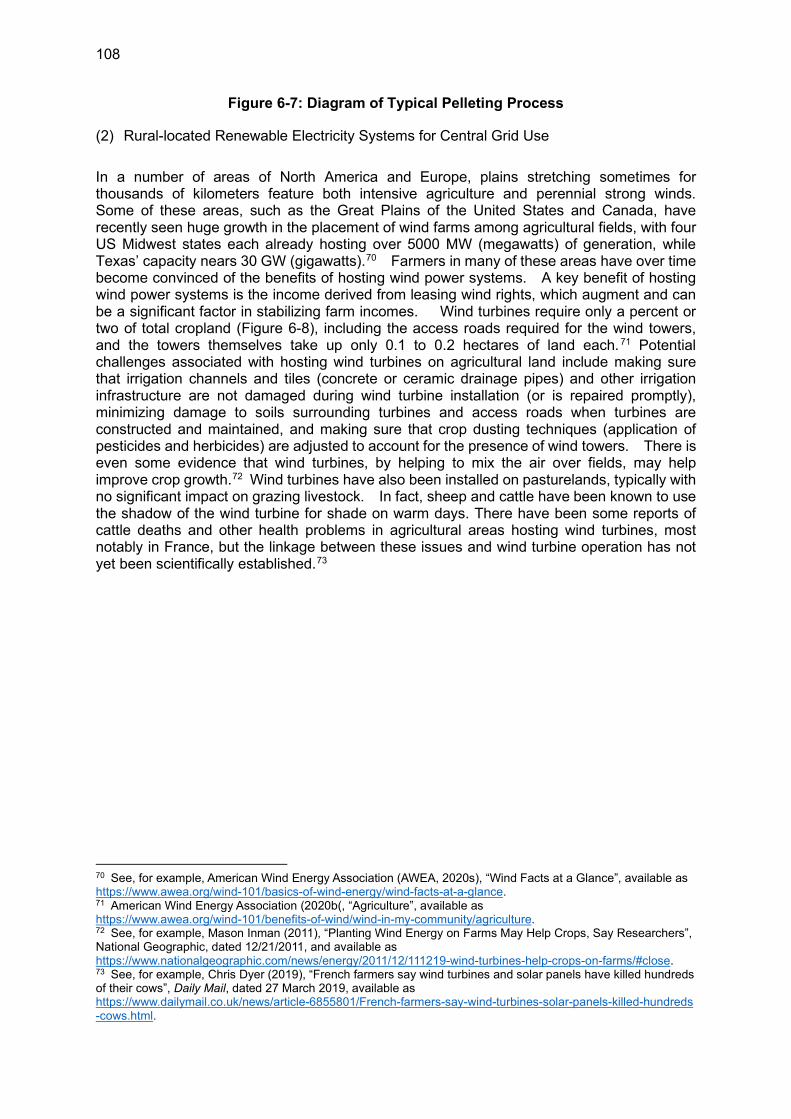
108
Figure 6-7: Diagram of Typical Pelleting Process
(2) Rural-located Renewable Electricity Systems for Central Grid Use
In a number of areas of North America and Europe, plains stretching sometimes for thousands of kilometers feature both intensive agriculture and perennial strong winds. Some of these areas, such as the Great Plains of the United States and Canada, have recently seen huge growth in the placement of wind farms among agricultural fields, with four US Midwest states each already hosting over 5000 MW (megawatts) of generation, while Texas’ capacity nears 30 GW (gigawatts).70 Farmers in many of these areas have over time become convinced of the benefits of hosting wind power systems. A key benefit of hosting wind power systems is the income derived from leasing wind rights, which augment and can be a significant factor in stabilizing farm incomes. Wind turbines require only a percent or two of total cropland (Figure 6-8), including the access roads required for the wind towers, and the towers themselves take up only 0.1 to 0.2 hectares of land each. 71 Potential challenges associated with hosting wind turbines on agricultural land include making sure that irrigation channels and tiles (concrete or ceramic drainage pipes) and other irrigation infrastructure are not damaged during wind turbine installation (or is repaired promptly), minimizing damage to soils surrounding turbines and access roads when turbines are constructed and maintained, and making sure that crop dusting techniques (application of pesticides and herbicides) are adjusted to account for the presence of wind towers. There is even some evidence that wind turbines, by helping to mix the air over fields, may help improve crop growth.72 Wind turbines have also been installed on pasturelands, typically with no significant impact on grazing livestock. In fact, sheep and cattle have been known to use the shadow of the wind turbine for shade on warm days. There have been some reports of cattle deaths and other health problems in agricultural areas hosting wind turbines, most notably in France, but the linkage between these issues and wind turbine operation has not yet been scientifically established.73
70 See, for example, American Wind Energy Association (AWEA, 2020s), “Wind Facts at a Glance”, available as https://www.awea.org/wind-101/basics-of-wind-energy/wind-facts-at-a-glance. 71 American Wind Energy Association (2020b(, “Agriculture”, available as https://www.awea.org/wind-101/benefits-of-wind/wind-in-my-community/agriculture. 72 See, for example, Mason Inman (2011), “Planting Wind Energy on Farms May Help Crops, Say Researchers”, National Geographic, dated 12/21/2011, and available as https://www.nationalgeographic.com/news/energy/2011/12/111219-wind-turbines-help-crops-on-farms/#close. 73 See, for example, Chris Dyer (2019), “French farmers say wind turbines and solar panels have killed hundreds of their cows”, Daily Mail, dated 27 March 2019, available as https://www.dailymail.co.uk/news/article-6855801/French-farmers-say-wind-turbines-solar-panels-killed-hundreds-cows.html.
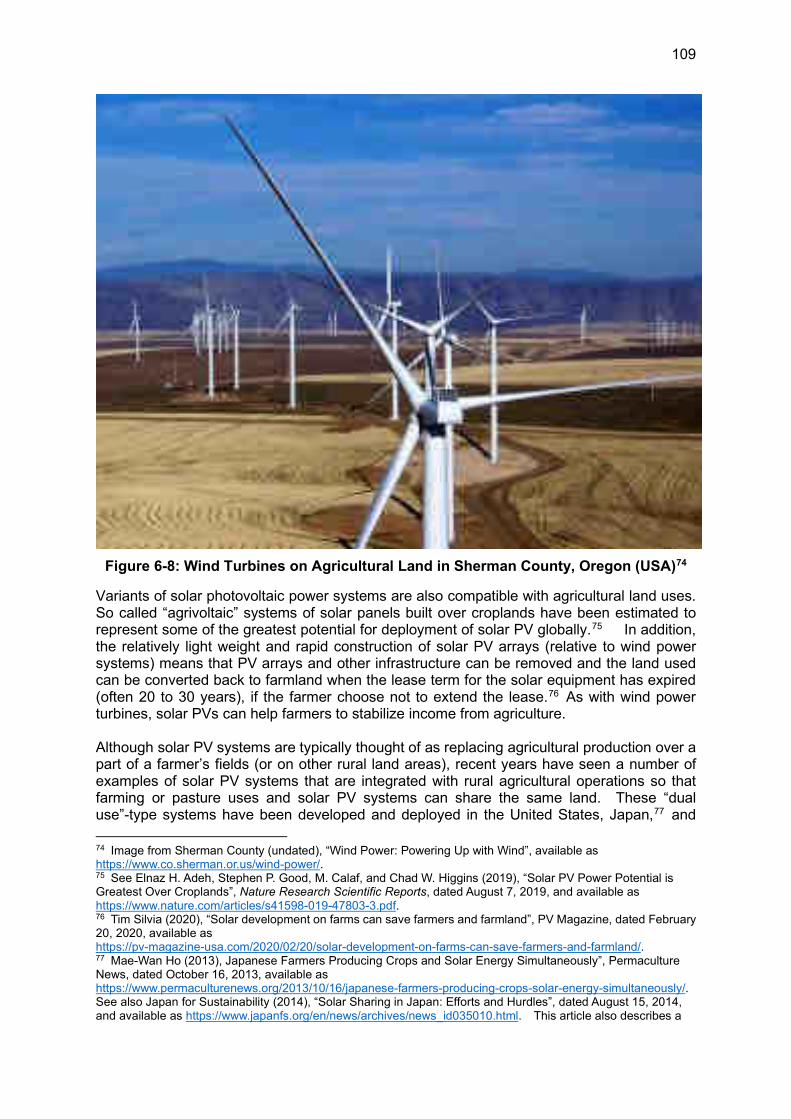
109
Figure 6-8: Wind Turbines on Agricultural Land in Sherman County, Oregon (USA)74
Variants of solar photovoltaic power systems are also compatible with agricultural land uses. So called “agrivoltaic” systems of solar panels built over croplands have been estimated to represent some of the greatest potential for deployment of solar PV globally.75 In addition, the relatively light weight and rapid construction of solar PV arrays (relative to wind power systems) means that PV arrays and other infrastructure can be removed and the land used can be converted back to farmland when the lease term for the solar equipment has expired (often 20 to 30 years), if the farmer choose not to extend the lease.76 As with wind power turbines, solar PVs can help farmers to stabilize income from agriculture. Although solar PV systems are typically thought of as replacing agricultural production over a part of a farmer’s fields (or on other rural land areas), recent years have seen a number of examples of solar PV systems that are integrated with rural agricultural operations so that farming or pasture uses and solar PV systems can share the same land. These “dual use”-type systems have been developed and deployed in the United States, Japan,77 and
74 Image from Sherman County (undated), “Wind Power: Powering Up with Wind”, available as https://www.co.sherman.or.us/wind-power/. 75 See Elnaz H. Adeh, Stephen P. Good, M. Calaf, and Chad W. Higgins (2019), “Solar PV Power Potential is Greatest Over Croplands”, Nature Research Scientific Reports, dated August 7, 2019, and available as https://www.nature.com/articles/s41598-019-47803-3.pdf. 76 Tim Silvia (2020), “Solar development on farms can save farmers and farmland”, PV Magazine, dated February 20, 2020, available as https://pv-magazine-usa.com/2020/02/20/solar-development-on-farms-can-save-farmers-and-farmland/. 77 Mae-Wan Ho (2013), Japanese Farmers Producing Crops and Solar Energy Simultaneously”, Permaculture News, dated October 16, 2013, available as https://www.permaculturenews.org/2013/10/16/japanese-farmers-producing-crops-solar-energy-simultaneously/. See also Japan for Sustainability (2014), “Solar Sharing in Japan: Efforts and Hurdles”, dated August 15, 2014, and available as https://www.japanfs.org/en/news/archives/news_id035010.html. This article also describes a
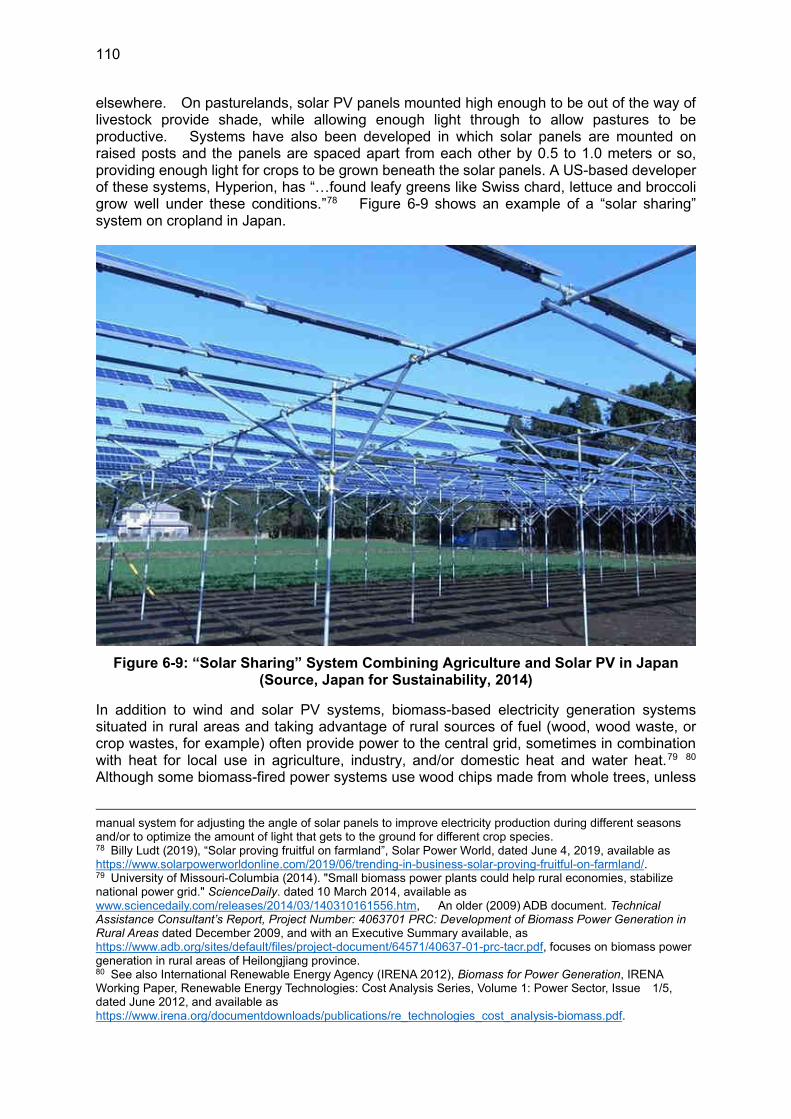
110
elsewhere. On pasturelands, solar PV panels mounted high enough to be out of the way of livestock provide shade, while allowing enough light through to allow pastures to be productive. Systems have also been developed in which solar panels are mounted on raised posts and the panels are spaced apart from each other by 0.5 to 1.0 meters or so, providing enough light for crops to be grown beneath the solar panels. A US-based developer of these systems, Hyperion, has “…found leafy greens like Swiss chard, lettuce and broccoli grow well under these conditions.”78 Figure 6-9 shows an example of a “solar sharing” system on cropland in Japan.
Figure 6-9: “Solar Sharing” System Combining Agriculture and Solar PV in Japan (Source, Japan for Sustainability, 2014)
In addition to wind and solar PV systems, biomass-based electricity generation systems situated in rural areas and taking advantage of rural sources of fuel (wood, wood waste, or crop wastes, for example) often provide power to the central grid, sometimes in combination with heat for local use in agriculture, industry, and/or domestic heat and water heat.79 80 Although some biomass-fired power systems use wood chips made from whole trees, unless
manual system for adjusting the angle of solar panels to improve electricity production during different seasons and/or to optimize the amount of light that gets to the ground for different crop species. 78 Billy Ludt (2019), “Solar proving fruitful on farmland”, Solar Power World, dated June 4, 2019, available as https://www.solarpowerworldonline.com/2019/06/trending-in-business-solar-proving-fruitful-on-farmland/. 79 University of Missouri-Columbia (2014). "Small biomass power plants could help rural economies, stabilize national power grid." ScienceDaily. dated 10 March 2014, available as www.sciencedaily.com/releases/2014/03/140310161556.htm, An older (2009) ADB document. Technical Assistance Consultant’s Report, Project Number: 4063701 PRC: Development of Biomass Power Generation in Rural Areas dated December 2009, and with an Executive Summary available, as https://www.adb.org/sites/default/files/project-document/64571/40637-01-prc-tacr.pdf, focuses on biomass power generation in rural areas of Heilongjiang province. 80 See also International Renewable Energy Agency (IRENA 2012), Biomass for Power Generation, IRENA Working Paper, Renewable Energy Technologies: Cost Analysis Series, Volume 1: Power Sector, Issue 1/5, dated June 2012, and available as https://www.irena.org/documentdownloads/publications/re_technologies_cost_analysis-biomass.pdf.

111
the trees are harvested when quite small, it is typically more economic to use the majority of the tree trunk (bole) for higher value uses such as veneers or lumber, with smaller-diameter woody materials used for either fuel or wood pulp. In some places biomass power systems use other waste materials, such as tire-derived fuel, as a small portion of their feedstock, thus providing a key disposal benefit for plant economics, although doing so probably keeps the ash from biomass production from being usable as a soil amendment.81
81 Michigan Biomass (2020), An Overview of Biomass in Michigan, dated February 2020, and available as http://www.michiganbiomass.com/docs/biomasswhitepaper.pdf.
112
(3) Rural Renewable Electricity Systems in Mini- and Micro-grids with Central Grid Connections Wind power, solar photovoltaic systems, and biomass power sources, the latter including biomass converted to biogas for fueling generators and combined heat and power systems, can all be a part of electricity systems designed to provide power mostly for local use—for example, on farms and at rural agricultural processing and related facilities—with connections to provide any excess power to the central grid, as well as to purchase energy from the grid if there is a shortfall. For wind power systems of this type, the average size of generators is likely to be smaller, if supplying local power is the goal. Solar PV systems, which are modular and can supply energy on scales ranging from watts to hundreds of megawatts, are readily adaptable to this type of use. Biomass energy generation systems are becoming more available in smaller sizes, including modular gasifier-based systems manufactured in China in sizes ranging from hundreds of kilowatts to tens of megawatts.82 The mountainous areas of GBTH, particularly areas in the western and northern parts of Hebei, may be candidates for mini-grid systems based on small or mini-hydroelectric plants, although local rainfall, as noted earlier in this report, varies substantially by location and over the course of the year. And some mini-grids may use hybrid systems incorporating two or more renewable energy sources in order to provide more continuous power at a higher overall capacity factor than one resource alone could provide. “Mini-grids” or “micro-grids” designed to provide local power with an interconnection to the grid are typically configured so as to supply much or all of local power needs, but to rely on the central power grid for back-up and to be able to sell power to the grid when there is an excess. Although recent decades have seen mini- and micro-grids installed in many lower-income countries as a means for expanding electricity provision in areas where grid extension is expensive and national grids have limited investment funds,83 mini-grids have also been developed in countries that, like China, the US, and Europe, already have universal or near-universal access to central grid power. Reasons for adopting mini-grids in situations where a grid connection already exist include the desire to use local resources, to reduce and control electricity costs, to improve reliability, and sometimes to add another stream of income through power sales to the grid, Mini-grids in remote locations served by the central grid can also help to stabilize grid connections and reduce the significant transmission losses that are often incurred in serving remote areas. Even in areas that are not particularly remote, mini-grids can help to provide balancing and other ancillary services to the main grid, as well as adding flexibility to main grid operations.
(4) Stand-alone Rural Renewable Electricity Systems
82 As an example, see Zibo Zichai New Energy Co., “Biomass gas, municipal waste gas generator”, at http://en.zcxnypower.com/Biomass_gas_municipal_waste_gas_generator.html?gclid=Cj0KCQjwzZj2BRDVARIsABs3l9I1OoWgJXjq7yA_s__wjeuHoXnt1KpMPO4iAzIGzg-T6i_1t_x44dEaAsgYEALw_wcB. 83 See, for example, Tenenbaum, Bernard, Chris Greacen, and Dipti Vaghela (2018), Mini Grids and the Arrival of the Main Grid: Lessons from Cambodia, Sri Lanka, and Indonesia. Energy Sector Management Assistance Program (ESMAP) Technical Report 013/18,World Bank, Washington, DC: Available as https://openknowledge.worldbank.org/bitstream/handle/10986/29018/134326.pdf?sequence=6&isAllowed=y. See also Chris Greacen, Richard Engel, and Thomas Quetchenbach (2013), A Guidebook on Grid Interconnection and Islanded Operation of Mini--Grid Power Systems Up to 200 kW, dated April, 2013, and available as https://eta-publications.lbl.gov/sites/default/files/a_guidebook_for_minigrids-serc_lbnl_march_2013.pdf, which focuses on technical aspects of interconnecting mini-grids with a central grid, and on the elements of the interconnection process.
113
The most common applications for rural renewable electricity systems that are not connected to a central grid are in places, such as islands and remote locations, where connecting to a grid is impossible or prohibitively expenses, or in places where power from central grid is unreliable, and better-quality electricity is a goal. In some cases, however, rural mini- or micro-grids have been set up without a central grid connection even in industrialized nations, for reasons that include saving on electricity costs, where power is very expensive (as in Japan), avoiding costs of interconnection, or a conscious decision to reduce the carbon footprint of a town, village, rural industrial organization, or household. Micro-grids or even smaller home energy systems can be used for residential compounds or other buildings in isolated locations, including holiday homes. In these instances, the choice of stand-alone power may be made to avoid a large charge to connect to the central grid, and/or to avoid problems associated with maintenance of a connection to the central grid. More electricity users, including both single users and communities, will likely adopt stand-alone systems as the prices of generators and other components of mini- and micro-grid systems continue to fall and use ammonia, hydrogen, and other renewable-derived products for agricultural, industrial or fuels use.
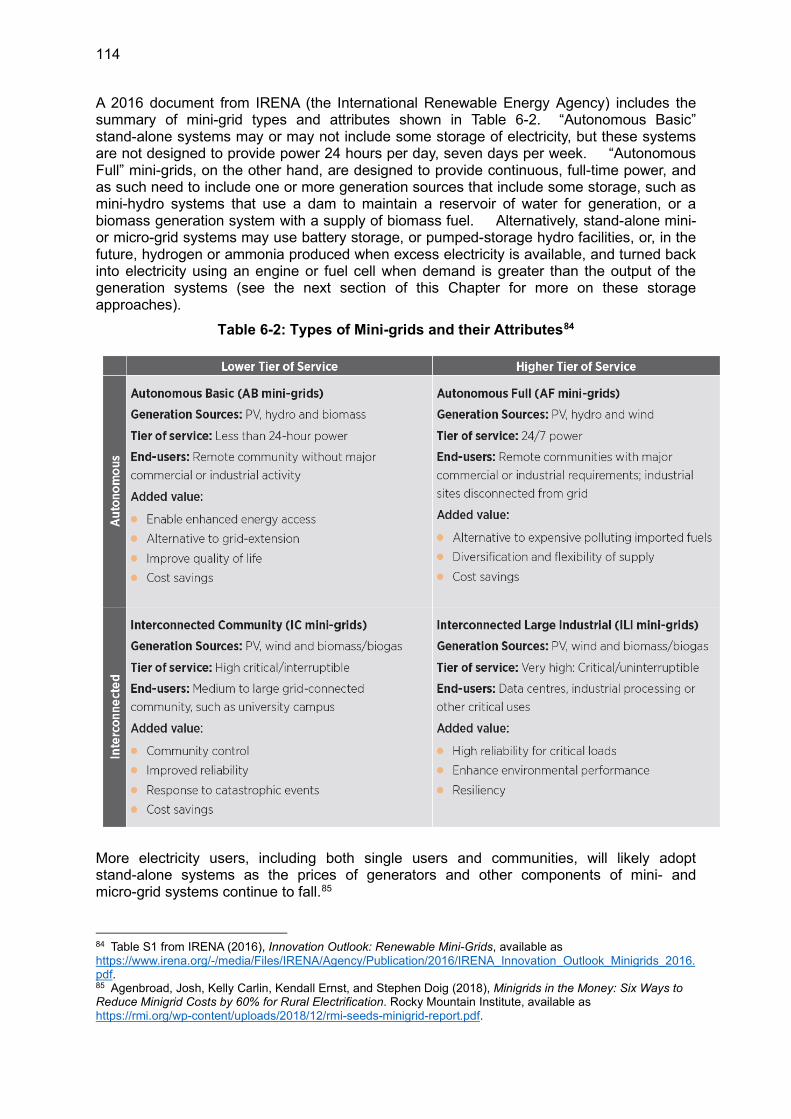
114
A 2016 document from IRENA (the International Renewable Energy Agency) includes the summary of mini-grid types and attributes shown in Table 6-2. “Autonomous Basic” stand-alone systems may or may not include some storage of electricity, but these systems are not designed to provide power 24 hours per day, seven days per week. “Autonomous Full” mini-grids, on the other hand, are designed to provide continuous, full-time power, and as such need to include one or more generation sources that include some storage, such as mini-hydro systems that use a dam to maintain a reservoir of water for generation, or a biomass generation system with a supply of biomass fuel. Alternatively, stand-alone mini- or micro-grid systems may use battery storage, or pumped-storage hydro facilities, or, in the future, hydrogen or ammonia produced when excess electricity is available, and turned back into electricity using an engine or fuel cell when demand is greater than the output of the generation systems (see the next section of this Chapter for more on these storage approaches).
Table 6-2: Types of Mini-grids and their Attributes84
More electricity users, including both single users and communities, will likely adopt stand-alone systems as the prices of generators and other components of mini- and micro-grid systems continue to fall.85
84 Table S1 from IRENA (2016), Innovation Outlook: Renewable Mini-Grids, available as https://www.irena.org/-/media/Files/IRENA/Agency/Publication/2016/IRENA_Innovation_Outlook_Minigrids_2016.pdf. 85 Agenbroad, Josh, Kelly Carlin, Kendall Ernst, and Stephen Doig (2018), Minigrids in the Money: Six Ways to Reduce Minigrid Costs by 60% for Rural Electrification. Rocky Mountain Institute, available as https://rmi.org/wp-content/uploads/2018/12/rmi-seeds-minigrid-report.pdf.
115
(5) Ammonia, Hydrogen, and Other Renewable-derived Products for Agricultural, Industrial, or Fuels Use In some areas where wind and solar PV systems, typically large systems, are being developed, particularly in rural areas, not all generation can always be sold for a profit. This can happen where either A) transmission capacities are insufficient to allow the full output of the renewable generators to be taken up by the grid, and/or B) electricity markets operate such that at some times of the day—typically when demand is low and renewable generation is high—the prices offered for renewable generation are low or even negative. In these instances, the availability of electricity storage allows generators to reserve some output for sale to the grid later, when generation is low (periods of low wind or, for solar PV systems, at night) or as transmission capacity becomes available. Electricity on site can be stored in physical or electrochemical systems such as:
• Batteries, including lead-acid battery packs, which have been used for mini- and micro-grid systems, as well as solar home systems, for many years, lithium-ion batteries, which have begun to dominate the market for renewable energy storage, and are available in modular units and in rapidly increasing capacities, flow batteries that “store electrical charge in tanks of liquid electrolyte that is pumped through electrodes to extract the electrons; the spent electrolyte returns to the tank”, and can potentially be built in very large sizes, which are now being commercialized, and newer technologies likely soon to be commercialized, such as zinc-air batteries and others.86
• Pumped-storage hydro systems, in which water is pumped uphill into a reservoir when excess power is available and allowed to flow down through a turbine when power is needed. These systems have been in use since the early 1900s and can be and have been built in capacities from kilowatt (or smaller) scale for micro-grids to gigawatt scale. Some of the mountain areas in rural Hebei may be candidates for additions of pumped storage capacity, and as of this writing the 3600 MW Fengning Pumped Storage Power Station, which will be the world’s largest, is currently under construction, and scheduled to be on line in 2022 and 2023.87
• Other systems for storing electricity as potential energy, such as systems of automated cranes that stack up weights when excess power is available, and lets the weights down, generating electricity in the process, when power is needed. 88
• Storage of energy as heat in various materials, including solid silicon, molten salts, hot water, or hot gravel, in which the storage medium is heated electrically by resistance heaters or heat pumps, stores heat in a heavily insulated structure or hole, and uses a heat engine to reconvert the heat into electricity when needed.
86 An as-yet not fully described battery technology backed by Microsoft founder Bill Gates is being deployed by a utility in Minnesota in the US, and aims at providing storage for 150 hours, which would make it able to compete directly with peaking power plants such as gas turbines. Julian Spector (2020), “Long Duration Breakthrough? Form Energy’s First Project Tries Pushing Storage to 150 Hours”, GTM, dated May 7, 2020, and available as https://www.greentechmedia.com/articles/read/form-energys-first-project-pushes-long-duration-storage-to-new-heights-150-hour-duration. 87 Steve Hanley (2019), “Fengning Pumped Hydro Project Will Increase China’s Hydro Storage To 40 Gigawatts”, Cleantechnica, dated September 28th, 2019, and available as https://cleantechnica.com/2019/09/28/fengning-pumped-hydro-project-will-increase-chinas-hydro-storage-to-40-gigawatts/. 88 Talal Husseini (2019), Tower of power: gravity-based storage evolves beyond pumped hydro”, Power Technology, dated 7 March, 3019, and available as https://www.power-technology.com/features/gravity-based-storage/.
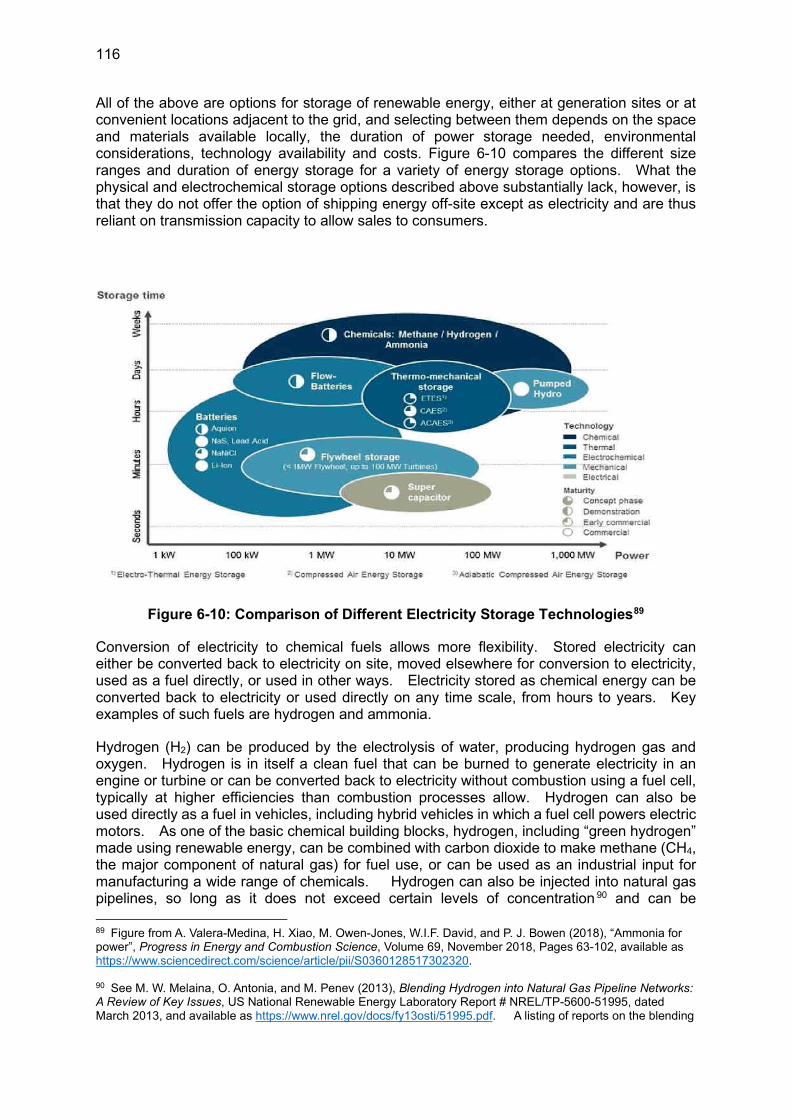
116
All of the above are options for storage of renewable energy, either at generation sites or at convenient locations adjacent to the grid, and selecting between them depends on the space and materials available locally, the duration of power storage needed, environmental considerations, technology availability and costs. Figure 6-10 compares the different size ranges and duration of energy storage for a variety of energy storage options. What the physical and electrochemical storage options described above substantially lack, however, is that they do not offer the option of shipping energy off-site except as electricity and are thus reliant on transmission capacity to allow sales to consumers.
Figure 6-10: Comparison of Different Electricity Storage Technologies89
Conversion of electricity to chemical fuels allows more flexibility. Stored electricity can either be converted back to electricity on site, moved elsewhere for conversion to electricity, used as a fuel directly, or used in other ways. Electricity stored as chemical energy can be converted back to electricity or used directly on any time scale, from hours to years. Key examples of such fuels are hydrogen and ammonia.
Hydrogen (H2) can be produced by the electrolysis of water, producing hydrogen gas and oxygen. Hydrogen is in itself a clean fuel that can be burned to generate electricity in an engine or turbine or can be converted back to electricity without combustion using a fuel cell, typically at higher efficiencies than combustion processes allow. Hydrogen can also be used directly as a fuel in vehicles, including hybrid vehicles in which a fuel cell powers electric motors. As one of the basic chemical building blocks, hydrogen, including “green hydrogen” made using renewable energy, can be combined with carbon dioxide to make methane (CH4, the major component of natural gas) for fuel use, or can be used as an industrial input for manufacturing a wide range of chemicals. Hydrogen can also be injected into natural gas pipelines, so long as it does not exceed certain levels of concentration 90 and can be
89 Figure from A. Valera-Medina, H. Xiao, M. Owen-Jones, W.I.F. David, and P. J. Bowen (2018), “Ammonia for power”, Progress in Energy and Combustion Science, Volume 69, November 2018, Pages 63-102, available as https://www.sciencedirect.com/science/article/pii/S0360128517302320. 90 See M. W. Melaina, O. Antonia, and M. Penev (2013), Blending Hydrogen into Natural Gas Pipeline Networks: A Review of Key Issues, US National Renewable Energy Laboratory Report # NREL/TP-5600-51995, dated March 2013, and available as https://www.nrel.gov/docs/fy13osti/51995.pdf. A listing of reports on the blending
117
transported by dedicated pipelines. Germany, for example, plans to convert an underused natural gas pipeline to supply hydrogen produced from renewable electricity to industrial consumers.91 A difficulty of hydrogen as an energy carrier is its relatively low energy density, meaning that it must be compressed at relatively high pressures when storage space is limited, such as for transport by truck, ship, or rail. Hydrogen must also be compressed for storage if it is to be used as a vehicle fuel, although some alternatives, such as storage of hydrogen as a metal hydride, are under development that offer a higher energy density (kg of hydrogen per cubic meter of storage).92
A hydrogen “carrier” that offers energy densities and ease of handling rivaling those of fossil fuels, and which is receiving increasing attention in the energy community, is ammonia (NH3). When combusted, ammonia yields energy, water, and mostly nitrogen gas (N2), so is a carbon-free energy carrier. Ammonia has been a major industrial chemical for well over a century, often made from hydrogen derived from coal, oil, or natural gas, and is also used globally as a fertilizer. In more recent years, however, ammonia has begun to be appreciated for its potential as a renewable energy carrier. Ammonia is a gas at room temperature but can be easily compressed and handled in ways similar to liquefied petroleum gas (LPG), as it has a similar boiling point (-33 C) to propane (-42 C). Ammonia has an energy density per unit mass of 22.5 MJ (megajoules)/kg, which is similar to some types of coal, and a volumetric density of 11.62 MJ per liter, about half that of LPG (and about 35 percent of the density of gasoline) but more than 10-fold higher than the current generation of lithium-ion batteries.93
“Green” ammonia, made with hydrogen derived from renewable energy (as opposed to “brown” ammonia made with fossil fuels), is typically produced using electrolytic hydrogen via the Haber–Bosch process that “fixes” atmospheric nitrogen. Several ammonia producers have announced planned “green ammonia” investments recently, including in Chile, New Zealand, and Australia.94 An ammonia plant to be built in the remote Orkney Islands of Scotland, which has an excess of renewable energy from wind power, was also recently announced.95 The multi-purpose use of green ammonia, including as a fuel for vehicles and for electricity generation, as well as an industrial and agricultural input, is increasingly of interest in rural areas of industrialized countries for several reasons, including the desire to reduce the carbon footprint of industrial, transport, and agricultural activities, and to provide a means by which farmers can augment their income streams with renewable ammonia production and sales. In addition, for these rural areas—a major group of ammonia fuel
of hydrogen into natural gas pipelines compiled by the California (US) Hydrogen Business Council (2019) is available here https://www.californiahydrogen.org/wp-content/uploads/2019/01/Research-Reference-List-for-Hydrogen-Injection-Blending-Limits_Jan25.2019.pdf. 91 See, for example, Reuters (2020), “German hydrogen pipeline planned to aid green industry shift”, dated March 18, 2020, and available as https://www.reuters.com/article/germany-hydrogen-oge/german-hydrogen-pipeline-planned-to-aid-green-industry-shift-idUSL8N2BB64S. 92 See, for example, Alfons Geueke (2020), “How powder metal hydrides solve safety and size challenges for hydrogen storage”, Hy2green, dated January 16, 2020, available as https://news.pminnovationblog.com/blog/how-low-pressure-hydrogen-storage-tanks-increase-safety-and-efficiency. 93 NH3 Fuel Association (2020). “Comparisons: The Logical Path Forward”, available as https://nh3fuelassociation.org/comparisons/. 94 Trevor Brown (2019), “Green Ammonia Plants in Chile, Australia, New Zealand”, Ammonia Fuels Association, dated October 4, 2019, and available as https://www.ammoniaenergy.org/articles/green-ammonia-plants-in-chile-australia-new-zealand/. See also Marija Maisch (2020), “BP Australia study to investigate green hydrogen and ammonia opportunity”, PV Magazine, dated May 8, 2020, available as https://www.pv-magazine-australia.com/2020/05/08/bp-australia-study-to-investigate-green-hydrogen-and-ammonia-opportunity/. 95 Trevor Brown (2020), “Green ammonia plant proposed for Orkney”, Ammonia Energy Association, dated May 21, 2020, and available as https://www.ammoniaenergy.org/articles/green-ammonia-plant-proposed-for-orkney/.
118
advocates, for example, the Ammonia Energy Association, began with a group based in the US Midwest, and currently includes participants from all over the world—but also because the use of ammonia as a fuel builds upon existing and mature distribution and storage networks nearly a century old; transport and use of ammonia as a fertilizer and industrial input is long-established.
A means of producing ammonia that has yet to be commercialized, but is being actively investigated, is electrochemical synthesis of ammonia.96 In this process, inputs are electricity, air (the source of nitrogen) and water (the source of hydrogen), and ammonia and oxygen are the outputs. Conversion processes using a range of catalysts and membrane systems and operating at temperatures from room temperature to 500 C or more are being investigated. Solid-state devices may ultimately become available to allow the direct production of ammonia from electricity, which would in turn make it possible for farmers or other renewable energy owners to quickly switch from producing electricity to producing ammonia for use as a fertilizer or fuel, as demand dictates, even at relatively small scales.
For GBTH, the production of ammonia from renewable electricity offers the opportunity to produce ammonia to offset China’s production from fossil fuels (China has ammonia production capacity of over 80 million tonnes/year, and its ammonia production industry started in the 1930s97) and its imports, while offering rural renewable energy producers the option of storing energy as ammonia at times when markets for direct sales of electricity are not favorable. At the provincial, county, town, and enterprise (large farms or farm cooperatives, for example) levels, ammonia made locally from renewable energy in GBTH can be used as a fertilizer for local agriculture, to power transport and agricultural machinery, and/or as energy storage for reconversion to electricity when markets are favorable or when electricity is needed locally. A recent publication calls for a market for a billion tonnes of green ammonia annually as a part of a renewable energy low-carbon transition.98 For GBTH, one interesting prospect, though somewhat beyond the scope of the current project, is the use of green ammonia to replace residual fuel oil as a bunkering fuel for maritime transport, as the port of Tianjin is a major center for maritime transport. Figure 6-11 outlines the basic process for production of ammonia from water, air, and renewable energy, and some of its potential end-uses.
96 Ioannis Garagounis, Anastasios Vourros, Demetrios Stoukides, Dionisios Dasopoulos and Michael Stoukides (2019), “Electrochemical Synthesis of Ammonia: Recent Efforts and Future Outlook”, Membranes, 2019,9, 112, dated 30 August 2019, and available as https://www.ncbi.nlm.nih.gov/pmc/articles/PMC6780605/pdf/membranes-09-00112.pdf. 97 Cai Zeng (2014), “Overview of China Ammonia Industry”, in Ammonia Technical Manual, pp. 119-125, available as http://www.iffcokandla.in/data/polopoly_fs/1.2465646.1437673193!/fileserver/file/507750/filename/012.pdf. 98 Natalie Kakish (2020), “Green ammonia: Opportunity knocks”, Argus, posted 28 May 2020, and available as https://www.argusmedia.com/en/blog/2020/may/28/green-ammonia-opportunity-knocks?amp=1.
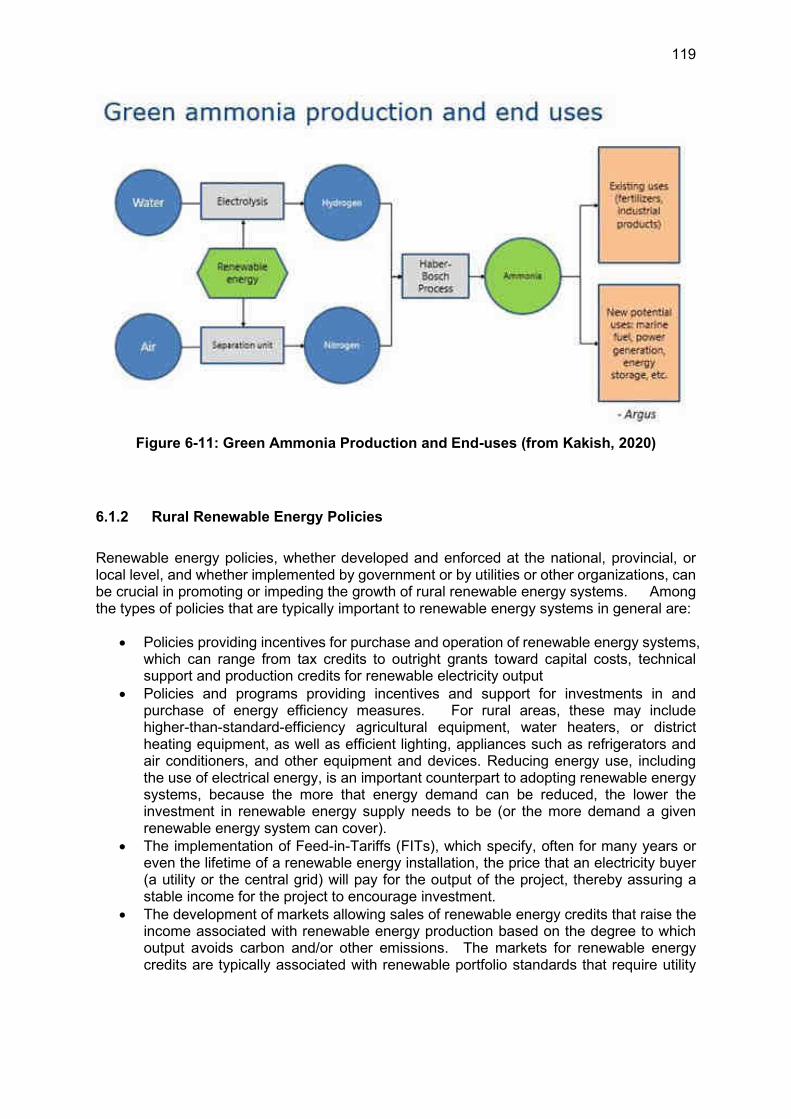
119
Figure 6-11: Green Ammonia Production and End-uses (from Kakish, 2020)
6.1.2 Rural Renewable Energy Policies
Renewable energy policies, whether developed and enforced at the national, provincial, or local level, and whether implemented by government or by utilities or other organizations, can be crucial in promoting or impeding the growth of rural renewable energy systems. Among the types of policies that are typically important to renewable energy systems in general are:
• Policies providing incentives for purchase and operation of renewable energy systems, which can range from tax credits to outright grants toward capital costs, technical support and production credits for renewable electricity output
• Policies and programs providing incentives and support for investments in and purchase of energy efficiency measures. For rural areas, these may include higher-than-standard-efficiency agricultural equipment, water heaters, or district heating equipment, as well as efficient lighting, appliances such as refrigerators and air conditioners, and other equipment and devices. Reducing energy use, including the use of electrical energy, is an important counterpart to adopting renewable energy systems, because the more that energy demand can be reduced, the lower the investment in renewable energy supply needs to be (or the more demand a given renewable energy system can cover).
• The implementation of Feed-in-Tariffs (FITs), which specify, often for many years or even the lifetime of a renewable energy installation, the price that an electricity buyer (a utility or the central grid) will pay for the output of the project, thereby assuring a stable income for the project to encourage investment.
• The development of markets allowing sales of renewable energy credits that raise the income associated with renewable energy production based on the degree to which output avoids carbon and/or other emissions. The markets for renewable energy credits are typically associated with renewable portfolio standards that require utility
120
companies (and sometimes municipal utilities) to source a fraction of the energy they generate or sell from renewable sources.99
• The promulgation of clear and consistent rules for the interconnection of different sizes and types of renewable energy generators with the grid. Regulations must both assure grid safety, including the safety of technicians working on transmission and distribution networks as well as grid stability, while also not being overly burdensome for generators seeking to interconnect.100 In some locations, utilities have historically sought to impede renewable energy markets (or independent power production generally) by demanding excessive and often expensive measures to secure grid safety, and in those cases intervention by government was often necessary to make sure that rules for interconnection were fair and balanced.
• Financial support and favorable tax treatment for development of renewable energy and related technologies. For example, universities based in rural areas may be good targets for funding of renewable energy development that focuses on rural needs. In the United States, the Small Business Innovation Research (SBIR) program, administered under multiple cabinet ministries (the Department of Energy, the Department of Commerce, the Department of Agriculture, and others), provides funding to small companies to pursue innovative new technologies.101
When rural areas host renewable energy systems, particularly systems such as large wind or solar farms that produce electricity for a regional or national grid, and thus benefit all electricity consumers, urban and rural alike, it is important to make sure rural villages and towns receive monetary and other benefits from hosting renewable energy systems. One way of doing that is to assure that some payments from renewable energy developers go to local governments. For example, in the US state of Wisconsin, located in the northern Great Plains owners of wind farms larger than 50 MW contribute to local governments via the following mechanism: “…owners of wind farms greater than 50 megawatts (MW) pay annually into a utility local aid fund which is shared with the local governments where the wind farm is located. Under the revenue sharing formula in place, a qualifying wind farm will contribute $2,333 per MW to the county and $1,667 per MW to the township(s) hosting the project, for a total of $4,000 per MW per year.”102
Other policies and regulations associated with wind power systems in rural areas include:
• Policies identifying which projects (for example, projects under a certain capacity) are solely under the jurisdiction of local governments and which involve other authorities (such as the state regulatory commissions in the US, or the provincial government in China).
• Guides and regulations indicating how a candidate project is to be reviewed by a local authority.103
99 See, for example, Solar Energy Industry Association (2020), “Renewable Energy Standards”, available as https://www.seia.org/initiatives/renewable-energy-standards. 100 See, for example, Interstate Renewable Energy Council (2013), IREC 2013 Model Interconnection Procedures, available from https://irecusa.org/publications/model-interconnection-procedures/, and a supplemental 2017 IREC volume, Priority Considerations for Interconnection Standards: A Quick Reference Guide for Utility Regulators, dated August 2017, and available from the same URL. 101 Small Business Innovation Research (SBIR, 2020), “About SBIR”, available as https://www.sbir.gov/about/about-sbir. 102 Renew Wisconsin (2018), “Wind Farms in Wisconsin”, available as https://www.renewwisconsin.org/wind-farms/. 103 See, for example, Wisconsin State Legislature (2012), “Chapter PSC 128: WIND ENERGY SYSTEMS”, dated December, 2012, and available as https://docs.legis.wisconsin.gov/code/admin_code/psc/128.
121
• Setback rules specifying how far a wind turbine must be from homes and other nearby structures.
• Rules on turbine placement related to “shadow flicker” associated with turbine operations.
• Noise regulations specifying the maximum noise levels that wind farms can produce, sometimes differentiated by time of day.
In its summary recommendations for the deployment of biomass-based power generation (BPG) in China, a 2009 ADB document echoed many of the general points made above with regard to policy formulation but with a number of elements specific to biomass energy systems:104
“Enhanced research and development in BPG” which includes:
• Biomass pre-treatment technologies;
• Development of improved combustion technologies;
• Technology development of co-firing of biomass in large power plants;
• Development of new equipment which are more suitable for collection of Chinese agriculture residues to increase the effectiveness of the collection;
• Innovative micro/small scale CHP technologies based on biomass combustion.
“Clear and Coherent Policy and Regulation Framework” which includes:
• Coordination and harmonization of policy and regulations for BPG should be further improved.
• Further reform of electricity market should be further implemented in particular in the new BPG sector.
• Government’s support and guidance for the sector should be further enhanced.
• Taxation Reduction for BPG should be included in the taxation policy as a key technology in the renewable energy portfolio;
• Policies and incentives to encourage biomass CHP development and co-firing should be established to solve the issues related to energy price, monitoring of the biomass supply in the co-firing plant etc.
“Explore More Financial Instruments and Incentives” which includes:
• Government support to BPG will be significant for stimulating the involvement from
the institutional investors;
104 Asian Development Bank (2009), Technical Assistance Consultant’s Report, Project Number: 4063701: PRC: Development of Biomass Power Generation in Rural Areas, dated December 2009, and available as https://www.adb.org/sites/default/files/project-document/64571/40637-01-prc-tacr.pdf.
122
• More development should be conducted to attract international funding and investment in BPG. The institutions include for example, GEF, CDM and other bilateral or international investments and grants;
• Utilization of the loans from ADB and World Bank etc.”
6.2 International Good/Best Practices for Renewable Energy Development in Rural Areas
Following on to the description of energy technologies and of policies that likely are or will be applicable in the rural areas of BTH as provided in the section above, this section focuses on good/best practices in a number in renewable energy and related areas. These practices in many cases focus on enabling policies or organizations to allow the efficient deployment and use of the technologies described above. These good/best practices are gleaned from experience in countries in North America, Europe, Australia/New Zealand, Japan, and elsewhere, but also from experiences in developing nations and from international guidance documents intended for any nation that is in the process of reviewing its rural sustainable energy options.
6.2.1 Good Practices for Development of Grid-Interconnected Solar, Wind or
Biomass Electricity Systems
Key to promoting the development of robust and sustained systems for grid-interconnected electricity generation sited in rural areas is the development of consistent regulations and institutions that allow developers, investors, local governments, rural residents, and other stakeholders to have confidence in the long-term prognosis for and benefits of deployment of rural energy systems. In a summary “Best Practices” guide,105 a group from the US National Renewable Energy Laboratory (NREL) and other colleagues began by noting the following barriers to wind power deployment:
• “Lack of consistent policy signals, which can create uncertainty in markets
• Unstandardized and time-consuming regulatory and permitting processes
• Concerns of utilities related to integration of distributed or variable power on the grid
• Public concern related to visual, sound, land use, and other environmental impacts that maybe associated with wind
• Need for post-installation and ongoing skilled labor for turbine maintenance in developing countries
• At high wind penetration levels and in competitive wholesale markets, potential impacts on other generation sources due to low or negative bidding.”
To address these barriers, the NREL group offers the following best practices:
• Establishing Renewable Electricity Standards (RES), which set requirements “for a region, utility, or country to purchase a specific amount of electricity from renewable
105 Sadie Cox, Suzanne Tegen, Ian Baring-Gould, Frank A. Oteri, Sean Esterly, Trudy Forsyth, and Ruth Baranowski (2015), Policies to Support Wind Power Deployment: Key Considerations and Good Practices, National Renewable Energy Laboratory, dated May 2015, NREL/TP-6A20-64177, available as https://www.nrel.gov/docs/fy15osti/64177.pdf.
123
sources”, including basing the RES in sound resource and market assessments, making sure that the RES calls for an increasing share of renewable electricity over time and is specific in calling for wind power (and by extension, other renewable electricity sources as applicable in a particular area) as part of the RES, enacting subnational RES regimes to support development of renewable electricity in diverse areas, and supporting a “broader enabling policy environment”. The latter could, for example, include the use of feed-in tariffs, production and investment tax credits, and other financial mechanisms to provide incentives for renewable power development, as described below, as well as requirements for integrated resource planning by utilities, voluntary green power markets, policies addressing transmission needs, and support for research and development for wind and other renewable energy systems.106
• Establishing feed-in tariffs (FIT) that provide for long-term payments at a specified price for developers, but also include mechanisms for revising FITs as technologies and other factors change, guarantee grid access, improve forecasting of renewable system output to aid transmission grid operators, and streamline administration and approvals to make it easier for renewable project developers in initiating projects. FITs should also be differentiated by project type (for example, onshore and offshore), size, resource quality, and technology, and may benefit from transparent policies of FIT price “degression” to gradually remove financial support as markets for renewable power mature.107
• Establish clear and consistent interconnection standards and net metering policies,
particularly, for example, for smaller distributed renewable energy systems implemented by farmers and other local residents or firms.
• Establish investment and production tax credits that operate so as to stabilize markets, but do not provide excessive subsidies and seek to control costs. Means should be found to provide subsidies to support non-taxable as well as taxable entities to adopt renewable energy systems, and to create a stable policy environment for renewable investments.
• Adopt other approaches to encourage private investment, such as developing competitive renewable energy zones (as has been done in Texas, in the United States108), reducing the cost of capital via various mechanisms, including providing or backing low-interest or guaranteed/partially guaranteed loans, designing local ordinances specific to resources such as wind, and streamlining permitting processes, including with the involvement of local communities that would host wind farms, solar PV installations, or biomass energy facilities.
106 See also for example, Jenny Heeter, Bethany Speer, and Mark B. Glick (2019), International Best Practices for Implementing and Designing Renewable Portfolio Standard (RPS) Policies, NREL report NREL/TP-6A20-72798 dated April 2019, and available as https://www.nrel.gov/docs/fy19osti/72798.pdf. And Sadie Cox and Sean Esterly (2016), Renewable Electricity Standards: Good Practices and Design Considerations, Technical Report NREL/TP-6A20-65507, dated January 2016, and available as https://www.nrel.gov/docs/fy16osti/65507.pdf. 107 The IRENA (2018) report Renewable Energy Policies in a Time of Transition, for example, includes sections (in chapter 4) on regulatory and pricing policies for large and distributed renewable generation, as well as for access to electricity from decentralized renewables. Document available as https://www.irena.org/-/media/Files/IRENA/Agency/Publication/2018/Apr/IRENA_IEA_REN21_Policies_2018.pdf. 108 See, for example, Americans for a Clean Energy Grid (2017), “Texas as a National Model for Bringing Clean Energy to the Grid”, dated 13 October 2017, and available as https://cleanenergygrid.org/texas-national-model-bringing-clean-energy-grid/.
124
Another guide focusing on wind power was assembled for the Great Lakes region of North America109 and includes the following 18 “Best Practices” which overlap in many cases with the NREL findings above:
1. “Balanced and Uniform Siting Policies”, for which regulators in, for example, provincial governments would create “…balanced and transparent policies that are uniform throughout a state or region to help protect communities and the environment, while enabling developers to propose wind farms [or other renewable energy systems] that meet community approval”.
2. “Financing Mechanisms and Financial Incentives”, implemented by provincial governments, local governments (such as cities or towns), or financial institutions, would seek to provide “clear, consistent, and well-designed financing mechanisms or financial incentives that assure developers they will be able to recoup costs in a competitive market”, with approaches such as FITs, tax credits, loan guarantees, net metering, production taxes (taxes per MWh produced) instead of property taxes (based on the value of the generating equipment), and revolving loan funds .
3. “Renewable Portfolio Standards”, implemented by provincial governments (and in China, likely under the guidance of the national government), establish renewable energy purchase mandates and targets that should be maintained and increased over time.
4. “Integrated Resource Planning, Transmission Planning and Advanced Grid Management”, established by provincial (and/or national) governments, in collaboration with transmission system operators, provide “a common framework for balancing the traditional goals of utility planning – reliable service, economic efficiency, environmental protection, and equity – by considering all supply and demand options as potential contributors and selecting an integrated set of least-cost resources that meets expected needs”, and thus provide a clear and ongoing context for sustainable use of renewable resources and renewable technologies within a planning framework that is regularly updated with input from a range of stakeholders.110.
5. “Strategic Siting for Efficient Transmission Management”, implemented by renewable project developers with input from transmission planning/operating agencies and provincial agencies, summarized as siting renewable energy “developments to take advantage of existing transmission capabilities wherever possible and develop new electric transmission system infrastructure as needed to provide access to premier renewable energy. This will require collaboration in the planning and execution of transmission projects, while actively engaging the public and [in North America] federal, state/provincial and local officials.”
6. “Accessibility of Wind Project Documents”, implemented by renewable energy project developers, regulators, and other project participants, suggests that making project documents, including those related to environmental assessments associated with
109 Great Lakes Wind Collaborative (2011), Best Practices for Sustainable Wind Energy Development in the Great Lakes Region, Great Lakes Commission, dated July 2011, and available as https://www.glc.org/wp-content/uploads/2016/10/2011-wind-bp-toolkit.pdf. This guide, though prepared in 2011, includes a number of useful case studies and references to other tools and documents related to implementing best practices in rural wind energy (and by extension, other renewable energy) development. Another regional guide from North America worth reviewing though not quite as broad in scope, is Lee Todd and Binnu Jeyakumar (2017), When the wind is fair: Best practices for responsible wind development in Alberta, dated July 2017, and available as https://www.pembina.org/reports/wind-best-practices-report-final.pdf. 110 See also, for example, Christopher Greacen, Chuenchom Greacen, David von Hippel, and David Bill (2013), An Introduction to Integrated Resources Planning, International Rivers, dated October, 2013, and available as https://www.internationalrivers.org/sites/default/files/attached-files/intlrivers_irp.pdf.
125
projects, accessible on the internet to help to provide local communities with confidence in the transparency of projects, and a better understanding of ways to engage with the projects.
7. “Community Support through Public Engagement and Outreach”. implemented by project developers, community leaders, regulators, and others—in China, possibly provincial development and reform commissions—with goals including maintaining “a high level of transparency, [cultivating] relationships with the surrounding communities and [increasing] support for their projects by incorporating public involvement early in the planning process and continuing with public outreach throughout the life of a project.”
8. “Visual Impact Assessments”, implemented by developers and regulatory agencies, examine the visual impacts of wind turbines and arrays, and similarly large fields of solar photovoltaic or concentrating solar plant collectors.
9. “Noise Impact Assessments”, also implemented by developers (and applying particularly to wind turbine arrays) to comply with local regulations. but sometimes with inputs from academics and others, “should use available noise models to assess noise impacts from wind energy projects”, and “should be conducted to effectively communicate to the public the extent of noise impacts throughout the landscape and community.”
10. “Comprehensive Environmental Assessments”, prepared by developers with input and oversight by regulators and the local community, “include, but are not limited to: determining unique community considerations such as noise and visual impacts, avoiding sensitive wildlife habitats and protecting water quality, and examining other environmental impacts.”
11. “Site Plans and Constraints Maps”, also prepared by developers with input and oversight by regulators and the local community, deal with issues ranging from wildlife and historic resources to soil erosion, community issues, and safety. The site plan should have “sufficient detail to describe the nature and scope of the proposed project, the attributes of the specific location, as well as any potential issues or questions relating to the site chosen.”
12. “Stormwater Pollution Prevention Plans”, “created during the planning process and utilized during construction and operation”, are “developed during the planning phase and used to guide site management during construction” so as to prevent damage to both the immediate site and to neighboring or downstream sites. This will likely be most important in, for example, the hilly areas of Hebei Province.
13. “Construction Impact Mitigation”, undertaken by developers using a checklist of best management practices, comply “with general construction regulations and [use] best management practices to minimize the construction footprint”, including addressing issues such as minimizing pollutant discharges and soil disturbance, properly disposing of wastes and excavation materials, site restoration, and the implementation of site safety practices.
14. “Standardized Environmental Survey Protocols”, developed by regulatory agencies at the national and provincial levels, would specify how wildlife resources should be assessed, and developers should “adhere to those standardized environmental survey protocols for both pre- and post-construction monitoring”, as well as for creating inputs to a database of wildlife counts and activity.
126
15. “Using Brownfields for Wind Projects” or for other projects, such as solar PV or biomass energy projects, may be possible only in some limited areas of GBTH, but provides a way to make productive use of underutilized industrial or otherwise disused land, which in GBTH could include older, closed/decommissioned or soon-to-be-closed power stations. Regulators should promote the use of such sites, and developers should prioritize brownfield sites to reduce additional impacts and possibly to reduce project land costs.
16. “Decommissioning and Reclamation” refers to the portions of comprehensive development project plans, prepared by developers, that “create provisions for future site decommissioning and reclamation to ensure that the entire development life cycle” of the renewable energy project is accounted for.
17. “An Adaptive Regulatory Roadmap for Offshore Wind”, which may be applicable to offshore areas of Tianjin and Hebei, suggests that national and provincial agencies with a “regulatory or permit review” roles related to the offshore wind developments collaborate to provide a roadmap for offshore wind that provide security for both developers and residents and other stakeholders. This would include setting “forth the information requirements, timing and process by which an offshore wind proposal is reviewed in [each] agency role related to offshore wind”, integrating information into a single roadmap, perhaps for all of coastal Tianjin and Hebei, and creating and building in mechanisms to “streamline the siting and permitting processes for offshore wind”
“Bottomlands Leasing Policy” may or may not be directly applicable in GBTH, as it refers specifically to jurisdiction over lake bottoms in North America’s Great Lakes region, but some of the elements of these policies, ranging from provisions for installing transmission facilities to leasing of public lands and waters for offshore wind (or solar PV) development to collection of royalties by national and provincial agencies and lessee insurance requirements may be germane to certain situations in rural GBTH as well.
Some of these Best Practices are likely to become more important in China as local economies and regulatory expectations in GBTH grow over time.
In addition, though not explicitly mentioned in the guides above, another financing mechanism for renewable power systems that could become more viable in China and GBTH in the future is financing via revenues from carbon taxes. Carbon tax revenues paid, for example, but utilities or fossil-fueled generation companies could be used to provide partial grants or underwrite low-interest loans for rural renewable electric power systems.
As noted above, a trend in agriculture that is coming, though not yet implemented widely, is the use of electricity to power farm equipment that traditionally have used diesel or, for smaller units, gasoline engines. Both new and traditional major manufacturers of tractors, for example, are introducing electric models of various sizes, some of which will be guided autonomously.111 Figure 6-12 shows an example of an autonomous tractor produced in Japan.112 It is likely that this trend will accelerate in North America and Europe in the coming years, and possibly in China as well. These new uses for electricity on the farm can be charged by grid-connected on-farm power plants, thus reducing fuel costs for farmers. In addition, with proper configuration with smart meters and smart grids, the battery systems in these tractors may contribute to both on-farm back-up power and to grid electricity storage in the same way that electric vehicles may eventually loan their batteries to meeting peak power
111 See, for example, Soletrac.com (2020), “The Future of Farming”, available as https://www.solectrac.com/. 112 Sean Szymkowski, “The future face of smart farming”, CNET.com, dated Jan. 29, 2020, and available as https://www.cnet.com/roadshow/news/autonomous-electric-tractor-future-farming/.
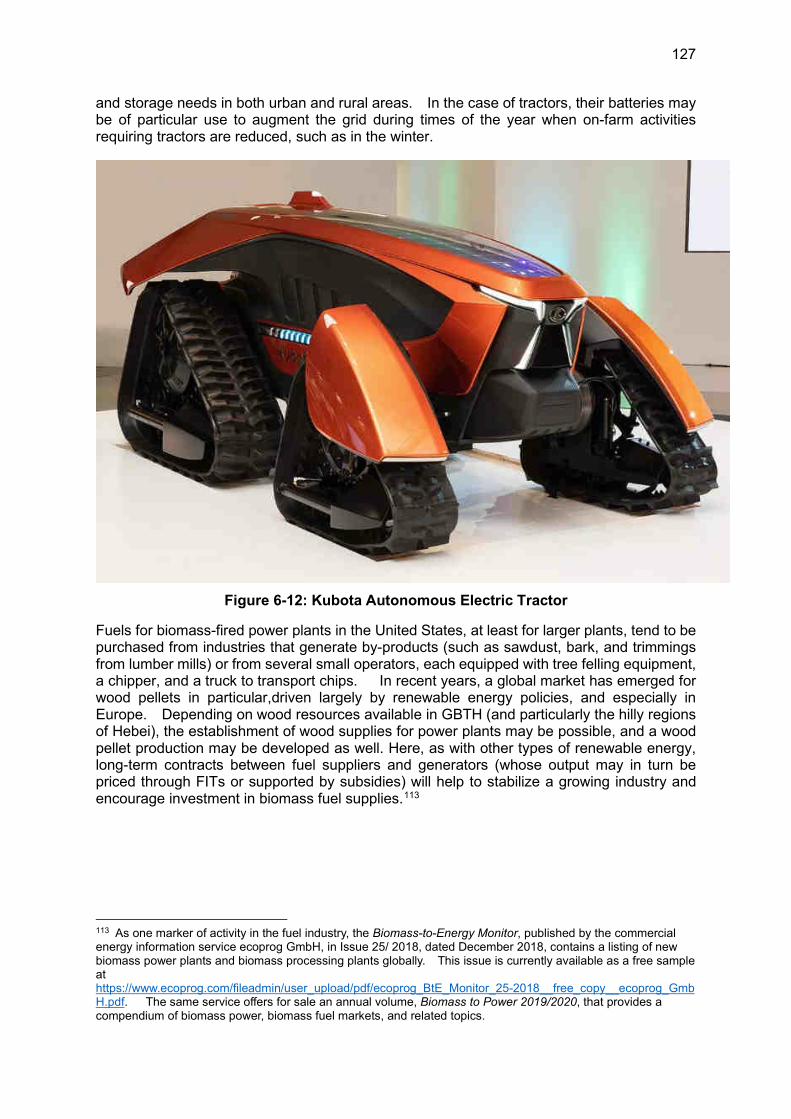
127
and storage needs in both urban and rural areas. In the case of tractors, their batteries may be of particular use to augment the grid during times of the year when on-farm activities requiring tractors are reduced, such as in the winter.
Figure 6-12: Kubota Autonomous Electric Tractor
Fuels for biomass-fired power plants in the United States, at least for larger plants, tend to be purchased from industries that generate by-products (such as sawdust, bark, and trimmings from lumber mills) or from several small operators, each equipped with tree felling equipment, a chipper, and a truck to transport chips. In recent years, a global market has emerged for wood pellets in particular,driven largely by renewable energy policies, and especially in Europe. Depending on wood resources available in GBTH (and particularly the hilly regions of Hebei), the establishment of wood supplies for power plants may be possible, and a wood pellet production may be developed as well. Here, as with other types of renewable energy, long-term contracts between fuel suppliers and generators (whose output may in turn be priced through FITs or supported by subsidies) will help to stabilize a growing industry and encourage investment in biomass fuel supplies.113
113 As one marker of activity in the fuel industry, the Biomass-to-Energy Monitor, published by the commercial energy information service ecoprog GmbH, in Issue 25/ 2018, dated December 2018, contains a listing of new biomass power plants and biomass processing plants globally. This issue is currently available as a free sample at https://www.ecoprog.com/fileadmin/user_upload/pdf/ecoprog_BtE_Monitor_25-2018__free_copy__ecoprog_GmbH.pdf. The same service offers for sale an annual volume, Biomass to Power 2019/2020, that provides a compendium of biomass power, biomass fuel markets, and related topics.
128
6.2.2 Good Practices for Development of non-Grid Connected Solar, Biomass, and
Wind Energy Systems
Although some of the good practices for grid-connected renewable energy systems described above, such as financing mechanisms and encouraging community involvement, also pertain to the development of non-grid-connected renewable energy systems, there are a number of attributes of the latter, including smaller scale and isolation from the main grid, that call for different considerations.114 In many cases, governments—especially national and provincial governments—can be expected to play a much smaller role in setting the parameters for isolated system development, although there are ways that governments can provide frameworks that make such systems more viable.
In rural GBTH, where existing communities almost always already are served by grid power, grid-independent renewable energy systems are likely to arise when new settlements or facilities are formed or developed, or when existing rural communities or installations choose to go “off-grid” for economic reasons (in instances where local generation can be less expensive than grid power) or to reduce their “carbon footprint”. Examples may be new tourist resorts, small mines, wood product production facilities, or communications infrastructure built in the mountainous areas of Hebei Province, and/or similarly remote country homes.115 For these sorts of installations, solar PV augmented by some type of energy storage (battery storage or pumped-storage hydro, for example) will likely be the technologies of choice,but where winds are favorable wind hybrid systems are a possibility, and where a biomass resource exists, a grid centered around biomass generation would also be a possibility.
A 2016 NREL document, Quality Assurance Framework for Mini-Grids, describes attributes designed to “address some of the root challenges of providing safe, quality, and financially viable mini-grid power systems to remote customers”.116 The framework is built around first, defining levels of service that customers can expect, ranging from basic service, in which interruptions of electricity availability are expected, to high-level service at near-central-grid levels, and second, providing an accountability and performance reporting network that supplies trusted information to consumers, funders, and regulators. The Quality Assurance Framework (QAF) suggested in this document seeks to achieve the following summary goals for grid-independent electricity systems:
• “Facilitating safe, quality, and affordable delivery of power through mini-grids” by setting levels of service that “ensure basic safety while matching service delivery to customer needs and ability to pay”, thereby allowing optimization of designs so as to strengthen revenue flows and maintain or increase a project’s financial viability.
• “Providing a formalized, common standard for classifying energy consumers” through levels of service that provide a common basis for assessment of community (or
114 An intermediate set of issues that may arise in BTH in some isolated areas over the coming decades are decisions related to how isolated mini-grids are connected to the main grid, when the latter arrives. For a treatment of these issues, which range from the highly technical to economic, financial, and policy considerations, see Chris Greacen, Richard Engel, and Thomas Quetchenbach (2013), A Guidebook on Grid Interconnection and Islanded Operation of Mini-Grid Power Systems Up to 200 kW, Lawrence Berkeley National Laboratory, dated April, 2013, and available as https://www.osti.gov/servlets/purl/1171616. 115 Offshore islands are also frequently attractive sites for stand-alone grids, but there seem to be relatively few such islands in GBTH, with the exception of those so close to the shore and population centers that the use of an underwater distribution cable is not a major undertaking. 116 Ian Baring-Gould, Kari Burman, Mohit Singh, Sean Esterly, Rose Mutiso and Caroline McGregor (2016), Quality Assurance Framework for Mini-Grids, Technical Report NREL/TP-5000-67374, dated November 2016, and available as https://www.nrel.gov/docs/fy17osti/67374.pdf.
129
remote venture) electricity needs, as well as “streamlining community assessment and site selection efforts” and facilitating improved forecasting of electricity needs.
• “Facilitating aggregation of mini-grid projects and unlocking private investment” is achieved, in part, by providing a “common classification system for customers and level of service provided, supported by the QAF’s standard monitoring and performance reporting protocols”, allowing projects to be more easily bundled together and understood/accepted by potential providers of financing, who can also use the data provide as market intelligence to help guide future mini-grid investments and thus spur the growth in mini-grid investments.
• “Informing policy and regulatory frameworks while helping to standardize regional rural electrification deployment efforts” through providing information in a standardized format that can help in the evaluation of regulations and reduce regulatory burdens associated with projects.
Three levels of service are described in the QAF, namely “Base Level”, “Standard Level” and “High Level”, and these are differentiated by a range of parameters such as acceptable voltage drop or imbalance, presence of/protection from transient surges, and number and duration of annual outages. Given China’s near-universal grid coverage, it seems likely that most grid-independent electricity consumers would require service at the Standard or High level as described in this document, but that choice will be a function of the particular circumstances of the installation. Table 6-3 and Table 6-4, both from the Executive Summary of the NREL document, provide, respectively, descriptions of the roles and of the activities and benefits that would pertain to four different sets of stakeholders, namely investors, governments, developers/supplier and electricity customers.
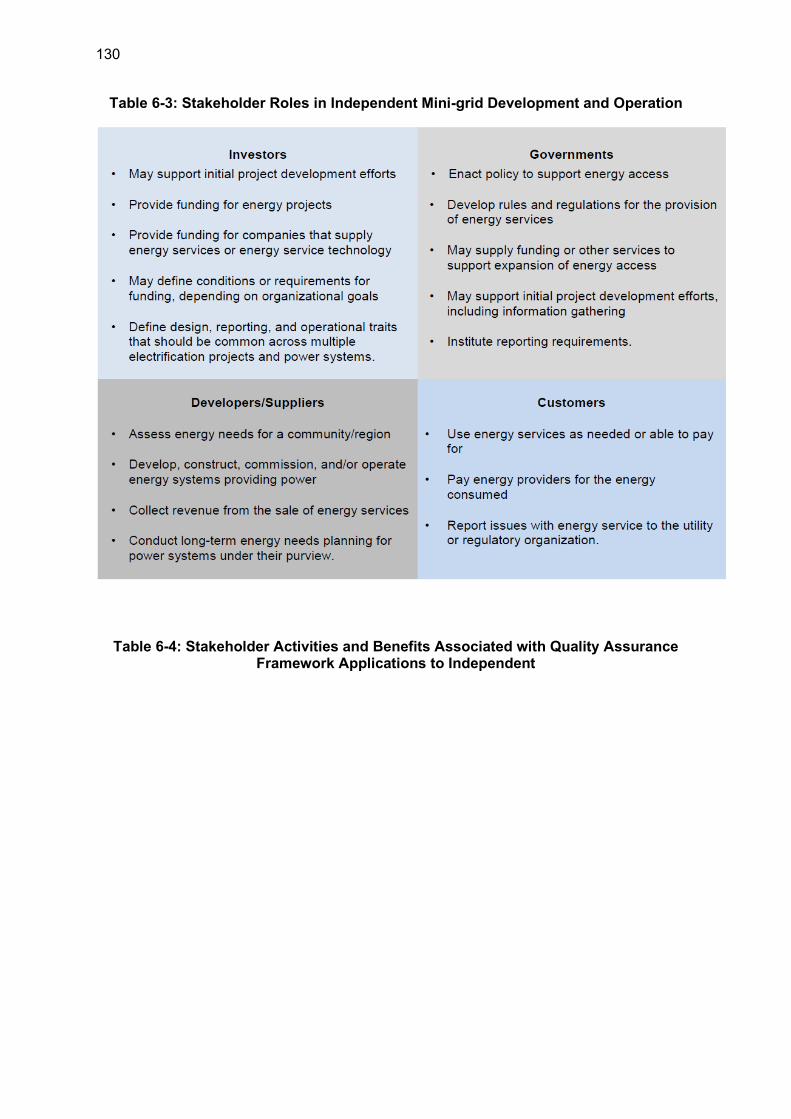
130
Table 6-3: Stakeholder Roles in Independent Mini-grid Development and Operation
Table 6-4: Stakeholder Activities and Benefits Associated with Quality Assurance Framework Applications to Independent
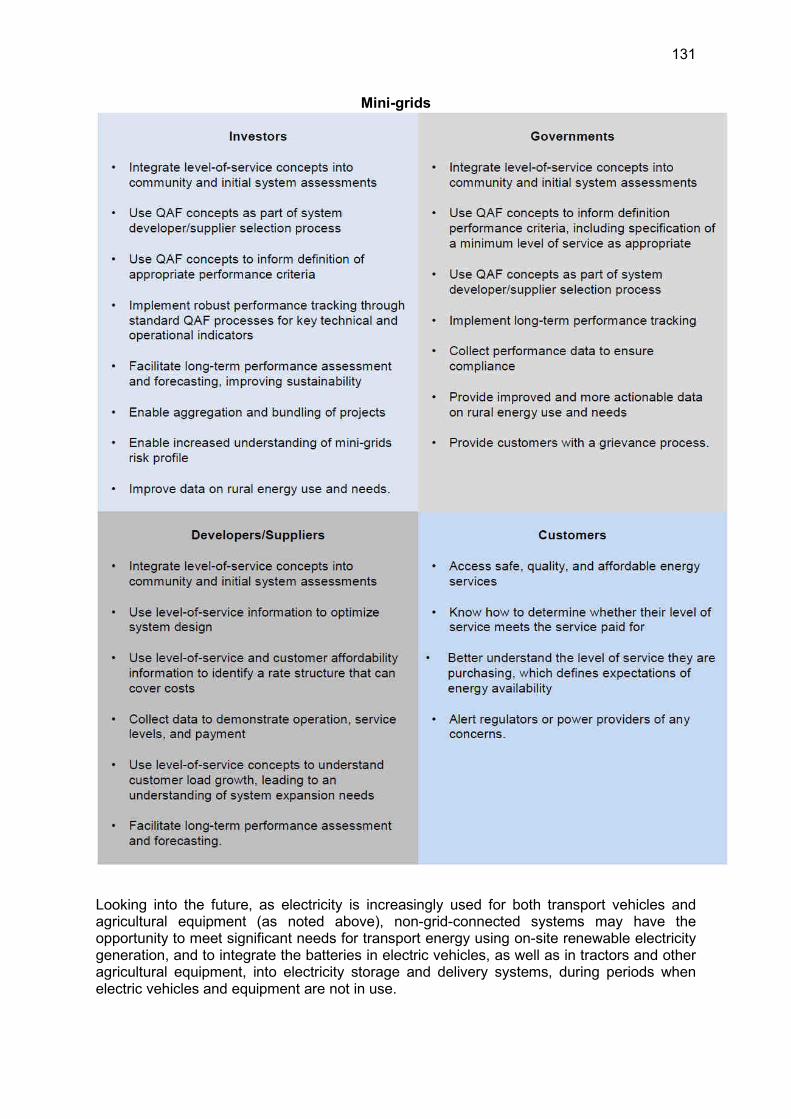
131
Mini-grids
Looking into the future, as electricity is increasingly used for both transport vehicles and agricultural equipment (as noted above), non-grid-connected systems may have the opportunity to meet significant needs for transport energy using on-site renewable electricity generation, and to integrate the batteries in electric vehicles, as well as in tractors and other agricultural equipment, into electricity storage and delivery systems, during periods when electric vehicles and equipment are not in use.
132
It should be remembered that although remote grids benefit the users and developers of the remote systems, they also provide benefits to society at large, and to the central grid, by allowing the avoidance of investment in expensive transmission and distribution lines to remote areas, and the attendant electricity distribution losses typically incurred in serving those locations. These benefits are, in some ways, similar to the benefits of encouraging energy efficiency (see below) among consumers, and as such it may make sense, in some circumstances, to provide partial financial subsidies to encourage the development of stand-alone systems in incidences where it would be more expensive or otherwise suboptimal (such as when installing a service line might result in environmental damage) to serve a particular consumer, installation, or community from the central grid.
An older (2008) World Bank document summarizes guidelines for off-grid power project designers.117 Among the guidelines most relevant to the GBTH situation are the following:
• “The conception and implementation of the off-grid project must be consistent with the overall rural electrification plan for the region.” In GBTH, with practically universal grid coverage, this will likely pertain to the choice of whether remote users should be connected to the grid or whether off-grid solutions make more sense for the case being studied.
• “Project design must not be technology driven”, rather should be guided by a cost-benefit analysis of technology options.
• “Early in the assessment phase, efforts must be made to maximize community awareness, involvement, and support, which are vital to project success.”
• “For off-grid projects that rely on private-sector participation [probably most or all in the case of GBTH], the simplest delivery mechanism or business model (or mix thereof) commensurate with local realities should be applied.”
• “The government must put in place light-handed regulatory measures that simplify operations for private sector participants and limit the cost of doing business, while adequately protecting consumers.”
• “Appropriate training should be provided to participants of off-grid projects at various levels, including government staff, potential service providers, and consumers.” In the case of GBTH, this may call, for example, for a targeted set of training courses and certifications for off-grid equipment providers and installers.
• “One should maximize opportunities for productive and institutional applications that complement the provision of household service.” Given that applications of off-grid systems for new facilities in GBTH will likely be quite specific in nature, this guidance may be infrequently needed, but in a future where small communities may start to “opt out” of the central grid for various reasons, it may become more applicable.
• “Opportunities for international co-financing should be explored.” The applicability of this guidance for GBTH may be limited as China’s per-capita income continues to rise, but there still may be opportunities for international co-financing in the near-term.
Grid-independent biomass-fired power systems would be most likely to be built where a waste fuel supply was readily available on or near to the proposed mini-grid. If the biomass fuel is to be harvested from nearby forests, it is important to make sure that harvests are sustainable, that is, do not exceed replacement growth on an annual average basis, and do not deplete the soil of carbon or other nutrients. Biomass harvest should also take place in a way the minimizes damage to soils and surrounding ecosystems and considers the needs of nearby wildlife. From a commercial standpoint, a biomass-fueled mini-grid system would need to have a long-term supply of fuel secured or largely assured before construction of major components, such as the generator, begins.
117 World Bank Group (2008), Designing Sustainable Off-Grid Rural Electrification Projects: Principles and Practices, dated November 2008, and available as https://www.ctc-n.org/sites/d8uat.ctc-n.org/files/resources/offgridguidelines_0.pdf.
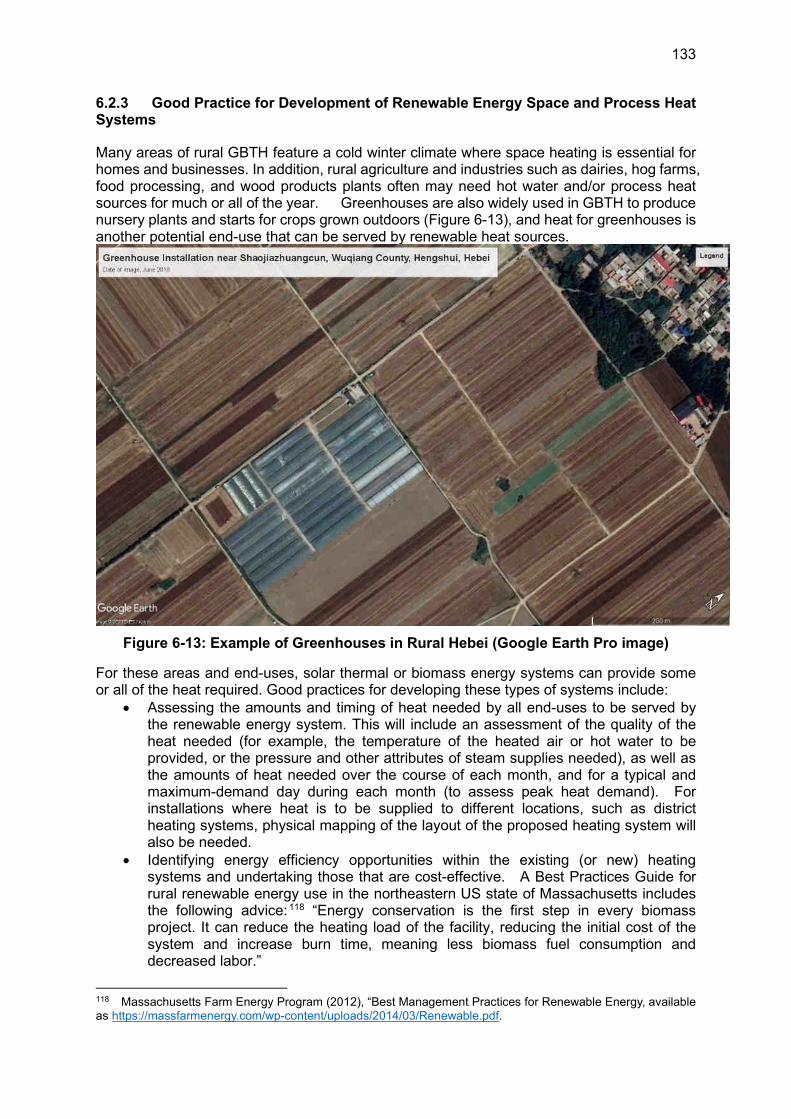
133
6.2.3 Good Practice for Development of Renewable Energy Space and Process Heat Systems
Many areas of rural GBTH feature a cold winter climate where space heating is essential for homes and businesses. In addition, rural agriculture and industries such as dairies, hog farms, food processing, and wood products plants often may need hot water and/or process heat sources for much or all of the year. Greenhouses are also widely used in GBTH to produce nursery plants and starts for crops grown outdoors (Figure 6-13), and heat for greenhouses is another potential end-use that can be served by renewable heat sources.
Figure 6-13: Example of Greenhouses in Rural Hebei (Google Earth Pro image)
For these areas and end-uses, solar thermal or biomass energy systems can provide some or all of the heat required. Good practices for developing these types of systems include:
• Assessing the amounts and timing of heat needed by all end-uses to be served by the renewable energy system. This will include an assessment of the quality of the heat needed (for example, the temperature of the heated air or hot water to be provided, or the pressure and other attributes of steam supplies needed), as well as the amounts of heat needed over the course of each month, and for a typical and maximum-demand day during each month (to assess peak heat demand). For installations where heat is to be supplied to different locations, such as district heating systems, physical mapping of the layout of the proposed heating system will also be needed.
• Identifying energy efficiency opportunities within the existing (or new) heating systems and undertaking those that are cost-effective. A Best Practices Guide for rural renewable energy use in the northeastern US state of Massachusetts includes the following advice: 118 “Energy conservation is the first step in every biomass project. It can reduce the heating load of the facility, reducing the initial cost of the system and increase burn time, meaning less biomass fuel consumption and decreased labor.”
118 Massachusetts Farm Energy Program (2012), “Best Management Practices for Renewable Energy, available as https://massfarmenergy.com/wp-content/uploads/2014/03/Renewable.pdf.
134
• Install equipment that is certified by relevant authorities with regard to its efficiency, safety, and environmental emissions (for biomass-fueled systems).
• Make sure that adequate technical support and qualified labor is available, preferably within reasonable transport distance of the project site, to design, install, and maintain the heating system.
• For biomass-fired systems, make sure that adequate supplies of fuel are available, ideally, particularly for larger systems, by securing a long-term contract for fuel supply.
• Heat and hot water produced solar-thermal systems, for example, for on-farm use, may use unglazed collectors, for example for aquaculture (these typically do not operate in cold weather), glazed collectors, or evacuated tube collectors, the latter of which are widely produced and used in China. For these systems, a common target is to design the system to provide on the order of 40 to 60 percent of annual hot water needs, depending on the installation, as sizing to meet peak demands may mean higher capital costs than are needed because the purchased capacity will be greater than is needed for much of the year.
• For existing district heating systems in rural towns, convert systems from fossil fuels to renewable fuels including biomass, biogas, or solar thermal heat, and update to “fourth generation” district heating systems that use low-temperature heat (60 °C) to reduce heat losses, as well as using “two-way district heating and cooling, [using] smart energy management (optimizing supply, distribution and consumption) and [relying] uniquely on renewable or secondary heat production”.119
An extensive guide recently prepared for the Australian Renewable Energy Agency (ARENA) reviews a number of renewable energy technologies useful for providing industrial process heat, which may be applicable to some rural industries in GBTH, including the use of renewable electricity to provide process heat.120 For the latter, one means of converting electricity to heat at and apparent efficiency of greater than the near-100 percent offered by resistance electric heating is heat pump technologies. Ground-source heat pumps, sometimes referred to as “geothermal heat pumps”, use the relatively constant temperatures found meters to hundreds of meters underground, and sometimes in groundwater, as the basis for heat-pump installations that can supply several units of heat for each unit of renewable electricity provided. Figure 6-14, below, summarizes the ARENA research on the relative costs of a range of renewable (and non-renewable) technologies for producing process heat. One of the summary conclusions of the study was that “Abattoirs [livestock slaughter and butchering facilities], dairy processing, fruit and vegetable processing, breweries and various other sub-sectors, all of which use only hot water and low-pressure steam, which, together with the non-metropolitan location of many plants and the availability of biowaste in many cases, makes them attractive targets for early adoption of renewables.”
119 C40 Cities and UNEP (2016), Good Practice Guide: District Energy, dated February, 2016, and available as https://californiaseec.org/wp-content/uploads/2016/03/C40-Good-Practice-Guide_District-Energy.pdf. 120 Keith Lovegrove, Dani Alexander, Roman Bader, Stephen Edwards, Michael Lord, Ahmad Mojiri, Jay Rutovitz, Hugh Saddler, Cameron Stanley, Kali Urkalan, and Muriel Watt (2019), Renewable Energy Options for Industrial Process Heat, prepared for ARENA, dated November, 2019, and available as https://arena.gov.au/assets/2019/11/renewable-energy-options-for-industrial-process-heat.pdf.
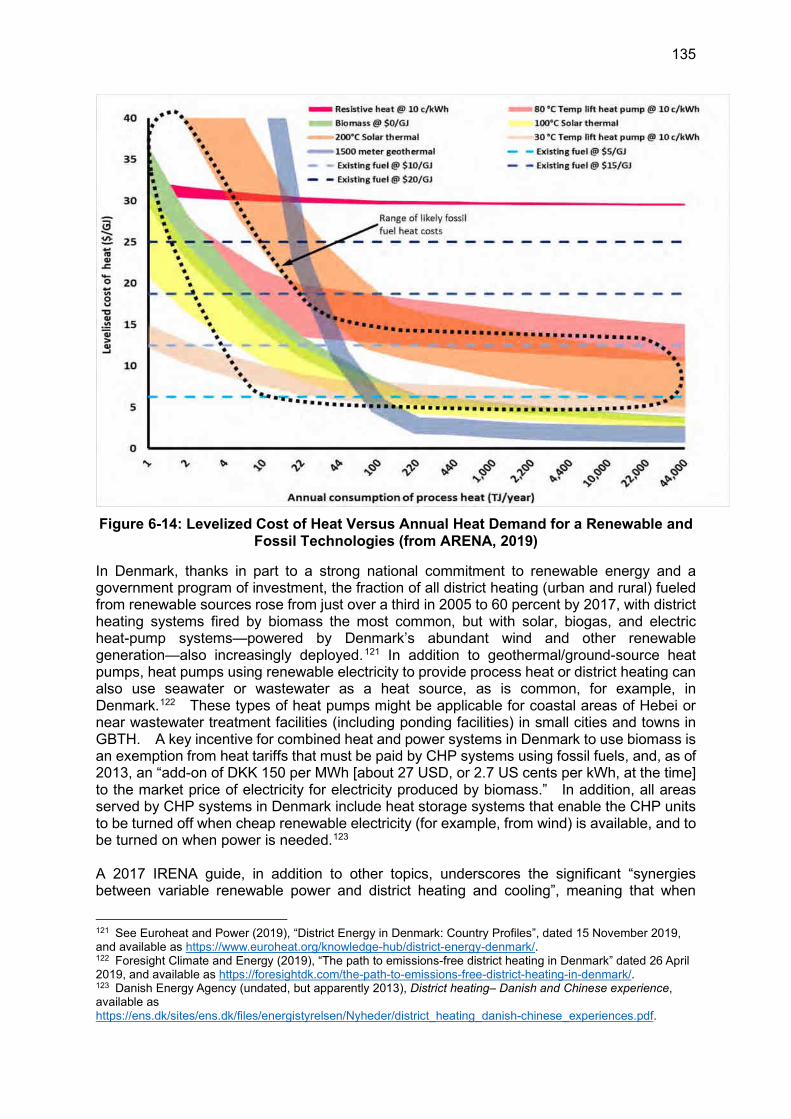
135
Figure 6-14: Levelized Cost of Heat Versus Annual Heat Demand for a Renewable and Fossil Technologies (from ARENA, 2019)
In Denmark, thanks in part to a strong national commitment to renewable energy and a government program of investment, the fraction of all district heating (urban and rural) fueled from renewable sources rose from just over a third in 2005 to 60 percent by 2017, with district heating systems fired by biomass the most common, but with solar, biogas, and electric heat-pump systems—powered by Denmark’s abundant wind and other renewable generation—also increasingly deployed.121 In addition to geothermal/ground-source heat pumps, heat pumps using renewable electricity to provide process heat or district heating can also use seawater or wastewater as a heat source, as is common, for example, in Denmark.122 These types of heat pumps might be applicable for coastal areas of Hebei or near wastewater treatment facilities (including ponding facilities) in small cities and towns in GBTH. A key incentive for combined heat and power systems in Denmark to use biomass is an exemption from heat tariffs that must be paid by CHP systems using fossil fuels, and, as of 2013, an “add-on of DKK 150 per MWh [about 27 USD, or 2.7 US cents per kWh, at the time] to the market price of electricity for electricity produced by biomass.” In addition, all areas served by CHP systems in Denmark include heat storage systems that enable the CHP units to be turned off when cheap renewable electricity (for example, from wind) is available, and to be turned on when power is needed.123 A 2017 IRENA guide, in addition to other topics, underscores the significant “synergies between variable renewable power and district heating and cooling”, meaning that when
121 See Euroheat and Power (2019), “District Energy in Denmark: Country Profiles”, dated 15 November 2019, and available as https://www.euroheat.org/knowledge-hub/district-energy-denmark/. 122 Foresight Climate and Energy (2019), “The path to emissions-free district heating in Denmark” dated 26 April 2019, and available as https://foresightdk.com/the-path-to-emissions-free-district-heating-in-denmark/. 123 Danish Energy Agency (undated, but apparently 2013), District heating– Danish and Chinese experience, available as https://ens.dk/sites/ens.dk/files/energistyrelsen/Nyheder/district_heating_danish-chinese_experiences.pdf.
136
renewable electricity from wind or solar power is abundant and cannot all be used by the central grid (or by local end-users), heat pumps and other technologies can be used to add to long-term thermal storage (heat storage or chilled water or ice, for example), with the thermal storage tapped for use in district heating or process heat as needed.124
6.2.4 Good Practice for Use of Renewable Energy for Fuels Production
The potential uses of renewable energy for fuels production ranges from:
• The use of crop residues and other biomass wastes to generate producer gas or “syngas” (and, with processing) hydrogen, via thermal gasification;
• Production of methane-rich biogas from animal manures and other (typically high-moisture) feedstocks;
• The cultivation of crops for conversion—either via fermentation or via thermal conversion—into fuels such as ethanol and methanol; to
• The use of renewable electricity, via the electrolysis of water (or, eventually, advanced technologies), to produce hydrogen, ammonia, or methane from carbon dioxide (CO2) and hydrogen, though the latter technology is still under development.
Good practices for the production of fuels—which can in turn be used for rural end-uses such as farming or to support rural industrial processing, or sold as fuels for transport of other sectors—in some case mirror some of the other good practices described above, including the provision of incentives to get fuels production started, undertaking assessments to identify the needs for fuels in both rural areas and beyond, and involving local stakeholders when planning large projects. Some types of good practices for fuels production, however, are more specific, including those related to sustainable farming of inputs for biofuel production, accounting for the net greenhouse gas emission consequences of fuels production, setting standards for fuels consumption to encourage the use of renewable fuels, and other considerations. Some of these issues are summarized below.
One analytical tool that has been used to evaluate the potential of renewable fuels production, and the potential pitfalls of same, is life cycle analysis, or LCA. Although LCA can be applied from the perspectives of many different stakeholders, and thus yield different result even for the same project, in essence it is intended as a way of evaluating the impacts of the production and use of a fuel (or other economic good) relative to that of a competing product. For biofuels, the elements of an LCA would typically be evaluated include quantitative and sometimes qualitative metrics such as greenhouse gas (GHG) emissions from the different steps in a fuel production system (including, for example, emissions from cultivated fields), air pollutant emissions and air quality impacts, water quality impacts, the quantity of water required for fuels production, and the fraction of that water representing consumptive use, impacts on soil and soil quality, and impacts on biodiversity and the provision of ecosystem services.125 As an example, although ethanol produced from corn, when burned as s fuel, nominally produces no fossil-based CO2, counting other inputs to corn cultivation such as fuel used by tractors and other agricultural equipment burning petroleum-derived diesel, and fossil-fuel inputs to chemical fertilizer production, the overall life-cycle emissions from
124 IRENA (2017), Renewable Energy in District Heating and Cooling: A Sector Roadmap for Remap, dated March, 2017, and available as http://www.ourenergypolicy.org/wp-content/uploads/2017/03/IRENA_REmap_DHC_Report_2017.pdf. 125 See, for example, (US) National Academy of Sciences (2011), Renewable Fuel Standard: Potential Economic and Environmental Effects of U.S. Biofuel Policy, “Chapter: 5 Environmental Effects and Tradeoffs of Biofuels”, available as https://www.nap.edu/read/13105/chapter/7.
137
corn-based ethanol in the United States have been estimated at on the order of 60 percent that of gasoline produced from crude oil, although the results change when comparisons using different assumptions about the ethanol production process are used.126
The United States maintains a renewable fuel standard (RFS) that mandates the use of specific volumes of biofuels in four different categories nationwide.127 The four different categories are:
• Biomass-based diesel” meeting a “50% lifecycle GHG reduction standard”, meaning that its manufacture and use must emit a maximum of 50 percent as much greenhouse gas emissions (as total CO2 equivalents) as conventional diesel made from crude petroleum;
• “Cellulosic biofuel must be produced from cellulose, hemicellulose, or lignin and must meet a 60% lifecycle GHG reduction” relative to gasoline made from crude petroleum;
• “Advanced biofuel can be produced from qualifying renewable biomass (except corn starch) and must meet a 50% GHG reduction”; and
• “Renewable (or conventional) fuel typically refers to ethanol derived from corn starch and must meet a [minimum] 20% lifecycle GHG reduction threshold”.
These standards, first put in place in 2007, have been phased in over the years so that in 2022 US refiners and other fuel producers must incorporate 36 billion gallons (about 136 billion liters) of renewable fuels (see Figure 6-15), which amounts to about 18 percent of total 2019 US supplies of gasoline and diesel combined.128 RFS in the United States were intended to accomplish multiple objectives. Foremost among these are reductions in fossil GHG emissions, but the RFS has also been responsible for providing a more secure (less price volatility) market for corn for corn producers, for driving technological innovation in fuels production, and for spurring the growth of jobs in the renewable fuel industry.129 Lowering the cost of fuels (as the cost of ethanol has typically been below that of gasoline) is also touted as an advantage of an RFS.
126 See, for example, United States Department of Agriculture (USDA, 2018), USDA Factsheet: Lifecycle Greenhouse Gas Emissions of Corn-Based Ethanol, available as https://www.usda.gov/oce/climate_change/mitigation_technologies/Ethanol_GHG_Balance_Factsheet.pdf, and referencing the full report, J. Rosenfeld, J. Lewandrowski, T. Hendrickson, K. Jaglo, K. Moffroid, and D. Pape,(2018), A Life-Cycle Analysis of the Greenhouse Gas Emissions from Corn-Based Ethanol, report prepared by ICF under USDA Contract No. AG-3142-D-17-0161, dated September 5, 2018, and available as https://www.usda.gov/oce/climate_change/mitigation_technologies/LCA_of_Corn_Ethanol_2018_Report.pdf. . 127 United States Environmental Protection Agency (USEPA, 2017), “Renewable Fuel Standard Program: Overview for Renewable Fuel Standard”, dated June, 2017, and available as https://www.epa.gov/renewable-fuel-standard-program/overview-renewable-fuel-standard. 128 Based on statistics from United States Department of Energy/Energy Information Administration (2020), “Petroleum & Other Liquids Supply and Disposition”, available as https://www.eia.gov/dnav/pet/pet_sum_snd_d_nus_mbbl_a_cur.htm. 129 Renewable Fuels Association (2020), “Renewable Fuel Standard (RFS): The foundation of America's renewable energy policy”, available as https://ethanolrfa.org/renewable-fuel-standard/.
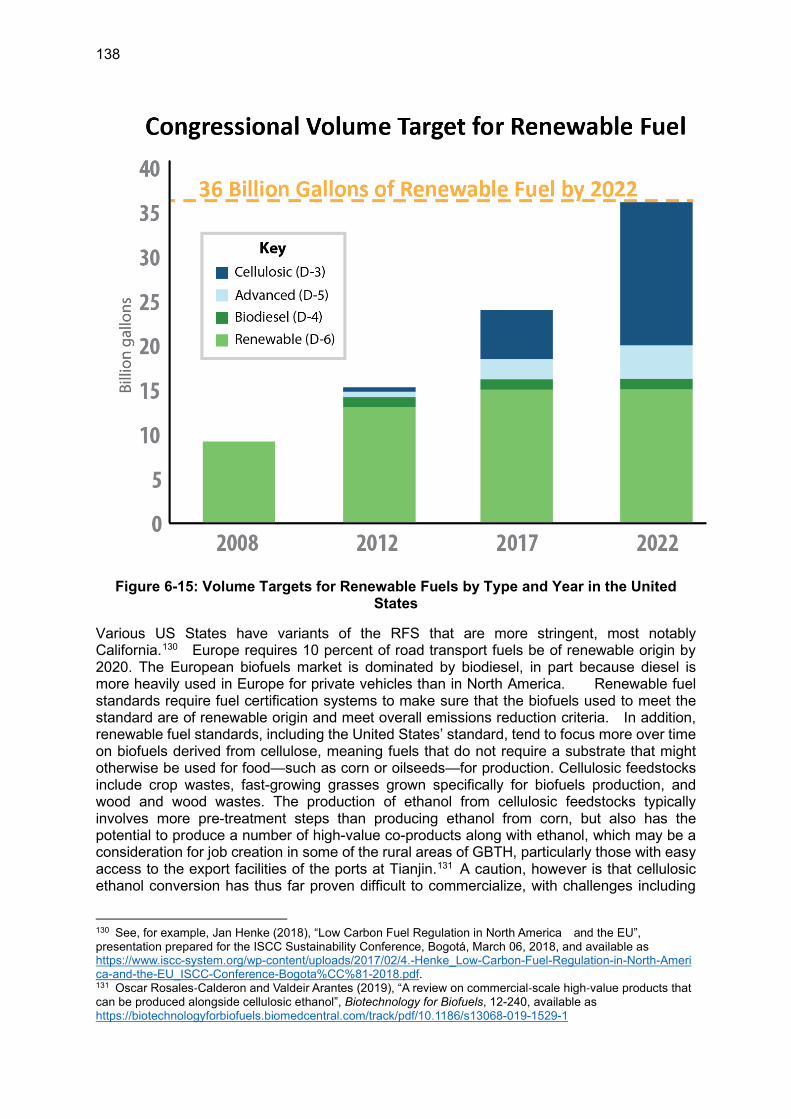
138
Figure 6-15: Volume Targets for Renewable Fuels by Type and Year in the United States
Various US States have variants of the RFS that are more stringent, most notably California.130 Europe requires 10 percent of road transport fuels be of renewable origin by 2020. The European biofuels market is dominated by biodiesel, in part because diesel is more heavily used in Europe for private vehicles than in North America. Renewable fuel standards require fuel certification systems to make sure that the biofuels used to meet the standard are of renewable origin and meet overall emissions reduction criteria. In addition, renewable fuel standards, including the United States’ standard, tend to focus more over time on biofuels derived from cellulose, meaning fuels that do not require a substrate that might otherwise be used for food—such as corn or oilseeds—for production. Cellulosic feedstocks include crop wastes, fast-growing grasses grown specifically for biofuels production, and wood and wood wastes. The production of ethanol from cellulosic feedstocks typically involves more pre-treatment steps than producing ethanol from corn, but also has the potential to produce a number of high-value co-products along with ethanol, which may be a consideration for job creation in some of the rural areas of GBTH, particularly those with easy access to the export facilities of the ports at Tianjin.131 A caution, however is that cellulosic ethanol conversion has thus far proven difficult to commercialize, with challenges including
130 See, for example, Jan Henke (2018), “Low Carbon Fuel Regulation in North America and the EU”, presentation prepared for the ISCC Sustainability Conference, Bogotá, March 06, 2018, and available as https://www.iscc-system.org/wp-content/uploads/2017/02/4.-Henke_Low-Carbon-Fuel-Regulation-in-North-America-and-the-EU_ISCC-Conference-Bogota%CC%81-2018.pdf. 131 Oscar Rosales‑Calderon and Valdeir Arantes (2019), “A review on commercial‑scale high‑value products that can be produced alongside cellulosic ethanol”, Biotechnology for Biofuels, 12-240, available as https://biotechnologyforbiofuels.biomedcentral.com/track/pdf/10.1186/s13068-019-1529-1
139
feedstock harvesting and handling, pretreatment reliability, and the optimization of catalysts.132 The output of cellulosic ethanol in the United States is well behind the targets shown in Figure 6-15. As such, despite its promise, cellulosic ethanol may be some years away from large-scale commercialization, but would benefit from investments that could, for example, involve research at rural universities in GBTH, thus building a local knowledge base and helping to create attractive jobs for rural areas.
Production of biofuels requires care in the maintenance of the agricultural systems that are used to produce biofuels feedstocks. Use of farmlands that might otherwise be producing food is a concern that is at least partially addressed when agricultural wastes and by-products are used as biofuels feedstocks, or when lands not suitable for food production are used to produce bioenergy crops. Maintenance, and preferably building, of soil organic carbon is also a concern when crop residues are removed, or biomass crops are harvested. A program of regular measurement of soil carbon is needed, with adjustments in harvesting rates, changes in tillage practices, or the addition of soil amendments applied as needed. Because crops and soils vary from place to place, a program of regular measurement of soil carbon is needed, with adjustments in harvesting rates, changes in tillage practices, or the addition of soil amendments applied as needed.133 A United Nations Food and Agriculture Organization (UN FAO) document lists a number of policy instruments to promote sustainability and good practices in biofuels feedstock production, including mandates for GHG reduction, certification of agricultural systems used to produce biofuels, financial incentives for sustainable biofuels production (including direct payments “conditional to farmers’ compliance with specific environmental and socio-economic good practice”, tax credits, payments for environmental services and grants), and capacity-building to teach sustainable production practices to this and future generations of producers.134
6.2.5 Good Practice for Energy Efficiency Deployment in Rural Areas
In a large number of locations and situations, the most cost-effective and least-polluting way to provide more energy services is to improve the efficiency with which fuels and other forms of energy are used. In many parts of the world, including the United States, rural energy users tend to have less access to energy efficiency improvement options than those living in suburban and urban settings, while at the same time paying higher energy costs due to not being connected to natural gas grids, being served by remote electricity grids, and/or paying additional transport costs for fuels such as gasoline, diesel, and liquefied petroleum gas (LPG). 135 Rural consumers facing these challenges can benefit greatly from energy efficiency improvements. For example, building energy efficiency improvements can greatly reduce the heating fuel use in often older, and less efficient, rural homes, as well as increasing comfort levels. In addition, energy efficiency products and services are often less available to rural residents, thus programs that increase their availability in rural areas can have an important impact. Several northern US states have implemented programs
132 See, for example, Douglas B. Rivers, “10-slide Guide to Commercialization of Cellulosic Ethanol: Past, Present, and Future”, Biofuels Digest, dated February 27, 2019, and available at http://www.biofuelsdigest.com/bdigest/2019/02/27/cellulosic-commercialization-the-digests-2019-multi-slide-guide-to-cellulosic-ethanol/. 133 Heather Youngs and Chris Somerville (2014), “Best practices for biofuels”, Science, June 2014 344(6188):1095-6, available as https://www.researchgate.net/publication/262929665_Plant_science_Best_practices_for_biofuels. 134 Andrea Rossi and Paola Cadoni (for United Nations Food and Agriculture Organization, UN FAO, 2012), Policy Instruments to Promote Good Practices in Bioenergy Feedstock Production, available as http://www.fao.org/uploads/media/1203_BEFSCI-FAO_Policy_instruments_to_promote_good_practices_in_bioenergy_feedstock_production.pdf. 135 See, for example, Lauren Ross, Ariel Drehobl, and Brian Stickles (2018), The High Cost of Energy in Rural America: Household Energy Burdens and Opportunities for Energy Efficiency, American Council for an Energy-Efficient Economy (ACEEE), dated July, 2018, and available as https://www.aceee.org/sites/default/files/publications/researchreports/u1806.pdf.
140
providing a range of services including education on the benefits of energy efficiency, grants and loans to residents to improve the efficiency of their dwellings (“weatherization programs”), often with flexible repayment options such as on-bill financing through utilities, rural workforce training (likely also useful in China as a way of keeping young workers in rural communities), bulk purchasing of energy-efficient goods and services, and community partnerships.136
Several types of policy approaches can be used to help improve the efficiency of energy use in rural areas, including:
• Improve building energy codes for the types of buildings constructed in rural areas (for new buildings and substantial building retrofits) and provide training in enforcement of energy codes to local authorities. This would also include rural institutional buildings such as town offices, hospitals and clinics, and schools.
• In tandem with improved building codes, provide training in construction of energy-efficient buildings for local building contractors.
• Encourage the use of solar photovoltaic panels and solar water heaters for rural households and businesses to build toward “net-zero” building energy use, including a combination of FIT, tax incentives, grants for low-income buyers, and other approaches.
• Adopt nationwide or provincial energy efficiency standards for key appliances such as refrigerators, air conditioners, water heaters, heat pumps, and large consumer electronics, such as TVs.
• Adopt nationwide or provincial standards for key equipment used on farms and in food processing and other rural industries, including electric motors, air compressors, and pumps.
• Offer low-interest financing for energy efficiency improvements on buildings, such as through property-assessed clean energy programs, where the costs of energy efficiency improvements are incorporated in real estate loans and partially subsidized by property taxes.137
• Support energy efficiency improvements and renewable energy additions for institutional buildings in rural communities through provision of information on energy efficiency to town officials, making available support for building energy audits and making grants and financing for building improvements (or building new buildings better) available from provincial or national sources.
• Encourage the use of utility-funded energy efficiency programs targeted at rural residents. These programs in other nations are often ultimately ratepayer-funded, but offer opportunities for most or all consumers to lower their energy bills by participating.138
136 Suzanne MacDonald, Brooks Winner, Lisa Smith, Juliette Juillerat, and Sam Belknap (2019), “Bridging the rural efficiency gap: expanding access to energy efficiency upgrades in remote and high energy cost communities”, Energy Efficiency (2019), available as https://link.springer.com/article/10.1007/s12053-019-09798-8. 137 See, for example, US Department of Energy (2015), “Better Buildings Residential Network Peer Exchange Call Series: The Other 15%: Expanding Energy Efficiency to Rural Populations”, dated September 10, 2015, available as https://www.energy.gov/sites/prod/files/2015/10/f27/bbrn_Summary_RuralEE_091015.pdf. 138 See, for example, Mary Shoemaker, Annie Gilleo, and Jill Ferguson (2018), Reaching Rural Communities with Energy Efficiency Programs. ACEEE, dated September 2018, and available as https://www.aceee.org/sites/default/files/publications/researchreports/u1807.pdf.
141
• Create, apply, and enforce high standards for building energy efficiency in manufactured homes, which may also help to further develop rural industries as China becomes more of an exporter of manufactured and modular dwelling units.
• Provide government (provincial or county) grants for energy efficiency improvements for on-farm or food processing energy systems.
6.2.6 Good Practice in Providing Information, Financing Services, and Other Support for Rural Renewables.
Despite the presence of renewable resources and the technologies to harness them (including those described above), rural renewable energy deployment is unlikely to happen without information and financing. Specifically, rural actors need access to the information and expertise required to evaluate renewable energy opportunities, and to financing and financial approaches that can help with funding the purchase and installation of renewable energy systems.
In some countries, organizations have formed to act as a clearinghouse for information and tools (including software tools) that rural stakeholder need to research, design, and implement renewable energy systems as well as to help cooperatives and other groups of potential renewable energy system hosts in identifying and obtaining financial services. In the United States, for example, the National Renewables Cooperative Organization (NRCO)139
“…offers cooperatives access to the necessary resources to thoroughly evaluate renewable energy projects without the expense of a dedicated staff and specialized software. NRCO is active in the renewable energy marketplace on behalf of its members and customers, providing a centralized source of intelligence and opportunities. NRCO evaluates projects, presenting only the most promising to its members. NRCO facilitates transmission constraint modeling, Renewable Energy Credit (REC) market analysis, and engineering studies, and packages these into comprehensive recommendations. NRCO offers an established subscription process to participate in specific projects and can help members and customers with the ongoing operations and maintenance of those projects.”
As such, NRCO offers a business model that could be adapted for use in assisting the development of renewable energy systems for clients in GBTH.
A recent US document focusing on the role of energy infrastructure, and of change in energy infrastructure, in addressing inequalities and improving community health includes a number of lessons potentially applicable to rural areas in GBTH, such as:140
• Directing efforts to help energy cooperatives in rural areas to invest in renewables and energy efficiency.
• Enacting standards and mandates for energy efficiency in low-income areas and “[i]ncorporating non-energy benefits into decision-making on energy efficiency measures”.
• Changing electric utility ratemaking and billing practices to encourage energy efficiency while providing an affordable rate for basic service.
139 See http://nrco.coop/services/. 140 Regulatory Assistance Project, Synapse Energy Economics, and Community Action Partnership (2020), Energy Infrastructure Sources of Inequities and Policy Solutions for Improving Community Health and Wellbeing, dated April 28, 2020, and available as https://www.synapse-energy.com/sites/default/files/Equity-in-Energy-Report-19-037-compressed-0.pdf.
142
• Improving consumer education related to energy use and programs.
• Seek to address local air pollution problems in rural or semi-rural areas that currently host major coal-fired power plants (of which there are many in GBTH) by replacing coal-fired generation with renewable generation.
• Providing new employment opportunities, including in renewable energy and related sectors, to workers displaced when coal-fired power plants are decommissioned.
• Reforming existing environmental regulatory processes to consider a wider range of alternatives and community impacts, including reforming how utility plans are prepared, what elements are to be included in those plans, and community involvement in planning processes.
In other nations, such as Spain, rural energy cooperatives are adopting renewable energy despite a regulatory environment that does not favor local cooperatives.141 This experience underscores the need not just for local support to potential renewable energy developers and hosts, but also for national and provincial legislation and regulations that provide, for example, incentives for renewable energy development, and/or remove economic, regulatory, and institutional barriers to renewables deployment at the local level.
6.3 Case Studies of Successful Rural Renewable Energy Systems
This section presents four case studies of successful implementation of rural renewable energy systems in the United States, Europe, Australia, and Japan. These examples span a range from a nationwide program of solar photovoltaic deployment in rural areas through local energy cooperatives to the use of both biomass and electricity and wind power for district heating to “agrivoltaic” systems that combine solar generation and agriculture on the same piece of land. Some of these case studies may include models that will be immediately applicable to the situations in rural GBTH with no modification while some others may not be applicable to GBTH.
6.3.1 “A Solar Revolution in Rural America”
A report by the National Rural Electric Cooperative Association (NRECA) on the implementation of a project called the Solar Utility Network Deployment Acceleration (SUNDA) illustrates the benefits of good program design and dissemination through rural cooperative utilities, which are located in rural areas across the United States.142 Rural electric cooperatives are private, independent, and typically not-for-profit electric utilities serving their owner-members. The United States has 834 distribution cooperatives and 63 generation and transmission (G&T) cooperatives that provide wholesale power to the distribution cooperatives. The distribution cooperatives serve over 20 million consumers in 48 of the 50 states and cover 56 percent of the land mass of the US.143
141 See, for example, Science Daily, “Renewable energy cooperatives, an opportunity for energy transition”, dated November 12, 2018, and available as https://www.sciencedaily.com/releases/2018/11/181112131520.htm. This source is based on the research paper by Iñigo Capellán-Pérez, Álvaro Campos-Celador, and Jon Terés-Zubiaga (2018). “Renewable Energy Cooperatives as an instrument towards the energy transition in Spain”, Energy Policy, 2018; 123: 215 DOI: 10.1016/j.enpol.2018.08.064. 142 National Rural Electric Cooperative Association (NRECA, 2018) A Solar Revolution in Rural America, dated July, 2018, and available as https://www.cooperative.com/programs-services/bts/sunda-solar/Documents/Solar-Revolution.pdf. 143 National Rural Electric Cooperative Association (NRECA, 2020), America’s Electric Cooperatives, available as https://www.electric.coop/wp-content/uploads/2020/05/NRECA-Fact-Sheet-5-2020-1.pdf.
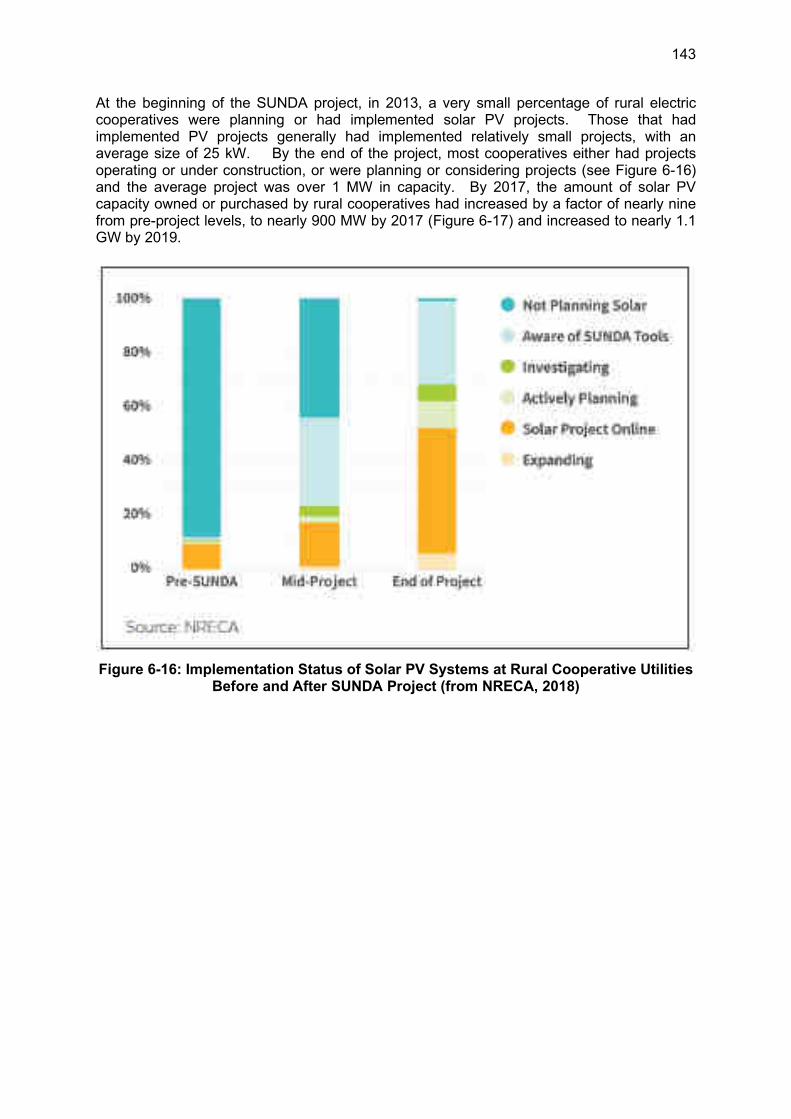
143
At the beginning of the SUNDA project, in 2013, a very small percentage of rural electric cooperatives were planning or had implemented solar PV projects. Those that had implemented PV projects generally had implemented relatively small projects, with an average size of 25 kW. By the end of the project, most cooperatives either had projects operating or under construction, or were planning or considering projects (see Figure 6-16) and the average project was over 1 MW in capacity. By 2017, the amount of solar PV capacity owned or purchased by rural cooperatives had increased by a factor of nearly nine from pre-project levels, to nearly 900 MW by 2017 (Figure 6-17) and increased to nearly 1.1 GW by 2019.
Figure 6-16: Implementation Status of Solar PV Systems at Rural Cooperative Utilities Before and After SUNDA Project (from NRECA, 2018)
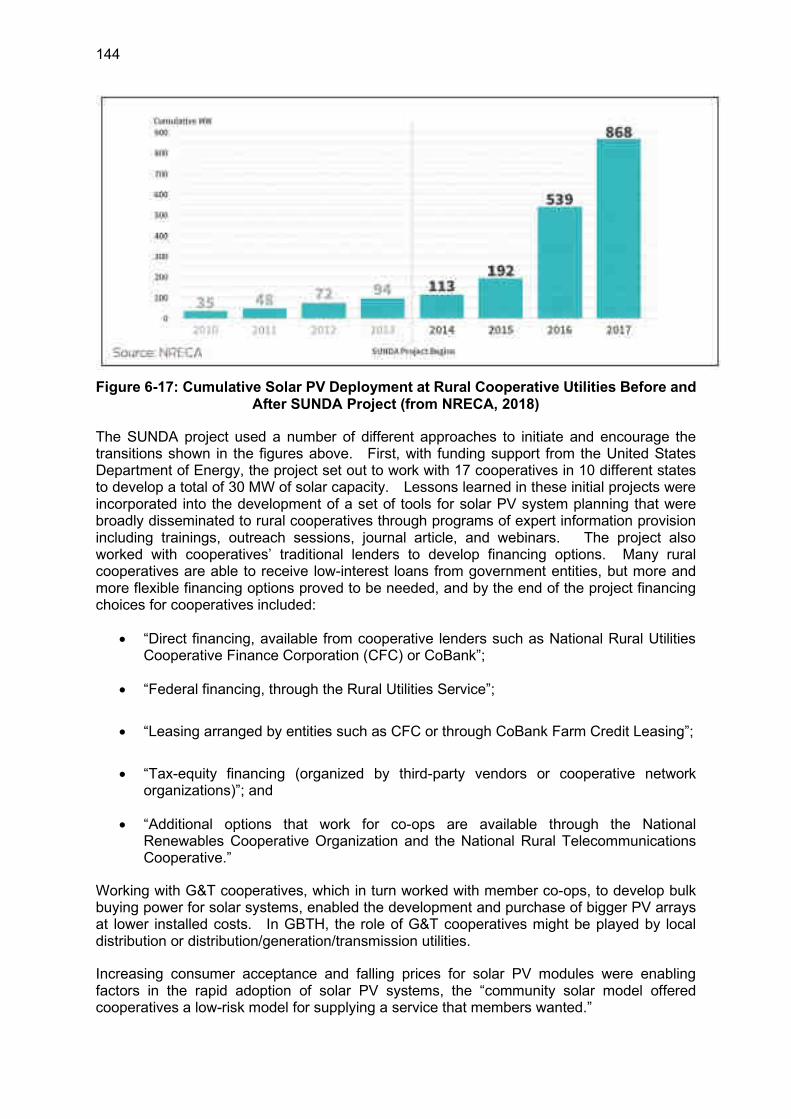
144
Figure 6-17: Cumulative Solar PV Deployment at Rural Cooperative Utilities Before and After SUNDA Project (from NRECA, 2018)
The SUNDA project used a number of different approaches to initiate and encourage the transitions shown in the figures above. First, with funding support from the United States Department of Energy, the project set out to work with 17 cooperatives in 10 different states to develop a total of 30 MW of solar capacity. Lessons learned in these initial projects were incorporated into the development of a set of tools for solar PV system planning that were broadly disseminated to rural cooperatives through programs of expert information provision including trainings, outreach sessions, journal article, and webinars. The project also worked with cooperatives’ traditional lenders to develop financing options. Many rural cooperatives are able to receive low-interest loans from government entities, but more and more flexible financing options proved to be needed, and by the end of the project financing choices for cooperatives included:
• “Direct financing, available from cooperative lenders such as National Rural Utilities Cooperative Finance Corporation (CFC) or CoBank”;
• “Federal financing, through the Rural Utilities Service”;
• “Leasing arranged by entities such as CFC or through CoBank Farm Credit Leasing”;
• “Tax-equity financing (organized by third-party vendors or cooperative network organizations)”; and
• “Additional options that work for co-ops are available through the National Renewables Cooperative Organization and the National Rural Telecommunications Cooperative.”
Working with G&T cooperatives, which in turn worked with member co-ops, to develop bulk buying power for solar systems, enabled the development and purchase of bigger PV arrays at lower installed costs. In GBTH, the role of G&T cooperatives might be played by local distribution or distribution/generation/transmission utilities.
Increasing consumer acceptance and falling prices for solar PV modules were enabling factors in the rapid adoption of solar PV systems, the “community solar model offered cooperatives a low-risk model for supplying a service that members wanted.”
145
The information resources and planning tools developed for cooperative member use under the SUNDA project have included:
• The “PV Cost & Finance Screening Tool”, a spreadsheet-based tool to help co-ops in the initial stages of planning a solar PV system that is easy to use and pre-loaded with cost, solar resources and performance information;
• The “Project Manager’s PV Quick Start Guide”, providing “an overview for project managers with proven, annotated checklists outlining project tasks and schedules, what to watch out for, and references to other materials, such as field manuals”;
• A “Communicator’s Toolkit” that provides co-op officials with “resources and samples to help co-ops educate consumer-members about how they can participate in cooperative solar development”; and
• A three-volume set of “PV Field Manuals” that were “developed to be the culmination of all the in-depth information the co-ops needed to successfully deploy their solar PV systems during the SUNDA project, and as the ultimate reference guide for cooperatives interested in solar.”
Aspects of the SUNDA project model that allowed it to succeed included:
• “Leaning by doing”, that is, a continuous process of evaluating project results and using those leanings to inform the next set of solar installations.
• Using “peer-to-peer” sharing of experience between cooperatives adopting solar PV systems to assist in the process of both providing information for cooperatives considering systems, and to exchange information on useful practices in solar PV development and operation.
• Providing standardized templates, designs, and tools to reduce the planning time needed, speed installation, help to transfer knowledge between users, and reduce system development and installation costs.
• Providing direct technical assistance by experts to cooperatives considering and developing PV systems.
• Using “data driven assessment[s] of project efficacy”, meaning collecting information on each project, using those data to evaluate what elements of the project made it successful or problematic, and using those data to refine approaches to outreach, as well as to refine tools, designs, and templates.
A broader study by the National Resources Defense Council (NRDC) of renewable energy deployment in rural areas in a 12-state Midwest region of the U.S. found rapid growth in the number of clean energy jobs in the area, vastly exceeding, in every state over 2015-2016, growth in jobs in the overall state economies. 144 By 2017, clean energy employment exceeded 3 percent of total rural jobs in three states, with the other states not far behind, and provided far more jobs than fossil energy industries in all states but one—oil-rich (and low-population) North Dakota (see Figure 6-18).
144 Arjun Krishnaswami and Elisheva Mittelman (2018), Clean Energy Sweeps Across Rural America, National Resources Defense Council (NRDC), dated November, 2018, and available as https://www.nrdc.org/sites/default/files/rural-clean-energy-report.pdf.
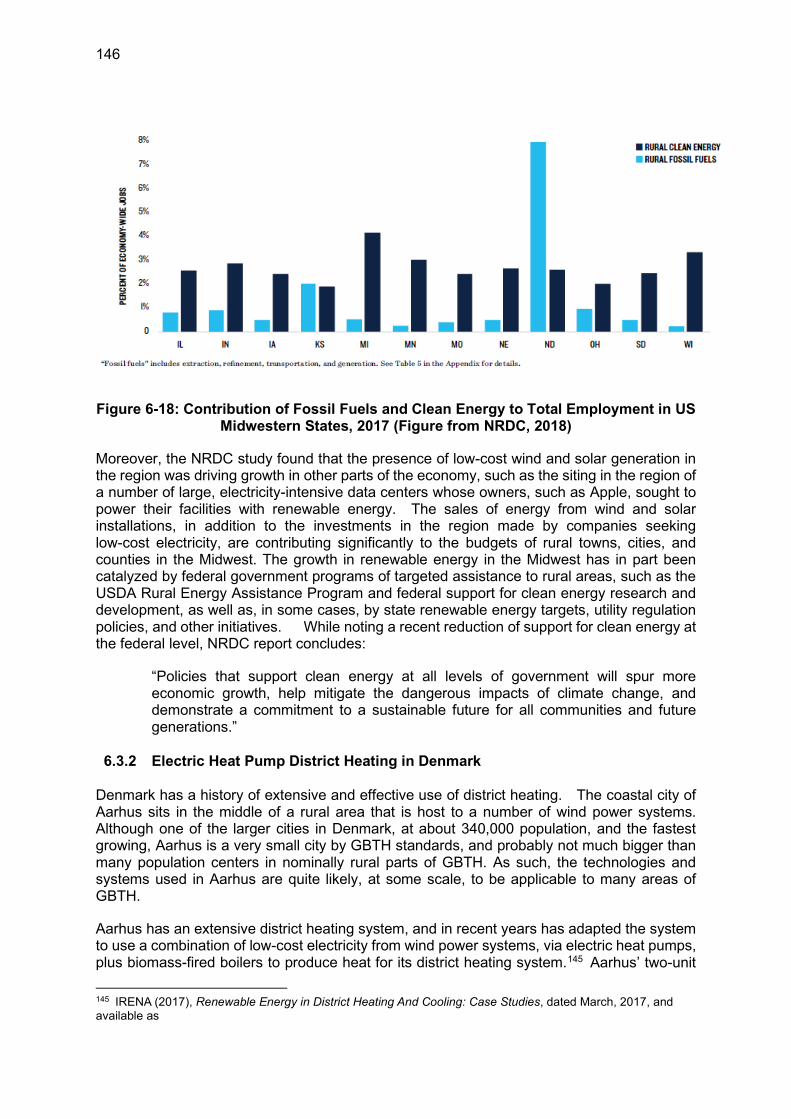
146
Figure 6-18: Contribution of Fossil Fuels and Clean Energy to Total Employment in US Midwestern States, 2017 (Figure from NRDC, 2018)
Moreover, the NRDC study found that the presence of low-cost wind and solar generation in the region was driving growth in other parts of the economy, such as the siting in the region of a number of large, electricity-intensive data centers whose owners, such as Apple, sought to power their facilities with renewable energy. The sales of energy from wind and solar installations, in addition to the investments in the region made by companies seeking low-cost electricity, are contributing significantly to the budgets of rural towns, cities, and counties in the Midwest. The growth in renewable energy in the Midwest has in part been catalyzed by federal government programs of targeted assistance to rural areas, such as the USDA Rural Energy Assistance Program and federal support for clean energy research and development, as well as, in some cases, by state renewable energy targets, utility regulation policies, and other initiatives. While noting a recent reduction of support for clean energy at the federal level, NRDC report concludes:
“Policies that support clean energy at all levels of government will spur more economic growth, help mitigate the dangerous impacts of climate change, and demonstrate a commitment to a sustainable future for all communities and future generations.”
6.3.2 Electric Heat Pump District Heating in Denmark
Denmark has a history of extensive and effective use of district heating. The coastal city of Aarhus sits in the middle of a rural area that is host to a number of wind power systems. Although one of the larger cities in Denmark, at about 340,000 population, and the fastest growing, Aarhus is a very small city by GBTH standards, and probably not much bigger than many population centers in nominally rural parts of GBTH. As such, the technologies and systems used in Aarhus are quite likely, at some scale, to be applicable to many areas of GBTH.
Aarhus has an extensive district heating system, and in recent years has adapted the system to use a combination of low-cost electricity from wind power systems, via electric heat pumps, plus biomass-fired boilers to produce heat for its district heating system.145 Aarhus’ two-unit
145 IRENA (2017), Renewable Energy in District Heating And Cooling: Case Studies, dated March, 2017, and available as
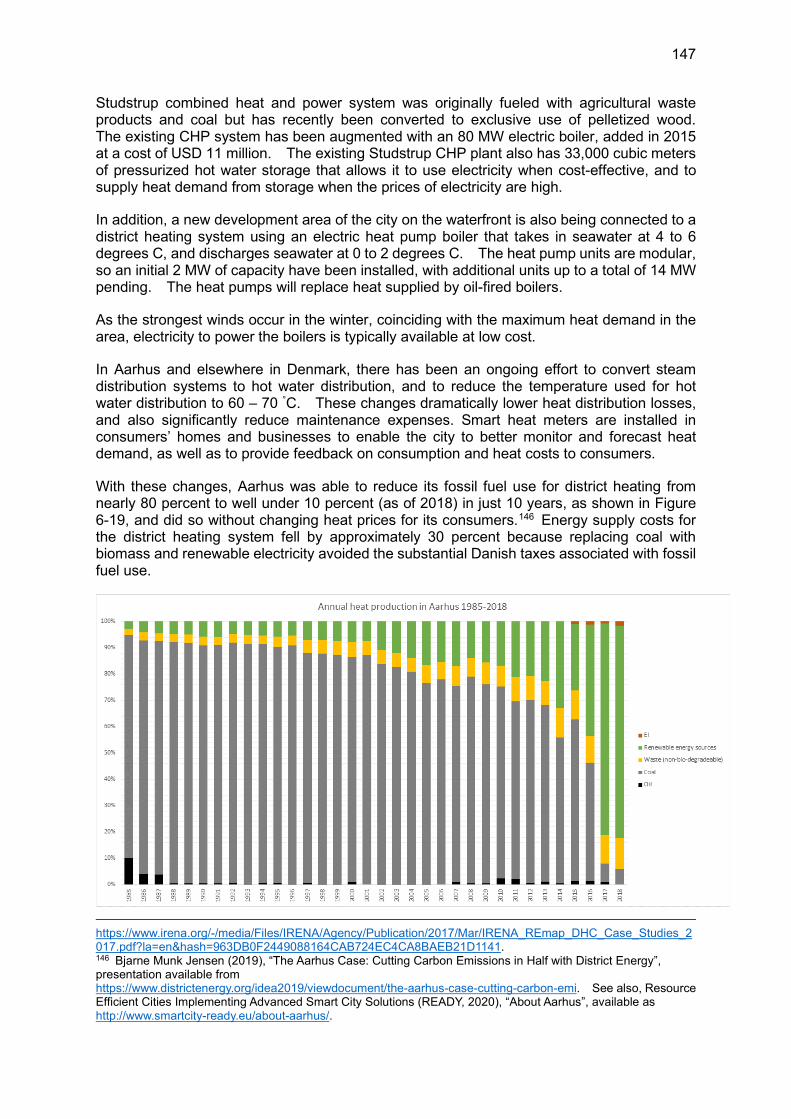
147
Studstrup combined heat and power system was originally fueled with agricultural waste products and coal but has recently been converted to exclusive use of pelletized wood. The existing CHP system has been augmented with an 80 MW electric boiler, added in 2015 at a cost of USD 11 million. The existing Studstrup CHP plant also has 33,000 cubic meters of pressurized hot water storage that allows it to use electricity when cost-effective, and to supply heat demand from storage when the prices of electricity are high.
In addition, a new development area of the city on the waterfront is also being connected to a district heating system using an electric heat pump boiler that takes in seawater at 4 to 6 degrees C, and discharges seawater at 0 to 2 degrees C. The heat pump units are modular, so an initial 2 MW of capacity have been installed, with additional units up to a total of 14 MW pending. The heat pumps will replace heat supplied by oil-fired boilers.
As the strongest winds occur in the winter, coinciding with the maximum heat demand in the area, electricity to power the boilers is typically available at low cost.
In Aarhus and elsewhere in Denmark, there has been an ongoing effort to convert steam distribution systems to hot water distribution, and to reduce the temperature used for hot water distribution to 60 – 70 °C. These changes dramatically lower heat distribution losses, and also significantly reduce maintenance expenses. Smart heat meters are installed in consumers’ homes and businesses to enable the city to better monitor and forecast heat demand, as well as to provide feedback on consumption and heat costs to consumers.
With these changes, Aarhus was able to reduce its fossil fuel use for district heating from nearly 80 percent to well under 10 percent (as of 2018) in just 10 years, as shown in Figure 6-19, and did so without changing heat prices for its consumers.146 Energy supply costs for the district heating system fell by approximately 30 percent because replacing coal with biomass and renewable electricity avoided the substantial Danish taxes associated with fossil fuel use.
https://www.irena.org/-/media/Files/IRENA/Agency/Publication/2017/Mar/IRENA_REmap_DHC_Case_Studies_2017.pdf?la=en&hash=963DB0F2449088164CAB724EC4CA8BAEB21D1141. 146 Bjarne Munk Jensen (2019), “The Aarhus Case: Cutting Carbon Emissions in Half with District Energy”, presentation available from https://www.districtenergy.org/idea2019/viewdocument/the-aarhus-case-cutting-carbon-emi. See also, Resource Efficient Cities Implementing Advanced Smart City Solutions (READY, 2020), “About Aarhus”, available as http://www.smartcity-ready.eu/about-aarhus/.
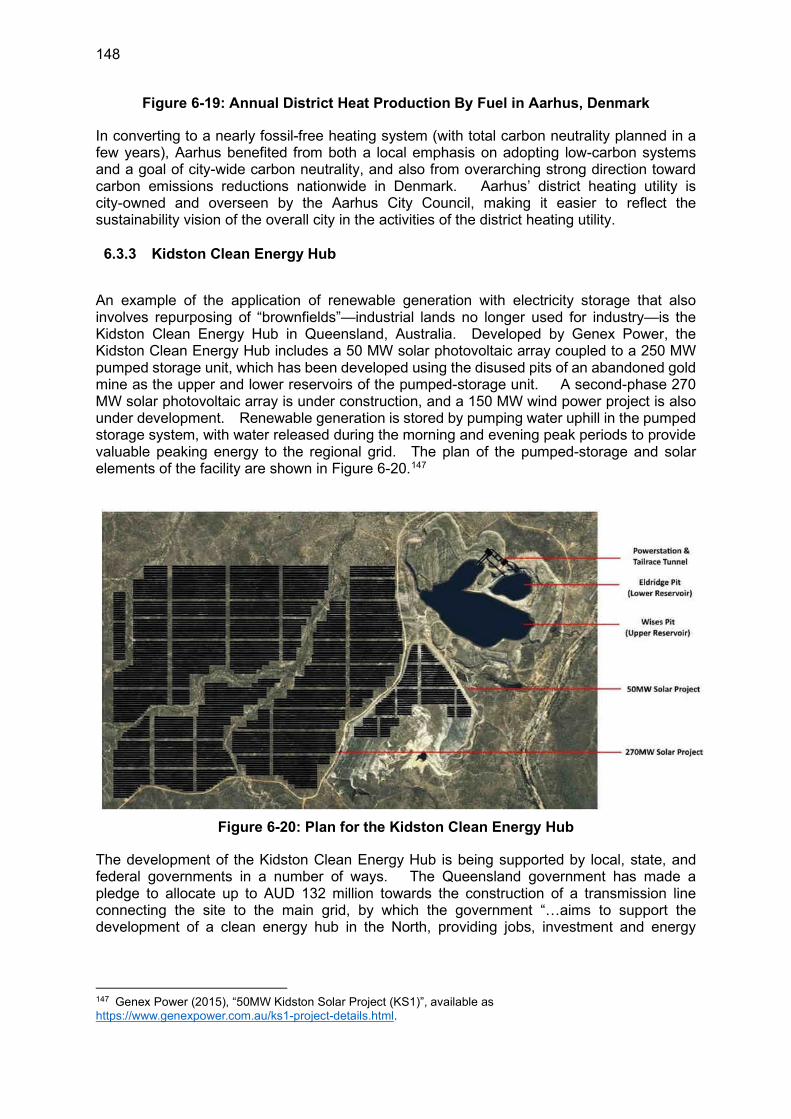
148
Figure 6-19: Annual District Heat Production By Fuel in Aarhus, Denmark
In converting to a nearly fossil-free heating system (with total carbon neutrality planned in a few years), Aarhus benefited from both a local emphasis on adopting low-carbon systems and a goal of city-wide carbon neutrality, and also from overarching strong direction toward carbon emissions reductions nationwide in Denmark. Aarhus’ district heating utility is city-owned and overseen by the Aarhus City Council, making it easier to reflect the sustainability vision of the overall city in the activities of the district heating utility.
6.3.3 Kidston Clean Energy Hub
An example of the application of renewable generation with electricity storage that also involves repurposing of “brownfields”—industrial lands no longer used for industry—is the Kidston Clean Energy Hub in Queensland, Australia. Developed by Genex Power, the Kidston Clean Energy Hub includes a 50 MW solar photovoltaic array coupled to a 250 MW pumped storage unit, which has been developed using the disused pits of an abandoned gold mine as the upper and lower reservoirs of the pumped-storage unit. A second-phase 270 MW solar photovoltaic array is under construction, and a 150 MW wind power project is also under development. Renewable generation is stored by pumping water uphill in the pumped storage system, with water released during the morning and evening peak periods to provide valuable peaking energy to the regional grid. The plan of the pumped-storage and solar elements of the facility are shown in Figure 6-20.147
Figure 6-20: Plan for the Kidston Clean Energy Hub
The development of the Kidston Clean Energy Hub is being supported by local, state, and federal governments in a number of ways. The Queensland government has made a pledge to allocate up to AUD 132 million towards the construction of a transmission line connecting the site to the main grid, by which the government “…aims to support the development of a clean energy hub in the North, providing jobs, investment and energy
147 Genex Power (2015), “50MW Kidston Solar Project (KS1)”, available as https://www.genexpower.com.au/ks1-project-details.html.
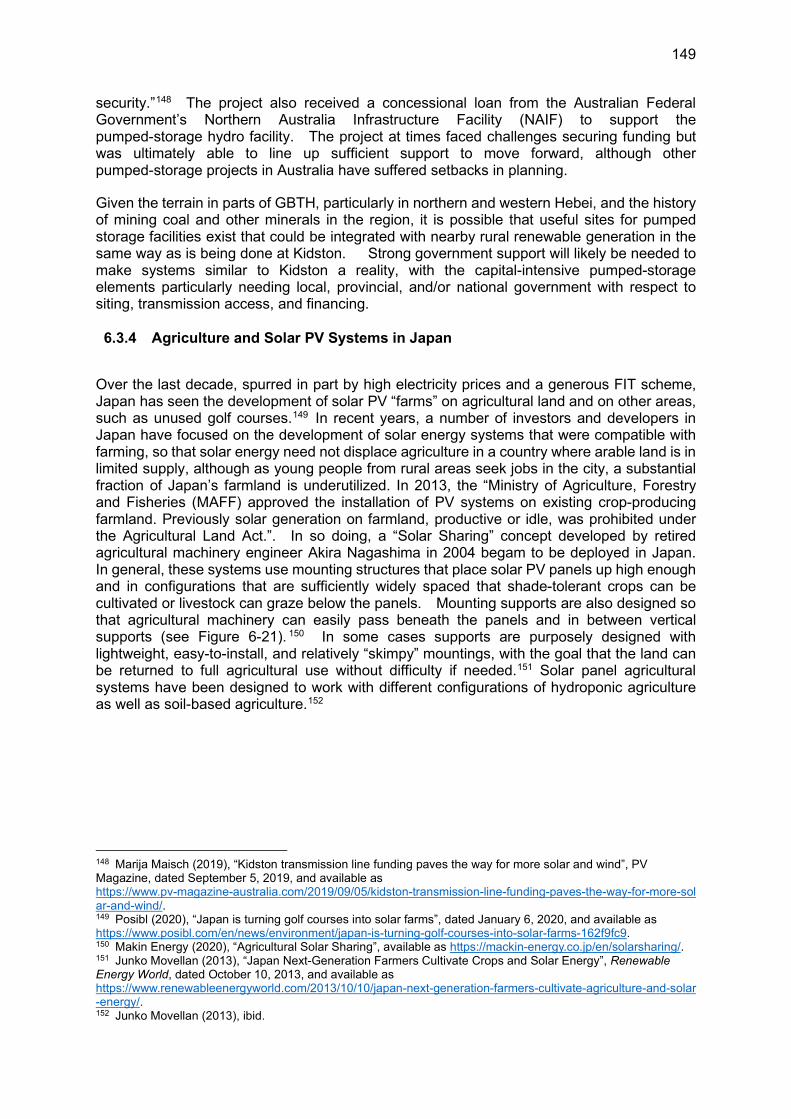
149
security.”148 The project also received a concessional loan from the Australian Federal Government’s Northern Australia Infrastructure Facility (NAIF) to support the pumped-storage hydro facility. The project at times faced challenges securing funding but was ultimately able to line up sufficient support to move forward, although other pumped-storage projects in Australia have suffered setbacks in planning.
Given the terrain in parts of GBTH, particularly in northern and western Hebei, and the history of mining coal and other minerals in the region, it is possible that useful sites for pumped storage facilities exist that could be integrated with nearby rural renewable generation in the same way as is being done at Kidston. Strong government support will likely be needed to make systems similar to Kidston a reality, with the capital-intensive pumped-storage elements particularly needing local, provincial, and/or national government with respect to siting, transmission access, and financing.
6.3.4 Agriculture and Solar PV Systems in Japan
Over the last decade, spurred in part by high electricity prices and a generous FIT scheme, Japan has seen the development of solar PV “farms” on agricultural land and on other areas, such as unused golf courses.149 In recent years, a number of investors and developers in Japan have focused on the development of solar energy systems that were compatible with farming, so that solar energy need not displace agriculture in a country where arable land is in limited supply, although as young people from rural areas seek jobs in the city, a substantial fraction of Japan’s farmland is underutilized. In 2013, the “Ministry of Agriculture, Forestry and Fisheries (MAFF) approved the installation of PV systems on existing crop-producing farmland. Previously solar generation on farmland, productive or idle, was prohibited under the Agricultural Land Act.”. In so doing, a “Solar Sharing” concept developed by retired agricultural machinery engineer Akira Nagashima in 2004 begam to be deployed in Japan. In general, these systems use mounting structures that place solar PV panels up high enough and in configurations that are sufficiently widely spaced that shade-tolerant crops can be cultivated or livestock can graze below the panels. Mounting supports are also designed so that agricultural machinery can easily pass beneath the panels and in between vertical supports (see Figure 6-21). 150 In some cases supports are purposely designed with lightweight, easy-to-install, and relatively “skimpy” mountings, with the goal that the land can be returned to full agricultural use without difficulty if needed.151 Solar panel agricultural systems have been designed to work with different configurations of hydroponic agriculture as well as soil-based agriculture.152
148 Marija Maisch (2019), “Kidston transmission line funding paves the way for more solar and wind”, PV Magazine, dated September 5, 2019, and available as https://www.pv-magazine-australia.com/2019/09/05/kidston-transmission-line-funding-paves-the-way-for-more-solar-and-wind/. 149 Posibl (2020), “Japan is turning golf courses into solar farms”, dated January 6, 2020, and available as https://www.posibl.com/en/news/environment/japan-is-turning-golf-courses-into-solar-farms-162f9fc9. 150 Makin Energy (2020), “Agricultural Solar Sharing”, available as https://mackin-energy.co.jp/en/solarsharing/. 151 Junko Movellan (2013), “Japan Next-Generation Farmers Cultivate Crops and Solar Energy”, Renewable Energy World, dated October 10, 2013, and available as https://www.renewableenergyworld.com/2013/10/10/japan-next-generation-farmers-cultivate-agriculture-and-solar-energy/. 152 Junko Movellan (2013), ibid.
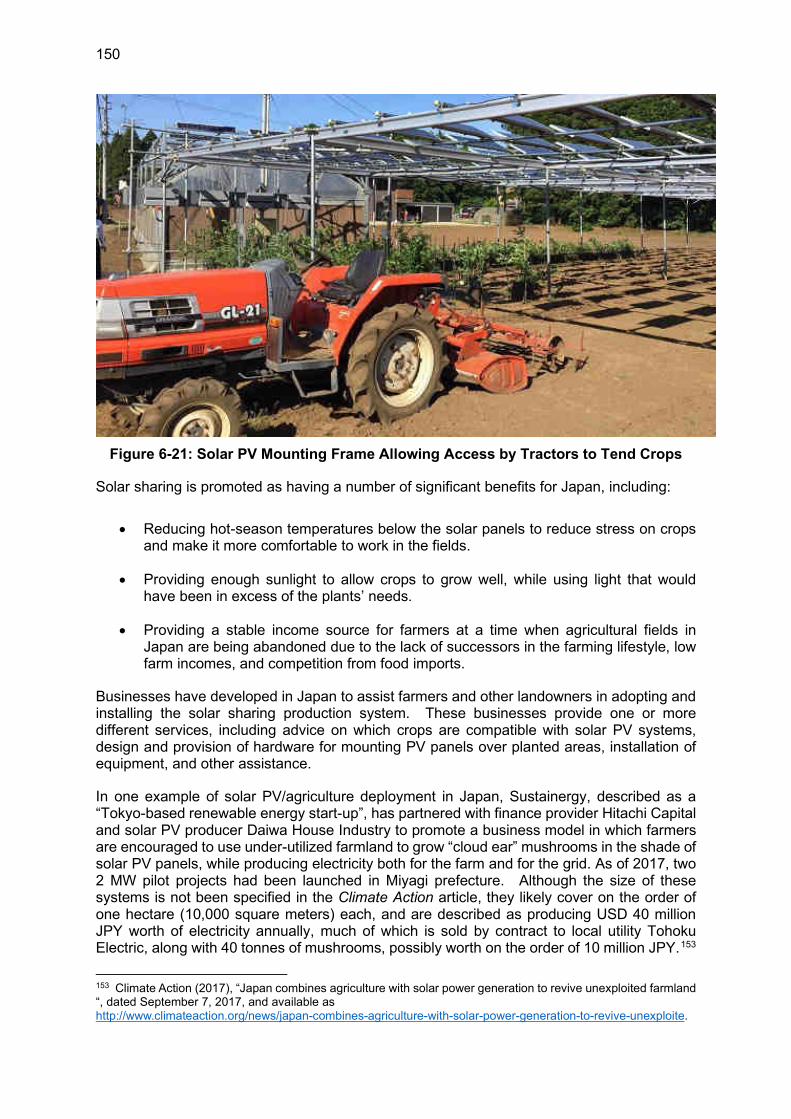
150
Figure 6-21: Solar PV Mounting Frame Allowing Access by Tractors to Tend Crops
Solar sharing is promoted as having a number of significant benefits for Japan, including:
• Reducing hot-season temperatures below the solar panels to reduce stress on crops and make it more comfortable to work in the fields.
• Providing enough sunlight to allow crops to grow well, while using light that would have been in excess of the plants’ needs.
• Providing a stable income source for farmers at a time when agricultural fields in Japan are being abandoned due to the lack of successors in the farming lifestyle, low farm incomes, and competition from food imports.
Businesses have developed in Japan to assist farmers and other landowners in adopting and installing the solar sharing production system. These businesses provide one or more different services, including advice on which crops are compatible with solar PV systems, design and provision of hardware for mounting PV panels over planted areas, installation of equipment, and other assistance.
In one example of solar PV/agriculture deployment in Japan, Sustainergy, described as a “Tokyo-based renewable energy start-up”, has partnered with finance provider Hitachi Capital and solar PV producer Daiwa House Industry to promote a business model in which farmers are encouraged to use under-utilized farmland to grow “cloud ear” mushrooms in the shade of solar PV panels, while producing electricity both for the farm and for the grid. As of 2017, two 2 MW pilot projects had been launched in Miyagi prefecture. Although the size of these systems is not been specified in the Climate Action article, they likely cover on the order of one hectare (10,000 square meters) each, and are described as producing USD 40 million JPY worth of electricity annually, much of which is sold by contract to local utility Tohoku Electric, along with 40 tonnes of mushrooms, possibly worth on the order of 10 million JPY.153
153 Climate Action (2017), “Japan combines agriculture with solar power generation to revive unexploited farmland “, dated September 7, 2017, and available as http://www.climateaction.org/news/japan-combines-agriculture-with-solar-power-generation-to-revive-unexploite.
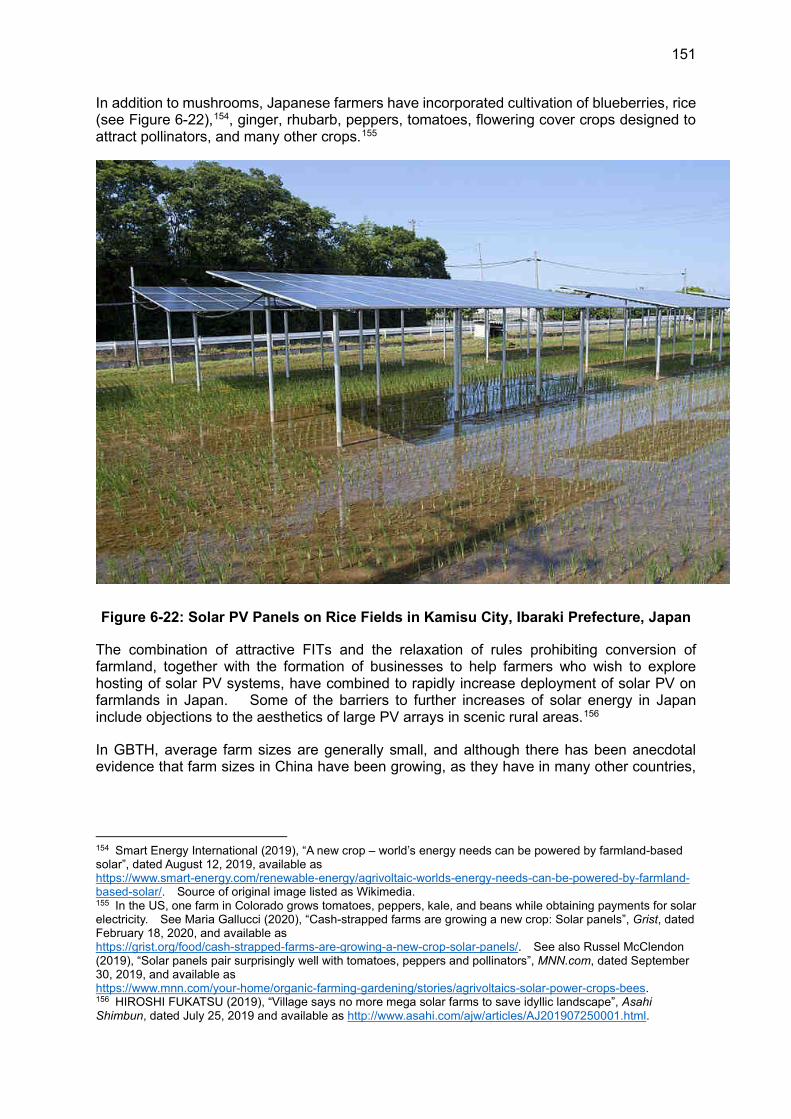
151
In addition to mushrooms, Japanese farmers have incorporated cultivation of blueberries, rice (see Figure 6-22),154, ginger, rhubarb, peppers, tomatoes, flowering cover crops designed to attract pollinators, and many other crops.155
Figure 6-22: Solar PV Panels on Rice Fields in Kamisu City, Ibaraki Prefecture, Japan
The combination of attractive FITs and the relaxation of rules prohibiting conversion of farmland, together with the formation of businesses to help farmers who wish to explore hosting of solar PV systems, have combined to rapidly increase deployment of solar PV on farmlands in Japan. Some of the barriers to further increases of solar energy in Japan include objections to the aesthetics of large PV arrays in scenic rural areas.156
In GBTH, average farm sizes are generally small, and although there has been anecdotal evidence that farm sizes in China have been growing, as they have in many other countries,
154 Smart Energy International (2019), “A new crop – world’s energy needs can be powered by farmland-based solar”, dated August 12, 2019, available as https://www.smart-energy.com/renewable-energy/agrivoltaic-worlds-energy-needs-can-be-powered-by-farmland-based-solar/. Source of original image listed as Wikimedia. 155 In the US, one farm in Colorado grows tomatoes, peppers, kale, and beans while obtaining payments for solar electricity. See Maria Gallucci (2020), “Cash-strapped farms are growing a new crop: Solar panels”, Grist, dated February 18, 2020, and available as https://grist.org/food/cash-strapped-farms-are-growing-a-new-crop-solar-panels/. See also Russel McClendon (2019), “Solar panels pair surprisingly well with tomatoes, peppers and pollinators”, MNN.com, dated September 30, 2019, and available as https://www.mnn.com/your-home/organic-farming-gardening/stories/agrivoltaics-solar-power-crops-bees. 156 HIROSHI FUKATSU (2019), “Village says no more mega solar farms to save idyllic landscape”, Asahi Shimbun, dated July 25, 2019 and available as http://www.asahi.com/ajw/articles/AJ201907250001.html.
152
the evidence of changes in farm size is not yet entirely clear.157 The small size of most farms in Hebei suggests that the dissemination of “agrivoltaic” or “solar sharing” concepts in GBTH will require the development of technical assistance services (either government-run or private) to help farmers decide on solar PV and mounting systems to accompany agricultural crops, to help with system design, purchase, and installation, preferably with the development of a finite number of flexible designs that can be replicated easily from farm to farm, and technical assistance to help farm-based solar PV systems to arrange for safe and affordable connections to the electricity distribution system. This will need to be in addition to the establishment and maintenance of FITs consistently set at levels sufficient to induce farmers to adopt PV systems, and of land use regulations that encourage, or at least allow, PVs to be used extensively on farmlands.
6.4 Conclusions
The Greater Beijing-Tianjin-Hebei area, with a population that would rank it as approximately the 13th largest country in the world, represents an economic powerhouse that is home to many major cities, including Beijing, the capital of China and Tianjin, the major port city for the region, as well as many hubs of industrial production and innovation. Although population trends show continued movement from rural areas of GBTH to the cities, the rural areas of the provinces continue to be economically important as sources for food, minerals and other materials, and energy, as well as hosts for important rural industries, for both the BTH region and for the nation as a whole.
An assessment of renewable resources in BTH is covered elsewhere in this Report, but in general GBTH has significant biomass, hydro (including mini- and micro-hydro), wind power (over 8 GW of capacity has been built already in GBTH, with over 7 GW in Hebei158) and solar energy resources. Most renewable resources used to generate electricity will likely be connected to existing power grids, which cover nearly all inhabited areas in BTH. That said, BTH does include a number of remote currently areas that could conceivably, if developed for tourism or other purposes, as well as villages, rural industries, and other installations located at the end of the existing grid where it might make sense to set up and operate stand-alone mini-grids.
In addition to providing energy to serve both rural activities and those of the large nearby urban areas in GBTH, it will be important for officials in rural GBTH, and the developers and provincial authorities that work with them, to look not just at current needs but at ways that sustainable energy systems can contribute to implementing clean energy throughout the economy in the future, while also addressing key rural social and economic issues. For example:
• Implementation of wind, solar, and biomass energy systems can help to provide jobs for rural residents, and particularly for young people, who might otherwise leave for opportunities in the city. Retention of rural populations and building/reinforcing of rural economies through income generated from implementation of renewable energy systems, and the sales and tax revenues they create, helps to reinforce the fabric of rural communities, as well as reducing the demographic and social services pressures on cities.
157 See, for example, Xianqing Ji, Scott Rozelle, Jikun Huang, Linxiu Zhang, Tonglong Zhang (2016), “Are China’s Farms Growing?”, China & World Economy, 41–62, Vol. 24, No. 1, 2016, available as http://www.igsnrr.cas.cn/xwzx/jxlwtj/201609/P020160929403217366534.pdf. 158 See, for example, Wind Power (2020), “Online access > Countries > China > Hebei”, database of wind power projects and map at https://www.thewindpower.net/zones_en_9_198.php.
153
• Renewable energy systems can serve not only electrical end-uses, but also end-uses such as home heating and water heating, via district heat, biogas, or wood/biomass pellet stoves and heaters.
• Newer technologies, such as heat pumps for space and water heat, on scales ranging from single households to rural cities (via district heating), should be investigated and, where cost-effective (or useful as pilot projects) implemented in BTH.
• The role of storage of energy, including of electricity and heat, will become increasingly important as renewable energy systems become key providers of energy in rural GBTH. Rural areas typically offer sufficient land area for a number of different storage solutions, ranging from battery or potential energy storage systems (pumped storage hydro or newer systems using towers of weights, for example), The use of heat storage systems for district heating plants that could be used in rural towns and cities, and/or to provide process heat for rural industries, has been underlined as a key element of Danish and other heating grid implementations.
• A key opportunity that should be fully evaluated for GBTH is the future production of fuels from renewable energy sources, preferably in flexible systems that can offer fuels for different uses, depending on needs and markets. These fuels most prominently include hydrogen and ammonia derived from renewable electricity, but also include ethanol from biomass sources (crop wastes and biofuel crops), biodiesel from oilseeds, convenient-to-use biomass solid fuels such as wood chips and pelletized crop wastes and wood, and methane made from carbon dioxide and renewable hydrogen. China has active programs of research on most of these fuels, and using rural GBTH’s renewable resources and government technical and financial support as needed will help to accelerate the implementation of renewable energy use, and the attendant reduction in greenhouse gas and other pollutant emissions for many sectors of the rural and provincial economies. In particular, ammonia, which can be used to provide compact storage of energy from electricity generated by wind and solar PV systems, can flexibly provide energy storage (converted back to power and/or heat in a conventional combustion turbine, boiler, combined cycle unit, or fuel cell), can be used as a fuel for transportation and farm equipment, and can be used as a fertilizer. This flexibility provides rural producers with a range of markets, and thus a number of ways to help support the rural economy.
• Both wind and solar energy systems can be compatible with agriculture, and thus the production of wind or solar electricity need not substantially displace farming operations. New solar PV mountings that can be adapted to harvest solar electricity and crops on the same plots of land are in use in a number of countries, particularly in Japan, and with many different crops. These systems provide significant and consistent income for farmers, who are often at the mercy of fluctuating prices for agricultural commodities.
Moving forward on the initiatives above will require the creation of a supportive policy environment and, in some cases, financial support from local, provincial, and national leaders. Among the types of policies that officials might consider are:
• Carbon taxes and/or expanded cap-and-trade programs to reflect a portion of the environmental cost of carbon emissions, and to provide an incentive for renewable energy system investments (see, for example, the Aarhus district heating case study, above).
• Strong support for research and development on key future technologies—including but not limited to, conversion of renewable electricity to hydrogen, ammonia, and other fuels, advanced solar PV materials, electricity storage, and conversion of cellulosic biomass to liquid fuels.
154
• Support for research into the technical and economic aspects of the use of mini-grids to substitute for grid-based service in remote areas where distribution losses associated with providing service from the central grid are high.
• Support for research and development of systems for energy storage, and for grid support using distributed energy, dedicated energy storage systems, and, perhaps five to 10 years from now, support for development of systems to enable the convenient use of non-dedicated electricity storage, such as vehicle or equipment batteries.
• Support, possibly through grants (such as, in the United States, the Small Business Innovation Research, or SBIR programs), or for example, through support through State-owned enterprise in China, for the commercialization of technologies in the areas of renewable energy, electricity-derived fuels, energy storage, and others.
• Provincial or National regulations to simplify and reduce the cost of grid interconnections for distributed generation using renewable energy systems.
• Provincial or National support for job creation in clean energy in rural areas, including, for example, providing tor subsidizing training programs for solar PV and wind power installers, subsidizing private firms to take on trainees from rural areas, or financial support for rural industries that will use renewable energy.
• More stringent energy efficiency standards for devices and equipment widely used in rural areas, ranging from lighting to farm equipment, pumps, air compressors, and commercial/industrial electric motors.
• Consistent and clear rules for feed-in-tariffs for electricity produced by renewable energy systems of different sizes, ranging from utility-scale systems to on-farm “solar sharing” systems and systems mounted on rural residential buildings.
The types of financing that might be provided to help accelerate rural clean energy investments could include:
• National or provincial grants for R&D, commercialization, and implementation of clean energy systems, including those financed by cap-and-trade revenues or carbon taxes.
• Low-interest loans from government entities, or loans from private or state-owned banks guaranteed by government agencies.
• Full or seed support for new or early (first commercial venture in the area) renewable energy technology deployment from multilateral banks.
• Development and support of the independent power provider model for renewable energy systems, and/or lowering of barriers to entry for domestic and foreign investors in BTH renewable energy systems.
• Price guarantees (or guaranteed purchase agreements) for the first years of output for new energy systems such as hydrogen, ethanol, or ammonia production systems.
A recent report by the Rocky Mountain Institute (RMI) focuses on promoting a “green recovery” for China from the economic impacts of the 2019-2020 coronavirus (COVID-19) pandemic by emphasizing that economic stimulus measures should focus on zero-carbon electrification and on green technologies in general.159 Although the RMI report focuses largely on urban areas, and the industrial and transport systems that support them, The nature of zero-carbon electricity sources is such that rural areas of China, including rural GBTH, will have an integral role to play in providing zero-carbon electricity and other energy
159 Ji Chen, Jiayin Song, and Lord Adair Turner (2020), Achieving a Green Recovery for China: Putting Zero-Carbon Electrification at the Core, Rocky Mountain Institute, dated June, 2020, and available from https://rmi.org/insight/achieving-a-green-recovery-for-china-putting-zero-carbon-electrification-at-the-core/.

155
forms nationwide, in addition to the central role of rural areas in feeding the nation and in other industries. As a key economic engine of China, GBTH could continue its role as a leading region in China and the world in demonstrating adoption of green energy systems that integrate the needs and resources of rural areas. Doing so will both firmly establish renewable energy systems within the rural economy of GBTH and provide sustainable flows of energy to, and earn sustainable flows of income from, the growing urban areas of GBTH.
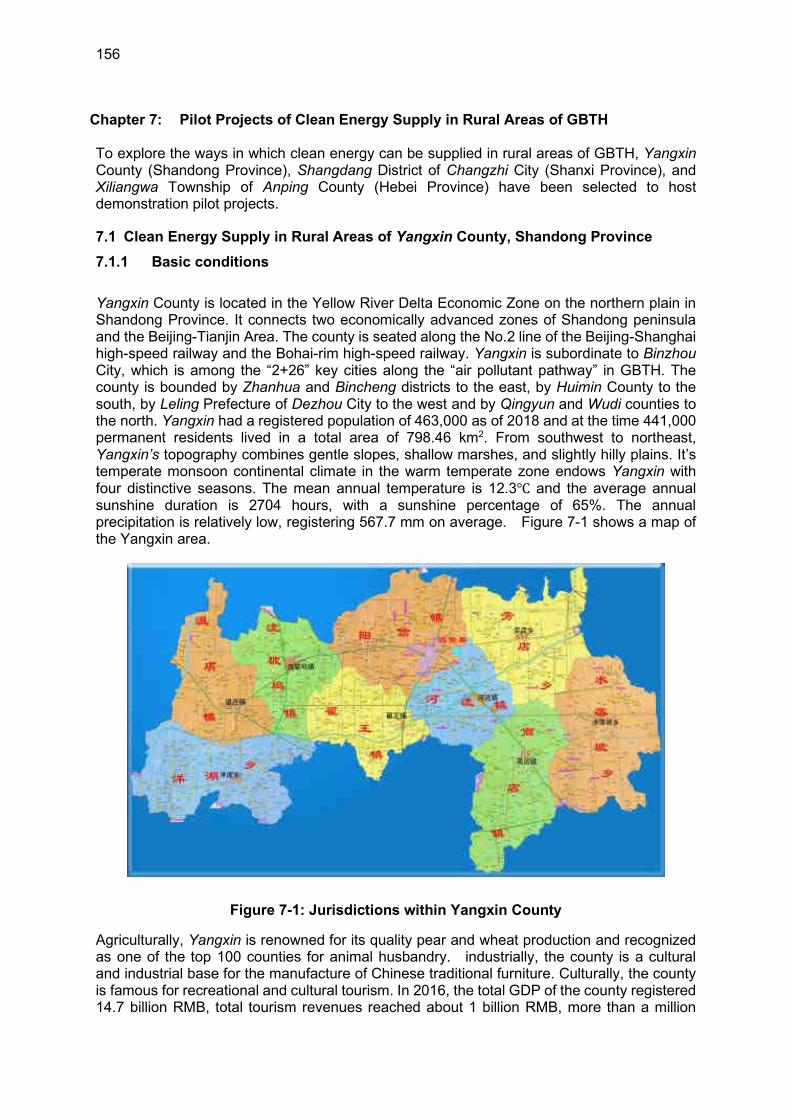
156
Chapter 7: Pilot Projects of Clean Energy Supply in Rural Areas of GBTH To explore the ways in which clean energy can be supplied in rural areas of GBTH, Yangxin County (Shandong Province), Shangdang District of Changzhi City (Shanxi Province), and Xiliangwa Township of Anping County (Hebei Province) have been selected to host demonstration pilot projects.
7.1 Clean Energy Supply in Rural Areas of Yangxin County, Shandong Province
7.1.1 Basic conditions
Yangxin County is located in the Yellow River Delta Economic Zone on the northern plain in Shandong Province. It connects two economically advanced zones of Shandong peninsula and the Beijing-Tianjin Area. The county is seated along the No.2 line of the Beijing-Shanghai high-speed railway and the Bohai-rim high-speed railway. Yangxin is subordinate to Binzhou City, which is among the “2+26” key cities along the “air pollutant pathway” in GBTH. The county is bounded by Zhanhua and Bincheng districts to the east, by Huimin County to the south, by Leling Prefecture of Dezhou City to the west and by Qingyun and Wudi counties to the north. Yangxin had a registered population of 463,000 as of 2018 and at the time 441,000 permanent residents lived in a total area of 798.46 km2. From southwest to northeast, Yangxin’s topography combines gentle slopes, shallow marshes, and slightly hilly plains. It’s temperate monsoon continental climate in the warm temperate zone endows Yangxin with four distinctive seasons. The mean annual temperature is 12.3℃ and the average annual sunshine duration is 2704 hours, with a sunshine percentage of 65%. The annual precipitation is relatively low, registering 567.7 mm on average. Figure 7-1 shows a map of the Yangxin area.
Figure 7-1: Jurisdictions within Yangxin County
Agriculturally, Yangxin is renowned for its quality pear and wheat production and recognized as one of the top 100 counties for animal husbandry. industrially, the county is a cultural and industrial base for the manufacture of Chinese traditional furniture. Culturally, the county is famous for recreational and cultural tourism. In 2016, the total GDP of the county registered 14.7 billion RMB, total tourism revenues reached about 1 billion RMB, more than a million
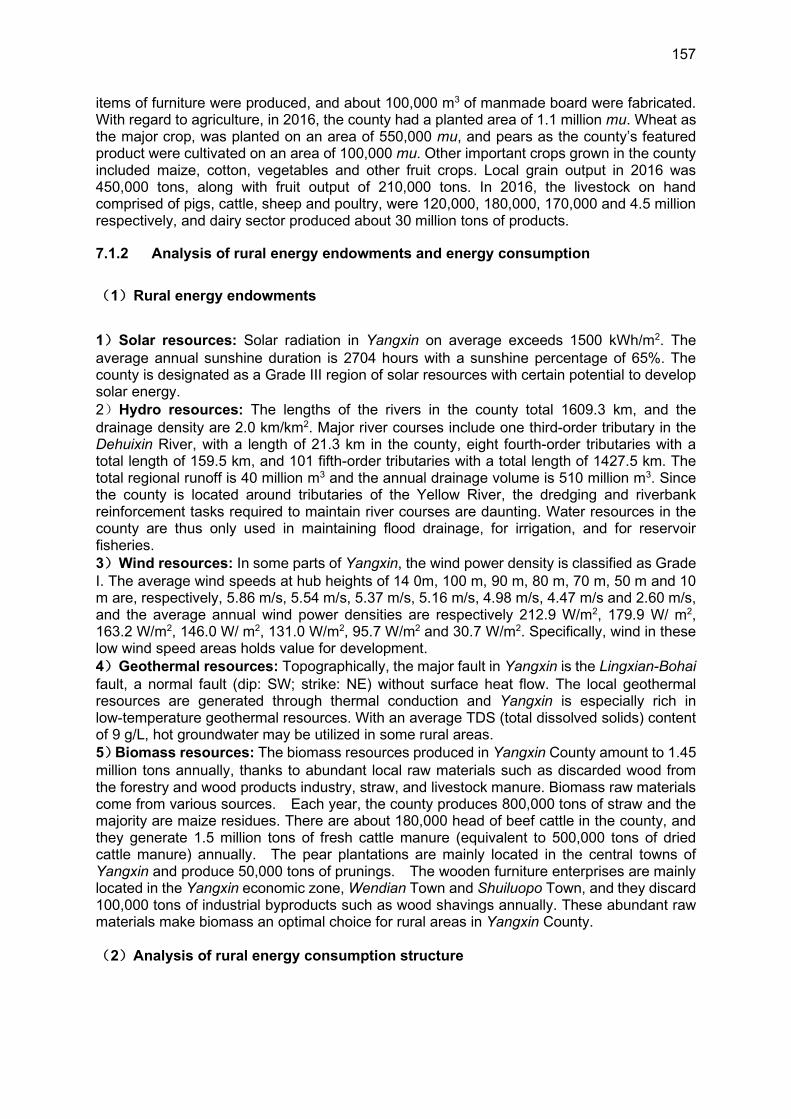
157
items of furniture were produced, and about 100,000 m3 of manmade board were fabricated. With regard to agriculture, in 2016, the county had a planted area of 1.1 million mu. Wheat as the major crop, was planted on an area of 550,000 mu, and pears as the county’s featured product were cultivated on an area of 100,000 mu. Other important crops grown in the county included maize, cotton, vegetables and other fruit crops. Local grain output in 2016 was 450,000 tons, along with fruit output of 210,000 tons. In 2016, the livestock on hand comprised of pigs, cattle, sheep and poultry, were 120,000, 180,000, 170,000 and 4.5 million respectively, and dairy sector produced about 30 million tons of products.
7.1.2 Analysis of rural energy endowments and energy consumption
(1)Rural energy endowments
1)Solar resources: Solar radiation in Yangxin on average exceeds 1500 kWh/m2. The average annual sunshine duration is 2704 hours with a sunshine percentage of 65%. The county is designated as a Grade III region of solar resources with certain potential to develop solar energy. 2)Hydro resources: The lengths of the rivers in the county total 1609.3 km, and the drainage density are 2.0 km/km2. Major river courses include one third-order tributary in the Dehuixin River, with a length of 21.3 km in the county, eight fourth-order tributaries with a total length of 159.5 km, and 101 fifth-order tributaries with a total length of 1427.5 km. The total regional runoff is 40 million m3 and the annual drainage volume is 510 million m3. Since the county is located around tributaries of the Yellow River, the dredging and riverbank reinforcement tasks required to maintain river courses are daunting. Water resources in the county are thus only used in maintaining flood drainage, for irrigation, and for reservoir fisheries. 3)Wind resources: In some parts of Yangxin, the wind power density is classified as Grade I. The average wind speeds at hub heights of 14 0m, 100 m, 90 m, 80 m, 70 m, 50 m and 10 m are, respectively, 5.86 m/s, 5.54 m/s, 5.37 m/s, 5.16 m/s, 4.98 m/s, 4.47 m/s and 2.60 m/s, and the average annual wind power densities are respectively 212.9 W/m2, 179.9 W/ m2, 163.2 W/m2, 146.0 W/ m2, 131.0 W/m2, 95.7 W/m2 and 30.7 W/m2. Specifically, wind in these low wind speed areas holds value for development. 4)Geothermal resources: Topographically, the major fault in Yangxin is the Lingxian-Bohai fault, a normal fault (dip: SW; strike: NE) without surface heat flow. The local geothermal resources are generated through thermal conduction and Yangxin is especially rich in low-temperature geothermal resources. With an average TDS (total dissolved solids) content of 9 g/L, hot groundwater may be utilized in some rural areas. 5)Biomass resources: The biomass resources produced in Yangxin County amount to 1.45 million tons annually, thanks to abundant local raw materials such as discarded wood from the forestry and wood products industry, straw, and livestock manure. Biomass raw materials come from various sources. Each year, the county produces 800,000 tons of straw and the majority are maize residues. There are about 180,000 head of beef cattle in the county, and they generate 1.5 million tons of fresh cattle manure (equivalent to 500,000 tons of dried cattle manure) annually. The pear plantations are mainly located in the central towns of Yangxin and produce 50,000 tons of prunings. The wooden furniture enterprises are mainly located in the Yangxin economic zone, Wendian Town and Shuiluopo Town, and they discard 100,000 tons of industrial byproducts such as wood shavings annually. These abundant raw materials make biomass an optimal choice for rural areas in Yangxin County.
(2)Analysis of rural energy consumption structure
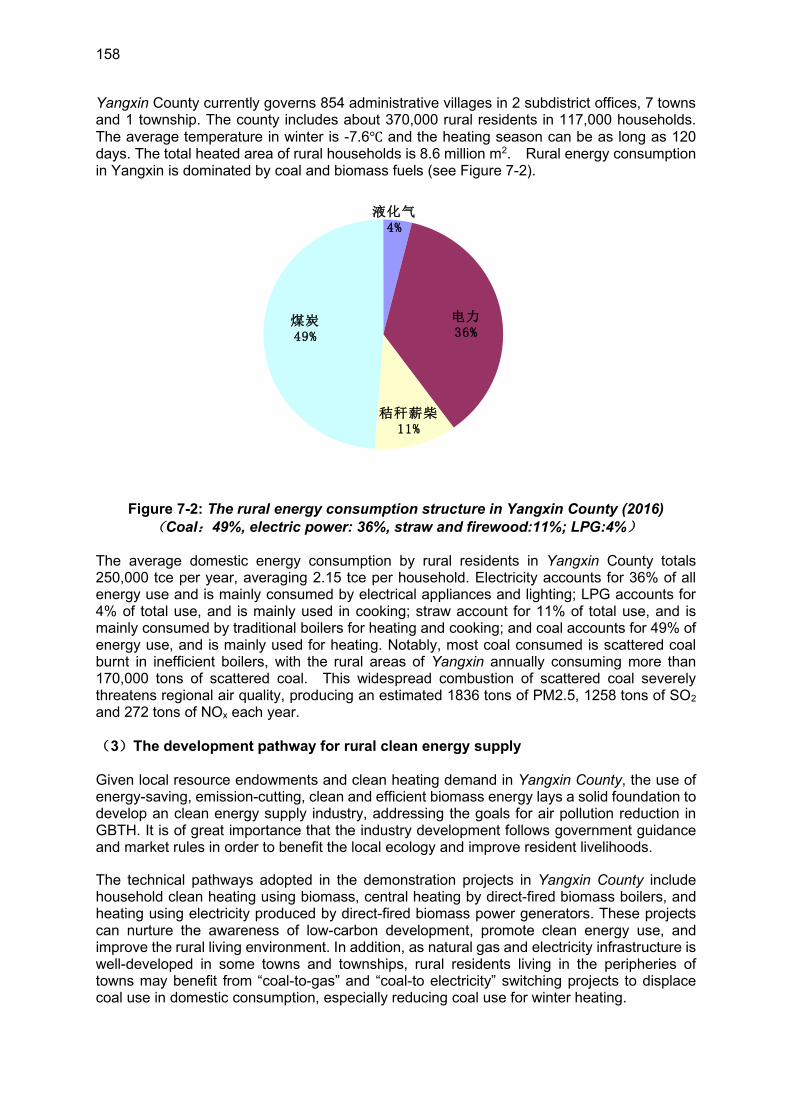
158
Yangxin County currently governs 854 administrative villages in 2 subdistrict offices, 7 towns and 1 township. The county includes about 370,000 rural residents in 117,000 households. The average temperature in winter is -7.6℃ and the heating season can be as long as 120 days. The total heated area of rural households is 8.6 million m2. Rural energy consumption in Yangxin is dominated by coal and biomass fuels (see Figure 7-2).
秸秆薪柴11%
电力36%
煤炭49%
液化气4%
Figure 7-2: The rural energy consumption structure in Yangxin County (2016)
(Coal:49%, electric power: 36%, straw and firewood:11%; LPG:4%)
The average domestic energy consumption by rural residents in Yangxin County totals 250,000 tce per year, averaging 2.15 tce per household. Electricity accounts for 36% of all energy use and is mainly consumed by electrical appliances and lighting; LPG accounts for 4% of total use, and is mainly used in cooking; straw account for 11% of total use, and is mainly consumed by traditional boilers for heating and cooking; and coal accounts for 49% of energy use, and is mainly used for heating. Notably, most coal consumed is scattered coal burnt in inefficient boilers, with the rural areas of Yangxin annually consuming more than 170,000 tons of scattered coal. This widespread combustion of scattered coal severely threatens regional air quality, producing an estimated 1836 tons of PM2.5, 1258 tons of SO2 and 272 tons of NOx each year.
(3)The development pathway for rural clean energy supply
Given local resource endowments and clean heating demand in Yangxin County, the use of energy-saving, emission-cutting, clean and efficient biomass energy lays a solid foundation to develop an clean energy supply industry, addressing the goals for air pollution reduction in GBTH. It is of great importance that the industry development follows government guidance and market rules in order to benefit the local ecology and improve resident livelihoods.
The technical pathways adopted in the demonstration projects in Yangxin County include household clean heating using biomass, central heating by direct-fired biomass boilers, and heating using electricity produced by direct-fired biomass power generators. These projects can nurture the awareness of low-carbon development, promote clean energy use, and improve the rural living environment. In addition, as natural gas and electricity infrastructure is well-developed in some towns and townships, rural residents living in the peripheries of towns may benefit from “coal-to-gas” and “coal-to electricity” switching projects to displace coal use in domestic consumption, especially reducing coal use for winter heating.
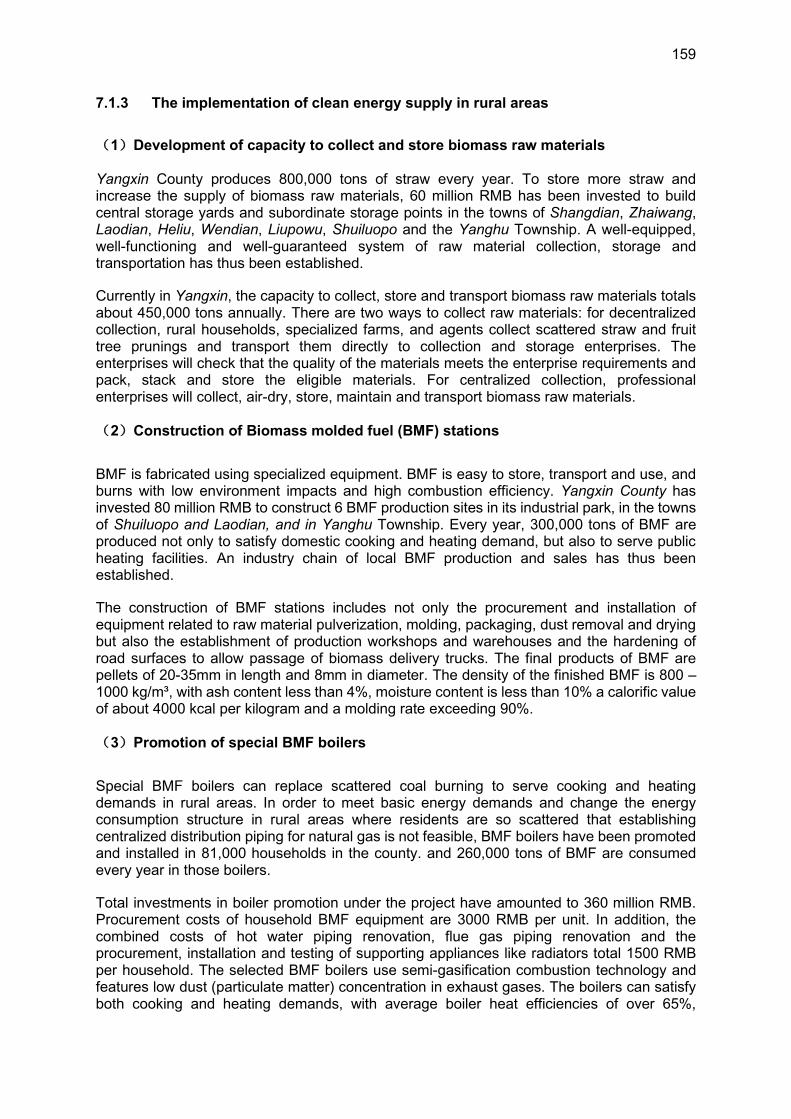
159
7.1.3 The implementation of clean energy supply in rural areas
(1)Development of capacity to collect and store biomass raw materials
Yangxin County produces 800,000 tons of straw every year. To store more straw and increase the supply of biomass raw materials, 60 million RMB has been invested to build central storage yards and subordinate storage points in the towns of Shangdian, Zhaiwang, Laodian, Heliu, Wendian, Liupowu, Shuiluopo and the Yanghu Township. A well-equipped, well-functioning and well-guaranteed system of raw material collection, storage and transportation has thus been established.
Currently in Yangxin, the capacity to collect, store and transport biomass raw materials totals about 450,000 tons annually. There are two ways to collect raw materials: for decentralized collection, rural households, specialized farms, and agents collect scattered straw and fruit tree prunings and transport them directly to collection and storage enterprises. The enterprises will check that the quality of the materials meets the enterprise requirements and pack, stack and store the eligible materials. For centralized collection, professional enterprises will collect, air-dry, store, maintain and transport biomass raw materials.
(2)Construction of Biomass molded fuel (BMF) stations
BMF is fabricated using specialized equipment. BMF is easy to store, transport and use, and burns with low environment impacts and high combustion efficiency. Yangxin County has invested 80 million RMB to construct 6 BMF production sites in its industrial park, in the towns of Shuiluopo and Laodian, and in Yanghu Township. Every year, 300,000 tons of BMF are produced not only to satisfy domestic cooking and heating demand, but also to serve public heating facilities. An industry chain of local BMF production and sales has thus been established.
The construction of BMF stations includes not only the procurement and installation of equipment related to raw material pulverization, molding, packaging, dust removal and drying but also the establishment of production workshops and warehouses and the hardening of road surfaces to allow passage of biomass delivery trucks. The final products of BMF are pellets of 20-35mm in length and 8mm in diameter. The density of the finished BMF is 800 – 1000 kg/m³, with ash content less than 4%, moisture content is less than 10% a calorific value of about 4000 kcal per kilogram and a molding rate exceeding 90%.
(3)Promotion of special BMF boilers
Special BMF boilers can replace scattered coal burning to serve cooking and heating demands in rural areas. In order to meet basic energy demands and change the energy consumption structure in rural areas where residents are so scattered that establishing centralized distribution piping for natural gas is not feasible, BMF boilers have been promoted and installed in 81,000 households in the county. and 260,000 tons of BMF are consumed every year in those boilers.
Total investments in boiler promotion under the project have amounted to 360 million RMB. Procurement costs of household BMF equipment are 3000 RMB per unit. In addition, the combined costs of hot water piping renovation, flue gas piping renovation and the procurement, installation and testing of supporting appliances like radiators total 1500 RMB per household. The selected BMF boilers use semi-gasification combustion technology and features low dust (particulate matter) concentration in exhaust gases. The boilers can satisfy both cooking and heating demands, with average boiler heat efficiencies of over 65%,
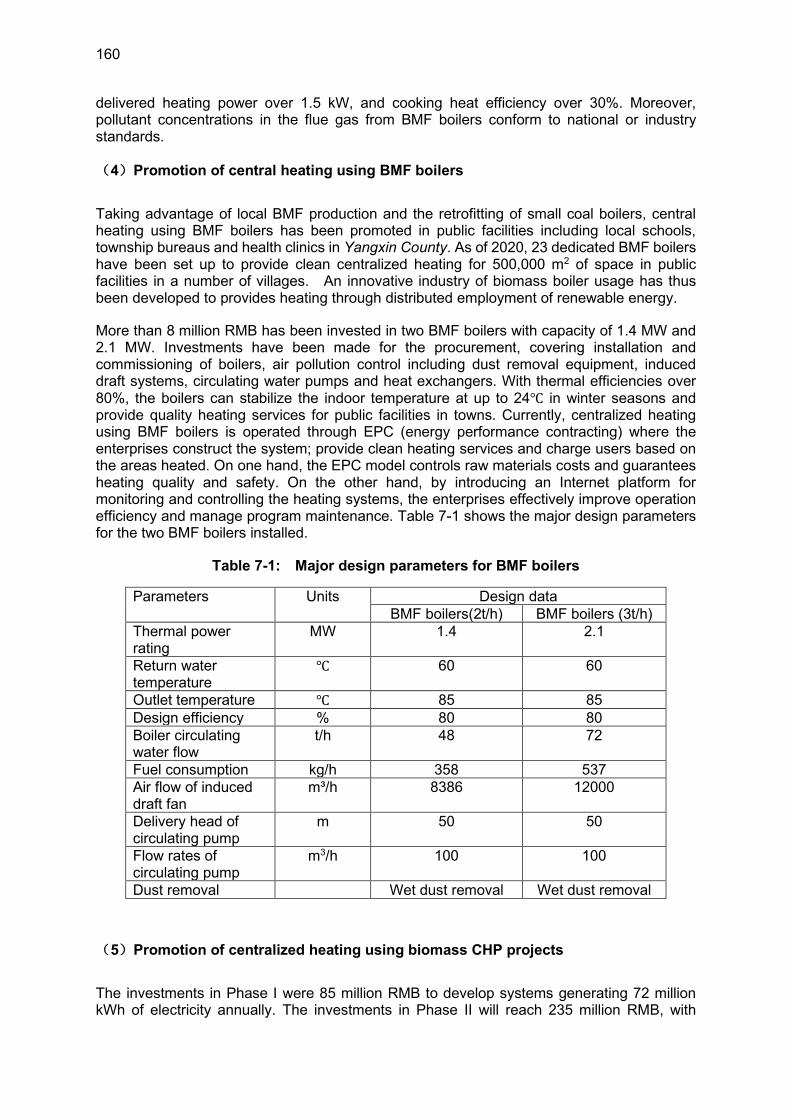
160
delivered heating power over 1.5 kW, and cooking heat efficiency over 30%. Moreover, pollutant concentrations in the flue gas from BMF boilers conform to national or industry standards.
(4)Promotion of central heating using BMF boilers
Taking advantage of local BMF production and the retrofitting of small coal boilers, central heating using BMF boilers has been promoted in public facilities including local schools, township bureaus and health clinics in Yangxin County. As of 2020, 23 dedicated BMF boilers have been set up to provide clean centralized heating for 500,000 m2 of space in public facilities in a number of villages. An innovative industry of biomass boiler usage has thus been developed to provides heating through distributed employment of renewable energy.
More than 8 million RMB has been invested in two BMF boilers with capacity of 1.4 MW and 2.1 MW. Investments have been made for the procurement, covering installation and commissioning of boilers, air pollution control including dust removal equipment, induced draft systems, circulating water pumps and heat exchangers. With thermal efficiencies over 80%, the boilers can stabilize the indoor temperature at up to 24℃ in winter seasons and provide quality heating services for public facilities in towns. Currently, centralized heating using BMF boilers is operated through EPC (energy performance contracting) where the enterprises construct the system; provide clean heating services and charge users based on the areas heated. On one hand, the EPC model controls raw materials costs and guarantees heating quality and safety. On the other hand, by introducing an Internet platform for monitoring and controlling the heating systems, the enterprises effectively improve operation efficiency and manage program maintenance. Table 7-1 shows the major design parameters for the two BMF boilers installed.
Table 7-1: Major design parameters for BMF boilers
Parameters Units Design data BMF boilers(2t/h) BMF boilers (3t/h)
Thermal power rating
MW 1.4 2.1
Return water temperature
℃ 60 60
Outlet temperature ℃ 85 85 Design efficiency % 80 80 Boiler circulating water flow
t/h 48 72
Fuel consumption kg/h 358 537 Air flow of induced draft fan
m³/h 8386 12000
Delivery head of circulating pump
m 50 50
Flow rates of circulating pump
m3/h 100 100
Dust removal Wet dust removal Wet dust removal
(5)Promotion of centralized heating using biomass CHP projects
The investments in Phase I were 85 million RMB to develop systems generating 72 million kWh of electricity annually. The investments in Phase II will reach 235 million RMB, with
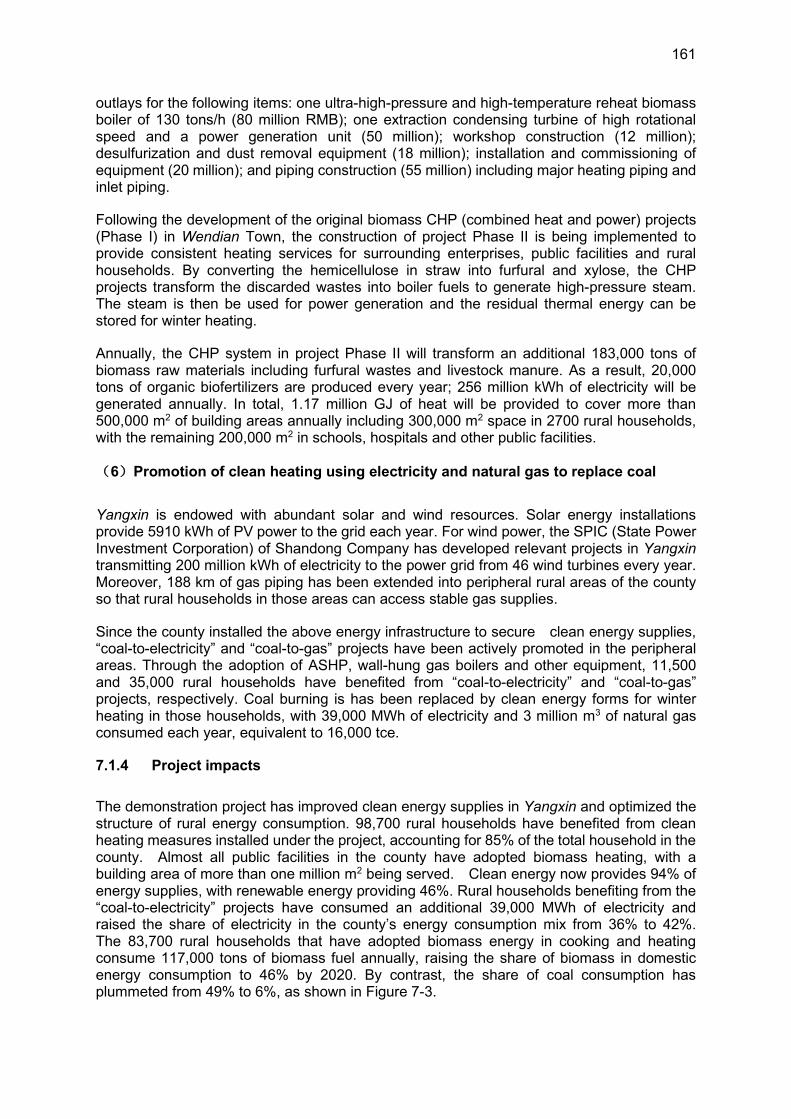
161
outlays for the following items: one ultra-high-pressure and high-temperature reheat biomass boiler of 130 tons/h (80 million RMB); one extraction condensing turbine of high rotational speed and a power generation unit (50 million); workshop construction (12 million); desulfurization and dust removal equipment (18 million); installation and commissioning of equipment (20 million); and piping construction (55 million) including major heating piping and inlet piping.
Following the development of the original biomass CHP (combined heat and power) projects (Phase I) in Wendian Town, the construction of project Phase II is being implemented to provide consistent heating services for surrounding enterprises, public facilities and rural households. By converting the hemicellulose in straw into furfural and xylose, the CHP projects transform the discarded wastes into boiler fuels to generate high-pressure steam. The steam is then be used for power generation and the residual thermal energy can be stored for winter heating.
Annually, the CHP system in project Phase II will transform an additional 183,000 tons of biomass raw materials including furfural wastes and livestock manure. As a result, 20,000 tons of organic biofertilizers are produced every year; 256 million kWh of electricity will be generated annually. In total, 1.17 million GJ of heat will be provided to cover more than 500,000 m2 of building areas annually including 300,000 m2 space in 2700 rural households, with the remaining 200,000 m2 in schools, hospitals and other public facilities.
(6)Promotion of clean heating using electricity and natural gas to replace coal
Yangxin is endowed with abundant solar and wind resources. Solar energy installations provide 5910 kWh of PV power to the grid each year. For wind power, the SPIC (State Power Investment Corporation) of Shandong Company has developed relevant projects in Yangxin transmitting 200 million kWh of electricity to the power grid from 46 wind turbines every year. Moreover, 188 km of gas piping has been extended into peripheral rural areas of the county so that rural households in those areas can access stable gas supplies.
Since the county installed the above energy infrastructure to secure clean energy supplies, “coal-to-electricity” and “coal-to-gas” projects have been actively promoted in the peripheral areas. Through the adoption of ASHP, wall-hung gas boilers and other equipment, 11,500 and 35,000 rural households have benefited from “coal-to-electricity” and “coal-to-gas” projects, respectively. Coal burning is has been replaced by clean energy forms for winter heating in those households, with 39,000 MWh of electricity and 3 million m3 of natural gas consumed each year, equivalent to 16,000 tce.
7.1.4 Project impacts
The demonstration project has improved clean energy supplies in Yangxin and optimized the structure of rural energy consumption. 98,700 rural households have benefited from clean heating measures installed under the project, accounting for 85% of the total household in the county. Almost all public facilities in the county have adopted biomass heating, with a building area of more than one million m2 being served. Clean energy now provides 94% of energy supplies, with renewable energy providing 46%. Rural households benefiting from the “coal-to-electricity” projects have consumed an additional 39,000 MWh of electricity and raised the share of electricity in the county’s energy consumption mix from 36% to 42%. The 83,700 rural households that have adopted biomass energy in cooking and heating consume 117,000 tons of biomass fuel annually, raising the share of biomass in domestic energy consumption to 46% by 2020. By contrast, the share of coal consumption has plummeted from 49% to 6%, as shown in Figure 7-3.
162
Figure 7-3: Domestic energy consumption structure in rural areas of Yangxin County (2020)
The demonstration project in Yangxin County has helped to save energy and reduce emissions and has drastically improved the environment in rural areas. The clean energy supply for household stoves and boilers based on BMF has not only replaced the inefficient consumption of scattered coal and biomass raw materials during the heating seasons but has also reduced environment pollution caused by open-air burning of straw to dispose of crop wastes and of careless disposal of livestock manure. Consuming BMF ameliorates local air quality and yields particulate concentrations in flue gases of 20 – 45 mg/m3, NOx concentrations 169 – 200 mg/m3; Ringelmann blackness lower than level I, and undetectable SO2 concentrations. From the perspective of the atmospheric carbon cycle (greenhouse gas emissions), CO2 emissions from fossil fuels are cut by 340,000 tons annually, and the burning of straw and firewood in low-efficiency stoves has been reduced by 53,000 tons/year and scattered coal consumption has been decreased by 142,000 tons/year.
Through the demonstration projects, clean energy supplies based on BMF have been widely recognized for their benefits in saving costs and increasing revenue. Clean heating goals in rural areas of Yangxin have been achieved as a result of project activities. By combining different types of energy including biomass, electricity, and natural gas in clean heating systems, Yangxin County has become an example for clean energy development. Shandong Province undertook a “Survey on the Rural Civilized Action”. The results of the survey showed that Yangxin County outperformed other jurisdictions in Binzhou City and is a frontrunner in clean energy province wide. Clean and low-carbon development has been widely recognized in Yangxin County. Economically, the energy consumption costs of biomass clean heating are 2000 RMB per year per household, outperforming coal heating significantly. In addition, an enterprise can earn 300 million RMB by producing and selling
163
300,000 tons of BMF at the price of 800 RMB/ton (and the price of biomass wood pellets can reach 1200 RMB/ton).
7.2 Clean Energy Supply in Xiliangwa Township, Anping County, Hebei Province
7.2.1 Basic conditions
Anping County is located in Hengshui City in the mid-south Hebei Province. It is bounded by Raoyang County to the east, by Shenze County to the west, by the cities of Shenzhou and Xinji to the south and by Anguo City and Boye County to the north. Anping County is situated in the center of the delta area between Beijing, Tianjin, and Shijiazhuang, and in the overlapping areas of the Bohai-rim Economic Circle, the BTH Economic Circle and the Central Plain Economic Circle of China. Looking northward, Anping is only 50 km from the Xiong’an New Area. In terms of transportation, two provincial highways, S231 and G338, pass through Anping and the county connects with the Shijin, Daguang, Qugang and Shihuang expressways. To the east, the county is 10 km away from the Beijing-Kowloon railway and 5 km away from Daguang expressway. To the south, it is 25 km away from the Shihuang expressway; to the north, it is 238 km away from the Capital Airport and 248 km away from Tianjin Harbor; to the west, the county is 90 km away from Shijiazhuang airport.
Anping County governs 230 administrative villages in 5 towns and 3 townships. As of 2018, 327,000 residents lived in an area of 5.05 million km2, with 210,000 of those residents living in rural areas. Xiliangwa Township is located in the eastern part of Anping County, 7.5 km away from the county seat. The township covers an area of 44.36 km2 and is adjacent to Raoyang to the east. The township governs the 18 administrative villages of Xiaoxinzhuang, Xiliangwa, Nanliangwa, Dongliangwa, Dongmiaotou, Dongchenggan, Dongmaozhuang, Ximaozhuang, Xizhaizi, Dongzhaizi, Houpu, Qianpu, Donglitun, Zhengjiazhuang, Xilitun, Shiguantun, Gengguantun and Xiangguantun. The township has a semi-arid and semi-humid continental monsoon climate with a mean annual temperature of 12℃. It has four distinctive seasons with a windy spring with little precipitation, a hot and rainy summer, a mild autumn and a freezing winter with little snow. The heating season for rural households lasts 120 days each year.
As a focus of Anping’s industrial and economic structure, Xiliangwa has 308 industrial enterprises with 5 of them above the designated threshold for small and medium enterprises. Most of the enterprises in the area are involved in wire mesh fabrication, in hog production, or in other sectors such as making automobile parts, sanitary ware and chemical products. The township has 11 comprehensive stores or supermarkets over 50 m2 of business area. Xiliangwa boasts 41,000 mu of arable land, with wheat, maize and cotton planted as the major crops. The local animal husbandry sector centers around production of hogs and laying hens. Jing’an pig farm is the largest livestock farm in Anping county, and produces 50,000 breeding pigs and 130,000 commercial pigs each year.
7.2.2 Analysis of rural energy resource endowment and consumption in Anping
County
(1) Overview of rural energy resource endowment
1) Solar energy resources. Anping County is categorized as Class III in terms of solar energy resources, with 5,000 MJ/m2 of annual solar radiation. With the support of national policies, all forms of solar power technologies are gradually being promoted in the county. Due to geographical limitations, however, solar power is still only utilized in the form of solar
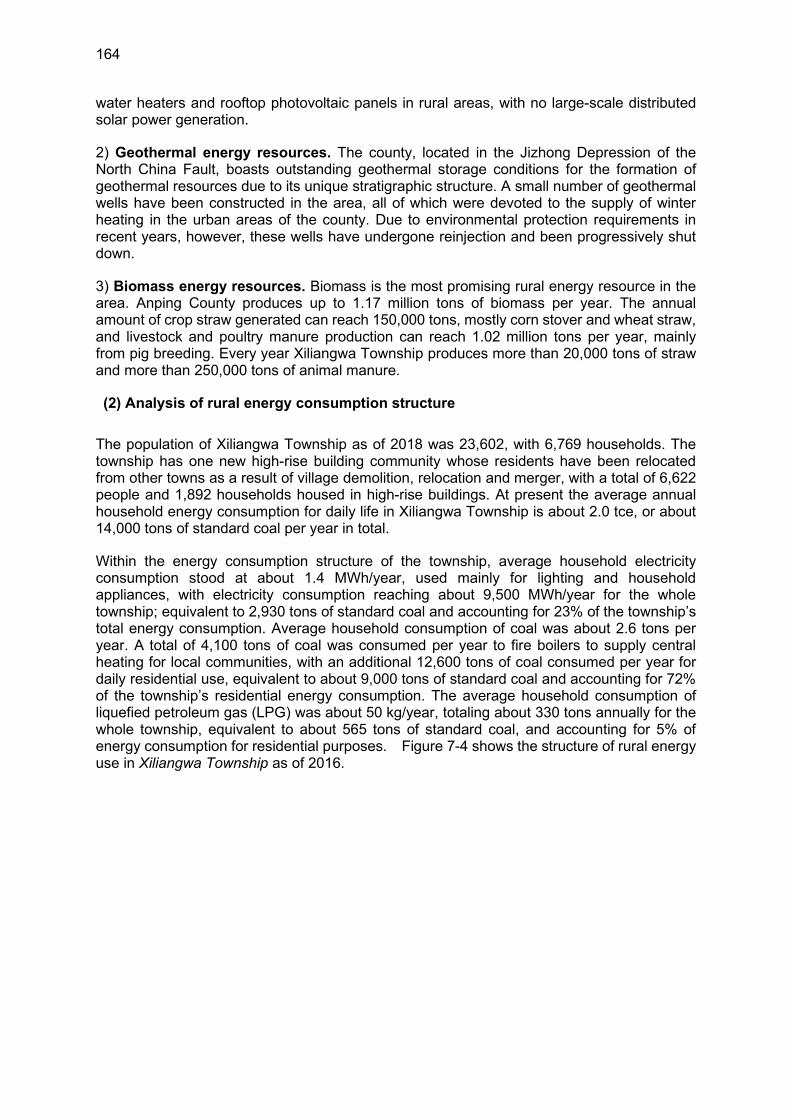
164
water heaters and rooftop photovoltaic panels in rural areas, with no large-scale distributed solar power generation.
2) Geothermal energy resources. The county, located in the Jizhong Depression of the North China Fault, boasts outstanding geothermal storage conditions for the formation of geothermal resources due to its unique stratigraphic structure. A small number of geothermal wells have been constructed in the area, all of which were devoted to the supply of winter heating in the urban areas of the county. Due to environmental protection requirements in recent years, however, these wells have undergone reinjection and been progressively shut down.
3) Biomass energy resources. Biomass is the most promising rural energy resource in the area. Anping County produces up to 1.17 million tons of biomass per year. The annual amount of crop straw generated can reach 150,000 tons, mostly corn stover and wheat straw, and livestock and poultry manure production can reach 1.02 million tons per year, mainly from pig breeding. Every year Xiliangwa Township produces more than 20,000 tons of straw and more than 250,000 tons of animal manure.
(2) Analysis of rural energy consumption structure
The population of Xiliangwa Township as of 2018 was 23,602, with 6,769 households. The township has one new high-rise building community whose residents have been relocated from other towns as a result of village demolition, relocation and merger, with a total of 6,622 people and 1,892 households housed in high-rise buildings. At present the average annual household energy consumption for daily life in Xiliangwa Township is about 2.0 tce, or about 14,000 tons of standard coal per year in total.
Within the energy consumption structure of the township, average household electricity consumption stood at about 1.4 MWh/year, used mainly for lighting and household appliances, with electricity consumption reaching about 9,500 MWh/year for the whole township; equivalent to 2,930 tons of standard coal and accounting for 23% of the township’s total energy consumption. Average household consumption of coal was about 2.6 tons per year. A total of 4,100 tons of coal was consumed per year to fire boilers to supply central heating for local communities, with an additional 12,600 tons of coal consumed per year for daily residential use, equivalent to about 9,000 tons of standard coal and accounting for 72% of the township’s residential energy consumption. The average household consumption of liquefied petroleum gas (LPG) was about 50 kg/year, totaling about 330 tons annually for the whole township, equivalent to about 565 tons of standard coal, and accounting for 5% of energy consumption for residential purposes. Figure 7-4 shows the structure of rural energy use in Xiliangwa Township as of 2016.
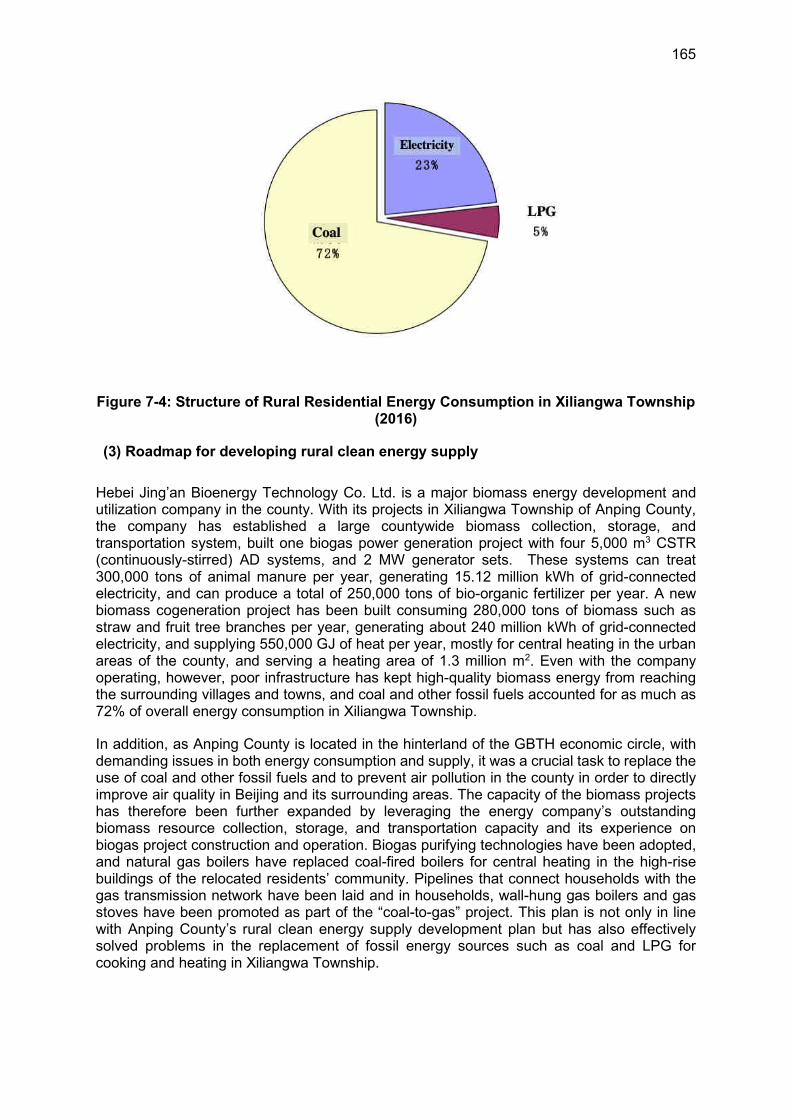
165
Figure 7-4: Structure of Rural Residential Energy Consumption in Xiliangwa Township (2016)
(3) Roadmap for developing rural clean energy supply
Hebei Jing’an Bioenergy Technology Co. Ltd. is a major biomass energy development and utilization company in the county. With its projects in Xiliangwa Township of Anping County, the company has established a large countywide biomass collection, storage, and transportation system, built one biogas power generation project with four 5,000 m3 CSTR (continuously-stirred) AD systems, and 2 MW generator sets. These systems can treat 300,000 tons of animal manure per year, generating 15.12 million kWh of grid-connected electricity, and can produce a total of 250,000 tons of bio-organic fertilizer per year. A new biomass cogeneration project has been built consuming 280,000 tons of biomass such as straw and fruit tree branches per year, generating about 240 million kWh of grid-connected electricity, and supplying 550,000 GJ of heat per year, mostly for central heating in the urban areas of the county, and serving a heating area of 1.3 million m2. Even with the company operating, however, poor infrastructure has kept high-quality biomass energy from reaching the surrounding villages and towns, and coal and other fossil fuels accounted for as much as 72% of overall energy consumption in Xiliangwa Township.
In addition, as Anping County is located in the hinterland of the GBTH economic circle, with demanding issues in both energy consumption and supply, it was a crucial task to replace the use of coal and other fossil fuels and to prevent air pollution in the county in order to directly improve air quality in Beijing and its surrounding areas. The capacity of the biomass projects has therefore been further expanded by leveraging the energy company’s outstanding biomass resource collection, storage, and transportation capacity and its experience on biogas project construction and operation. Biogas purifying technologies have been adopted, and natural gas boilers have replaced coal-fired boilers for central heating in the high-rise buildings of the relocated residents’ community. Pipelines that connect households with the gas transmission network have been laid and in households, wall-hung gas boilers and gas stoves have been promoted as part of the “coal-to-gas” project. This plan is not only in line with Anping County’s rural clean energy supply development plan but has also effectively solved problems in the replacement of fossil energy sources such as coal and LPG for cooking and heating in Xiliangwa Township.
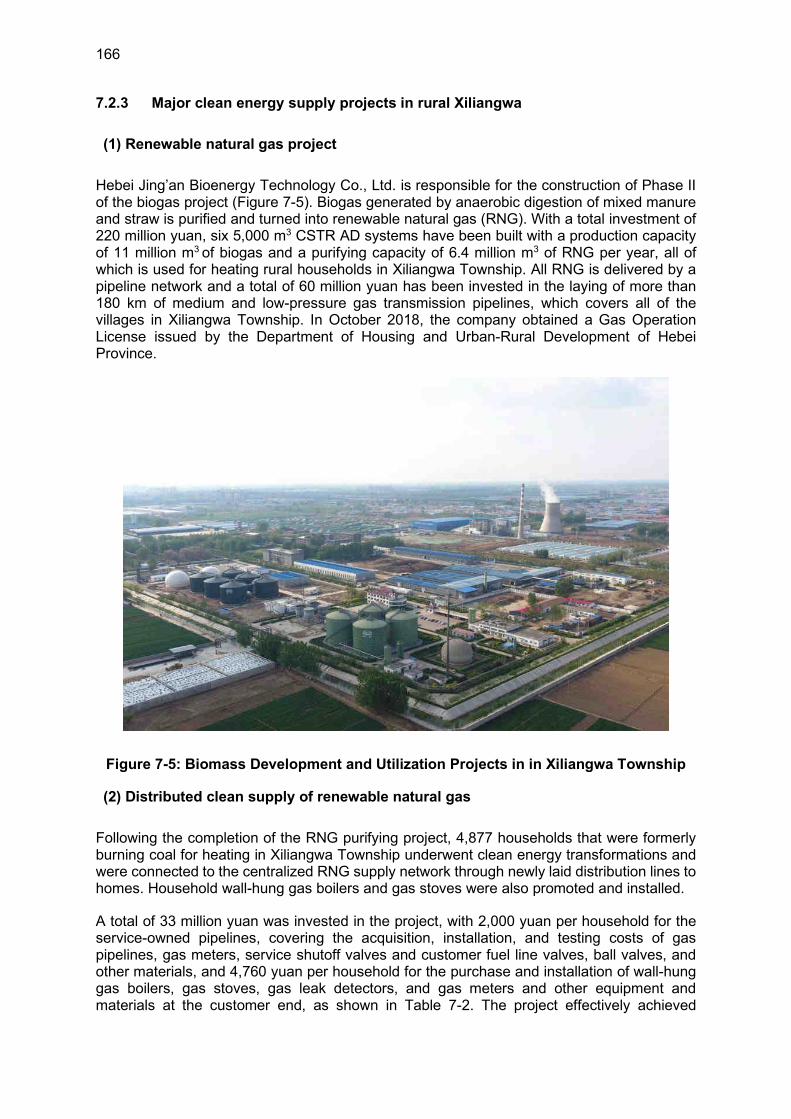
166
7.2.3 Major clean energy supply projects in rural Xiliangwa
(1) Renewable natural gas project
Hebei Jing’an Bioenergy Technology Co., Ltd. is responsible for the construction of Phase II of the biogas project (Figure 7-5). Biogas generated by anaerobic digestion of mixed manure and straw is purified and turned into renewable natural gas (RNG). With a total investment of 220 million yuan, six 5,000 m3 CSTR AD systems have been built with a production capacity of 11 million m3 of biogas and a purifying capacity of 6.4 million m3 of RNG per year, all of which is used for heating rural households in Xiliangwa Township. All RNG is delivered by a pipeline network and a total of 60 million yuan has been invested in the laying of more than 180 km of medium and low-pressure gas transmission pipelines, which covers all of the villages in Xiliangwa Township. In October 2018, the company obtained a Gas Operation License issued by the Department of Housing and Urban-Rural Development of Hebei Province.
Figure 7-5: Biomass Development and Utilization Projects in in Xiliangwa Township
(2) Distributed clean supply of renewable natural gas
Following the completion of the RNG purifying project, 4,877 households that were formerly burning coal for heating in Xiliangwa Township underwent clean energy transformations and were connected to the centralized RNG supply network through newly laid distribution lines to homes. Household wall-hung gas boilers and gas stoves were also promoted and installed.
A total of 33 million yuan was invested in the project, with 2,000 yuan per household for the service-owned pipelines, covering the acquisition, installation, and testing costs of gas pipelines, gas meters, service shutoff valves and customer fuel line valves, ball valves, and other materials, and 4,760 yuan per household for the purchase and installation of wall-hung gas boilers, gas stoves, gas leak detectors, and gas meters and other equipment and materials at the customer end, as shown in Table 7-2. The project effectively achieved
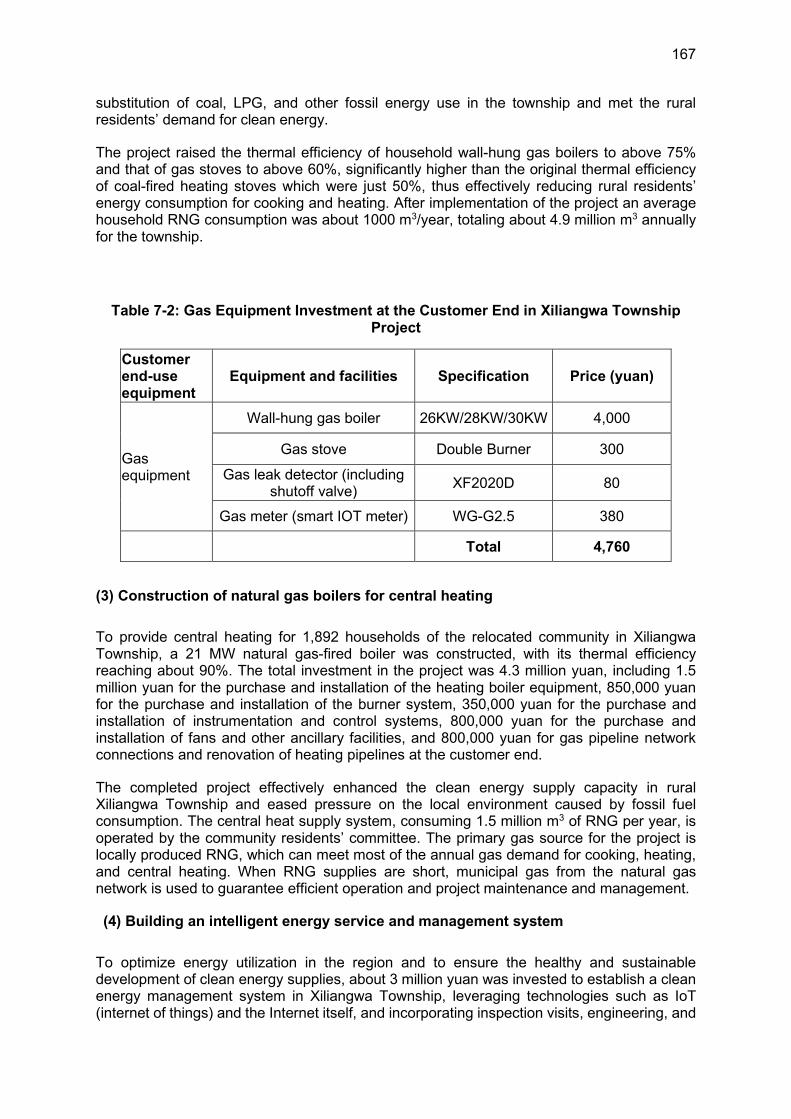
167
substitution of coal, LPG, and other fossil energy use in the township and met the rural residents’ demand for clean energy.
The project raised the thermal efficiency of household wall-hung gas boilers to above 75% and that of gas stoves to above 60%, significantly higher than the original thermal efficiency of coal-fired heating stoves which were just 50%, thus effectively reducing rural residents’ energy consumption for cooking and heating. After implementation of the project an average household RNG consumption was about 1000 m3/year, totaling about 4.9 million m3 annually for the township.
Table 7-2: Gas Equipment Investment at the Customer End in Xiliangwa Township Project
Customer end-use equipment
Equipment and facilities Specification Price (yuan)
Gas equipment
Wall-hung gas boiler 26KW/28KW/30KW 4,000
Gas stove Double Burner 300
Gas leak detector (including shutoff valve)
XF2020D 80
Gas meter (smart IOT meter) WG-G2.5 380
Total 4,760
(3) Construction of natural gas boilers for central heating
To provide central heating for 1,892 households of the relocated community in Xiliangwa Township, a 21 MW natural gas-fired boiler was constructed, with its thermal efficiency reaching about 90%. The total investment in the project was 4.3 million yuan, including 1.5 million yuan for the purchase and installation of the heating boiler equipment, 850,000 yuan for the purchase and installation of the burner system, 350,000 yuan for the purchase and installation of instrumentation and control systems, 800,000 yuan for the purchase and installation of fans and other ancillary facilities, and 800,000 yuan for gas pipeline network connections and renovation of heating pipelines at the customer end.
The completed project effectively enhanced the clean energy supply capacity in rural Xiliangwa Township and eased pressure on the local environment caused by fossil fuel consumption. The central heat supply system, consuming 1.5 million m3 of RNG per year, is operated by the community residents’ committee. The primary gas source for the project is locally produced RNG, which can meet most of the annual gas demand for cooking, heating, and central heating. When RNG supplies are short, municipal gas from the natural gas network is used to guarantee efficient operation and project maintenance and management.
(4) Building an intelligent energy service and management system
To optimize energy utilization in the region and to ensure the healthy and sustainable development of clean energy supplies, about 3 million yuan was invested to establish a clean energy management system in Xiliangwa Township, leveraging technologies such as IoT (internet of things) and the Internet itself, and incorporating inspection visits, engineering, and
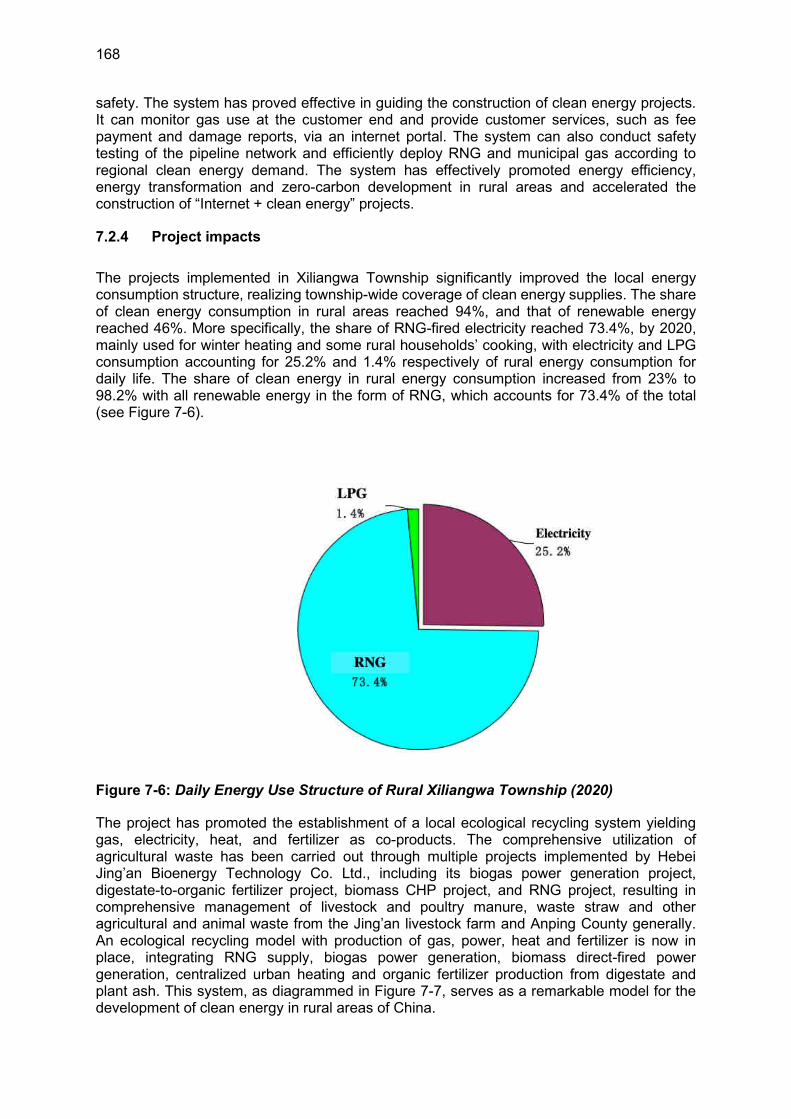
168
safety. The system has proved effective in guiding the construction of clean energy projects. It can monitor gas use at the customer end and provide customer services, such as fee payment and damage reports, via an internet portal. The system can also conduct safety testing of the pipeline network and efficiently deploy RNG and municipal gas according to regional clean energy demand. The system has effectively promoted energy efficiency, energy transformation and zero-carbon development in rural areas and accelerated the construction of “Internet + clean energy” projects.
7.2.4 Project impacts
The projects implemented in Xiliangwa Township significantly improved the local energy consumption structure, realizing township-wide coverage of clean energy supplies. The share of clean energy consumption in rural areas reached 94%, and that of renewable energy reached 46%. More specifically, the share of RNG-fired electricity reached 73.4%, by 2020, mainly used for winter heating and some rural households’ cooking, with electricity and LPG consumption accounting for 25.2% and 1.4% respectively of rural energy consumption for daily life. The share of clean energy in rural energy consumption increased from 23% to 98.2% with all renewable energy in the form of RNG, which accounts for 73.4% of the total (see Figure 7-6).
Figure 7-6: Daily Energy Use Structure of Rural Xiliangwa Township (2020)
The project has promoted the establishment of a local ecological recycling system yielding gas, electricity, heat, and fertilizer as co-products. The comprehensive utilization of agricultural waste has been carried out through multiple projects implemented by Hebei Jing’an Bioenergy Technology Co. Ltd., including its biogas power generation project, digestate-to-organic fertilizer project, biomass CHP project, and RNG project, resulting in comprehensive management of livestock and poultry manure, waste straw and other agricultural and animal waste from the Jing’an livestock farm and Anping County generally. An ecological recycling model with production of gas, power, heat and fertilizer is now in place, integrating RNG supply, biogas power generation, biomass direct-fired power generation, centralized urban heating and organic fertilizer production from digestate and plant ash. This system, as diagrammed in Figure 7-7, serves as a remarkable model for the development of clean energy in rural areas of China.
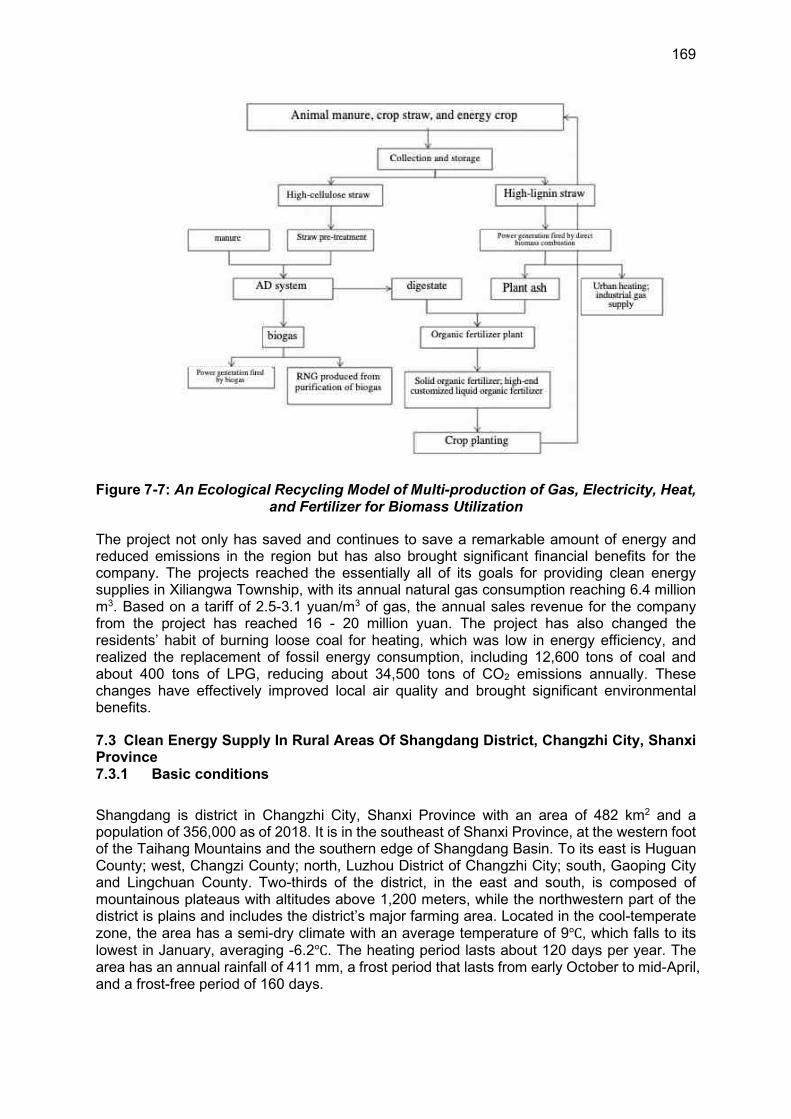
169
Figure 7-7: An Ecological Recycling Model of Multi-production of Gas, Electricity, Heat, and Fertilizer for Biomass Utilization
The project not only has saved and continues to save a remarkable amount of energy and reduced emissions in the region but has also brought significant financial benefits for the company. The projects reached the essentially all of its goals for providing clean energy supplies in Xiliangwa Township, with its annual natural gas consumption reaching 6.4 million m3. Based on a tariff of 2.5-3.1 yuan/m3 of gas, the annual sales revenue for the company from the project has reached 16 - 20 million yuan. The project has also changed the residents’ habit of burning loose coal for heating, which was low in energy efficiency, and realized the replacement of fossil energy consumption, including 12,600 tons of coal and about 400 tons of LPG, reducing about 34,500 tons of CO2 emissions annually. These changes have effectively improved local air quality and brought significant environmental benefits.
7.3 Clean Energy Supply In Rural Areas Of Shangdang District, Changzhi City, Shanxi Province 7.3.1 Basic conditions
Shangdang is district in Changzhi City, Shanxi Province with an area of 482 km2 and a population of 356,000 as of 2018. It is in the southeast of Shanxi Province, at the western foot of the Taihang Mountains and the southern edge of Shangdang Basin. To its east is Huguan County; west, Changzi County; north, Luzhou District of Changzhi City; south, Gaoping City and Lingchuan County. Two-thirds of the district, in the east and south, is composed of mountainous plateaus with altitudes above 1,200 meters, while the northwestern part of the district is plains and includes the district’s major farming area. Located in the cool-temperate zone, the area has a semi-dry climate with an average temperature of 9℃, which falls to its lowest in January, averaging -6.2℃. The heating period lasts about 120 days per year. The area has an annual rainfall of 411 mm, a frost period that lasts from early October to mid-April, and a frost-free period of 160 days.
170
Shangdang District is famous for its historical and cultural heritage. The district has an annual GDP of about 22 billion yuan with a per capita disposable income of more than 30,000 yuan per person for urban residents and about 20,000 yuan per person for rural residents. The area is rich in coal, which is a pillar industry with coal fields covering 242 km2 and coal reserves exceeding 3.4 billion tons, the district has therefore long been known as “a town of coal.” The district has 365,600 mu of arable land, mainly used for growing corn, rice, wheat, root and tuber crops and beans, Oil crops, herbs, and vegetables are secondary crops. Annual grain output for the district is about 120,000 tons. Hogs are the primarily animal bred in the district, with the annual slaughter reaching 250,000.
7.3.2 Analysis of energy resource endowment and consumption in Shangdang
(1) Overview of energy resource endowment
Shangdang District is rich in biomass resources, with an annual 85,000 tons of crop straw output of which 78,000 tons are collectable resources, and mostly composed of corn stover, with an annual 350,000 tons of livestock and poultry manure output, mainly from the hog farming industry. In addition, the area is rich in solar energy with 1,390 kWh/m2 of annual average solar radiation and 3,000 hours of sunshine per year, thus falling somewhere between Class II and Class III solar radiation resources. With a direct solar radiation rate of 0.48 and solar energy stability of 0.36160, the area has potential for solar energy development and utilization. Currently,however, most solar use is in the form of household solar water heaters and a small number of rooftop photovoltaic systems.
Finally, the area has a relatively modest endowment of wind, water, and geothermal energy resources. Water resources are mostly from the Taoqing River, a tributary of the Zhuozhang River. The Yincheng River, which flows through the southern mountains, travels north along the western boarder of Shangdang to join Zhangze Reservoir after leaving the plain area. Water resources are relatively scarce with hydraulic resources only suitable for farmland irrigation and reservoir fisheries. Due to its regional geography wind and geothermal resources are under-developed and under-utilized in Shangdang district, with a handful of project having been built for demonstration purposes only.
(2) Analysis of energy consumption structure
Shangdang District encompasses 6 counties, 5 townships, 1 new area and 2 development zones with a rural population of roughly 620,000 and 78,000 households in total as of 2018. Before the implementation of the project the average rural household energy consumption in Shangdang District was about 3.94 tons of standard coal per year, and the total annual energy consumption of the district as a whole was about 307,000 tons of standard coal.
Within household energy consumption, electricity was used mainly for lighting and household appliances, with an average household electricity consumption of about 2,400 kWh per year and an annual total consumption of 187,200 MWh for the district, equivalent to about 57,800 tons of standard coal, and accounting for 19% of rural household energy consumption in the area in 2016. Coal was used mainly for heating in winter and cooking for a certain percentage of rural households, with about 4 tons of coal consumption for heating and about 0.5 ton for cooking on average per household. The annual consumption of coal in the rural parts of Shangdang District reached 336,000 tons, equivalent to about 240,000 tons of standard coal, and accounting for 78% of the total rural household energy consumption in the area. Straw
160 The soalr energy stability is expressed by the ratio of the maximum and minimum number of days with sunshine duration more than 6 hours in each month. The stability can be divided into stable, relatively stable and unstable levels.
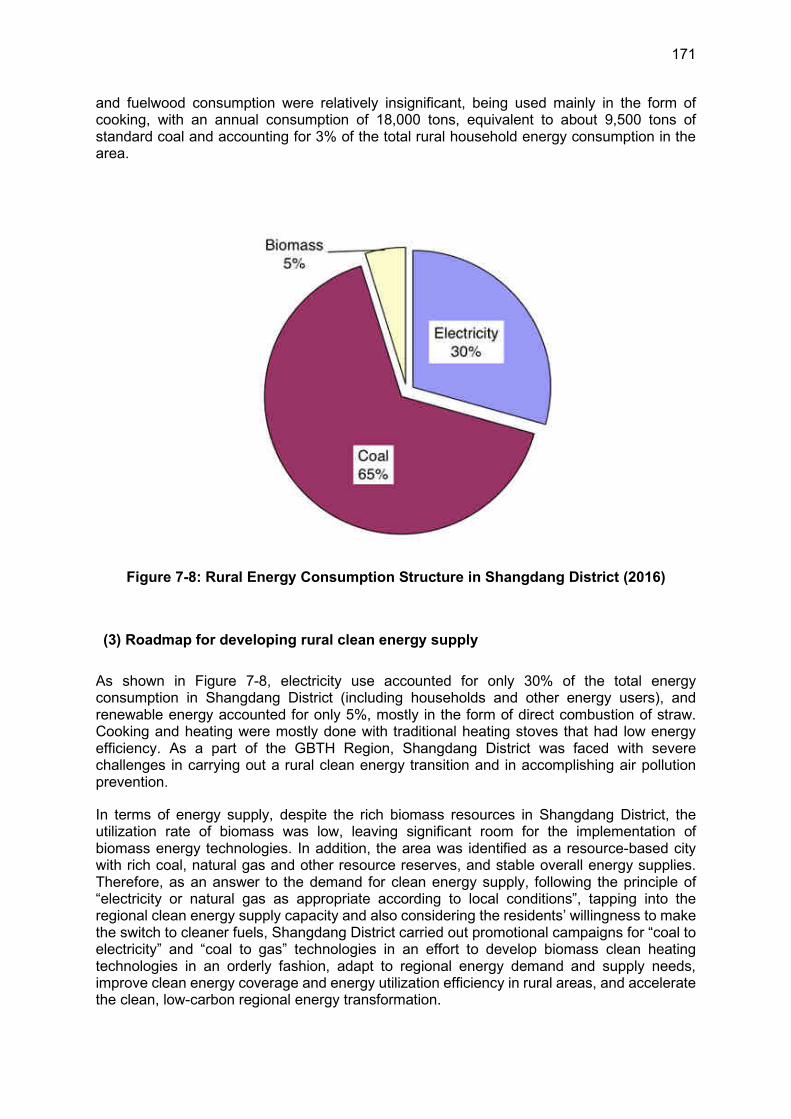
171
and fuelwood consumption were relatively insignificant, being used mainly in the form of cooking, with an annual consumption of 18,000 tons, equivalent to about 9,500 tons of standard coal and accounting for 3% of the total rural household energy consumption in the area.
Figure 7-8: Rural Energy Consumption Structure in Shangdang District (2016)
(3) Roadmap for developing rural clean energy supply
As shown in Figure 7-8, electricity use accounted for only 30% of the total energy consumption in Shangdang District (including households and other energy users), and renewable energy accounted for only 5%, mostly in the form of direct combustion of straw. Cooking and heating were mostly done with traditional heating stoves that had low energy efficiency. As a part of the GBTH Region, Shangdang District was faced with severe challenges in carrying out a rural clean energy transition and in accomplishing air pollution prevention.
In terms of energy supply, despite the rich biomass resources in Shangdang District, the utilization rate of biomass was low, leaving significant room for the implementation of biomass energy technologies. In addition, the area was identified as a resource-based city with rich coal, natural gas and other resource reserves, and stable overall energy supplies. Therefore, as an answer to the demand for clean energy supply, following the principle of “electricity or natural gas as appropriate according to local conditions”, tapping into the regional clean energy supply capacity and also considering the residents’ willingness to make the switch to cleaner fuels, Shangdang District carried out promotional campaigns for “coal to electricity” and “coal to gas” technologies in an effort to develop biomass clean heating technologies in an orderly fashion, adapt to regional energy demand and supply needs, improve clean energy coverage and energy utilization efficiency in rural areas, and accelerate the clean, low-carbon regional energy transformation.
172
7.3.3 Clean energy supply development and implementation in Shangdang
(1) “Coal to electricity” technology promotion and implementation
To meet rural energy demand needs in Shangdang District, the dissemination of “coal to electricity” technologies, mainly in the form of air source heat pump heating, was carried out to solve the problem of coal heating and fossil energy replacement for rural households and to meet their demand for clean heating. “Coal to electricity” projects were completed in a total of 12,000 rural households, and mainly consisted of installing “air source heat pump + radiator” systems. This has involved a total investment of 510 million yuan in areas such as external power grid expansion and retrofitting costing roughly 5,000 yuan per household, the addition of village parallel capacitors at about 20,000 yuan per household, and the purchase and installation of air source heat pump equipment and indoor pipeline retrofitting, at about 18,000 yuan per household.
In the implementation of the project floor-type household air source heat pump equipment was mostly adopted, integrating existing indoor radiators, and eliminating the need to retrofit floor heating and other system. The ASHP installed were rated at about 5kW, and the heat pump produces about 16 kW of heat while offering a long service life, safe performance, low operating costs, and an energy efficiency ratio between 2.0 and 3.5. Operating the heat pump system is very easy and intuitive, with freely adjustable and controllable temperatures, including output water temperatures up to 50℃ for the water flowing through the radiators, and the system can be set at 10℃ in summer to provide cooling. The average household energy consumption for heating in winter is about 2,600 kWh/year, effectively meeting the residential heating demand of rural residents and reducing energy consumption for heating in winter, including displacing coal use.
(2) “Coal to gas” technology promotion and implementation
Natural gas use is very compatible with the existing habits of the Chinese people living in the GBTH area with regard to heat supply and other end uses. In addition to meeting the main energy needs of space heating and boiling water in rural areas, gas also fits with Chinese cooking habits. The adoption of “coal to gas” technologies in Shangdang District in the form of wall-hung gas boilers has covered a total of 57,000 rural households, with gas used mainly for cooking and heating. This project has involved a total investment of around 900 million yuan including about 500 million yuan in gas pipeline networks, about 2,000 yuan per household for integration with and access to the pipeline networks, and about 5,000 yuan per household for the purchase and installation of wall-hung gas boilers, gas cookers and other equipment.
The “coal to gas” project has effectively provided coal, LPG, and other fossil energy replacement for rural residents, and has met rural demand for clean energy. With thermal efficiencies of up to 75% or more in wall-hung gas stoves and up to 60% or more in gas cookers, the thermal efficiency of energy equipment has been significantly improved relative to the previous use of coal and LPG in households. The average household now consumes about 1300 m3 of natural gas per year, resulting in a total annual consumption of natural gas of 74.1 million m3 in the district.
(3) Promotion of central heating technologies fired by direct combustion of straw bales
In 7 villages under 5 counties and townships of Shangdang District, a central heating project using boilers fired by direct combustion of straw bales was implemented, covering about 3,756 households with a total heating area of 377,000 m2, and at a total investment of 61.18
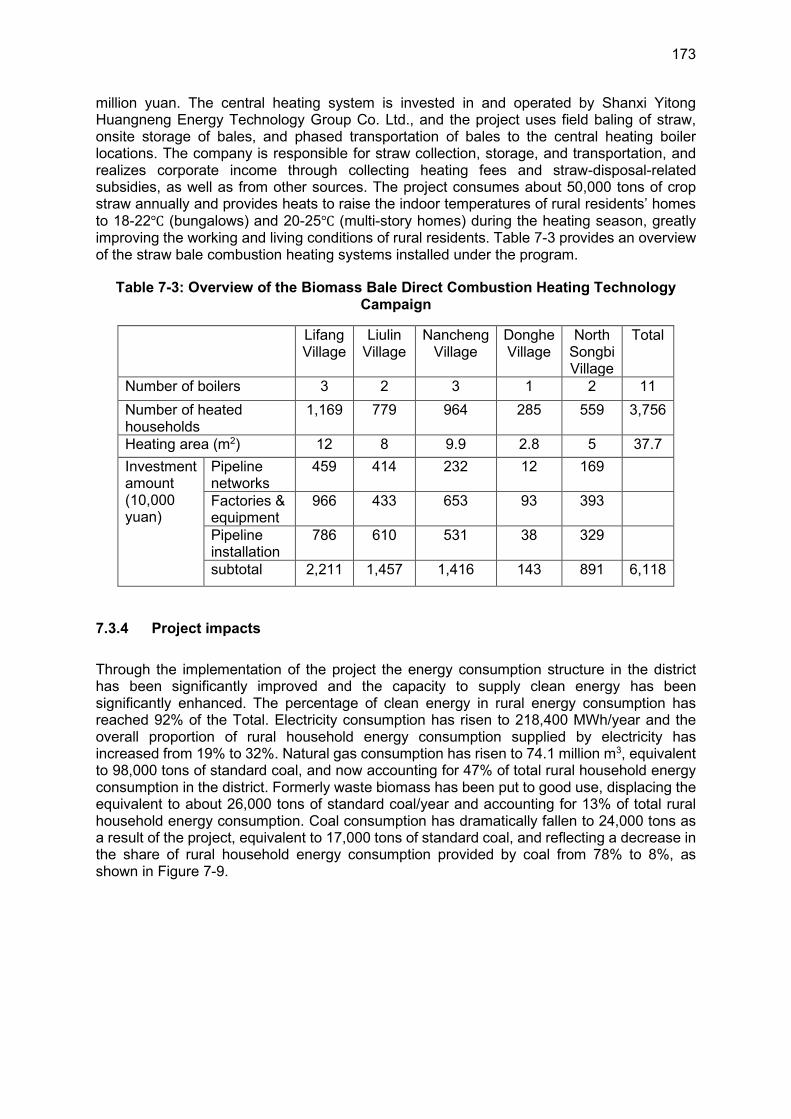
173
million yuan. The central heating system is invested in and operated by Shanxi Yitong Huangneng Energy Technology Group Co. Ltd., and the project uses field baling of straw, onsite storage of bales, and phased transportation of bales to the central heating boiler locations. The company is responsible for straw collection, storage, and transportation, and realizes corporate income through collecting heating fees and straw-disposal-related subsidies, as well as from other sources. The project consumes about 50,000 tons of crop straw annually and provides heats to raise the indoor temperatures of rural residents’ homes to 18-22℃ (bungalows) and 20-25℃ (multi-story homes) during the heating season, greatly improving the working and living conditions of rural residents. Table 7-3 provides an overview of the straw bale combustion heating systems installed under the program.
Table 7-3: Overview of the Biomass Bale Direct Combustion Heating Technology Campaign
Lifang Village
Liulin Village
Nancheng Village
Donghe Village
North Songbi Village
Total
Number of boilers 3 2 3 1 2 11
Number of heated households
1,169 779 964 285 559 3,756
Heating area (m2) 12 8 9.9 2.8 5 37.7
Investment amount (10,000 yuan)
Pipeline networks
459 414 232 12 169
Factories & equipment
966 433 653 93 393
Pipeline installation
786 610 531 38 329
subtotal 2,211 1,457 1,416 143 891 6,118
7.3.4 Project impacts
Through the implementation of the project the energy consumption structure in the district has been significantly improved and the capacity to supply clean energy has been significantly enhanced. The percentage of clean energy in rural energy consumption has reached 92% of the Total. Electricity consumption has risen to 218,400 MWh/year and the overall proportion of rural household energy consumption supplied by electricity has increased from 19% to 32%. Natural gas consumption has risen to 74.1 million m3, equivalent to 98,000 tons of standard coal, and now accounting for 47% of total rural household energy consumption in the district. Formerly waste biomass has been put to good use, displacing the equivalent to about 26,000 tons of standard coal/year and accounting for 13% of total rural household energy consumption. Coal consumption has dramatically fallen to 24,000 tons as a result of the project, equivalent to 17,000 tons of standard coal, and reflecting a decrease in the share of rural household energy consumption provided by coal from 78% to 8%, as shown in Figure 7-9.
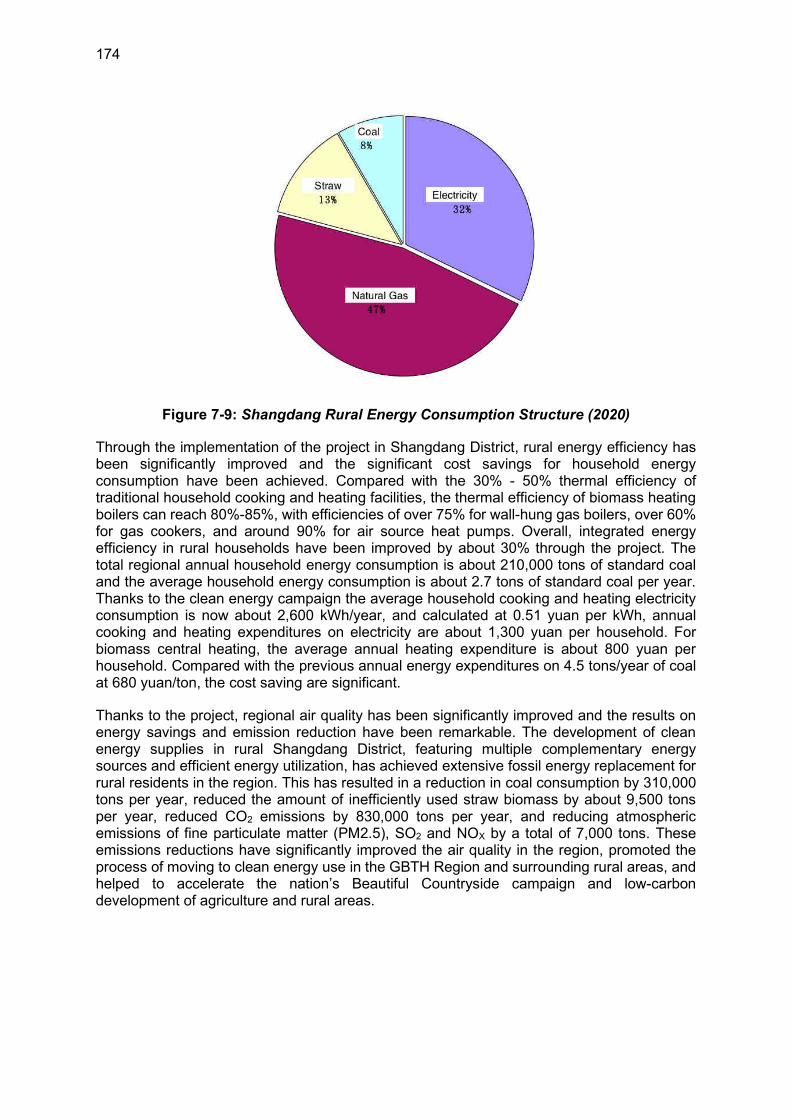
174
Figure 7-9: Shangdang Rural Energy Consumption Structure (2020)
Through the implementation of the project in Shangdang District, rural energy efficiency has been significantly improved and the significant cost savings for household energy consumption have been achieved. Compared with the 30% - 50% thermal efficiency of traditional household cooking and heating facilities, the thermal efficiency of biomass heating boilers can reach 80%-85%, with efficiencies of over 75% for wall-hung gas boilers, over 60% for gas cookers, and around 90% for air source heat pumps. Overall, integrated energy efficiency in rural households have been improved by about 30% through the project. The total regional annual household energy consumption is about 210,000 tons of standard coal and the average household energy consumption is about 2.7 tons of standard coal per year. Thanks to the clean energy campaign the average household cooking and heating electricity consumption is now about 2,600 kWh/year, and calculated at 0.51 yuan per kWh, annual cooking and heating expenditures on electricity are about 1,300 yuan per household. For biomass central heating, the average annual heating expenditure is about 800 yuan per household. Compared with the previous annual energy expenditures on 4.5 tons/year of coal at 680 yuan/ton, the cost saving are significant.
Thanks to the project, regional air quality has been significantly improved and the results on energy savings and emission reduction have been remarkable. The development of clean energy supplies in rural Shangdang District, featuring multiple complementary energy sources and efficient energy utilization, has achieved extensive fossil energy replacement for rural residents in the region. This has resulted in a reduction in coal consumption by 310,000 tons per year, reduced the amount of inefficiently used straw biomass by about 9,500 tons per year, reduced CO2 emissions by 830,000 tons per year, and reducing atmospheric emissions of fine particulate matter (PM2.5), SO2 and NOX by a total of 7,000 tons. These emissions reductions have significantly improved the air quality in the region, promoted the process of moving to clean energy use in the GBTH Region and surrounding rural areas, and helped to accelerate the nation’s Beautiful Countryside campaign and low-carbon development of agriculture and rural areas.
175
Chapter 8: Recommendations
The Chinese government has attached high importance to clean energy development in rural areas and has identified renewable energy as a crucial means to increase energy supply, adjust the energy structure away from the use of polluting fuels, protect the environment, eliminate poverty, and promote sustainable development. After decades of strenuous work, China’s clean energy industry has witnessed remarkable progress—including world-class development of hydro, wind, solar and biomass energy—but the sound and sustainable development of rural clean energy in China requires additional k political support and effective financing mechanisms. Based on consideration of the characteristics of rural energy supply and demand in the GBTH region, this study recommends that policy support be strengthened, financing channels widened, and the “three major projects” be forcefully implemented.
8.1 Greater Policy Support
Under the framework of Renewable Energy Law and the Medium- and Long-term Development Plan for Renewable Energy, efforts can be made to advocate for and guide the central government to set up a suitable policy mechanism for the GBTH Region to continue and accelerate its clean energy transition, and to devise feasible implementation measures and detailed plans for the transition. The study therefore puts forward the following three recommendations with regards to the needed macro and technical policies:
First, establish an institution responsible for coordinating different departments and agencies to promote rural clean energy development. This change would provide greater clarity as to what agency(ies) take the lead and how cross-departmental coordination would be undertaken. Policy alignment is the key to efficiently and successfully implementing clean energy development policies. In particular, those policies that are legally binding should be well coordinated with one other to avoid fragmentation or piecemeal efforts. Emphasis should be placed on addressing challenges in implementation so that the macro policies for clean energy development and implementation can be more workable and effective in local contexts. A well-functioning legal and policy system should gradually be established to support clean energy development in rural areas.
Second, the project-centered subsidy provision approach should be altered. With reference to the subsidy granting initiatives in developed countries that directly target the users, China should strive to integrate diverse projects’ resources and incorporate technical standards into the eligibility criteria for the granting of subsidies. Such practices can replace the current arbitrary and ill-defined methods often in use in China to access fiscal support, minimize project swindling behavior by those involved in projects, and give greater play to the agency and needs of end users. Up to now this consumer-side approach have been adopted in the crop straw utilization projects described in this study, in which subsidies have been granted according to pre-set technical standards.
Third, implement standardized management based on technical standards. A standard framework should be established to support the sound and orderly development of rural clean energy. Standards, collection of energy statistics, and metering systems for clean energy systems should be improved and related equipment, design, construction, and operational criteria should be developed. To forge a full-fledged mechanism for monitoring, management, and provision of rewards and penalties related to performance under clean energy projects, technical standards, and specifications should serve as the basis for tracking and managing product quality, entry criteria for firms and projects to participate in a program, project
176
construction, and construction acceptance by project users, operational services and post-project evaluation. Currently, the China Association of Rural Energy Industry is developing technical standards and specifications related to clean energy projects.
8.2 Expand Financing Channels
China is endowed with abundant clean energy resources offering great prospects and potential. The huge capital investments required to tap these resources, together with financing difficulties, however, have been hampering the sound development of the clean energy industry in rural areas of China for a long time.
First, rural clean energy development projects should be included in the national carbon emission trading market. Now that the central government has put forward the goals of achieving peak carbon emissions and ultimately carbon neutrality, efforts should be made to spur clean energy development as an important pathway towards achieving carbon neutrality in rural areas. The carbon emissions reductions that are and could be generated by the use of rural clean energy should be better studied and evaluated in order to facilitate the entry of rural clean energy use into the national carbon trading market.
Second, favorable credit policies should be used to foster rural clean energy development. All levels of governments should designate rural clean energy as a key category to receive low-interest policy-based loans. The loans’ durations should be extended and the interest rates charged for the loans should be moderately reduced. The NDRC, relevant departments, and some provincial and municipal governments have already begun to provide favorable low-interest loans to support the clean energy sector.
Third, green finance should be developed. A national green development fund and subordinate rural energy funds should be established as soon as possible. With the involvement of important stakeholders such as ADB and other international financial organizations, a green finance model will be established in the GBTH Region to help to fund renewable energy development and rural revitalization, and to provide financial products and services for the clean energy industry, financing facilitation, market development, ecological conservation, and livability enhancement. Clean energy enterprises should be encouraged to issue green bonds, and eligible enterprises should be supported in acquiring financing and refinancing on the stock market. Financial instruments such as lease financing and securitization should be leveraged to provide more financing channels for clean energy enterprises.
8.3 Implement Rural Clean Energy Replacement Projects
As spurred by the Rural Revitalization Strategy and based on the resource endowment and living habits in rural GBTH, “coal-to-gas” and “coal-to-electricity” projects should be given priority, biomass and solar energy projects should be further developed, and traditional rural energy systems should be replaced, and the quality of life and living conditions in rural areas should be improved by these clean energy transitions.
First, rural “coal-to-gas” and “coal-to-electricity” projects should be steadily implemented. Infrastructure including power grids and natural gas distribution networks connecting gas transmission to households should be constructed, and heating facilities including ASHPs, storage electric heaters, and carbon fiber heating system should be installed in rural households.
Second, solar energy should be proactively developed. Solar streetlights and water heaters should be installed in accordance with the national “Beautiful Countryside Construction”
177
strategy. Solar facilities such as passive solar houses, distributed photovoltaic systems and household PV/T (photovoltaic/thermal) systems should be constructed based on needs and resources determined by local conditions.
Third, geothermal energy should be steadily developed. In rural GBTH, the distribution of middle-to-high depth geothermal energy resources is uneven. Geothermal heating should therefore be developed in rural areas with (relatively) abundant geothermal resources.
Fourth, biomass energy should be developed. Public facilities including centralized biomass direct-fired facilities, biomass gasification facilities and biomass molded fuels facilities should be installed to allow traditional heating and cooking appliances to be rapidly replaced with efficient and innovative clean units.
8.4 Implement Rural Building Retrofitting Projects for Higher Energy Efficiency
Since most rural houses in China are self-built, 80% of them are not designed for high energy efficiency performance. Retrofitting rural houses to raise energy efficiency will drastically reduce energy consumption and help drive rural areas further towards the goals of reaching carbon peak emissions and carbon neutrality and will thus contribute emissions reductions as the nation continues on in its path towards the two carbon emissions reduction targets.
First, roofs, walls, doors, and windows of built houses in rural area should add heat insulation or be replaced with high-performance units so as to increase the insulating efficiency of home building envelopes and reduce the energy requirements for home heating.
Second, when new houses are built in rural areas, new materials and technology should be applied according to the requirements of village planning authorities in order to meet or exceed energy efficiency and heat insulation requirements.
Third, prefabricated buildings, green buildings, and ultra-low energy consuming buildings should be proactively promoted for rural areas. The construction sector should commit itself to green and low-carbon development throughout the industrial housing production chain (inclusive of the selection of building materials, on-site construction, maintenance, and operations), in order to facilitate rural development and the transition towards a lower carbon society.
8.5 Drive Clean Energy-oriented Industrial Upgrading
To drive the upgrading and expansion of clean energy-oriented industries, a first step will be to set up an enabling environment to foster the participation of leading enterprises in rural clean energy industries. Based on technical specifications and standards, China should encourage the standardized manufacturing of end-use heating and cooking appliances such as storage electric heaters, electric heating films, wall-mounted gas boilers and electric heating cables, as well as clean energy supply equipment (ASHPs, biomass direct-fired boilers and biomass gasification equipment).
As second step will be to further activate the market providing rural clean energy services. Design, construction and operations standards for clean energy equipment and facilities should be constantly updated, a standard framework should be built to ensure sound and orderly development of clean energy services delivery in rural areas, a rural clean energy service system and sector should be built and encouraged to provide professional management services, and the rural clean energy industry should be enabled and fostered.