Embed Size (px)
Citation preview
I II -I~
I 1
I . I I I I I I· I I'
I I I I , I
1243
FINAL REPORT
FILTER TESTING PROGRAM
JPL CONTRACT # 951489
EVALUATION OF FILTERS TO STERILIZE LIOUIDS AND GASES
April 1, 1968
RESEARCH LABORATORIES CASTLE COMPANY
ROCHESTER, NEW YORK 14623
SUbmitted:;l,4rt~e4-Principal Investigator
https://ntrs.nasa.gov/search.jsp?R=19680028338 2020-03-12T05:39:38+00:00Z
I
I I I I I I I I I I I
'I I I I r I
TABLE OF CONTENTS
Acknowledgement
Introducti on
HEPA Filters
Establishing Test Procedures
HEPA Filter Evaluati on
Membrane Filters
Evaluation of Filters & Filtration of Liquids under pressure
The Evaluation of Filters & Filtration Methods for the Sterilization of Gas under Pressure
Conclusion
List of References
Tables and Figures (see following Pages)
P 1
pp 2-5
pp 5-16
pp 16-28
pp 29-36
pp 37-40
pp 41-43
pp 44-47
pp 48-49
I I I I I I I I I I I I I I I It I
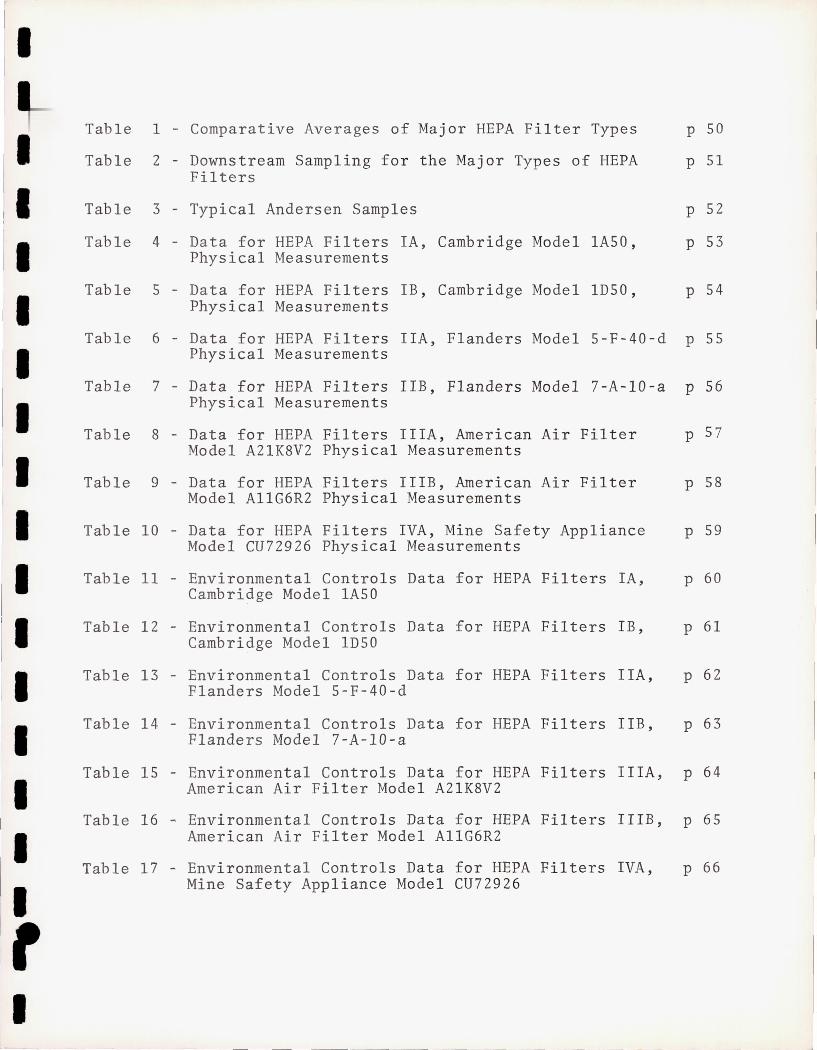
Table 1 - Comparative Averages of Major HEPA Filter Types p 50
Table 2 - Downstream Sampling for the Major Types of HEPA p 51 Filters
Table 3 - Typical Andersen Samples p 52
Table 4 - Data for HEPA Filters lA, Cambridge Model lASO, p 53 Physical Measurements
Table 5 - Data for HEPA Filters IB, Cambridge Model lD50, p 54 Physical Measurements
Table 6 - Data for HEPA Filters IIA, Flanders Model 5-F-40-d p 55 Physical Measurements
Table 7 - Data for HEPA Filters lIB, Flanders Model 7-A-lO-a p 56 Physical Measurements
Table 8 - Data for HEPA Filters IlIA, American Air Filter p 57 Model A2lK8V2 Physical Measurements
Table 9 - Data for HEPA Filters IIIB, American Air Filter p 58 Model AllG6R2 Physical Measurements
Table 10 - Data for HEPA Filters IVA, Mine Safety Appliance p 59 Model CU72926 Physical Measurements
Table 11 - Environmental Controls Data for HEPA Filters lA, p 60 Cambridge Model lA50
Table 12 - Environmental Controls Data for HEPA Filters IB, p 61 Cambridge Model lD50
Table 13 - Environmental Controls Data for HEPA Filters IIA, p 62 Flanders Model 5-F-40-d
Table 14 - Environmental Controls Data for HEPA Filters lIB, p 63 Flanders Model 7-A-lO-a
Table 15 - Environmental Controls Data for HEPA Filters IlIA, p 64 American Air Filter Model A2lK8V2
Table 16 - Environmental Controls Data for HEPA Filters IIlB, p 65 American Air Filter Model AllG6R2
Table 17 - Environmental Controls Data for HEPA Filters IVA, p 66 Mine Safety Appliance Model CU72926
I I I I
II I I I I I I I :. I
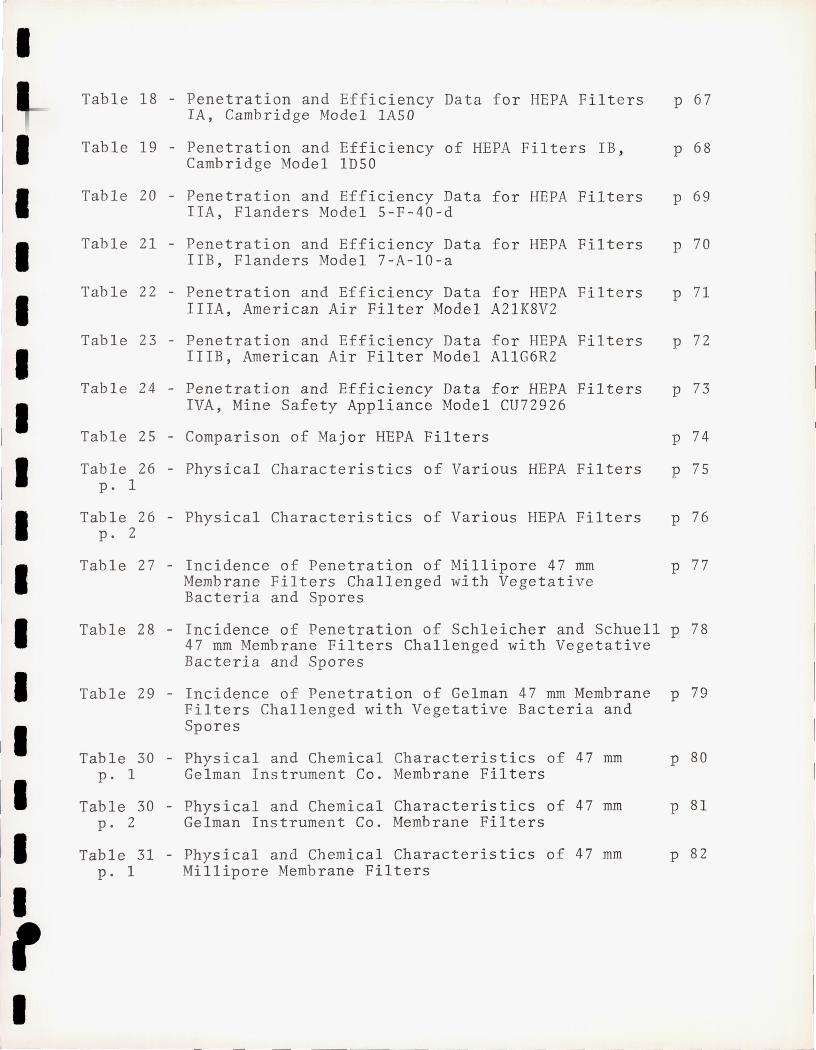
Table 18 - Penetration and Efficiency Data for HEPA Filters lA, Cambridge Model lASO
Table 19 - Penetration and Efficiency of HEPA Filters IB, Cambridge Model lD50
Table 20 - Penetration and Efficiency Data for HEPA Filters IIA, Flanders Model 5-F-40-d
Table 21 - Penetration and Efficiency Data for HEPA Filters lIB, Flanders Model 7-A-IO-a
Table 22 - Penetration and Efficiency Data for HEPA Filters IlIA, American Air Filter Model A2lK8V2
Table 23 - Penetration and Efficiency Data for HEPA Filters IIIB, American Air Filter Model A1IG6R2
Table 24 - Penetration and Efficiency Data for HEPA Filters IVA, Mine Safety Appliance Model CU72926
Table 25 - Comparison of Major HEPA Filters
Table 26 - Physical Characteristics of Various HEPA Filters p. I
Table 26 - Physical Characteristics of Various HEPA Filters p. 2
Table 27 - Incidence of Penetration of Millipore 47 mm Membrane Filters Challenged with Vegetative Bacteria and Spores
p 67
p 68
p 69
p 70
p 71
p 72
P 73
P 74
P 7S
P 76
P 77
Table 28 - Incidence of Penetration of Schleicher and Schuell p 78 47 mm Membrane Filters Challenged with Vegetative Bacteria and Spores
Table 29 - Incidence of Penetration of Gelman 47 mm Membrane p 79 Filters Challenged with Vegetative Bacteria and Spores
Table 30 - Physical and Chemical Characteristics of 47 mm p 80 p. I Gelman Instrument Co. Membrane Filters
Table 30 - Physical and Chemical Characteristics of 47 mm p 81 p. 2 Gelman Instrument Co. Membrane Filters
Table 31 - Physical and Chemical Characteristics of 47 mm p 82 p. 1 Millipore Membrane Filters
I
I I I I I I I I I I II I I I ,
II I
Table 31 - Physical and Chemical Characteristics of 47 mm p. 2 Mi11ipore Membrane Filters
Table 32 - Physical and Chemical Characteristics of 47 mm Schleicher and Schue11 Membrane Filters
P 83
P 84
Table 33 - Physical Characteristics of 47 mm Membrane Filters p 85 p. 1 from Manufacturer's Data
Table 33 - Physical Characteristics of 47 mm Membrane Filters p 86 p. 2 from Manufacturer's Data
Table 34 - Incidence of Penetration of 47 mm Membrane Filters p 87 Challenged with Vegetative Bacteria and Spores
Table 35 - Incidence of Penetration of 47 mm Membrane Filters p 88 p. 1 Challenged with Vegetative Bacteria and Spores
Table 35 - Incidence of Penetration of 47 mm Membrane Filters p 89 p. 2 Challenged with Vegetative Bacteria and Spores
Table 35 - Incidence of Penetration of 47 mm Membrane Filters p 90 p. 3 Challenged with Vegetative Bacteria and Spores
Table 36 - Incidence of Penetration of 47 mm Membrane Filters p 91 p. 1 Challenged with Vegetative Bacteria and Spores
Table 36 - Incidence of Penetration of 47 mm Membrane Filters p 92 p. 2 Challenged with Vegetative Bacteria and Spores
Table 37 - Incidence of Penetration of 47 mm Membrane Filters p 93 Challenged with Vegetative Bacteria and Spores
Table 38 - The Evaluation of a Single Liquid Filter under Positive and Negative Pressure
Table 39 - The Evaluation of Filters under Liquid Pressure
Table 40 - The Evaluation of Filters under Liquid Pressure
Table 41 - Double Filtration of Liquids under Pressure: p. 1 A Filter Evaluation
Table 41 - Double Filtration of Liquids under Pressure: p. 2 A Filter Evaluation
Table 42 - Filtration of Air under Pressure: A Filter Evaluation
P 94
P 95
P 96
P 97
P 98
P 99
L---~---
I
I I I I
II I I I I I
II I I I ,
Table 43 - Recommended Filtration Applications as Determined p 100 p. 1 by this Study - I Producing Sterile Aqueous Liquids
Table 43 - Recommended Filtration Applications as Determined p 101 p. 2 by this Study - I Producing Sterile Aqueous Liquids
Table 43 - Recommended Filtration Applications as Determined p 102 p. 3 by this Study - I Producing Sterile Aqueous Liquids
Table 44 - Recommended Filtration Applications as Determined p 103 by this Study - II Producing Sterile Organic Solvents - Double Filtration Recommended
Table 45 - Recommended Filtration Applications as Determined p 104 by this Study - III Collecting and Counting Viable Particles - Single Filtration Application
Table 46 - Recommended Filtration Applications as Determined p 105 by this Study - Double Filtration required - IV Providing Sterile Gases. V Collecting and Count-ing Viable particles - Single Filtration Application
Figure 1 - Schematic Layout of Air Filter Test Assembly P 106
Figure 2 - The Roving Probe Assembly and the Stationary Probe p 107 Assembly with the Andersen Sampler
Figure 3 - The Isokinetic Roving Probe with Hot Wire p 108 Anemometer Attachment
Figure 4 - Distribution of Viable Particles of Bacillus p 109 Subtilis var. niger Spores
Figure 5 - The Velocity Profile showing a nearly coincident plIO multiple trace
Figure 6 - Velocity Profiles for HEPA Filters, Cambridge pIll Model lASO (l -A-l) and Cambridge Model lD50 (l-B-l) Explanat ory Notes
Figure 7 - Velocity Profiles for HEPA Filters, Cambridge p 112 Model lASO (I-A) Explanatory Notes
Figure 8 - Velocity Profiles f or HEPA Filters, Cambridge p 113 Model lDSO (I-B) Explanatory Notes
Figure 9 - Vel ocity Profiles for HEPA Filters, Flanders p 114 Model 5-F-40-d (II-A) and Flanders Model 7-A-lO-a
I
I I
I
II I I I I I
II I It i
' I I
Figure 10 - Velocity Profiles for HEPA Filters, American Air Filter Model AllG6R2 (III-B) Explanatory Notes
P 115
Figure 11 - Velocity Profiles for HEPA Filters, American Air p 116 Filter Model A2lK8V2 (III-A) and Mine Safety Appliance Model CU72926 (IV -A) Explanatory Notes
Figure 12 - Membrane Filtration Assemblies: Millipore, Gelman, and Schleicher and Schuell
Figure 13 - Disassembled Membrane Filtration Assemblies: Millipore, Gelman, and Schleicher and Schuell
Figure 14 - Stainless Steel Membrane Filtration Assembly (Gelman)
Figure 15 - Glass Membrane Filtration Parts greatly chipped
Figure 16 - Liquid Filtration Filters : Schleicher & Schuell, Pall, Selas, Horman, and Gelman
Figure 17 - F.R . Horman Co. Filter Apparatus
Figure 18 - Apparatus for Low Pre ssure Fil t ration of Liquids
Figure 19 - High Pressure Liquid Filtration Apparatus for Testing Membrane Filters
Figure 20 - High Pressure Double Liquid Fil t ration Apparatus for Testing Membrane Filters in Series
Figure 21 - Apparatus for testing High Pressure Gas Filters
Figure 22 - High Pressure Gas Filters: Pall Ultipor, Linde, and Representative Membrane
Figure 23 - Filter Holders for Selas Porcelain and Seitz
P 117
P 118
P 119
P 120
P 121
P 122
P 123
P 124
P 125
P 126
P 127
P 128
'- ----
r -_.-
I
I I I I I I I I I I I I I I r I
ACKNOWLEDGEMENTS
The assistance of the following personnel is gratefully
acknowledged in the work represented in this report:
Norbert W. Behringer
John E. Doyle
George J. Humbert
Albert P. Kretz, Jr.
Alvin McDaniel
Jerome W. Sands
I I I I I I I I I I. I I I I
I ~----
-1-
The evaluation of filters used to sterilize liquids
and gases encompassed not only filters themselves, but the
apparatus and procedure. In many cases the filters them-
selves were found to be adequate, but the equipment, such
as filtration assemblies, suggested for use were found to
cause failure, either because of inadequate seals or
fragility. Procedural difficulties were also encountered
in many cases due in part to difficulty in handling filters
and apparatus because of fragility or unwieldiness.
The course of investigation covered four broad and
major categories: (1) Testing of high efficiency particu
late air (HEPA) filters. Prior to the actual testing of
HEPA filters, it was necessary to evaluate procedures and
the effects of certain physical forces and their influence
on the ultimate data. These included aerosolizing means
and media, gravitational and electrostatic forces affecting
precipitation, fallout, and impingement, isokinetic relation
ships, and sampling means. (2) Evaluation of membrane
filters and filtration methods. (3) Evaluation of filters
and filtration of liquids under pressure. (4) Evaluation
of filters and filtration methods for sterilizing gases
under pressure.
I
·1 II I
II I I. II I.
f· II II II I
[I I
I
-2-
HEPA FILTERS
The Test System:
Fi gure 1 shows the schematic layout of the filter
test assembly. With the HEPA filter in place as shown,
and with polyethylene bags closing the far end of the pre-
and post filter, the entire assembly was sterilized with
ethylene oxide (EtO) gas overnight prior to testing of
HEPA filters during the subsequent working day. Sampling
collectors (Andersen and Reyniers), stationary and roving
probes, respectively, were attached to and within flexible
isolators. These were sterilized coincidently with duct
and attachments.
HEPA filters were sterilized in EtO apart from the
test system. Prior to sterilization these were wrapped
in polyethylene bags which were heat-sealed. The
presterilized filter (bag and all) was clamped in place
as shown. When securely in position, the retaining poly
bag was cut in circumference around the external filter
case. Then the film covering the exit face of the filter
was pulled out leaving the exit face exposed to the EtO
during sterilization of duct and isolators, but providing
a barrier via the inlet face which was still covered with
polyethylene. After sterilization, and prior to starting
the test system, the inlet plastic was removed to allow
air passage through the test filter.
I
I
-3-
The blower forced air through the 2' x 2' HEPA filter
under pressure. The HEPA test filter manufacturer's
recommended pressure differential was maintained to produce
the rated flow by adjustment of the baffle which is a per-
forated double plate arrangement where a moveable plate
slides over a fixed plate enlarging or partially closing
the perforations as required. The perforations are small
holes so distributed as to provide a very uniform flow of
air through the duct.
Three DeVilbiss #40 nebulizers were positioned cen
trally in the duct. These were fed the spore suspension
from the outside and clean filtered air under pressure
(10 psig) generated the aerosol.
Andersen Sampler # 1 was connected to an isokinetic
probe in the exact center of the duct, positioned 4 feet
from the DeVilbiss generators. Water gauges measured
upstream and downstream pressures. An Alnor hot wire
anemometer measured the flow rate continuously. RH and
temperature measurements were also taken continuously.
The Downstream Sampler #2 (either Andersen or
Reyniers) was also connected to an isokinetic probe
similarly located 4 feet from the filter exit face.
All of the preliminary work in evaluation of
aerosolizing, particle sizing, and sampling was done in the
upstream open segment.
I
I I
/1 I I
I, II I
II II II II II I II II
II
-4-
The Roving Probe and Sampler (Reyniers):
The Roving Probe consisted of a thin-walled metal
(Figure 2) tub e whose entrance was positioned within one
inch of the exi t face of the filter under test. The
contour and radius bend conformed to recommended standards.
In this case the bend was 90 00n a 6 inch radius. The
orifice was isokinetic with respect to the linear flow
velocity corresponding to the 50 cfm generally indicated
as rated, and a sampling rate of one cfm through the
Reyniers (8-inch diameter) Sampler.
The probe was attached to a machine drive (Figure 3)
which permitted horizontal traverse as well as incremental
vertical adjustments to provide complete coverage of
the exit face of the filter under test. There were 8
horizontal traverses for each complete cycle. For the
50 cfm filters, the orifice diameter was 1.25 inches.
This provided an overlap of 0.25 inches between traverses.
The close proximity of the orifice to the filter face and
the regions of overlap provided adequate assurance that, for
practical purposes, no viable particles penetrating the filter
would escape detec tion. In the case of the 1.25 inch diameter
orifice, the sampling aliquot of the entire area or volume
was 1/52nd.
The horizontal traverse was provided by a worm gear
and the vertical by air actuated cylinders. The complete
scan or cycle could be repeated a prescribed number o f
I -5-
times. The complete scan for this test series required
an elapsed time of eleven minutes and 28 seconds.
ESTABLISHING TEST PROCEDURES
Aerosol Production:
Atomizers of various types and manufacture were
tested from which one was chosen which seemed most
suitable from visual observations.
Among the nebulizing or atomizing units tested were:
1 - The Air Brush, Thayer and Chandler, Chica go, Ill.
This unit seemed to nebulize well, but would have required
special adaptations for mounting and for remote
operation.
2 - Astro Spray, 1700 series. An ultrasonic unit
which produced an excellent dispersion. Its pro-
duction was in much greater mass than required, and
furthermore, it dispersed in a lateral direction
making it difficult to prevent excessive impingement
on walls.
3 - Rotary Paint Gun, Electro Engineering Products Co.,
Chicago. A Rotary Disc Type. This unit was found
not suitable. Most objections are similar to # 2.
4 - DeVilbiss MBC Paint Sprayer. This unit was not
suitable. Particle size produced was too large .
5 - DeVilbiss. Type P-EGA Series 502. This unit
produced a better spray, but the quantity was too
great.
I I I I I I I I I I, I
[I I I
I
-6-
6 - Aerosol Cylinder, Aerodyne Corporation,
Emmetsburg, Iowa . Model EIOO EF3. The unit Vro
duced too much in quantity. It sprayed in a band
at great velocity.
7 - The DeVilbiss #40 (Glass Nebulizer) was chosen
for subsequent tests because it produced a fine,
almost imperceptible spray, unidirectional, and
in small quantity.
The ultrasonic dispensing device which was proposed
for the aerosol produc t ion in a pressure chamber for the
testing of in-line filters under pressure produced droplets
of very minute size, but required impractical volumes of
gas under pressure to operate .
Spore Suspensions for Aerosol Production:
Spores of Bacillus subti1is var. niger were suspended
in various media chosen to produce a dry spore aerosol
in an air stream . Such media were chosen on their ability
to nebulize well and to vaporize on dispersion; to main-
tain a stable, uniform, uncoagulating suspension; and to
preserve viability in storage .
Stock spore suspensions of these media in the range
of 10 7and 10 9 spores per m1 were ch ecked f o r stability of
viable numbers over a period of 6 to 8 months.
Spore suspensions were also tested for aerosol pro-
duction in the test system using the DeVilbiss Nebulizer .
I
~ I I I I I I I I I I
II I I I I, , I
-7-
The nebulized viable particles were dispersed in the 8" x
8" duct and the air stream was sampled via Sampler #1
(Andersen Sampling) (Figure 2). The duct was divided into
one-foot sections for fall-out determinations and measure-
ment of electrostatic deposition on the dielectric surfaces
of the walls. To determine the extent of the electro
static effect one one-foot section, midway between DeVilbiss
and isokinetic probe, was divided into 3 segments of 4
inches each. The central 4-inch segment consisted of an
aluminum foil band which was grounded to dispel purely
electrostatic deposition. Swab samples in this area were
taken to compare counts on the metal surface vs. th e
dielectric surfaces adjacent to it. Thus, pure gravita
tional or direct impingement effects could be discounted
in the electrostatic determinations.
Each surface of each one-foot section along the
length of the chamber was swabbed, top , bottom, and sides,
after each trial series. Calgiswabs moistened with sterile
distilled water were used to make these determinations.
Each 8 inch x 12 inch section was swabbed in en t irety.
Plate counts were made from the swabs.
Particle Size Distribution:
The dispensing rate of viable particle production
was set to generate appr oximately 250,000 per minute.
As indicated by the Ander sen Sampling, the particle
I
II I
I
II II I
II
II II I
II
:. II I
II I
II I
II
il I ) I I
I L_
-8-
size range of less than 3.5 microns consistently repre
sented around 98% of the viable particles recovered
(based on Andersen evaluation techniques) (Andersen, 1958).
Microscopic examinations were also made of the
collected particles. Since the agar surface of the
Andersen plates lends itself well for collecting particles
and for microscopic observation, cleaned glass slides
were imbedded in the Andersen plates under a very thin
layer of agar. To accomplish this a portion of the 27 ml
of agar medium was dispensed into the plate. After hard-
ening, the glass slide was positioned centrally on top of
this agar layer, then the remaining portion of agar was
dispensed to provide a thin layer over the glass slide.
Subsequent to collecting by the Andersen Sampler
(Figure 2), each slide from each stage was cut out of the
agar for microscopic examination. A thin cover slip was
placed over the agar on the slide, and the slide was
examined under oil immersion.
Where the methanol spore suspension was dispersed,
almost 100% of the refractile particles observed were
single and double spore units of a size range of 0.5 to
1.2 microns. This represented stages 4,5, and 6 for
the Sampler. Stages 1, 2 , and 3 showed primarily large
accumulations of dust of up to 10 microns and greater.
The dust apparently arose largely from flaking of the
Cambridge HEPA pre-filter and, no doubt, the 2 % or so of
II I
I
II I, II II
il II
il II il I
I
: ~ II I
-9-
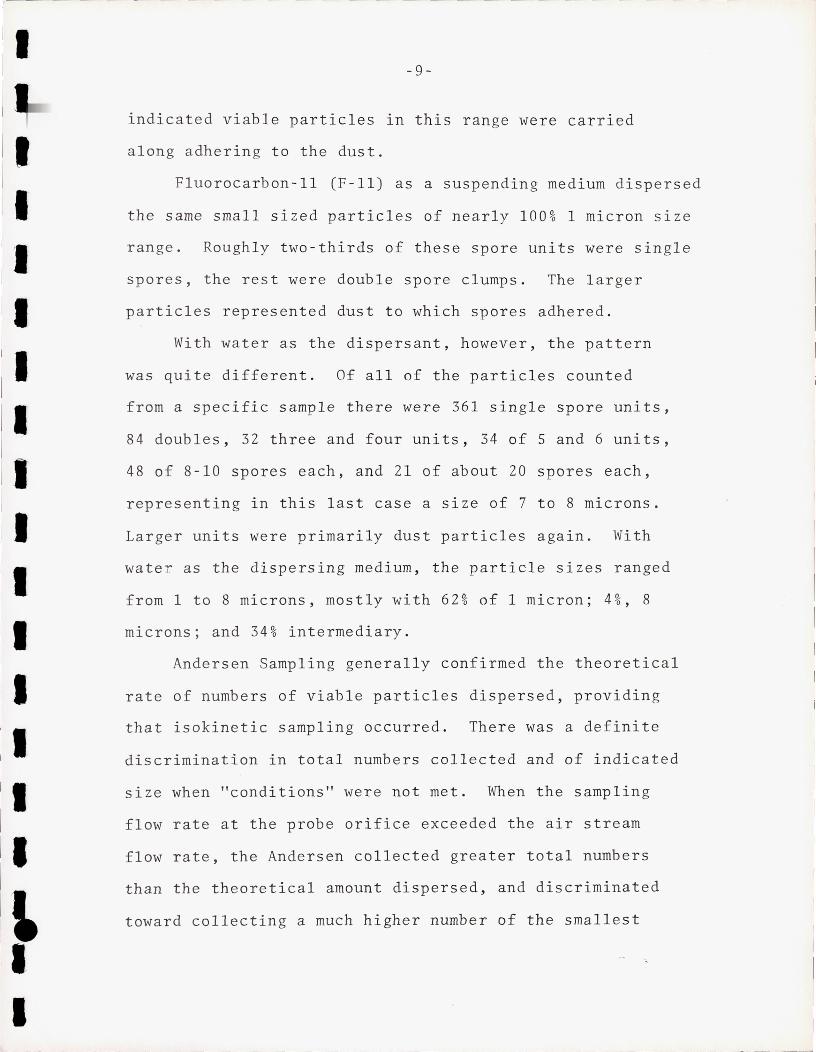
indicated viable particles in this range were carried
along adhering to the dust.
Fluorocarbon -II (F-ll) as a suspending medium dispersed
the same small sized particles of nearly 100% 1 micron size
range. Roughly two-thirds of these spore units were single
spores, the rest were double spore clumps. The larger
particles represen t ed dust to whi ch spores adhered.
With water as the dispersant, however, the pattern
was quite different. Of all of the particles counted
from a specific sample there were 361 single spore units,
84 doubles, 32 three and f our units, 34 of 5 and 6 units,
48 of 8-10 spores each, and 21 of about 20 s pores each,
representing in this last case a size of 7 to 8 microns.
Larger units were primarily dust particles again. With
wate r. as the dispersing medium, the par t icle sizes ranged
from 1 to 8 microns, most ly with 62% of 1 micron; 4%, 8
microns; and 34% intermediary.
Andersen Sampling generally confirmed the theoretical
rate of numbers of viable particles dispersed, providing
that isokinetic sampling occurred. There was a definite
discrimination in total numbers collected and of indicated
size when "condi t ions" were not met. When the sampling
flow rate at the probe orifice exceeded the air stream
flow rate, the Andersen collected greater total numbers
than the theoretical amount dispersed, and discriminated
toward collecting a much higher number of the smallest
r -
I
I I I I I I I I I I I
I
-10-
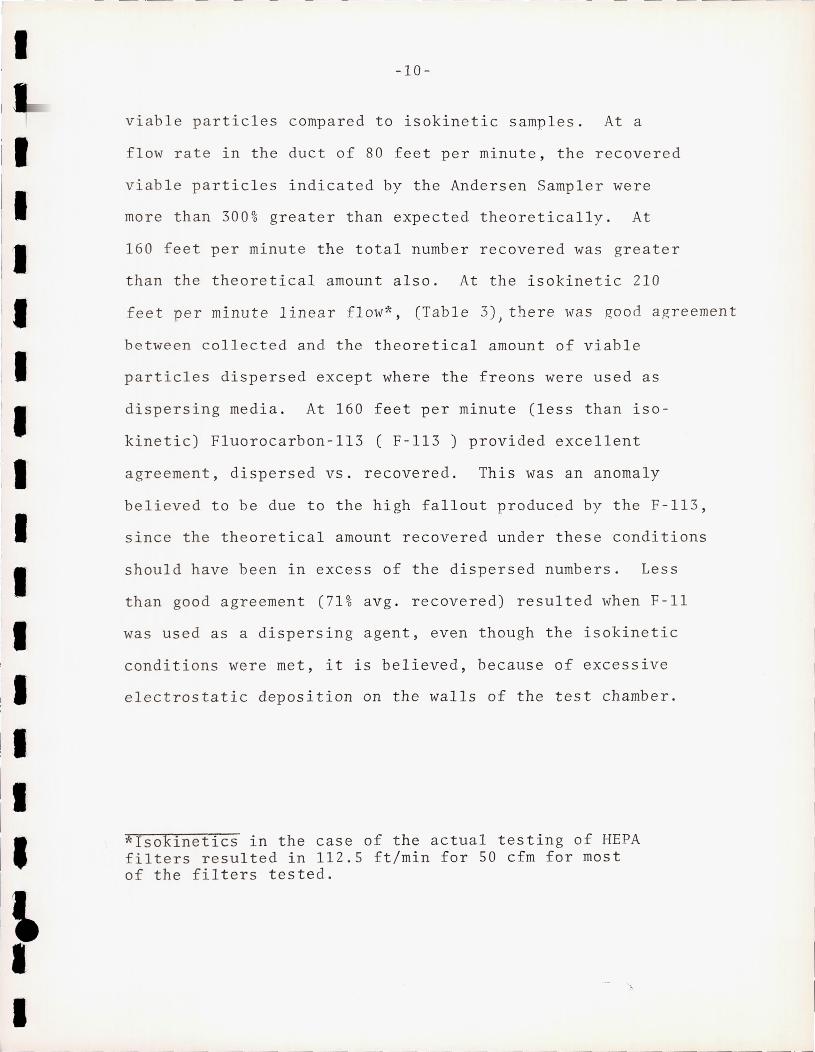
viable particles compared to isokinetic samples. At a
flow rate in the duct of 80 feet per minute, the recovered
viable par ticles indicated by the Andersen Sampler were
more than 300% greater than expected theoretically. At
160 feet per minute the total number recovered was greater
than the theoretical amount also. At the isokinetic 210
feet per minute linear f low*, (Table 3), there wa s good agreement
between collected and the theoretical amount of viable
particles dispersed except where the freons were used as
dispersing media. At 160 feet per minute (less than iso
kinetic) F1uorocarbon-1l3 ( F-113 ) provided excellent
agreement, dispersed vs. recovered. This was an anomaly
believed to be due to the high fallout produced by the F-113,
since the theoretical amount recovered under these conditions
should have been in excess of the dispersed numbers. Less
than good agreement (71% avg. recovered) resulted when F-1l
was used as a dispersing agent, even though the isokinetic
conditions were met, it is believed, because of excessive
electrostatic deposition on the walls of the test chamber.
*Isokinetics in the case of the actual testing of HEPA filters resulted in 112.5 ft/min for 50 cfm for most of the filters tested.
I
I /1 'I I
II
:. II ,I
II I ,I 'I I I
I
~ ,I I
I
-11-
Gravitational and Electrostatic Effects:
Numbers of viable particles recovered by swab sampling
from the grounded foil band, 4 inches in width, as compared
to the adjacent dielectric surfaces indicated various
electrostatic deposition patterns. Gravitational influences
were also noted. For example, in the case of water as the
dispersing medium, very little deposition occurred on the
sides of the column and hardly any on the top. Depositional
difference due to electrostatic forces was primarily noted
on the bottom section. As stated previously, water produced
larger particles. These particles would be presumed to .
have a lesser charge to mass density because the transit
time was too short to reduce particle size by evaporation.
Therefore, normal gravitational influence was only slightly
augmented by electrostatic forces.
A similar situation resulted in the methanol system.
Since the viable particles produced were almost 100% in
the 1 micron size range, a high charge density might be
expected. It was discovered that deposition of viable
particles by electrostatic forces on the dielectric chamber
were somewhat greater on the side walls than on the top, and
were decidedly greater on the bottom. Methanol seems to be
intermediary in these respects, having a greater apparent
electrostatic deposition than water, but less than F-ll.
Gravitational deposition was also influenced by relative
vapor densities of the dispersing media. This was partic-
ularly evident for F-113 which has a relative vapor-
II I
I
II II
i' II II I, I rl II I, :. II II I
II
:. I
I
-- ~ -- - - - - - -- - - - - ---_. __ .-
-12-
density of above 6. It was less apparent for F-II with
a vapor density of s. Methanol has a vapor density
slightly greater than one (air), but which is almost twice
that o f water vapor. Thus, a very large apparent fallout
occurred with Freon-113 as dispersant because this heavy
carrier tended to separate from the lighter air stream.
This agent, carrying viable particles entrained in it in
a downward sweep, caused a downward direc t ional impinge-
ment. The electrostatic forces were so great on the
Freon-ll dispersed particles as to cause the electrostatic
pattern to be most graphically noted in the top sections.
And deposition generally was so much greater in all areas
as to remove significant numbers of viable particles from
the air stream, resulting in an abnormally low viable
recovery (75 % of theoretical).
Characteristically , ln all cases, most viable
particles were collected in Andersen Stage #5. For methanol,
the next highest count occurred in #6 then #4. For Freon-II
next to #5 a higher count invariably occurred in stage #4,
then #6. In all cases except for water the stages 4,5, and
6 accounted for over 95 % of the total number of viable
particles recovered. From all of the considerations men-
tioned there appeared to be an anomaly. The Freon-II
Andersen pattern seemed to reflect a similarity to a
greater-than-isokinetic pattern, this is due in part to
I
I
I I
I
I I
I
I
I
I
I I I
I 'I II II
f· ' I :. II II I II I II II I
II
I II
- 13-
the strong directional electrostatic forces, as indicated,
which would tend to selectively remove the smallest part-
icles.
Methods of Collecting Viable Particles:
Andersen Sampling techniques were compared with liquid
impingement methods and found to be far superior. The
impingement technique was found to be much harder to handle
and to control, and was far less reliable. Whereas it was
expected that particles would break up on impingement
(USPHS monograph No. 60), far below the theoretical amount
of viable particles dispersed were recovered by impinge-
ment techniques. This was, no doubt, due in part to the
fact that most of the particles were already of unit size
in the methanol DeVilbiss system. These results confirmed
what was also discovered by experience, that liquid
impingement does not seem to entrap viable particles as
readily as impaction methods.
Concluding Statements in Establishing the Test System:
Methanol was chosen as the dispersing agent for the
evaluation of air filtration systems for use in the
DeVilbiss #40 unit described because it produced viable
particles of almost 100% single and double spores units
of the size range 0.5 through 1.2 microns. The methanol
spore suspension was stable for storage. Electrostatic
and gravitational forces were minimal influences on the
L_~ __ . ______ . _________ _
1- -
II I ..
I
II II I
I I · II
:. II
II II /1 II' I,
I
I
-14-
viable particles released from this dispersing medium and
the theoretically dispersed numbers were recovered by
the Andersen technique.
F-113 was disqualified because it was observed to
be slightly toxic to the spores in suspension. It also
greatly augmented gravitational fall-out.
F-ll was disqualified because it produced more
highly charged particles than the other suspensions tested
causing a greater depression in the number of viable part-
icles recovered because of electrostatic particle deposition
on the dielectric walls of the plastic channel.
Water was ruled out as a suspending medium for 2
reasons; because it did not produce uniformly sized part-
icles, and most of the particles were above 2 microns in size.
The Andersen sampling technique seems to be excellent.
And if used according to specifications, will provide data
more meaningful with respect to sampling of viable particles
in filtered air streams in large numbers than any other
method short of using elec tronic devices in conjunction
with it. It is furthermore recognized that the measurement
of particles, e specially viable particles, can be influenced
by many and diverse environmental circumstances.
Some of the adverse fea tures of liquid impingement
samplers as compared to Andersen are as follows:
1. The smaller sample volume reduces the probability
of obtaining a representative sample, since the
r-- - - --
I I
I" I II I I. :1 I :. I I I
II II I -
I I
il II
I
~ II
I ,-
-lS-
ratio of sample to total volume 1S decidedly less
than the Andersen.
2. Low levels of viable particle contamination are
not likely to be detected in liquid impingers
since the sampling time must be shorter because
of liquid evaporation .
3. Liquid impingers are more difficult to prepare,
more fastidious to operate, and require careful
consideration in assay of liquid losses if
aliquots are taken.
4. It becomes increasingly more difficult to
stoichiometrically collect particles of smallest
size by liquid impingement methods .
S. Total numbers only are indicated, and in high
velocity samplers, particles are fragmented.
Thus, liquid impingers usually show abnormally
high numbers where large particles predominate,
and abnormally low numbers where small particles
predominate.
On the other hand, the Andersen is easy to operate,
is quickly assembled and disassembled, is reasonably
accurate, and indicates the spectrum of size reasonably
well.
Reasonably good agreement was found between Reyniers
Slit Sampler and the Andersen where low numbers of viable
particles per unit time were recovered. In the low
r
II I
'I I
il II I I II I
'I I I
II II I
I
-16-
numbers, the Andersen tended to pick up larger numhers of
particles, perhaps due to the wider range of discrimination.
The lower numbers on the Reyniers could also have been due
to coincident impingement. The Reyniers was therefore
chosen for the Roving Probe , since size discrimination
was of l i ttle importance in exit face sampling. Both
Andersen and Reyniers Samplers were used as back up
evidence in Sampler # 2.
Much of the evidence and conclusions resulting from
establishing the test procedures are documented in the
discussion to follow in the actual testin g of HEPA filters.
HEPA FILTER EVALUATION
The testing of the 70 HEPA fil t ers required over 80
test procedures. These were subjected to challenge
by viable particles of Bacillus subtilis var. niger spore s
suspended in nearly pure methanol and dispersed by 3
DeVilbiss #40 Nebulizers producing particles nearly 100 %
in the 0.5 - 1.2 micron size range within the 8" x 8" duct
diagrammed and described in the previous discussion.
The Challenge :
Figure 4 compares the distribution s of those viable
particles dispersed vs. those collec t ed via Andersen
Sampling and MPN estimates. Although there seems to be a
fairly wide distribution of Andersen counts, the mean and
I
Ie I I I I 'I I I I I I I I
il II
1& I I
-17-
median values are in good agreement with those actually
dispersed (2.5 x 10⁵ Andersen vs. 2.46 x 10⁵ dispersed -
arithmetic averages). Andersen sampling ~roduced higher
counts generally (Table 1) as shown from indications of
downstream (Table 2). Thus, the median and
arithmetic mean in both distributions indicated a viable
particle challenge very close to 250,000 per minute.
Table 3 is a collection of representative Andersen
counts which demonstrates the collection pattern as com-
pared to Andersen cascading stages. Consistently, the
highest counts were recovered in stage #5, followed by
#6, then #4 with 98% of the upstream total counts falling
in stages 4, 5, and 6; 93% in stages 5 and 6; and 68% in
stage #5. Although, the total count varied quite widely,
the recovery pattern was very consistent. It is interesting
to note that 100% of downstream samples were collected in
stages 4,5, and 6 of which 98.2% were exclusively in
stages 5 and 6.
The Roving Probe Monitor:
The Roving Probe Orifice was designed to be isokinetic
for 112.5 linear ft/ min (equivalent to 50 cfm ln the 8" x 8"
duct). Linear velocity profiles across the face of the
various filters varied from zero to over 900 ft/min. The
orifice also scanned within one inch of the filter face.
Thus, the tendency was to oversamp1e, especially at
the low velocity edges, providing thereby a built-in safety
"
I ..
I
[I I
I I I
il II I. I
fl II I, I /1 II
i. i I I
-----
-18-
factor, assuring than any contamination penetrating the
filter would have a better-than-average chance of being
detected. The design of this orifice was such as to
sample 1/52nd of the area and/or volume of the effluent
stream. Each filter was challenged for a period of
approximately 2 hours. Single or multiple samples were
taken via Roving Probe using Reyniers Slit Samplers
during this period. Control samples were taken sans challenge
to determine the base contamination level, if any. For
the most part, the base contamination level was zero, since
the downstream channel and isolators containing the
Samplers were sterilized with ethylene oxide gas daily.
If contamination was picked up by the Roving Probe,
although all the evidence seems to indicate this was not
the case, it may have affected the ultimate penetration
factor upon which filter efficiency was calculated. Where
it was suspected, these specific filters were retested.
The roving probe cycle time was 11 minutes, 28 seconds
average. The 1.25 diameter orifice scanned the 8" x 8" face
in eight traverses per cycle. There was therefore a 1/4 inch
overlay between traverses, producing again a greater-than-
average assurance of not missing penetrating viable part-
icles, especially at low velocity edges.
Downstream Sampling:
The Reyniers was used consistently with the Roving
Probe. A stationary probe was also situated 4 feet beyond
-- - -~---
I ,
f
[. II I rl I II I i. I. ,I 'I I il
I I ;il JI
II. I I
-19-
the Roving Probe centrally in the duct. Table 2 compares
viable particle counts sampled via Roving Probe vs.
Stationary Probe using either Reyniers or Andersen
Samplers. Compared to the Roving Probe counts, the
Stationary Slit (Reyniers) was decidedly low (64 %) and
the Stationary Andersen, decidedly high (140%). Strangely
enough, the overall average was in close agreement, 21.66
vs. 22.18.
Environmental Controls:
Every precaution was taken to prevent back contamina-
tion, and every means to detect such, if any, as well.
Ethylene oxide sterilization of each filter sealed in a
polyethylene bag was accomplished apart from the "system".
The system, duct and enclosures, completely isolated from
the area with plastic film, glove ports, and entry ports
were nightly sterilized with ethylene oxide with the filter-
to -be-tested on the following morning in place. The agar
plates for fall-out determinations and samplers were filled
with sterile agar media from outside of the isolator which
was introduced through sterile tubing via sterile media dis-
penser. Hood environment control samples were taken with
fall-out plates strategically located, and with both
Reyniers and Andersen Samplers. Samples were taken prior
to and during challenge. The fall-out plates were
negative 92.6 % of the time. The positives were usually
single colonies per plate' (large 8" plates were used).
f .-I r
JI (I I
II II f. I. rl I I I I I
-20-
Eighteen out of 243 samples were positive. The sampling
of the environment prior to challenge proved no correlation
with roving probe sampling prior to challenge. Since the
isolator system was presumed sterile in the A.M., no attempt
was made to sterilize prior to P.M. testing, except that
the duct itself with filter in place was exposed to
ethylene oxide for circa one hour . Every indication points
to the fact that the filters contributed to environmental
contamination, but not vice versa. (Tables 11 through 17
compared with Tables 18 through 24).
Filter Efficiencies Compared :
Table 1 is a compilation of facts taken from
Tables 4-10 and Tables 18-24 inclusive. The rating A-F
excellent to poor, are given by the author of this report
in Table 25, and are based on numerical considerations
only as efficiencies are compared with differential pressures,
flow rates and uniformity of results .
It is felt that such HEPA filters should be at least
99.9999+% efficient for the size range of viable particles
indicated. Two filters were inadvertently damaged in
handling. These did not influence the overall interpre-
tation.
I
I I
I ____ J
I-~ ~- -
II
'-I I I I I I I I I I I I I I
, I
II
-21-
The Roving Probe and the Velocity Profile:
A hot wire anemometer detection device was fashioned
by the principal investigator for the Kretz and Ernst
(1966) Roving Probe. It was quite surprising to observe
that a close proximity velocity profile provided a trace
that was characteristic of the filter showing convolutions,
dead spaces, edges, high velocity . peaks, etc., which could
be duplicated invariably (like a finger print) many times,
as is shown in Figure 5. (The same pattern was actually re
traced) using different colors of ink, as many as five
times ).
The velocity profile is a combination not only of
the air velocity traversing the filter, but also of the
Reyniers sampling rate of 1 cfm. Therefore, the velocity
profile in these instances will never show zero, but
always in the vicinity of 112 linear ft per min. or higher.
Figure 6 compares the velocity profiles for two types
of filters by the same manufacturer, the principal variation
being a minor difference of construction to make filter
I-B-l fire resistant. A high degree of similarity is
apparent. The difference is only in the fact that aluminum
separators were used rather than paper. The same filter
media was used in both types. Paper separators may have a
greater retarding effect on the air stream linear velocity.
I
I I I
II I I I I I I I I I I
il
:1 II
-22-
There is an apparent difference in patterns when
Figure 6 is compared with Figures 7 and 8. This is
no doubt due to the fact that different air velocity scales
apply to the latter two figures. Similarity is again
apparent between HEPA types I-A and I-B.
The similarity observed in the types A and B of I is
not observed as well for types A and B of manufacturer II
(Fig.9). Close observation does reveal internal manu-
facturers similarities if one bears in mind that the two
filters of II are radically different. Type B is made of
combustible materials (wood frame and paper-glass fiber'
filter media) whereas type A is ceramic using ceramic
asbestos filter media. The convolutions in the manufacturer
II filter are not nearly as apparent as the other manu-
facturers'. However, these filters were the most uniform
and consistently of high efficiency filtration characteristics.
A general rule which seems to apply is that where wide
velocity differences do appear, such as with filter types
lA, IB (Figures 6,7, and 8), lIB (Fig.9), and IlIA ( Fig. 11),
there is a relatively high coincidence of contamination
penetrating the filters.
Comparing Velocity and Contamination Profiles:
Figures 7 and 8 show contamination pat t erns of colonies
of B. subtilis arising from the petri plates by Reyniers
sampling via the Roving Probe mechanism . Each circular
I
~ II II I I I
I I I I I I I I I I
I
-23-
plate shows the accumulated contamination from 10 complete
traverses of the filter face. The bars of the graphs (Fig.7,8,10)
depicting the number of viable particles related to incre-
ments of traverse represent the total of the ten cycles.
This was done to vrovide greater variance. The bar graph
was placed at the mid point of each quarter increment of
traverse. An increment of traverse, for the purpose of
this report, is one scan from one side of the 8" filter
to the other side. There were 8 increments of traverse per
cycle and 10 cycles per filter test; the total filter test,
therefore, accumulated 80 horizontal increments of traverse.
The areas between 0 and 1, and between 7 and 8, as well as
in the region of each number incremental position, denote
occluded filter edges, bottom, top and sides respectively.
In examining Figure 7 an edge contamination pattern
seemed to be apparent for filter l-A-S. Velocities varied
quite radically from nearly zero to 900 ft/min. across the
face of the filter. These velocities were determined in
close proximity to the filter (about 1/8 inch from filter
matrix) by an Alnor hot wire anemometer. Such great diff-
erences were not measurable at the distance of 1 inch from
the filter face, where the isokinetic probe of our design
was measuring velocity. The anemometer filament was placed
1/8th inch in front of the isokinetic probe and was strongly
influenced by the 112 linear feet per minute sampling rate
of the Reyniers sampler. Thus, the lowest velocity points
I. ..
[I I I I I I I I
II I I
II I
I I
~ I
-24-
are coincident with a flow of 112 feet per minute which was
isokinetic for the 50 cubic feet per minute filter-face
average velocity. For this reason, along the very low
velocity edges of the filter, the sampler would pick up its
sample from a much wider area than when the roving urobe
was in or near the center of the filter matrix. It was
very difficult to measure the exact origin of contamination
from any point on the filter surface because of the rel
atively rapidly scanning probe and the relatively slowly
moving clock of the Reyniers Sampler.
To determine exactly contamination points on the
filter face was impossible. However, it seemed to be quite
apparent from analysis of the considerations that the
leak was alon~ the top and left edge, since the probe tra
versed along the top from right to left and down along the
left edge in the 7-8 region . (the last increment) to begin
another sequence in the 0-1 region from left to right in
the first increment. The traverses were alternating direct
ions throughout the cycle. Although there may have been
some leakage through the filter matrix, it is almost im-
possible to so state with certainty.
Whereas filter l-A-S seemed to demonstrate an edge
leakage effect, filter l-B-5 (Fig.8) seemed to show a great-
er degree of mid section contamination. The effective
I
I ~ I I I
II II /1 I. /
il il
i. II I. I
I
I
-25-
filtration area was extremely small for filter types IIIH
of which III-B-4 is an example (Fig. 10). The sealing com-
pound was extended so far in toward the mid section as to
radically reduce the filtration area. The velocity profile
shows this. Thus, between traverse increments 0 and 1, the
scan along the bottom edge shows no contamination picked
up. However, where the sealing compound leaves off, con-
tamination is picked up along the bottom. Between 6 and 8,
the top sealing compound area, very little contamination
appears.
Conclusion:
In the evaluation of HEPA filters for filtration
efficiencies for vi able particles much consideration and
attention must be given to test methods and procedures.
Prior methods, which used inadequate dispersing means,
used water as a dispersing medium which tended to discrim-
inate toward favorable test results, even in cases where
viruses were used since water droplets of less than 9
microns in diameter are almost impossible to achieve. Water
droplets, if dried down, can produce highly charged, but
fairly large and heavy coalesced viable forms which tend
to fallout of the stream and attach themselves to dielectric
surfaces.
In the testing of various dispersing spore suspensions
for the production of adequate and uniform aerosol particles,
I I
,I I
I
-26-
methanol was found to provide the best overall characteristics,
producing very uniform single and double spore particle units
of 1 micron and less and producing minimal adverse electro-
static effects. Furthermore, this suspension produces dry
particles for impacting the filter matrix. The DeVilbiss
Vaponefrin nebulizer was proven the most effective means for
dispersing the viable particles.
Because of the high efficiency characteristic of the
HEPA filters, it is necessary to subject them to high levels
of contamination to make efficiency calculations meaningful.
Because the level of particles penetrating the filter is
generally so low, sterile environments must also be provided
for the testing. Only a relatively few organisms entrained
in the downstream sample, arising from a contaminated en-
vironment, could make a filter look ban.
The evaluation of HEPA filters can be based on many
factors. Of course, filter efficiency is the best criterion.
But some manufacturer's types of HEPA filters demonstrated
a wide variation in efficiency; some were poorly constructed,
as demonstrated by edge leakage; some had the effective
filtration area critically reduced by their sealing methods
necessitating much higher velocities in the central regions
to maintain the rated capacity. Under these conditions one
could expect greater chances for filter matrix damage and
poor air velocity distributions.
r- ---- - - ---
i il
I :. '. I I
il i. I
II
"
I
-27-
A great deal can be learned ahout filter efficiency
from velocity profiles hy comparing high contamination
areas, as detected by biological sampling, and velocity
profiles obtained by the roving probe mechanism. Thus,
HEPA filters can be eVRluated and compared by visual
inspection; by efficiency determinations using adequate
and effective methods of microbial challenge; and hy use
of the velocity profile, which serves as a fingerprint of
the filters characteristics both good and bad.
The results of the HEPA filter tests has been reward-
ing with respect to the new technology gained but dis-
appointing with respect to the performance and character-
istics of the filters themselves. Primarily, HEPA filters
are relatively very unreliable, and only a circa 70-80 %
are as claimed. The uniformity of qURlity is very un-
certain for most manufactured types tested.
Further, a great deal of care and caution must be exercis ed
in their use. The need for better HEPA filters of greater
reliability is indicated by the test results. Only a single
viable particle is dangerous in an environment which will
favorably allow it to reproduce to great numbers. This
possibility exists and high efficiency may be meaningless
in a situation where a highly charged bacterial vegetative
cell or spore may come within close rroximity, let us
say, to a dielectric surface like plastic tubing, stoppers,
or syringes which may later be placed in a favorable
1----- -
I I I
I
I
I I I I
[I I I
i. II
I-'I I
II il II I
I I II it I
-28-
environment for growth (such as the human body or exudates
thereof) (Ernst and Kretz, 1964).
_ J
(
I I I r
r
I II [. II I i l II I, I II
II ,I ,I I I
il I,
-29-
MEMBRANE FILTERS
Evalua t ion of th e 47 mm membran e filters was accom-
plished within a sterile env ironment, a flexible plastic
isola tor steri l ized be tween operations with a 16 hour or
longer expos ure to gaseous ethylene ox ide (Etn) at room
temperature. Filte r holders, funnels and 2000 ml vacuum
collection flasks were stearn sterilized prior to use .
Each unit assembly was used only onc e f or a single filter
test. The filter assemblies were wrapped in hand towels
for stearn sterilization. These were then placed in the
isolator unopened. The vacuum flasks were cotton-plugged
and covered with f oil f or stearn sterilization. Media and
distilled water we re stearn sterili ze d, securely capped
and placed in the isolator along with ancillary equipment.
Individual f i lters were separately packaged in either
polyethylene film, paper, or nylon and stearn sterilized
if recommended , or ethylene oxide sterilized prior to
placing in the isolator. The isolator and contents were
then EtO sterilized .
An 18 to 24 hour culture of Serratia marcescens (Sm)
was used to make up 1 ml s uspensions in sterile screw-cap
tubes of 3 x lOS/mI. These were used to contaminate liter
portions of sterile dist ill ed water to provide a contamin
ation level of 300 Sm per mI . The contaminated water was
fed to the filter funnel by means of tubing originating
on the outside of the isolator. The filters were
fl [I 'I I /1 II f
fl [. II I 11 :. :1 I II, I I
rl r II I
-30-
individually challenged with this one lit e r contamination.
The contaminated water was drawn through the filter via
an outside vacuum source connected with sterile tubin g
fitted with a cotton plug filter to prevent backflow con -
tamination . Bacillus subtilis var. niger CBg) spores were
taken fr om stock suspensions to provide similar liter
porti ons o f challenge.
Media for 8m was trypticase phosphate broth (Zimmerman,
1962) and trypticase soy broth for Bg. Preliminary work,
using these media, demonstrated by MPN techniques that they
were capable of providing outgrowth for each organism in
concentrations of less than 2 microbes per 100 ml of media.
Counting methods were not used in the evaluation of
membrane filters since the ultimate goal was the exclusion
of all viable particles. It was, however, necessary to
detect as low as 1- 2 microbes that may pass through a
filter matrix to provide an adequate sterility test. The
media was prepared triple strength. The one liter filtrate
would then dilute the concentrated media to normal strength.
After filtra tion, the flasks containing the 1500 ml media-
filtrate were plugged with sterile cotton and incubated at
370C overnight. If growth was observed, subcultures were
used to identify the organism, If no growth was ohserved in 48
hours, the flasks were incuba ted with 8m or Bg to determine whether
Or not the medium would still support ~r ow th.
Various control procedures were initiated to prevent and
to detect cross-contamination. Two filters of each
--- -- ------- -- _____________ J
II I
I ,
f,
il )1
I. il
II II
rl
JI
II :. I
II
I I r I
-31-
set being tested were subjected to sterility test procedures.
These were aseptically transferred to Sabouraud broth for
incubation at 2S oC and to thioglycol1ate and trypticase soy
broth for incubation at 37 0 C. Every filter membrane thus
tested proved sterile. A flask of media from each test
set was incubated as a sterility 'control check. A procedural
control was also instituted where uncon t aminated sterile
distilled water was passed through the membrane into the
triple strength media to determine if any contamination
would be introduced from the environmen t by procedure or
transfer technique. Other controls such as fall-out plates
were used. All controls were 100% effective.
Results:
Physical and chemical characteristics of the membrane
filters appear in Tables 30-32 inclusive. The dynamic
characterjstics such as flow rates appear in Table 32.
These data were compiled primarily from manufacturers'
literature as well as from personal communications. Char-
acteristics of the Schleicher and Schuell were very closely
related to Millipore and Gelman major types. The Selas
Metal membrane filters proved to be so undesirable that a
listing of their characteristics was considered unnecessary.
In preliminary tests the Millipore filters tested in
Millipore holders (Table 27) gave consistently good results
except the 8 . 0 micron size, which was as expected. The
Gelman holder (Fig.14) gave consistently poor results.
r - - - -
I. I I
II /1 II I
i l I, I
II I I I II I, I II I. 'I I I I I , I
'--- ---
-32-
The Schleicher and Schuell filters of Table 28 were also
comparably good with the exception of MC-4. An unusually
high variation in filtration time was evident.
Table 29 shows the results of the testing of Gelman
filters. Again the Gelman holder was suspect. Filter
type GA-6 was found to be so outstanding in reliability
(Table 33) that it was used for a control study to determine
whether or not the low incidence of unsterile results
generally noted was procedural. The Selas Flotronic
Metal membrane filter, regardless of pore size, produced
consistently unsterile results (Table 34). However,the
Millipore, Gelman, Schleicher and Schuell (S & S), except
MC-4, showed up excellently where either the Millipore
or the S&S assemblies were used. Figure 13 shows the Gelman
glass apparatus which gave consistently poor results
(See also Tables 35 and 36). Table 36 shows that the un-
reliability of the Gelman holder may be obviated in the
double filtration assembly configuration where a Gelman
and a Millipore assembly are used in combination.
Millipore Filter Specifications; Taken from the Millipore
Data Manual ADM-20.
Millipore filters are porous membranes composed of
pure and biologically inert cellulose esters. The type
HA and GS have pore size variability of ± 0 . 02p and thick
ness of ISO p ± 10 P and 135 p ± 10 p, respectively. The
porosities are also respectively 79 . 5 ± 0 . 5% and 74.5±
I
I
I I
I I I
I
I I
I I
I I
I
I I
I I I I I I I I ,
II
-33-
0.5 %. Extrac tables are less than 3%. They are h ea t
resistant to l 25 0 C. The bubble point no. for HA is 32 psi,
and 55 psi for GS.
Gelman Membrane Fil ters (Gelman, 1965):
Metricel is the name given the largest category o f
Gelman membrane fil t ers . Metricel filters are made o f
vinyl, alpha cellulose, and cellulose triacetate . They
all have these characteristics:
1. Thicknes s 0.005" - 0.006"
2. Absolute physical integrity -- no fibers to mi gra te
under heat or pressure.
3. Surface openings are of consistent, measurable
pore size.
4. 85% void space. This sponge-like structure of the
membrane s, leaving void space, results in faster
flow rates than would normally be exp ec ted with
such small pore sizes. Ge lman membrane filters
are all manufactured in a controlled environment
as set up accordin g to Fede ral Standard 209.
Schleicher and Schuell Memb rane Filters ( Schleicher and
Schuell, 1963):
Schleicher and Schuell membrane fi lte rs are produced
from pure cellulose or derivatives and have an extremely
uniform micropore structure with a very smooth surface.
The pore size of the different types range from 5 mill i -
I
II II I I I
il II I
I I I I I I I I I Ir
I
I
-34-
microns to 10 microns. The thickne s depends upon the
permeability or pore size and ranges from 70 to 1 50 microns.
Discussion:
An interestin g paper has recently appeared in the literature
regarding the sterilization of liquids by filtra t ion,
reported by Portner, Phillips, and Hoffman (196 7) . The
nature of results obtained and the difficulty experienced
with various techniques and apparatus used were very simi lar
to those which are reported here.
In our testing of membrane filters, procedural cont r o ls
were always negative and the recovered and microscopically
examined growth was invariably the test organism. Nonethe-
less, fur ther precautions were taken. In addition, the
one filter type which gave consistent negative results
(Gelman GA -6, 0.45M, tested with 8m) was tested an addi tiona l
30 times using exactly the same techniques to increase the
statistical reliability of the procedures and the validity
of using GA-6 as a control fi lter.
Difficulties were encoun tered because o f the character -
istics of vari ous types of apparatus. A typical example
is the metal Gelman filter holder (Figure 14) which evid-
ently serrated the membranes. Similarly, tension was not
great enough on the Ge lman glass apparatus ( Figure 13) to
prevent leakage. The glass membrane filter holders were
generally quite fragile and were greatly subject to damage,
resulting in leakage. The 8 & 8, B-ll, Gelman GA-8 and
I
I
,I II II II I I I I I
II I I I I r
II I
-35-
Gelman VM-6 were particularly vulnerable to damage by the
sharp edge of the Millipore glass funnel.
The most reliable filtration apparatus tested was the
stainless steel funnel and holder of S & S (Figure 13).
The most reliable membrane tested under vacuum was the Gelman
GA-6. However, for most of the filters tested there was a
very high order, circa 95%, of reliability. Nonetheless, double
filtration seems to be a necessary means for assurance of a
sterile produet even when the most reliable apparatus is
used.
There was little correlation between differential
pressure, length and spread of filtration time, and the
ultimate results. In some cases where filtration occurred
most rapidly, the ~ P was least, but this was not implicated
in the unsterile results. Filtration rates of certain
filter types varied widely, indicating wide variation in
pore size. Differences in flow rates were not apparent
between different manufacturer's comparable types, in com-
paring the consistently good membranes.
In addition, the following generalizations could be
stated:
1) Autoclavable filters tended to shrink when so
sterilized.
2) Generally, vegetative cells and spores seemed to
provide similar test results.

1.------[I
-36-
I 3) Sterilization of liquids by membrane filtration,
to be successful, requ ires awareness of problem
I areas and the exercise of reasonable care.
I I I.
II I
[I I
I I I
!I II 'I I I
[, :1 I
--
I I il :. il I I I
-37-
EVALUATION OF FILTERS AND FILTRATION OF LIQUIDS UNDER PRESSURE
The evaluation of filters and systems under liquid
pressure presented some problems concerned with the frag
ility of the membranes as well as leakage .
The Horman Company Filter
This filter shown In Fig. 16 is a glass fiber asbestos
mat of 140 mm diameter and 4 mm thickness. The filter mat
is clamped in place and the liquid is pressurized by air
in the glass reservoir. This filter was tested as shown
in Fig. 17 under both vacuum and pressure. The results,
within the limits of our test (Table 37) were excellent in
both cases. This method is easy to use, reliable, and
rapid for the sterilization of intermediate volumes of
liquid.
Method:
Snecial pressure apparatus which included a pressure
gauge, valves, a pressure regulator and piping connections to
the pressure fil ter holders . ( Figures 18,19, and 20) was
fabricated to contain the bacterial suspension. The pressure
apparatus was entirely flushed and steam sterilized prior
to use. The assembly of filter elements in the filter
holders was accomplished within a sterile hood at which
time the receiving flask containing the triple strength
[I I
I-II
I
il I I
II I I f
I; I
-38-
growth recovery media was fitted to the apparatus.
Three series of tests were run. In the first series,
the membrane filters were tested using the r,elman holder
and the designated maximum pressure and pressure differential
of 200 p.s.i.g. In the second series, the Millipore
holder was used under the designated maximum pressure and
differential pressure of 100 p.s . i.g. To obtain a more
reasonable comparison of filter response under a nominal
pressure and pressure differential, all the filters desig-
nated in the subject contract were tested at 10 p.s.i.g.
in the third series of tests . The test organisms used
in these series were Bacillus subtilis var . niger spores.
The special pressure apuaratus was modified to
hold two filter holders in series for the second
portion of this study. Since the Gelman filter was rated at
the higher pressure, it was placed in all cases first in
the series. In the program for the two-in-series tests,
5 units were run at 100 p.s.i . g. and 5 at 200 p.s.i.g. using
the test apparatus illustrated in Figure 20.
Results:
The Selas Flotronics Co. stated by letter that the metal
membrane, if properly supported, would withstand 15,000 p.s.i.g.
They recommended the use of the Millipore holder for the
tests. These membranes proved to be inefficient under all
of the series of tests regardless of pressure, but when
___ _ J
II I
II
I I
II I I I
i l 'I I
II II I
/1 I
'I I I
I I
-39-
subject to tests of 100-200 p.s.i . g. they invariably blew
out. Millipore invariably blew out at 200, but not at
100 p.s.i.g. The Millipore GS and HA of 0 . 22 and 0.45
microns, respectively,and the Schleicher and Schuell B-ll,
MC-4, were excellent in the Millipore holder at 100 p.s.i.g.
None of the filters tested were passable in the Gelman
Holders at 200 p.s.i.g. The Horman fil t er proved excellent
under the conditions of its tests.
The results of double filtration un der pressure (Table 40)
are self evident. In all but two cases, 200 pounds pressure
was too much for even the double membranes . The exception
being the combination uSIng the S . S. , B-II , 0.25)1 as th e
final filtration. The type of organism used in the serial
filtration did not seem to matter. The results were in-
fluenced, however, by the Selas metal membrane fi lters,
despite the fact that they were used in the first stage of
double filtration, since they invariably tore under the
influence of pressure.
Discussion:
A pressure of 200 p . S.I.g. is evidently too much for
most membrane filters tested. The Gelman pressure filt-
ration apparatus damaged the membranes in many cases.
Protection of normally fragile membranes becomes even
more important in pressurized filtration systems. Some
better supporting means is necessary.
II I I
/1 II I I I I
i l II I I I
I-I I I
-40-
The Millipo r e apparatus se e med to be a go od one at
the recommended Ll P of lOOp. s .1. g. The Se las Ungla zed
Porcelain (Feg . 23) Fil ter and Pall Ultipore did not
provide good results.
Of all the filter s test e d, the membrane t ypes were
the most reliable under differential and total pressures
of 100 p.s.i.g . or less. The mat type filters did poorly
under the higher pressures. As with the vacuum systems,
good filters are required in redundancy in reliable
apparatus under pressures not exceeding 100 p.s.i.g. to
provide reliable sterile filtrations. Gr e at procedural
care and caution is a necessity.
____________________ J
I fl I I I I
I I I I I , I
-41-
THE EVALUAT I ON OF FILTERS AND FILTRATION METHODS FOR THE STERILIZATION OF GAS UNDER PRESSURE
A great deal of difficulty arose in attempting to
provide and maintain aerosolization in a pressurized
system. There still remains a great need for work in
this area to determine the problems and to resolve them.
Method:
The test apparatus used for liquids under pressure
was modified f or the gas pressure system. A methanol
suspension of spores of Bacillus 2ubtilis var. niger of
200 per ml was vaporized in the air or nitrogen stream.
Because of the previously discussed inherent difficulties
of membranes bursting with the Selas Flotronics Metal
Membrane filters , several modifications were made in the
apparatus and test method. At first, the exhaust from
the filter holder (Ge lman rated at 200 p.s.i. g.) was piped
to a flask of sterile media f or direct impin gement on the
liquid surface. Al thou gh these filters are rated to with
stand pressures in exce ss of 1000 p.s.i.g., they invariably
split under the 200 p.s.i.g. It was believed that more
support was necessary. For this reason, the filter was
backed up by fib re separators supplied by Millipore but this
met with no success . The fil ter split immedi a tely on ex -
po sure to the pressure differential causing an excessive lo s s
of media, which caused this method t o he abandoned.
I
II I
II f
I 'I I
-42-
The differential pressure was subsequently reduced to 100
p.s.i.g. using the Millipore holder, hoping that it would
provide better results. Unfortunately they were the same.
The apparatus was then modified in the following manner.
The exhaust from the filter holder was channeled to two
downstream filter holders which contained Mi11ipore GS ~
filters each for collecting spores which traversed the
test membranes (Selas, metal) . The differential pressure
was reduced to the incident pressure of 60 p.s.i . g. One
of the collection filter membranes was subjected to
sterility test and the other was held for subsequent plate
count.
The Pall Corporation filters were t ested at 100 p.s.i.g.and
a ~ P of 100 p.s.i.g. The Linde Gas Filters were tested
at 200 p. s . i . g. an d a A P 0 f 113 p . s . i . g . ( see Fig. 2 2 )
The back pressure of 87 psi was the result of two down
stream mil1ipore collecting filters (Fig.2lE).
The effluent from the test filter passed t h rough two
GSF membrane filters (Fig. 21) . The membrane filters
were then subsequently assayed for the test organism . The
results appear in Table 41 .
Discussion:
The Se1as Metal Membrane Filter invariably blew out under
high pressure. This was due to the fact that thA metal
membrane was not resilient . Another major problem was
I I il II I [I I
I.
I I II I. I I I
II t
I
I
- - - - - -- _.- - - - - --- ---_._--
-43-
one of ~upport, howeve r, the metal membrane filters were
generally very unr e liable, so that, even if they could
have been kept from tearing , their microbial retention was
too poor for consideration.
The Linde and Pall filters also we re not consistently
reliable. According to tests conducted, they did not
provide sufficient assurance that they could be used in a
single stage of filtration to provide sterile gases. The
possibility of dual stage filtration applications was not
tested in this study.
I II I. I
rl
i· II
i. II i. II :. II f
II I I I.
I
-44-
CONCLUSIONS
About 80% of the HEPA filters tested were as claimed
(99.9999+ % efficient for the removal of viable particles
in the range of I micron). However, a wide variability
was generally observed in efficiency, in the effective
filtration surface area, and in the velocity profile
characteristics. The methods used in this study to
check test parameters are not in ge n eral use at this time,
but they were found to be extremely important in the
evaluation of the test results. It was determined that
certain physical characteristics radically biased the
data. These characteristics include dispensing methods,
viability recovery media, electrostatic charge on particles
and dielectric surfaces, relative humidity, particle size
and distribution and gravitational effects.
The use of the roving probe providing velocity profiles
and integrating bacterial sampling (such as the Reyniers
which also provides a contamination profile) shows promise
to provide not only a reliable method for testing filter
efficienty but to determine filter characteristics, and
also to indicate physical abnormalities of construction.
This method could be extended to evaluate and assist in
the development of better filters. Although these tests
were limited to a microbiological system, there is no reason
that the roving probe could not be attached to a machine
counter of some type. The test method utilizing the roving
I. :1 II il :1 il I
il II I JI I
II I
I
-45-
probe assembly in this study could be improved upon to
provide a better correlation between velocity and con-
tamination. This could be achieved by slowing down the
rates of both scanning probe and the agar plate mechanism.
The matter of air filtration for sterile systems is
a difficult one. According to the tests reported here,
filtration systems may be too unreliable to place con-
fidence in them. The recommendation proposed is to use
the filters presently available which are most reliable
and most efficient by test in redundancy. Redundancy,
however, will result in radically reduced flow rates and
pressure drop. The state of the art is, in the opinion of
the writer, not sufficiently well advanced to provide
adequately reliable single filtration for steril e gas
systems.
With the exception of metal membranes which were
shown to be inefficient, the membrane filters are the most
reliable of all filter types tested, if used within reason- .
able limits in reliable apparatus designed specifically
for the application.
For filtration or intermediate amounts (1 gallon or
less) of liquid, under either negative or positive pressure
to 25 p.s.i.g., as specified by the manufacturer, the
Horman proved very reliable and permitted rapid filtration.
I
II :1 il II il il il :1 II I
I
II I
I I I
I
-46-
Some general concluding statements for the filtration of
liquids follow:
1) The types of apparatus used in testing liquid fi1t-
ration by membrane filters under low and intermediate
pressures were generally unwieldy and difficult to
handle. The membranes were readily subject to damage
because of their fragility.
2) To increase reliability of present systems to pro-
vide sterility, redundancy is required.
3) Except for a few specific cases, such as the Gelman
stainless steel holder for membrane filtration and the
Millipore high pressure apparatus, the membrane holders
were evidently poorly designed, and glass was least
acceptable because of chipping and fragility. Stainless
steel would seem to be the material of choice, if
properly designed.
4) Membrane filters must be properly protected from sharp
edges and must be adequately supported to prevent damage
and leakage. Generally, the membrane filters tested
were good, but the holding apparatus available were very
poor. The S&S, B-11, Gelman GA-8 and Gelman GA-6, as
examples, were particularly vulnerable to such damage in
this Millipore glass funnel.
5) Great variance in filtration times indicated a wide
variation in pore size distribution in most membrane
filters.
_ _ J
I
I I I
II I I I :t II
6)
7)
8)
9)
-47-
Autoclaving proved to be a poor means of sterilizing
"autoclavable" membranes because of shrinkage.
Ethylene oxide appears preferable as a sterilizing
method.
The Millipore membrane apparatus proved best for the
filtration of liquids under pressure.
The maximum pressures recommended by manufacturers do
not always produce reliable results. It would seem
advisable to eva luate filters for the application
rather than to rely on manufacturer's recommendations
entirely.
The Selas porcelain filters were not reliable under the
conditions of the tests at 25 p.s.i.g.
I
I
I
II I I II
I I
:II
I I
I I
-48-
LIST OF REFERENCES
Andersen, A.A. 1958. New sampler for the collection, slzlng, and enumeration of viable airborne particles. J. Bacteriol.76:47l-484.
Decker, H.M., L.M. Buchanan, L.B. Hall, and K.R. Goddard. 1963. Air filtration of microbial particles. Am. J. Publ. Health. 52:1982-1988.
Ernst, R.R., and A.P. Kretz. 1964. Compatibility of sterilization and contamination control with application spacecraft assembly. Am. Assoc. Contam. Control J. 3:10-15.
Ernst, R.R., and A.P. Kretz. 1964. Compatibility of sterilization and contamination control. Conference Proceedings, Am. Assoc. Contam. Control. Third Annual Tech. Meeting, Los Angeles, May 5-8.
Ernst, R.R. 1965. Progress reports #1 through #7. the efficiency and reliability of filters to liquids and gases. Filter testing program. #950934. Castle Project W47l2.
Evaluation of sterilize JPL Contract
Ernst, R.R. 1965. Protocol for testing and evaluation procedures. Filter Testing Program. JPL Contract # 950934.
Ernst, R.R. and A.P. Kretz. 1965. Microbial evaluation of superinterception filters by use of the "Roving Probe." Proceedings of the Fourth Annual Tech. Meeting of the Am. Assoc. of Contam. Control. Miami Beach, Fla., May 25-28.
Ernst, R.R. and A.P. Kretz. 1966. The roving probe. Assoc. Contam. Control, July.
Gelman Instrument Company. 1965. Filter Progress report. Dec.
Goddard, K.R., 1963. of air filters.
A procedure for microbiological testing Ashrae J. 5:75 - 82. .
Mitchell, R.I., R.E. Thomas, and A.A. putman. 1964. Transport of aerosols through ducts. I and EC Process Design and Devel. 3:339-345.
Portner, D.M., C.R. Phillips, and Hoffman, R.K. 1967. Certification of probability of sterilization of liquid by filtration. J. Appl. Microbiol. !.
r-- - - - - - - .- - -
:-I I I I I il II
I ]1 II I I I
I
-49-
Schleicher and Schuell. 1963. "Membrane filters and App aratus," Bulletin # 79, March.
Songer, J.R., J.F. Sullivan, and J.W. Hurd. 1963 Testing airfiltering systems. T. Procedure for testing highefficiency air filters on exhaust systems. App1. Microbiol . 11:394-397.
Songer, J.R., J.P. Sullivan, and J.W. Hurd. 1965. Testing airfiltering systems. Bull. Parent. Drug Assoc. 12: 6- 12 .
Wolf, W.W., P. Skaliy, L.B. Hall, M.M. Harris, H.M. Decker, L. M. Buchanan, and C.M. Dahlgren. 1964. (2nd Ed.). Samp ling microbiological aerosols. Public Health Monograph No. 60. Publlc Health Service. U.S. Dept. H.E.W.
Zimmerman, Leonard. 1962. Survival of Serratia marcescens after freeze-drying or aerosolization at unfavorable humidity. T. Effects of sugars. J. Bacteriol. ~: 1297 -1302.
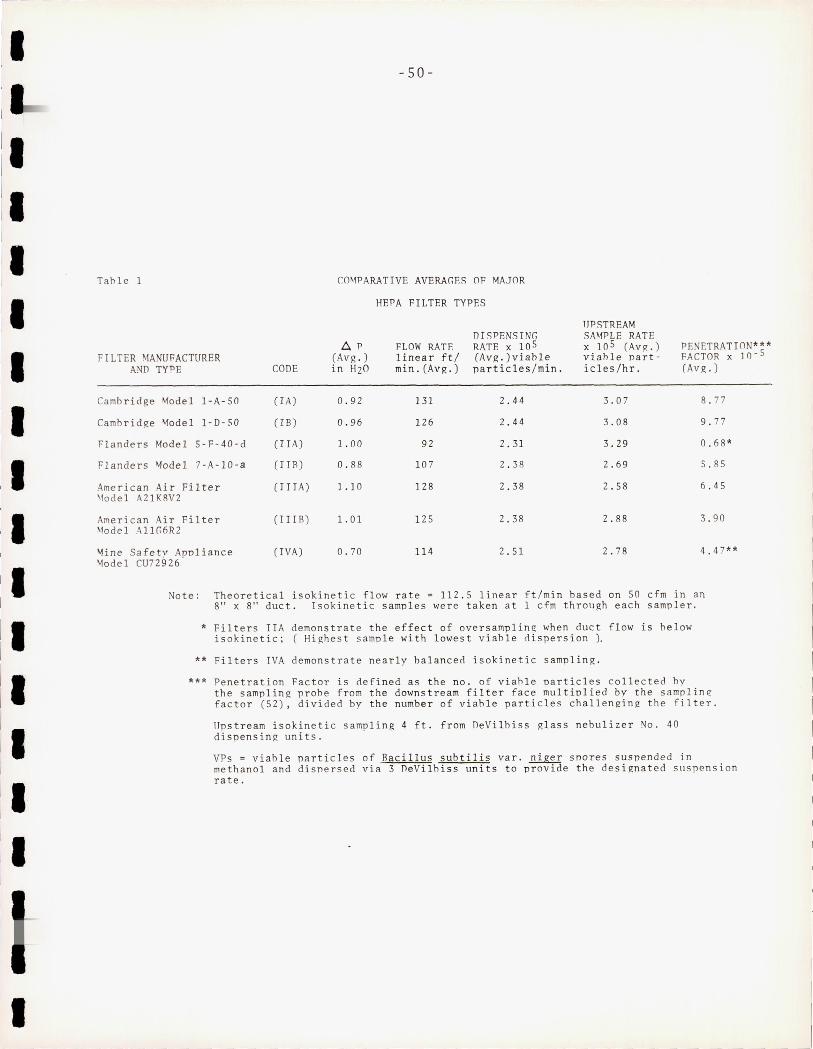
I. I
[. II I
I I
II I
I I I I I. I
II I I
I
-50 -
Tahle 1 r.O~PARATIVE AVERAr,F.S OF MAJOR
HEl'A FILTER TYPES
UPSTREAM DISPENSING SAMPLE RATE
t:,. P FLOW RATF. RATE x 105 x 105 CAvg . ) PENETRATI ON *** FILTER MANUFACTURER (Avg . ) li near ftl (Avg . )v iahl e viable part- FACTOR x )0 - 5
AND TYPE CODE in H2O min.(Avg . ) pa r ticles / min . icles/hr. (Avg . )
Cambridge Model l-A - SO CIA) 0 . 92 131 2 . 44 3.07 8.77
Cambrid!(e >.1odel l-D-SO (IB) 0 . 96 126 2.44 3.0 8 9 . 77
Flanders Model 5-F-40-d (I IA) 1. 00 92 2 .31 3.29 0.68 *
Flanders >.1odel '7-A- l O-a (JIB) 0.88 107 2 . 38 2 . 69 5.85
American Ai r Filter (IIlA) 1.10 ]28 2.38 2 . 58 6 .45 \lodel A21KRV2
American Air Filter (HIll) 1. 01 125 2.38 2 . 88 3.90 ~lodel AllG6R2
>.1ine Safety Appli ance (IVA) 0 . 70 114 2 . 51 2 . 78 4.47** \lodel CU72926
Note: Theor etical isokinetic flow rat e = 11 2.5 linear ft/min based on SO cfm in an 8" x 8" duct. Isokinetic samples were taken a t 1 cfm through each sampler.
* Filters IIA demonstrat e the effec t of oversampling when duct flow is helow isokine ti c; ( Highest sample with lowest viable rlispersion ),
** Filters TVA demonstrate nea rly balancerl isokinetic sampling .
*** Penetra ti on Factor is rlefined as th e no . of viahle particles co llected by the sampling probe from the downstream filter face multipl ied by the sampling factor (52) , divided by the number of viahle particles challenging t he filter .
Upstream isokineti c sampl ing 4 ft. from DeVilbiss glass nebuli zer . o. 40 dispensing units .
VPs = viable particl es of Jlac illus subtilis va r . niger spores s uspended in methanol and dispersed via 3 DeVi lhiss units to provide the designated sllspension rate .
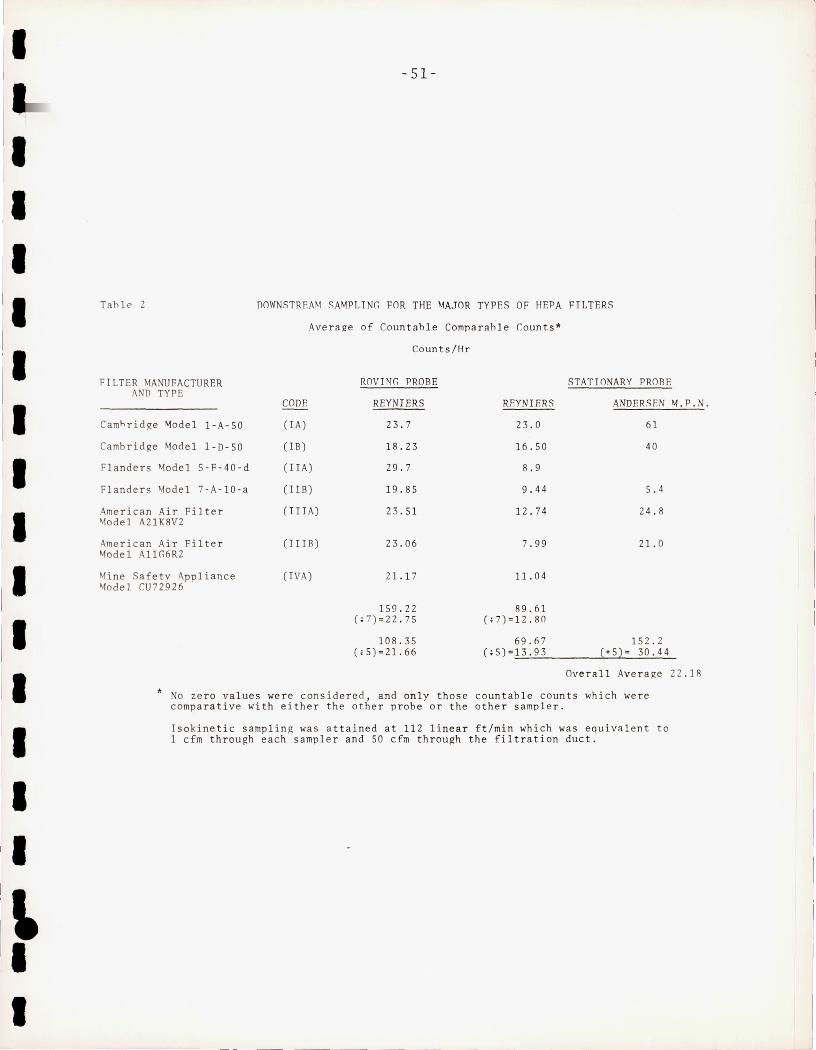
I II I I I I I I I I I I I I
Tahl e 2
FILTER MANUFACTURER AND TYPE
Camhridge Model 1-A -5 0
Ca mhrid!(e Model 1-0-50
Fla nders "'1ode l 5-F -4 0-d
Flanders "'1ode 1 7- A- lO- a
Ameri can Ai r Filter \jode 1 A2 1K8V2
Ame rican Air Filte r "'1ode1 AllG6R2
"'1i ne Safe t y Appliance \lode 1 CU72926
- 51-
DOWNSTREAM ~AMPLING FOR THE MAJOR TYPES OF HEPA FILTERS
Average of Countah1e Comparah1e r.ounts *
Counts / Hr
ROVING PROBE
CODE REYNIERS REYNIERS
( IA) 23 . 7 23.0
(IB) lS.23 16 . 50
( IIA ) 29 . 7 8.9
(IIB) 19.55 9.44
(IIIA) 23.51 12.74
(IIIB) 23.06 7.99
( IVA) 21.17 11. 04
159 .22 89.61 ( ; 7) ~22.75 (T7)~12 . S0
108 . 35 69.67 (;5) ~ 21.66 (;5) ~1 3.93
STATIONARY PRO BE
ANDERSEN "'1.P. N.
61
40
5.4
24.S
21. 0
15 2 . 2 ( +5 ) ~ 30.44
Overall Average 22 . lR
* No zero values were considered , and only thos e countable counts which were compara tive with either the other probe or the other sampl e r .
Isokine ti c samp1in!( was attained at 112 linear f t /m in which was equivalent to 1 cfm through each sampler and 50 cfm throu!(h the fil tration duct .
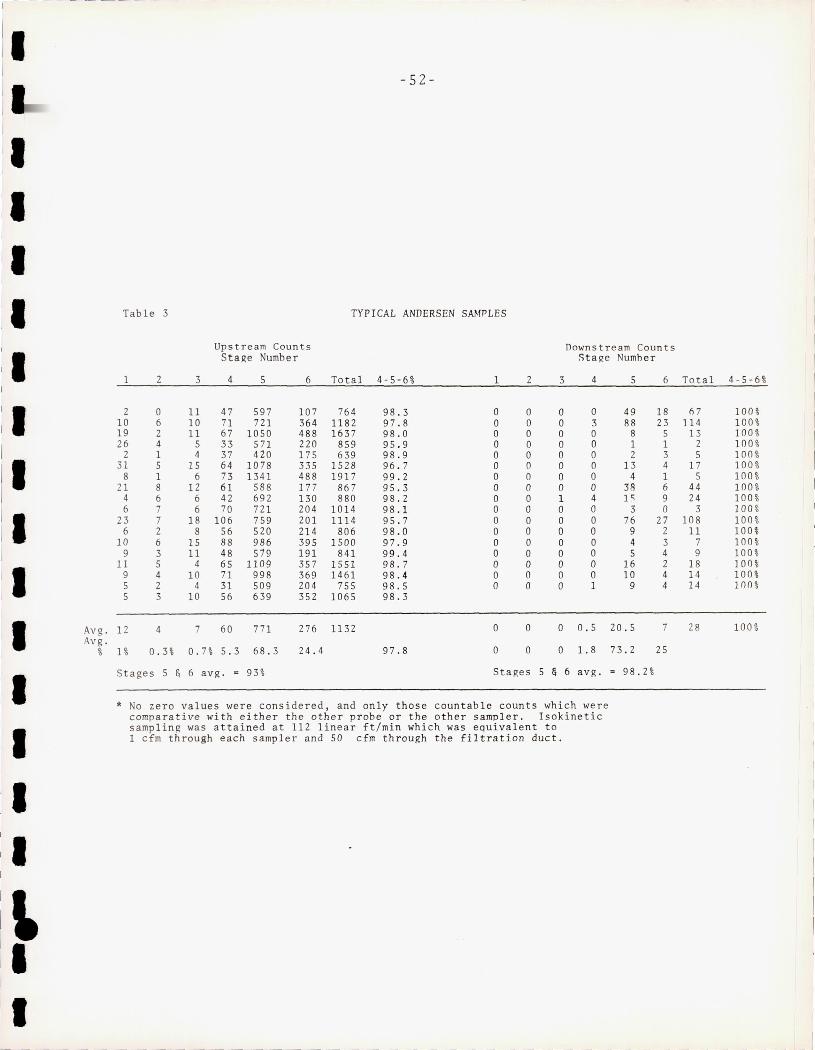
1--- - --- - --- - - -
I
I
I I I I I tl il I
II I I
ilt I
I I
Avg . Avg .
%
- 52-
Table 3 TYPICAL ANDERSEN SAMPLES
Upstream Counts Downst r eam Counts Stage Number Stage Numher
1 2 3 4 5 6 Tota l 4-5-6% 1 2 3 4 5 6
2 0 11 47 597 107 764 98.3 0 a a a 49 IS 10 6 10 71 721 364 1182 97 . 8 0 0 a 3 88 23 19 2 11 67 1050 488 1637 98.0 0 0 0 a 8 5 26 4 5 33 571 220 859 95 . 9 0 0 0 0 1 1
2 1 4 37 420 175 639 98.9 0 0 a 0 2 3 31 5 15 64 1078 335 1528 96.7 0 0 0 0 13 4
8 1 6 73 1341 488 1917 99.2 0 0 0 0 4 1 21 8 12 61 5S8 177 867 95 . 3 0 0 0 0 38 6
4 6 6 42 692 130 880 98.2 0 0 1 4 IS 9 6 7 6 70 721 204 1014 98.1 a a a a 3 0
23 7 18 106 759 201 1114 95 .7 0 0 0 0 76 27 6 2 8 56 520 214 806 98 . 0 0 0 0 a 9 2
10 6 15 88 986 395 1500 97.9 0 0 0 0 4 3 9 3 11 48 519 191 84 1 99.4 0 0 0 0 5 4
11 5 4 65 1109 357 1551 98.7 0 0 0 0 16 2 9 4 10 71 998 369 1461 98. 4 0 0 0 0 10 4 5 2 4 31 509 204 755 98.5 a 0 0 1 9 4 5 3 10 56 639 352 1065 98.3
1 2 4 7 60 771 276 1132 0 0 0 0.5 20.5 7
1% 0.3 % 0 .7% 5.3 68 . 3 24.4 97.8 0 0 0 1. 8 73 . 2 25
Sta ge s 5 & 6 avg. = 93 % Stages 5 & 6 avg . = 98.2 %
* No zero values were conside r ed, a nd only t h ose countable counts which were comparative with e i ther the oth er p robe or the other samp l er. Isokinet ic s ampling was att ained at 112 linear ft/min which was equivalent to 1 cfm through each sampler and 50 cfm th r ough the filtration duct.
Total 4-5-6%
67 100 % 114 100 %
1 3 100 % 2 100 % 5 100 %
1 7 100 % 5 100 %
44 100 % 24 100 %
3 100 % 108 100 %
11 100% 7 100 % 9 100 %
1 8 100 % 14 100% 14 11)0 %
28 100 %
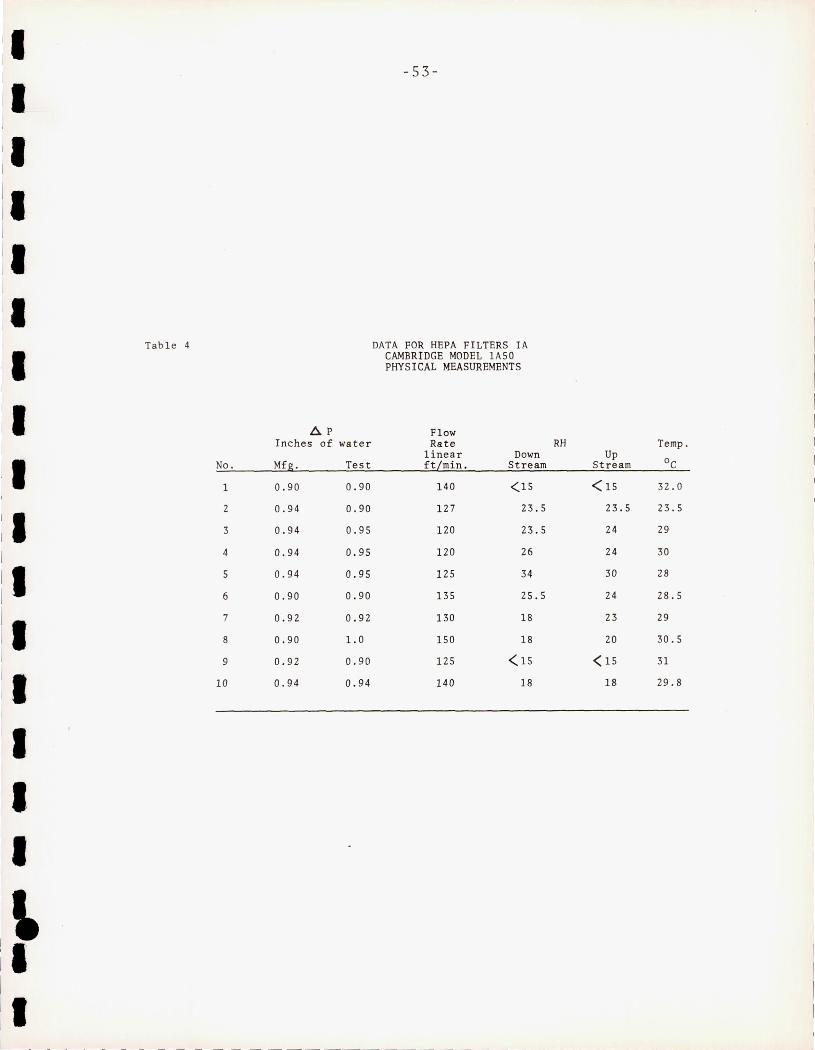
I I I I I II I Table 4
II
I I
,6, p Inches of water
il No.
I 1
Mfg. Test
0.90 0.90
II 2
3
0 . 94 0 . 90
0.94 0.95
I 4 0 . 94 0.9 5
:1 s
6
0.94 0.95
0.90 0.90
I 7
8
0 . 92 0.92
0 . 90 1.0
9 0.92 0.90
I 10 0.94 0.94
I I I
l-I I
------
-53-
DATA FOR HEPA FI LTERS IA CAMBRIDGE MODEL lA50 PHYSICAL MEASUREMENTS
Flow Rate
linear Down ft/min. Stream
140 <15
127 23.5
120 23.5
120 26
125 34
135 25.5
130 18
150 18
125 < 15
140 18
RH Temp. Up
°c Stream
<15 32.0
23.5 23.5
24 29
24 30
30 28
24 28 .5
23 29
20 30.5
< 15 31
18 29.8
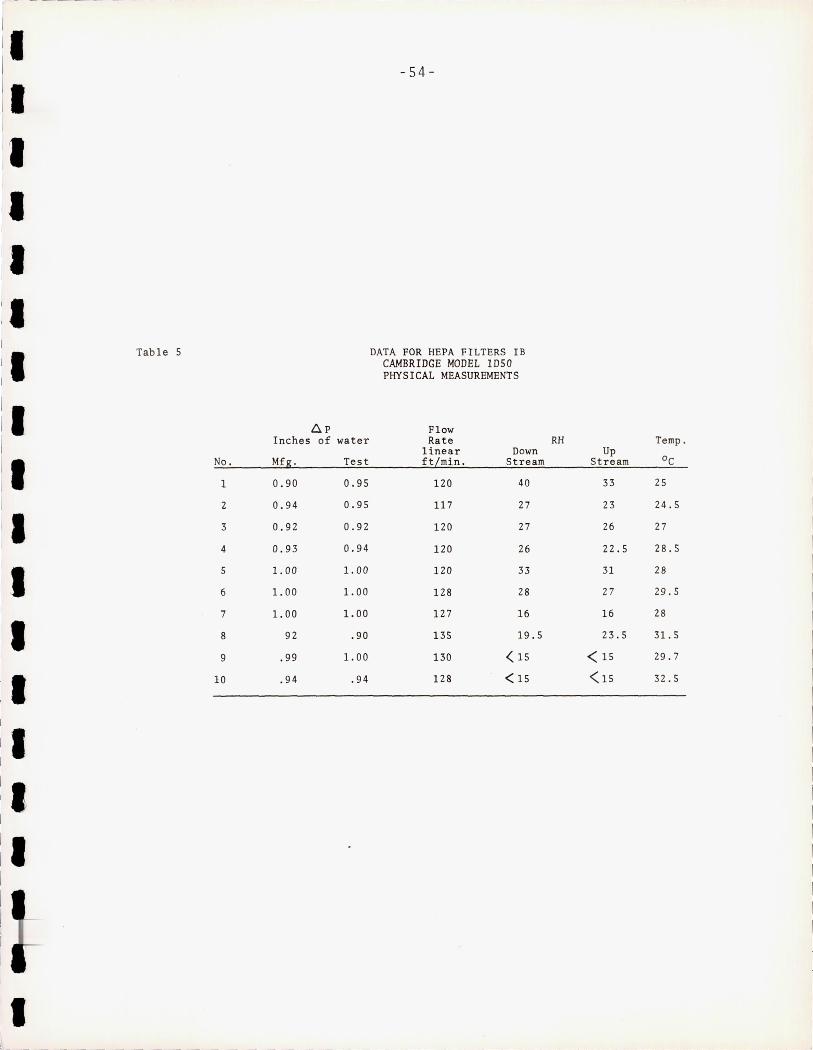
[-------
I II il I
I II II
I Tab le 5
I ilp Inches of water
I No. Mfg . Test
1 0.90 0.95
2 0.94 0.95
I 3 0 . 92 0.92
4 0 . 93 0 . 94
II 5 1. 00 1. 00
6 1. 00 1. 00
7 1. 00 1. 00
I 8 92 .90
9 .99 1. 00
I 10 .94 . 94
I II il
I
-54-
DATA FOR HEPA FILTERS IB CAMBRIDGE MODEL IDSO PHYSICAL MEASUREMENTS
Flow Rate
linear Down ftLmin. Stream
120 40
117 27
120 27
120 26
120 33
128 28
12 7 16
135 19.5
130 < 15
128 < 15
RH Temp. Up
Stream DC
33 25
23 24.S
26 27
22 .5 28.5
31 28
27 29.S
16 28
23. 5 31. 5
< 15 29.7
<15 32.S
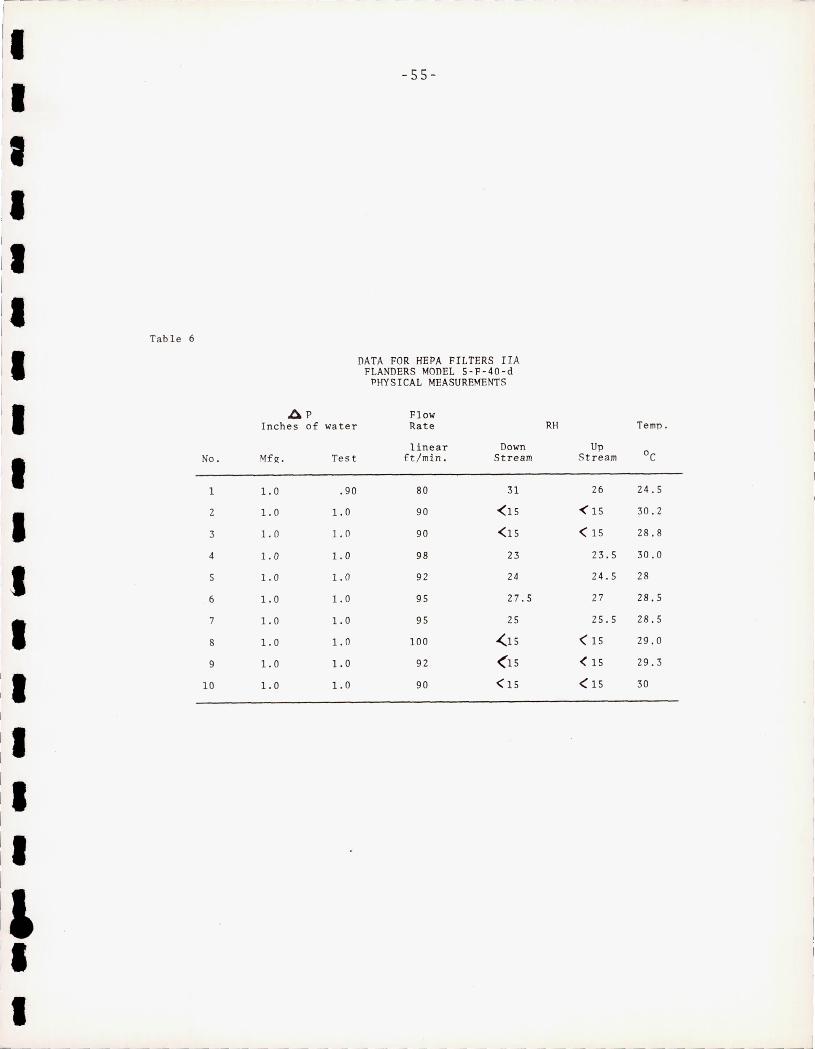
r il i. :. II
II I il II I
]1 il II I
II !. I
il i, I
II I 11 !. I
Table 6
No.
1
2
3
4
5
6
7
S
9
10
..AP Inches of water
Mfg. Test
1.0 .90
1.0 1.0
1. 0 1.0
1.0 1.0
1.0 1.0
1.0 1.0
1.0 1.0
1.0 1.0
1.0 1.0
1.0 1.0
-55-
DATA FOR HEPA FILTERS IIA FLANDERS MODEL 5-F-40-d
PHYSICAL MEASUREMENTS
Flow Rate RH Temp.
linear Down Up ft/min. Stream Stream °c
SO 31 26 24.5
90 < 15 < 15 30 . 2
90 < 15 < 15 2S.S
9S 23 23.5 30.0
92 24 24.5 2S
95 27.S 27 28.5
95 25 25.5 28.5
100 <.15 < 15 29 . 0
92 ( IS < 15 29.3
90 < 15 < IS 30
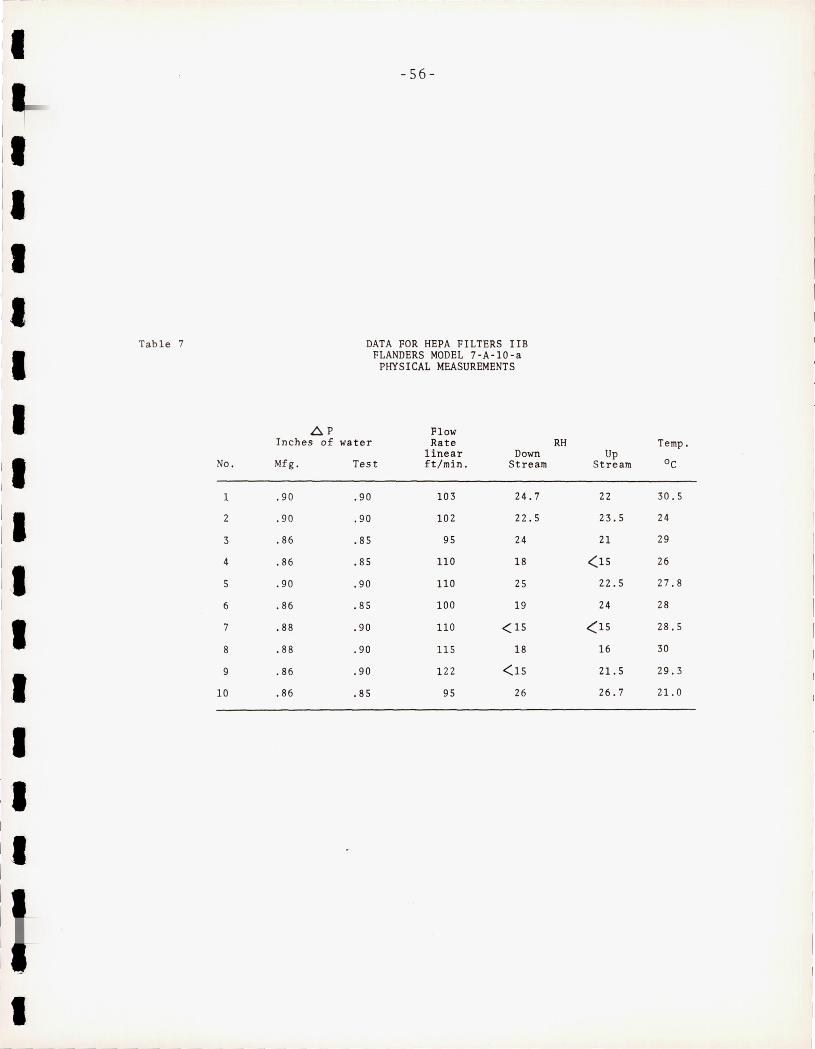
I
II I
II I ,
Table 7
I il I No.
II 1
2
3
,I 4
5
6
I 7
8
I 9
10
I I I
AP
-56-
DATA FOR HEPA FILTERS lIB FLANDERS MODEL 7-A-10-a
PHYSICAL MEASUREMENTS
Flow Inches of water Rate
linear Down Mfg. Test ft/min . Stream
.90 .90 103 24.7
. 90 . 90 102 22.5
.86 .85 95 24
.86 .85 110 18
.90 .90 110 25
.86 .85 100 19
.88 .90 110 <15
.88 .90 115 18
.86 . 90 122 <15
.86 . 85 95 26
RH Temp. Up
Stream °c
22 30.5
23.5 24
21 29
<15 26
22.5 27.8
24 28
<15 28.5
16 30
21. 5 29.3
26.7 21. 0
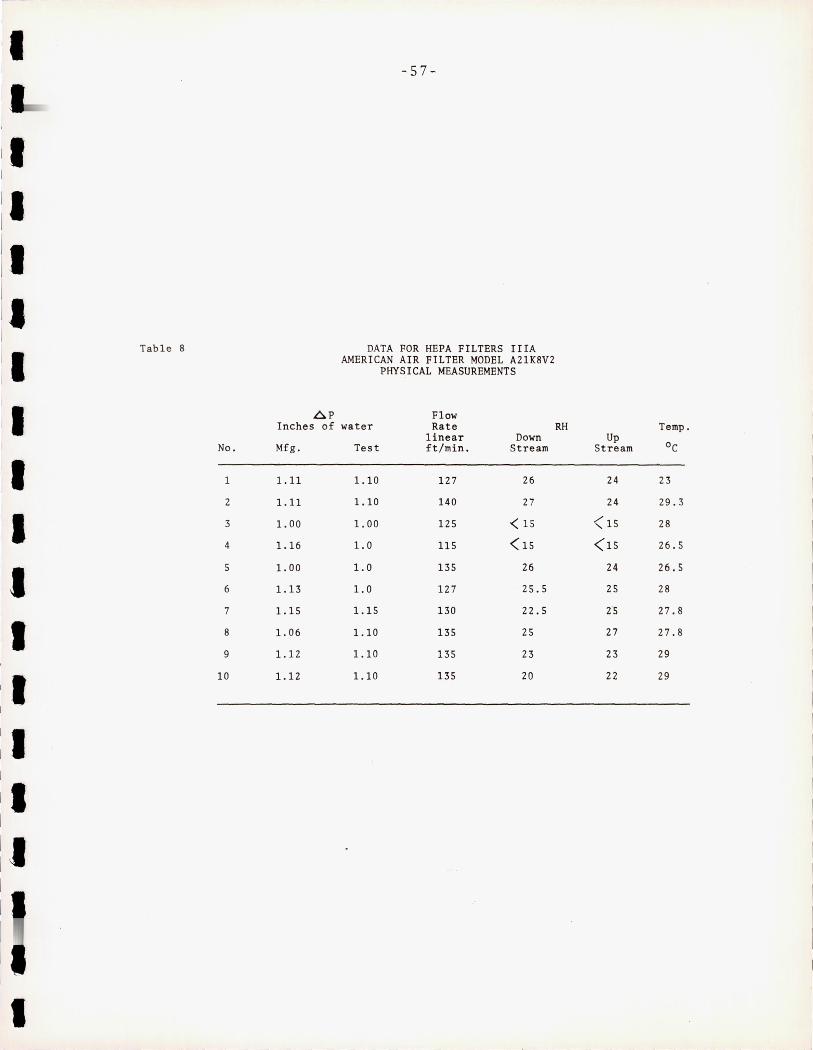
I I I I I I I I.
II I I I I
I I
Tab Ie 8
No.
1
2
3
4
5
6
7
8
9
10
-57-
DATA FOR HEPA FILTERS IlIA AMERICAN AIR FILTER MODEL A21K8V2
PHYSICAL MEASUREMENTS
,6P Flow Inches of water Rate RH Temp.
linear Down Up Mfg. Test ft/min. Stream Stream °c
1.11 1.10 127 26 24 23
1.11 1.10 140 27 24 29.3
1. 00 1. 00 125 < 15 <15 28
1.16 1.0 115 < 15 <15 26.5
1. 00 1.0 135 26 24 26.S
1.13 1.0 127 25. 5 25 28
1.15 1.15 130 22.5 25 27.8
1. 06 1.10 135 25 27 27.8
1.12 1.10 135 23 23 29
1.12 1.10 135 20 22 29
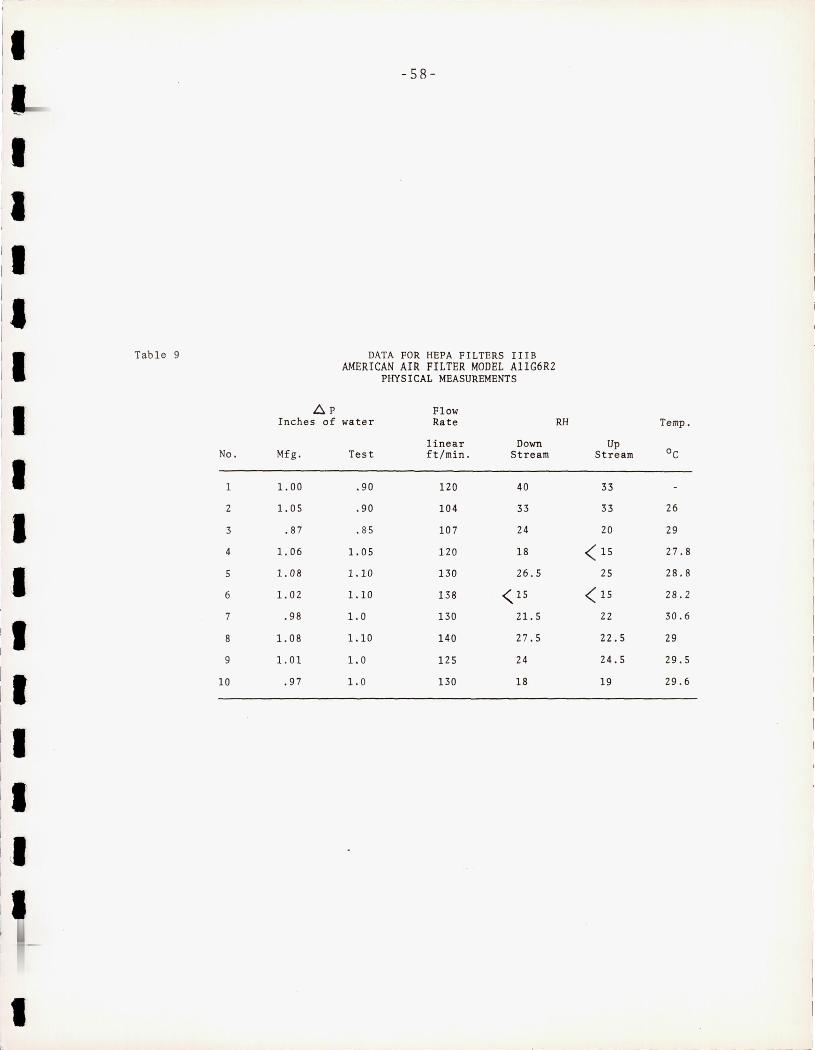
I I I I I
Table 9
I No.
I 1
2
I 3
4
5
6 I 7
I 8
9
I 10
I I I I
I
-58-
DATA FOR HEPA FILTERS IIIB AMERICAN AIR FILTER MODEL AIIG6R2
PHYSICAL MEASUREMENTS
AP Flow Inches of water Rate
linear Down Mfg. Test ft/min. Stream
1. 00 .90 120 40
1. OS .90 104 33
.87 . 8 5 107 24
1. 06 1. 05 120 18
1. 08 1.10 130 26 . 5
1. 02 1.10 138 < 15
.98 1.0 130 21. 5
1. 08 1.10 140 27.5
1. 01 1.0 125 24
.97 1. 0 130 18
RH
Up Stream
33
33
20
< 15
25
< 15
22
22.5
24.5
19
Temp.
26
29
27.8
28.8
28.2
30 . 6
29
29 . 5
29 . 6
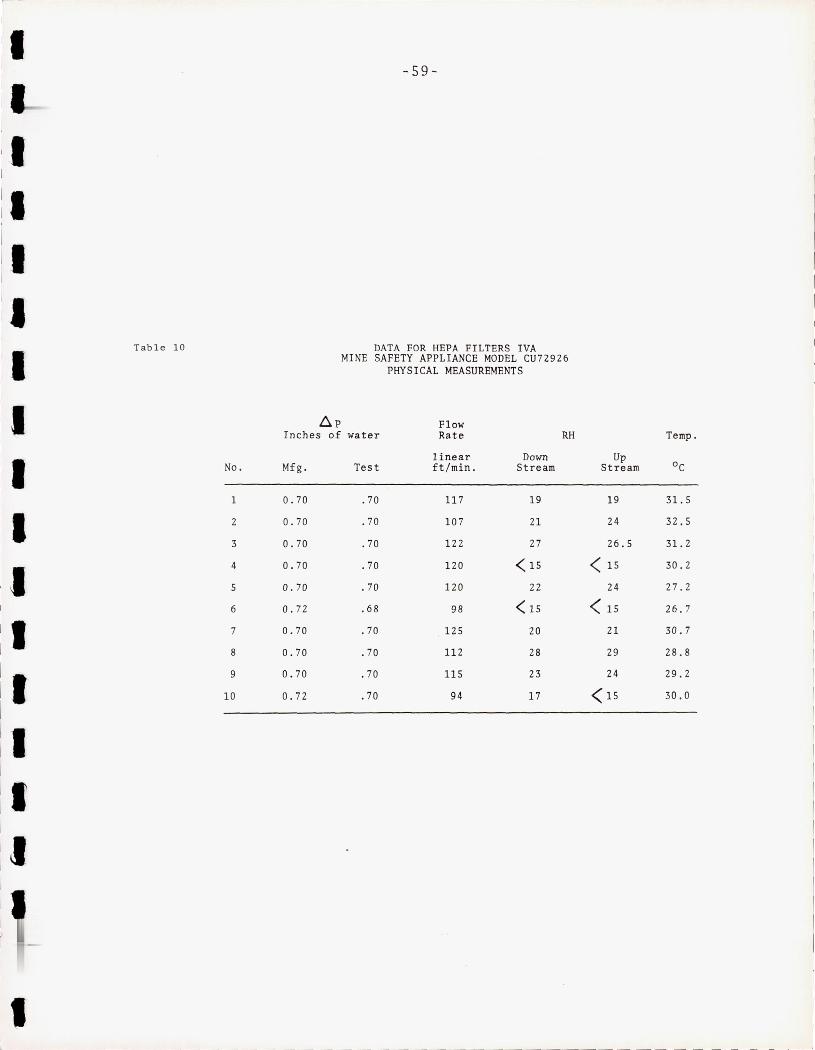
r-~
II I
II I
II I
:1 il [I II
Table 10
I
II :1 No .
I 1
I I I
2
3
I
II I
4
5
6
I 7
8
I 9
10
I I I
,
6 p
-59-
DATA FOR HEPA FILTERS IVA MINE SAFETY APPLIANCE MODEL CU72926
PHYSICAL MEASUREMENTS
Flow Inches of wa ter Rate RH
1 inear Down Mfg . Test ft/min. Stre am
0.70 . 70 117 19
0 . 70 .70 10 7 21
0.70 .70 122 27
0.70 .70 120 < 15
0.70 .70 120 22
0.72 .68 98 < 15
0.70 .70 125 20
0.70 . 70 11 2 28
0.70 .70 115 23
0.72 . 70 94 17
Temp .
Up Stream °c
19 31. 5
24 32.5
26 . 5 31. 2
< 15 30. 2
24 27.2
< 15 26.7
21 30.7
29 28.8
24 29.2
< 15 30.0
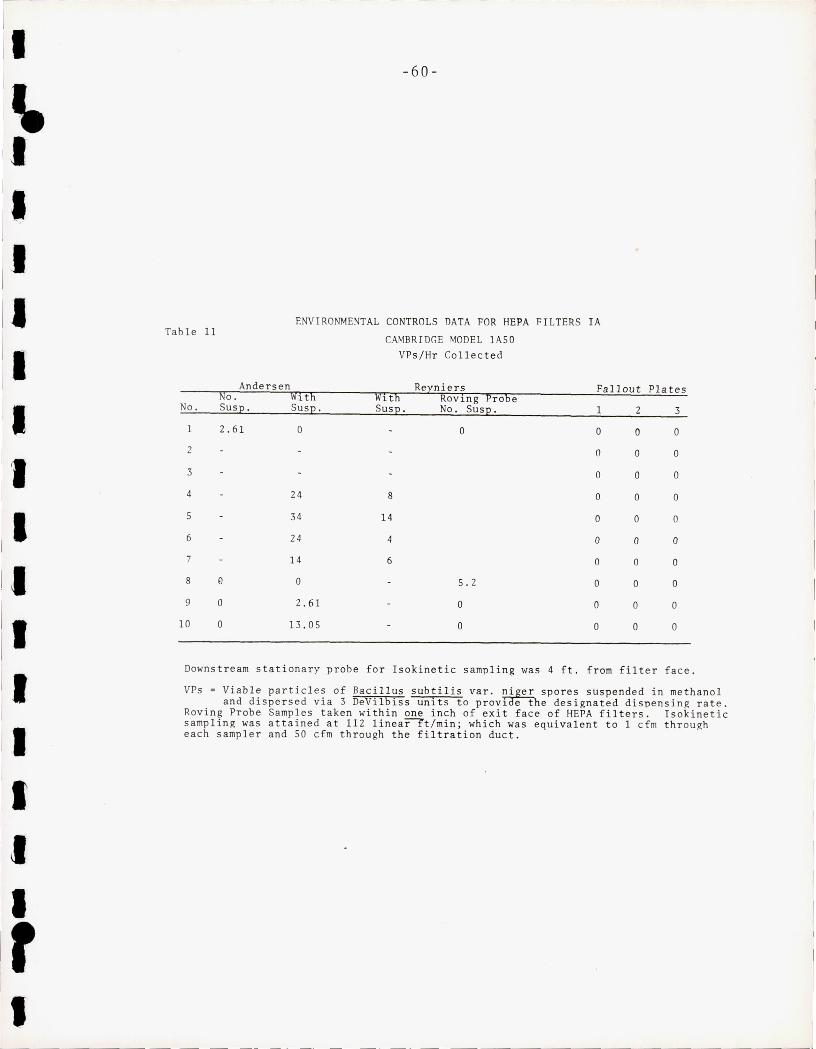
,-
i· I" 'I I, I "
II II II I. I. I
,I II
II II [I I
II II I, [' II
-60-
ENVIRONMENTAL CONTROLS DATA FOR HEPA FILTERS IA Table 11 CAMBRIDGE MODEL lA50
VPs/Hr Collected
Andersen Rerniers Fallout Plates No . wi th Wlth Roving Probe
No. SusE' Su sE' SusE' No . SusE' 1 2 3
1 2.61 0 0 0 0 0
2 0 0 0
3 0 0 0
4 24 8 0 0 0
5 34 14 0 0 0
6 24 4 0 0 0
7 14 6 0 0 0
8 0 0 5.2 0 0 0
9 0 2 .6 1 0 0 0 0
10 0 13.05 0 0 0 0
Downstream stationary probe for Isokinetic sampling was 4 ft. from filter face.
VPs = Viable particl e s of Baci llus subtilis var. nJger spores suspended in methanol and dispersed via 3 DeVilbiss units to provi e t he designated dispensing rate.
Roving Probe Samples taken within one inch of exit face of HEPA filters. Isokinetic samp ling was attained at 112 linear-tt/min; which was equivalent to 1 cfm through each sampler and 50 cfm through the filtration duct.
__ I
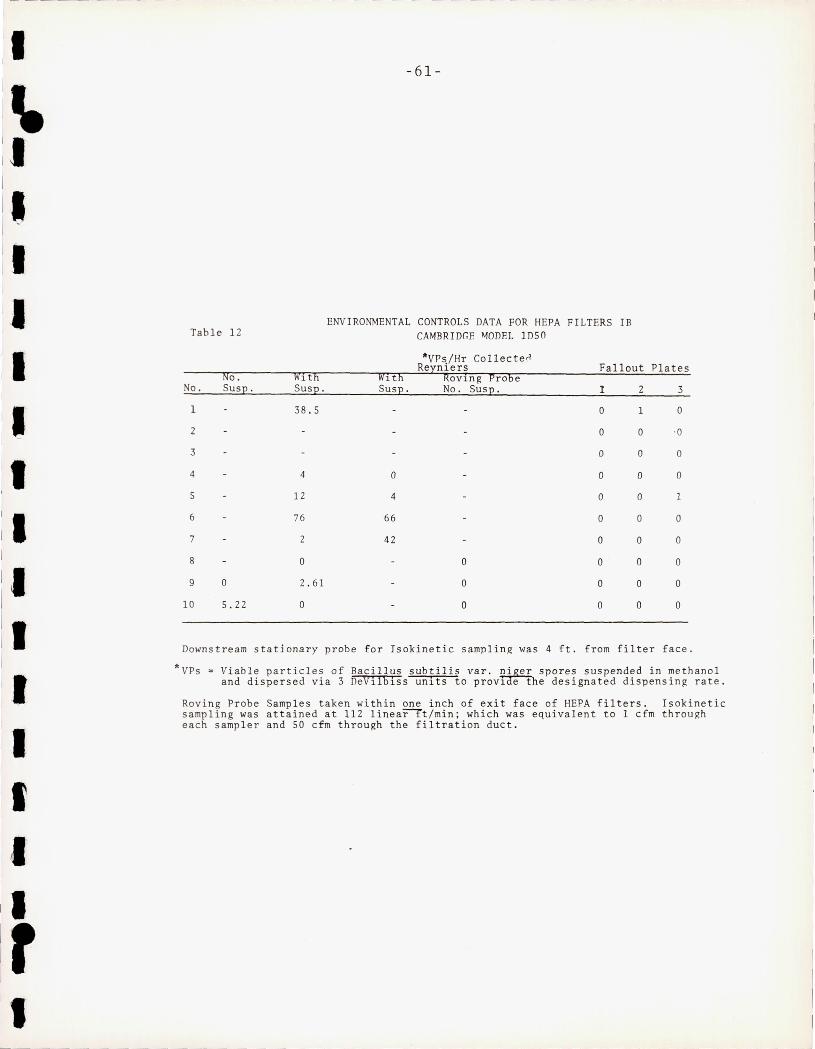
I I I I I
I I I
II :r !I
- 61-
ENVIRONMENTAL CONTROLS DATA FOR HEPA FILTERS IB Table 12 CAMBRIDr.E MODEL lDsO
*VPs/Hr Collecte n Reyniers Fallout Plates
No. Wlth Wl th Rovlng Probe No. SusE' SusE' SusE' No. SusE' I 2 3
1 38 . 5 0 1 0
2 0 0 ·0
3 0 0 0
4 4 0 0 0 0
5 12 4 0 0 1
6 76 66 0 0 0
7 2 42 0 0 0
8 0 0 0 0 0
9 0 2 . 61 0 0 0 0
10 5.22 0 0 0 0 0
Downstream stationary probe for Isokinetic sampling was 4 ft. from filter face.
*VPs = Viab l e particles of Baci llus subtilis var. n~ger spores suspended in methanol and dispersed via 3 DeVilbiss units to provl e the designated dispensing rate.
Roving Probe Samples taken within one inch of exit face of HEPA filters. Isokinetic sampling was attained at 11 2 linear-ft/min; which was equivalent to 1 cfm through each sampler and 50 cfm through the filtration duct.
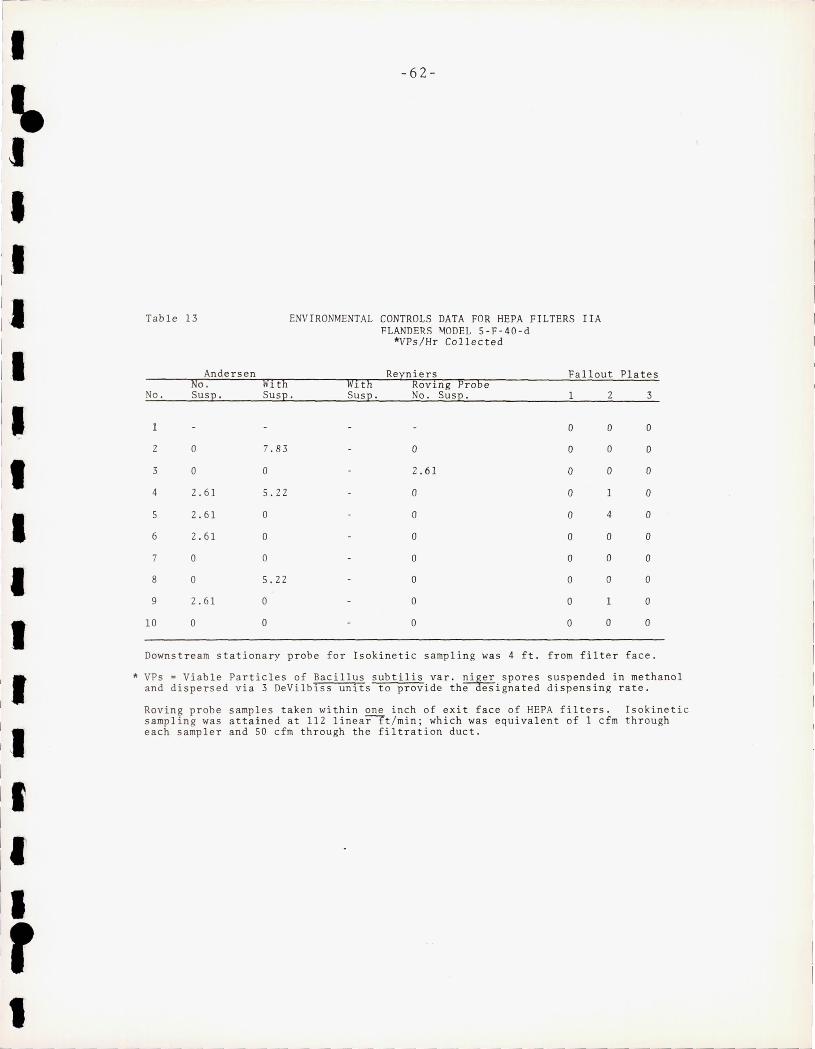
I
,~ -
I
ie. I
II I, I II , ,
I I II I
I
1
Table 13
Andersen No .
No . Susp.
1
2
3
4
5
6
7
8
9
10
o
o 2.61
2 . 61
2 . 61
o
o 2 . 61
o
-62 -
ENVIRONMENTAL CONTROLS DATA FOR HEPA FILTERS IIA FLANDERS ~ODEL 5-F-40 - d
· VPs/Hr Collected
Reyni ers Fallout Plates WIth Susp.
7.83
o
5 . 22
o
o o
5.22
o
o
WIth Sus p.
ROVIng Probe No . Susp.
o
2 .6 1
o o
o
o
o
o
o
1
o
o
o
o
o o
o
o
o
o
2
o
o
o
1
4
o o
o
1
o
3
o
o
o
o
o
o
o
o
o
o
Downs tream stationary probe for Isokinetic sampling was 4 f t. from f i lter face.
* VPs = Viable Partic les of Baci llus subtil is var . ni~er spo r e s suspended in methanol and dispersed via 3 DeVilbiss units to provide the esignated dispensing ra te.
Rovi ng probe samples t aken wi th in one inch of exit f ace of HEPA fil t e r s . Isokinet ic sampling was attained at 112 linear-It / min; which was equivalent of 1 cfm through each samp l er and 50 cfm through the fil trat ion duct.
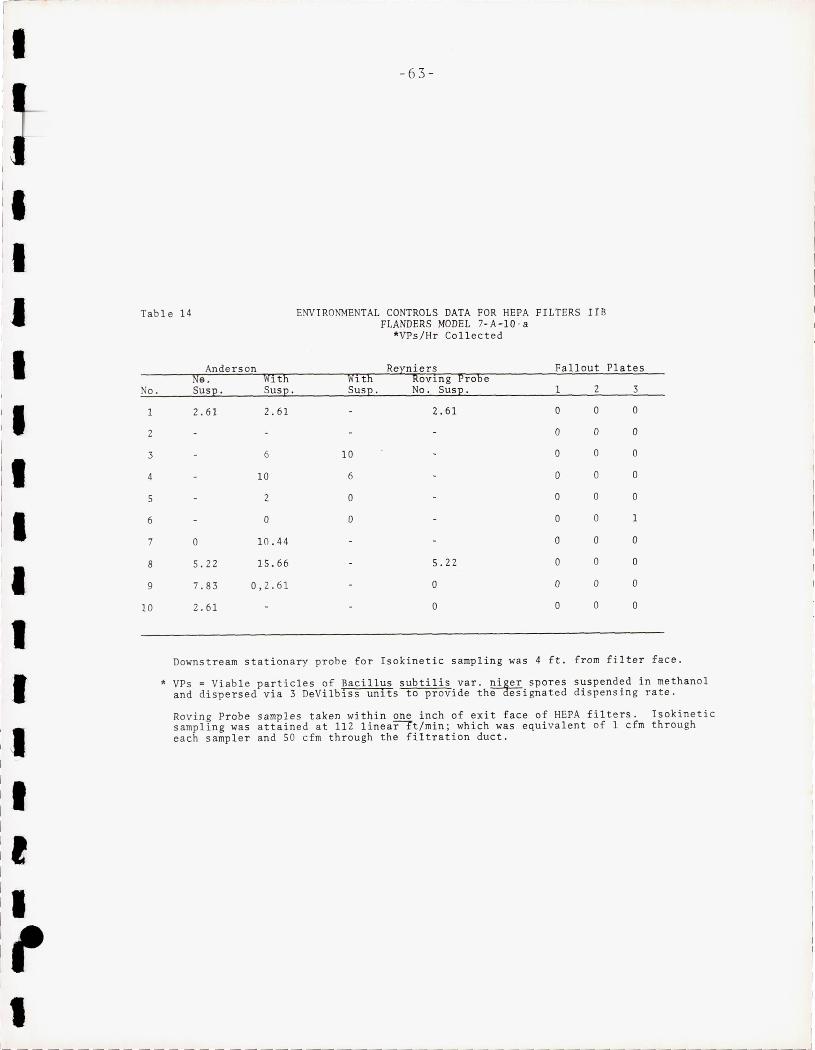
r :1 I I I I I I
;1 il I
:1 I
II
I I I I I I I -I
;1 I
II
if I
II L __
- 63-
Table 14 ENVIRONMENTAL CONTROLS DATA FOR HEPA FILTERS TIB
No.
1
2
3
4
5
6
7
8
9
10
FLANDERS MODEL 7- A-lO -a ~VPs/Hr Collected
Anderson Reyniers Fallout Plates Ne. Wlth Wlth Rovl ng Probe Susp. Susp . Susp. No. Susp. 1 2 3
2.61 2.61 2.61 0 0 0
0 0 0
6 10 0 0 0
10 6 0 0 0
2 0 0 0 0
0 0 0 0 1
0 10.44 0 0 0
5.22 15.66 5 . 22 0 0 0
7.83 0,2.61 0 0 0 0
2.61 0 0 0 0
Downstream stationary probe for Isokinetic samplin g was 4 ft . from filter face.
* VPs = Viable particles of Bacillus subtilis var. ni~er spores suspended in methanol and dispersed via 3 DeVilbiss unlts to provide the esignated dispensing rate.
Roving Probe samples taken within one inch of ex it face of HEPA filters. Isokinetic sampling was attained at 112 linear-It/min; wh ich was equivalent of 1 cfm through each sample r and 50 cfm through the filtration duct.
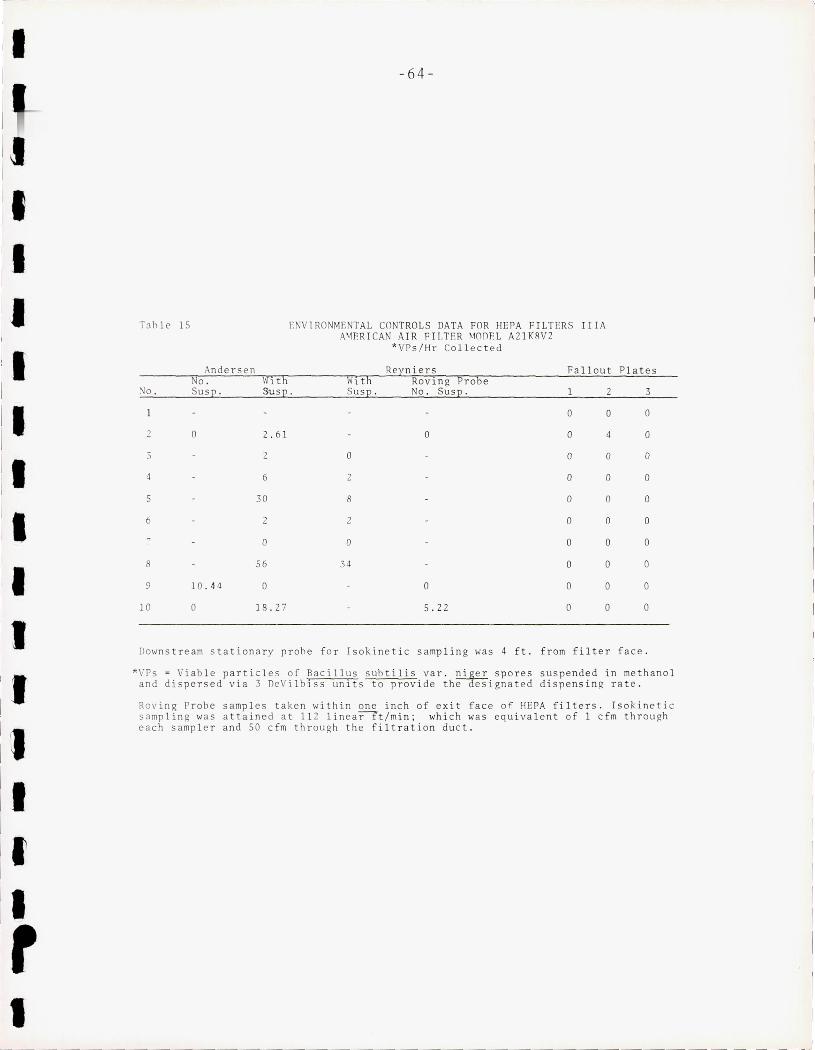
I
I II I. :. i
i' :1 :. I, il !r I
T~bl(' 15
Anders en No .
'10 . Sus p.
o
4
5
6
8
9 10.44
10 o
-64 -
ENV IRONMENTAL CONTROLS DATA FOR HEPA FILTERS IlIA A'vIF.RlCAN AIR FILTER MOnEL A2lKRV2
*VPs/Hr Collected
Reyniers Fallout Plates wi th Susp.
2.61
6
3D
2
o
56
o
18 . 27
wi th Susp .
o
z
8
2
o
34
Roving Probe No . Susp.
o
o
5.22
1
o
o
o
o
o
o
o
o
o
o
2
o
4
o
o
o
o
o
o
o
o
3
o
o
o
o
o
o
o
o
o
o
Downstream s tat ionary probe for Isokin e tic samplin g was 4 ft. from filter face .
*VPs ~ Viab l e particle s of Bacil lus sub tili s var. ni~er spores suspended in methanol and dispe rse d via 3 DeVi lbi ss unIts to provide th e es ignat ed dispensing rat e .
Roving Probe samp l es taken wit hin one inch of exit face of HEPA filters. Isokineti c samp ling was attained at 11 2 lin ear-It/min; which was equiva l ent of I cfm through eac h sample r and 50 cfm through the filt ration duct.
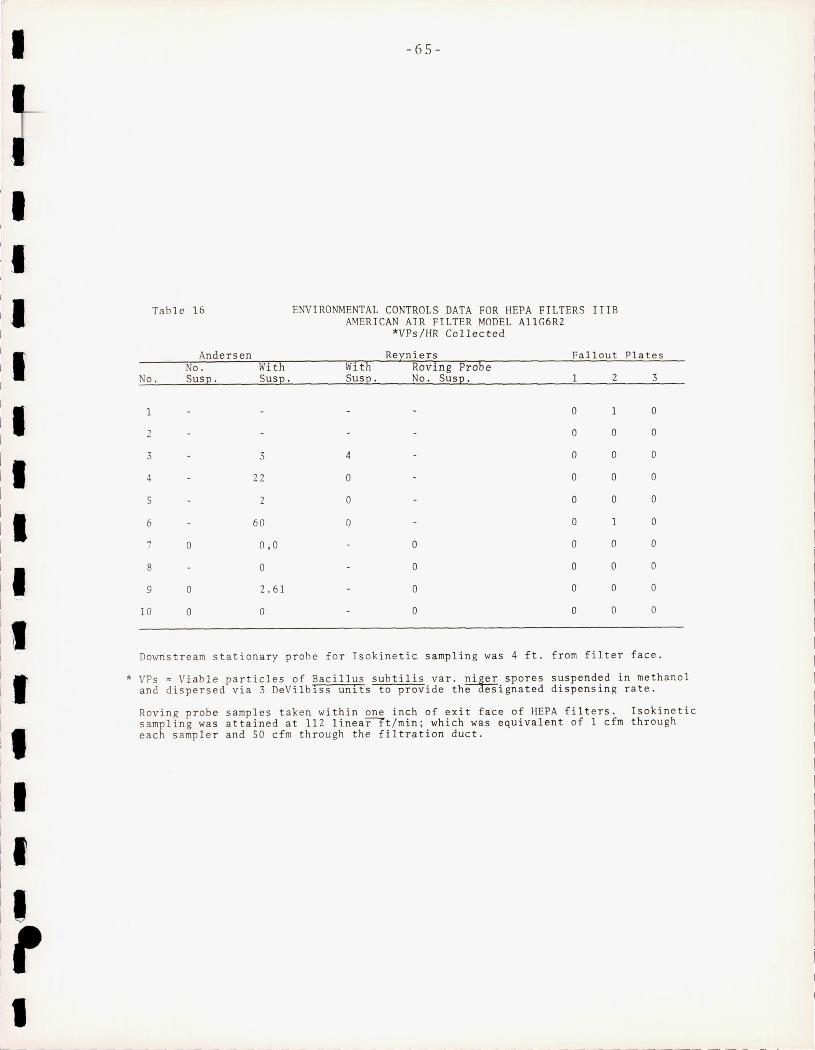
II I r
I I 'I I I I I I I I I I I
I r I
-65-
Table 16 ENVIRONMENTAL CONTROLS DATA FOR HEPA FILTERS I II B AMERICAN AIR FILTER MODEL A1lG6R2
*VPs/HR Co llected
Andersen Reyniers Fallout Plates No . With Wi th Roving Probe
o. Susp. Susp. Susp. No. Susp . 1 2 3
1 0 1 0
2 0 0 0
3 3 4 0 0 0
4 22 0 0 0 0
2 0 0 0 0
6 60 0 0 I 0
7 0 0,0 0 0 0 0
8 0 0 0 0 0
9 0 2 . 61 0 0 0 0
10 0 a 0 0 0 0
Downstream stationary probe fo r Isokine tic samplin g was 4 ft. from filter face.
* VPs : Viable partic les of Baci ll us subtilis var . ni~er spores suspended in methanol and dispersed via 3 DeVi l bI ss unIts to provide the esignated dispensing rate.
Roving probe samples taken wi th i n one inch of ex it face of HEPA fi lt ers. Isokinetic sampling was atta ined at 112 linear-It /m in; which was equivalent of 1 cfm through each sampler and SO cfm through the fil tration duct.
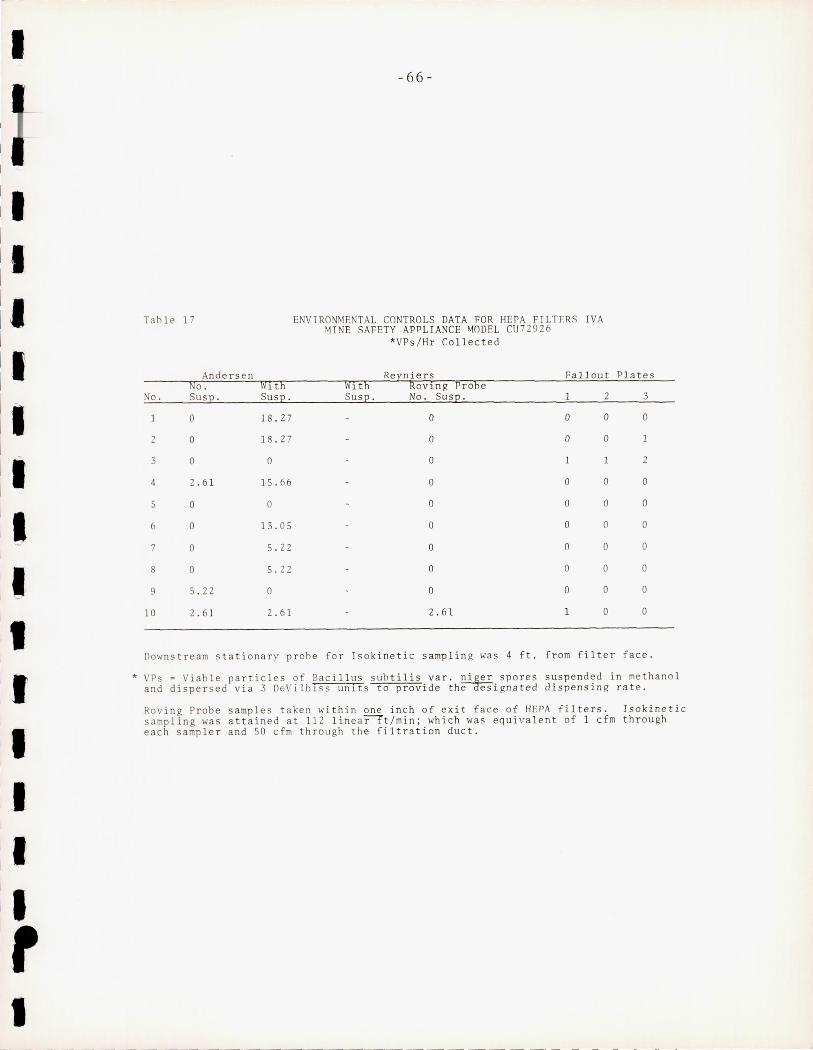
I
I I
I
Tahle 17
Andersen No.
No . Susp.
3
4
5
6
7
8
9
10
a
a
a
2 .61
a
a
a
a
5.22
2.61
\'h th Susp.
18 . 27
18 . 27
a
15 . 66
a
13. 05
5.22
5.22
a
2.61
-66-
E VTRONMENTAL CONT ROLS DATA FOR HEPA FILTERS IVA MI NE SAFETY APPLIANCE ~ODEL CU7 2926
*VPs/ Hr Collected
Reyniers Fallout Plates WIth Susp .
Ravin" Probe No. Susp.
a a o
o
a
a
a
a
a
2.61
1
a
a
o
o
o
o
a
a
1
2
a
a
o
a
a
o
a
a
a
3
a
2
a
o
o
a
o
a
a
Downstream stationary probe for Tsokinetic sampling was 4 f t. f rom filter face .
* VPs = Viab l e particles of Bacil lus subti lis var . ni~er spores suspended in methanol and dispersed via 3 DeVilbIss units to provide th e esignated dispe ns ing rate.
Roving Probe samples taken within one inch of ex it face of HErA filters . Isokinetic sampling was attained at 112 line artt / min; which was eq ui valent of 1 cfm throu"h each sample r and 50 cfm through the filtration duct.
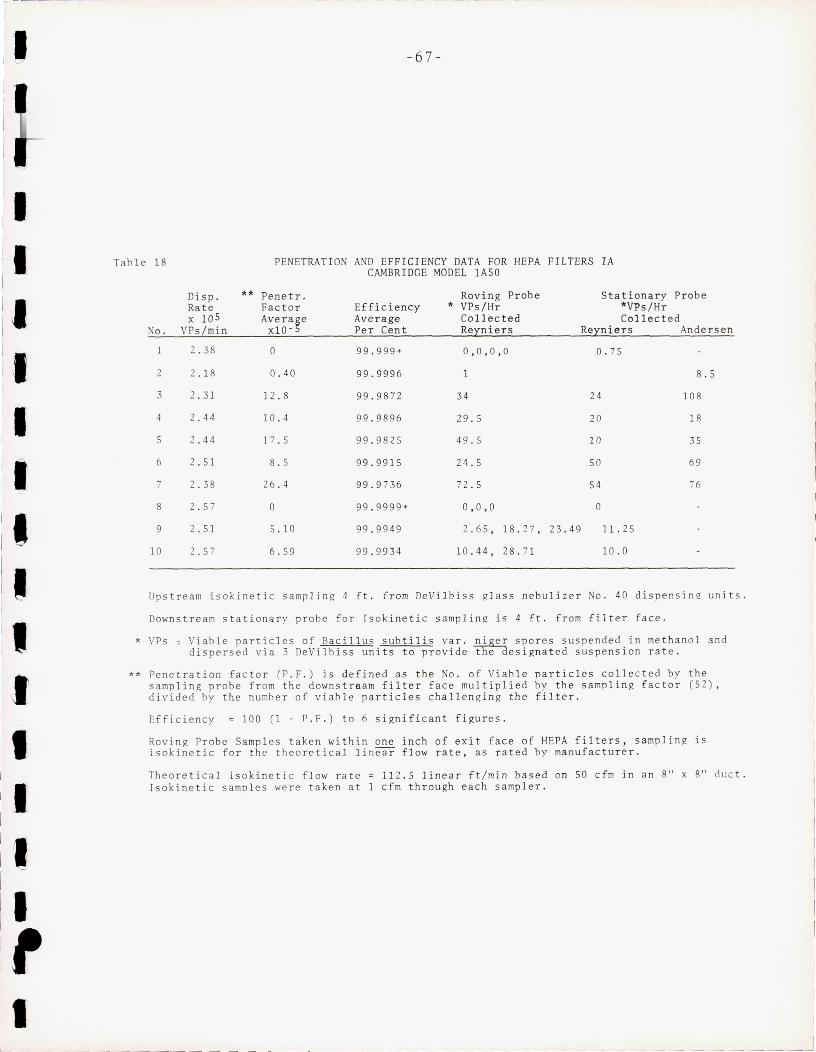
I
r :.
I II I
il ,I
il II I _
I. I. [, J I I
II it I
Tahle 18
Disp. Rate x 105
No. VPs/mi n
3
4
5
6
7
8
9
10
2 . 38
2. 18
2 . 31
2.44
2 . 44
2 . 51
2 . 38
2 . 57
2.51
2.57
-67-
PENETRATION AND EF FICIENCY DATA FOR HEPA FILTERS IA CAMBRI DGE MODEL lASO
** Penetr. Factor Average
xlO - 5
o
0 .4 0
12.8
10 . 4
17 . 5
8 . 5
26 . 4
o 5 .1 0
6 . 59
Efficiency Average Per Cent
99 . 999 +
99.9996
99.9872
99 . 9896
99 . 9825
99.9915
99 . 9736
99 . 9999 +
99 . 9949
99 . 9934
Roving Probe * VPs/Hr
Co llected Reyniers
0 , 0,0 , 0
1
34
29.5
49.5
24.5
72 .5
Stationary Probe *VPs/Hr Collected
Reyniers Andersen
0.75
24
20
10
50
54
8 .S
108
18
35
69
76
0,0,0 0
2.65 , 18. 27 , 23 .49 11.25
10 . 44, 28.71 10.0
Ups tream isokinetic sampli ng 4 ft . f rom DeVilbiss g l a ss nebulizer No . 40 dispensinq units.
Downstream station~ ry probe f or Isokinetic sampling is 4 ft . from filt e r face.
* VPs 0 Viable par ti cles of Baci llu s subtilis va r. niger spores s uspended in methan ol and dispersed via 3 DeVilbiss units to provide the designated suspension rat e.
** Pene tration factor (P . F.) is def ined as the No . of Vi able particles collec t ed by the samp l ing probe fr om th e downstr e am filter face multip lied by the sampling factor (52) , divided by the numhe r of viable particles challen gin g the filte r.
Eff iciency ~ 100 (1 - P . F.) t o 6 significant figures.
Roving Probe Samples taken within one inch of exit face of HEPA filters , sampling is isokine tic for th e theore ti ca l linea r flow rate, as r a t ed by manufacturer.
Theo r etical isokin e t ic flow rate 11 2 .5 linear ft /m in based on 50 cfm in an 8" x 8" duc t. Tsokinetic sampl es we re taken at 1 cfm through each sampler .
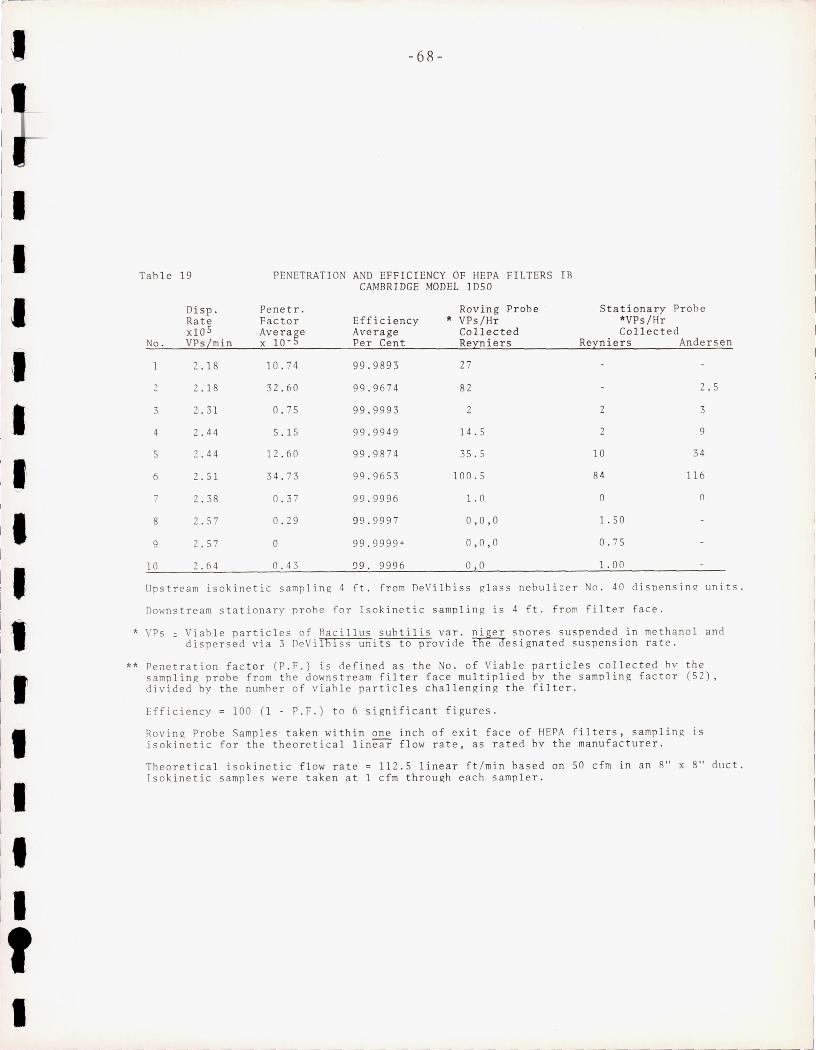
r-- ------
I. I
I
I I
II :1 I
I II :. I, II I I I
"
I I
)1 :. I
II !, I
Tab l e 1 9
No .
3
4
5
6
7
8
9
10
Dis p . Ra t e x l OS VP s / mi n
2.18
2.18
2 . 31
2 . 44
2 . 44
2.51
2 . 38
2 . 57
2.57
2.64
-68-
PENETRAT I ON AND EFFICIENCY OF HEPA FI LTERS I B CAMB RIDGE MODEL I DSO
Pene tr . Rov in g Probe Factor Eff iciency " VPs/Hr Ave ra ~e Ave rage Co llected x 10- Per Ce n t Reyniers
10 . 74 99 . 9893 27
32 . 60 99.9674 82
0.75 99 . 9993 2
5.15 99 . 9949 1 4.5
12 . 60 99 . 9874 35 . 5
34 . 73 99.9653 100 . 5
0 . 37 99 . 9996 1.0
0 . 29 9 9 . 9997 0 , 0 , 0
0 99 , 9999+ 0 , 0 , 0
0 . 43 99 . 9996 0 , 0
St ationary Pr obe "VP s /Hr Coll ect ed
Reyni er s Ande r s en
2 . 5
3
9
10 34
8 4 116
0 n
1. 50
0.75
1. 00
Upstream isokinetic sampling 4 ft, from DeVilbi s s gl ass nebulizer No . 40 disoensing units .
Downstream stationary prohe fo r Isokinetic sampl ing is 4 ft. f r om fi l te r face .
* VPs ~ Viable particles of Racillus sub til is var . nA gea soo r es s uspend ed in methanol ano dispe r sed via 3 DeVi lb lss uni t s t o pro vi de t e esigna t ed s usp en s ion r ate .
** Penetration fac t or (P . F . ) is oefi ned as th e No . of Viah le pa rt icles co ll ec t ed hy the sampling pr obe from the downstream fi lt e r f a ce mult ip l ied by th e s ampl i ng f acto r (52), divided by the numher of viahle par t ic l es cha ll engin g the f ilte r .
Efficiency = 100 (1 - P . F . ) to 6 signifi c ant figures .
Roving Probe Samples taken wi t h in one i n ch of ex it f a ce of HErA f ilte r s , samp l ing is isokinetic fo r t he t heo r etical l inear f l ow r ate, as rat ed hy the manuf act ur e r .
Theoretical isokinetic fl ow r a t e 11 2 .S linear ft / min hase d on 50 cfm in an 8 " x 8" duc t. Isokinetic samples were take n a t 1 c fm through each s ample r .
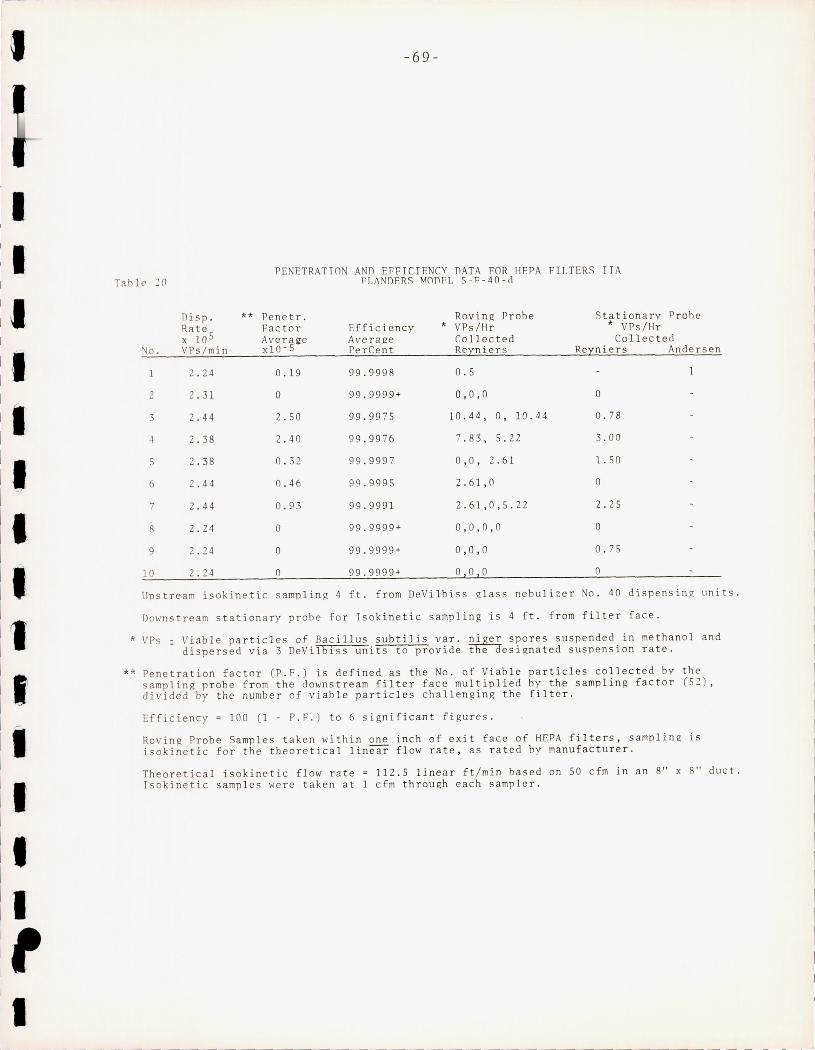
rI ,I I
! f
I
I
I il I
fl I
II I .
il II
I
-69 -
Tahle' 20 PENETRATTO AND EFFICIENCY DATA FOR IIEPA FILTERS IT i\
FLANDERS MOD EL S-F-40-o
Disp . ** Penetr. Roving Prohe StationarY Proh e Rate Fact or Eff i c iency * VPs/Hr * VPs/Hr x 10 5 Avera ee Ave ra ge Co ll ec ted Co ll ec t ed
)/0 . VPs/min xlO- 5 Pe r Ce nt Reyniers Reyniers Andersen
1 2 . 24 0 . 19 99.9998 O.S 1
2 2 . 31 ° 99 . 9999 + 0, 0,0 ° 3 2 .44 2.50 99 .9975 10.44, ° , 10 .44 0 . 78
.\ 2 . 38 2.40 99 . 9976 7 .83, 5.22 3 . 00
5 2 .38 0.32 99 .9 997 0 , 0 , 2 . 61 1. 50
6 2 . 44 0 .4 6 99.9995 2 .61,0 ° 7 2 . 44 0.93 99 . 9991 2 . 61,0,5 . 22 2 . 25
8 2.24 ° 99 . 9999 + 0 , 0 , 0 , 0 ° 9 2.24 ° 99 . 9999 + 0,0,0 0 . 75
10 2.24 0 99 . 9999 + °1°1° 0
Upstream isokinetic samplin g 4 ft. f rom DeV ilbis s gl ass neb uli ze r o. 40 dispensin g unit s .
DOIVns tream s t ationary p r obe fo r Tsokinetic s amp ling i s 4 f t . f rom fil t e r face.
* VPs = Viable particles of Baci llus subtil i s var. niger spores suspended in methan ol and dispersed via 3 DeVilbiss units to provide the designated suspension r a te.
** Penetra tion fact or (P . F.) is def in ed as the No . of Viab l e particles c ollected by th e sampling probe f r om th e downstream filt e r face multiplied by the sampling fact or (5~) , divided by the numbe r of viab le particle s challenging th e filte r .
Efficiency ; 100 (1 - P.F.) t o 6 s i gnificant figures.
Roving Probe Samples t aken within one i nch of exit face of HEPA filters, samplin g i s isokinetic for the th eo r e tical linear f low rate, as rated by manufac t ur er.
Theo r etical isokinetic flow r a t e 112 . 5 li near ft/min based on 50 cfm i n an 8" x 8" duc t. Isokinetic samp l es were t ake n at 1 cfm through eac h sampl e r.
I I I I
I I
l I
l I I I I I I I I I
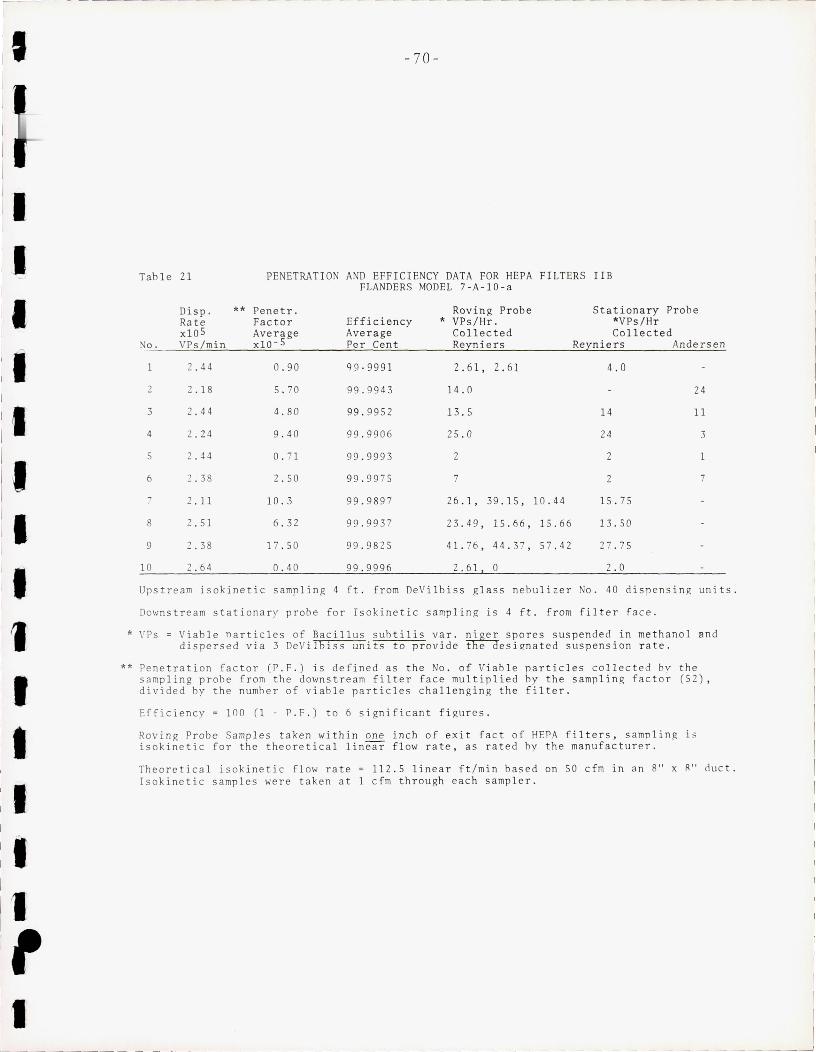
I
il il I II I
il I
II I. I
il I
II I
i, I
II I
il
I II I
il 1 , I
Tab l e 21
Disp. ** Rate xl0 5
No . \fPs/min
2 . 44
2 . 18
3 2.44
4 2.24
5 2 . 44
6 2 . 38
7 2.11
8 2 . 51
9 2 . 38
10 2 . 64
- 70 -
PENETRATION AND EFFICIENCY DATA FOR HEPA FILTERS lIB FLANDERS MODEL 7-A- 10 - a
Penet r . Factor Efficiency Average Average xlO- S Per Cent
0 . 90 g9·9991
5 . 70 99 . 9943
4.80 99.9952
9.40 99 . 9906
0.71 99 . 9993
2.50 99.9975
10.3 99 . 9897
6.32 99.9937
1 7 .5 0 99 . 9825
0 . 40 99 . 9996
Roving Pr obe * VP s /Hr .
Co llected Reyniers
2.61 , 2 . 61
14.0
13 . 5
25 . 0
7
26 . 1,
23 . 49 ,
41. 76 ,
2 . 61,
39 . 15,
15 . 66,
44 . 37 ,
0
10.44
15 .66
57 .4 2
Stationar y Probe *VPs!H r Co llected
Reyniers Andersen
4 . 0
14
24
2
15.75
13 . 50
27 . 75
2.0
24
11
3
1
7
Upstream isokinetic sampli ng 4 ft . f rom DeVi lbi ss glass nebulizer No . 40 d i spensi n g units.
Downs tream stationary probe fo r Isoki netic sampling i s 4 ft . from filt er face .
* \iPs = Viable narticles of Bacillus suh tilis va r. n~ge a spore s suspended in methanol Bn d dispersed via 3 DeVilb i ss un i t s t o provide t e esigna t e d suspension rate.
** Pene tration factor (P . F. ) is defined as th e No . of Viab l e pa r ti c le s co ll ec t ed bv the samp ling probe from th e downstream fil t e r face multiplied by the samplin g factor (52), divided by the numhe r of viable pa rti c le s challenging the filter.
Efficiency = 100 (1 - P.F.) to 6 significan t figures.
Roving Probe Samples taken within one inch of exit fact of HEPA fil t ers, sampl i ng is isokinetic for the theoretica l linear flow rat e , as rate d by the manufacturer.
Theoretica l isokinetic flow rate 11 2.5 linea r ft/min based on 50 cfm in an 8" x R" duc t . Isokinetic samples were taken at 1 c fm through each sampler .
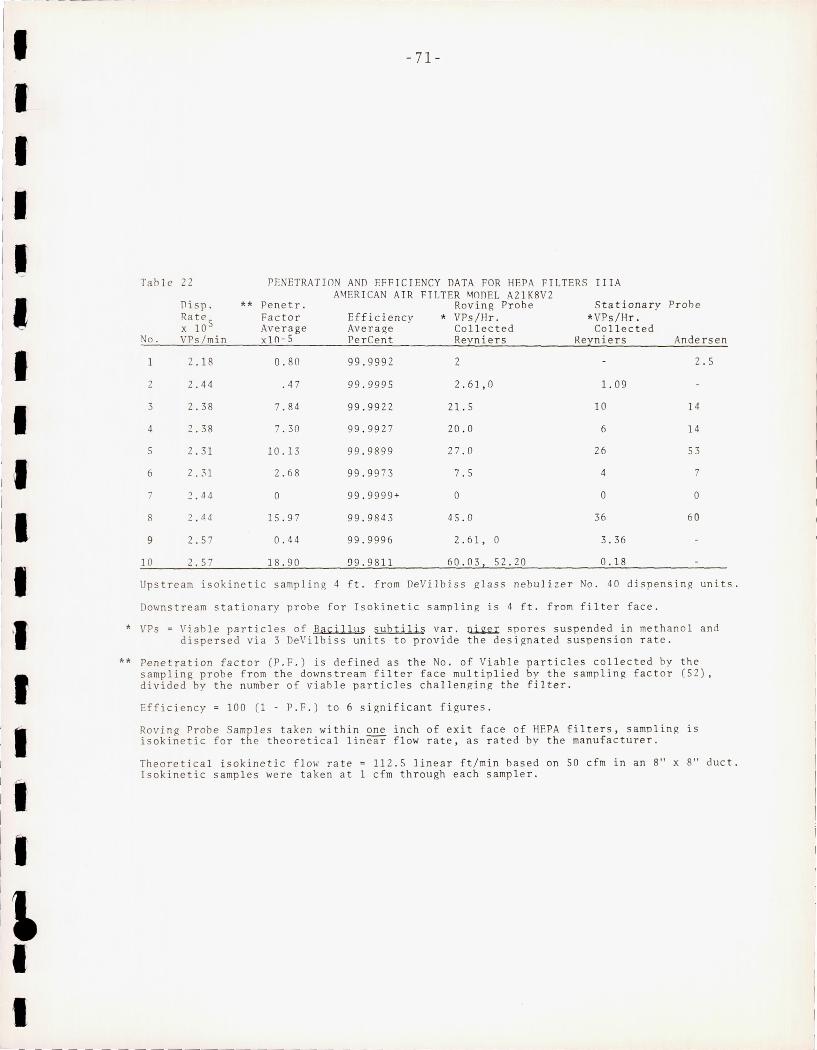
,-- --- - ---- -
I I
I II I I I I
I I I
I I I I , I I
Table 22
Disp. Ra te 5 x 10
o. VPslmin
2
3
4
5
6
7
8
9
10
2.18
2.44
2.38
2.38
2.31
2.31
2.57
2.57
-71-
PENETRATION AND EFFICIENCY DATA FOR HEPA FILTERS IlIA AMERICAN AIR FILTER MOnEL A2lK8V2
** Penetr . Roving Probe Stationary Pr obe Factor Efficiency * VPs/Hr. *VPs /Hr. Average Average Col l ected Co llected xlO-5 PerCent Reyniers Reyniers Andersen
0.80
. 47
7 .84
7.30
10.13
2 . 68
o
15 . 97
0 .4 4
18.90
99.9992
99 . 9995
99 . 9922
99 . 9927
99 . 9899
99 . 9973
99.9999+
99 .9 843
99 . 9996
99 . 9811
2
2.61 ,0
2 1. 5
20.0
27 . 0
7.5
o
45.0
2 . 61, 0
60 . 03, 52.20
1. 09
10
6
26
4
o
36
3 . 36
0 .18
2.5
14
14
53
7
o 60
Upstream isokinetic sampling 4 ft. f r om DeVilbiss glass nebulizer No. 40 dispensing units.
Downstream stationary probe for Isokinetic sampling is 4 ft . f rom fjl t er face.
* VPs = Viable particles of Bacillus subtilis var. ~ spores suspended in methanol and dispersed via 3 DeVilbiss units to provide the designated suspension rat e.
** Penetration factor (P.F.) is defined as the No . of Viable particles collected by the sampling probe from the downstream filter face multiplied by the sampling factor (52) . divided by the number of viab l e particles challenging the filter.
Efficiency = 100 (1 - P.F . ) to 6 signifi cant f igures .
Roving Probe Samples taken within one inch of exit face of HEPA filters, sampling is isokinetic for the theoretical linear f l ow rate, as rat ed by the manufa cturer.
Theoretical isokinetic flow rate 112.5 linear ftlmin based on SO c fm in an 8" x 8" duct. Isokinetic samples were taken at 1 cfm through each sampler .
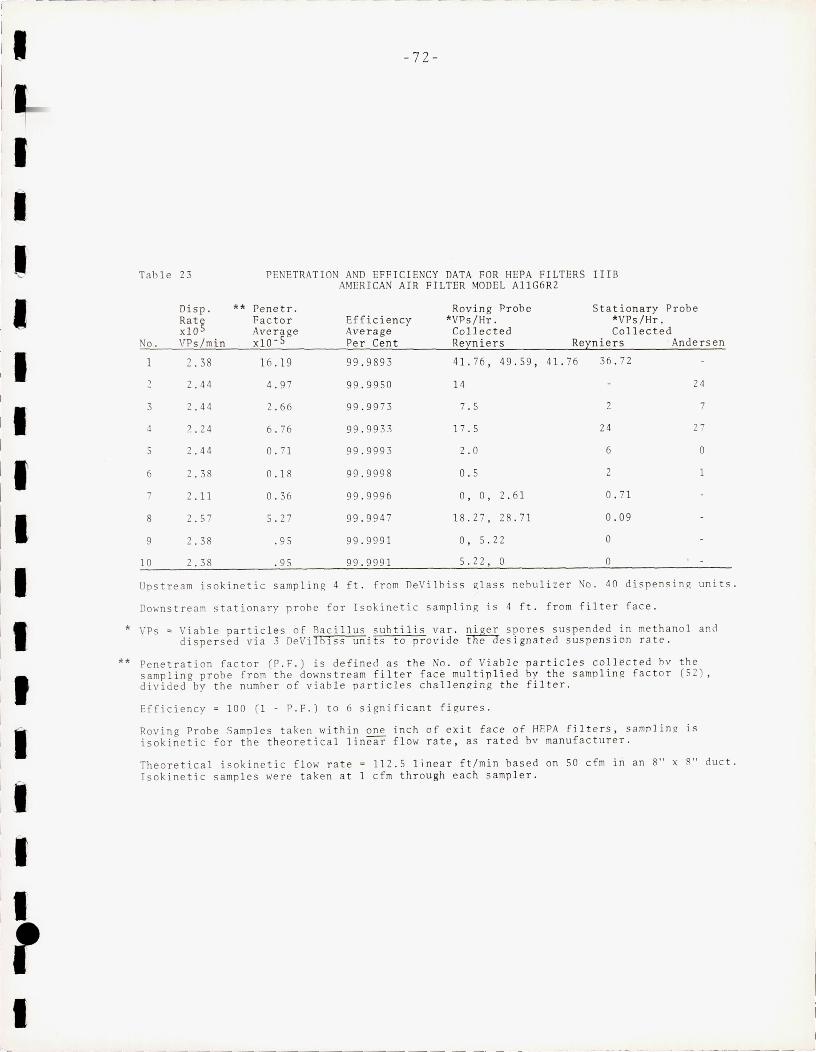
I, I I
II :, I
IJ I I
I I I r I
Table 23
No.
1
3
5
6
7
8
9
10
Disp. Rat e xl0 5 VPs/m in
2 .38
2.44
2 .44
~.24
2.44
2 .38
2.11
2.57
2.38
2.38
-7 2-
PENETRATION A D EFFICIENCY DATA FOR HEPA FILTERS IllS AMERICAN AI R FILTER MODEL AllG6R2
** Penetr . Fac t or Average xlO- S
16.19
4.97
2 . 66
6 . 76
0.71
0.18
0 . 36
5 . 27
.95
. 95
Efficiency Average Per Cent
99 . 9893
99.9950
99.9973
99 . 9933
99.9993
99 . 9998
99.9996
99 . 9947
99 . 9991
99.999 1
Roving Probe *VPs/Hr .
Stationary Probe *VPs/Hr. Co ll e ct ed Collec t ed
Reyniers Reyniers Andersen
41 . 76 , 49 . 59 , 41 . 76
14
7 . 5
17 .5
2 . 0
0 .5
0 , 0 , 2 . 61
18.27,28 . 71
0 , 5 . 22
5 . 22 , 0
36 . 72
2
24
6
2
0 . 71
0 . 09
o
o
24
7
27
o
1
Upstream isokinetic sampling 4 ft . from DeVilhiss glass nehulizer No. 40 dispensing units .
Downstream stationary probe for Isokine ti c sampling is 4 ft . from fil t e r face.
* VPs = Viable particles of Baci ll us subtilis va r . ngged spores suspended in methanol and dispersed via 3 DeVi lbI ss units to provide t e esigna t ed suspe nsion rate.
** Pe netrati on factor (P . F.) is defined as the No . of Viab le pa rti cles col l ec ted bv the sampl ing probe from the downst r eam fi lt e r face multip l ied by the samp lin g factor (52), divided by the numher of viable particles challenging th e fi lter.
Efficiency = 100 (1 - P.F . ) to 6 significant figures .
Roving Probe Samples taken wi th in one inc h of exit face of HEPA fil t ers, sampling is isokinetic for the theoretical llneaT' flow r ate , as rat ed bv manufacturer.
Theo retical isokinetic flow rate 112.5 1 i nea r ft/min based on 50 cfm in an 8" x 8" duct. Isoki neti c samples were t aken at 1 cfm throu gh each samp ler .
I
I ------~
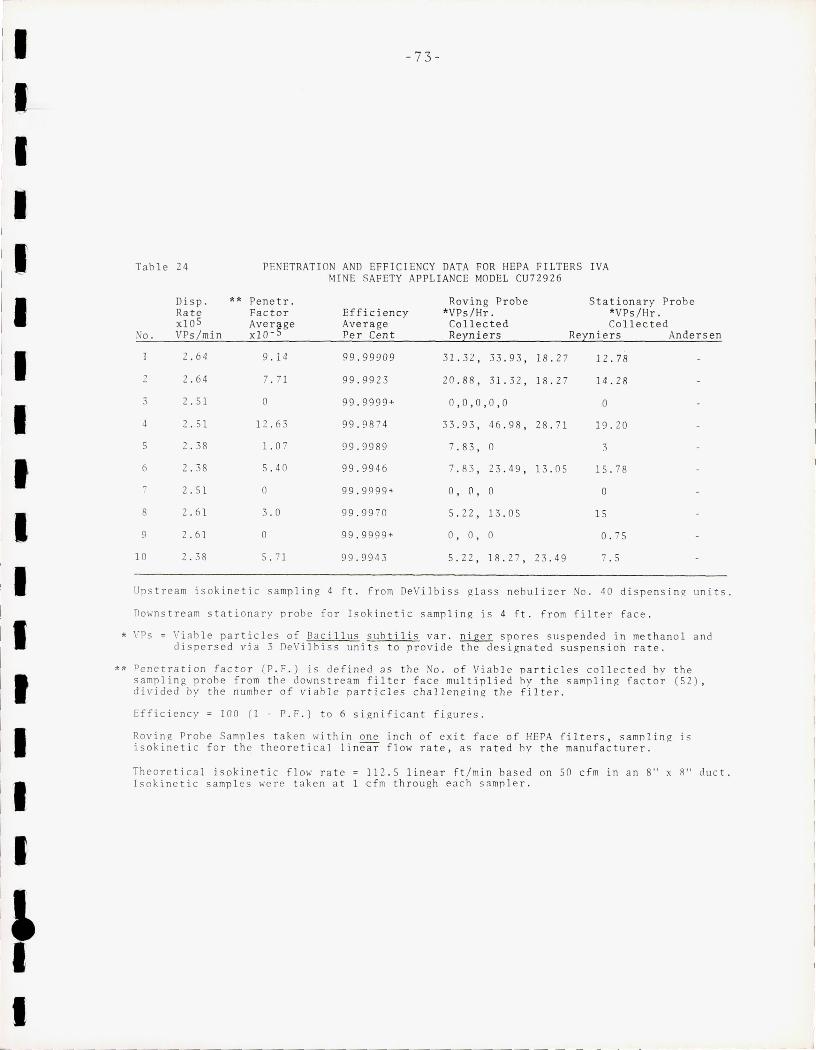
r I
[I II I
II il I I I I I
II II I I I I
I I I
'1 I
L I I
Tab l e 24
No.
2
3
4
5
6
7
8
9
1 0
Di sp . Rate x l OS VPs/mi n
2 . 64
2.64
2.51
2 . 51
2 . 38
2 .3 8
2 . 51
2 . 61
2 . 61
2 . 38
- 73 -
PENETRATI ON AND EFFICIENCY DATA FOR HEPA FI LTERS I VA MI NE SAFETY APPL I ANC E MODEL CU72926
** Pene tr. Factor Ave ra ge xl O- S
9 .1 4
7 . 71
o
1 2 . 63
1. 0 7
5 . 40
o
3 . 0
o
5 . 71
Eff i c i ency Ave r age Pe r Cent
99 . 9990 9
99 . 9923
99 . 9999 +
99 . 987 4
99 . 9989
99.9 94 6
99 . 9999 +
99 . 99 70
99 . 99 99 +
99 . 994 3
Rov i n g Pr obe *VP s /Hr.
Collec t e d Reyniers
31. 3 2 , 3 3 . 93 , 18 .2 7
20 . 88 , 31. 3 2 , 18 . 27
0 , 0 , 0 , 0 , 0
33 . 93 , 46 . 98 , 28 . 71
7 . 83 , 0
7 . 1\ 3 , 2 3 . 49 , 13 . 05
0 , 0, 0
5 . 22 , 1 3 . 05
0 , 0 , 0
5 . 22 , 1 8 . 27 , 23 . 49
Stationary Prob e *VPs/Hr. Collected
Reyn ie r s Andersen
1 2 . 78
14 . 28
o 19.20
1 5. 78
o
1 5
0 . 7 5
7 . 5
Ups tr eam i so kineti c s amp l i n g 4 ft . f r om DeVi l b i ss glass nebul ize r No . 40 d i spensin g unit s .
Down s tr eam s tati ona r y p r ob e fo r Is ok ine t ic samp l i ng is 4 ft . f r om fi lter face .
* \'Ps = Viab l e par t icl es of Bacillus sub tili s var . nige r spores sus pend ed in me th ano l and d i spe rsed v i a 3 DeV i lbi s s uni t s t o p r ov i de th e de si gna t e d s usp ensi on ra t e .
** Penet r a ti on fa c t o r ( P. F. ) is de fi ne d as th e No . of Vi ab l e parti c l e s co ll ec t ed by th e sampli ng prob e fr om t he dOHns t ream fil t e r f ace multipli ed hy t he samp lin g fac t or (52 ) , div i de d by the num be r of v i ab l e par t icles c hal l e nRing th e f ilt e r.
Ef f i c i ency = 100 ( I - P . F . ) to 6 sign if icant f igu r es .
Rov in g Pr obe Samp l es t ak en wi thi n one i nc h of e xi t face o f HEPA f ilt e r s , s amp l i ng i s is okin e ti c fo r th e t heo r e t ical l i nea r f l ow r a t e , as r a ted hy the manufactu r e r .
Theo r e t ica l isok i neti c flo~" rat e 11 2 . 5 line ar f t /m in based on 50 c f m in a n 8" x R" du c t . Isok in e ti c s ampl es we r e t ak en a t 1 c fm th r ough e a ch s ampl e r .
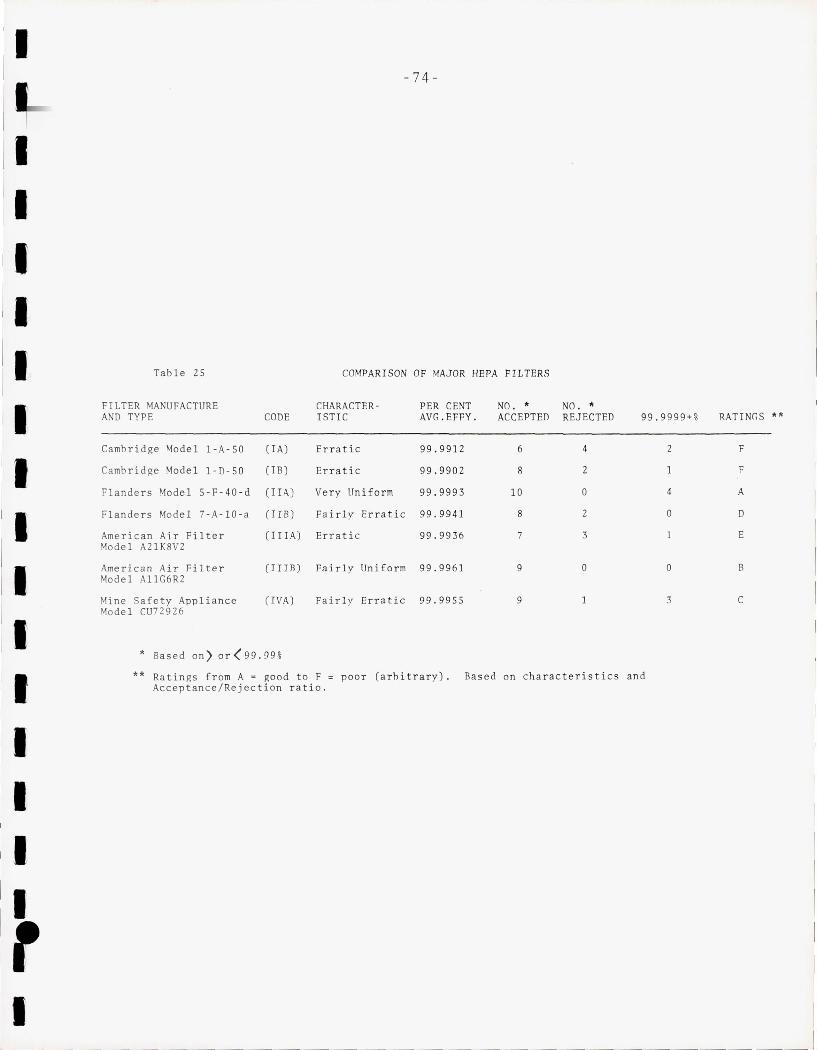
I II I. I, [. II
il II
:. 1.1 I, Ir I
Table 25
FILTER MANUFACTURE AND TYPE
Cambridge Model l-A-S O
Camb rid ge Model l-D-50
Flanders ~1ode 1 5-F-40-d
Flanders Model 7- A-l O-a
American Air Filter Model A2lK8V2
American Air Filte r Model AllG6R2
Mine Safe ty Appliance Mode l CU72926
CODE
(IA)
( IB)
( ITA )
(I IB )
(IT TA)
(I lI B)
el VA)
.. Based on ) or < 99 . 99%
-74-
COMPARISON OF MAJOR HEPA FILTERS
CHARACTERISTIC
Errati c
Erratic
Very Uniform
Fairly Erratic
Erratic
Fairly Uniform
Fairly Erratic
PER CENT AVG . EFFY.
99.9912
99.9902
99.9993
99.9941
99.9936
99.9961
99.9955
NO . " NO ." ACCEPTED REJEC TED
6 4
8 2
10 0
8 2
7 3
9 0
9 1
** Ratings f rom A = good to F = poor (arbitrary) . Based on characteristics Acceptance/ Rej ec ti on ratio.
99.9 999 +% RATINGS **
2 F
1 F
4 A
0 D
1 E
0 B
3 C
and
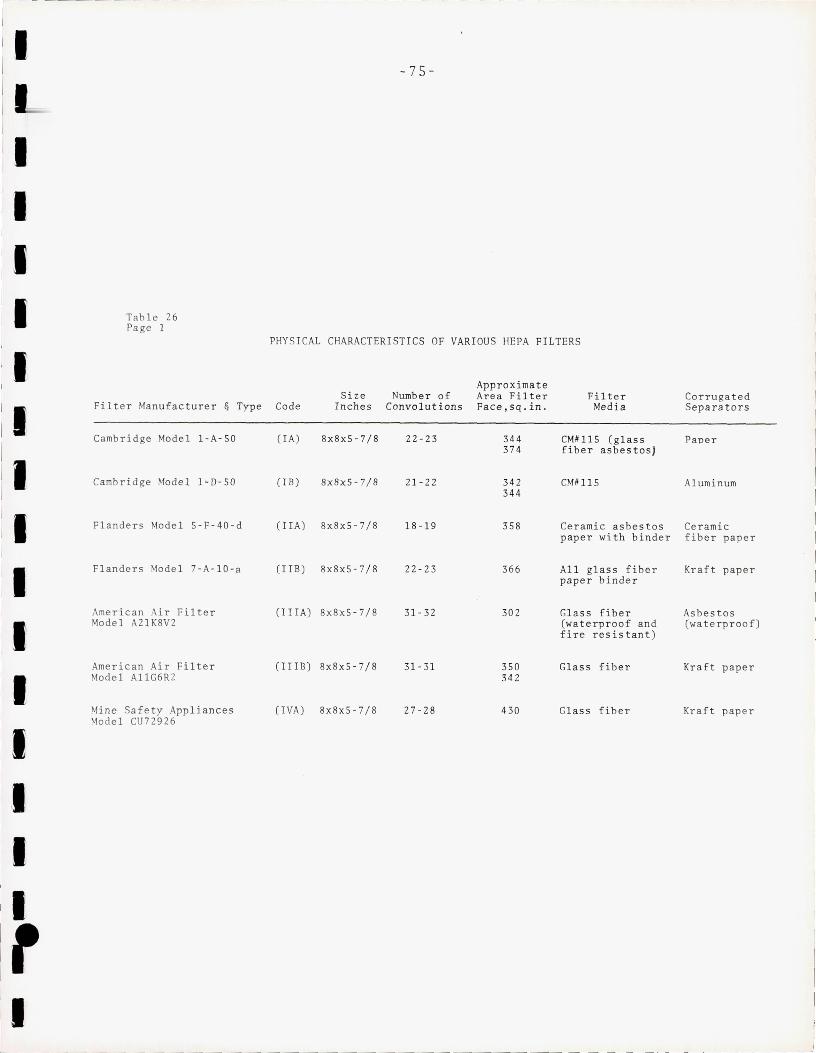
~--- - ---------I II I
I
I
i. il il :1 I
:1 :. :. I
:1 I I I
Table 26 Page 1
Filter Manufacturer &
Cambridge Model l-A-SO
Cambridge Model I-D-SO
Type
Flanders Model S-F-40-d
Flanders Model 7-A-IO-a
American Air Filter Model A21K8V2
American Air Filter Model AllG6R 2
Mine Safety Appliances Model CU72926
-75-
PHYS I CAL CHARACTERIST ICS OF VARIOUS HEPA FILTERS
Approximate Size Number of Area Filter Fi lte r Corrugated
Code Inches Convolutions Face,sq.in. Media Separators
(IA) 8x8x S-7/8 22-23 344 CM# 115 (g lass Pape r 374 fiber asbestos)
(I B) 8x8x 5-7/8 21-22 34 2 CMH 11 5 Alumi num 344
(I IA ) 8x8x S-7/8 18-19 358 Ceramic asbestos Ce ramic paper with binder fibe r paper
( IrB ) 8x8xS-7/8 22-23 366 All glass fiber Kraft paper paper binde r
(I IIA) 8x8xS -7 /8 31-32 30 2 Gl ass fiber Asbestos (waterproof and (wa t erp roof) fi r e resistant)
(IrIB) 8x8x 5- 7/8 31- 31 3S0 Glass fiber Kraft paper 342
(IVA) 8x8xS-7/8 27-28 430 Gl ass fiber Kraft paper
i ________ J
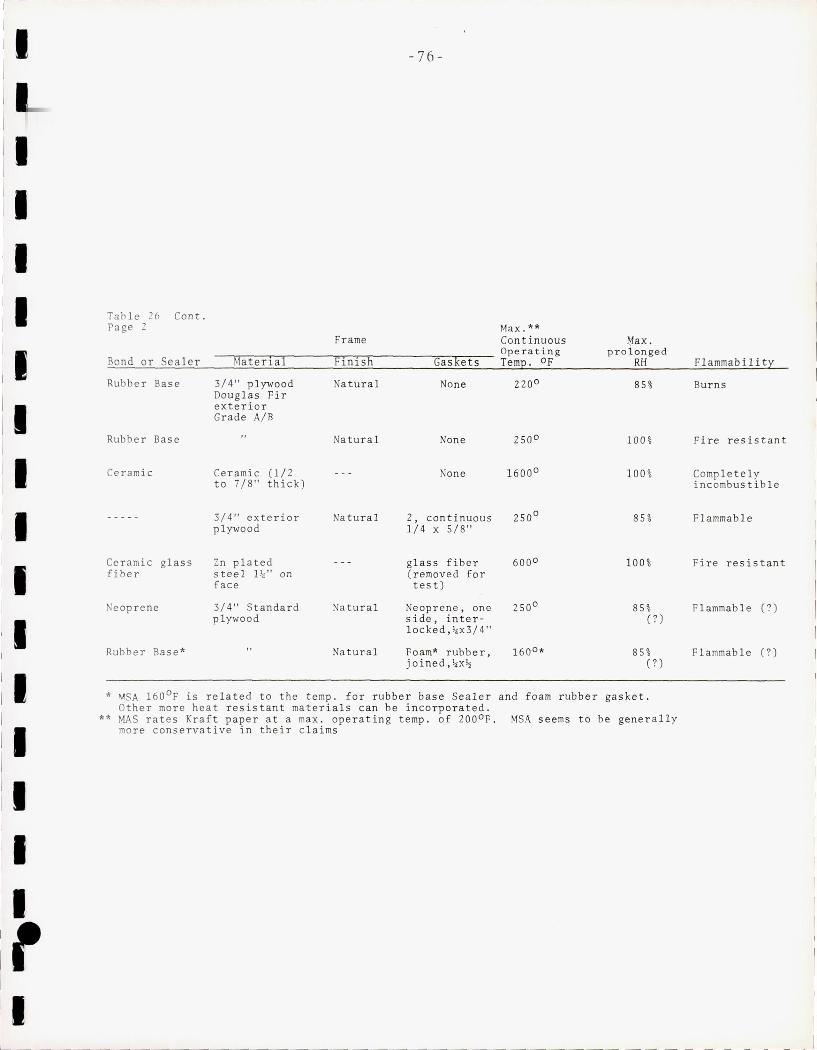
i~
II I I I
I
il
:1 :1 :. il :. I
II
I
- 76-
Tahle 26 Cont. Page 2
Frame Max."* Co ntinuous
--~~--'-.-------~r-r-r---------~-,--~-- Ope rat i ng Bond or Sea ler Mater ial Fi nish Ga s ke ts Temp . of
Rubber Base 3/4" plywood Douglas Fir exterior Grade A/B
Rubber Base
Ceramic Ceramic (1/2 to 7/8" thick)
Ce ramic glass fiber
Neop rene
Rubber Base*
3/4" exte rior plywood
Zn plated s t ee l l l,r " on face
3/4 " Standard plywood
Natural
Natural
Na t ural
Na tural
Natura l
None
None
None
2, continuous 1/4 x 5/8"
glass fiber ( removed fo r test )
Neoprene , one side, int e r-10cke d, l,rx3/4 "
Fo am* rubber, jo ined, l,rx~
220 0
250 0
600 0
~ax . prolonged
RH
85%
100%
100 %
85%
100 %
85% (?)
85% (?)
* MSA 160°F is related to the temp. for rubber base Seale r Other more heat resistant materia ls can be incorpo r ated.
** MAS rates Kraf t paper at a max . operating temp . of 200 0F. more conse r vative in their c l a ims
and foam rubber gasket.
MSA seems to be gener al l y
Flammabili ty
Burns
Fi r e r e s istant
Complete l y in c ombustible
Flammab le
Fire re sis tant
Flammab l e (?)
Flammable (?)
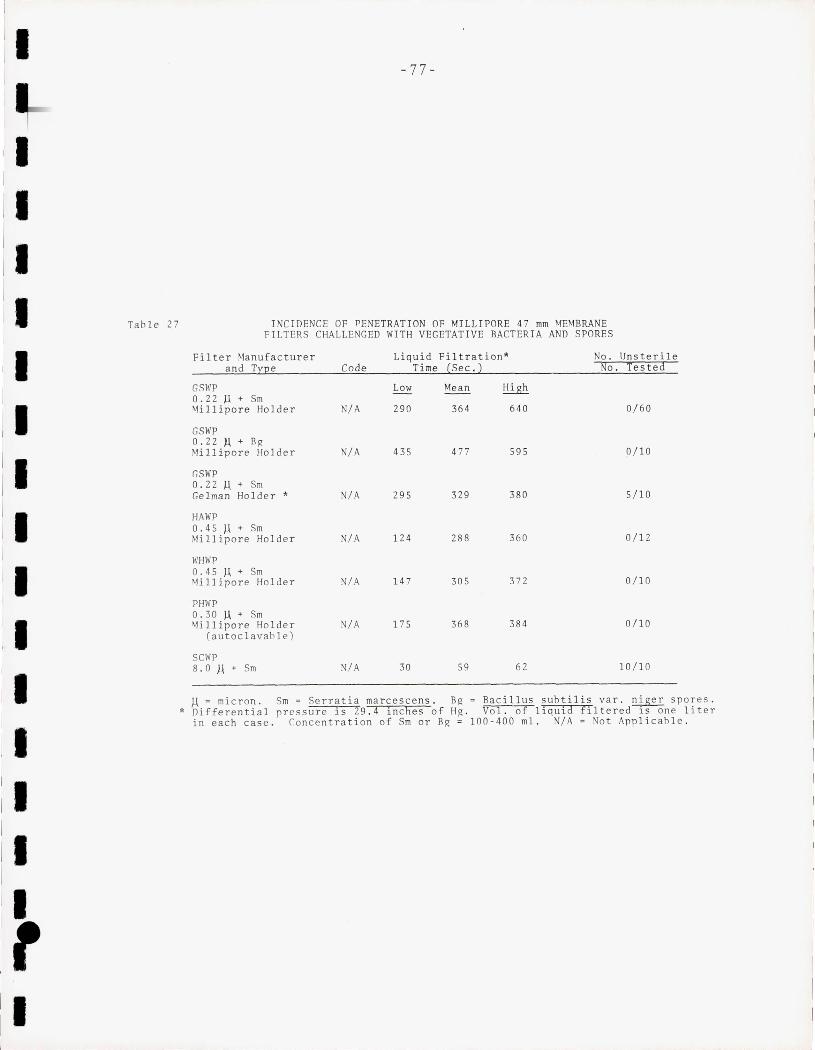
i
[-I
I
II I
II :. 'I , Table 27
II I
II il il I I
,I :. *
I. I
I I
II
it II
- 77-
INCIDENCE OF PENETRATION OF MILLIPORE 47 mm MEMBRANE FILTERS CHALLENGED WITH VEGETATIVE BACTERIA AND SPORES
Filter Manufac turer Liquid Fil t r ation* o . Unsterile and T:[Qe Code Time (Se c . ) No. Testea:
GSWP Low Mean High 0.22 JJ + Sm ~1illipore Holde r N/A 290 364 640 0/60
GSWP 0.22 J.( + Bg Millipore Holde r N/A 435 477 595 0/10
r,SWP 0.22 A + Sm Gelman Holder * N/A 295 329 380 5/10
HAWP 0.45 JJ + Sm Millipore Holder N/A 124 288 360 0/12
WHWP 0.45 JJ + Sm Millipore Holder N/A 147 305 372 0/10
PHWP 0.30 JJ + Sm Millipore Holder N/A 175 368 384 0/10
(autoc1avah1e)
SCWP 8.0 H + Sm N/A 30 59 62 10/10
A : micron. Sm : Serratia marcescens . Bg = Baci llus subti1is var . niger spores. Differential pressure is 29 . 4 inches of Hg . Vol. of liquia: filtered is one liter in each case. l.oncentration of Srn or Bg = 100-400 mI. N/A = Not Applicable.
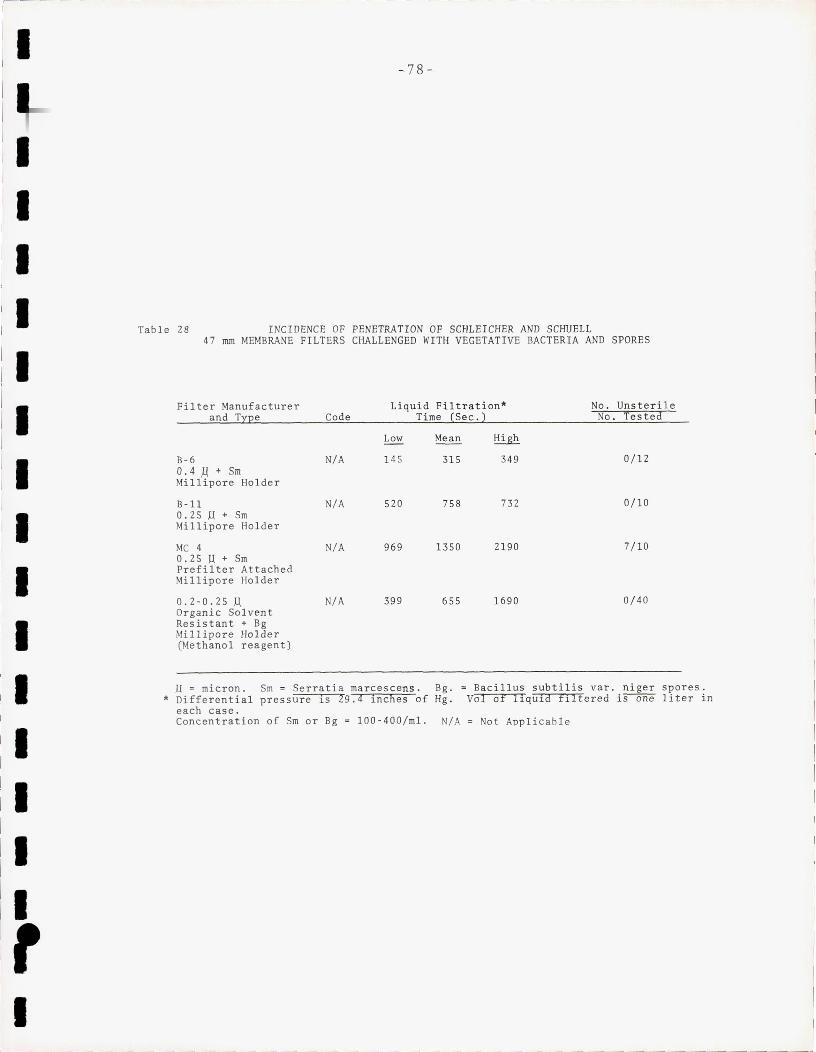
r
II I I
II I
il II I
II I ! I I ,
I I
I I I
'I I
I I I I I I I r I
-78-
Table 28 INCIDENCE OF PENETRATION OF SCHLEICHER AND SCHUELL 47 mm MEMBRANE FILTERS CHALLENGED WITH VEGETATIVE BAC TERIA AND SPORES
Filter Manufacturer Liquid Filtration* No . Unsterile and Type Code Time (Sec. ) No. Tested
Low Mean High
B-6 N/A 145 315 349 0/12 0.4 ,l.1 + Sm Millipore Holder
B-ll N/A 520 758 732 0/10 0.25.u + Sm Millipore Holder
MC 4 N/A 969 1350 2190 7/10 0.25 Jl + Sm Prefilter Attached Millipore Holder
0.2-0.25 A N/A 399 655 1690 0/40 Organic Solvent Resistant + Bg Millipore Holder (Methanol reagent)
II = micron . Sm = Serratia marcescens. Bg. = Bacillus subtilis var. niger spores. * Differential pressure is 29.4 ~nches of Hg . Vol of llqU~d fIlt ered is one liter in
each case. Concentration of Sm or Bg = 100-400/ml. N/A = Not Applicable
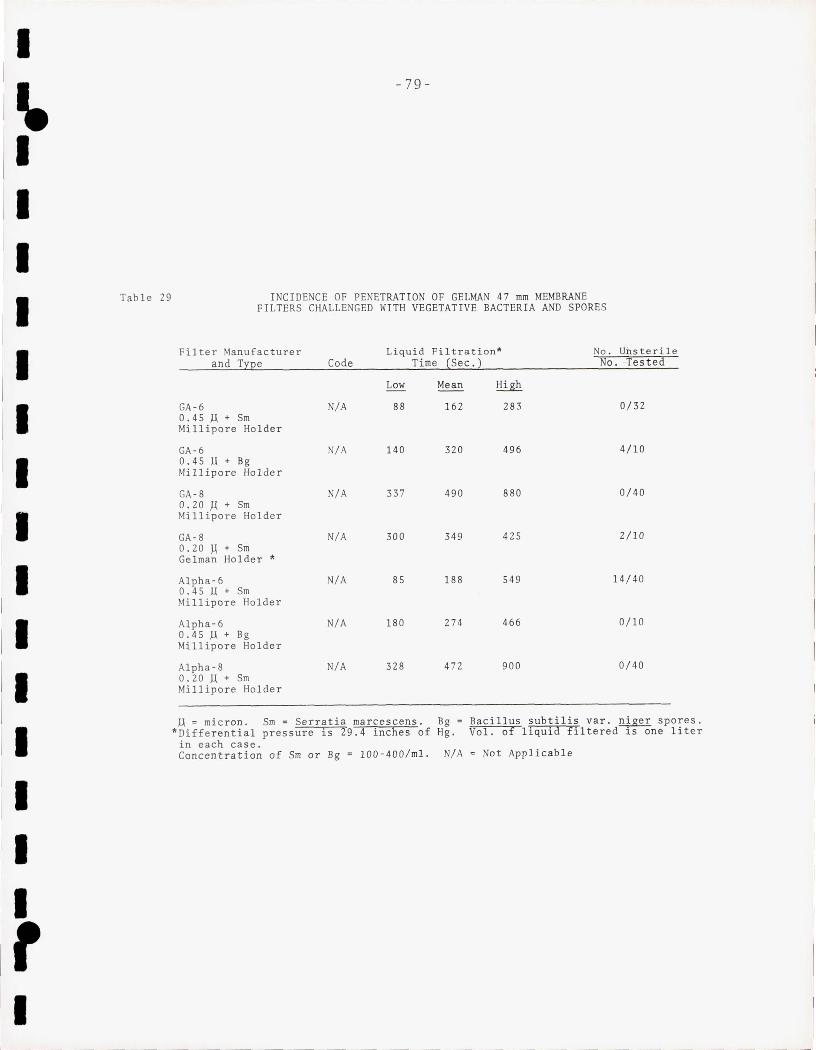
[I - ~
I .. I
,I il I
II
II
II [ I [ I
II I.
:. II I. II t
II
Table 29
-79-
INCIDENCE OF PENETRATION OF GELMAN 47 mm MEMBRANE FILTERS CHALLENGED WITH VEGETATIVE BACTERIA AND SPORES
Filter Manufacturer and Type
GA-6 0 .4 5 P. + Sm Millipore Holder
GA-6 0 .4 5 L\ + Bg Millipore Holder
GA- 8 0.20 )1. + Sm Millipore Holder
GA-8 0.20 J.I + Sm Gelman Holder 1<
Alpha-6 0.45 II + Sm Millipore Holder
Alpha-6 0.45 P. + Bg Millipore Holder
Alpha-a 0.20 J.l. + Sm Millipore Holder
Code
N/A
N/A
N/A
N/A
N/A
N/A
N/A
Liquid Fi ltration* Time (Sec . )
Low
88
140
337
300
85
18 0
328
Mean
162
320
490
349
188
274
472
High
283
496
880
425
549
466
900
No . Unsterile No. Test ed
0/32
4/10
0/40
2/10
14/40
0/10
0/40
p. = micron. Sm = Ser rat ia marcescens. *Differential pressure is 29.4 inches of
in each case.
Bg = Bacillus subtilis var. n~ger spores. Hg. Vol. of liquid filtered 1S one liter
Concentration of Sm or Bg = 100-400/ml. N/A = Not Applicable
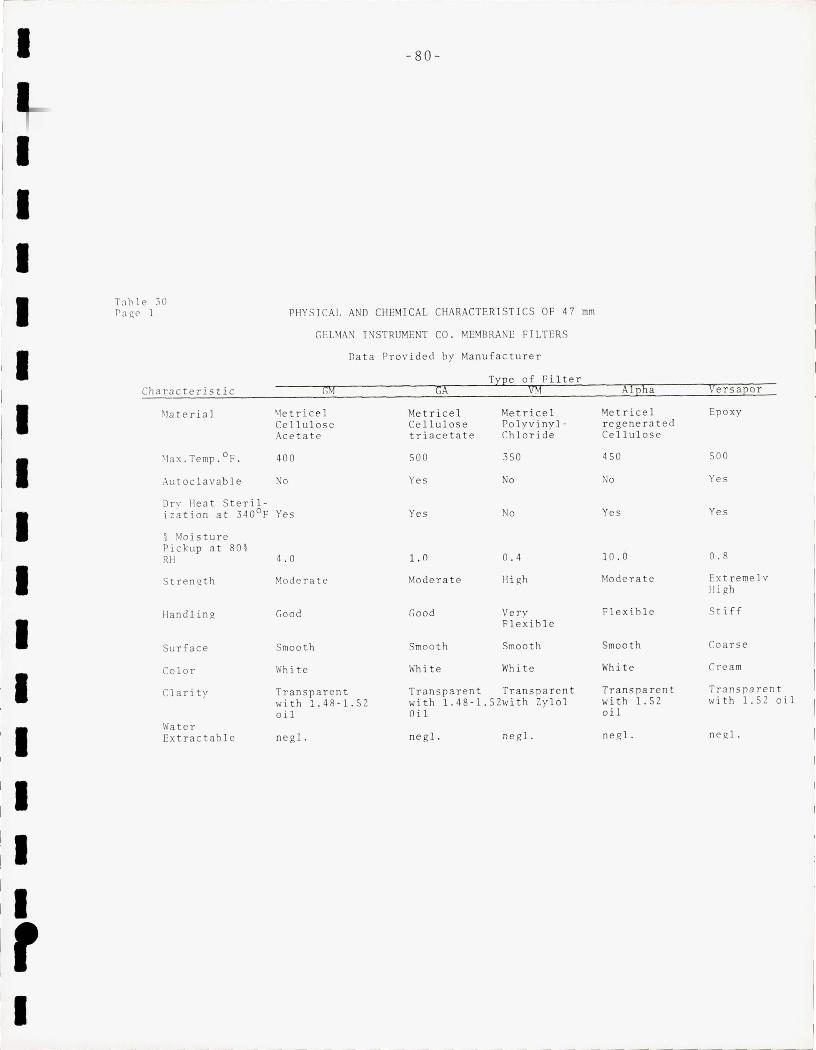
I
I /1 'I /
/1 :1 II I
I i l il I
-80 -
T:-thle 30 Pa gc 1 PHYS I CAL AND CHEMICA L CHARACTER TSTICS OF 47 mm
GEL 1AN I NSTRUMENT CO . MEMBRANE FILTERS
Data Provided by Manufa c turer
Characteris tic
' Iater i al
GM
'Ie tricel Ce llul ose Acetate
~ax.Temp.oF . 400
Autoclavabl e No
Drv Hea t St e rilization at 340 0 F Yes
% Mois ture Pickup at 80% RH 4 . 0
Strength
Handling
Surface
Color
Cla rity
Water Extractab l e
Moderate
Good
Smooth
Wh it e
Transparen t with 1.48-1.5 2 oi l
neg l.
Type of Fi lter GA VM
Metricel Metricel Ce llulos e Po l yvinyl-triac e tat e Chloride
500 350
Yes No
Yes No
1. 0 0 . 4
Moderate Hi gh
Good Very Flexible
Smoo th Smoo th
White White
Transparent Transparent with 1.4 8- I . s2with Zylol Oil
negl . negl .
Alpha Versapor
Metricel Epoxy r ege nerat ed Ce llul ose
450 500
No Yes
Yes Yes
10 . 0 0.8
~1odera te Ext r emelv High
Flexible St i ff
Smooth Coa r se
Il'hi t e Cream
Tr an sparent Transpa r en t wi th 1. 52 with 1. 5 Z oil oil
ne g l. negl .
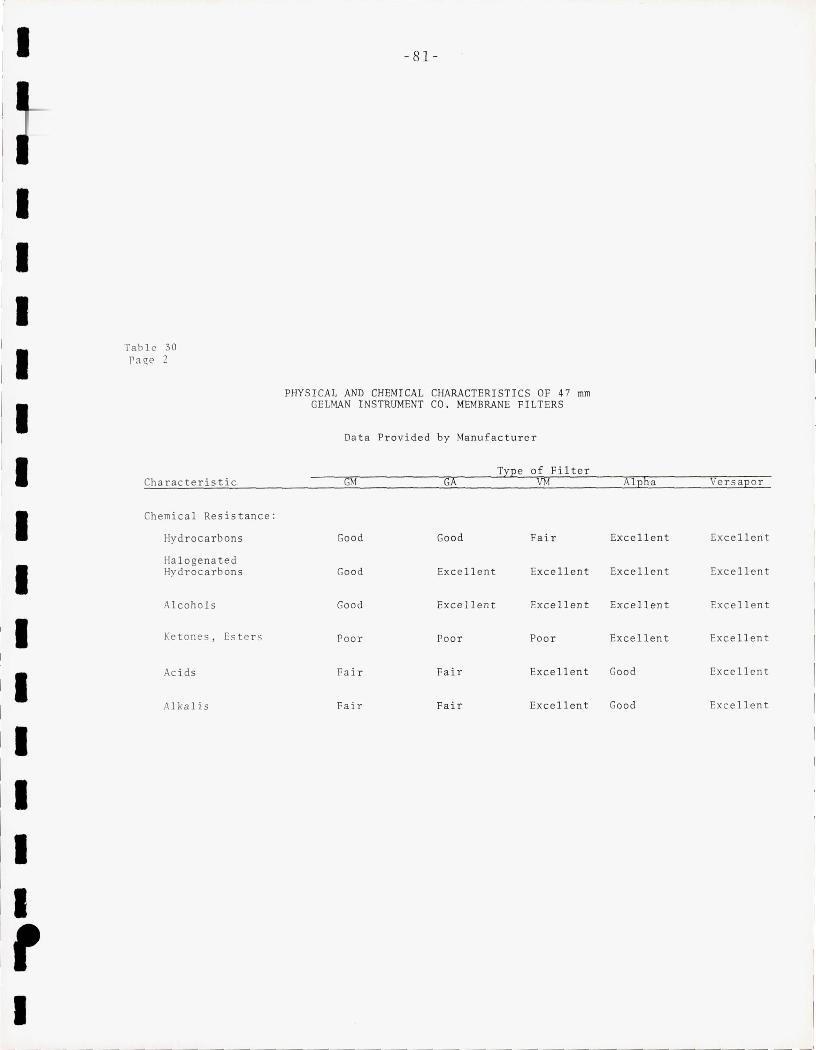
I [I
i
l il jl il
il il i. :. It I
I
Tab l e 30 Pa ge 2
Charac t e r is ti c
Chem i ca l Re s i stance :
Hydrocarbons
Ha l ogena t ed Hydroca r bons
Al cohols
Ke t ones , Es t e r s
Ac i ds
Alka l is
- 81-
PHYSICAL AND CHEMI CAL CHARACTER I STICS OF 47 mm GELMAN INSTRUMENT CO . MEMBRANE FILTERS
Da t a Provided by Manufactu r er
Tne of Filter GM GA VM Alpha Ve r s ap or
Good Good Fair Excellent Excell ent
Goo d Excellent Excellent Excellent Exce ll ent
Good Excell en t Excellent Excellent Exce ll ent
Poo r Poor Poor Excellent Exce ll ent
Fair Fair Excellent Good Exce ll ent
Fair Fair Excellent Good Exce ll ent
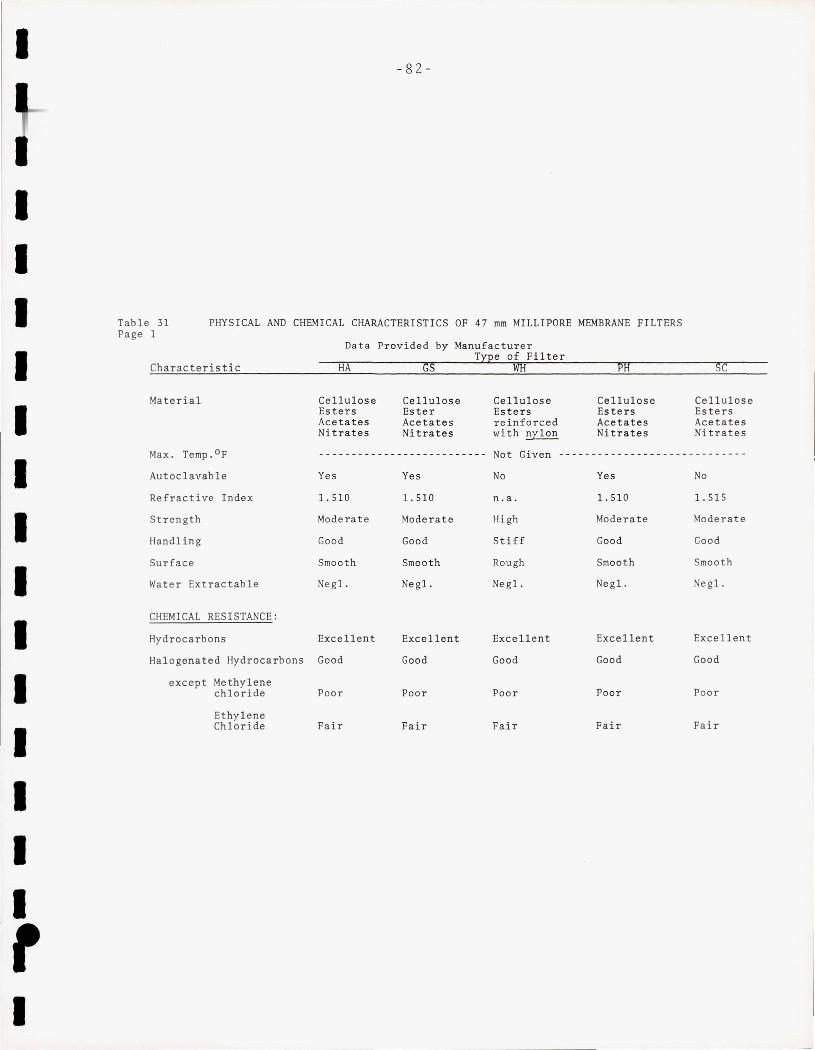
I
I I I I I I I I I I I I I I I , I
- 8 2-
Tab Ie 31 Page 1
PHYSI CAL AND CHEMI CAL CHARACTERISTICS OF 47 mm MILLIPORE MEMBRANE FILTERS
Charac teri stic
Mate r ial
Max. Temp.oF
Autoclavable
Refractive Index
Strength
Handling
Surface
Water Extractable
CHEMICAL RESISTANCE :
Hydrocarbons
Data Provided by Manuf acturer Type of Filter
HA GS WH
Ce llulose Esters Acetates Ni trates
Yes
1. SIO
Mode rat e
Good
Smoo th
Negl.
Excell ent
Cellulose Ester Acetates Nitrates
Yes
1. SIO
Moderate
Good
Smooth
Ne gl .
Excellent
Cellulose Esters r e inf orced with ny lon
Not Given
No
n.a.
High
Stiff
Rough
Neg l .
Excellent
Halogenated Hydrocarbons Go od Good Good
except Methylene chloride
Ethy l ene Ch l oride
Poor
Fa i r
Poor Poor
Fair Fair
PH
Cellulose Esters Acetates Nitrates
Yes
1 . SlO
Moderate
Good
Smoo t h
Negl.
Ex cel lent
Good
Poor
Fa i r
sc
Ce ll u los e Esters Acetates Ni t rat es
No
1 . SlS
Moderate
Goo d
Smooth
Negl.
Excellent
Good
Poor
Fair
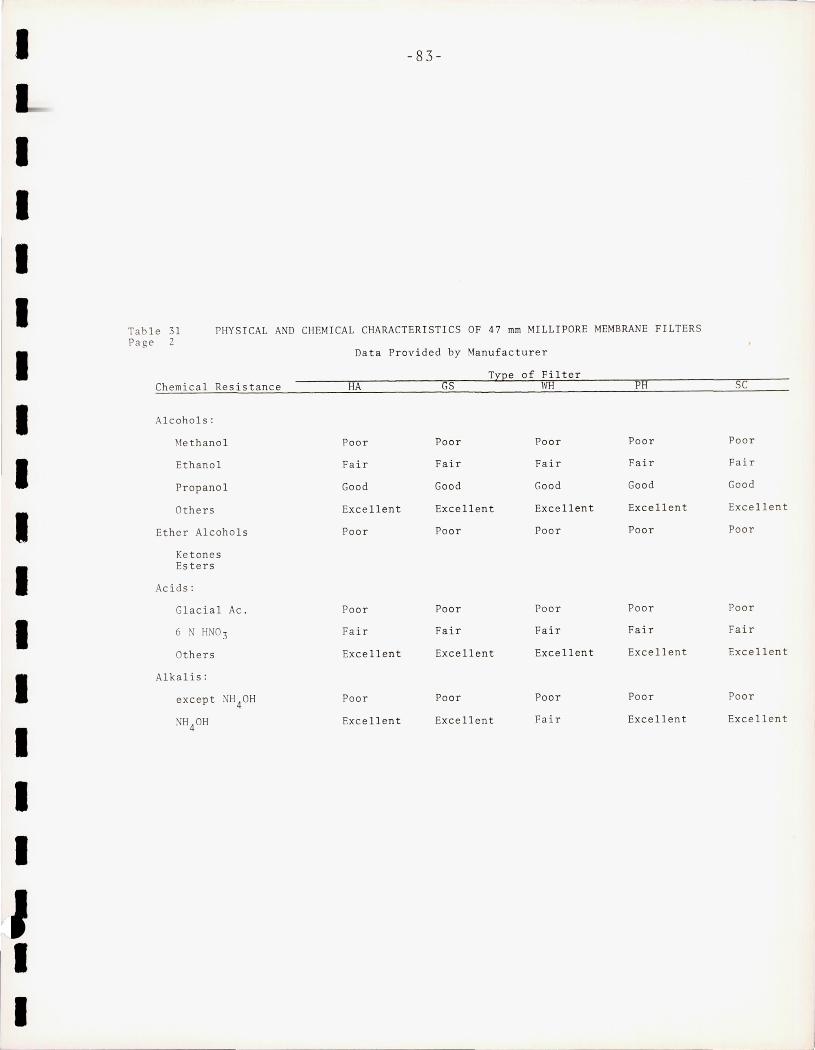
~- ---
I - 83-
I I I I I
Table 31 PHYSICAL AND CHEMICAL CHARACTERI STICS OF 47 mm MILL IPORE MEMBRANE FILTERS Page 2
I Data Prov i ded by Manuf ac t urer
TlEe of Fi lter Chemical Resistance HA GS WH PH SC
I Alcohols :
~le th ano l Poor Poor Po or Poor Poor
I Ethanol Fair Fai r Fair Fair Fair
Propano l Go od Go od Good Go od Good
I Others Exce llent Excell ent Excel lent Excellent Excellent
Ether Alcohols Poor Po or Poor Po or Poor
Ketones
I Esters
Acids:
Glacia l Ac. Poor Poor Poor Poor Poor
I 6 N HN0 3 Fair Fai r Fair Fai r Fair
Others Exce ll ent Ex cell ent Excell ent Excellent Excellent
I Alka lis :
except NH40H Poor Poor Po or Poor Poor
I NH 40H Exce ll ent Excellen t Fair Ex cellent Excellent
I I
~ I
II
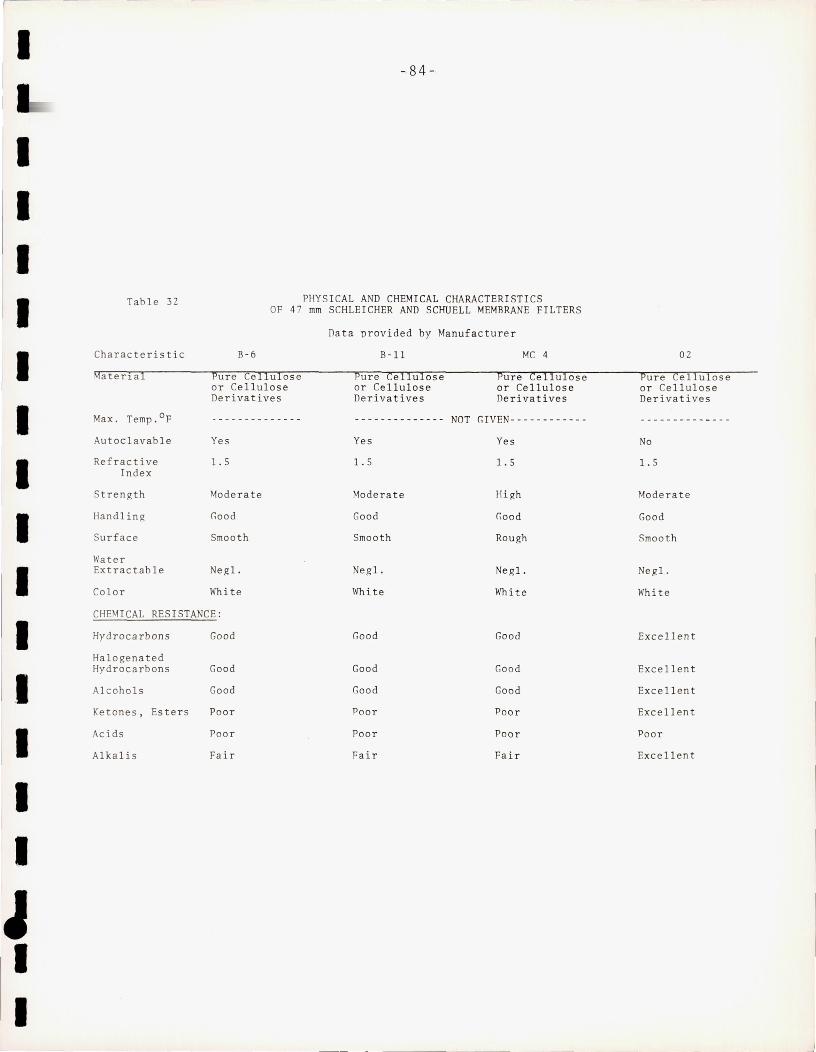
I
I I I I I I I I I I I I I I
~ I I
-·84 -
Table 32 PHYSICAL AND CHEMICAL CHARACTERISTICS OF 47 mm SCHLEICHER AND SCHUELL MEMBRANE FILTERS
Characte ristic
Max. Temp.oF
Autoclavab le
Refractive Index
Str ength
Handling
Surface
Wate r Extractable
Colo r
B-6
Pure Cellulose or Cellulose Derivatives
Yes
1.5
Moderate
Good
Smooth
Ne gl.
White
CHEMICAL RESISTANCE:
Hydrocarbons
Halogenated Hydrocarbons
Al cohol s
Keto ne s, Est er s
Acids
Alkalis
Good
Good
Good
Poor
Poo r
Fair
Data provided by Manufacturer
B-ll
Pure Ce llulose or Ce llulose Derivatives
Yes
1.5
Modera te
Good
Smooth
Negl .
Whi te
Good
Good
Good
Poor
Poor
Fai r
Me 4
Pure Cellulose or Cellulose Derivatives
NOT GIVEN------------
Yes
1.5
High
Good
Rough
Negl.
Whi te
Good
Good
Good
Poor
Poor
Fair
02
Pure Cellu l ose or Ce llulose Der iva tive s
No
1.5
Moderate
Good
Smo oth
Negl .
White
Excellent
Excellen t
Excellent
Ex ce ll ent
Poor
Excellent
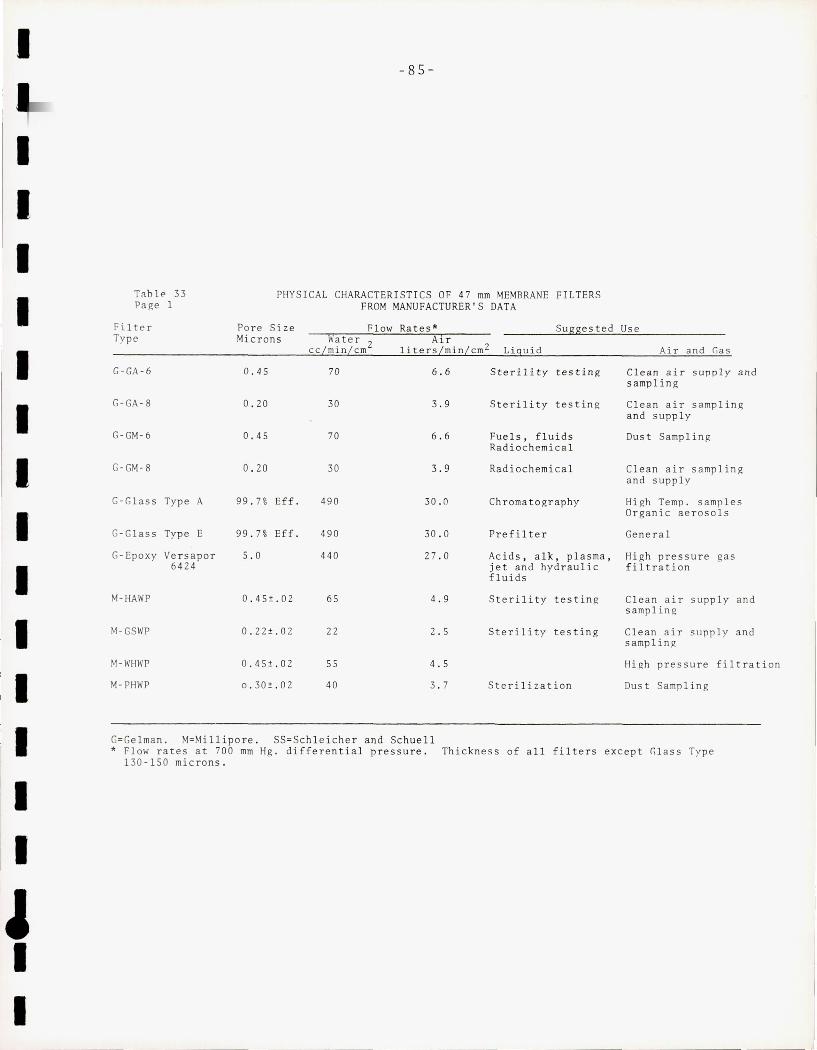
I-
I
I I I I I I I I I I I I I I
, I I
Table 33 Page I
Filter Type
G-GA -6
G-GA-8
G-GM - 6
G- GM -8
G-Glass Type A
G-Glass Type E
G-Epoxy Ve r sapo r 6424
M-HAWP
M-GSWP
-8 5-
PHYSICAL CHARACTERISTICS OF 47 mm MEMBRANE FILTERS FROM MANUFACTURER ' S DATA
Pore Siz e Flow Rat es * Suggested Us e Microns Water 2 Ai r
0 .45
0 . 20
0.45
0.20
99.7 % Eff.
99.7% Eff .
5.0
0 . 45±.02
0.22±.02
cc/min/cm liters / min /cm2 Liqui d Air and Gas
70 6 . 6
30 3.9
70 6.6
30 3 . 9
490 30 . 0
490 30 . 0
440 27.0
65 4 . 9
22 2 .S
Sterili t y testing Clean ai r supply and samplin g
Sterility testin g Clean air sampl ing and supply
Fuels, f l uids Dust Samp ling Radiochemi ca l
Radiochemical Clean ai r samp lin g and supply
Chroma t ography Hi gh Temp. samp l es Organi c aerosols
Prefilter General
Acids , alk, plasma, High pressure gas je t and hydraulic filtration fluids
St erility testin g Cl ean air supply and samp l ing
Sterility testing Clean air supply and sampling
~1-WHWP 0.45± .0 2 SS
40
4. S
3 . 7
Hi gh pressure filtration
M-PHWP o .30±.02 Sterili za tion Dust Samplin g
G=Gelman. M=Millipo re. SS=Schleicher and Schuell * Flow r ates at 700 mm Hg . differential pressu r e. Thickness of all fi lters except "lass Type
130 -15 0 microns.
I I
_1
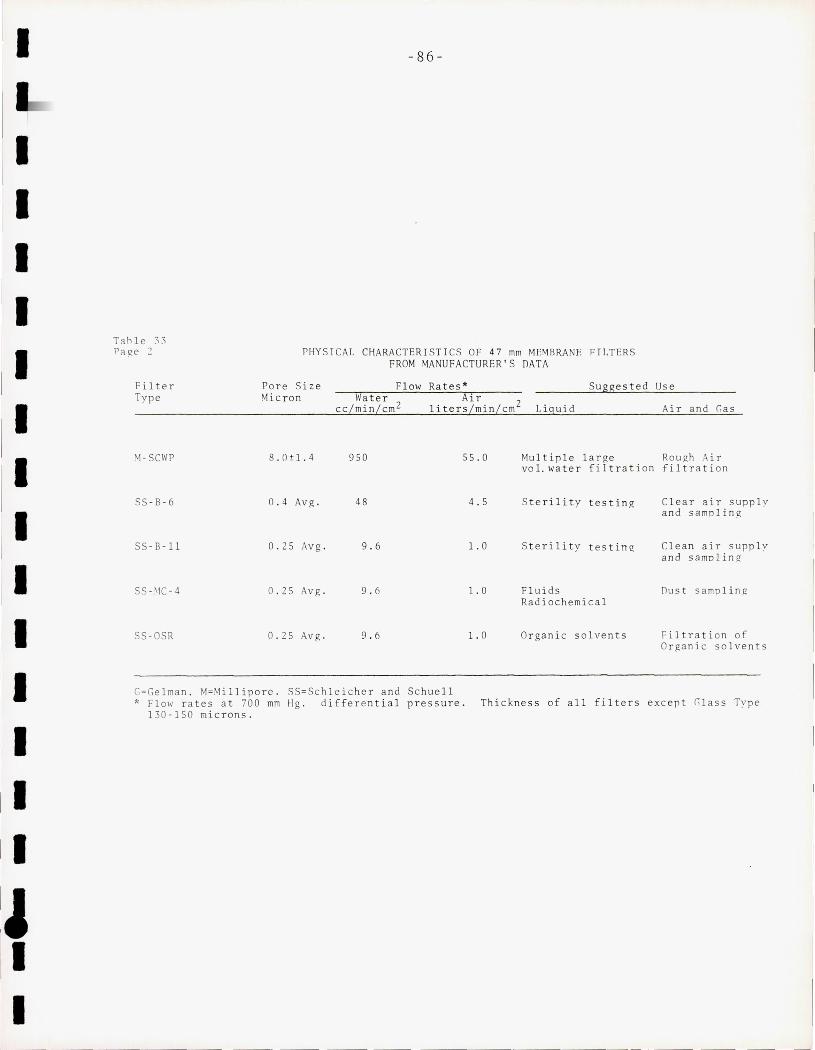
I
I I I I I I I I I I I I I II
I
Table ~:I Page 2
-86-
PHYSICAL CHARACTERISTICS OF 47 mm MEMBRANE FILTERS FROM MANUFACTURER'S DATA
Fi lter Type
Pore Size Mic ron
Flow Rates * Suggested Use Water Air
cc/min / cm 2 liters /mi n/cm 2 Liquid Air and Gas
'1-SCWP 8 . 0 ±1.4 950 55 . 0 Multiple large Rough Air vol. 'vater filtration filtr a tion
SS-B - 6 0 . 4 Avg . 48 4.5 St e ril ity t e stin g Clear air supp l y and sa mplin g
SS-B -11 0 . 25 Avg . 9 . 6 1.0 St erili t y t e sting Clean air supp l y and sampling
0 . 25 Avg. 9 . 6 1.0 Fluid s Oust sampl in g Rad ioch emical
SS-OSR 0 . 25 Avg . 9 . 6 1.0 Or ganic solvent s Filt r a ti on of Organic solve n ts
G;Gelman . M;Mi lli po r e . SS; Sch l eic he r a nd Schue ll * Flow rates a t 700 mm Hg , d i ffere ntial pressure, Th i ckness of all fi lters except Glass Tvp e
130-150 microns,
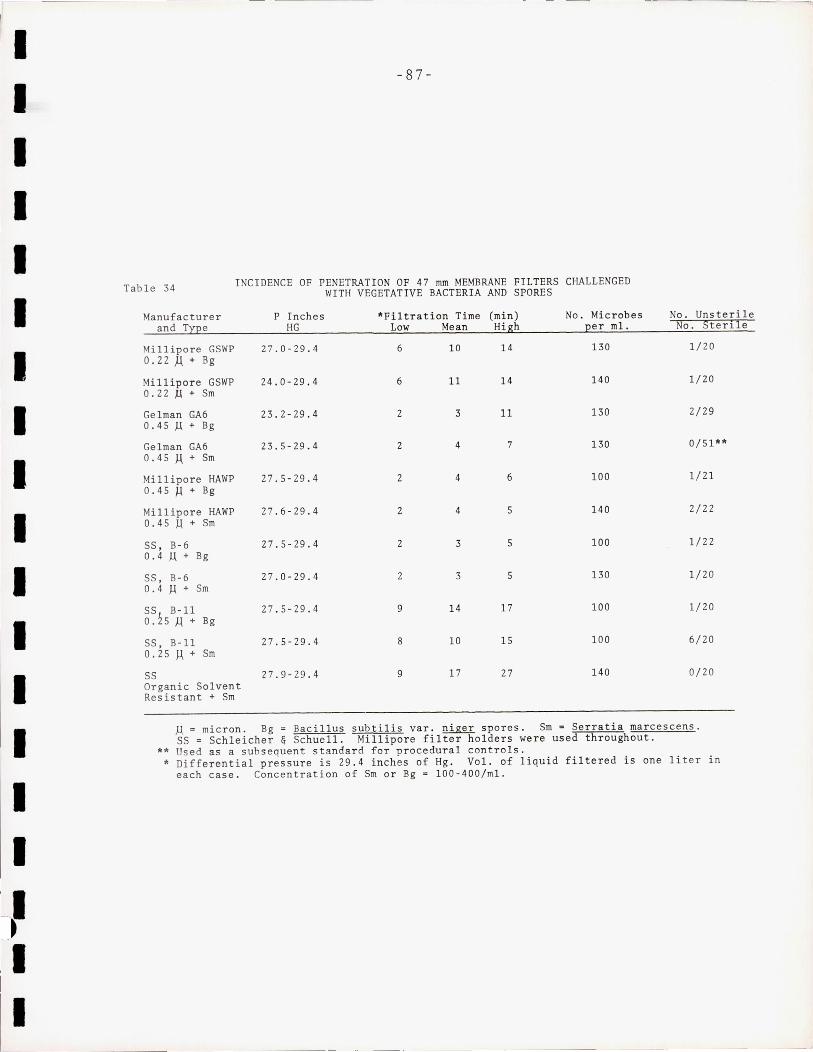
I I I I I I I I I I I I I I I I I
I
-87-
Table 34 INCIDENCE OF PENETRATION OF 47 mm MEMBRANE FILTERS CHALLENGED WITH VEGETATIVE BACTERIA AND SPORES
Manufacturer and Type
Mi 11 ipore GSWP 0.22p+Bg
Millipore GSWP 0.22.u + Sm
Gelman GA6 0.45 ]..I + Bg
Gelman GA6 0.45 A + Sm
Mi11ipore HAWP 0.45}J. + Bg
Millipore HAWP 0.45 )..I + Sm
SS, B- 6 0 . 4 )..I + Bg
SS, B - 6 0.4 )..I + Sm
SS, B-ll 0.25,l.\+Bg
SS, B-11 0.25 A + Sm
SS Organic Solvent Resistant + Sm
PInches HG
27.0-29 . 4
24 .0-29.4
23.2-29.4
23.5-29 . 4
27.5 - 29.4
27.6-29 .4
27 . 5-29.4
27.0-29.4
27.5-29 . 4
27.5-29.4
27 . 9-29 . 4
*Filtration Time (min) Low Mean High
6 10 14
6 11 14
2 3 11
2 4 7
2 4 6
2 4 5
2 3 5
2 3 5
9 14 17
8 10 15
9 17 27
No . Microbes per mI.
130
140
130
130
100
140
100
130
100
100
140
No. Unste ril e No. Sterile
1/20
1/20
2/29
0/51**
1/21
2/22
1/22
1/20
1/20
6/20
0/20
]..I = micron. Bg = Bacil lus sub tilis var . niger spores . Sm = Serratia marcescens. SS = Schleicher & Schuell. Millipore filter holders were used throughout .
** Used as a subsequent standar d for procedural controls. * Differential pressure is 29.4 inches of Hg. Vol. of liquid filtered is one liter in
each case. Concentration of Sm or Bg = 100-400/m1.
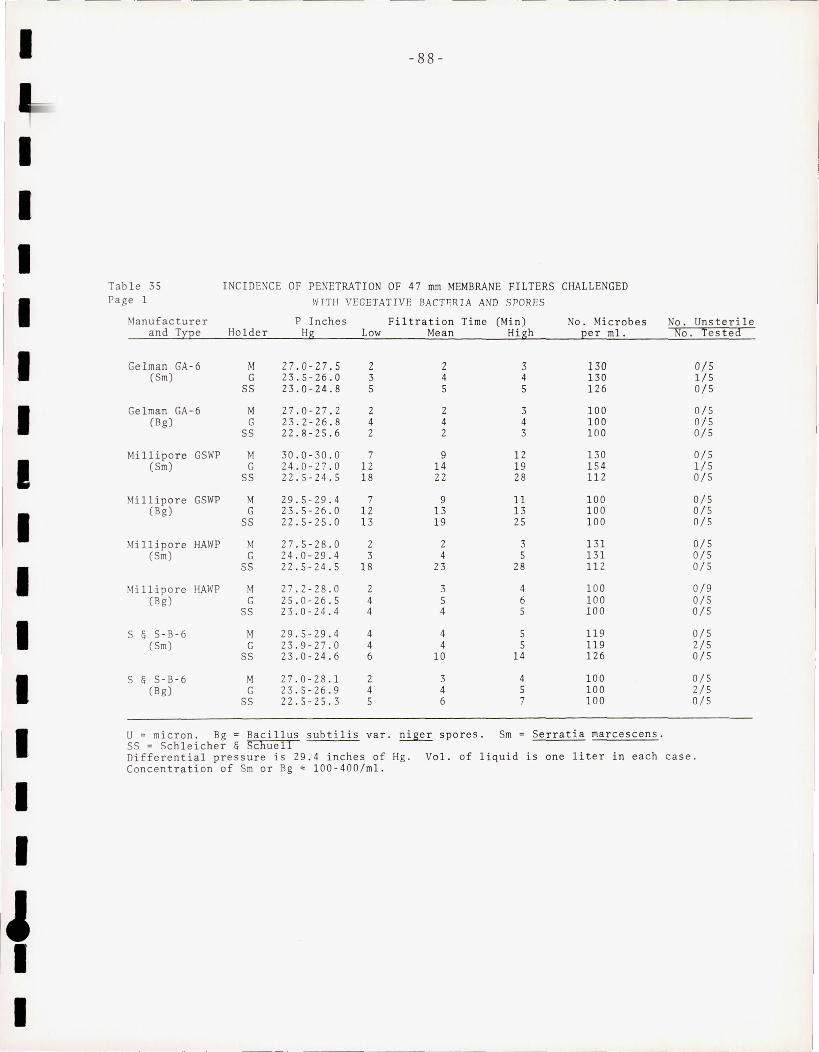
I - 88 -
I I I
Table 35 INCID ENCE OF PENETRAT ION OF 47 mm MEMBRANE FILTERS CHALLENGED
I Page 1 WTTH VEGE TATIVE BACT~RIA AND SPOR ES
Manufacturer PInches Filtration Time (Min ) No. Mic r obe s No. Unsterile and Type Holder Hg Low Mean High per mI. No. Tes tea
Gelman GA-6 M 27.0-27 .5 2 2 3 130 0/5 (Sm) G 23 . 5-26 . 0 3 4 4 130 liS I
SS 23.0-24 . 8 5 5 5 126 0/5
Ge lman GA-6 M 27 . 0 - 27.2 2 2 3 100 O/S (Bg) G 23 . 2-26.8 4 4 4 100 0/5
SS 22.8-25 . 6 2 2 3 100 O/S I Millipore GSWP M 30.0 - 30.0 7 9 12 130 0/5
(Sm) G 24.0 - 27 . 0 12 14 19 154 1/5 SS 22.5 -2 4 . 5 18 22 28 112 0/5 I
Mi llipore GSWP M 29 . 5-29 . 4 7 9 11 100 0/5 (Bg) G 23.5 - 26 . 0 12 13 13 100 0/5
55 22.5-25 . 0 13 19 25 100 0/5
Millipore HAWP M 27 . 5- 28 . 0 2 2 3 131 0/5 (Sm) G 24 . 0-2 9 . 4 3 4 5 131 0/5
I 5S 22.5-24.5 18 23 28 112 0/5
Mi llipore HAWP M 27 .2 - 28.0 2 3 4 100 0/9 (Bg) G 25.0-26.5 4 5 6 100 0/5
I SS 23.0-24 . 4 4 4 5 100 0/5
5 & S- B-6 M 29 . 5-29.4 4 4 5 119 0/ 5 (5m) G 23.9 - 27.0 4 4 5 11 9 2/5 I
55 23.0 - 24.6 6 10 14 126 0/5
S & S- B- 6 M 27 . 0-28 .1 2 3 4 100 0/5 (Bg) G 23.5 - 26.9 4 4 5 100 2/ 5
SS 22.5-25 . 3 5 6 7 100 0/5 I U = micron. Bg = Bacil lus subti lis va r. nige r spore s . 5m Serratia ma r ce scens. 5S = Schleicher & Schuel 1 Differential press ure is 29 . 4 inches of Hg. Vol. of liquid is one liter in each case. I Concen trati on of Sm or Bg = 100-400 / ml .
I I
, I I
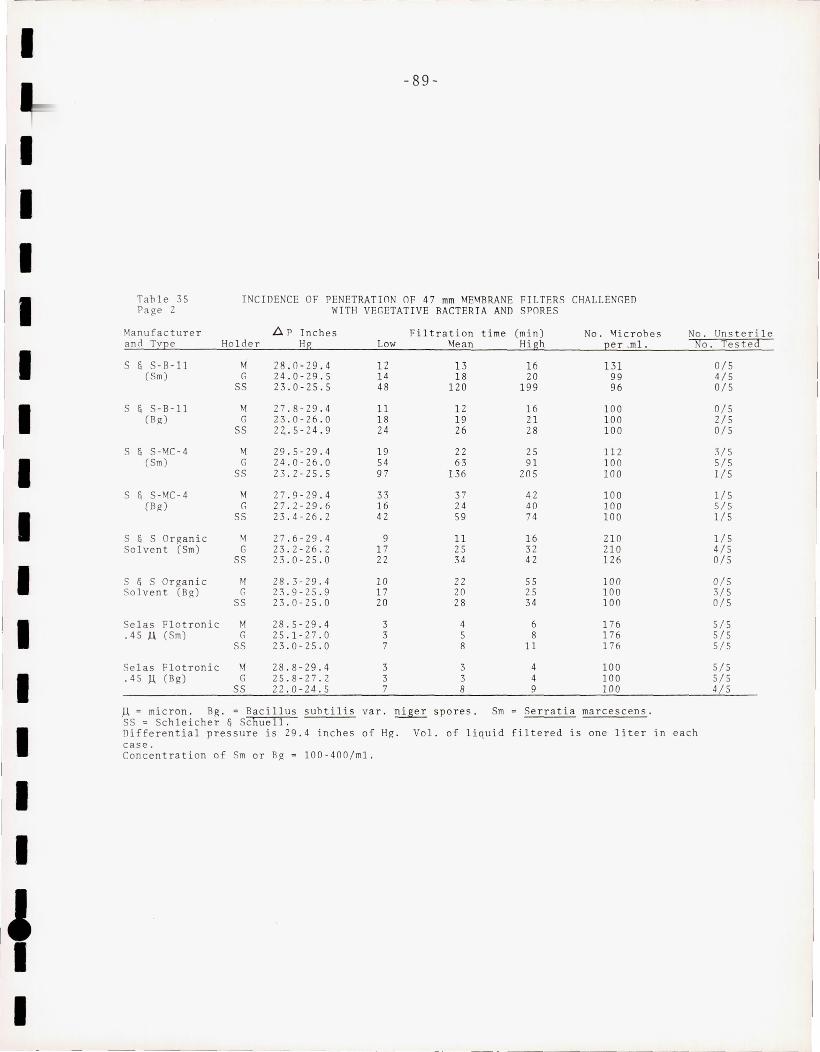
I
I I I I I I I I I I I I I I
, I I
-89-
Table 35 Page 2
I NC IDENCE OF PENETRATION OF 47 mm MEMBRANE FILTERS CHALLENGED WITH VEGETATIVE BACTERIA AND SPORES
iJ. PInche s Manufactu r e r and Type Ho l de r Hg
5 & 5 - 8 -11 (Sm)
M 28 . 0- 29 .4 G 24 . 0-29 . 5
55 23 .0-25.5
5 & 5-B -l l M (Bp;) G
55
S & S-MC -4 M (Sm) G
5S
5 & S-MC-4 M (Bp;) G
5S
S & S Or p; ani c M Solvent (Sm) G
SS
S & S Organi c M Solvent (Bg) G
SS
5elas Flotronic M .45 ll (Sm) G
SS
Se l as Flotronic M . 45 A (Bg) G
SS
27.8-29 . 4 23 . 0 - 26 . 0 22, .5- 24 . 9
29 . 5-29 .4 24.0-26 .0 23.2-25 .5
27.9-29 .4 27.2-29.6 23 .4-26.2
27 .6 -29.4 23 . 2-26.2 23 .0-25.0
28.3-29 .4 23.9-25 . 9 23 . 0-2 5.0
28.5 - 29.4 25 .1-2 7.0 23 . 0-25.0
28 . 8 -29.4 25 . 8 -27. 2 22 .0-24. 5
Low
12 14 48
11 18 24
19 54 97
33 16 42
9 17 22
10 17 20
3 3 7
3 3 7
Filtrat ion time (mi n) Mean High
13 18
120
12 19 26
22 63
136
37 24 59
11 25 34
22 20 28
4 5 8
3 3 8
16 20
199
16 21 28
25 91
205
42 40 74
16 32 42
55 25 34
6 8
11
4 4 9
No. "1icrobes pe r .ml .
131 99 96
100 100 100
112 100 100
100 100 100
210 210 126
100 100 100
176 176 17 6
100 100 100
A = micron . Bp;. = Bacillus subtilis var. niger spores. Sm Se rratia marcescens. SS = Schl e i che r & Schuell.
No . Unste r ile No . Tes t e d
0/5 4/5 0/5
0/5 2/5 0/5
3/5 5/5 1/5
1/5 5/5 1/5
1/5 4/5 0/5
0/5 3/5 0/5
5/5 5/5 5/5
5/5 5/5 4/5
Diffe r ential pressure is 29 .4 inches of Hg. Vol . of liquid filtered is one liter in each case . Concent rati on of Sm or Bp; ~ 100-400/ml.
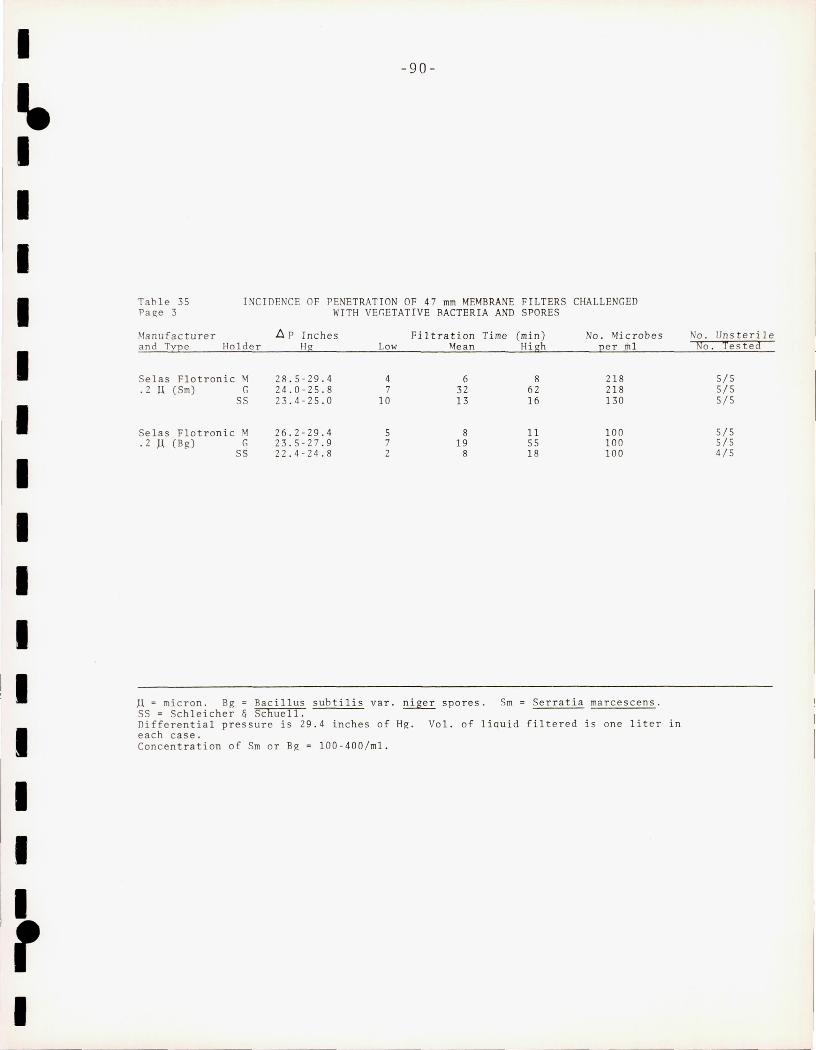
I
.. I I I .1 I I I I I I
I I I , I
-90-
Table 35 INCIDENCE OF PENETRAT ION OF 47 mm MEMBRANE FILTERS CHALLENGED Pa ge 3 WITH VEGETATIVE BACTERIA AND SPORES
Manufacturer ,6 p Inches Filtration Time (min) No . Microbes and Typ e Holder Hg Low Mean High per ml
Selas Flotronic M 28 . 5-29.4 4 6 8 218 .2 )..\ (Sm) G 24 . 0-25 . 8 7 32 62 218
SS 23.4-25.0 10 13 16 130
Selas Flotronic M 26 . 2-29.4 5 8 11 100 .2 M (Bg) G 23.5-27.9 7 19 55 100
SS 22.4-24.8 2 8 18 100
M = micron. Bg = Bacillus subtilis var. niger spores . Sm = Se rrat ia marcescens . SS = Schleicher & Schuell . Differential pressure is 29.4 inches of Hg. Vo l. of liquid fi lt ered is one liter in each case. Concentration of Sm or Bg = 100-400/ml.
No . Unsterile !\Io. TesteCl
5/5 5/5 5/ 5
5/5 SIS 4/S
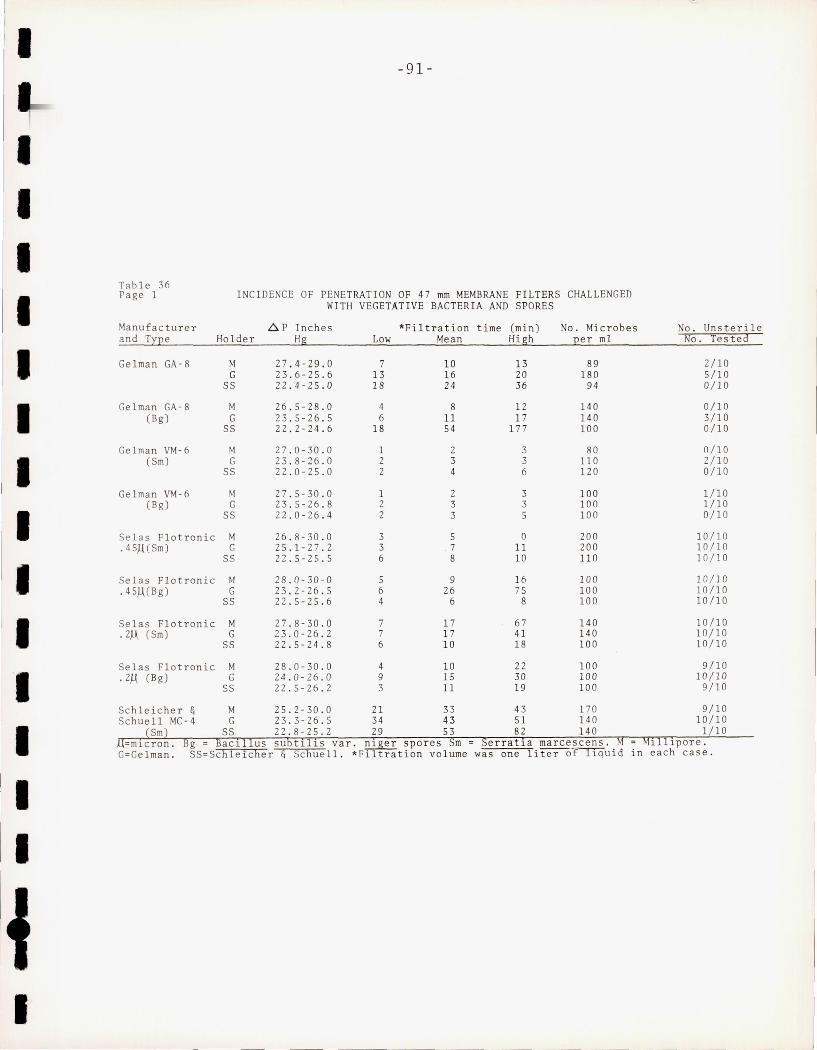
I - 91 -
I I I
T1\ble 36 Page 1 INCIDENCE OF PENETRATION OF 47 mm MEMBRANE FILTERS CHALLENGED
WITH VEGETATIVE BACTERIA AND SPORES
Manufacturer ~ P Inches *F i ltrat ion time (min) No . Mic r obe s No . Unsterile a nd Tne Holder Hg Low Mean High Ee r m1 No. Testea
I Gelman GA-8 M 27 . 4-29.0 7 10 13 89 2/10
G 23 . 6 - 25.6 13 16 20 180 5/10 SS 22.4-25.0 IB 24 36 94 0/10
I Gelman GA-B M 26 . 5-28.0 4 B 12 140 0/10
(Bg) G 23 . 5-26 .5 6 11 17 140 3/10 SS 22 . 2 - 24 .6 IB 54 177 100 0/10
Gelman VM-6 M 27 . 0-30.0 1 2 3 BO 0/10 (Sm) G 23 . 8-2 6 . 0 2 3 3 11 0 2/10
SS 22.0 - 25.0 2 4 6 120 0/10 I Gelman VM-6 M 27 . 5-30 .0 1 2 3 100 1/10
( Bg) G 23 . 5-26 . 8 2 3 3 100 1/10 SS 22 . 0 - 26.4 2 3 5 10 0 0/10
Se la s Flotronic M 26.8-30 . 0 3 5 0 200 10/10 I .4 5}-1 (Sm) G 25 .1- 27 . 2 3 7 11 200 10/10
SS 22.5-25.5 6 8 10 11 0 10/1 0
Selas Flotronic M 28.0-30-0 5 9 16 100 1 O!l 0 .45J..HBg) G 23 . 2-26 . 5 6 26 75 100 10/10
SS 22.5-25 . 6 4 6 8 100 10/10 I
Selas Flotronic M 27.8-30 . 0 7 17 67 140 10/10 .2M (Sm) G 23 . 0-26.2 7 1 7 41 140 10/10
SS 22 . 5-24 . 8 6 10 18 100 10/10 I Se las Flotronic M 2B.0 -30. 0 4 10 22 100 9/10 .2].1. (Bg) G 24.0-26.0 9 15 30 100 10/10
SS 22.5-26.2 3 11 19 100 9/10 I Schleicher & M 25 . 2- 30 . 0 21 43 170 9/10 Schue11 MC-4 G 23 . 3-26 . 5 34 51 140 10/10
Sm SS 22 . 8-25.2 29 82 140 1/10 Bg BaCll us su tIlls var. nIger spores m - erratla marcescens. I Ipore . SS=Schleicher & Schue11 . *Fi ltration vo lume was one li t er o-f~uid in each case . I
I I
I
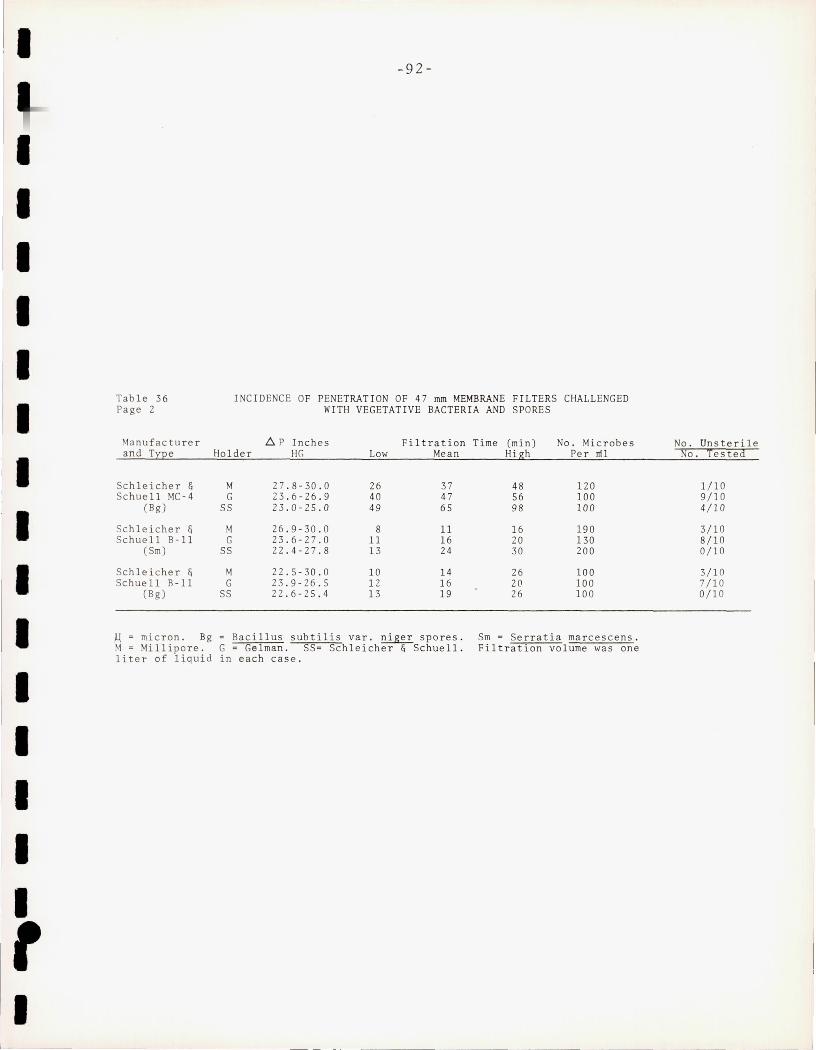
I
I I I I I I I I I I I I I I I ,
Table 36 Page 2
Manufacturer and Type
Schleicher & Schue11 MC -4
(Bg)
Schle icher & Schue 11 B-11
(Sm)
Schleicher & Schue11 B-11
(Bg)
1-1 = mic ron . Bg M = Mi 11 ipore . liter of liquid
-92-
INCIDENCE OF PENETRATION OF 47 mm MEMBRANE FILTERS CHALLENGED WITH VEGETATIVE BACTERIA AND SPORES
D. P Inches Filtration Time (min) No. Microbes Holder He; Low Mean High Per 1111
M 27.8 - 30.0 26 37 48 120 G 23 . 6-26 . 9 40 47 56 100
SS 23.0-25.0 49 65 98 100
M 26 . 9-30.0 8 11 16 190 G 23 .6-27 .0 11 16 20 130
SS 22 .4- 27 .8 13 24 30 200
M 22 .5- 30.0 10 14 26 100 G 23.9-26 . 5 12 16 20 100
SS 22 . 6 - 25.4 13 19 26 100
= Bacillus subtilis var . nige r spores . Sm = Serratia marcescens. G - Gelman. SS- Sch l eicher & Schue11. Filtration volume was one in each case .
No. Unsteril e No. Teste d
1/10 9/10 4/10
3/10 8/10 0/10
3/10 7/10 0/10
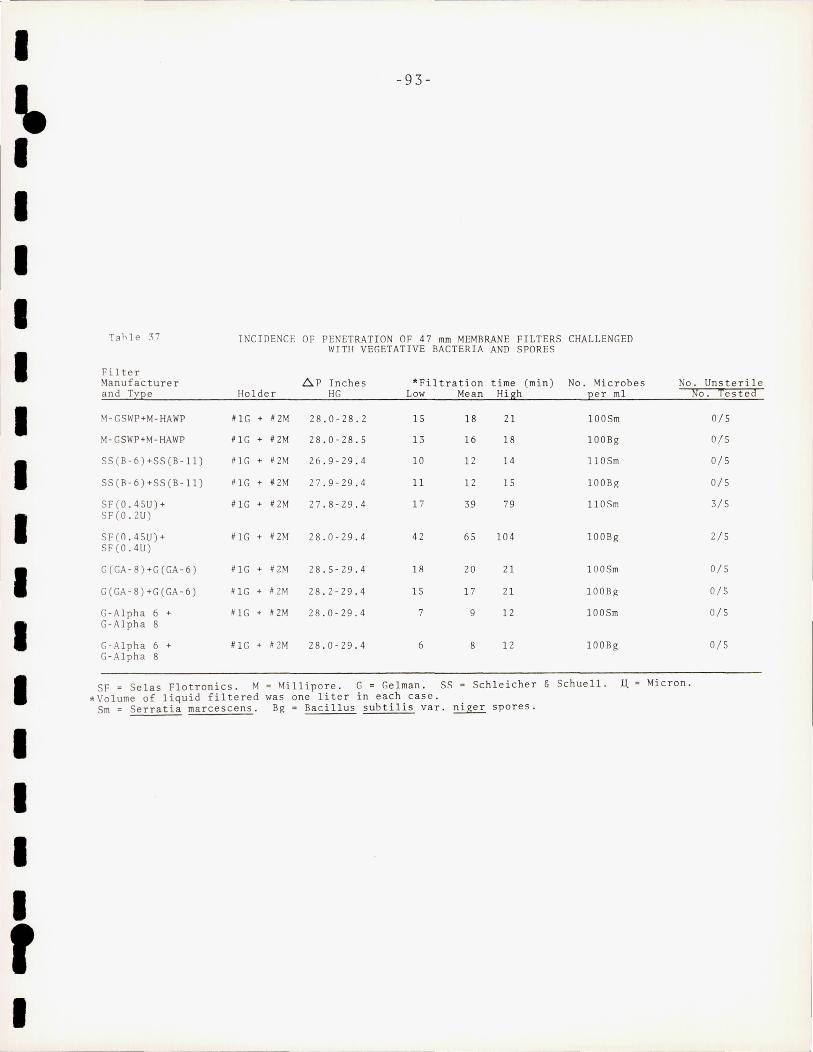
I
.. -9 3 -
I I I I
T~hle 37 INCIDENC E OF PENETRATION OF 47 mm MEMBRANE FILTERS CHALLENGED
I WITH VEGETATI VE BACTERIA AND SPORES
Filter Manufacturer 6, P Inches *Fi lt r a t i on time (min ) No . Mi crobes No. Un st e r ile and Tne Holder HG Low Me an High Ee r ml Flo . Tes t e a
I M-GSWP+M-HAWP RIG + R2M 28.0-28 . 2 15 18 21 100Sm 0/5
~1-GSWP+M-HAWP RIG + R2M 28 . 0-28 . 5 13 16 18 100Bg 0/5
I SS(B-6) +SS (B- ll) #lG + R2M 26.9 - 29 . 4 10 12 14 1l0Sm 0/5
SS(R-6) +SS(B -ll) #lG + #2M 27.9-29.4 11 1 2 15 100Bg O/S
SF(0 .45U)+ #lG + #2M 27.8-29 . 4 17 39 79 1l0Sm 3/5
I SF(O .2U )
SF(O .45U) + #lG + #2M 28.0 - 29.4 42 65 104 lOOBg 2/5 SF(0. 4U )
I G(GA-8) +G(GA-6) #lG + #2M 28.5 - 29.4 18 20 21 100Sm 0/5
G(GA-8) +G(GA-6) #lG + #2M 28 . 2-29.4 15 17 21 100Bg 0/5
G- Alpha 6 + #lG + #2 M 28.0-29.4 7 9 12 100Sm 0/5
I G-A1pha 8
G-Alpha 6 + #IG + #2M 28 . 0 - 29.4 6 8 12 100Bg O/S G-A lpha 8
I SF = Se 1as Flotronics . M = ~illipore. G = Gelman. SS = Schl ei ch e r & Schuell. ,ll Micron . *Volume of liquid fi l tered was one lite r in each cas e.
Sm = Serratia marcescens . Bg = Bacillus s ub t i1is var . ni ge r s po r es.
I I I I r I
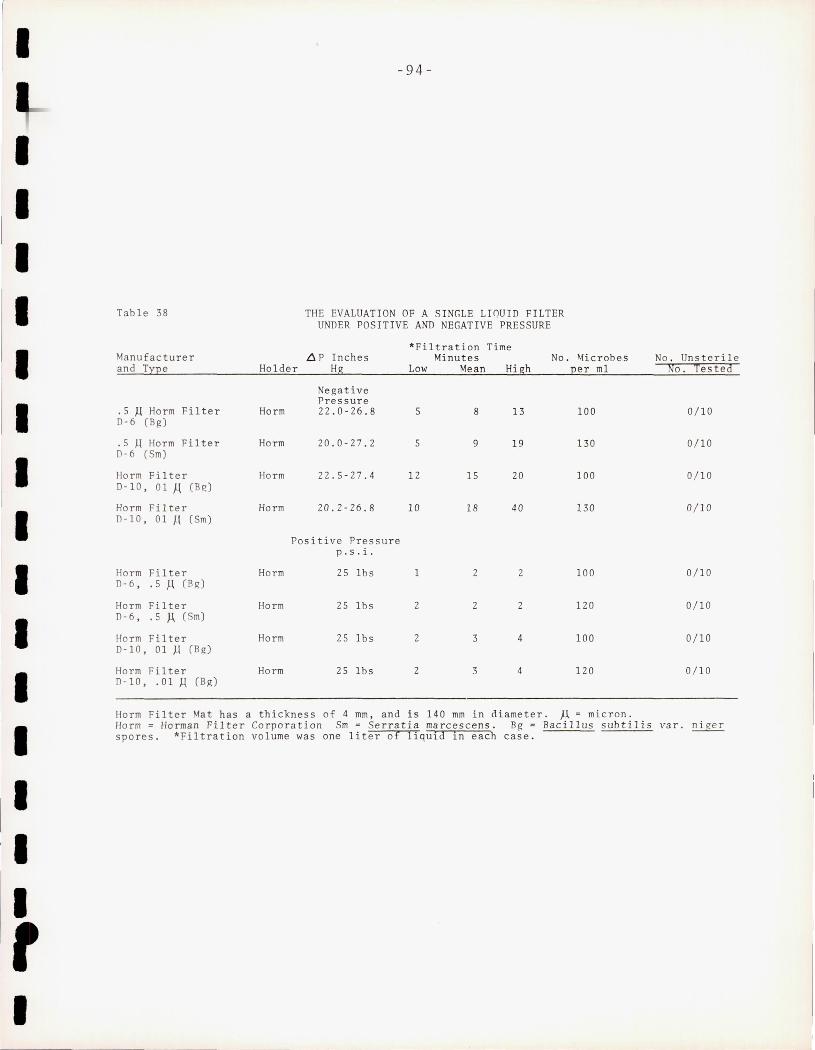
I
I I I I I I I I I I I I I I
I
- 94-
Table 38 THE EVALUATION OF A SINGLE LIQUID FILTER UNDER POSITIVE AND NEGATIVE PRESSURE
*Filtration Time Manufacturer LH Inches Minutes No . Microbes No . Unsterile and Tne Holder Hg Low Mean High :Q er ml f.l'o. Testeo
Negative Pressure
.5 }.l Horm Filter Horm 22.0-26.8 5 8 13 100 0/10 D-6 (Bg)
.5 /.l Horm Filter Horm 20.0-27.2 5 9 19 130 0/10 D-6 (Sm)
Horm Fi lter Horm 22. 5- 27.4 12 15 20 100 0/10 D-lO, 01 A (Bg)
Horm Filter Horm 20 . 2-26.8 10 18 40 130 0/10 D-I0, 01 ~I (Sm)
Positive Pressure p. s. i.
Horm Filter Horm 25 Ibs 1 2 2 100 0/10 D-6 , . 5 g CBg)
Horm Filter Horm 25 lbs 2 2 2 120 0/10 D-6 , . 5 A (Sm)
Horm Filter Horm 25 1bs 2 3 4 100 0/10 D-I0, 01 }.l (BR)
Horm Filter Horm 25 Ibs 2 3 4 120 0/10 D-lO, .01 }.l (BR)
Horm Filter Mat has a thickness of 4 mm, and is 140 mm in diameter. A = micron. Horm = Horman Filter Co rporation Sm = Serratia marcescens. Bg = Bacillus subtilis va r. niger spores . *Fi1tration volume was one liter of llquid in each case.
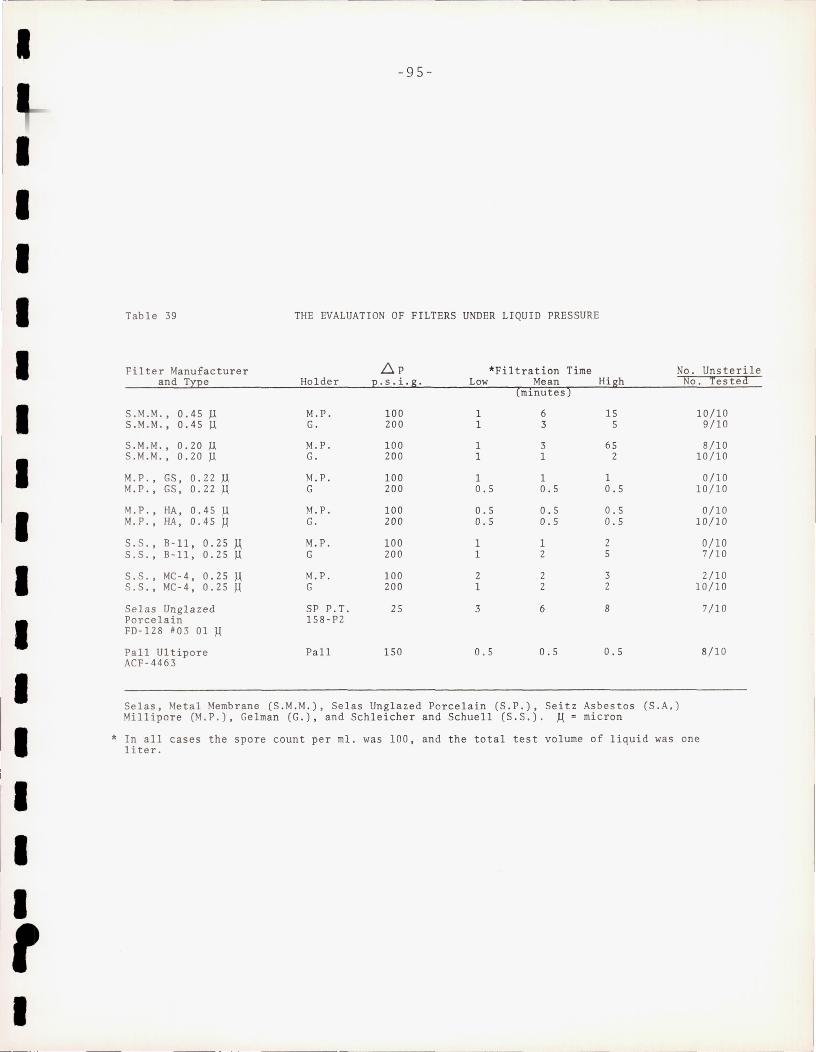
I
I I I I I I I I I I I I
I I , I
-95-
Table 39 THE EVALUATION OF FILTERS UNDER LIQUID PRESSURE
Filter Manufacturer ~P *Filtration Time No. Unsterile and Type Holder p . s.i.g . Low Mean High
(minutes)
S.M.M. , 0.45 JJ M.P. 100 1 6 15 S.M.M. , 0.45 JJ G. 200 1 3 5
S.M.M. , 0.20 JJ M.P. 100 1 3 65 S.M.M. , 0.20 JJ G. 200 1 1 2
M. P., GS, 0.22 JJ M. P. 100 1 1 1 M. P., GS, 0.22 JJ G 200 0.5 0.5 0 . 5
M. P., HA, 0.45 JJ M.P. 100 0.5 0.5 0.5 M.P. , HA, 0.45 /-I. G. 200 0.5 0 . 5 0.5
S. S. , B-ll, 0.25 JJ M.P. 100 1 1 2 S. S. , B-ll, 0.25 JJ G 200 1 2 5
S. S. , MC-4, 0.25 JJ M.P. 100 2 2 3 S. S. , MC-4, 0.25 ).1 G 200 1 2 2
Selas Unglazed SP P.T. 25 3 6 8 Porcelain 158-P2 FD-128 #03 01 ).1
Pall Ultipore Pall 150 0 .5 0.5 0.5 ACF-4463
Selas, Metal Memb rane (S.M.M.), Selas Unglazed Porcelain (S.P.), Seitz Asbestos (S.A,) Millipore (M.P.), Gelman (G.), and Schleicher and Schuell (S.S.). JJ = micron
No. Testea
10/10 9/10
8/10 10/10
0/10 10/10
0/10 10/10
0/10 7/10
2/10 10/10
7/10
8/10
* In all cases the spore count per mI. was 100, and the total test volume of liquid was one Ii ter.
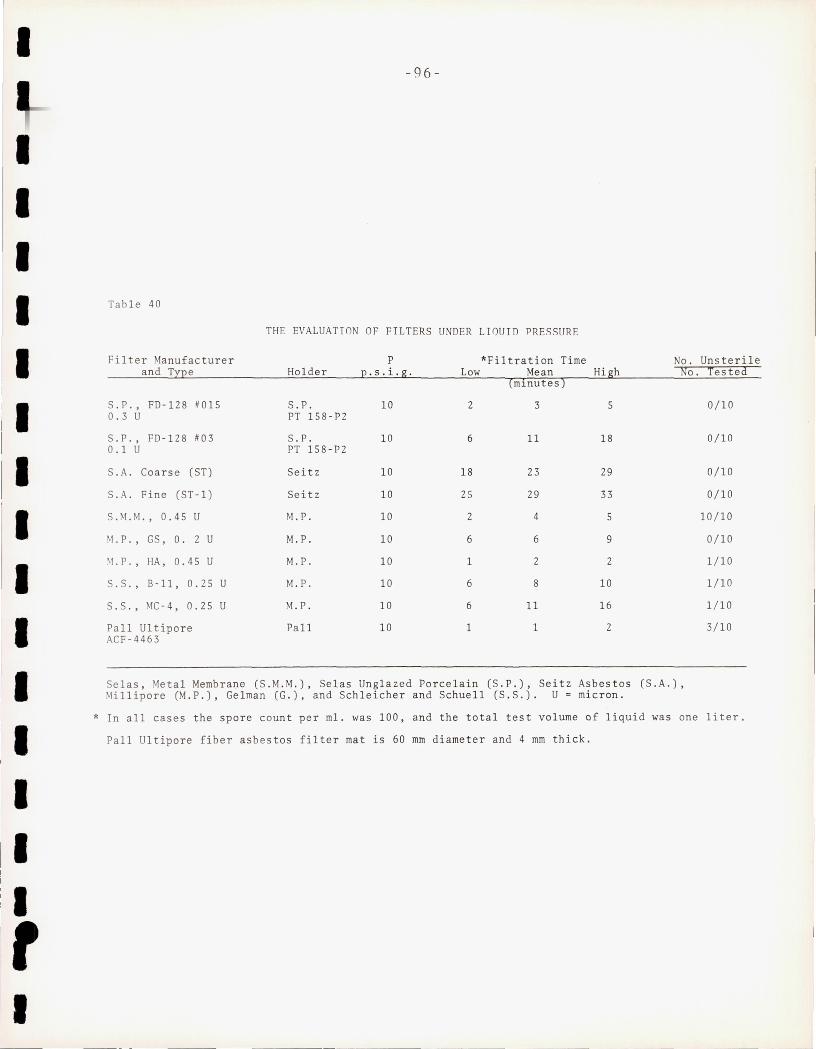
I
I I I I I I
II I I I I I I I I , I
-96-
Tab l e 40
THE EVALUATIO OF FILTERS UNDER LIQUID PRESSURE
Filter Manufacturer P *Fi1tration Time No . and Type Holder p . s.i.g. Low Mean
(mlnutes) High No.
S . P . , FD-128 #015 S.P . 10 2 3 5 0.3 U PT 15 8-P 2
S. P. , FD- 12 8 #03 S.P . 10 6 11 18 0.1 U PT 158-P2
S . A. Coars e (ST) Seitz 10 18 23 29
S. A. Fine (ST- 1) Seitz 10 25 29 33
S. M. ~1. , 0.45 U M.P. 10 2 4 5
.LP. , GS, O. 2 U M.P. 10 6 6 9
~ I . P. , HA, 0 . 45 U M.P. 10 1 2 2
S. S . , B-11 , 0 . 25 U M. P . 10 6 8 10
S . S . , MC-4, 0.25 U M. P . 10 6 11 16
Pall Ultipore Pall 10 1 1 2 ACF-4463
Se 1as, Meta l Membrane (S . M.M.), Se 1as Unglazed Porcelain (S.P.), Seitz Asbestos (S.A.), Mi l1ipore (M .P.), Ge lman (G . ) , and Schl eicher and Schuel1 (S . S.). U = mic ron .
Unste rile Teste a:
0/10
0/10
0/10
0/10
10 /10
0/10
1/10
1/10
1/10
3/10
* In all cases the spore count per mI. was 100, and the total test volume of liquid was one l iter.
Pal l Ult ipore fiber asb es tos filter mat is 60 mm diame t er and 4 mm thick.
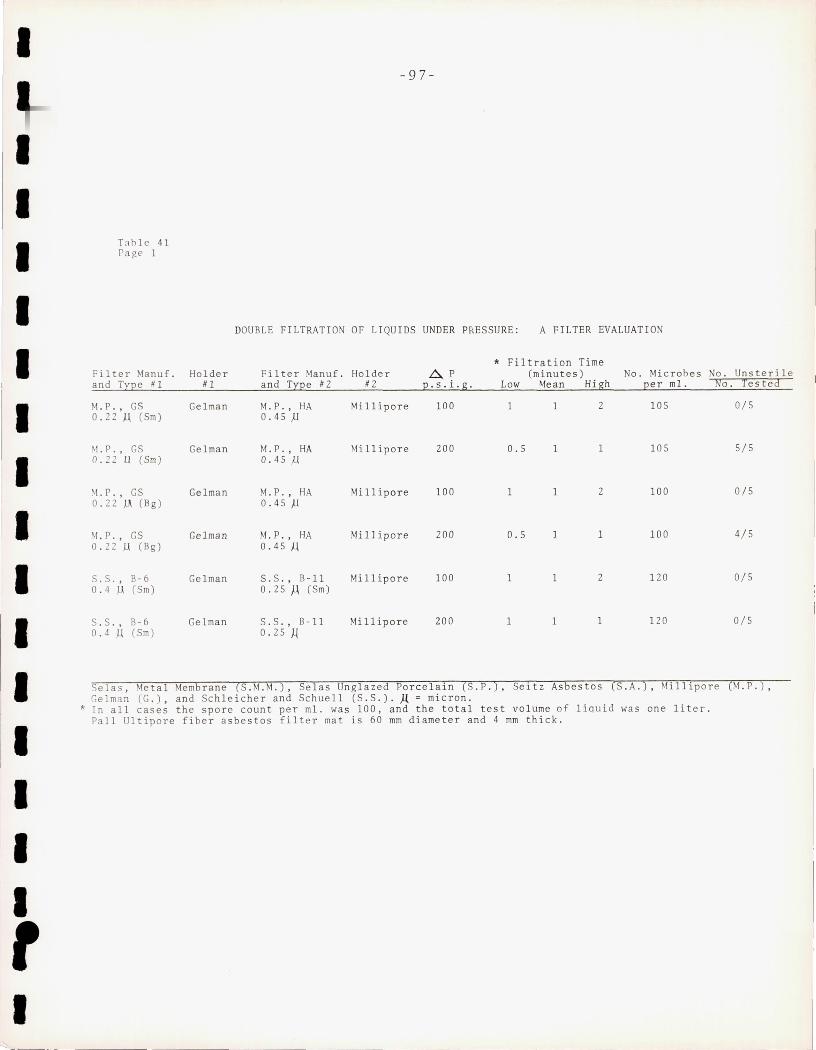
I
I I I I I I I I I I I I I I I r I ~-- ... -
T:lhle 41 Page 1
Filter Manuf. and Tne #1
~1. P. , GS 0 . 22 ,l\ (Sm)
~1. P. , GS 0 . 22 .u (Sm)
\1. P. , GS 0.22 ).;\ (Bg)
M. P. , GS 0 . 22 U (Bg)
S. S. , B-6 0 . 4 U (Sm)
S . S . , B-6 0 . 4 ,l\ (Sm)
Holder #1
Gelma n
Gel man
Gelman
Gelman
Gelman
Gel man
-97-
DOUBLE FILTRATION OF LIQUIDS UNDER Pf<ESSURE: A FILTER EVALUATION
* Filtration Time Fil ter Manu£. Holder A P (mi nutes) No. Microbes No. Unsteril e and TYl~e #2 #2 2· s . i .g. Low Mean High 2er mI. r:Jo . Testea
M. P. , HA Millipore 100 I 1 105 0/5 0 . 45 )l
M. P . , HA Mi llipore 200 0 .5 1 1 105 5/5 0 .4 5 )l
M. P. , HA Millipore 100 1 1 100 0/5 0.45..u
M. P. , HA Millipore 200 0.5 1 1 100 4/5 0 .45 J.l
S. S ., B-ll Millipore 100 1 1 2 120 0/5 0 . 25 J..\ (Sm)
S . S . , B-ll Millipore 200 1 1 120 0/5 0.25 ].{
Selas , Metal Membra ne (S.M.M.), Selas Unglazed Porcelain (S.P .) , Seitz Asbestos (S.A.), 1illipore (M.P. ) , Gelman (G . ) , and Sc hl eicher and Schuell (S . S.). ~ = micron.
* In all cases th e spore count per mI. was 100, and the total t es t volume of liquid was one liter. Pall Ultipore fiber asbestos filter mat is 60 mm diameter and 4 mm thick.
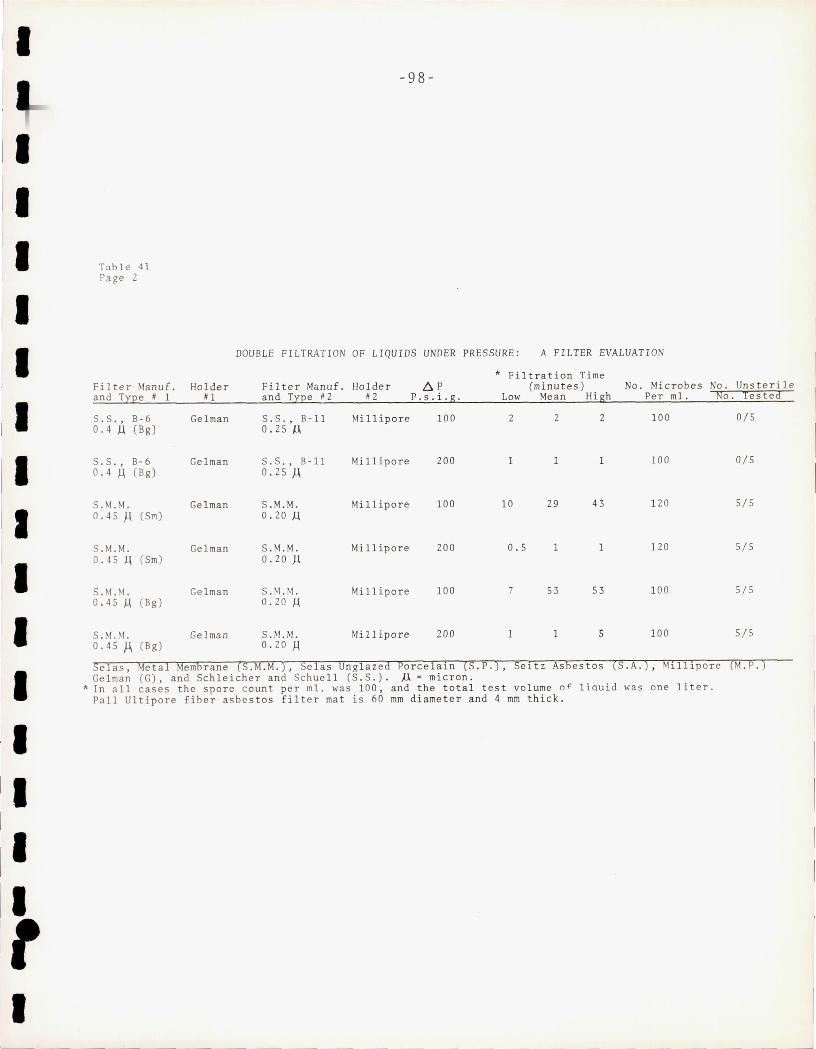
II I
I I I I I
/1 I
II II I
I , I
Table 41 Page 2
Filter Manuf. and Type # 1
S.S ., B-6 0.4 .u (Bg)
S . S., B-6 0.4.u (Bg)
S.M .M. 0.45)J. (S1'1)
S .1-1. M. 0 . 45.u (Sm)
S.M.~1. 0.45.u (Bg)
S .M. M. 0.45)J.. (Bg)
Holder #l
Gelman
Gelman
Gelman
Gelman
Gelma n
Gelman
-98-
DOUBLE FILTRATION OF LIQUIDS UNDER PRESSURE: A FILTER EVALUATION
Filter Manuf . Holder and Type #2 #2
S . S., B-ll 0 . 25 A
S.S. , B-ll 0.25 )J.
S.M.M . 0.20 J.{
S . M.M. 0.20 )..l
S.M . M. 0.20 J..(
S.M.M . 0 . 20 J..(
Millipore
Millipore
Millipore
Millipore
Millipor e
Millipore
~ P P.s.i.g.
100
200
100
200
100
200
* Filtration Time (minutes ) No. Mic r obes No. Unsterile
Low Mean High Per mI. No. Tested
2 2 2 100 0/5
1 1 100 0/5
10 29 43 12 0 5/5
0 .5 1 1 120 5/5
7 53 53 100 5/5
1 1 5 100 5/5
Selas, Metal Membrane (S .M. M. ), Selas Unglazed Porcelain (S.P.), Seitz Asbestos (S.A.), Millipore (M.P.) Gelman (G) , and Schleicher and Schue ll (S . S.) . A = micron.
* In all cases the spore count per mI. was 100, and the total test volume o~ liquid was one liter. Pall Ultipore fiber asbestos filter mat is 60 mm diameter and 4 mm thick.
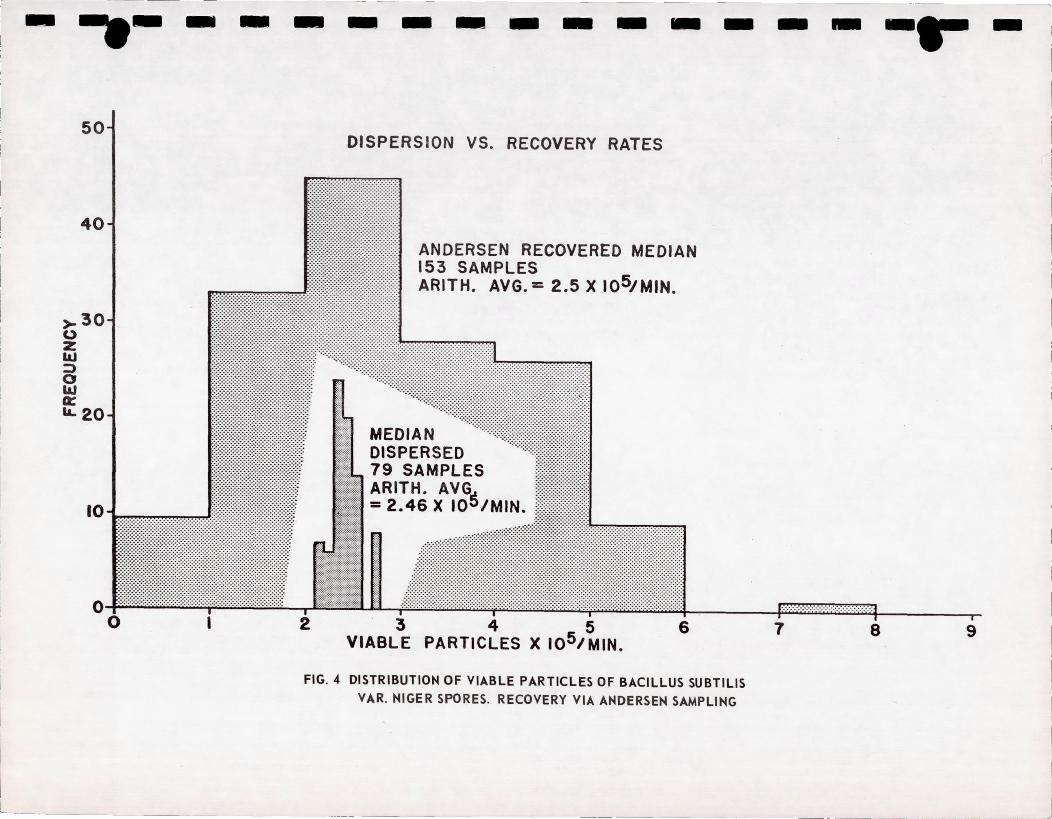
- -.-50
40
>- 30 u Z ILl ::> o ILl ct: IL 20
-
10~. Ii'li
- -- -- -~.- -- ------- - - - -- - - -DISPERS ION VS. RECOVERY RATES
ANDERSEN RECOVERED MEDIAN 153 SAMPLES ARITH. AVG. = 2.5 X 10⁵, MIN.
MEDIAN DISPERSED 79 SAMPLES
! R~:: 6 xA y gs, MIN . lll~ll~l~l~ll·l·.~l:l::::· :
o f ·;·;·;·;·····;·;·;·;·;·;·;·;·····:-;·;·;·;·:-;y ;·:-;·;·;.:-;.;.:-;.;.;.;.;.:-;.;.:-; i " """"" """" ",
3 4 5 VIABLE PARTICLES X 105, MIN.
FIG." DISTRIBUTION OF VIABLE PARTICLES OF BACILLUS SUBTILIS VAR. NIGER SPORES. RECOVERY VIA ANDERSEN SAMPLING
- - -r -
7 8 9
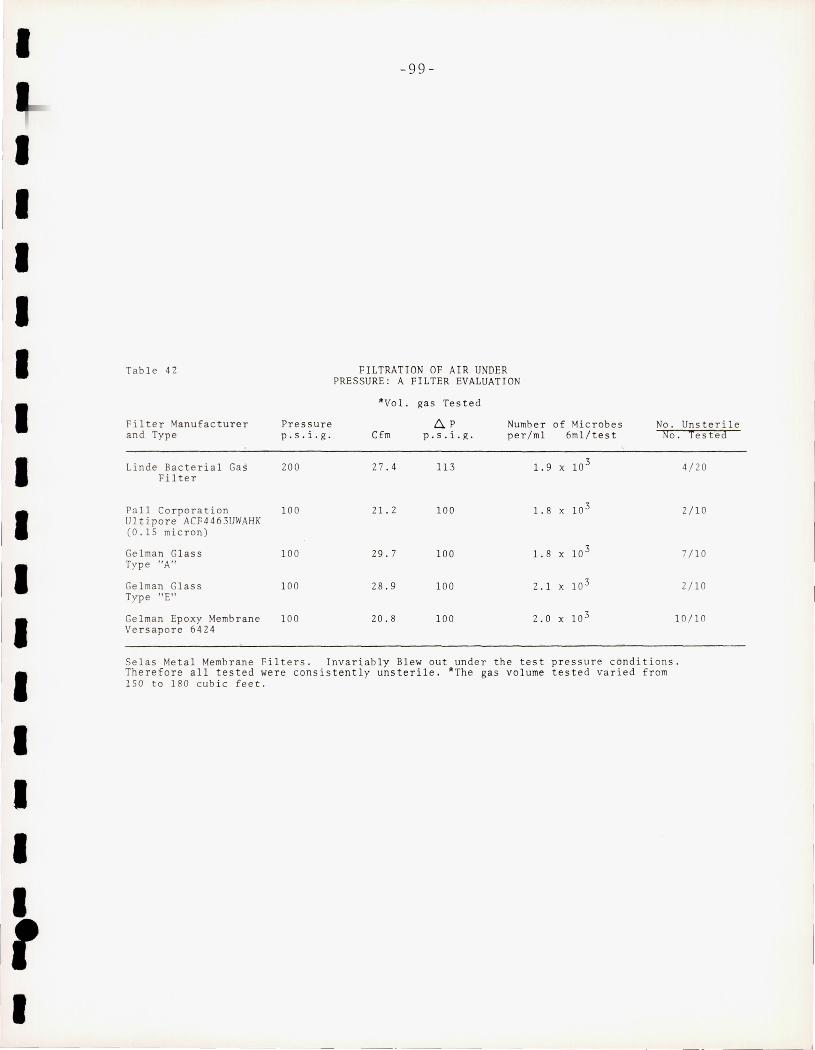
I I I I I I I I I I
II I I
-99 -
Table 42 FI LTRATION OF AI R UNDER PRESSURE: A FILTE R EVALUATION
*Vo l. gas Tested
Filte r Manu fac turer Pressure 6, p Numbe r of Microbes No. Unsteril e and Type p.s.i.g. Cfm p.s.i.g . per / ml 6ml/te st fJo. Teste Ci
Linde Bacterial Gas 200 27 .4 113 1. 9 x 10 3 4/20 Filter
Pall Corporation 100 21. 2 100 1.8 x 10 3 2/10 Ultipo r e ACF4463UWAHK (0 .1 5 micron)
Ge lman Glass 100 29.7 100 1. 8 x 10 3 7/10 Type "A"
Gelma n Glass 100 28 . 9 100 2. 1 x 10³ 2/10 Type "E"
Gelman Epoxy Membrane 100 20 . 8 100 2.0 x 10 3 10/10 Ve r sapore 6424
Se las Metal Membrane Fi l ters. Inva r iably Blew ou t under the test pressure co nd itions . Therefore all tested we r e co ns i stently unsterile. *The gas volume teste d varied from 150 to 180 cub ic feet.
---- ----
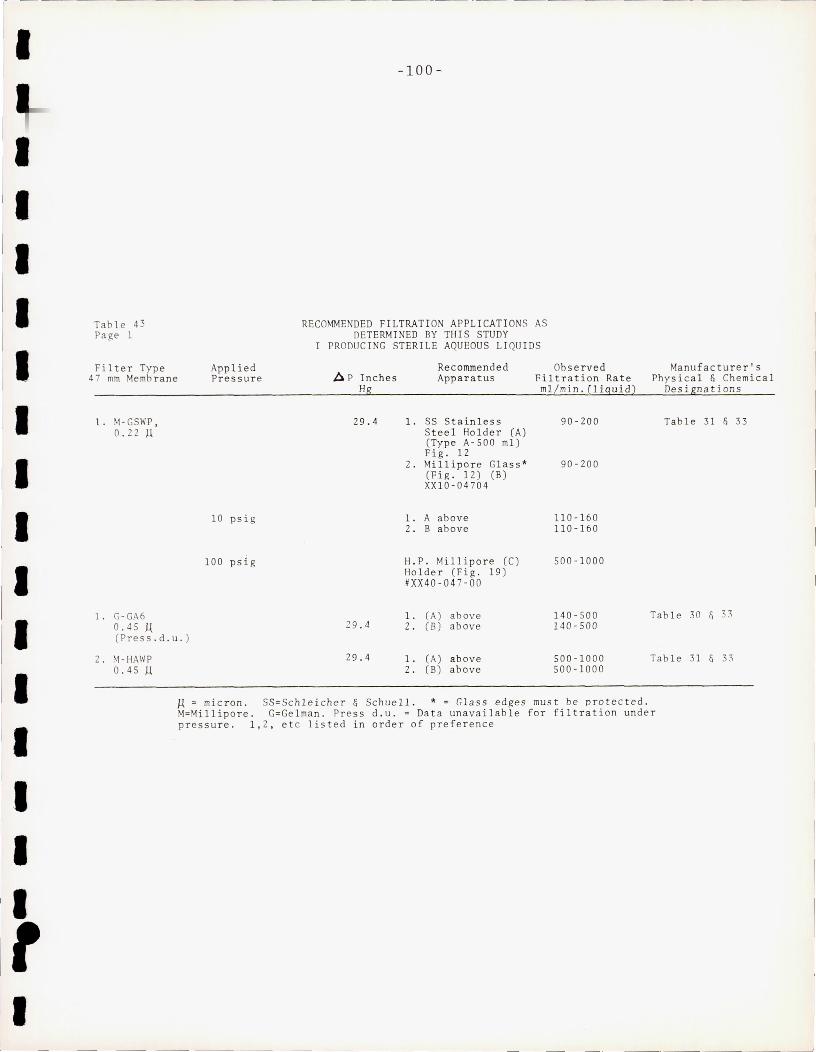
[I
I
I I I II I I I
I t I
Table 43 Page I
Filte r Type 47 mm Membrane
1. ~f-GSWP,
0.22 )..l
1. G-GA6 o . 45 1-1. (Press . d.u . )
2 . M-HAWP 0 . 45 )..l
Applied Pressure
10 psig
100 psig
-10 0 -
RECOMMENDED FILT RATI ON APPLICATI ON S AS DETERMINED BY THIS STUDY
PRODUCING STERILE AQUEOUS LIQUIDS
Ohserved A PInches
Hg
Rec ommend e d Appara tus Fil t r ation Rate
ml /mi n . (liqu id )
29 .4
29 .4
29.4
1. 5S Stain less Steel Holder (A) (Type A- 500 ml ) Fig. 12
2. Milli pore Glass · (Fig . 12 ) (B) XXlO-04704
1. A above 2 . B above
H. P . Mi11ipore eC) Holder (Fig. 19 ) nX40-047-00
1. CAl above 2 . (B) above
1. (A) above 2. (B) above
90-200
90-200
110-160 110-160
500-1 000
140-500 140-5 00
500-1000 500-1000
Manufacture r 'S Physical & Chemical
De signat ions
Table 31 & 33
Tab l e 30 & 33
Tab le 31 & 33
)..l = micron. SS=Sc hl eiche r & Schuell . * = Glass edges must be protec t ed. M=Millipore. G=Ge lman. Press d . u . = Dat a unavailab l e for filtration und e r pressure. 1, 2 , etc listed in or der of preference
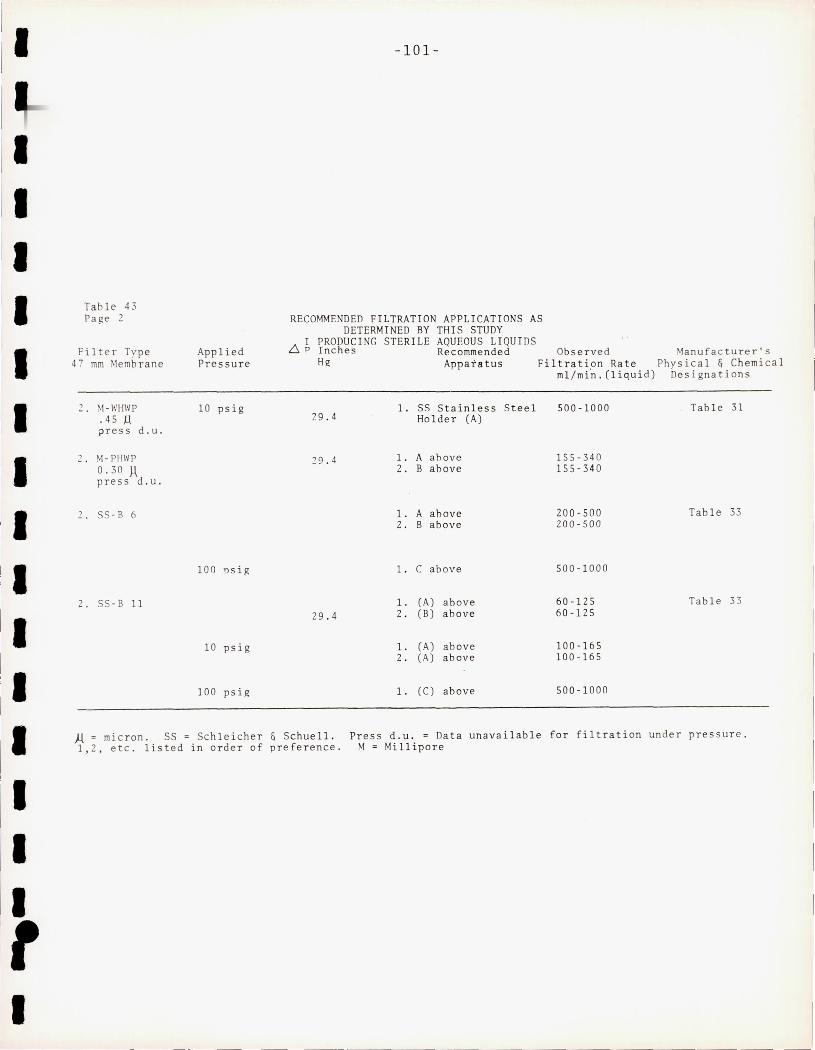
I I I
I I
I
I r I
-1 0 1-
Table 43 Page 2 RECOMMENDED FILTRATION APPLICATIONS AS
DETERMINED BY THIS STUDY
Filter Typ e Applied 6~ PRODUCING STERILE AQUEOUS LIQUIDS Inches Recommended Observed Manufacturer's
47 mm ~Iemb rane Pressure Hg Appar a tus Filtration Rate Physical & Chemical ml/mi'n. (liquid) Designations
2. ~1- WHWP 10 psig 1. SS Stainless Stee l 500-1000 Table 31 .45 ,l\ 29 .4 Holder (A) "ress d.u ,
0 ~I- PHWP 29 . 4 1. A ahove 155-34 0 0.30 A 2. B above 155-340 press d.u .
, SS - B 6 l. A above 200-500 Table 33 2. B above 200-500
100 nsig 1. C above 500-1000
2. SS - B 11 1. (A) above 60-125 Table 33 29 . 4 2 . (B) above 60-125
10 psig 1. (A) above 100-165 2 . (A) above 100 - 165
100 psig l. (C) above 500-1000
~ = micron . SS = Schleicher & Schuell. 1, 2 , e tc . listed in order of preference.
Press d . u. = Data unavailable for filtration under pressure. M = Millipore
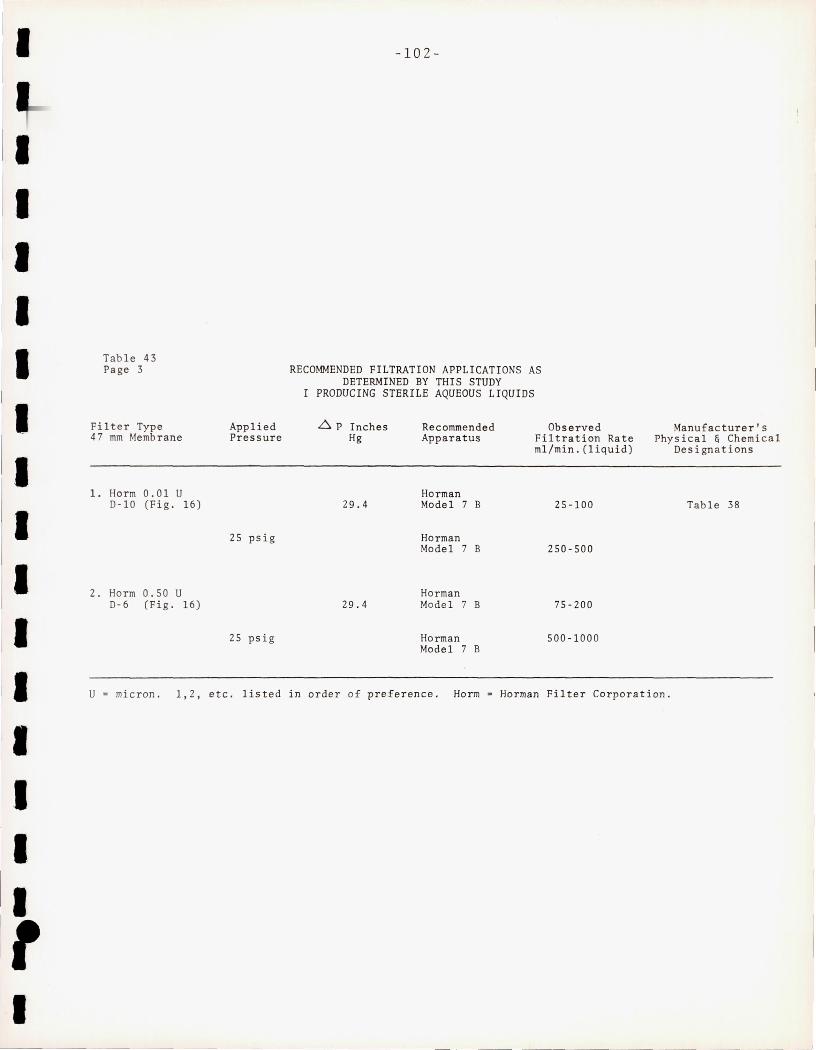
I I I I I I I I I I I I I I I t I
Table 43 Page 3
Filter Type 47 mm Membrane
1. Horm 0.01 U D-IO (Fig . 16)
2. Horm 0.50 U D-6 (Fig . 16)
Applied Pressure
25 psig
25 psig
-102-
RECOMMENDED FILTRATION APPLICATIONS AS DETERMINED BY THIS STUDY
I PRODUCING STERILE AQUEOUS LIQUIDS
.6. PInches Hg
29.4
29.4
Recommended Apparatus
Horman Model 7 B
Horman Model 7 B
Horman Model 7 B
Horman Model 7 B
Observed Filtration Rate ml/min. (liquid)
25-100
250-500
75-200
500-1000
Manufacturer' s Physical & Chemical
Designations
Table 38
u micron . 1, 2, etc. listed in order of preference . Horm Horman Filter Corporation.
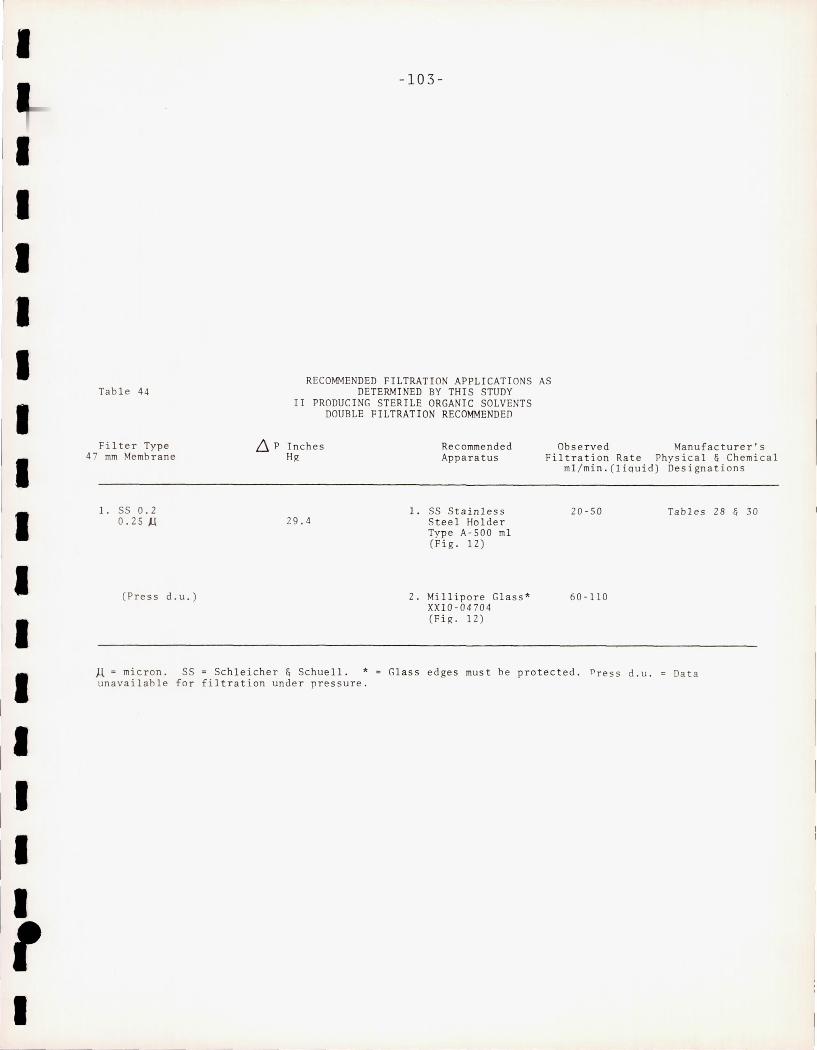
I
I
I I I I I I I I I
II I I I , I
Table 44
Fi Iter Type 47 mm Membrane
1. SS 0 . 2 0.25 J.I
(Press d.u. )
-1 0 3-
RECOMMENDED FILTRATION APPLICATIONS AS DETERMINED BY THIS STUDY
II PRODUCING STERILE ORGANIC SOLVENTS DOUBLE FILTRATION RECOMMENDED
Ll PInches HR
29 .4
Recommended Apparatus
1 . SS Stainless Steel Holder Type A-sOO ml (Fig . 12)
2. Millipore Glass* XXlO-04704 (FiR. 1 2)
Obse r ved Manufacturer's Filtration Rate Physical & Chemical
m1 / min . (liquid) Desi gnations
20-50 Tables 28 & 30
60-110
A ; micron. SS; Schleicher & Schuell . * unavailable for filtration under pressure.
Glass edges must be protected . Press d . u . Data
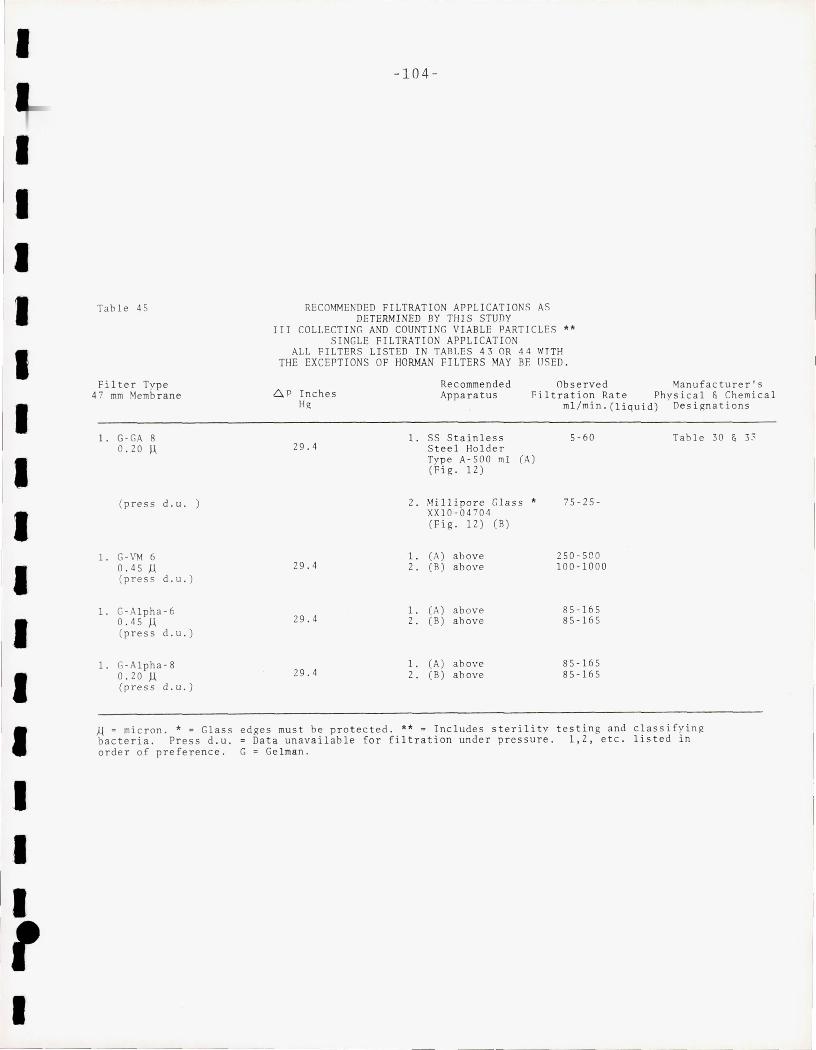
I
I I I I I I I I I I I I I I I It I
Table 45
Filter Type 47 mm Membrane
1. G-GA 8 0 . 20 J..\
(press d . u. )
1. G-VM 6 0 .45 J-\ (p r e ss d . u. )
1. G-Alpha-c 0 .45 J-\ (press d.u.)
1. G-Alpha-8 0.20 J-\ (press d.u.)
- - --- ._- - --
- 104-
RECOMMENDED FILTRATION APPLICATIONS AS DETERMINED BY THIS STUDY
III COLLECT I NG AND COUNTING VIABLE PARTICLES ** SINGLE FILTRATION APPLICATION
ALL FILTERS LISTED IN TABLES 43 OR 44 WITH THE EXCEPTIONS OF HORMAN FILTERS MAY BF. USED.
Recommended Apparatus
Obse rved Manufacturer's 6. PInches
HI;
29 .4
29.4
29.4
Z9 .4
1-
2.
1. Z.
1. 2 .
1. 2.
Filtration Rate Physical & Chemical ml/min.(liquid) Designations
SS Stainless 5-60 Table 30 & 33 Steel Holder Type A-SOO ml (A) (Fig. l Z)
Millipore Glass * 75-25-XXlO-04704 (Fig . lZ)
(A) above (B) above
(A) above (B) abov e
(A) above (B) above
(B)
2S0-5eo 100-1000
85 -165 85-165
85-165 85-165
J-\ = micron. * = Glass edges must be pro te cted. ** = Includes sterility testin g and classifying bacter ia. Press d.u. Data unavailable for filtration under pressure. 1,2, etc. listed in order of preference. G = Gelman.
I
I I I 'I I I I I I I I I '
I I I , I
Table 46
-105-
RECOMMENDED FILTRATION APPLICATIONS AS DETERMINED BY THIS STU DY
DOUBLE FILTRATION REQUIRED IV PROVIDING STERILE GASES
No recommendations can be made based on this study since none of the filters were adequate for this purpose, (Tabl e 42),
V COL LE CT I NG AND COUNTING VIABLE PARTICLES
SINGLE FILTRATION APPLICATI ON
Although specific data is unavailable, essentially the same filters could be used for this purpose as indicated in Table 4 5 with th e ex ceptions of Horm filters and the organic solvent filters,
,--I I
I I I I I I I I I I I I I I, 't I
A1HW~SSV lS~l ~~11Id ~IV dO IDOAV1 JIIVW~HJS ·1 8~n2~d
-901-
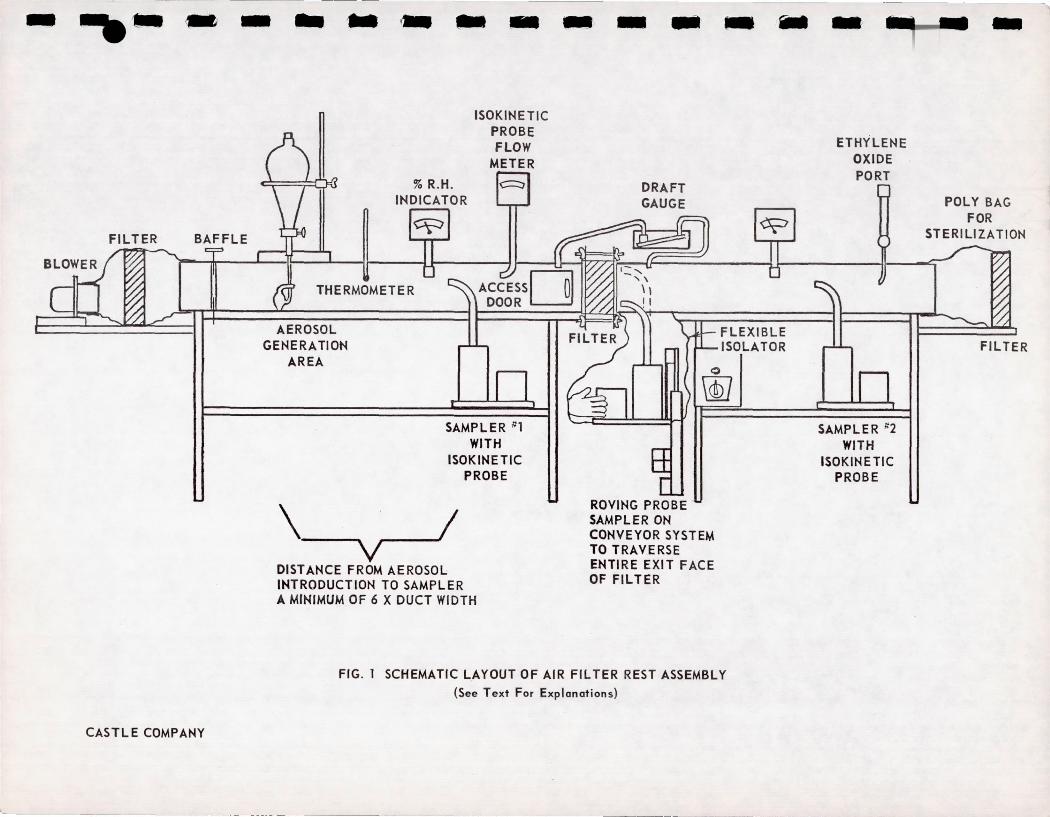
- ---- .. - - .. ,- - - - - - - -
CASTLE COMPANY
'-- .- -_.-.-
% R.H. INDICATOR
,-----,
ISOKINETIC PROBE FLOW
METER
THERMOMETER
AEROSOL GENERATION
AREA
SAMPLER III WITH
ISOKINETIC PROBE
\ I V
DISTANCE FROM AEROSOL INTRODUCTION TO SAMPLER A MINIMUM OF 6 X DUCT WIDTH
ROVING PROBE SAMPLER ON CONVEYOR SYSTEM TO TRAVERSE ENTIRE EXIT FACE OF FILTER
FLEXIBLE ISOLATOR
FIG. 1 SCHEMATIC LAYOUT OF AIR FIL TER REST ASSEMBLY (See Text For Explanations)
-ETHYLENE
OXIDE PORT
SAMPLER 1:2 WITH
ISOKINETIC PROBE
- I
POLY BAG FOR
STERILIZATION
FIL TER
-10 7-
Figure 2. THE ROVING PROBE ASSEMBLY AND THE STATIONARY ASSEMBLY WITH THE ANDERSEN SAMPLER
I
J I
I I I I I I
PROBE I I I I I I. I
'I --~
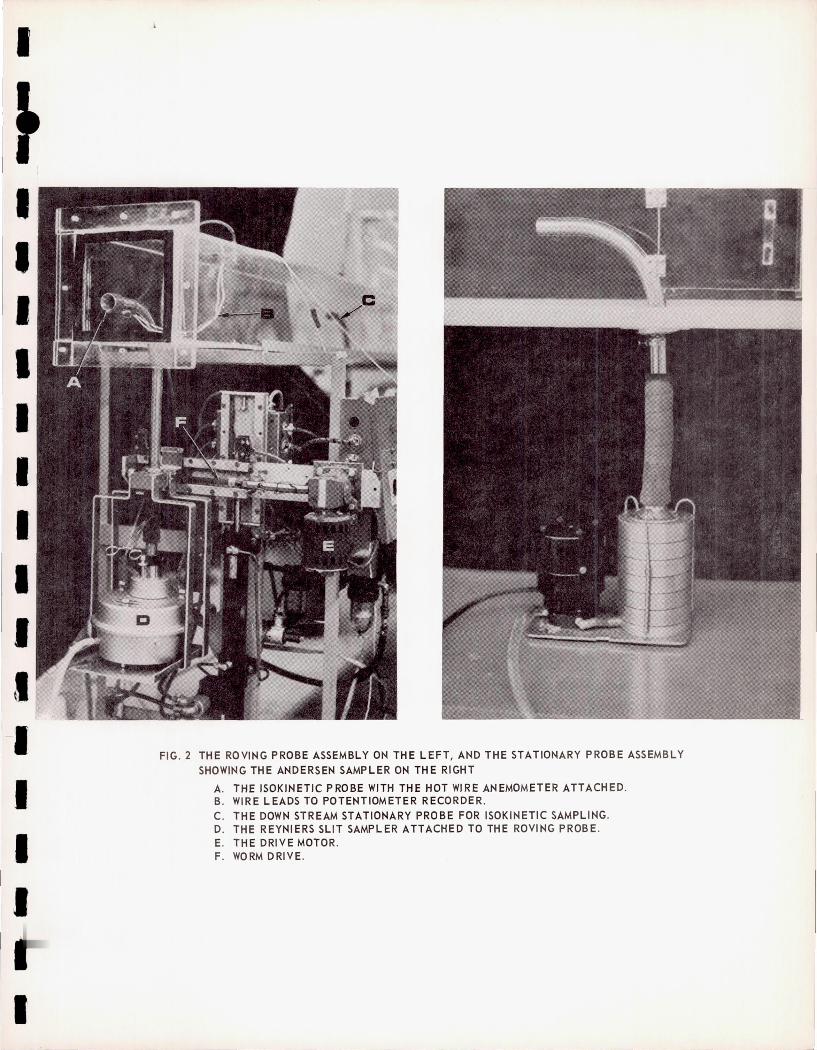
I
I I I I I
I I I I I I I
I
FIG . 2 THE ROVING PROBE ASSEMBLY ON TH E LEFT, AND THE STATIONARY PROBE ASSEMBLY SHOWING THE ANDERSEN SAMPLER ON THE RIGHT
A. THE ISOKINETIC PROBE WITH THE HOT WIRE ANEMOMETER ATTACHED . B. WIRE LEADS TO POTENTIOMETER RECORDER. C. THE DOWN STREAM STATIONARY PROBE FOR ISOKINETIC SAMPLING. D. THE REYNIERS SLIT SAMPLER ATTACHED TO THE ROVING PROBE . E. THE DRIVE MOTOR. F. WORM DRIVE.
-108-
Figure 3. THE ISOKINETIC ROVING PROBE WITH HOT WIRE ANEMOMETER ATTACHMENT
I
tJ I I I I
I i I I I I I I
1'1 I I I I
I I I I ,I I I
_IJ
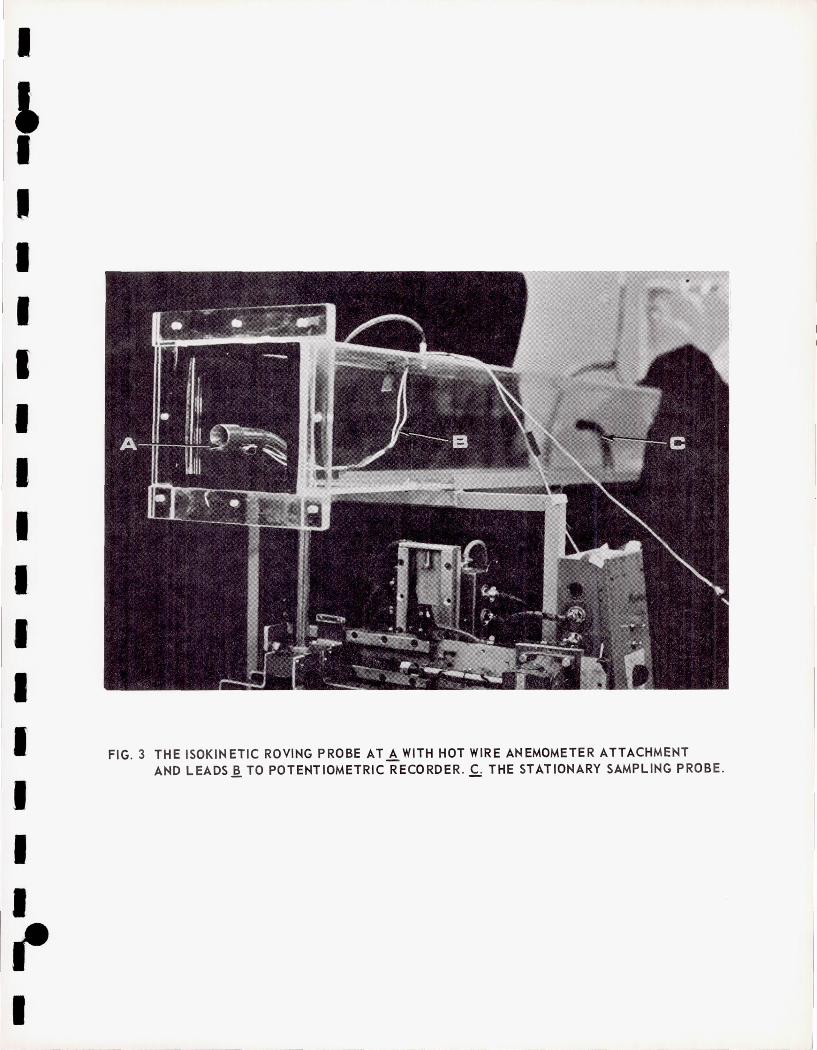
r·-I
, I I I I I I I I I I I I FIG. 3 THE ISOKINETIC ROVING PROBE AT ~ WITH HOT WIRE ANEMOMETER ATTACHMENT
AND LEADS~ TO POTENTIOMETRIC RECORDER.,£; THE STATIONARY SAMPLING PROBE .
I I I (' I
-109-
I
J I I I I I I I
Figure 4. DISTRIBUTION OF VIABLE PARTICLES OF BACILLUS SUBTILIS I VAR. NIGER SPORES
I I . 1 I I I I
~ i I I
I - - -- ----~
1.---I I I
'I I I I I I
'I I I I
II .. il II
------ - -
-110-
Figure 5. THE VELOCITY PROFILE SHOWING A NEARLY COINCIDENT MULTIPLE TRACE
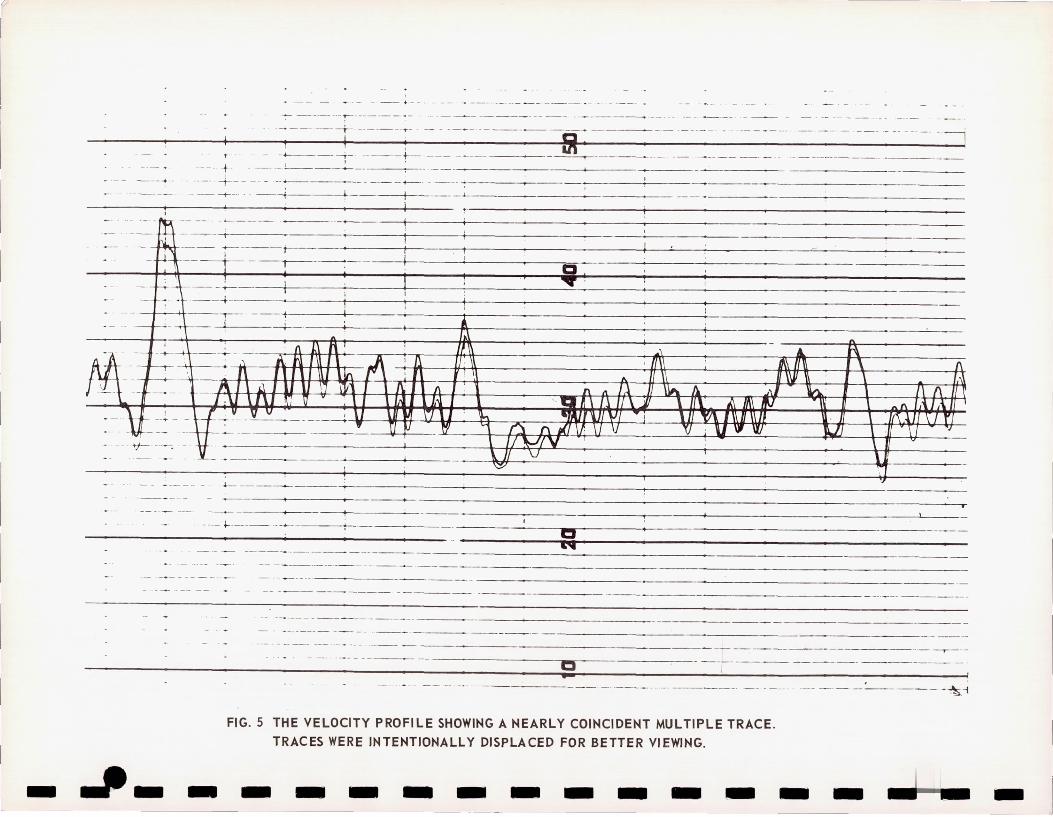
;-
-
, . -- - -- . -- - --- _., ------_ .. _- - --- --_._.- " --' -~ -----_.- :- --------------+- ------ ~- - - - ---- ----------- -----.- .- -- -- -- --- -- -- - - - - --- - -- --- - - - ----i
I C. . I -~_~ _+-- __ -;. _ _____ +-_ _ _____________ ~-_-----.- ._ .. ________ __ _ . ___ -_0-- -___ - _. _.---
I •
---- + - ---- '--- - - - ------. _ __ .... .. + -- - -_. - .. 4---_ _ ____ _ _ _ _ +-- ___ . ______ ~---
._ ___ ___ _ _ -+- _. ~ ___ --l _ _ _
I . ~------------------_+_----------------------------------• . , I
- - , - - - I • I ---·ft- -- -- -'----- - - .. -+--.----t-
. --- ~----t--' I C'
- . - - ! - I -----"7! rt
. : : ... . :~ ~-lf.E=~~---l- ~.! g!~~ ~~~~~*~ f!ll~~ AA 1f~tti~ -r:, : . ~ , .~ f -. -: -~--\ttr_v~= A~ I :~aflflff\- =~: ni .; : I
VJNVVJ \J~ 'l
-- _. -- - ---- - ~ ----
- --.- +------- .- ~-----+- 1:1 -..,- -
-- - - -----_._- ------ ------ ----- -------- ---- -.- - - - -- -- -----------------------~----------------
- -- .- -- - - - - ---------- ------- ----
.1'- -
-. -_ ._--- - - - - --- - ----- --- - - ------ - -
--- -- .- --- ._- ... .. '. - --- - - ------ - - ---- ----------------.- --r---
o -----.--------------- .
FIG_ 5 THE VELOCITY PROFILE SHOWIHG A HEARLY COIHCIDEHT MULTIPLE TRACE_
TRACES WERE INTEHTIONALLY DISPLACED FOR BETTER VIEWIHG .
- - - - - - - - - --- - - -' - - - - - -~-;
- - -
I
~ I I I I I I I
I I I I
I I
-111-
Figure 6. VELOCITY PROFILES FOR HEPA FILTERS, CAMBRIDGE MODEL lA50 (l-A-l) AND CAMBRIDGE MODEL lD50 (l-B-l)
EXPLANATORY NOTES
Air Velocity. Air velocity increases vertically upward. The lowest velocity level was isokinetic, 112 linear feet per minute, equivalent to 50 cfm in the air duct and 1 cfm Reyniers probe sampling rate. Velocity was measured at a distance of one inch from the filter face and was positioned at the entry port of the roving probe.
Increments of traverse. A machine drive (Figure 3) permits horizontal traverse as well as incremental vertical adjustments upward to provide complete scanning of the exit face of the filter under test. There were 8 horizontal increments for each complete cycle. The complete traverse covering the entire filter face area required 11 min. and 28 seconds. The total filter area was traversed a total of 10 times per test. Thus, there were 8 horizontal increments per traverse, or a total of 80 increments per test.
The probe orifice diameter of 1.25 inches provided an overlap of 0.25 inches between traverse increments. The sampling aliquot of the entire filter face area or volume was 1/52nd.
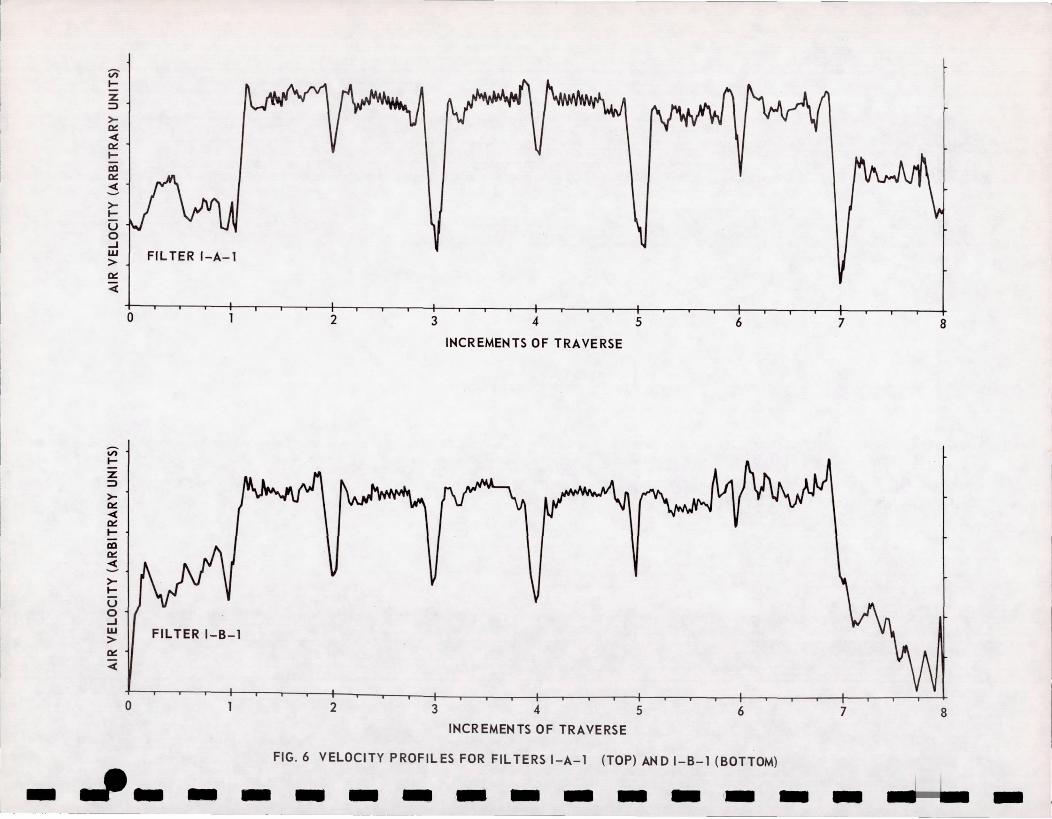
.. _--_._._-_._----
Vi" ..... Z :::l
>-c::: -« c::: ..... al c::: -« ->-..... u 0 ..J W > c::: 4
." ..... Z :::l
>c::: -« c::: ..... al c::: -« ->..... u o ..J W > c::: -«
FIL TER I-A-1
4-0
FILTER I-B-1
o
l_ . ~_~- - -
2 3 4 5 6
INCREMENTS OF TRAVERSE
2 3 4 5 6
INCREMENTS OF TRAVERSE
FIG. 6 VELOCITY PROFILES FOR FIL TERS I-A-1 (TOP) AND I-B-1 (BOTTOM)
------ - - -
7 8
7 8
- - -
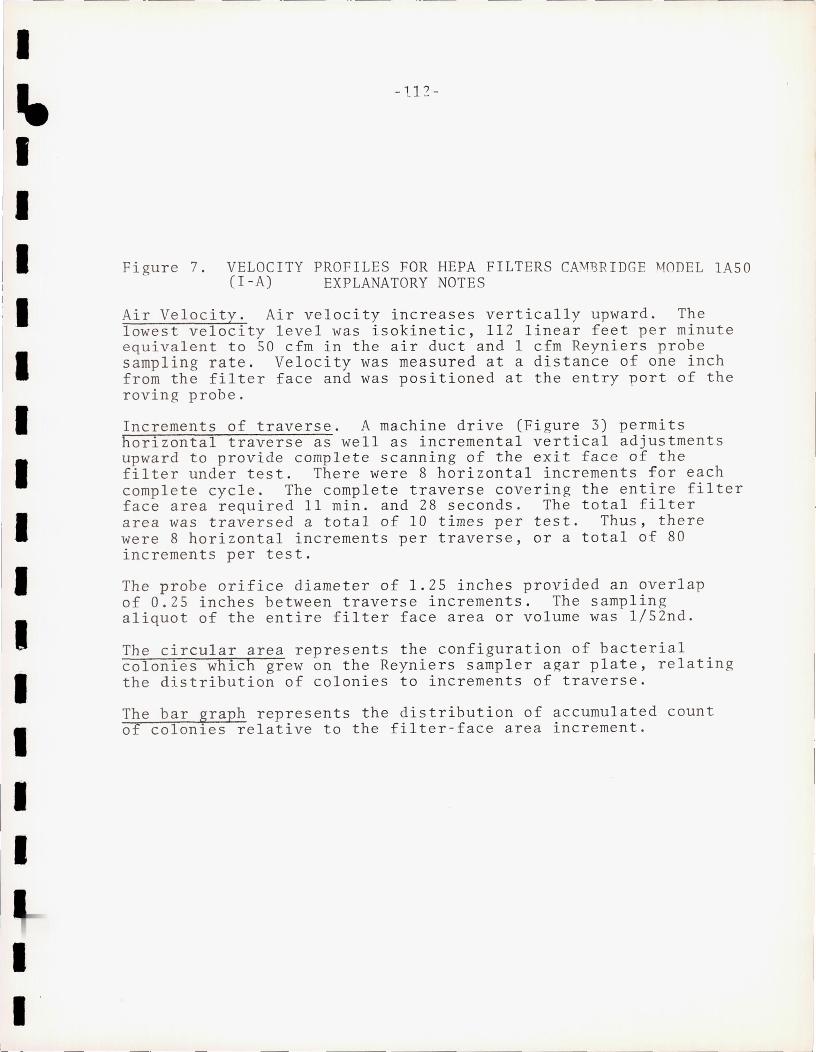
I
~ I I I I I I I I I I I I I I
I I
-112-
Figure 7. VELOCITY PROFILES FOR HEPA FILTERS CAMBRIDGE MODEL lA50 (I-A) EXPLANATORY NOTES
Air Velocity. Air velocity increases vertically upward. The lowest velocity level was isokinetic, 112 linear feet per minute e quivalent to 50 cfm in the air duct and 1 cfm Reyniers probe sampling rate. Velocity was measured at a distance of one inch from the filter face and was positioned at the entry port of the roving probe.
Increments of traverse. A machine drive (Figure 3) permits horizontal traverse as well as incremental vertical adjustments upward to provide complete scanning of the exit face of the filter under test. There were 8 horizontal increments for each complete cycle. The comp lete traverse covering the entire filter face area required 11 min. and 28 seconds. The total filter area was traversed a total of 10 times per test. Thus, there were 8 horizontal increments per traverse, or a total of 80 increments per test.
The probe orifice diameter of 1.25 inches provided an overlap of 0.25 inches between traverse increments . The sampling aliquot of the entire filter face area or v olume was 1/52nd.
The circular area represents the configuration of bacterial colonies which grew on the Reyniers sampler agar plate, relating the distribution of colonies to increments of traverse.
The bar graph represents the distribution of accumulated count of colonies relative to the filter-face area increment.
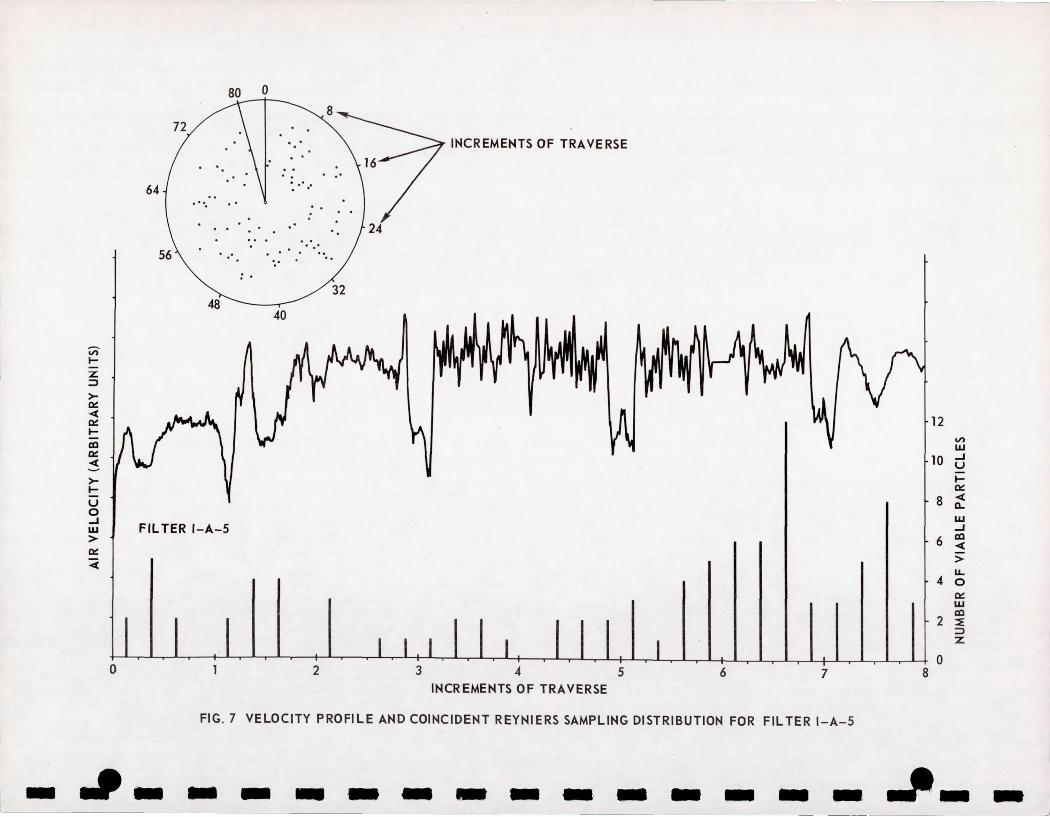
8'L-!l.
INCREMENTS OF TRAVE RSE
32
12 VI LU
10 -I U I-~
8 -4 0.. LU -I
6 III -4 > u..
4 0 ~ LU III
2 ~ :::l Z
o 2 3 4 5 0
6 7 8 INCREMENTS OF TRAVERSE
FIG.7 VELOCITY PROFILE AND COINCIDENT REYNIERS SAMPLING DISTRIBUTION FOR FIL TER I-A-5
- .#. - - - -- - - -.- - - - - J_ -
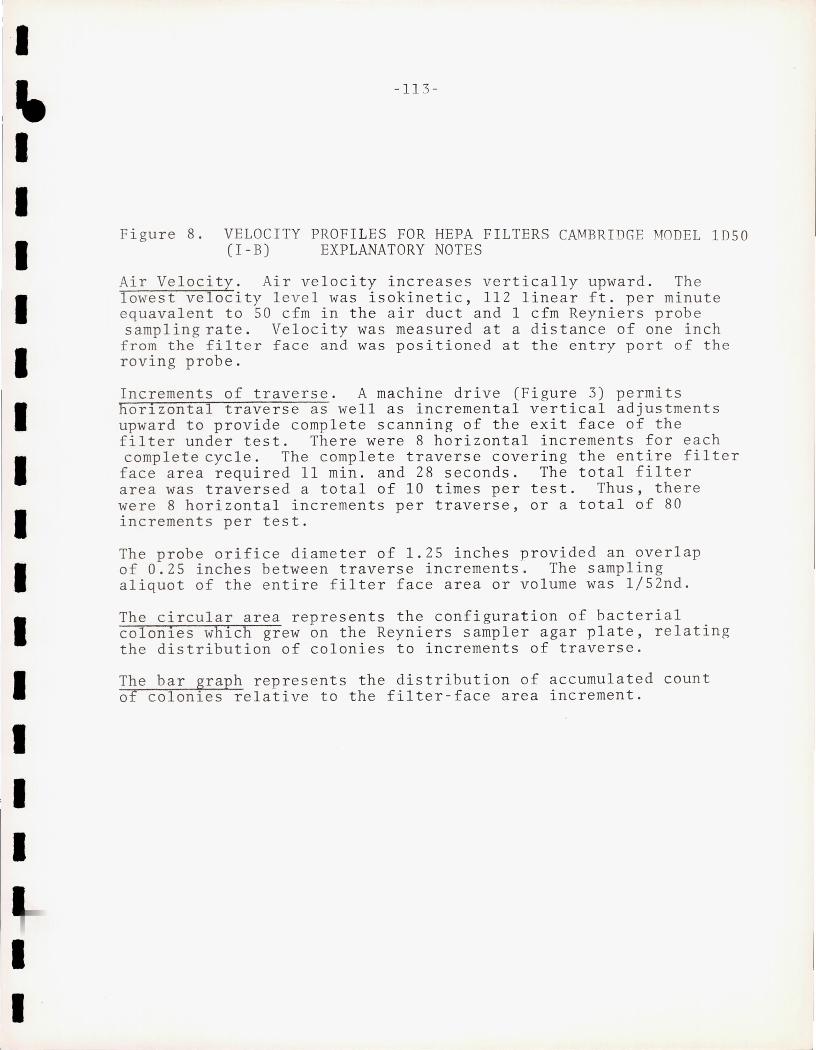
I
~ I I I I I I I
'I I I I I I I
I I
-11 3 -
Fi gure 8. VELOCITY PROFILES FOR HEPA FILTERS CAMBRI DGE MODEL lD 50 (I- B) EXPLANATORY NOTES
Ai r Velocity. Air velocity increases vertically upward. Th e lowest velocity l eve l was isokinetic, 112 linear f t. per minute e quavalent to 50 cfm in the air duct and 1 cfm Reyniers prob e samplin g rate. Velocity was measured at a distance of one inch fr om the f ilter face and was positioned at the entry port of the roving probe.
I ncrements of traverse. A machine drive (Figure 3) permits horizontal traverse as well as incremental vertical adjustments upward to provide complete scanning of the exit face of the fi lter under test. There were 8 horizontal increments for e a ch complete cycle. The complete traverse covering the entire filt e r
f ace area required 11 min. and 28 seconds. The total filter are a was traversed a total of 10 times per test. Thus, there were 8 horizontal increments per traverse, or a total of 80 increments per test.
The probe orifice diameter of 1.25 inches provided an overlap o f 0.25 i nches between traverse increments. The sampling aliquot o f the entire filter face area or volume was 1/52nd.
The circular area represents the configuration of bacterial colonies which grew on the Reyniers sampler agar plate, relating the distribution of colonies to increments of traverse.
The bar graph represents the distribution of accumulated count o f c olon ies relative to the filter-face area increment.
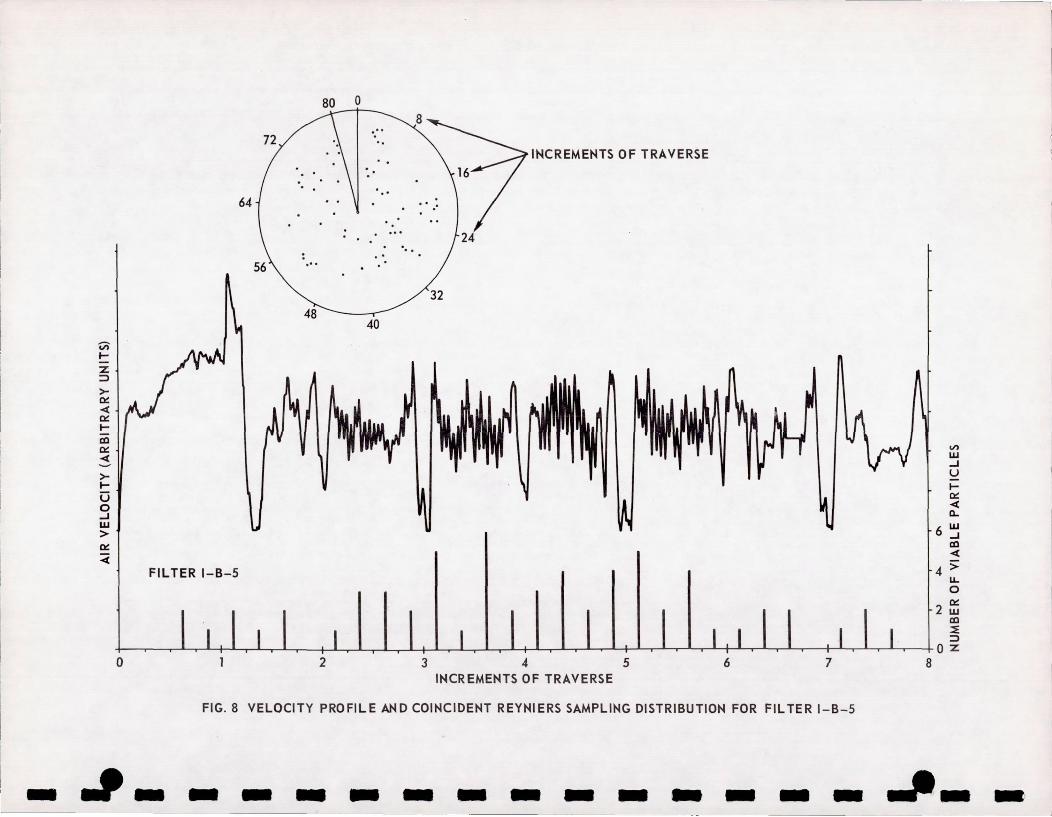
-
VI I-
Z :::> >~
< ~ I-al ~
< ->I-a o ...J W > ~
:;( FILTER I-B-5
o
80 0 .:--+
64
. "
48
2
40
INCREMENTS OF TRAVERSE
32
345 INCREMENTS OF TRAVERSE
on W ...J U I~
< 0..
6 W ...J al <
4 :;; u.. o
2 ~
I I al ~ ::J
10 z 6 7 8
FIG. 8 VELOCITY PROFILE AND COINCIDENT REYNIERS SAMPLING DISTRIBUTION FOR FILTER I-B-5
.#- - - - - - - - - - - - - - ---
l I
..
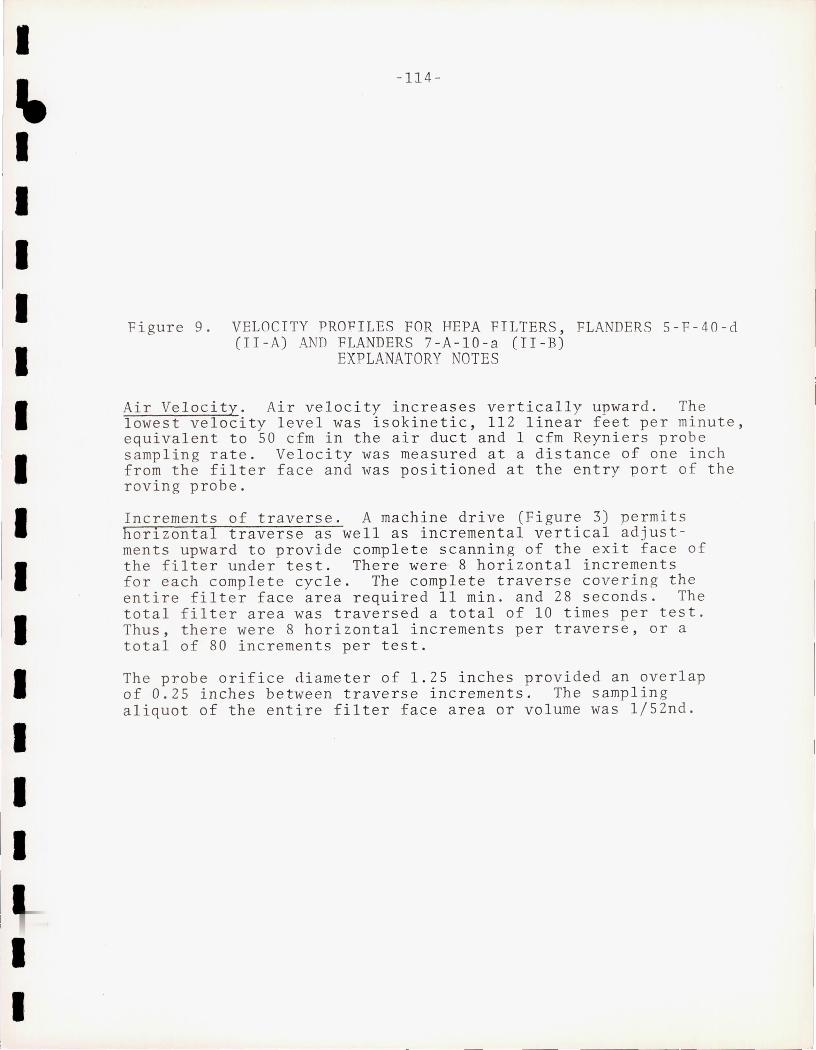
I
~ I I I I I I
II
I I I I I I I
I I
-114-
Figure 9. VELOCITY PROFILES FOR HEPA FILTERS, FLANDERS 5-F-40-d (II-A) AND FLANDERS 7-A-lO-a (II-B)
EXPLANATORY NOTES
Air Velocity. Air velocity increases vertically upward. The lowest velocity level was isokinetic, 112 linear feet per minute, equivalent to 50 cfm in the air duct and 1 cfm Reyniers probe sampling rate. Velocity was measured at a distance of one inch from the filter face and was positioned at the entry port of the roving probe.
Increments of traverse. A machine drive (Figure 3) permits horizontal traverse as well as incremental vertical adjustments upward to provide complete scanning of the exit face of the filter under test. There were 8 horizontal increments for each complete cycle. The complete traverse covering the entire filter face area required 11 min. and 28 seconds. The total filter area was traversed a total of 10 times per test. Thus, there were 8 horizontal increments per traverse, or a total of 80 increments per test.
The probe orifice diameter of 1.25 inches provided an overlap of 0.25 inches between traverse increments. The sampling aliquot of the entire filter face area or volume was 1/52nd.
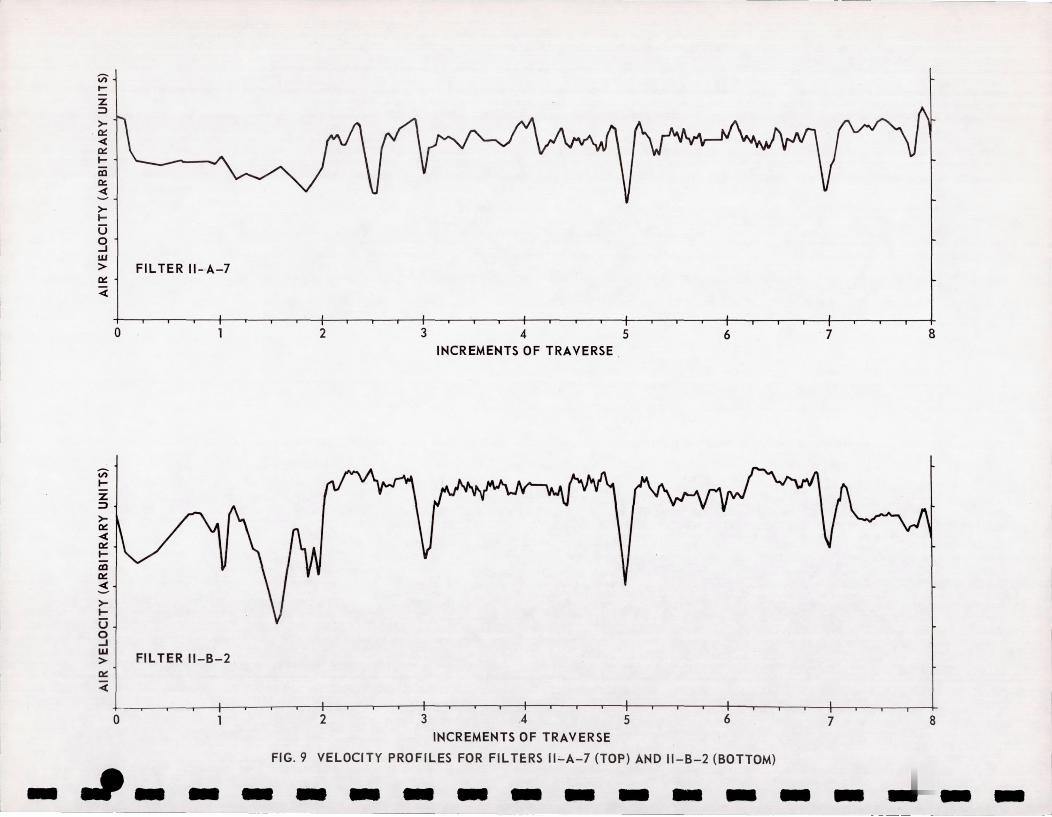
-
Vi' t-
Z ::J
>-. Q::
~ Q::
tiii fl: ~ -->t-O o ...J W
> FILTER 1I-·A-7 Q::
::;(
Vi' t-Z ::J
>Q::
~ Q:: tOl Q::
~ -->t-O o ...J
o
W > I FILTER II-B-2 Q::
~
o
2 3 4 5 6 INCREMENTS OF TRAVERSE
2 3 4 5 6
INCREMENTS OF TRAVERSE
FIG. 9 VELOCITY PROFILES FOR FILTERS II-A-7 (TOP) AND II-B-2 (BOTTOM)
~- - - - -- - -- - - -
7 8
7 8
- - _ "r=-- __
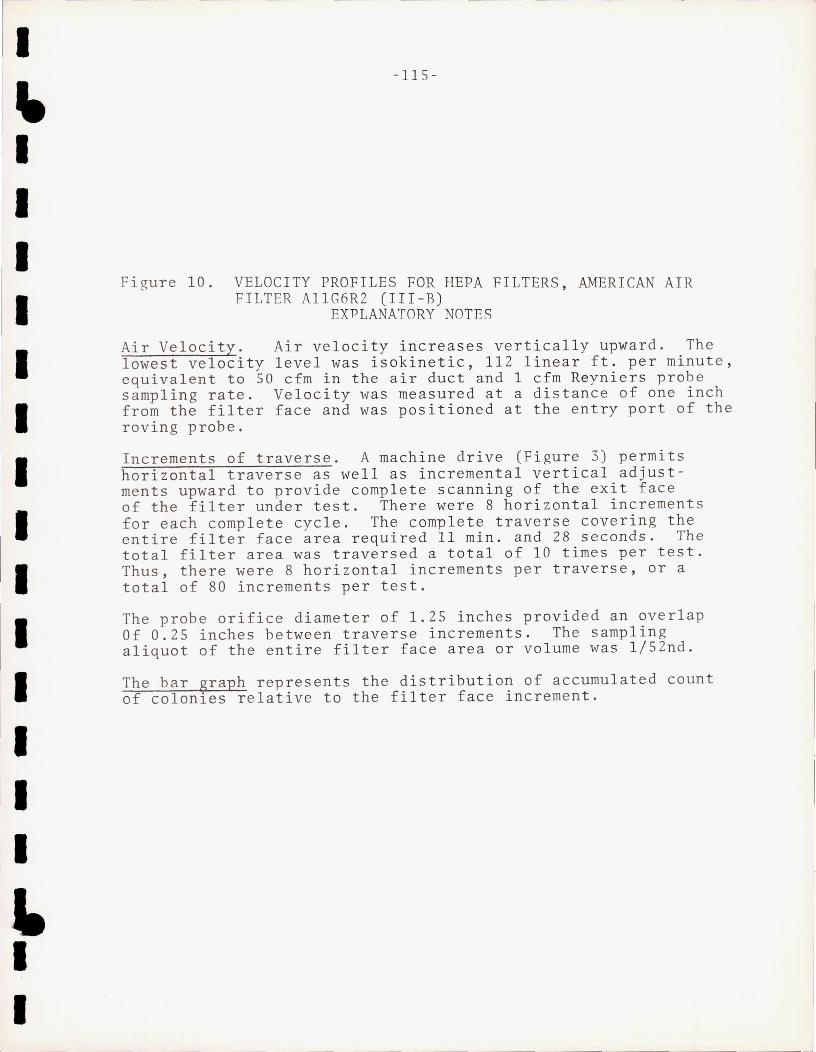
I I I I I I I I I I I
It I I
-115-
Figure 10. VELOCITY PROFILES FOR HEPA FILTERS, AMERICAN AIR FILTER AllG6R2 (III-B)
EXPLANATORY NOTES
Air Velocity. Air velocity increases vertically upward. The lowest velocity level was isokinetic, lIZ linear ft. per minute, equivalent to 50 cfm in the air duct and 1 cfm Reyniers probe sampling rate. Velocity was measured at a distance of one inch from the filter face and was positioned at the entry port of the roving probe.
Increments of traverse. A machine drive (Figure 3) permits horizontal traverse as well as incremental vertical adjustments upward to provide complete scanning of the exit face of the filter under test. There were 8 horizontal increments for each complete cycle. The complete traverse covering the entire filter face area required 11 min. and 28 seconds. The total filter area was traversed a total of 10 times per test. Thus, there were 8 horizontal increments per traverse, or a total of 80 increments per test.
The probe orifice diameter of 1.Z5 inches provided an overlap Of 0.Z5 inches between traverse increments . The sampling aliquot of the entire filter face area or volume was 1/5Znd.
The bar graph represents the distribution of accumulated count of colonies relative to the filter face increment.
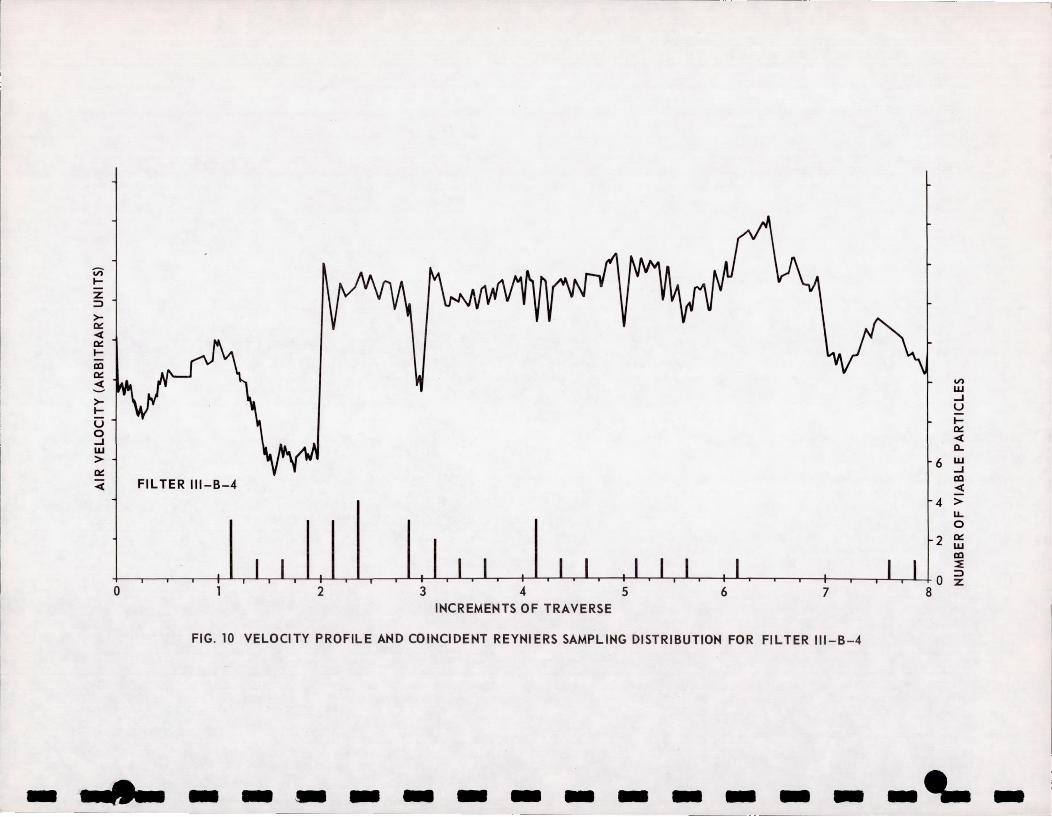
Vi" ..... z :::> >-0::: < 0::: ..... al 0:::
~ >..... u o ...J W > 0:::
~ FILTER III-B-4
o 2 3 4 5 6 7 INCREMENTS OF TRAVERSE
FIG. 10 VELOCITY PROFILE AND COINCIDENT REYNIERS SAMPLING DISTRIBUTION FOR FILTER III-B - 4
_ ....... - - .- - - - - - - - - - -
on W ...J U ..... 0::: < ~
6 w ...J al <
4 > LL 0
2 0::: W al ~ :::> z
-'- -
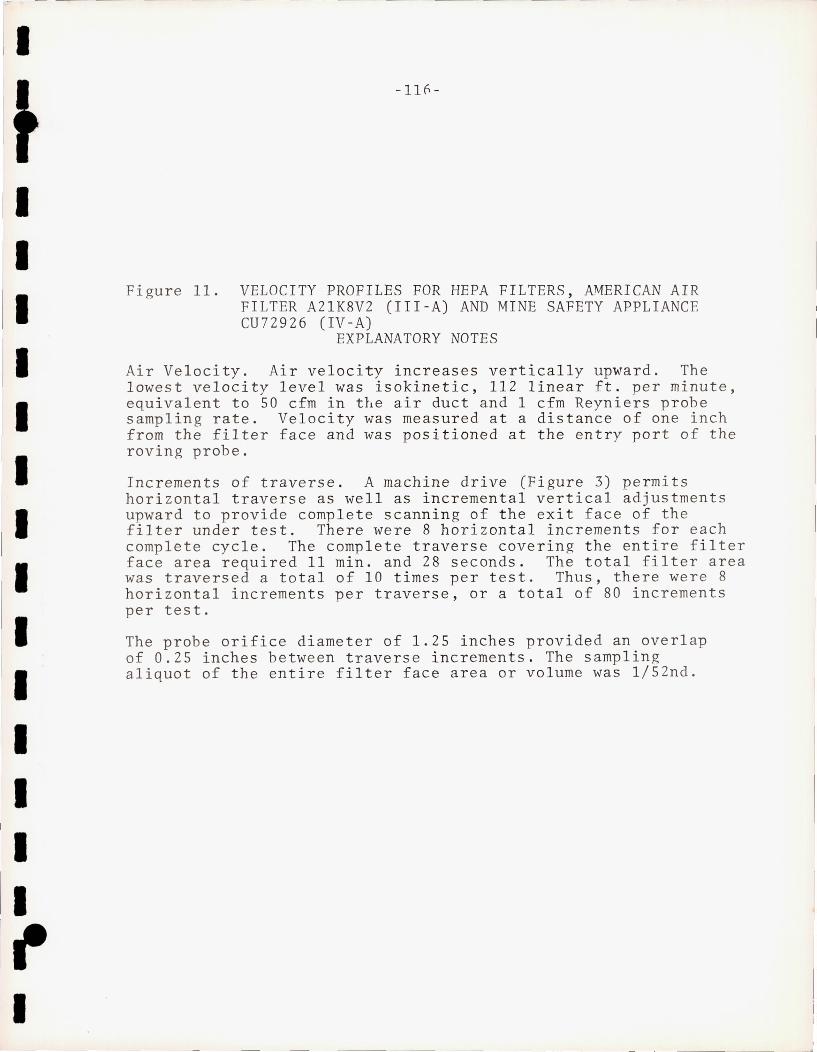
r I
I I I I I I I I I I I I I I t' I
-ll()-
Figure 11. VELOCITY PROFILES FOR HEPA FILTERS, AMERICAN AIR FILTER A21K8V2 (III-A) AND MINE SAFETY APPLIANCE CD 7 2 9 2 6 (IV -A)
EXPLANATORY NOTES
Air Velocity. Air velocity increases vertically upward. The lowest velocity level was isokinetic, 112 linear ft. per minute, equivalent to 50 cfm in the air duct and 1 cfm Reyniers probe sampling rate. Veloci ty was measured at a distance of one inch from the filter face and was positioned at the entry port of the roving probe.
Increments of traverse. A machine drive (Figure 3) permits horizontal traverse as well as incremental vertical adjustments upward to provide complete scanning of the exit face of the filter under test. There were 8 horizontal increments for each complete cycle. The complete traverse covering the entire filter face area required 11 min. and 28 seconds. The total filter area was traversed a total of 10 times per test. Thus, there were 8 horizontal increments per traverse, or a total of 80 increments per test.
The probe orifice diameter of 1.25 inches provided an overlap of 0.25 inches between traverse increments. The sampling aliquot of the entire filter face area or volume was 1/52nd.
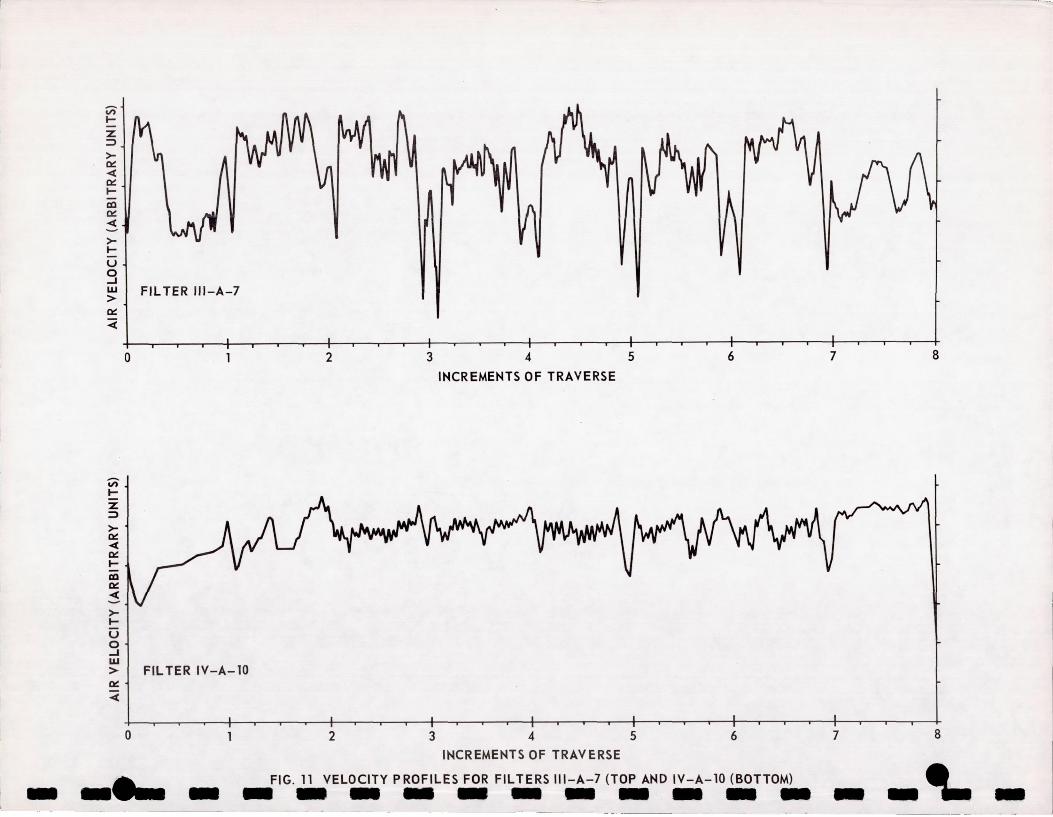
r-
-
Vi' .... z :::> ~ 0:: 4 0:: .... a::I 0:: 4
~ .... U o ...J ~ I FILTER III-A-7
0::
~
Vi' .... z :::> ~ 0:: 4 0:: .... a::I 0:: 4 -~ ....
o
u o ...J W > I FILTER IV-A-I0 0::
~
o
2
2
3 4 5 6 7 8
INCREMENTS OF TRAVERSE
3 4 5 6 7 8
INCREMENTS OF TRAVERSE
FIG. 11 VELOCITY PROFILES FOR FILTERS III-A-7 (TOP AND IV-A-lO (BOTTOM) • ------------_ ... --
I I
I I I I I I I I I
,I I I I I
-117-
Figure 12. MEMBRANE FILTRATION ASSEMBLIES: MILLIPORE, GELMAN, AND SCHLEICHER AND SCHUELL
I J
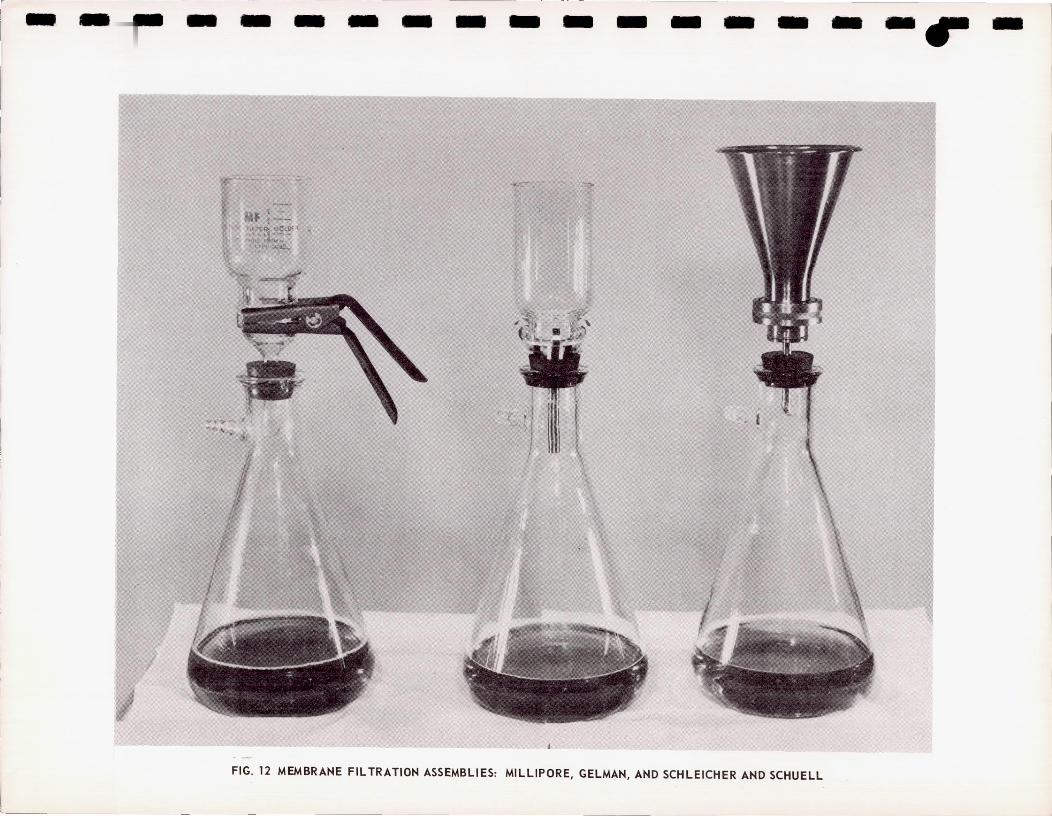
I Ie I I I I I I I I I I I I I I I I
..J ..J W
:J
:I: U
on o %
~
0:: W
:I: U
W
..J :I: U
on o %
~
% ~ ~
..J W
<.!I
W
0:: o c.. ..J ..J
~
I~
·IL
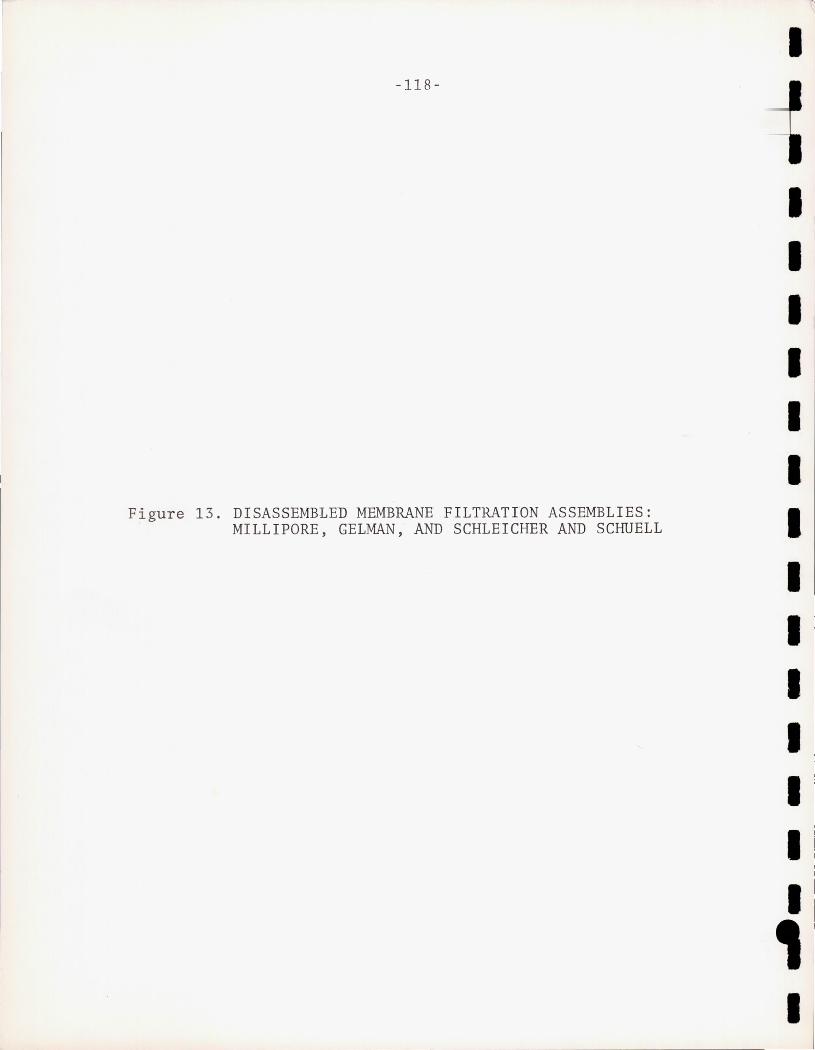
--------------- ---------------------- --
-118-
Figure 13. DISASSEMB~LED MEMBRANE FILTRATION ASSEMBLIES: MILLIPORE, GELMAN, AND SCHLEICHER AND SCHUELL
-"
I
I 11
I I I I I I I I I I I I , I
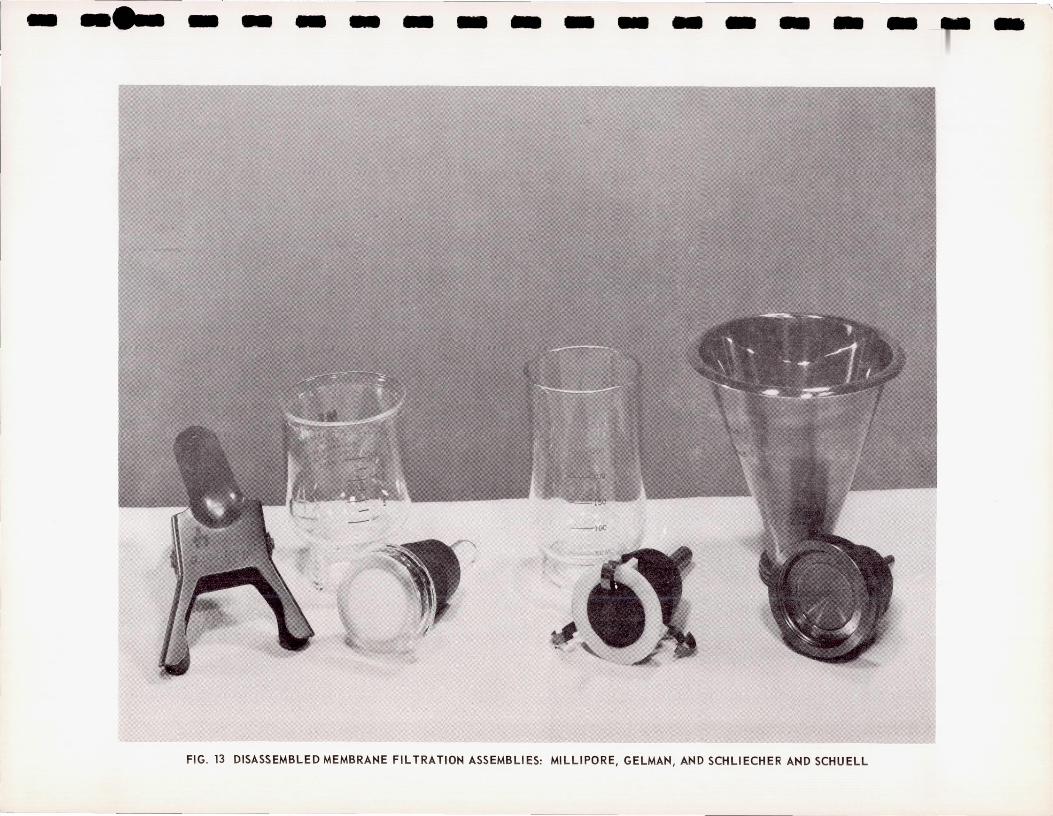
- --~- --- -, - ---------_ .. _-- -
FIG. 13 DISASSEMBLED MEMBRANE FIL TRATION ASSEMBLIES: MILLIPORE, GELMAN , AND SCHLIECHER AND SCHUELL
-119-
Figure 14. STAINLESS STEEL MEMBRANE FILTRATION ASSEMBLY (GELMAN)
I
I I I I ' I I I I I I I I I I I , I
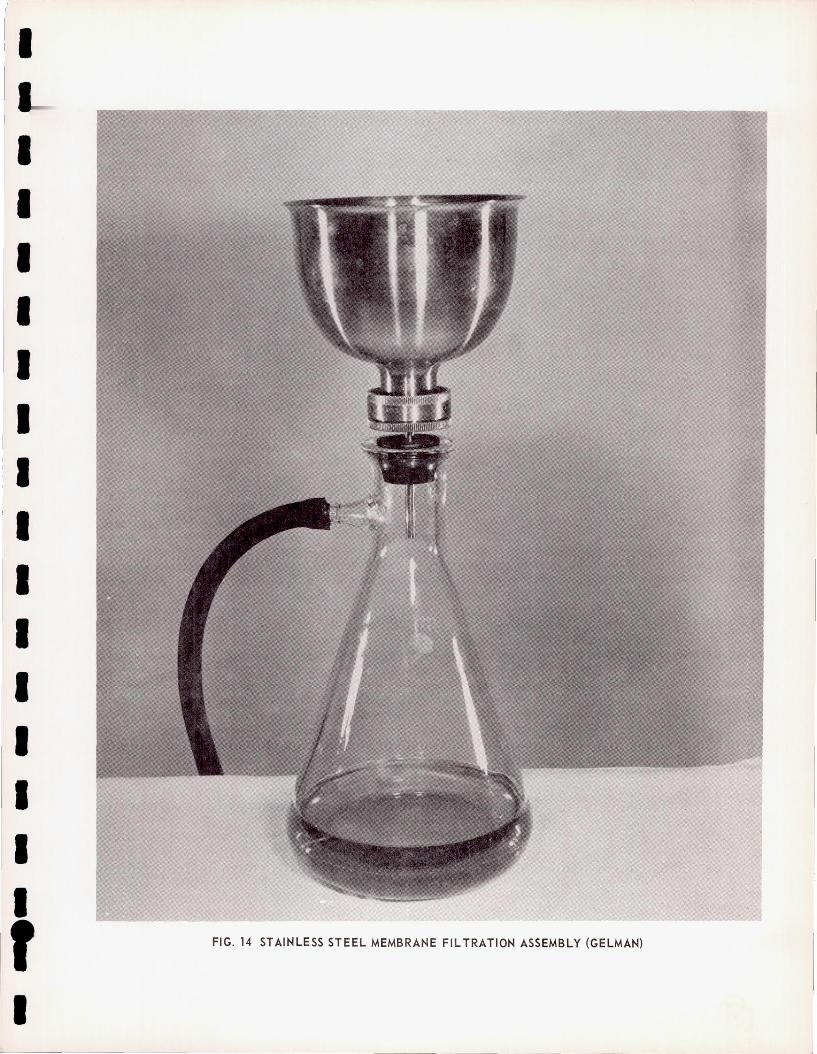
( - -
i l I
I I I I I I I
' I I I I I I I I r I
FIG. 14 STAINLESS STEEL MEMBRANE FIL TRATION ASSEMBLY (GELMAN)
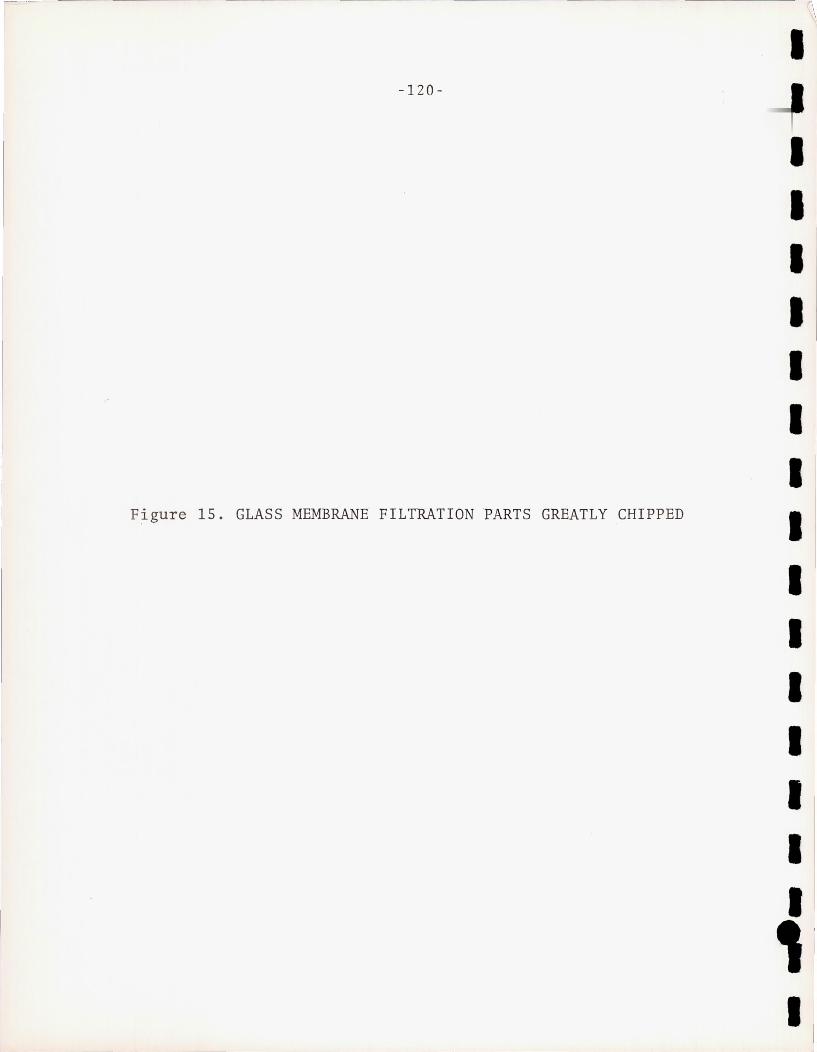
- 120-
Figure 15. GLASS MEMBRANE FILTRATION PARTS GREATLY CHIPPED
I I I I
I I I
I I I
I I I I I I I I
' 1 I
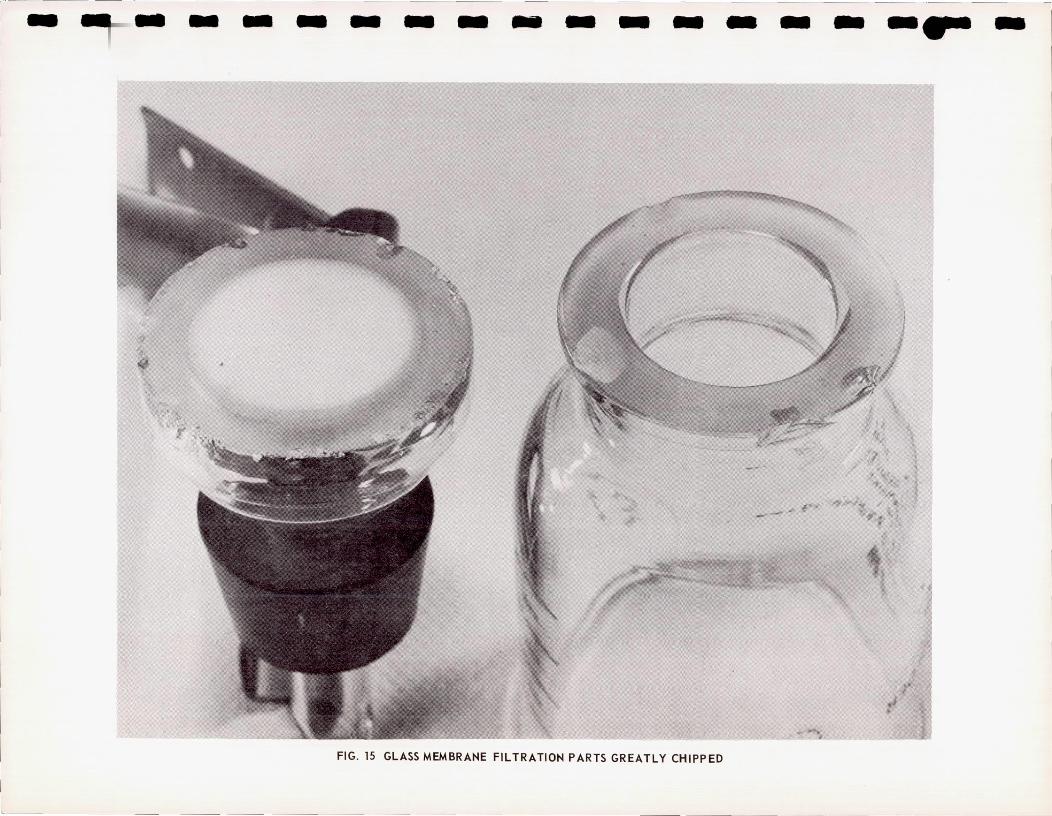
I
I~ I I
II I
I I I I I I I I I I I I I
-----
-
"
o W
0... 0...
:t: U
>...J ..... <
W
0:
l!)
VI
..... 0
: <
0...
Z
o ..... <
0
: ..... ...J u.. W
Z
<
0
: CO
~ ~ VI
VI
<
...J l!)
Ln
~
l!)
u..
I ~ ----- - - - - -~ - - - ~ ----- - - I
-12 1-
I I I I I I I I
I Figure 16 . LIQUID FILTRATION FILTERS: SCHLEICHER AND SCHUELL I I
PALL , SELAS, HORMAN, AND GELMAN
. 1
. 1
.i I I I I I I I ,1 I
- - - --~
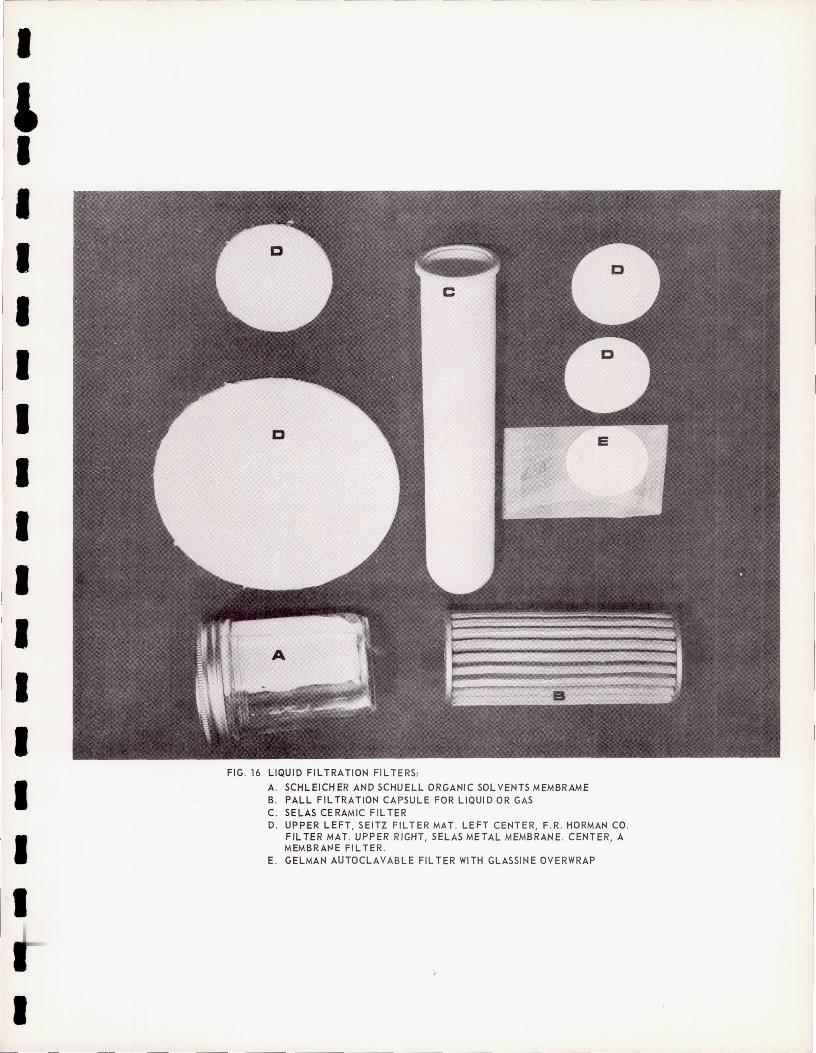
, I I I I I I I I I
I I I I I
I
-~- --- --
FIG. 16 LIQUID FIL TRATION FIL TERS:
A. SCHLEICHER AND SCHUELL ORGANIC SOLVENTS MEMBRAME B. PALL FIL TRATION CAPSULE FOR LIQUID OR GAS C. SELAS CERAMIC FIL TER D. UPPER LEFT, SEITZ FILTER MAT . LEFT CENTER, F . R. HORMAN CO .
FIL TER MAT. UPPER RIGHT, SELAS METAL MEMBRANE. CENTER, A MEMBRANE FILTER.
E. GELMAN AUTOCLAVABLE FIL TER WITH GLASSINE OVERWRAP
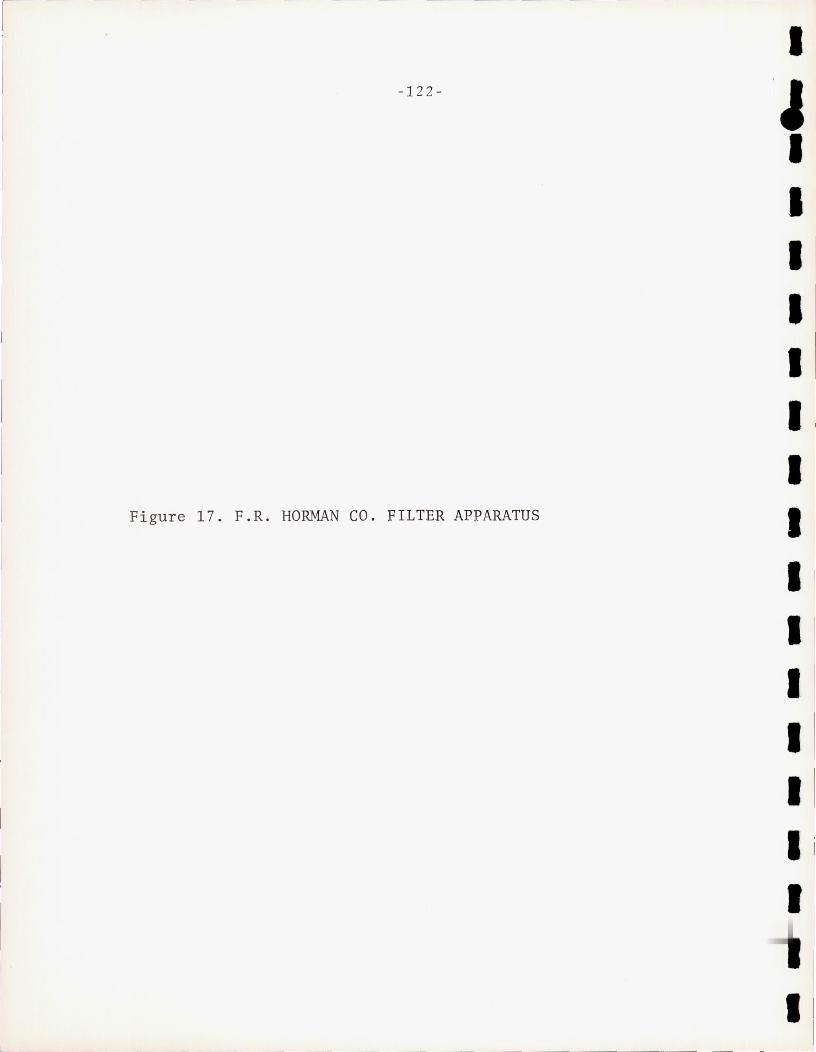
- - "----- - ~- - -
-12 2 -
Figure 17. F.R. HORMAN CO. FILTER APPARATUS
I I ' ~
I I I I I I I I I I I I I I
I I
I
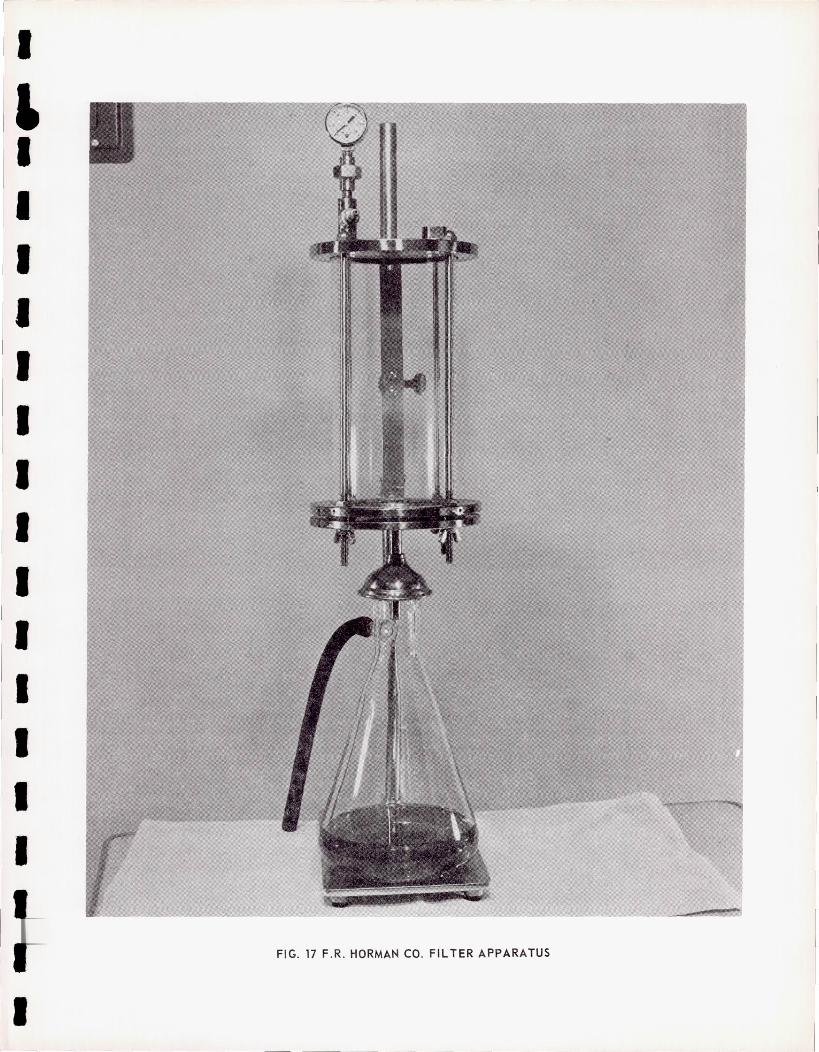
,-- - - - -
II , I I I I I I
II I I I I
II II I
I
FIG. 17 F.R. HORMAN CO . FILTER APPARATUS
I ---- ---
-1 23-
Figure 18. APPARATUS FOR LOW PRESSURE FILTRATION OF LIQUIDS
I i I I 1 I I I I I I I I I I I I I I , I
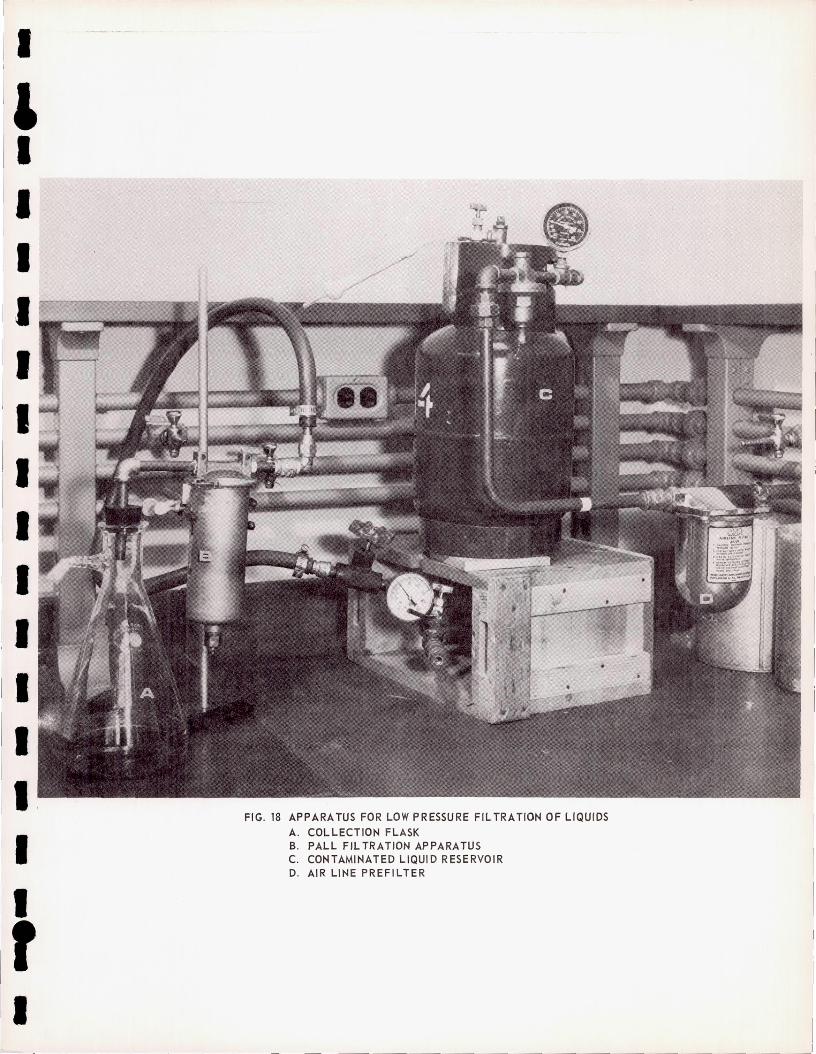
I
rl I I, II I II II I, I, I, I I, II I, I I I, I r I
----- - - - - - - -- -- -- -- - -- - --- _ .- - ~- -
FIG. 18 APPARATUS FOR LOW PRESSURE FIL TRA nON OF LIQUIDS A. COLLECTION FLASK B. PALL FIL TRATION APPARATUS C. CONTAMINATED LIQUID RESERVOIR D. AIR LINE PREFILTER
-1 24 -
Figure 19. HIGH PRESSURE LIQUID FILTRATION APPARATUS TESTING MEMBRANE FILTERS
FOR
I
I I I I I I I I
I I I I I I I , I
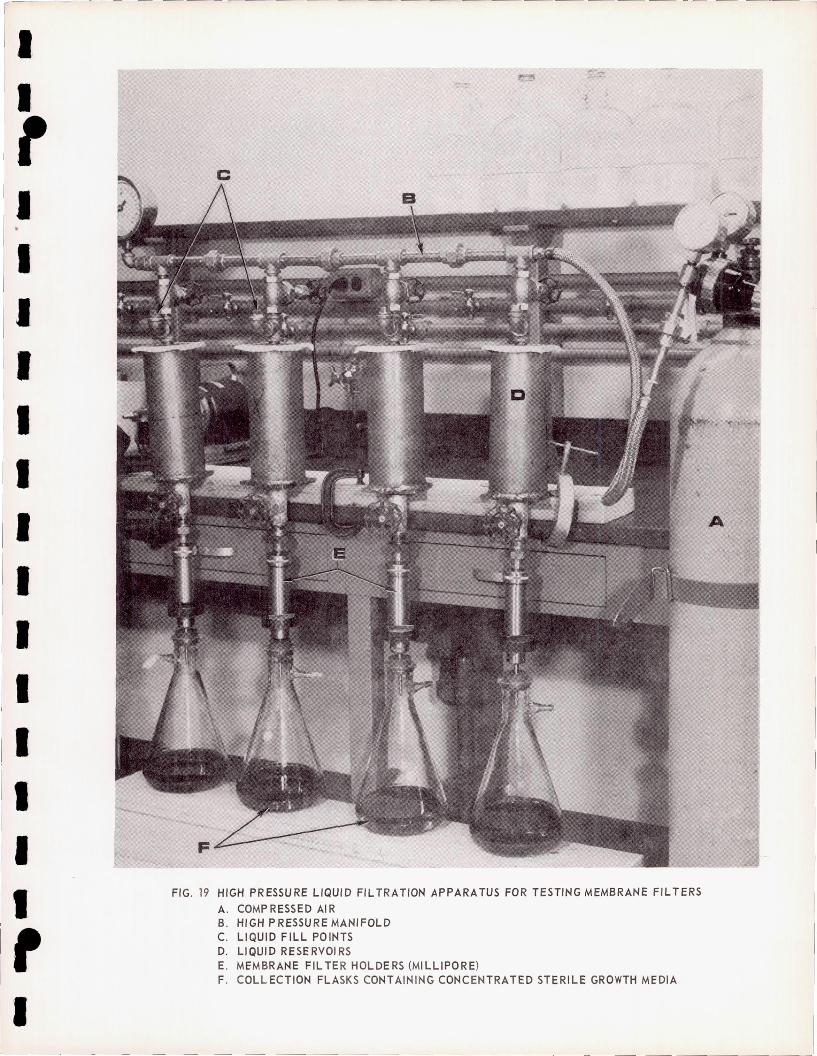
I It II ]', II II II II I
II II /1 I
II II I I,
II
-~--~-- ~ - - - - - -- ~ -- I
FIG. 19 HIGH PRESSURE LIQUID FIL TRATIDN APPARATUS FOR TESTING MEMBRANE FIL TERS
A . COMP RESSED AI R B. HIGH PRESSURE MANIFOLD C. LIQUID FILL POINTS D. LIQUID RESERVOI RS E. MEMBRANE FIL TE R HOLDERS (MILLIPORE) F. COL L ECTION FLASKS CONTAININ G CONC ENTRATED STERILE GROWTH MEDIA
1--1 25 -
I
JI I I I I I I I
Figure 20. HIGH PRESSURE DOUBLE LIQUID FILTRATION APPARATUS I I FOR TESTING MEMBRANE FILTERS IN SERIES
- ---- - - --- - ----
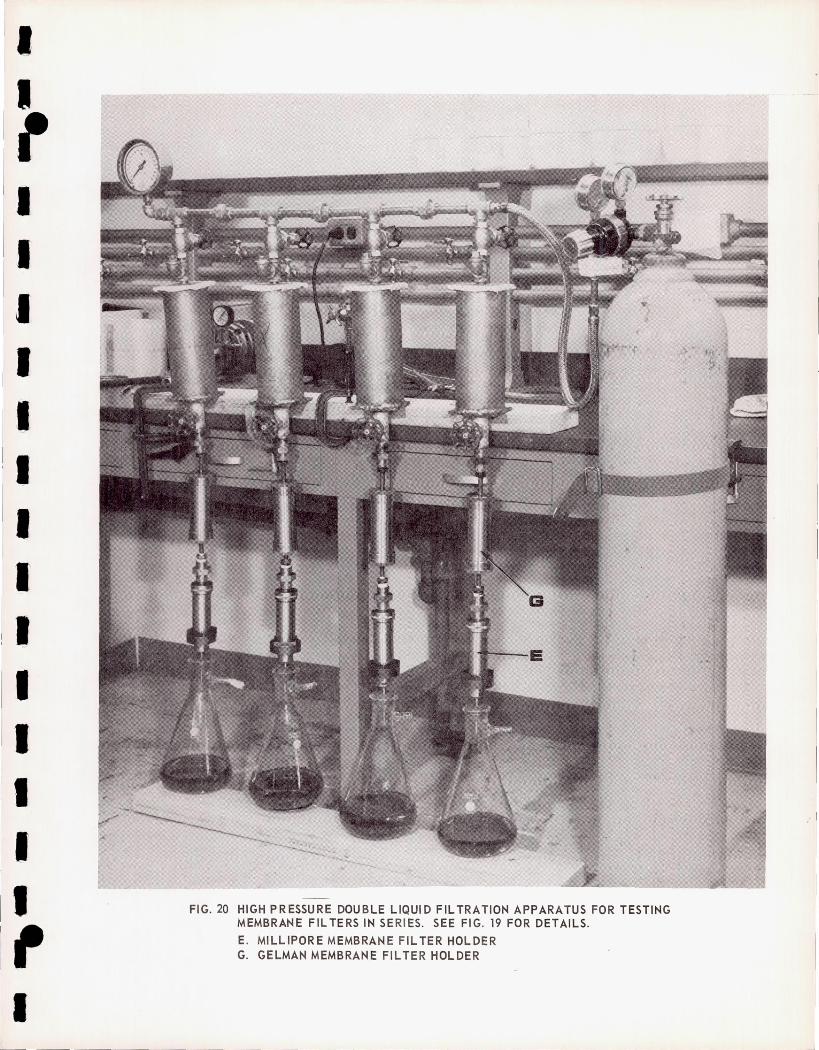
- - -- --r-
II
If I I I
/1 I I I I I I I I I I I, I
FIG. 20 HIGH PRESSURE DOUBLE LIQUID FIL TRATION APPARATUS FOR TESTING MEMBRANE FIL TERS IN SERIES. SEE FIG. 19 FOR DETAILS.
E. MILLIPORE MEMBRANE FIL TER HOLDER G. GELMAN MEMBRANE FILTER HOLDER
- 126-
Figure 21. APPARATUS FOR TESTING HIGH PRESSURE GAS FILTERS
1
I :
I I I I I 1 I I I I I
I I I I
I )
; I .
- - -- -- - ~~
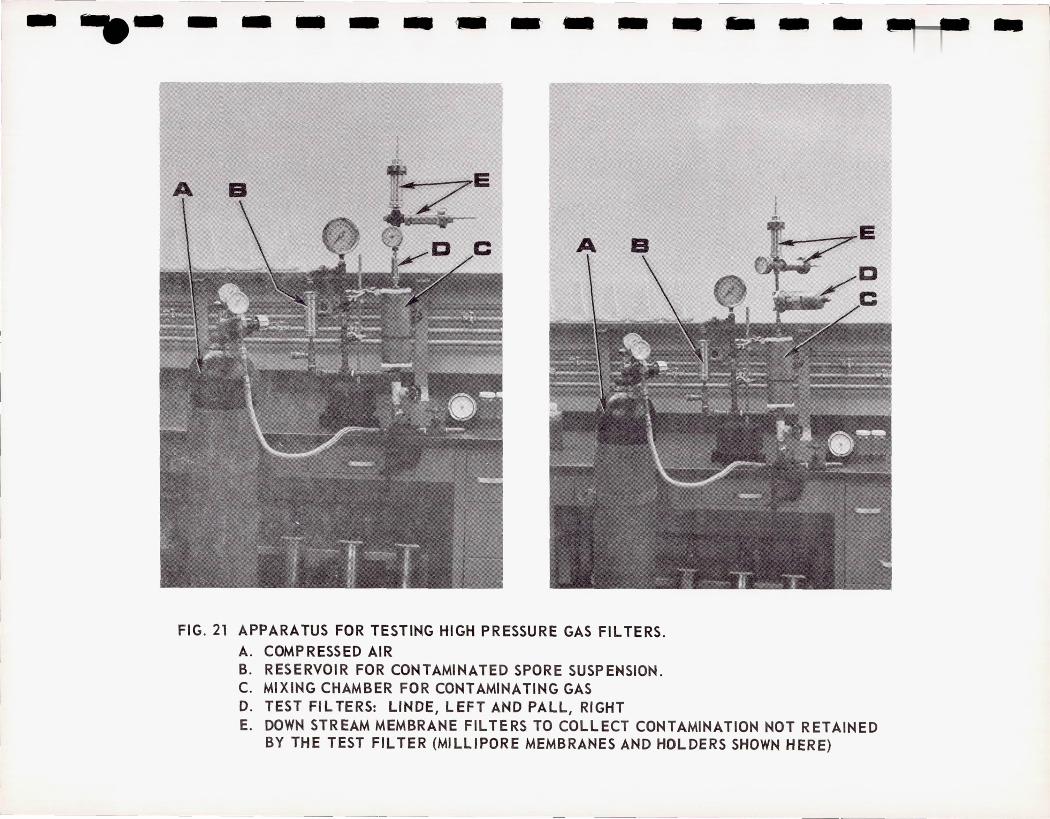
- -.- - - - - - .-- .. - - - - - -~~
A B
FIG. 21 APPARATUS FOR TESTING HIGH PRESSURE GAS FILTERS.
A. COMPRESSED AIR B. RESERVOIR FOR CONTAMINATED SPORE SUSPENSION. C. MIXING CHAMBER FOR CONTAMINATING GAS D. TEST FIL TERS: LINDE, LEFT AND PALL, RIGHT E. DOWN STREAM MEMBRANE FILTERS TO COLLECT CONTAMINATION NOT RETAINED
BY THE TEST FILTER (MILLIPORE MEMBRANES AND HOLDERS SHOWN HERE)
- l I I I !
-127-
I
I I I I
I I i
I
I I I
I
I Figure 22. HIGH PRESSURE GAS FILTERS: PALL ULTIPOR, LINDE, I I
, AND REPRESENTATIVE MEMBRANE
I
I 1'1 1'1 I I I
I
I I I I , : I
_ ~ J
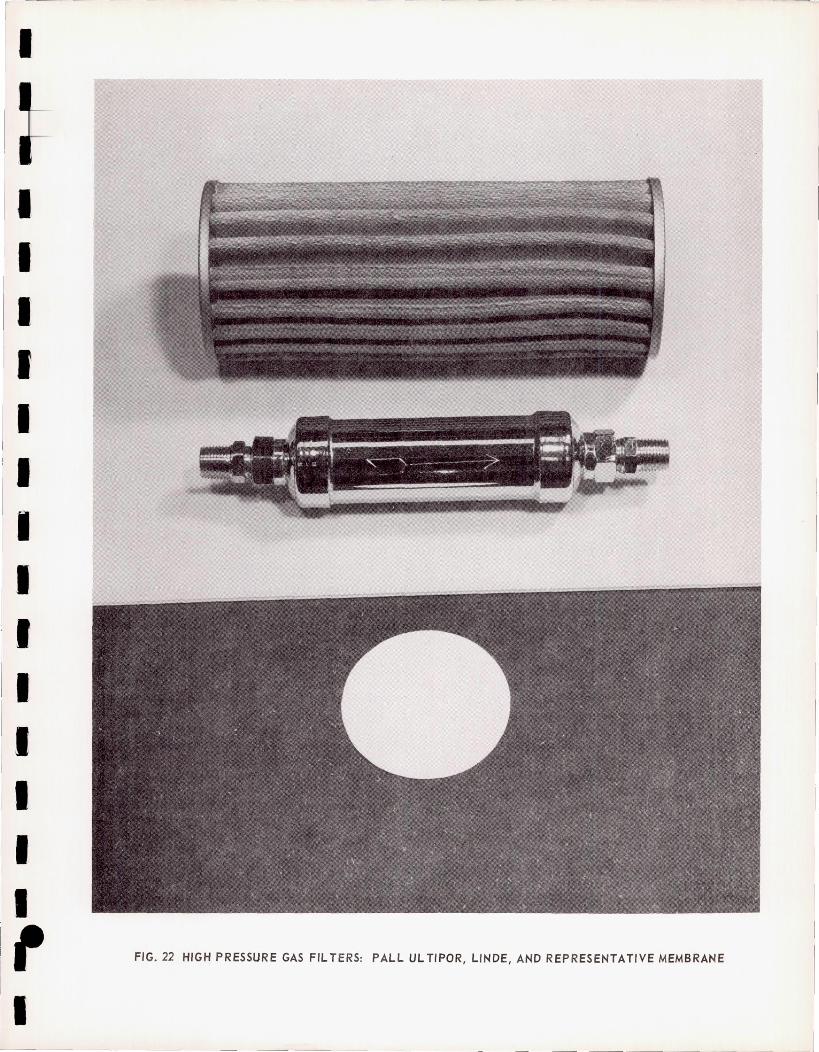
I ------ - - - - -- - -,
I
I I I I I I I I I
[, I II I, I , FIG. 22 HIGH PRESSURE GAS FIL TERS: PALL UL TlPOR, LINDE, AND REPRESENTATIVE MEMBRANE
I ---
1-,
-128-
Figure 23. FILTER HOLDERS FOR SELAS PORCELAIN AND SEITZ
I I
~ I I I I I I I I I I I . I I I
I J
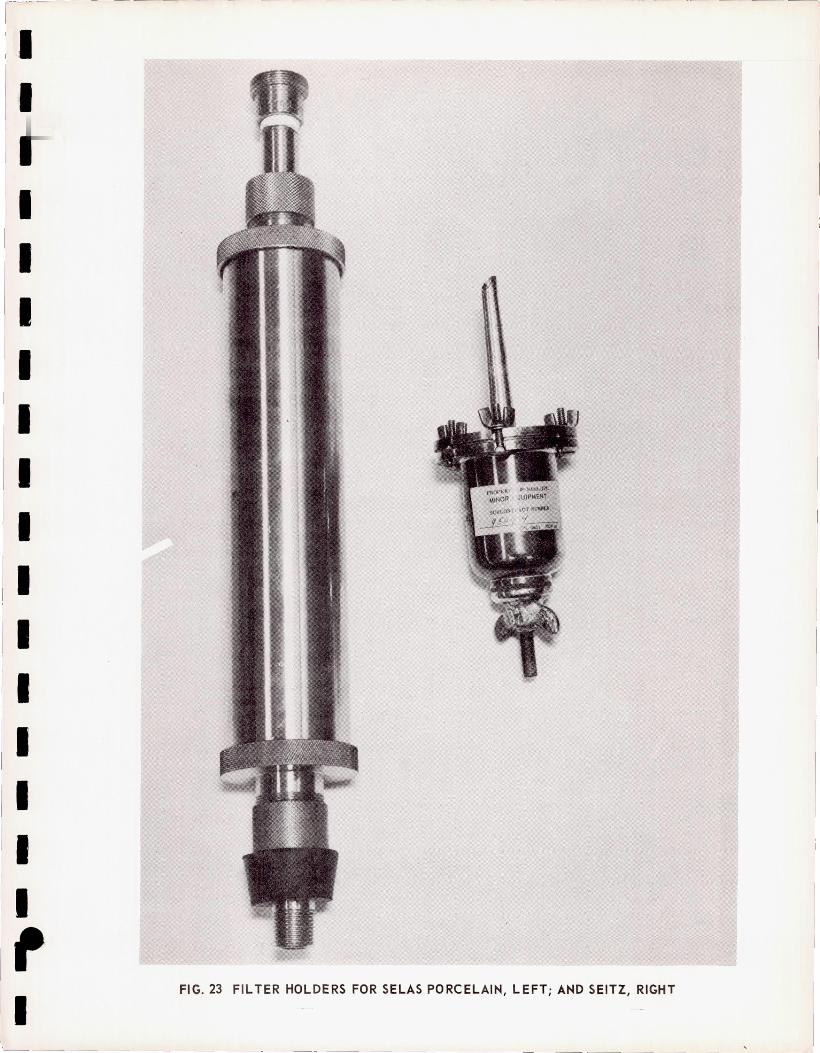
r----~---- ------ - --- -- ------:1 I
I I I I I I I I I I I
II I
I I
f I
FIG. 23 FILTER HOLDERS FOR SELAS PORCELAIN, LEFT; AND SEITZ, RIGHT


