Embed Size (px)
Citation preview
Suggested Answer_Syl12_Dec2016_Paper 20
Academics Department, The Institute of Cost Accountants of India (Statutory Body under an Act of Parliament) Page 1
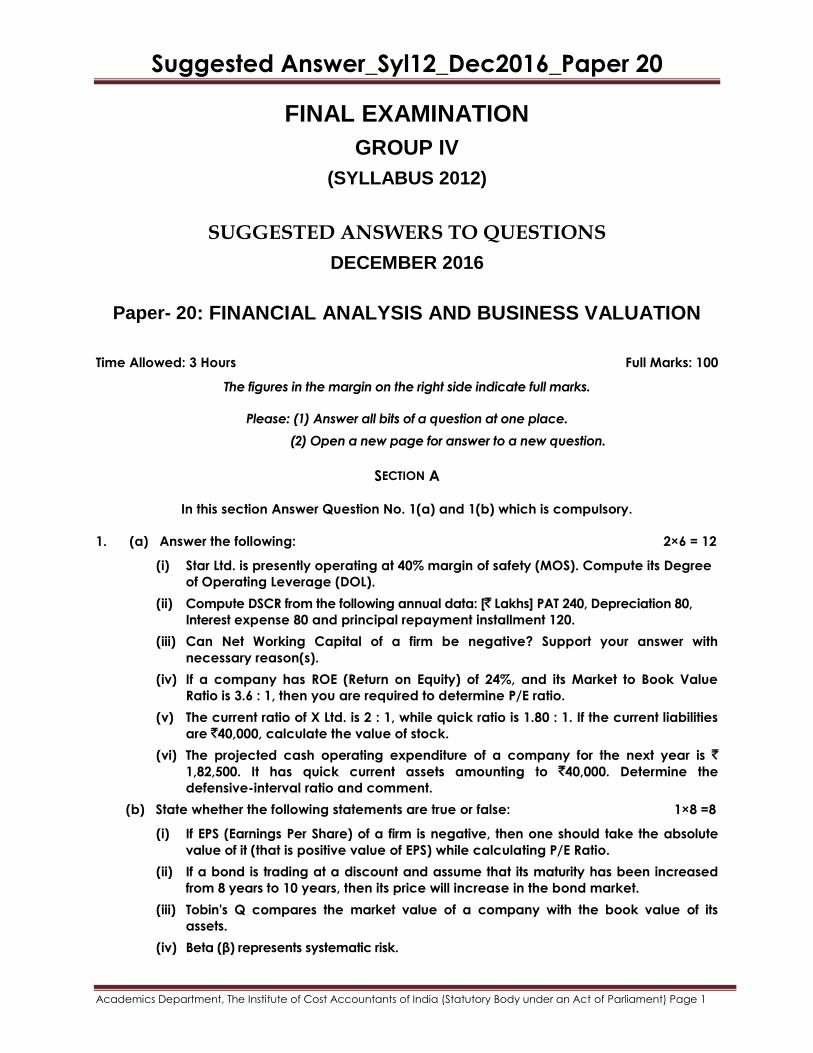
FINAL EXAMINATION
GROUP IV
(SYLLABUS 2012)
SUGGESTED ANSWERS TO QUESTIONS
DECEMBER 2016
Paper- 20: FINANCIAL ANALYSIS AND BUSINESS VALUATION
Time Allowed: 3 Hours Full Marks: 100
The figures in the margin on the right side indicate full marks.
Please: (1) Answer all bits of a question at one place.
(2) Open a new page for answer to a new question.
SECTION A
In this section Answer Question No. 1(a) and 1(b) which is compulsory.
1. (a) Answer the following: 2×6 = 12
(i) Star Ltd. is presently operating at 40% margin of safety (MOS). Compute its Degree
of Operating Leverage (DOL).
(ii) Compute DSCR from the following annual data: [` Lakhs] PAT 240, Depreciation 80,
Interest expense 80 and principal repayment installment 120.
(iii) Can Net Working Capital of a firm be negative? Support your answer with
necessary reason(s).
(iv) If a company has ROE (Return on Equity) of 24%, and its Market to Book Value
Ratio is 3.6 : 1, then you are required to determine P/E ratio.
(v) The current ratio of X Ltd. is 2 : 1, while quick ratio is 1.80 : 1. If the current liabilities
are `40,000, calculate the value of stock.
(vi) The projected cash operating expenditure of a company for the next year is ` 1,82,500. It has quick current assets amounting to `40,000. Determine the
defensive-interval ratio and comment.
(b) State whether the following statements are true or false: 1×8 =8
(i) If EPS (Earnings Per Share) of a firm is negative, then one should take the absolute
value of it (that is positive value of EPS) while calculating P/E Ratio.
(ii) If a bond is trading at a discount and assume that its maturity has been increased
from 8 years to 10 years, then its price will increase in the bond market.
(iii) Tobin's Q compares the market value of a company with the book value of its
assets.
(iv) Beta (β) represents systematic risk.
Suggested Answer_Syl12_Dec2016_Paper 20
Academics Department, The Institute of Cost Accountants of India (Statutory Body under an Act of Parliament) Page 2
(v) Higher risk firms will have lower Price Earnings ratio than lower risk firms.
(vi) The higher the Z-Score, there is a greater possibility of bankruptcy.
(vii) Realistic, error free and flexible are not the attributes of a good financial model.
(viii) According to basic valuation model the value of a financial asset is present value
of its expected future cash flows.
Answer: 1 (a)
(i) MOS 40% means 40% reduction in sales will bring sales to BEP, i.e. reduce profit by 100% Thus,
DOL = Rate of Change in Profits/Rate of Changes in Sales = 100/40 = 2.5
(ii) DSCR = (PAT + Depreciation + Interest)/(Principal Installment + Interest) = (240 + 80 +80) /
(120 + 80) = 2
(iii) N e t Working Capital of a firm can be negative; it may be possible when the current assets
are less than current liabilities. Normally, negative working capital is not considered a good
financial position, but if a company is strong enough in negotiation to buy raw material etc.
on credit for a longer period as compared to extending credit to their own customers, it
may be increasing the profitability of the company.
(iv) P/E Ratio = Price/EPS = (Price/Book Value) × (Book Value/EPS) = Market to Book Value/ROE =
3.6/24% = 15
(v) Value of stock: ` 8,000 (Hint: (Current assets-Stock)/current liabilities) = 1.8)
(vi) Defensive interval ratio = 40000/500 = 80 days. The quick current assets are sufficient to meet
operating expenses for 80 days.
1 (b)
(i) FALSE; if EPS of a firm is negative, then we do not define P/E Ratio.
(ii) FALSE; when a bond is trading at a discount and its maturity is increased, then its price will
fall.
(iii) FALSE; Tobin's Q is the ratio of the market value of a firm (as measured by the market value
of its outstanding shares and debt) divided by the replacement cost of the company's
assets.
(iv) TRUE
(v) TRUE
(vi) FALSE. The higher the Z-Score, there is a lesser possibility of bankruptcy.
(vii) FALSE. Realistic, error free and flexible are the attributes of a good financial model.
(viii) TRUE
Section – B
In this section answer any five questions from the following.
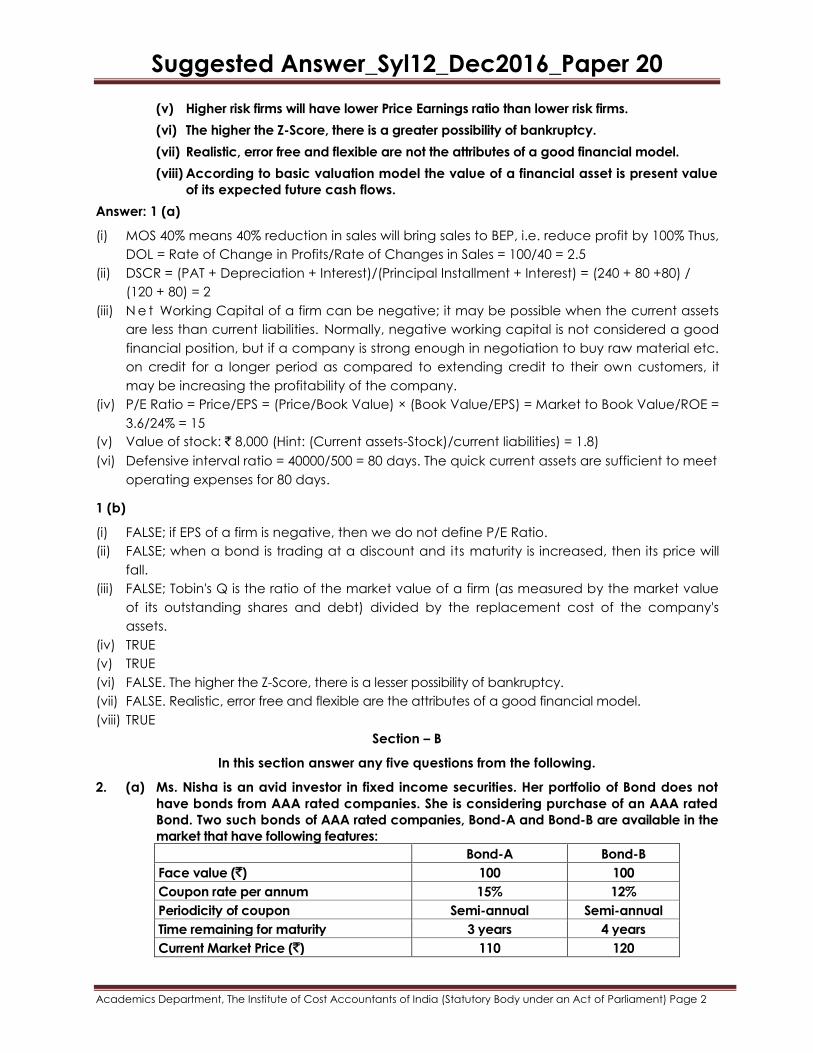
2. (a) Ms. Nisha is an avid investor in fixed income securities. Her portfolio of Bond does not
have bonds from AAA rated companies. She is considering purchase of an AAA rated
Bond. Two such bonds of AAA rated companies, Bond-A and Bond-B are available in the
market that have following features:
Bond-A Bond-B
Face value (`) 100 100
Coupon rate per annum 15% 12%
Periodicity of coupon Semi-annual Semi-annual
Time remaining for maturity 3 years 4 years
Current Market Price (`) 110 120
Suggested Answer_Syl12_Dec2016_Paper 20
Academics Department, The Institute of Cost Accountants of India (Statutory Body under an Act of Parliament) Page 3
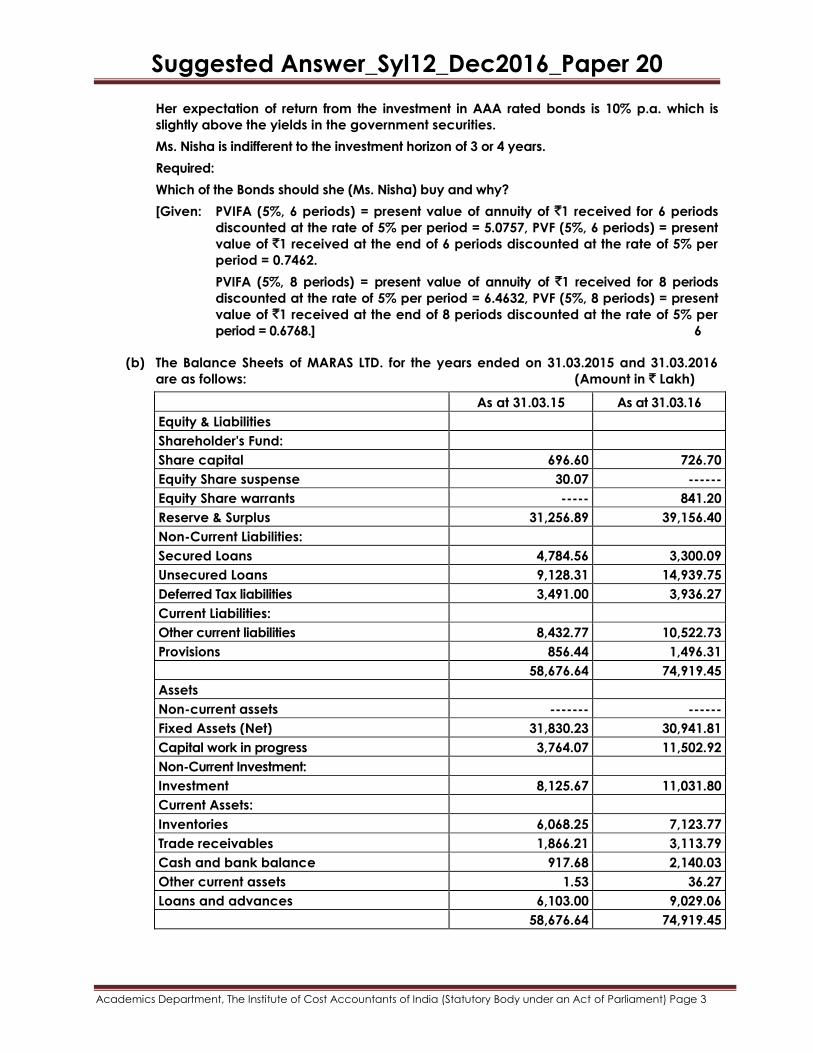
Her expectation of return from the investment in AAA rated bonds is 10% p.a. which is
slightly above the yields in the government securities.
Ms. Nisha is indifferent to the investment horizon of 3 or 4 years.
Required:
Which of the Bonds should she (Ms. Nisha) buy and why?
[Given: PVIFA (5%, 6 periods) = present value of annuity of `1 received for 6 periods
discounted at the rate of 5% per period = 5.0757, PVF (5%, 6 periods) = present
value of `1 received at the end of 6 periods discounted at the rate of 5% per
period = 0.7462.
PVIFA (5%, 8 periods) = present value of annuity of `1 received for 8 periods
discounted at the rate of 5% per period = 6.4632, PVF (5%, 8 periods) = present
value of `1 received at the end of 8 periods discounted at the rate of 5% per
period = 0.6768.] 6
(b) The Balance Sheets of MARAS LTD. for the years ended on 31.03.2015 and 31.03.2016
are as follows: (Amount in ` Lakh)
As at 31.03.15 As at 31.03.16
Equity & Liabilities
Shareholder's Fund:
Share capital 696.60 726.70
Equity Share suspense 30.07 ------
Equity Share warrants ----- 841.20
Reserve & Surplus 31,256.89 39,156.40
Non-Current Liabilities:
Secured Loans 4,784.56 3,300.09
Unsecured Loans 9,128.31 14,939.75
Deferred Tax liabilities 3,491.00 3,936.27
Current Liabilities:
Other current liabilities 8,432.77 10,522.73
Provisions 856.44 1,496.31
58,676.64 74,919.45
Assets
Non-current assets ------- ------
Fixed Assets (Net) 31,830.23 30,941.81
Capital work in progress 3,764.07 11,502.92
Non-Current Investment:
Investment 8,125.67 11,031.80
Current Assets:
Inventories 6,068.25 7,123.77
Trade receivables 1,866.21 3,113.79
Cash and bank balance 917.68 2,140.03
Other current assets 1.53 36.27
Loans and advances 6,103.00 9,029.06
58,676.64 74,919.45
Suggested Answer_Syl12_Dec2016_Paper 20
Academics Department, The Institute of Cost Accountants of India (Statutory Body under an Act of Parliament) Page 4
Required:
(i) Prepare the Common-Size Balance Sheet of Maras Ltd.
(ii) Present and interpret your observations on the common-size Balance Sheet 7+3=10
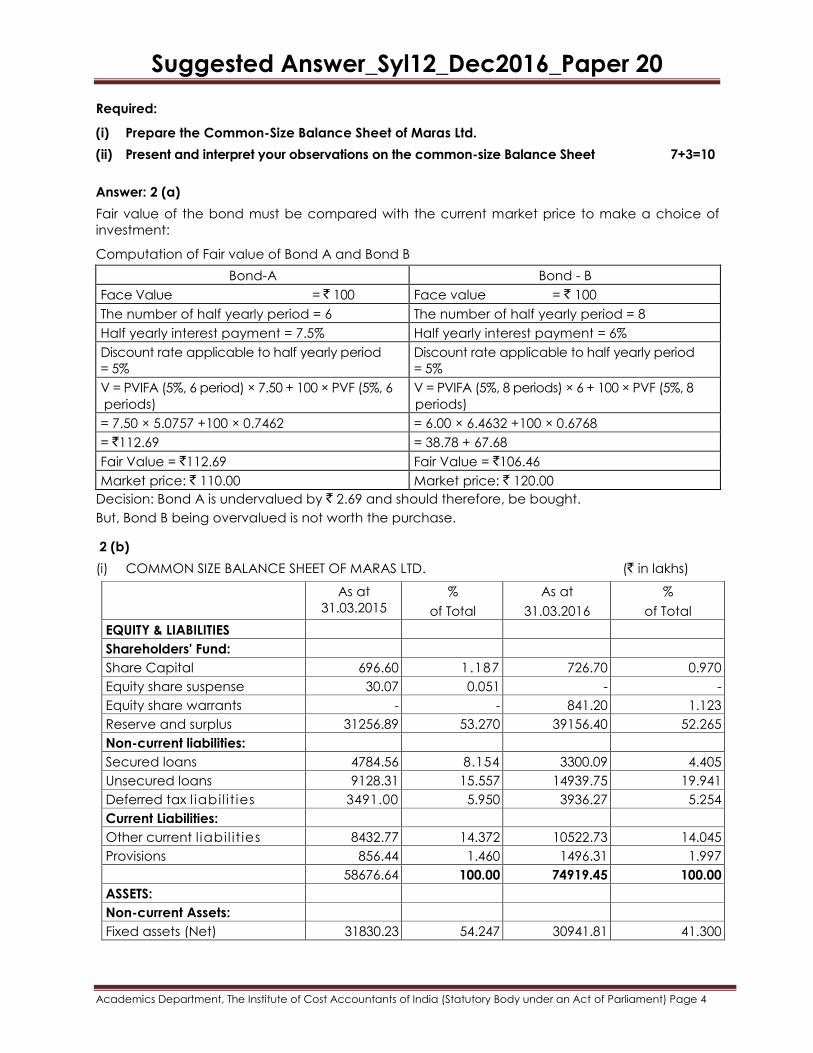
Answer: 2 (a)
Fair value of the bond must be compared with the current market price to make a choice of
investment:
Computation of Fair value of Bond A and Bond B
Bond-A Bond - B
Face Value = ` 100 Face value = ` 100
The number of half yearly period = 6 The number of half yearly period = 8
Half yearly interest payment = 7.5% Half yearly interest payment = 6%
Discount rate applicable to half yearly period
= 5%
Discount rate applicable to half yearly period
= 5%
V = PVIFA (5%, 6 period) × 7.50 + 100 × PVF (5%, 6
periods)
V = PVIFA (5%, 8 periods) × 6 + 100 × PVF (5%, 8
periods)
= 7.50 × 5.0757 +100 × 0.7462 = 6.00 × 6.4632 +100 × 0.6768
= `112.69 = 38.78 + 67.68
Fair Value = `112.69 Fair Value = `106.46
Market price: ` 110.00 Market price: ` 120.00
Decision: Bond A is undervalued by ` 2.69 and should therefore, be bought.
But, Bond B being overvalued is not worth the purchase.
2 (b)
(i) COMMON SIZE BALANCE SHEET OF MARAS LTD. (` in lakhs)
As at
31.03.2015
%
of Total
As at
31.03.2016
%
of Total
EQUITY & LIABILITIES
Shareholders' Fund:
Share Capital 696.60 1.187 726.70 0.970
Equity share suspense 30.07 0.051 - -
Equity share warrants - - 841.20 1.123
Reserve and surplus 31256.89 53.270 39156.40 52.265
Non-current liabilities:
Secured loans 4784.56 8.154 3300.09 4.405
Unsecured loans 9128.31 15.557 14939.75 19.941
Deferred tax l iabil i t ies 3491.00 5.950 3936.27 5.254
Current Liabilities:
Other current l iabi l i t ies 8432.77 14.372 10522.73 14.045
Provisions 856.44 1.460 1496.31 1.997
58676.64 100.00 74919.45 100.00
ASSETS:
Non-current Assets:
Fixed assets (Net) 31830.23 54.247 30941.81 41.300
Suggested Answer_Syl12_Dec2016_Paper 20
Academics Department, The Institute of Cost Accountants of India (Statutory Body under an Act of Parliament) Page 5
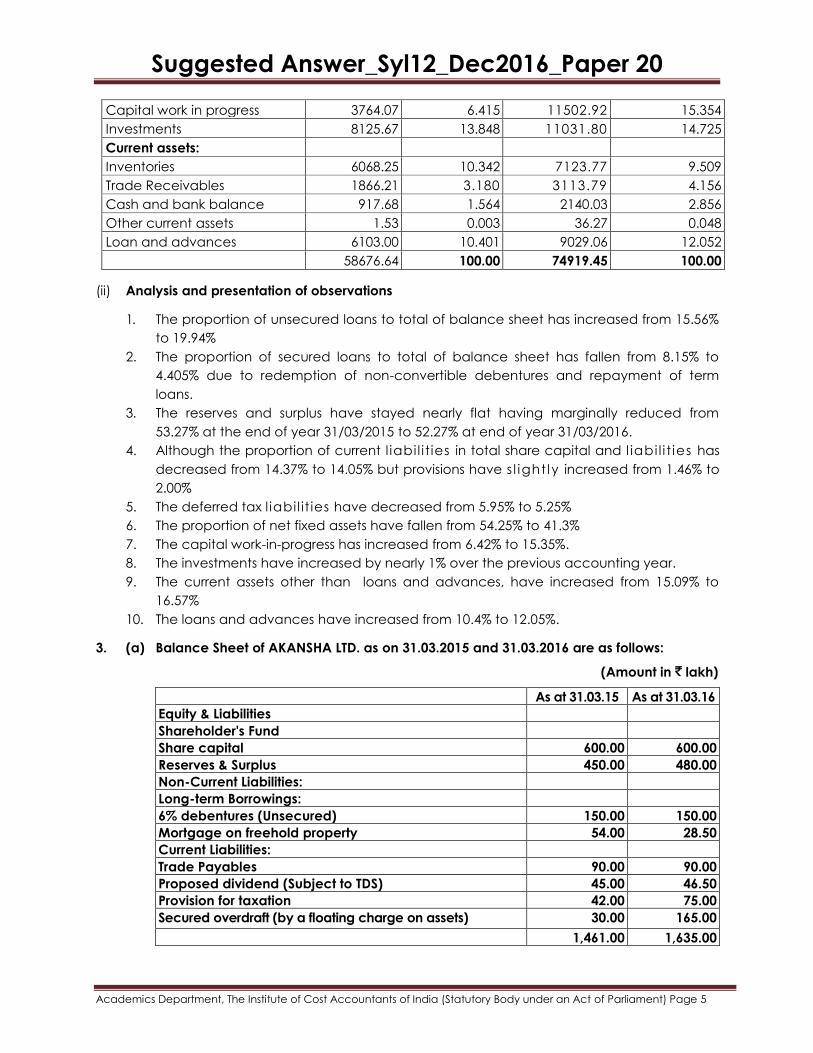
Capital work in progress 3764.07 6.415 11502.92 15.354
Investments 8125.67 13.848 11031.80 14.725
Current assets:
Inventories 6068.25 10.342 7123.77 9.509
Trade Receivables 1866.21 3.180 3113.79 4.156
Cash and bank balance 917.68 1.564 2140.03 2.856
Other current assets 1.53 0.003 36.27 0.048
Loan and advances 6103.00 10.401 9029.06 12.052
58676.64 100.00 74919.45 100.00
(ii) Analysis and presentation of observations
1. The proportion of unsecured loans to total of balance sheet has increased from 15.56%
to 19.94%
2. The proportion of secured loans to total of balance sheet has fallen from 8.15% to
4.405% due to redemption of non-convertible debentures and repayment of term
loans.
3. The reserves and surplus have stayed nearly flat having marginally reduced from
53.27% at the end of year 31/03/2015 to 52.27% at end of year 31/03/2016.
4. Although the proportion of current l iabi l i t ies in total share capital and l iabi l i t ies has
decreased from 14.37% to 14.05% but provisions have s l ight ly increased from 1.46% to
2.00%
5. The deferred tax l iabil it ies have decreased from 5.95% to 5.25%
6. The proportion of net fixed assets have fallen from 54.25% to 41.3%
7. The capital work-in-progress has increased from 6.42% to 15.35%.
8. The investments have increased by nearly 1% over the previous accounting year.
9. The current assets other than loans and advances, have increased from 15.09% to
16.57%
10. The loans and advances have increased from 10.4% to 12.05%.
3. (a) Balance Sheet of AKANSHA LTD. as on 31.03.2015 and 31.03.2016 are as follows:
(Amount in ` lakh)
As at 31.03.15 As at 31.03.16
Equity & Liabilities
Shareholder's Fund
Share capital 600.00 600.00
Reserves & Surplus 450.00 480.00
Non-Current Liabilities:
Long-term Borrowings:
6% debentures (Unsecured) 150.00 150.00
Mortgage on freehold property 54.00 28.50
Current Liabilities:
Trade Payables 90.00 90.00
Proposed dividend (Subject to TDS) 45.00 46.50
Provision for taxation 42.00 75.00
Secured overdraft (by a floating charge on assets) 30.00 165.00
1,461.00 1,635.00
Suggested Answer_Syl12_Dec2016_Paper 20
Academics Department, The Institute of Cost Accountants of India (Statutory Body under an Act of Parliament) Page 6
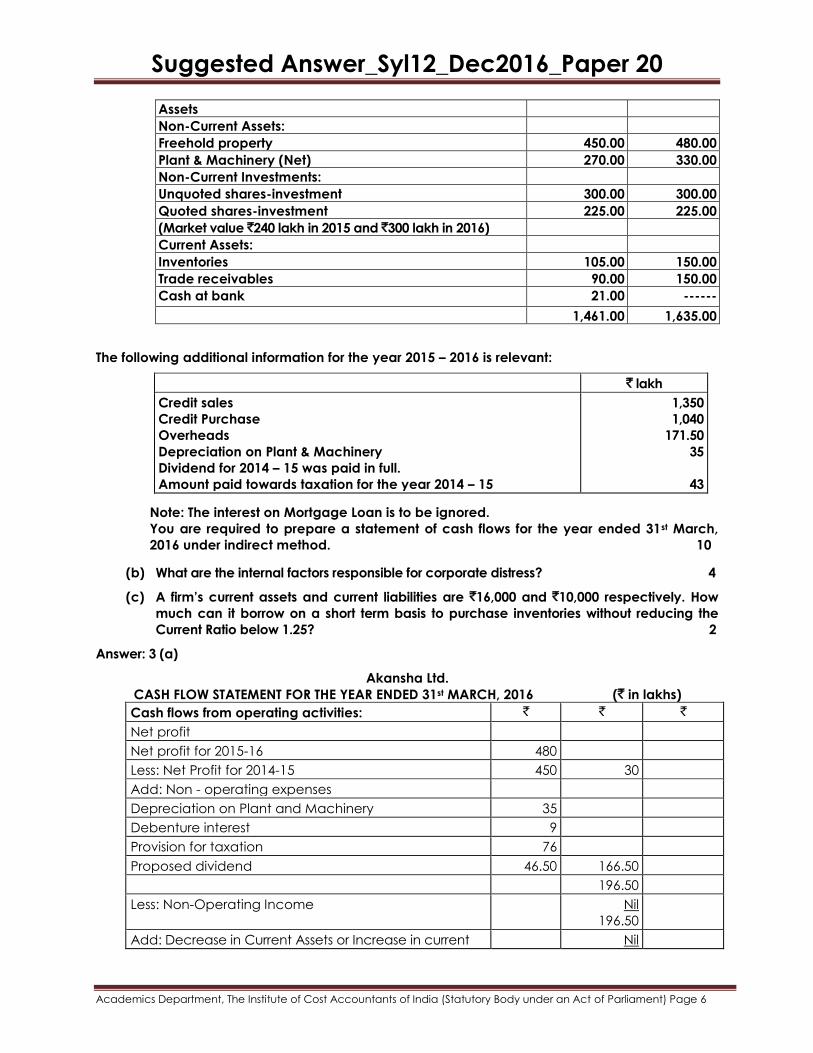
Assets
Non-Current Assets:
Freehold property 450.00 480.00
Plant & Machinery (Net) 270.00 330.00
Non-Current Investments:
Unquoted shares-investment 300.00 300.00
Quoted shares-investment 225.00 225.00
(Market value `240 lakh in 2015 and `300 lakh in 2016)
Current Assets:
Inventories 105.00 150.00
Trade receivables 90.00 150.00
Cash at bank 21.00 ------
1,461.00 1,635.00
The following additional information for the year 2015 – 2016 is relevant:
` lakh
Credit sales
Credit Purchase
Overheads
Depreciation on Plant & Machinery
Dividend for 2014 – 15 was paid in full.
Amount paid towards taxation for the year 2014 – 15
1,350
1,040
171.50
35
43
Note: The interest on Mortgage Loan is to be ignored.
You are required to prepare a statement of cash flows for the year ended 31st March,
2016 under indirect method. 10
(b) What are the internal factors responsible for corporate distress? 4
(c) A firm’s current assets and current liabilities are `16,000 and `10,000 respectively. How
much can it borrow on a short term basis to purchase inventories without reducing the
Current Ratio below 1.25? 2
Answer: 3 (a)
Akansha Ltd.
CASH FLOW STATEMENT FOR THE YEAR ENDED 31st MARCH, 2016 (` in lakhs)
Cash flows from operating activities: ` ` `
Net profit
Net profit for 2015-16 480
Less: Net Profit for 2014-15 450 30
Add: Non - operating expenses
Depreciation on Plant and Machinery 35
Debenture interest 9
Provision for taxation 76
Proposed dividend 46.50 166.50
196.50
Less: Non-Operating Income Nil
196.50
Add: Decrease in Current Assets or Increase in current Nil
Suggested Answer_Syl12_Dec2016_Paper 20
Academics Department, The Institute of Cost Accountants of India (Statutory Body under an Act of Parliament) Page 7
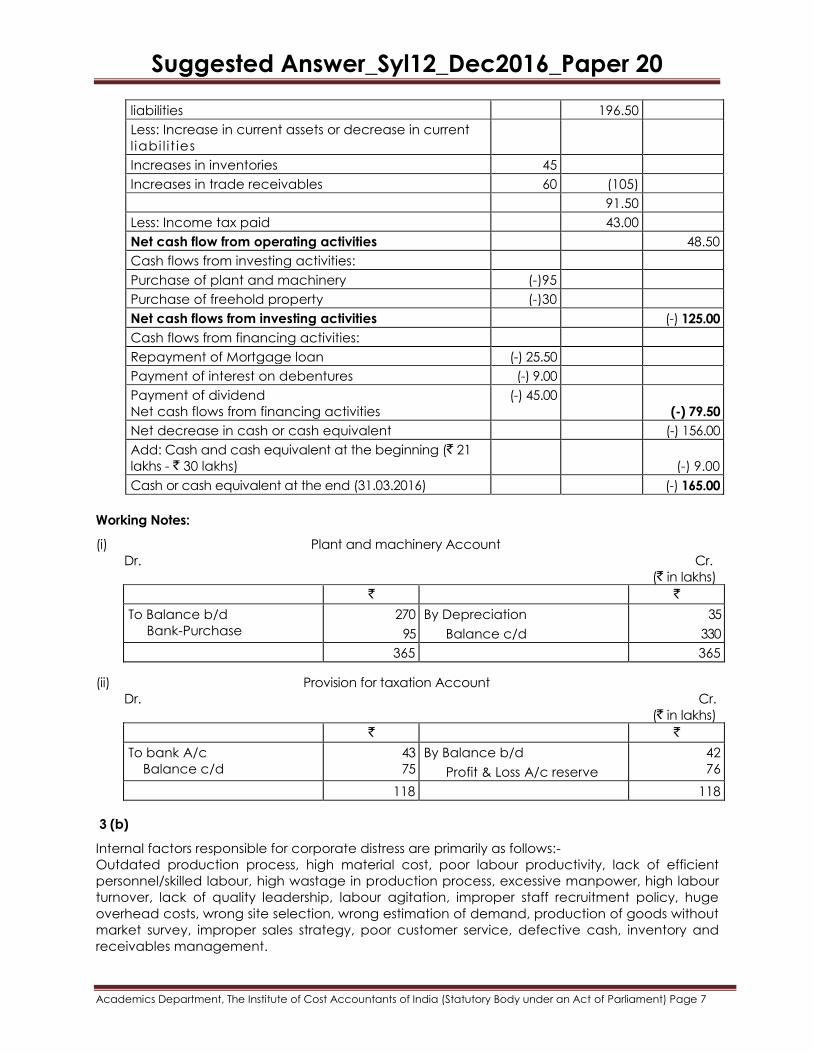
liabilities 196.50
Less: Increase in current assets or decrease in current
l iabi l i t ies
Increases in inventories 45
Increases in trade receivables 60 (105)
91.50
Less: Income tax paid 43.00
Net cash flow from operating activities 48.50
Cash flows from investing activities:
Purchase of plant and machinery (-)95
Purchase of freehold property (-)30
Net cash flows from investing activities (-) 125.00
Cash flows from financing activities:
Repayment of Mortgage loan (-) 25.50
Payment of interest on debentures (-) 9.00
Payment of dividend
Net cash flows from financing activities
(-) 45.00
(-) 79.50
Net decrease in cash or cash equivalent (-) 156.00
Add: Cash and cash equivalent at the beginning (` 21
lakhs - ` 30 lakhs)
(-) 9.00
Cash or cash equivalent at the end (31.03.2016) (-) 165.00
Working Notes:
(i) Plant and machinery Account
Dr. Cr.
(` in lakhs)
` `
To Balance b/d
Bank-Purchase
270
95
By Depreciation
Balance c/d
35
330
365 365
(ii) Provision for taxation Account
Dr. Cr.
(` in lakhs)
` `
To bank A/c
Balance c/d
43
75
By Balance b/d
Profit & Loss A/c reserve
42
76
118 118
3 (b)
Internal factors responsible for corporate distress are primarily as follows:-
Outdated production process, high material cost, poor labour productivity, lack of efficient
personnel/skilled labour, high wastage in production process, excessive manpower, high labour
turnover, lack of quality leadership, labour agitation, improper staff recruitment policy, huge
overhead costs, wrong site selection, wrong estimation of demand, production of goods without
market survey, improper sales strategy, poor customer service, defective cash, inventory and
receivables management.
Suggested Answer_Syl12_Dec2016_Paper 20
Academics Department, The Institute of Cost Accountants of India (Statutory Body under an Act of Parliament) Page 8
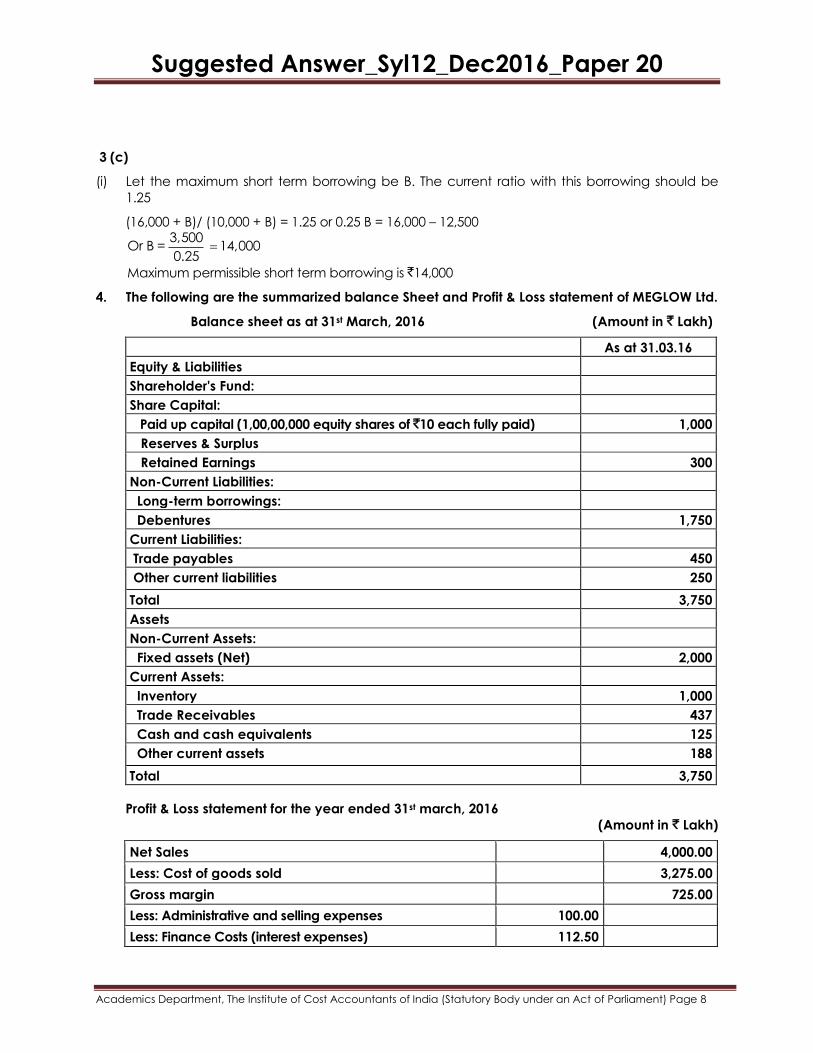
3 (c)
(i) Let the maximum short term borrowing be B. The current ratio with this borrowing should be
1.25
(16,000 + B)/ (10,000 + B) = 1.25 or 0.25 B = 16,000 – 12,500
3,500
Or B = 14,0000.25
Maximum permissible short term borrowing is `14,000
4. The following are the summarized balance Sheet and Profit & Loss statement of MEGLOW Ltd.
Balance sheet as at 31st March, 2016 (Amount in ` Lakh)
As at 31.03.16
Equity & Liabilities
Shareholder's Fund:
Share Capital:
Paid up capital (1,00,00,000 equity shares of `10 each fully paid) 1,000
Reserves & Surplus
Retained Earnings 300
Non-Current Liabilities:
Long-term borrowings:
Debentures 1,750
Current Liabilities:
Trade payables 450
Other current liabilities 250
Total 3,750
Assets
Non-Current Assets:
Fixed assets (Net) 2,000
Current Assets:
Inventory 1,000
Trade Receivables 437
Cash and cash equivalents 125
Other current assets 188
Total 3,750
Profit & Loss statement for the year ended 31st march, 2016
(Amount in ` Lakh)
Net Sales 4,000.00
Less: Cost of goods sold 3,275.00
Gross margin 725.00
Less: Administrative and selling expenses 100.00
Less: Finance Costs (interest expenses) 112.50
Suggested Answer_Syl12_Dec2016_Paper 20
Academics Department, The Institute of Cost Accountants of India (Statutory Body under an Act of Parliament) Page 9
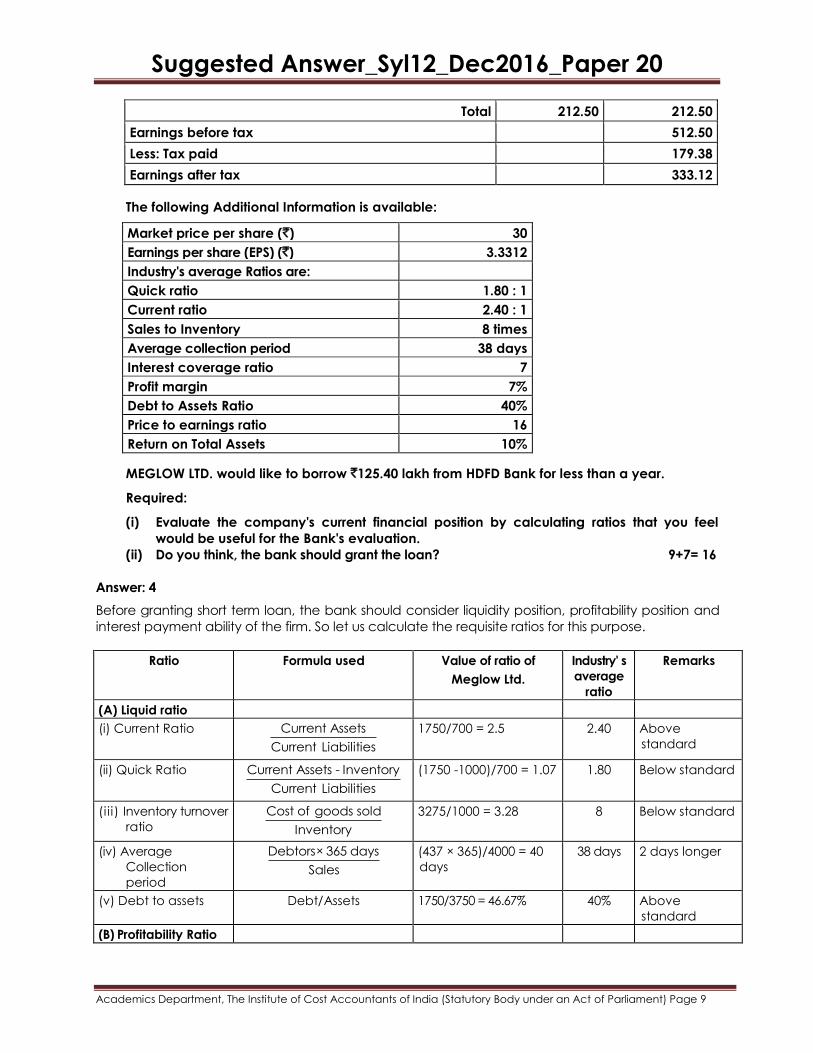
Total 212.50 212.50
Earnings before tax 512.50
Less: Tax paid 179.38
Earnings after tax 333.12
The following Additional Information is available:
Market price per share (`) 30
Earnings per share (EPS) (`) 3.3312
Industry's average Ratios are:
Quick ratio 1.80 : 1
Current ratio 2.40 : 1
Sales to Inventory 8 times
Average collection period 38 days
Interest coverage ratio 7
Profit margin 7%
Debt to Assets Ratio 40%
Price to earnings ratio 16
Return on Total Assets 10%
MEGLOW LTD. would like to borrow `125.40 lakh from HDFD Bank for less than a year.
Required:
(i) Evaluate the company's current financial position by calculating ratios that you feel
would be useful for the Bank's evaluation.
(ii) Do you think, the bank should grant the loan? 9+7= 16
Answer: 4
Before granting short term loan, the bank should consider liquidity position, profitability position and
interest payment ability of the firm. So let us calculate the requisite ratios for this purpose.
Ratio
Formula used Value of ratio of
Meglow Ltd.
Industry' s
average
ratio
Remarks
(A) Liquid ratio
(i) Current Ratio Current Assets
Current Liabilities
1750/700 = 2.5 2.40 Above
standard
(ii) Quick Ratio Current Assets - Inventory
Current Liabilities
(1750 -1000)/700 = 1.07 1.80 Below standard
(i ii) Inventory turnover
ratio
Cost of goods sold
Inventory
3275/1000 = 3.28 8 Below standard
(iv) Average
Collection
period
Debtors× 365 days
Sales
(437 × 365)/4000 = 40
days
38 days 2 days longer
(v) Debt to assets Debt/Assets 1750/3750 = 46.67% 40% Above
standard
(B) Profitability Ratio
Suggested Answer_Syl12_Dec2016_Paper 20
Academics Department, The Institute of Cost Accountants of India (Statutory Body under an Act of Parliament) Page 10
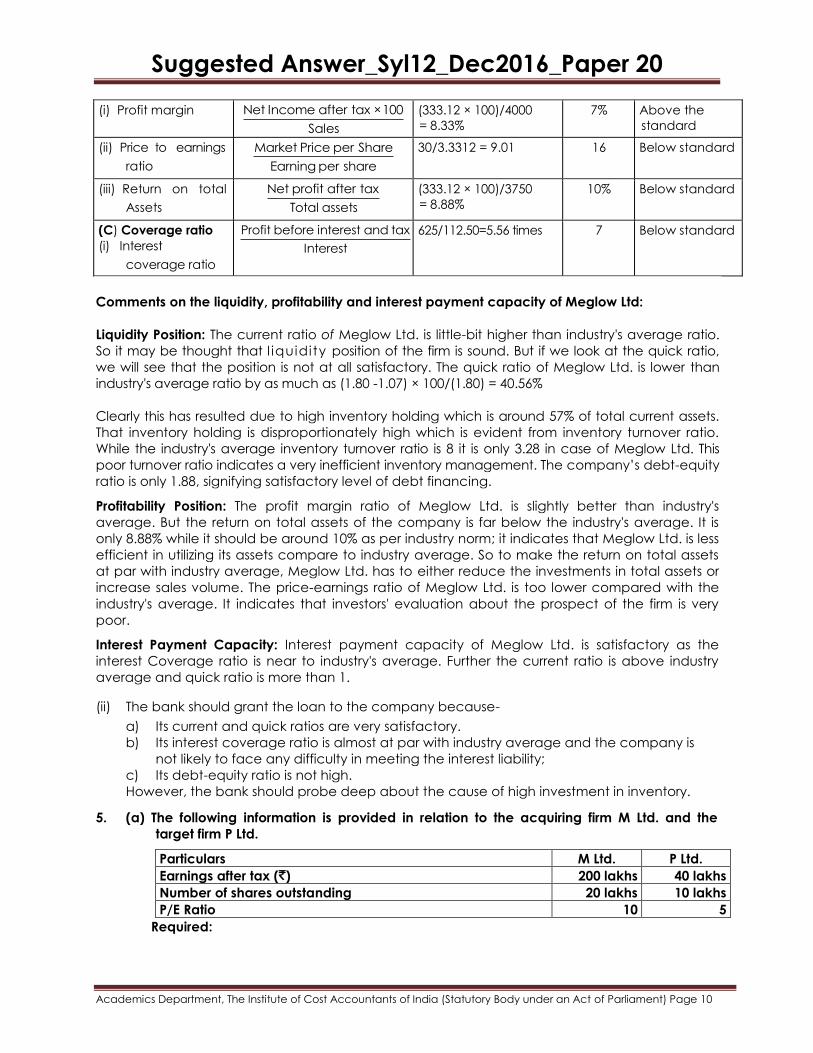
(i) Profit margin Net Income after tax ×100
Sales
(333.12 × 100)/4000
= 8.33%
7% Above the
standard
(ii) Price to earnings
ratio
Market Price per Share
Earning per share
30/3.3312 = 9.01 16 Below standard
(iii) Return on total
Assets
Net profit after tax
Total assets
(333.12 × 100)/3750
= 8.88%
10% Below standard
(C) Coverage ratio
(i) Interest
coverage ratio
Profit before interest and tax
Interest
625/112.50=5.56 times 7 Below standard
Comments on the liquidity, profitability and interest payment capacity of Meglow Ltd:
Liquidity Position: The current ratio of Meglow Ltd. is little-bit higher than industry's average ratio.
So it may be thought that l iquidity position of the firm is sound. But if we look at the quick ratio,
we will see that the position is not at all satisfactory. The quick ratio of Meglow Ltd. is lower than
industry's average ratio by as much as (1.80 -1.07) × 100/(1.80) = 40.56%
Clearly this has resulted due to high inventory holding which is around 57% of total current assets.
That inventory holding is disproportionately high which is evident from inventory turnover ratio.
While the industry's average inventory turnover ratio is 8 it is only 3.28 in case of Meglow Ltd. This
poor turnover ratio indicates a very inefficient inventory management. The company’s debt-equity
ratio is only 1.88, signifying satisfactory level of debt financing.
Profitability Position: The profit margin ratio of Meglow Ltd. is slightly better than industry's
average. But the return on total assets of the company is far below the industry's average. It is
only 8.88% while it should be around 10% as per industry norm; it indicates that Meglow Ltd. is less
efficient in utilizing its assets compare to industry average. So to make the return on total assets
at par with industry average, Meglow Ltd. has to either reduce the investments in total assets or
increase sales volume. The price-earnings ratio of Meglow Ltd. is too lower compared with the
industry's average. It indicates that investors' evaluation about the prospect of the firm is very
poor.
Interest Payment Capacity: Interest payment capacity of Meglow Ltd. is satisfactory as the
interest Coverage ratio is near to industry's average. Further the current ratio is above industry
average and quick ratio is more than 1.
(ii) The bank should grant the loan to the company because-
a) Its current and quick ratios are very satisfactory.
b) Its interest coverage ratio is almost at par with industry average and the company is
not likely to face any difficulty in meeting the interest liability;
c) Its debt-equity ratio is not high.
However, the bank should probe deep about the cause of high investment in inventory.
5. (a) The following information is provided in relation to the acquiring firm M Ltd. and the
target firm P Ltd.
Particulars M Ltd. P Ltd.
Earnings after tax (`) 200 lakhs 40 lakhs
Number of shares outstanding 20 lakhs 10 lakhs
P/E Ratio 10 5
Required:
Suggested Answer_Syl12_Dec2016_Paper 20
Academics Department, The Institute of Cost Accountants of India (Statutory Body under an Act of Parliament) Page 11
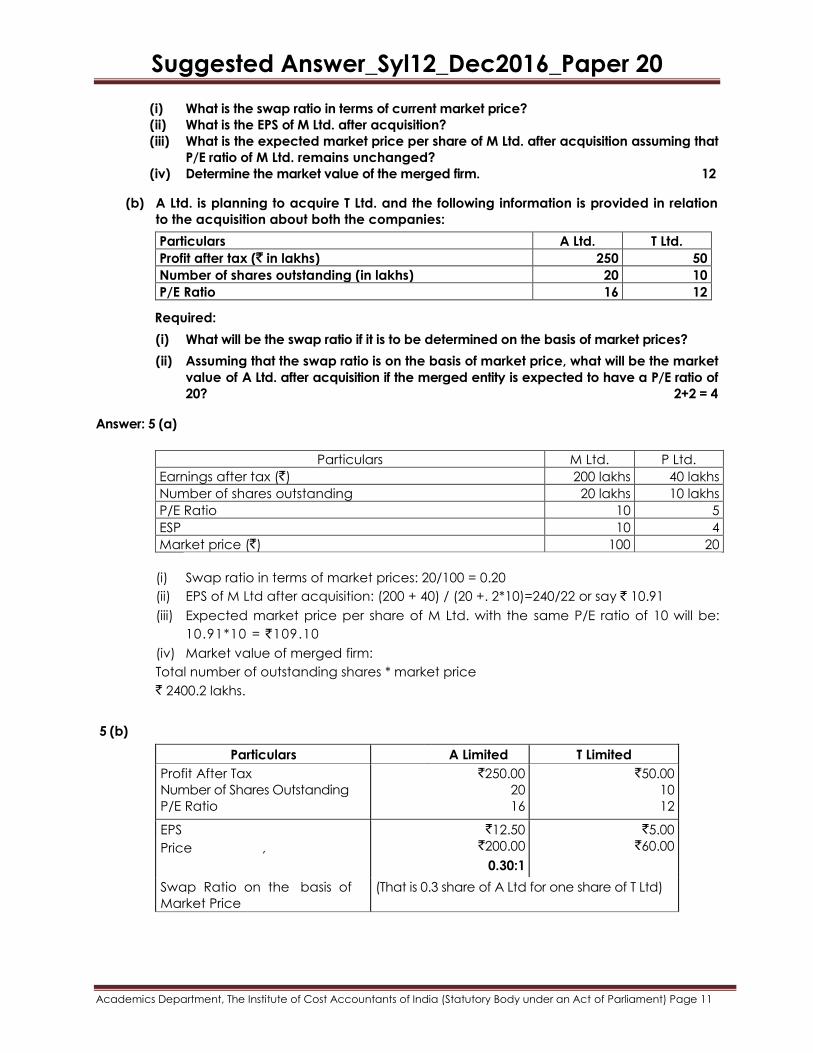
(i) What is the swap ratio in terms of current market price?
(ii) What is the EPS of M Ltd. after acquisition?
(iii) What is the expected market price per share of M Ltd. after acquisition assuming that
P/E ratio of M Ltd. remains unchanged?
(iv) Determine the market value of the merged firm. 12
(b) A Ltd. is planning to acquire T Ltd. and the following information is provided in relation
to the acquisition about both the companies:
Particulars A Ltd. T Ltd.
Profit after tax (` in lakhs) 250 50
Number of shares outstanding (in lakhs) 20 10
P/E Ratio 16 12
Required:
(i) What will be the swap ratio if it is to be determined on the basis of market prices?
(ii) Assuming that the swap ratio is on the basis of market price, what will be the market
value of A Ltd. after acquisition if the merged entity is expected to have a P/E ratio of
20? 2+2 = 4
Answer: 5 (a)
Particulars M Ltd. P Ltd.
Earnings after tax (`) 200 lakhs 40 lakhs
Number of shares outstanding 20 lakhs 10 lakhs
P/E Ratio 10 5
ESP 10 4
Market price (`) 100 20
(i) Swap ratio in terms of market prices: 20/100 = 0.20
(ii) EPS of M Ltd after acquisition: (200 + 40) / (20 +. 2*10)=240/22 or say ` 10.91
(iii) Expected market price per share of M Ltd. with the same P/E ratio of 10 will be:
10.91*10 = `109.10
(iv) Market value of merged firm:
Total number of outstanding shares * market price
` 2400.2 lakhs.
5 (b)
Particulars A Limited T Limited
Profit After Tax
Number of Shares Outstanding
P/E Ratio
`250.00
20
16
`50.00
10
12
EPS `12.50 `200.00
0.30:1
`5.00 `60.00 Price ,
Swap Ratio on the basis of
Market Price
(That is 0.3 share of A Ltd for one share of T Ltd)
Suggested Answer_Syl12_Dec2016_Paper 20
Academics Department, The Institute of Cost Accountants of India (Statutory Body under an Act of Parliament) Page 12
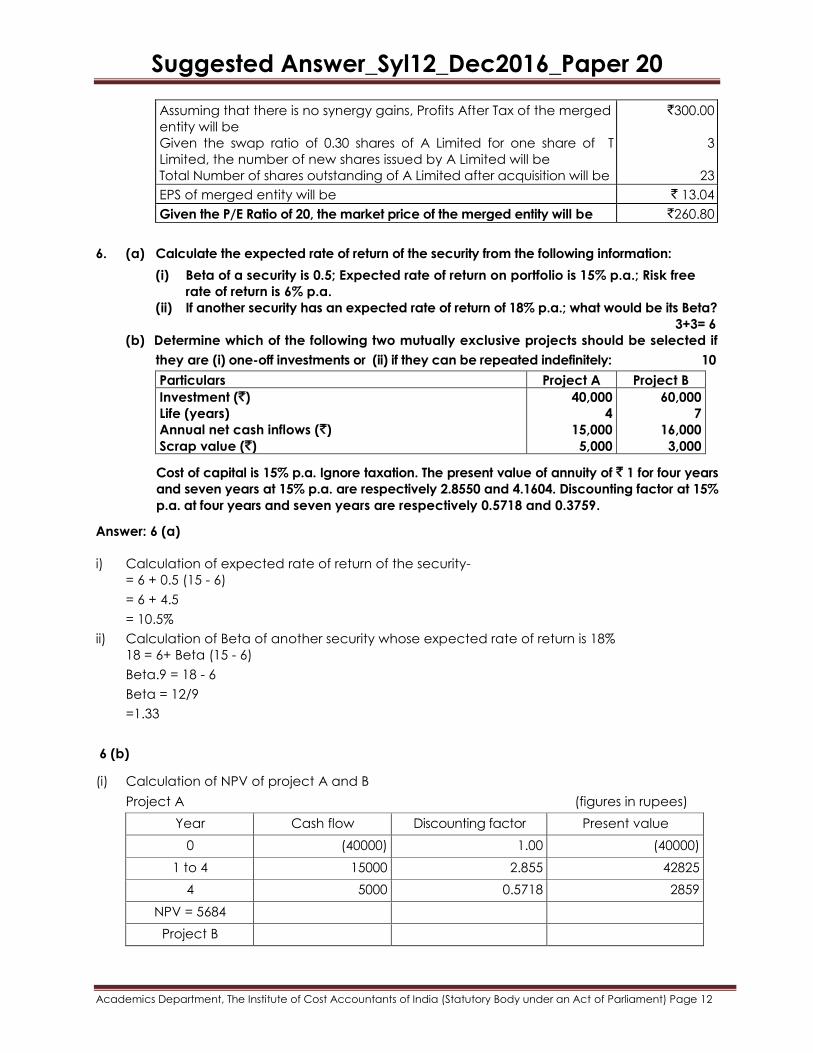
Assuming that there is no synergy gains, Profits After Tax of the merged
entity will be
Given the swap ratio of 0.30 shares of A Limited for one share of T
Limited, the number of new shares issued by A Limited will be
Total Number of shares outstanding of A Limited after acquisition will be
`300.00
3
23
EPS of merged entity will be ` 13.04
Given the P/E Ratio of 20, the market price of the merged entity will be `260.80
6. (a) Calculate the expected rate of return of the security from the following information:
(i) Beta of a security is 0.5; Expected rate of return on portfolio is 15% p.a.; Risk free
rate of return is 6% p.a.
(ii) If another security has an expected rate of return of 18% p.a.; what would be its Beta?
3+3= 6
(b) Determine which of the following two mutually exclusive projects should be selected if
they are (i) one-off investments or (ii) if they can be repeated indefinitely: 10
Particulars Project A Project B
Investment (`)
Life (years)
Annual net cash inflows (`)
Scrap value (`)
40,000
4
15,000
5,000
60,000
7
16,000
3,000
Cost of capital is 15% p.a. Ignore taxation. The present value of annuity of ` 1 for four years
and seven years at 15% p.a. are respectively 2.8550 and 4.1604. Discounting factor at 15%
p.a. at four years and seven years are respectively 0.5718 and 0.3759.
Answer: 6 (a)
i) Calculation of expected rate of return of the security-
= 6 + 0.5 (15 - 6)
= 6 + 4.5
= 10.5%
ii) Calculation of Beta of another security whose expected rate of return is 18%
18 = 6+ Beta (15 - 6)
Beta.9 = 18 - 6
Beta = 12/9
=1.33
6 (b)
(i) Calculation of NPV of project A and B
Project A (figures in rupees)
Year Cash flow Discounting factor Present value
0 (40000) 1.00 (40000)
1 to 4 15000 2.855 42825
4 5000 0.5718 2859
NPV = 5684
Project B
Suggested Answer_Syl12_Dec2016_Paper 20
Academics Department, The Institute of Cost Accountants of India (Statutory Body under an Act of Parliament) Page 13
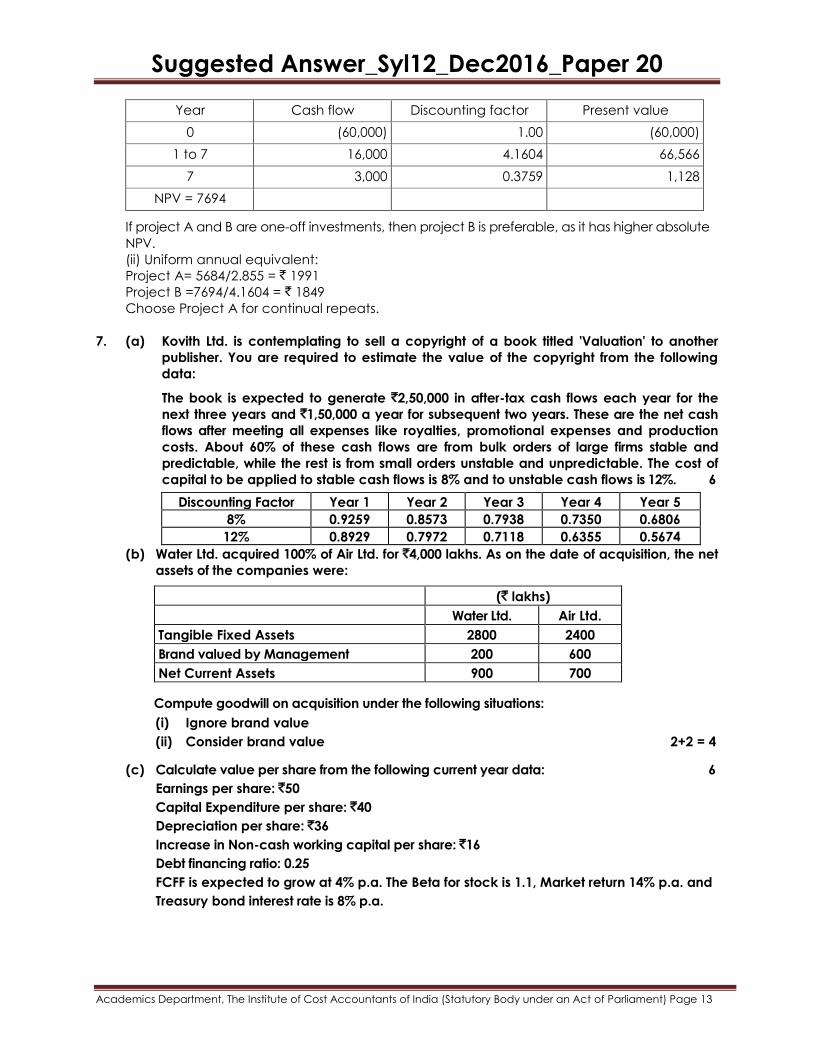
Year Cash flow Discounting factor Present value
0 (60,000) 1.00 (60,000)
1 to 7 16,000 4.1604 66,566
7 3,000 0.3759 1,128
NPV = 7694
If project A and B are one-off investments, then project B is preferable, as it has higher absolute
NPV.
(ii) Uniform annual equivalent:
Project A= 5684/2.855 = ` 1991
Project B =7694/4.1604 = ` 1849
Choose Project A for continual repeats.
7. (a) Kovith Ltd. is contemplating to sell a copyright of a book titled 'Valuation' to another
publisher. You are required to estimate the value of the copyright from the following
data:
The book is expected to generate `2,50,000 in after-tax cash flows each year for the
next three years and `1,50,000 a year for subsequent two years. These are the net cash
flows after meeting all expenses like royalties, promotional expenses and production
costs. About 60% of these cash flows are from bulk orders of large firms stable and
predictable, while the rest is from small orders unstable and unpredictable. The cost of
capital to be applied to stable cash flows is 8% and to unstable cash flows is 12%. 6
Discounting Factor Year 1 Year 2 Year 3 Year 4 Year 5
8% 0.9259 0.8573 0.7938 0.7350 0.6806
12% 0.8929 0.7972 0.7118 0.6355 0.5674
(b) Water Ltd. acquired 100% of Air Ltd. for `4,000 lakhs. As on the date of acquisition, the net
assets of the companies were:
(` lakhs)
Water Ltd. Air Ltd.
Tangible Fixed Assets 2800 2400
Brand valued by Management 200 600
Net Current Assets 900 700
Compute goodwill on acquisition under the following situations:
(i) Ignore brand value
(ii) Consider brand value 2+2 = 4
(c) Calculate value per share from the following current year data: 6
Earnings per share: `50
Capital Expenditure per share: `40
Depreciation per share: `36
Increase in Non-cash working capital per share: `16
Debt financing ratio: 0.25
FCFF is expected to grow at 4% p.a. The Beta for stock is 1.1, Market return 14% p.a. and
Treasury bond interest rate is 8% p.a.
Suggested Answer_Syl12_Dec2016_Paper 20
Academics Department, The Institute of Cost Accountants of India (Statutory Body under an Act of Parliament) Page 14
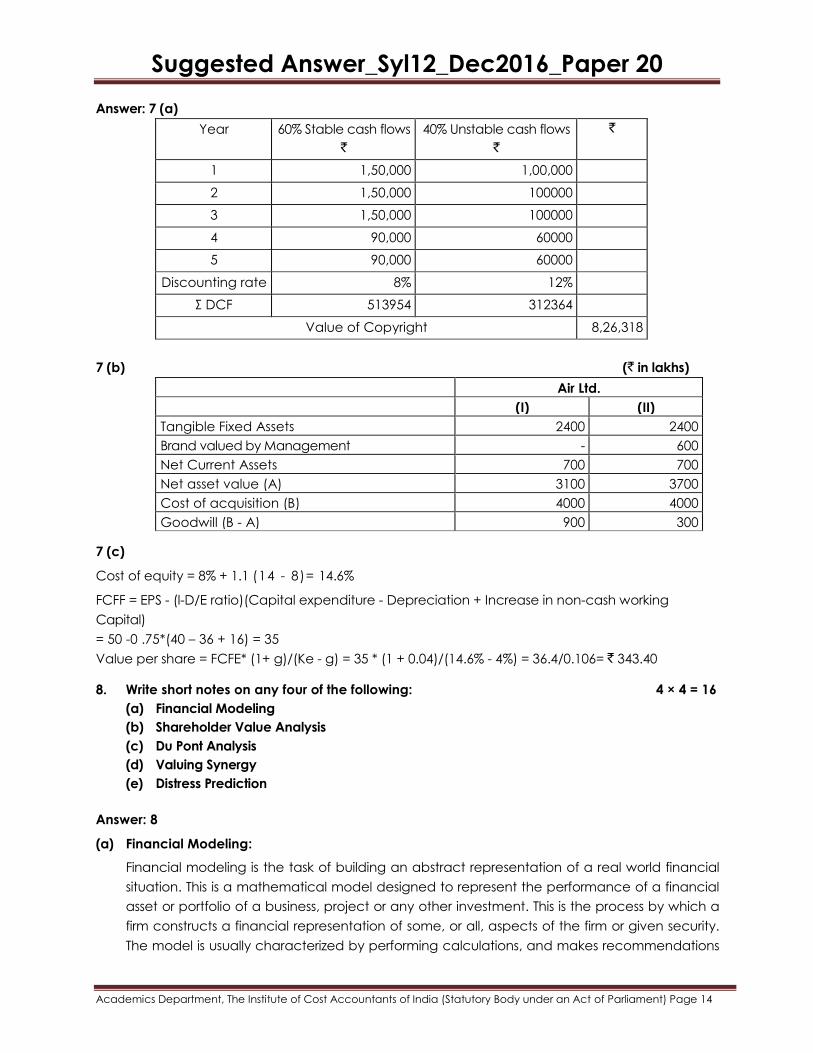
Answer: 7 (a)
Year 60% Stable cash flows
`
40% Unstable cash flows
`
`
1 1,50,000 1,00,000
2 1,50,000 100000
3 1,50,000 100000
4 90,000 60000
5 90,000 60000
Discounting rate 8% 12%
Σ DCF 513954 312364
Value of Copyright 8,26,318
7 (b) (` in lakhs)
Air Ltd.
(I) (II)
Tangible Fixed Assets 2400 2400
Brand valued by Management - 600
Net Current Assets 700 700
Net asset value (A) 3100 3700
Cost of acquisition (B) 4000 4000
Goodwill (B - A) 900 300
7 (c)
Cost of equity = 8% + 1.1 (14 - 8)= 14.6%
FCFF = EPS - (l-D/E ratio)(Capital expenditure - Depreciation + Increase in non-cash working
Capital)
= 50 -0 .75*(40 – 36 + 16) = 35
Value per share = FCFE* (1+ g)/(Ke - g) = 35 * (1 + 0.04)/(14.6% - 4%) = 36.4/0.106= ` 343.40
8. Write short notes on any four of the following: 4 × 4 = 16
(a) Financial Modeling
(b) Shareholder Value Analysis
(c) Du Pont Analysis
(d) Valuing Synergy
(e) Distress Prediction
Answer: 8
(a) Financial Modeling:
Financial modeling is the task of building an abstract representation of a real world financial
situation. This is a mathematical model designed to represent the performance of a financial
asset or portfolio of a business, project or any other investment. This is the process by which a
firm constructs a financial representation of some, or all, aspects of the firm or given security.
The model is usually characterized by performing calculations, and makes recommendations
Suggested Answer_Syl12_Dec2016_Paper 20
Academics Department, The Institute of Cost Accountants of India (Statutory Body under an Act of Parliament) Page 15
based on that information. The model may also summarise particular events for the end user
and provide direction regarding possible actions or alternative.
Financial modeling is the task of building a financial model, or the process of using a financial
model for financial decision making and analysis. It is an abstract representation of a financial
decision making situation. Financial models are not limited to profit making entities. Nonprofits,
governments, personal finances, all can be represented by financial models.
Uses of Financial Modeling:
Financial modeling is used to do historical analysis of a company's performance, and to do
projections of its financial performance into the future. Project finance is another area that
lends itself to financial models. A project (such as a real estate investment or a new factory)
can be analyzed using a financial model. It does not have to be complete business.
Financial Modeling is not just for the Accountant or Financial Consultant, who are called upon to
develop financial projections, but also for business owners and managers with improved user
interfaces and heavy use of graphics, it is now feasible for non-technical people to use a
financial model to test option and make decisions based on the projected impact on profits
and cash flow.
(b) Shareholder value analysis:
Shareholder Value Analysis (SVA) focuses on the creation of economic value for Shareholders,
as measured by share price performance and flow of funds.
Shareholders Value is used to l ink management strategy and decision to the creating of value
for shareholders.
Value Drivers: Factors or value Drivers which influence the Shareholder's Value are identified.
Example: Growth in Sales, Profit Margin, Capital Investments Decisions, etc.
Management Responsibilities: Management should pay attention to Value drivers, while
taking investment and finance decisions.
Benefit
a) SVA helps the management to concentrate on activities which create value to
the shareholders rather than on short-term profitability.
b) SVA and EVA together helps to strengthen the competitive position at the Firm, by
focusing on wealth creation.
c) They provide an objective and consistent framework of evaluation and decision
making across all functions, departments and units of the Company.
(c) Du Pont Analysis:
Du Pont Analysis is a method of performance measurement that was started by the Du Pont
Corporation. The Du Pont analysis breaks down Return on Equity (that is, the returns that
investors receive from the firm) into three distinct elements. This analysis enables the analyst to
understand the source of superior (or inferior) return by comparison with companies in similar
industries (or between industries). The Du Pont identity is less useful for industries, such as
investment banking, in which the underlying elements are not meaningful. The company's
Suggested Answer_Syl12_Dec2016_Paper 20
Academics Department, The Institute of Cost Accountants of India (Statutory Body under an Act of Parliament) Page 16
return on assets, ROA [=Net income/Assets, can be expressed as: ROA = (Net
Income/Revenue) × (Revenue/Assets) = Profit Margin X Asset Turnover]
And the company's return on equity, ROE (= Net income/Equity), can be expressed as ROE =
(net income/Revenue) × (Revenue/Assets) × (Assets/Equity) = ROA × Equity Multiplier.
Both the company's profitability (as measured in terms of profit margin) and efficiency (as
measured in terms of asset turnover) determine its ROA. This ROA, along with the company's
financial leverage (as measured in terms of its equity multiplier), contributes to its ROE. The
changes in the company's ROE are to be noted and explained through its profit margin, asset
turnover, and equity multiplier over time. The objective is to identify the company's strong area
that can be capitalized upon and/or its weak area that must be improved upon.
(d) Valuing synergy:
The most general definition of synergy is a whole that is greater than the sum of its parts. In the
context of takeovers, the additional value from synergy can come from a variety of sources,
either operational or financial. The key to the existence of synergy is that the target firm
controls a specialized resource that becomes more valuable when combined with bidding
firm's resources. The specialized resource will vary depending on the type of merger. In case of
horizontal merger (it occurs when two firms in the same line of business merge), the synergy
must come from some form of economies of scale, which reduces costs, or from increased
market power, which increases profit margin and sales. Valuing synergy requires
assumptions about future cash flows and growth. The lack of precision in the process does
not mean that an unbiased estimate of value cannot be made. Thus, we maintain that
synergy can be valued by answering two fundamental questions:
1. What form is the synergy expected to take? Will it reduce costs as a percentage of
sales and increase profit margins? Will it increase future growth?
2. When can the synergy be expected to start affecting cash flows instantaneously.
Once these questions are answered, the value of synergy can be estimated using an
extension of discounted cash-flow techniques, first, the firms involved in the merger are
valued independently by discounting expected cash flows to each firm at the weighted
average cost of capital for that firm. Second, the value of the combined firm, with no
synergy, is obtained by adding the values obtained for each firm in the first step. Third, the
effects of synergy are built into the expected growth rates and cash flows, and the
combined firms revalued with synergy. The difference between the values of the combined
firm with synergy and the value of the combined firm without synergy provides a value for
synergy.
(e) Distress Prediction
Distress Prediction is an essential issue in the field of finance. It is a very important tool used
for the purpose of prediction of future probable financial condition of a corporate entity so
that any financial crisis-that may crop up in the near future can be predicted in advance.
Using various models of Distress Prediction, the management of a company comes to know
about its future probable financial condition beforehand and accordingly, it may adopt
appropriate remedial measures to avoid the financial crisis as predicted through the various
models of Distress Prediction. Distress Prediction is considered a very significant tool for
sustainment of a company in the long-run. As a company can have a predicted notion
about occurrence of its financial hardship in future, it gets a scope to avoid such a situation
by taking proper preventive measures in advance. Therefore, Distress Prediction plays a very
significant role in the survival of a company in the long-run.
Suggested Answer_Syl12_Dec2016_Paper 20
Academics Department, The Institute of Cost Accountants of India (Statutory Body under an Act of Parliament) Page 17
Following are the two types of models generally used for prediction of Corporate
Distress/Sickness:
i. Univariate Model: In thi s model, a single variable is used for Corporate Distress Prediction.
ii. Multivariate Model: In this model, a number of variables are used for Corporate Distress
Prediction.