Embed Size (px)
Citation preview
3 (2007) 36–52www.elsevier.com/locate/chemgeo
Chemical Geology 24
Surface chemical reactivity and metal adsorptive properties of naturalcyanobacterial mats from an alkaline hydrothermal spring,
Yellowstone National Park
S.V. Lalonde a,⁎, L.A. Amskold a, L.A. Warren b, K.O. Konhauser a
a Department of Earth and Atmospheric Sciences, 1-26 Earth Sciences Building, University of Alberta, Edmonton, AB, Canada T6G 2E3b School of Geography and Earth Sciences, 309 General Science Building, McMaster University, Hamilton, ON, Canada L8S 4K1
Received 11 November 2006; received in revised form 11 May 2007; accepted 16 May 2007
Editor: D. Rickard
Abstract
The propensity for microbes to adsorb dissolved metals onto their surfaces has been well documented, to the point wherepredictive surface complexation models can accurately account for these reactions under experimental conditions. However, criticalsurface chemical parameters, such as surface functional group concentrations and proton stability constants, have only beenevaluated using laboratory cultures. Whether or not natural microbes are comparable in surface chemical reactivity to laboratorycultures, and whether they display variations across diverse populations, remains untested. To resolve this, we examined naturalcyanobacterial mats of various morphologies (i.e., streamers, vertical spires, horizontally laminated structures), sampled from asingle hydrothermal system in Yellowstone National Park, in terms of surface chemical parameters and acid-leachable metalcontents. Potentiometric titration data of samples that were acid-washed to remove sorbed metals and reveal underlying organicsurfaces indicated functional group concentrations of 0.98±0.28 to 2.84±0.41 mmol g−1 (dry weight) summed over a pKa range of4 to 10, which is comparable to previously reported experimental values. In contrast, samples that were not acid-washed, butmerely rinsed in titration electrolyte adjusted to stream pH, had functional group concentrations ranging from 6.12±1.39 to 19.23±3.14 mmol g−1. They were also largely dominated by a single functional group of pKa∼7 that may be explained by the presence ofaqueous or solid phase metal carbonate species that are removed from the mats by acid-washing. Analysis of the acid-washsolutions indicate that different metals were concentrated to varying extents, and that metals with low metal-carbonate solubilityproducts, such as Ba, Ca, Fe, Mg, Mn, Ni, Sr, and Zn, were preferentially concentrated by the mats, perhaps as the result ofprecipitation as, or complexation with, mat-hosted carbonate species. These results highlight the complexity of metal partitioning innatural microbial communities, where a variety of processes other than surface adsorption, such as metabolism, authigenic mineralprecipitation, and the physical entrapment of detrital material, may contribute to metal sequestration.Crown Copyright © 2007 Published by Elsevier B.V. All rights reserved.
Keywords: Surface chemistry; Metal adsorption; Cyanobacteria; Microbial mats
⁎ Corresponding author. Tel.: +1 780 492 6532; fax: +1 780 4922030.
E-mail address: [email protected] (S.V. Lalonde).
0009-2541/$ - see front matter. Crown Copyright © 2007 Published by Elsdoi:10.1016/j.chemgeo.2007.05.016
1. Introduction
Microbes are found in nearly every aqueousenvironment on Earth, where their highly reactive sur-faces effectively adsorb metals to such an extent that
evier B.V. All rights reserved.

37S.V. Lalonde et al. / Chemical Geology 243 (2007) 36–52
they exert significant control over elemental cycling ona variety of scales (see Konhauser, 2006). The ad-sorption of metals by microbial biomass has been wellstudied in a laboratory context, and predictive surfacecomplexation models can now accurately account formicrobial sorptive phenomena under a wide range ofphysicochemical conditions (e.g., Fowle and Fein,1999; Borrok and Fein, 2005). However, the applicationof surface complexation modeling (SCM) towardsnatural microbial assemblages, in order to better un-derstand their propensity to sequester metals, is com-plicated by several factors.
First, the determination of microbial surface chemicalparameters, such as discrete surface functional groupconcentrations and their respective acidity constants, isrequired to enable SCM, yet is difficult to achieve forenvironmental samples. There exists no practicalprotocol for the culture-independent isolation of micro-bial biomass from most water-rock and soil systems, andindeed, surface chemical parameters have yet to bereported for natural microbial biomass. Second, matscontain a variety of microorganisms that are in differentgrowth stages, and they produce extracellular organicmaterials (e.g., capsules, sheaths, S-layers) that eachhave their own unique chemical compositions. Third,the ability to identify and quantify metals adsorbed tomicrobial surfaces may be complicated by the presenceof a variety of metal-bearing detrital and authigenicmineral phases that are inseparable from the microbialbiomass. For instance, microbes that assemble asbiofilm communities in the form of laminated matsand other macroscopic structures have been observed totrap detrital material and precipitate authigenic mineralsto the point where they become fully mineralized (e.g.,Konhauser and Urrutia, 1999). The extent to whichorganic surface adsorption reactions drive metal seques-tration in such complex natural systems is unknown.
In order to better understand microbial metal se-questration processes as they occur in a natural context,we evaluated surface chemical parameters and acid-leachable metal contents of cyanobacterial mats collect-ed from an alkaline hydrothermal spring system inYellowstone National Park. Samples representing di-verse mat morphologies (streamers, vertical spires,horizontally laminated mats) were collected from thehydrothermal system within a very small spatial area(b2.5 m2) and evaluated for diversity in their respectivesurface chemical properties and ability to sequestermetals. Although we selected cyanobacterial mats thatappeared to be wholly unmineralized, light microscopyrevealed that all samples contained somemineral phases.Potentiometric titrations were performed on samples in
two ways: (1) after washing in titration electrolyte thatwas approximately at spring pH and ionic strength, inorder to best approximate the acid-base behavior ofsamples as they existed in-situ, and (2) after acid-washing, in order to remove minerals to the greatestpossible extent, and thus reveal the inherent surfacechemical properties of the organic components. Thispreliminary work is intended to serve as a starting pointfor better understanding the relative importance of thediverse chemical and physical processes that lead tometal sequestration in natural microbial assemblages.
2. Materials and methods
2.1. Site description and sample collection
Water and microbial mat samples were collected inJuly 2005 from a ∼2.5 m2 area approximately 8 mdownstream from the vent of Mound Spring, an alkalinegeothermal feature located in the Sentinel Meadows areaof lower Geyser Basin, Yellowstone National Park(Fig. 1A). Spring temperature and pH were measured atthe location of mat sampling using a Fisher digitalthermometer, Beckman pH meter, and an Orion Rosselectrode that was calibrated between 7 and 10 usingcommercial buffers heated to spring temperature.Source waters were collected in sterile 25 ml syringes,filtered through 0.45 μm in-line nylon syringe filters,acidified on-site by TraceMetal grade HNO3, and cold-stored until analysis for dissolved and colloidal metals(described below). Additional spring water sampleswere collected for analysis by ion chromatography, butwere not acidified. Total alkalinity was determined on-site by titrations with phenolphthalein and bromcresolgreen indicators, modified for the addition of reagentsdirectly into a syringe containing the sample. Samples ofmicrobial mat (0.55–3.37 g wet weight) were collectedwith sterile, stainless steel scalpels, placed in sterile50 ml conical polypropylene centrifuge tubes, stored inspring water and ice-cooled during transport to theUniversity of Alberta. All samples were stored in thedark at 4 °C until examination, and all titration and acid-wash experiments were completed within 4 days ofsampling.
2.2. Sample preparation and acid-base titration
All glassware and plasticware were acid-washed in~ 30% v/v concentrated HCl for at least 2 h and soakedin deionized water for 12 h prior to use. Microbial matsamples were divided by weight into two groups forseparate preparation and titration. One half of sample

Fig. 1. Site map (A) and photographs (B–F) showing sample location and mat morphologies. (B) All samples were obtained within an area ∼2.5 m2
(highlighted by white box) that lay ∼8 m from the spring source. The relative position of samples representing four mat morphologies are indicatedon (C): (1) subaqueous samples with vertical spire morphology (shown enlarged in (D)) were collected from a small pooled section of stream,(2) samples with streamer morphology were collected from the pool outflow channel (upper part of photograph (E)), (3) yellow mat was collectedfrom the left side of the same outflow channel (E), and (4) white mat were collected from the central portion of the large mat bounding the proximaledge of the stream pool (C). Upon return to the laboratory, thick (∼4 cm) samples of laminated mat morphology (3,4) were sectioned into upper andlower portions for individual analysis (F).
38 S.V. Lalonde et al. / Chemical Geology 243 (2007) 36–52
material was prepared by four alternating rinse (10 sagitation and 10 min soak) and harvest (centrifugationfor 10 min at 10,000 ×g) cycles, using for each rinse∼35 ml 0.01 M KNO3 titration electrolyte that had beenadjusted to spring pH (9.2) with 0.01 M NaOH in orderto minimize the chemical disturbance of mat samples.These samples, prepared in and titrated from electrolyteadjusted to spring pH and ionic strength, are intended tobest reflect the acid-base properties of the mats as they
were found in-situ (i.e., retaining surface complexes andaccessory minerals), and are thus referred to herein as“electrolyte-washed samples”. The second half wassimilarly prepared, however the 0.01 M KNO3 titrationelectrolyte was first adjusted to pH 3 with TraceMetalHNO3 in order to serve as an acid-wash, replacingsurface complexed cations with protons, and dissolvingany solid phase calcite. This acid-wash procedure isintended to reveal the proton-binding behavior of the

39S.V. Lalonde et al. / Chemical Geology 243 (2007) 36–52
organic components comprising the biomass surface in amanner analogous to previous bacterial acid-basetitrations (e.g., Fein et al., 2005 and references therein),and thus these samples are herein referred to as “acid-washed”. The rinsing solutions, 0.45 μm filtered finaltitration suspensions, and samples of stream water weresubsequently analyzed for selected aqueous species (Al,As, Ba, Be, Ca, Cs, Fe, Ge, Li, Mg, Mn, Ni, Rb, Sb, Sr,Ti, Zn) using a Quadrupole ICP-MS (Perkin Elmer Elan6000, University of Alberta).
For each titration, prepared sample (0.01 to 0.05 gdry weight) was suspended in ∼50 ml of fresh titrationelectrolyte in a 125 ml titration flask, and fitted with aRoss-type pH electrode (Mandel Scientific, Guelph,Ontario), thermocouple, magnetic stir bar, titrantdispenser, and N2 purge line. Titrations were performedalkalimetrically to pH 11 with 0.01 M NaOH (FisherCertified 0.01 M NaOH solution) and acidimetrically topH 3 with 0.01 M HNO3 prepared from TraceMetalgrade HNO3 and standardized against 0.01 M NaOH. AQC-Titrate autotitrator (Mandel Scientific) interfaced toa personal computer was set to variably dispense titrantfor increments of 0.1 pH units with electrode stabilitycriteria of b0.5 mV/s between additions. Equilibrationtime between additions averaged about 40 s, and eachtitration was completed in approximately 60 min. Sus-pensions were purged with N2 gas for 30 min prior to,and throughout, the titrations. Electrode calibrationsusing commercial buffers of pH 3.0, 4.0, 7.0, 10.0, and12.0 were performed between every set of titrationreplicates (3–5) representing a single sample, and all pHmeasurements were automatically temperature-cor-rected. After the titrations, samples were filtered throughpre-weighed 0.45 μm glass-fiber filters (GF/C #42,Whatman Inc, Florham park, NJ) and weighed after7 days of air-drying. It should be noted that some cellsmay have lysed during storage, preparation, andtitration, and that the heterogeneous nature of the matbiomass made it difficult to determine by light mic-roscopy whether lysis occurred. As a proxy for cellintegrity, pigment autofluorescence was examined forselected samples immediately pre-and post-titration, andno change in the frequency or intensity of cell auto-fluorescence was observed.
2.3. Discrete ligand modeling
Discrete ligand concentrations were fit to the titrationdata using a non-electrostatic linear-programming pKa
spectrum approach described in detail by Smith andKramer (1999) and previously applied in a variety ofpotentiometric titration studies of natural organic matter
and microbial biomass (Brassard et al., 1990; Smith et al.,1999; Cox et al., 1999; Martinez and Ferris, 2001;Martinez et al., 2002; Phoenix et al., 2002; Fein et al.,2005). Fitting was performed using the software packageMatlab (Mathworks, Natick, MA) with computer codekindly provided by D. Scott Smith (Wilfred LaurierUniversity). Replicate blank titrations indicated negligi-ble experimental error in system charge balance betweenpH∼3.5 and pH∼10.3, and data in the 4 to 10 pH rangewas used for modeling of ligand concentrations over apKa range of 3 to 11 in 0.2 pH unit increments. Excess inthe charge balance of the system results from thespeciation of surface-associated proton-exchangingligands and the influence of any proton-exchangingligands in solution. Although the latter is generallyassumed to be limited for titrations of vigorously washedbiomass grown under laboratory conditions, this is likelynot the case for the environmental samples titrated in thisexperiment (discussed below). Charge arising by proton-exchange with ligands is related to charge arising duringtitration by the following charge balance:
Xn
j¼1
½L�j �−½ANC� ¼Cbi−Caiþ½Hþ�i−½OH��i ð1Þ
where, for the ith addition of titrant, Cb and Ca are theconcentrations of base and acid, respectively, [H+] and[OH−] are measured by the pH electrode, [Lj
−] is theconcentration of deprotonated ligands for the jth mono-protic ligand of n possible pKa values set by the pKa
spectrum, and the acid neutralizing capacity (ANC)functions as a constant offset in charge excess. The ligandconcentrations and ANC that provide the best fit to themeasured charge excess (right hand side of Eq. (1)) isdetermined iteratively by minimizing the absolute errorbetween measured and fitted charge excess (left hand sideof Eq. (1)). The number of distinct-pKa ligands that arerequired to describe the data is minimized as the linear-programming approach emphasizes zero as a possiblesolution. For each sample, between 3 and 5 replicatetitrations were performed, and each titration was modeledindependently.
2.4. Light microscopy
Small amounts of wet, refrigerated sample weredissected by sterile stainless steel scalpel, fixed to glassslides with several drops of low-fluorescence water-based fixative, air-dried for 15 min, and immediatelyexamined. Photomicrographs were obtained using aQuorum Technologies 16 bit color QICAM and Zeiss
40 S.V. Lalonde et al. / Chemical Geology 243 (2007) 36–52
Axioskop mot 2 microscope operating in dark-field,differential intereference contrast (DIC), bright-field,and phase contrast modes. Fluorescence imagesemployed an excitation range of 530–585 nm. Sampleswere refrigerated before and after preparation, and allmicroscopy was performed within 7 days of sampling.
3. Results
3.1. Site and sample descriptions
At the time of collection in July 2005, Mound Springhad a source water temperature of 49 °C, declining to46 °C over the ∼8 m separating the source and 2.5 m2
sampling area (Fig. 1B), and a pH of 9.2 at both sourceand sampling area. Four distinct cyanobacterial matstructures surrounding a pooled section of stream wereinvestigated (Fig. 1C): submerged, “vertical spires” ofbiomass occupying calm waters of the pool (Fig. 1D),“streamers” found under flowing water at a pool outlet(Fig. 1E), and thick laminated structures forming on thepool walls, designated herein as “yellow mats” (Fig. 1E)
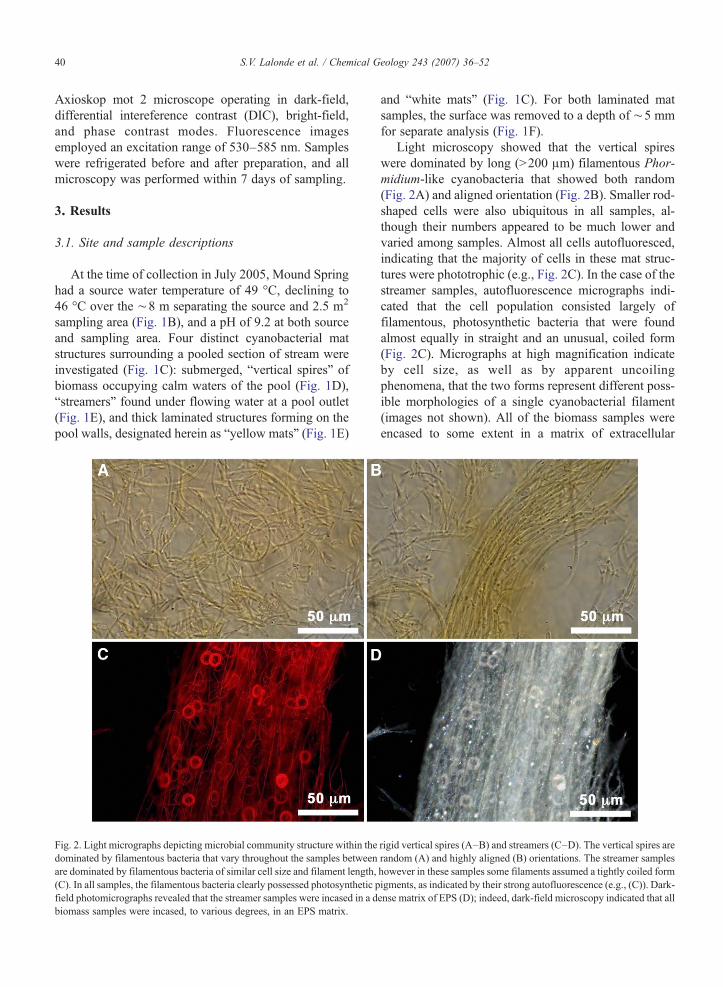
Fig. 2. Light micrographs depicting microbial community structure within thedominated by filamentous bacteria that vary throughout the samples betweenare dominated by filamentous bacteria of similar cell size and filament length,(C). In all samples, the filamentous bacteria clearly possessed photosynthetic pfield photomicrographs revealed that the streamer samples were incased in a dbiomass samples were incased, to various degrees, in an EPS matrix.
and “white mats” (Fig. 1C). For both laminated matsamples, the surface was removed to a depth of ∼5 mmfor separate analysis (Fig. 1F).
Light microscopy showed that the vertical spireswere dominated by long (N200 μm) filamentous Phor-midium-like cyanobacteria that showed both random(Fig. 2A) and aligned orientation (Fig. 2B). Smaller rod-shaped cells were also ubiquitous in all samples, al-though their numbers appeared to be much lower andvaried among samples. Almost all cells autofluoresced,indicating that the majority of cells in these mat struc-tures were phototrophic (e.g., Fig. 2C). In the case of thestreamer samples, autofluorescence micrographs indi-cated that the cell population consisted largely offilamentous, photosynthetic bacteria that were foundalmost equally in straight and an unusual, coiled form(Fig. 2C). Micrographs at high magnification indicateby cell size, as well as by apparent uncoilingphenomena, that the two forms represent different poss-ible morphologies of a single cyanobacterial filament(images not shown). All of the biomass samples wereencased to some extent in a matrix of extracellular
rigid vertical spires (A–B) and streamers (C–D). The vertical spires arerandom (A) and highly aligned (B) orientations. The streamer sampleshowever in these samples some filaments assumed a tightly coiled formigments, as indicated by their strong autofluorescence (e.g., (C)). Dark-ense matrix of EPS (D); indeed, dark-field microscopy indicated that all

Fig. 3. Dark-field and epifluorescent micrographs indicate that the upper 5 mm of both laminated mats consists of a dense EPS matrix (A) hostingrandomly-aligned filamentous phototrophs (B). Lower sections of the mats show patches of more and less dense EPS (C), the former being occupiedby a mix of phototrophic rod-shaped and filamentous cells, and the latter by mostly rod-shaped cells, not all of which displayed autofluorescence (D).
41S.V. Lalonde et al. / Chemical Geology 243 (2007) 36–52
polymeric substance (EPS); the abundant EPS enclosingthe streamer structures was readily apparent in dark-field micrographs (Fig. 2D). The upper 5 mm of bothlaminated mats (yellow and white) were largelycomprised of EPS (Fig. 3A) and filamentous bacterialacking any alignment (Fig. 3B). Sections lower in the
Fig. 4. Mineral grains of diverse size and morphology were observed in all samsome mineral grains, and in consideration of the alkaline stream and mat chemthe laminated mats, mineral grains larger than 20 μm were abundant (A), whspires and streamers (imaged in (B)), grains larger than 20 μm were absent,
laminated mats (2–5 cm) displayed alternating regionsof more or less dense EPS (Fig. 3C), the former beingoccupied by nearly equal densities of filamentous androd-shaped photosynthetic bacteria, and the lattercontaining almost exclusively rod-shaped bacteria, notall of which displayed autofluorescence (Fig. 3D).
ples. Crossed-polar light micrographs revealed strong birefringence foristry, suggest potentially-authigenic carbonates. In the upper layers ofile in the lower layers of the laminated mats, as well as in the verticaland smaller grains (b5 μm) dominated.

42 S.V. Lalonde et al. / Chemical Geology 243 (2007) 36–52
These rod-shaped non-phototrophic cells were foundexclusively at lower depths in the laminated mats, andwere visibly motile in wet-mount slide preparations.
Collectively, the micrographs indicate that despitetheir spatial proximity in the stream, the four mat mor-phologies differ in the relative abundances of cell types,the alignment of filamentous bacteria (directional,coiled, or random), and in the nature or density oftheir EPS matrix. Vertical spire and streamer mat mor-phologies appeared to be dominated almost exclusivelyby photosynthetic bacteria of filamentous or rod shape,while laminated mat morphologies additionallycontained non-photosynthetic, motile, rod-shaped bac-teria at depth that may be heterotrophic. The consistencyin cell size and cylindrical morphology of filamentousbacteria among samples suggests that similar bacteriacontribute to all four mat morphologies, although it isimpossible to confirm without further ecological study(that is beyond the focus of this work). This is also true
Fig. 5. Acid-base data presented as excess charge in the titration system. Exceare as follows: (A) spire structures, (B) streamers, (C) upper 5 mm and (D) loof white mat. Titration data is plotted as points, and lines demonstrate the ex
for the photosynthetic bacteria of rod shape. In turn, thevarious mat morphologies would appear to arise largelyas a function of differential EPS production and thevarying relative abundances of the bacteria describedabove.
Interestingly, the diverse mat morphologies alsodiffered with respect to their visible mineral content.In the upper 5 mm of the laminated mat samples,mineral grains were abundant and typically greater than20 μm in their longest dimension (Fig. 4A), while in thelower sections, grains were distinctly smaller (typicallyless than 5 μm in longest dimension), with sizes rangingdown to the limits of equipment resolution. By com-parison, streamer and vertical spire structures not onlypossessed fewer grains, but they were also less than5 μm in longest dimension (Fig. 4B). Analysis of themineral grains under crossed-polars revealed the pre-sence of calcite. Furthermore, acid washing for 30 minat pH 3 showed that a significant proportion of those
ss charge plots of electrolyte-washed and acid-washed mat preparationswer portions of yellow mat, and (E) upper 5 mm and (F) lower portionscess charge fit by pKa spectra models.

43S.V. Lalonde et al. / Chemical Geology 243 (2007) 36–52
grains dissolved, as would be expected from calciumcarbonate dissolution. However, some mineral grainsremained, suggesting either that those grains werehighly crystalline, or not carbonate in composition.
3.2. Acid-base titrations
In a natural mat, metals will be sequestered by avariety of submerged substrates, including the microbialbiomass as well as any authigenic and detrital mineralsthat it hosts. To better understand the relative roles ofthese individual components, we have attempted toascertain the acid-base behavior of samples containingboth organic and mineral components, and the acid-basebehavior of samples that we have acid-washed with thegoal of removing mineral components. In order toachieve this, we have prepared the mat samples in twodistinct ways. First, “electrolyte-washed” biomass wasprepared by rinsing in titration electrolyte adjusted tostream pH (9.2), and then titrated down to pH 3 to
Fig. 6. The concentrations and pKa values of ligands modeled from excess ch(C) upper and (D) lower yellow mat, and (E) upper and (F) lower white mat.the total weight of all replicates in order to generate the composite plots pre
approximate the excess charge behavior of the matsample as it was found in-situ, i.e. with mineralcomponents intact. Second, mat material was first acid-washed for 30 min in 0.001 M HNO3 to strip offadsorbed metals, dissolve carbonate minerals, andprotonate surface ligands. Samples were then similarlyrinsed with titration electrolyte, and titrated from pH 3 to11 to evaluate proton sorption by native organic surfacecomponents.
Excess charge plots of both “acid-washed” and“electrolyte-washed” mat preparations reveal that im-portant changes in titration charging behavior are in-curred by the acid-washing procedure (Fig. 5). Mostnotably, all suspensions of electrolyte-washed mat(top lines in Fig. 5A-F) exchanged more protons overthe titration range than did their acid-washed counter-parts. All samples also displayed an accumulation ofexcess charge at both extremes of the titration range(i.e., around pH 4 and 10). Although excess chargeplots generated from titration data are ill-suited for
arge data of acid-washed samples are diverse: (A) spires, (B) streamers,Ligand concentrations were summed over all replicates and divided bysented above.

44 S.V. Lalonde et al. / Chemical Geology 243 (2007) 36–52
quantitative comparisons between samples, they doprovide a visual assessment of proton sorption overthe titration range, and thus are presented here forqualitative purposes.
3.3. Discrete functional group distributions
The excess charge data is more readily interpretedafter being fitted with a distribution of discretefunctional groups, in terms of functional groupconcentrations and acidity constants (henceforth pre-sented as pKa, the negative log of the acidity constant;Fig. 6). This permits the concentrations of functionalgroups accounting for excess charge behavior to becompared between samples or preparations. Addition-ally, their pKa values can aid in the identification ofreactive mat components, and the reported data as awhole can be related to past and future studies invokinga surface complexation model to explain chargingbehavior. Although a non-electrostatic model wasemployed here for the modeling of discrete functionalgroups, the results are likely comparable with otherstudies that employ electrostatic models, as surfacecapacitance values assumed for previous bacterialtitration studies are sufficiently high (8.0 F/m2) as tobe approximately equivalent to the non-electrostaticmodel (see Borrok et al., 2004 and references therein).Furthermore, in a recent comparison of discrete sitemodeling approaches, it was determined that for thegram-negative surface of two Pseudomonas species,surface electric field effects were negligible for proton
Table 1Modeled ligand concentrations of all samples, grouped by preparation meth
Ligand concentration (mmol g−
Sample 4 to 6 6
Acid-washed preparationsSpires (n=5) 0.77±0.25 0Streamers (n=2) 0.40±0.40 0Upper yellow mat (n=3) 0.05±0.04 0Lower yellow mat (n=3) 0.32±0.18 0Upper white mat (n=5) 0.03±0.03 0Lower white mat (n=5) 0.25±0.14 1
Electrolyte-washed preparationsSpires (n=5) 1.46±0.71 4Streamers (n=2) 0.31±0.02 6Upper yellow mat (n=5) 2.67±2.48 7Lower yellow mat (n=5) 1.76±1.02 11Upper white mat (n=4) nd 13Lower white mat (n=5) 2.16±2.16 9
Uncertainty is expressed as one standard error.
adsorption, and a non-electrostatic model adequatelydescribed proton adsorption over a wide ionic strengthrange (0.001 to 0.6 M) (Borrok and Fein, 2005).
3.3.1. Acid-washed samplesThe pKa spectra of acid-washed samples, assumed
here to represent proton-active components of the native(organic) mat surface, reveal both conserved chemicalfeatures and diversity between samples. Samples of thespire-type mat indicated a pKa distribution of ligands thatspan the 5 to 10 range (Fig. 6A), while the ligand pKa
distribution of streamer samples was dominated by low toneutral pKa values (Fig. 6B). The upper 5 mm of both thelaminated yellow and white mats (Fig. 6C and D) showedreasonably comparable ligand densities near pKa 6 and 9,while lower sections of the mats indicate the presence ofligands closer to pKa 10 (Fig. 6E and F). In general, bothupper and lower samples of laminated mat showed apaucity of ligands with pKa values below 5.5, andsignificant cluster of ligands between pKa∼5.5–7.5.
For purposes of comparison, ligands were groupedinto 3 pKa classes (4–6, 6–8, and 8–10) (Table 1). Theresults indicate that the different mat structures varywith respect to total ligand concentration, as well as inthe relative importance of individual ligand classes;however, the average standard error in most pair-wisecomparisons of total ligand concentration was suffi-ciently high (55%) as to exclude appreciable confidence.Total ligand concentrations in the acid-washed prepara-tions varied from 2.84±0.41 mmol g−1 for the spire-type mat to 0.98±0.28 mmol g−1 for the lower mat
od and further classified by ligand pKa range1) per pKa class
to 8 8 to 10 Total
.53±0.19 1.54±0.38 2.84±0.41
.73±0.28 nd 1.13±0.68
.88±0.35 0.42±0.31 1.36±0.59
.35±0.11 0.32±0.32 0.98±0.28
.55±0.18 0.79±0.58 1.36±0.76
.28±0.38 0.29±0.29 2.20±0.61
.53±1.13 0.14±0.14 6.12±1.39
.87±0.97 nd 7.18±0.98
.68±0.49 0.97±0.97 11.77±2.28
.32±1.45 1.54±1.54 14.62±1.21
.26±1.17 nd 13.26±1.17
.96±3.69 5.76±3.31 19.23±3.14

45S.V. Lalonde et al. / Chemical Geology 243 (2007) 36–52
section, similar in range to some previously reportedvalues obtained for acid-washed suspensions of culturedGram-negative (0.80–1.77 mmol g−1; Plette et al.,1995; Sokolov et al., 2001; Phoenix et al., 2002) andGram-positive bacteria (0.22–2.29 mmol g−1; Feinet al., 1997; He and Tebo, 1998; Cox et al., 1999; Yeeet al., 2004). However, the lack of sites with pKab4 forthe laminated mat samples differs from culturedrepresentatives. These sites, often designated as carbox-yl by their low pKa values, have been implicated asprimary sites for the adsorption of cations by bacteria(e.g., Beveridge and Murray, 1980). Their absence mayexplained by a retention of cations throughout the acid-wash and titration procedures, rather than an actualabsence of carboxylic functional groups on the biomasssurface, although additional (e.g., spectroscopic) evi-dence is required for any further inference.
Fig. 7. pKa spectra of ligands modeled from excess charge data of electrolyte-conserved ligand around pKa 7: (A) spires, (B) streamers, (C) upper and (Dconcentrations were summed over all replicates and divided by the total weighabove.
3.3.2. Electrolyte-washed samplesThe most significant observation of this study is
that the electrolyte-washed samples contain signifi-cantly higher ligand concentrations than the acid-washed samples, with a single ligand typically dom-inating the pKa spectra around 7 (Fig. 7, Table 1). Insome instances, ligands with pKa values near 4 and/or10 were present, however they contributed no morethan 48% of ligands for any electrolyte-washed sample,and on average constituted only 23% of the totalligands. The influence of an abundant ligand withpKa∼7 is evident in the plots of excess charge, whereprotons are strongly consumed in the pH 6–8 range(recall Fig. 5).
Unlike the acid-washed samples, some of theelectrolyte-washed samples are statistically different interms of total ligand concentration (Table 1). Total
washed samples reveal elevated concentrations and the dominance of a) lower yellow mat, and (E) upper and (F) lower white mat. Ligandt titrated of replicates in order to generate the composite plots presented

Fig. 8. A log plot of distribution coefficients, arranged in order of increasing stream concentration, reveals specificity in the adsorption of trace metalsfrom the aqueous phase. Values ranged from less concentrated to nearly 21,000× more concentrated on the biomass than in the stream. The high-lowbars demonstrate the spread in values between samples for each element about the mean values (dotted line).
46 S.V. Lalonde et al. / Chemical Geology 243 (2007) 36–52
ligand concentrations were lowest for the spires andstreamers, but higher for the upper laminated matsections, and highest for the bottom laminated matsections.
3.4. Acid-leachable metal concentrations
Metal partitioning between the cyanobacterial matsand the spring waters was evaluated in terms of acid-leachable metal concentrations, which were obtainedby analyzing the supernatant of each acid-washsolution for dissolved metals, and then normalizingthe metal concentrations to the dry weight of acid-washed biomass. It should be noted that the metalconcentrations reported here depend, to some degree,on the conditions of the acid-washing process and thepresence of inorganic mat components; it is possiblethat the acid-wash procedure employed here failed todesorb some surface-complexed metals, and at thesame time, released other metals by the dissolution ofmineral components in the mat.
The concentrations of acid-leachable metals, interms of μmol/Kg, are tabulated in Appendix 1. Theability of the mats to concentrate individual metalsfrom the spring water may be better assessed bycomparing the concentration of metals that weredesorbed from the mats by acid-washing with their
respective concentration in spring waters using thedistribution coefficient, Kd (Fig. 8):
Kd ¼mat½ � lmol Kg�1
� �
spring½ � lmol L�1� � ð2Þ
In the log Kd plot presented in Fig. 8, the metals areordered by increasing aqueous concentration in springwater, and a range of distribution coefficients are ap-parent. Lower and upper values indicate that the con-centration of metals leached from the mat ranged from0.36 (Cs, Al) to almost 21,000 times higher (Mg) thanthe overlying water concentration. Distribution coeffi-cients generally increased with decreasing spring waterconcentration, such that elements found at very lowaqueous concentrations showed greater partitioning tothe mats than did those elements found in the greatestaqueous concentration, although important exceptionsare apparent (Ca, Zn). Another interesting observation isthe degree of variation in elemental partitioning amongsamples. Some elements, such as Li, Ca, Ge, Sb, and Ti,were concentrated to similar extents by all mat samples,while others, such as Al, Rb, Cs, Be, Fe, and Mg, variedamong samples in their concentration factors by up totwo orders of magnitude. It further appears that theupper mat samples concentrated metals to the lowestextent, and streamer samples to the highest extent, yet

47S.V. Lalonde et al. / Chemical Geology 243 (2007) 36–52
once again, caution must be exercised as exceptions tothis generalization are numerous.
4. Discussion
4.1. Identification of mat ligands
A variety of organic ligands have been invoked aschemical moieties that contribute to the chemical re-activity of the microbial surface. Their putativeassignment to ligand clusters modeled from acid-basetitration data is based on spectroscopic data (e.g.,infrared (Jiang et al., 2004) and X-ray adsorption(Boyanov et al., 2002; Kelly et al., 2002) spectroscopy)and comparisons with model organic acids in terms ofacid-base behavior (e.g., Fein et al., 1997). Cox et al.(1999) used organic acid pKa values from Martell andSmith (1989) to outline an approximate ligand classi-fication scheme as follows: (1) carboxyl functionalgroups possess pKa values in the range of 2–6, phos-phoryl functional groups in the range of 6–7, aminofunctional groups in the range 9–11, and hydroxylfunctional groups in the range 8–13.
In this study, the ligands determined for acid-washed samples might include representatives from allof the above categories. The ligand classificationscheme employed in Table 1, where ligands aregrouped into pKa ranges of 4–6, 6–8, and 8–10,approximately correspond to the scheme of Cox et al.,where the three classes represent carboxyl, phosphoryl,and hydroxyl/amino functional groups respectively. Asspectroscopic evidence is required to confirm theseidentities, as well as distinguish between hydroxyl andamino functional groups whose pKa values mayoverlap, these assignments should be regarded asstrictly operational.
For the electrolyte-washed samples, we believe thatthe dominant ligand at pKa∼7 does not represent anorganic functional group because of its loss upon acid-washing. Instead, we consider this behaviour to beconsistent with mat-associated carbonate minerals and/or dissolved inorganic carbon (mostly as bicarbonate,HCO3
- ) that are at least partially dissolved or removedfrom the biomass by acid-washing, but are not removedby the rinsing procedure of electrolyte-washed samples.Indeed, as discussed above, calcite grains were observedwithin the EPS matrix of all samples, and their presenceindicates local conditions of calcite supersaturationconsistent with the microscopic observations indicatingvariably sized and located Ca-carbonate grains. A pKa
value of ∼7 is in itself suggestive that the dissolution ofcalcite and/or production of H2CO3 from HCO3
− is
responsible for the dominant ligand, as the maximumbuffer capacity for a closed system in equilibrium withcalcite is around pH 7 (Langmuir, 1997). It is critical tonote that the ligand concentrations of electrolyte-washedsamples represent the combined contribution from bothcarbonate mineral grains and any mat-hosted aqueouscarbonate species retained through the rinsing proce-dure, with the former dissolving to yield the latter overthe course of titration. In other words, the ligandconcentrations of electrolyte-washed samples are pre-sumed to correspond to the total (aqueous+solid-phase)carbonate content of the mat.
For the electrolyte-washed samples, total ligandconcentrations were lowest for the spires and streamers,higher for the upper laminated mat sections, and highestfor the bottom laminated mat sections. This order is ingeneral agreement with microscopy suggesting anabundance of calcite grains in thick lamnated mat sam-ples, with fewer grains contained in the spire andstreamer structures. Such an observation is not unexpect-ed given that the thick mat layers serve as diffusivebarriers that prevent the rapid loss of soluble ions (e.g.,HCO3
−). This, in turn, maintains appropriate saturationstates facilitating crystal growth. Conversely, soluble ionsmay be rapidly lost by diffusion and advection from therelatively thin spires and streamer structures.
Implicit in the above trends is the fact that the car-bonate grains are authigenic in origin. Although wecannot be absolutely confident that some of the grainsare not detrital, it is well known that cyanobacteriafacilitate carbonate precipitation by the adsorption ofCa2+cations to their cell surfaces and their metabolicproduction of HCO3
−(Thompson and Ferris, 1990;Merz-Preiß, 2000). It is interesting to note thatdifferences in organic surface functional group chemis-try are small (total ligand concentrations ranging from0.98±0.28 to 2.84±0.41 mmol g−1) relative to dif-ferences attributable to carbonate mineral content (i.e.,electrolyte-washed total ligand concentrations rangingfrom 6.12±1.39 to 19.23±3.14 mmol g−1), suggestingthat organic surface functional group chemistry was nota major determinant of the mat’s aqueous or mineralcarbonate content.
4.2. Balance between available ligands and seques-tered metals
As discussed above, acid-leachable metal concentra-tions in the microbial mats ranged from 0.36 to 21,000times their respective stream water concentrations, andmost metals were concentrated by a factor of 10 to 1000.This is not surprising for an alkaline spring system (pH
48 S.V. Lalonde et al. / Chemical Geology 243 (2007) 36–52
9.2 in this case), where most anionic functional groups(e.g., carboxyl and phosphoryl) attributable to thebiomass should be in a deprotonated state and thusavailable as anionic sites for metal cation adsorption.However, mat-associated metal concentrations wereapproximately 3 orders of magnitude less than thenumber of available ligands determined for either acid-washed and electrolyte-washed samples. In other words,by a large majority, most ligands available within themicrobial mats were unoccupied by metals. This fact,although counter-intuitive, is readily explained by thelow concentrations of metals in the stream waters (seeAppendix 1); at the stream pH of 9.2, the solubility ofmany of the metals examined in this study were verylow. It is also worth noting that in this system, themicrobial sequestration of metals is unlikely to affectaqueous metal concentrations, as the continuous supplyof stream water approximates a flow-through systemrather than a batch system, and the surfaces of interestshould reach a steady-state equilibrium barring anychemical or biological change in the system. The endresult is a system where metal adsorption is governed byequilibrium between metals in stream water andavailable ligands, the former of which is low, and thelatter is high, as the result of elevated pH. Interestingly,the fact that the concentration of metals.
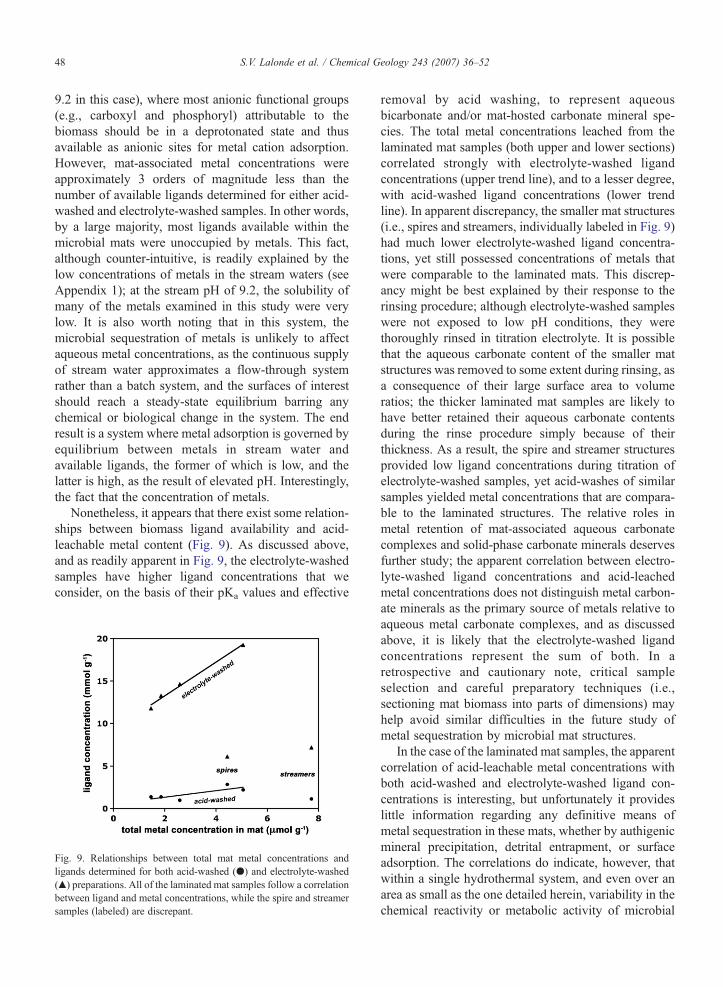
Nonetheless, it appears that there exist some relation-ships between biomass ligand availability and acid-leachable metal content (Fig. 9). As discussed above,and as readily apparent in Fig. 9, the electrolyte-washedsamples have higher ligand concentrations that weconsider, on the basis of their pKa values and effective
Fig. 9. Relationships between total mat metal concentrations andligands determined for both acid-washed (●) and electrolyte-washed(▲) preparations. All of the laminated mat samples follow a correlationbetween ligand and metal concentrations, while the spire and streamersamples (labeled) are discrepant.
removal by acid washing, to represent aqueousbicarbonate and/or mat-hosted carbonate mineral spe-cies. The total metal concentrations leached from thelaminated mat samples (both upper and lower sections)correlated strongly with electrolyte-washed ligandconcentrations (upper trend line), and to a lesser degree,with acid-washed ligand concentrations (lower trendline). In apparent discrepancy, the smaller mat structures(i.e., spires and streamers, individually labeled in Fig. 9)had much lower electrolyte-washed ligand concentra-tions, yet still possessed concentrations of metals thatwere comparable to the laminated mats. This discrep-ancy might be best explained by their response to therinsing procedure; although electrolyte-washed sampleswere not exposed to low pH conditions, they werethoroughly rinsed in titration electrolyte. It is possiblethat the aqueous carbonate content of the smaller matstructures was removed to some extent during rinsing, asa consequence of their large surface area to volumeratios; the thicker laminated mat samples are likely tohave better retained their aqueous carbonate contentsduring the rinse procedure simply because of theirthickness. As a result, the spire and streamer structuresprovided low ligand concentrations during titration ofelectrolyte-washed samples, yet acid-washes of similarsamples yielded metal concentrations that are compara-ble to the laminated structures. The relative roles inmetal retention of mat-associated aqueous carbonatecomplexes and solid-phase carbonate minerals deservesfurther study; the apparent correlation between electro-lyte-washed ligand concentrations and acid-leachedmetal concentrations does not distinguish metal carbon-ate minerals as the primary source of metals relative toaqueous metal carbonate complexes, and as discussedabove, it is likely that the electrolyte-washed ligandconcentrations represent the sum of both. In aretrospective and cautionary note, critical sampleselection and careful preparatory techniques (i.e.,sectioning mat biomass into parts of dimensions) mayhelp avoid similar difficulties in the future study ofmetal sequestration by microbial mat structures.
In the case of the laminated mat samples, the apparentcorrelation of acid-leachable metal concentrations withboth acid-washed and electrolyte-washed ligand con-centrations is interesting, but unfortunately it provideslittle information regarding any definitive means ofmetal sequestration in these mats, whether by authigenicmineral precipitation, detrital entrapment, or surfaceadsorption. The correlations do indicate, however, thatwithin a single hydrothermal system, and even over anarea as small as the one detailed herein, variability in thechemical reactivity or metabolic activity of microbial

Fig. 10. A plot of anhydrous metal carbonate (MeCO3(s)) solubilityproducts (Ksp) vs. their average biomass distribution coefficientsdisplays a strong linear relationship (R2=0.97) for most of thecarbonate-forming metals. Ca and Zn are treated as outliers andomitted from this regression (see text). However, a similarly linearrelationship is observed with Me-oxalate stability constants (R2=0.60,Ca omitted), highlighting the difficulty in relating metal sequestrationto either mineral precipitation or biomass adsorption from a ther-modynamic standpoint.
49S.V. Lalonde et al. / Chemical Geology 243 (2007) 36–52
mats may be sufficient high as to be reflected in theconcentrations of metals the mats sequester.
4.3. Trends in metal sequestration
Our work shows that various elements are concentrat-ed to different extents by the microbial mats. Metals oflow Kd values (0.5–1), such as Al, As, Cs, Li, Rb, and Ti,are only slightly concentrated by the mats, in anapparently non-specific manner; this is consistent withlaboratory experiments demonstrating general non-spec-ificity during metal sorption by bacterial surfaces (e.g.,Fein et al., 2001). However, those metals most concen-trated by the mats (with Kd valuesN2), such as Ca, Fe,Mn, Sr, Zn, Ba, andMg, are preferentially sequestered in amanner that is inconsistent with non-specific adsorptionto organic mat components. Importantly, these metals areprimarily divalent cations with relatively low anhydrousmetal carbonate solubility products (Ksp),:
MeCO3ðsÞXMe2þþCO2−3 ; Ksp¼ ½Me2þ�½CO2−
3 � ð3Þ
In other words, saturation for their respective metalcarbonates may be achieved at low Me2þ� and CO2−
3
� ��
values, and thus, these divalent metals are readilysequestered by co-precipitation with, or sorption to,calcium carbonate. Indeed, when their metal carbonatesolubility products (Ksp values from the WATEQ4Fdatabase, Ball and Nordstrom, 1991) are plotted againsttheir respective biomass distribution coefficients, itbecomes evident that their mat distribution coefficientsincrease as a function of increasing solubility, with theexception of Ca and Zn (Fig. 10). At first glance, thismight indicate that these metals were sequestered intheir metal carbonate form, and that the extent to whichthey were dissolved by the acid-leaching proceduredepended on their respective mineral solubilities.
Stability constants for aqueous metal complexation byoxalate are also presented in Fig. 10, because it has beenpreviously demonstrated that the adsorption of metals tobacterial surfaces are correlated to some extent with theirdegree of aqueous complexation by simple carboxylicacids such as oxalate (Fein et al., 2001). This apparentcorrelation is not surprising given the chemical homologybetween carboxylic acids on the bacterial surface andthose of simple organic acids such as oxalate; in fact, thesame principal of chemical homology explains whymetal distribution coefficients in Fig. 10 correlate withboth calcium carbonate solubility and oxalate complexstability. The stability constants of aqueous oxalate(CH3O2
−) and carbonate (CO32−) metal complexes are
known to correlate with each other as the result of their
similarity in size, geometry, electron configurations andother bonding properties (Langmuir, 1997).
The elements Ca and Zn, found at higher concentra-tions in the stream waters than the other carbonate-forming elements, poorly adhere to the above stabilityconstant relationships. Zachara et al. (1991) previouslyinvestigated the sorption of divalent metals to calcitesurfaces, and found that Zn deviates from other metals inthe relationship between its calcite surface stabilityconstant and its ionic radius relative to Ca, implyingthat additional factors related to the Zn atom's electronicstructure may additionally influence its sorption to calcite.However, in a plot similar to Fig. 10, they find that thesorption of Zn is equally related to its metal carbonatesolubility product. According to the observed trends, Znshould have been found at higher surface concentration tocorrelate with its oxalate stability constant, and at lowersurface concentrations to correlate with its metalcarbonate solubility product. It is possible that thisrepresents competition between organic and carbonateligands for available Zn, however given the limited data,unknown factors may be equally responsible.
With respect to both apparent correlations, Calciumwasconsistently found at low concentrations. This trend mayrepresent either incomplete dissolution of calcium carbon-ate grains or a failure for calcium to desorb from organiccomponents during acid-washing. In the case of theformer, time-lapsed dissolution experiments (unpublished)

50 S.V. Lalonde et al. / Chemical Geology 243 (2007) 36–52
indicated that the larger grains (as shown in Fig. 4A) werenot completely removed within the 30 min acid-leachprocedure. At the same time, the latter hypothesis may beequally valid, as carboxylic functional groups that wereconspicuously absent from the acid-washed pKa spectramay have been ‘masked’ by cation occupancy even afterthe acid-washing procedure, as discussed above.
While interesting, the simultaneous correlation ofmetaldistribution coefficients with metal carbonate Ksp valuesand metal-oxalate stability constants complicates anyefforts to determinewhichmetalsmay have been adsorbedto biomass vs. those that may have been hosted incarbonate minerals and subsequently released during acid-leaching. Overall, these results highlight the fact that metaldistribution coefficients reflecting metal sequestration bynatural microbial biomass may be highly ordered accord-ing to the thermodynamic properties of individual metals(e.g., ionic radius, ionic potential, electron configurations),yet vague in relation to actual sequestrative processesbecause of chemical homology between organic andmineral components in a natural microbial community.
It is clear that despite the analysis presented above,authigenic mineral precipitation, detrital entrapment, andsurface adsorption all remain viable as mechanisms thatmay have lead to metal sequestration by the microbialmats. It is possible, if not probable, that all three proc-esses occur simultaneously in this complex microbialcommunity. At the very least, the results presented hereinemphasize some of the difficulties inherent to themechanistic understanding of metal sequestration innatural microbial systems. Perhaps more importantly,this study highlights the need for an encompassing viewof metal sequestration by natural microbial assemblagesthat includes, but also looks beyond, organic surfacecomplexation reactions. At least in this case, the par-titioning of metals into a heterogeneous assemblage ofcells, EPS, and diverse minerals must be considered inlight of the fact that, despite their close proximity withinin a single hydrothermal spring, such microbial commu-nities may be highly varied with respect to their mineralcontent, organic surface reactivity, metabolic activity, andphysical factors such as mat structure (e.g., streamer vs.spire vs. laminated mat) and permeability. It is clear fromthis preliminary work that future studies aiming toevaluate the microbial sequestration of metals maybenefit from the use of natural samples for whichlaboratory analogues are poor or wholly unavailable.
5. Conclusions
Natural microbial mats grow under environmentalconditions that are difficult, if not impossible to replicate,
and the study of such systems may reveal complexgeochemical processes that are not easily reproduced in alaboratory setting. Metal sequestration by microbialbiomass is one such process, where simple laboratoryanalogues have beenwell characterized, but their relevancetowards natural systems has remained untested. In order tobetter understandmicrobial metal sequestration as it occursin natural settings, cyanobacterial mats of diverse mor-phology were collected from a small area within a singlealkaline hydrothermal spring, Yellowstone National Park,and critically assessed for their ability to sequester metalsfrom solution. Metal distribution coefficients indicate thatsome metals are non-specifically adsorbed, while othermetals, primarily divalent cations characterized by lowmetal carbonate solubility products, were more stronglysequestered. While the latter might indicate sequestrationby authigenic precipitation or detrital entrapment ofcarbonate mineral phases, a critical evaluation of pertinentthermodynamic parameters fails to distinguish whetherthese metals were sourced from mineral or organic matcomponents. Microscopy and acid-base titrations ofelectrolyte-washed samples demonstrate that the matsdiffer in their carbonate mineral content, and titrations ofacid-washed samples imply that there exists some of degreeof variation between mats in the surface functional groupchemistry of their organic components, despite the closeproximity of mats within the hydrothermal feature. Totalmetal concentrations in the biomass correlated with bothcarbonate (electrolyte-washed) ligand concentrations andnative organic (acid-washed) ligand concentrations, againfailing to distinguish the exact mechanisms responsible formetal sequestrationwithin the diversemat structures. Theseresults demonstrate that over small spatial areas, the extentof metal sequestration by diverse cyanobacterial mats mayvary significantly, and that such variations may arise fromthe combined influences of metabolic activity, mineralphase entrapment and/or authigenic precipitation, and bythe differences in surface functional group chemistry andphysical organization of organic mat components. Thisstudy, being one of the first to evaluate metal sequestrationby natural biomass in a framework relevant to surfaceadsorption models, highlights important considerations inthe extrapolation of microbe-metal interaction from simplelaboratory experiments to complex and heterogeneousenvironmental samples.
Acknowledgements
We thank Everett Shock for his assistance in the field,and for arranging samples under NPS permit numberYELL-2005-SCI-5434. This work was funded by aNSERC award to K.K.

51S.V. Lalonde et al. / Chemical Geology 243 (2007) 36–52
Appendix 1
Concentrations of various elements in stream water and their corresponding mat concentrations as inferred by acid-washing
Element
Stream concentration(μM)Mat concentration (μmol/Kg)
Spires
Streamers Upper yellow mat Lower yellow mat Upper white mat Lower white matLi
246.343 2726.467 2107.851 603.253 695.030 1106.698 2015.892 Al 15.292 60.831 344.071 5.573 24.569 44.293 54.650 As 14.660 63.777 67.086 10.889 19.412 46.646 48.280 Ca 11.792 1216.319 3070.557 514.184 679.426 367.679 1786.925 Rb 1.384 129.767 10.284 2.430 4.280 3.203 14.196 Cs 0.688 79.847 0.690 0.268 0.797 0.683 4.948 Ge 0.658 26.181 13.727 10.675 16.996 38.208 19.093 Zn 0.399 70.452 822.112 160.728 956.689 69.329 704.195 Sb 0.386 3.412 4.258 0.758 1.424 2.059 2.846 Ti 0.384 1.618 1.305 0.453 1.255 1.094 1.370 Be 0.157 6.297 48.686 1.252 1.888 0.562 8.914 Fe 0.088 1.763 32.078 8.347 9.354 104.781 4.121 Ba 0.080 31.937 429.550 83.851 107.104 49.301 212.819 Mg 0.035 15.411 743.281 57.131 61.225 18.480 154.105 Mn 0.010 1.214 15.332 1.262 1.520 0.445 6.142 Sr 0.006 1.279 11.839 1.754 2.132 0.931 5.257 Ni 0.004 0.564 1.194 0.326 1.838 1.435 12.256 Sum 292.366 4437.135 7723.898 1463.134 2584.939 1855.826 5056.008 Cl− 223.914 Fl− 23.822 SO42−
15.941 Total alkalinity 5045.849 pH 9.2 Temperature (°C) 46.0 Ionic strength (M) 0.011Elements are arranged by their stream water concentration. Also included for stream water are basic parameters as well as principle anionconcentrations as determined by ion chromatography.
References
Ball, J.W., Nordstrom, D.K., 1991. WATEQ4F-User's manual withrevised thermodynamic database and test cases for calculatingspeciation of major, trace and redox elements in natural waters.U.S. Geological Survey Open-File Report 90-129. 185 pp.
Beveridge, T.J., Murray, R.G.E., 1980. Sites of metal deposition in thecell wall of Bacillus subtilis. Journal of Bacteriology 141, 876–887.
Borrok, D., Fein, J.B., 2005. The impact of ionic strength on theadsorption of protons, Pb, Cd, and Sr onto the surfaces of gram-negative bacteria: testing non-electrostatic, diffuse, and triple-layermodels. Journal of Colloidal and Interface Science 286, 110–126.
Borrok, D., Fein, J.B., Tischler, M., O’Loughlin, E., Meyer, H., Liss,M., Kemner, K.M., 2004. The effect of acidic solutions and growthconditions on the adsorptive properties of bacterial surfaces.Chemical Geology 209, 107–109.
Boyanov, M.I., Kelly, S.D., Kemner, K.M., Bunker, B.A., Fein, J.B.,Fowle, D.A., 2002. Adsorption of cadmium to B. subtilis bacterialcell walls — a pH-dependent XAFS spectroscopy study.Geochimica et Cosmochimica Acta 67, 3299–3311.
Brassard, P., Kramer, J.R., Collins, P.V., 1990. Binding site analysisusing linear programming. Environmental Science Technology 24,195–201.
Cox, J.S., Smith, D.S., Warren, L.A., Ferris, F.G., 1999. Characterizingheterogeneous bacterial surface functional groups using discrete
affinity spectra for proton binding. Environmental ScienceTechnology 33, 4514–4521.
Fein, J.B., Boily, J.F., Yee, N., 2005. Potentiometric titrations ofBacillus subtilis cells to low pH and a comparison of modelingapproaches. Geochimica et Cosmochimica Acta 69, 1123–1132.
Fein, J.B., Daughney, C.J., Yee, N., Davis, T.A., 1997. A chemicalequilibrium model for metal adsorption onto bacterial surfaces.Geochimica et Cosmochimica Acta 61, 3319–3328.
Fein, J.B., Martin, A.M., Wightman, P.G., 2001. Metal adsorption ontobacterial surfaces: development of a predictive approach. Geochi-mica et Cosmochimica Acta 65, 4267–4273.
Fowle, D.A., Fein, J.B., 1999. Competitive adsorption of metal cationsonto two gram-positive bacteria: testing the chemical equilibriummodel. Geochimica et Cosmochimica Acta 63, 3059–3067.
He, L.M., Tebo, B.M., 1998. Surface charge properties of and Cu(II)adsorption by spores of the marine Bacillus sp. strain SG-1.Applied and Environmental Microbiology 64, 1123–1129.
Jiang, W., Saxena, A., Song, B., Ward, B.B., Beveridge, T.J., Myneni,S.C.B., 2004. Elucidation of functional groups on Gram-positiveand Gram-negative bacterial surfaces using infrared spectroscopy.Langmuir 20, 11433–11442.
Kelly, S.D., Kemner, K.M., Fein, J.B., Fowle, D.A., Boyanov, M.I.,Bunker, B.A., Yee, N., 2002. X-ray absorption fine structuredetermination of pH-dependent U-bacterial cell wall interactions.Geochimica et Cosmochimica Acta 66, 3855–3871.

52 S.V. Lalonde et al. / Chemical Geology 243 (2007) 36–52
Konhauser, K.O., 2006. Introduction to Geomicrobiology. BlackwellPublishing, Oxford, UK.
Konhauser, K.O., Urrutia, M.M., 1999. Bacterial clay authigenesis: acommon biogeochemical process. Chemical Geology 161, 399–413.
Langmuir, D., 1997. Aqueous Environmental Geochemistry. Prentice-Hall, Upper Saddle River, NJ.
Martell, A.E., Smith, R.M., 1989. Critical Stability Constants. PlenumPress, New York.
Martinez, R.E., Ferris, F.G., 2001. Chemical equilibrium modelingtechniques for the analysis of high-resolution bacterial metal sorptiondata. Journal of Colloidal and Interface Science 243, 73–80.
Martinez, R.E., Smith, D.S., Kulczycki, E., Ferris, F.G., 2002.Determination of intrinsic bacterial surface acidity constantsusing a Donnan shell model and a continuous pKa distributionmethod. Journal of Colloidal and Interface Science 253, 130–139.
Merz-Preiβ, M., 2000. Calcification in cyanobacteria. In: Riding, R.E.,Awramik, S.M. (Eds.), Microbial Sediments. Springer-Verlag, Berlin,pp. 51–56.
Phoenix, V.R., Martinez, R.E., Konhauser, K.O., Ferris, F.G., 2002.Characterization and implications of the cell surface reactivity ofthe cyanobacteria Calothrix sp. Applied And EnvironmentalMicrobiology 68, 4827–4834.
Plette, C.C., Van Riemsdijk, W.H., Benedetti, M.F., Van der Wal, A.,1995. pH dependent charging behavior of isolated cell walls of a
gram-positive soil bacterium. Journal of Colloidal and InterfaceScience 173, 354–363.
Smith, D.S., Adams, N.W.H., Kramer, J.R., 1999. Resolvinguncertainty in chemical speciation determinations. Geochimica etCosmochimica Acta 63, 3337–3347.
Smith, D.S., Kramer, J.R., 1999. Multi-site proton interactions withnatural organic matter. Environment International 25, 307–314.
Sokolov, I., Smith, D.S., Henderson, G.S., Gorby, Y.A., Ferris, F.G.,2001. Cell surface electrochemical heterogeneity of the Fe(III)-reducing bacteria Shewanella putrefaciens. Environmental ScienceTechnology 35, 341–347.
Thompson, J.G., Ferris, F.G., 1990. Cyanobacterial precipitation ofgypsum, calcite, and magnesite from natural alkaline lake water.Geology 18, 995–998.
Yee, N., Fowle, D.A., Ferris, F.G., 2004. A Donnan potential model formetal sorption onto Bacillus subtilis. Geochimica et Cosmochi-mica Acta 68, 3657–3664.
Zachara, J.M., Cowan, C.E., Resch, C.T., 1991. Sorption of divalentmetals on calcite. Geochimica et Cosmochimica Acta 55,1549–1562.


