Embed Size (px)
Citation preview
$TTITUDES TONARD SOCIALLY RESPONSIBLE CONSUMPTIONs
DEVELOPMENT AND VALIDATION OF A SCALE AND
INVESTIGATION OF RELATIONSHIPS TO CLOTHING
ACOUISITION AND DISCARD BEHAVIORS,
bv
Susan Helm_§tephensH
Dissertation submitted to the Faculty of the
Virginia Polytechnic Institute and State University
in partial fulfillment of the requirements for the degree of
Doctor of Philosophy
in
Clothing and Textiles
APPRUVED:
M. A. ZeZtner• Chairman
B. E. Densmore Z M. H. Marshall
’E.
F. Fern ; M. J. Norton
December 1985
Blacksbur9» Virginia
I
ATTITUDES TDNARD SOCIALLY RESPDNSIBLE CDNSUMPTION¤I
DEVELDPMENT AND VALIDATIDN OF A SCALE AND
.} INVESTIGATIDN OF RELATIDNSHIPS TD CLDTHING0gj ACQUISITIDN AND DISCARD BEHAVIORS
bv
Susan Helm Stephens
M. A. Zentner, Chairman
Clothing and Textiles
(ABSTRACT)
Environmental deterioration has been and continues to be a serious
problem in our consumer-oriented society. The ecologically detrimental·é)€
effects of clothing waste are often unappreciated even by those who at-L
tempt to practice social responsibility in other areas of consumption.
The purpose of this research was to examine the degree of social respon-
sibility exhibited by individuals in their consumption of clothing.
The specific clothing acquisition and discard (CAD) behaviors studied
were garment recycling. purchase uf secondhand clothingp purchase of
classic style apparel, and general olothing conservation. A 26—item in-
strument (CAD scale) was developed to measure attitudes toward these be-
haviors. The scale was subjected to two pretests using student samples
from VPI&SU and was analyzed by means of a computer program (PACKAGE)
designed to assess reliability and dimensionality. Construct validity
was evaluated by correlating the CAD scale with an established measure
I
of attitudes toward socially responsible consumption. Correlation with
a behavior measure was used to investigate the scale's predictive valid-
ity.
Data were obtained through the distribution of a questionnaire to a
sample of 405 shoppers at a Roanoke, Virginia, mall. Only questionnaires
with complete CAD scales (282) were used for analysis. This group of
respondents was divided into three parts. the top third was considered
to have favorable attitudes toward responsible clothing consumption and
the bottom third to have less favorable attitudes. Chi-square tests
compared the scores of both groups on clothing consumption behaviors.
sociodemographic variables, and media usage variables. Stepwise
discriminant analysis and correlation coefficients were also used tc ex-
amine the relationship between attitudes and sociodemographic variables.
The CAD scale was found to be a reasonably reliable and valid measure
of attitudes toward socially responsible clothing consumption as concep-
tualized. Respondents with favorable attitudes were older and had lower
incomes and higher education levels than those with less favorable atti-
tudes. They were also less inclined to be politically conservative and
more likely to be married and living with their spouses. They watched
more news and nature/wildlife television programs and fewer game shows.
They also read more literary and educational magazines.
ACKNONLEDGMENTS
I want to express my gratitude and appreciation to my advisor, Dr.
Mary Ann Zentner, Associate Professor of Clothing and Textiles, for her
guidance and unfailing encouragement during this study.
To the other committee members: Dr. Barbara E. Densmore, Professor
of Clothing and Textiles; Dr. Edward F. Fern, Assistant Professor of
Marketing; Dr. Mary Helen Marshall, Assistant Professor of Clothing and
Textiles; and Dr. Marjorie J. Norton, Assistant Professor of Clothing and
Textiles, I offer my sincere appreciation for their invaluable assistance
and support.
Special recognition and thanks is extended to Sharon Myers, Pro-
grammer Analyst in the Department of Statistics, for her time and exper-
tise, so generously shared in the final stages of this research.
I am most grateful to, a fellow graduate student, who worked long
hours during the summer helping with data collection.
To, my dear friend, who has spent time and money to offer
encouragement and advice, I offer my heartfelt thanks.
The gratitude and recognition that is due my parents for their help
in this and all my endeavors can never be adequatelv expressed. I am
forever in their debt.
iv
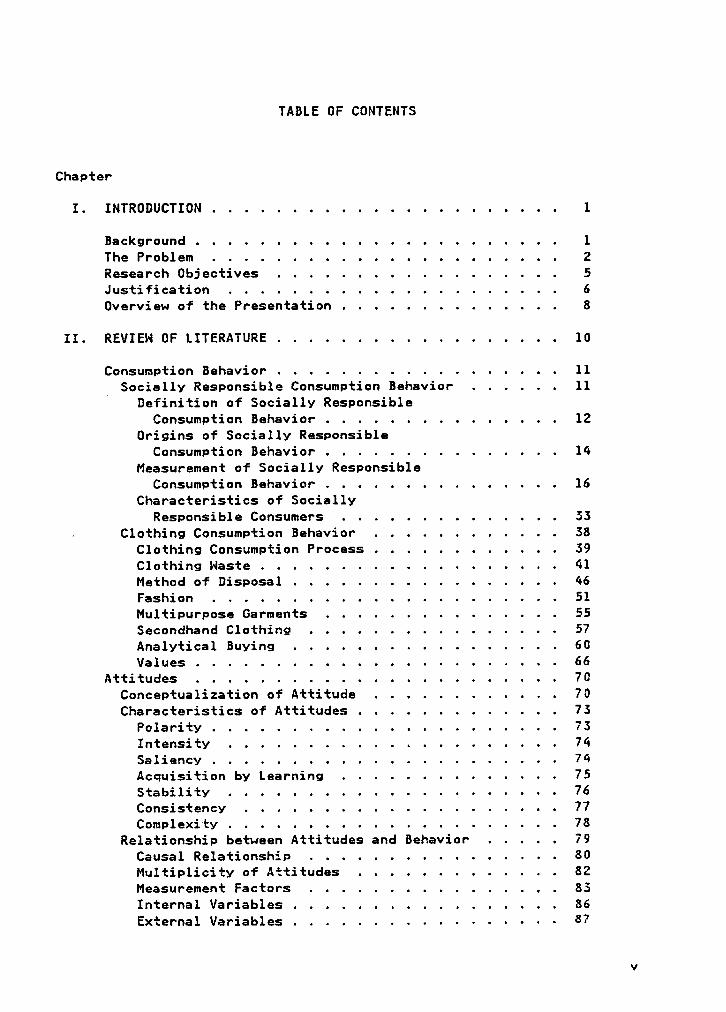
TABLE OF CONTENTS
Chapter
I. INTRODUCTION ...................... 1
Background ....................... 1The Problem ...................... 2Research Objectives .................. 5Justification ..................... 6Overview of the Presentation .............. 8
II. REVIEW OF LITERATURE .................. 10
Consumption Behavior .................. llSocially Responsible Consumption Behavior ...... 11
Definition of Socially ResponsibleConsumption Behavior ............... 12
Origins of Socially ResponsibleConsumption Behavior ............... 14
Measurement of Socially ResponsibleConsumption Behavior ............... 16
Characteristics of SociallyResponsible Consumers .............. 33
4 Clothing Consumption Behavior ............ 38
Clothing Consumption Process ............ 39
Clothing Waste ................... 41Method of Disposal ................. 46Fashion ...................... 51
Multipurpose Garments ............... 55Secondhand Clothing ................ 57
Analytical Buying ................. 60
Values ....................... 66
Attitudes ....................... 70
Conceptualization of Attitude ............ 70
Characteristics of Attitudes ............. 73
Polarity ...................... 73
Intensity ..................... 74
Saliency ...................... 74
Acquisition by Learning .............. 75
Stability ..................... 76
Consistency .................... 77
Complexity ..................... 78
Relationship between Attitudes and Behavior ..... 79
Causal Relationship ................ 80
Multiplicity of Attitudes ............. 82Measurement Factors ................ 83Internal Variables ................. 86
External Variables ................. 87
v
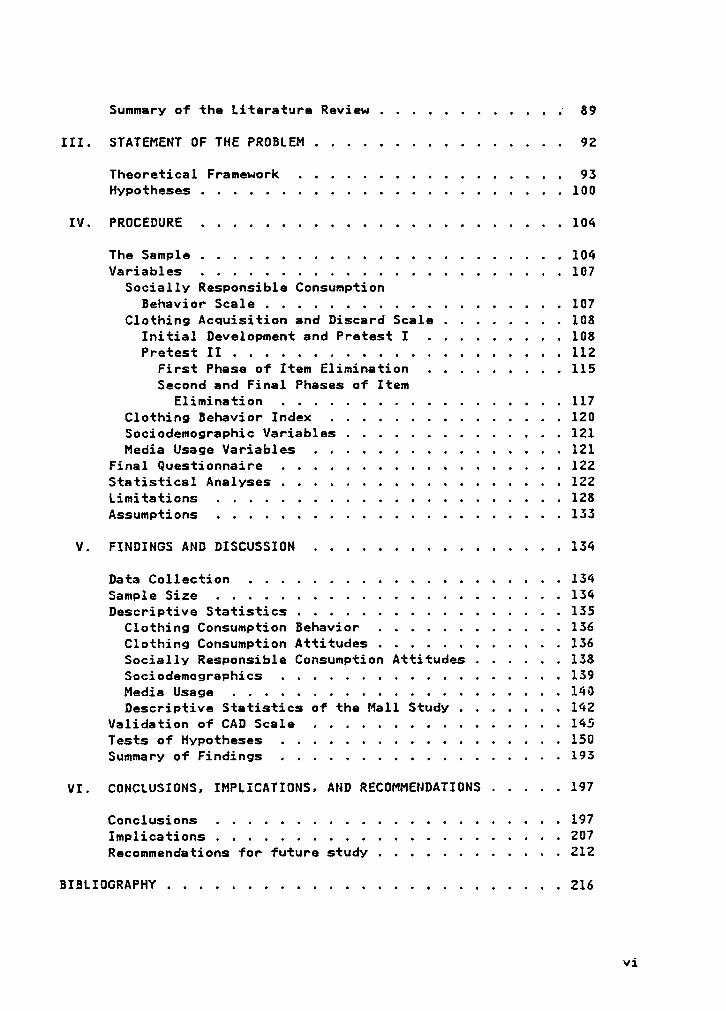
Summary of the Literature Review ............‘ 89
III. STATEMENT OF THE PROBLEM ................ 92
Theoretical Framework ................. 93Hypotheses ....................... 100
IV. PROCEDURE ....................... 104
The Sample ....................... 104Variables ....................... 107
Socially Responsible ConsumptionBehavior Scale ................... 107
Clothing Acquisition and Discard Scale ........ 108Initial Development and Pretest I ......... 108Pretest II ..................... 112
First Phase of Item Elimination ......... 115Second and Final Phases of Item
Elimination .................. 117Clothing Behavior Index ............... 120Sociodemographic Variables .............. 121Media Usage Variables ................ 121
Final Questionnaire .................. 122Statistical Analyses .................. 122Limitations ...................... 128Assumptions ...................... 153
V. FINDINGS AND DISCUSSION ................ 134
Data Collection .................... 134Sample Size .................... . . 134Descriptive Statistics ................. 135
Clothing Consumption Behavior ............ 136Clothing Consumption Attitudes ............ 136Socially Responsible Consumption Attitudes ...... 138Sociodemographics .................. 139Media Usage ..................... 140Descriptive Statistics of the Mall Study ....... 142
Validation of CAD Scale ................ 145Tests of Hypotheses .................. 150Summary of Findings .................. 193
VI.” CONCLUSIONS, IMPLICATIONS„ AND RECOMMENDATIONS ..... 197
Conclusions ...................... 197Implications 207Recommendations for future study ............ 212
BIBLIOGRAPHY ......................... 216
vi
I
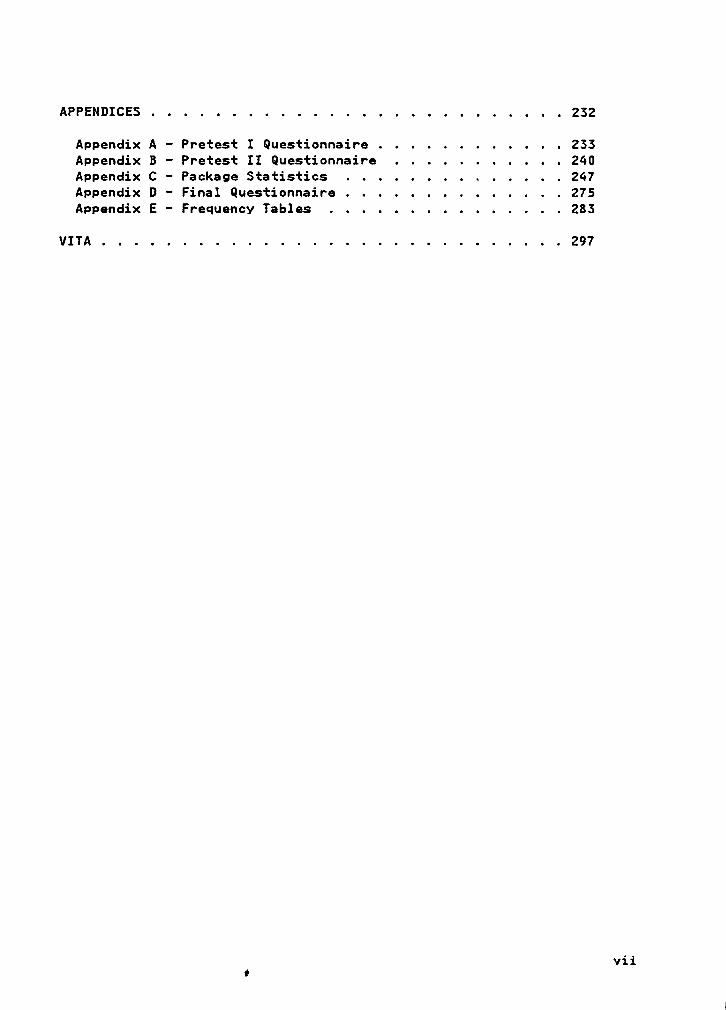
APPENDICES .......................... 232
Appendix A — Pretest I Questionnaire ............ 233Appendix B - Pretest II Questionnaire ........... 240Appendix C — Package Statistics .............. 247Appendix D — Final Questionnaira..............275Appendix E - Frequency Tables...............283
VITA.............................297
vii* I
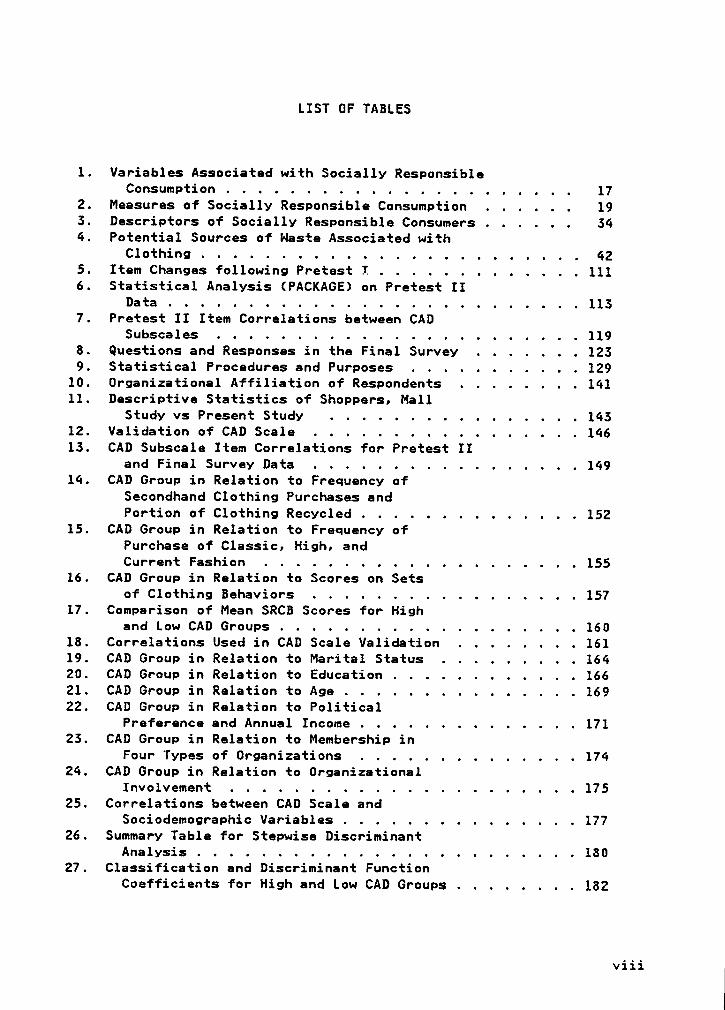
LIST OF TABLES
1. Variables Associated with Socially ResponsibleConsumption ...................... 17
2. Measures of Socially Responsible Consumption ...... 193. Descriptors of Socially Responsible Consumers ...... 344. Potential Sources of Waste Associated with
Clothing ........................ 425. Item Changes following Pretest I ............. 1116. Statistical Analysis (PACKAGE) on Pretest II
Data .......................... 1137. Pretest II Item Correlations between CAD
Subscales ....................... 1198. Questions and Responses in the Final Survey ....... 1239. Statistical Procedures and Purposes ........... 129
10. Organizational Affiliation of Respondents ........ 14111. Descriptive Statistics of Shoppers, Mall
Study vs Present Study ................ 14312. Validation of CAD Scale ................. 14613. CAD Subscale Item Correlations for Pretest II
and Final Survey Data ................. 14914. CAD Group in Relation to Frequency of
Secondhand Clothing Purchases andPortion of Clothing Recycled .............. 152
15. CAD Group in Relation to Frequency ofPurchase of Classic, High, andCurrent Fashion .................... 155
16. CAD Group in Relation to Scores on Setsof Clothing Behaviors ................. 157
17. Comparison of Mean SRCB Scores for Highand Low CAD Groups ................... 160
18. Correlations Used in CAD Scale Validation ........ 16119. CAD Group in Relation to Marital Status ......... 16420. CAD Group in Relation to Education ............ 16621. CAD Group in Relation to Age ............... 16922. CAD Group in Relation to Political
Preference and Annual Income .............. 17123. CAD Group in Relation to Membership in
Four Types of Organizations .............. 17424. CAD Group in Relation to Organizational
Involvement ...................... 17525. Correlations between CAD Scale and
Sociodemographic Variables ............... 17726. Summary Table for Stepwise Discriminant
Analysis ........................ 18027. Classification and Discriminant Function
Coefficients for High and Low CAD Groups ........ 182
viii
28. Classification Tables for High and Low CADGroups ......................... 185
29. CAD Group in Relation to Weekly Hours ofCommercial and Educational TV Viewing ......... 187
50. CAD Group in Relation to Frequency ofWatching Three Types of TelevisionPrograms ........................ 189
51. CAD Group in Relation to Frequency ofReading Four Types of Magazines ............ 190
52. CAD Group in Relation to Magazine ReadingScores and Frequency of Newspaper Reading ....... 192
55. Summary of Findings ................... 19554. Factors Positively Related to Antil's
SRCB Scale ....................... 20655. Mitchell's Characteristics of the
Societally Conscious .................. 208E·l. Distribution of Subjects with Complete
CAD Scales by Behaviors ................ 284E—2. Distribution of Subjects by CAD Scale
Responses ....................... 285E-5. Distribution of Subjects with Complete
CAD Scales by SRCB Scale Responses ........... 289E—4. Distribution of Subjects with Complete
CAD Scales by Sociodemographic andMedia Usage Variables ................. 291
E—5. Distribution of Subjects with CompleteCAD Scales by Frequency of ViewingTypes of Television Programs .............. 294
E—6. Distribution of Subjects with CompleteCAD Scales by Types of Magazines Read ......... 295
ix
I

LIST OF FIGURES
1. Clothing Consumption Model ................ 402. Disposition Decision Taxonomy .............. 473. Clothing Consumption Model with Disposition
Options ........................ 484. Schematic Diagram of the Theoretical
Framework ....................... 945. Theoretical Framework Operationalized .......... 101
L
CHAPTER I
INTRODUCTION
Background
During the early l970's, the ecological crisis was widely discussed,
and public consciousness of environmental issues was heightened by na-
tional events like Earth Day and the 1973 energy crisis. Criticism of
the American lifestyle was often severe. Lowry (1971) labeled Americans
~“pigs" for consuming 50% of the world's resources and generating 60% of
its pollution while constituting only 10% of the total population. Fisk
(1973) stated that, based on per capita consumption expenditures, one
U.S. consumer had an ecological impact 50 times that of a person from
India. In like manner, Pirages and Ehrlich (1972) discussed the shocking
environmental situation which would occur if one billion Chinese enjoyed
the standard of living available to U.S. consumers. They estimated that
one American used about 22 times as much energy as a Chinese citizen.
Thus an "Americanized" China would more than double world energy con-
sumption and engender a catastrophic reduction in the planet's capacity
to support life.
Although the crisis has not dissipated, public awareness seems to
have suffered a setback. Americans are occasionally shocked by reports
of toxic waste or vanishing animal species, but as a whole, they appear
disinterested in the long term problems of scarce resources and environ-
1
I
mental abuse. Many have been lulled into complacency, waiting for clearer
signs of environmental deterioration or expecting that technology will
provide a cure-all. Ecologists warn however, that many ecological systems
do not deteriorate gradually but maintain their basic integrity till the
point of collapse (Falk, 1971). Others caution that technological
progress, 'although encouraging, cannot keep pace with the problem
(Faramelli, 1971; Nicosia & Mayer, 1976).
The ecological issue is not foreign to the apparel field. Economic
waste in clothing is not only accepted but encouraged through routine
fashion changes and status factors. As Kelley, Geiger, and Bailey (1975a)
suggested, "clothes may offer an opportunity for acquisition and change
of material goods when more expensive long term consumer goods such as
housing and home furnishings are priced out of the family's budget" (p.
50). In fact, clothes are "changed" so often that many are discarded long
before they are worn out. Over three billion pounds of obsolete and wcrn
apparel end up in municipal waste each year. Agencies like Goodwill are
inundated with discarded clothing, most of which they are forced to throw
away (Batelle, 1972).
The Problem
Several problems are imbedded in the ecological crisis. The most
obvious are related to the consequences of environmental abuse, but others
center around its causes. Still others involve the difficulties inherent
in finding·solutions to the dilemma.
2
I
As indicated, the environmental effects of ever increasing consump-
tion by a constantly growing population are massive and multiplicative.
Humans need air, water, minerals, food, and energy to survive; yet human
pollution and waste of these resources have led to their increasing
scarcity. Consumers in the U.S. have set a precedent in wastefulness and,
as representatives of a prosperous postindustrial nation, serve as models
for citizens of developing countries. Worldwide communication systems
have ensured that our consumption practices are a matter of global sig-
nificance. Unfortunately, emulation of the American lifestyle by other
peoples would exacerbate an already critical situation by further in-
creasing resource depletion and pollution. With a finite reservoir of
resources, one country's level of living inevitably affects that of oth-
~ers. Continuation of the present pace of human growth and consumption
portends a collapse of the global ecological system and seriously
threatens human survival.
The causes of environmental deterioration are perhaps not as obvious
as its consequences. The central issue is social responsibility, or ac-
tive concern for the welfare of society as a whole. Individual consumers
are at the heart of the problem since their values not only affect per-
- sonal behavior but also drive economic and political systems. The
consumption—oriented lifestyles and insatiable materialistic appetites
prevalent in this country reflect cultural standards which have evolved
from American families and individuals. In the words of political phi-
losopher Russell Baker, "The American Dream is to convert goods into trash
as fast as possible” (cited in Faramelli, 1971, p. 226). Consumer5 Ü
activists who have tirelessly advanced the causes of consumer rights and
consumer education have often failed to address consumer responsibility.
The concept includes responsible individual consumption as well as col-
lective consumer pressure on manufacturers, marketers, and policy makers
to exercise social responsibility in their decision making.
Businesses have frequently taken a short·sighted approach to profits,
ignoring the long term effects of their decisions. For years, economists
have maintained that externalities, environmental or otherwise, must be
considered in the costs of production. Many marketers, through their
product and promotion strategies, have encouraged irresponsible consump-
tion and a throw·away mentality. Recycling of products and packages has
received relatively little emphasis, and few channel systems exist to
„ accommodate this reverse distribution of goods.
Public policy makers also share in the environmental problem. A
traditional role of public servants is the regulation of social and en-
vironmental externalities. Performance of this function has varied from
assiduous to negligent. Environmentalists have condemned the lack of
business regulation and/or inadequate enforcement of existing laws.
Protection measures such as control of product designs or sales volumes
and taxation of non-recyclable or luxury goods have been largely ignored
by government. The anticipated resistance of business and consumer sec-
tors to government interference in the marketplace highlights the need T
for public officials to educate their constituency concerning the sever-
ity of the problem and the necessity for drastic solutions.
4
A final facet of the ecological dilemma has to do with market seg-
mentation. A problem that originates with human behavior requires an
understanding of people for its solution. Identification of socially
responsible and nonresponsible individuals has been the subject of much
research in the field of marketing. These investigations have concen-
trated primarily on goods with a clearly established environmentally-
preferred option, such as nonphosphate detergents or soft drinks in
returnable bottles. Findings have indicated that an ecologically ori-
ented market segment exists for such products. Nhether this ecological
consciousness extends to apparel is another question and the subject of
this research.
Research Objectives
The purpose of this research was to examine the degree of social
responsiblity exhibited by individuals in their consumption of a specific
product, clothing. The researcher sought to provide a better under-
standing of socially responsible clothing consumption so that such be-
havior could be encouraged and related resource problems alleviated.
Several specific objectives were defined:
l. To understand the attitudes and behaviors in-
volved in clothing waste and their relationship
to socially responsible consumption.
2. To develup meeningful measures to assess these
attitudes and behaviors.
5
5. To determine the characteristics of consumers
who exhibit these attitudes and behaviors.
Justification
Solutions to the environmental situation will not be easy. Tradi-
tional remedies such as financial incentives, appeals to civic pride, and
local government restrictions are unlikely to have any significant im-
pact. Lowry (1971) pointed out that the monumental character of pollution
will not be solved bv backyard cleanups or neighborhood litter campaigns.
Radical, but probably infeasible, solutions such as a maximum limit on
family expenditures or a tax on the volume and type of household trash
have been mentioned (Carlsen, 1975; D'Arge 8 Hunt, 1971). Most experts
agree that the most effective solutions to the environmental crisis would
incorporate an alteration of consumer values and attitudes. People must
learn to be happy with less. Unfortunately "less" is often equated with
a lower level of living. Janice Hogan, an authority on household energy
conservation, preferred to call it a "redefinition of how we live"
(Grossman, 1979, p. 5). Other terms include "joy of frugality," "volun-
tary simplicity," "conserver society," and "postindustrial consumer"
(Boulding, cited in Paolucci, 1978; Elgin 8 Mitchell, 1977; Shapiro, 1978;
Stampfl, 1978). The essence of these concepts is responsible consumption.
Individuals who exhibit social responsibility in consumption are a
key element in fighting resource abuse and ultimately in preserving the
quality of life and maintaining human survival. Groups who service or
6 T
T
seek to service these people should be interested in research which helps
to identify and characterize socially responsible segments. For example,
home economists are in a position to help responsible clothing consumers
act on their ecological concern by providing training in garment recycl—
ing, recognition of garment value, wardrobe planning, and shopping in
secondhand markets. In addition, home economists, separately or en masse
through national organizations, can carry the consumer perspective to
policy makers at all government levels. Enterprising marketers and man-
ufacturers may wish to capitalize on ecological appeal as a selling fea-
ture. Kassarjian (1971) noted that the market potential for a good
product with an ecological edge is impressive. As consumers become more
aware of the relevant issues, environmentally compatible products should
become more profitable, and the importance of a positive corporate image
with respect to this and other social issues will increase.
An even larger market segment is comprised of individuals with a
moderate to low sense of responsibility in consumption. Different ap-
proaches are necessary for addressing this group since their attitudes
end values must be changed first. The intervention of business into the
realm of social problems, once hotly debated, is now widely accepted and
often expected. Thus businesses may be asked to devise ways of ”sel1ing"
ecological issues as well as ecological products. Similarly, government
officials may need to cultivate demand rather than accept it as a monopoly
condition in the same way that AMTRAK and the postal service were salvaged
to substitute for more wasteful alternatives (Fisk, 1973). Educational
programs will be needed to raise the ecological consciousness of the un-
7
I
concerned or unaware segment. For home economists, education will gen-
erally focus on changing family attitudes and practices. The family, as
the primary environment for developing attitudes, values, and goals,
should be a potent agent for social change in the future (Paolucci, 1978;
Paolucci & Hogan, 1973).
It is hoped that this study will be helpful in identifying responsible
and nonresponsible consumers and thereby provide the means for govern-
ment, business, and other interested parties to communicate with them.
Communication with nonresponsible consumers might attempt to alter unfa-
vorable attitudes and behaviors through education, public announcements,
advertisements, or other means explaining the merits of "voluntary sim-
plicity.” Appeals to responsible consumers might seek to elicit their
assistance in spreading their consumption ideas to others.
. Overview of the Presentation
The research presentation is organized into six sections. The next
chapter reviews the related literature and elucidates the issues, con-
cepts, and research methods germane to the topic of interest.
Chapter III develops the theoretical framework for the study, based
on the literature review. Research hypotheses are proposed to guide the
investigation.
1
Chapter IV describes the research procedure, including the measure-
ment instruments and the techniques used in their validation. Sampling
and data collection methods are also explained. Finally, procedures for
statistical analysis of the data and evaluation of hypotheses are delin-
eated.
The results are discussed in Chapter V. The sample delineation,
descriptive statistics, and method of data collection are presented. The
reliability and validity of the CAD scale are also evaluated. Each hy-
pothesis is tested, and the findings are compared to those of related
studies.
The final chapter presents the conclusions and implications of the
study. Recommendations are offered to those who may' wish to conduct
further research on this topic.
CHAPTER II
REVIEW OF LITERATURE »
The root of the ecological problem is the profligate behavior of
individual consumers. Hence, a review of relevant literature should focus
on consumption behavior and its motivators. Specifically, examination
of socially responsible clothing consumption requires an understanding
of two subsets of consumer behavior: socially responsible consumption
behavior (SRCB) and clothing consumption behavior (CCB). This chapter
starts with a discussion of SRCB in an attempt to determine its nature,
origins, and correlates. Techniques for measurement of the behavior are
analyzed to gain insight into the difficulties and advantages of various
methods. Next, selected aspects of clothing consumption behavior are
considered to gain some knowledge of the process of clothing consumption
and the factors which contribute to clothing waste.
As powerful antecedents of behavior, attitudes provide an avenue for
determining the causes of past behavior and predicting future behavior.
Thus an examination of the definitions and dimensions of attitudes is
undertaken to see how they function. In addition, the relationship be-
tween attitudes and overt behavior is explored in an effort to explain
attitude-behavior inconsistencies and to provide a means for avoiding
similar contradictions in this study.
10
Consumption Behavior
Usually consumer behavior centers around market purchase and
acqui—sition,but consumption in its broadest sense includes not only acquisi-
tion of goods but also their use and disposal. Jacoby, Berning, and
Dietvorst (1977) said that consumer behavior involves the "acquisition,
consumption, and disposition of goods, services, time and ideas by deci-
- sion making units" (p. 22). As previously mentioned, the present study
concentrates on two sections of consumption behavior. First, socially
responsible consumption behavior is reviewed. Research related to this
topic provides insight into the attitudinal origins of responsible be-
havior as well as techniques for measuring it. The literature also sug-
gests a set of psychological, demographic, and behavioral characteristics
which identify the socially responsible consumer and help in developing
a parallel profile of the responsible clothing consumer. Second, clothing
consumption behavior is discussed. Studies on the characteristics and
practices of apparel consumers provide guidance for defining and charac-
terizing socially responsible clothing consumers and for formulating hy-
potheses regarding their behaviors.
§og;ally Responsible Qonsgmgtiog Behavior
It is beneficial to initiate the discussion of SRCB by defining the
t
concept hnd its possible origins. Although most definitions are similar,
operationalizations of the construct vary widelyt Numerous measurement
instruments with differing levels of reliability and validitv have been
Till
used in SRCB research. Not surprisingly, considerable diversity also
exists in the characteristics of consumers identified bv these measures.
Qefjgjtjgn gf §ocially Resgonsiblg Qgnsumgtion Bshsgigr
Individuals who are concerned with the societal consequences of their
consumption patterns have been labeled:
1. The socially responsible consumer is one whose "behaviors andpurchase decisions. . .are related to environmental-resource prob-lems and are motivated not only by a desire to satisfy personalneeds, but also by a concern for the welfare of society in general"(Antilp P, 5),
2. The ecologically-responsible consumer is a consumer who "re·cognizes the 'ecological imperatives' or ecological impact of herconsumption behavior" (Nelson, 1974, p. 5-6).
5. The ecologically concerned consumer is "a person whose values,attitudes, intentions, or behaviors exhibit and reflect a rela-tively consistent and conscious concern for the environmental con-sequences related to the purchase, ownership, use or disposal ofparticular products or services" (Henion, cited in Henion, II,1982, P. 282).
4. The socially conscious consumer is one who "takes into accountthe public consequences of his or her private consumption or whoattempts to use his or her purchasing power to bring about socialchange" (Webster, 1975, p. 188).
5. Responsible consumption is the "rational and efficient use ofresources with respect to the global human population" (Fisk, 1975,p. 24).
With allowances for differences in wording, the foregoing definitions
embody essentially the same idea, socially responsible consumption. All
describe a personal consideration of the consequences of consumption be-
havior in relation to a system of living organisms. Webster (1975) ex-
12
panded his definition to include not only private consumption but also
the use of purchasing power to effect social change. Although the defi-
nitions imply that personal needs as well as societal needs are consid-
ered, Antil's (1978) definition is the only one that specifically refers
to individual needs.
Despite the similarities in definitions of the socially responsible
consumer, there has been some confusion over nomenclature in the past.
The terms appear to have much in common with the ”traditional socially
responsible persona1ity" originally conceptualized by Berkowitz and
Daniels (1964). These researchers developed an 8-item Social Responsi-
bility Scale (SRS) which was later used by Berkowitz and Lutterman (1968)
to formulate a profile of the traditional socially responsible person.
The "traditional" individual showed a willingness to help others even when
no personal gain was expected and tended to be conservative in values and _
politics, middle class, educated, and involved in the community.
Application of the Berkowitz-Daniels SRS to the area of consumer
behavior was first attempted by Anderson and Cunningham (1972) in their
research on the socially conscious consumer. Subsequently* Anderson,
Henion, and Cox (1975) perceived that a difference might exist between
socially and ecologically responsible consumers. In their study, par-
ticipants in a local ecological organization were designated as
ecologically responsible consumers and individuals scoring high on the
SRS measure were classified as socially responsible consumers. Compar-
ison of the two groups across attitudinal and demographic variables in-
15I
dicated that the two measures identified clearly different consumer
segments.
Nebster (1975) employed the SRS measure again in his research. Using
two additional measures of social consciousness, an ecological consump-
tion behavior measure and membership in a recycling service, he discovered
a distinct difference between the consumer described by the SRS and the
one described by the other measures. In his opinion the SRS was outdated,
overly traditional, and in need of revision. Thus much of the confusion
over terminology that exists in the literature seems to be the result of
attempts to relate traditional social responsibility ‘to personal con-
sumption patterns, e.g., using the SRS to predict the socially conscious
consumer. Nith that exception, future reference to the ”socially re-
sponsible consumer" will be understood to encompass both ecological and
social responsibility/consciousness as described in the literature.
Most studies on socially responsible consumption do not go beyond a
simple definition of the concept. However, consideration of the internal
motivation for responsible behavior might contribute to a richer and more
useful understanding of those who practice it.
Qrigjgg gf §ocially ßggggggiblg Qoggumgtion ßehgyjgg
As the preceding definitions indicate, SRCB refers to concern for-
others which implies that the behavior is derived from a basicallyÄ
altruistic nature. Indeed there is a considerable body of literature
14
concerning other-directed behavior variously termed social responsibility
(Berkowitz & Daniels, 1964), altruism (Krebs, 1970), prosocial behavior
(Bandura & Walters, 1963), helping behavior (Berkowitz, 1966), and
unselfishness (Bohannan, 1963).
In his review of literature on altruism, Krebs (1970) highlighted a
terminology problem. Definition of the concept entails the establishment
of intentions behind the unselfish, other-directed action. Researchers
have skirted the definitional issue by (1) assuming that the altruistic-
appearing antecedents of behavior were the corresponding motivators (op-
erational definition) or (2) assuming that the attributions of others
concerning the behavior were the motivators. Krebs summarized the problem
by sayingz
The definitional problem which involves the status of altruism asa dependent variable, has attracted very little attention from re-cent researchers. They have generally been content to assume thatbehavior that seems altruistic is altruistic, and to concern them-selves with its determinants (p. 262).
Nith these limitations in mind, the altruistic individual is generally
seen as one whose compassion for others leads to unselfish conduct, in-
volving some degree of sacrifice and little personal gain.
Another way of viewing the socially responsible consumer is not from
a standpoint of altruism or concern for others but from a perspective
based on reasonableness and practicality (another term might be effi-
ciency). Perhaps individuals who exhibit socially responsible behavior
do so because they have reasoned that it is the only way for them to derive
1
maximum satisfaction from life or ultimately to survive on a planet with
a rapidly increasing population. This is not to say that they have no
compassion for others, but rather that it is not the driving motivation
behind their ecological actions.
Reason, according to some definitions, means saying "no" to oneself
and being willing to forego instant gratification. Philosopher Peters
(1974) referred to this quality as transcendence of the particular, which
allows actions to be governed by beliefs about past and future events
rather than immediate circumstances. Thus, reasonableness may account
for much behavior which seems to provide little reward to the perpetrator,
such as ecologically oriented behavior. In fact, it may provide a very
valuable rewardr the pleasure of a self·discip1ined, simple life as op-
posed to one of excess and extravagance.
Although the motivating force behind responsible consumption has not
been investigated per se, many studies consider both attitudes and be-
havior in their measurement of the SRCB cunstruct.
Measurement of §ggiall¥ Rgsgonsible Consumgtion ßehavior
Numerous methods have been employed to measure social consciousness
in consumption. Table l reflects some of the attitudinal and behavioral
variables that have been used. Validity and reliability assessment of
the measures was not always available. In some cases, there appeared to
be no attempt at validation; in others, the information provided was un-
16
I
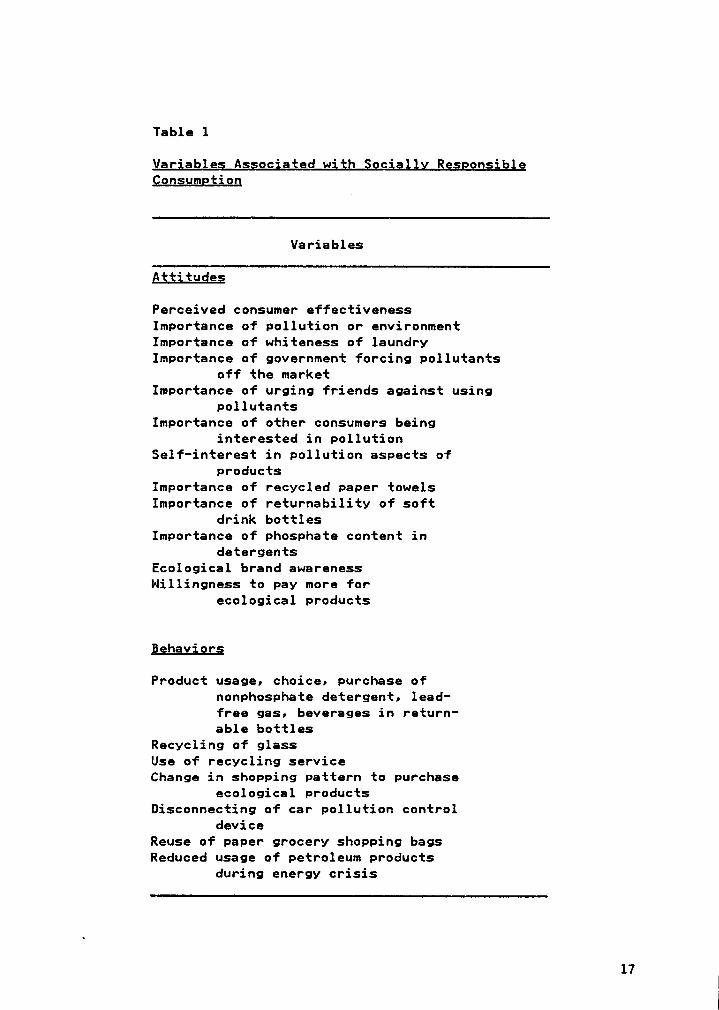
Table l
Variable; As;gciated with §ocjg1l¥ ResggnsjbleQgn;umgtiog
Variables
Atijtuges
Perceived consumer effectivenessImportance of pollution or environmentImportance of whiteness of laundryImportance of government forcing pollutants
off the marketImportance of urging friends against using
pollutantsImportance of other consumers being
interested in pollutionSelf-interest in pollution aspects of
productsImportance of recycled paper towelsImportance of returnability of soft
drink bottlesImportance of phosphate content in
detergentsEcological brand awarenessNillingness to pay more for
ecological products
Behavigrs
Product usage, choice, Purchase ofnonphosphate detergent, lead-free gas, beverages in return-able bottles
Recycling of glassUse of recycling serviceChange in shopping pattern to purchase
ecological productsDisconnecting of car pollution control
deviceReuse of paper grocery shopping bagsReduced usage of petroleum products
during energy crisis
17
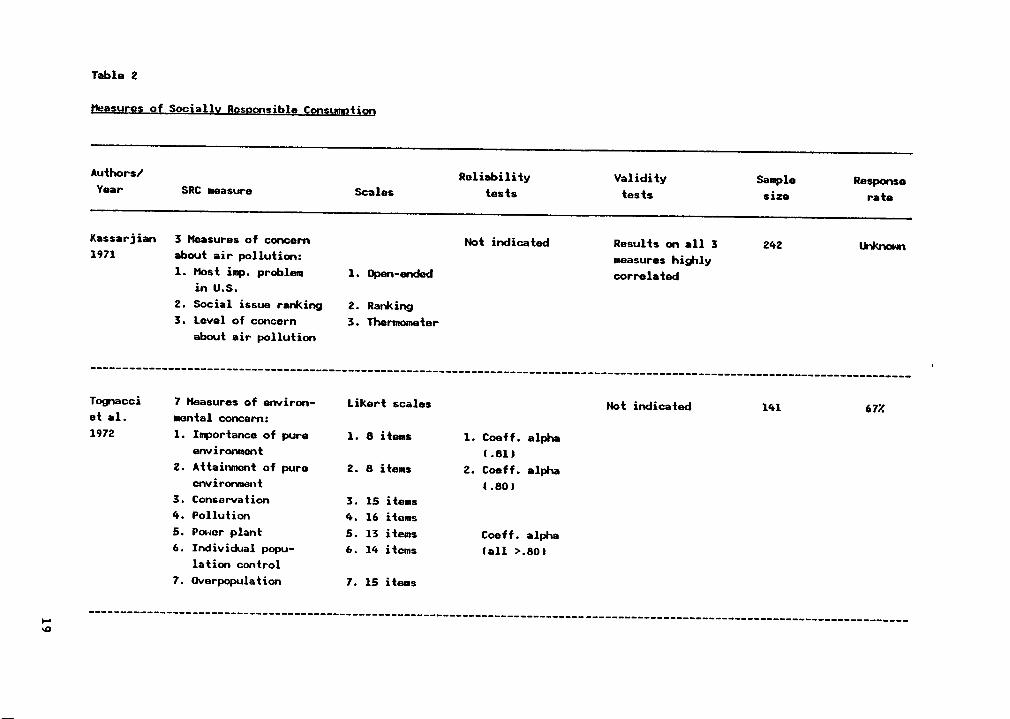
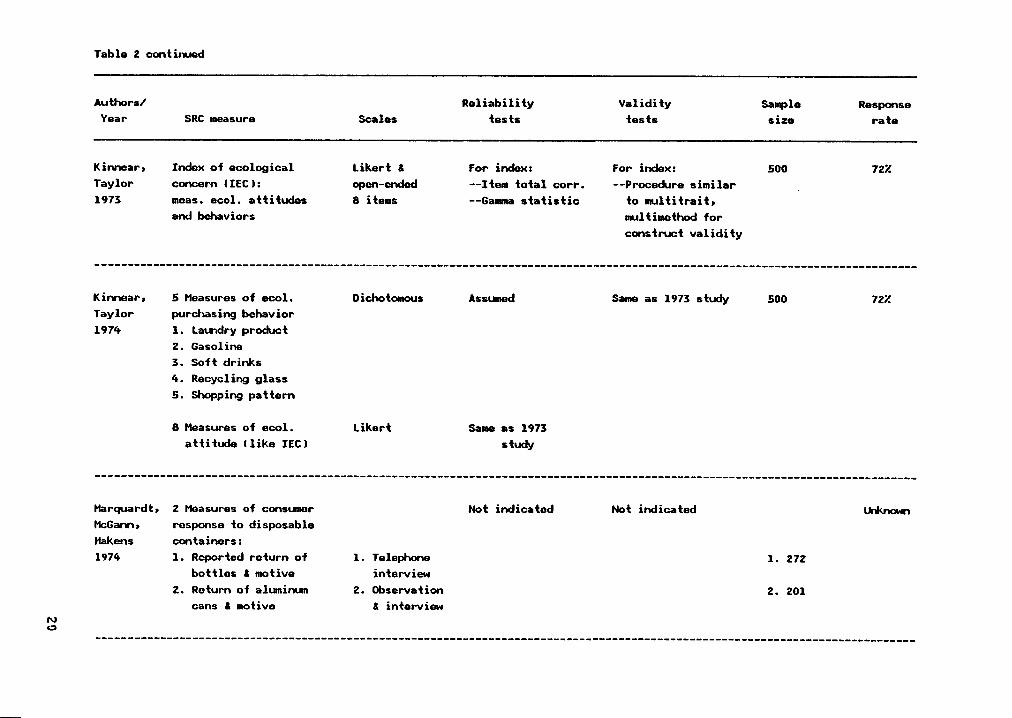
clear. Table 2 provides a summary of the instruments used in SRCB re-
search.
Kassarjian's study (1971) on concern about air pollution is one of
several which used attitudes alone as an operational measure of environ-
mental concern. Interviewees were asked three attitudinal questions:
1. Name the most important problem facing the
country.
2. Select from a list the most important problem
facing the country.
5. On a thermometer scale (0 - 100) indicate your
level of concern about air pollution.
These three measures were highly intercorrelated and produced very simi-
lar results when processed separately. Thus, for ease of presentation
lKassarjian only published data related to the first question.
Reizenstein, Hills, and Philpot (1975) classified consumers according
to their (1) willingness to pay for improvement of environmental condi-
tions and (2) degree of understanding of the term "recycle." "Nillingness
to pay" was determined by questionnaire, and level of awareness or
understanding was ascertained through personal interviews.
Using a questionnaire composed of seven Likert scales, Tognacci,
Neigel, Nideen, and Vernon (1972) attempted to determine the extent of
concern about environmental quality. Opinions were solicited from sub-
18
I
II
I2
II
§-2I
IEI
NI
WI
up
sI
:Ä
I[
II
[I
[I
[I
[I
[I
|
I0
II
•-IOI
HI
NN
I~t
III
I2
*22
[I
[I
[I
[I
II
I2:I
EI
IE-I
EE
5.:%
Ill
II
0I
>‘
II|'*‘
[••1
Iga
ÜIÜ
NI
ma
n·••I..•-I
II
II:2*38
···
2==iI
IIIE
··2
[I
II
II
II
|
II
ÄÄ
Ҥ*
Ic
EI
TITI
'IIII
>•I
·'
'^I
*0-
:·1:E
2S
‘!S·
I~2
anI
g—
Q-
U""
[Q
-HI
_I
-•«*‘
I•
NI
•-•2
I•'*
I0
II
°‘I
II
I0I-
IZI
'm
wVI
'I
TIIII
IIII
QI
ug
E°I°
'“°«
IQ
••¤~•·I-•·I·•*I
IN
*‘‘°'
""""""
"‘I
IIII
"'"‘
°°‘In
~¤
m¢
VII
IIS
22
}I
*6·=¤
<=¤-······•"*
"‘I
"I
ä·
-···‘
I:I
•~
•°
IIIW
uup
fN
ÜÜ
{A
F.
I
4*·
I[
II
IIII
2)[
II
0Ä
5..ä;g
Ä5
§I
ä.
5il
Üu
sr!
GE
:I.¤
-«II-I
„..¤
05
_„,,„
,I
-••u
jg
SC
S.
I4u
·•¤N
,
UI,..[g
_0
II
gg
go
äI
O°g
.°
,,,.¤[.«
••I
N„4
Q_
‘B{
III“
uv&
•°‘
Iz'°‘
°"S8
_I
°3
¤¤
··•I'!';F,.,„.•
Is0
¤_
g·;_
§3
,?,I5
.?..„;
IE
§"$°'Z»‘?_§I
ä—
·§z:ä
ä6
äE
*äg
IVI
IIlll
I
-Ico
II•IIu
0.¤
•-•—•
TI'·’
Ää
gm
me
-In{
2-E
,-.“
‘
'''°
°I
.¢
_,.
I'
G;
Me
m;
Ng
°‘n
ä-I
~~
II
""
IIh
{E
cI
°II
I*6
Ix
;I
_“
IIl
EI
°:·„E
0::
Ié
IIII
=I2
=2
>-
xp
.I
I-
192
III
II
I
I'
I1
I1
SU
~I
I
ät;*1
1'“
E1
~·“'“
11
1
I
I
I
II
I•¤I
II
Il'¤
I
I
1ev
°‘1
I
°·
I
11
I-·
“1
Q1
S1
1
EJ
3I
-11I
I
'ZII"
I
II
12I
1
1
I
'I
3*1
I1
11——
1i
11
1-1I-?
1
17
1
1TI
13
1
I~
‘
I
I
aß
1
1
1
IIZ
1""
1
0**1
°‘
1'E
1
nll>
·"'a
·".§«
13
I.1.
I
:1.§~2—
-11
111
1
-Q-1-1,„
8°*'*
S1
21
1
Lsg
gg
gu
1N
11
gn
.tn
1
1
gv
gl
I
1
I
>1
gI
11
1
I
I
I
I
1
I
II
I
'
·¤
{.2I
I0
I
·•·°I
VI1
'*‘
I
8:11
2·
11
···t;1
'"II
‘”1
I
wlw
I
I
>><2*
1"“'
1"
1
*'
·•¤
E-III
Iäsg
II
QI
.,1111.,1111
I
1I
AQ
·•1•N
IÜ
1
I
gv
Lyq
ßI
I
I
.111Q
1!
1‘
11
.-1“.II
1
1
I
ß
I
I11n-H
I
u
1
1I
·'
Ill1
1Z
Z;
I
I„
IG
lou
nn
I
11
·-1'•E"
1
I
I1
21
•·Ig
_
1
°‘M
I*°
0I
-N;
1
2*;.5
I·§
5I
"I
-11
1g
·•;1
...·'
1
1
1¤
II
-·$“·1
11
EI
‘·I'·2
§I
1
°I
gg
IIII
111
,„
,,1.
1-II"
1g
g:·1-*
31
Io
vQ
°I
I
1-1
ԤI
zu
gv
IQ
.2W
av
I
II*,
I>
•¤l*
'1••
Ig
,'U
"•·*•-2
1
IJ.,1
1g
ßa
¤"
1•--1I
¤..n
01
"‘••1•
1·c
ga
¤"
1°v1
¤‘”
••I
1g
gg
N1
$‘°
”°s·:§
E1
111·3
8"¤
I>1€·-:*1.-1
•¤‘§I
=3
2g
*·3
ä·
s1111132
13
21
-:'°1
.1¤
§-,·
•3
···„'°$
¤1
1I
31•;·'21°>
Ig
-;,·'§¤
;§·§
gg
;1
11
§3
¤1
1¤
=°
1
111Q
,0
1M
I,
I
I§
·gS
é1
°$¤
EI;
Iä
ää
-E~
I111
'I
·¤E
.§§$‘EI
mg_„_,„111„1·1I11
In,,1
11
2**
11
I
I
IL
-I
ZSI
IQ
"'I
g1
C·
I·1I.~:1
1c
···s
1~·¤1;1»
·
N11
111-1
1g
f:-•
‘1...91111
1Z
";I
¤•.211
>I~
1·•*".-1
1
*3g
gm
g:
1¤¢I"
1
11*;<
"
20I
II{{
{
IN
1E
”
E{
{
I
I
I
I{
{
II
Iq
lq
nl
I
QIQ
I
3N
{°¤
"{
2In
I
**-*1
cI
§.ß
”°
I
¤~
}ltII
L
Id
elm
l
2
23
-·2
“
{
{{
{
I
I{
{
I
I{
{
141%*·
2
E2
E
•1•
,¤
2**
IIIz
gg
21
;
2
gQ
IO
I
Q2
2>
2«
22
2
Mci:
ä_
1-E
1
“.••
O,.,&
>
1-••
1
*1-su
mu
'W
1
1
,0
'^.2
~!:
1·•
*
1
2.
*2%
;:%:ä
I
22
2
s„·I;'•·§
°1
v.
III
1
1
1.N
.
.9-*:
"!
2E
E
GIn
l'
-•·•III
-1-1
-Q·¤
W1
1
1
2%E
·$“'E
E2
E
2**=‘
E2
2
>
cg
1-··•
1
°‘!·—·
"2
2
2/I8
Im
I
'IoQ
I
I
.._g
>•_
ä.5
}"‘
{
21
11
""III
12
1
I:@1
„
22
“,.I
1
1
1112.
I
I
;,,,1•
II
>•
“°••-I_
1
1
:-=%
2¤
22
#2:%
&2*
2§
2
••1
°
•;-(I
1
2~·#
2-*
22
2
„1«udä
E§
E
-22
22
§?
EE
2
2%
2
2
GII,.
1II
1
I*:~·
¤
:.2
2
IL
FIV
I
äß
EI
LI
gg
I1
LI
nä
•°
O·"
I
__
8'Q
TJII
U-
:*L
02
Z,
I
äcN
«•4
I
-*,.1
80
vo
mg
__
I
21
,,,-2
21
81-1
_¤q
13
1
N1
°¤
I3
:I
*‘u1
°
I
1l
I
I,
.,22
I
od
!
I
I5Q
'·g
_1
-I
UIN
‘I
~"..<
¤",g
¤2
*3%
**
{3
5,,,:
Q
111
=°
WIII
1
„••
7],
I-
{
\0N
I-•-•'“
.2**v2Z
•-I¤>'
·¤<
N1-
IIIIIIIIIIII
:
I
IN
I
:2
:
I
I
I
I
E
I
I
E
I
E
m
I}2
I
Q
III
Im
I
gg
ü
I
I
*‘
I
I
2
:
:
[0gg
I
I
“
E
I
E
E
IB
I
Z
I·•·
I
I~
:§
:
0
.
-,2
I3
I
Erw
I·"
I
I3
{·•~¤
I
:2
E
„,
E
E
2;
I
E
I
I
JI
I
I
I
I
E
IE
I
.•·•
I,,,,
I
Bü
·•·•
_
I
,-1**
I,„g
I
3::
2
2
:3
:
%*
8
:-~
:
>
,_,
{-••
E
2
:2
I
2
E
é
:
I
ä,•1
Ü
I
I
••¤•I•
I
=
IE
”‘ä
I
IG
I
-9
I
C
•
ZW
5
I"‘
~
I
=·‘*
I--
:
A
«:
32
E?
I
*6
;
Q.··
㤤
I
g0
•"
I
Uq,-•••
I
‘I‘°
X
g
N>
‘
CI"!
I
U
IIIIII
•
L
I
··
I2E
E
*
,1A
II
”:=5
§
E
,,,4,g
U
I
PI
I
Sg
;)
In
L,•1
'*•
—
I-U
0
lg
9:
I
°‘°€‘I'g
E
I‘-Zä
§-·•-
I
·<‘äg*?’¤
:§·.:
~
:
q,1
·3;_
,.äg
•2é
‘I
I
Q2
-I
I
-•
U'E
„-I1-·"‘I
+•
I
'
"‘v
I'
zI
I
§..„§
g·"‘Z
;·„1¤
:"‘
:
*8
2„_
22
::“’g
6_§_,,„
22
:§·;;I2
‘•‘§§
°‘
;,·3«
•g;•$
.••"‘
'
C*"";"'
0
0§
.·•
NI
Iqv•·;‘¤
,
I.
I•_
,8
,g
_
IN
•
3
3·m
I_
,•
=
UI
Wo
N
IQ
0
0**.
Ig
22§"
:
ä
NI
In
Q L*‘!
gL
I>·
ä=
0
Il„
IE:
ü
<'3I!
IIIIII
E
II{IS
E
{
IO
S
I{'Z
I?
{
{°
{
I
I
I
I
I
I
I
lg
I
I
I
I
I
I
I
I
I
I
I
I
I
I
E
E
E
I
In
-
I
E
E2
E
I
I
{
{
{
{
3II
{
{
{
¢·
I
I
I
§.2
I:
I:
:
E
22
ll-E
I
I2
I
$'3
{
{
{8
{
I-u
IZ
I
I.-
I
IncI•
·I
I
I
I
~¤-7
I
I-E
I
um
III
In
-
I
M
>•III
I
1:
I
I
0
··I·I
IN
I-I-
I
I-I3
>I&
nw?
I-••
I
I
EI.-
·•-
'¤
IIII
I2
I
III
.•w.••
.•wI•'I
I0
I
I
'¤II
-·-I
In
-
I
I
.•·IL
g>
•I
I
I
S
I-IIII0
InI
IE
I
I
III·'·0·I-I
In
-
I
I
1I'J
I9I$
"$ä
-'ES
III
I
I
0
·+
•·L
¤.•«
I
I
I
•-4
3*S
|\/0+
*)
I
I
I
UG
--!-O-•
·•-I
UI
I
I
EI~
L
¤.·
•-S
LI
Ing
I
L5
·0•«
Qu
I
I·•-I
I
--3
*••••-I-•¤I„¤
I
I
IN
I
II
¤I•
·II••0
IIII
I
IO
I
-•-I
:I7L
—
I
In
-
I
I
IE
I
LI
I
I
I
)
SI.-
BI
I
II-
I
I·•I
I
'UIII
I-II
I·•w
I
0I•
I-IIII
<
I8
I2
UI':}
.""°'
-{
II
{
"'{‘6
g
.·
=·:1 I
.•w
I
·••-2
II
L••-·••
erA
I
I
.••0
I
‘3
"'
I"I
2
I-1
·III¤
¤~
g0
I
I
0--I.-,¤
I
·~
A
.•·-cu
-I
I
ga
;/I
II-I
-*2-°
ga
"?
{
ä{
"‘
I
I
JN
I
-•·•,•w•-I0
:
I
-••I¤•z
I
•
I>•
LE
-I0
-I
I
Ilz
I
I-I
IQ
>I
NG
LI
I
zu
I
I
I
0-I-
I
I
.-·•-•-•
I-II
I
0-v
c
I
I'§°
I-IIII
I-III
I
IIISI-I
I
I
IS-3,2
I
I
I':
"
{
-°‘
{
{
Z:
II
I
I-I
I
Im
0
Ing
I
I
Q
IQ-
¢
ME
I
II-IS
II-I
II§¤I-I·•
I
I0
Gl
S-t"'
{
3{Ԥ
3.3
{S
3$
"‘¤E
{
{
"'IIE
{II.-
3.2
{If
I-IO
n-I
I
äu
I
IIE.
UI
0¤I·-I
·
I
III
I*•-I/I
IC
••-I-I
·¢
I
IL0
IOS
-•I
IG
\•II‘I
I-I
§0-1I
UEI.!
UI
·N
II!
-vI
IIIIn
••-II!
III
Q
gg
-I
I,•-1
I4-
IG
S-IN
L
I-V
-I
lg
*8
0
IL
OO
QI
I-
I
••-
EIS
.-U
II
III
In
o¤
¤I
IIIIUII4
·I0
I
III·I-III.-
I0
g_
AIIL
ug
Itg
gä
fä
IIN
II:
"‘-S"'
{ES
I-
°°'{
{
Su
é
I3I•
•3
%.¤
:
I
L
lg
¢·—·„.:
==
:rI*8
“
III
-°
III
••-,-1
Q
I§
5•
I
•~
=-g
g
IIR
I
Q
I
I-I
I)
mn
§«
*S°
I0
I
Qu
-
0
U
0
IN
li
0•<
L
0
-•·••-I
I
IL
I!-I
:.2
•·IU
I
IE
!
IIIO-Ig
ß
I
I
5
Q
0II-
I
I
2
L
äIII,¤
+•~
·
IL
I
3
'S'6
-2"·
IG
II
+•·I·•>
•~I·
I
~¤
EL
.--
{“
In
I
1:
·••
2·
*·.I
*-Ԥ=
*‘
III="
Ü*5*
*"
<lgI-
QI
Ina
Iä-P
NN
IN
¢I¤
Iu
Lh
mIIIII
IIIIII
|Q
LII-
II
QL
IIII
IS
GI-
PI
•••IO
I
2*"’I"
IIE
2:1
:1
:13
}I-
IQI
I-III
>Ic
·•-II
*8
.•«I
••4U
I'¤
••|
«•-IQ
I
ISI';1
äI
wa
>-I
I‘¤
>I
U-.:**2
IT
I>•
---0-*rlg
äI
0*'
@Ö
'VÖ
LI
-I-I••-IM
0-*0
-*
II.•
IuI
In·•·•
SI
·•-•-e
mL
I¤
.L
Ig
eIö
I·.I.—•·•-U
n.:
I+'
ILI
IIIIII
,Q
I·•·•
IIQ
•••>
II
·••
····ä
12
2ääß
*61
··-I-
--2C
I2
•*I/I
QIԤ
Lg
*-*
IN
•-•·•·•U
0Q
*I!I
I.•Iu
Zg
·•·'+•m
••-eu
IL
-00
IhO
-**6*3
0*
I0
IU¢
*·•··w
¤-
•I
-•-.«
L;-
Iu.I3
-Q
L.
I0
•-IO
III
II
G0
IL
III
II
lbIIIIIIII
erI
vl
18*.1
I831
I2ä
qI
fc
dn
tI
-IN
IIII.
III,·
...I
:1?·s
1..
.2g:§=·1
.:50
QI
00
0U
*EIA
I8
0L
InZ
0%
Ivl
••-Ig
gm
uu
I‘•·
o.¤u
sw
I0
0I
°·
IL
u-4
0U
>·•*5
NI
B0
ZIIIQ
,·¤•
-•·•I
08
InI
wfg
·•·•:
IU
Ä-:L
.¤w
·••uI
II-!I
§1
NII
UL
LI-I
I•-I
go
---0I
-5G-
*8:2
22
I1
2I-
<<
•-II
na
241
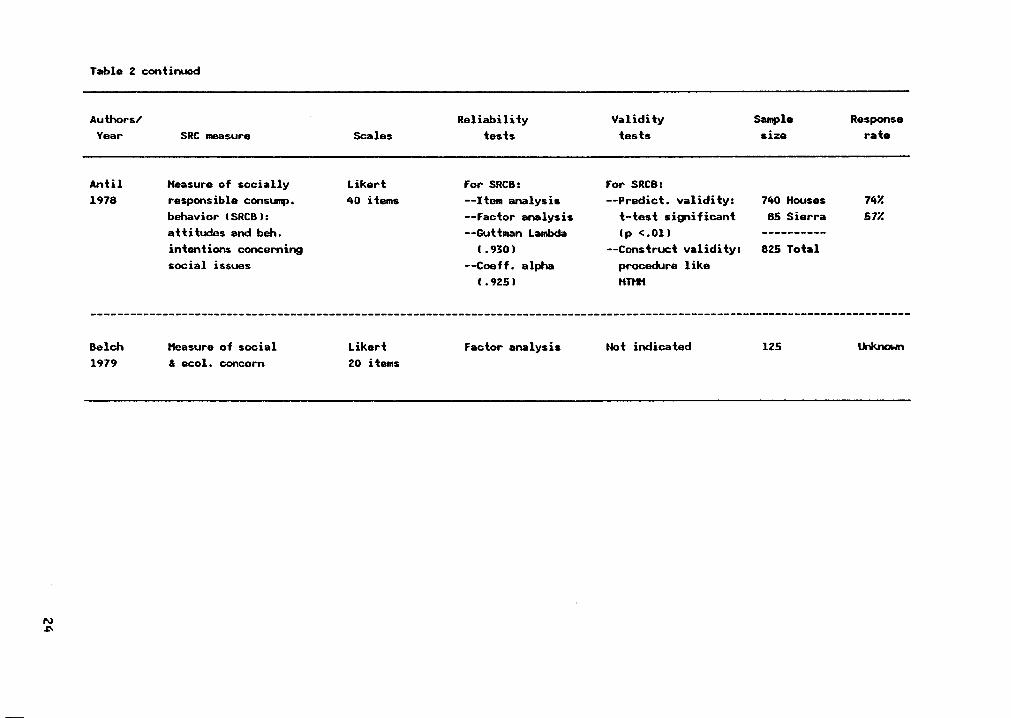
jects concerning the country's performance in realizing selected envi-
ronmental goals and the importance they attached to those goals. More
specific environmental attitudes were determined by means of five sub-
scales: conservation scale, pollution scale, power plant scale, indi-
vidual population control scale, and overpopulation scale. All seven
scales were found to be internallv consistent, with coefficient alphas
of .80 or greater. Intercorrelations between scales were also generally
high (most greater than .40). The highest correlations were among the
five specific environmental scales.
Belch (1979) developed a shorter scale of social and ecological
concern. His 20-item instrument measured concern on several dimensions
including air, noise, and water pollution; energy resources; littering;
and physical health. Factor analysis was performed to assess the re-
lationship between subscales and yielded seven factors accounting for
97.7% of the total variance. The factors in order of explained variance
were: energy, air pollution, exercise, noise pollution, water pollution,
personal habits, and attitude toward additives. A Total Concern Index
(TCI) representing the respondent's overall cumulative score was also
calculated end correlated with each of 406 statements of attitude, in-
terest, and opinion (AIO) to determine which variables best described the
concerned consumer.
Most investigators have tried to include a behavioral component in
operationalizing the socially conscious consumer construct. Frequently
behavioral measures are represented by several questions concerning ac-
25

tual behavior. Kinnear and Taylor (1973) explained their rationale for
including behavior in their 8-item Index of Ecological Concern (IEC):
Obviously, verbal expressions of concern are not enough. Likewise,it is possible for· a consumer to purchase in an ecologically-concerned manner without being aware that he is doing so. Thus thelevel of ecological concern a person demonstrates will be a functionof both his attitude and his behavior (p. 191).
The behavioral portion of the index was composed of two questions dealing
with respondents' purchasing practices relative to products low in
pollutants. Statistical analysis of the index included calculation of
the gamma statistic, which summarized the relationship between index
components, and item—tota1 correlations which were used to eliminate
items not strongly related to the total index. The researchers also at-
tempted to assess the construct validity of the measure using a procedure
similar to that of Campbell and Fiske (1959).
Another facet of the same study by Kinnear and Taylor (1976) compared
scores on five behavioral measures with scores on eight attitudinal
measures. Behavioral items dealt with ecologically constructive purchase
behaviors in the following areas: laundry products, gasoline, soft
drinks, recycling glass, and shopping patterns. Responses to these
questions were generally dichotomous in form. The attitudinal measures
included six questions from the IEC and two additional items concerning
perceived consumer effectiveness and willingness to spend money for non-
polluting products. Validity and reliability for the attitude measure
were tested as described above. The researchers assumed that responses
T26T
T
to the behavioral questions were true statements and therefore did not
assess validity/reliability for that section.
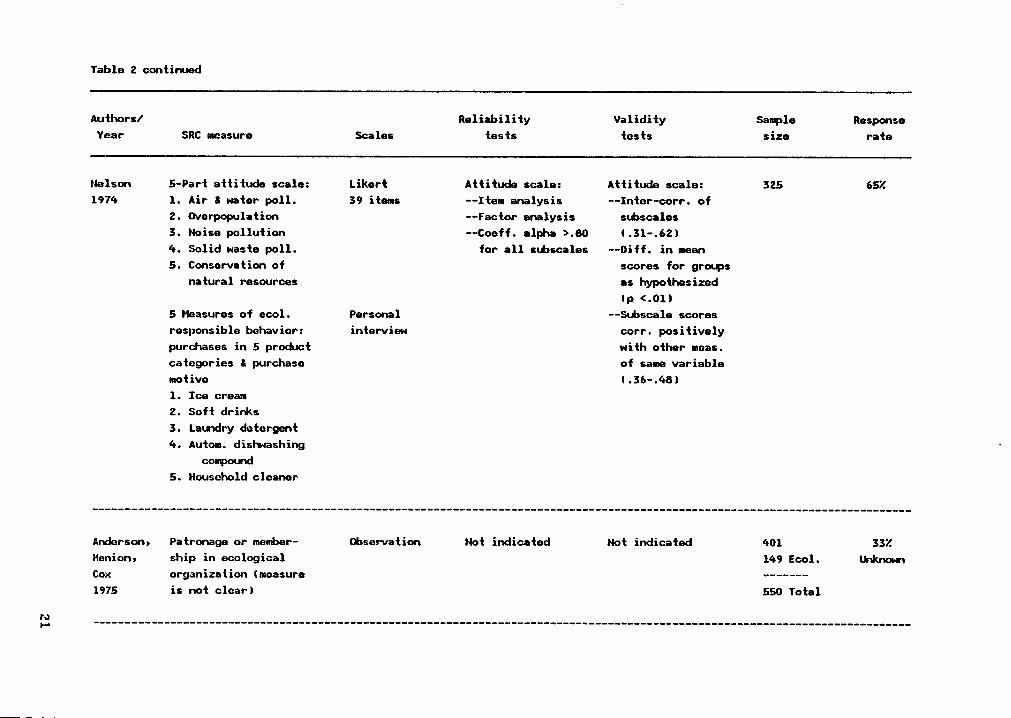
Nelson (1976) also classified ecologically-motivated consumers based
on their past purchases of five ecologically-preferred products and their
reasons for purchase. In addition, he administered a lengthy survey to
ascertain attitudes on a variety of environmental issues. To construct
the attitude scale, a pool of 119 items was combined with items from eight
personality scales (making 192 in all) and pretested on a group of 282
students. Item analysis was performed to determine which items to elim-
inate, and factor analysis was used to verify the unidimensionality of
the resulting subscales. A minimum coefficient alpha of .80 was achieved
for all subscales. The final instrument was composed of a total of 59
items in eight factors or subscales. ·
Nelson (1976) evaluated scale validity in three ways. First, since
the set of subscales was to be a measure of attitudes toward the envi-
ronment, each subscale was expected to be significantly correlated with
the others. Intercorrelations were generally moderate, ranging from .51
to .62, with an average correlation of .69. Second, comparison of mean
scores was made to determine if the attitudes of ecologically responsible
and nonresponsible housewives differed as hypothesized. The difference
in mean scores was statistically significant beyond an alpha level of .01.
Finally, subscales were supposed to correlate positively with other
measures assumed to measure the same construct. A pastoralism scale,
which measured "an appreciation of and sensitivity to the primitive na-
27
1
tural environment, and a desire to preserve it" (McKechnie, cited in
Nelson, 1974, p. 44), was used for this purpose. Correlations between
subscale scores and pastoralism scores ranged from .36 to .48.
As can be seen, Nelson (1974) exerted considerable effort to establish
the validity and reliability of his measure, with fairly good results.
In addition, he endeavored to avoid the social desirability factor by
asking respondents their opinion of the research purpose. After analysis
of those who correctly identified the purpose of the study, Nelson de-
termined that they differed attitudinally and behaviorally from those who
guessed incorrectly. Thus he decided to delete the correct guessers from
the analysis to improve the validity of the results.
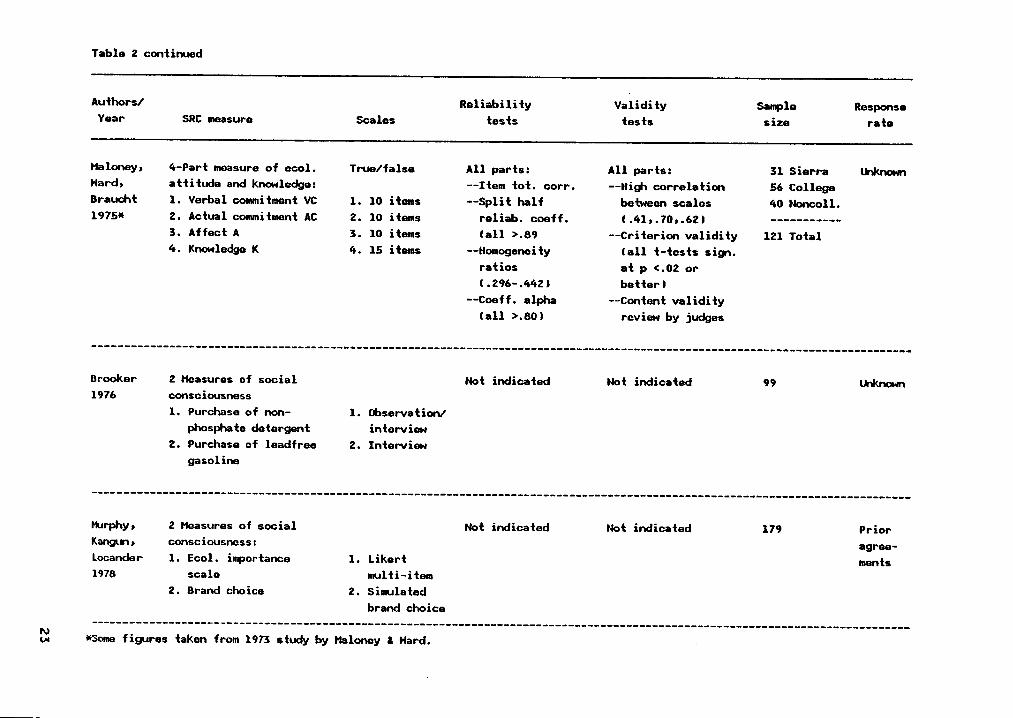
Maloney and Ward (1973) developed a 128-item Ecology Scale composed
of four subscaless verbal commitment (VC), actual commitment (AC), affect
(A), and knowledge (K). Although the investigators did not refer to
Fishbein in their article, his concepts of intention, behavior, attitude,
and belief roughly correspond to the four subscale descriptions (Fishbein
8 Ajzen, 1975). The measure was later refined and shortened to 45 items
making it more practical to use as a research tool (Maloney, Ward, 8
Braucht, 1975).
A pool of 500 items in the original scale was reduced to 128 after
a review by judges. For the revised version, another 83 items were
eliminated by item—tota1 correlations (for the VC, AC, and A scales) and
by deletion of geographic or time specific items (for the K scale).
TzaÄ
Scott's homogeneity ratio (A = .358, VC = .296, AC = .442) and Chronbach's
alpha (A = .846, VC = .805, AC = .888) were calculated and indicated a
fairly homogeneous and highly consistent measure. Correlations between
the scales (.70, .41, .62) showed strong interdependence but less than
in the original scale. The instrument was tested on three groups: (1)
college adults, (2) noncollege adults, and (3) Sierra Club members. Using
a series of post hoc Duncan multiple—range tests, all subscales were able
to distinguish among the three groups at p = .05 or better.
Perhaps the most rigorously constructed measure advanced to date is
one developed by Antil (1978). This 40-item measure used a 5—point Likert
scale to assess sccially responsible consumption behavior (SRCB). Pro-
cedures followed in construction of the scale were similar to those later
suggested by Churchill (1979). The initial pool of 124 items was drawn
in part from the scales of Maloney and Nard (1973), Nelson (1974), and
Tognacci et al. (1972). The scale items were divided in half and pre-
tested on a convenience sample of 444 university' students. Based on
pretest results, items were eliminated in three stages using item-total
correlations and factor analysis. The remaining 59 items were combined
and pretested on a second sample of 382 students. Subsequent item anal-
ysis eliminated another 17 items from the scale. After a final pretest
using 98 nonstudent adults, two more items were dropped, leaving a scale
of 40 items.
The final SRCB scale was mailed to 1000 households participating in
a consumer mail panel and to 150 members of a Sierra Club chapter. Re-
29
sponse rates were 74% and 572 respectively. The scale was found to have
excellent reliability using Guttman's Lambda 3 (.930) and Chronbach's
coefficient alpha (.925). Factor analysis in both the pretest and na-
tional survey indicated that the SRCB construct was predominantly
unidimensional, an indication of the scale’s logical validity. "Known
groups" validation was performed using the Sierra Club sample. Signif·
icant differences between mean scores of the national sample and the
Sierra Club group indicated that the scale had predictive validity. To
measure construct validity a variation of Campbell and Fiske's
mu1titrait·multimethod technique was used. The SRCB scale was found to
have convergent validity and some degree of discriminant validity.
In two investigations, simulated shopping trips were used to classify
individuals according to their level of environmental concern. Herberger
and Buchanan (1971) used illustrations of detergents containing various
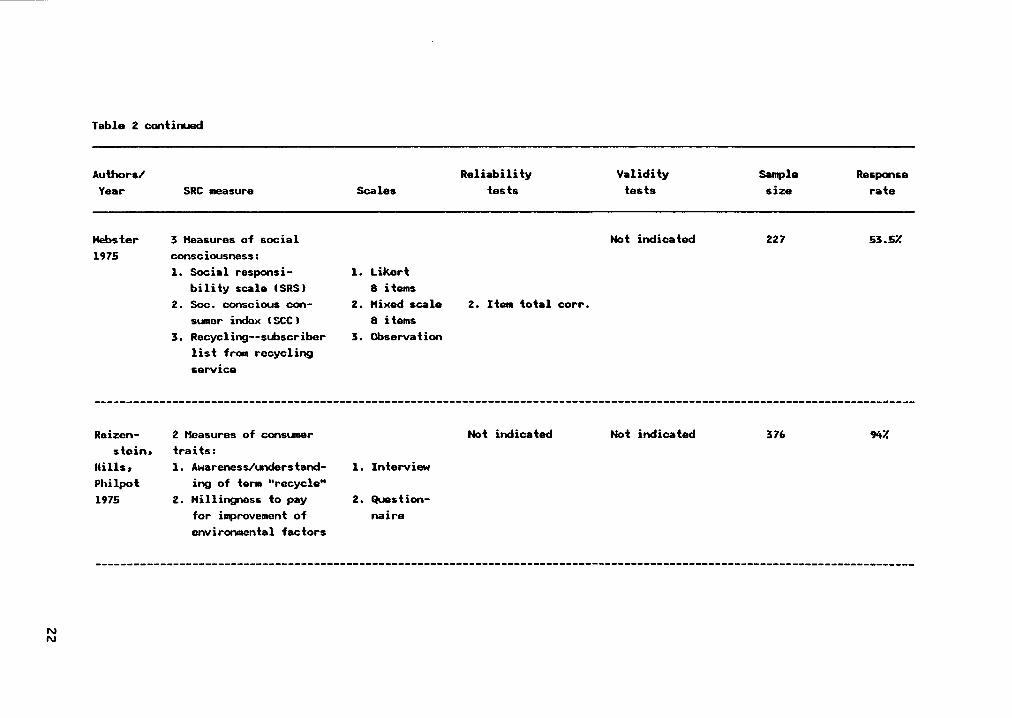
amounts of phosphate and soft drinks in returnable and nonreturnable
bottles. "Customers" were directed to make selections from among the
illustrated products. Brooker (1976) conducted a brand choice exercise
to determine if subjects would select the environmentally correct brand
of soft drinks, i.e., those in returnable bottles.
In all of the previous studies, behavior was meesured by a survey
technique which relied on respondent se1f—report. Departing from that
pattern, Webster (1975) used observation as an alternate method. His
"recycling" measure simply noted whether or not the individual subscribed
to'a reycling service. After obtaining subscription information from a
30
1
local recycling business, Webster precoded the questionnaires so that
subscribers were clearly identified. Studies by Marquardt, McGann, and
Makens (1974) and Anderson, Henion, and Cox (1975) also used participation
in an ecological organization as a measure of ecological concern.
Webster's technique had the additional advantage of unobtrusiveness since
none of the participants were aware that their recycling activities were
being recorded in this manner.
Webster (1975) developed another self-report behavioral measure which
consisted of eight questions about respondents' past purchases and con-
servation practices. Item analysis on the SCC scale produced correlations
of .65, .59, .59, .55, .46, .56, .18, and .02. Scores on this scale were
compared to those on the recycling measure and the Berkowitz-Daniels So-
cial Responsibility Scale. As indicated earlier, the degree of corre-
spondence between the three dependent variables was not high. In his
conclusions, Webster was undecided as to which measure, recycling or SCC,
was a more valid measure of buyer behavior. The SCC had the advantage
of a larger number of items, but the recycling index was a better measure
of actual behavior since it utilized direct observation.
A few studies monitored actual consumer shopping behavior to deter-
mine levels of ecological concern. At four different supermarkets (two
in high—income areas, two in low-income areas), Henion (1972) observed
customer response to information on the phosphate content of various de-
tergents. One test and one control store were designated for each income
level. In test stores, detergents were labeled as to their phosphate T
51
level and arranged in order of phosphate content. To control for con-
sumers' natural preference for brands with higher numbers, detergents in
the control stores were labeled as to their share of the market and ar-
ranged in order of increasing market share. Comparison of market shares,
for each brand under each condition, revealed that consumers responded
favorably to ecological buying information by buying more low-phosphate
detergent. This trend was observed in both high- and low-income stores.
Brooker's (1976) research used a combination of observation and self-
report. Subjects who were seen buying or reported buying either lead-free
gasoline or low-phosphate detergent were designated as ecologically con-
scious consumers.
Overall, measurement of the socially responsible consumer has been
conducted largely through surveys designed‘to assess attitudes, behavior,
or both. In a few cases, direct observation was used to measure the de-
pendent variable. _Researchers' efforts to pretest or validate their re-
spective instruments have ranged from minimal or no validation to fairly
rigorous scale construction and testing. In this respect, Antil's SRCB
scale appears to be the most carefully derived measure.
Having discussed measurement of responsible consumption, attention
will now focus on the relationship between SRCB and other variables of
interest. An objective of much of the research in this area has been to
identify the distinguishing characteristics of the responsible consumer. Ä
S2
Qhagggjgristicg gf the Sogially Resggngiglg Cgnsumeg
The descriptor variables analyzed in connection with the socially
responsible consumer (SRC) include a varied list of demographic, behav-
ioral, socioeconomic, and psychological factors. In Mitche1l's (1983)
extensive survey of American values and and lifestyles (VALS), he devel-
oped perhaps the most detailed profile of the "societally conscious" in-
dividual in terms of demographics, attitudes, financial status, activity
patterns, and consumption patterns. Although results differ, most
studies have found psychological factors to be better predictors of so-
cially responsible consumption than demographic variables- (Anderson,
Henion, 8 Cox, 1975; Antil, 1978; Brooker, 1976; Kinnear, Taylor, 8 Ahmed,
1974). Table 3 shows some of the descriptors most commonly found to be
associated with socially responsible consumption. The table indicates
that agreement on the direction or even the existence of the relationships
depicted is far from universal. To provide a better understanding of the
SRC's characteristics, a few of the traits listed in the table, and others
not shown, will be discussed in the remainder of this section.
Environmentally conscious consumers have been found to be incon-
sistent with respect to the ecological concern they exercise in their
purchasing behavior. Fritzsche (1975) found that none of the Better Life
customers (recycling organization) consistently chose the environmentally
positive alternative when faced with six purchase decisions. The majority
of customers were environmentally consistent in indirect "purchases,”
such as a bond issue, but inconsistent with regard to direct purchases.
33
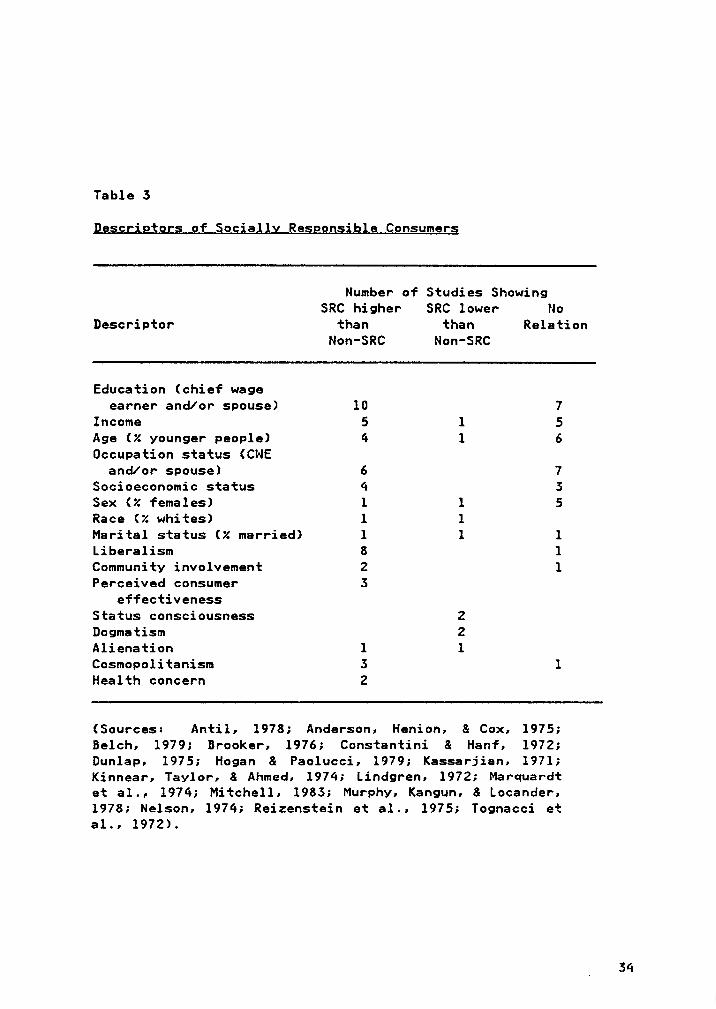
Table 3
Qesgrjgtggg gf Social}! Responsible Consumer;
Number of Studies ShowingSRC higher SRC lower No
Descriptor than than RelationNon-SRC Non-SRC
Education (chief wageearner and/or spouse) 10 7
Income 5 1 5Age (Z younger people) :4 1 6Occupation status (CNE
and/or spouse) 6 7Socioeconomic status 4 3Sex (Z females) 1 1 5Race (Z whites) 1 1Marital status (Z married) 1 1 1Liberalism 8 1Community involvement 2 1Perceived consumer 3
effectivenessStatus consciousness 2Dogmatism 2Alienation 1 1Cosmopolitanism 3 1Health concern 2
(Sources: Antil, 1978; Anderson, Henion, 8 Cox, 1975;Belch, 1979; Brooker, 1976; Constantini 8 Hanf, 1972;Dunlap, 1975; Hogan 8 Paolucci, 1979; Kassarjian, 1971;Kinnear, Taylor, 8 Ahmed, 1974; Lindgren, 1972; Marquardtet al., 1974; Mitchell, 1983; Murphy, Kangun, 8 Locander,1978; Nelson, 1974; Reizenstein et al., 1975; Tognacci eta1• r •
T
_ 34
The findings agree with Maloney and Nard's (1973) contention that where
ecology is concerned, people tend to have high levels of verbal commitment
and effect but lower levels of actual commitment and knowledge. These
and other findings indicate that ecological concern is often dependent
on the particular product or situation involved (Brooker, 1976; Herberger
8 Buchanan, 1971; Murphy, Kangun, 8 Locander, 1978). In general, the more
costly the environmentally-preferred product is in terms of personal en-
ergy, time, or money, the less likely consumers will be to select it.
Perceived consumer effectiveness is a measure of the subject's belief
that an individual consumer can have an impact on environmental problems.
Nebster (1975) found that this variable was the only significant predictor
of all three of his dependent measures (social consciousness). Other
studies corroborated the strength of the relationship between perceptions
of effectiveness and consumer social responsibility (Antil, 1978;
Kinnear, Taylor, 8 Ahmed, 1974). Apparently when consumers feel that
their actions can actually improve environmental conditions, they tend
to score higher on measures of ecological/social concern.
According to the Brooker (1976) study, those who are socially con-
cerned tend to be more self-actualized or interested in realizing their
full potential. A related concept, locus of control, was explored by
Henion end Nilson (1976). Internally controlled persons are those who
perceive that their rewards are a direct result of their own efforts.
This definition has much in common with the idea of perceived consumer
effectiveness discussed earlier. Findings of the Henion and Nilson study
35
I
revealed that the SRC is generally more internally controlled than con-
sumers who are less socially responsible.
The role of education in ecological consumption is not clearcut.
Several studies revealed a direct correspondence between socially con-
cerned consumers and their level of education (Anderson, Henion, 8 Cox,
1975; Hogan 8 Paolucci, 1979; Mitchell, 1985; Nelson, 1974; Tognacci et
al., 1972; Nebster, 1975). Others noted the lack of any association be-
tween two variables (Antil, 1978; Brooker, 1976; Kassarjian, 1971). Re-
searchers seem to agree however, that knowledge of environmental problems
is an important characteristic of the SRC. This idea is intuitively ap-
pealing since people are seldom greatly concerned about something they
do not understand. Reizenstein et al. (1975) measured subjects' awareness
of air pollution by noting their understanding of the word "recycle" and
found that awareness was related to willingness to pay for improved air
quality. Regrettably, society's level of ecological knowledge appears
to be low (Kinnear, Taylor, 8 Ahmed, 1974; Maloney 8 Nard, 1975). None-
theless, when individuals are supplied with relevant information, con-
sumption can be favorably affected (Henion, 1972). Socially responsible
consumers are therefore generally more informed about environmental
problems than those who are less responsible.
The issue of race has received little attention in SRC literature.
In one study, middle- and upper-class white women, when compared to black
women of the same social standing, exhibited a significantly higher level
of ecological sensitivity in their product preferences (Murphy et al.,
56
1978). Marquardt et al. (1974) observed that more black and other mi-
nority racial groups returned aluminum cans to redemption centers, but
the Primary motive was economic not ecological. The variance between the
findings of the two studies points to a potential confounding factor in
research related to ecological activity. The economic status of the re-
spondent and the monetary costs/benefits associated with a particular
activity may greatly overshadow environmental concerns.
A sizable number of consumers seems to be willing to pay for im-
provement of the environment (Kassarjian, 1971; Kinnear & Taylor, 1974;
Reizenstein, et al., 1975). Many people are also willing to return soft
drink bottles for a monetary refund. However, Marquardt et al. (1974)
found that even with higher deposit rates, some consumers are not moti-
vated to return bottles for redemption. Convenience is an important
factor where money and ecology are concerned. Consumers seem to be more
willing to improve the environment by forfeiting money than by foregoing
convenience. In the case of soft drink bottles, convenience was more
important for some consumers than either money or environmental quality.
As a springboard for his research, Webster (1975) proposed a "social
involvement model" which described the socially conscious consumer as:
a person who is in a good position in terms of income, education,and occupation to contribute to the community and his self—conceptallows him to take an active role. He acts in a manner consistentwith his attitudes, playing an active role not only in organizedactivities but also in his individual behavior as a consumer (p.
190).
37
Unfortunately, Nebster's (1975) results did not substantiate his model.
Socially conscious consumers were not the "pillar(s) of the community"
heavily involved in civic activities. Rather, they acted in a manner
consistent with their own standards of responsibility but did not force
these standards on others. Nebster characterized these individuals as
members of the "upper middle class 'counterculture'...who operated at a
rather low key" (p.l96). Antil (1978), however, contended that Nebster's
original model was not as far wrong as he believed. Antil's consumer was
more involved in community activities and more informed about environ-
mental problems but not necessarily because of a higher education level.
Like Nebster's low-key consumer, this individual was not an opinion leader
and did not push his views onto others.
Qlothigg Cgnsumgtiog ßehavig;
In order to discern which clothing practices might also be socially
responsible consumption behaviors, some knowledge of the process of
clothing consumption is needed. Furthermore, since conservation and
stewardship are pivotal components of social responsibility, clothing
waste and its causes should be understood. Some factors which have been
related to apparel waste are disposal methods, fashion, multi-purpose
garments, secondhand clothing, analytical buying, and values. The fore-
going topics will be reviewed in this section with the intention of de-
fining socially responsible clothing ccnsumption behavior (SRCCB) and
identifying consumers who might exhibit this behavior.
. 38
I
Qlojhigg Coggumgtiog Pggcesg
Ninakor (1969) described clothing consumption as the ”process of
acquiring, storing, using, maintaining, and discarding clothing” (p.
629). Consumption in this sense is not limited to the traditional concept
of purchasing clothes in the market but includes the entire range of ac-
tivities which individuals undertake in relation to clothing. Figure l
depicts Ninakor's clothing consumption process for a single individual.
The model consists of three main parts: acquisition, inventory, and
discard. Acquisition is the flow which occurs intermittently whenever a
person gains possession of a garment. Garments for permanent ownership
may be obtained by purchase, gift (including handing-down), home con-
struction, making—over, exchange, or as payment. Methods of acquiring
clothing for temporary possession include borrowing and renting. Both
permanent and temporary clothing may be new or used.
Inventory represents the stock of clothing owned by an individual
and available for fairly regular use (wear). Apparel items needing careI
or maintenance (e.g., cleaning, remodeling, repairing) are also part of
inventory if the owner intends to wear them once the maintenance function
has been completed. Garments which the individual retains but does not
plan to wear again are in inactive storage, a 1imbo—like stage between
inventory and discard. Discard, like acquisition, is also a flow which
occurs when garments leave the owner's possession. Disposal methods in-—
clude selling, abandoning, making over, using as rags, throwing away,
exchanging, and handing-down. The precise moment of discard is often
l 39
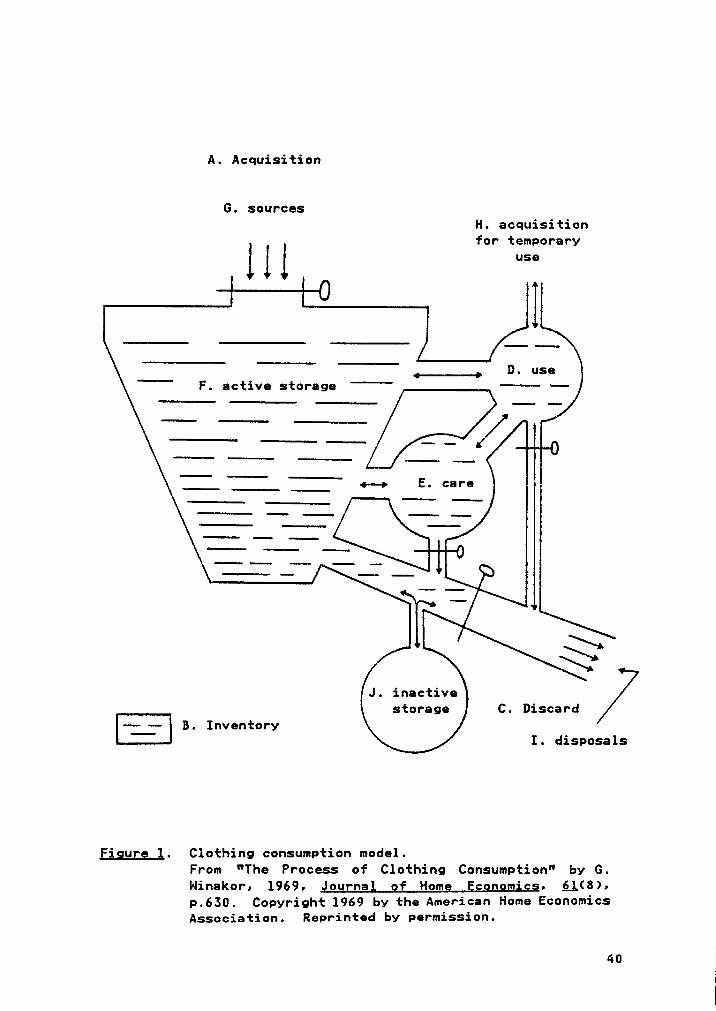
A. Acquisition
G. sourcesH. acquisitionfor temporary
lllI
I D. useF. active storage
“"" -———— ———
... „6-—• E. care
___ ,.;.—..— —.§__ x
TA
\
J. inactivestorage C. Discard
I- -1 B. InventoryI. disposals
Eigugg 1. Clothing consumption model.From “The Process of Clothing Consumption" by G.Ninakor, 1969, Joggnal gf Hom; Egonomjcs, §l(8>,p.650. Copyright 1969 by the American Home EconomicsAssociation. Reprinted by permission.
40I
harder to determine than the moment of acquisition because acquisitions
tend to be more memorable. In addition, a garment may become part of
inactive inventory unexpectedly or without a conscious decision from the
owner. The present study will concentrate on specific aspects of clothing
acquisition and discard as they relate to garment waste. Inventory and
all that it encompasses (active storage, use, care) will be discussed only
in relation to the acquisition and discard processes.
Qlgjbing Haste
Waste can be thought of as the inefficient use of resources. This
broad concept is applicable to waste associated with clothing throughout
the production, distribution, and consumption processes. In fact every
aspect of clothing is a potential source of waste. Table 4 illustrates
the range of factors that could be related to waste. Nhether the factor
is considered a resource or an output depends on the individual or unit
making the assessment and the time at which the observation was made.
Often the assumption is made that resources or outputs are strictly
tangible substances, e.g., natural resources or material goods. However
they also can be intangible entities such as time or psychological sat·
isfaction. Time is rapidly becoming one of the most valuable resources
in our society (Becker, 1965; Lazer, 1969; Nicosia & Mayer, 1976). The
importance of psychological needs is also receiving more attention.
Scitovsky (1976) discussed the human desire for novelty, pleasure, com-
fort, and maintaining habits as well as the need for freedom from care
41
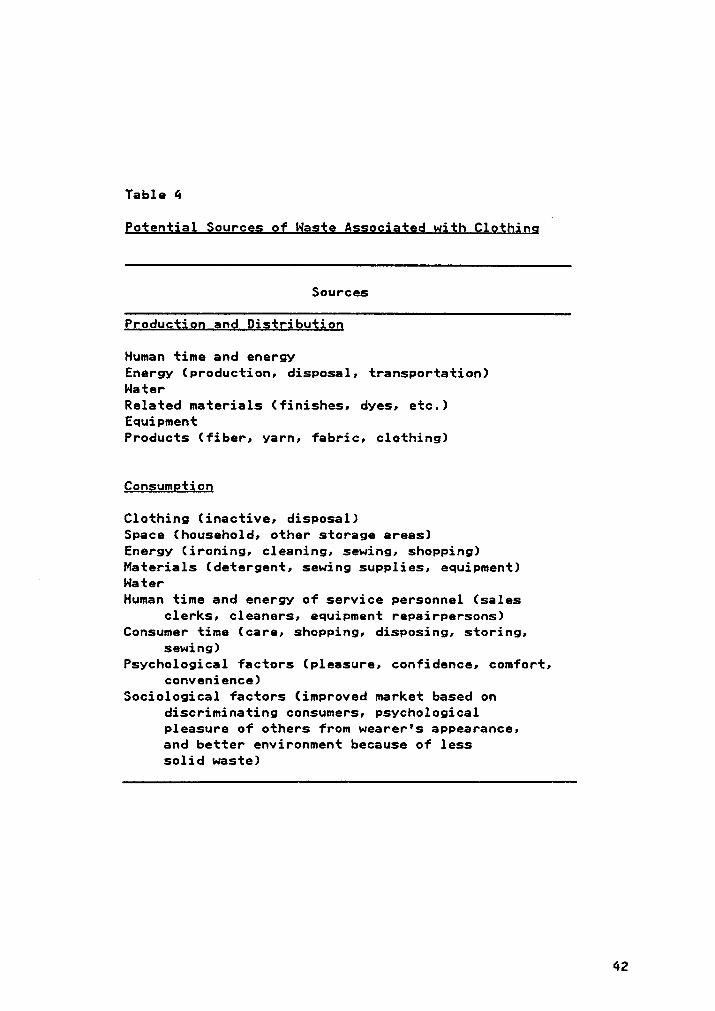
Table 4
Eotgntigl Sgugcgg gf Qagje Asgggjajeg with Qlgthiggi
Sources
Producjigg ang Qigtgibutiog
Human time and energyEnergy (production, disposal, transportation)WaterRelated materials (finishes, dyes, etc.)EquipmentProducts (fiber, yarn, fabric, clothing)
Congumgtiog
Clothing (inactive, disposal)Space (household, other storage areas)Energy (ironing, cleaning, sewing, shopping)Materials (detergent, sewing supplies, equipment)WaterHuman time and energy of service personnel (sales
clerks, cleaners, equipment repairpersons)Consumer time (care, shopping, disposing, storing,
sewing)Psychological factors (pleasure, confidence, comfort,
convenience)Sociological factors (improved market based on
discriminating consumers, psychologicalpleasure of others from wearer's appearance,and better environment because of lesssolid waste)
l
42
and bother. In his view, individual decisions regarding resource use
effect society as a whole. An obvious example is the environmental effect
of personal disposal practices. Less obvious is the pleasure observers
derive from the attractive appearance of another person or the beneficial
collective effect of careful shoppers. By practicing discriminating
shopping behavior, consumers pressure producers and marketers to be at—
tentive to their demands thereby improving market competitiveness and
benefiting all consumers. Such societal benefits are lost, however, if
people attempt to avoid "care" and "bother" by not taking the time to
dress attractively or shop carefully.
Haste reduction or elimination occurs when consumers receive the
maximum value from their particular stock of resources. VeVerka (1974)
referred to the benefits derived from clothing as use—value. Use of re-
sources also results in costs to the consumer. Burk (1968) defines waste
as the "costs incurred through reductions in value or costs of replacement
as opposed to alternative costs of efforts to reduce such wastes" (p.
144). Thus another way of considering waste in clothing consumption is
to examine the costs incurred in the process. Such costs include time,
money, opportunities foregone, and external effects (VeVerka). Since
total waste is minimized when costs of consumption are lowest, it seems
logical that the greater the margin between = garment's use-value and its
consumption costs, the less total waste will occur.
Most research on clothing waste has had a narrower focus than the
broad concept of waste described above. For example, Sherrill (1949)
45
described "economic waste" in clothing as the failure of consumers to
receive the maximum satisfactory wear from their clothes. Other defi-
nitions include the following:
Economic waste is "present when an item of wearing apparel is dis-carded which still has either years or seasons of usefulness andthus retains its physical utility" (Lapitsky, 1952, p. 5).
Waste can occur when garments are discarded or placed in inactivestorage before they are worn out (VeVerka, 1974, p. 14).
Waste occurs when garments are ”1eft hanging in the closet or dis-carded before they wear out" (Margerum, Walker, & Kernaleguen,1977, p. 40).
Thus the emphasis in clothing research has been on waste from underu-
tilization and premature disposal.
Several studies indicated that clothing inactivity was fairly ex-
tensive, with as much as one-third of an entire wardrobe receiving in-
frequent wear (ßradlyn, 1965; Fratzke, 1976; Grieg, 1975; Lapitsky, 1952;
Otis, 1958). Actual discard of clothing still in usable condition was
also widespread. Avery (1967) determined that 59% of the garments dis-
carded by respondents had "much wear" left in them.
Demographic profiles of wasteful apparel consumers have been diffi-
cult to establish since most studies used homogeneous samples (e.g.,
college students) or did not analyze waste in relation to demographic
variables. In addition, research findings were often contradictory. For
example, age was not a significant factor in clothing waste according to
Lapitsky (1952) and Grieg (1975). Yet Bradlyn (1965) and Boyle (1965)
44
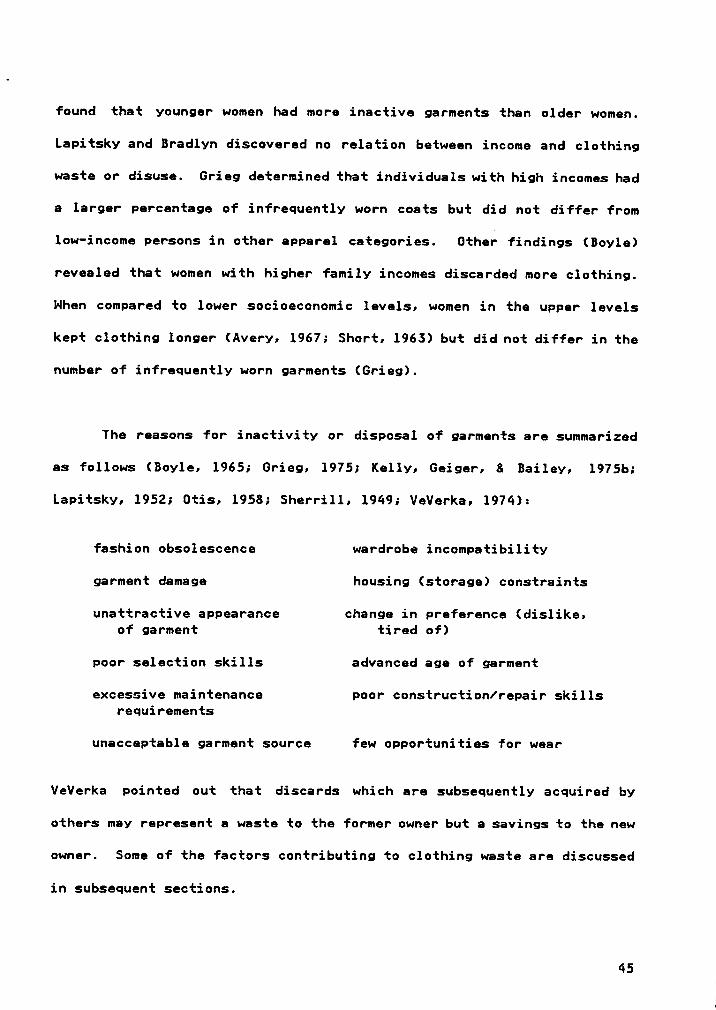
found that younger women had more inactive garments than older women.
Lapitsky and Bradlyn discovered no relation between income and clothing
waste or disuse. Grieg determined that individuals with high incomes had
a larger percentage of infrequently worn coats but did not differ from
low-income persons in other apparel categories. Other findings (Boyle)
revealed that women with higher family incomes discarded more clothing.
When compared to lower socioeconomic levels, women in the upper levels
kept clothing longer (Avery, 1967; Short, 1963) but did not differ in the
number of infrequently worn garments (Grieg).
The reasons for inactivity or disposal of garments are summarized
as follows (Boyle, 1965; Grieg, 1975; Kelly, Geiger, 8 Bailey, 1975b;
Lapitsky; 1952; Otis, 1958; Sherrill, 1949; VeVerka, 1974):
fashion obsolescence wardrobe incompatibility
garment damage housing (storage) constraints
unattractive appearance change in preference (dislike,of garment tired of)
poor selection skills advanced age of garment
excessive maintenance poor construction/repair skillsrequirements
unacceptable garment source few opportunities for wear
VeVerka pointed out that discards which are subsequently acquired by
others may represent a waste to the former owner but a savings to the new
owner. Some of the factors contributing to clothing waste are discussed
in subsequent sections .
45
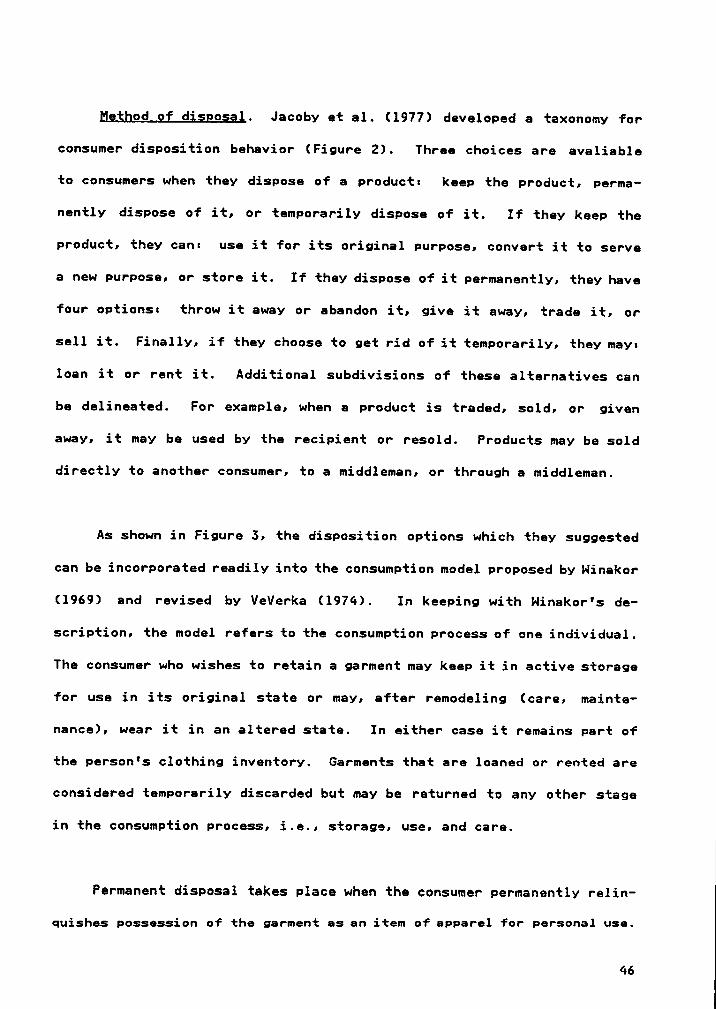
Mg;bgg_gj_g;;gg;gl. Jacoby et al. (1977) developed a taxonomy for
consumer disposition behavior (Figure 2). Three choices are avaliable
to consumers when they dispose of a product: keep the product, perma-
nently dispose of it, or temporarily dispose of it. If they keep the
product, they can: use it for its original purpose, convert it to serve
a new purpose, or store it. If they dispose of it permanently, they have
four options: throw it away or abandon it, give it away, trade it, or
sell it. Finally, if they choose to get rid of it temporarily, they may;
loan it or rent it. Additional subdivisions of these alternatives can
be delineated. For example, when a product is traded, sold, or given
away, it may be used by the recipient or resold. Products may be sold
directly to another consumer, to a middleman, or through a middleman.
As shown in Figure 3, the disposition options which they suggested
can be incorporated readily into the consumption model proposed by Ninakor
(1969) and revised by VeVerka (1974). In keeping with Ninakor's de-
scription, the model refers to the consumption process of one individual.
The consumer who wishes to retain a garment may keep it in active storage
for use in its original state or may, after remodeling (care, mainte-
nance), wear it in an altered state. In either case it remains part of
the person's clothing inventory. Garments that are loaned or rented are
considered temporarily discarded but may be returned to any other stage
in the consumption process, i.e., storage, use, and care.
Permanent disposal takes place when the consumer permanently re1in—
quishes possession of the garment as an item of apparel for personal use.
46
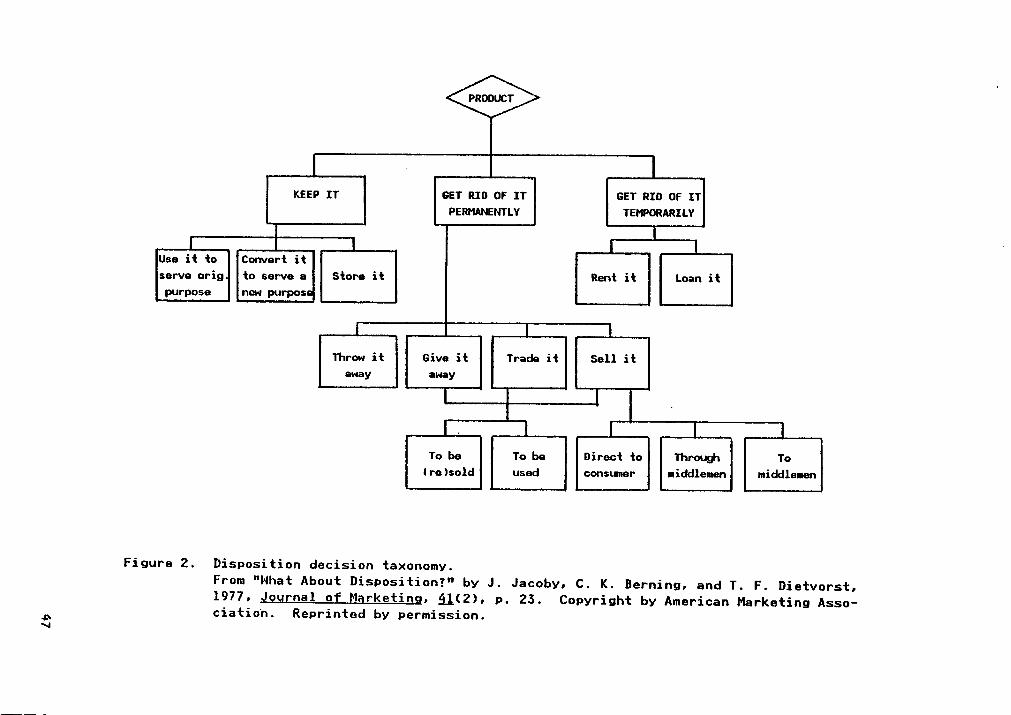
*2.4-*m
wL
V]
0<
imnä
'
2*5
ag°‘·?••¥
ng
*2°'c
·¤¤¤2
=2Ü
QL
,
Q2
*2:>
*2=<
...:2’
'E'>cg
ä-¤Z
S2
-3s“°_'E
EE·*§
,5922**
2;;
Eu
og-QS
*4„
‘§.2.¤'g
NN
qm
1es
•-¤
·
F-
L
•¤
,
•-1:
h-'_
.c
°"S
E
Eg
oä
=·‘“3
***2_
Q•§
I-I
Ü:>‘
.3
2m
x22
22䤗
EQ
un
d~
C'•"'
Q°
§':.§
¤.
-6-*.3
go
>•
.
af-¤
gg.äß
aruö
l
.2-•»‘4—¢
gd
U¤
o.:
UG
¤.v-
*°£7
¤‘¤
*..
oqd+
-2IV
*
MN
:
IH••·•
+¢
_§
O'
ZÜ
@:1
-:
-•·-Z=
’¤s
W,,.,
uv
o•
“•¤.sr~·*“
§¤
ä
“*2';L'Q
°°°'c
EL
L-•U
riB
gg
Nä
gä
20
-ä
¤
ug
QD
_"u.
I47
I
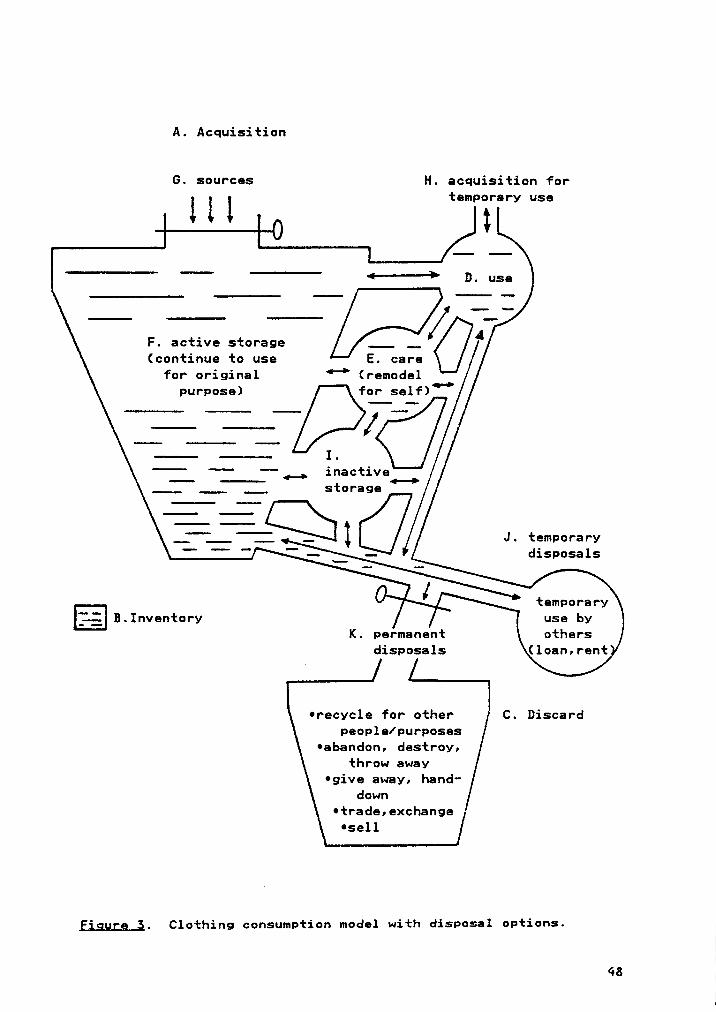
A. Acquisition
G. sources H. acquisition fortEII\P0|‘äPY USE
***1* D. use
. 4F. active storage ___ __(continue to use E. care
for original‘"°
(remodelpurpose) ~ se1f)"'°—:—— Ö"'* *"' "* inactivei, __ _, storage
_ __ ____ .. J. temporary
'
J temporaryB.Inventory use by
K. permanent othersdisposals (loan, rent
•recyc1e for other C. DiscardPEOP1 E/PUPPOSES
•abandon, destroy,throw away
•give away, hand-down
•trade,exchange•se11 /
Figgrg §. Clothing consumption model with disposal options.
48
lf the garment is "made over" for someone else to wear (e.g., adult
clothing altered to fit a child) or if the clothing item is converted into
a product which will not be worn (e.g., rags), then permanent disposal
of the garment has taken place. Methods of permanent disposal include:
l. Throwing away, abandoning, destroying
2. Giving away - to charity, friends, family (in-
cludes handing-down)
5. Trading or exchanging
4. Selling - at flea markets, garage and rummage
sales, or to family or friends
5. Remodeling for other people or purposes - rags,
patches, childrens' clothes, quilts, rugs, etc.
In terms of solid waste, throwing away or destroying clothing is the
most wasteful method of permanent discard since no one receives further
use from it. The clothing literature revealed that this method, while
seldom the most common, is fairly widespread. In Sherrill's (1949) study,
garments were most often disposed of by giving them away, followed by
selling, using around the house, and destroying. Lapitsky's (1952) re-
sults were similar; 99% of the respondents gave clothing away and 8% ei-
ther destroyed it or kept it for household use. Pershing (1974) found
that 89% of her· sample of male professors donated discarded items to
charity, 52% threw them away, and 2% burned them. Throwing clothes away
was most prevalent in the 41-50 age group.
49
Avery's (1967) findings showed that slacks and shoes were most often
discarded by throwing them out while other clothing articles were usually
given to charity. For both upper and lower economic groups, the major
form of disposal was donation to charity. Members of the lower economic
group threw more garments away, perhaps because they were forced to pur·
chase cheaper, less durable garments at the outset. Avery concluded that
the discard method varies according to the type of garment, treatment of
the garment, and the socioeconomic level of the respondent.
Fratzke (1976) determined that older respcndents were more likely
to discard clothing by giving it to another family and 26-$5 year olds
were more prone to throw out clothing. Nomen who engaged in outdoor ac-
tivities gave more clothing to other families than did the less active
women, and respondents who did not work outside the home threw away more
clothing than those who were employed. As compared to nonparticipators,
individuals involved in group activities gave more to churches or chari-
ties, sold more at garage and rummage sales, and used more fabric from
old clothing for other purposes.
The foregoing studies indicate that throwing away or destroying
clothing is not uncommon. Although generalizations are difficult to make,
it appears that these disposal methods are chosen more often by people
in lower socioeconomic levels who are not involved in many activities
outside the home and therefore not exposed to alternate discard options
as frequently as others.
so III
fgghigg. Fashion has been cited as the villain in much of clothing
waste. As early as 1912, Veblen singled out dress as the epitome of both
conspicuous waste and conspicuous leisure, which could be considered
waste of human resources. He observed that the commercial value of goods
is determined more by fashionableness than serviceability. Similarly,
Sapir (cited in Sproles, 1981) noted that the "charge of economic waste
which is often leveled against fashion has had little or no effect on the
public mind. Haste seems to be of no concern where values are to be
considered, particularly when these values are both egoistic and uncon—
scious" (p. 26). Gregory (1948) was one of the chief critics of fashion.
Although he acknowledged the need for novelty, he felt that a slow evo-
lution in style is the best reflection of true human wants. Rapid fashion
change only fosters a high rate of obsolescence inducing people to replace
clothes frequently and diverting their attention from price and quality
considerations. Nhen styles change quickly, consumers cannot anticipate
and therefore must spend more time and effort in selecting wardrobe items.
Packard's book (1960) on waste in the United States acknowledged the
women's fashion field as the leader in "planned obsolescence of desir—
ability." In his view, the industry was so successful at planned obso-
lescence that "only those women in the very lowest and very highest social
classes in the United States have actually come close to wearing out their
dresses...." (p. 71). More recently, Margerum et al. (1977) observed that
American consumers still consider fashion in clothing much more important
than durability.
51!
· I
This preoccupation with fashion is substantiated to some extent in
clothing acquisition and discard studies. Some studies cited style or
fashion as the primary reason for selection of a new garment (Gilmore 8
Rosencranz, 1961; Rosencranz, 1958). However, others found economy
(Richards 8 Hawthorne, 1971), fit (O'Brien, 1970; O'Connor, 1967), com-
fort (Richards 8 Hawthorne; Sproles 8 Geistfeld, 1978), and price (Martin,
1971-72; Otis, 1958) to be more important than style. Even in the used
clothing market, the influence of fashion is felt. In a survey of thrift
shop patrons, 8% said ”fashionable clothes" were the most important factor
in deciding to shop for clothing at a secondhand store (Rucker, 1981).
Margerum's (1981) research revealed that prices for men's used suits were
determined principally by fashionableness.
Poor fit was often offered as the main reason for discarding apparel,
with outdated fashion named much less frequently (Avery, 1967; Boyle,
1965; Fratzke, 1976; VeVerka, 1974). However, Pinard (1974) found that
loss of fashion value was responsible for 44% of clothing discards while
poor fit accounted for only 11%. Watson (1974) also determined that
discards for loss of fashion value and loss of durability were greater
than those for poor fit. Another interesting discovery from Pinard’s
research is the variance between expressed reasons for garment dissatis-
faction and those for actual discard. Prior to discarding garments, most
subjects said that their dissatisfaction stemmed from the garments'
physical shortcomings, but when these garments were actually discarded,
the reasons given were more often related to socio-psychological factors.
Subjects may have been trying to rationalize their dislike for these
52
garments by offering reasons which coincided with their attitudes about
waste.
Fashion conscious individuals have been referred to as fashion
leaders, innovators; innovative-communicators. and change agents among
others. Regardless cf the terminology; fashion leaders tend to have
similar characteristics. Some of the personality traits fcund to be as-
sociated with innovatcrs are the following (Baumgarten; 1975; Greeno;
Sommers; 8 Kernan; 1973; King 8 Sproles, 1973; Pasnak 8 Ayers, 1969;
Schrank 8 Gilmore; 1973; Summers; 1970):
GregariousnessLeadershipAttention seeking (exhibitionism)Self-confidence (self-acceptance; secure)NarcissismNonindividualism (conformity)Present·orientedActivism (competitiveness, venturesomeness„
assertiveness; impulsiveness)
It is interesting to note that fashion leaders generally displayed
a nonindividualistic personality rather than the nonconformist nature one
might expect. Agreement on the above factors was not unanimous however.
Baumgarten (1975) discerned no difference between innovative and nonin-
novative communicators in emotionalism, likeability, responsibility. in-
telligence, assertiveness. leadership; tenseness; a1oofness•
competitiveness; self·confidence; and individualism. The fact that his
sample was composed of men rather than women may partially explain the
lack of agreement between his results and those of others. Although many
53
fashion opinion leaders are venturesome, Summers (1970) asserted that
this was not an essential trait since 22% of the leaders in his survey
preferred classic fashions over more current styles. Fashion innovators
and noninnovators were also found to be similar in their attitudes toward
conformity (Schrank & Gilmore, 1973).
On the whole, demographics have not been especially good predictors
of innovative individuals. In fact, fashion leaders have been found at
all socioeconomic levels (Baumgarten, 1975; Sproles, 1979; Summers,
1970). This appears to be true in the realm of used clothing as well.
In a study of persons shopping for used clothing, fashion innovativeness
was found to be unrelated to sex, age, employment, family composition,
number of children, and income level (Richardson, 1981).
Unlike the fashion conscious consumer, there is little empirical data
concerning the buyer of classic fashions. Several definitions of classic
styles have been advanced:
Designs, once fashion, held on past their time due to utility offunction (Anspach, 1961, p. 428)
Basic styles that have received acceptance for a long time (Sproles,1979, p. 16)
Time tested fashion that stays in popular favor over considerableperiods of time (Hoffman, 1956, p. Z22)
Fashion that stays in popular favor over considerable periods oftime (Otis, 1958, P. 6)
54
Anspach described a use-oriented clothing consumer who emphasized
wear and comfort and favored classic or truly artistic designs. This
individual was in the middle status levels of society and had limited
imagination, restricted emotions, and a desire for conformity. A somewhat
different picture ums painted by Nasson (1968) who conceptualized the
buyer of classics as one who had little need for complete conformity.
This consumer did not have a strong drive for new experiences, but desired
core function attributes and realized that compromise was sometimes nec-
essary. Altpeter (1963) studied the relationship between consumer
clothing purchases and values and ascertained that women with high eco-
nomic value scores purchased traditional styles more often than those with
lower scores. The economic clothing value was defined as the desire for
comfort and conservation with regard to clothing usage and selection.
üultigurgose garment;. As Britten (1968) observed, multipurpose
garments have several advantages. A major advantage is that they are not
limited to a single activity but can be worn for various activities, e.g.,
school, church, recreation, and shopping. Alternately, if garments can
be readily demoted from dress—up to work and finally to casual occasions,
they can have multiple uses through time. Conceivably, more use would
be made of such garments, and therefore less waste would exist in the
clothing consumption process.
Joyce (1966) ascertained that individuals at different income levels
tended to purchase different types of clothes for their children.
Middle-income consumers bought more combinations of clothing (e.g., play
55 TI
T \
and school dress). Upper income individuals spent more on playwear, and
lower income individuals spent more on school clothes. In a study of
married women's wardrobes, Hawes and Gilmore (1967) found that 55% of all
garments were acquired for all—purpose wear, 35% for dress-up, and 10%
for work. On the other hand, frequency of wear was almost always greater
for work clothing than for all-purpose or dress-up attire, a fact which
is somewhat surprising given the greater number of opportunities avail-
able for wearing all—purpose garments.
Clothing versatility, although not always well defined, has been
measured by some researchers. O'Brien (1970) found that versatility as
a reason for purchase depended on the type of garment under consideration.
It was ranked as the fifth (out of 15) most important reason for buying
handbags, eighth for outerwear, ninth for shoes, and tenth for hosiery.
Otis (1958) described versatility as the ease with which an item of
wearing apparel could be combined with other garments. Nhen used in this
sense, the term is not synonymous with multipurpose but is at least a
related concept. A majority of the participants in the Otis survey (52%)
considered versatility at the time of garment purchase; 60% had refused
to wear clothing because it lacked versatility.
Many consumers select specific portions of their wardrobes for oc-
casional use only. However, like Hawes and Gilmore (1967), both Smith
(1974) and Kelley et al. (1975a) found that the majority of individuals
often chose clothing that was suitable for several occasions. Three-
fourths of Smith's sample of professional black women selected a single
S6
standard style purse rather than several purses to coordinate with each
outfit. Adolescents in the Kelley study seldom wore outfits only to
school, although 54% did own some single—purpose garments for school,
church, parties, play after school, and "hanging around the house."
In summary, it seems that the majority of consumers purchases
multipurpose garments more often than single—purpose clothes. Although
greater wear is usually anticipated from all-purpose apparel, such may
not always be the case (Hawes 8 Gilmore, 1967). Much depends on the
frequency with which the particular purpose arises. Also, if single-
purpose garments can be readily demoted from more formal to less formal
use, they may receive more wear than some multipurpose items.
§egggghand glojlging. Researchers have found that consumers, even
in the lower socioeconomic levels, acquire most of their clothing by
purchasing it new (Avery, 1967; Brew, 0'Leary, 8 Dean, 1956; Britton,
1975; Fitzsimmons 8 Perkins, 1947; Kelley, Daigle, LaFleur, 8 Wilson,
1973; Winakor, 1969). In contrast, secondhand purchases usually repre-
sent only a minor source of clothing for most individuals and families.
Brew et al. studied 923 families and discovered that the amount of sec-
ondhand clothing purchased was negligible. Avery's study found that used
garments represented no more than 10% of the clothing purchases of
homemakers, and those who bought used clothing were generally from the
lower socioeconomic levels. Only 1% of the upper class homemakers pur-
chased used clothing as opposed to 10% of the lower class homemakers.
57
Peters (1968) and Manoushagian (1977) also found that lower income fami-
lies were the major buyers of secondhand apparel.
Current indications are that the used clothing market is no longer
confined to the lower classes. In one study, 20% of the buyers of sec-
ondhand clothing were white collar workers (Margerum, 1978). Although
students with projected annual incomes over $20,000 had more negative
attitudes toward used clothing, their actual use of secondhand clothing
did not differ from that of students with lower projected incomes (Hinton
8 Margerum, 1984). The largest proportion of secondhand store patrons
in Richardson's (1981) survey had yearly incomes of over $17,000 while
the most unfavorable reactions to used clothing came from shoppers in the
lowest income range. Thrift shops and the like are increasingly patron-
ized by businesspeople and professionals, many of whom could afford
full-price apparel ("Chic Comes", 1981).
Factors which affect the appeal of various clothing sources have been
delineated by Ninakor (1969): the particular time, place, economic and
social circumstances, and individual characteristics. Nith regard to
secondhand clothing, saving money was usually the principal reason for
purchase, and there was a definite limit on the price people were willing
to pay for items that were not new. Secondary reasons often centered
around a need for novelty, e.g., rebellion against convention, curiosity,
relief from boredom, desire for variety, and shopping excitement or en-
joyment ("Chic Comes", 1981; Margerum, 1978, 1981; Richardson, 1981;
Rucker, 1981; Ninakor 8 Martin, 1963).
58
Much of the reluctance to buy previously worn garments stems from
the stigma attached to used goods (Margerum, 1978). Aversion to used
clothing may relate to how close to the skin an article of apparel is
worn. One study determined that consumers were least interested in used
clothing that was likely to come in close contact with the body (0'Reilly,
Rucker, Hughes, Gorang, & Hand, 1984). Peters (1968) decided that it was
not the use of secondhand clothes that was distasteful but the purchase
of them. In the 1973 study conducted by' Kelley et al., adolescents
strongly preferred new clothing, but 65-75% said they "sometimes" or
"always" liked used clothes. Most of their secondhand clothes were gifts,
not purchases, however.
Manoushagian's (1977) respondents gave the following reasons for not
buying used clothing: alterations too involved, out of date, not sani-
tary, and no economic reason. With respect to personal sales, the reasons
were: nothing in my size, prefer not to purchase used clothes, clothes
not in fashion, and prices too high (0'Reilly et al., 1984). In Rucker's
(1981) study, subjects shunned secondhand apparel because they: preferred
to make their own clothes, needed special sizes, lacked exposure to used
clothing, and disliked wearing other people's clothes. She concluded that
"the major deterrent to recycling of clothing seems to be attitudina1"
(p. 221).
The unfavorable image of secondhand apparel appears to be disap—
pearing ("Chic Comes", 1981). In fact, for some consumers, shopping in
a used clothing store represents the adoption of a new "fashionable" idea;
59
an idea which may offer at least a partial solution to the clothing waste
problem. By purchasing used clothing, consumers can conserve resources
and yet still satisfy their need for novelty and variety (Richardson,
1981). A
In their study of a second—order marketing system, 0'Reil1y et al.
(1984) investigated the relationship of psychological and situational
variables to patronage of personal sales and purchase of clothing at such
sales. Three methods of data collection were used: telephone survey of
local residents, questionnaire survey of sale patrons, and observations
of sale merchandise. For telephone respondents, marital status was the
only variable that differentiated between patrons and nonpatrons, i.e.,
more married subjects were patrons. Nhen compared to nonpurchasers,
purchasers in the telephone group were more often female and married.
They also had more children. The questionnaire respondents who purchased
clothing at personal sales were more often students, had higher status
occupations and more children, attended more sales during the previous
year, and were older than nonpurchasers.
Agalytjgal buying. Pennock and Jaeger (1964) postulated that "the
greater the care taken in the selection of an item with a view to its
meeting the needs of the purchaser, the greater the likelihood that it
would fill those needs and so be continued in use as long as possible"
(p. 25). Careful shopping then probably has as much to do with discard
as it does with acquisition. Consumers dissatisfied with their purchases
will tend to discard them more quickly. Many of the reasons given for
60
discard reflect poor selection or planning on the part of the consumer,
e.g., poor fit, unbecoming style, or lack of harmony with rest of the
wardrobe.
Otis (1958) found that a great deal of economic waste occurred because
of discrepancies between consumers' considerations at the time of pur-
chase and during actual use. The most important discrepancies were (1)
ease of care, (2) versatility of color (didn't harmonize with wardrobe),
and (5) occasion for use (anticipated occasions never realized).
Sherrill's (1949) research revealed that the most inexperienced shoppers
were responsible for the greatest amount of waste.
To minimize waste, consumers must develop shopping skills which allow
them to analyze the social, psychological, and physical aspects of
clothing. Knowledge of a garment's workmanship, fabric, and expected
fashion life as well es its suitability for the consumer's personality
and life style are important skills for discriminating shoppers (Britton,
1968; Margerum, 1981). Unfortunately consumer evaluation of the per-
formance characteristics of clothing is often hampered by inadequate
seller-provided information. The problem is even more acute with used
clothing since, in many cases, size, fiber content, and care instructions
are absent altogether.
Burns (1964) developed a 7—section measure of analytical buying be-
havior which included awareness of merchandise availability, awareness
of price-quality relations, purchase planning, esthetic awareness, qual-Q
61
ity awareness, awareness of social needs, and resources used. She de-
termined that high education and socioeconomic levels were associated
with a high degree of analytical buying. Low socioeconomic and education
levels were related to high economic value scores and low analytical
buying. Apparently individuals in the lower levels were interested in
economy but did not have the skills or knowledge to apply their interest
in a shopping situation.
Degree of analysis in clothing acquisition was also examined by B.
A. Nalker (1967). Her sample was composed of 69 married women who were
predominantly middle-aged (36-65) and from middle socioeconomic levels.
Five variables were used to measure degree of analysis:
l. Breadth of stores in which respondent lookedI
for clothing
2. Knowledge of selected relations among price,
quality, and fashion levels
3. Awareness of selected esthetic and physical
factors related tc self _
6. Knowledge of fibers, fabrics, construction, and
brands
5. Planning for clothing purchases and use of re-
seurces to meet social and physical needs
The following variables were found to be positively related to the
degree of analysis used in shopping:
62 I
I
1. Education
2. Social involvement (higher for informal groups
than formal erganizatiens)
3. Secioeconomic status ef husband
4. Confidence and satisfaction with clothing pur-
chases
5. Level of fashion interest
6. Experience and training in clothing and tex-
tiles
Wardrobe planning is an essential feature of buying analysis and a
topic en which several studies have been conducted. Careful planning
tends to increase satisfaction derived from garments and confines acqui—
sition to the more essential clothing articles. Thus premature discards
and impulse buying are reduced. According to Ryan (1966) much of the
early clothing literature on impulse buying lacked validity because
ofimproperuse ef the term "impulse." She maintained that many "unplanned"
clothing purchases were net truly impulse actions because they were made
by persons who had been searching for some time. In the field of mar-
keting, a four-way definition ef impulse purchase encompasses not only
"pure impulse" buying but "reminder impulse," "suggestion impulse," and
"planned impulse" purchases as well (Stern, cited in Williams, 1982, p.
44). Impulse buying without prior planning or search, can be wasteful
if it does not channel resources where they are most needed. Consumers
may reduce waste by planning beforehand, shopping around for items, and
avoiding impulse purchases that de not fit their plan (Britten, 1968).
63
0'Brien (1970) studied the clothing practices of 55 secretarial
trainees from predominantly lower socioeconomic levels. The majority
engaged in wardrobe planning and considered the following factors either
"frequently" or "always" in their plans:
l. Relationship of outerwear items to each other
2. Relationship of accessories to each other
3. Relationship of outerwear to accessories
4. Anticipated occasions for wear
5. Relationship of current fashion to present
wardrobe needs
6. Specific items, designs, textures, and fabrics
to be added
Another study by Francis (1971) compared the clothing behavior of
50 mothers and their college-age daughters. These families were generally
in the middle to upper socioeconomic levels and had heads of household
in the highest occupational status categories. Despite the differences
in background between this sample and the previous one, the findings were
similar. Most mothers (39/50) and daughters (27/50) thought about their
wardrobes as a whole and considered the following factors in planning:
1. Relationship of garments to each other (fre-
quently)
2. Occasions planned for wear (frequently)
5. Relationship of fashion forecasts to present
wardrobe needs (occasionally or frequently)
64
Smith (1974) investigated wardrobe planning of professional black
women from the highest social classes. The majority enjoyed wardrobe
planning and felt it provided a better selection and saved time and money.
Few women made frequent impulse purchases. Nardrebe planning was unre-
lated to education, occupation, age, and family responsibility.
In their study on lower income adolescents, Kelley et al. (1975a)
found that youths also engaged in planning. Most of the 196 eighth
graders "sometimes" er "most ef the time" evaluated their current
wardrobes, beught multiple purpose garments, and planned for occasions
they might attend. Unplanned purchases resulted from impulse buying,
unexpected special occasions, or appealing advertisements. Before making
purchases, adolescents considered such factors as fit, cost, con-
struction, and color. Few bought unbeceming clothes simply because they
were popular.
In the secondhand clothing market, one might expect more impulse
shopping. Chance encounters with neighborhoed garage sales or short-
lived bargains would seem to fester impulsive actions. 0'Reilly et al.
(1984) found however, that planned trips to personal sales were far more
common than unplanned visits and that heavy users of personal markets
engaged in more advanced planning than light users.
In summary, conserving resources "nay mean that we have to use more
ef our own time and energy, acquire more knowledge and skills, and sim-
plify our standards" (Britten, 1974, p. 20). It appears that many cen-
65
sumers at various socioeconomic levels are vdlling to engage in some
wardrobe planning and keep impulse buying to a minimum. In the clothing
realm, some people may have entered the transition period between the
industrial age, where consumers know little about their market products,
and the postindustrial age in which the primary concern will be "efficient
and responsible consumption" (Stampfl, 1978). This trend seems to indi-
cate that changes in consumer values are taking place.
Value;. Ryan (1966) referred to values as "fundamental beliefs and
feelings that include or direct...specific attitudes and interests" (p.
98). Lapitsky (1961) defined clothing values as "wishes, desires, in-
terests, motives or goals which an individual considers worthwhile and
thus are major determinants of attitudes and behavior in relation to
clothing choices and usage" (p. 3). Fishbein's attitude-behavior model
does not address values per se. However, it was his contention that
values imply bipolar evaluation (feeling) and thus can be considered
similar to attitudes (Fishbein 8 Ajzen, 1975).
Much of the research relating clothing to values used the Allport-
Vernon-Lindzey (AVL) (1951) test derived from Spranger's (1928/1966) six
types of man: theoretical, economic, esthetic, social, political, reli-
gious. The corresponding clothing values varied somewhat among re-
searchers. Although individuals possess a conglomeration of interrelated
values, the economic and social values are of particular interest in the
present study. Hartmann (1949) theorized that Spranger's economic man,
whose predominant concern was practicality and usefulness, might corre-
66
spond to e clothing consumer who emphesized shrewd purchases and elimi-
nated all waste. The social man, according to Spranger, stressed love
of people and selflessness. Hartmann's clothing-oriented equivalent was
an individual who was conscientious end disturbed by rags versus riches.
Other clothing values have been related to Spranger's general values.
Lapitsky (1961) defined the economic clothing value es the "desire for
comfort in clothing and for the conservation of time, energy, and money
in relation to clothing usage or selection” (p. 4). The social I value
was considered an "expression of regard for fellow beings through clothing
behavior" (p. 4), and the esthetic value was "the desire for, appreciation
of, or concern with beauty in clothing" (p. 3). Lapitsky's findings in-
dicated that the esthetic and economic values were considered to be the
most important values in relation to clothing and the social I value was
least important.
Using the Lapitsky clothing measure, Altpeter (1963) also found that
the economic and esthetic clothing values were the most significant values
to respondents; once again social was the least important. In a group
of young married women, above-average scores on the economic value were
associated with buying traditional styles, examining seems before buying,
and having little interest in clothes or shopping for them. The social
I value was negatively related to the importance of beauty and fit in
dress and unrelated to deliberating before buying, considering labels,
examining seems, and trying on before purchase.
67
Esthetic, economic, and social (desire for social approval) values
were the three most important ones to Gilgo's (1962) sample of sorority
and independent college women. Burns' (1964) highest ranking clothing
value was economic and the lowest was social I. Predictably, esthetic
value scores increased with higher levels of education and socioeconomic
status. The expected association between the economic value and analysis
in purchasing clothes was not confirmed by the findings.
Slocum (1975) found that esthetic was the highest ranked clothing
value, and economic value ranked only fourth. As a result of factor
analysis, "lack of interest in clothing as a source of prestige or ex-
perimentation" was coupled with the following factors: a practical con-
cern for comfort, intellectual understanding, and conservation of time,
energy, and money with respect to clothing. Accompanying goals indicated
a desire for basic rather than unique styles, small inventory, and ac-
cepted fashions rather than less generally accepted ones. Higher economic
value scores were significantly related to the desire for a small number
of shoes worn more often, basic colors and styles of shoes, and inexpen·
sive shoes. Lower economic value scores coincided with higher
socioeconomic levels.
In the Creekmore study (1965) the AVL general values were related
to several clothing behaviors and needs. The social (feeling of regard
for others) and economic values were third and fourth respectively in
importance. Altruistic use of clothing, defined as "consideration of .
others' welfare in the choice and use of clothing" (p. 10), did not show
68
any relationship to the social value as was expected. However, clothing
altruism was positively related to the exploratory value (i.e., the desire
to investigate, experiment, or satisfy one's curiosity) and the need for
self-actualization, a trait found to be associated with socially con-
scious consumers. Another behavior, management of clothing, stressed
those "processes concerned with buying, use, and care of clothing which
result in an attempt to save time, energy, and money" (p. 10) and was
positively related to the economic value.
Two other studies considered general values, as opposed to clothing
values. 0'Connor (1967) found the economic and exploratory values to be
the most important to her sample. Her research also revealed no signif-
icant relation between the economic value and clothing management behav-
ior. In N. P. Nalker's (1968) study higher levels of self-actualization
generally corresponded to higher expenditures on clothing, greater
amounts of clothing purchased, more dressy garments, and higher prices
paid for clothing. Both economic and social general values were nega-
tively related to overall self-actualization. The most dominant values
were religious and social.
In summary, there are two clothing values which appear to be related
to waste and conservation: economic and social (regard for mankind).
It should be noted that these two values roughly correspond to the
aforementioned motivations behind socially conscious consumption, i.e.,
practicality and altruism. The economic value appears to be related to
practicality and management of clothing. Logically, social value should
69
be related to altruistic use of clothing, although Creekmore (1963) did
not find a relationship between clothing altruism and social value.
Economic values seemed to be held by many consumers as evidenced by their
frequent ranking as the first or second highest value in importance.
However, these economically oriented people tended to be in the lower
socioeconomic and educational levels and thus may have been acting out
of necessity rather than conservation concern. Social values on the other
hand were not strong factors in clothing consumption. Neither economic
nor social values were related to self—actualization, a trait associated
with the SRC.
Attitudes
Attitudes are a key element in understanding behavior, socially re-
sponsible or otherwise. As such, it behooves the researcher to gain some
knowledge of the properties of attitudes and the relationship between
attitudes and behavior. The remainder of the literature review is devoted
to these issues.
Qoncggtualigatigg of Attitude
The literature contains numerous definitions of the term "attitude"
(Allport, 1935; DeFleur & Nestie, 1963). Opinions, feelings, beliefs,
motives, values, behaviors, intentions, perceptions, cognitions, emo-
tions, habits, and dispositions have all been subsumed under the attitude
label at one time or another. A few examples illustrate the point:
70
An attitude is a mental and neural state of readiness, organizedthrough experience and exerting a directive or dynamic influenceupon the individual's response to all objects and situations towhich it is related (Allport, p. 810).
Attitude is the effect for or against a psychological object(Thurstone, 1951, p. 261).
Attitude is...an implicit, drive producing response considered so-cia1ly* significant in the individual's society (Doob, 1947, p.156).
Attitudes are ”relatively enduring organizations of feelings, be-liefs, and behavior tendencies directed toward specific persons,issues, objects, or groups" (Baron 8 Byrne, 1984, P. 165).
Attitudes refer to the stands the individual upholds and cherishesabout objects, issues, persons, groups, or institutions (Sherif,Sherif 8 Nebergall, 1965, p. 4).
An attitude is a relatively enduring organization of beliefs aroundan object or situation predisposing one to respond in some prefer-ential manner (Rokeach, 1968, P. 112).
Although the list is short, it highlights some of the past and present
controversies in attitude theory and the universal lack of definitional
precision. The situation is similar to McGuire's (1968) description of
attempts to differentiate attitudes and opinions as "a situation involv-
ing names in search of a distinction, rather than a distinction in search
of a terminology" (p. 152).
Berkowitz (1972), a social psychologist, attempted to give some
structure to the various definitions by aggregating them into three
schools of thought:
1. Readiness to respond - in a specific way to an
attitude object .
71
2. Evaluative or feeling reaction — favorableness or _
unfavorableness of feeling toward a phenomenon.
3. Constellation of cognitive, affective, and
conative components - a combination of beliefs,
feelings, and actions directed toward an object.
Proponents of the first school conceive of attitudes as a precondition
of behavior or preparation for overt response (Allport, 1935; Bogardus,
1931; Cantril, 1934). This readiness can exist in various degrees from
dormant habits to conscious tension and exert a directive influence on
behavior. Another group holds that attitudes are affective or evaluative
responses (Fishbein, 1966; Osgood, Suci, 8 Tannenbaum, 1957; Thurstone,
1931). Favorableness or unfavorablenenss toward some object represents
a person's attitude about that object. Finally, a third group favors a
tripartite conceptualization (Baron, 8 Byrne, 1984; Katz 8 Stotland,
1959; Krech, Crutchfield, 8 Ballachey, 1962; Rosenberg 8 Hovland, 1960).
The affective component is combined with cognitive and behavioral compo-
nents in a multifaceted phenomenon called attitude. The cognitive com-
ponent refers to individuals' beliefs or knowledge about attitude objects
and the behavioral component represents what they intend to do about their
knowledge and feelings.
Attitudes are motivated by stimulus conditions (Fishbein 8 Ajzen,
1975; Rosenberg 8 Hovland, 1960) which can be any internal or external
phenomenon related to the attitude object. For example, personality,
physical ability, situational factors or other people act as stimuli.
72
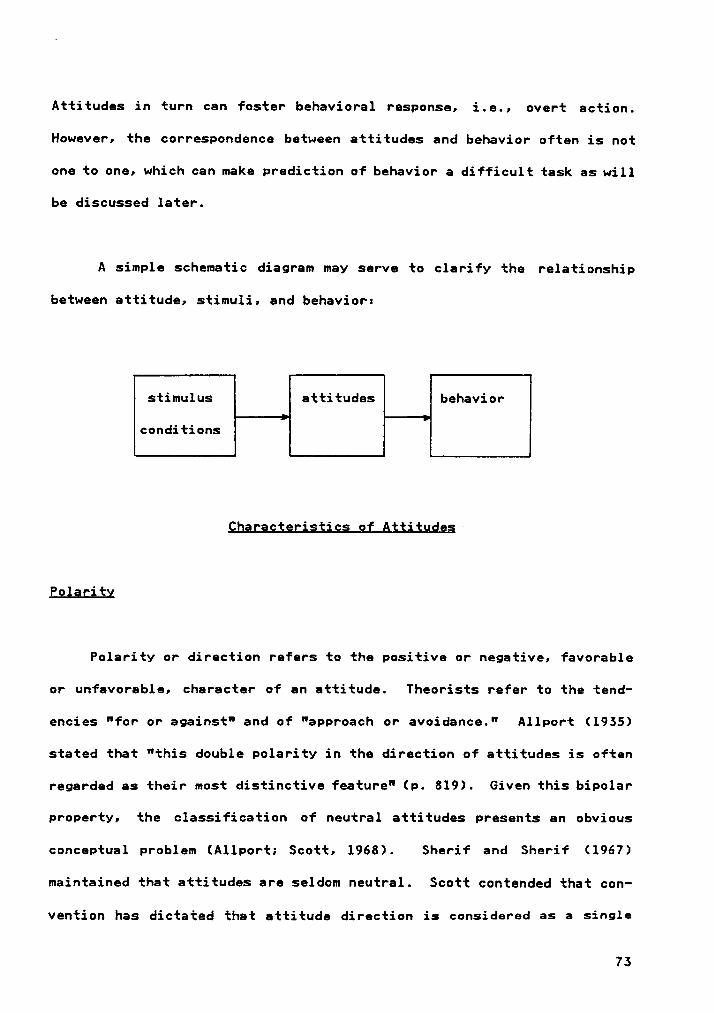
Attitudes in turn can foster behavioral response, i.e., overt action.
However, the correspondence between attitudes and behavior often is not
one to one, which can make prediction of behavior a difficult task as will
be discussed later.
A simple schematic diagram may serve to clarify the relationship
between attitude, stimuli, and behavior:
stimulus attitudes behavior
conditions
Qba;eeteri;tie; of Attitude;
Poiegity
Polarity or direction refers to the positive or negative, favorable
or unfavorable, character of an attitude. Theorists refer to the tend-
encies "for or against" and of "approach or avoidance." Allport (1955)
stated that "this double polarity in the direction of attitudes is often
regarded as their most distinctive feature" (p. 819). Given this bipolar
property, the classification of neutral attitudes presents an obvious
conceptual problem (Allports Scott, 1968). Sherif and Sherif (1967)
maintained that attitudes are seldom neutral. Scott contended that con-
vention has dictated that attitude direction is considered as a single
75
bipolar attribute when in reality degree of favorableness and degree of
unfavorableness could be distinct concepts present at varying levels and
combinations vdthin each individual. If "opposite” tendencies can be
present simultaneously in the attitude construct„ then the likelihood of
ambivalence not only exists but increases as the tendencies become
strenger and more equal.
Lnieväix
In general, the strength of or commitment to an attitude is its in-
tensity (Cantril; 1946; Hartley 8 Hartley, 1952; Nasson, 1975). Attitudes
may be very lightly held and easily changed or deeply ingrained in the
subject's disposition. Hovland, Harvey, and Sherif (1957) proposed a
measure of commitment or ego-involvement which is the ratio of the lati-
tude of acceptance to the latitude of rejection. The latitude of ac-
ceptance is represented by the number of acceptable alternatives, and the
latitude of rejection by the number of unacceptable alternatives. Com-
mitment to an attitude is weak if the ratio of the two latitudes
(acceptance/rejection) is large. In other words, the more acceptable
alternatives that exist; the weaker the attitude commitment or strength.
Saliengy
A salient attitude is one which is prominent or more readily expressed
(Hart1ey 8 Hartley, 1952). Scott (1968) suggested that saliency may also
be related to centrality (Krach 8 Crutchfeld, 1948) or the importance of
74I
the attitude object to the individual. The more salient the attitude,
the more likely it is to affect overt behavior (DeFleur 8 Nestie, 1958)
and the more enduring it tends to be.
Agggigigion by Learning
Attitudes are not inherited, they must be developed (Fishbein 8 Ajzen,
1975; Rokeach, 1968; Sherif 8 Sherif, 1967). The consumer internalizes
information from dispositional sources, e.g., needs, motives, personal-
ity, aspirations; and situational sources, e.g., friends, teachers, par-
ents, and culture. There are several ways in which attitudes can be
learned (Nilliams, 1982):
l. Exposure - Simple familiarity with the psycholog-
ical object can lead to attitude formation.
Maslow (1937) demonstrated this in an experiment
in which subjects were repeatedly exposed to se-
veral paintings by well-known artists. Nhen sub-
jects were later shown different paintings, they
usually preferred the familiar ones. In like
manner, Krugman (1943) exposed classical music
devotees to swing music and vice versa. At the
end of eight weeks, both sets of music lovers had
developed a favorable attitude toward the music
they had previously shunned.
75
2. Conditioning - Individuals may formulate attitudes
as a result of the environment surrounding the
attitude-object or reinforcement from other indi-
viduals. Staats and Staats (1957) conducted ex-
periments which showed that attitudes toward
nonsense syllables may be classically conditioned
by pairing them with words having evaluative
meaning.
5. Observation ·· New attitudes may be established
simply by watching the behavior of others
(Campbell, 1965).
4. Information Processing/Problem Solving - As indi-
viduals use information to solve problems, they
form attitudes based on the information they have
available. Attitudes develop from the consumer's
evaluation of the ability of the attitude object
to provide desired benefits (Mitchell 8 Biglan,
1971).
Stgbility
Attitudes tend to be long lasting and without large variation in the
short term (Rokeach, 1968; Sherif 8 Sherif, 1967). The extended time span
usually necessary for attitude formation and change helps to differen-
tiate whim from true attitude. Three determinants of attitude stabilitv
are confidence, involvement, and change in mood (Day, 1970). In general,
76
people who are involved, confident, and resistant to mood alterations with
regard to an attitude object have corresponding attitudes which are rel-
atively stable and enduring. Nalters (1978) offered several reasons for
attitude instability: (1) conflicts between attitudes, (2) situational
variations, (3) the existence of multiple attitudes, and (4) traumatic
experiences.
Consistency theories are based on the notion that a person "tends
to behave in ways that minimize the internal inconsistency among his
interpersonal relationships, among his intrapersonal cognitions, or among
his beliefs, feelings, and actions" (McGuire, 1966, p. 1). Once again
there appears to be an overabundance of terms representing a single con-
cept "consistency" (e.g., balance, congruity, symmetry, consonance),
however most can be classified under one of three headingsz balance the-
ory, congruity theory, and cognitive dissonance theory (Suedfeld, 1971).
The initial formulation of balance theory is normally attributed to Heider
(1946) although other theorists have adopted similar assumptions of cog-
nitive balance. The dynamic element of Heider's theory is the desire to
maintain balance or harmony between cognitive elements, i.e., people,
objects, events, and acts. Positive and negative sentiments toward these
perceived units are brought into agreement or balance to eliminate the
discomfort of contradictions in the individual's life space. Expansion
and improvement of Heider's principle was undertaken bv several subse-
77
quent investigators and theorists (Abelson 8 Rosenberg, 1958; Cartwright
8 Harary, 1956; Feather, 1967).
Osgood and Tannenbaum's congruity theory (1955) is really a special
case of balance theory dealing specifically with situations involving
acceptance of a communication (Kiesler, Collins, 8 Miller, 1969). In this
theory, emphasis is on the intensity of the attitude and its relation to
attitude change. The idea of cognitive dissonance was originally proposed
by Festinger (1964) and later modified by others (Aronson, 1968; Brehm 8
Cohen, 1962). Dissonance, or inconsistency between cognitive elements,
creates psychological tension which motivates a person not only to reduce
the dissonance but also to avoid situations and information which would
increase it.
Qomglgxity
An individual striving for consistency and stability may simultane-
ously seek novelty and exploration (ßerlyne, 1960; Fiske 8 Maddi, 1961;
Fowler, 1965). McGuire (1966) termed these theories "complexity theo-
ries," and noted the unexpected peaceful coexistence of consistency and
complexity theories within the field of psychology. Kiesler et al. (1969)
maintained that the two theories need not be contradictory since indi-
viduals may desire consistency in their cognitive world while at the same
time express curiosity or the need to explore.
78
Pepitone (1966) proposed several hypotheses for cognitive tension-
seeking behavior. The idea of hitting one's head against a wall in order
to enjoy the pleasure of stopping exemplifies motivation which seeks to
"maximize the satisfaction from ultimate tension reduction" (p. 260).
Alternately, individuals may strive for inconsistency to divert attention
from deeper, more painful internal conflicts, or they may seek an optimal
level of cognitive tension between total consistency and total incon-
sistency.
ßeiationshig beiwegg Aijiiudgs ang Behavior
The interest in attitudes exhibited by social psychologists and more
recently by market researchers reflects the unending search for explana·
tions of individual behavioral differences. Thus, inconsistencies be-
tween attitudes and associated behaviors have given rise to considerable
concern from researchers and those attempting to apply attitude-behavior
concepts in practice.
The classic and widely·cited research conducted by· sociologist
LaPiere in 1934 was one of the first significant studies highlighting
attitude-behavior inconsistency. LaPiere traveled cross-country with a
Chinese couple and received service in nearly every motel and restaurant
visited along the way. However, when he later wrote to the same propri-
etors asking if they would serve an Oriental couple, most stated that they
would refuse to do so. Although LaPiere's methodology was criticized,
79
it sparked a reexamination of the concept of attitude and its relation
to behavior.
Examples of attitude·behavior inconsistencies abound. In fact as
Antil (1978) pointed out, it is easier to find studies which show a lack
of correspondence between attitudes and behavior than to locate those
which delineate a direct relationship (Ehrlich, 1969; Liska, 1974;
McGuire, 1976; Tittle & Hill, 1967b). Nevertheless, investigation of the
attitude-behavior link continues and rightly so. As Antil (1978) ex-
plained,
It is true that investigators have persisted in their beliefs aboutthis relationship; however, this persistence is based upon firmconvictions that the theoretical concept of attitude is useful andnecessary to the behavioral sciences. No one can argue with thefact that even after 75 years of research, the exact relationshipbetween attitudes and behavior has not been established, or for thatmatter proven to even exist. But this lack of success does notprove that the basic concepts are invalid (p. 48).
Factors associated with the interaction between attitudes and behavior
are discussed in the following sections to provide a better understanding
of that relationship and to furnish guidance for the development of an
attitude measure.
Caugal Rglajiggghigg
Traditionally, attitudes were thought to precede overt behavior. A
change in attitude fostered a corresponding change in behavior. However,
Katz & Stotland (1959) explained that "nearly every phenomenon of an in-
89
dividual's social life which is influenced by another factor also has some
influence upon that factor" (p. 425). Not surprisingly then, an opposing
theory emerged claiming that behavior resulted in attitude change.
In reality, both viewpoints are valid depending on the circumstances
(Bauer, 1968; Deutscher, 1966). For instance, direction of the ceusal
relationship may depend on the individual's degree of involvement in the
behavior of interest (Krugman, 1965). Involvement is defined as "the
activation of extended problem-solving behavior when the act of purchase
or consumption is seen by the decision maker es having high personal im-
portance or relevance" (Engel 8 Blackwell, 1982, p. 24). High involvement
may be fostered by situations which involve a great deal of risk or enx-
iety in either e social or economic sense. For example, the decision to
purchase an item of clothing which the consumer feels is a direct re-
flection of self-image might lead to high involvement. Consumers also
tend to be more involved in situations of considerable economic risk.
Big-ticket items will typically prompt a greater degree of problem solving
behavior than inexpensive items. Social pressure can lead to high in-
volvement if the individual is motivated to conform to societal expecte-
tions. Finally, the permanence of a decision can also effect the
individual's involvement. Irreversible decisions prompt more involvement
than ones which are easily changed.
The extended problem solving inherent in high involvement decisions
leads to the accumulation of new information which in turn effects the
individual's evaluetive criteria in beliefs, attitudes, and intentions.
31
I
These internal changes are followed by behavior change. Conversely, un-
important decisions are often made using current information which the
individual already possesses. In this case, changes in beliefs, attitudes
or intentions are the result of the decision already made, i.e., the be-
havior. Thus with high involvement, attitudes are thought to precede the
relevant behavior. With low involvement, behavior often forms the atti-
tude (Krugman, 1965).
Bem (1968) also conceded the possibility of a reversible causal se-
quence between attitudes and behavior. Individuals may form attitudes
by drawing inferences from accompanying behaviors. To illustrate, when
asked the question "Do you like brown bread?", the individual who responds
with "I guess I do, I'm always eating it" is using overt behavior to
formulate an attitude. Bem saw this self-perception (behavior—to-
attitude) model as merely a reinterpretation of the cognitive dissonance
studies. His own laboratory experiments lent further support to the model
(Bem, 1965, 1966). However, he found weaker evidence favoring the
attitude-to-behavior sequence. This causal relationship stems from the
hypothesis that attitude statements such as "I like brown bread" serve
as self-instruction in the same way that interpersonal instructions do.
Thus, repetition of the attitude statement elicits the corresponding be-
havior. In sum, Bem stated "we can be certain that we like brown bread
because we eat it. It may also be that we eat brown bread because we like
it" (1968, p. 214).
82
üutttglicity of Attitgdeg
Another factor affecting the interaction between attitudes and be-
havior is related to the number of attitudes held by an individual. Each
person has a large stock of attitudes which can be applied to various
situations. Although not all attitudes are salient to each behavior de-
cision, virtually all behavior involves a tradeoff between conflicting
attitudes (Hansen, 1968; Nasson, 1975). Certainly this is true in most
purchase situations which involve both negative attitudes about parting
with personal wealth and positive attitudes regarding the product to be
acquired. Evidence of attitude interaction has been provided by several
investigators (Jeffries & Ransford, 1972; Schwartz, 1968). The resol-
ution of attitude conflict is individually determined and hence resultant
behavior can show considerable variation (Walters, 1978). Consistency
theory attempts to explain the process by which resolution takes place.
A given behavior may be the result of entirely different attitudes
from two different individuals or from the same individual under different
circumstances. One person might purchase an item because of its color,
and another, who dislikes the color, may buy it because of its low price.
Prediction of behavior from attitudes is thus complicated by the lack of
a one-to-one relationship between the two variables.
83
1
Measurement Factors
Efforts to predict behavior from attitudes can be complicated by
problems in measuring the variables. Certainly the confusion over ter-
minology discussed earlier has contributed to some of these measurement
difficulties. The apparent lack of validity in commonly used measurement
procedures has also been a problem. Kiesler et al. (1969) leveled the
following criticism against attitude research: "The typical laboratory
investigation of attitude change employs one or two simple, unpretested
pencil and paper questions which reflect little of the theoretical em-
phasis on behavioral implications of attitudes or the methodological em-
phasis on elaborate measurement techniques" (p. 9). The assumption in
much research has been that "attitude is: 'whatever is measured by' my
pencil and paper test'" (p. 21).
There has been some controversy over the use of self-reported be-
havioral intentions and previous behavior as substitutes for measures of
actual behavior. Researchers have questioned the validity of these sub-
stitutes because of their susceptibility to demand artifacts and other
inherent inaccuracies (Deutscher, 1966; Phillips, 1971; Webb, Campbell,
Schwartz, & Sechrist, 1966). Measurement of overt behavior is not nec-
essarily more accurate however. People may intentionally or uninten-
tionally lie about their intended or past actions, but they may also
distort their behavior to reflect inner feelings which they do not hold.
In addition, overt actions are often susceptible to misinterpretation by
the observer. The difficulties inherent in measuring actual behavior and
84
the limitations of most research designs often necessitate alternate
techniques. Several studies indicated that self-reported intentions and
behavior can serve as adequate substitutes (Calahan, 1968; Clark & Tifft,
1966; Clausen, 1968; Liska, 1974; Tittle & Hill, 1967a). In his review
of research on attitude-behavior consistency, Liska concluded that "the
strong criticism (cf. Deutscher, 1966) leveled against the use of ques-
tionnaire items as a measure of overt behavior is not well empirically
substantiated" (p. 263).
Another measurement issue is the specificity of variables. There
is much evidence indicating that attitudes and behaviors which are not
measured at the same level of specificity will lead to inconsistencies
in attitude-behavior congruence. Fishbein, for example, noted a possible
reason for the failure to predict behavior from attitude: "Ne have often
measured attitude toward an inappropriate stimulus object--thus for ex-
ample we have often measured attitude toward a class of people or objects
when we should have been measuring attitude toward a particular member
of the class" (Fishbein, 1967, p. 483). Schuman and Johnson (1976) made
the same contentionz "The most generally accepted hvpothesis for im-
proving A-B consistency is that attitudinal and behavioral variables
should be measured at the same level of specificitv....Nhere the behavior
is a single specific act, this means that the attitudinal measure should
be specific also, and closely congruent with the act" (p. 170-1).
"Item difficulty" can also produce what appear to be inconsistent
results (Kiesler et al., 1969). The LaPiere (1934) study offers a good
85
example of results which were affected by differences in task difficulty.
The study compared face-to-face refusal of a well-dressed Chinese couple
accompanied by a European with refusal in a mail questionnaire of Chinese
people in general. The two tasks clearly represented different extremes
in item difficulty. Thus refusal in the "easy" task (questionnaire) and
acceptance in the "hard" task were not inconsistent. Inconsistency would
exist if subjects who refused face-to-face later accepted by question-
naire, or if they accepted by questionnaire and then refused face-to—face
(Campbell, 1963).
lgjgrgal Variable;
Attitude is only one of many psychological factors which can affect
behavior. Cook and Selltiz (1964) referred to these additional variables
as "other characteristics of the individual, including his dispositions
toward other objects represented in the situation, values he holds that
are engaged by the situation, his motivational state, his expressive
style, and so on..." (p. 37). To the extent that these factors influence
behavior, the relationship between attitude and behavior is clouded.
One such factor is knowledge. An individual may possess a favorable
disposition toward a clean environment (attitude object) but be ignorant
of the appropriate environmentally sound response. Maloney 8 Ward (1973)
discovered that general knowledge of ecology was weak despite the popu-
larity of the issue. Consequently, their construction of a knowledge scale
as part of a four-part ecology scale was a difficult task. Using that
86
scale, Antil (1978) found that consumer knowledge was closely related to
environmentally associated behaviors and attitudes but did not help to
explain inconsistencies between those attitudes and behaviors.
People differ in their willingness to undergo inconvenience or their
readiness to expend energy in a particular behavior. With respect to
ecologically oriented behavior, Kardash (1976) made the following state-
ment: "It is my contention that virtually all of us are ecologically
concerned consumers'--our degree of concern, however, varying directly
with the convenience/inconvenience of a particular eco—request'" (p. 5).
For example, many consumers might buy recycled paper but balk at return-
able bottles which are less convenient. Antil (1978) investigated the
effect of required effort on attitude-behavior inconsistencies but was
unable to draw any conclusions due to methodological problems.
Exjergal Variables(
Kiesler et al. (1969) made the point that behavioral differences from
situation to situation are much larger than those from attitude to atti-
tude. In diverse situations it would take a "practiced eye" to detect
attitudinal contributions to a particular behavior. The influence of
situational or environmental variables has been recognized for some time.
Lewin (1935) proposed a symbolic equation incorporating the effects of
environmental factors: B = f(P,E). Behavior (B) is a function of both
the person (P) and the environment (E). Using field theory as a founda-
tion, Lewin explained changes in attitudes and behaviors resulting from
87
heavy dependency on other people. Newcomb (1943) also stressed the im-
portance of interpersonal context in altering or sustaining attitudes.
In his view, the influence of reference groups on attitudes was so great
that other psychological processes were subordinate. The impact of ex-
ternal factors, whether they be social, legal, or economic, has been re-
peatedly emphasized in the field of social psychology.
Kiesler et al. (1969) highlighted several studies which demcnstrated
the effects of situational factors. Based on the findings of his study
of attitudes and behaviors toward Chinese people, LaPiere (1934) stated:
In the end I was forced to conclude that those factors which mostinfluenced the behavior of others towards the Chinese had nothingto do with race. Quality and condition of clothing, appearance ofbaggage.... Cleanliness and neatness were far more significant forperson—to-person reactions in the situations I was studying thanskin pigmentation, straight black hair, slanting eyes, and flatnoses...(p. 232).
A study by Minard (1952) revealed that the attitude and behavior
differences exhibited by coal miners toward Negroes were different de-
pending on the setting. In the mine, workers were under considerable
pressure from management to act in a nonprejudicial manner, but in town
no such pressure existed. Similarly, Lohman and Reitzes (1954) noticed
work-residency inconsistencies in another set of workers who were subject
to the anti-Negro attitudes of the neighborhood civic club and pro—Negro
attitudes of the local union.
88
As the foregoing discussion highlights, there are numerous examples
of attitude—behavior inconsistencies in the literature. Nonetheless,
there is also considerable evidence that attitudes can serve as relatively
reliable indicants of behavior (Bass, Pessemier, 8 Lehmann, 1972; Day,
1970; DeFleur 8 Nestie, 1958; Nettler 8 Golding, 1946; Sherif 8 Hovland,
1961). As Berkowitz stated,
Considering all of the conditions that could intervene between at-titude expression and behavior, it is surprising that attitude in-dicators predict action successfully as often as they do. It isdefinitely worth studying attitudes as predictors of, and partialcontributors to, behavior (1972, p. 49).
Summary of the Literature Review
One fact which the literature review highlights is the lack of
agreement among researchers and scholars about various sociopsychological
concepts and their interrelationships. Definitions for the term "atti-
tude" for example are quite varied, in part because of their nebulous
nature. Attitudes depend on a number of complex properties such as
saliency, consistency, polarity, complexity, and others. The connection
between attitudes and behavior is equally complex but vital to under-
standing why people act as they do. Causal relationships, measurement
error, and numerous other factors can affect the link between attitudes
and behavior. It is not surprising then that the instruments used to
measure sociopsychological constructs have differed not only in content
but also in their levels of reliability and validity. Although highly
precise measures may not be possible in this field, the lessons learned
89
from past research can serve as foundations for development and refinementof future measures.
Socially responsible consumption, another sociopsychological con-struct, has also been described by a variety of theoretical and opera-tional definitions. Here again, the quality of construct measurementfluctuates. Despite these differences, a tentative picture of the so-cially responsible consumer has begun to emerge from the literature.These individuals tend to have higher than average levels of education,income, occupational status, socioeconomic status, and community in-volvement. They are generally younger, more liberal and cosmopolitan,less dogmatic and status conscious, more concerned about health matters,and more likely to believe they can contribute to improvement of the en-vironment.
In an effort to define yet another concept, socially responsibleclothing consumption, related areas of literature were studied. TheNinakor (1969) clothing consumption model provided a framework for de-termining which phases of the consumption process to emphasize and sug-gested possibilities for further research in other phases. Severalcategories of behavior related to wastefulness or conservation in cloth-ing consumption were also reviewed: fashion consciousness, multi-purposegarments, secondhand apparel, analytical buying, clothing values, anddisposal methods. Attempts to characterize clothing consumers in thesecategories were hampered at times by conflicting results or insufficientdata.i
90

Overall, the literature review provides some understanding of the
relationship between attitudes and behavior and suggests a way of organ-
izing the literature and logically combining the concepts of socially
responsible consumption behavior (SRCB) and clothing acquisition and
discard (CAD) into a useful framework. Further, it offers guidance on
acceptable measurement variables and techniques.
91
I
CHAPTER III
STATEMENT OF THE PROBLEM
Consumption behavior is the acquisition, use, and disposition of
"goods, services, time and ideas by decision making units" (Jacoby et al.,
p. 22). Of particular interest in this study are two subsets of con-
sumption behavior, socially responsible consumption and clothing con-
sumption. SRCB is defined as "those behaviors and purchase decisions made
by consumers which are related to environmenta1—resource problems and are
motivated not only by a desire to satisfv personal needs, but also by a
concern for the welfare of society in general" (Antil, 1978, p. 5). SRCB
involves the efficient use of resources. Often by selecting products
which are recyclable, long-lived, nonpolluting, and nonresource intensive
consumers can derive the same benefits from consumption while reducing
the environmental costs or externalities. Encouraging others to adopt
these practices is also considered socially responsible behavior.
Clothing consumption behavior (CCB) has been described by Ninakor (1969)
as the "process of acquiring, storing, using, maintaining, and discarding
c1othing" (p. 629).
It is not unreasonable to assume that these two facets of consumption
behavior could overlap and that some individuals might consume clothing
in a socially responsible way as the diagram depictsz
92
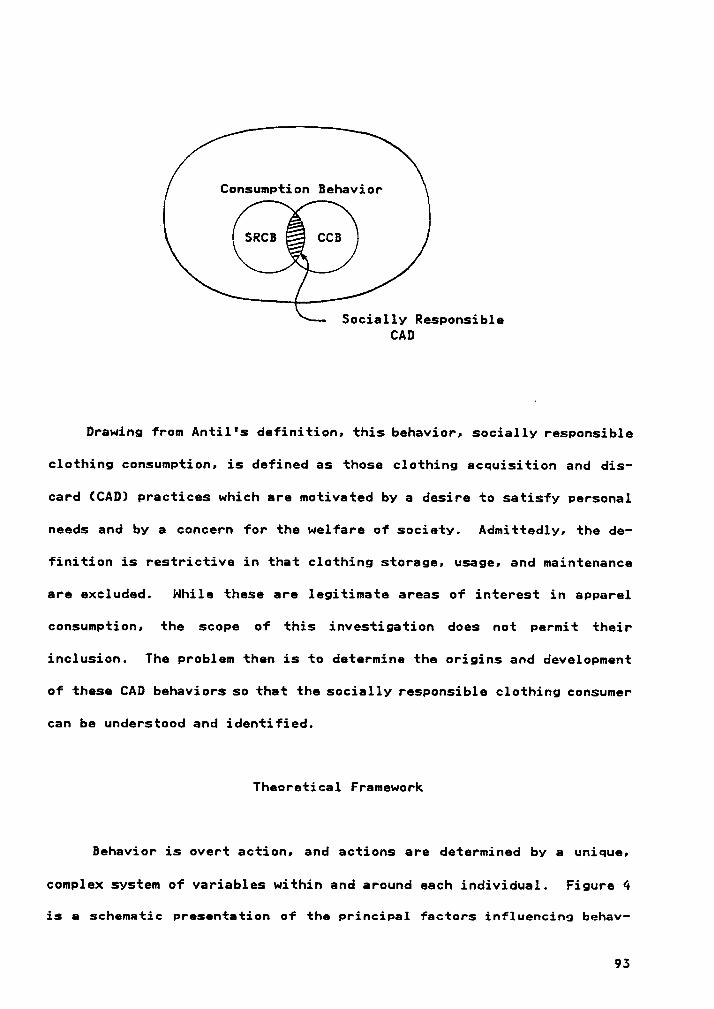
Consumption Behavior
éé'\
Socially ResponsibleCAD
Drawing from Antil's definition, this behavior, socially responsible
clothing consumption, is defined as those clothing acquisition and dis-
card (CAD) practices which are motivated by a desire to satisfy personal
needs and by a concern for the welfare of society. Admittedly, the de-
finition is restrictive in that clothing storage, usage, and maintenance
are excluded. While these are legitimate areas of interest in apparel
consumption, the scope of this investigation does not permit their
inclusion. The problem then is to determine the origins and development
of these CAD behaviors so that the socially responsible clothing consumer
can be understood and identified.
Theoretical Framework
Behavior is overt action, and actions are determined by a unique,
complex system of variables within and around each individual. Figure 4
is a schematic presentation of the principal factors influencing behav-
95
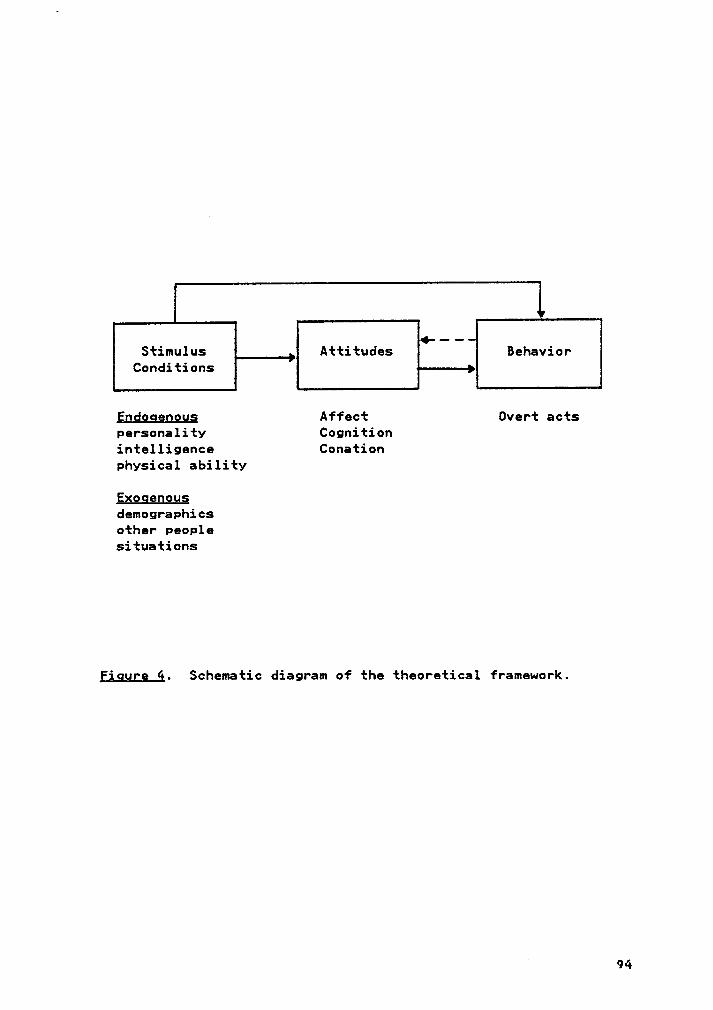
Q-•-—
Stimulus Attitudes BehaviorConditions
§gdogenou; Affect Overt actspersonality Cognitionintelligence Conationphysical ability
Egogegousdemographicsother peoplesituations
Ejgurg 4. Schematic diagram of the theoretical framework.
”94
iors stimulus conditions and attitudes. Stimulus conditions are phe-
nomena which contribute to the formation of attitudes and behavior. They
may be endogenous factors such as personality, mental capacity, and
physical ability, or exogenous factors such as income, other people, or
situational variables. Stimuli foster attitudes which in turn influence
behavior. In some cases, stimulus conditions affect behavior directly,
acting as resource constraints which alter the link between attitudes and
behavior. The literature provides numerous examples of attitude and be-
havior stimuli. For instance, time constraints and levels of physical
energy determine the effort that can be expended in acquiring, maintain-
ing, and discarding clothing. Exposure to relevant ecological informa-
tion affects purchase attitudes, as do psychological characteristics,
such as fashion consciousness, ecological consciousness, or self-
actualization. Income, education, and age are examples of demographic
stimulus variables which have been connected with ecologically conscious
attitudes.
According to one school of thought, attitudes are enduring systems
or organizations of three structural components: affect, copnition, and
conation. Affect refers to a person's favorable or unfavorable feelings
toward an attitude object. Cognition represents what is known or thought
about the object, i.e., a person's knowledge, beliefs, and opinions.
Included in this information base are beliefs about what relevant
referents think the person should or should not do with respect to a
particular behavior. For socially responsible consumers, the cognitive
component includes an awareness (knowledge) of the ecological alterna-
95
tives in consumption and often a belief that individuals can be effective
in combating ecological problems. Conation is an individual's behavioral
intention toward or desire to respond to an object in a certain way.
Frequently, intentions culminate in some sort of behavior or overt action.
Because of this association with behavior, attitudes can provide valuable
insight into behavior motivation.
The attitude-behavior relationship may be reversed so that actions
cause the formation of attitudes rather than vice versa. The consumer's
degree of involvement with a particular behavior could determine the
causal sequence. High involvement generally stems from high risk situ-
ations. Purchases of garments which are expressive of self-image, costly,
or highly innovative are potentially high-risk activities. In such cases
attitudes might tend to spawn behaviors. The opposite is often true in
cases of low involvement, i.e., behavior fosters a particular attitude.
Given the range of possible stimulus conditions and attitudes which
could pertain to a particular behavior and the inherent complexity of
interactions among all three variables in the model, it is not surprising
that attitude-behavior inconsistencies exist. Typical factors influenc-
ing the interaction between an attitude and a behavior are causal re-
lationships, multiplicity of attitudes, measurement factors, internal
variables, and external variables. Nonetheless, attitudes can be effec-
tive predictors of behavior (see Chapter II, p. 89).I
96
It is hypothesized that CAD behavior which is socially responsible
includes attempts to reduce waste in clothing by increasing the length
of garment ownership or extending its use-value. A greater degree of
analytical buying might be exercised to ensure higher satisfaction and
fewer discards. Perhaps classic styles would be preferred over high
fashion which would be more quickly outdated and discarded. To achieve
more use from garments, more multipurpose clothing might be purchased.
The importance of the secondhand market might increase as a vehicle for
garment acquisition and discard.
Assessment of attitudes related to these behaviors should provide a
better understanding of consumer motivation as well as a means of pre-
dicting which consumers will engage in these activities. Research on
socially responsible consumption and clothing consumption suggests a set
of stimulus conditions, attitudes, and actions associated with the fore-
going behaviors that could be used to identify the socially responsible
CAD consumer.
For example, clothing research indicates that both upper- and
lower-class people exhibit these behaviors. Consumers with higher in-
comes, socioeconomic status, educational attainment, and occupational
status are more likely to be analytical buyers and less likely to throw
clothing away. This seems reasonable since analytical buying requires
knowledge of garment attributes and planning of garment purchases,
actions which should lead to greater purchase satisfaction and less need
for discard. These same consumers usually have low economic values and
97
high esthetic values as evidenced by their concern for fashionability.
Consumers in the lower socioeconomic levels seem to lack interest in
fashion as a prestige factor and concentrate on comfort and traditional
styles. Although they practice some analytical buying skills, they may
lack the knowledge, experience, or income to be as discriminating as they
desire. Their lower incomes tend to contribute to high economic clothing
values, i.e., belief in the merits of eliminating waste and conserving
time, energv, and money.
This combination of class characteristics lends credence to Nebster's
(1975) description of the socially conscious consumer as a member of the
"upper-middle class countercu1ture" who from an attitudinal and behav-
ioral standpoint does not fall neatly into a specific class. Perhaps this
underlying trait could account for the more liberal-minded, less dogmatic
outlook associated with the ecologically conscious.
Socially responsible consumers tend to be low key individuals who
may be involved in community activities and organizations but generally
not as leaders. They choose not to push their beliefs onto others.
Conversely, fashion conscious people prefer a leadership role. They often
seek attention and exhibit an active, competitive, assertive nature. This
supports the idea that socially responsible consumers of clothing may be
indifferent to high fashion and more likely to favor classic style ap-
parel. Their involvement in community groups permits more frequent ex-
posure to a variety of acquisition and disposal sources (e.g., secondhand
98
markets) and fosters a greater need for different kinds of clothes or
versatile clothes that can be worn for several types of occasions.
Responsible consumers are characterized as individualistic, having
their own set of values and beliefs which may or may not accord with the
mainstream. This might explain their lower status consciousness and their
sometimes alienated nature. Nasson's (1968) concept of the non-
conformist buyer of classics accords with this description. Secondhand
clothing purchasers also display a degree of individualism. They reject
the social stigma attached to used clothing and may even think of their
shopping behavior as a rebellion against convention. Fashion leaders,
on the other hand, tend to exhibit more conforming and gregarious dis-
positions.
Concern for the environment implies a future-oriented, universal
outlook or a transcendence of the particular. The cosmopolitan nature
of SRCs seems to indicate that they may have broader horizons than other
individuals. How this concern is translated into action is not certain.
It is reasonable to conjecture that these individuals would carefully
analyze the effects of their consumption practices and try to bring them
in line with their ecological philosophy, much as the careful clothing
shopper analyzes wardrobe purchases. Although fashion leaders engage in
analytical buying to some extent, they· also have been described as
present—oriented and impulsive.
99
The universal outlook of SRCs may be motivated by a sense of altruism
or perhaps by sheer practicality. Nith regard to clothing, the social I
value, expression of regard for others through the use of clothing, ap-
pears to be unrelated to altruism. Further, it was consistently shown
to be of little importance to people in their clothing choices. The
economic value, concern for conservation of time, energy, and money, was
generally considered a very important factor to clothing consumers. This
value seems to be related to the concepts of practicality and reason-
ableness. It may also have something in common with "perceived consumer
effectiveness," one of the strongest predictors of socially responsible
consumers. Individuals who are not overwhelmed by environmental problems
but feel their actions can make a practical difference tend to be more
socially responsible.
Hypotheses
Operationally, the theoretical concepts are represented by specific
questionnaire items divided into three major sections which include five
scales in all. Figure 5 shows the scales and the constructs they measure.
Anti1's instrument, although labeled a behavior scale, utilizes state-
ments of beliefs, feelings, and intentions as measurement variables and
therefore is considered a measure of attitude for the purposes of this
research. A detailed explanation of each scale is presented in the fol-
lowing chapter.
100
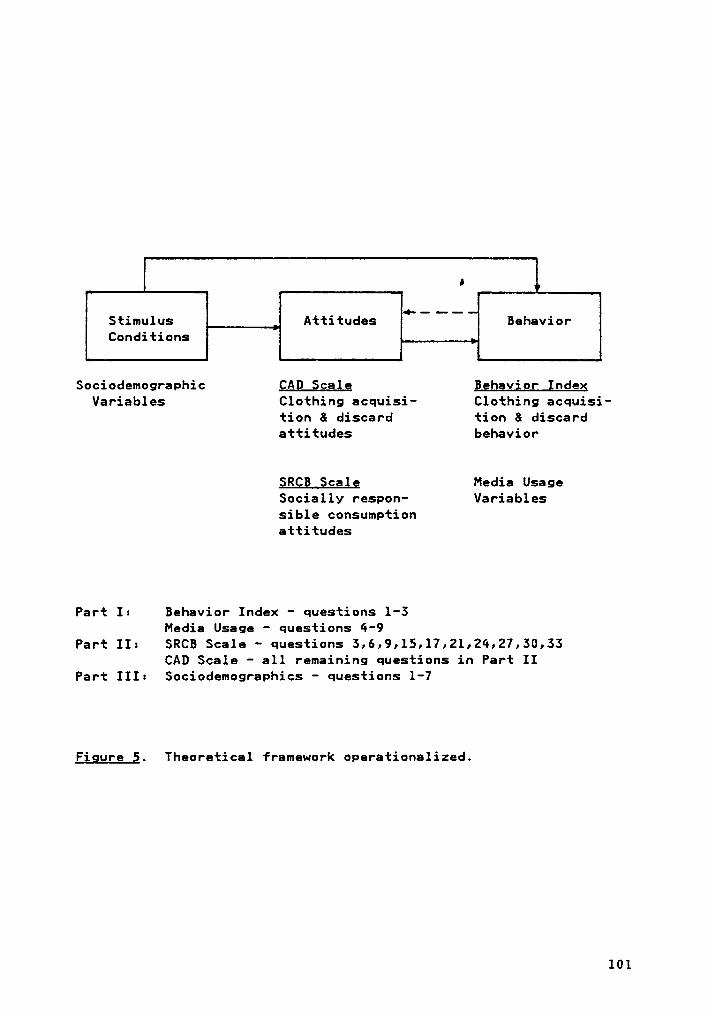
Stimulus Attitudes BehaviorConditions
Sociodemographic QAQ Scale Behavior IndexVariables Clothing acquisi— Clothing acquisi-
tion 8 discard tion 8 discardattitudes behavior
§RQ§ Scalg Media UsageSociallv respon- Variablessible consumptionattitudes
Part I: Behavior Index - questions l-5Media Usage - questions 4-9
Part II: SRCB Scale - questions 5,6,9,15,17,21•24»27,50,33CAD Scale - all remaining questions in Part II
Part III: Sociodemographics - questions 1-7
Figure §. Theoretical framework operationalized.
101
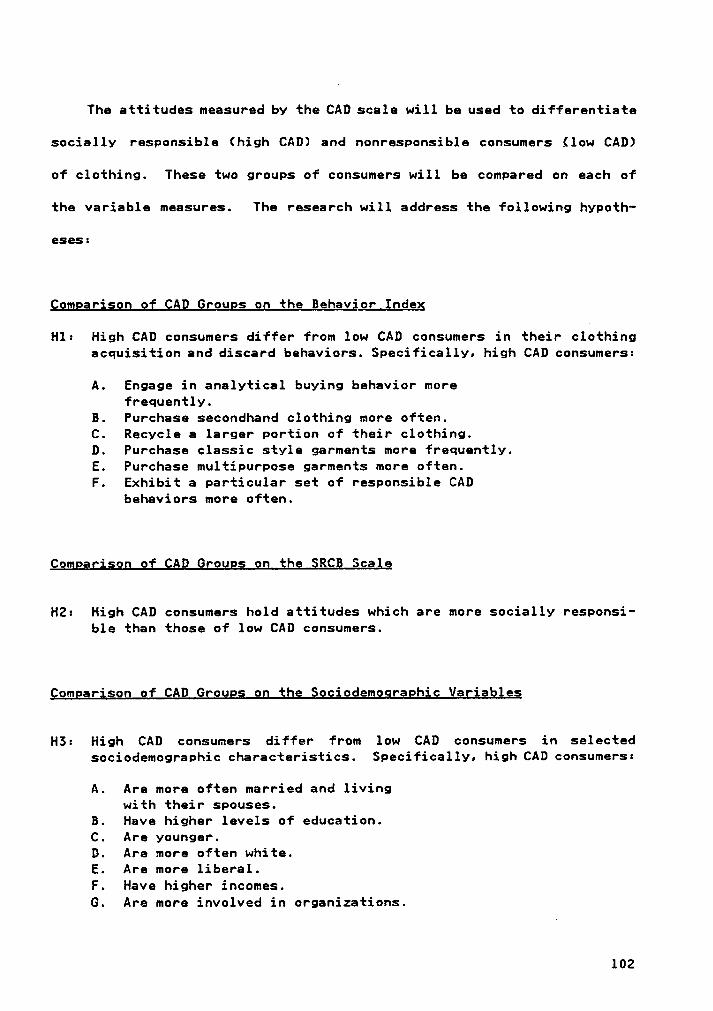
The attitudes measured by the CAD scale will be used to differentiate
socially responsible (high CAD) and nonresponsible consumers (low CAD)
of clothing. These two groups of consumers will be compared on each of
the variable measures. The research will address the following hypoth-
csesz
Qgmgarisog of CAD Qgougs gg the Behavior igdgg
Hl: High CAD consumers differ from low CAD consumers in their clothingacquisition and discard behaviors. Specifically„ high CAD consumers:
A. Engage in analytical buying behavior morefrequently.
B. Purchase secondhand clothing more often.C. Recycle a larger portion of their clothing.D. Purchase classic style garments more frequently.E. Purchase multipurpose garments more often.F. Exhibit a particular set of responsible CAD
behaviors more often.
Comgarison of QAD Qrougs on the §RC§ Scaig
H2: High CAD consumers hold attitudes which are more socially responsi-ble than those of low CAD consumers.
Qomgarison of CAD Grougs og tge Sggiodemggraghig Vagiagles
H5: High CAD consumers differ from low CAD consumers in selectedsociodemographic characteristics. Specifically, high CAD consumers:
A. Are more often married and livingwith their spouses.
B. Have higher levels of education.C. Are younger.D. Are more often white.E. Are more liberal.F. Have higher incomes.G. Are more involved in organizations.
102
H4: A relationship exists between CAD attitudes and selectedsociodemographic variables.
Coggagjsog of CAD Qrgugs on the [Qedig Usage Variables
H5: High CAD consumers and low CAD consumers differ in their media usage.
103
CHAPTER IV
PROCEDURE
AChapter IV details the research design. Selection of the sample and
determination of the sample size are discussed first. Following that, a
description of each research variable is presented, including development
of the CAD scale and assessment of its validity and reliability. Sta-
tistical techniques for analyzing the data are described along with the
purposes they are intended to serve. The last two sections outline the
limitations and assumptions associated with the research design.
The Sample
The subjects were adult female patrons of a regional shopping mall
in the Roanoke, Virginia, Standard Metropolitan Statistical Area (SMSA),
a three county area with about 224,000 residents (Martin Research, 1984).
The sample was limited to women in order to control for pcssible gender
variations in clothing consumption practices.
The Roanoke mall was chosen for two reasons. First, the designation*
of Roanoke as a naticnal test market (Neinblatt, 1983) implies that the
research results should be externally valid and therefore more
generalizable. Second, a marketing study initiated by the mall management
(Martin Research, 1984) indicated that in comparison with other Roanoke
shopping centers, this mall had a higher percentage of patrons in the
104
middle to upper socioeconomic and income levels. A homogeneous higher
income sample was desirable to lessen the importance of economic necessity
as a motivating force in behavior which appears environmentally related.
The disparity between the findings of Marquardt et al. (1974) and Murphy
et al. (1978) concerning eco-consciousness of black consumers might have
been due to differences in the socioeconomic levels of the two samples.
Also, Richardson (1981) observed negative attitudes toward secondhand
clothing in members of the lower classes, indicating perhaps that indi-
viduals forced to purchase such items have feelings which differ markedly
from those of higher classes.
Determination of the sample size was based on Cohen's (1969) proce-
dures for power analysis. Chi-square tests were of primary interest since
they composed the bulk of the analyses planned for this research. Ac-
cording to Cohen, the sample size needed for a chi-square contingency or
independence test depends on four factors: the effect size (e), degrees
of freedom (u), significance criterion (a), and power of the test.
Effect size, or the degree to which socially responsible clothing
consumption is present in the population, was expected to be small for
several reasons. Often in relatively new areas of research, such as so-
cially responsible consumption, measurement instruments are rudimentary
and tend to show only small effects. Indeed, for those studies on SRC
for which effect size (ratio) could be calculated, the values were small
(.10 - .20). In addition, personality and social research frequently
produce small effects because measures are difficult to perfect and issues
105
are·subtle (Cohen, 1969). As a frame of reference, Cohen defined a small
effect size (e) for x2 to be .05.
Nhen no other basis exists for setting the desired power level, a
value of .80 is generally considered a reasonable goal (Cohen, 1969).
This selection assumes a = .05, a common convention in much of behavior
research. The ratio of the Type I (a) to Type II (b = 1—power) error rates
would be b/a = .20/.05 = 4 to l, which implies that a mistaken rejection
of the null hypothesis is considered four times as serious as a mistaken
acceptance. As Cohen stated, "The notion that failure to find is less
serious than finding something that is not there accords with the con-
ventional scientific view" (p. 54).
The degrees of freedom (u) for an r x k contingency table are de-
termined by the size of the table, as the formula indicatesz
u = (r-1)(k—l)
The majority of the contingency tables for this study were expected to
be 2x3 or smaller. Thus the number of degrees of freedom was set at u =
2.
Given the foregoing parameters, a = .05, power = .80, e = .05, and
u = 2, the minimum sample size necessary for a X2 analysis would be ap-
proximately 193 (Cohen, 1969).
106
Variables
Five multi-item measures were included in the research design. A
scale measuring attitudes about socially responsible consumption behavior
(SRCB) was used for comparison with the researcher's measure of attitudes
toward socially responsible clothing acquisition and discard (CAD) be-
havior. The latter instrument was developed to address the research ob-
jectives. Three clothing behavior questions were used as behavioral
criteria to test the predictive validity of the CAD scale. Seven
sociodemographic questions and six media usage questions were included
to provide data for a profile of the responsible clothing consumer.
Sogially ßegggnsiblg Qonsumgtion Behavior Sgalg
The SRCB scale, developed by Antil (1978), is comprised of 40 Likert
scale items. As discussed in the literature review, several steps were
taken to substantiate the reliability and validity of the instrument.
These included: (1) extensive pretesting on large samples, (2) perform-
ance of item analysis and factor analysis at several stages, (3) "known
groups" validation and a modified version of Campbell and Fiske's (1959)
multitrait-multimethod procedure for construct validation, and (4) test-
ing and administering the scale using a national sample.
In order to reduce the size of the final questionnaire for the current
study, only the first quarter of the SRCB scale was used. The estimated
107
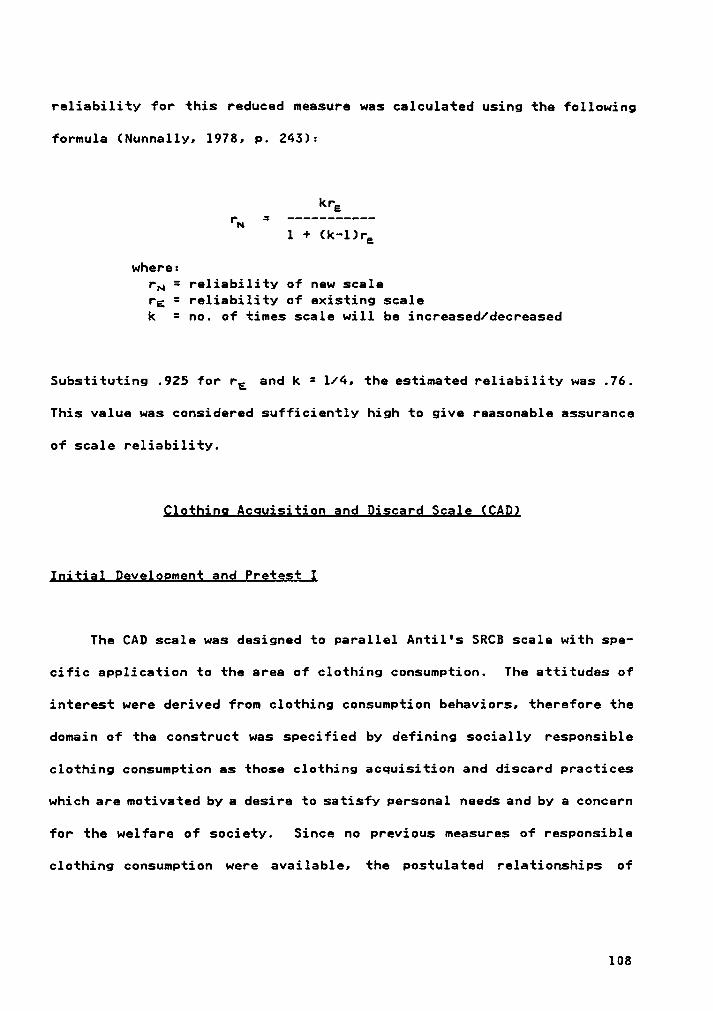
reliability for this reduced measure was calculated using the following
formula (Nunnally, 1978, p. 243):
krérN = -—-—-------
1 + (k-l)rg
where:rN = reliability of new scalera = reliability of existing scalek = no. of times scale will be increased/decreased
Substituting .925 for ra and k = 1/4, the estimated reliability was .76.
This value was considered sufficiently high to give reasonable assurance
of scale reliability.
Qlgthlng Acgulsitlon and Djgcard Scale §CAD)
lnltigl Development ggd Ergtggt l
The CAD scale was designed to parallel Antil's SRCB scale with spe-
cific application to the area of clothing consumption. The attitudes of
interest were derived from clothing consumption behaviors, therefore the
domain of the construct was specified by defining socially responsible
clothing consumption as those clothing acquisition and discard practices
which are motivated by a desire to satisfy personal needs and by a concern
for the welfare of society. Since no previous measures of responsible
clothing consumption were available, the postulated relationships of
108
clothing acquisition and discard practices to social responsibility were
based on suppositions logically derived from the literature.
The socially responsible CAD construct was perceived as a multidi-
mensional concept. Initial operationalization of the construct included
attitudes related to behavior in six areas of clothing consumption:
l. "Secondhand" - secondhand clothing purchases
2. "Recycling" - clothing disposal or recycling
3. "Analytical" - analytical buying
4. "Multipurpose" - multi—purpose garment purchases
5. "Fashion" - importance of fashion in acquisitionand disposal
6. ”General" — clothing wastefulness and pollution
Based on the literature and the author's own experience, a pool of 99
scale items related to these six areas was compiled. The items were re-
viewed by a member of the dissertation committee, a professor in the De-
partment of Clothing and Textiles, who was knowledgeable in the area of
clothing consumption. Several changes in wording and content were made
in accordance with the recommendations of the reviewer, after which the
instrument (Appendix A) was pretested on a group of 65 female seniors from
various academic departments of Virginia Polytechnic Institute and State
University. Respondents were also asked to comment on any ambiguous or
unclear items.
109
Comments from the pretest sample indicated that several of the re-
spondents were not familiar with secondhand clothing stores and were un-
certain about the meaning of words such as "secondhand," "recycle," "solid
waste," "classic," and "consignment shop." To clarify these terms, de-
finitions were included in the introductory comments of the question-
naire. A "does not apply" category was added for the items which might
not pertain to every respondent. Subjects were also advised to indicate
the response that ggg; described their general opinion or impression even
if they were not entirely certain about it. The complete questionnaire
administered in the second pretest is shown in Appendix B.
Table 5 indicates the item changes following the first pretest.
Response frequencies and item-total correlations were inspected as an
initial measure of the contribution of each item to the CAD scale. Items
were scored from one to five with the "strongly disagree" category equal
to one. Negatively stated items were reverse coded. Analytical buying,
as represented by the survey questions, was practiced so universally that
it was of questionable use as a distinguishing characteristic of socially
responsible consumers. Hence these questions were deleted from the CAD
scale.
A total of 21 questions was eliminated because of poor response
distribution. Other reasons for deletion were low item-total corre-
lations and lack of a clearly positive or negative response with respect
to the CAD construct. Three questions were reworded for clarification,
110
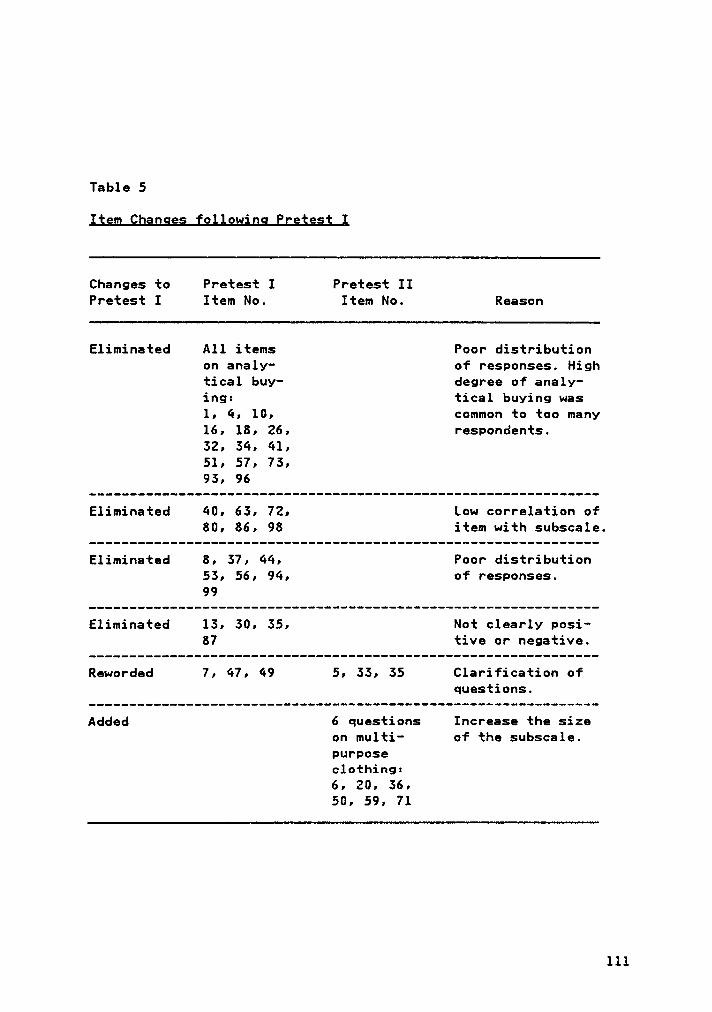
Table 5
ltem Qhagges following Pretest l
Changes to Pretest I Pretest IIPretest I Item No. Item No. Reason
Eliminated A11 items Poor distributionon analy- of responses. Hightical buy- degree of analy-ing: tical buying was1, 4, 10, common to too many16, 18, 26, respondents.52, 54, 41,51} 57} 75,
95, 96
Eliminated 40, 65, 72, Low correlation of80, 86, 98 item with subscale.
Eliminated 8, 57, 44, Poor distribution55, 56, 94, of responses.99
Eliminated 15, 50, 55, Not clearly posi-87 tive or negative.
Reworded 7, 47, 49 S, 55, 55 Clarification ofquestions.
Added 6 questions Increase the sizeon multi- of the subscale.purposeclothing=6, 20, 56,50, 59, 71
111
and six questions were added to the "multipurpose" factor to increase the
size of the subscale.
f’.Ls$äL.I.l
Because of the nature of the construct and the large number of items
(74) on Pretest II, a fairly large sample was considered necessary for
testing. Responses from 376 female students were obtained and analyzed.
This allowed for a better than 5 to 1 ratio of subjects to scale items.
To refine the measure, the unidimensionality of the subscales or
clusters was evaluated (Table 6). Prior to the analysis, it was decided
that any subscale retained in the CAD scale must have no less than five
items. However, a relatively short overall scale was desired to keep
completion time and respondent fatigue to a minimum. Danes and Mann
(1984) suggested three criteria for creating a unidimensional set of in-
dicators= homogeneity of content, internal consistency, and external
consistency,
Homogeneity of content refers to the face validity of the measure.
As discussed, all items were reviewed prior to the first pretest by a
knowledgeable individual and judged to be representative of the domain
of responsible clothing consumption as conceptualized. Pretest I also
served to eliminate ambiguity by asking respondents to review the
questions for clarity. Internal and external consistency were evaluated
112
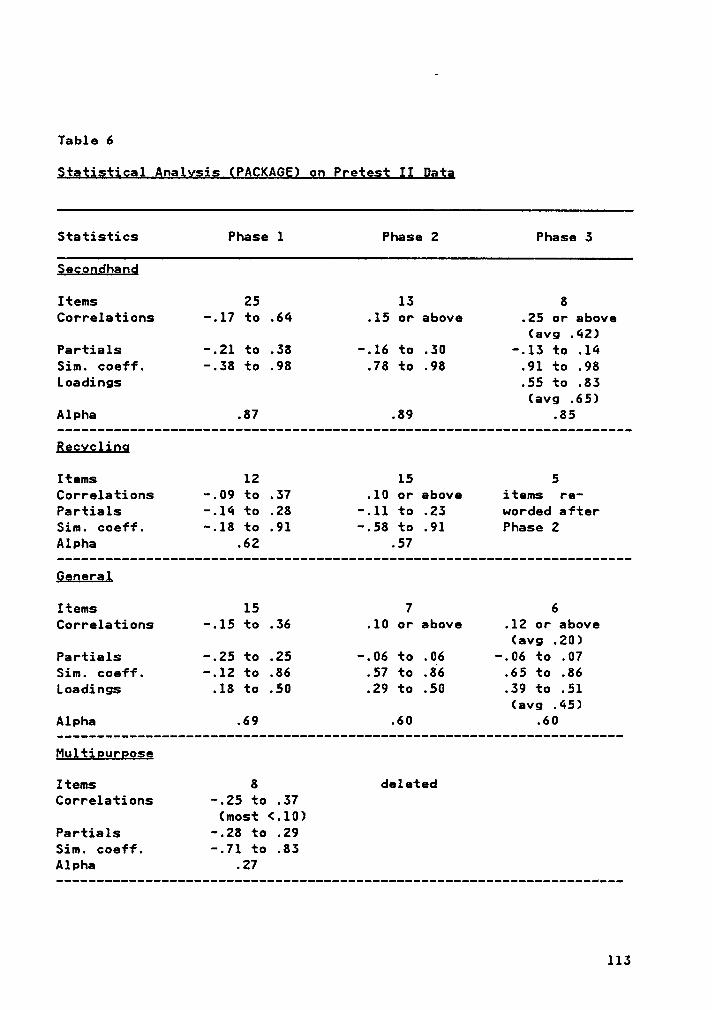
Table 6
Stggigtjgal Aga1¥;;; §PA§KAG§) gg Pgejggj II Dat;
Statistics Phase 1 Phase 2 Phase 5
Segogghagg
Items 25 15 8Correlations -.17 to .64 .15 or above .25 or above
(avg .42)Partials -.21 to .58 -.16 to .50 -.15 to .14Sim. coeff. -.58 to .98 .78 to .98 .91 to .98Loadings .55 to .85
(avg .65)Alpha .87 .89 .85
Beggcligg
Items 12 15 5Correlations -.09 to .57 .10 or above items re-Partials -.14 to .28 -.11 to .25 worded afterSim. coeff. -.18 to .91 -.58 to .91 Phase 2Alpha .62 .57
Qggerg;
Items 15 7 6Correlations -.15 to .56 .10 or above .12 or above
(avg .20)Partials -.25 to .25 -.06 to .06 -.06 to .07Sim. coeff. -.12 to .86 .57 to .86 .65 to .86Loadings .18 to .50 .29 to .50 .59 to .51
(avg .45)Alpha .69 .60 .60
Multiguggose
Items 8 deletedCorrelations -.25 to .57
(most <.10)Partials -.28 to .29Sim. coeff. -.71 to .85Alpha .27
115
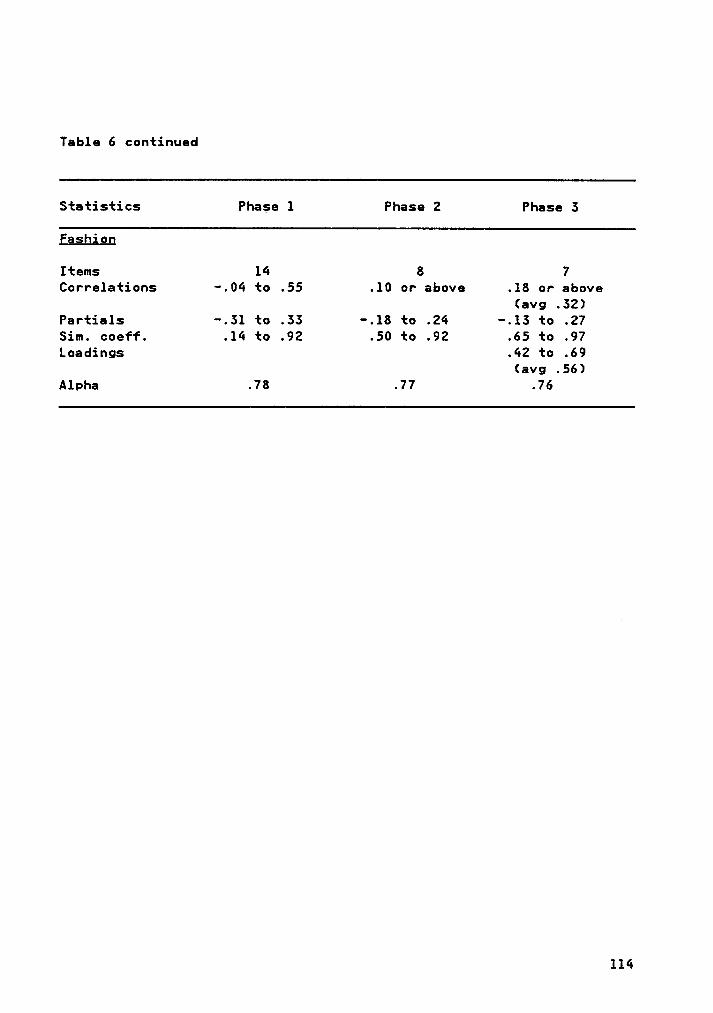
Table 6 continued
Statistics Phase 1 Phase 2 Phase 3
Eashjog
Items 14 8 7Correlations -.04 to .55 .10 or above .18 or above
(avg .32)Partials -.31 to .33 -.18 to .24 -.13 to .27Sim. coeff. .14 to .92 .50 to .92 .65 to .97Loadings .42 to .69
(avg .56)Alpha .78 .77 .76
114
using a computer analysis technique PACKAGE (Hunter 8 Cohen, 1969) which
is described in subsequent Paragraphs.
As an initial measure of internal
consistency, the inter-item correlations of all questions in each of the
five clusters were analyzed (Appendix C). Items measuring the same factor
were expected to have high, positive correlations. All items in the
"recycling,“ "general," and "fashion" clusters with correlations of .10
or below were eliminated. Because of the large number of items and gen-
erally stronger correlations in the "secondhand" cluster, the correlation
cutoff point for this factor was .15. The "multipurpose” cluster had the
lowest overall correlations (most were below .10). This fact, coupled
with the factor's small size (8 items) and its poor performance on other
tests, led to the decision to drop the "multipurpose" questions from the
scale.
Partial correlation matrices for each factor were also used to test
for internal consistency. Since these matrices partial out the underlying
trait variable, each partial correlation was expected to be close to zero
in a unidimensional cluster. That is, if items 1 and 2 are both
unidimensional indicators of the factor "secondhand," then the latent
"secondhand" variable is the sole nonrandom influence on these two items.
Partialing out the effect of the latent variable from the two indicators
should produce a partial correlation near zero (Danes 8 Mann, 1984). The
items having partial correlations with the highest absolute values (i.e.,
the farthest from zero) were generally the same items that had already
115
been designated for elimination because of low correlation coefficients.
Thus, this second measure of internal consistency corroborated the re-
sults of the first.
External consistency exists if each indicator correlates in the same
way with outside variables. This was tested by inspecting similarity
coefficients between items in different clusters. Similarity coeffi-
cients are indices of the consistency of two indicators in their corre-
lation with an outside variable (see Danes 8 Mann, 1984, p. 348 for
formula). Items in a unidimensional cluster should have similar corre-
lation patterns with items in other clusters. In other words, the range
of values for the similarity coefficients in a particular cluster should
be small. As Table 6 shows, similarity coefficients after the first
computer run were inconsistent. Once again, those items showing the
widest variation were usually those that performed poorly on the previous
tests and were deleted.
Hunter and Gerbing (1982) maintained that coefficient alpha should
be interpreted only after the three criteria of unidimensionality have
been satisfied. Therefore, the following alpha coefficients were evalu-
ated at this stage: "secondhand"
.87, "recyc1ing" .62, "genera1" .69,
”fashion" .78. Since Nunnally contended that reliabilities of .50 to .60
are generally sufficient for basic research, these values were considered
to be within acceptable limits (Nunnally, 1978).
116
In all, a total of 41 items was deleted during the initial reduction
of the CAD scale (Table 6). The remaining 55 questions were distributed
as follows: "secondhand" 15, "recycling" 5, "general" 7, and "fashion”
8.
Segond agg final ghases of igem glimiggtigg. A process similar to
that just described was followed in subsequent phases of item elimination.
The final CAD scale is composed of 26 items and four subscales= "sec-
ondhand" 8, ”recycling" 5, ”general" 6, "fashion" 7. The lowest inter-
item correlations for each factor were: "secondhand" .25, "general”.l2,
”fashion" .52, and ”recycling" .10. Due to the low correlations and
minimal number of items in the "recyc1ing” cluster, a decision was made
to reword the questions slightly in an effort to capture the construct
more effectively.
The final alpha coefficients were : "secondhand" .85, "general" .60,
"fashion" .76, and "recycling" .57. It was expected that rewording would
improve the coefficient for the "recycling" factor in the final survey.
Again, these reliabilities fall within Nunnal1y's guidelines of accepta-
bilitv.
To verify dimensionality, confirmatory factor analysis was performed
on the three intact subscales. The average factor loadings for each
subscale were: "secondhand" .65, "general" .45, and ”fashion" .56.
Factor loadings above .50 are generally judged to be substantial (Hair,
Anderson, Tatham, & Grablowsky, 1979; Hinkle, Niersma, & Jurs, 1979) since
117
they account for about 10% (square of the factor loading) of factor var-
iance. The average loadings and most of the individual variable loadings
met that standard. The results of the factor analysis indicated that the
scale construction procedure was successful in developing relatively pure
. measures of each factor, i.e., items were loading cnn a single parent
construct.
Item correlations between subscales were inspected to evaluate the
dimensionality of the entire CAD scale. Table 7 gives the range of cor-
relations and the average correlation for the items in each combination
of factors. The small magnitude of the average correlations implies that
the CAD construct has several dimensions, thereby confirming the earlier
assumption of multidimensionality.
In Chapter V additional analyses are reported on the final CAD scale
using data collected from the research sample. Two types of validation
are evaluated, construct validity and predictive validity. Evidence of
construct validity is provided when a measure performs in accordance with
theoretical expectations. To assess this Nunnally (1978) suggested the
following paradigm comprised of four hypothesesz
l. Constructs A and B correlate positively.2. X is a measure of construct A {i.e., X has construct validity}.3. Y is a measure of construct B.4. X and Y correlate positively (p. 104).
In practice, hypotheses 1 and 5 are assumed to be correct, and therefore
an empirical test of hypothesis 4 permits a valid inference regarding
118
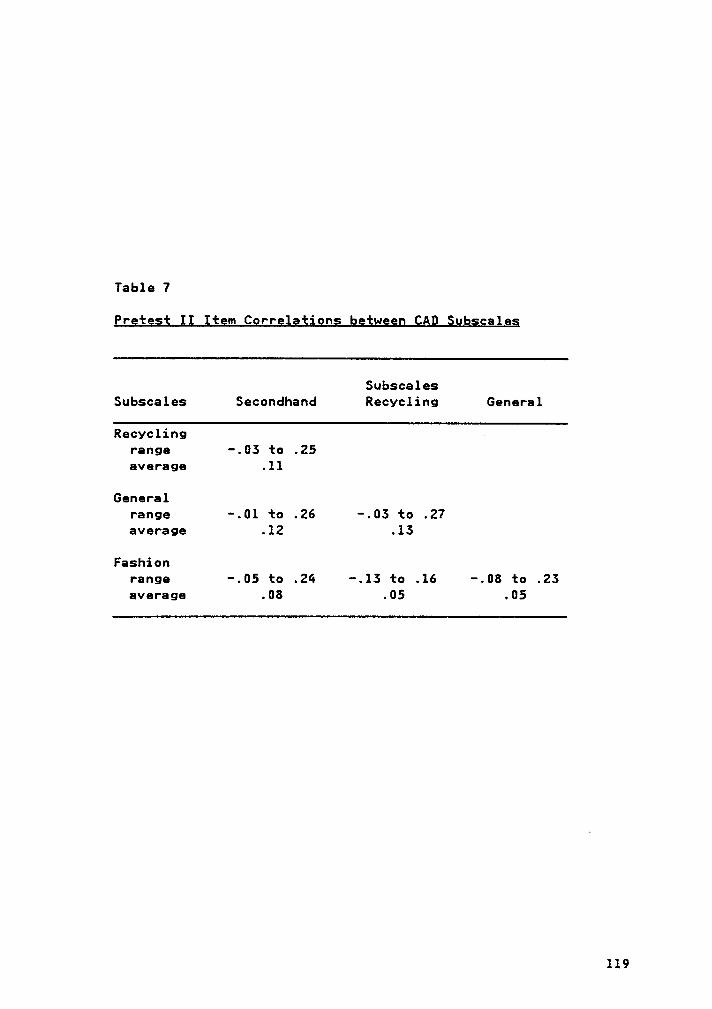
Table 7
Prgtesj I1 {tem Cgrgelajions between CAQ Subgcaleg
SubscalesSubscales Secondhand Recycling General
Recycling —
range -.03 to .25average .11
Generalrange -.01 to .26 -.03 to .27average .12 .13
Fashionrange -.05 to .24 -.13 to .16 -.08 to .23average .08 .05 .05
119
hypothesis 2. Hence as a somewhat crude measure of the CAD scale's con-
struct validity, the scale was correlated with an instrument which the
researcher believed could accurately measure attitudes regarding socially
responsible behavior, the SRCB scale.
Criterion-related or predictive validity (also called concurrent or
pragmatic validity) involves comparing scores on the predictor test with
scores on the criterion variable. To determine if the CAD scale would
predict behavior as expected, a behavioral criterion measure or index was
constructed. Predictive validity is determined by the degree of corre-
spondence or association between the two measures involved (Nunnally,
1978). Therefore, correlation coefficients between scores on the CAD
scale and the behavior index were calculated to evaluate the scale's
predictive validity.
Clothing Behavior lgde;
The behavioral criteria in this index were based on three areas of
clothing consumption represented by the CAD scale factors: purchase of
secondhand clothing, purchase of classic style clothing, and recycling
of clothing. In the statistical analyses, the behaviors were considered
separately and in combination. The reader may recall from the literature
that the attitude (predictor) and behavioral measures should be at the
same level of specificity. This multi-item behavior index, although
shorter than the CAD scale, should provide a measure more nearly equal
120
to it in specificity than the individual behavior items. Questions in-
cluded in the index assessedz
1. Frequency of purchase of secondhand clothing
2. Portion of clothing disposed of by recycling
3. Frequency of purchase of high fashion, current
fashion, and classic fashion clothes.
§ogigdemggragbig Vagiables
Sociodemographic information solicited from respondents was based
on past profiles of SRCs. All factors selected were found to be related
to SRCs in at least one study. Demographic variables included marital
status, education, income, race, and age. Additional factors were or-
ganizational involvement and political preference.
Mgdia Usagg Variable;
Further classification of respondents was made according to selected
media habits. With some alterations, questions were derived from the VALS
survey (Mitchell, 1983). These activities were chosen because they were
considered the most useful for market segmentations
1. Weekly hours of commercial television viewing
2. Weekly hours of PBS television viewing
3. Frequency of watching various television programs
4. Daily hours of radio listening
121
5. Frequency of newspaper reading
6. Frequency of reading various magazines
Final Questionnaire
The final questionnaire (Appendix D) was divided into three parts
as Table 8 depicts. The total number of responses was larger than the
number of questions because some of the questions had more than one part.
To estimate completion time, the questionnaire was administered to six
individuals in the College of Human Resources, including secretaries,
students, and faculty. The average completion time was about ten minutes.
Although shoppers are often in a hurry, the researcher felt that most
women would be willing to invest ten minutes of their time to complete
the survey.
Statistical Analyses
The procedures for refinement and validation of the CAD scale were
described earlier in this chapter. The same statistical evaluation was
conducted following the final survey to reassess the reliability and
consistency of the CAD scale.
In order to test the hypotheses, respondents were divided into three
sections based cn their CAD scores. The third with the highest scores
was designated "high CAD consumers" (high CADs), and the third with the
lowest scores was labeled "low CAD consumers" (low CADs).
122
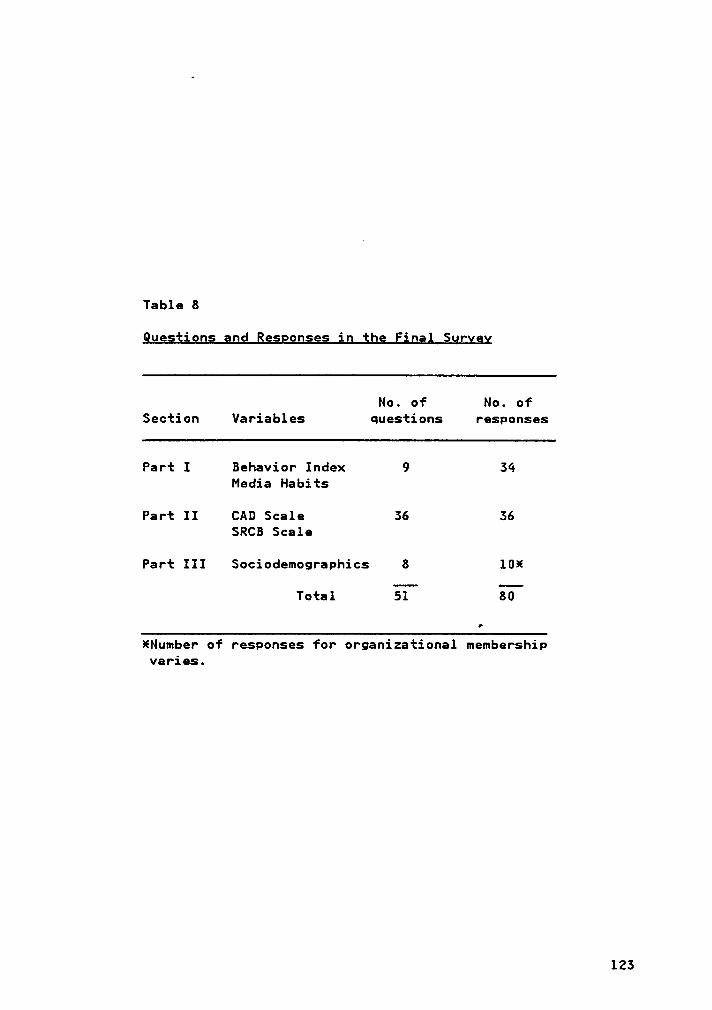
Table 8
Quegjiogg gnd Egsgonses ig the Final Survgy
No. of No. ofSection Variables questions responses
Part I Behavior Index 9 34Media Habits
Part II CAD Scale 36 36SRCB Scale
Part III Sociodemographics 8 10¤
Total 51 80
¥Number of responses for organizational membershipvaries.
123
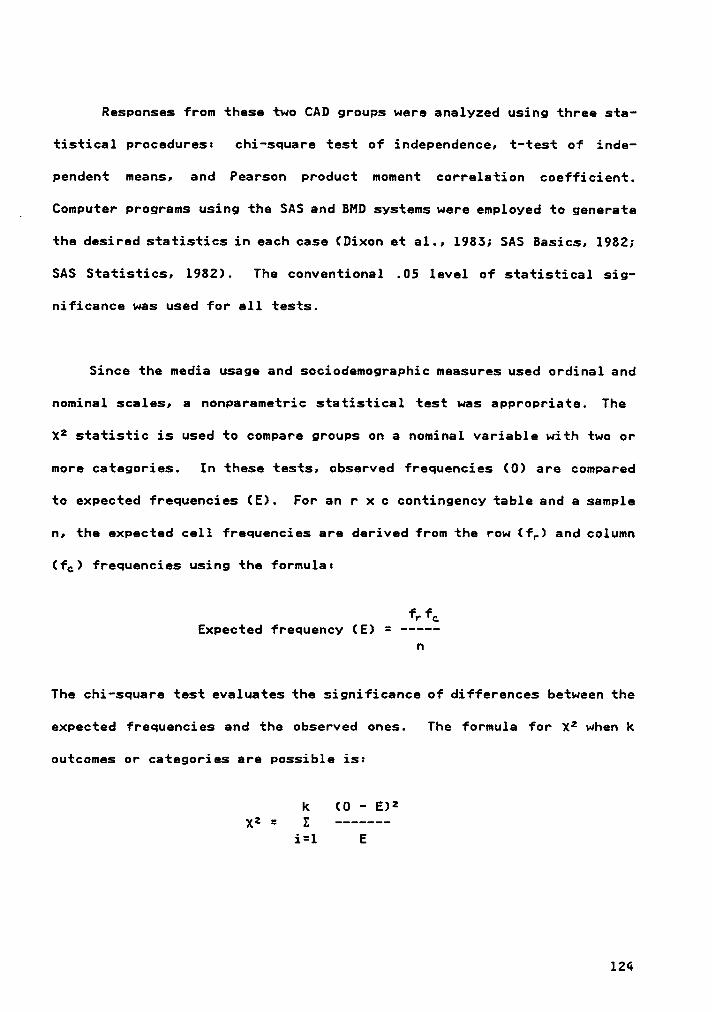
Responses from these two CAD groups were analyzed using three sta-
tistical procedures: chi-square test of independence, t-test of inde-
pendent means, and Pearson product moment correlation coefficient.
_ Computer programs using the SAS and BMD systems were employed to generate
the desired statistics in each case (Dixon et al., 1985; SAS Basics, 1982;
SAS Statistics, 1982). The conventional .05 level of statistical sig-
nificance was used for all tests.
Since the media usage and sociodemographic measures used ordinal and
nominal scales, a nonparametric statistical test was appropriate. The
X2 statistic is used to compare groups on a nominal variable with two or
more categories. In these tests, observed frequencies (0) are compared
to expected frequencies (E). For an r x c contingency table and a sample
n, the expected cell frequencies are derived from the row (f,) and column
(fc) frequencies using the formula:
f}fCExpected frequency (E) = ---·-
n
The chi-square test evaluates the significance of differences between the
expected frequencies and the observed ones. The formula for X2 when k
outcomes or categories are possible is:
k (0 - E)2X2: E .......
i=l E
124
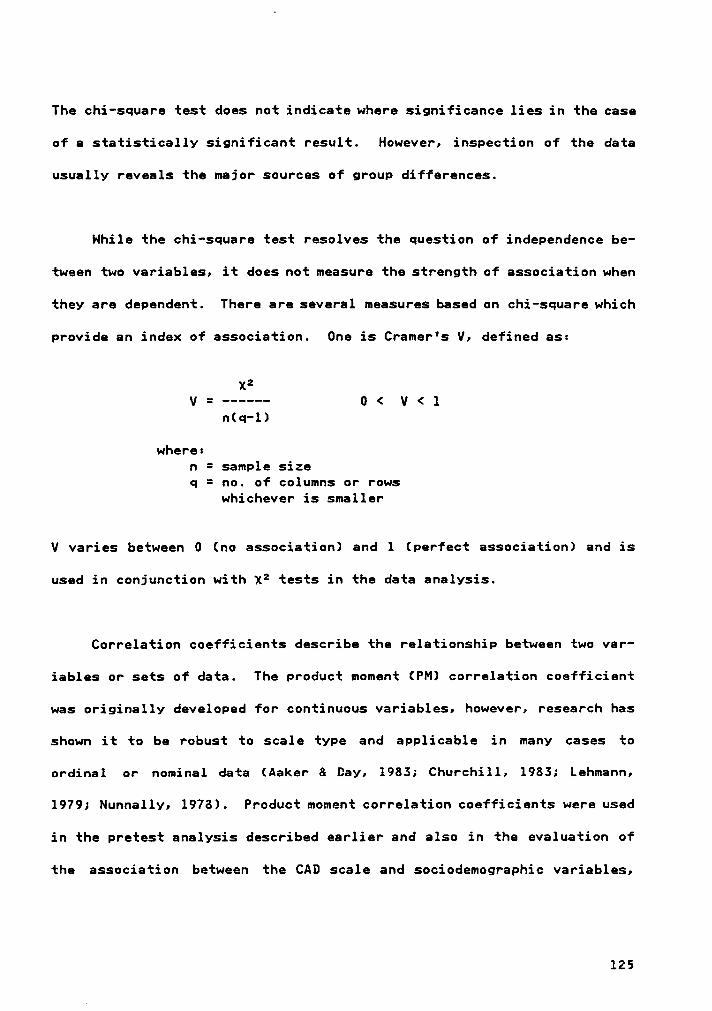
The chi—square test does not indicate where significance lies in the case
of a statistically significant result. However, inspection of the data
usually reveals the major sources of group differences.
Nhile the chi—square test resolves the question of independence be-
tween two variables, it does not measure the strength of association when
they are dependent. There are several measures based on chi—square which
provide an index of association. One is Cramer's V, defined as:
X2
V = ···-·— O < V < 1n(¤·l)
where:n = sample sizeq = no. of columns or rows
whichever is smaller
V varies between 0 (no association) and 1 (perfect association) and is
used in conjunction with x2 tests in the data analysis.
Correlation coefficients describe the relationship between two var-
iables or sets of data. The product moment (PM) correlation coefficient
was originally developed for continuous variables, however, research has
shown it to be robust to scale type and applicable in many cases to
ordinal or nominal data (Aaker & Day, 1983; Churchill, 1983; Lehmann,
1979; Nunnally, 1978). Product moment correlation coefficients were used
in the pretest analysis described earlier and also in the evaluation of
the association between the CAD scale and sociodemographic variables,
125
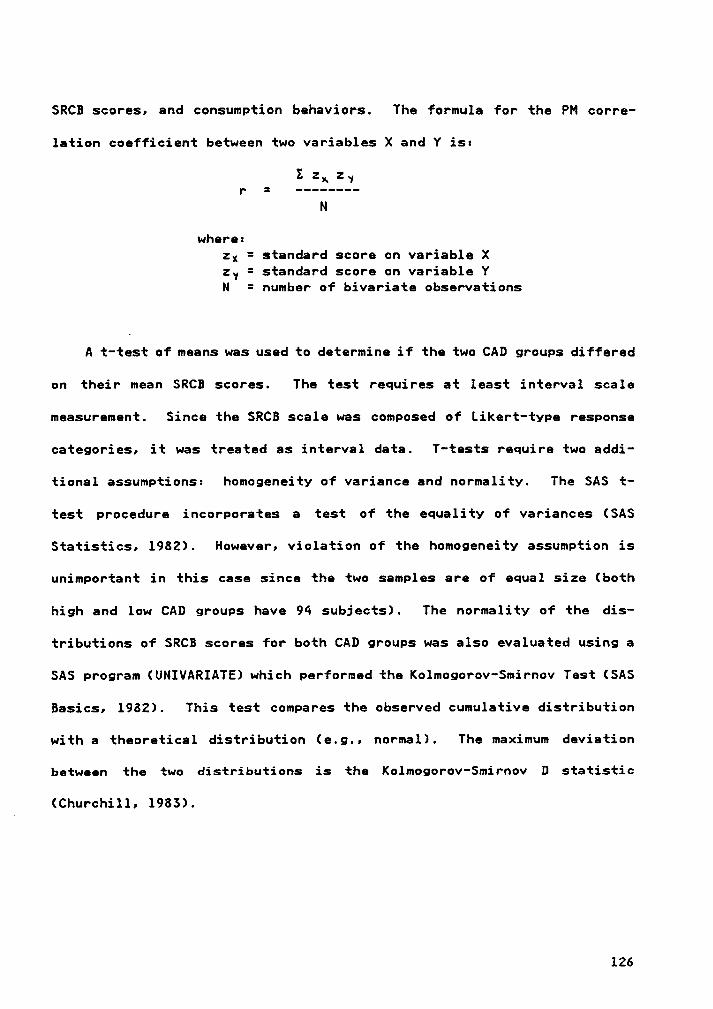
SRCB scores, and consumption behaviors. The formula for the PM corre-
lation coefficient between two variables X and Y iss
E zx zvr = -----—--
N
where:zx = standard score on variable Xzy = standard score on variable YN = number of bivariate observations
A t-test of means was used to determine if the two CAD groups differed
on their mean SRCB scores. The test requires at least interval scale
measurement. Since the SRCB scale was composed of Likert-type response
categories, it was treated as interval data. T-tests require two addi-
tional assumptionss homogeneity of variance and normality. The SAS t-
test procedure incorporates a test of the equality of variances (SASl
Statistics, 1982). However, violation of the homogeneity assumption is
unimportant in this case since the two samples are of equal size (both
high and low CAD groups have 94 subjects). The normality of the dis-
tributions of SRCB scores for both CAD groups was also evaluated using a
SAS program (UNIVARIATE) which performed the Kolmogorov-Smirnov Test (SAS
Basics, 1982). This test compares the observed cumulative distribution
with a theoretical distribution (e.g., normal). The maximum deviation
between the two distributions is the Kolmogorov-Smirnov D statistic
' (Churchill, 1985).
126
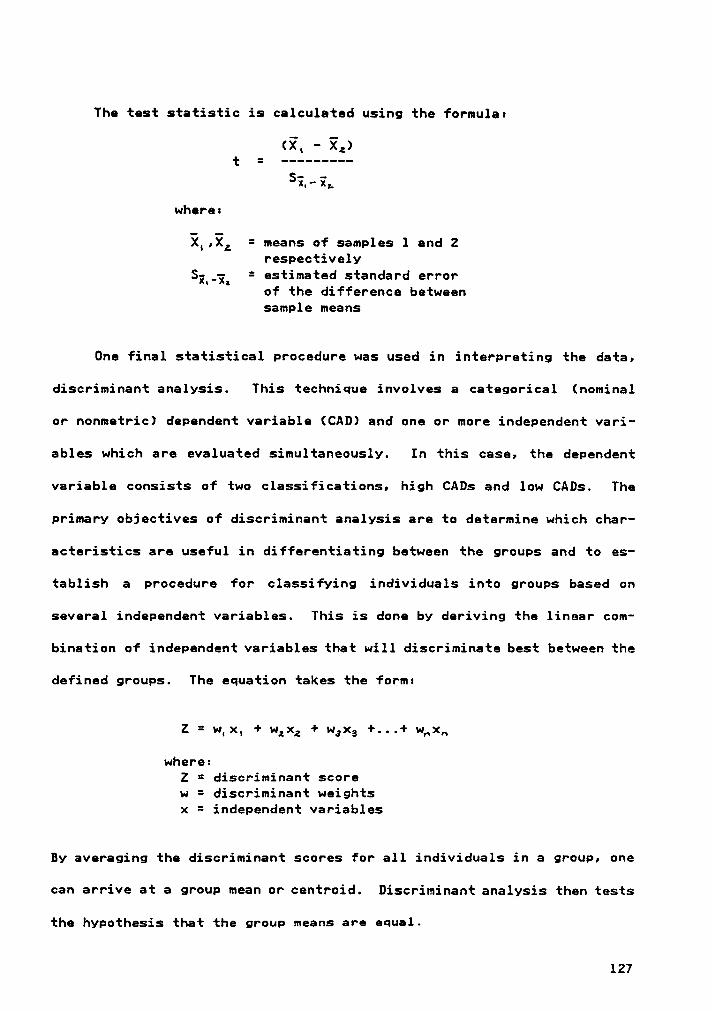
The test statistic is calculated using the formulaz
ci, - SE,)t = ----—-—--
5:.-:.where:
i·,Ya = means of samples 1 and 2respectivelySL_q; = estimated standard errorof the difference betweensample means
One final statistical procedure was used in interpreting the data,
discriminant analysis. This technique involves a categorical (nominal
or nonmetric) dependent variable (CAD) and one or more independent vari-
ables which are evaluated simultaneously. In this case, the dependent
variable consists of two classifications, high CADs and low CADs. The
primary objectives of discriminant analysis are to determine which char-
acteristics are useful in differentiating between the groups and to es-
tablish a procedure for classifying individuals into groups based on
several independent variables. This is done by deriving the linear com-
bination of independent variables that will discriminate best between the
defined groups. The equation takes the form:
Z = w‘x, + wax; + wax; +...+ w;x„
where:Z = discriminant scorew = discriminant weightsx = independent variables
By averaging the discriminant scores for all individuals in a group, one
can arrive at a group mean or centroid. Discriminant analysis then tests
the hypothesis that the group means are equal.
127
The BMDP7M stepwise discriminant analysis procedure (Dixon et al.,
1983) involves entering the independent variables into the function one
at a time according to their ability to discriminate, as measured by their
partial F values. Once the discriminant function has been determined»
the program develops a classification matrix which indicates the func-
tion's ability to discriminate between the categories of the dependent
variable. The percentage of subjects that is correctly classified is a
measure of the function's effectiveness as a tool for identification.
The discriminant analysis procedure is discussed in more detail in Chapter
V. Table 9 summarizes the statistical procedures used in this investi-
gation and the purpose of each.
Limitations
A general limitation of nonexperimental research is that it assesses
and compares phenomena that have already occurred. Manipulation of in-
dependent variables and strict control of extraneous variables are gen-
erally not possible in this design. Furthermore, subjects are selected
on the basis of demographic (in this case income) or psychographic char-
acteristics. These two factors, lack of control and subject selection,
restrict the elimination of rival hypotheses. Thus the researcher can
establish that a relationship between variables exists but cannot usually
justify causal inference. This is not a serious limitation to the present
study however, since the primary objective is to identify socially re-
sponsible clothing consumers and their characteristics, not to establish
causal relationships.
128
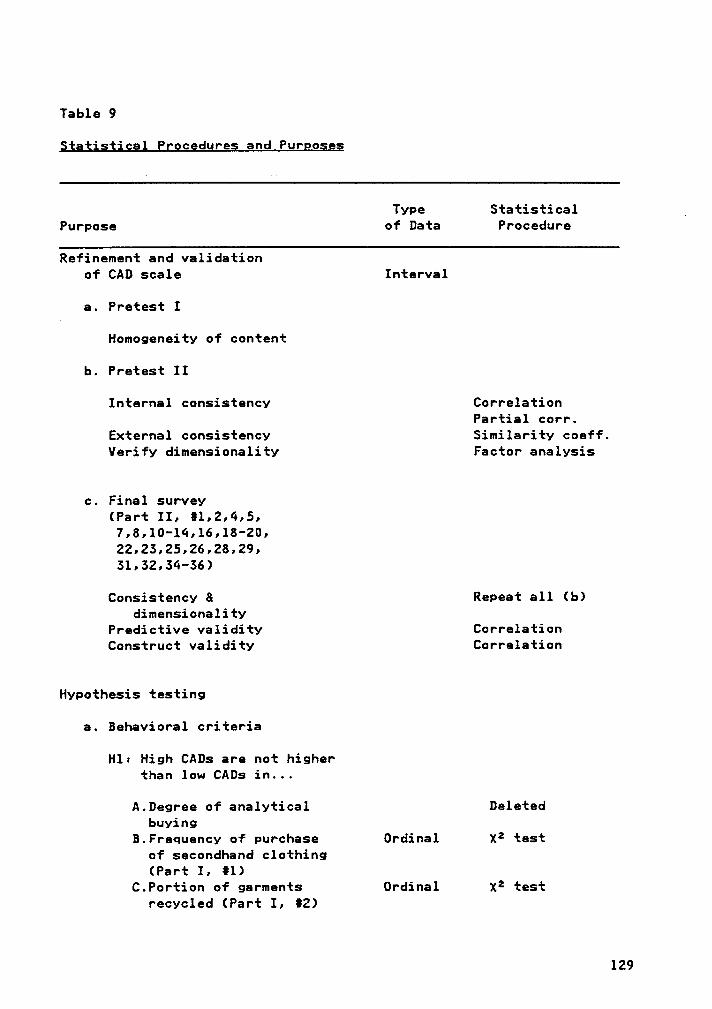
Table 9
§tgjjsjigal Pgocgdurgg and Pgrgoges
Type Statistical VPurpose of Data Procedure
Refinement and validationof CAD scale Interval
a. Pretest I
Homogeneity of content
b. Pretest II
Internal consistency CorrelationPartial corr.
External consistency Similarity coeff.Verify dimensionalitv Factor analysis
c. Final survey(Part
II,7,8,10—14,16,l8-20,
22,25,25,26,28,29,$1,52,54-56)
Consistency 8 Repeat all (b)
dimensionalityPredictive validity CorrelationConstruct validity Correlation
Hypothesis testing
a. Bahavioral criteria
Hl, High CADs are not higherthan low CADs in...
A.Degree of analytical Deletedbuying
B.Frequency of purchase Ordinal X2 testof secondhand clothing(Part I, #1)
C.Portion of garments Ordinal X2 testrecycled (Part I, #2)
129
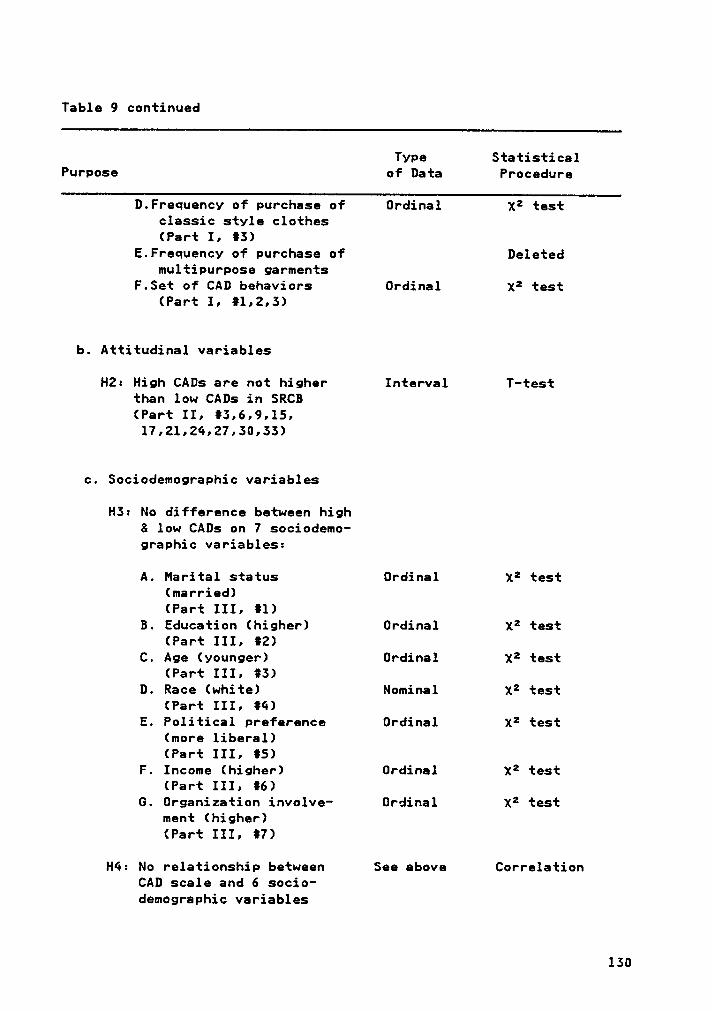
Table 9 continued
Type StatisticalPurpose of Data Procedure
D.Frequency of purchase of Ordinal X2 testclassic style clothes(Part I, #3)
E.Frequency of purchase of Deletedmultipurpose garments
F.$et of CAD behaviors Ordinal x2 test(PartI;b.
Attitudinal variables
H2: High CADs are not higher Interval T—testthan low CADs in SRCB(Part II, #3,6,9,15,
l7,21,24,27,30,33)
c. Sociodemographic variables
H3: No difference between high8 low CADs on 7 sociodemo—graphic variables:
A. Marital status Ordinal X2 test(married)(Part III, #1)
B. Education (higher) Ordinal x2 test(Part III, #2)
C. Age (younger) Ordinal x2 test(Part III, #3)
D. Race (white) Nominal X2 test(Part III, #4)
E. Political preference Ordinal x2 test(more liberal)(Part III, #5)
F. Income (higher) Ordinal x2 test(Part III, #6)
G. Organization involve— Ordinal X2 testment (higher)(Part III, #7)
H4: No relationship between See above CorrelationCAD scale and 6 socio-demographic variables
130
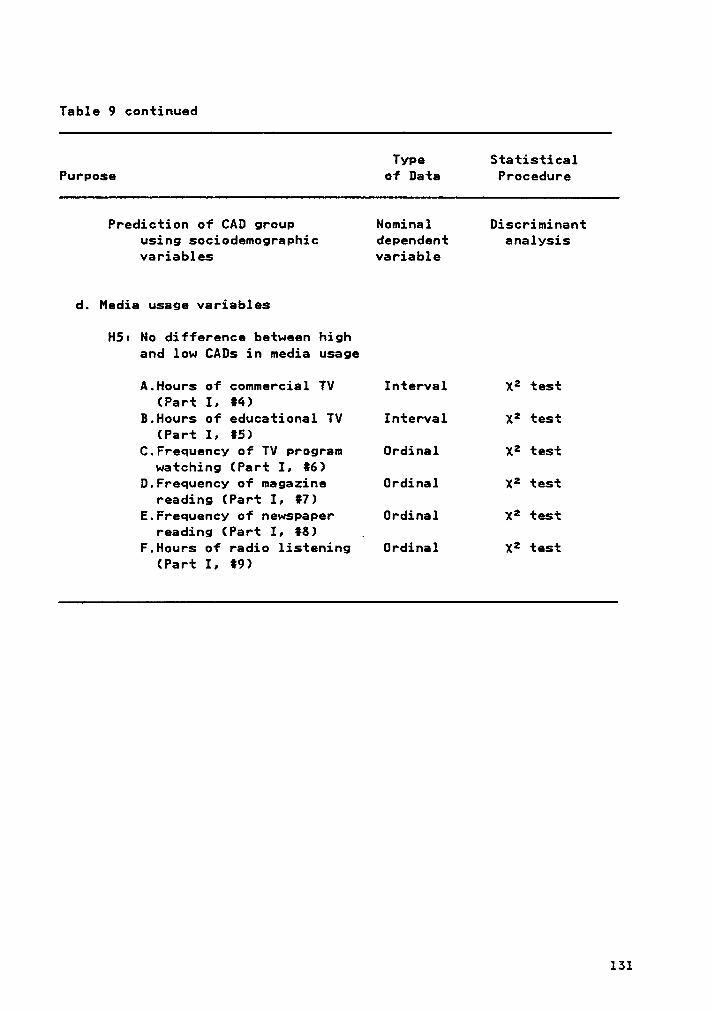
Table 9 continued
Type StatisticalPurpose of Data Procedure
Prediction of CAD group Nominal Discriminantusing sociodemographic dependent analysisvariables variable
d. Media usage variables
H5: No difference between highand low CADs in media usage
A.Hours of commercial TV Interval X2 test(Part I, #4)
B.Hours of educational TV Interval X2 test(Part I, #5)
C.Frequency of TV program Ordinal x2 testwatching (Part I, #6)
D.Frequency of magazine Ordinal X2 testreading (Part I, #7)
E.Frequency of newspaper Ordinal x2 testreading (Part I, #8) 4
F.Hours of radio listening Ordinal x2 test(Part I, #9)
151
The research design is cross-sectional as opposed to longitudinal.
Typically, the snapshot time frame of cross-sectional studies requires
heavy reliance on respondent recall and does not permit time comparisons.
Nonetheless, a cross-sectional design has several advantages. Research
conducted over a short period of time is usually less susceptible to
history effects. Samples used in cross-sectional research tend to be more
representative of the general population since they generally do not re-
ceive compensation or agree to long—term commitments.
A common drawback of survey research is its intrusive nature which
creates the possibility of contamination by participant reactivity.
Knowledge of the survey gives rise to errors due to the good subject role
and evaluation apprehension. Moreover, despite the best intentions, re-
spondents may not possess the information desired by the researcher or
may be unable to recall or articulate it. They also may be unwilling to
provide certain facts, either because of the effort required or the sen-
sitivity of the topic. Although these limitations are acknowledged, the
advantages of versatility, speed, and cost (usually) are potent arguments
for surveys (Churchill, 1983). In addition, the questionnaire used in
this study does not rely on recall as much as it does on current attitudes
and behaviors.
The population for this research is composed of female patrons of a
Roanoke shopping mall. The nature of the sample (convenience) dictates
that inferences from the sample to the population can be made only on a
logical, not a statistical basis (Hinkle et al., 1979). However, the
132
designation of Roanoke as a national test market implies that this popu-
lation is representative of female mall shoppers in other cities. Thus
the inferences and implications derived from the findings can be gener-
alized to similar populations in other locations.
Assumptions
This research is dependent on several assumptions.
1. The measures of media usage, clothing behaviors,
and sociodemographic variables used in this study
are valid and reliable.
2. Respondents were motivated to complete the ques-
tionnaires accuratelv.
3. Respondents were able to correctly recall data
~ requested on the questionnaires.
4. Data provided by Likert type measures is interval
in scale.
133
CHAPTER V
FINDINGS AND DISCUSSION
This chapter reports and discusses the statistical analyses and re-
search results of the study. It includes descriptive data on the final
sample, its size and characteristics. The findings related to each hy-
pothesis are presented and, where appropriate, compared to results of
similar studies.
Data Collection
The final survey was conducted over a four day period during mid-
August 1985. A "survey table" was set up at a central location in the
mall. Female shoppers who appeared to be high school age or older were
asked to complete the survey as they passed by the table. During the data
collection, the researcher was usually aided by one or two assistants who
helped with the distribution of questionnaires.
Sample Size
A total of 405 questionnaires was distributed to shopping mall pa-
trons, and all but one were returned. Several of the returned question-
naires were incomplete, however. Those with more than one third of the
questions blank (27) were discarded leaving 377 or 93.0% for analysis.
Seventeen of the discarded questionnaires contained no sociodemographic
134
data. Inspection of the remaining 10 indicated that these respondents
were similar to the other 377 on most of the variables, with the exception
of age and political preference. In general, the 10 subjects were older
and more conservative. There is the possibility of bias because of these
differences, however, the comparison group was so small that conclusions
based on it would be highly suspect.
Since the CAD scale was a composite measure of 26 items and the basis
for segmentation of the respondents, its completeness was particularly
important to ensure unbiased results. Consequently, it was decided to
eliminate any questionnaires that did not have complete CAD scales (95).
Using chi-square tests, scores of these 95 respondents and scores of the
remaining 282 were compared on each of the sociodemographic variables.
The lack of any statistically significant differences between the two
groups implied that the sample was not biased by the exclusion of the 95
subjects. The final sample then was composed of 282 women who completed
the CAD scale or 70% of the original sample of 405.
Descriptive Statistics
The descriptive statistics are based on response frequencies which
are presented in Appendix E. Each section of the questionnaire is dis-
cussed separately. Socially responsible consumption attitudes are based
on responses to questions taken from Antil's SRCB scale which is consid-
ered an attitude measure for the purposes of this study.
135
Qigtbigg Qonsuggtign ßehavior
A small majority (51.4%) of the subjects bought secondhand clothing
either sometimes or often (Table E-1). Few people bought it often (5.7%),
however 45.7% said they purchased it at least sometimes. A large number
(48.6%) never bought any secondhand apparel.
Recycling was a fairly common practice among sample members. Most
(53.2%) recycled more than half of their clothing and many (29.1%) recy-
cled over three fourths of their wardrobes.
Classic style clothing was purchased often or always by more women
(73.5%) than either high fashion (10.8%) or current styles (46.7%). Many
respondents avoided high fashion altogether; 42.2% said they never bought
it. By comparison, the percentage of people who never bought current
styles (4.3%) and/or classic styles (4.9%) was much smaller. In general,
despite their youth, the sample subjects appeared to prefer more con-
servative styles or at least perceived their clothing to be conservative
in nature.
Qiotbing Qogsumgtion Attitude;
Attitudes were usually in agreement with the behaviors just de-
scribed. Almost half of the respondents (45.8%) said they would not buy
more secondhand garments even if more shops were available (Table E-2).
Nonetheless, 64.2% of the sample said they would be willing to purchase
136
used clothing, and most disagreed with statements suggesting that this
kind of apparel was dirty/unsanitary, inconvenient, or unappealing. Al-
though respondents generally felt they were capable of judging the quality
of secondhand clothing, the group was less confident about their knowledge
of used clothing sources. About 35% said they had little knowledge of
where to buy secondhand garments.
On the whole, attitudes toward garment recycling were positive. Over
80% thought that recycling was a good idea, and 64.9% felt that people
ought to be encouraged to recycle more of their clothes. The personal
effort necessitated by recycling was a disincentive for some individuals,
but a large number (48.5%) said they did not consider recycling too
troublesome and were willing to spend time and money to do it.
While many respondents considered themselves to be very fashion
conscious (48.2%), most thought that fashion had little effect on their
discard practices (61.0%) and were not willing to pay more for fashionable
garments (59.6%). The subjects were divided on their feelings about the
importance of what others were wearing. Approximately equal numbers
agreed and disagreed with the statement "When I select clothing, I don't
really care what others are wearing." When asked about their attitudes
on being in style, 57.8% of the sample said it was ridiculous for women
to feel they must always have the latest styles, but only 35.1% felt that
keeping up with fashion was impractical.
137
Nith regard to clothing waste, most subjects agreed that clothing
was often wasted (76.9%), that many consumers bought more clothing than
they needed (83.0%), and that people should be asked to conserve in
clothing consumption (57.8%). However, they were predominantly indifj
ferent about whether there was a relationship between conservation and
clothing consumption (45.4% neutral) and whether resource conservation
should be considered when buying apparel (42.6% neutral).
§ogiaii¥ Rg;ggn;ig;; Consumgtion Attitude;
Overall, the sample appeared to be quite concerned about pollution
and its consequences. Many agreed that public concern about air and water
pollution was justified (70.9%) or that attempts to control water pol-
lution were worth the trouble (83.4%) (Table E-3). A majority said they
were incensed about the damage done by pollution to plant and animal life
(66.5%).
In some respects subjects were strong in their convictions about their
own responsibilities and those of others in the fight against pollution
and waste. A large number (68.0%) felt that the government should provide
a list of agencies to which citizens could report pollution grievances,1
and over half (55.5%) thought commercial advertisers should mention the
ecological disadvantages of their products. Respondents were not so sure
about whether manufacturers should be forced to use recycled products;
slightly fewer people agreed with this idea (30.6%) than disagreed
(33.5%).
138
At the consumption level, the majority of participants thought that
people should urge their friends to avoid products which utilize scarce
resources (55.7%) or contribute to pollution (66.6%). Almost three-
fourths of the sample were willing to pay a dollar more for electricity
each month if it meant cleaner air. They were less enthusiastic about
paying higher taxes. Although 28.0% were willing to pay 5% more taxes
to control pollution, 57.6% were not willing.
§gciodemograghjc§
Just over half (51.1%) of the respondents indicated that they were
married and living with their spouses (Table E-4). Nith respect to racial
identification, the overwhelming majority of participants was white
(95.2%). Of the minorities, black subjects were more numerous (5.7%) than
other groups (1.1%).
About a third (55.5%) of the respondents were under 25 years of age
and over half (54.4%) were under 54. The relative youthfulness of the
sample is partially explained by the fact that schools were not in ses-
sion, and many students were at liberty to go shopping. Most people
considered themselves to be middle-of-the—roaders in the political arena
(55.0%). Liberals were the smallest political category (16.2%).
The majority of the shoppers (84.2%) were high school graduates.
In fact, most had at least some college education (56.6%). Only 29.4%
had completed college however. Nearly three quarters (75.9%) of the
159
shoppers had annual household incomes less than $40,000, and most of those
(53.9%) received less than $30,000 in income a year.
Organizational activity was not a particularly strong characteristic
of the sample. Over half of the respondents either were not involved in
community organizations or left the question about organizational mem-
bership blank (51.2%). Only 15.0% of the subjects reported belonging to
more than two organizations. _1
Table 10 shows the types of organizations that respondents listed
in each of the four categories. Ecological associations were supported
by the smallest number of women (4.6%) and community organizations by the
largest (33.7%). The names of some associations were unrecognizable
(e.g., initials used for identification instead of entire names). More-
over, the large number of organizations suggested the need for consol-
idation. Thus the organization titles often represent general types or
themes of associations rather than specific names. Ecological organiza-
tions are an exception; all legible titles from the survey are listed in
the table. Although the existence and ecological orientation of these
organizations could not be verified in every case, several are familiar,
such as the Sierra Club, Greenpeace, and Save the Nhales.
Media Qsagg
The majority of participants watched 10 hours or less of commercial
television per week (60.4%) and 5 hours or less of educational television
140
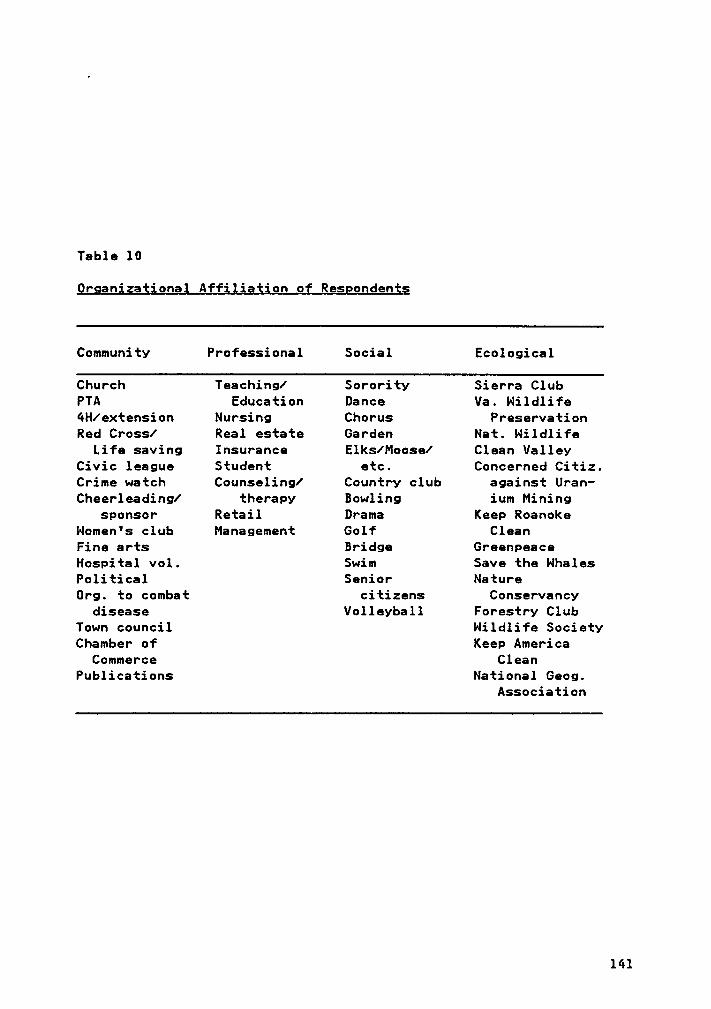
Table 10
Qrganiggjional Affiligjion of Resgogdenjg
Community Professional Social Ecological
Church Teaching! Sorority Sierra ClubPTA Education Dance Va. Nildlife4H!extension Nursing Chorus PreservationRed Cross! Real estate Garden Nat. Nildlife
Life saving Insurance Elks!Moose! Clean ValleyCivic league Student etc. Concerned Citiz.Crime watch Counseling! Country club against Uran-Cheerleading! therapy Bowling ium Mining
sponsor Retail Drama Keep RoanokeHomen's club Management Golf CleanFine arts Bridge GreenpeaceHospital vol. Swim Save the NhalesPolitical Senior NatureOrg. to combat citizens Conservancy
disease Volleyball Forestry ClubTown council Nildlife SocietyChamber of Keep America
Commerce CleanPublications National Geog.
Association
141
(90.5%) (Table E·4). News programs seemed to be the most popular, with
42.8% of the sample watching them sometimes and another 52.2% watching
them often. Sports programs were the least popular; 45.7% of the re·
spondents never watched them and 41.5% watched them only sometimes (Table
E—5). A large number of people also avoided nature programs; 55.2% never
watched them, and 50.6% watched them occasionally.
Domestic magazines, like fggily_§i;gLg and Nomag'§ Day, were read
by more women than any other magazine type (77.2%) (Table E-6). Other
fairly popular magazine categories were fashion (read by 69.9%), home
(69.7%), human interest (66.8%), news (64.8%), and educational (61.6%).
Commentary magazines, like New Regublig, were read by the fewest number
of women (16.5%), followed closely by men's (17.6%) and automotive (18.7%)
magazines. Nature magazines were relatively unpopular also; over half
of the sample did not read them at all (58.1%). Respondents were much
more consistent when it came to newspaper reading. Almost all of them
read the newspaper (96.1%), usually on a daily basis (62.9%) (Table E·4).
Deggrjgtive Stgtistigs of the Mall §tudy
A table of some of the findings of the mall study (Martin Research,
1984) was developed for comparison with the present study (Table 11).
Unfortunately, direct comparisons are not always possible since the cat-
egories are usually different. In addition, the mall survey included both
sexes while the sample for this study was limited to women. The final
variable from the mall study presented in the table, cable TV viewing
142
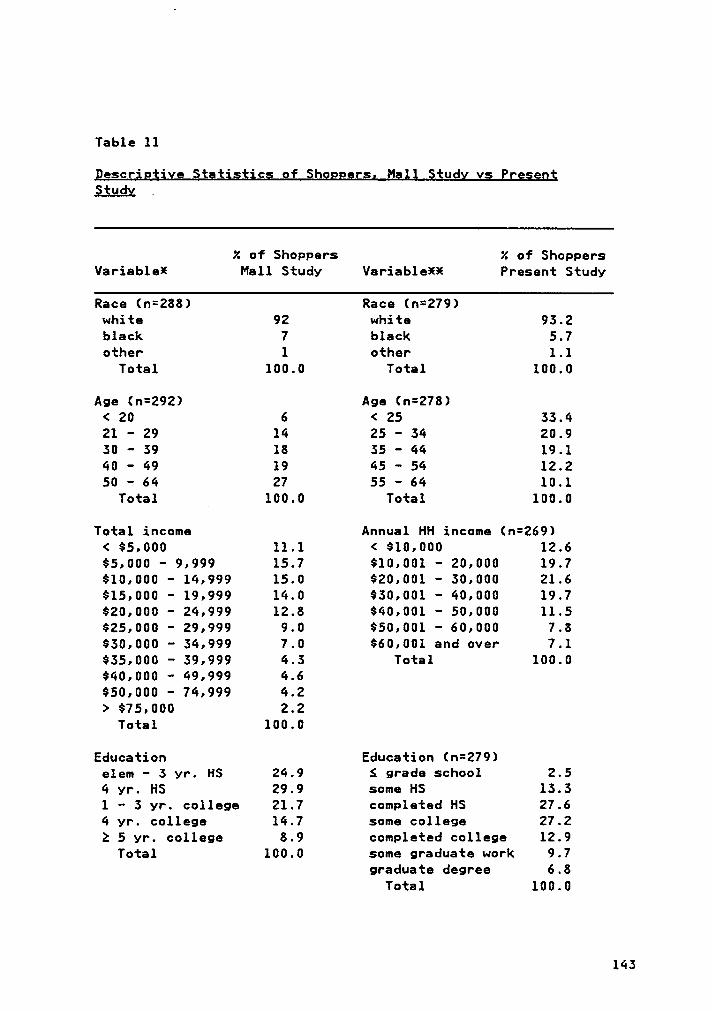
Table 11
Qescgigtiyg Stgtistics of §hgggg;s, Mgli §tud¥ vs ßgesggt.$$1Ldx .
Z of Shoppers Z of ShoppersVariable! Mall Study Variable!! Present Study
Race (n=288) Race (n=279)white 92 white 93.2black 7 black 5.7other 1 other 1.1
Total 100.0 Total 100.0
Age (n=292) Age (n=278)< 20 6 < Z5 33.421 — 29 14 25 - 34 20.930 - 39 18 35 - 44 19.140 · 49 19 45 - 54 12.250 - 64 27 55 - 64 10.1
Total 100.0 Total 100.0
Total income Annual HH income (n=269)< $5,000 11.1 < $10,000 12.6$5,000 · 9,999 15.7 $10,001 - 20,000 19.7$10,000 - 14,999 15.0 $20,001 — 30,000 21.6$15,000 — 19,999 14.0 $30,001 — 40,000 19.7$20,000 — 24,999 12.8 $40,001 — 50,000 11.5$25,000 - 29,999 9.0 $50,001 - 60,000 7.8$30,000 - 34,999 7.0 $60,001 and over 7.1$35,000 — 39,999 4.3 Total 100.0$40,000 · 49,999 4.6$50,000 - 74,999 4.2> $75,000 2.2
Total 100.0
Education Education (n=279)elem — 3 yr. HS 24.9 S grade school 2.54 yr. HS 29.9 some HS 13.31 — 3 yr. college 21.7 completed HS 27.64 yr. college 14.7 some college 27.22 5 yr. college 8.9 completed college 12.9
Total 100.0 some graduate work 9.7graduate degree 6.8
Total 100.0
143
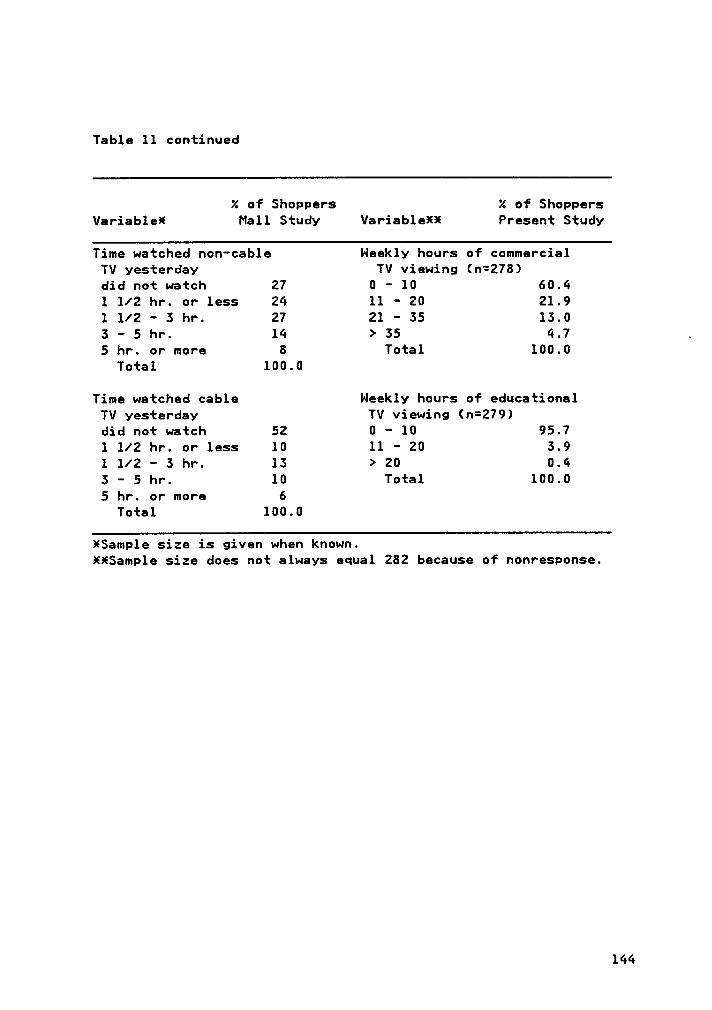
Table ll continued
Z of Shoppers Z of ShoppersVariable! Mall Study Variab1e!! Present Study
Time watched non·cab1e Weekly hours of commercialTV yesterday TV viewing (n=278)did not watch 27 0 - 10 60.41 1/2 hr. or less 24 ll · 20 21.91 1/2 — 3 hr. 27 21 · 35 13.03 - 5 hr. 14 > 35 4.7 .5 hr. or more 8 Total 100.0
Total 100.0
Time watched cable Weekly hours of educationalTV yesterday TV viewing (n=279)did not watch 52 0 - 10 95.71 1/2 hr. or less 10 11 - 20 3.91 1/2 — 3 hr. 13 > 20 0.43 · 5 hr. 10 Total 100.05 hr. or more 6
Total 100.0
!Sample size is given when known.!!Sample size does not always equal 282 because of nonresponse.
144
time, obviously is not equivalent to the educational TV viewing time
variable used in this research. However, the data on both variables is
provided for information.
The two samples had approximately the same racial makeup but differed
in several other respects. The shoppers in this study appeared to be
younger and more educated, had higher incomes, and watched slightly less
commercial (non-cable) television.
Reasons for the differences may be due to sampling techniques (the
mall study does not describe the research procedures used), survey meth-
ods, time of year, or other situational variables. Whatever the cause,
the higher incomes of the sample in this study are beneficial for the
accomplishment of the research objectives (see Chapter IV, p. 104).
Validation of the CAD Scale
The PACKAGE computer program (Hunter & Cohen, 1969) was used to
evaluate the CAD scale after the final survey. The alpha coefficient for
each subscale showed
lan
increase over pretest results, indicating
stronger internal consistency and reliability (Table 12). Inter-item
correlations, another measure of internal consistency, also improved.
All average correlations increased, and in every case but one ("general"),
the value of the lowest correlation rose. The following rule of thumb
for interpreting the size of a correlation coefficient was suggested by
one source (Hinkle et al., 1979):
145
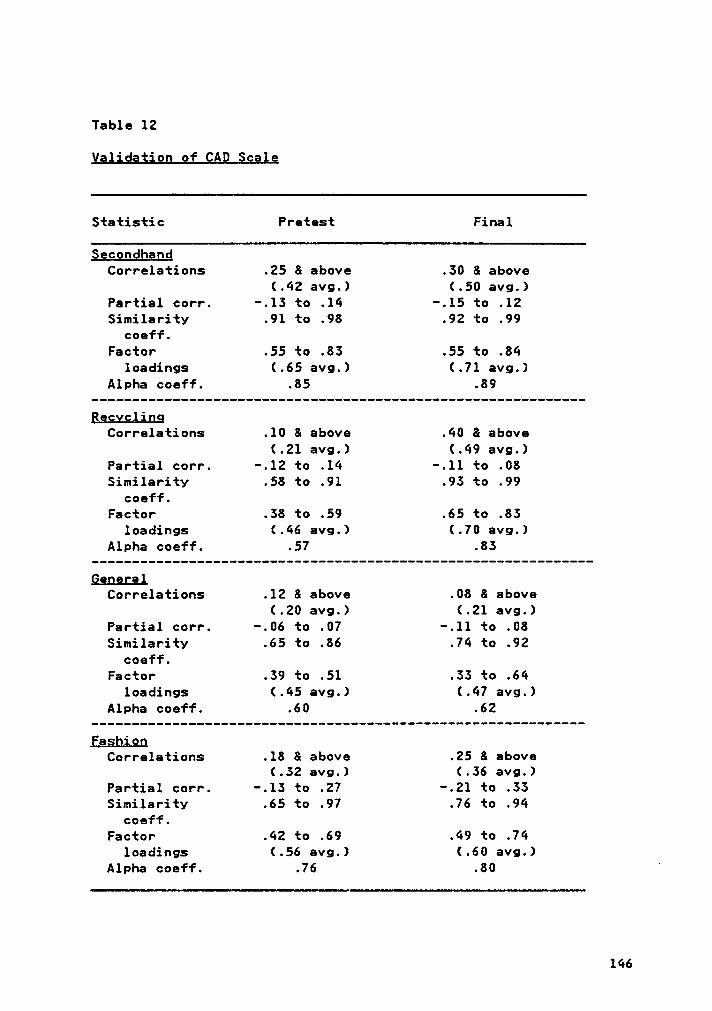
Table 12
Valldajiog of QAQ Seele
Statistic Pretest Final
gecondhandCorrelations .25 8 above .30 8 above
(.42 avg.) (.50 avg.)Partial corr. -.13 to .14 -.15 to .12Similaritv .91 to .98 .92 to .99
coeff.Factor .55 to .83 .55 to .84
loadings (.65 avg.) (.71 avg.)Alpha coeff. .85 .89
RecyclingCorrelations .10 8 above .40 8 above
(.21 avg.) (.49 avg.)Partial corr. -.12 to .14 -.11 to .08Similarity .58 to .91 .93 to .99
coeff.Factor .38 to .59 .65 to .83
loadings (.46 avg.) (.70 avg.)Alpha coeff. .57 .83
generalCorrelations .12 8 above .08 8 above
(.20 avg.) (.21 avg.)Partial corr. -.06 to .07 -.11 to .08Similarity .65 to .86 .74 to .92
coeff.Factor .39 to .51 .33 to .64
loadings (.45 avg.) (.47 avg.)Alpha coeff. .60 .62
fashionCorrelations .18 8 above .25 8 above
(.32 avg.) (.36 avg.)Partial corr. -.13 to .27 -.21 to .33Similarity .65 to .97 .76 to .94
coeff.Factor .42 to .69 .49 to .74
loadings (.56 avg.) (.60 avg.)Alpha coeff. .76 .80 '
146
.90 — 1.00 very high
.70 - .90 high
.50 - .70 moderate
.30 - .50 low
.00 - .30 little if any
By these standards the average subscale product moment correlations of
.50, .49, .21, and .36 are low. However the authors were quick to state
that the decision about what correlation magnitude represents a notewor—
thy relationship is somewhat arbitrary. In the field of psychology,
correlations larger than .60 are the exception rather than the rule
(Nunnally, 1978, ¤.33).
Partial correlations showed mixed results. In a unidimensional
cluster, these coefficients should be close to zero. The smaller range
of values for the ”secondhand" and "recycling” factors indicated an in-
crease in internal consistency. However, the expanded range for the
"general“ and ”fashion" subscales denoted a slight decline in internal
consistency.
Similarity coefficients were inspected to determine the external
consistency of the factors. These statistics are based on correlations
between items of different scales and should be similar for all items in
a particular factor. In all cases the range of coefficient values was
small and represented an improvement over the pretest values. Based on
these results, the factors were judged to be externally consistent.
147
The last evaluation of the subscales based on PACKAGE statistics was
confirmatory factor analysis. The average loading for each factor in-
creased in the final survey, indicating an improvement in the
unidimensionality of each subscale.
The data analysis demonstrates that the CAD scale is composed of four
relatively pure subscales. The strongest are ”secondhand" and "recycl·
ing." As a result of item changes made after the pretest, the "recycling"
subscale showed a marked improvement in all statistics. The "general"
factor had the lowest correlations (.21 average) and in hindsight should
have been revised in the same way as the "recycling" factor.
Table 13 compares the item correlations between the subscales using
pretest and final survey data. For each set of subscales, the average
correlation increased, and the range of correlations grew larger and more
positive, with the exception of the "general" - "fashion" range. The
lowest average correlations involved the "fashion" subscale. This factor
was also the only one to exhibit negative inter·subscale correlations.
Once again, the relatively low correlations between factors substantiate
the idea that the CAD construct is multidimensional. The predictive and
construct validity of the CAD scale are discussed following the first two
hypotheses.
148
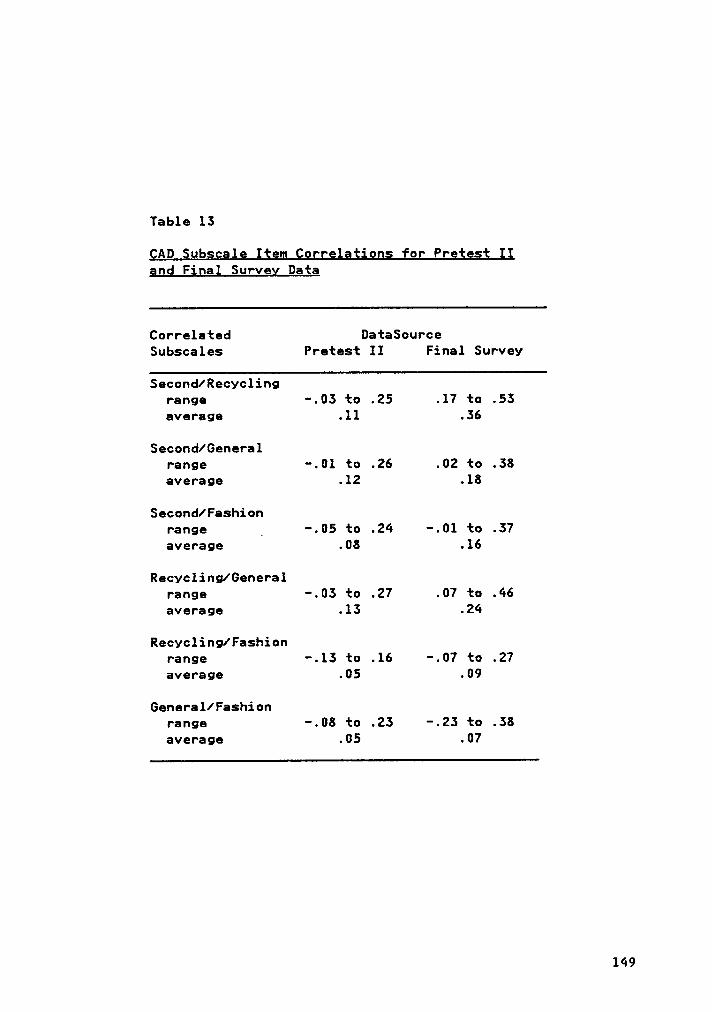
Table 13
QAD Subscale Iggm Cogrelagjong fo; Pgetggj L1and Final Survey Daga
Correlated DataSourceSubscales Pretest II Final Survey
Second/Recyclingrange -.03 to .25 .17 to .53average .11 .36
Second/Generalrange -.01 to .26 .02 to .38average .12 .18
Second/Fashionrange _ -.05 to .24 -.01 to .37average .08 .16
Recycling/Generalrange -.03 to .27 .07 te .46
average .13 .24
Recycling/Fashionrange -.13 to .16 -.07 to .27average .05 .09
General/Fashionrange -.08 to .23 -.23 to .38
average .05 .07
149
Tests of Hypotheses
For hypothesis testing, subjects were divided into three groups (94
in each) based on their CAD scores. The third with the highest CAD scores
was designated "high CADs", and the third with the lowest scores was
called "low CADs." Although the size of both CAD groups together (94 +
94 = 188) was slightly less than the desired minimum of 193 (see Chapter
IV), the difference was not substantial.
The x2 test was used to evaluate most of the hypotheses posed in
Chapter III. When the chi-square distribution is used to approximate the
distribution of a discrete variable, the computed value can become in-
flated if too many of the expected frequencies are small (Churchill,
1983). Therefore whenever more than 20% of the cells showed frequencies
less than five, smaller categories were combined to produce cells of an
acceptable size.
For presentation of the results, hypotheses were restated in the null
form. 0ne or more tables present the statistical data used to test each
hypothesis. Although both CAD groups possess 94 members, the tables oc-
casionally show fewer subjects for a particular test because respondents
did not always answer every question. For all analyses, the statistical
significance level was set at .05.
Referring back to the theoretical framework, Hypothesis 1 deals with
the relationship between attitudes (CAD scale) and behavior (behavior
150
index). Initially, each behavior is evaluated separately in Hypotheses
1A - 1E and then as a group in Hypothesis 1F.
Mg;} Hypothesis IA
High CAD consumers will nct engage in analyticalbuying behavior more frequently than low CAD con-sumers.
This hypothesis was not tested because the scale developed for analytical
buying behavior was not sufficiently discriminating (See Chapter IV).
The analytical buying variable was dropped from the analysis after the
first pretest.
Mull Hygotbesig lß
High CAD consumers will not purchase secondhandclothing more often than low CAD consumers.
To test this hypothesis a chi-square test of independence was conducted
using the responses of high and low CAD groups to the question:
How often do you buy secondhand clothing from fam-ily or friends, yard sales, consignment shops, orany other sources? (never, sometimes, often)
A chi-square value of 64.79 (p = .0001) was sufficient to reject the null
hypothesis and support the contention that high CADs do tend to purchase
secondhand clothing more often than low CADs (Table 14). Nearly 60% more
high CADs purchased used clothing (79.8% versus 21.3%). Further, Cramer's
151
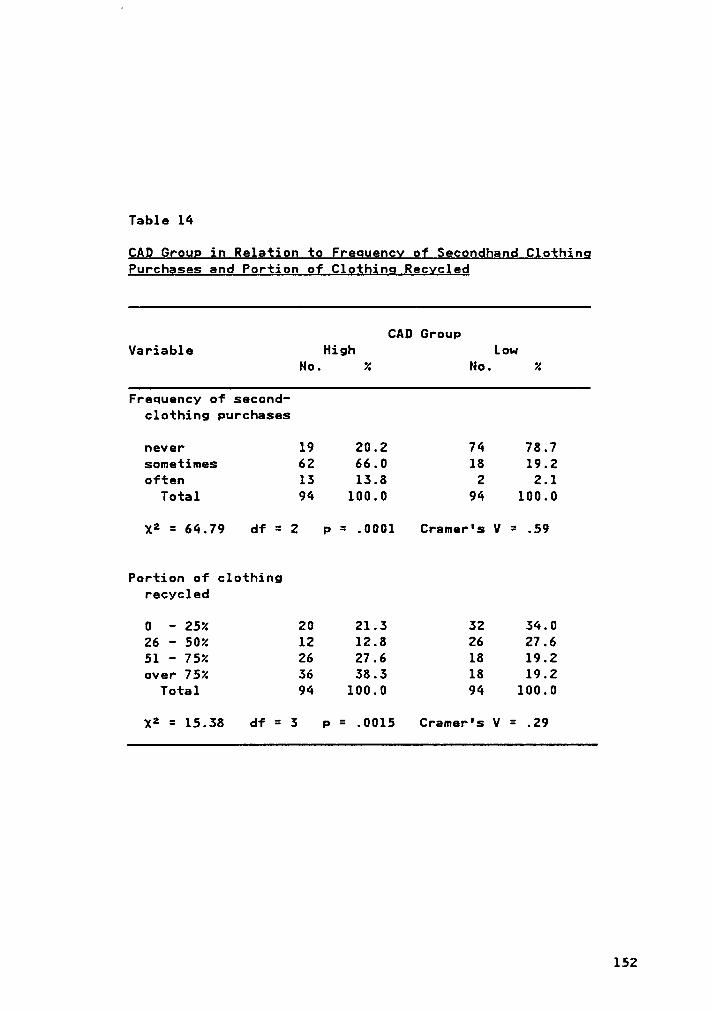
Table 14
CAD Groug in Relation to Frggugncy of Segondhand ClothingEurchgses and Portion of Clgtbjgg Recycled
CAD GroupVariable High Low
No. % No. %
Frequency of second-clothing purchases
never 19 20.2 74 78.7sometimes 62 66.0 18 19.2often 13 13.8 2 2.1
Total 94 100.0 94 100.0
X2 = 64.79 df = 2 P = .0001 Cramer's V = .59
Portion of clothingrecycled
0 - 25% 20 21.3 32 34.026 - 50% 12 12.8 Z6 27.651 - 75% 26 27.6 18 19.2over 75% 36 38.3 18 19.2
Total 94 100.0 94 100.0
x2 = 15.38 df = 3 p = .0015 Cramer's V = .29
152
V = .59 (over halfway between the limits 0 and 1) indicated that the as-
sociation between CAD category and self-reported frequency of used
clothing purchases was moderate to high.
Null Hygothgsig 1C
High CAD consumers will not recycle a larger por-tion of their discarded clothing than low CAD con-sumers.
Responses to the following question were used to test this hypothesiss
When you discard clothing, what portion do you re-cycle? That is, what portion is remodeled, sold,or given to charity, friends, or family? (0-25%,
26-50%, 51-75%, over 75%)
A test of high CAD and low CAD groups on this question yielded a chi-
square statistic of 15.38 (p = .0015) and a rejection of the null hy-
pothesis (Table 14). A majority of high CADs (66.0%) recycled over 50%
of their discarded clothes. Only 38.4% of the low CADs recycled this
much. The data endorse the argument that high CADs recycle more of their
discarded clothes than low CADs. The relationship between the contingency
table variables was considered to be of low to moderate strength (V =
.29).
Ngll Hygothesig LD
High CAD consumers will not purchase classic fash-ion garments more frequently than low CAD consum-ers.
153
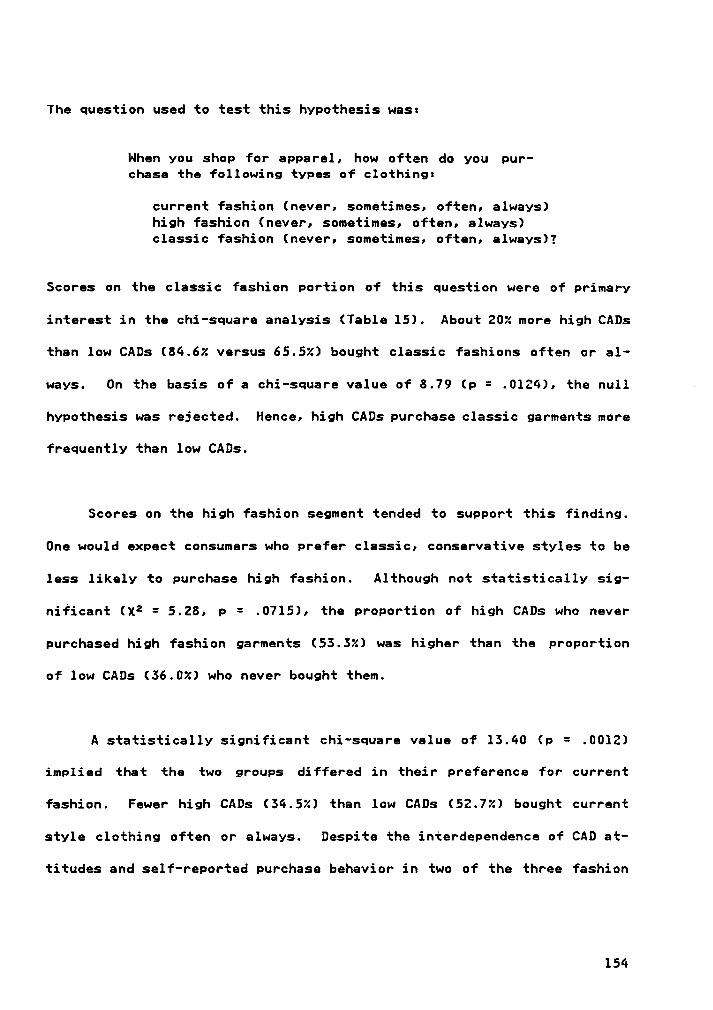
The question used to test this hypothesis was:
Nhen you shop for apparel, how often do you pur-chase the following types of clothingr
current fashion (never, sometimes, often, always)high fashion (never, sometimes, often, always)classic fashion (never, sometimes, often, always)?
Scores on the classic fashion Portion of this question were of primary
interest in the chi-square analysis (Table 15). About 20% more high CADs
than low CADs (84.6% versus 65.5%) bought classic fashions often or al-
ways. 0n the basis of a chi-square value of 8.79 (p = .0124), the null
hypothesis was rejected. Hence, high CADs purchase classic garments more
frequently than low CADs.
Scores on the high fashion segment tended to support this finding.
One would expect consumers who prefer classic, conservative styles to be
less likely to purchase high fashion. Although not statistically sig-
nificant (X2 = 5.28, p = .0715), the proportion of high CADs who never
purchased high fashion garments (53.5%) was higher than the proportion
of low CADs (36.0%) who never bought them.
A statistically significant chi—square value of 15.40 (p = .0012)
implied that the two groups differed in their preference for current
fashion. Fewer high CADs (34.5%) than low CADs (52.7%) bought current
style clothing often or always. Despite the interdependence of CAD at-
titudes and self-reported purchase behavior in two of the three fashion
154
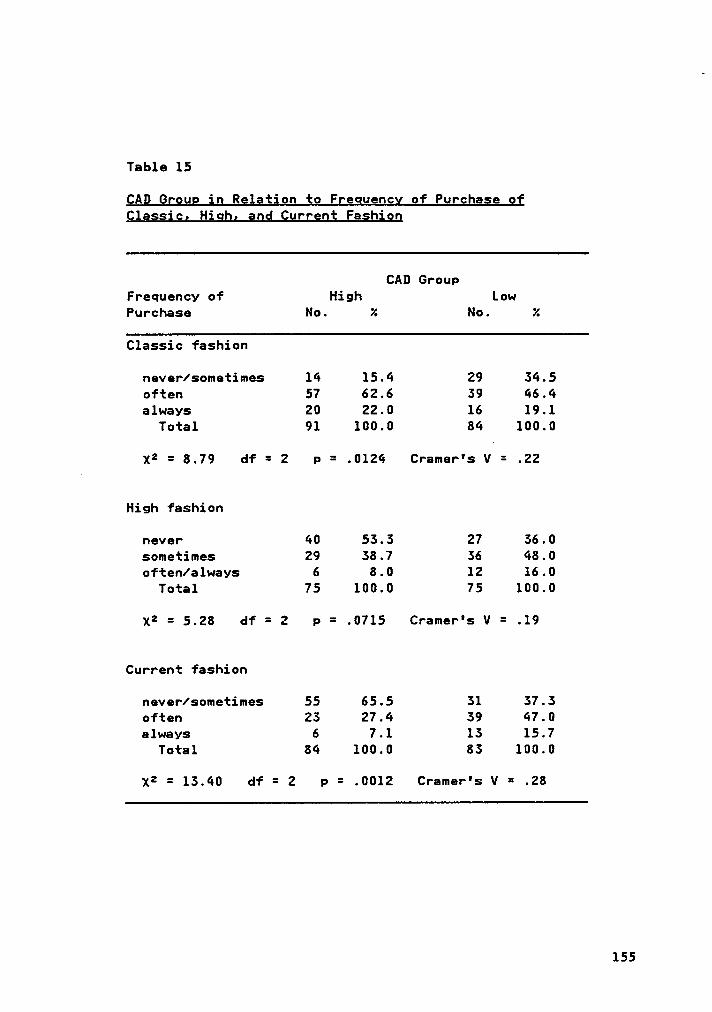
Table 15
CAQ Groug ig Rglgjion $0 Fgeguency of Purggage gfC1a§sic„ Higg, gnd Currgnt Fashjgg
CAD GrouPFrequency of High LowPurchase No. X No. X
Classic fashion
never/sometimes 14 15.4 29 34.5often 57 62.6 39 46.4always 20 22.0 16 19.1
Total 91 100.0 84 100.0
X2 = 8.79 df = 2 P = .0124 Cramer's V = .22
High fashion
never 40 53.3 27 36.0sometimes 29 38.7 36 48.0often/always 6 8.0 12 16.0
Total 75 100.0 75 100.0
X2 = 5.28 df = 2 p = .0715 Cramer's V = .19
Current fashion
never/sometimes 55 65.5 31 37.3often 23 27.4 39 47.0always 6 7.1 13 15.7
Total 84 100.0 83 100.0
X2 = 13.40 df = 2 P = .0012 Cramer's V = .28
155
categories, the corresponding V values indicated that the relatiunships
were not especially strong.
Null ßygogbgsis l§ _
High CAD consumers will not purchase multipurposegarments more often than low CAD consumers.
This hypothesis was not tested because of the poor performance of the
"multipurpose" subscale during the scale validation process (see dis-
cussion of Pretest II, Chapter IV).
Null ßygothesig lf
High CAD consumers will not exhibit a particularset of responsible clothing acquisition and discardbehaviors more often than low CAD consumers.
The set of behaviors referred to in this hypothesis is a combination of
behaviors previously discussed: (1) frequency of purchase of secondhand
clothing, (2) portion of garments recycled, and (5) frequency of purchase
of classic style clothes. Grouping of these three behaviors (Set I in
Table 16) provided a more general, multi-item behavior index to correspond
more nearly to the multi-item CAD attitude scale.
A chi-square test once again resulted in a statistically significant
test value of 29.25 (p = .0001) and a rejection of the null hypothesis.
156
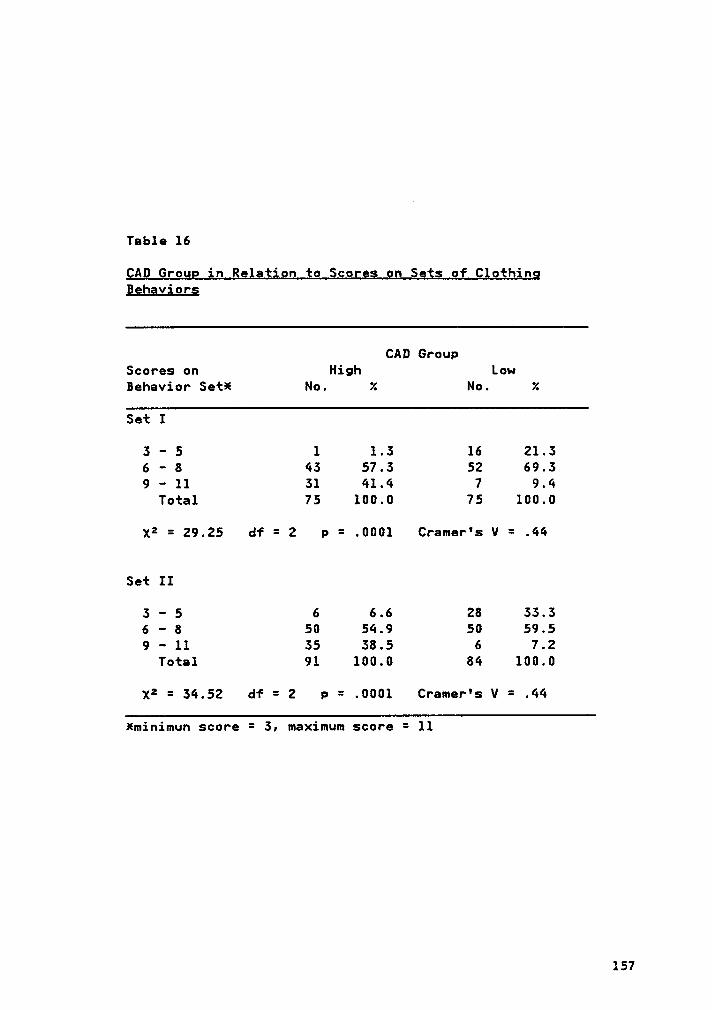
Table 16
QAQ Ggogg in ßglgtign to Scoggg gg Sgts of Clothingßegavjorg
CAD GroupScores on High LowBehavior Set! No. Z No. Z
Set I
5 — 5 1 1.5 16 21.56 — 8 45 57.5 52 69.59 — 11 51 41.4 7 9.4
Total 75 100.0 75 100.0
x2 = 29.25 df = 2 p = .0001 Cramer's V = .44
Set II
5 — 5 6 6.6 28 55.56 - 8 50 54.9 50 59.59 - ll 55 58.5 6 7.2
Total 91 100.0 84 100.0
x2 = 54.52 df = 2 p = .0001 Cramer's V = .44
Xminimun score = 5, maximum score = ll
157
The number of high CADs receiving high scores (9 - 11) on the index was
nctably larger than the number of low CADs receiving high scores.
As another test of this hypothesis, the third behavior in the set
was changed to frequency of purchase of high fashion clothes (reverse
coded). A test of this combination of three variables (Set II) corrob-
orated the results of the first test, X2 = 54.52 (p = .0001). Again, more
high CADs received the higher scores even though the "high fashion pur-
chasing" behavior was not statistically significant by itself (Null Hy-
pothesis ID). Cramer's V values suggested that the degree of association
between CAD group and the two behavior sets was moderate.
Null Hypothesis Z
High CAD consumers do not hold attitudes which aremore socially responsible than those of low CADconsumers.
Hypothesis 2 concerns the association between two attitudes, socially
responsible consumption attitudes (SRCB scale) and responsible clothing
acquisition and discard attitudes (CAD scale). Logically, the SRCB at-
titudes should be related to CAD attitudes and by association to CAD be-
haviors (based on results of Hvßothesis 1).
To ensure that the shortened SRCB scale fulfilled expectations re-
garding its reliability, an alpha coefficient was calculated using final
survey data. The resultant value of .78 was slightly higher than the
158
alpha estimated in Chapter IV (.76), indicating that the scale's reli-
ability was even better than expected.
Prior to conducting e one-tailed t—test of mean SRCB scores, the
observed distributions of the scores for both CAD groups were tested for
normality. The Kolmogorov-Smirnov D for the low CAD group was .08 (p =
.13) and for the high CAD group was .06 (p = .15). Neither D value was
statistically significant indicating that the observed distributions were
approximately normal (i.e., null hypothesis is normality).
Nith a mean of 38.44 for high CADs and a mean of 33.45 for low CADs,
the calculated test statistic (t = 6.95, p = .00005) was sufficient to
reject the null hypothesis and support the premise that high CADs have
attitudes which are more socially responsible than low CADs (Table 17).
A test for equality of variance was also performed using the folded F
statistic (F') (SAS Statistics, 1982). An F' value of 1.03 (p = .8744)
supported the assumption of equal variances.
Based on the results of Hypotheses l and 2, the CAD attitude scale
appeared to be .a good predictor of self-reported socially responsible
consumption attitudes and clothing consumption behaviors which have been
designated es socially responsible. To verify the scale's predictive
validity, correlation coefficients were calculated between CAD scale
scores and scores on the behavior index (Set I and Set II in Table 18).
The attitudes expressed in the CAD scale had a substantial degree of
correspondence with the acquisition and discard behaviors. Similar re-
159
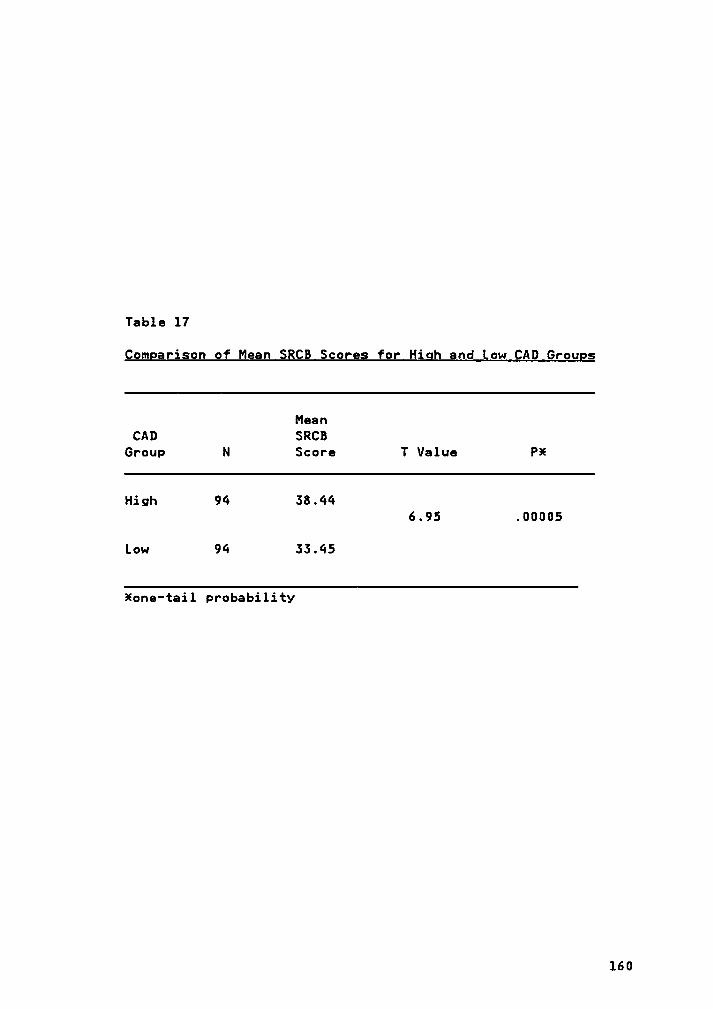
Table 17
Qomgarison of Mgan SBCB Scoheg for High and Low QAD Grougs
MeanCAD SRCB
Group N Score T Value PX
High 94 58.446.95 .00005
Low 94 55.45
xone—tai1 probability
160
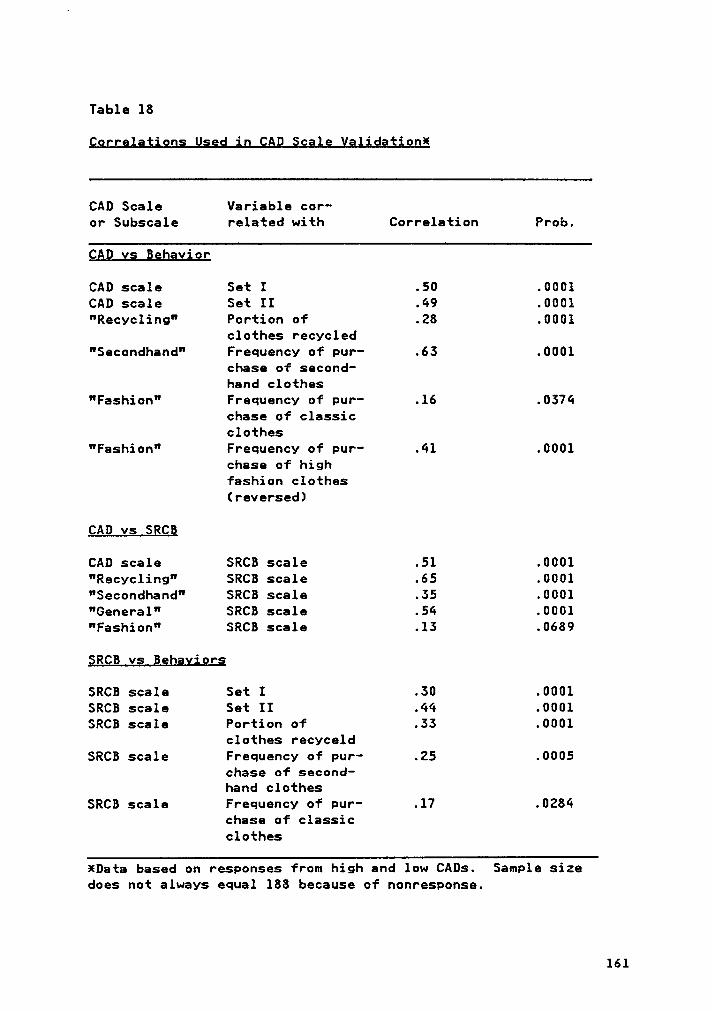
Table 18
Qerreiation; Useg ig QAQ Sceie Veiidationä
CAD Scale Variable cor-or Subscale related with Correlation Prob.
QAD vs Behavior
CAD scale Set I .50 .0001CAD scale Set II .49 .0001"Recycling" Portion of .28 .0001
clothes recycled"Secondhand" Frequency cf pur- .63 .0001
chase cf second-hand clothes
"Fashion" Frequency of pur- .16 .0374chase of classicclothes
”Fashion" Frequency of pur- .41 .0001chase of highfashion clothes(reversed)
CAD vs SRCB
CAD scale SRCB scale .51 .0001"Recycling" SRCB scale .65 .0001"Secondhand" SRCB scale .35 .0001"General” SRCB scale .54 .0001"Fashion" SRCB scale .13 .0689
§RCB v; Behavior;
SRCB scale Set I .30 .0001SRCB scale Set II .44 .0001SRCB scale Portion of .33 .0001
clothes recyceldSRCB scale Frequency of pur- .25 .0005
chase of second-hand clothes
SRCB scale Frequency of pur- .17 .0284chase of classicclothes
XData based on responses from high and low CADs. Sample sizedoes not always equal 188 because of nonresponse.
161
sults were obtained when correlation coefficients were calculated between
CAD subscales and their corresponding behavior index items. (There was
no behavior item for the "general" factor). Although correlation coef-
ficients do not indicate causality or even a meaningful relationship be-
tween the variables involved, they do express the degree to which one can
generalize from scores on one variable to scores on another (Nunnally,
1978, p. 90). Thus, the masnitude of the coefficients between the CAD
attitude and behavior measures implies that (l) there is a relationship
between attitudes and behaviors as the theoretical framework suggested,
and (2) the CAD scale may be useful in identifying individuals who prac-
tice certain clothing consumption behaviors.
The strong association between the CAD scale and the SRCB scale showed
that the CAD scale was related to socially responsible consumption. With
the exception of the "fashion" factor, correlations between the CAD sub-
scales and the SRCB scale were also statistically significant. Another
indication of the close connection between socially responsible consump-
tion and clothing consumption is provided by correlations between the SRCB
scores and the CAD behavior scores. Table 18 presents these statistics
also. Overall, the CAD measure behaves as expected with respect to the
SRCB scale, signifying that construct validity is present.
162
Null Hygggbesis 3
High CAD consumers do not differ from low CAD con-sumers in selected sociodemographic character-istics. Specifically, high CAD consumers:
A. Are not more often married andliving with their spouses
- B. Do not have higher leve‘s ofeducation
C. Are not youngerD. Are not more often whiteE. Are not more liberalF. Do not have higher incomesG. Are not more involved in
organizations
This hypothesis investigates the relationship between stimulus conditions
(sociodemographic variables) and attitudes (CAD scale). Hypothesis 4 and
the discriminant analysis are concerned with the same theoretical re-
lationship but employ different statistical procedures to evaluate it.
Chi-square tests of independence were calculated for all of the subhy-
potheses. Each is discussed individually.
yu;} Hypothesis §A
Although a larger number of high CADs were married and living with
their spouses (56.4% versus 44.1%), the chi-square value = 2.83 (p =
.0926) did not support a rejection of the null hypothesis (Table 19).
Marital status then was not a discriminating variable for CAD consumers.
Although not statistically significant, this finding tends to support
that of 0'Reilly et al. (1984) who determined that personal sale patrons
163
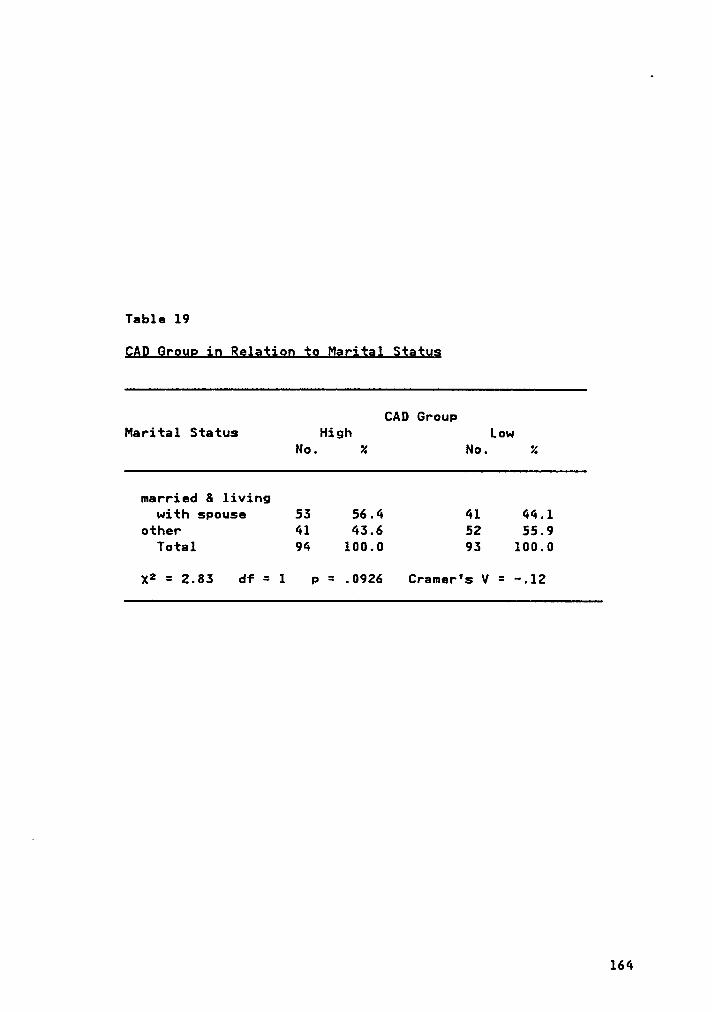
Table 19
CAQ Qroug ig Relation to Maritgl §tgtu§
CAD GrouPMarital Status High Low
No. Z No. Z
married 8 livingwith spouse 53 56.4 41 44.1
other 41 43.6 52 55.9Total 94 100.0 93 100.0
X2 = 2.83 df = 1 p = .0926 Cramer's V = -.12
164
and purchasers were differentiated from nonpatrons and nonpurchasers on
the basis of marital status. That is, patrons and purchasers were more
often married. CAD consumers, in contrast to the personal sale consumers,
are not defined solely by their usage of a particular second·order mar-
keting system. The broader scope of the CAD concept may account for the
lack of a statistically significant result.
In the marketing literature, the relationship between marital status
and social responsibility was not clearly established. Mitchell (1985)
maintained that most (70%) socially conscious individuals were married,
while Lindgren (1972) determined they were usually single. Conversely,
Kassarjian (1971) found that marital status was not a statistically sig·
nificant segmentation variable in any case.
Mull Hygothesjs §B
The original categories of the education variable were:
1. Grade school or less2. Some high school5. Completed high school4. Some college5. Completed college6. Some graduate work7. Graduate degree
The chi—square test yielded a statistic of 16.00 (p = .0157) which was
sufficient for rejection of the null hypothesis (Table 20). In general,
the proportion of high CADs in the upper education levels was greater than
165
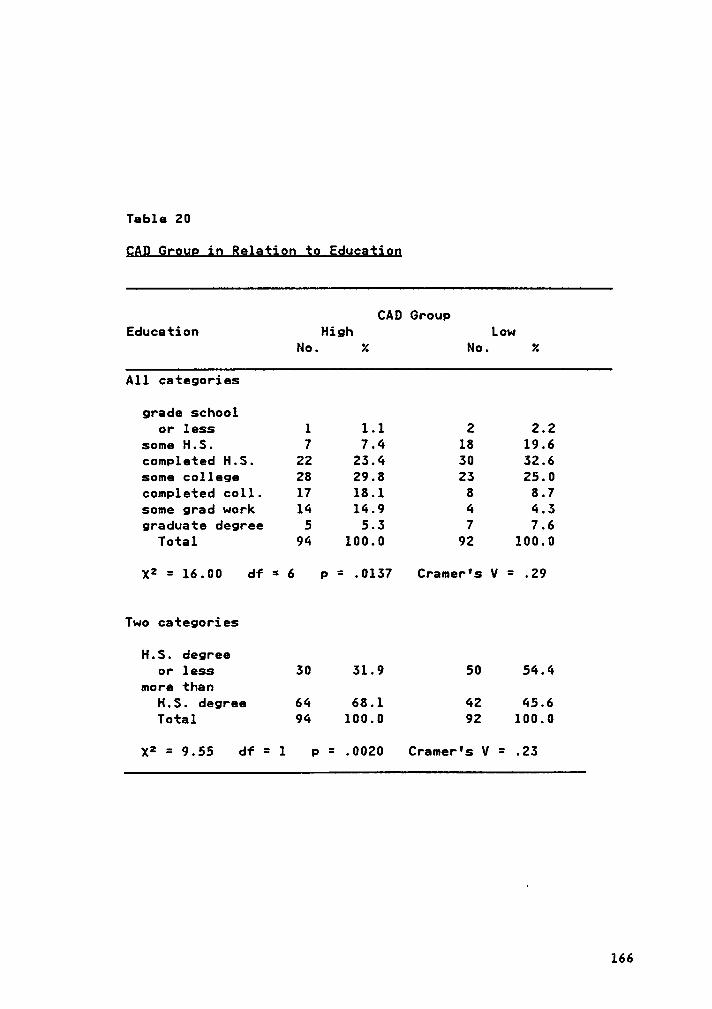
Table 20
CAQ Grgug in ßelgjjog to Edugajiog
CAD GroupEducation High Low
No. X No. Z
All categories
grade schoolor less 1 1.1 2 2.2
some H.S. 7 7.4 18 19.6completed H.S. 22 23.4 30 32.6some college 28 29.8 23 25.0completed coll. 17 18.1 8 8.7some grad work 14 14.9 4 4.3graduate degree 5 5.3 7 7.6
Total 94 100.0 92 100.0
x2 = 16.00 df = 6 p = .0137 Cramer's V = .29
Two categories
H.S. degreeor less 30 31.9 50 54.4
more thanH.S. degree 64 68.1 42 45.6Total 94 100.0 92 100.0
X2 = 9.55 df = 1 p = .0020 Cramer's V = .23
166
that of the low CADs (Category 7 had slightly more low CADs, 7.6% versus
5.3%).
A natural division between high school graduates (or less) and those
with at least some college seemed to emerge. Thus another test was con-
ducted for the following two categories:
1. High school degree or less2. More than high school degree
The chi-square value of 9.55 (p = .0020) again resulted in a rejection
of the null hypothesis although the strength of the relationship was low
to moderate (V = .23). The percentage of high CADs with more than a high
school degree (68.1%) was larger than the percentage of low CADs (45.7%).
Thus it appears that the two groups do differ with respect to education
levels and that high CADs are generally better educated. This conclusion
is in agreement with numerous studies reporting a positive relationship
between education and social responsibility (Hogan & Paolucci, 1979;
Lindgren, 1972; Nelson, 1974; Tognacci et al., 1972; Webster, 1975).
Null Hygothesis §Q
Initially, age was divided into six categories:
1. less than 252. 25 — 343. 35 - 444. 45 — 545. 55 — 646. 65 and older
167
All age categories above Z5, with the minor exception of the over 65
category, had more high CADs than low CADs. The statistic for this test
was X2 = 15.87 (P = .0084) (Table 21).
Since the major difference between high and low CAD consumers centered
around the age of 25, the above categories were collapsed to form two
larger ones:
T
1. Less than 25 years2. 25 years or more
Table 21 shows that there were 24.3% more people over 25 years of
age in the high CAD group (78.7%) than in the low CAD group (54.4%). Once
again, the value for Cramer's V indicated that the association between
CAD group and age was not a strong one. Overall, it can be said that the
CAD groups do differ with respect to age but in the opposite direction
from that hypothesized, i.e., high CADs are generally older than low CADs.
This result implies that high CADs may differ somewhat from the larger
group of all socially responsible consumers. Most researchers who de-
tected an association between age and social consciousness, found an in-
verse relationship (Anderson, Henion, & Cox, 1975; Lindgren, 1972;
Tognacci et al., 1972). An exception is Mitchell's (1983) group of
societally conscious individuals who were predominantly middle-aged.
Using multivariate discriminant analysis, O'Reil1y et al. (1984) also
discerned that those who purchased clothing at personal sales were older
168
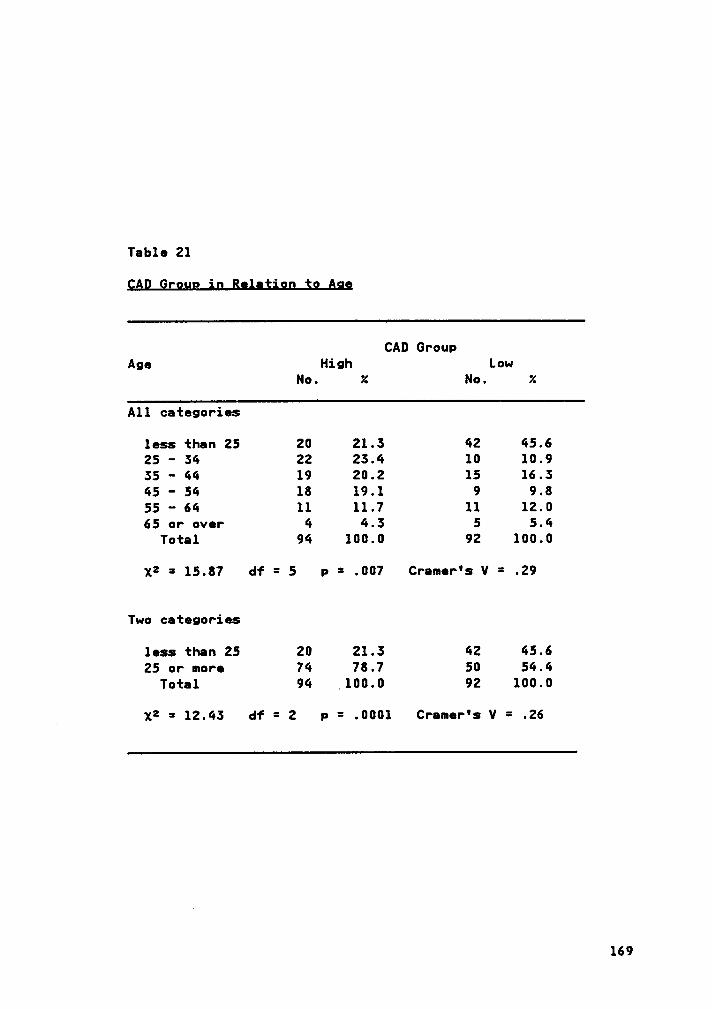
Table 21
CAD GroupAge High Low
No. Z No. Z
All categories
less than 25 20 21.3 42 45.625 - 34 22 23.4 10 10.935 - 44 19 20.2 15 16.345 · 54 18 19.1 9 9.855 - 64 11 11.7 ll 12.065 or over 4 4.3 5 5.4
Total 94 100.0 92 100.0
X2 = 15.87 df = 5 p = .007 Cramer's V = .29
Two categories
less than 25 20 21.3 42 45.625 or more 74 78.7 50 54.4
Total 94 .100.0 92 100.0
_ X2 = 12.43 df = 2 P = .0001 Cramer's V = .26
169
than nonpurchasers. However, age was not a significant discriminator of
personal sale users when considered by itself in univariate analysis.
Hull Hygojhggis SQ
Unfortunately, race could not be analyzed in this study because the
respondents were almost entirely white (95.7% high CADs, 96.8% low CADs).
The remaining participants, blacks and other racial groups, were present
in such small numbers that a valid test was not possible.
Ngll Hygothgsig §§
Political preference was not found to be a statistically significant
variable (X2 = 4.60, p = .101) (Table 22). The number of liberals in both
CAD groups was almost identical (17.2% high CAD, 17.1% lcw CAD). More
respondents in the high CAD group were politically middle·of—the·road
(62.4% versus 48.9%), and fewer were conservative (20.4% versus 34.1%).
Although these figures suggest a trend toward nonconservatism, they
do not reflect the strong liberal outlook evidenced in many investigations
of the SRC (Anderson, Henion, 8 Cox, 1975; Antil, 1978; Belch, 1979;
Constantini 8 Hanf, 1972; Dunlap, 1975; Lindgren, 1972; Mitchell, 1983;
Tognicci et al., 1972). This finding seems to reinforce earlier results
concerning age. The oft observed tendency of human beings to become more
conservative with age is one possible reason for the findings. The gen-
170
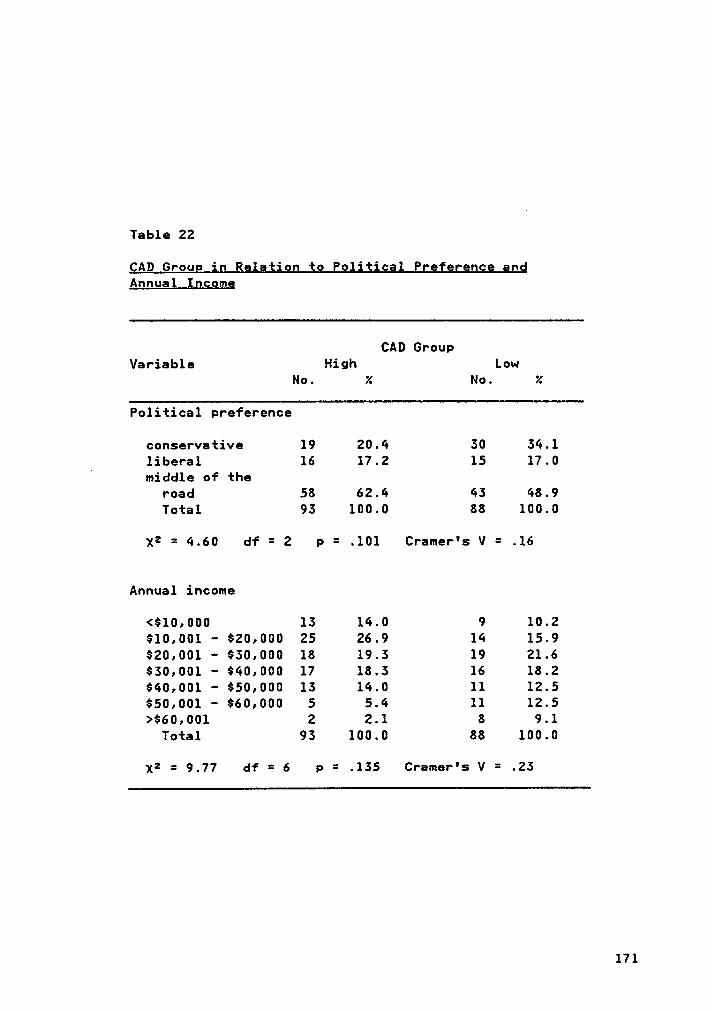
Table 22
QAD Grgug ig Relatjog go Politjgal Prefeggngg angAnngal [ggomg
CAD GroupVariable High Low
No. Z No. X
Political preference
conservative 19 20.4 30 34.1liberal 16 17.2 15 17.0nmiddle of the
road 58 62.4 43 48.9Total 93 100.0 88 100.0
X2 = 4.60 df = 2 p = .101 Cramer's V = .16
Annual income
<$10,000 13 14.0 9 10.2$10,001 · $20,000 25 26.9 14 15.9$20,001 · $30,000 18 19.3 19 21.6$30,001 - $40,000 17 18.3 16 18.2$40,001 - $50,000 13 14.0 11 12.5$50,001 — $60,000 5 5.4 ll 12.5>$60,001 2 2.1 8 9.1
Total 93 100.0 88 100.0
X2 = 9.77 df = 6 p = .135 Cramer's V = .23
171
erally conservative reputation of Virginians is an alternative explana-
tion.
Null Hygothesis SF
The questionnaire listed seven income levels:
1. less than $10,0002. $10,001 ' $20,000S. $20,001 - $50,0004. $50,001 ' $40,0005. $40,001 - $50,0006. $50,001 - $60,0007. over $60,000
High CADs exceeded low CADs in the lower income levels (less than $20,000)
but lagged behind in the higher levels (over $50,000) (Table 22). The
two were nearlv equal in the middle income categories ($20,001 - $50,000).
Despite the differences, the chi-square value was not statistically sig-
nificant (X2 = 9.77, P = .155).
Null Hygothegig 5G
The last question in the survey asked respondents about their in-
volvement in several kinds of organizations: community, Professional,
social, and ecological. Individuals were required to give the names of
the organizations to which they belonged. This extra effort, added to
the overall length of the questionnaire, may have caused many subjects
to forego this question. Unfortunately, because of the wording of the
question, the Pespondents who simply omitted it could not be distinguished
172
from those who actually did not belong to any organizations. Therefore,
the data for each organization type were collapsed into two categories,
no membership and membership, with the knowledge that the first category
might include a number of people who did belong to organizations but left
the question blank. For all four types of organizations, high CADs had
a higher proportion of members than low CADs (Table 23). However, in each
case the differences were not statistically significant.
Each respondent was assigned an organizational involvement score
equal to the total number of memberships she held in any type of organ-
ization. Again the difference between the two groups was not statis-
tically significant even though high CADs had about 20% more memberships
in at least one organization (59.1%) than low CADs (39.4%) (Table 24).
Both Antil (1978) and Lindgren (1972) found that socially responsible
consumers were more involved in organizations. Fratzke (1976) did not
address organizational involvement per se but did investigate involvement
in group activities. Nomen who Participated in more group activities
tended to sell goods at garage sales more often. lt is logical to expect
that greater exposure to other People would increase an individual's re-
cycling options, i.e., more people to offer and/or accept used clothing,
greater knowledge of personal sales, and so on. Moreover, as Ninakor and
Martin (1963) observed, organizations themselves often sponsor used
clothing sales.
173
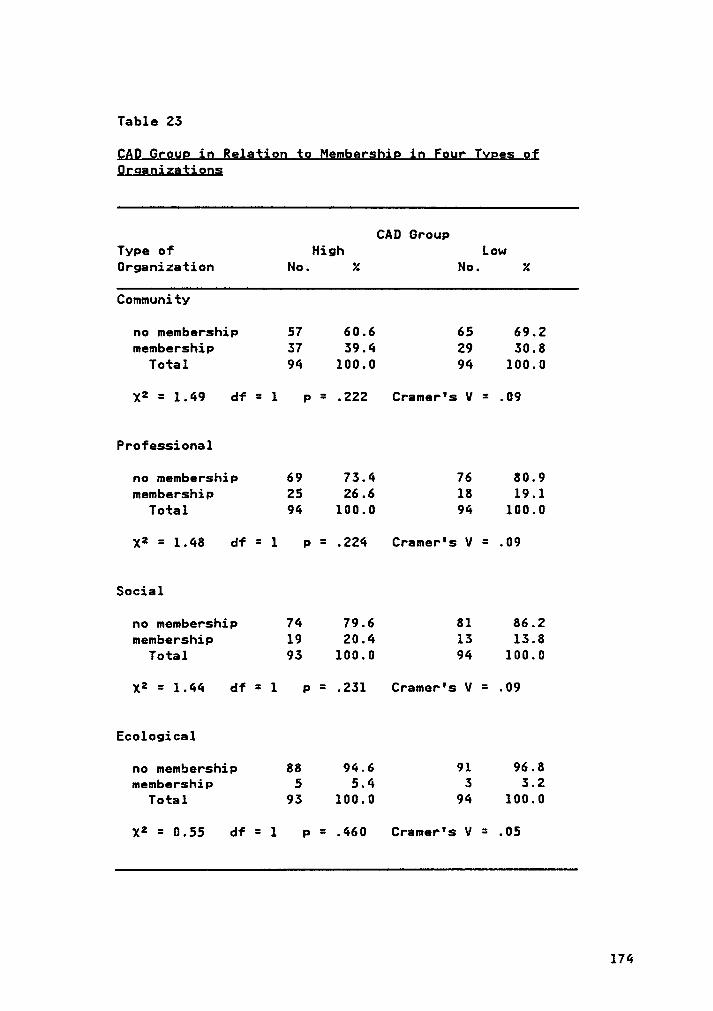
Table 23
CAQ Group in Relagiog tg Mgmbergbip ig Eggr lypeg ofQrgagigagigng
CAD GroupType of High LowOrganization No. Z No. Z
Community
no membership 57 60.6 65 69.2membership 37 39.4 29 30.8
Total 94 100.0 94 100.0
X2 = 1.49 df = 1 p = .222 Cramer's V = .09
Professional
no membership 69 73.4 76 80.9membership 25 26.6 18 19.1
Total 94 100.0 94 100.0
x2 = 1.48 df = 1 p = .224 Cramer's V = .09
Social
no membership 74 79.6 81 86.2membership 19 20.4 13 13.8
Total 93 100.0 94 100.0
X2 = 1.44 df = l P = .231 Cramer's V = .09
Ecological
no membership 88 94.6 91 96.8membership 5 5.4 3 3.2
Total 93 100.0 94 100.0
X2 = 0.55 df = 1 p = .460 Cramer's V = .05
174
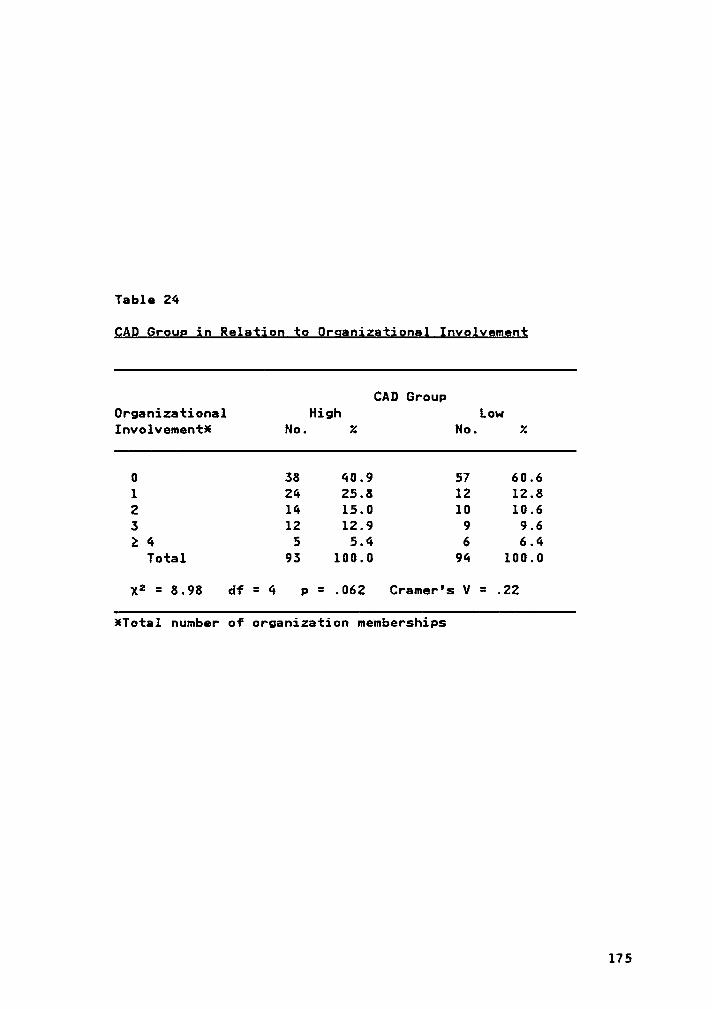
Table 24
QAQ Ggoug ig Relgjjog $0 Qrganjgatignal Igvolvgmgnj
CAD GroupOrganizational High LowInvolvementä No. Z No. Z
0 38 40.9 57 60.61 24 25.8 12 12.82 14 15.0 10 10.63 12 12.9 9 9.62 4 5 5.4 6 6.4
Total 93 100.0 94 100.0
X2 = 8.98 df = 4 p = .062 Cramer's V = .22
¤Tota1 number of organization memberships
175
Null Hyggthesig 4
No relationship exists between CAD attitudes and se-lected sociodemographic variables.
In an attempt to get another measure of the relationship between the
CAD scale and the sociodemographic variables, correlation coefficients
were calculated between CAD scores and scores on the individual variables
(Table 25). As previously stated, the Pearson correlation coefficient
is robust to scale violations. However, interpretation of the relation-
ship can be a problem when data do not follow any order. A dichotomous
variable is automatically ordered since one category always exceeds the
other with respect to the variable in question. Thus "marital status"
was considered an ordinal variable. "Political preference" was also
treated as ordinal since there was a ranking from conservative to liberal.
Racial identification could not be ordered in any meaningful sense and
therefore was not included in the correlation analysis.
Only three variables had statistically significant correlations with
the CAD scale: education, age, and income. The statistics on education
and age corroborate earlier findings. Nhile income was not found to be
dependent upon CAD group classification in the X2 analysis, there was a
trend in the data which supports the correlation result.
The finding of a negative relationship between CAD scores and income
levels is perplexing in light of differences in the educational background
of the two groups. The higher education levels of the high CADs normallv
176
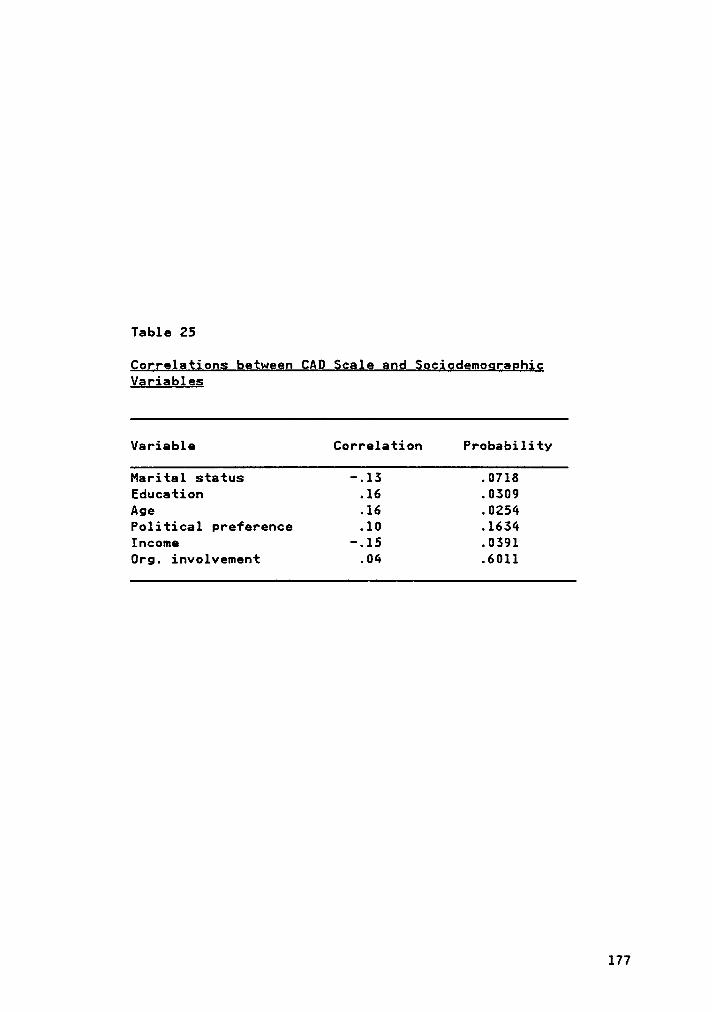
Table 25
Corgelationg between CAD §gale agd §oc§odemograghigVggiables
Variable Correlation Probability
Marital status -.13 .0718Education .16 .0309Age .16 . 0254Political preference .10 .1634Income -.15 .0391Org. involvement .04 .6011
177
would be expected to correspond to higher income levels, as was the case
in several studies of the SRC (Webster, 1975; Mitchell, 1983). One in-
vestigation, however, did obtain an inverse relationship in the income
and education levels of environmentally concerned citizens (Constantini
8 Hanf, 1972). The high·concern group had higher levels of education and
lower levels of income than the low-concern group. The investigators
attributed this apparent inconsistency to occupational differences.
Two-thirds of the low-concern group were businessmen, and two-thirds of
the high—concern group were either professionals or government officals.
Businessmen had relatively high incomes and low educational attainment,
while government officals possessed the opposite characteristics. The
researchers stated that the relationship between businessmen and low en-
vironmental concern appeared throughout the survey data.
Unfortunately, occupational data were not obtained in the present
study. The professional organizations listed by respondents suggest that
nursing and teaching were two well represented professions. Both require
education beyond the high school level and are known for low salaries.
These facts point toward an occupational influence on CAD behavior and
attitudes.
Qiscriminaai Analysis
The BMDP7M computer program for stepwise discriminant analysis (Dixon
et al., 1983) was used to evaluate the effectiveness of the
sociodemographic variables in identifying CAD group membership when con-
178
sidered together rather than one at a time. The eight predictor variables
were: marital status, education, age, racial identification, political
preference, annual income, and organizational involvement.
Table 26 is a summary of the stepwise analysis. The "F to enter"
is the partial F for each variable that is still a candidate for inclusion
in the discriminant function. Nilks' lambda is a general statistic used
for testing centroid equality. The distribution of the lambda statistic
is approximated by the F distribution. The variables selected for
inclusion in the discriminant function were income, marital status, edu-
cation, and political preference. Only two of these, income and educa-
tion, were found to be related to CAD group in the individual analyses
(X2 and correlation). Apparently marital status and political preference
contribute to the prediction of CAD group membership only in the presence
of the other sociodemographic variables.
Once the discriminant function has been computed, its statistical
significance level must be assessed to test the equality of CAD group
centroids. This can be done by evaluating the significance level of the
Nilks' lambda generated after all contributing variables have been en-
tered into the equation. Referring again to Table 26, the value of Nilks'
lambda after the final step was .87. The equivalent F statistic of 6.16
was statistically significant at the .001 level indicating that the high
and low CAD groups were statistically different from each other.
179
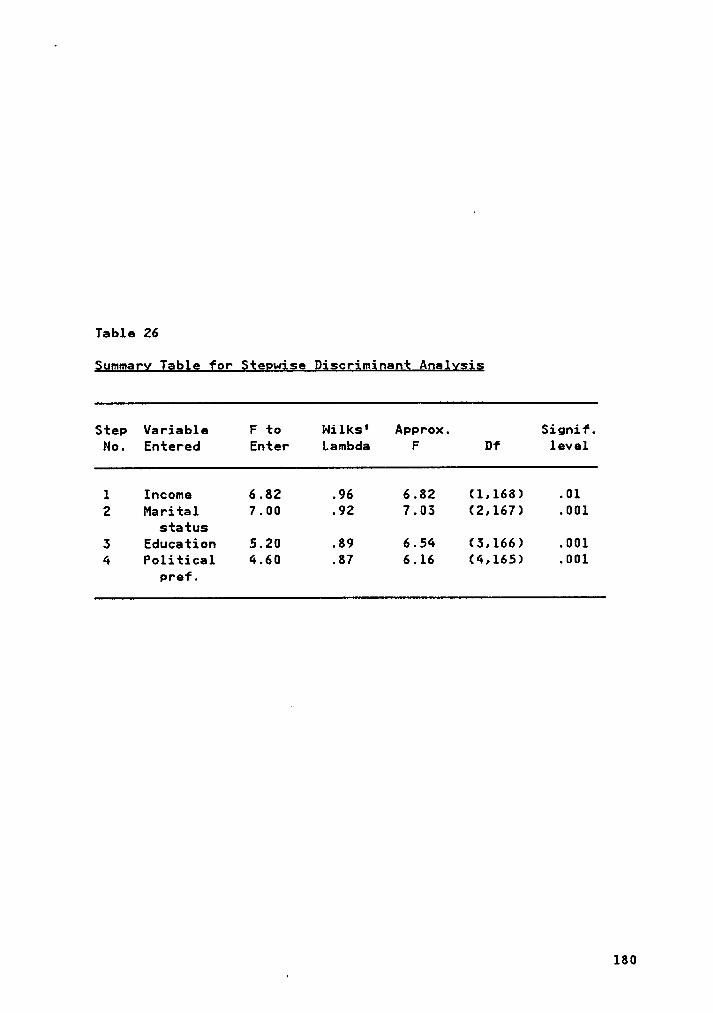
Table 26
§ummar¥ [gb}; for Sgggwise Djscgimigagg Analysis
Step Variable F to Nilks' Approx. Signif.No. Entered Enter Lambda F Df level
1 Income 6.82 .96 6.82 (1,168).012Marital 7.00 .92 7.03 (2,167) .001
status3 Education 5.20 .89 6.54 (3,166) .0014 Political 4.60 .87 6.16 (4,165) .001
pref.
180
However, with large sample sizes it is not difficult to get a sta-
tistical1y* significant F ratio. Consequently, a classification matrix
was developed to provide a more accurate assessment of the function's
discriminating power.
Classification or confusion matrices are constructed by assigning
individuals to groups based on their classification or discriminant
scores. For this purpose, the BMDP7M program essentially separates the
discriminant function into two functions called classification functions.
Each discriminant function coefficient is simply the difference between
the classification function coefficients of the two groups multiplied by
a constant (Table 27). Individuals are classified by substituting their
independent variable values into each classification function. The
function yielding the highest value determines the group to which the
individual is assigned (Brown, 1980).
The discriminant function coefficient, or discriminant weight, for
each variable is standardized by multiplying it by the pooled within
groups standard deviation of that variable. All standardized coeffi-
cients are expressed in the same units and therefore can be compared to
determine the relative importance of the variables as discriminators.
In this case, marital status was the most effective discriminator, fol-
lowed by political preference, annual income, and education respectively.
The classification matrix in the first section of Table 28 indicated
that 68.1% of the high CAD and 60.8% of the low CADs were correctly
181
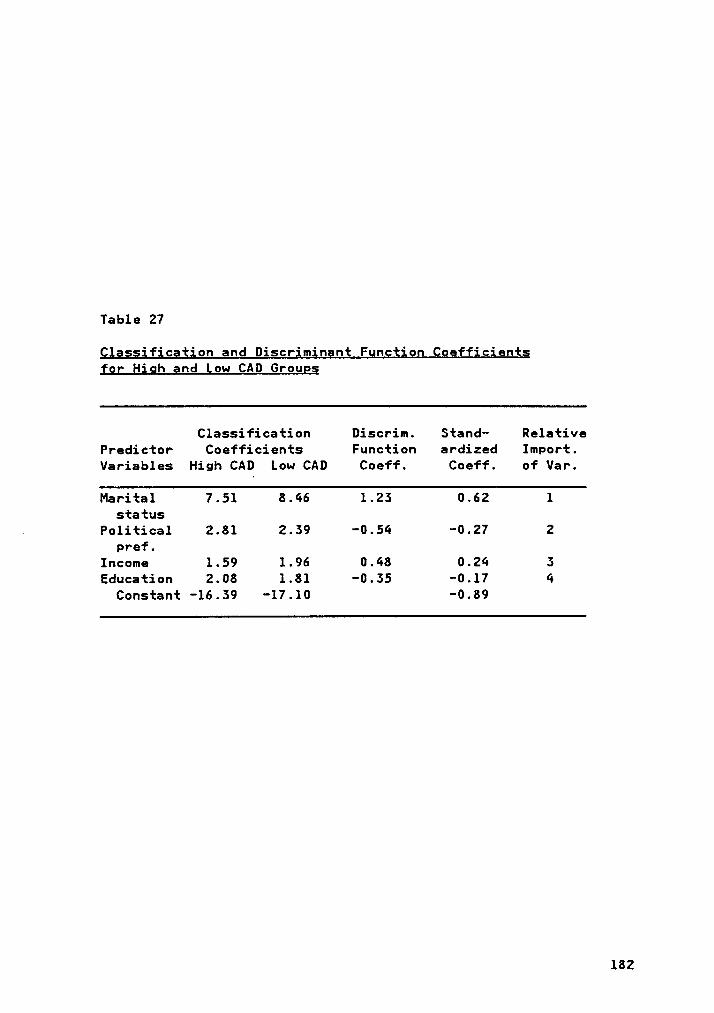
Table 27
Qlassificajjon and Discrimingnt Fgngtjgg Qgefficientsfor ßigh ang Low CAD Grougg
Classification Discrim. Stand- RelativePredictor Coefficients Function ardized Import.Variables High CAD Low CAD Coeff. Coeff. of Var.
Marital 7.51 8.46 1.23 0.62 1status
Political 2.81 2.39 -0.54 -0.27 2pref.
Income 1.59 1.96 0.48 0.24 3Education 2.08 1.81 -0.35 -0.17 4
Constant -16.39 -17.10 -0.89
182
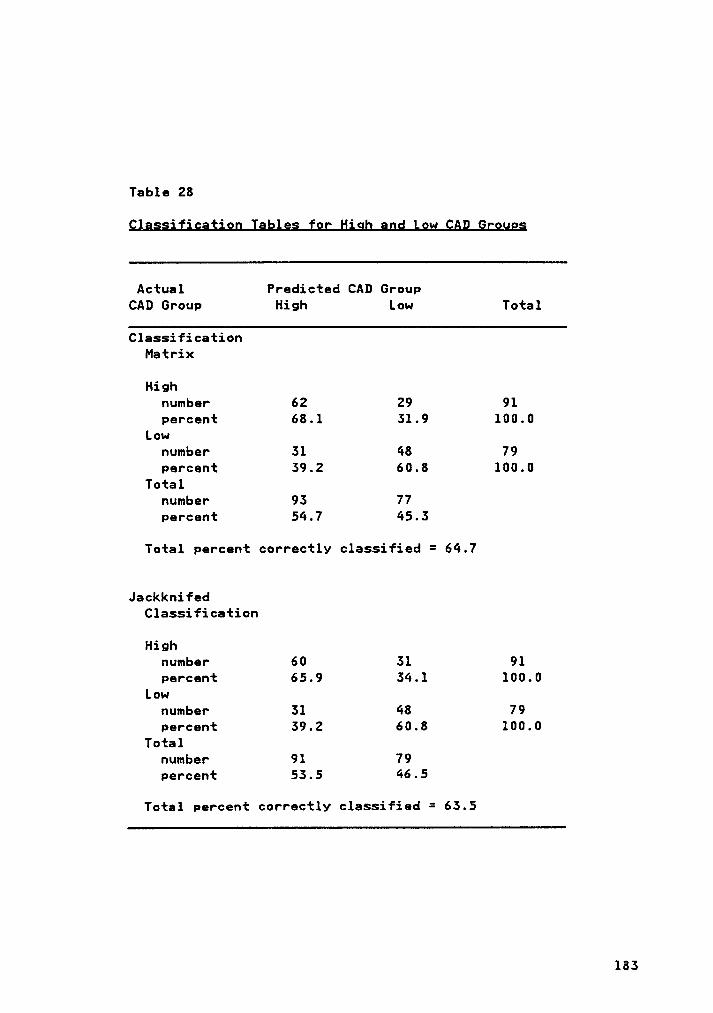
Table 28
Qiassificgiioh labies fgr High and Lgw CAD Qrougg
Actual Predicted CAD GroupCAD Group High Low Total
ClassificationMatrix
Highnumber 62 29 91percent 68.1 51.9 100.0
Lownumber 51 48 79percent 59.2 60.8 100.0
Totalnumber 95 77percent 54.7 45.5
Total percent correctlv classified = 64.7
JackknifedClassification
Highnumber 60 51 91percent 65.9 54.1 100.0
Lownumber 51 48 79percent 59.2 60.8 100.0
Totalnumber 91 79percent 55.5 46.5
Total percent correctly classified = 65.5
135
classified by the discriminant function. Overall, the percent correctly
classified was 64.7%. When both groups are of equal size, the percent
of individuals that can be classified correctly by chance is 50%. In the
present case, 18 of the 188 observations were not included in the analysis
due to missing values, leaving two unequal groups (high CADs 91, low CADs
79). Consequently, the proportional criterion should be used to determine
the chance classification (Hair et al., 1979):
C proportional = pz + (1 ·p)z
where:p = proportion of individuals in group 1
(1-p) = proportion of individuals in group 2
Substituting the appropriate value for each group (.535 and .465) yielded
a proportional chance criterion of .502. Thus the groups are essentially
equal for the purposes of the analysis, and the predictive accuracy of
64.7% is better than chance.
Hair et al. (1979) suggested that classification accuracy should be
at least 25% greater than by chance. Therefore, with chance accuracy of
50%, the predictive accuracy should be no less than 62.5% to justify in-
terpretation of the discriminant function. Based on this criterion, the
classification accuracy of the present analysis is acceptable.
The predictive accuracy is somewhat overstated because the data used
to develop the discriminant model were also used to test the model. The
jackknifed classification matrix is a method of correcting for this upward
bias which excludes the element being classified from the computation of
184
the function (Dixon et al., 1985). The percent correctly classified using
this procedure was 65.5%, a value not substantially different from the
"uncorrected" accuracy measure. This level of classification accuracy
also exceeds the minimum 62.5% criterion, indicating that differences on
the predictor variables do provide meaningful information for identifying
CAD group membership.
In summary, the discriminant function using four predictor variables,
marital status, education, political preference, and annual income, was
successful in predicting membership in the two CAD groups. Compared to
low CADs, high CADs were more often married and living with their spouses.
They were also less conservative politically, more highly educated, and
had lower annual household incomes. Based on these results, it appears
that marital status and political preference, while not strong identifi-
ers of CAD group membership by themselves, would be helpful discriminators
when combined with education and annual income.
Null Hygogbesis §
High CAD consumers and low CAD consumers do notdiffer in selected types of media usage:
A. Hours of commercial TV viewingB. Hours of PBS TV viewingC. Frequency of program viewing
(9 program types)D. Frequency of magazine reading
(16 magazine types)E. Frequency of newspaper readingF. Hours of radio listening
185
The results of Hypothesis l confirmed that CAD attitudes are associated
with CAD behaviors. However, these attitudes may be related to other
behaviors as well. Hypothesis 5 is concerned with testing the re1ation·
ship between CAD attitudes and media usage behaviors.
Since the data for hypotheses SA and SB are interval scale, the re-
searcher had intended to test them with a t—test of means. However, a
normality test of the distributions of both sets of data (i.e., commercial
and educational) indicated that they deviated materially from the normal
distribution. For commercial TV viewing, the Kolmogorov·Smirnov D for
the low CAD group was .20 (p = .01) and for the high CAD group was .19
(p = .01). Both values were statistically significant indicating that
the observed distributions were not normal. A test of the data on edu-
cational TV viewing produced similar results (high CAD D = .30, p = .01
and low CAD D = .33, p = .01).A
In view of the foregoing statistics, it was decided to use chi·square
tests to determine if the CAD groups differed in the number of hours they
spent watching commercial and educational television each week. High CADs
watched more of both types of television programs, but the differences
were not statistically significant (Table 29).
Respondents were asked to indicate how often they watched nine dif-
ferent types of programs: news programs, dramas, comedies, game shows,
soap operas, movies, talk shows, sports programs, and nature or wildlife
shows. Using a chi··square test of independence, only three program types
186
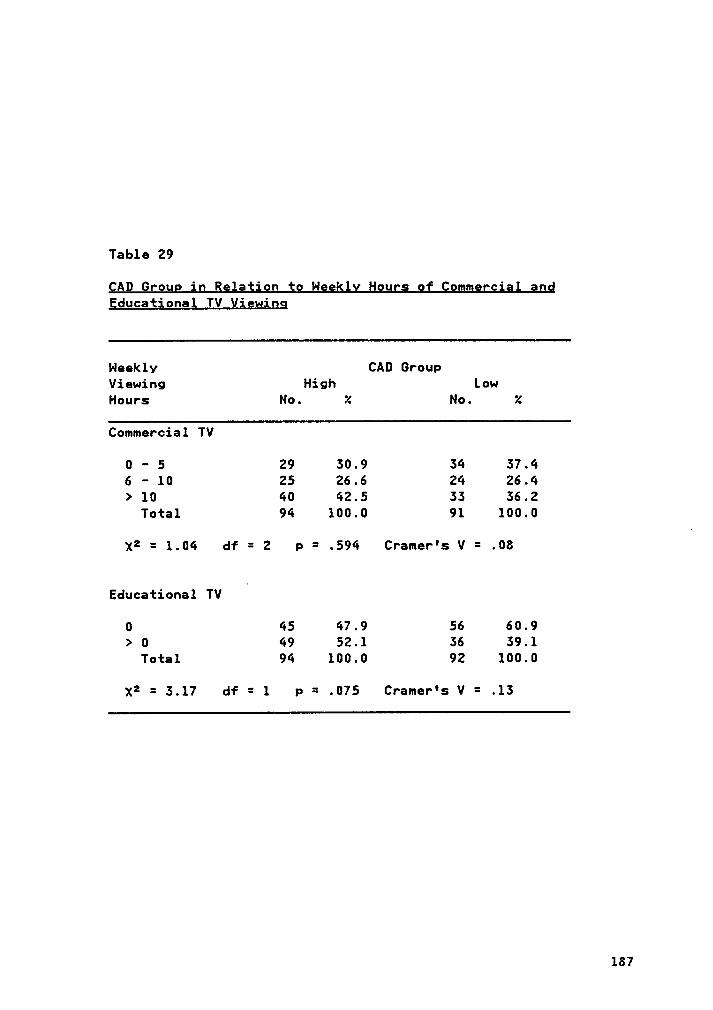
Table 29
QAQ Ggoug in Rglajign go Weekly Hgurs of Qgmggggjgl aggEducatjonal TV Vjgwigg
Weekly CAD GroupViewing High LowHours No. Z No. X
Commercial TV
0 · 5 29 30.9 34 37.46 - 10 25 26.6 24 26.4> 10 40 42.5 33 36.2
Total 94 100.0 91 100.0
X2 = 1.04 df = 2 p = .594 Cramer's V = .08
Educational TV
0 45 47.9 56 60.9> 0 49 52.1 36 39.1
Total 94 100.0 92 100.0
X2 = 3.17 df = 1 p = .075 Cramer's V = .13
187
were found to be statistically significant: news programs, game shows,
and nature or wildlife shows (Table 30). High CADs watched news and na-
ture programs more often and games shows less often than low CAD consum-
ers. Cramer's V values were low to moderate for all three types of
programs, with nature programs indicating a slightly stronger relation-
ship to CAD classification.
In a similar manner, sixteen kinds of magazines were tested: busi-
ness, major news, television, general sports, human interest, tabloids,
automotive, specific sports, domestic, men's magazines, fashion, educa-
tional, home or.garden, commentary, literary, and nature. Of these, two
magazines exhibited statistically significant chi-squares values: edu-
cational and literary. High CADs read both types more often than low CADs
(Table 31). This result seems to confirm the findings associated with
the higher education levels of high CAD consumers. One would expect ed-
ucational and literary magazines to appeal to individuals with more edu-
cation.
Two other magazines had chi-square values approaching statistical
significance= fashion and nature. More high CADs said that they never
read fashion magazines (36.7% versus 27.8%) and slightly more said they
sometimes read this type of magazine (50.5% versus 44.4%). However, fewer
high CADs read fashion magazines often (13.3% versus 27.8%). Nith respect
to nature magazines, high CADs read more magazines related to nature
topics than low CADs (50.6% versus 33.3%).
188
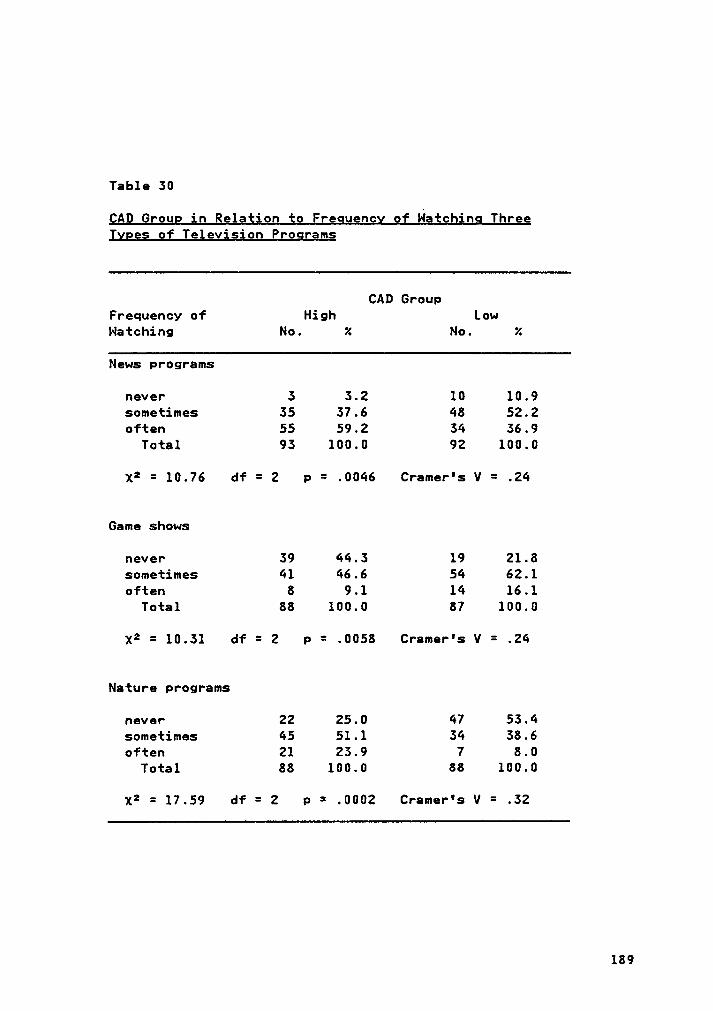
Table 30
CAD Qgoug in Relaiion io Freguency gf Qatching ThgeeTyges of Teievisiog Programs
CAD GroupFrequency of High LowWatching No. Z No. X
News PTOQPBMS
never 3 3.2 10 10.9sometimes 35 37.6 48 52.2often 55 59.2 34 36.9
Total 93 100.0 92 100.0
X2 = 10.76 df = 2 P = .0046 Cramer's V = .24
Game shows
never 39 44.3 19 21.8sometimes 41 46.6 54 62.1often 8 9.1 14 16.1
Total 88 100.0 87 100.0
X2 = 10.31 df = 2 P = .0058 Cramer's V = .24
Nature programs
never 22 25.0 47 53.4sometimes 45 51.1 34 38.6often 21 23.9 7 8.0
Total 88 100.0 88 100.0
X2 = 17.59 df = Z P = .0002 Cramer's V = .32
189
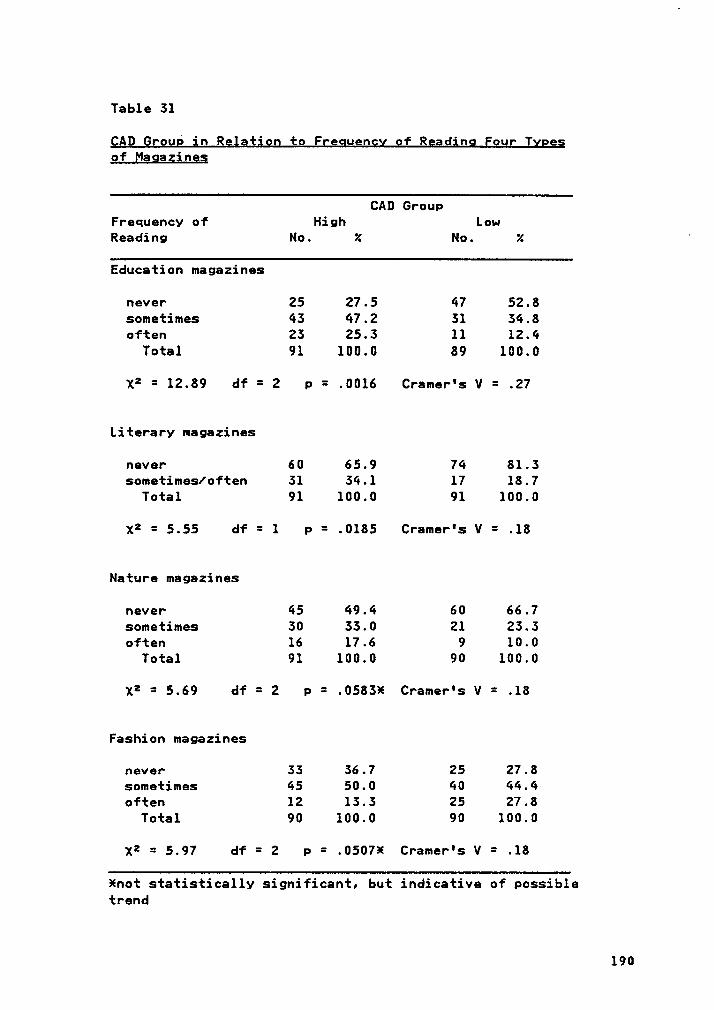
Table 31
QAD Group in ßglgtigg to Egggueggg gf ggggigg four [ygesof Magagingg
CAD GroupFrequency of High LowReading No. Z No. Z
‘
Education magazines
never 25 27.5 47 52.8sometimes 43 47.2 31 34.8often 23 25.3 11 12.4
Total 91 100.0 89 100.0
X2 = 12.89 df = 2 p = .0016 Cramer's V = .27
Literary magazines
never 60 65.9 74 81.3sometimes/often 31 34.1 17 18.7
Total 91 100.0 91 100.0
X2 = 5.55 df = 1 p = .0185 Cramer's V = .18
Nature magazines
never 45 49.4 60 66.7sometimes 30 33.0 21 23.3often 16 17.6 9 10.0
Total 91 100.0 90 100.0
X2 = 5.69 df = 2 p = .0583X Cramer's V = .18
Fashion magazines
never 33 36.7 25 27.8sometimes 45 50.0 40 44.4often 12 13.3 25 27.8
Total 90 100.0 90 100.0
x2 = 5.97 df = 2 p = .0507l Cramer's V = .18
Xnot statistically significant, but indicative of possibletrend
190
To assess overall magazine reading, a composite score was calculated
for each individual. This score was equal to the sum of all magazines
which the subject read either sometimes or often. Since scores ranged
from 16 to 48, those below 33 were considered low and those equal to or
above 33 were labeled high. A chi-square test of these scores did not
reveal any statistically significant differences between the CAD groups
(X2 = .60, P = .4388) (Table 32).
Newspaper reading was another media variable for which there were
only minor differences. Both CAD groups had approximately the same number
who read the paper on a daily basis (67.7% high CAD, 64.5% low CAD) and
several times a week or never (32.3% high CAD, 35.5% low CAD). The chi-
square value (.22) was not statistically significant (p = .6421).
The final media usage variable, daily hours of radio listening, could
not be evaluated because of inconsistent data. The question read, "On
an average weekday (Monday through Friday) about how much time do you
spend listening to the radio?” Although the researcher intended to elicit
daily hours of radio listening, many people responded with weekly hours
of listening. Undoubtedly the question was worded inappropriately to
obtain accurate responses.
Mitchell (1983) is the only researcher who considered these media
usage variables. His results differed from those presented here in se-
veral respects. People who held societally conscious values displayed a
low incidence of cammercial TV watching, preferring instead to view edu-
191
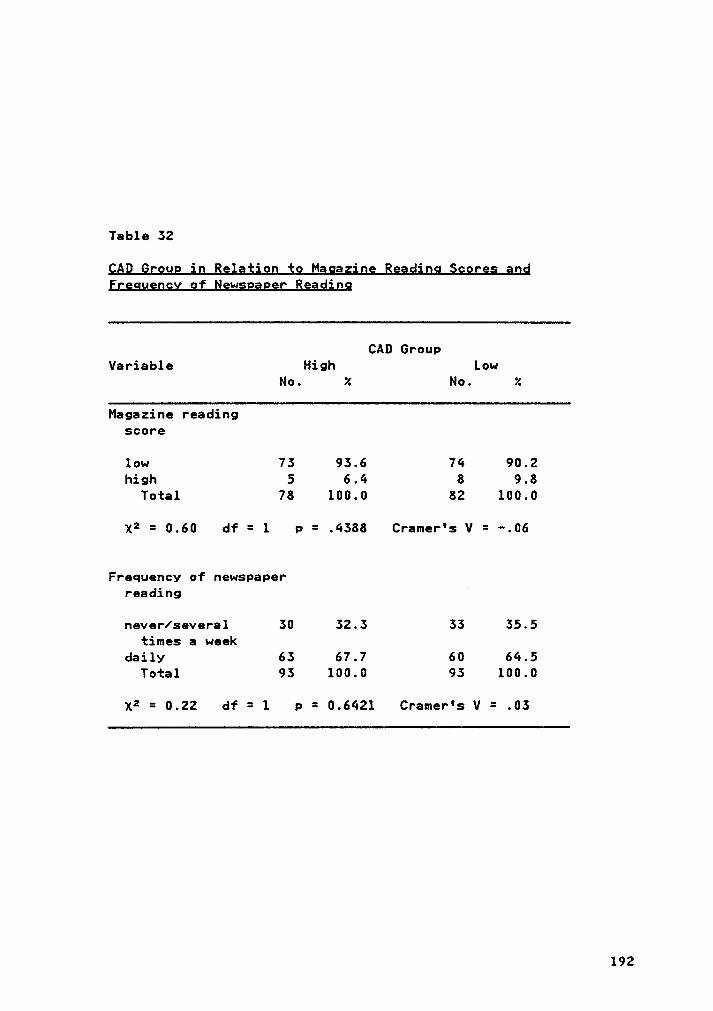
Table 32
QAD Qrgug ig Relation jo Magagjng Readjgg §ggrg; gggErggugncy of ßgwsgageg Reagjgg
CAD GroupVariable High Low
No. Z No. Z
Magazine readingscore
low 73 93.6 74 90.2high 5 6.4 8 9.8
Total 78 100.0 82 100.0
x2 = 0.60 df = 1 P = .4388 Cramer's V = ~.06
Frequency of newspaperreading
never/several 30 32.3 33 35.5times a week
dailv 63 67.7 60 64.5Total 93 100.0 93 100.0
X2 = 0.22 df = 1 p = 0.6421 Cramer's V = .03
192
cational television. When they did look at commercial television pro-
grams, they watched more sports programs and fewer soap operas than the
average viewer. They were above average readers of many sections of the
newspaper (e.g., business) and many types of magazines. The obvious
disparities between the high CADs and the societally conscious consumers
may be a factor of sample gender. The fact that almost half of the
societally conscious group was male could easily account for the dissim-
ilar results.
Summary of Findings
Table 33 summarizes the research results. The CAD scale performed
well in all analyses and was associated with clothing consumption behav-
iors, individually and as a set. Further it was related to the SRCB
scale, indicating a connection with general social responsibility.
Respondents with complete CAD scales were divided into thirds. The
top third was designated "high CADs," and the bottom third was called "low
CADs." Sociodemographic and media usage variables were analyzed using
chi-square tests and correlations. Education, age, educational and lit-
erary magazines, and news and nature television programs were positively
related to CAD attitudes. Two variables, income and watching TV game
shows, were negatively related to CAD attitudes. Discriminant analysis
permitted the simultaneous evaluation of the sociodemographic variables
to determine which were important in distinguishing high and low CADs.
The analvsis verified the importance of education and income as
193

discriminators and added marital status and political preference as sig-
nificant variables in the discriminant function.
194
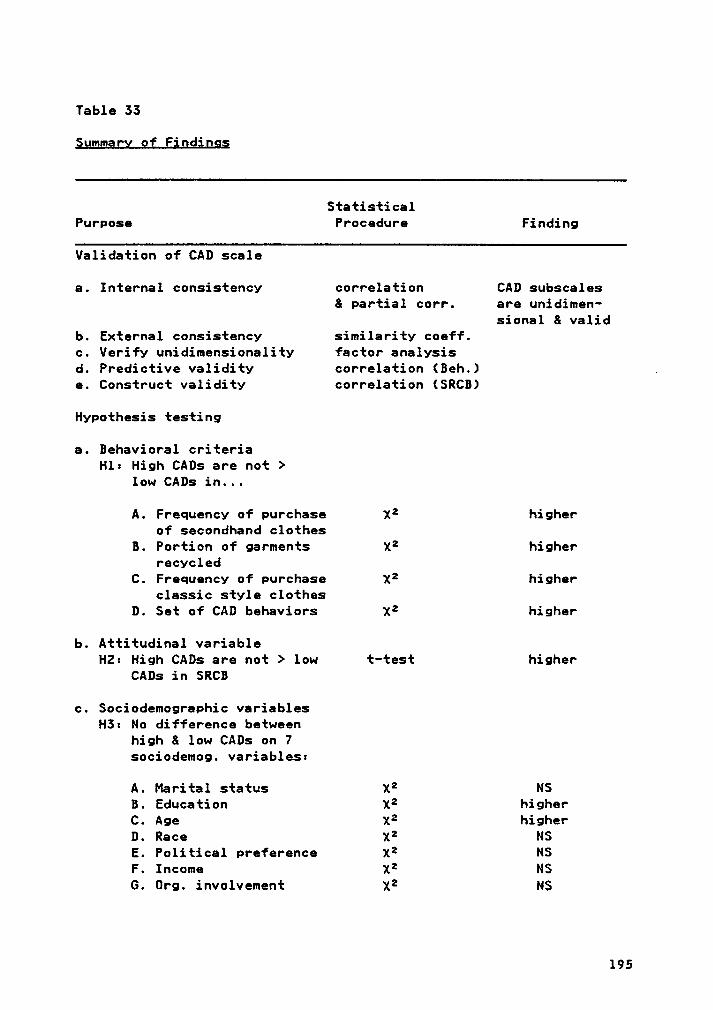
Table 53
§ummar¥ gf Eigdiggs V
StatisticalPurpose Procedure Finding
Validation of CAD scale
a. Internal consistency correlation CAD subscales8 partial corr. are unidimen-
sional 8 validb. External consistency similarity coeff.c. Verify unidimensionality factor analysisd. Predictive validity correlation (Beh.) .e. Construct validity correlation (SRCB)
Hypothesis testing
a. Behavioral criteriaHl: High CADs are not >
low CADs in...
A. Frequency of purchase X2 higherof secondhand clothes
B. Portion of garments X2 higherrecycled
C. Frequency of purchase X2 higherclassic style clothes
D. Set of CAD behaviors X2 higher
b. Attitudinal variableH2: High CADs are not > low t—test higher
CADs in SRCB
c. Sociodemographic variablesH3: No difference between
high 8 low CADs on 7sociodemog. variables:
A. Marital status x2 NSB. Education x2 higherC. Age X2 higherD. Race x2 NSE. Political preference x2 NSF. Income X2 NSG. Org. involvement X2 NS
195
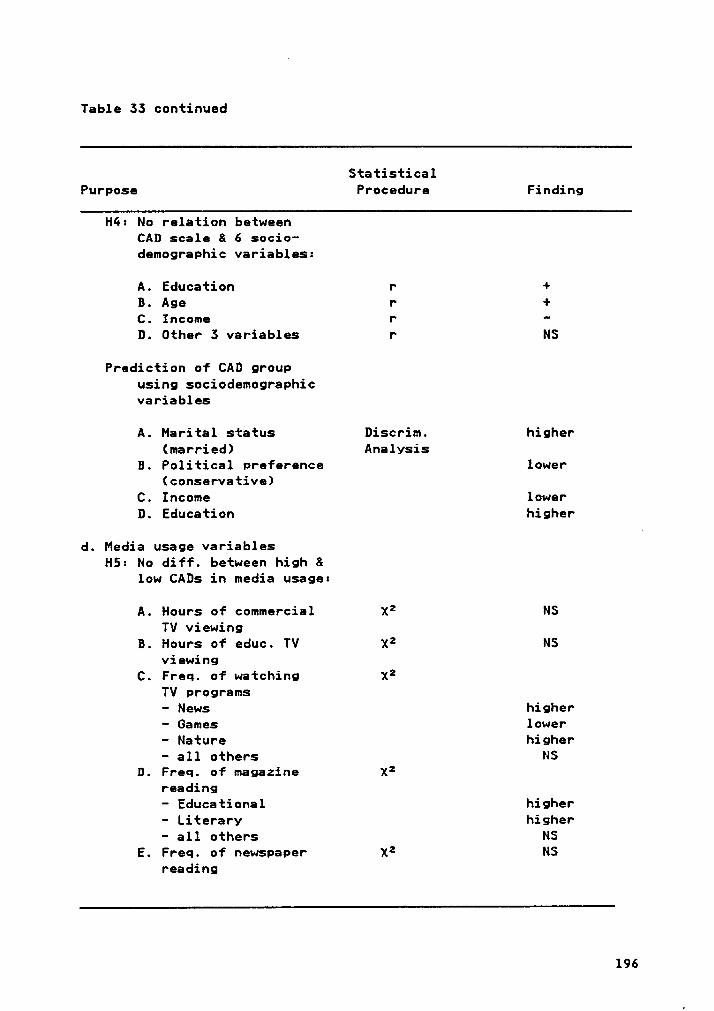
Table 35 continued
StatisticalPurpose Procedure Finding
H4: No relation betweenCAD scale 8 6 socia-
demographic variables:
A. Education r +B. Age r +C. Income r -D. Other 3 variables r NS
Prediction of CAD groupusing sociodemographicvariables
A. Marital status Discrim. higher(married) Analysis
B. Political preference lower(conservative)
C. Income lowerD. Education higher
d. Media usage variablesH5: No diff. between high 8
low CADs in media usage:
A. Hours of commercial X2 NSTV viewing
B. Hours of educ. TV x2 NSviewing
C. Freq. of watching X2
TV programs
~ News higher
- Games lower
- Nature higher
- all others NSD. Freq. of magazine X2
reading
- Educational higher— Literary higher
- all others NSE. Freq. of newspaper X2 NS
reading
196
CHAPTER VI
CONCLUSIDNS, IMPLICATIDNS» AND RECOMMENDATIONS
Conclusions
To draw conclusions from the findings, it is helpful to refer to the
research objectives as presented in the introduction.
Objgctive L. To understand the attitudes and behaviors involvedin clothing waste and their relationship to socially responsibleconsumption.
The review of literature provided cursory knowledge of the factors
involved in clothing waste and the nature of attitudes, behaviors, and
their interaction. Using that background, it was hypothesized that people
concerned about the environment would perceive a connection between re-
source conservation and apparel consumption. As a result they would try
to reduce clothing waste by increasing the duration of garment ownership
or by expanding the use-value of clothing. These individuals were ex-
pected to exercise a greater degree of analytical buying in order to in-
crease garment satisfaction and reduce discards. They would utilize
secondhand markets for clothing acquisition and discard and attempt to
obtain greater use from garments through recycling or by purchasing
multipurpose or classic styles.
197
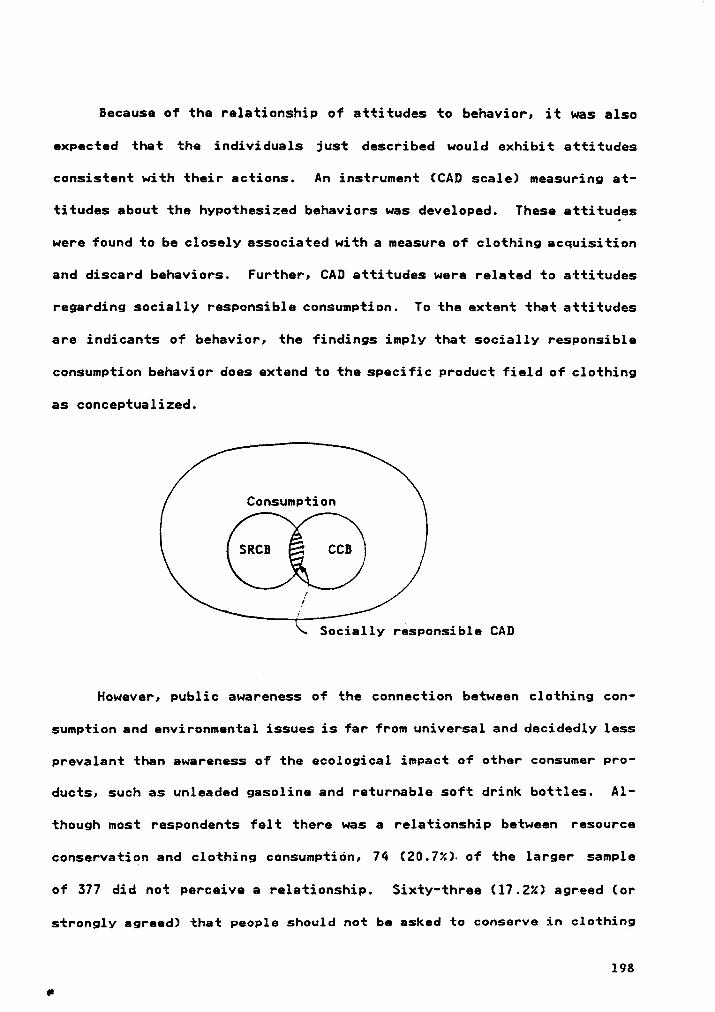
Because of the relationship of attitudes to behavior, it was also
expected that the individuals just described would exhibit attitudes
consistent with their actions. An instrument (CAD scale) measuring at-
titudes about the hypothesized behaviors was developed. These attitudes
were found to be closely associated with a measure of clothing acquisition
and discard behaviors. Further, CAD attitudes were related to attitudes
regarding socially responsible consumption. To the extent that attitudes
are indicants of behavior, the findings imply that socially responsible
consumption behavior does extend to the specific product field of clothing
as conceptualized.
Consumption
¢@Socially responsible CAD
However, public awareness of the connection between clothing con-
sumption and environmental issues is far from universal and decidedly less
prevalant than awareness of the ecological impact of other consumer pro-
ducts, such as unleaded gasoline and returnable soft drink bottles. Al-
though most respondents felt there was a relationship between resource
conservation and clothing consumption, 74 (20.7%} of the larger sample
of 377 did not perceive a relationship. Sixty-three (17.2%) agreed (or
strongly agreed) that people should not be asked to conserve in clothing
198•
consumption, and 45 (9.9%) did not think resource conservation should be
considered when buying clothes.
As discussed in the literature review, there are a variety of sources
of waste associated with clothing (Table 4). This research has concen—
trated on waste resulting from the underutilization or premature disposal
of clothing, waste which often creates environmental problems in the form
of trash. Many consumers did not consider this factor in their clothing
acquisition and discard, perhaps placing a higher priority on minimizing
other aspects of waste, e.g., loss of time or of psychological satisfac-
tion. There is certainly room for argument about the relative importance
of various sources of clothing waste. Eventually however, nature may
determine these priorities for us. As the pollution problmn worsens,
considerations less crucial to human survival, such as psychological
satisfaction, may become secondary to environmental ones or be redirected
into other outlets (e.g., secondhand clothing or remodeling of garments).
An understanding of responsible clothing consumption attitudes and
behaviors includes some awareness of the motivation behind them. Altruism
and practicality (efficiency) were discussed earlier as possible motives
(Chapter II). The selection of a sample from the middle- to high-income
brackets ums designed to·address another possible explanation for re-
sponsible clothing consumption, namely that people who practice these
behaviors (CAD) may be reflecting a desire to save money rather than a
concern for the environment. Although high CADs tended to have lower
incomes than low CADs, the strong relationship between the SRCB scale and
199
the CAD scale appears to indicate that CAD behavior is somehow connected
to a sense of social responsibility. There are also indications that the
price may be a secondary concern to this segment. The investigation of
0'Reil1y et al. (1984) concerning a similar group, personal sale shoppers,
revealed that price by itself was not an important variable to them. It
is conceivable that both motivations operate concurrently. In fact, the
two may be inextricable since each is concerned with conserving resources.
Hinton and Margerum's (1984) findings support this notion. Their study
revealed that ecological and economic concern were related to each other
and to the use of and attitudes toward used clothing.
Qgjgctive Q. To develop meaningful measures to assess the attitudesand behaviors related to clothing waste and socially responsibleconsumption.
As discussed above, the CAD scale was initially designed to measure
attitudes about six areas of clothing consumptione garment recycling,
purchase of secondhand clothing, importance cf fashion in acquisition and
discard, purchase of multipurpose garments, analytical buying, and gen-
eral clothing wastefulness and conservation. From a pool of 99 items,
26 were selected for inclusion in the final CAD scale. Refinement of the
scale was accomplished by means of two pretests. Pretest I, using a
sample of 63 female college seniors, resulted in a reduction of the
measure by 25 items. Fifty-two additional items were deleted following
Pretest II, a survey of 376 college women. The data from the second
pretest were analyzed by means of a computer program (PACKAGE) which
calculated inter—item correlations, partial correlation coefficients,
200
similarity coefficients, factor loadings, and alpha coefficients. These
statistics provided information on the internal consistency, external
consistency, dimensionality, and reliability of the subscales or factors.
Pretesting resulted in the elimination of two factors which did not
contribute to the sca1e's ability to discriminate. The "analytical buy-
ing" cluster of items was designed to measure the ability to judge
clothing quality, consider pertinent information when shopping, and plan
clothing purchases as opposed to buying on impulse. Judging from the
pretest sample, most consumers engage in these practices when shopping
for clothes. The universality of the behaviors included in "analytical
buying" made the subscale a poor means of differentiating between groups
of shoppers. Perhaps a more definitive concept of analytical buying would
have been successful. It may be that socially responsible consumers tend
to look at certain garment attributes (e.g., fiber content or care in-
structions) more often than other shoppers. Likewise when planning
clothing purchases, they may prefer to buy small items like accessories
to coordinate their wardrobes rather than larger, more expensive apparel
items.
The ”multipurpose" factor was also deleted from the CAD scale. The
subscale items dealt with respondent feelings about garment versatility
and variety and the importance of clothing which could be worn for dif-
ferent occasions. Low and/or negative correlations in this subscale in-
dicated that there was a lack of consistency among the items. Apparently
201
people appreciate clothes which can serve several purposes, but they also
want a large variety of garments.
The four subscales remaining in the final CAD scale were: "second-
hand," "recycling," "general," and "fashi¤n." Pretest results prompted
a rewording of items in the "recycling" factor to improve its internal
consistency. The measure was administered to a sample of 405 female pa-
trons of a shopping mall in Roanoke, Virginia. The data were subjected
to the same battery of tests used during pretesting and to additional
analyses to determine construct and predictive validity. The findings
indicated that the CAD scale is composed of four unidimensional subscales.
In addition, the low inter-subscale correlations confirmed that the CAD
construct is a multidimensional concept, not wholly defined by any one
factor.
The theoretical model suggests that there is a connection between
attitudes and behavior. Chi—square tests were used tc evaluate the as-
sociation of CAD scale attitudes with related behaviors, i.e., garment
recycling and purchase of secondhand and classic clothing. In each case
these tests were statistically significant, suggesting that CAD attitudes
and behaviors were not independent. High correlations between the CAD
scale and the behavior index also established the scale's predictive or
concurrent validity.
Finally, the strong association between the CAD scale and the SRCB
scale (t-test, correlation) indicated that the former was related to ec-
202
ological consciousness. In other words, the scale performed in accordance
with theoretical expectations, thereby establishing construct validity.
The overall performance of the CAD scale in testing leads to the conclu-
sion that it is a reasonably reliable and valid measure of attitudes
concerning socially responsible clothing acquisition and discard.
Qgjgg;i;g_§. To determine the characteristics of consumers iden-tified by their attitudes and behaviors relative to clothing wasteand socially responsible consumption.
Based on the findings in Chapter V, a profile of consumers with fa-
vorable attitudes toward socially responsible clothing acquisition and
discard behavior (high CADs) can be drawn. Nith respect to responsible
clothing consumption, high CADs buy secondhand clothes more often, recy-
cle a larger portion of their clothing, and purchase classic style gar-
ments more frequently than low CADs. High CADs also display attitudes
which coincide with these behaviors. They are strongly in favor of gar-
ment recycling and feel that it should be encouraged. They agree that
clothing is often wasted and conservation should be considered in clothing
consumption. As a whole, the group is not particularly concerned about
wearing the latest fashion or being in style. High CADs appreciate sec-
ondhand clothing, are aware of secondhand markets, and do not feel that
shopping for used clothes is inconvenient or embarrassing. Several
sociodemographic characteristics distinguish high CADs from low CADs.
High CADs tend to be older and have lower annual household incomes and
higher levels of education. They may also be less politically conserva-
203
tive and more prone to be married and living with their spouses (when
considered in conjunction with other variables).
One reason for the disparity between income and education levels was
discussed in the previous chapter. Namely, high CADs, despite their high
education levels may choose or be forced to choose lower paying jobs.
Alternatively, they may prefer to stay home with their families rather
than work outside the home. These explanations suggest that high CADs
may have an individualistic nature which rejects society's standard of
success and emphasizes self·fulfillment. This individualism coincides
with previous descriptions of the socially responsible consumer (Antil,
1978; Henion 8 Wilson, 1976; Mitchell, 1985).
_ High CADs also exhibit media usage habits which distinguish them from
low CADs. They watch more news and nature television Programs, but are
less likely to watch game shows. High CADs read more educational and
literary magazines, a practice which seems to agree with their higher
education levels. The trends noted for fashion and nature magazines
(i.e., read fewer fashion and more nature magazines) also seem reasonable
in light of other characteristics identified with high CADs. Conceivably,
their interest in classic fashions would make them less likely to read
magazines that usually concentrate on current or high fashion. Also,
since high CADs are more ecologically concerned (higher SRCB scores) than
low CADs, they would be expected to show a greater interest in nature
magazines.
204
Related studies suggest additional characteristics that might be
associated with the high CAD consumer. For example, because of the re-
lationship between the CAD scale and the SRCB scale, one might expect the
characteristics which Antil found to be associated with high scores on
the SRCB scale to be similarly related to high CAD scale scores. Table
34 shows his findings.
One should be cautious in assuming that all of the variables asso-
ciated with high SRCB scores are also characteristics of high CADs. Al-
though the two constructs are similar, they are not identical, as the
results indicate. Antil (1978) found that his scale was not related to
age, income, or education but was positively associated with a liberal
outlook and organizational involvement. In contrast, the CAD scale had
a statistically significant relationship with age, income, education, and
political preference (discriminant analysis), but not with organizational
involvement (although the trend for the latter variable was in the same
direction as Antil's results). In the study by 0'Reilly et al. (1984),
consumers of clothing at personal sales were less inclined to talk with
friends about products and less concerned with brand names. These
findings also conflict with Antil's, and yet one suspects that they might
be descriptive of high CADs, a group that enjoys shopping for used
clothing.
Nonetheless, information given in Table 34 still offers opportunities
for speculation and investigation. Socially responsible consumers (SRCs)
are aware of specials, shop discount stores, budget for purchases, and
205
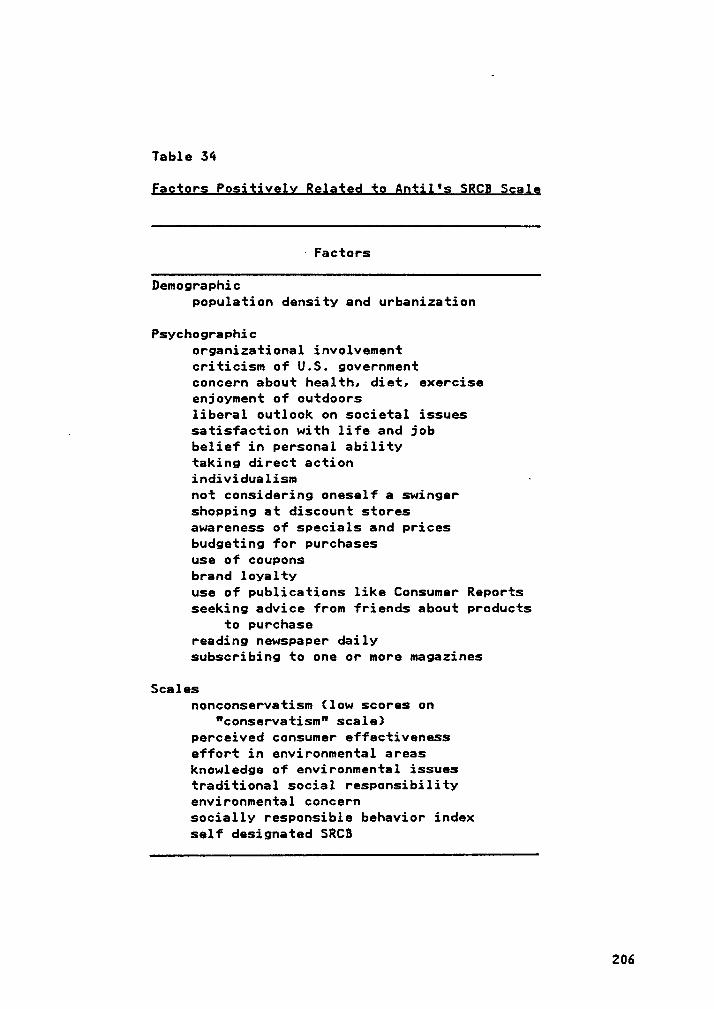
Table 34
fggjgrg Pggjjjvely Rglgjgg ig Ag$i1'§ §ßC§ Sgalg
·Factors
Demographicpopulation density and urbanization
Psychographicorganizational involvementcriticism of U.S. governmentconcern about health, diet, exerciseenjoyment of outdoorsliberal outlook on societal issuessatisfaction with life and job
belief in personal abilitytaking direct actionindividualism —
not considering oneself a swingershopping at discount storesawareness of specials and pricesbudgeting for purchasesuse of couponsbrand loyaltyuse of publications like Consumer Reportsseeking advice from friends about products
to purchasereading newspaper dailysubscribing to one or more magazines
Scalesnonconservatism (low scores on
"conservatism" scale)perceived consumer effectivenesseffort in environmental areasknowledge of environmental issuestraditional social responsibilityenvironmental concernsocially responsible behavior indexself designated SRCB
206
use coupons. These characteristics might be the specific buying behaviors
that could be used to identify high CADs in an “analytical buying" scale
(discussion on p. 201). $RCs possess satisfaction with their lives and
jobs, a belief in their own abilities, and a sense of individualism. If
high CADs also possess these traits, then their lower incomes may beta
reflection of these qualities as was suggested earlier in this section
(p. 204).
The characteristics of Mitchell's societally conscious individual
(Table 55) are similar in many respects to those of the high CAD consumer.
The societally conscious are well educated and middle aged, patronize
secondhand stores, and wear conservative clothing. Their low economic
motivation/high personal motivation may also be a trait which high CADs
share. A major difference between the two groups lies in their annual
household incomes. Additionally, they tend to watch different TV programs
and read different magazines.
Implications
The consumer group just described is a segment of a larger population,
female patrons of a Roanoke shopping mall. The designation of Roanoke
as a national test market implies that this population is representative
of similar populations in other locations. Thus, the implications can
be generalized to those populations.n
207
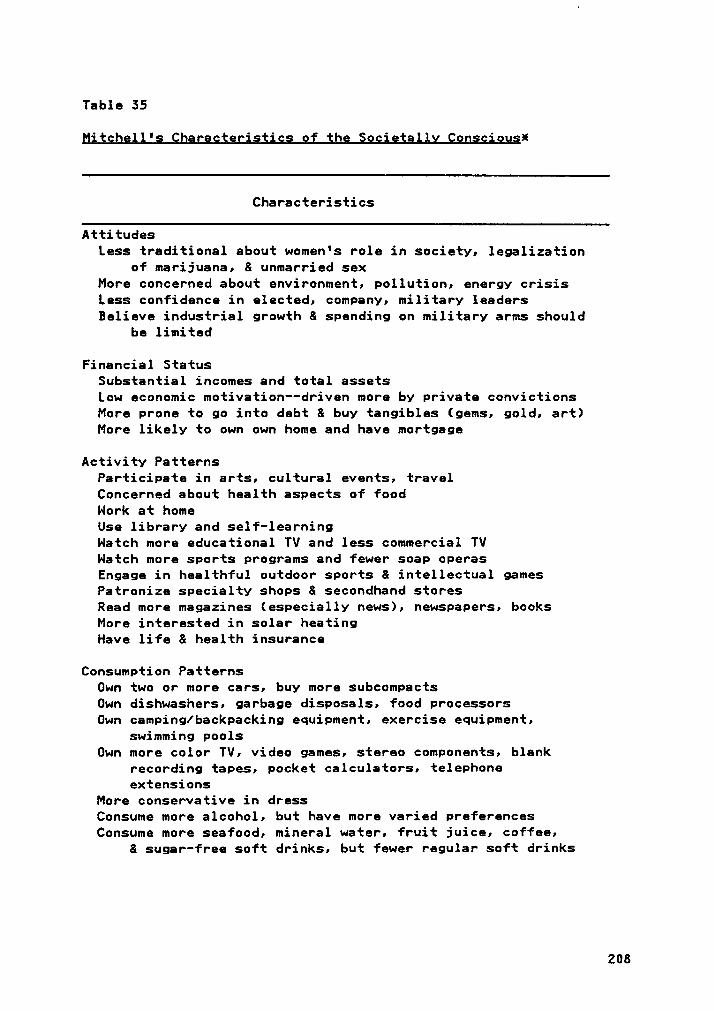
Table 35
ßitghgll's Qhgggcterjstics of the Sgcigjally Qongciougä
Characteristics
AttitudesLess traditional about women's role in society, legalization
of marijuana, & unmarried sexMore concerned about environment, pollution, energy crisisLess confidence in elected, company, military leadersBelieve industrial growth & spending on military arms should
be limited
Financial StatusSubstantial incomes and total assetsLow economic motivation-—driven more by private convictionsMore prone to go into debt & buy tangibles (gems, gold, art)More likely to own own home and have mortgage
Activity PatternsParticipate in arts, cultural events, travelConcerned about health aspects of foodNork at homeUse library and self-learningWatch more educational TV and less commercial TVWatch more sports programs and fewer soap operasEngage in healthful outdoor sports & intellectual gamesPatronize specialty shops & secondhand storesRead more magazines (especially news), newspapers, booksMore interested in solar heatingHave life & health insurance
Consumption PatternsOwn two or more cars, buy more subcompactsOwn dishwashers, garbage disposals, food processorsOwn camping/backpacking equipment, exercise equipment,
swimming poolsOwn more color TV, video games, stereo components, blank
recording tapes, pocket calculators, telephoneextensions
More conservative in dressConsume more alcohol, but have more varied preferencesConsume more seafood, mineral water, fruit juice, coffee,
& sugar-free soft drinks, but fewer regular soft drinks
208
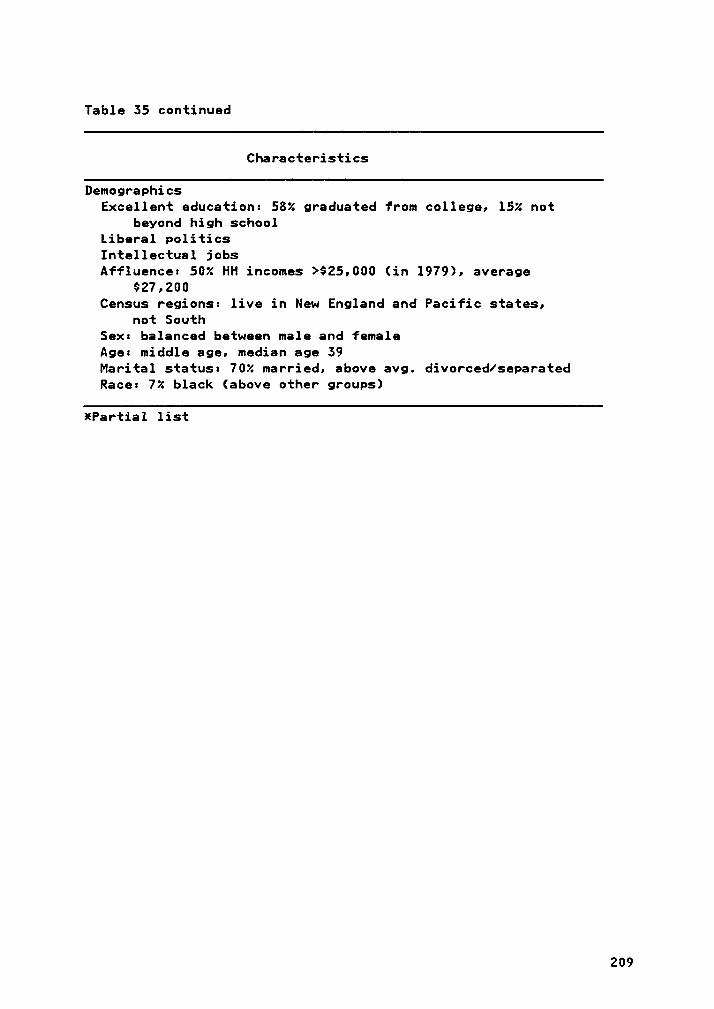
Table 35 continued
Characteristics
DemographicsExcellent education: 58% graduated from college, 15% not
beyond high schoolLiberal politicsIntellectual jobsAffluence: 50% HH incomes >$25,000 (in 1979), average
$27,200Census regions: live in New England and Pacific states,
not SouthSex: balanced between male and femaleAge: middle age, median age 59Marital status: 70% married, above avg. divorced/separatedRace: 7% black (above other groups)
¥Partial list
209
Knowledge of the characteristics of socially responsible clothing
consumers could be of use to a number of individuals. Retailers of new
clothing could approach this segment by emphasizing the classic styling
and resale value of their clothing. Merchants of secondhand clothing
might use the information to guide their efforts to reach new customers
(high CADs) and increase sales. Services businesses could also target
this group by emphasizing their role in recycling. For example,
seamstresses and tailors could specialize in alterations or repairs for
secondhand garments. Laundry and dry cleaning establishments could cater
to consumers wanting to revitalize old clothes. If the popularity of
secondhand clothing grows, a need may emerge for designers who remodel
used garments. Zikmund and Stanton (1971) maintained that recycling was
essentially a channels-of-distribution issue. Thus demand may increase
for the once commonplace "rag and junk" man, who collected unwanted goods
from discarders and delivered them to users.
Marketers wishing to target this segment through print media could
use educational, literary, and possibly nature magazines. Fashion maga-
zines would not be a particularly efficient means of communication since
high CADs comprise a smaller percentage of the readership of these maga-
zines. News or nature/wildlife television programs would provide an ef-
fective way of reaching this segment through broadcast media.
Consumers with a low to moderate interest in clothing conservation
(low CADs) can also be identified using the results of this study. Their
sociodemographic characterics and media habits are essentiallv the re-
210
verse of the high CAD group. A large number of them are under 25 years
of age with high school educations or less. They watch more television
game shows and fewer news and nature programs. Fashion magazines are more
popular with this group than educational or literary magazines. To reach
this segment, marketers in the secondhand clothing business could adver-
tise their stock of high fashion items and the fashionability of shopping
at secondhand stores. Individuals with design skills might restyle used
garments and market them as "one of a kind" or "like new." Merchants
seeking usable secondhand goods to recycle might wish to concentrate on
low CADs as a supply source since they tend to prefer new clothing. A
possible media vehicle for those wishing to raise the eco-consciousness
of this group might be television game shows which are non—consumption
oriented.
One prevalent need highlighted by this study is the need for more
information: facts about where to buy and how to select secondhand ap-
parel, how to recycle garments, and how clothing waste can affect the
environment. To fill the need, home economists and other professionals
could emphasize these areas in their lectures to students or extension
presentations. Many home economists are in a position to teach recycling
and selection skills, explain the advantages of extending the use-value
of garments, and suggest unique ways of improving the fashionability of
older garments. In addition, they could influence consumer values and
help to initiate a "redefinition of how we live" (Grossman, 1979, p. 5)
by explaining the drawbacks of society's preoccupation with newness and
encouraging an appreciation for the old.
211
Support for consumer education should also come from public officials
attempting to protect the quality of life enjoyed by their constituencies.
Cultivation of public demand for durable and/or secondhand clothing might
help reduce solid waste. Public appeals could stress both altruistic and
economic rationale, much as they did during the energy crisis of the
1970's.
The pollution problem is one which will necessitate an alteration
of society's values. In many cases these changes will require inconven-
iences. To repeat Kardash's (1976) statement, "Virtually all of us are
'ecologically concerned consumers'--our degree of concern, however vary-
ing directly with the convenience/inconvenience of a particular 'eco-
request'” (p. 5). Indeed, the findings of 0'Reilly et al. (1984) strongly
suggested that convenience was a key factor in clothing recycling. Pur-
chasing and recycling of secondhand clothes demand an investment of money
and, perhaps more importantly, time. Social stigma also acts as a de-
terrent to the acquisition and use of secondhand clothes. For many people
the costs of responsible CAD behavior outweigh the benefits. These costs,
combined with the natural resistance of attitudes ·to change (attitude
stability), imply that strong measures will be required to promota so-
cially responsible clothing acquisition and discard.
Recommendations for Future Studv
Typically, research answers some questions and poses additional ones.
That is the case here. The socially responsible CAD construct involves
212
clothing acquisition and discard practices which are motivated by per·
sonal needs and by a concern for society. As Ninakor (1969) indicated,
acquisitien and discard are only two aspects of clothing consumption.
l
Others which could be investigated are maintenance, usage, and storage.
For instance, the electrical energy used in garment maintenance, the re-
sources required for apparel storage, and the functionality and durabil-
ity of clothing in use seem to be logically related to waste and
conservation.
The CAD scale itself could be refined. Statistical data gathered
on two of the subscales, "genera1" and "fashion", indicated that internal
consistency could be improved. Although the "analytical buying" and
"multipurpose c1othing" subscales seem to be logically related to so-
cially responsible clothing consumption, they were not used in this study.
It is possible that revision and subsequent inclusion of these factors
in the CAD scale might produce a more definitive measure.
The theoretical model for this research (Chapter III) allows for a
two—way causal relationship beteween attitudes and behaviors. Although
CAD attitudes were found to be associated with CAD behaviors, it was not
the purpose of this study to establish the direction of that relationship.
However, future researchers may wish to explore this area. If attitudes
are the antecedent variable, then it should be possible to effect behavior
changes by altering those attitudes. That is, promotion of socially re-
sponsible attitudes should in turn promote socially responsible behavior.
215
Investigation of the influence of economic considerations on CAD
attitudes and behavior would provide clarification on consumer moti-
vation. An attempt was made to control this variable by restricting the
sample to shoppers at a mall patronized by predominantly middle- to
upper-class consumers. Tighter control of the economic variable would
help to define the role of economic factors in the formation of CAD at-
titudes and behavior. As an alternative or additional measure, shoppers
could be asked about their reasons for holding certain attitudes or
practicing particular behaviors. This information would also be helpful
in clarifying other motivation questions, such as the importance of
altruism and practicality (efficiency) in ecology-conscious clothing
consumption.
There is a dimension element involved in conservation which was not
addressed by this research. Those who demonstrate responsible clothing
consumption attitudes and behaviors can do so on a number of levels.
Geographic levels might include individual, family, neighborhood, city,
state, country, or world. Distinctions could also be made according to
racial, ethnic, religious, ideological, political, or other cultural af-
filiation. Clearly, responsible consumption at one level may conflict
with that at other levels. The global society would derive the greatest
ecological benefit from individual consumption attitudes and actions that
promote world conservation, although admittedly, the information required
for this type of orientation is not available. Nonetheless, evaluation
of the scope of the consumer's attitudes would provide enlightening and
useful information relative to the CAD construct. In a sense, this di-
214
mensional aspect can be thought of as "transcendence of the particular"
(see p. 16) or the ability to expand one's attitudinal horizons beyond
immediate circumstances.
A few studies have employed observation as a primary or secondary
means of obtaining data. This method, if used covertly, lessens the in-
fluence of social desirability as a confounding variable. In conjunction
with an overt technique, such as the CAD scale, it would serve as a check
on the reliability of participant responses.
Testing with different samples would expand the base of information
about the CAD construct. For example, the use of a racially or sexually
heterogeneous group would permit interesting comparisons with the sample
in this study. Administration of the CAD scale to a "known group" of
environmentalists such as the Sierra Club, would provide another test of
the scale's validity.
It has been stated previously that knowledge is an important factor
in the formation of attitudes and behaviors. The effect of an increase
in the knowledge level of subjects concerning CAD attitudes and related
behaviors is a potentially rich research topic. A variety of educational
or informational programs could be designed and evaluated to determine
their relative effectiveness in raising public awareness and effecting
change in consumer behavior.
215
BIBLIOGRAPHY
Aaker, D. A., 8 Day, G. S. (1983). Magketjgg re;eagcg (Znd ed.). NewYork: John Wiley 8 Sons.
Abelson, R. P., 8 Rosenberg, M. J. (1958). Svmbolic psycho-logic: A modelof attitudinal cognition. ßehagigrel §giegce, 3, 1-13.
Allport, G. W. (1935). Attitudes. In C. A. Murchison (Ed.), A gandbookgf ;oejel g;ychglggy (Vol. 2, pp. 798-844). Worcester, MA: ClarkUniversity Press.
Allport, G. W., Vernon, P. E., 8 Lindzey, G. (1951). §tugy ef value;.Boston: Houghton Mifflin.
Altpeter, B. K. (1963). Ag inve;tigetjog gf egg;umer behavior ig
glothing gugcha;e; as related to glothtng value;. Unpublished mas-ter's thesis, Cornell University, Ithaca, NY.
Anderson, W. T., Jr., 8 Cunningham, W. H. (1972). The socially consciousconsumer. gogrgal of Marketing, 3§(3), 23-31.
Anderson, W. T., Jr., Henion, K. E., 8 Cox, E. P., III. (1975). Sociallyvs ecologically responsible consumers. In R. C. Curhan (Ed.), 12ZQQgmbineg Pgoceegtng; (Series No. 36, PP. 304-311). American MarketingMarketing Association.
Anspach, K. (1961). Clothing selection and the mobility concept.gougnal of Home §coggmig;, §3(6), 428-430.
Antil, J. H. (1978). The construction and validation of an instrumentto measure socially responsible consumption behavior: A study of thesocially responsible consumer. Di;sertation Abstgacts lgternatjgnal,32, 511lA. (University Microfilms No. 7902570).
Aronson, E. (1968). Dissonance theory: Progress and problems. In R. P.Abelson, E. Aronson, W. J. McGuire, P. M. Newcomb, M. H. Rosenberg, 8P. H. Tannenbaum (Eds.), Theorie; gf gognitive ggns;;tegcy: A;ourgebggk (pp. 3-27). Chicago: Rand McNa1ly.
Avery, C. E. W. (1967). ßraetjge; gf ggmemakers eongerging glothiggg;;eerds. Unpublished master's thesis, University of Rhode Island, .Providence.
Bandura, A., & Walters, R.(1963).velggmegt.New York: Holt, Rinehart, 8 Winston.
Baron, R. A., & Byrne, D.(1984).igtegeetieg(4th ed.). Boston: Allyn 8 Bacon.
216
Bass, F. M., Pessemier, E. A., 8 Lehmann, D. R. (1972). An experimentalstudy of relationships between attitude, brand, preferences, andchoice. ßehgvlorgl ßcighgg, 11, 532-541.
Batelle (Columbus Laboratories). (1972, June). A study tg identlfy og-ggrtunltlgs fgr lhgreased solid wastg gtillggtlgh (Paper and textilereport prepared for National Association of Secondary Material Indus-tries, Inc.). Columbus, OH: Author.
Bauer, R. A. (1968). Does attitude change take place before or afterbehavior change? In L. Alder 8 I. Crespi (Eds.), Attitude rgseahghgn thg hgchs (pp. 3-7). Chicago: American Marketing Association.
Baumgarten, S. A. (1975). The innovative communicator in the diffusionprocess. LZ: lZ'18·
Becker, G. S. (1965). A theory on the allocation of time. lhe EgohgmlgJourhgl, Z§(299), 493-517.
Belch, M. A. (1979). Identifying the socially and ecologically concernedsegment through life-style research: Initial findings. In K. N.Henion, II 8 T. C. Kinnear (Eds.), Thg ggnsgrver sgclgty (pp. 69-81).Chicago: American Marketing Association.
Bem, D. J. (1965). An experimental analysis of self-persuasion. dgugnalof Eggegimental Soglal Psychology, 1, 199-218.
Bem, D. J. (1966). Inducing belief in false confessions. dourhal of
ßegsonallty gnd Social Psychology, §, 707-710.
Bem, D. J. (1968). Attitudes as self-descriptions: another look at theattitude—behavior link. In A. G. Greenwald 8 T. C. Brock (Eds.),ßsychologlcgl fgundatighs gf attltudes (pp. 197-215). New York: Aca-demic Press.
Berkowitz, L. (1966). A laboratory investigation of social class andnational differences in helping behavior. Interngtignal Jgurnal gfE§!Cb0l0§¥r
,1,:Berkowitz,L. (1972). Sgcjgl gsyghology. Glenview, IL: Scott, Foresman.
Berkowitz, L., 8 Daniels, L. R. (1964). Affecting the salience of thesocial responsibility norm: Effects of past help on the response todependency relationships. Journal of Ahnohmgl and Soclal Psychology,gg, 275-281.
Berkowitz, L., 8 Lutterman, K. G. (1968). The traditional socially re-sponsible personality. ßubllc Qgihigh Qgahtghly, dg, 169-185.
Berlvne, D. E. (1960). Qonfligt, ahgusgl, ahd gghlgsity. New York:McGraw-Hill.
217
Bogardus, E. s. (1951). (2nd ed-).New York: Century.
Bohannan, P. (1965). Soeiai enthgogoiogy. New York: Holt, Rinehart, 8Winston.
Boyle, M. M. (1965). A ;tgdy of the tergination of u;e of seiected item;of womeg's gigthigg a; reiateg to attituees on savigg and use etcigtging. Unpublished doctoral dissertation, The Pennsylvania StateUniversity.
Bradlyn, B. J. (1965). Ag exgieretggy ;tudy ef ;eme factor; affectingtge gisuse of clgthing amogg two groug; gf women coilege graguate;.Unpublished master's thesis, University of California, Los Angeles.
Brehm, J. W., 8 Cohen, A. R. (1962). ßxgiggetiog; in cognitivegi;sggagee. New York: John Wiley 8 Sons.
Brew, M. L., 0'Leary, R. R., 8 Dean, L. C. (1956). Famiiy eiothing in-ventorie; end gurchase; with an analysi; to ;how fagtogs affeetingeonsumgtigg (Agriculture Information Bulletin No. 148, U.S. Departmentof Agriculture). Washington, DC: U.S. Government Printing 0ffice.
Britton, V. (1968). Regsgnei finagge. New York: American Book.
Britton, V. (1974, Spring). Clothing and textiles: Supplies, prices,and outlook for 1974. Famiiy gcongmie; Review, U. S. Department ofAgriculture (ARS-NE-56, CFE 1), 18-20.
Britton, V. (1975, Fall). Stretching the clothing dollar. Family §co-nomig; Review, U. S. Department of Agriculture (ARS·NE-56, CFE 1), 5-7.
Brooker, G. (1976). The self—actualizing socially conscious consumer.Jourgai of §gn;umeg Research, §, 107-112.
Brown, F. E. (1980). MarRetigg research: A strgctuge for deci;iogmaking. Reading, MA: Addison-Wesley.
Burk, M. (1968). Qogsumgtign eeonomics= A muitidi;eigligary aggroacg.New York: John Wiley 8 Sons.
Burns, M. D. (1964). Qiethigg gugeha;e anaiy;i; useg by e seieeteg greugl
ef women eonsumer; a; related to theig soeio-economic ieveis, educe—tion, end vaiue;. Unpublished master's thesis, The Pennsylvania StateUniversity, University Park.
Calahan, D. (1968). Correlates of respondent accuracy in the Denvervalidity study. Rggiie Qginiog Quagteriy, ig, 607-622.
218
Campbell, D. T. (1963). Social attitudes and other acquired behavioraldispositions. In s. Koch (Ed.), (Vol.6, Pp. 94-172). New York: McGraw-Hill.
CamPbell, D. T., & Fiske, D. N. (1959). Convergent and discriminantvalidation by the multitrait-multimethod matrix. ßsychgiogicai §ul—
lgtiflrCantril, H. (1934). Attitudes in the making. Ugdgrstanding the ghiig,Q, 13-15.
Cantril, H. (1946). The intensity of an attitude. Jougggi gf Ahgggggigogiai Esyghoiogy, $1, 129-135.
Carlsen, E. (1973). The economics of recycling. ggviggnmegiai
Affairs, Z, 653-666.
Cartwright, D., & Harary, F. (1956). Structural balance: A generaliza-tion of Heider's theory. ßsyghoiggicai Bgview, QQ, 277-293.
Chic comes to secondhand clothes. (1981, February). Qhggging Times, PP.79-80.
Churchill, G. A., Jr. (1979). A paradigm for developing better measuresof marketing constructs. Journai of Marketing Rgseagch, LQ, 64-73.
Churchill, G. A., Jr. (1983). Markgfigg ggsearch: Mgihodgiogigai foun-datigns (3rd ed.). Chicago: Dryden Press.
Clark, J., 8 Tifft, L. (1966). Polygraph and interview validation ofself reported deviant behavior. Amggiggg gogigiogy Review, gi,
516-606.
Clausen, A. (1968). Response validitye Vote report. Pubiig Qginiog
Quarfehlx, §Z, 588-606.
Cohen, J. (1969). gtgfisfigal gowgr agalysis fgg ihe behavioraisgiggces. New York: Academic Press.
Constantini, E., 8 Hanf, K. (1972). Environmental concern and _LakeTahoe: A study of elite perceptions, backgrounds, and attitudes. gn-
vironmenf and Bghaviog, $(2), 209-242.
Cook, S. N., & Selltiz, C. (1964). A multiple-indicator approach toattitude measurement. Esychoiogicai ßuiietin, QZ, 36-55.
Creekmore, A. M. (1963). Qiothing hehaviogs gnd iheir ggigtion fo ggg-Unoublishcd doctoral
dissertation, The Pennsylvania State University.
219
Danes, J. E., 8 Mann, 0. K. (1984). Unidimensional measurement andstructural equation models with latent variables. geurnai gf ßusineseßeeeaggh, 12, 557-552.
D'Arge, R. C., 8 Hunt, E. K. (1971). Environmental pollution,externalities, and conventional economic wisdom: A critique. Egvi-ggngegial Affairs, l, 266-286.
Day, G. S. (1970). ßuyeg affifudee agd egagg gbeice eehavio;. New York:Free Press.
DeFleur, M. L., 8 Westie, F. R. (1958). Verbal attitudes and overt acts:An experiment on the salience of attitudes. American §ocioiegicaiReview, 2;, 667-675.
DeFleur, M. L., 8 Westie, F. R. (1965). Attitude as a scientific con-cept. Soeiai Fggcee, Q2, 17-51.
Deutscher, I. (1966). Words and deedsz Social science and social policy.§ociai Egobiege, lé, 255-254.
Dixon, W. J., Engelman, L., Frane, W. J., Hill, M. A., Jennrich, R. J.,8 Toporek, J. D. (Eds.). (1985). BMQP stafisficai eoffwage manuaii2§§ grinfiag. Berkley, CA: University of California Press.
Doob, L. W. (1947). The behavior of attitudes. Esychgiegicai geview,§Q, 155-156.
Dunlap, R. E. (1975). The impact of political orientation on environ-mental attitudes and actions. Envigoamegf ang Behavior, 1(4),
428-454.
Ehrlich, H. (1969). Attitudes, behavior, and intervening variables.Ameriean Socigiogiei, Q, 29-54.
Elgin, D. S., 8 Mitchell, A. (1977). Voluntary simplicity: Life-styleof the future! The Fuferisi, ll, 200-209.
Engel, J. F., 8 Blackwell, R. D. (1982). Qoaeume; bebaviog (4th ed.)New York: Dryden Press.
Falk, R. A. (1971). Toward a world order respectful of the globalecosystem. Egvirggmeniai Affaire, 1, 251-265.
Faramelli, N. J. (1971). Perilous links between economic growth, justiceand ecology: A challenge for economic planners. EnvigoamegfaiAffaire, 1, 218-227.
Feather, N. T. (1967). A structural balance approach to the analysisof communication effects. In L. Berkowitz (Ed.), Advageee_ia_e;ge;;
220
igegtel_§ggiel_geyghglggy (Vol. 3, pp. 100-165). New York: AcademicPress.
Festinger, L. (1964). A theogy of gognitive dissgnenge. Stanford, CA:Stanford University Press.
Fishbein, M. (1966). The relationships between beliefs, attitudes, andbehavior. In S. Feldman (Ed.) Qggnitive eoneietehgy (pp. 199-223).New York: Academic Press.
Fishbein, M. (1967). Attitude and the prediction of behavior. In M.Fishbein (Ed.), Eeedinge ia attitude theohy ahg meeeugement (pp.477-492). New York: John Niley 8 Sons.
Fishbein, M., 8 Ajzen, I. (1975). ßelief, ettitude, ihtehtioh, ang be-haviog: An ihtroduetion tg thegry eng researgh. Reading, MA:Addison-Wesley.
Fisk, G. (1973). Criteria for a theory of responsible consumption.gggrhel of Marhetihg, §1(2), 24-31.
Fiske, D. N., 8 Maddi, S. R. (1961). Eungtions gf yaried exgerienee.Homewood, IL: Dorsey.
Fitzsimmons, C., 8 Perkins, N. L. (1947). Some Illinois clothing con-sumption patterns. Jgggnal of Home Egghomiee, §2(8), 495-497.
Fowler, H. (1965). Qurigeity ang exglgratory hehavio;. New York:Macmillan.
Francis, E. C. (1971). §eleeted clothing usage end buying gractices gfa sgegified gggug gf college women end their mothers. Unpublisheddoctoral dissertation, The Pennsylvania State University.
Fratzke, D. M. L. (1976). Qlothing yelue; as related to elothing ihac-tivity and diseard. Unpublished master's thesis, Iowa State Univer-sity, Ames.
Fritzsche, D. J. (1975). The environmental consistency of consumerpurchases. ~In R. C. Curhan (ed.), l27§ Combineg Proceedihge (SeriesNo. 36, pp. 312-315). American Marketing Association.
Gilgo, B. L. (1962). A eomgerisoh gf elgthing values held by collegestggehte ahd reasoh; why they eeldgm or never weah the unused garmente
they heeg ih theih wardrobe. Unpublished master's thesis, ThePennsylvania State University, University Park.
Gilmore, L., 8 Rosencranz, M. L. (1961, January). hothere' greferenceeang buying ggaeticee fer hgye' ehirte, jeans, ang elacks (ResearchBulletin 873, North Central Regional Publication 116). Hooster, OH:
Ohio Agricultural Experiment Station.
221
Gregory, P. M. (1948). Fashion and monopolistic competition. Jounnelof ßelitieal Eeonomy, ig, 69-75.
Greeno, D. W., Sommers, M. S., 8 Kernan, J. B. (1975). Personality andimplicit behavior patterns. Jgunnel gf Marketing Reseercb, lg, 65-59.
Grieg, N. V. (1975). lnfreguently worn women's elgthing: keasons fonang relationshig tg certain socio-economie variagles. Unpublishedmaster's thesis, Washington State University, Pullman.
Grossman, M. A. (1979, July 29). Families fight energy price increases.§t. Paul Sunday Pigneer Press (Trends Section), pp. 1, 5.
Hair, J. F., Jr., Anderson, R. E., Tatham, R. L., 8 Grablowsky, B. J.(1979). Multivagiate data analysis witn neadings. Tulsa, OK: Petro-leum Publishing.
Hansen, F. (1968). An attitude for analyzing consumer behavior. In L.Alder 8 I. Crespi (Eds.), Attitude neseancn on the nocks (pp. 159-159).Chicago: American Marketing Association.
Hartley, E. L., 8 Hartley, R. E. (1952). Fundamentals ef soeial gsy-ehology. New York: Knopf.
Hartmann, G. W. (1949). Clothing: Personal problem and social issue.Journel of Home Economics, il(6), 295-298.
Hawes, D. A., 8 Gilmore, D. L. (1967). Clothing utilization: Length ofwear in married women's wardrobes. Journal of Hgne Economigs, §Q(2),112-115.
Heider, F. (1946). Attitudes and cognitive organization. Journal ef
.21, 107·112·
Henion, K. E. (1972). The effect of ecologically relevant informationon detergent sales. Jognnal of Marketing keseaneh, 2(1), 10-14.
Henion, K. E., II. (1982). Ecological marketing: Will the normativebecome descriptive? In D. A. Aaker 8 G. S. Day (Eds.), Qonsumerism:Searen fer the cgnsgmen interest. (pp. 280-291). New York: Free Press.
Henion, K. E., II, 8 Wilson, W. H. (1976). The ecologically concernedconsumer and locus of control. In K. E. Henion, II 8 T. C. Kinnear(Eds.), Eeological Marketing (pp. 151-144). Chicago: American Mar-keting Association.
Herberger, R. A., Jr., 8 Buchanan, D. I. (1971). The impact of concernfor ecological factors on consumer attitudes and buying behavior. InF. C. Allvine (Ed.), Comnined Proceedings: l27l Snring and Fell Qgn-ferenees (Series No. 55, pp. 644-646). American Marketing Associ-ation.
222
Hinkle, D. E., Niersma, N., 8 Jurs, S. G. (1979). Aggllgg_§tgtlgt;g§fo; the hehaviohal sclggces. Chicago: Rand McNally.
Hinton, K., 8 Margerum, B. J. (1984). Adolescent attitudes and value‘concerning used clothing. Adoleggeggg, lg(74), 397-402.
Hoffman, A. M. (1956). Qlothing hehavigral fgctorg foh a sgeclfic grouggf gomgg related tg aegthgtic segsltlvity agd gggtaig sogio—ecgnomlgggg ggycholggjgal haghgrougg fgctgg;. Unpublished doctoral disserta-tion, The Pennsylvania State University.
Hogan, M. J., 8 Paolucci, B. (1979). Energy conservation: Family values,household practices and contextual variables. Hogg Economigs ResearchJOUCHSL r Z,} ,
Hovland, C., Harvey, 0., 8 Sherif, M. (1957). Assimilation and contrasteffects in reactions to communication and attitude change. ggugnalof Abngrmal gggial Pgycholggy, §§, 244-252.
Hunter, J. E., 8 Cohen, S. H. (1969). PACKAGE= A system of computerroutines for the analysis of correlational data. Egucatlogal angPgygholgglgal Measuhgment, Zg, 697-700.
Hunter, J. E., 8 Gerbing, D. N. (1982). Unidimensional measurement,second order factor analysis, and causal models. ßesearch ig 0rgan-igatjogal ßghavlor, i, 267-320.
Jacoby, J., Berning, C. K., 8 Dietvorst, T. F. (1977). What about dis-position? gournal of Marketigg, gl(2), 22-28.
Jeffries, V., 8 Ransford, H. E. (1972). Ideologv, social structure, andthe Yorty-Bradley mayoralty election. §oclal Prgblemg, lg, 358-372.
Joyce, M. C. (1966). A study of 236 families'purchases of children'sclothing. Jggrgal gf Home Qconomlcg, §§(6), 445-447.
Kardash, N. J. (1976). Corporate responsibility and the quality of life:Developing the ecologically concerned consumer. In K. E. Henion, II8 T. C. Kinnear (Eds.), ggologlggl markgtlng (pp. 5-9). Chicago:American Marketing Association.
Kassarjian, H. H. (1971). Incorporating ecology into marketing strategy:The case of air pollution. Journgl gf Mgrketigg, §§(3), 61-65.
Katz, D., 8 Stotland, E. (1959). A preliminary statement to a theoryof attitude structure and change. In S. Koch (Ed.), Psychology: Agtudy of g gglgggg (Vol. 3, pp. 423-475). New York: McGraw-Hill.
Kelley, E. A., Daigle, C. N., LaFleur, R. S., 8 Nilson, L. J. (1973).
Qlgthlng acgulgjtlgg agd use grgctlces of garly adolesgents (Home
Economics Research Report No. 2). Baton Rouge: Louisiana State Uni-
223
versity and Agricultural 8 Mechanical College, Agricultural ExperimentStation.
Kelley, E. A., Geiger, C. A., 8 Bailey, J. N. B. (1975a). Qlgtningnrscticgs of rural adglesggnts: Part Z, Wangnogg nlanning nractices,
sngnning stsngargs, snd glothing resgurggs of nunal sdolgsgents fngnlowen socigl glass familigs (Home Economics Research Report No. 4).
Baton Rouge: Louisiana State University and Agricultural 8 MechanicalCollege, Agricultural Experiment Station.
Kelley, E. A., Geiger, C. A., 8 Bailey, J. N. B. (1975b). Qlgtningnragticgs gf runal sdglgsgents: Part 4, Patterns gf glothing use ofngral adolgsgents fron lower socigl glass fanilies (Home EconomicsResearch Report No. 6). Baton Rouge: Louisiana State University andAgricultural 8 Mechanical College, Agricultural Experiment Station.
Kiesler, C. A., Collins, B. E., 8 Miller, N. (1969). Attitude gnange.New York: John Wiley 8 Sons.
Kinnear, T. C., 8 Taylor, J. R. (1973). The effect of ecological concernon brand perceptions. gounnal of Manggting ßgseangn, l8(2), 191-197.
Kinnear, T. C., 8 Taylor, J. R. (1974). Identifying ecological buyingsegments through attitude measurement. Jgunnsl gf Business Agminis-
33-43.
Kinnear, T. C., Taylor, J. R., 8 Ahmed, S. A. (1974). Ecologically con-cerned consumersz Who are they? gggnnsl gf Marketing, 38(Z), 20-24.
King, C. W., 8 Sproles, G. B. (1973). Predictive efficacy ofpsychopersonality characteristics in fashion change—agent identifica-tion. Prgceedings of the 8lst Annusl Qgnvention gf the American Psy-ghglogicsl Assogistign, §, 841-842.
Krebs, D. L. (1970). Altruism--An examination of the concept and a re-view of the literature. Esyghological ßnllgtin, Z3, 258-302.
Krech, C., 8 Crutchfield, R. S. (1948). lhggny and grgblems in sggislgsyghglggy. New York: McGraw-Hill.
Krech, D., Crutchfield, R. S., 8 Ballachey, E. L. (1962). lngiyiggglNew York: McGraw··Hil1.
Krugman, H. E. (1943). Affective response to music as a function offamiliarity. Jogrnal gf Abnonmgl eng §ggisl ßsychology, 38, 338-392.
Krugman, H. (1965). The impact of television advertising: Learningwithout involvement. ßublig Oninion Quartenly, 38, 583-596.
LaPiere, R. T. (1934). Attitudes vs. actions. §ggigl_J3g5gs, 13,
230-237.
224
Lapitsky, M. (1952). An ahaiysis gf ecohomig wasia in fhe wargrgbas gfa groug of home ecanomigs frainag womah. Unpublished master's thesis,Ohio State University, Columbus.
Lapitsky, M. (1961). Clothing values and their relation to generalvalues and social security and insecurity. Qissehiation Ahsgragfs
Lhfarhationl, éi, 244-245. (University Microfilms No. MIC 61-2582).
Lazer, N. (1969). Marketing's changing social relationships. Joughaiof Maghaiihg, §§(1), 5-9.
Lehmann, D. R. (1979). Mahßai haseahah ang anaiysis. Homewood, IL:Richard D. Irwin.
Lewin, K. (1955). Qynamig fheory of gehsonaiify. New York: McGraw-Hill.
Lindgren, D. R. (1972). The QBÜUEB and ghavaienga of fhg egoiogicaiiymofivaied gonsumeh. Unpublished master's thesis, University ofMinnesota, Minneapolis.
Liska, A. E. (1974). Emergent issues in the attitude-behavior consist-ency controversy. Aherigan Socioiggicai Review, Q2, 261-272.
Lohman, J. D., 8 Reitzes, D. C. (1954). Deliberately organized groupsand racial behavior. Americaa Sogioiggicai Review, L2, 542-544.
Lowry, R. P. (1971). Toward a radical view of the ecological crisis.§nvironmen3ai Affairs, 1, 550-559.
Maloney, M. P., 8 Ward, M. P. (1975). Ecology: Let's hear from thepeople. American Psychologist, 28, 585-586.
Maloney, M. P., Nard, M. P., 8 Braucht, G. N. (1975). Psychology inaction: A revised scale for the measurement of ecological attitudesand knowledge. Amagigan Psyghoiogisi, §Q, 787-790.
Manoushagian, M. B. (1977). A siudy of gharaciaristig graciices ig bafound in saiegied families guhghasing used clgfhing in a rurai commu-
nify. Unpublished master's thesis, Texas Noman's University, Denton.
Margerum, B. J. (1978, May). (Article, no title). A§§1Q_§agsia;;a;,p. 4.
Margerum, B. J. (1981). The clothing scene--A teaching guide. Jogrnaigf homa Egohomigs, Z§(1), 45-47.
Margerum, B. J., Walker, N. E., 8 Kernaleguen, A. (1977). Men's clothingpractices. Journal of Home Qgohomigs, §2(1), 59-40.
Marquardt, R. A., McGann, A. F., 8 Makens, J. C. (1974). Consumer re-sponses to the problem of disposable containers. In S. Ward 8 P.
225
Wright (Eds.), Advance; ln gonsuger gesgarch (Vol. 1, pp. 58-50).Urbana, IL: Association for Consumer Research.
Martin, C. R., Jr. (1971-72). What consumers of fashion want to know.Jgurnal of Rgtgiligg, §Z(4), 65-71, 94.
Martin Research Associates, Inc. (1984). lggglewogd gell. Roanoke, VA:Martin Research Associates.
Maslow, A. H. (1957). The influence of familiarization on preference.Jgurgal of Eggeglmental Esyghology, Z1, 162-180.
McGuire, W. J. (1966). The current status of cognitive consistencytheories. In S. Feldman (Ed.), Qoggltivg consistgngy (pp. 1-46). NewYork: Academic Press.
McGuire, W. J. (1968). The nature of attitudes and attitude change.In G. Lindzey 8 E. Aronson (Eds.), [hg hgndbook gf social gsychology(Vol. 5, 2nd ed., pp. 156-514). Reading, MA: Addison-Wesley.
McGuire, W. J. (1976). Some internal psychological factors influencingconsumer choice. Jourgal of Consumer Research, Z, 502-519.
Minard, R. D. (1952). Race relationships in the Pocahontas coal field.Jourgal of §oglgl lssues, §(l), 29-44.
Mitchell, A. (1985). The glng American lifestyle;. New York: Macmillan.
Mitchell, T. R., 8 Biglan, A. (1971). Instrumentality theories: Currentissues in psychology. Esychologlcgl Bullgtjn, Zé, 452-454.
Murphy, P. E., Kangun, N., 8 Locander, W. B. (1978). Environmentallyconcerned consumers--Racial variations. Journal gf Mgrhetigg, §g(4),
61-66.
Nelson, J. E. (1974). An empirical investigation of the nature and in-cidence of ecologically responsible consumption of housewives. Dis-segtation Abstracts lntgrnatlonal, 5i, 5222A. (University MicrofilmsNo. 74-26, 215).
Nettler, G., 8 Golding, E. H. (1946). The measurement of attitudes to-ward the Japanese in America. Agggjcag gogrnal of Sgciolggy, 52,
51-59.
Newcomb, T. M. (1945). Persgnallty ggg soglal chgnge. New York: Holt.
Nicosia, F. M., 8 Mayer, R. N. (1976). Toward a sociology of consump-tion. gournal gf Qgnsumer Researgh, §(2), 65-75.
Nunnally, J. C. (1978). ßsychomgtgig theory (2nd ed.). New York:McGraw-Hill.
226
0'Brien, H. T. (1970). §elegtiog end use gf hangbags, ggsiery, shoes,agg sgeeifie outerwear garments by segretagiel trainees. Unpublishedmaster's thesis, The Pennsylvania State University, University Park.
0'Connor, A. R. (1967). Qlothing gegeviogs as gelateg tg selected geg-Unpublished master's thesis,
The Pennsylvania State University, University Park.
0'Rei11y, L., Rucker, M., Hughes, R., Gorang, M., 8 Hand, S. (1984).The relationship of psychological and situational variables to usageof a second-order marketing system. Jgurgal gf tge Agademy gf Mar-Petigg §eiegge, l2(3), 53-76.
Osgood, C. E., Suci, G. J., 8 Tannenbaum, P. H. (1957). lge geasurementof meaning. Urbana: University of Illinois Press.
Osgood, C. E., 8 Tannenbaum, P. H. (1955). The principle of congruityin the prediction of attitude change. Psychological Review, Q2, 42-55.
Otis, M. J. R. (1958). §elective use of clgthing gy twenty-five fgeshmegang tyegty-five sggggmgre girls ig the eollege gf home eeonomies atThe Pennsylvania State University. Unpublished master's thesis, ThePennsyvlania State University, University Park.
Packard, V. (1960). The waste magers. New York: David McKay.
Paolucci, B. (1978). Energy decisions and quality living. Jgurnal ofgome Economics, 1Q(5), 22-23.
Paolucci, B., 8 Hogan, M. J. (1973). The energy crisis and the family.Journal of ggme Ecogomics, Q§(9), 12-15.
Pasnak, M. F. D., 8 Ayers, R. N. (1969). Clothing attitudes and per-sonality characteristics of fashion innovators. Journal gf Home Ecg-
Pennock, J. L., 8 Jaeger, C. M. (1964). Household service life of du-rable goods. Journel gf ggme Eeongmigs, §Q(1), 22-26.
Pepitone, A. (1966). Some conceptual and empirical problems of con-sistency models. In S. Feldman (Ed.), Cognitive consistency (pp.257-297). New York: Academic Press.
Pershing, P. L. (1974). The aeguisitiog, tyge, use ang gisgosal ofelothigg worn gy fagulty men frog selected colleges. Unpublishedmaster's thesis, University of Missouri, Columbia.
Peters, R. S. (1974). Psyggolggy eng etgical develogment. London:George Allen 8 Unwin.
227
Peters, S. C. (1968). Qlgtging gggujreg frgg ;etggtgd gugglgmggtagy;ource; by low tg moderate incomg familigs ig a mjdwesterg gjty. Un-published master's thesis, Iowa State University, Ames.
Phillips, D. L. (1971). Kngwlggge fggg ghgt. Chicago: Rand McNally.
Pinard, L. D. (1974). Eagtog; gogtributigg tg geg'; giscagg gf ;elegteg1tgg;_gj_gg;igg;;_gtgtgigg. Unpublished master's thesis, Universityof Nevada, Reno.
Pirages, D., 8 Ehrlich, P. R. (1972, March 16). If all Chinese hadwheels. Tge New Yogg [img;, p. 47.
Reizenstein, R. C., Hills, G. E., 8 Philpot, J. W. (1975). Willingnessto pay for control of air pollution: A demographic analysis. In R.C. Curhan (Ed.), l2Z4 combiggg ggocggging; (pp.523-528). AmericanMarketing Association.
Richards, E. A., 8 Hawthorne, R. E. (1971). Values, body cathexis, andclothing of male university students. Jogrngl of Hgme Ecggomic;,§;(3), 190-194.
Richardson, S. O. (1981). Qonsuggg; of useg clotgigg. Unpublishedmaster's thesis, Oregon State University, Corvallis.
Rokeach, M. (1968). §g1jgf;, gttitggg;, gng vglug;. San Francisco:Jossey-Bass. ·
Rosenberg, M. J., 8 Hovland, C. I. (1960). Cognitive, affective, andbehavioral components of attitudes. In C. I. Hovland 8 M. J. Rosenberg(Eds.), Attitude ogganjgatjon and ggangg (pp. 1-14). New Haven, CT:Yale University Press.
Rosencranz, M. L. (1958, August). ßglgvgnce of oggugation and ingometo mother;' ;glggtiog of clotgigg fg; daughter; (Technical Bulletin268). East Lansing: Michigan State University, Agricultural ExperimentStation.
Rucker, M. H. (1981). The thrift shop as a source of used textile pro-ducts: An alternative marketing system. Combingg ßrocgedings, Cen-tral, Eastern and Western Regional Meetings, Association of CollegeProfessors of Textiles and Clothing, 221.
Ryan, M. S. (1966). Qlgthings A ;tudy ig humgn bghavjgr. New York: Holt,Rinehart, 8 Winston.
SAS Institute Inc. (1982). SA§ gggg'; gujgg: ßggjgg, 1282 §gitjgg.Cary, NC: SAS Institute.
SAS Institute Inc.(1982%Cary,NC: SAS Institute.
228
Schrank, H. L., 8 Gilmore, D. L. (1975). Correlates of fashion leader-ship: Implications for fashion process theory. §ociglogigal Qusr-igrly, li, 554-545.
Schuman, H., 8 Johnson, M. (1976). Attitudes and behavior. In A.Inkeles, J. Coleman, 8 N. Smelser (Eds.), Angugl geview gf sociglogy(Vol. 2, pp. 161-207). Palo Alto, CA: Annual Reviews.
Schwartz, S. H. (1968). Nords, deeds, and the perception of consequencesand responsibility in action situations. gouggel of Persgnglity ang§gcial Esyghglogy, LQ, 252-242.
Scitovsky, T. (1976). Igg_igyigss_ggggggy. New York: Oxford UniversityPress.
Scott, N. A. (1968). Attitude measurement. In G. Lindzey 8 E. Aronson(Eds.), lge handggok of social gsyggglogy (Vol. 2, 2nd ed., PP.204-275). Reading, MA: Addison-Wesley.
Shapiro, S. J. (1978). Marketing in a conserver society. Business gg-gigggs, gl, 5-15.
Sherif, C. N., Sherif, M., 8 Nebergall, R. (1965). Atiitude ang aiiiigdgggangg. Philadelphia: Saunders.
Sherif, M., 8 Hovland, C. I. (1961). §ogisl judgmggi= Assimilatiog agggogirasi effegjs ig gogmunigsiiog ggd siiiiude ghaggs. New Haven, CT:Yale University Press..
Sherif, M., 8 Sharif, C. N. (Eds.) (1967). Aitijugg, ego-igvolvemeniand ghangg. Nestport, CT: Greenwood Press.
Sherrill, S. J. (1949). A study gf jgs economic wasig ig glothing amgngyoung womgn gmgloygg in §reensboro„ Norih Carolins. Unpublished mas-ter's thesis, Consolidated University of North Carolina,
Short, M. L. (1965). Some social fagiogs igflugnging ghe family acgui—
siiiog, use ang gisgosal of clothigg. Unpublished master's thesis,University of Missouri, Columbia.
Slocum, A. C. (1975). Acguisiiign, igvggiory and disgard of shoes asgelgied to vslugs, ggals, saiisfaciions, and oige; selgcgegvariables. Unpublished doctoral dissertation, The Pennsylvania StateUniversity.
Smith, B. (1974). Fashion grgfergnces agg fashigg guying gactices ofggofessiggal black womgn. Unpublished master's thesis, LouisianaState University, Baton Rouge.
Spranger, E. (1966). lyges cf Meg (P. J. N. Pigors, Trans.). New York:Johnson Reprint. (Original work published 1928).
229
Sproles, G. B. (1979). Easgieg: Consumeg gehavigg towagd dress.Minneapolis: Burgess.
Sproles, G. B. (1981). ße;sgegtiyes_gf_jesgieg. Minneapolis: Burgess.
Sproles, G. B., & Geistfeld, L. V. (1978). Issues in analyzing consumersatisfaction/dissatisfaction with clothing and textiles. In Advaneesin Consumer Research (Vol. 5, pp. 585-591). Ann Arbor, MI: Associ-ation for Consumer Research.
Staats, C., & Staats, A. (1957). Meaning established by classical con-ditioning. journal gf Exgerimegtel Psyegolggy, §$, 74-80.
Stampfl, R. W. (1978). The postindustrial consumer. Jgurgal of HemeEeonemics, 1Q(1), 25-28.
Suedfeld, P. (Ed.) (1971). Attitude ggenge: [he comgeting views.Chicago: Aldine Atherton.
Summers, J. 0. (1970). The identity of women's clothing fashion opinionleaders. Jgugnal ef Megketing ßeseergb, Z, 178-185.
Tittle, C. R., & Hill, R. J. (1967a). The accuracy of self-reported dataand prediction of political activity. ßuglie Ogigion Quarterly, gl,
105-106.”
Tittle, C. R., & Hill, R. J. (1967b). Attitude measurement and predic-tion of behavior: An evaluation of conditions and measurement tech-niques. §eeiogetry, I2, 199-215.
Thurstone, L. L. (1951). The measurement of social attitudes. Jougnalof Abnormal egd Social Psychology, Zé, 249-269.
Tognacci, L. N., Weigel, R. H., Wideen, M. F., & Vernon, D. T. A. (1972).Environmental quality: How universal is public concern? Envirogmentegg Behevior, $(1), 75-86.
Veblen, T- (1912)- New Y¤r·k=MacMil1an.
VeVerke- M- J-(1974)-lishedmaster's thesis, Iowa State University, Ames.
Walker, N. P. (1968). Qlgthing eggenditures as related to selegtegvalues, self-ectualigation, and euying grectices, an eggloratory
study. Unpublished doctoral dissertation, The Pennsylvania StateUniversity.
Walker, B. A. (1967). Qegree of analytigal buyigg, selected ettitugeseng graetices ef women ig tge gurehese of tgeir euterwear garments.
250
Unpublished master's thesis, The Pennsylvania State University, Uni-versity Park.
Walters, C. G. (1978). Qon;gmer behavigh, theohy ang gragtic; (3rd ed.)Homewood, IL: Richard D. Irwin.
Nasson, C. R. (1975). §oh;umer hghgviorz A hghaggrigl vigwgoiht.Austin, TX: Austin Press.
Hasson, C. R. (1968). How predictable are fashion and other product lifecycles? Journal gf hagheting, §Z(5), 56-43.
Natson, V. C. K. (1974). Consume; eggectations vgrsu; gonsumgr gxgeri-ences with ;g1egted item; of men's clothihg ih relation to weag lifeggg fa;hioh lifg. Unpublished master's thesis, University of Nevada,Reno.
Nebb, E. J., Campbell, D. T., Schwartz, R. D., 8 Sechrist, L. (1966).Unghthusivg megsgrgss Nohrgagtivg re;eahgh in th; ;ocial ;ciences.Chicago: Rand McNa1ly.
Nebster, F. E., Jr. (1975). Determining the characteristics of the so-cially conscious consumer. Jgurhal of Consumer Resggrgh, Z(5),188-196.
Neinblatt, I. (1985). Dancer Fitgggrald Samglg guide tg te;tmgghgtihg. New York: Dancer Fitzgerald Sample.
Williams, T. G. (1982). Qonsume; hehavior fundamgntal; ahd ;trgtggig;.St. Paul: Nest.
Ninakor, G. (1969). The process of clothing consumption. Journal of HongECQ|!Omi §§r n •
Ninakor, G., 8 Martin, M. (1963). Used clothing sales in a small city.Jguhngl of Hgme Egghgmigg, §§(5), 557-559.
Zikmund, N. G., 8 Stanton, N. J. (1971). Recycling solid wastes: Achannels-of-distribution problem. Journal of Marheting, §§(5), 54-39.
251
A
APPENDICES
Appendix A - Pretest I Questionnaireä
Appendix B - Pretest II Questionnaireä
Appendix C — PACKAGE Statistics
Appendix D — Final Questionnaire
Appendix E · Frequency Tables
XSubscale designations have been added to the ori—ginal questionnairesz S = secondhand, R = recycl·ing, G = general, M = multipurpose, F = fashion, A
= analytical. The relationship of the item to thesubscale is indicated by + (positively related) or— (negatively related).
252
APPENDIX A
Pretast I Questionnaira
235
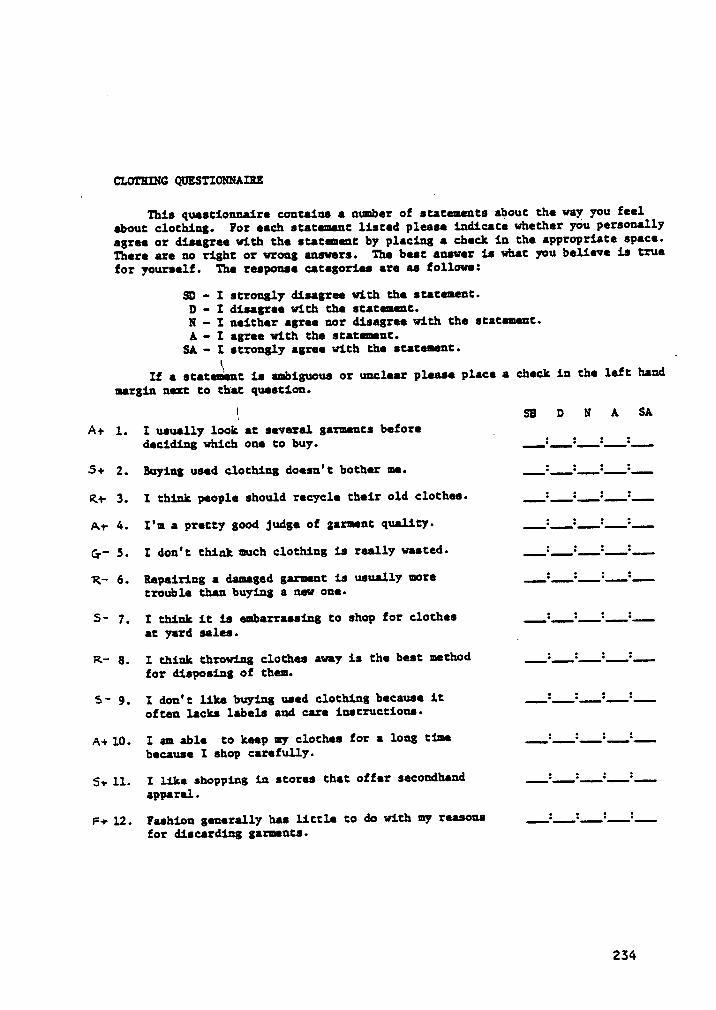
CLUTBING QUESTIONNAIRE
This queationnaire contains a number of statements about the way you feel
about clothing. For each statement listed please indicate whether you personally
agree or disagree with the statement by placlng a check in the appropriate space.
There are no right or wrong answers. The best answer is what you believe is true
for yourself. The response categories are as followe:
SD • I strongly disagree with the statement.D · I disagree with the statement.N · I neither agree nor disagree with the statement.A · I agree with the statement.
SA - I strongly agree with the statement. ‘
If a statement is ambiguous or unclear please place a check in the left hand
margin next to that question.
E ss 1: N A saA+ l. I usually look at several garments before _
deciding which one to buy. : : : :
5+ 2. Buying used clothing doesn't bother me. iz : : :__
R1- 3. I think people should recycle their old clothes. : : : :
A1- 4. I'm a pretty good judge of garment quality. : : : :
Q-- 5. I don': think much clothing is really wasted. :__: : :
R- 6. Repeiring a damsged garment is usually more : :__:__:
trouble than buying a new one.
5* 7. I think it is embarrassing to shop for clothes : : :___:
at yerd sales.
R- 8. I think thrcwing clothes away is the beat method _:___: : :__
for dispoeing of them.
5* 9. I don': like buying used clothing because it : :___:__:
often lacks labels and care instructions.
A+ 1.0. I am able to keep my clothes for a long time : : : :
because I shop carefully.
$1- ll. I like shopping in stores that offer secondhand __: :__: :
apparel.
F1- l2. Fashion generally has little to do with my reasons :__:__:__:_
for diacarding garments.
234
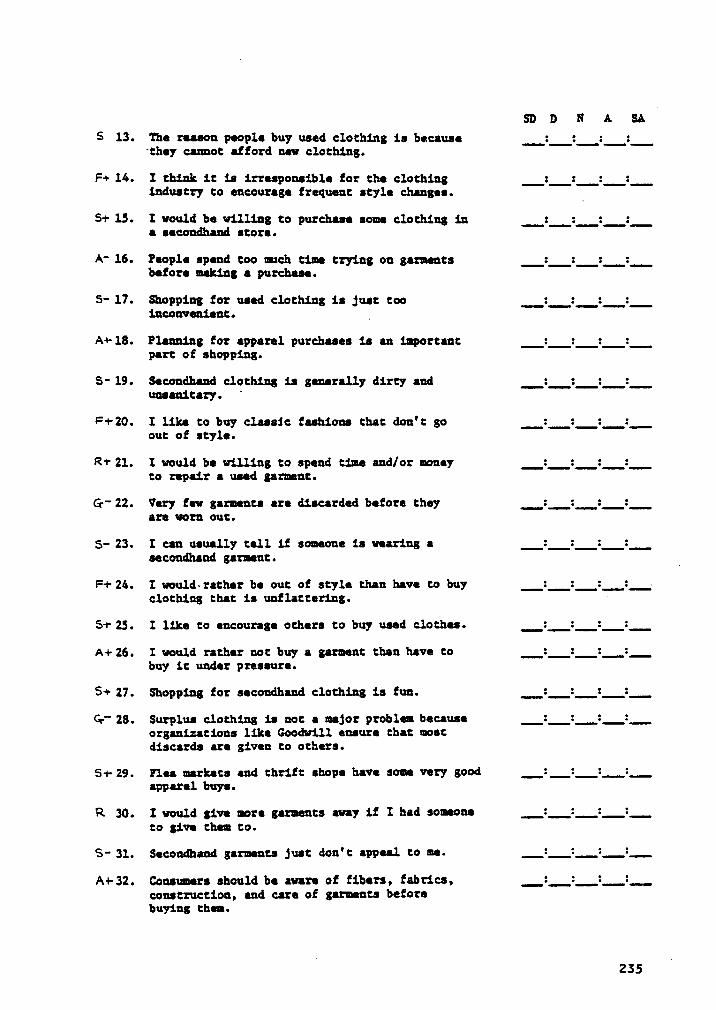
SD D N A SAl
S 13. The reason people buy used clothing is because _:_: : :‘they cannot afford new clothing.
F+ 14. I think it is irresponsible for the clothing _: :_:_:_
industry to encourage frequent style changes.
5+ 15. I would be willing to purchase some clothing in :_: : :_
e secondhand store.
A- 16. People spend too nach time trying on gaments : : : :before making e purchase.
5- 17. Shopping for used clothing is just too : :_: :inconvenient. _A4- 18. Planning for apparel purchases ie an important :_:_:_:_
part of shopping.
5- 19. Secondhand clothing is generally dirty and :_:_: :_
unsenitary.‘
F4·20. I like to buy classic fashions that don': go _:_:_:_:_
out of style.
R4- 21. I would be willing to spend time end/or noney _:_:_: :_
to repair a used garnent.
G-- 22. Very few garments ere discarded before they :_:_: :_
are worn out.
5- 23. I can usually tell if someone is wearing s _:_:_: :secondhand garnent. Q
F4- 24. I would~rather be out of style then have to buy __: :_:_: eclothing that is unflattering. ·
5+ 25. I like to encourage others to buy used clothes. _: :_:_:_
A+ 26. I would rather not buy a garnent than have to _:_:_:_:_
buy it under pressure.
$4- 27. Shopping for secondhand clothing is fun. _:_:_:_:_
G-" 28. Surplus clothlng is not a major problen because __:_:_:_:_
organizations like Goodwill ensure that nostdiscards are given to others.
5+ 29. Plea markets and thrift shops have sone very good _:_:_: :_
epparel buys.
R 30. I would give mors garnents away if I had someone _: : :_:_
to give then to.
S- 31. Secondhand garnents just don': appeal to ne. _:_:_:_:_
A4- 32. Consuners should be aware of fibers, fabrics, _:_:_:_:_construction, and care of garments beforebuying then.
V235
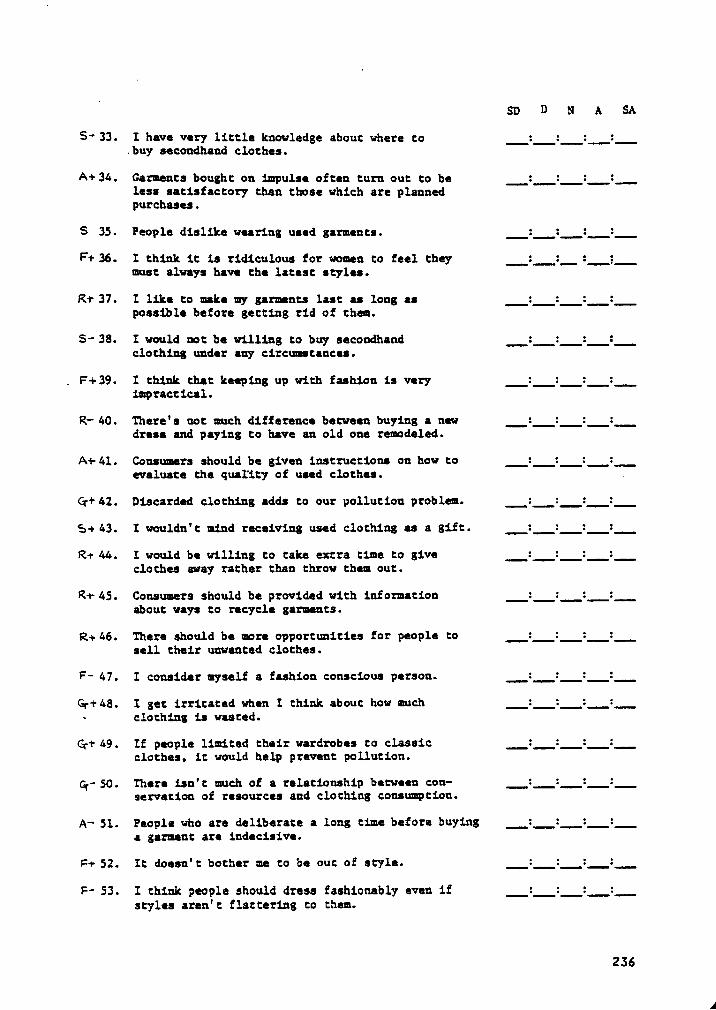
_SD D N A SA
5* 33. I have very little knowledge about where to : : : :.buy secondhand clothes.
A+ 34. Garments bought on impulse often turn out to be : : : :less satisfactory then those which are plannedpurchases.
S 35. People dislike wearing used garments. : : : :
F1- 36. I think it is ridiculous for women to feel they : :__ : ;must always have the latest styles.
R1- 37. I like to make my garments last as long as : : : :possible before getting rid of them.
S- 38. I would not be willing to buy secondhand ___:__: : :clothing under any circumstances.
. F1- 39. I think that keeping up with fashion is very : : : :impractical.
R- 40. There's not mach difference between buying a new __: : : z;dress and paying to have an old one remodeled.
A1- 4l. Consumers should be given instructions on how to : : :__:
evaluate the quality of used clothes.
(4-+ 42. Discarded clothing adds to our pollution problem. :__: : :
5+ 43. I wouldn't mind receiving used clothing as a gift. :__: : :
R+ 44. I would be willing to take extra time to give : : :__:
clothes away rather than throw them out.
R1- 45. Consumers should be provided with information :__: : :___
about ways to recycle garments.
R1- 46. There should be more opportunities for people to : :__:__:__
sell their unwanted clothes.
F— 47. I consider myself a fashion conscious person. : : : :
Q1- 48. I get irritated when I think about how mach : : : :___
- clothing is wasted.
Q-1- 49. If people limited their wardrobes to classic __: : : :clothes, it would help prevent pollution.
CT- 50. There isn't much of a relationship between con- __: :__:__:__
servation of resources and clothing consumption.
A* Sl. People who are deliberate a long time before buying : : : :a garment are indecisive.
F1- 52. It does¤'t bother me to be out of style. : : : :___
F- S3. I think people should dress fashionably even if : : : :__
styles aren't flattering to then.
236
A
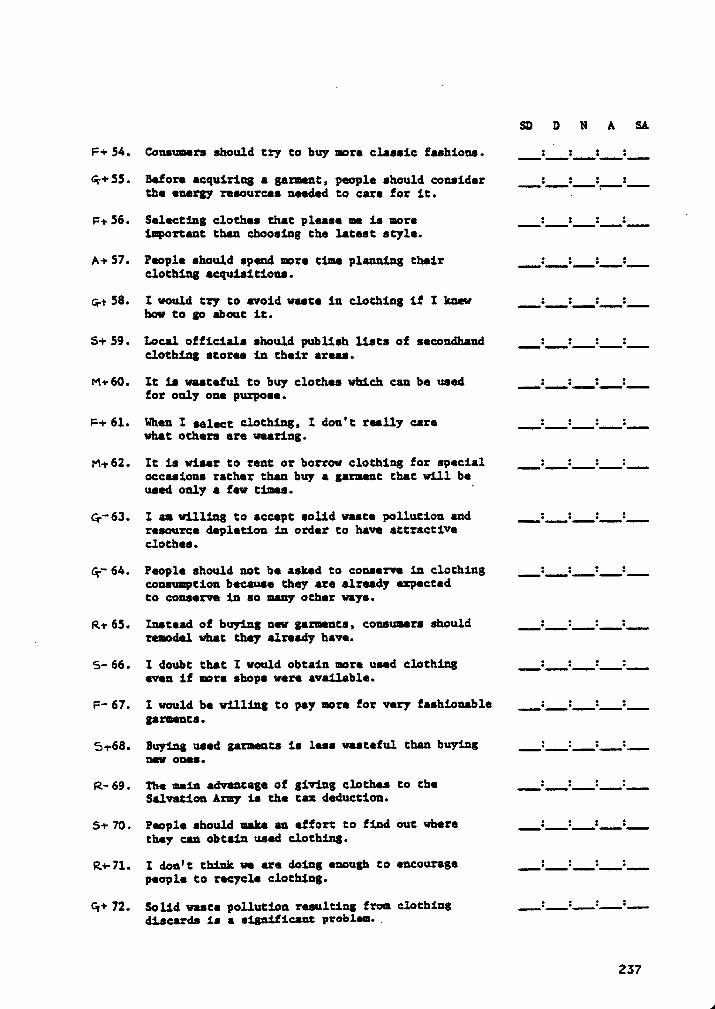
SD 0 N A SA
F-•·54. Consumars should try to buy more classic fashions. 2
U2 2 2__
<i·+ 55. Before acquiring a germent, people should consider __2 2 2 2the energy resources needed to care for it. - '
•=+56. Selecting clothes that please me is more 2__2_2__2 '
iuportant than choosing the latest style.
A+ 57. People should spend mre tine planning their 2 :___: 2clothing acquisitions.
5+ 58. I would try to avoid waste in clothing if I knew : 2 2 :how to go about it.
5+ 59. local officials should publish lists of secondhand __2 2 :___:__clothing stores in their areas.
Me- 60. It is wasteful to buy clothes which can be used 2 2 2__2
for only one purpose.
I=+ 61. When I ulm; clothing, I don't really care :__:_: :___
what others are wearing.
M+ 62. It is wiser to rent or borrow clothing for special :__: 2 :__
occasions rather than buy a garment that will beused only a few times. °
C.-·63. I am willing to accept solid waste pollution and __2__2_2__:__
resource depletion in order to have attrsctiveclothes.
q-— 64. People should not be asked to conserve in clothing __: 2 :__:__
conswmptlon because they are already expectedto conserve in so many other ways.
R1- 65. Instead of buying new garments, consumers should __:__2__:__:___
. remodel what they already have.
5- 66. I doubt that I would obtain more used clothing 2__: : :__
even if more shops were available.
F- 67. I would be willing to pay more for very fashionable 2 2__: 2__
garments.
5+-68. Buying used garments is less wasteful than buying __: 2 :__:__
new ones.
R- 69. The main advantage of giving clothes to the 2__:__:__:__
Salvation Army is the tax deduction.
5+ 70. People should make an effort to find out where _2__:__2__:__
they can obtain used clothing.
R+-7l. I don': think we are doing enough to encourage __: :_2_:__people to recycle clothing.
($1* 72. Solid waste pollution resulting from clothing __:__:__:__=....discards is a significanc problem. _
257
A
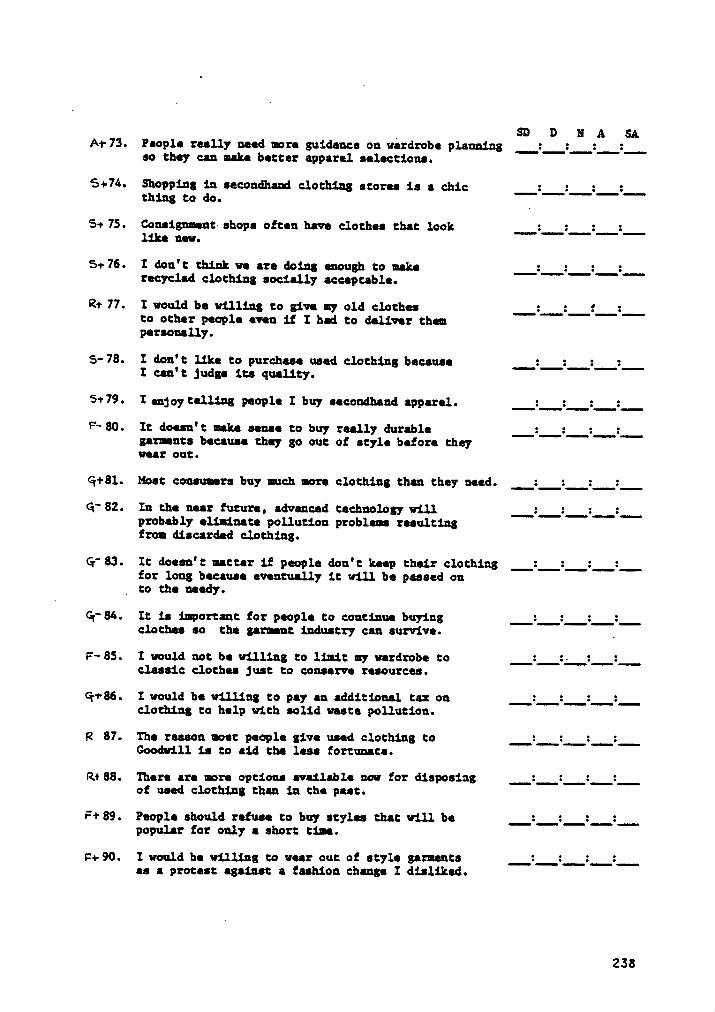
_ SD D N A SAA1- 73. People really need more guidance on wardrobe planning :__2 2 :__
so they can make better apparel selectiona.
5+74. Shopping in secondhand clothing stores is a chic 2 2__2__:__thing to do. _
5+ 75. Conaignment shops often have clothes that look __:__2 2;:like new.
5+76. I don't think we are doing enough to make 2 2 2 :__recycled clothing socially acceptable.
2+ 77. I would be willing to give ny old clothes __: :_2__:to other people even if I had to deliver thempersonally.
5- 78. I don': like to purchase used clothing because 2 2 2__2_I can't judge its quality.
Sv 79. I qjqy telling people I buy secondhand apparel. 2 2 2 :__
F— 80. It doesn't make sense to buy really durable _:__: 2 2garuenta because they go out of style before theywear out.
<-}+8l. Most consuners buy much more clothing than they need. 2 2 2 2
Gr 82. In the near future, advanced technology will. _2__:_: :___probably eliminate pollution probleme reeultingfrom discarded clothing.
G·‘83. It doesn't matter if people don': keep their clothing __:__:_:___:___
for long because eventually it will be passed on_ to the naedy.
C+·84. It is important for people to continue buying 2 2 2 :__clothes so the garment industry can survive. _
F- 85. I would not be willing to limit my wardrobe to ___: :2 :_:classic clothes just to conserve resources.
q·+86. I would be willing to pay an additional tax on _:__:___:___:_clothing to help with solid waste pollution.
2 87. The reason most people give used clothing to _:___:i2_:__Goodwill is to aid the less fortunate.
2+ 88. There are more options avallable now for disposing ___:___:__:__:____of used clothing than in the past.
F+ 89. People should refuse to buy styles that will be i2__:__2__:___popular for only a short time.
¥=+ 90. I would be willing to wear out of style garments ___:i:___2__:__es a protest against a fashion change I disliked.
238
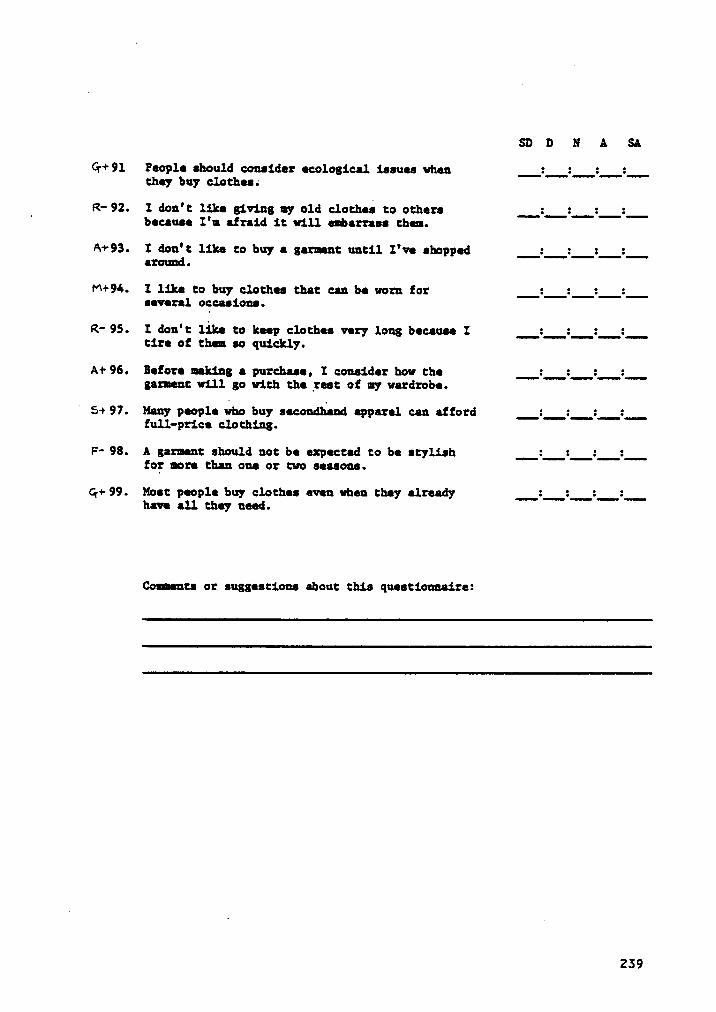
SD D N A SA
G·+ 91 People should consider ecological issues when __:__:___:__:_they buy clothes.
R- 92. I don’t like giving my old clothes to others __:_:__:__:;' because I'¤ afraid it will enbarrase cha.
A+93. I don't like to buy a garnent untilI'v•
shopped __: : :___:____around.
M+9&. I like to buy clothes that can be vorn for __:___:__:__:___several occasions.
R- 95. I don': like to keep clothes very long because I :___:__:__:__cire of cha so quickly.
A+ 96. Before uking a purchase, I consider how the :__:i: :___garnent will go with the rest of ny wardrobe.
A5+ 97. Many people who buy secondhand apparel can atford ___:___:_:;:___
£ull·price clothing.
F- 98. A garment should not be expected to be stylish ;:__:_: :___for more than one or two seasons.
Q-+· 99. Most people buy clothes even when they already __:__:__:__:___have all they need.
Contents or suggestions about this questionnaire:
239
APPENDIX B
Pratast II Ouastionnaire
240
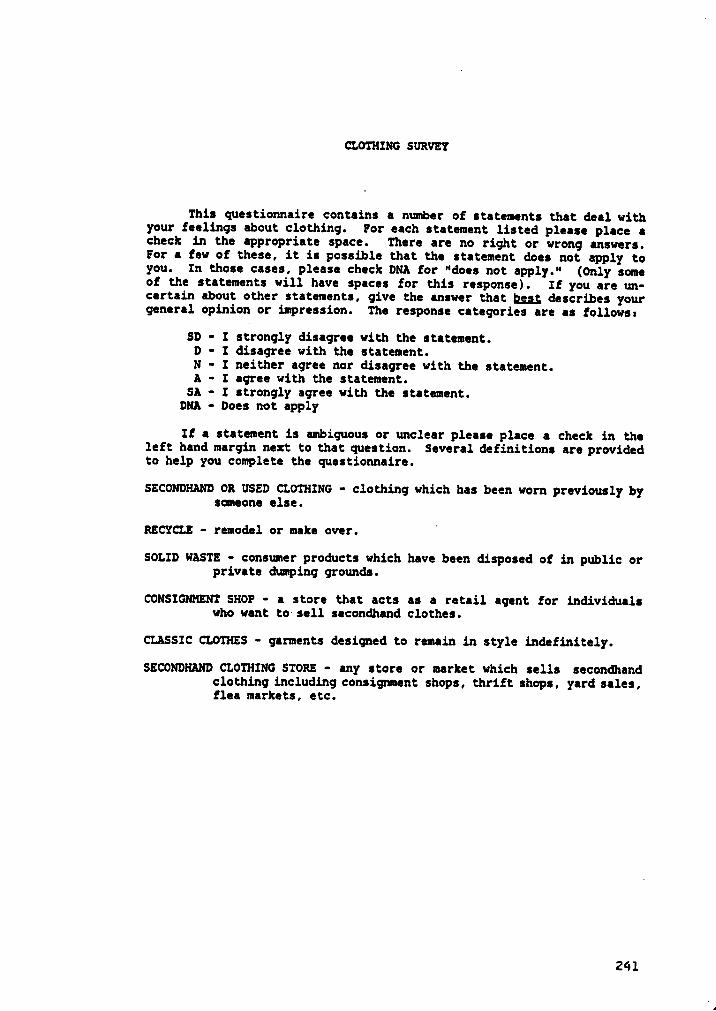
CLOTHING SURVEY
This questionnaire contains a nmber of statements that deal withyour feelings about clothing. For each statement listed please place echeck in the appropriate space. There are no right or wrong answers.For a few of these, it is possible that the statement does not apply toyou. In those cases, please check DNA for "does not apply.“ (Only someof the statements will have spaces for this response). If you are un-certain about other statements, give the answer that bes; describes yourgeneral opinion or impression. The response categories are as followse
SD • I strongly disagree with the statement.D ~ I disagree with the statement.N -
I neither agree nor disagree with the statement.A • I agree with the statement.
SA — I strongly agree with the statement.DNA • Does not apply
If a statement is ambiguous or unclear please place a check in theleft hand margin next to that question. Several definition: are providedto help you complete the questionnaire.
SECONDHAND OR USED CLOTHING - clothing which has been worn previously bysomeone else.
RECYCLE · remodel or make over.”
SOLID WASTE - consumer products which have been disposed of in public orprivate dumping grounds.
CONSIGNHENT SHOP · a store that acts as a retail agent for individualswho want to sell secondhand clothes.
CLASSIC CLOTHES • garments designed to remain in style indefinitely.
SECONDHAND CLOTHING STORE · any store or market which sells secondandclothing including consignment shops, thrift shops, yard sales,flea markets, etc.
241
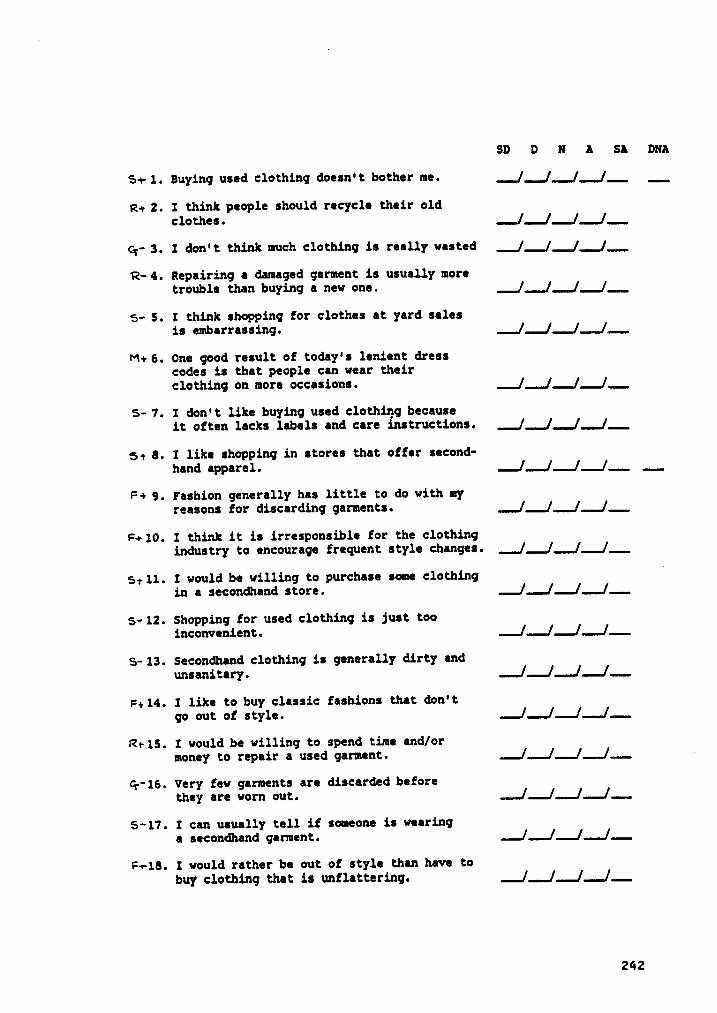
SD D N A SA DNA
5+ 1. Buying used clothing doesn°t bother me. / / //__ __
R+ 2. I think people should recycle their oldclothes. / ( ( (__CT- 3. I don't think much clothing is really wasted __
12-4. Repairing a damaged garment is usually moretrouble than buying a new one. / / / (__
5- 5. I think shopping for clothes at yard salesis embarrassing. / [ [ (__
M+ 6. One good result of today's lenient dresscodes is that people can wear their
'
clothing on more occasiona. __/ / [ /___
5- 7. I don't like buying used clothing becauseit often lacks labels and care instructions. _] / / /__
5+ 8. I like shopping in stores that offer second-hand apparel. / / / [_ __
F+ 9. Fashion generally has little to do with myreasons for discarding garments.
__/__// /_
F+ 10. I think it is irresponsible for the clothingindustry to encourage frequent style changes. __j__/___/ /__
5+11. I would be willing to purchase some clothingß
in a secondhand store.__/__/__/__/___
5- 12. Shopping for used clothing is just tooinconvenient.
__/_/___/__/___
5- 13. Secondhand clothing is generally dirty andunsanitary.n=+
14. I like to buy classic fashions that don'tgo out of style.
___/__/__/__/_
R+ 15. I would be willing to spend time and/ormoney to repair a used garment.
_/_/___/_/__ —
Q-- 16. Very few garments are discarded beforethey are worn out.
__,/_/__/__/__
5-17. I can usually tell if someone is wearinga secondhand garment.
__/__/___/___/_
F+18. I would rather be out of style than have tobuy clothing that is unflattering.
__/__/__/___/__
242
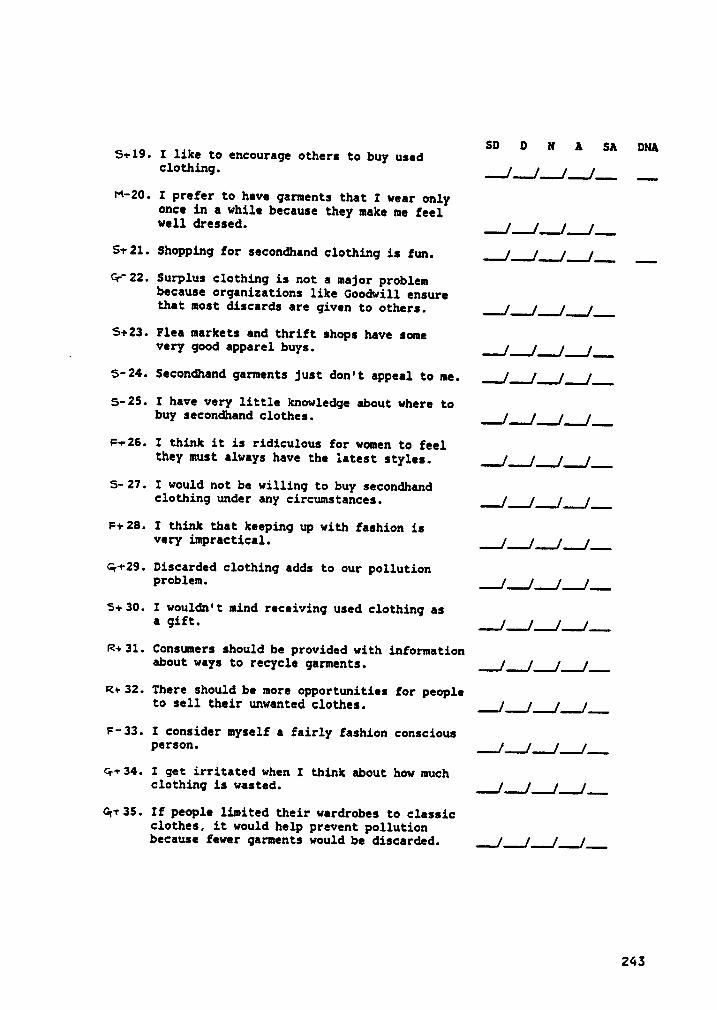
SD D N A SA DNA5+19. I like to encourage others to buy usedclothing. / / / /__ __
M—20. I prefer to have garments that I wear onlyonce in a while because they make me feelwell dressed. / /
/5+21.Shopping for secondhand clothing is fun. / / / /_ _C1-‘
22. Surplus clothing is not a major problembecause organizations like Goodwill ensurethat most discards are given to others. / / /
/_
5+23. Flea markets and thrift shops have somevery good apparel buys. _] / / /_
5- 24. Secondhand garments just don't appeal to me. / / //__
5-25. I have very little knowledge about where tobuy secondhand clothes. _] / / /_
I=+-26. I think it is ridiculous for women to feelthey must always have the latest styles. / / / /___
5- 27. I would not be willing to buy secondhandclothing under any circumstances. / / /
/_
F1- 28. I think that keeping up with fashion isvery impractical. __/__/__/__/__
G,-+29. Discarded clothing adds to our pollutionproblem . _/_/_/__/_
5+ 30. I wouldn't mind receiving used clothing asG Gift. .J_./.../.—/...r2+ 31. Consumers should be provided with information
about ways to recycle garments. __/__/_/___/_
r~z+ 32. There should be more opportunities for peopleto sell their unwanted clothes. _/_/_/_/_
F-33. I consider myself a fairly fashion consciousperson. _/_/__/_/_
q-+ 34. I get irritated when I think about how muchclothing is wasted. _/__/__/__/__
Gpv 35. If people limited their wardrobes to classicclothes, it would help prevent pollutionbecause fewer garments would be discarded. _/_/_/_/_
243
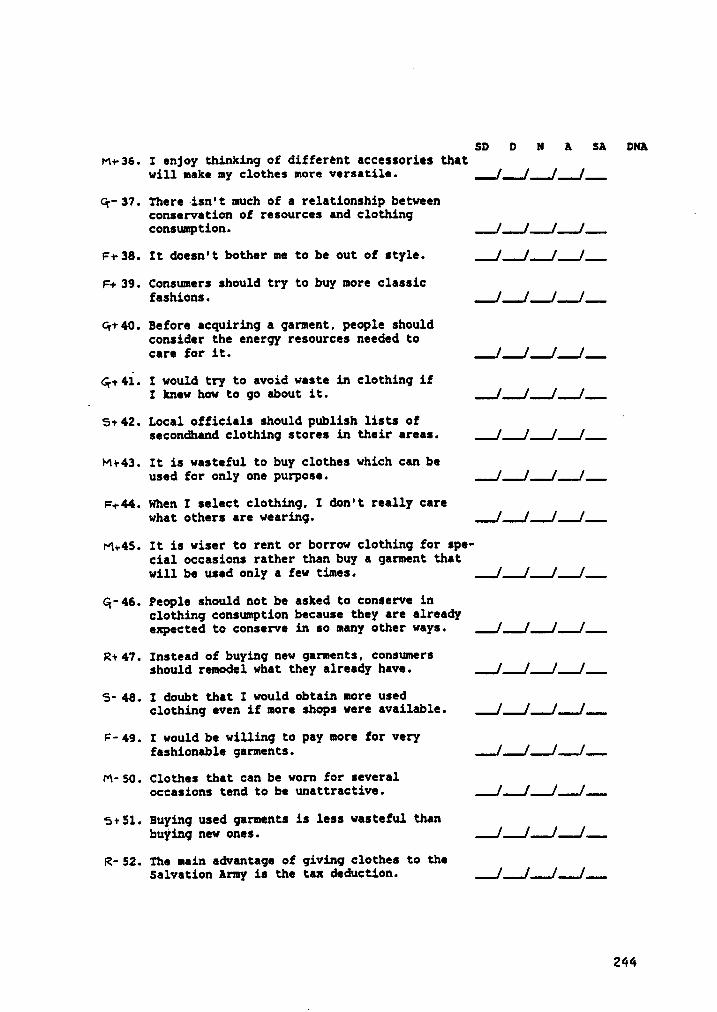
SD D N A SA DNArm-36. I enjoy thinking of different accessories that
will make my clothes more versatile. / / /(_
Gr 37. There —isn't much of a relationship betweenconservation of resources and clothing ~consumption. ( ( ( (__
F1- 38. It doesn°t bother me to be out of style. / / //___
F+ 39. Consumers should try to buy more classicfashions. / / / (_C++ 40. Before acquiring a garment, people should
consider the energy resources needed tocare for it. _Q-+ 41. I would try to avoid waste in clothing if
I knew how to go about it. __
5+ 42. Local officials should publish lists of‘
secondhand clothing stores in their areas.___
+4+43. It is wasteful to buy clothes which can beused for only one purpose. __/ __
F-+44. When I select clothing, I don't really carewhat others are wearing. _
rm-45. It is wiser to rent or borrow clothing for spe-cial occasions rather than buy a garment thatwill be used only a few times. _] / / /__
G;·46. People should not be asked to conserve inclothing consumption because they are alreadyexpected to conserve in so many other ways. __/ /___/ /_
R+ 47. Instead of buying new garments, consumersshould remodel what they already have. _/ / / /__
S- 48. I doubt that I would obtain more usedclothing even if more shops were available. __/ / / /_____F- 49. I would be willing to pay more for very
fashionable garments.__/_/_/ /___
M- 50. Clothes that can be worn for severaloccasions tend to beunattractive.5+51.
Buying used garments is less wasteful thanbuying new ones. __/_/___/__/__
R- 52. The main advantage of giving clothes to theSalvation Army is the tax deduction. __/ /__/ /__
244
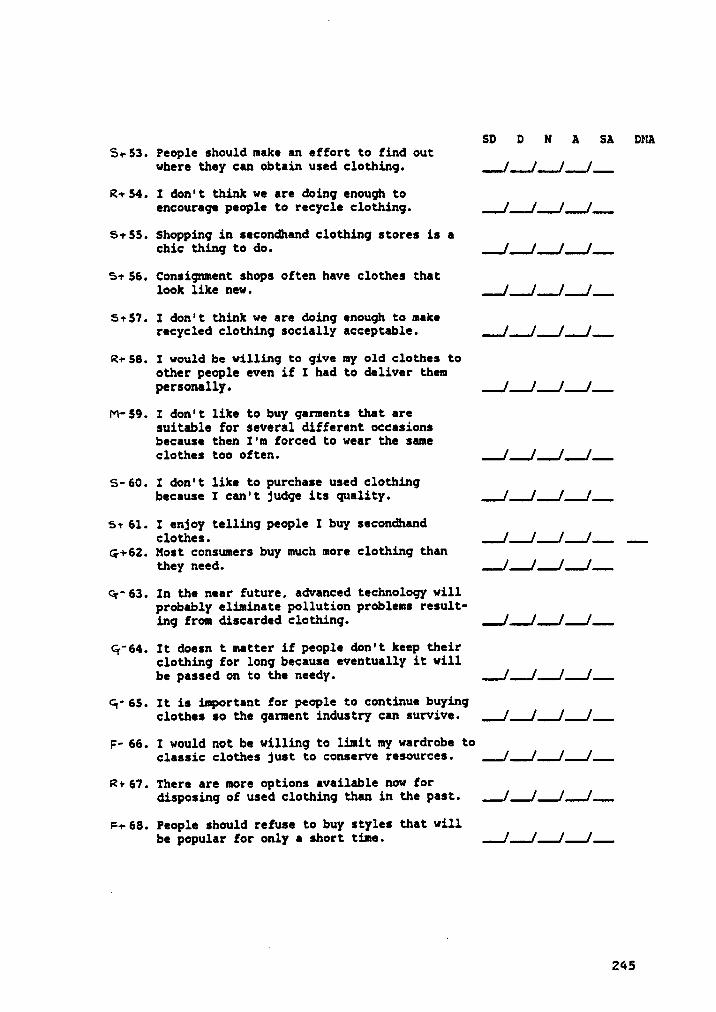
SD D N A SA DMA5+53. People should make an effort to find out
where they can obtain used clothing. / / / (_
2+54. I don't think we are doing enough toencourage people to recycle clothing. [ / /
/___
5+55. Shopping in secondhand clothing stores is echic thing to do. [ ; ( (____
5+ 56. Consignment shops often have clothes thatlook like new. ( ( ( fi5+57. I don't think we are doing enough to make
recycled clothing socially acceptable. __
2+- 58. I would be willing to give my old clothes toother people even if I had to deliver thempersonally. / / / (_
M- 59. I don't like to buy garments that aresuitable for several different occasionsbecause then I'm forced to wear the sameclothes too often. / / / /_
5- 60. I don't like to purchase used clothingbecause I can't judge its quality. / / / /_
5+ 61. I enjoy telling people I buy secondhandclothes. ___/_/ / /__ __
q·+62. Host consumers buy much more clothing thanthey need.
_/_/ //__
<ä·* 63. In the near future, advanced technology willprobably eliminate pollution problems result-ing from discarded clothing. _/_/ / /___
C+‘64.It doesn t matter if people don't keep theirclothing for long because eventually it willbe passed on to the needy. __/_/ /___/__
Gr 65. It is important for people to continue buyingclothes so the garment industry can survive. __/_/ / /__
F- 66. I would not be willing to limit my wardrobe toclassic clothes just to conserve resources. _/__/__/__/__
2+ 67. There are more options available now fordisposing of used clothing than in the past. __/_/_/___/___
•=+ 68. People should refuse to buy styles that willbe popular for only a short time. __/___/_/_/__
245
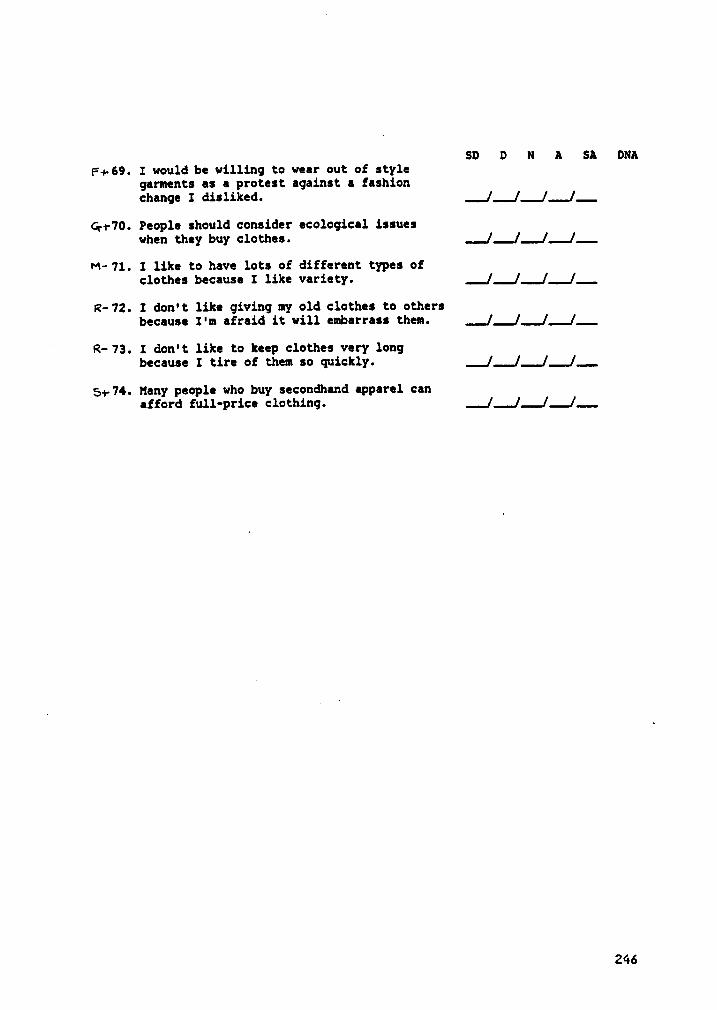
SD D N A SA DNAF+· 69. I would be willing to wear out of style
garments as a protest against a fashionchange I disliked. / / / /_
C\•‘I"7°• People should consider ecological issueswhen they buy clothes. / / /
/__
M- 71. I like to have lots of different types of„ clothes because I like variety. [ / /
/__
R- 72. I don't like giving my old clothes to othersbecause I'm afraid it will embarrass them.
__// / /_
R- 73. I don°t like to keep clothes very longbecause I tire of them so quickly. ( / / /___
5+ 74. Many people who buy secondhand apparel canafford full•price clothing. _] /___/ /__
246
APPENDIX C
PACKAGE Statistics
247
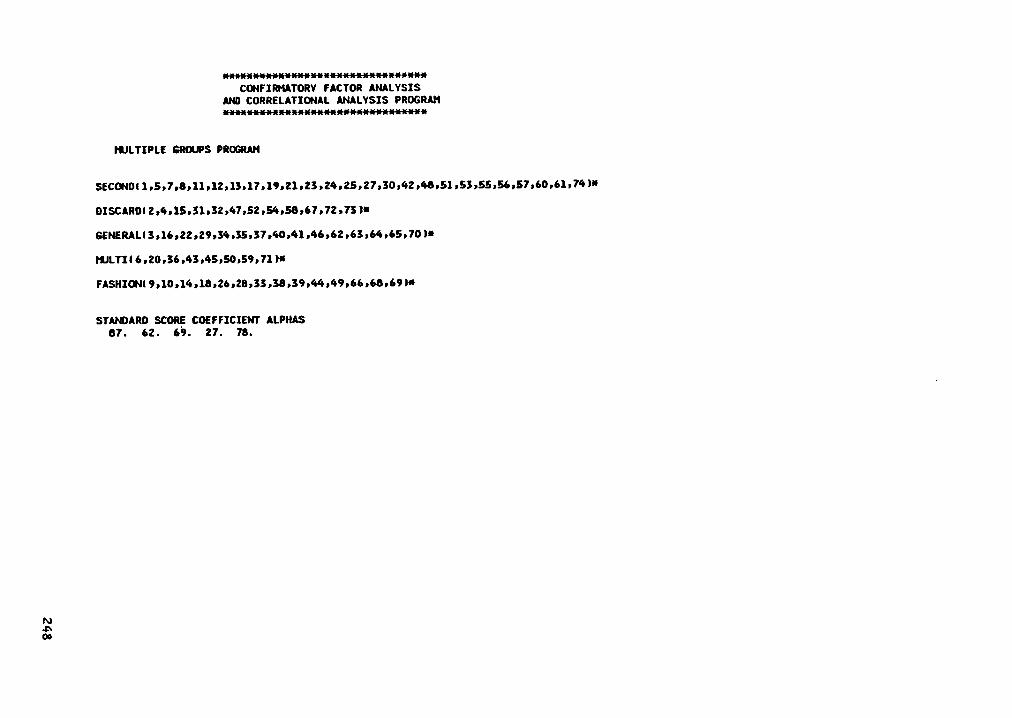
5;vg
2.5
rn
0
*
".!
'T.
°°2
2 ~•;
2
22
9
ME
;
·2•2
g§
$2
E‘
*-1*0S•-
MA
Qi-:
Mu
'!
”°
éä
2-·xä
;<.:
sä
.„
,:"¤s=
·
§··
***8
¤„«
·•‘^
•·•°{5
S
¢/In
zgxä
fd
Fl
EV
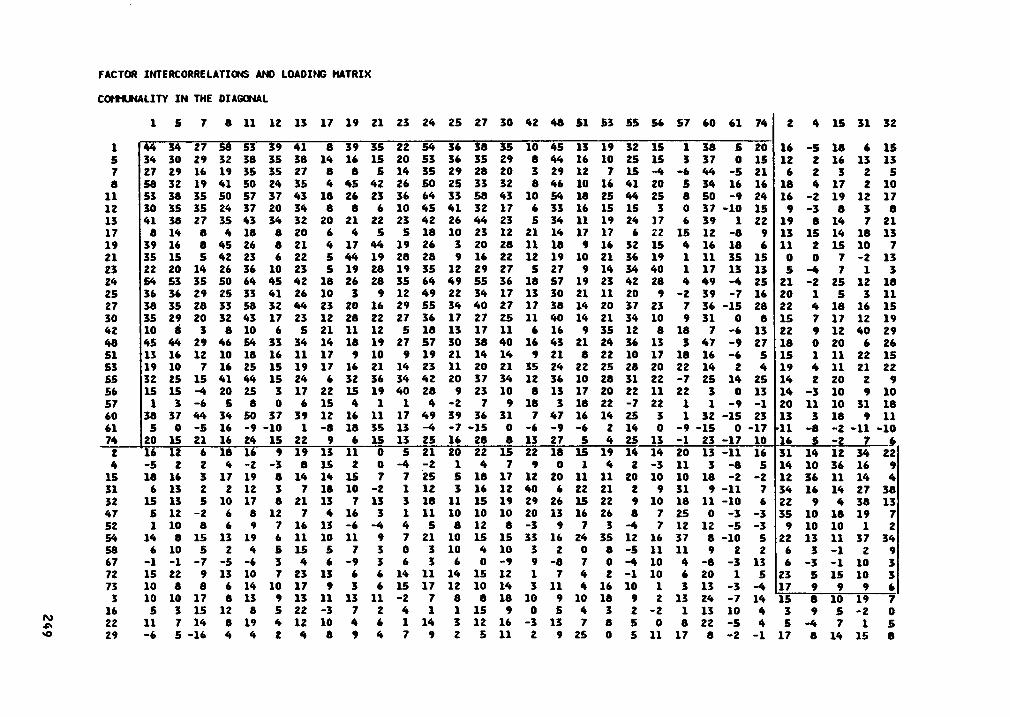
NM
N0
MM
MM
MN
MM
MM
MM
NN
MN
N:M
0M
NN
NM
N0
6N
MN
MO
N6
0N
NO
M0
NN
0Q
$3
$„3
„”S“2
3°S
?”2
III0
MN
0N
NN
NM
MN
Q 3„{I|\N
N{N
M0
N6
NM
N0
6M
NM
MM
0„
„„B
T•
''
•„?
“SS
#3
22
Q“?
“°°°Y°
N0
N0
00
00
MM
6IlIM
6N
I|\NO
Il\0»
t~¢
6M
MO
MN
N0
{6
IlIMO
QIIIN
OO
IhM
0M
NM
N.
NNM
NM
NM
NP
I|h
6||I0
¢6
MO
OI|IM
NII\6
00
0N
60
NM
QIM
IMIM
MM
YIMIIII
60
N~
f6N
ON
OM
N0
00
MN
NO
»fIlIM
MN
II\MM
M0
00
MM
$Ü
|HM
MM
MM
M{M
MM
¢M
MN
MT
IN
MN
MM
OIlI0
60
IlI•6*M
M{N
NO
OM
ON
NN
MM
OM
6M
6M
IllI
MI
MM
NIN
Ih
6IlIM
NN
IlI06
06
MN
6N
0
IIIN
IIIIIIMIII~
f0N
0~
fN6
N9
N0
6N
N0
M0
6N
OIIIIlIO
NO
MM
M6
MIlI
NII1
6N
0„„„MM
ON
60
0N
06
00
M0
N«•
„„„„•„•„Q„-•
„•III
00
M9
ON
NG
60
MM
0M
MN
ON
00
N6
0M
06
0IlIM
MN
I|\0M
NM
00
0In
NO
ON
NB
00
9M
MN
MM
MM
MM
MM
MM
6
II\06
NM
NM
NO
NN
ON
NII\M
6xfM
sf6
0M
6IIIN
NN
06
0
NQ
uin
nN
M6
00
I|\~f6
NN
{6N
MN
O|l\0
N0
06
N
Ih0
00
I|IMM
06
MO
NO
NsfN
M6
MM
60
NO
N0
6M
II\MM
60
66
0~
?N
OM
MN
NM
MN
NM
{N
MM
{N
MM
MM
NM
NIM
IM
NM
MM
MM
M
NIn
MIlI0
99
MN
NM
O~
¢II\M
MII\M
N9
N9
NN
I_N
MM
MN
MM
M
MN
6~
t00
6M
II\0Q
OIIIN
ON
MIN
09
96
MN
MM
UI9
NM
MM
9N
60
9¤
N9
MN
NN
NM
NM
MN
MN
MM
MN
NN
MM
{M
MM
MI
MII\IfIII'IN
MO
NI!I$
00
00
0N
N0
6M
OO
MM
II\¤6
6N
NM
M9
0M
M0
0•·•N
0s'f
XN
MM
{N
NM
NN
MN
MM
MN
MM
MM
IM
M
00
00
II\00
M9
N$
00
M6
0M
00
0N
¤{0
00
MN
¤6
NO
OM
NO
OM
MN
90
IäM
MM{N
NM
MNNNMM
MMMM
MM
MIM
IM
N0
sf0
¢0
06
0sfI|\IlI0
6M
NM
~$
•NN
ON
IhN
OO
M¤
90
M9
M6
II‘IOM
OM
M6
0E
MM
MN
MM
NM
NM
MM
NM
MI
MM
MM
MM
MM
IMM
MO
NIB
Mn
fN6
MN
MN
O$
MIB
!•·I0sfN
OO
MN
00
sfN
MN
O•*¤
¢M
NM
NN
·O3
M{M
NM
{M
MN
NN
N{N
NM
MM
NM
MN
MM
NM
MN
MM
NM
Ju
JM
MM
MN
MN
MM
¢~7MM
MM
MM
MM
MI
MM
00
N0
00
gä
Q$3äS
$R$2£'3;£$33'$3:£2£$!}°S
•£.‘f•':‘„•2„'°„"f2£Q
°.-•‘*M
:0
8N
0•-•c
9IfIO
II'IN0
6I|IM
N0
06
0M
6I|I~
f00
0¢
NN
60
0M
NIlIM
OO
N0
~¢
QM
M{II\N
M{{N
Il\N
MM
{M
M{N
MM
MM
MM
MIM
M
.IIH
IH2
NN
00
0IIII|IN
00
\lI¢III0
06
MO
NN
I|\T0
$IlIM
ON
MN
II\N0
l|\I|\NO
ON
ItI~f0
I-N
NM
MM
MN
MM
NN
NN
MM
IIN
IM
IM
MM
M2
UM
In0
60
NO
II‘\3~
t0IfI6
MO
IIIO‘0
$0
6II\¤
MN
6Ih
NN
OM
MN
60
6M
N0
6M
NIII
MM
NMM
MM
MM
NIIIMM
NM
MN
MMM
MM
MM
MM
INM
EM
M$
9N
3M
6M
OO
Il•N$
00
\I\6ItIM
ON
IlIMO
III60
II\00
IlIIIIM•„?
0M
I|I66
I|\M0
MJ
MN
|l\M
{M
MN
MM
MM
{M
MM
MM
NM
IM
MM
IMM
MM
I
Bä
MIIIN
QM
NM
NO
MM
QIIIN
QN
MM
IA
ON
QM
{N
{Il\M
NN
NN
NM
MO
N0
MN
N
249
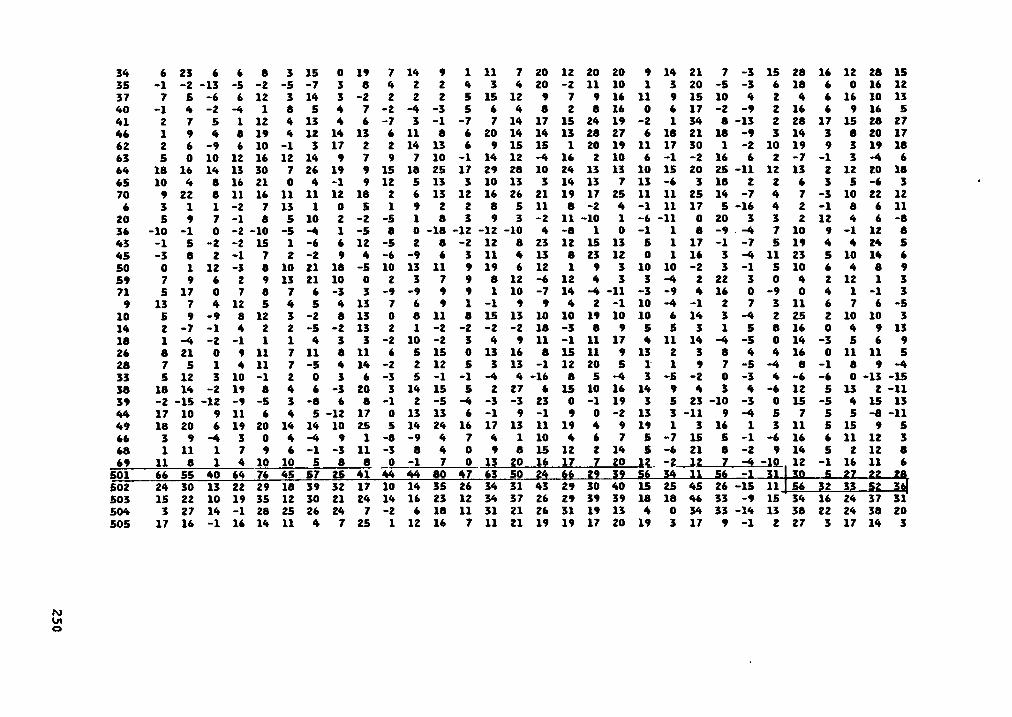
NM
NN
QM
NN
GM
MG
N·-
-‘2
77
“„72
27
7?
°“'?
”2“7
77
27
“”°°R
3"O
QG
NQ
QN
QN
GN
GG
„7„7
$3
77
«.„
7$
7'”.‘S
°77
“2?
22223S
NQ
QG
IIIM
0N
NN
N7
77
°”2
“7°'.'S
77
2'“¤
°°¤7
“2¤
"3$
$2
NM
ON
NM
MN
NG
QÜ
I~lN
N¢
IIIßd
~D
IIIIII\II|II¢IIId
Qu
mN
NI
IINI
II
II
NN
OO
OQ
GN
MQ
NN
NQ
¢M
¤Q
¤N
¤Q
OQ
N¤
NN
NQ
ON
Nd
dN
dd
IdN
NN
NN
dd
dld
NN
NN
MM
N
IIIQN
NN
MQ
NN
NQ
QM
NIIIN
IIIQG
MN
O¤
Q¤
'rQQ
¤I¤
hM
QG
¤N
IIIMN
dd
dd
II
Ivr
dd
d
MM
QG
MG
NQ
NN
NQ
MN
NM
QN
MM
NN
NG
~..
.7..
7Id
7.7
.7
“?'7
.'.7..7
.7.7
7N
IIIQN
OO
NQ
IIIOQ
IIIOG
NM
MN
QN
MN
TO
NO
MQ
GQ
IIIOQ
MM
GIN
IN
dN
dd
NII
NN
NN
NM
M
NN
NN
MN
MIN
Nd
NN
IIN
NI
NN
NN
:-7gf
Md
MG
QN
NN
NN
NO
GN
NN
GN
.3
27
.27
32
7„7
.7°“7
7“””.7
?·£
2°"
GN
NQ
NQ
NQ
OM
NN
QN
IIIQQ
MM
OO
IIIQM
NM
QM
MG
IIIIIINS
OQ
GN
IN
NN
NIII
NIN
NN
NN
NN
NN
¢¢
GN
GO
MN
SQ
NG
MN
MM
NN
QG
NG
WQ
QG
NG
NQ
GM
QN
dd
dd
Nd
dd
dd
Irld
dd
dI
dN
§M
dN
ON
GO
QO
ON
MM
NN
QN
IIIMG
NG
QN
NO
IIIQN
QN
N¤
GG
NN
dN
NN
dd
dld
dN
dd
dN
dl
!IH\d
d
NI
dd
NN
NN
NIN
NN
NII
NN
dd
NN
MN
GO
GQ
NQ
IIITO
MN
NN
QM
MN
QN
GO
ON
ON
MN
NG
¤Q
QM
GN
Nd
dd
dN
dl
Nd
dll
dd
dId
Nld
dd
¢N
Nd
r~¢
~¤
tQ~
f•n~
¤m
~•IIm
¤O
¢Q
~¤
•~m
u•~
~•m
«tr~
«••~
w•N
¤¤
¤N
r~«
•Nd
dd
dd
Nd
Nvr
dd
dl
dd
NI
dN
IHY
ININ
N
NM
IIIQN
¤G
~¢
G¤
QO
GN
NN
GO
NN
MN
QM
MT
NM
NN
QG
MM
NN
NN
Nd
Nd
dvrd
dd
INI
NIIN
NQ
MM
MN
NQ
IIIIRN
NN
MN
NM
NN
MG
GG
NO
NM
OM
NM
TQ
QN
OQ
NQ
NN
NI
IdN
NI
II
N{N
NN
IId
dN
dd
NN
NI
INN
ININ
NO
MN
NN
QN
NQ
MN
¢N
OIIIQ
Gd
¢N
GM
MO
¢U
d¢
IIINIIIQ
N!¢
I¢G
Od
$Q
~&
QN
dd
dd
Id
Id
dd
d!
Id
dd
NQ
NN
NQ
NG
IIINN
NIIIO
IIIQ¢
NG
N¤
NN
QN
MM
N¤
II\OM
¤:Q
QN
NI
Id
dI
IId
II
II
III
dd
I
GN
NN
GG
NN
MM
MM
MN
Nd
dIN
NN
NG
GN
NQ
GO
GM
NM
MM
QN
QG
MIIIN
NQ
Nd
dle
el
ee
Id
dI°
NM
NN
IIINM
NM
QN
•-I6Q
NN
NQ
IIINQ
NIIIO
QO
IIIQN
IIING
OQ
QN
IEIU
INN
ZN
ON
NT
IIN
NII?
dl
IN
IIIIIM
MN
MIIIM
OQ
QN
NN
QN
MIIIIIIN
N¤
MN
QM
NN
NN
NQ
MQ
Q¢
II\ON
¤N
IId
dd
Id
dd
dsfd
dd
QN
NN
NG
ON
QN
OO
IIINO
GO
IIINN
NN
NN
QIIIQ
¤¤
G¤
QG
IlIOQ
Idd
dd
dM
Nd
vrd
dd
dl
IN
dN
NM
Nd
N0
¢G
Gd
O·
NQ
NG
NQ
°‘1‘°7
'°°°22
.'?a
2‘}"1
"Z"i"i°'i‘“
2'"7
**77
.7.-•"‘
*'•.».7
.7Q
MN
GN
NQ
NN
NQ
OG
NN
ON
MN
NG
QN
NO
MO
QN
Nflm
els
zn
nIN
'III
IN
MN
NG
NN
GN
NG
NN
GN
NIIIN
QIIIQ
¤G
NO
III¤N
NQ
NIT
NN
NN
NN
NIIIM
NN
dG
Or-IM
rsrn
NN
NU
ION
NO
MN
NQ
QIIIM
NQ
NN
NN
NN
IIISS
MIR
".•¢
II'I„II\O
I
QIIIN
QN
QN
MQ
IIIOQ
GQ
MIIIG
GN
GO
QO
QO
MO
GG
QG
NN
MIII
mm
•n~
t~t¢
~¤
~a
~•~
aI~
•~••n
«·r¢
¤\•n
v~•·•«
••-•u~
•nn
¤•$
~t~
•2~
¢¤
c¤
go
IIIIIIIIIIIIIII
250
HIlIN
QN
QN
!MM
00
00
HQ
NQ
HM
0!Q
OQ
HH
MN
MQ
N!N
HN
HN
rII
III
eI0
N0
!NO
MH
NM
NO
ßN
!NM
MN
NM
QN
NH
MN
HN
NN
NIn
HN
HN
eH
HN
mrvtze
um
Q
QH
NM
ÜQ
HO
|llQM
H0
0!N
HO
MQ
QN
MH
Q!
00
N!
NH
InH
IH
NH
IHH
HH
HH
HI
lm
HIII
an
9I
II
II
HH
NH
HT
HN
HH
MH
HH
Ile
§2
HH
MH
II\NN
I|IH!!N
IIINN
NM
NIIIM
HN
HN
0N
·9
IIIH
IH
I°IH
°N
HH
Hm
Hl!
QH
QN
QIII
HIII
NN
QH
QH
H0
NQ
OH
N0
NM
HI
Iu
l?H
Q
IlION
H¢
QN
NIIIH
MO
MN
HQ
H!H
QH
0N
Im
HII
°IH
HI
!M
HH
NN
MH
QIIIH
ON
NO
Il\HQ
NQ
HH
N\I\!Q
NH
Q!H
QN
NO
IIIQQ
9M
HN
NH
IH
HI
IHH
HI
HH
HH
III
c0
NQ
rt!H
HN
QN
!MN
!!HO
NI|\H
HIl\Q
NQ
NM
QN
NIlIH
HH
MN
NM
HH
NQ
NN
HH
HH
HH
HH
HN
NH
HN
HH
NH
IIH
NH
NN
HI
HIH
HH
HN
IhQ
90
!•'*ö9
HO
NIIIM
MQ
MM
QM
NM
!M$
NN
!M|lI!M
Q!M
QN
N0
NIfIN
NQ
M!
H-
HN
IH
HH
HH
HH
IH
IH
II
HH
HI
QD
!9M
QN
!00
II\DIl\N
OO
Q9
MM
9Il\O
Il\HN
MN
NQ
DQ
N!9
!Nr~
«·••lI~
¤~
¢¤
N!
HH
HH
MN
HH
HN
HN
NH
NH
HH
HN
NH
HH
HN
HH
HIH
NH
MH
HH
MIIIQ
QN
!NQ
ON
ON
QH
9N
‘T!N
Q!H
N!!N
NH
MQ
!N!H
MO
NN
QM
MM
O•lIN
.!H
HH
HH
HIH
HH
HIIH
II
IIIH
IH
NH
INI
NN
!0!Q
HM
NN
NQ
M!0
IlI|l\HQ
OH
NQ
HN
QO
OM
OO
Q!N
!!NN
!!NN
QN
Q0
IH
IH
HH
HH
NH
HH
MIH
HH
HN
NH
HH
HH
HH
H
!••|¢
90
7*9
N9
M!•'I0
!Q9
9M
ON
!!HO
OM
QM
OQ
NH
M!H
0!
QO
NM
HI|\N
IlI9
HH
HH
HN
HH
HN
NH
NH
IH
NH
NN
HIH
HN
NH
HN
H
HN
NIIIH
NQ
MQ
!NM
HN
NQ
NIII9
0N
HQ
QM
N¢
NIlIQ
NH
MN
QO
QM
!Il\HO
HN
QH
HI
II
HH
HN
HI
M7
NH
HN
NN
NI
HN
MH
N
c•-•Q
~~
T•-•¤
II\QN
~\1
·uIIII~
•Q¤
u¤
~&
¤~
0r~
~¢
~u
~a
~••~
oIn
•-•«1
••¤~
•~•I:I~
a~
¤¤
~•-••n
•~Q
II
II
HH
llH
HN
II
NN
NH
NN
III!!NM
9M
NN
NN
IlI¤N
ON
0!H
OI|IQ
9N
Q!!Q
M!IlIO
NI|IN
Qß
HII‘IN
OT
U\M
MI
HH
Irt
HH
HH
HH
HH
HH
HIH
HH
HH
HH
IhMIIH
IIII
NIH
HN
IIH
HH
NI
IIN
NN
0N
0H
HN
NQ
0N
M!N
0Q
MIIIQ
NIA
MH
MN
S°'3
°°‘°"‘2°„•
S„•
3„3
«S
:}-23.-•„•32!„•
13„•„•
„„:‘•„¤„°
„0
!Ih!Q
QN
QO
OQ
NO
NIlIH
NO
Il\QIllH
NQ
NH
NQ
Q¤
QIIIM
II\IhM
NN
QN
NN
H!N
QN
IH
HN
HH
IIHH
HI
HH
HH
NN
HN
uH
NQ
§0
QN
Q9
!H9
MN
!MM
N¢
IlIOO
NIIl9
IlI9N
HIlIM
MԤ
QM
NM
!HQ
NH
OIl\¢
NH
HH
HH
HH
HIH
NI
IH
HM
NH
HH
IHN
N0
QM
NN
HM
QM
OI|IN
QN
QH
MN
I|IOQ
HN
MH
NI
HH
,I
IY
HIN
NH
YH
I
MQ
QN
QM
OM
HM
HN
NO
¢$
QO
QӢ
0N
MQ
N9
¤Q
QO
NQ
NH
IlI!NH
NO
!9I|\I¢
\U!
HH
HH
HH
HH
IH
HH
HH
NIH
HH
HIH
HN
NM
HH
IH
NN
H!
HM
IN0
00
HN
!NIh
0H
MN
NN
IIIF2
HH
TH
¢H
uNH
NH
HN
HH
HH
HH
IHN
NH
HN
NIH
HH
HH
HH
00
0N
MIII
Ill!S
'i"i"T‘€
'1‘""*‘T
"‘°'^"°•"?'“°*T
3"P
'?¤
°'1°'?
2'^“•
‘°°T?‘T.;•'^„':‘„
3!2
IIINQ
IIIZIIIIN
MQ
MS
QS
MN
QO
Mz:0
NN
!MH
NO
:\•3Q
¤!=
!MM
QM
MN
=0
HH
HH
HH
HN
HH
HM
HN
MH
HM
HN
HH
MM
NH
NH
NH
NN
0N
MN
NN
MO
HN
OM
NN
QM
MQ
IIIHS
"E’•'°°°
1’•¤?‘!"""'°„‘°'1‘Y
„„‘i‘„„„
"‘„„•„„
„T
„•N
NQ
M!!
NIlIQ
MM
II\QO
ON
OIl'IN
MN
9H
ON
MI|IO
M!H
QN
IIMH
HH
HN
HN
IH
HN
HN
HIA
NQ
HN
MN
OH
M9
IlIN¢
N$
HM
IlI!NQ
H9
N9
||\HN
NN
$Q
NN
MM
!NO
QII\N
QH
HH
HH
NN
NN
NM
9|lI|II\l\Ih
I¤lI!!N
HM
M9
IlII|I!N
NH
NN
MM
M9
251
~¢
¢••¤
•~~
e•·•~
0¤
•lI¢m
•·¤¤
•-•¤n
•·•¤•¤
•n¤
~¢
¤¤
c~
cm
lnv
•-•IM
MM
MI
NIM
MN
IIN
NN
NI
NM
NM
IM0
MN
OO
ÜÜ
°¢
UIIA
ON
NQ
QN
MIA
MO
QN
IAN
QN
MB
NQ
NM
NIM
NII
NM
MM
MN
MIM
IM
NO
M
uu
mm
h·t•~
uQ
O¤
¤•|~
•~~
•¢M
«•¤
n~
••r~~
7·¤
I~•«
•¤\~
•~•
cn
MM
IMN
IM
IMI
II
MN
M
~••^
•lIMY
~•h
•l\I~IlI·¢
f~~
•cß
lne
ba
uccu
mm
rnm
mu
nu
acm
MM
NM
IMM
MN
N·
MIM
MN
MM
MQ
N
BIIIN
~0
¢O
M¤
I~?
0I~
0Ih
0I|IN
ON
NQ
NO
NM
MO
~M
QN
MM
MN
IM
MN
MI
MM
NN
MN
MN
MM
NM
NN
Q
v~~
•·•¤l••~•n•n•-•••¢~
7·f¤•n¤n~•~
¤u•«•¤••*•~••-•¤•-•~
•¤•~r~
¤c•~
IIMIM
MM
INIM
MN
MN
MI
MM
MIIM
INM
II
II
II
II
II
III
II
#0
OIH
MM
OM
ÖM
BIIID
OÜ
MO
ON
GR
ON
GM
GN
MN
OM
DN
MN
IM
NIIM
MI
IM
IM
N
ÖN
NN
BQ
MQ
MM
GB
NQ
OM
MO
ÖIH
IIIIIINÜ
GG
NN
OO
MQ
MM
MM
IM
MI
II
MI
IMI
IN
N
•O¤
Oß
DM
OM
OM
MII\U
*DM
MO
M¢
¢M
¢O
•OC
BM
OD
GO
OM
NM
MM
MIM
NM
IIM
MM
MM
MM
MIM
NN
NN
NQ
M
N¢
ßN
BO
MY
M¤
OIll¢
O~
¢¤
¢h
MIIIM
¢M
O¤
MD
OO
|~¢
•M
MM
NM
MN
N·M
MM
NN
MM
NM
MM
MM
ma
ß~
0•n
¢lr~
•·•¢~
¢I~
r~¤
~¤
¤¤
¤•4
•0~
•t\~••·••-•¤
•·••v•«
•~a
•-•O
GN
MM
NN
MM
IMN
MM
NM
MM
MM
M
¤0
InM
~•r~
•~v~
¤II¤
~••n
•n•~
•-•r~c•4
\~¢
·¢~
¤¤
II»•«
•«•~
•Q~
•~Ia
nM
IM
MI
·I
MI
III
II
MI
QB
MIA
O¢
0~
NO
Mß
IlIMN
M¢
QN
§0
M¢
MD
QM
lH¢
M0
^0
^II\Q
OM
MM
IMM
MIN
NM
MI
NM
MN
NIM
MM
NM
MM
¢N
MIIIN
DQ
GQ
NO
NM
M¢
M~
¢O
0N
MM
OIIIM
OO
00
•IlIMIIIsf¢
$O
NN
MM
NN
MM
IMM
MN
IM
MM
MM
MN
MIII
M
~a
MI?
Qu
!~~
a¤
¢r~
r~~
•~0
~¢
•n~
•¢~
e••~
~~
¢r~
~0
¤¤
«•~
••n~
Q4
MN
MM
NM
MM
MM
MM
MIM
MN
NM
sf~
fMN
NM
MI
'MIM
MM
IIM
MM
MI
NI
MM
NN
MM
N
MN
MN
MN
II
MI
IIII
II
MM
NM
Q·¤\¢•·¢¤¤~n•·1~¤¤·•Q
~t¢•«·0¤•¤r~«••-•v•s•¢•~•v~»»•~oIn¤¢~r~$M
IM
MIIN
MI
MN
MN
MII1
MN
MM
NM
M
MM
MM
MM
MM
MII
NM
MM
IMM
IN
NQ
MN
N
NM
MM
MM
IM
MN
MN
MN
NM
MM
MN
MM
NQ
MM
NN
MM
MM
MM
MI
III
IM
QN
MO
OQ
MN
MQ
IIIMR
NIlIN
QN
MM
M¢
MIIIß
~7
QIIIN
MO
MIl\M
hIl\
MI
IM
II
III
II
MN
I
hh
kO
NQ
QN
OO
UIO
BU
IMM
MIH
IBO
MM
NM
ON
MM
NN
BN
MN
MM
NM
MI
IM
NN
QN
MM
MM
IIN
NM
MM
MN
MN
MN
MM
MM
MN
QM
QO
NN
NN
NQ
MM
MQ
NN
NN
IlINN
N¢
ON
¢•Q
OM
MIlIM
NM
ON
MM
IMI
MM
IM
MI
IIII
IIINM
NN
I
u•·~
•II~a
r~•n
¤„T
•~•III¤
III¤¢
~n
¤•·•~
•¤¤
•I\•·••-•»fln
~t~
A•rn
-•~•¤
~r~
IM
III
II
MIII
IMIM
III
um
-•~•rn
·¢¤
•-•0~
-10
•-••n~
•N~
••-•cQ
~f~
•H••o
N••\¢
·J•lI•-••~
•-1•~
A•4
I•-•~••II
II
MIM
IIM
II
MIM
NM
M
QO
I~ra~0HIM
NM
QM
ON
NQ
NM
OIR
NQ
MO
IBO
QM
MO
MQ
MO
IRN
MN
IMN
MI
NM
MIM
MM
IM
IIM
MM
MM
·¢m~
¤~•v~
~a•-•r~
¢••r~•n¢•·•vn¢0•n~
¢•·•~•n•·•~
f¢mnm
~¢M
¤«N
MM
IMN
NI
III
II
MN
MIIII
MM
QN
¢O
IhQ
MO
IIIOO
NN
OxfU
*0M
MN
\lIOO
¢IlI¢
0¤
M¤
$¢
NN
NIM
MN
MI
MM
MM
NM
MN
MN
NN
MN
N¢
¢M
MO
NM
QIIIO
O¤O
MI|I¤0~•-•¢•Q
~fQ~0Q
I•\O0•$0~~§Q
O·•·•¤|I•\gIlI
¢¢
OO
O•0
NN
MQ
QIH
IFIB
MM
MN
NM
MM
25
2
IIIN
Q-!Q
¢d
QN
IlIdN
QN
a-!a
uG
GN
OG
MN
Ga
-IN
NM
NG
a-!
NN
Nd
a-!
a-!N
da
-Ia-IN
I-!au
IN
Ag
dn
mlä
mlq
lgM
N¢
rIO
IhQ
~¢
NN
dd
au
Qd
GM
O~
¢M
¢N
\ON
~!0
OO
NG
dN
NG
NN
äN
-IINN
NN
Id
a-IM
NN
MI-Ia
-I"M
M-;!d
MN
NM
N$
I|IMd
IN»
?N
{cn-nge-I:
NI
I-!Nd
a-!M
dN
INN
a-Ia
-!Nd
MM
NN
MM
dd
QM
IdM
a-!N
MM
q·d
Md
INN
QN
~ts
1'M
dm
M
N9
OM
NG
QG
NN
OQ
IIIQG
MM
GO
OIH
IHU
IQIH
HQ
NM
NQ
MQ
OM
QN
o-!N
IlIN¢
NO
G¢
2N
Md
NN
dM
Md
a-!•-IM
NN
INIQ
NM
¤fd
N«
fN•:d
ItIMM
IlIMQ
NQ
NM
MN
NQ
NN
N
onQ
IIIQ
IHN
IIIM¤
N••\¤
~•0
0¢
ᢥ-I~
0•-••·•¤
IlINn
I¤¤
I~I•-II~
Id
GIII
N
0I-IQ
I-•~¢
¤¤
III0¤
¤•-•N
¤•IIo
~•N
N¤
uu
uN
e¤
I~••-•••-•~
•¤w
I0•-••-In
n-•-I~
•I~II~
I0·„¤
•-•„1»
Qau
o-••-!I
äNa¤|ä
Nrlla
-II•·:•a-•Id•-•
NIT
II-Ia-I
rlo-I-IN
Qa
-Ia-I•¤
!NG
Q•¤
IMo
-IMO
QO
GO
IIINN
Q!IIQ
•-ION
GQ
IIINN
QO
MM
NQ
M¤
Nd
¤d
NM
GN
QF
IIlä
lä
äF
IIN
Iä
äId
lä
I|a
·I
NN
HI
rd
QM
GQ
MO
GI-IO
GG
NQ
I-IO~
¢Q
NIlIN
I|IIlIdQ
dN
MIlIM
M•-•¤
1'd
MQ
NQ
-INN
NO
QI
II
a-IIä
III-!a-Ia-!
NId
-;!Idd
No-I
GU
OQ
GO
O¢
O¤
IlI~O
¢Q
NM
dG
QG
GI-!M
Q•-IM
r4I|II|\G
IIIOQ
sfMI|\Q
QM
IIIOO
IBI-I
Qo
-INä
hlä
ää
äN
•u
ää
o¤
Iää
ää
I-!N
II
NI
a-Io
-!I
NO
G•·4
QO
IlINN
OM
MQ
dG
dG
ON
MM
dG
~fIl'IN
I|I|lIOa
-•Q~
¢Q
N~
f·¢II'IN
Od
d•0
\I•\0I-F
Id
da-!
•:!da-Id
II
II-!ar
Ir;II
II
I•-I
II
II
GN
I|ING
IIIN\O
·0O•-IN
II\~T
I*\MM
Oa-IG
NIIIIN
ION
IOIH
IIIQIH
MQ
NIA
MM
GQ
MQ
NA
JIMM
QM
Ia-!•-III
II
IIIN
II-!N
a;!I
äl
dd
NI•-I
IIII-•d
\lIN
II
QMa
ud
lo-!
INauo-!
Na-Ida-Id
läI-!
Ta
-IIIIN
Ido-Io-II
NN
ION
OI-!
MN
ON
IQ
QO
MII'IN
Md
MIlIQ
NO
IlINQ
Nd
MM
u‘FI
FIT
TI
Ie
|I
III
II
||
NIIIF
Id
NIlI
NN
NIlIM
Md
NO
I|I•-Oo
-IGN
UI
GI-ID
G•-!~
§~
fMO
OIlIII\•·IO
~9
I|IN~
fl|Ia-!
a-III-IN
If
I'T
NII-
IIId
IN
-INII-I
GM
MO
QO
I-Ia-II|IM
¤|N
QO
§|M
IIIOd
Md
O~
¢Q
3°Z
°°‘:"‘¤°:‘°"'£
°¤3
°°2Z
•'„•"‘
„-•„.-I
.-I„
•„..•„
NM
2""T
'I"?""""""‘%
'2'}"""°‘:1
‘.’2.‘..•'S
S‘?
'f‘°.‘?••“‘
„•„„••
II.-•
„•
QN
Nd
QN
NIl\N
MN
o-!N
NN
NO
MQ
GI¤
IlI|IMa
-!IIIUQ
O~
2G
MG
IHQ
OI-•N
\lIMd
MN
sf~
$*I*^
dI
II
Io-!
II
II•
-!II-!
I-!I-!
II
o·•Nd
GG
NM
GO
OQ
OM
NIlIN
OO
M~
¢O
«•O
OI|I¢
Md
~§
~0
Md
GG
NN
GG
Nä
a-!N
NM
•!QN
QIl’IQ
~!N
dN
NO
IIINM
MIlIO
MM
ezm
em
em
dIo-!
a-IIN
\Ia;•Ia
-III
dN
o-!N
GN
-•a•!ItI~
aN
¤«
•QN
Q¤
I•«~
N~
QN
NM
MQ
NÖ
QIH
NO
253
O~
IO0
¢M
•¤IIO
NO
•-llllrdß
u-I
N•¤
IOIl\N
N•|O
"‘N•¤
I~
§~§~
0NQ
N•¤IN
•-IHII0
TO
NT
M$
UIM
N~
0~
8M
~ß
MM
IhM
$M
NM
U\$
2
0M
MN
NI}J
NO
M~
§‘i•z
g•4
HIh
M•-IN
T
UIÜ
BÜ
NO
NO
OÖ
ÜM
MO
H0
N¢
¢0
~D
Nr-4
nlß
ßlh
•·•
Me
0m
•··•0¤
•n•-•¤
¢•-•~
•·¢~
0•·«
¤•-•v
~n
••vv•0
IlI¤c~
nv¢
•cr~
r~O
MM
IMN
NH
FIN
MN
NN
NN
•-INr•I•-IN
NN
gr-Iw
I§~
03
:\\l\||\$
~§
~¢
|~¢
0~
§ß
N•¤
lOIII
hh
„„„•„•„„•~•„„•„•£
33*~••·•»•¤••¤¤¤uv~¤¤Inr~n0~~r~0
r~•-••n
¤I~
psN
O~•
Nu-In-•
•-IN
ION
:-I•-1
NIN
NZ
Nrlrl
¢~
0M
¤0
~••¤
m~
•·•
•··•
¢0
«••·•r~
•-nIA
Inu
-•rn
nnN
¤N
AM
N•-IT
IHIN
IQ
ON
UIN
OU
IGM
MG
NN
IBQ
DIB
A•-lr-l
r-•NI
TI:-Irll
Ir·I•-I
I•-Ir·••-••-INN
NM
NN
N•-IN
I¢
Q•-Ir¤
I|lI•¤Ik
¢¢
•-IIl\!l'I|lIOO
N¤
NN
•¤Ig
fNQ
ßß
•l\r•I|I¤!lI¤
-•¢N
rl:-•••II•-IN•-l
•:IN•I
NN
MN
MM
NM
NN
NM
r•NN
Ns1
Lh
~§
GQ
•-IHS
TO
HQ
MU
ION
ÜO
QA
GM
GO
OG
llßlilß
lhv-IN
NQ
IIII
II
•-•II
I•¤I
Nu
-4rIQ
HN
FOrl
IHI
'*•OÜ
¢•"O
O¢
G•¤
|NllIN
|llO6
~0
DO
NW
IO|ß
T0
O¢
N•4
rIOG
°‘O•·•I
r4•-IIN
•-II«
4N
¢•-lv
-INI
vdN
M•-I
NN
NM
OF
IMG
QM
OB
NQ
OO
GO
NQ
NO
MIH
O0
~fh
IlI6N
U\l!II¤
¢IlI0
·~•r|
•··••-IN
|l\OU
IlIO¢
\lI•IM
NN
~0
D3
G~
§T
0¢
UIT
OO
OO
ON
QM
ÜD
ON
•·••··••I}:
7N
••-•N
¤·•m•r4N
•·••-••
rnN
OH
NO
MM
UIN
ON
GM
Q¢
¢¢
N\~
§\I\0
Il|¢N
\Ur¤
!NrI•¢
•4N
\G~
ßN
MN
IN
•-I•;IN
NI
N•lI¢•¤|•-III\M
NIlIN
•·•I¢\•-IIl\N•·•¤4rlI•l\~§
n••·•
00
0r~
BIH
NO
OM
NN
UI
$'|IR
rl•fIr-•¤•lIr4
•¢\N
rINH
IIlI~§
•-IIII
•·••¤•r;••¤<Ir•N
•-Irl
N•-I
I•~INrt:-In-IN
rlrll
Ir4
I•d
•-In
-Io-Q
u-I•
·•,I•
-•¢
•·4
«l
NIrt
Nr•1
r1•-IIIr;Ih
'I•¤I
NN
N¤
NM
¢N
NN
AM
NA
NO
MIH
l\O0
!§O
\lI|l'II¢\!\~
§¤
O·O
O•-|0
\lI•§IIlO
ßß
e-IQ
OO
Nh
0•¤
I•-4~
!O$
II
rtI
I•-IM
NN
MM
MM
NO
NM
MN
•-INN
254
”8
88
8S
88
88
88
83
äS
3S
$$
S$
¤2
«£
£$
3S
$"8
“33
$$
$ä
ä¤
InQ
QO
NN
ON
EO
OÜ
NN
DN
ÜQ
OO
NM
ON
ÖQ
NM
OQ
QO
NO
NQ
MH
OQ
ÜQ
QO
QO
HH
QN
Qg
OQ
§O
O§
$Q
MO
MQ
O|h
OÜ
QO
·§xN
Ü•-IH
MG
QO
NN
ON
NQ
HM
N
Q
MQ
NQ
OQ
MÜ
O0
0*
QQQQQQQQQQQQQQQQQQQQQQQQQQQQQ
NQ
ND
OH
NN
MÜ
QU
QN
MN
OQ
HH
QN
QN
MU
IN0
QÜ
MN
NN
HN
0e
cccccco
oca
nq
0q
qn
ng
nq
QÜ
ÜO
OO
$Q
QN
¢~
OÜ
O•O
ÜN
MO
NN
MO
ÜM
NN
3N
NQ
QH
HN
NN
HH
ON
NM
NÜ
Q$
QO
QO
OH
0~
N$
NQ
QO
OÜ
OO
OQ
OM
GN
QO
NN
QO
ÜÜ
ÜQ
OO
ÜQ
ne
Q
Q:O
O$
O$
OQ
|IIQ
MQ
QO
•$Ü
NN
NÜ
QM
ÜÄ
ÜO
ÜÜ
HN
NÄ
HG
QO
OM
NN
ÜÜ
OM
JN
NÜ
MÜ
MM
QN
QD
ÜN
ON
MQ
HQ
OM
MN
ON
OS
ÜS
QN
GN
MN
QN
ÜN
NQ
$I!IÜ
OÜ
ÜfÜ
MS
Q(H
MQ
NH
NN
ON
OQ
QH
NQ
ON
NH
OÜ
NQ
OM
NM
NQ
HH
NQ
QO
MO
QH
NN
HN
OÜ
NQ
HN
SN
MÜ
MM
IhN
WQ
$N
ON
N$
NÜ
OO
RN
OH
O¢
MO
MÜ
MN
QM
QÜ
Q$
SQ
¤¢
EQ
0Q
MQ
NQ
MH
MN
MN
HM
QN
OH
MH
NM
QH
QM
HQ
N~
0H
MQ
N3
HM
N3
DO
NO
0•0
*$g
zH
¤?
\?Iä
2:=
‘\gW
NO
QM
ÜO
QÜ
ÜO
2Q
I-HN
HM
MQ
ÜQ
NQ
QÜ
MÜ
O~§$H
0~9•MQ
NM
MN
QN
ÜN
•-•co
occo
cn
n¢
~•4
e0
m0
0n
¤•n
••u
uO
NM
ME
Q0
JQQQQQQQQQQQQQQ
Mco
co
ocU
HQ
QO
QÜ
ÜO
QM
Qg
Q$
NQ
MO
MÜ
MM
ÜN
¢•$
\|\MQ
¤m
NH
QN
$¢
~N
Hz
.QO
QO
OÜ
ON
QM
Ü
EQ
NQ
SM
HH
QN
HO
•H
~§
Q3
MQ
Q_
QM
MQ
Mä
NO
QN
OQ
QH
NH
QÜ
NM
MH
ÜH
MO
NQ
„·’HM
NN
QUH
HQ
QH
ON
OO
0O
NH
HQ
OQ
QM
MQ
NQ
NO
MÜ
QH
ÜQ
ÜN
MQ
NH
HQ
GQ
MQ
QN
MÜ
NQ
NN
HN
¢•N
Q~
§N
Ü¢
•N
IAN
HQ
OÜ
HQ
°‘Ü8
E. QQ
ul
QII-
MM
MN
QN
NO
QO
HQ
ON
OO
OÜ
NN
SM
HO
NQ
NO
NQ
NQ
NÜ
MM
MQ
MO
QM
HO
HQ
OM
ON
QÜ
NN
NN
OgIs
QE,
nococo
oQ
uu
~0
en
uQ
Qn
mQ
u\
n3
Qu.U-
ÜQ
NQ
NQ
QN
ÜN
OQ
OG
ON
HQ
QO
ÜQ
ÜO
QN
QO
0$
0Q
ÜQ
gHN
N¢*Q
NÜ
HN
QÜ
ÜM
NO
D$H
\QH
ä*‘O0~
0~N
g=m
$I0~(':‘|!Q
QH
mg‘n
UQ
00
6*O
NN
NQ
QO
ÜO
INN
MÜ
NQ
OM
NQ
OIIIÜ
OÜ
QN
OO
ÜO
QÜ
CQ
•-•re
NO
QM
NO
MM
ÜQ
ÜO
NM
OO
NQ
M~
fÜQ
°°QÜ
ÜÜ
U*Q
NQ
ne
ne
n¢
NL
IIQIIIQ
HÜ
ÜM
30
¢*M
MM
xQ
Q*M
NM
NQ
QÜ
Q¢
ON
N3
$M
ÜQ
¢m
°$N
:Q
QG
QO
QO
OO
"D¢
0~
ÜO
NN
NÜ
ON
NM
ÜQ
QÜ
QM
OO
ÜS
ÜM
Q:1
ZN
NO
QÜ
NQ
IAN
ÜN
NM
M0
G”“
°:§
¤„„¤
3~
~~
„$
$G
$¤
$¤
•$
-“'«
$S
«ä
$3
•§
»3
3N
ä
255
•-INO
AO
ON
A•¤•N
Nvd
•-1O
OQ
OQ
A0
UIAOAOQSQQSIRMQQOIRgN0OONOM
•¤I
{NM
NO
AO
MO
NO
ON
ON
•-IAO
QM
AQ
N$
NM
3ä
o
MM
MN
A•-•N
00
$A
IRN
N•-••¤
IAM
~0
~0
~b
OM
MO
ON
MO
A$
Il\00
N0
~¢
OQ
MA
•·•~•n•·«•-I0
¤A
AA
AIR
¤$
M§
AN
OO
IRM
~f~
fOO
IRO
AO
OA
A0
~fO
AA
MIR
O~
OO
MIR
MM
0O
A
N\R
$r-IS
MIR
~1
'$•-IO
AO
¤A
M§
•¤•IR
AN
NIR
AQ
ON
OB
OQ
AA
AQ
AO
IR
MIR
O0
AA
OO
MA
NN
NN
MA
OM
OM
ON
N
•-INN
OE
MO
NA
UI
AN
A0
AO
IRIR
Ov-IA
Au
cb
mA
{N
AN
AU
RO
Öß
lhG
AIR
O0
0A
OA
OA
Oan
N~
t0IR
~I0
0~
0{M
M!
MO
NN
IRN
OQ
MO
IR
AO
"‘.
OO
OO
OO
OO
OO
OO
OO
OO
OO
OO
OO
OO
OO
OO
OO
OO
OU
IRIR
um
AM
MA
AA
'1OIROOMM
IRA
AAIR
OA
OO
OO
256
N6
66
66
66
66
66
66
66
66
66
66
66
66
65
66
66
66
66
66
66
66
66
66
66
66
66
6g
6S
gg
gS
gg
g§
!'i‘h9
\g¤
g:I‘
66
66
66
66
66
66
66
66
66
66
66
66
66
66
66
66
66
6U
\5G
GM
U\
¤¤
¤¤
¤¤
¤¤
¤¤
¤¤
¤¤
o¤
¤¤
¤o
¤c¤
nccco
oö
éö
éé
öé
éé
öé
öé
56
66
66
66
66
66
66
66
66
66
66
66
66
66
66
66
66
6M
GO
MU
IM
G6666666666666666666666666666833gggo¤¤¤o¤o¤¤o¤¤c¤¤¤¤¤¤¤¤¤o¤¤¤¤o¤o¤¤oééééééééé
66
66
66
66
66
66
66
66
66
66
66
66
66
66
3666666666666666666666666666638823666666666666666666666666666666666
6G
Ul
MQ
M$
¤¤
¤¤
¤¤
¤¤
¤¤
oo
ao
ao
co
ao
uo
oa
oo
ca
ccccö
°é6
éö
öc§
öé
$6
66
66
66
66
66
66
66
66
66
66
66
66
66
66
66
6Q
HN
HG
50
66
66
66
66
66
66
66
66
66
66
66
66
66
66
66
66
66
66
66
66
66
66
66
66
6g
6g
gg
gg
gn
oa
cö
éö
éé
N6
66
66
66
66
66
66
66
66
66
66
66
66
66
66
60*
Ih666666666666666666666666666666g6666666666666666666666666666666
QU
\65
U'•U
IUI$
MM
66
66
66
66
66
66
66
66
66
66
66
66
66
66
66
66
66
66
66
66
65
66
66
66
66
66
66
66
66
66
66
66
66
66
66
66
65
6¢
GU
I$6
M~
0U
IQ
66
66
66
66
66
66
66
66
66
66
66
66
66
66
66
H•~
•M6
GH
O~
G~
r•66
66
66
66
66
66
66
66
66
66
66
66
66
66
66
6Q
6U
\6Q
5U
I•-IQG
Ä6
66
66
66
66
66
66
66
66
66
66
66
66
66
66
66
66
66
66
66
66
6N
66
66
66
66
66
66
66
66
66
66
66
66
66
66
6M
NU
IOH
DN
GN
NG
QM
66
66
66
66
66
66
66
66
66
66
66
66
66
66
6H
QG
MN
HM
HN
HIA
56
66
66
66
66
66
66
66
66
66
66
66
66
66
66
I~|A
OU
lHG
U\5
Q|lIIh
|~6
66
66
66
66
66
66
66
66
66
66
66
66
66
66
66
66
66
66
66
66
6
H6
66
66
66
66
66
66
66
66
66
66
66
66
66
6J
M66666666666666666666666666666666666666666666666666666666
6Q
¢·U
\HU
\UIG
N$
G6
66
66
66
66
66
66
66
66
66
66
66
66
66
66
66
66
66
66
66
66
66
(HU!
66
66
66
66
66
66
66
66
66
66
66
66
66
6g
II\66
5N
UI•-•0
~ß
GO
Q6
H3
66
66
66
66
66
66
66
66
66
66
66
66
66
Nr-lG
U\8
M6
IlIN§
HQ
NW
66
66
66
66
66
66
66
66
66
66
66
66
66
G5
5|l'|5
HG
I~5
GG
5E
66
66
66
66
66
66
66
66
66
66
66
66
66
66
66
66
66
66
66
66
6Q
66
66
66
66
66
66
66
66
66
66
66
66
66
5!~
•··••-•5\I'\U
\5G
6I|\5
66
66
66
86
66
66
66
66
66
66
66
66
66
6M
5M
GU
\¢~
U•M
GU
\$f~
¤6
6W
66
66
66
66
66
66
66
66
66
66
66
66
6U
IGU
IUIQ
U\M
•·•U\Q
NM
G
26
66
66
66
66
66
66
66
66
66
66
66
66
66
66
66
66
66
66
66
66
O-HN
66
66
66
66
66
66
66
66
66
66
66
66
6M
Ih5
MG
Hß
¤5
G6
¢H
M6
6J
66
66
66
66
66
66
66
66
66
66
66
66
6G
N|~N
U\68N
•·-•MM
6G6Q
0~6
66
66
66
66
66
66
66
66
66
66
66
66
GO
DO
OU
WG
HG
55
MU
Ih0
66
66
66
66
66
66
66
66
66
66
66
66
66
66
66
66
66
66
66
66
66
Q6
66
66
66
66
66
66
66
66
66
66
66
6G
HO
·5N
66
MG
56
G\h
6|~
\l\5U
56
66
66
66
66
66
66
66
66
66
66
66
6=
66
66
66
66
66
66
66
66
66
66
66
66
GN
GQ
GQ
QG
QG
QUI
M
=6
66
66
66
66
66
66
66
66
66
66
66
66
66
66
66
66
66
66
66
66
6x
H6
66
66
66
66
66
66
66
66
66
66
66
0~
•-•U\5
U\H
6G
GM
M6
\h\|\N
G6
MV)
G6
66
66
66
66
66
66
66
66
66
66
66
Q65M
$5Q6|~
MQ
MY
~¤U
\MG
MSF;UH
66
66
66
66
66
66
66
66
66
66
66
6U
OU
IMN
QÜ
5Q
6N
M•-•!~
U\I~
EG
66
66
66
66
66
66
66
66
66
66
66
66
HM
U\M
HM
5U
\H
NN
5
66
66
66
66
66
66
66
66
66
66
66
66
66
66
66
66
66
66
66
66
66
2I-5
66
66
66
66
66
66
66
66
66
66
60
N$
6U
\0•\|\$
6lh
65
GN
9~
MQ
•46
0•
U!6
66
66
66
66
66
66
66
66
66
66
Hg
QS
HG
M0·N
$NU
\NH
GM
NN
66
66
66
66
66
66
66
66
66
66
6M
M6
GQ
ND
IQQ
HQ
UE
GN
QY
TQ
In6
66
66
66
66
66
66
66
66
66
66
66
66
66
66
66
66
66
66
66
66
6G
66
66
66
66
66
66
66
66
66
66
5N
55
U\U
|MM
GG
U1
Y~
NH
GN
MI|\N
QG
U1
66
66
66
66
66
66
66
66
66
66
HN
H¢
•I~
Q5
•·•H
MM
HG
••¢
«•G
GG
MH
¤6
66
66
66
66
66
66
66
66
66
6•U
!Gr'tG
GH
!GG
5U
IQ5
QN
GIh
U\M
G
36
66
66
66
66
66
66
66
66
66
66
6?
66
66
66
66
66
66
66
66
66
ILu.U\
66
66
66
66
66
66
66
66
66
6!~
MG
Nh
6Q
\h6
0~
$U
\6H
Y~
hH
Q¤
|G6
|~8
UI6
66
66
66
66
66
66
66
66
66
GQ
N¤
•!~M
G|I\$
6U
IO·6
¢·6
N$
5$
6M
U6
66
66
66
66
66
66
66
66
66
5M
06
5G
N5
GQ
MU
IQO
GG
U\
:6
66
66
66
66
66
66
66
66
66
66
66
66
66
66
66
66
66
66
66
66
HM
66
66
66
66
66
66
66
66
66
UIQ
¢U
\6G
6M
|NG
GH
MM
$N
6G
N$
QH
5¢
U]6
66
66
66
66
66
66
66
66
6Q
Y~
U\G
G5
U'|6
r-UN
UI6
53
QH
QN
•-•5G
0
=6
66
66
66
66
66
66
66
66
65
55
GN
G6
U|6
06
6Q
U\6
GG
5Q
|l!G5
:6
66
66
66
66
66
66
66
66
66
66
66
66
66
66
66
66
66
66
66
66
6II
Qu
ar~
v~m
•n~
•~•·—
t
52
57
NN
QN
GO
MG
I-4M
N|lIf~
NN
OM
GG
GN
rINO
OG
NG
Gr4
n4
N¤
~•~
¤·~
•m
»tI~
¢¢
•n
c¤
~m
~•~
au
uu
uu
mu
cu
ca
eu
um
GG
GG
GG
GG
GG
GG
GG
GG
GG
GG
GG
GG
GG
GG
GG
GG
GÜ
GO
NrIM
ß•-O
GG
MG
Ü¢
hN
QG
QN
UIO
MIH
GI~
~b
•-Ig$
NO
|¤l\U
ls1'\l\8
N|lI¢
|lI$I~
9~
N$
~0
•-I~0
NG
!-IIIIPIIIIS
S¤
•··••-••«
¤Q
r•¢•·•r••¢
I•|\¤c•·•n
•«7
¢•·••-••·••~
a«
-•ew
:-Iuu
uu
u
GG
GG
GG
GG
GG
GG
GG
GG
GG
GG
GG
GG
GG
GG
GG
GG
IIIIIIIII
IIII
IIlII‘|II|
NO
$N
NIII
3g
I~~
00
ON
NM
~fG
M¤
fMh
~§
Q•-IN
!-I~§
O*
N\|\3
|l‘I0Illä
lllNU
\¢6
fGM
$$
sfN
NM
MM
MN
GN
Mr¢
~fM
M'é
‘G
GG
GG
GG
GG
GG
GG
GG
GG
GG
GG
GG
GG
GG
GG
GG
G
he
-IG$
¤~
0I|IO
Qt\|•-IN
:-I~§$O
QI~
~¢Y
~~
0I|\GG
$k!~
Mm
O"!'T
'T.°‘!‘!“!'7
‘€°"2
°f°t'“'“."!°f"‘°""'°""^
°""""""°
°G
GG
GG
GG
GG
GG
GG
GG
GG
GG
GG
GG
GG
GG
GG
GG
GO
h•·4
Msf¢
~0
G~
0¢
GN
GN
•¤IO
Gh
ßM
ßs7
r4G
NM
OO
U\~
bM
MN
$¢
Nsf|lI~
0G
NO
GH
NM
NH
OM
HO
NG
OIB
GM
IDN
MN
NG
GN
sf~
0sf¢
~0
MM
Il\|llGN
M~
§0
N•I•-Ir4
NN
•1G
rIGG
MN
NM
GG
GG
GG
GG
GG
GG
GG
GG
GG
GG
GG
GG
GG
GG
GG
GG
ON
Y~N
llIM•¤I~D
lI\G
~0
|IIOIlI¢
s?G
GM
NO
GR
OO
NI~
Mg
|Ih~
§3
hG
•·¤I|I:I·|l\•-I•§
~0
N$
~&
H:~
0w
I£$
Oh
~!0
¢~
0\l\~
0G
GG
GG
GG
GG
GG
GG
GG
GG
GG
GG
GG
GG
GG
GG
GG
G~
0•-IQ
O•¤
IQQ
hN
hQ
\l\MM
OO
hQ
OG
•IGG
Nh
hh
G~
0I|\•-I~
§
GG
GG
GG
GG
GG
GG
GG
GG
GG
GG
GG
GG
GG
GG
GG
GG
|¤l\gUIG
s1'NIß
¢GM
Y~
GU
\|l\OY
~N
M|~
Qu-I:-IN
O~
&M
¢sfGG
G|lI
M~
b|~~
§3•-I~0M
I~G
xf|l\Nß
r4»f¢*N~
&G
M¤•I~
sfDN
I~r4$sfI~
OO
NG
N•¤
I¢sfß
~§
•·IGY
~l~
lI\M•-|M
~0
~0
0\|I¢
GM
~0
'G\l\
Q0
GG
GG
GG
GG
GG
GG
GG
GG
GG
GG
GG
GG
GG
GG
GG
GG
MG
G•¤
IsfOM
lhH
00
O.
GG
GO
Nsf~
0I|\§
I~Y
~sfG
¢N
¢¢
€‘f\l'I~
0Il'I
¢I|\~
0sf'IlI•0
IlIN~
0N
\<fI~
|l]V7
GG
GG
GG
GG
GG
GG
GG
GG
GG
GG
GG
GG
GG
GG
GG
GG
G\|\3
MN
I|Ih~
§O
MrlO
0N
I~Q
II\OO
Or•Q
||\•-I~§Y
~Y
~O
rIsfMM
N~f|l\II\D
Y*M$Y~~§•¤¢ß
$v~~n¤¤r~•~v~••~v~Q~0¤«•~2
MII\s
f~0
|l\|hG
¢M
MN
!-|¢M
rIN¢
MM
MM
GN
MG
M~
f~f
GG
GG
GG
GG
GG
GG
GG
GG
GG
GG
GG
GG
GG
GG
GG
GG
•-•r~c·~
•g¤
•~•IlI•~
•«·••-•¤
I¢\¤
•·•«•¤
•·•¤¤
$«
·•¤¤
~••~
r~••¢
•-em
u¢G
MN
QN
NO
NQ
NO
NN
XG
IAM
IH0~b•-|N
~§0*M•-lv-IN
~fO
OB
GN
GN
BU
IGG
NG
BN
GG
GG
GG
GG
GG
GG
GG
GG
GG
GG
GG
GG
GG
GG
GG
GG
Qlh
älh
ßd
lhr·I~
ßG
\l\Il\|~M
sf~
§sfO
«•M
OG
UIl\G
Osf3
Y~
QM
~0
~$
mr~
~$
v~Q
•n0
~Q
mu
na
nn
ßm
mo
um
uu
ßo
Q~~o0•II
rlN
MU
IM
7~
sf¢
¢M
r|MM
UIM
rINM
NN
MN
GN
r1N
»f•-IN
MG
GG
GG
GG
GG
GG
GG
GG
GG
GG
GG
GG
GG
GG
GG
GG
GG
lI\~§I|\~
§OO
~§G
GG
~bG
i~•¤|N
g~¢N
~fG
O~
§NxfIfIr4•-II•\M
N~
4l.
•n•·•¤¤lI<tn¢•nn¤~anl••¢\•·•c•¢\$«fsie-••nI~~f~fv~•-••-•¢~I•t\¢«•¤llII•I|
NM
MsfM
MG
NG
MM
NG
MN
N•-IG
N•-IN
•-Ir-Ir·|GN
r1rIN
NN
GG
GG
GG
GG
GG
GG
GG
GG
GG
GG
GG
GG
GG
GG
GG
GG
IIIIIIIIIIIIIIIIIIIIIIIIIIIIII
GO
Gr-I3IIIIIIO
•·|~ßO
G~I~§•-|•-Iß
$MO
¢NN
rI||\MrIIlIG
•·IOM
hxv-INM
GM
NY~G
~ßO•-II~~0O
NN
¢GN
MY
~N•-IO
MG
\lIY~
GN
vf0
¢~
0O
*0I¤
lIsfll’IN
\N|N
\IlI|l\¢M
W\F
lP*¢
MN
sfG
MQ
MM
¢G
GG
GG
GG
GG
GG
GG
GG
GG
GG
GG
GG
GG
GG
GG
GG
G¤
QN
i~N
|l\I~M
\l\Nh
u-lä
v-lr-IM
O\lIN
N$
•-IGO
~§
MM
MM
~0
G~
bN
•-•NY
~N
NrIN
¤
NN
GG
GG
GG
GG
GG
GG
GG
GG
GG
GG
GG
GG
GG
GG
GG
GG
~0
Q~
0g
G¢
¢Y
*3N
3M
Gg
GN
GG
~0
OM
|~Q
GN
UIO
OM
NQ
GO
ON
nu
uß
¤~O
Gr•N
ll\\|I\lINM
\l\~0
~0
GII'I~
f7~
~§
ON
MN
I|i¢\l\~
§0
M~
§N
\|h¢
GG
M¢
|l\MG
NsfM
~fI!\N
GM
Nr•~
f•-IM~
fG
GG
GG
GG
GG
GG
GG
GG
GG
GG
GG
GG
GG
GG
GG
GG
G
NO
OO
N~
0IllO
Q•-I¤
sfO
~fI~
•l\N|l|$
Q)I\¢
'sI¤
nI\It\N
¤Q
I~•-In
-I\*fs
fNM
|lI\h
YtIl!~
§M
MM
MM
sf•0
Msf
N!M
\lIsfN
|lI¤IIlI~
§N
¢\|\
GG
GG
GG
GG
GG
GG
GG
GG
GG
GG
GG
GG
GG
GG
GG
GG
Ah
GN
GG
QN
UIO
IHg
MO
•-IhY
~••I~
0r·IG
¢O
Gll\N
MG
NrIO
MN
\~b~bI\•-Ia-IG•-II~$O
NG
GO
$rIN~0~0•·IY
~•-IGN
G|~lII$N
¢|l\Y
~~
lND
q¢
Ü|h
IHM
FIO
OÜ
Msf~
0Ih
0llIIl\•I\lI\l\N
¢O
BG
GG
GG
GG
GG
GG
GG
GG
GG
GG
GG
GG
GG
GG
GG
GG
GO
QO
258
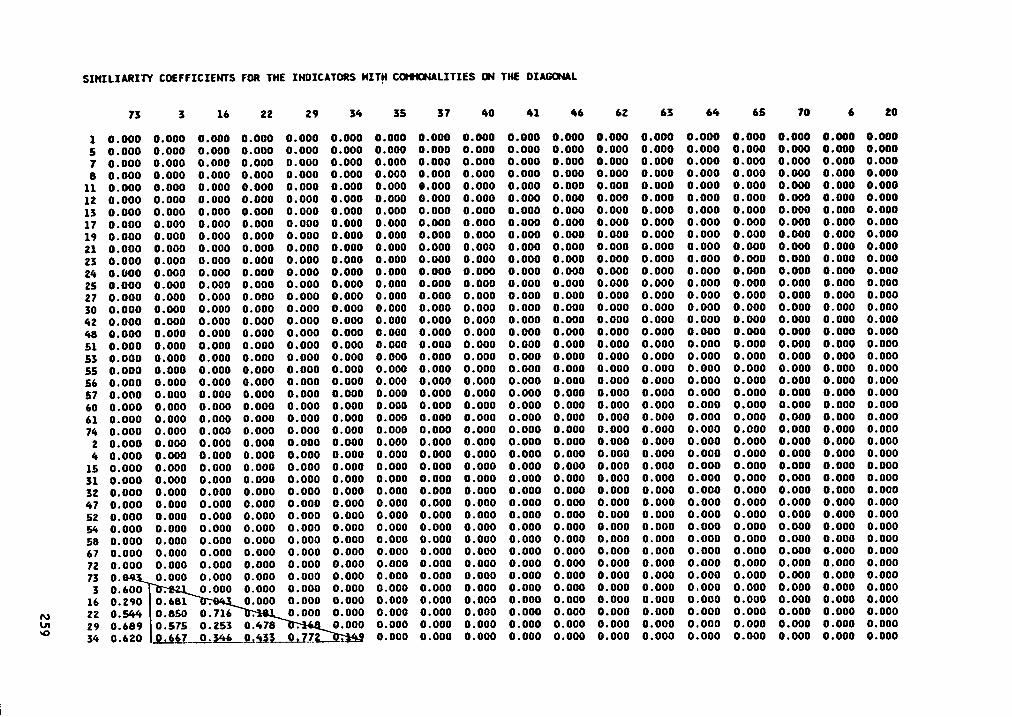
NQ
Q6
66
6Q
6Q
66
Q6
6Q
Qg
Qg
gg
gg
gg
gg
gg
3Q
66
66
6Q
Q
OQ
SQ
Q6
6Q
Q6
6Q
66
66
66
6Q
66
6Q
66
Q6
6Q
66
Qg
6Q
Q6
6Q
6
QN
66
66
6Q
Q6
Q8
Qg
gg
gg
SQ
Q
MQ
6G
66
66
66
66
6Q
Q6
Qg
6Q
Qg
gg
gg
QO
Q6
66
MQ
QG
N6
66
66
66
66
QG
60
66
66
66
66
66
66
6Q
Q6
GQ
66
QJ
66
66
66
66
66
Q(H
HQ
66
6Q
66
6Q
Q
WQ
Q
EQ
Q
Q6
66
66
66
66
66
66
66
6Q
66
66
66
Q6
Q6
6Q
Q6
6Q
6Q
66
Q6
66
66
66
66
Q6
Q6
66
6Q
66
66
66
66
66
mQ
Q
I-HN
66
66
66
66
6Q
JM
66
IhQ
66
¤6
66
66
66
Q6
66
Q6
66
66
QU
M6
66
66
Q6
66
66
66
66
66
66
66
6¤
66
Q6
66
Q6
66
Q
=Q
Q6
Q6
66
66
6:·
xQ
Q6
6Q
66
66
66
Q6
Q6
66
Q6
6Q
6V
IM
66
66
6Q
6Q
Q
59
€°!"·!°
°°°°!‘!°
??
°°°°9
9°!‘!°
°‘!‘?
°‘!°
!‘?°‘?
?‘!?
‘?°!‘!°
°°9
‘f.
I;Q
Q6
06
66
66
66
6Q
Q6
66
66
66
66
NQ
66
6Q
66
6Q
DN
äQ
Q
UQ
6Q
NQ
Q6
66
0N
6Q
Q6
66
6Q
Q6
66
6N
5°°°°°‘?
°"t°
!‘!°°°°°°9
‘?°°‘?
‘?‘?
9°£
°2
°!°
!‘?"!'%
?‘!°
!‘!9°!‘?
‘%n
tIn
QI
Ih6
66
66
66
66
6Q
60
66
66
OM
GN
NM
3Q
MQ
66
66
66
Q6
66
66
Q6
Q6
66
66
HQ
UIN
uaQ
66
66
66
66
6Q
66
OIIIN
O
8Q
QQQQQQQQQQQQQQQQQQQQQQQQQQQQQQQQQQQQQQQ6
HM
66
0Q
IN
QG
Q6
66
60
ON
=Q
QO
NO
Od
I0
HIII
NQ
HQ
NQ
UIH
NN
NN
NM
MO
NO
Q:7;
"""'“'°.'32‘•2„'?•„-•¤3££'&3$$„„$•„$•„„•••~
„„„«•„$
3„-
.-•„„„
259
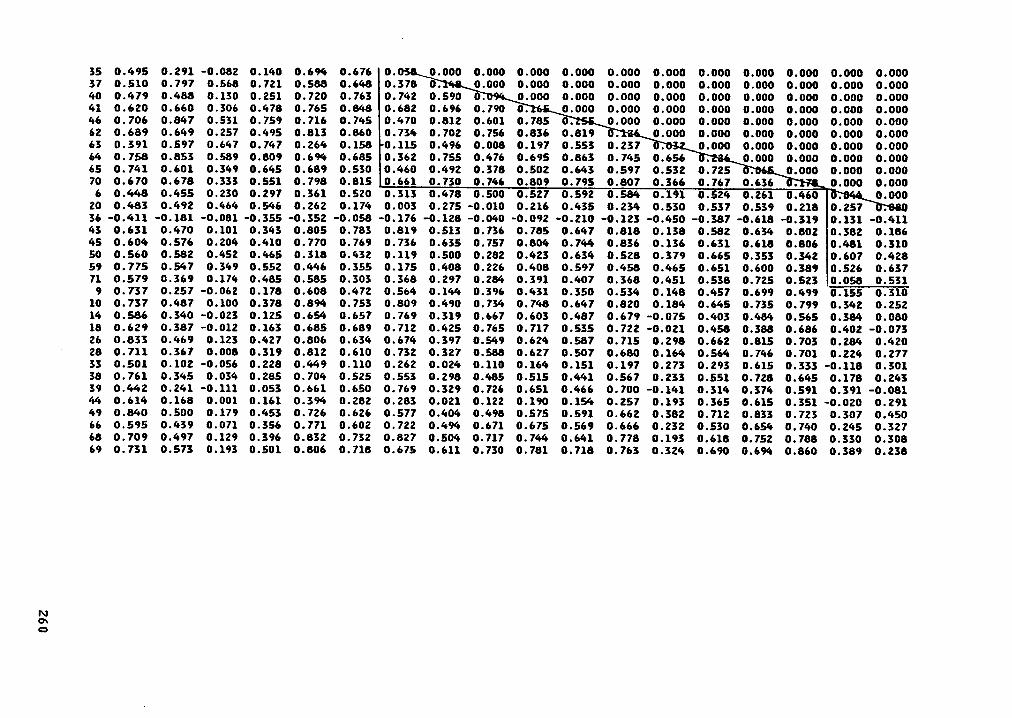
555555555555555555555555555555555555555555555
55
55
55
55
55
55
55
55
55
55555555555coccocccuc
rnm
ud
cu
Uh
r¤
~•-•r~
¢·~
o¢
m¤
555555555555555555555
55
55
55
55
55
55
55
55
55
55
555555555555555555Q
5555555555555555555
55
55
55
55
55
55
55
55
55
55
5
55
55
55
55
Qo
-00
55
M5
II'I0·Ih
QIII
M5555555555555555
55
55
55
55
55
55
55
55
55
55
55
55
55
55
55
||\hsfN
NN
•-·||lIF|5
N|l\N
\N
¢M
•¤•¢
IhN
55
55555555555555N
NIA
IAM
55
55
55
55
55
55
55
55
55
55
55
55
55
55
55
5
555555555555555555
55
55
55
55
55
55
55
55
55
55
55
55
55
55
55
NIH
NN
55
55
5M
Q0
5M
NM
MN
QH
INY
~N
¤I5
¢^Q
5Ih
I~Q
55555555555
55
55
55
55
55
55
55
55
55
55
55
55
5
55555555555555
NN
QN
QM
NN
2¤¤55525o
occ
«•r~
••¢e
•~r~
55
55
55
55
55
55
55
55
55
55
55
55
55
55
55
55
55
IIINN
50
NN
U•5Q
55
5U
^NIH
N\N
HIß
55
5O
NQ
NN
55
55
55
55
55
55
55
55
55
55
55
55
55
55
55
55
NN
M5
55
55
55
55
55
55
55
55
55
55
55
55
55
55
55
55
55
55
55
55
55
55
55
55
55
55
55
55
55
55
55
55
OG
q•V~Q
QN
WN
9IB
NN
55
55
55
55
55
55
55
55
55
55
55
55
55
55
55
55
In0
05
Qa
n
0~
26
0
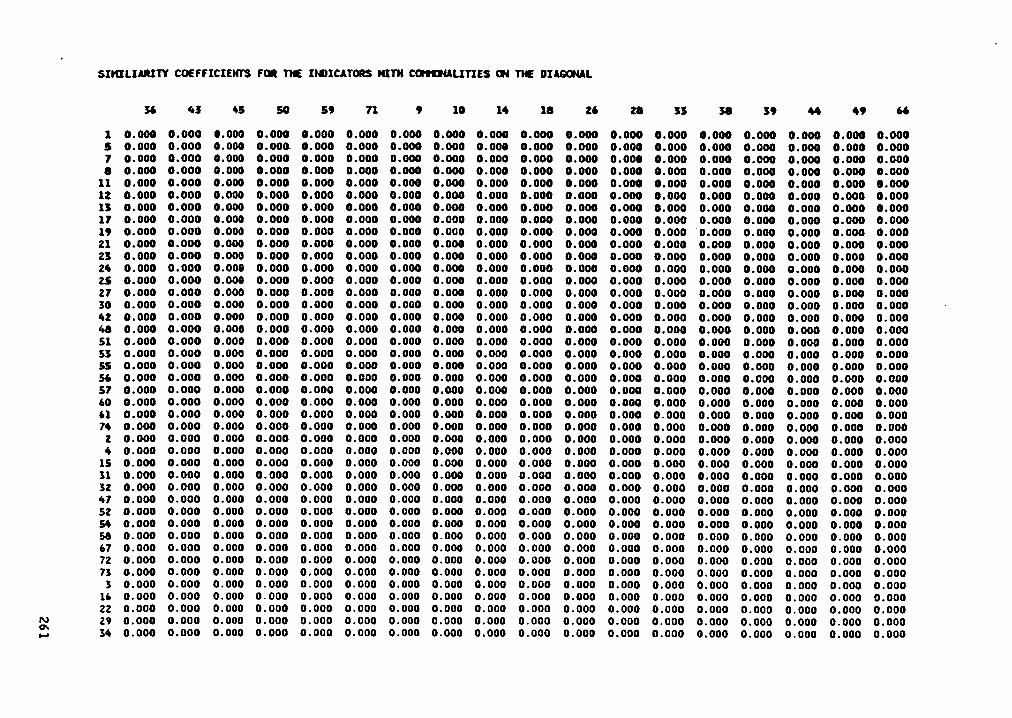
O6
66
66
66
66
66
66
66
66
66
66
66
66
66
66
66
66
66
6
66
66
66
66
66
66
66
66
66
66
66
66
66
66
66
66
66
66
66
66
66
O6
66
66
66
66
66
66
66
66
66
66
66
66
66
66
66
66
66
66
66
66
66
66
66
66
66
66
66
66
66
66
66
66
66
66
66
66
66
66
66
36
86
66
66
g6
66
66
66
66
66
66
66
66
66
66
66
66
66
66
66
66
6Ö
66
66
66
66
66
66
66
66
66
66
66
66
66
66
6
66
66
66
66
66
66
66
66
66
66
66
66
66
66
66
66
66
66
66
66
66
O6
66
66
66
66
66
66
66
66
66
66
66
66
66
66
66
66
66
66
66
66
66
66
66
66
66
66
66
66
66
66
66
66
66
66
66
66
66
66
66
66
66
66
66
66
66
66
66
66
66
66
66
66
66
66
66
66
66
6
M6
66
66
66
66
66
66
66
66
66
66
66
66
66
66
66
66
66
66
66
66
6M
66
66
66
66
66
66
66
66
66
66
66
66
66
66
ÖÖ
66
66
66
66
66
66
66
66
66
66
66
66
66
66
66
66
66
66
66
66
66
66
66
66
66
66
66
66
66
66
66
66
66
66
66
66
66
66
66
66
66
66
66
66
66
66
66
66
66
66
66
66
66
66
66
66
66
66
66
66
66
66
66
66
66
66
66
66
66
66
66
66
66
66
66
66
66
66
66
66
66
66
66
66
66
66
66
66
66
66
66
Ö6
66
66
6Ö
66
66
66
66
66
66
66
66
66
66
66
6g
66
66
6g
g6
66
66
66
66
66
66
66
66
66
66
66
66
66
66
66
66
6n
lN
66
66
66
66
66
66
66
66
66
66
6Ö
Ö6
66
6Ö
66
66
66
66
66
6Ö
66
66
66
66
66
6Ö
66
66
66
66
66
66
Ö6
66
66
66
6Ö
66
66
66
66
66
66
66
66
66
66
66
66
66
66
66
66
66
66
66
66
66
66
66
66
6
H6
gg
66
66
66
66
66
66
66
66
66
66
66
66
66
66
66
66
66
66
66
66
6F
l6
66
66
66
66
66
66
66
66
66
66
66
66
66
66
66
66
66
66
66
66
66
66
Ö6
66
66
66
66
66
66
66
66
66
66
66
Ö6
66
66
66
66
66
6
Ö6
66
66
66
66
66
66
66
66
66
66
66
66
66
66
66
6
M6
66
66
66
66
66
66
66
66
66
66
66
66
66
66
66
66
66
66
66
66
6
E6
66
66
66
66
66
66
66
66
66
6Ö
66
Ö6
66
66
66
66
66
66
66
66
66
66
66
66
66
66
66
66
66
66
66
66
66
66
66
66
66
66
3F
l66
66
66
66
66
66
66
66
66
66
66
66
66
66
66
66
66
66
66
66
66
66
66
66
66
66
66
66
66
66
66
66
66
66
66
66
66
66
66
66
66
66
66
66
66
66
66
66
66
66
66
66
66
66
66
66
66
66
66
66
66
66
66
66
66
66
66
66
66
66
66
66
66
66
66
66
66
E6
66
66
66
66
66
66
66
6Ö
66
Ö6
66
66
66
66
66
6Ö
66
66
66
66
6
66
66
66
66
66
66
66
66
66
66
66
66
66
66
66
66
66
Ö6
66
66
66
66
66
ÖÖ
66
66
66
66
66
66
66
66
66
66
66
66
6U;
66
66
66
66
66
66
66
66
66
66
66
66
66
66
66
66
66
66
66
66
66
U6
66
66
66
66
66
66
66
66
66
66
66
66
66
66
66
66
66
66
6—
ÖÖ
Ö6
66
66
66
66
66
66
66
66
66
66
66
66
66
66
66
66
66
66
66
66
66
66
66
66
66
66
66
66
66
66
66
66
66
66
66
66
66
66
66
66
66
66
66
66
66
66
66
66
66
66
66
66
66
66
66
66
66
66
66
66
6g
66
66
66
66
66
66
66
66
66
66
66
66
66
66
66
66
66
66
66
66
66
66
66
66
66
66
66
66
Ö6
66
66
6Ö
66
66
66
66
66
66
66
66
66
6In
66
66
66
66
66
66
66
66
66
66
66
66
66
66
66
66
66
66
66
66
66
co
¤
66
66
66
66
66
66
66
66
66
66
66
66
66
66
66
66
66
66
66
66
66
KInIl
66
66
66
66
66
66
66
66
66
66
66
66
66
66
66
66
66
66
66
66
66
66
66
66
66
66
66
66
66
66
66
66
66
66
66
66
6
;666666666666666666666666666666666666666666
66
66
66
66
66
6g
66
6g
66
63
66
6g
S6
66
66
66
66
66
66
66
66
66
66
66
66
66
66
66
66
66
66
66
3••••••••••••••••••••••••••••••••••••«
••„„„
E666666666666666666666666666666666666666666
BÖ
IOM
B6
NH
M~
Iß6
l'|ON
O|H
•¢N
Y~
NY
*N
MM
•|N¢
~f
261
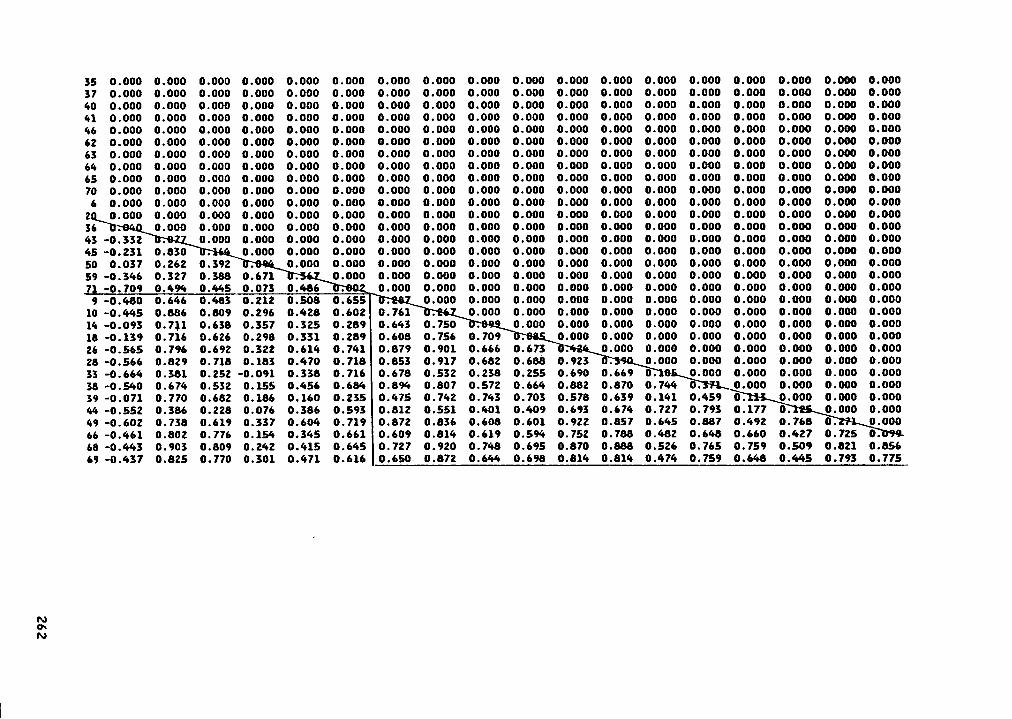
99
99
99
99
99
99
99
99
99
99
99
99
99
99
9O
U!
99
99
99
99
99
99
99
99
99
99
99
99
99
99
9£
N9
99
99
99
99
99
99
99
99
99
99
99
99
99
99
N
99
99
99
99
99
99
99
99
99
99
99
99
99
99
99
99
G9
99
99
99
99
9S
üß9
99
99
99
99
99
99
99
99
99
NO
N
99
99
99
99
99
99
99
99
99
99
99
99
99
99
99
99
99
99
99
99
99
99
G9
99
99
99
99
99
99
9O
NO
Ü9
99
99
99
99
99
99
99
99
99
99
99
99
99
ON
9$
99
99
99
99
99
99
99
99
99
99
99
99
99
9N
¢U
l
99
99
99
99
99
99
99
99
99
99
99
99
99
99
99
99
99
99
99
99
99
99
99
99
99
99
99
99
99
NN
90
·$9
99
99
99
99
99
99
99
99
99
99
99
99
9N
OO
III9
99
99
99
99
99
99
99
99
99
99
99
99
9•-|¢
ON
O
99
99
99
99
99
99
99
99
99
99
99
99
99
99
99
99
99
99
99
99
99
99
99
99
99
99
99
99
9Ü
MN
SIH
G9
99
99
99
99
99
99
99
99
99
99
99
99
Ih¢*3O
l'!9
99
99
99
99
99
G9
99
99
99
99
99
99
QN
ON
N9
99
99
99
99
99
99
99
99
99
99
99
99
99
G9
99
9
99
99
99
99
99
99
99
99
99
99
99
99
gr-•N|lIN
O~
f9
99
99
99
99
99
99
99
99
99
99
99
9¢
N¢
$N
|~9
99
99
99
99
99
99
99
99
99
99
99
9N
•-•I~O
\¢l¢
99
99
99
99
99
99
99
99
99
99
99
99
99
99
99
99
99
99
99
99
99
99
99
99
99
99
99
9¢
90
¢N
3Q
99
99
99
99
99
99
99
99
99
99
99
9O
NM
NIII
rl9
99
99
99
99
99
99
99
99
99
99
99
OO
OO
QN
9
99
99
99
99
99
99
99
99
99
99
99
99
99
99
99
9
99
99
99
99
99
99
99
99
99
99
99
M9
N9
MN
N9
~f
99
99
99
99
99
99
99
99
99
99
99
NO
‘3N
¢N
Il\Nr•
99
99
99
99
99
99
99
G9
99
99
99
.0*O
U\0
O~
N0
99
99
99
99
99
99
99
99
99
99
99
99
99
99
99
99
999999999999999999999999999999999999999999N
Il‘lO9
99
0*0
99
99
99
99
99
99
99
99
99
99
9O
ON
ON
¢~
0|l\O
O
99
99
99
99
99
99
99
99
G9
99
99
99
99
99
99
9
99
99
99
99
99
99
99
99
99
99
O•O
NO
NM
¤4902$9
99
99
99
99
99
99
99
99
99
99
09
MN
¤f9
9•-•
99
99
99
99
99
99
99
99
99
99
NO
ON
\|\NsfO
ON
O
99
99
99
9G
99
99
99
99
99
99
99
99
99
99
99
9
99
99
99
99
99
99
99
99
99
99
0¤
|NN
NN
•4
0~
f9N
99
99
99
99
99
99
99
99
99
9I|\I|\9
r4M
9~
f\l\M•-Q
NN
99
99
99
99
99
99
99
99
99
9N
N§
*¢
•|0
9N
|l\99
09
99
99
99
99
99
99
99
99
99
99
99
99
99
99
99
9
cccu
occa
cca
co
ccco
c•-n
nü
am
ßg
mu
ue
sg
99
99
99
99
99
99
99
99
99
O~
79
NIl\N
Y~
¤·•I~
9N
99
99
99
99
99
99
99
99
99
NO
O9
9~
09
¢U
9O
NO
99
99
99
99
99
99
99
99
99
99
99
99
99
99
99
9
9999999999999999999999999999999999||I9
99
~2
•·1H
M0
*r••O
€•'•
99
99
99
99
99
99
99
99
9O
ON
NN
NN
ON
ÜN
OO
O
99
99
99
99
99
99
99
99
99
99
99
99
99
99
99
9
99999999999999999999999999999999Q
NN
MA
NM
UIO
9~
fr|N99999999999999999999999999999999
99
99
99
99
99
99
99
9
99
99
99
99
99
99
99
9•-|M
NO
N9N
Mr•&
hOO
N$N
Ho
cca
cccco
ocß
co
or~
r~«
a~
u'•¤
~N
¤¢
•nQ
!~m
¢¤
99
99
99
99
99
99
99
9O
9N
NM
NM
•¤
I9r|•
49
N\rd
NN
\
99
9G
99
99
99
99
99
99
99
99
99
99
99
99
99
9
o¤
¤¤
¤¤
¢¤
c¤
¤¤
¤¤
N3
UiM
0~
Q~
a~
¤~
u~
0¢
~o
•~¤
99
99
99
99
99
99
99
0*$
29
MN
O·r•U
1M
ON
•-QN
QN
99
99
99
99
99
99
99
MM
QO
OO
NN
IIOG
BO
NQ
N9
99
99
99
99
99
99
99
99
99
99
99
99
99
99
99
99
99
99
99
99
99
99
NN
xO
OrIO
O0
•r•sf9
09
NM
\H9
99
99
99
99
99
99
MO
N¢
8•¤
4·n
lO~
ND
NN
9!*\9
9N
99
99
99
99
99
G9
90
NM
¢O
NN
N9
MO
NH
:N9
¢U
99
99
99
99
99
99
99
99
99
99
99
99
99
99
99
9
99
99
99
99
99
99
N•4
NO
0^9
|¤f|M
¢\l\~
0\7
9rIN
Nr4
MN
99
99
99
99
99
99
MM
M¢
9$
$¢
~M
OO
O$
N\I\9
0$
M9
99
99
99
99
99
9M
N9
MN
9r1
|h\llO
9|l\O
sf
~f99999999999T999G
999999999999999II|I|II|•Il|II|I|•
262
ä<H¤äi0wH»Häuo»<uEHQII-
QmHuä„0
oca
nco
co
ccu
co
cco
oco
cco
oa
co
cccco
cco
co
oo
co
cco
c0
cco
occccco
occco
ccco
oca
co
ao
oo
cce
occco
oca
oco
oc
SQ
qcq
c¤
¤o
c¤
¤¤
co
occ¤
occo
co
occo
co
co
oo
oco
ccco
c
I0
ce
cco
occcca
ecccca
co
00
oo
cccc¤
c¤
co
¤ccc¢
¤¤
ccccc
Q0
co
oo
ca
occce
co
co
co
co
occo
co
co
cco
cco
cco
occo
co
oo
Jcco
co
oo
co
ccccccco
no
co
cco
oco
occco
oo
oco
occco
oo
¤zk
kb
klll
QN
QC
HH
NB
NQ
26
3
0M0
ao
co
264

GS
SS
SS
SS
SS
SS
SS
SS
SS
Stkää3$°'.3$2$¤•'l'»‘E
•‘3„i’$$G•$"‘°$“’
NQ
AQ
QA
AQ
AA
Q3
M~
0~0¢·N
MI|IN
~§0N
$MA
~JQ
~0N
NO
~Q
.Q
QN
NQ
NU
IUIN
OQ
ON
MN
MO
N~
00
~N
MA
N~
•¢~
QA
QA
AQ
MN
QN
QN
AA
AA
MA
NN
A
NQ
ON
MQ
NQ
IIINM
AN
N¢
QQQQQQQQQQQQQQQQQQQQQQQQQQQQQQQ
QN
AQ
AQ
MN
AQ
NQ
QA
QA
OM
NM
AO
HIQ
ON
IAM
MQ
QN
MN
MQ
QA
NQ
Og
~fQ
NQ
QO
~A
sfIt\NA
Mg
A‘I£
2E
A$
QA
QA
AQ
AQ
AQ
AQ
AQ
AA
NQ
OQ
NO
AN
NA
AO
~ß
A¢~
§Q
N0~
NS
QS
.999.9
99
99
99
9.9
99
99
99
9°"!’t°f*"°"""‘
"""°°""‘*°"‘°*"‘Q
III
IIIIIIIIIIIIIIIIII
0•IlI~8A
NIII0
0Q
QN
NA
NIH
NN
AQ
NN
QA
AA
NQ
AQ
AQ
QA
AN
NN
QIIIIIIIIIIIIIIII
IIIIIII
sf QQQ
NQ
AQ
NM
~§
IlI~ß
¤ß
DÜ
°$¢
h\¢
OH
\~fN
I~0
¢ä
NN
N~
b3
¢J
EQ
NA
AQ
QsfQ
UIA
¢N
MN
QA
IIINM
¢Q
ZIIIIIIIIIIIIIIIIIIIIIIIII
MQ
AM
AQ
NO
~~
ßM
MA
NN
QN
UIQ
AN
AQ
OM
QN
AO
<4
NQ
AN
~§~0NM
MM
O~gA
MA
IlIQO
QIlIN
NQ
*‘MQ
AQ
I-HA
MM
äQ
AQ
QA
NA
AQ
NN
QN
AN
QA
AQ
NQ
NA
Q'
UQ
gn
II
IIII
IIIIIIIIIIII
IIIII
I-••·•
AQ
~fM
0~0Q
AQ
~0~
ß~
&Q
NA
M¤fN
O~
gNN
O~
Q~
0||IM~
0NA
QA
NN
MQ
•-•M~
2¤
\cA¢
M~
tln¤
I$Q
QA
~~
o~
M0
~a
•nN
c¤~
Q~
r~~
0v~
~E
SQ
AA
AA
AQ
QA
QA
MQ
MA
QM
QA
AA
AQ
AA
AI-
Q$
5III
IIII
IIIIIIIIIIIIIIII
AA
O•Q
IIINA
3N
AQ
NA
NQ
IlINN
Q~
&Q
0~
I|\NN
QN
NQ
QO
~M
NQ
$¤
~I-
AQ
QN
AN
OQ
AM
MQ
AA
¤0
•0N
mM
Q¤
\0~
¤A
~~
Ncq
AN
M
Q
EIII
IIIII
IIIIIIIIIIIIIIII
NQ
NIIIQ
NM
UIA
AQ
0M
QN
NIIIM
QO
QN
NA
Q5
99
99
99
9.9
99
.99
9"!9
'!99
"2"!9
99
99
99
.99
99
°°9
99
99
"!Q
Et
II
II
II
II
II
II
II
II
II
IA
HM
~0
MM
IlI¢·M
~•Q
AM
AM
QO
MO
AN
MN
SS
QN
AM
AN
OA
NI
JA
~0
MM
NN
¤N
QA
hl\N
¤fA
MQ
6·Q
Il\¢~
N~
§N
NN
NQ
QM
OW
Q·-
IIIIIIIIIIIIIIIIIIII
IIIII
4N
QM
NQ
QN
NQ
MM
AQ
MS
MI|IA
Qg
AM
¢~
NA
xN~
ßA
NM
$N
QM
UQ
AQ
AM
NQ
AN
IHM
NU
ISM
NM
IhA
AN
SN
OQ
SIlIQ
¢·g
¤Q
ON
•-•N
OA
QA
AA
AN
Qc¤
AA
¤A
QN
NN
ßc
AQ
QA
AA
2Q
I¤
||•
IIII
II
IIIIIIIIIIIIII
IIIIIII
I-A
~•M
M\|I~
0M
QN
NQ
Il\II\s
fNQ
N~
0¤
NN
QM
AQ
NQ
AQ
s*I'~00•6~g
4A
SQ
AS
NU
IO~
M0
¢~
MQ
3~
¤M
Nk1
Q$
Nx$
NA
ltIQA
~•M
~tS
u-•A
$s7
‘I-
EQ
AQ
AQ
AA
Qx?
¢Q
A~
fAM
NA
NA
MA
NM
QIII
IIIII
IIIIIIIIIIIIIIIIIII
NO
¢~N
QO
N~0
MO
N>
2'°
SS
SQ
3IHE
QIG
NIII
IIIIIIIIIIIIIIIIIIIIIIIIIIII
IIIQ
QN
Q0
00
"''“
SSG
QU
•Q
JO
IIIII
IIIIIIIIIIIIIIIIIIIIIII
<<
Inc
Q0
*NN
~§
AN
¢l\¢
lI'I¢¢
NN
MQ
QN
UM
MA
UIO
AN
NQ
N$
MsfQ
~0
~b
M\lI
Q0
~g
NM
6~
¤0
~N
Il\N·¢
AN
~0
AQ
«tQ
gM
QA
N~
b¢
NA
Q~
§M
¢M
IIIAA
QA
MN
,„E
°°
°"!9
°9
"9
""‘°
°°‘1
°"!9
°9
99
"*"!9
"!9"!9
“f9°9
'!"!'f"f°f9
EH
Qx
II
IIII
IIIIII
IIIIIIIIIIIIIIIII
RA“·
—Q
QN
QA
AQ
AQ
AQ
QM
MQ
AM
NN
AQ
QA
MA
NsfN
I-Q
Q5
4I
II
IIIIIII
IIIIIIIIIIIIIIIIII
NN
ON
QM
mN
oA
¢N
¢•n
A~
N~
NN
M~
•~0
~?
265
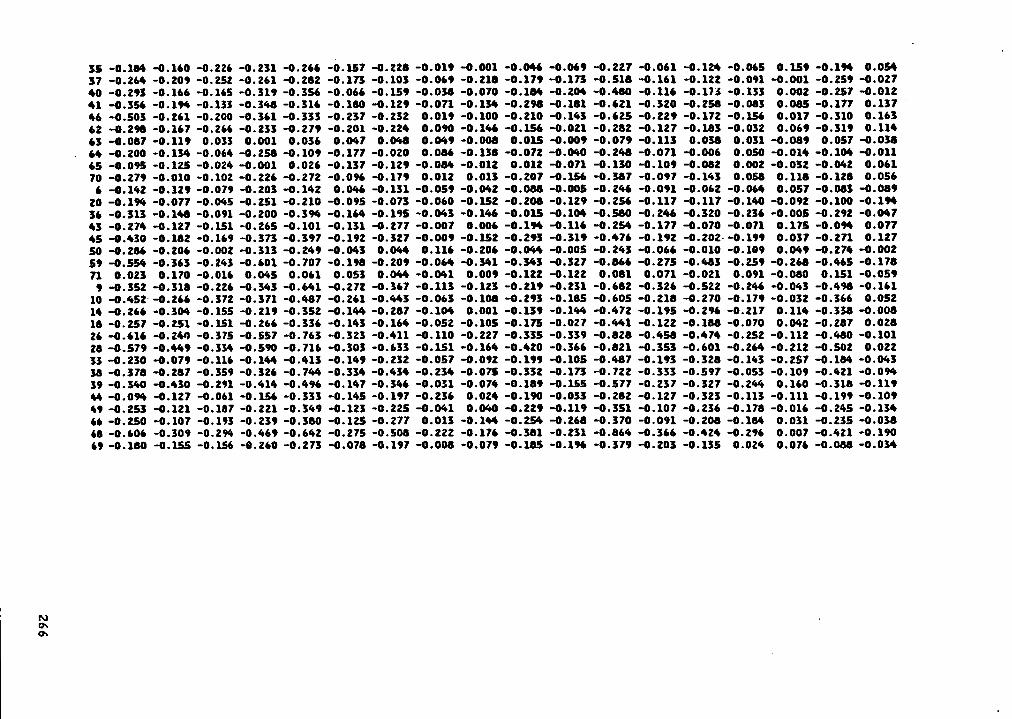
hN
hM
O••••¤
•O!
hh
hN
!•d
N•·•N
M!!
99
97
77
99
99
.7.9
77
97
99
97
99
77
79
79
II
IIII
IIIIIIIIIIIIII
t¢N
NQ
ON
8N
¢M
SN
:•üO
I|I•42
0¤
N§
N•-•§
!IIIIII•·•§•n
N•-Iu
llhN
!N
N•~
_IIIIIIIIIII
IIII
IIIIIIIIIIIIII
!h
!!
hh
!¤S
32„•¤$$2¤ä䣄g2§$¤£§¤¤$SS
¤3¤S2
NQ
NQ
NQ
Q•·•
•·•NN
IIII
II
II
II
II
II
II
MM
MM
NN
NO
nl!!!••
!h
QN
MM
MQ
OO
IIIIII
IIIIIII
IIIIIIIIIIIII
MM
h”
hh
rta-•r•N
¤:•-Z
•-:Q•·:M
QN
MN
NM
OO
MM
MM
NN
ON
97
97
77
97
77
77
77
77
77
97
77
77
77
77
97
79
Ö•I•¤
IM
Nd
•1
QrI¢
Gr4
N!I•I¢
NO
MN
NM
OM
FIM
NA
HQ
MN
77
99
77
79
97
77
77
77
7°7
77
77
77
77
79
97
7h
i•¤•
N!
Qh
OM
O•·•
NI|\N
•·•
Q•-Ih
Nh
N•·•
QO
!N
IIIO
ON
QN
AN
NN
ON
QO
OO
00
NIIIN
MM
QM
|••||••|I••••••¤
|||••••|•••I•••
OM
•¤|O
rl
OO
ON
NF
IN
OO
IHM
OV
4
:E§§:=s§s§§=§:¤§¤:z§§2¤:2E
B::§¤§
77
77
77
77
97
79
77
77
77
77
77
97
77
77
77
97
!Q
NN
hM
N!M
!Q
ON
O!
rlrl!-
INN
GÖ
ÖN
NQ
IIN
•4
NN
nI¤
MO
llMd
r4
N
Q7
77
•••°9°7
77
•77
77
77
77
•7••7
„•7•7
•N
N!
h!
§22$Sß
gßß
ß$¤$§§3g¤¤8S
ä~$¤!£$§$!„
NQ
•¤|•tr¢
‘•-t.
·Nrld
QIIIIIIIII
III
II
II
III
II
III
OO
•¤IO
ON
OO
MN
OC
IÜM
MN
0•¤
IN•-I~
lr4
MN
•¤•O
=h
•·•2$
3§
•·4II\O
gQ
Q•-•$
S¤
·•Og
Il\•-•§Il\M
•~1
Mg
••N3
¢Q
•¤IQ
·•¤tQ
r1Q
r·|•QN
QI•I.Q
I\IQQ
79
77
°°7°•7
97
7°7
77
••77
•••••7••
!!
hh
!h
hh
hh
N•4
•¤I•¤
INN
QrI•4
•lQ•¤
INM
NM
Nr•O
ON
OM
•4~
N•n
•-•
77
77
77
97
77
79
97
99
99
77
97
97
77
77
77
77
h!
hIn
NÖ
FIN
Nrlrlß
¢•¤
I•<
d«
|QN
N•¤
1rlM
I¢\r
IM•·Ir
I•¤
lrIN
0
.Q
Q9
77
97
7°7
77
°77
97
99
°77
77
77
7•9
79
9•7
MN
MQ
N¢
•¤
•G
OQ
QO
QIR
MO
HA
OM
OD
O3
SM
=M
NQ
•·•gN
•-•NM
•·•MN
hQ
OQ
MM
NN
ON
OH
IMM
ON
Q9
97
99
99
79
79
77
77
79
97
97
77
.7.••„•.7
Mu
!•¤•M
•·••·•O
M•¤
•Q•I\M
M•-•Il\•lI•·•!O
h2
OO
§••!!Q
NN
NM
O2
ää
ää
üä
ää
ää
ää
ßn
ää
ää
nß
ßä
mä
ää
«„$
„7
99
77
79
77
77
77
97
79
°79
97
99
99
97
97
79
•~$
33
33
32
3S
2S
S3
ä£
8$
S§
R2
¤;$
q$
§$
$q
qä
IIIIII¤
|•¤
•••••••••|•••I|II••I•
!h
!!h
hN
O!!h
Qh
••h
!rIN
•¤••-IN
r¤I•¤
I¤IrlQ
•¤I¢
r·Irl•¤IN
Mr|M
NI|I
NQ
NO
FIA
MM
'9
77
77
99
97
77
79
77
77
°77
77
77
97
77
77
97
$M
$M
=h
QIII!N
:MO
QO
$M
NN
Oh
O!Q
¢§
$M
QO
3O
UQ
ON
O•¤
|NO
NU
IUIO
•¤
INIlIN
O
§°€
°t"!%7
9°!9
°!77
77
Q°!“!9
"!‘!°£·‘{;9
"!"£”!
.9g
§9
7Q
Q••••••••••••7
79
99
97
97
77
77
79
77
77
7h
NM
QO
QO
MIII
OM
OO
OG
OO
M!
!O¢
9·
¤••\$
::O
O$
gh
NM
OO
$IIIh
•·••·••·•NN
M3
M$
OO
OO
266
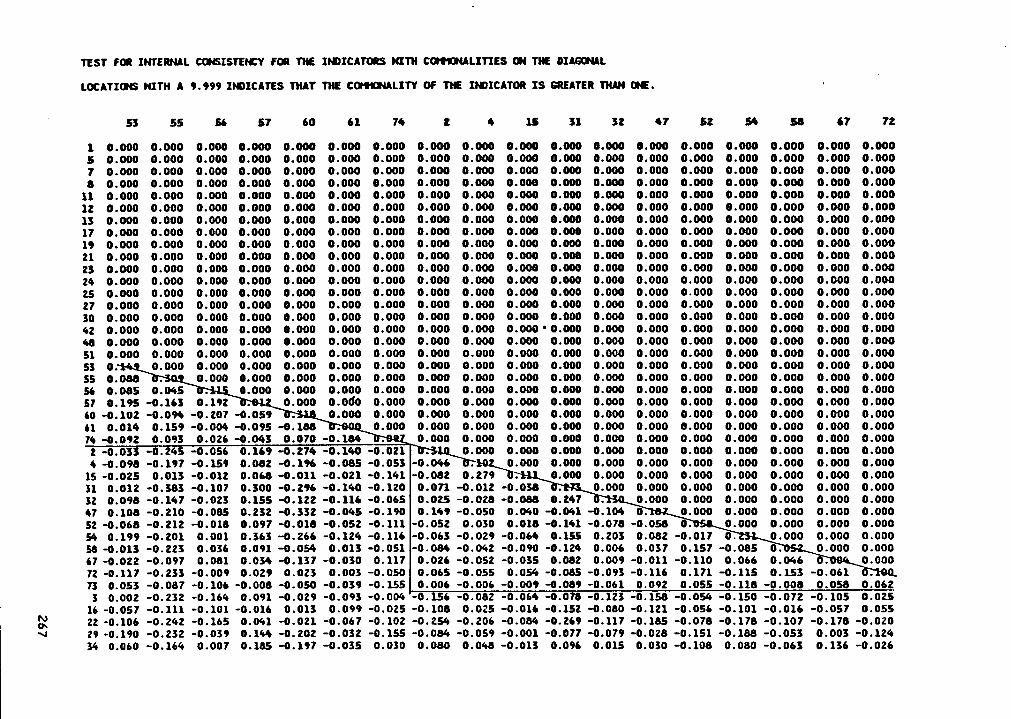
NG
GG
GG
GG
GG
GG
GG
GG
GG
GG
GG
GG
GG
GG
GG
GG
GG
GG
NIN
ING
QG
BG
GG
GG
GG
GG
GG
GG
GG
GG
GG
GG
GG
GG
GG
GG
GG
GG
GG
GG
GG
G?
BG
GG
GG
GG
GG
GG
GG
GG
GG
GG
GG
GG
GG
GG
GG
GG
GG
GB
OGGGGGGGGGGGGGGGGGGGGGGGGGGGGGGGGGGGGGGGGGGGGGGGGGGGGGGGGGGGGGGGGGGGG
GG
•-•Gr•G
•-I'
GG
GG
GG
GG
GG
GG
GG
GG
GG
GG
GG
GG
GG
GG
GG
GG
GG
GG
GG
GG
GG
GG
GG
GG
GG
GG
GG
GG
GG
GG
GG
GG
GG
GG
GG
GG
GG
GM
GN
QB
MM
GG
GG
GG
GG
GG
GG
GG
GG
GG
GG
GG
GG
GG
GG
GG
GG
Gg¤G
t~r·•G
IN~
0G
GG
GG
GG
GG
GG
GG
GG
GG
GG
GG
GG
GG
GG
GG
GG
GG
GG
GA
GG
GG
GG
GG
GG
GG
GG
GG
GG
GG
GG
GG
GG
GG
GG
GG
GG
GG
GG
GG
GG
G?
GG
GG
GG
GG
GG
GG
GG
GG
GG
GG
GG
GG
GG
GG
G$
§GG
GG
GG
GG
GG
GG
GG
GG
GG
GG
GG
GG
SG
GG
SG
GG
GG
GG
GG
GG
GG
GG
GG
GG
GG
GG
GG
GG
GG
GG
GG
GG
•-•«-ern-•¤••-1GG
GG
GG
GG
GG
GG
GG
GG
GG
GG
GG
GG
GG
GG
GG
GG
GG
GG
GG
GG
GG
GN
GG
GG
GG
GG
GG
GG
GG
GG
GG
GG
GG
GG
GG
GG
GG
GB
BG
•·•IN$
~lG
•·•QIN
GG
GG
GG
GG
GG
GG
GG
GG
GG
GG
GG
GG
GG
GG
GG
G•-•IN
•-•BIN
INB
ING
GG
GG
GG
GG
GG
GG
GG
GG
GG
GG
GG
GG
GG
GG
GG
GB
GG
GG
GG
GG
GG
GG
GG
GG
GG
GG
GG
GG
GG
GG
GG
SN
BA
GN
SH
QG
G{
gG
GG
GG
GG
GG
GG
GG
GG
GG
GG
GG
GG
GG
GG
GG
¤•6«<•-•0an
wm
••G
GG
GG
GG
GG
GG
GG
GG
GG
GG
GG
GG
GG
GG
GG
GG
GG
r·•G•-••«
•-•GG
gG
GG
GG
GG
GG
GG
GG
GG
GG
GG
GG
GG
GG
GG
GG
GG
GG
GG
GG
GG
GG
G
MG
GG
GG
GG
GG
GG
GG
GG
GG
GG
GG
GG
GG
GG
G$
GM
~••·•n
•-•m¤
•~•~
aM
GG
GG
SG
GG
GG
GG
GG
GG
GG
GG
GG
GG
GG
GG
BG
GG
G~
•~0
•-•r~Jä
·
GG
GG
GG
GG
GG
GG
GG
GG
GG
GG
GG
GG
GG
GG
GG
GG
GG
GG
GG
GG
GIllh-
nlG
GGG
GGGG
GGGG
B•¤••-•a~O~G
G~•~B~|
RGGGGGGGGGGGGGGGGGGGGGGGGGGGGE·~
‘G
GG
GG
GG
GG
GG
ING
G•-IM
"'EI
§S833S
S8S
38838S3S
¤¤¤¤S¤¤¤¤¤
3§
g„$
2„$
¤$
„$¤
„5
SI;G
GG
GG
GG
GG
GG
GG
GG
GG
GG
GG
GG
GG
GG
EO
gG
gG
GS
GG
GG
GG
GG
GG
GG
GG
GG
GG
GG
G~
GG
GG
NN
IN~
•N•N
~••$
2G
GG
GG
GG
GG
GG
GG
GG
GG
GG
GG
GG
BA
NM
MN
SIN
UIG
GN
GIN
·3
GG
GG
GG
GG
GG
GG
GG
GG
GG
GG
GG
GG
GG
NG
GG
GG
GG
GG
GG
GG
GG
GG
GG
GG
GN
uG
NM
~|IN~0~§G
GG
GG
GG
GG
Gg
Gg
GG
GG
GG
GS
GG
GG
G:Q
B¤
~fIt\~
0$
N~
0G
ING
$$
SG
GG
GG
GG
GG
GG
GG
GG
GG
GG
GG
GG
GG
GG
GG
GG
GG
GG
GG
GG
GG
GG
GG
GG
GG
GG
G•¤
•M•4
GI|IG
•¢~
••dB
GIN
~0
IN~
\NG
gIt
gg
gg
gg
gg
gg
gg
gG
GG
GG
GG
GG
GG
N\lI¢
N~
bG
•Ir4U
\•4I\¤
GN
GU
IH\
GG
GG
GG
GG
GG
GG
GG
GG
GG
GG
GG
GG
NG
GG
GG
GG
GG
GG
GG
GG
GG
GG
GG
GG
SS
H:-IG
OIN
NQ
MG
MG
MG
BN
UI
GG
GG
GG
GG
GG
UG
NQ
!IN
N•-•M
GM
GG
~•M
M3
U•
g8
Sg
gg
gg
gg
Gg
GG
GG
GG
GG
GG
G•-•rI3
Gr••¤
•gG
•4G
GG
GG
GG
GG
GG
GG
GG
GG
GG
GG
GG
GG
GG
GG
GG
GI-
GG
GG
GG
GG
GG
GG
GG
GG
GG
GG
GG
GG
GG
GG
OG
GG
GG
GG
GB
BM
GN
MM
GM
uN
AN
GG
GG
GG
GG
GG
GG
GG
GG
GG
GG
GG
GG
"'
EB
GG
GG
GG
GG
GG
GG
GG
GS
GG
GG
GG
INM
GN
3G
INN
BM
r4¢
GG
r•·•••$¤
(G
GG
GG
GG
GG
GG
GG
GG
GG
GG
ING
~|G
INM
GQ
GM
NG
GA
§U
mG
GS
GG
GG
GG
GG
GG
GG
GG
GG
GG
GG
SH
SG
MM
NG
MG
GG
GG
GG
HH
EG
GG
GG
GG
GG
GG
GG
GG
GG
GG
GG
GG
GG
GG
GG
GG
GG
GG
GG
GG
GG
In•·•
unG
GG
GG
GG
GG
GG
GG
GG
GG
GG
GG
NU
VU
IMG
N•-•G
MG
G~
aG
~¤
MG
gä
•4N
GG
Gr1
Gr:G
GG
GG
$Q
••••·:¤:•tG
¤
U GG
GG
GG
GG
GG
GG
GG
GG
GG
GG
JG
GG
MQ
GG
GG
GG
GG
GG
GG
GG
GG
GG
GI4
GG
GG
GG
GG
GG
ININ
NO
NM
GM
NG
GG
GM
NB
MN
BQ
GG
P=
GG
GG
GG
GG
GG
GG
GG
GG
GG
GG
GG
GG
GG
GG
GG
GG
GG
GG
GG
GG
GG
Wum
nu
su
•n~•~•~
E2
67
OA
D
Qin
•~Q
QO
DN
GQ
N
oc
III?
OIH
QÖ
NN
M
Qm
ßm
ug
zgg
za¢
MM
OQ
|~¤
f~III
QO
FF
OQ
NIIO
NO
NH
NQ
Q8
¤0
NO
¤ß
H¤
m£
2=
¤n
ge
-•m
Q~
¤·IQ
•••-•
UIQ
0IH
DN
NO
QN
QN
B•_
„S„
ne
em
uu
¤¢
me
em
ßß
vé
aa
sa
sa
äsä
ésä
äsä
zg
gq
gq
äq
_„„q
„;„„
cü
llhv~
QI~
Gd
NQ
•·IQ
Mln
cu
mO
lliN
MN
NM
NR
IAM
QA
Qln
Qu
Q
60
Q
QD
IIIIIIQN
AD
NM
QN
MU
NM
QM
NG
QM
¤c¤
Nn
gq
gq
n«
••-••-•u•~
••n•«
m$
¢
268
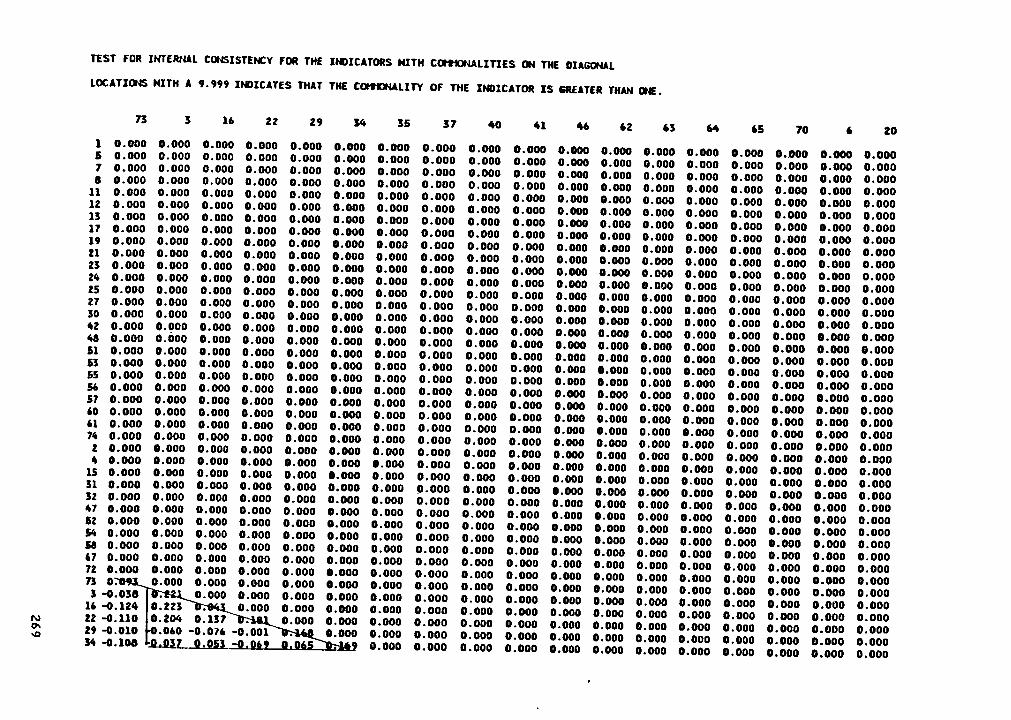
3S
SS
SS
SS
SS
SS
SS
SS
SS
88838888SS
SS
SS
SS
SS
SS
SS
SS
SQ
Q
0Q
QS
QS
Q
QN
GQ
InQ
0Q
QS
Qg
Qg
Q
SQ
Q
MQ
•~•
Sg
gQ
gg
gQ
Qg
g8
gg
gg
g8
gQ
Qg
gQ
QN
0Q
IHI-Q
Q§Q
Q§Q
SQ§Q
Q§§Q
QQQQQ
EE
:§ss„s
8¤S¤8¤S¤¤
¤38S88888388SS8888§S¤S¤
UQ
QIII
.E
MM
¢Q
Eg
$S
Qg
Qg
8Q
WP;
luUM
Q¤
Q:1
g'
SQ
SS
uQ
QZ°'
{RIa
QS
:C
QQQQQQQQQQQQQQQQQQQQQQQQQQQQQ.QQQQQQQQQQQQQM
InQ
Q-4
MQ
Q,,,
°9
9°9
99
99
99
99
99
99
99
99
99
99
99
99
9°9
99
99
99
99
99
8Q
Q•-1
SQ
2Q
QS
SQ
Qg
SQ
SQ
SQ
SS
SQ
EQ
ueI-
Q2
1N
O-E
Sm
:El
218
83
88
83
88
38
3S
SS
SS
SS
SE
ES
SS
SS
SS
SS
SS
S8
88
83
82
3Q
.Q
0Q
QN
0Q
MQ
QM
N2
SZ9
99
99
99
99
99
99
99
99
99
99
99
99
99
99
99
9°°9
°99
.*19
.U
•:Q
?=
1M
QM
SQ
EQ
N0
•„E
99
99
99
99
99
99
99
99
99
99
99
99
99
99
99
99
99
99
9.9
99
EE
QM
äg
Qg
gQ
gQ
Qg
„„„
99
99
99
99
99
99
99
99
99
99
9°9
9°9
9°9
°°°°°°9
9’1
"!9"!
FF;
Q?
??
??
Wsu
MO
NO
E§
"'“"‘*%*1
*,22
2!•¤
Z'•£
2Z
32
$&
'$•‘2
$$
2S
•‘Z""2
!:ä¤
';$$
3••~
F2
-•••••FX
269
IIII
IIIIIIIIIIIIII
OO
OO
OO
OO
OO
OO
OO
OO
OO
OO
MQ
HQ
ON
NM
OM
NO
MU
INR
NO
NO
OO
OO
OO
OO
OO
OO
OO
OO
OO
IIIIIIIIIIIIIIIIO
OO
OO
OO
OO
QM
OO
UI
NS
IRO
AQ
OO
MM
MIH
RM
MO
OO
OO
OO
OO
OO
hO
N~
§§
O•··•Y~r-I~br•~0~0\I\ll'I~0O
•r•0~•-IO
OO
OO
OO
OO
OFIN
I-IOO
OO
OO
OO
OO
OO
OO
O
OM
MN
•·40
~$
ON
HM
DN
~0
NO
NN
I~O
M~
0O
Y~
IIIIIIIIIIIIIIIIIIIII
OOOOOOOOOOOO¢
MO
HO
OH
¢O
MO
OO
0O
OY
~N
||\~§
N¢
•-I
OO
OO
O•-IO
OO
O•¤
I•-IO!-•IO
•-10
00
OO
rI•-IO!-Q
OO
O
OO
OO
hle
-IY~
\l\•-INO
Mh
hß
Olli
O0
||\U'\
MOOOOOOOOI
IIIIIIIIIIIIIIIIIII
Q¤
¤cO
OO
III
IIIIIIIIIIIIIIIII
OO
IIIIII
IIIII
IIIIIII
OQ
I
IIIIIIIIIIIIIIIIIIIIIII
UV
IOsf~
7'~
0O
NN
OO
ON
O\|\
OO
MO
OQ
N•·•••¤
O¤
•-•OO
•-•OO
AN
MQ
NO
ON
AQ
OA
OO
UIO
QN
NA
QO
U\|l7
Nh
M~
fON
O$
O!~
gg
ßO
Nsf|IIM
ON
MN
ON
hM
$!~
NN
HN
OM
NR
NM
Ü~0~ß
OM
OM
NM
OM
MO
UIU
IIII
IIIIIIII
IIIII
IIIIIIIII
O
IIIIIIIIIIIIIIIIIIIIIIIII
IIIII
IIIIIIIIIIIIIIIIIIIII
IIIII
IIIIIII!
IIIIIIIIIIIIII
IIII
IIIIIIIIIIIIIIIIIIIIII
OO
OO
OO
O
¢~n
e
270
99
99
99
99
99
99
99
99
99
99
99
99
99
99
99
99
99
99
99
99
99
9O
99
99
99
99
99
99
99
99
99
99
99
99
99
99
99
99
99
99
99
99
99
99
99
99
99
99
99
99
99
99
99
99
Q9
99
99
99
99
99
99
99
99
99
99
99
99
99
99
99
99
99
99
99
99
99
99
99
99
99
99
99
99
99
99
99
99
99
99
99
99
99
99
99
99
99
99
99
99
99
99
9¢
99
99
99
99
99
99
99
99
99
99
99
99
99
99
99
98
gg
gg
gg
g8
gg
99
99
99
99
99
99
99
99
99
99
99
99
99
99
99
99
99
99
99
99
99
99
99
99
99
99
99
99
99
99
99
99
99
99
99
99
99
99
99
99
99
9
'99
99
99
99
99
99
99
99
99
99
99
99
99
99
99
99
99
99
99
99
99
99
99
99
.9
9~
99
99
89
89
99
99
99
99
99
99
99
99
99
99
99
99
99
99
99
99
99
99
99
99
99
99
99
99
99
99
99
99
99
99
99
99
99
99
99
99
99
99
99
99
99
99
9M
99
99
99
99
99
99
99
99
99
99
99
99
99
99
99
R9
99
99
99
99
99
99
99
99
99
99
99
99
99
99
99
99
99
99
99
99
99
99
99
99
99
99
99
99
99
99
99
99
99
99
99
99
99
99
99
99
99
9
ui9
99
99
99
99
99
99
99
99
99
99
99
99
99
99
99
99
99
99
99
S9
99
99
99
99
99
99
99
99
99
99
99
99
99
99
99
99
99
99
99
99
99
99
99
99
99
99
99
99
99
99
99
99
99
99
99
N9
99
99
99
99
99
99
99
99
99
99
99
99
99
9g
gg
gg
gg
g°g
gg
°°
JE
99
99
99
99
99
99
99
99
99
99
99
99
99
99
99
99
99
99
89
99
gS
Ex
99
99
99
99
99
99
99
99
99
99
99
99
99
99
99
99
99
99
99
99
99
NL-0
99
99
99
99
99
99
99
99
99
99
99
99
99
91
1N
99
99
99
99
99
99
99
99
99
99
g9
99
99
8g
gg
gg
gg
g§
§g
°S
°g
3ce
ne
eo
ne
¤¤
¤¤
oo
e¤
eco
en
ao
ne
ccace
ea
nö
öö
öé
öé
éö
N2W
99
99
99
99
99
9*
“3
99
99
99
99
99
99
99
99
99
99
99
99
°.
9U
E“
S:
2999999999999999999999999°S
°°gggg8gSgggg333
QW
99
99
99
99
99
99
99
99
99
99
99
99
99
99
99
99
99
99
99
99
99
E9
99
99
99
99
99
99
99
99
99
99
99
9nl
\ö9
99
99
99
99
99
99
99
99
99
99
99
99
99
99
99
99
99
99
99
9g
89
99
99
99
99
99
99
99
99
99
99
99
99
99
99
99
99
99
99
99
99
9I
.O
-E
EZg
999999999999999999999999999999999999999999I-1
rl9
99
99
99
99
99
99
99
99
99
99
99
9UU
EW
99
99
99
99
99
99
99
99
99
99
99
99
99
99
99
99
99
99
99
99
99
EE
99
99
99
99
99
99
99
99
99
99
99
99
99
99
99
99
99
99
99
99
99
luP
-9
99
99
99
99
99
99
99
99
99
99
99
99
99
99
s;
¤8SSSSSSSSSSSSSSSSSSS8SS8888°ggggggg§gggggg
99
99
99
99
99
99
99
99
Whb
NV-
99
99
99
99
99
99
99
99
99
99
99
99
99
'
Q¤
lll9
99
99
99
99
99
99
99
99
99
99
99
99
99
99
99
99
99
99
99
99
99
¢9
99
99
99
99
99
99
99
92u
6¤
¤¤
¤¤
¤¤
¤¤
¤¤
¤¤
¤¤
¤¤
¤¤
¤o
ae
ce
ce
oe
ee
öö
öö
éö
éö
öé
é.0
1M
99
99
99
99
99
92
E9
99
99
99
99
99
99
99
99
99
99
99
99
99
99
°°°°°°°°¤
¤8
¤¤
oa
oo
oo
coc¤
¤¤
¤¤
¤¤
¤¤
¤¤
caca
ccno
nco
eé
éé
éé
öö
öö
öI1
Q9
99
99
99
99
99
99
99
99
99
99
99
99
99
99
99
62
~22222222222222222222=s====¤=¤¤¤ää888888ä38
„„
....................‘!.?
‘Y‘!9
9°°°·9
9°°°°°°°¤
¤¤
I;su8
•-••¤!~
¤•-•¢
~•••\v~
•••-••~x~
t•t¤•~
c«~
••-•m
•n~
ar~
¤¤
·•¢••
h4
««
««
«u
u«
~~
m•$
mu
mm
u••»
'Ü:¤
:$$
3Ü
#¤
“=Ü
$$
271
QIA
QD
Qrt
#9
NH
·Q
#:2
QQH
NN
O~
¢Q
QM
r-1Q
#v-I
de
-••·••·•Q
QN
9N
•-lr-•Q
•-I\AQ
#•-lk
QN
NQ
QM
9N
\Axf3
N\\|\
QO
QO
QN
NQ
Gx?
•-••-GQ
Q
M~
7•·4
QN
#0
Q|~
•-•
Nl|\N
QY
~•·•
HQ
•··•9\A
M•-•M
sf•·-|~
$Q
Q¢
NQ
Y~
QL
A|*•·••·!
NQ
QO
QN
#•-Q
gv-I\A
g0
Ng
QM
MN
LA
Nd
hQ
HQ
QH
QM
O·I~
¤Y
~Q
~7
\A•·•0
$Q
Q9
ND
NQ
•¢
\Q•-•
•¤
•#
QH
QM
AQ
'Q
I•\3~
2O
IhI|\M
Q•-Ird
ßd
sfr-•M
•··•!~Q
N¤
I'Q
Qr•
v-lv
-••·•
•-A
AQ
QQQQQQQQQQQQQQQQQQQQQQQQQQQQQQQQQQQQQ
IAIA
MH
9M
N¢
H\
OQ
OQ
Qr-••-IQ
•4Q
•·1Q
•-IQ
QIA
QH
\Qg
¤•1
|~7
~|~
•·•#O
nQ
ÜH
QN
•·•\|\¤·1
||I~0
•'\O0
•·|Q
QN
NN
NN
NH
NM
QM
9|~
IA~
f$Q
•-•9$
N|~
#Y
~Y
~O
Q9
#lA
Y~
#!~
r•IA
9Q
NU
\|~N
9Q
NM
QM
NM
HM
NM
NN
UQ
QIl'I~
0\A
9~
!'|fI09
N\N
\sfN
\#|~
Nsf
Q•-•Q
N¢
|~#
H\9
¤H
IHI#
H\|~
~f#
•-•r~~
o~
«•v
~r~
•¢m
¤¤
¤~
¤¤
>¤
•~0
QO
OQ
sfr
-U
MM
NQ
BN
QA
NQ
QM
Q
QQQQQQQQQQQQQQQQQQQQQQQQQQQQ
N\#
|\II¢N
N!\N
|~N
|~ß
N\#
NQ
sf
Q9
9Q
#Q
r4Q
HI|\·s
1'Y
*Q
H\H
\QH
Nr4
QN
QN
NQ
HQ
QM
QH
HN
HQ
9N
#IlI9
¢•r\Q
W\~
§U
|ll°‘NrQ
NH
\l!l$Q
OQ
Q0
~m
•-•u~
0¤
t~~
v~
¤\¤
~«
••A¤
¤¤
I»r•~
Qr-\Q
NN
NN
¢M
MM
OQ
NN
Nd
t~lA
Q#
QM
Ln
¤•~
•-••~c»
·t¤~
0¤
m¤
0~
•~~
•¤•~
mH
\g:$
2'~
2$
~§
7~
~:L
¤f¢
•A|A
Y~
•-••-•«•~
~«
•«••n
$~
e~
•~¤
~•
272
.1•-
56
11
r·•eu
E5
2th
•···•-•
I-0)
1U
U•·•
rnS
EJ
H
'
EnnU
O
EC•·•.1
§'2UU
•§MI
rnE
uab-
‘2
.-U
-th
u.
unU-
>1U
ä6
I-2PI00
g9
U•
9il
10
66
66
66
66
66
66
66
66
06
6¤
Q¤
06
60
66
06
¤0
66
66
66
66
0c
~•6
66
66
66
¤¤
0¤
6¤
66
6¤
¤6
6¢
¤6
66
6¤
66
66
66
6¤
¤6
¤¤
6¤
6E
E6
66
66
66
60
¤6
66
66
,66
66
6Q
66
66
¤6
66
66
66
66
66
66
6Q
Q•-•
66
66
66
66
66
UQ
66
66
66
66
66
66
¤6
6¤
66
6¤
6¤
66
06
66
6¤
IB
QU
DU
GU
QO
UQ
UU
UQ
OO
UQ
OO
¤O
OQ
Q¢
UQ
¢0
D¤
QG
O0
¢0
0D
Oß
“H
¤6
60
66
66
6Q
6¤
Q6
66
6Q
66
¤6
66
¤¤
66
6¤
66
66
6¢
¤¤
Q¤
6¤
hI;
66
66
66
6¤
¤¤
66
6¤
¤6
Q6
66
UU
OQ
QU
UU
UQ
GQ
OQ
VI
N•-4
N•l\h
9•4
•!\N
6¤
\~§
N6
••N
NN
NN
••I~0
N•·
273

09
09
OQ
O¤
QO
Q¤
¤0
O¤
¤0
¤¤
¤¤
¤¤
¤¤
Q¤
Q¤
¤¤
¤Q
O¤
¤¤
¤Q
QO
Q¤
¤Q
¤Q
¤¤
¤¤
¤Q
¤Q
CO
G¤
¤¤
¤¤
¤0
0Q
¤Q
Q¤
Q¤
¢¤
¤Q
¤¤
¤Q
O¤
¤Q
MQ
Q6
Qu
¤¤
¤¤
¤¤
¢Q
¤O
¤¤
0¤
¤¤
Q¤
¤¤
Q¢
99
09
GQ
Q¤
¤¢
¢¤
¢¤
Q¢
¤¤
0¢
Q9
¢¤
0
IHN
QH
~¢
NM
¢lh
Q~
0¤
~§
MIh
¤G
HG
¤~
fQ~
0Q
MG
GO
Gm
M~
tsf~t~
•~0
~0
~0
v~u
m¤
f~t•t\•t\I~
nu
nu
um
gm
gcg
eo
274
APPENDIX D
Final Questionnai ra
275
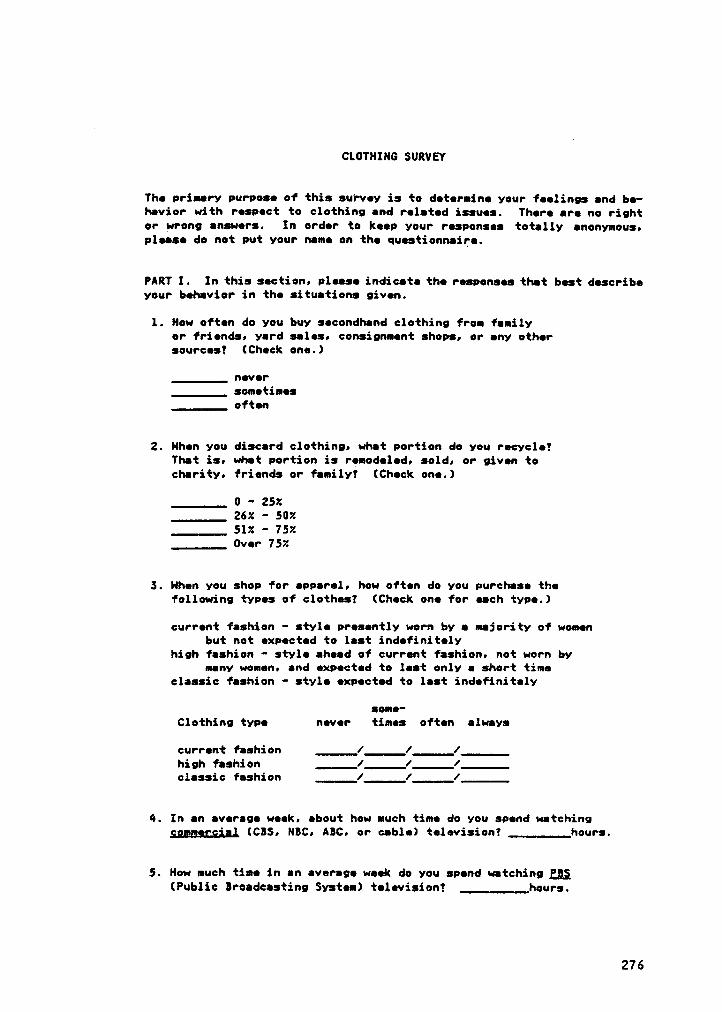
CLOTHING SURVEY
The primary purpose of this survey is to determine your feelings and be-havior with respect to clothing and related issues. There are no rightor wrong answers. In order to keep your responses totally anonymous,please do net put your name on the questionnaire.
PART I. In this section, please indicata the responses that best describeyour behavior in the situations given.
1. How often do you buy secondhand clothing from familyer friends, yard sales, consignment shops, or any othersources! (Check one.)
never_______ sometimes________ often
Z. Hhen you discard clothing, what portion do you recycle!That is, what portion is remodeled, sold, or given tocharity, friends or family! (Check one.)
0 - 25%26% · 50%51% - 75%Over 75%
3. Hhen you shop for apparel, how often do you purchase thefollowing types of clothes! (Check one for each type.)
current fashion · style presently worn by a majority of womenbut not expected to last indefinitely
high fashion - style ahead of current fashion, not worn bymany women, and expected to last only a short time
classic fashion · style expected to last indefinitely
some-Clothing type never times often always
currentfashionhighfashionclassic
fashion _____/_____/____/_l_
4. In an average week. about how much time do you spend watchingggmggggigl (CBS, NBC, ABC, or cable) television? _________hours.
5. How much time in an average week do you spend watching fg;(Public Broadcasting System) television! , hours.
276
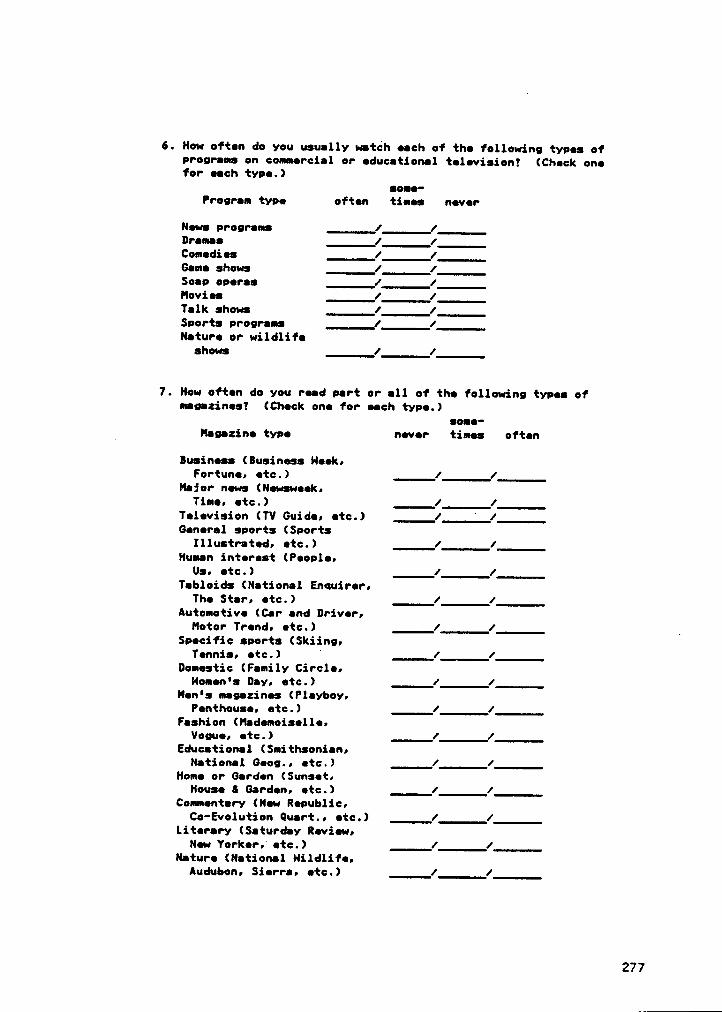
6. How often do you usually watch each of the following types ofprograms on commercial or educational television! (Ghock onefor each type.)
aome-Program typo often tieos never
Newe programs ______/____1
Dramas 1 1Comedies 1 1Game shows ___i_/_l1
Soap oporas ______1__l1
Novi » _i_1 1Talk shows _l_1 ‘
1Sports programs 1Nature or wildlifo
shows 1 1
7. How often do you road part or all of tho following types ofmagazinesi (Check one for each typo.)
soma-_ Magazine typo never times oftenBusiness (Business Hook,
Fortuno, etc.) ij 1Major news (Nowswook,
Timo, etc.) __?/_l____1;_iTelevision (TV Guido,etc.)Generalsports (Sports
Illustrated,etc.)Humaninterest (People,
Us, etc.) _____1_1_____
Tabloids (National Enquirer,The Star, etc.) ___1;__1_l
Automotive (Car and Driver,Motor Trend, etc.) ·Specific sports (Skiing,Tennis, etc.) ° ___/_i__/_l_
Domestic (Family Circle,Homen's Day, etc.) ____/____/;___
Mon': magazines (Playboy,Penthouse,
etc.)Fashion(Madomoiselle,Vogue,
etc.)Educational(Smithsonion,National Goog., etc.) _____/_,__i/__,i
Homo or Garden (Sunset,House 8 Garden, etc.) _l1___1____
Commentary (New Republic,Co-Evolution Quart.,
etc.)Literary(Saturday Review,Now Yorker;
etc.)Natura(National Hildlifo,Audubon, Sierra, etc.) ___1
1
277
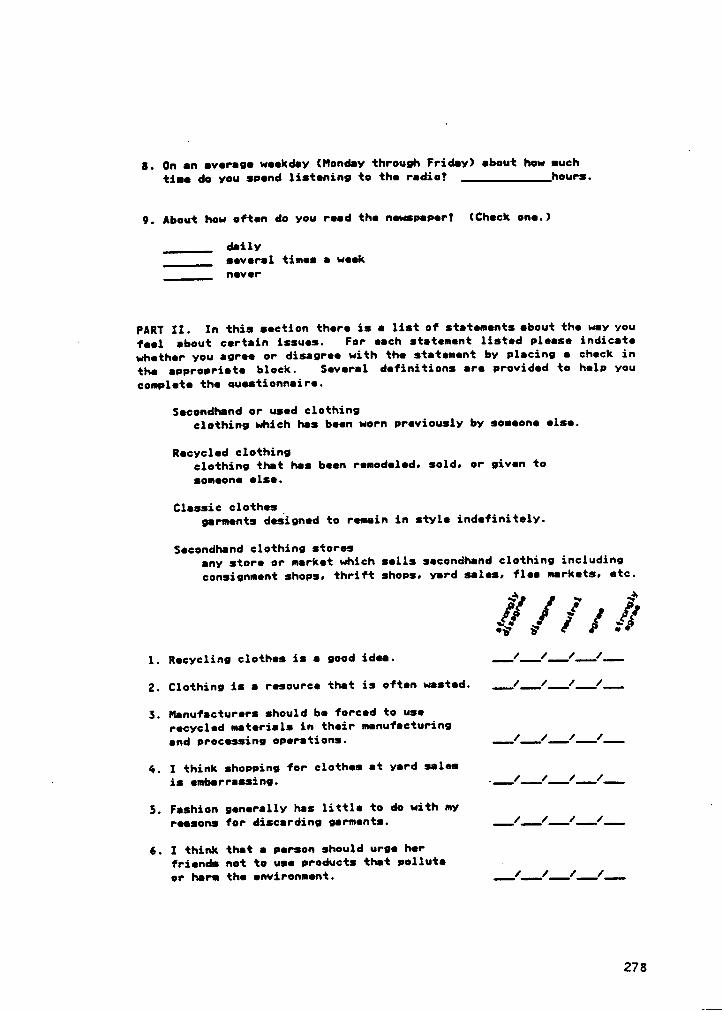
8. 0n an average weekday (Monday through Friday) about how muchI
time do you spend listening to the radio! ..„._„_ hours.
9. About how often do you read the newspaper! (Check one.)
dailyseveral times a weeknever
PART II. In this section there is a list of statements about the way you’
feel about certain issues. For each statement listed please indicate
whether you agree or disagree with the statement by placing a check in
the appropriate block. Several definitions are provided to help you
complete the questionnaire.
Secondhand or used clothingclothing which has been worn previously by someone else.
Recycled clothingclothing that has been remodeled. sold. or given to
someone else.
Classic clothes_garments designed to remain in style indefinitely.
Secondhand clothing storesany store or market which sells secondhand clothing including
consignment shops. thrift shops. yard sales. flea markets. etc.
A AN N N
\• . 1.•§•{ I
• 9
l. Recycling clothes is a good idee.___j___/___/___(___
2. Clothing is a resource that is often wasted. ___!___j___!___/___
3. Manufacturers should be forced to use
recycled materials in their manufacturing
and processing operations.__/__/_/__/_
4. I think shopping for clothes at yard sales
· is enbarrassing..__/__/__/__/__
5. Fashion generally has little to do with my ·
reesons for discardinggarments.6.
I think that e person should urge her
friends not to use products that polluta
or herm the environment.___/___/___/___/
278
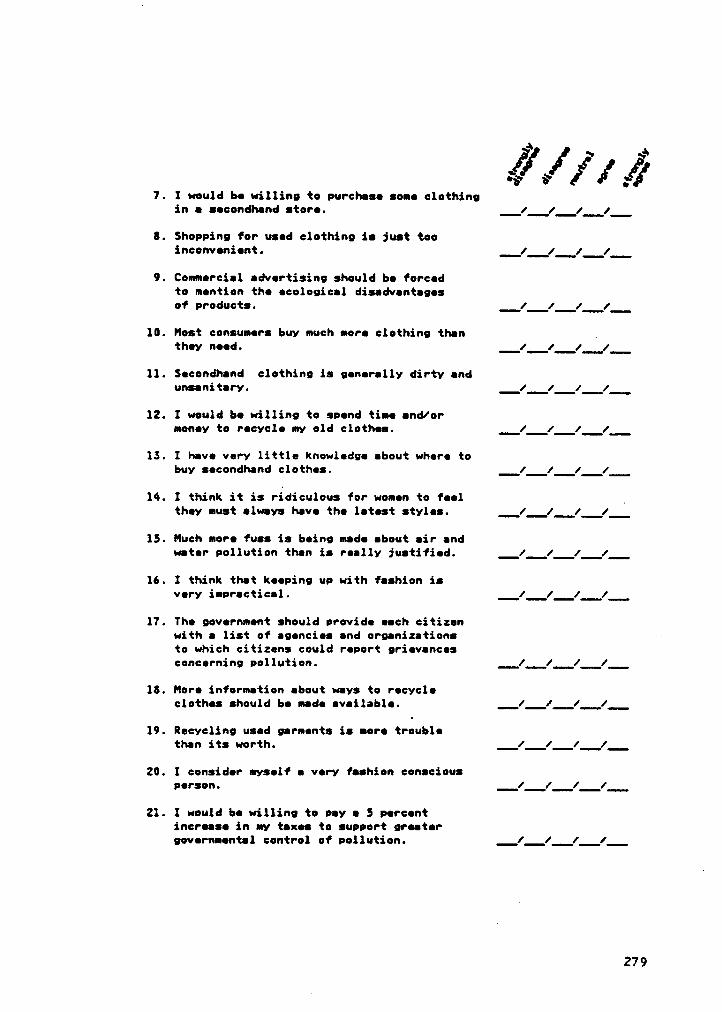
F /”
°"· ·~J gl Ä~s· > Ä :·
7. I would be willing to purchase some clothingin e secondhand store. 1 1 1 1
8. Shopping for used clothing is just tooinconvenient. 1 1;/ 1
9. Commercial advertising should be forcedto mention the ecological disadvantagesof products. 1 1;/ 1;
10. Most consumers buy much more clothing than _
they need. ;1 1 1 1;
11. Secondhand clothing is generally dirty endunsani tary. 1;/ 1;/
12. I would be willing to spend time and/ormoney to recycle my old clothes. 1 1;/ 1
13. I have very little knowledge about where tobuy secondhand clothes. 1;/;/ 1
16. I think it is ridiculous for women to feel _they must always have the latest styles. 1 1;/ 1
15. Much more fuss is being made about air andwater pollution then is really justified. ;1___1 1;/
16. I think that keeping up with fashion isvery imprectical. 1;/;/ 1
17. The government should provide each citizenwith a list of agencies and organizations Vto which citizens could report grievancesconcerning pollution. 1;/;/;/
18. More information about ways to recycleclothes should be made available. ;1 1 1 1
19. Recycling used garments is more troublethan its worth. 1 1;/ 1
20. I consider myself a very fashion consciousperson. 1 1 1 1
21. I would be willing to pay e 5 percentincrease in my taxes to support greatergovernmental control of pollution.
;/__1;11
279
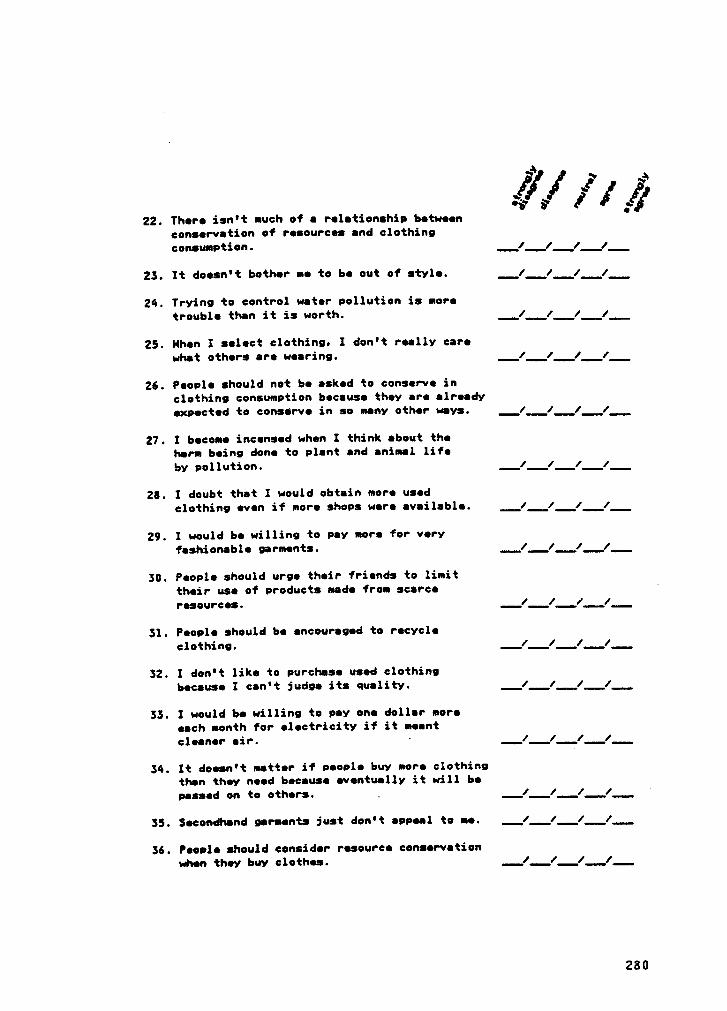
·§~ 4*
1€·’/1 1 1°€ Ü' ;•
22. There isn't much of a relationship betweenconservation of resources and clothinoconsumption. 1 1 1 1
25. It doesn't bother ae to be out of style. 1 1 1 1
24. Tryino to control water pollution is moretrouble than it is worth. 1 1 1 1
25. Hhen I select clothinm I don't really carewhat others are wearine. 1 1 1 1
26. People should not be asked to conserve inclothino consumption because they are already
expected to conserve in so many other ways. 1/ 1 1 1
27. l become incensed when I think about the
herm being done to plant and animal life
bv pollution.1__
28. I doubt that I would obtain more used
clothino even if more shops were available. __1_1__1___1_
29. I would be willing to pay more for veryfashioneble oarments.
1__1 1 1
30. People should uroe their friends to limit
their use of products made from scarce‘
resources.__1__1 1 1
Sl. People should be encouraged to recycleclothino.
__1__1 1 1
32. I don't like to purchase used clothino
because I cen't judoe its quality. 1__1 1 1
33. I would be willing to pay one dollar moreeach month for electricity if it meent
cleaner air. ·__1__1 1 1
34. It doesn't matter if people buy more clothino
then they need because eventually it will bepassed on to others. _ _1_1___1 1
35. Secondhand oarments just don't appeal to me. $1 1 1 1
36. People should consider resource conservationwhen they buy clothes.
___1___1__1 1
280
PART III. The following questions are asked to provide some backgroundinformation which will be used in statistical analysis.
l. Narital status (Check one).
____married and living with spouse___ other ‘
2. Highest level of education you have conpleted (Checkone):
____grade school or less ____ completed college_____some high school some graduate_l completed high school worksome college
__graduate degree
3. Age (Check one): '
_lless than 25 years _ 45 · 54 years_25 · 34 years l_
55 · 64 years____35 · 44 years _l
65 and older
4. Racial identification (Check one):
__Black °Hhite;_Other
‘
5. Political preference (Check one):
__ conservative___ liberal____ middle of the road
6. Total annual income of your household (Please include here allincome received by anyone in your household) (Check one):
less than 010.000 ___$40.001 - 050.000
010.001 - 020.000 ____ 050.001 · 060.000020.001 - $30. 000 __ 060.001 and over_; 030.001 · 040.000
281
7. List tha organization: or clubs to which you balono and yourlaval of participation in aach.
laval of participationKchack
on•for aach org.)
nonbar activaconnunity only aombar
profassional
- social
acoloiical
THANK YOU FOR YOUR HELP!
282
APPENDIX E
Frequency Tables
283
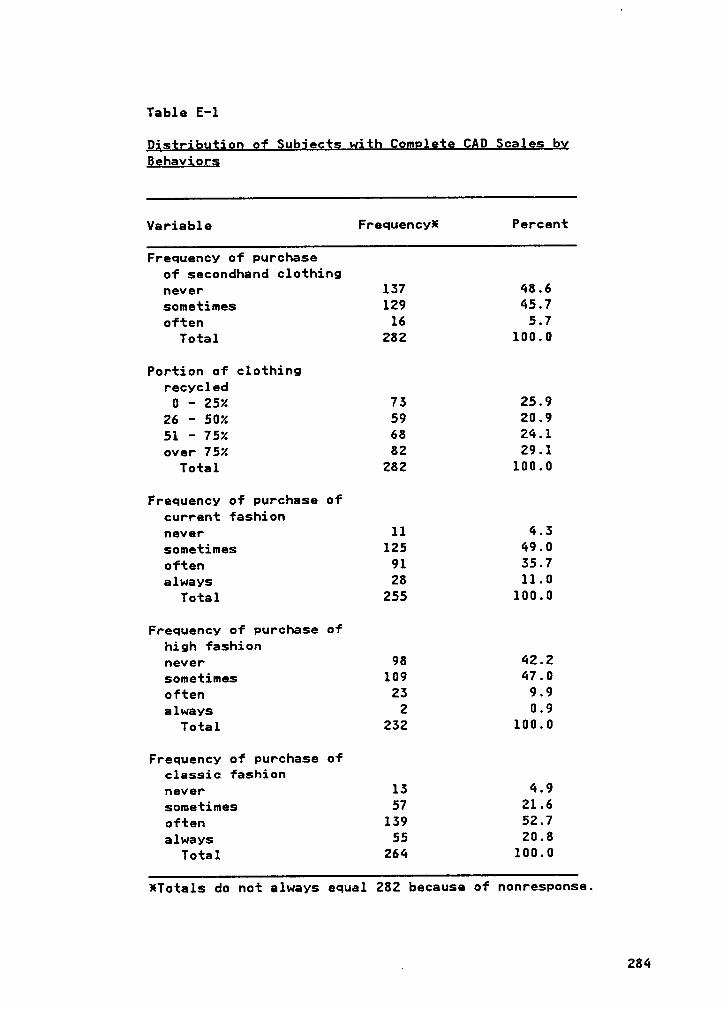
Table E—l
Disggibutiog of §ubjegt; with Qggglejg QAD Scglgs byBghavigrs
Variable Frequency! Percent
Frequency of purchaseof secondhand clothingnever 157 48.6sometimes 129 45.7often 16 5.7
Total 282 100.0
Portion of clothingrecycled
0 — 25% 75 25.926 - 50% 59 20.951 - 75% 68 24.1over 75% 82 29.1
Total 282 100.0
Frequency of purchase ofcurrent fashionnever 11 4.5sometimes 125 49.0often 91 55.7always 28 11.0
Total 255 100.0
Frequency of purchase ofhigh fashionnever 98 42.2sometimes 109 47.0often 25 9.9always 2 0.9
Total 252 100.0
Frequency of purchase ofclassic fashionnever 15 4.9sometimes 57 21.6often 159 52.7always 55 20.8
Total 264 100.0
!Totals do not always equal 282 because of nonresponse.
. 284
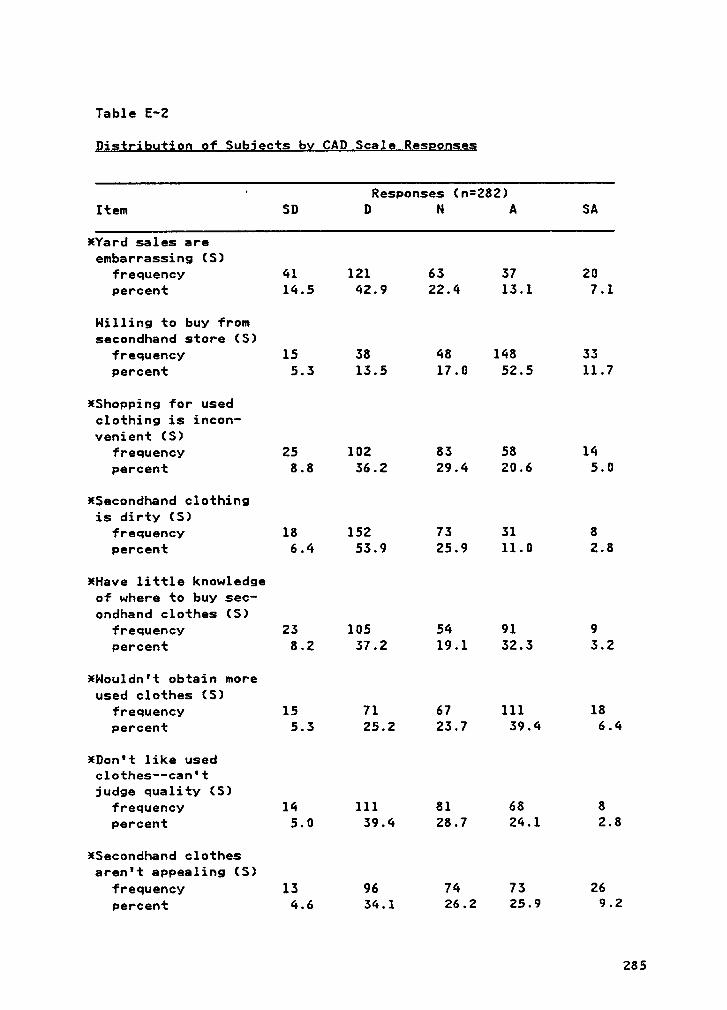
T
Table E—2
Qisiribution gf Subjgci; by CAD Scaie Resgonseg
‘Responses (n=282)
Item SD D N A SA
¥Yard sales areembarrassing (S)
frequency 41 121 63 37 20percent 14.5 42.9 22.4 13.1 7.1
Nilling to buy fromsecondhand store (S)
frequency 15 38 48 148 33percent 5.3 13.5 17.0 52.5 11.7
¥Shopping for usedclothing is incon-venient (S)
frequency 25 102 83 58 14percent 8.8 36.2 29.4 20.6 5.0
¥Secondhand clothingis dirty (S)
frequency 18 152 73 31 8
percent 6.4 53.9 25.9 11.0 2.8
¥Have little knowledgeof where to buy sec·ondhand clothes (S)
frequency 23 105 54 91 9
percent 8.2 37.2 19.1 32.3 3.2
xNouldn't obtain moreused clothes (S)
frequency 15 71 67 111 18
percent 5.3 25.2 23.7 39.4 6.4
¥Don't like usedclothes--can't
judge quality (S)
frequency 14 111 81 68 8
percent 5.0 39.4 28.7 24.1 2.8
!Secondhand clothesaren't appealing (S)
frequency 13 96 74 73 26
percent 4.6 34.1 26.2 25.9 9.2
285
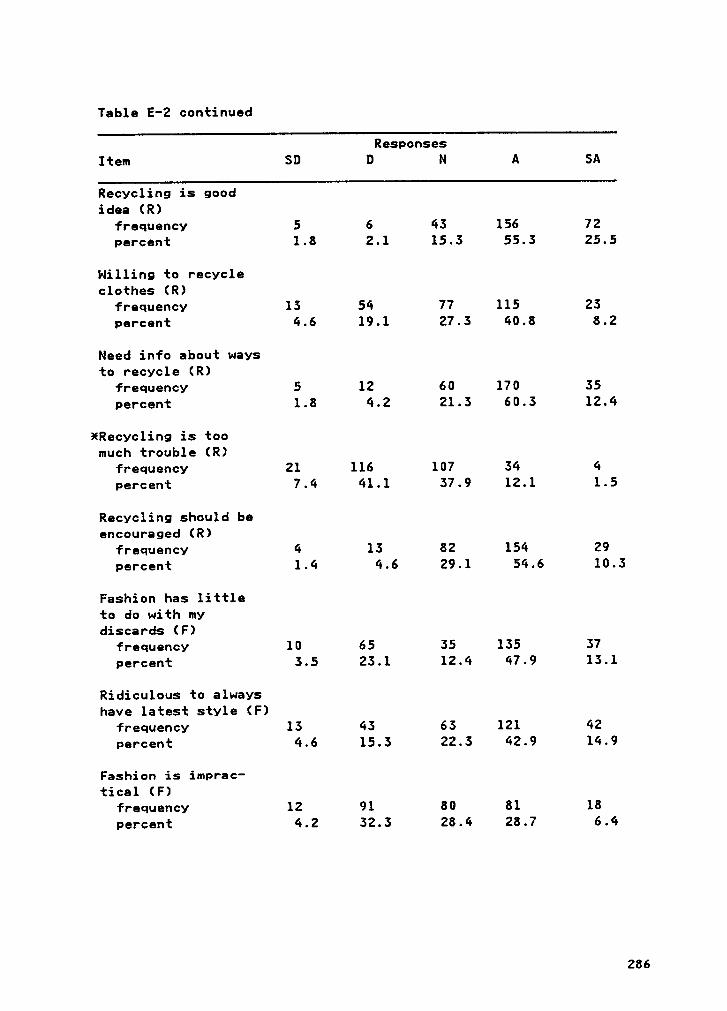
Table E-2 continued
Responses
Item SD D N A SA
Recycling is goodidea (R)
frequency 5 6 43 156 72
percent 1.8 2.1 15.3 55.3 25.5
Nilling to recycleclothes (R)
frequency 13 54 77 115 23
percent 4.6 19.1 27.3 40.8 8.2
Need info about ways
to recycle (R)
frequency 5 12 60 170 35
percent 1.8 4.2 21.3 60.3 12.4
¥Recyc1ing is toomuch trouble (R)
frequency 21 116 107 34 4
percent 7.4 41.1 37.9 12.1 1.5
Recycling should beencouraged (R)
frequency 4 13 82 154 29
percent 1.4 4.6 29.1 54.6 10.3
Fashion has littleto do with mydiscards (F)
frequency 10 65 35 135 37
percent 3.5 23.1 12.4 47.9 13.1
Ridiculous to alwayshave latest style (F)
frequency 13 43 63 121 42
percent 4.6 15.3 22.3 42.9 14.9
Fashi on is imprac·
tical (F)
frequency 12 91 80 81 18
percent 4.2 32.3 28.4 28.7 6.4
286
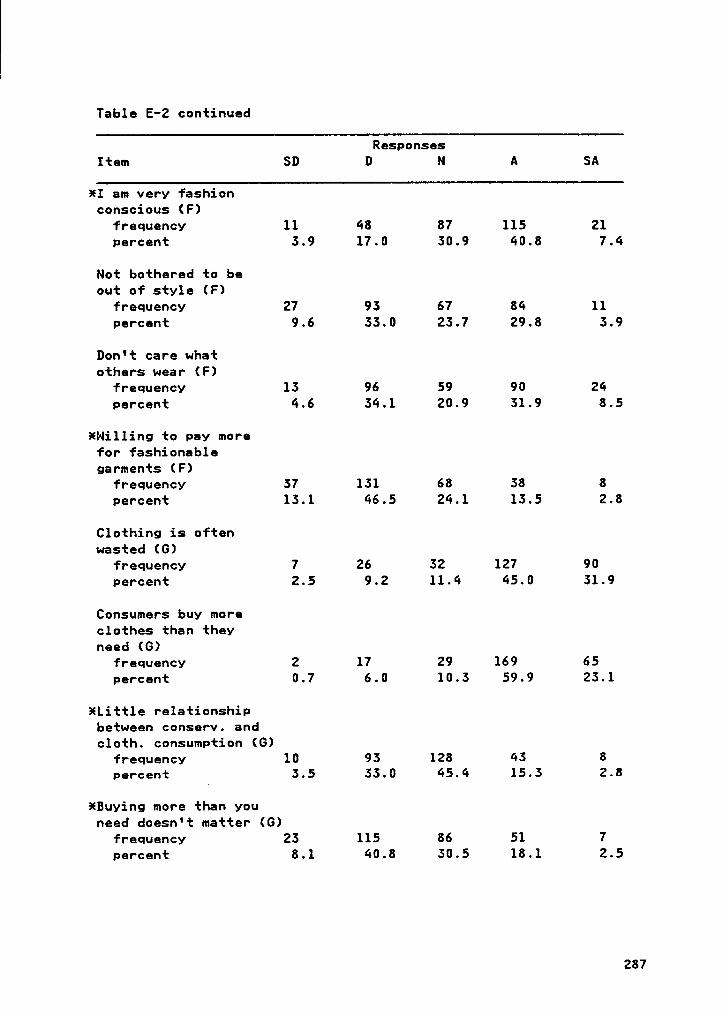
Table E-2 continued
ResponsesItem SD D N A SA
*1 am very fashionconscious (F)
frequency 11 48 87 115 21percent 3.9 17.0 30.9 40.8 7.4
Not bothered to beout of style (F)
frequency 27 93 67 84 11percent 9.6 33.0 23.7 29.8 3.9
Don't care whatothers wear (F)
frequency 13 96 59 90 24percent 4.6 34.1 20.9 31.9 8.5
*Ni1ling to pay morefor fashionablegarments (F)
frequency 37 131 68 38 8
percent 13.1 46.5 24.1 13.5 2.8
Clothing is oftenwasted (G)
frequency 7 26 32 127 90
percent 2.5 9.2 11.4 45.0 31.9
Consumers buy moreclothes than theyneed (G)
frequency 2 17 29 169 65
percent 0.7 6.0 10.3 59.9 23.1
*Litt1e relationshipbetween conserv. andcloth. consumption (G)
frequency 10 93 128 43 8
percent 3.5 33.0 45.4 15.3 2.8
*Buying more than you
need doesn't matter (G)
frequency 23 115 86 51 7
percent 8.1 40.8 30.5 18.1 2.5
287
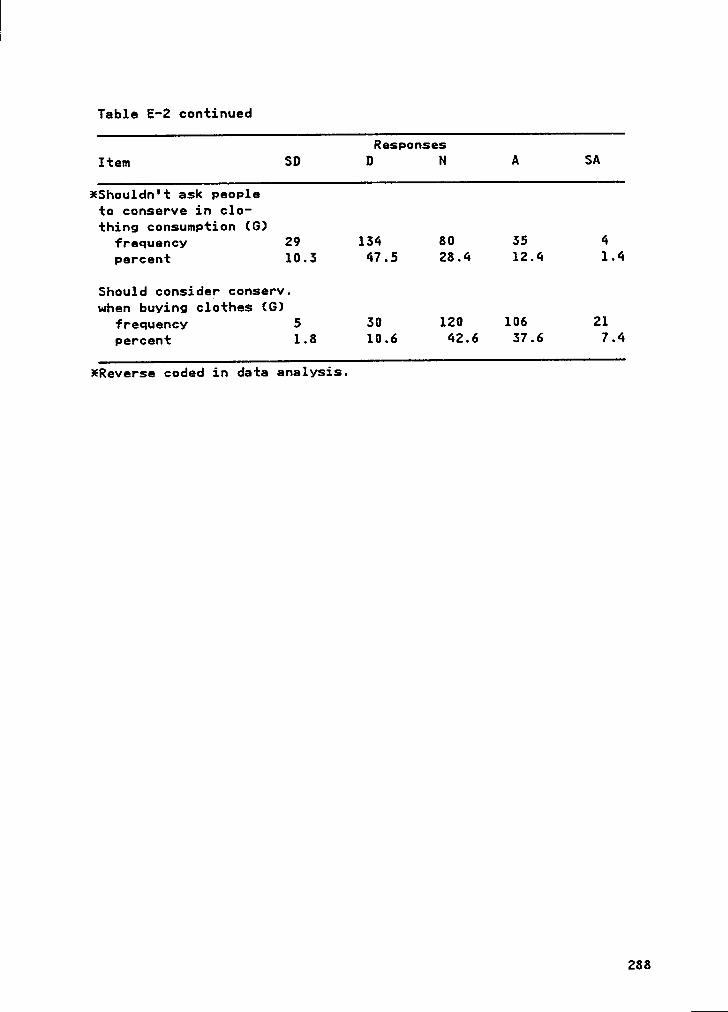
T
Table E·2 continued
Responses
Item SD D N A SA
¥Shouldn't ask peopleto conserve in clo-thing consumption (G)
frequency 29 134 80 35 4
percent 10.3 47.5 28.4 12.4 1.4
Should consider conserv.when buying clothes (G)
frequency 5 30 120 106 21
percent 1.8 10.6 42.6 37.6 7.4
xReverse coded in data analysis.
288
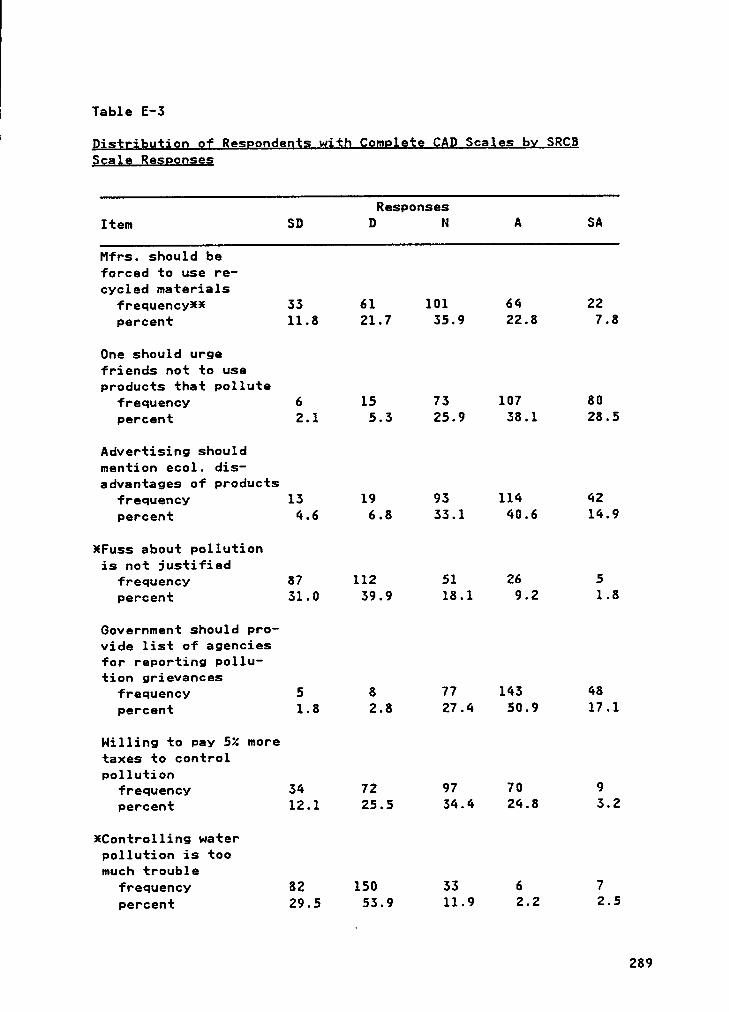
Table E-3
Qistgibution of Resgondegj; with Qgmglgje CAD Scale; by SßCB
T Sgalg ßeggonses
ResponsesItem SD D N A SA
Mfrs. should beforced to use re-cycled materials
frequency** 33 61 101 64 22
percent 11.8 21.7 35.9 22.8 7.8
One should urgefriends not to useproducts that pollute
frequency 6 15 73 107 80
percent 2.1 5.3 25.9 38.1 28.5
Advertising shouldmention ecol. dis-advantages of products
frequency 13 19 93 114 42
percent 4.6 6.8 33.1 40.6 14.9
§Fuss about pollutionis not justified
frequency 87 112 51 26 5
percent 31.0 39.9 18.1 9.2 1.8
Government should pro-
vide list of agenciesfor reporting pollu-tion grievances
frequency 5 8 77 143 48
percent 1.8 2.8 27.4 50.9 17.1
Nilling to pay 5% moretaxes to controlpollution
frequency 34 72 97 70 9
percent 12.1 25.5 34.4 24.8 3.2
§Contro11ing waterpollution is toomuch trouble
frequency 82 150 33 6 7
percent 29.5 53.9 11.9 2.2 2.5
289
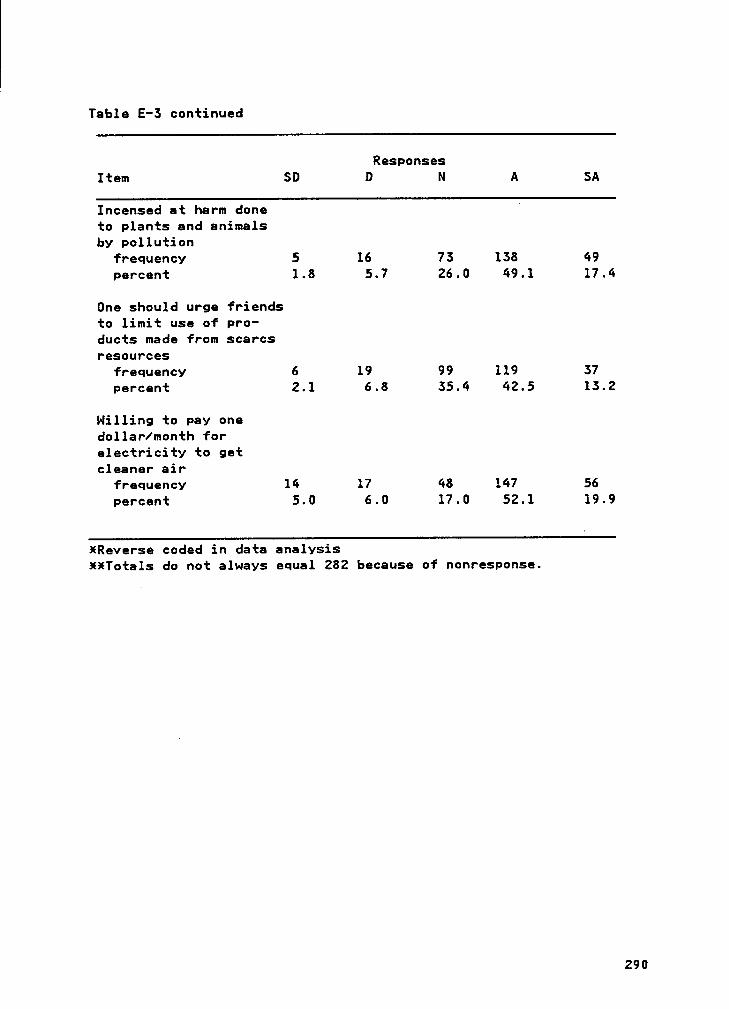
Table E-3 continued
TResponsesItem SD D N A SA
Incensed at harm done”
to plants and animalsby pollution
frequency 5 16 73 138 49
percent 1.8 5.7 26.0 49.1 17.4
One should urge friendsto limit use of pro-
ducts made from scarcsresources
frequency 6 19 99 119 37
percent 2.1 6.8 35.4 42.5 13.2
Nilling to pay onedollar/month forelectricity to getcleaner air
frequency 14 17 48 147 56
percent 5.0 6.0 17.0 52.1 19.9
§Reverse coded in data analysis§¥Tota1s do not always equal 282 because of nonresponse.
290
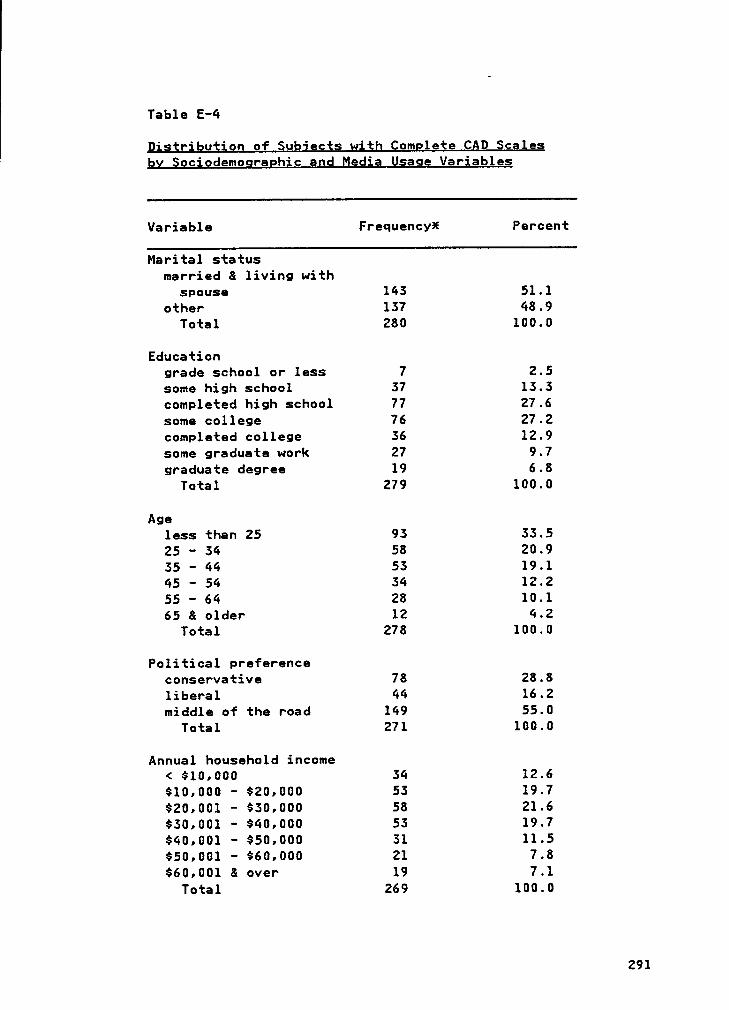
Table E-4
Qistribujigg gf Subject; with Qomglege CAQ §ca1g§by Sociodemograghic and Mgdia Usage Varjables
Variable Frequency! Percent
Marital statusmarried & living with
spouse 143 51.1other 137 48.9
Total 280 100.0
Educationgrade school or less 7 2.5some high school 37 13.3completed high school 77 27.6some college 76 27.2
· completed college 36 12.9some graduate work 27 9.7graduate degree 19 6.8
Total 279 100.0
Ageless than 25 93 33.525 — 34 58 20.935 — 44 53 19.145 — 54 34 12.255 - 64 28 10.165 & older 12 4.2
Total 278 100.0
Political preferenceconservative 78 28.8liberal 44 16.2middle of the road 149 55.0
Total 271 100.0
Annual household income< $10,000 34 12.6$10,000 - $20,000 53 19.7$20,001 - $30,000 58 21.6
‘ $30,001 — $40,000 53 19.7$40,001 - $50,000 31 11.5$50,001 - $60,000 21 7.8$60,001 & over 19 7.1
Total 269 100.0
291
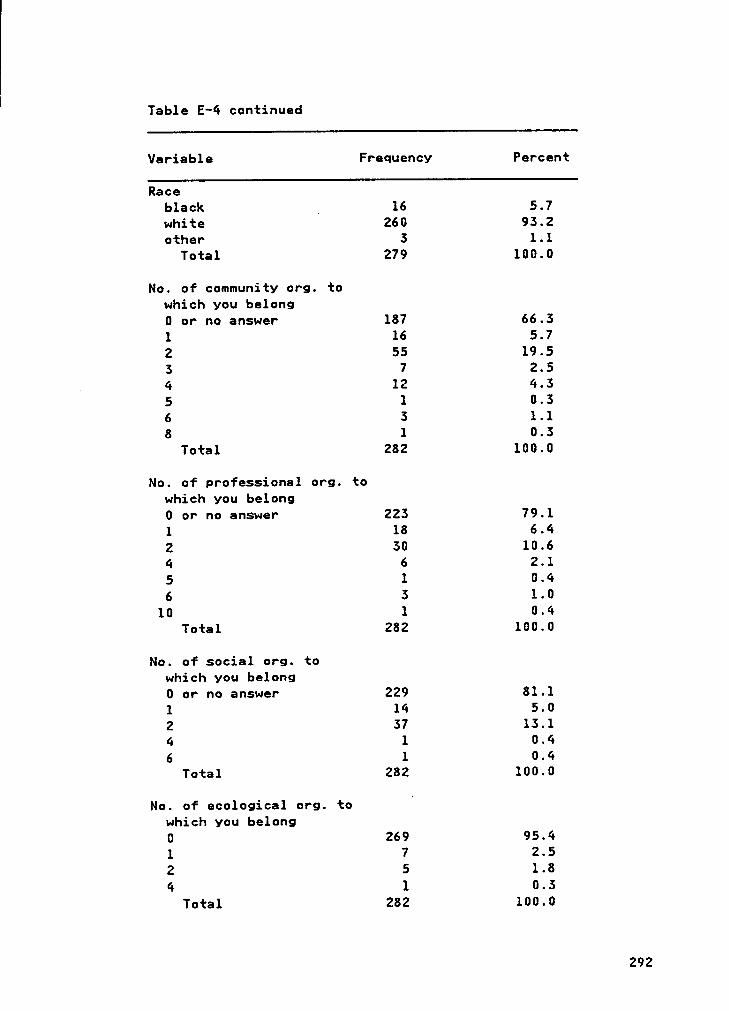
ITable E—4 continuedVariable Frequency Percent
Raceblack _ 16 5.7white 260 93.2other 3 1.1
Total 279 100.0
No. of community org. towhich you belong0 or no answer 187 66.31 16 5.72 55 19.53 7 2.5
. 4 12 4.35 1 0.36 3 1.18 1 0.3
Total 282 100.0
No. of professional org. towhich you belong0 or no answer 223 79.11 18 6.42 30 10.64 6 2.15 1 0.46 3 1.0
10 1 0.4Total 282 100.0
No. of social org. towhich you belong0 or no answer 229 81.1l 14 5.0
2 37 13.14 1 0.46 1 0.4
Total 282 100.0
No. of ecological org. towhich you belong0 269 95.41 7 2.52 5 1.84 1 0.3
Total 282 100.0
292
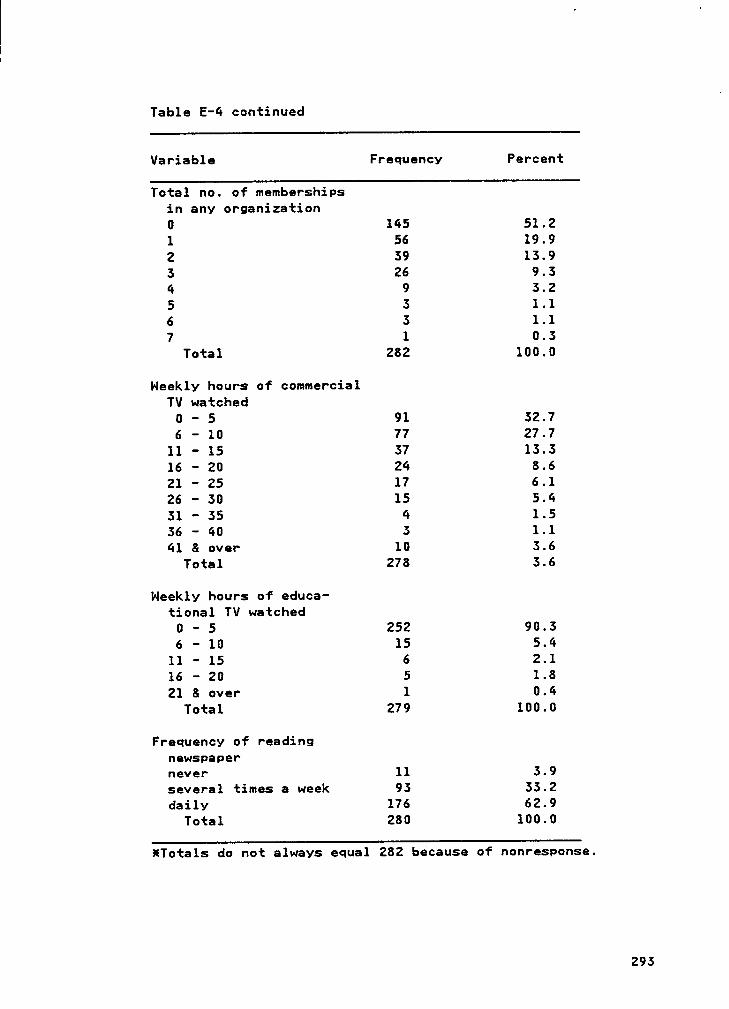
Table E-4 continued
Variable Frequency Percent
Total no. of membershipsin any organization0 145 51.21 56 19.92 39 13.93 26 9.34 9 3.25 3 1.16 3 1.17 1 0.3
Total 282 100.0
Weekly hours of commercialTV watched
0 · 5 91 32.76 - 10 77 27.7
11 · 15 37 13.316 — 20 24 8.621 - 25 17 6.126 · 30 15 5.431 · 35 4 1.536 · 40 3 1.141 & over 10 3.6
Total 278 3.6
Weekly hours of educa-tional TV watched
0 - 5 252 90.36 - 10 15 5.4
11 · 15 6 2.116 — 20 5 1.821 & over 1 0.4
Total 279 100.0
Frequency of readingnewspapernever ll 3.9several times a week 93 33.2dailv 176 62.9
Total 280 100.0
XTota1s do not always equal 282 because of nonresponse.
293
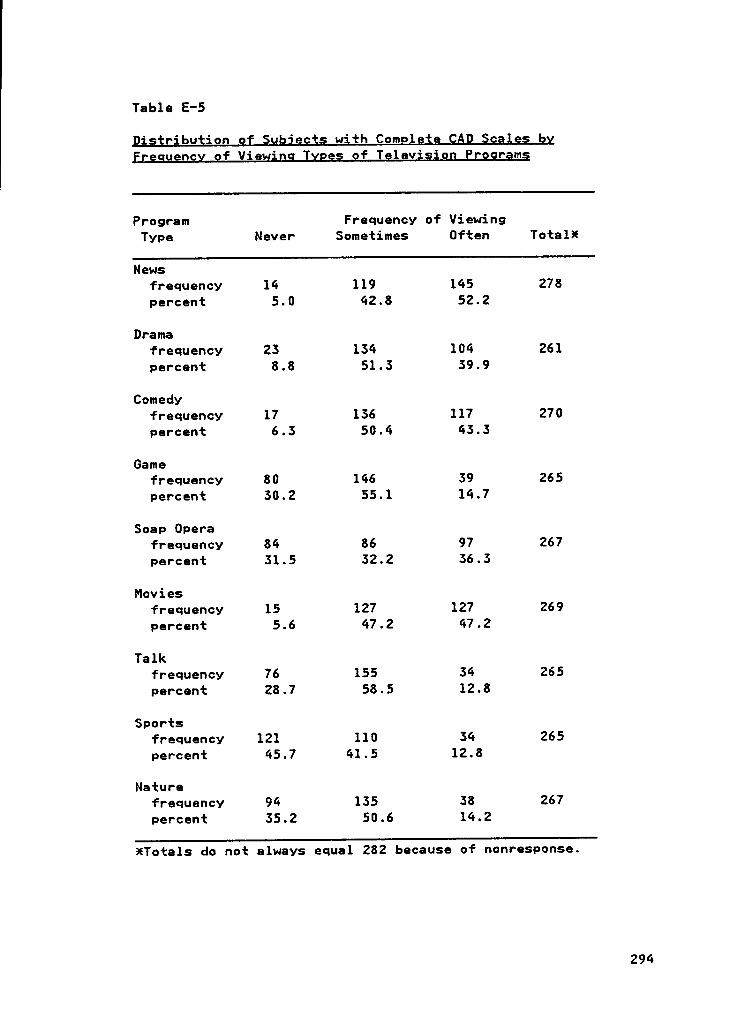
Table E-5
Qigtribuiion of Subjects with Comgleie CAD Sgaies gg
Ereguency gf Viewing Tyges of lgievigiog Egograms
1Program Frequency of ViewingType Never Sometimes Often Total!
Newsfrequency 14 119 145 278
percent 5.0 42.8 52.2
Dramafrequency 23 134 104 261
percent 8.8 51.3 39.9
Comedyfrequency 17 136 117 270
percent 6.3 50.4 43.3
Gamefrequency 80 146 39 265
percent 30.2 55.1 14.7
Soap 0perafrequency 84 86 97 267
percent 31.5 32.2 36.3
Moviesfrequency 15 127 127 269
percent 5.6 47.2 47.2
Talkfrequency 76 155 34 265
percent 28.7 58.5 12.8
Sportsfrequency 121 110 34 265
percent 45.7 41.5 12.8
Naturefrequency 94 135 38 267
percent 35.2 50.6 14.2
!Tota1s do not always equal 282 because of nonresponse.
294
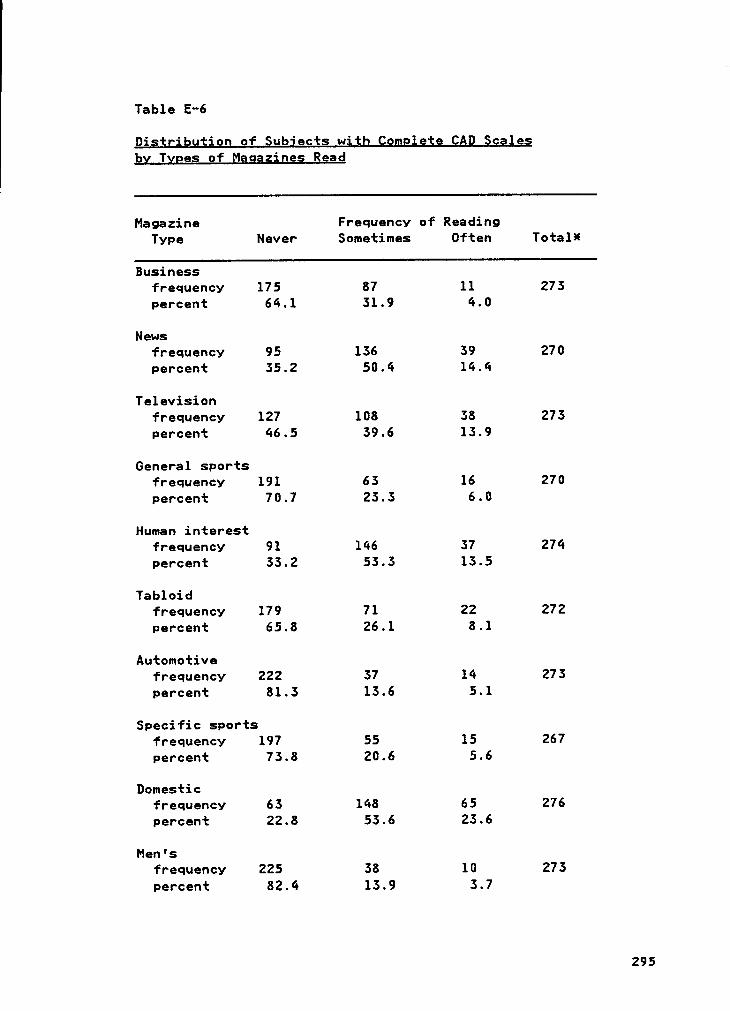
Table E·6
Distribution of Subjecgs with Complete CAD §cg1es
by Types of Magazine; Read
Magazine Frequency of ReadingType Never Sometimes Often Total!
Businessfrequency 175 87 11 273
percent 64.1 31.9 4.0
Newsfrequency 95 136 39 270
percent 35.2 50.4 14.4
Televisionfrequency 127 108 38 273
percent 46.5 39.6 13.9
General sportsfrequency 191 63 16 270
percent 70.7 23.3 6.0
Human interestfrequency 91 146 37 274
percent 33.2 53.3 13.5
Tabloidfrequency 179 71 22 272
percent 65.8 26.1 8.1
Automotivefrequency 222 37 14 273
percent 81.3 13.6 5.1
Specific sportsfrequency 197 55 15 267
percent 73.8 20.6 5.6
Domesticfrequency 63 148 65 276
percent 22.8 53.6 23.6
Men'sfrequency 225 38 10 273
percent 82.4 13.9 3.7
295
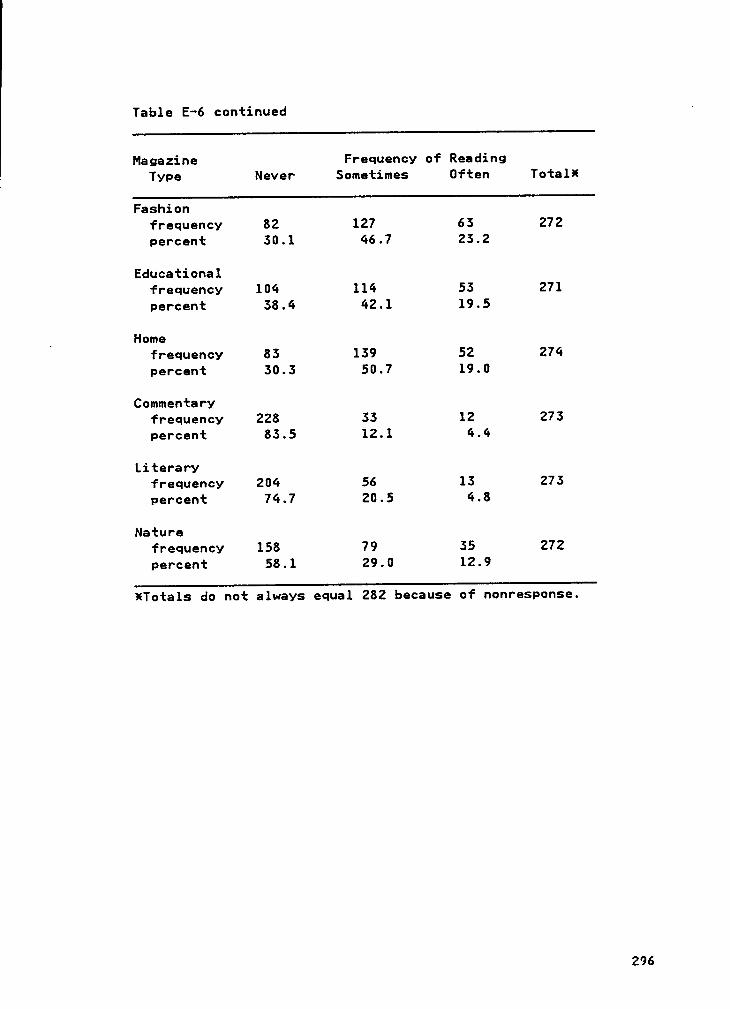
Table E—6 continued
Magazine Frequency of ReadingType Never Sometimes Often Total!
1 Fashionfrequency 82 127 65 272
percent 50.1 46.7 25.2
Educationalfrequency 104 114 55 271
percent 58.4 42.1 19.5
V Homefrequency 85 159 52 274
percent 50.5 50.7 19.0
Commentaryfrequency 228 55 12 275
percent 85.5 12.1 4.4
Literaryfrequency 204 56 15 275
percent 74.7 20.5 4.8
Naturefrequency 158 79 55 272
percent 58.1 29.0 12.9
!Totals do not always equal 282 because of nonresponse.
296