Embed Size (px)
Citation preview
Sustainable Parks Program From Idea to Implementation
County of Los Angeles Department Of Parks and Recreation
Section Goal 2012-2013
Sustainable Parks Program From Idea to Implementation
By Perla Arquieta ASLA PLA

Page 2

Page 3
Sustainability “Meeting the needs of the present without compromising the ability of future generations to meet their own needs.” - UN commission, 1983 headed by Norwegian Prime Minister Brundtland

Page 4
Page 5
Table of Contents Introduction ...................................................................................................................................................................... 7
Project Goals and Purpose ........................................................................................................................................ 8 The County of Los Angeles’s Energy and Environmental Programs .......................................................................... 8
Energy and Water Efficiency Program .................................................................................................................... 9 The Environmental Stewardship Program .............................................................................................................. 9 Public Outreach and Education Program ............................................................................................................... 9 Sustainable Design ............................................................................................................................................... 10
Chapter 1 - The Cost of Traditional Design and Construction ......................................................................................... 11 Electricity - Use ....................................................................................................................................................... 11 Water Use ............................................................................................................................................................... 14 Materials and Waste ............................................................................................................................................... 16 Stormwater Run-off ................................................................................................................................................ 17 Carbon Dioxide Emissions and Climate Change ...................................................................................................... 18 Conclusion ............................................................................................................................................................... 19
Chapter 2 - Economic Benefits of Sustainable Construction ........................................................................................... 20 Reduced Operating Costs ........................................................................................................................................ 20 Reduced Energy Costs ............................................................................................................................................. 20 Reduced Water Costs .............................................................................................................................................. 21 Reduced Maintenance Costs ................................................................................................................................... 21 Productivity Benefits ............................................................................................................................................... 21 Reduce Carbon Dioxide Emissions .......................................................................................................................... 22 Integrated Design Solutions .................................................................................................................................... 22
The Costs of Green Building ............................................................................................................................................ 23 New Construction ................................................................................................................................................... 23 Existing Buildings..................................................................................................................................................... 23 Landscapes .............................................................................................................................................................. 24 Conclusion ............................................................................................................................................................... 24
Chapter 3 – The Sustainable Parks Program ................................................................................................................... 25 The Sustainable Parks Program Goals ..................................................................................................................... 25 The Report Card ...................................................................................................................................................... 28
Chapter 4 - How to achieve the 10 Sustainable Parks Program Goals ............................................................................ 29 Goal 2 - Energy Conservation ................................................................................................................................. 29 Goal 3 - Switch to Renewable Energy Sources ........................................................................................................ 31 Goal 4 - Water Conservation ................................................................................................................................... 33 Goal 5 - Waste Management .................................................................................................................................. 34 Goal 6 - Sustainable Landscape Practices............................................................................................................... 35 Goal 7 - Purchasing Environmentally Preferred Products ....................................................................................... 36 Goal 8 - Reduce Stormwater Run-Off ..................................................................................................................... 37 Goal 10 - Reduce Heat Island effect ........................................................................................................................ 38 Goal 11 - Sustainable Building Practices ................................................................................................................. 39
Chapter 5 – Funding Sources .......................................................................................................................................... 41 Chapter 6- The Site Criteria, Site Selection for the “Model Green Park” ........................................................................ 48 Appendices ..................................................................................................................................................................... 49
The County Energy and Environmental Policy ........................................................................................................ 49 The County’s Recognized Green Programs ............................................................................................................. 53
LEED for Government Buildings ........................................................................................................................... 53 What is LEED......................................................................................................................................................... 53 The Sustainable Sites Initiative ............................................................................................................................. 54 Energy Star ........................................................................................................................................................... 55 Energy Star for Local Government Program ......................................................................................................... 55 Demand-Side-Management (DSM) Programs ...................................................................................................... 56 Sub metering ........................................................................................................................................................ 56 Water Budget and Conservation Letter Sent to all Parks and Recreation Staff from John Wicker ...................... 57

Page 6

Page 7
Introduction When we think of our local parks, the image that comes to mind most likely includes community centers, gymnasiums, ball fields, playgrounds, turf, and trees. These parks offer great benefits to our communities such as exercise opportunities, active -passive recreation and a sense of urban relief, but they have limited value to the environment and, with time, degrade the local ecosystem1 through their high maintenance needs2. The design of a traditional park facility is not always beneficial to conserving and enhancing the natural environment. Roads and parking lots fragment habitats, water-loving turf covers most of the active and passive recreational areas and plant material is chosen for aesthetics rather than benefit to the natural habitat. While these considerations are significant, the high cost of ongoing operations and maintenance are even greater.3 This study is directed to County’s Department of Parks and Recreation’s (DPR)’s executive staff and is primarily intended to build a case for a “Sustainable Parks Program”. It is broken into six chapters, four of which highlight grounds for establishing this program the fifth provides funding sources and chapter six defines the site criteria for the site selection to build an actual “Model Green Park”. The program “Goals” and “Report Card” is intended as an example and not as a final product.
• Chapter 1 illustrates the current trend of rapidly increasing energy and water use and the rise in energy and water rates in terms of their impact on the environment as well as DPR’s operations and maintenance costs.
• Chapter 2 explains the cost benefits of sustainable design and construction in comparison to the
traditional. It also provides several case studies of the cost of incorporating sustainable design and construction into new and existing buildings and landscapes.
• Chapter 3 defines the “Sustainable Parks Program” Goals. This program is intended to give
momentum toward the education of staff on environmental conservation techniques. It provides clear and achievable goals and a tracking method “Report Card” to measure the success toward these goals.
• Chapter 4 recommends techniques and resources to “achieve the 10 Sustainable Parks Program
Goals”. • Chapter 5 provides a list of grants and “Funding Sources” for conservation and environmental
projects for local government agencies. Sustainability has been considered simply “the right thing to do” if the costs of the added sustainable measures are affordable. This view is quickly changing. More and more government agencies are finding that the same strategies used to protect the environment also cut the costs of operations and maintenance significantly making sustainability “good business”. Managing our parks sustainably means managing them in a way that maximizes our maintenance and operations savings and at the same time optimizes environmental, economic and social benefits. The County of Los Angeles Department of Parks and is responsible for the operations and maintenance of more than 144 facilities, including 70,156 acres of parks, lakes, trails, natural areas, and gardens; the
1 The Impact of Lawn Care Practices on Aquatic Ecosystems in Suburban Watersheds.
http://cfpub.epa.gov/ncer_abstracts/index.cfm/fuseaction/display.abstractDetail/abstract/797/report/F
2 People in the Landscape Andria Cimino 11-17-2003
3 The Excellent City Park System: What Makes it Great and How to Get There by Peter Harnik, ” The Trust for Public Land, 2003, p.21,
http://cloud.tpl.org/pubs/ccpe_excellentcityparks_2006.pdf
Page 8
Arboretum and Descanso Gardens, and the world’s largest public golf course system. These include 87 regional and local parks, 344 miles of horse and hiking trails, 19 golf courses and 31 public swimming pools. Out of this, we irrigate approximately 2800 acres and provide water and energy to 49 community buildings, 11 senior centers, 25 gymnasiums, 4 auditoriums and 31 pools and pool buildings. Embedding sustainability across our Department requires behavior change. Effective resource management through positive behavior change will bring with it reduced utility and resources costs resulting in financial savings. Environmental protection is a complex undertaking; nevertheless, sustainability is a commitment to social and environmental responsibility. The County of Los Angeles Parks and Recreation, as it exists today, can incorporate a “program” that encourage conservation efforts, environmentally sustainable maintenance practices that protect wildlife habitat and natural resources. We can provide leadership on the journey to an environmentally sustainable future by means of our park facilities as living examples.
Project Goals and Purpose To build a case for a “Sustainable Parks Program” this program identifies and encourages design and development practices, which will:
1. Provide a park environment rich in innovative, multi-disciplinary solutions to today's environmental issues with economic benefits and educational opportunities resulting in a practical, sustainable model for future projects. This will be accomplished through the integration of the educational resources, economic opportunities and sustainable building design principles.
2. Produce a comprehensive “methodology” unique to County of Los Angeles Parks identifying the many elements within the process of revitalizing an existing park to meet the Federal, State and County requirements.
3. Integrate the existing rating systems recognized by the Los Angeles County Board of Supervisors into one tool that can be utilized by our Agencies.
4. Create a site-specific park design and construction documents for a chosen park with the applied rating systems.
5. Find funding sources for the construction of a Model Sustainable Park. 6. Construct a Model Sustainable Park which;
• Uses green building techniques such as solar power, daylighting, natural ventilation, perimeter heating, regenerating and recycled construction materials, etc.
• Uses green site techniques such as water harvesting, smart irrigation systems, solar landscape lighting
• Employs best management practices to ensure healthy ecosystems, e.g. LID techniques • Uses native, non-invasive environmentally appropriate plant choices • Recycles waste products as much as possible • Educates the public about the value of natural resource stewardship • Enhances wildlife habitat, does not pollute • Promotes alternative forms of transportation • Promotes “Green Purchasing” • Has a strong sense of place and identity
Most importantly, the “Sustainable Parks Program” seeks to support the County of Los Angeles recognized and adopted Energy and Environmental Programs. The following text is a brief overview of the programs.
The County of Los Angeles’s Energy and Environmental Programs On January 16, 2007, the Board of Supervisors adopted a Countywide Policy (The Countywide Energy and Environmental Policy) instructing that all County departments to implement the County’s Energy and Environmental Programs for energy conservation and environmental stewardship. Under the Policy the Energy and Environmental Team was created to investigate and develop energy and environmental programs for implementation in County facilities and operations. The Team also provides

Page 9
Exhibit A
support to County departments for programs initiated by the Board, including those that impact constituents County-wide or in County unincorporated areas. It is led by ISD and includes representatives from County Counsel, Chief Executive Office, Public Works, Parks and Recreation, Sheriff's Department, Public Library, Health Services, Public Health, Community and Senior Services, Community Development Commission, Southern California Edison, Southern California Gas Company, and the City of Los Angeles Department of Water & Power. Working committees have been established within each program area listed below and meet as necessary to accomplish the goals of the Policy.4 These programs are:
• Energy and Water Efficiency • Environmental Stewardship • Public Outreach and Education • Sustainable Design
Energy and Water Efficiency Program The program areas focus on reducing the County's consumption of energy and water to achieve the goal of reducing energy consumption in County facilities by 20% by the year 2015. Exhibit A shows our current progress.
The Environmental Stewardship Program This Program will maximize the potential to "green" basic County operations. This program includes such areas as:
• Environmentally Responsible Purchasing Standards • Recycling Programs • Environmentally Friendly Products
Public Outreach and Education Program The Public Outreach and Education Program utilizes the County’s communication and outreach channels to share utility industry information, facilitate implementation of assistance programs, and spread information and education on energy conservation practices through the region. The Team, in coordination with the region's utility companies, will implement a program that provides County residents with energy related information to include:
• Energy and Water Conservation practices, • Utility rates and rate changes, • Rotating power outage information, • Emergency power outage information,
4 The Countywide Energy and Environmental Policyhttp://countypolicy.co.la.ca.us/addendum12190644.pdf

Page 10
• Energy efficiency incentives
Sustainable Design Building design and construction have a tremendous impact on the natural environment, our economy, and the health and productivity of occupants. The energy used to heat, cool and light buildings, as well as the energy used in their construction, generates more greenhouse emissions than either transportation or industry. Buildings contribute anywhere from more than a third to nearly half of all greenhouse gas emissions in the United States. The County of Los Angeles’ Green Building Program went into effect starting January 1, 2009. The intent of this Program is to promote sustainable development, improve air and water quality, conserve energy, water and raw materials, and reduce carbon emissions into the environment. The County recognizes the need to conserve scarce resources as the County continues to build and grow. The program is designed to take into consideration different climates and geographies across the County as all types of new development in the unincorporated areas of the County are required to build green.5
• The County of Los Angeles Green Building Program, this program is supported by three County ordinances:
o Green Building Ordinance: requires use of materials and techniques that improve energy efficiency of at least 15% above Title 24 requirements and that create less air and emission pollution.
• As of February 15, 2007, The County imposed requirements on its own buildings all new county buildings 10,000 square feet and up must achieve Leadership in Energy and Environmental Design (LEED) Silver certification.
o Low Impact Development Ordinance: requires special design features that allow infiltration of stormwater on-site to reduce water pollution and recharge local water supplies.
o Drought Tolerant Landscaping Ordinance : requires landscaping with specific plant species with low to very low water needs, and limits high-maintenance plants and water-soaking turf6.
(For more information on the County of Los Angeles’s Energy and Environmental Programs refer to page 49 in the Appendices).
5 The County of los Angeles Green Building Technical Manual 2010 http://planning.lacounty.gov/assets/upl/project/green_buildings-technical-manual-
feb2010.pdf
6 The County’s Department of Parks and Recreation is exempt from the Drought Tolerant Landscaping Ordinance. However, the Department must comply with The
County’s Model Water Efficient Landscape Ordinance.
Page 11
Chapter 1 - The Cost of Traditional Design and Construction
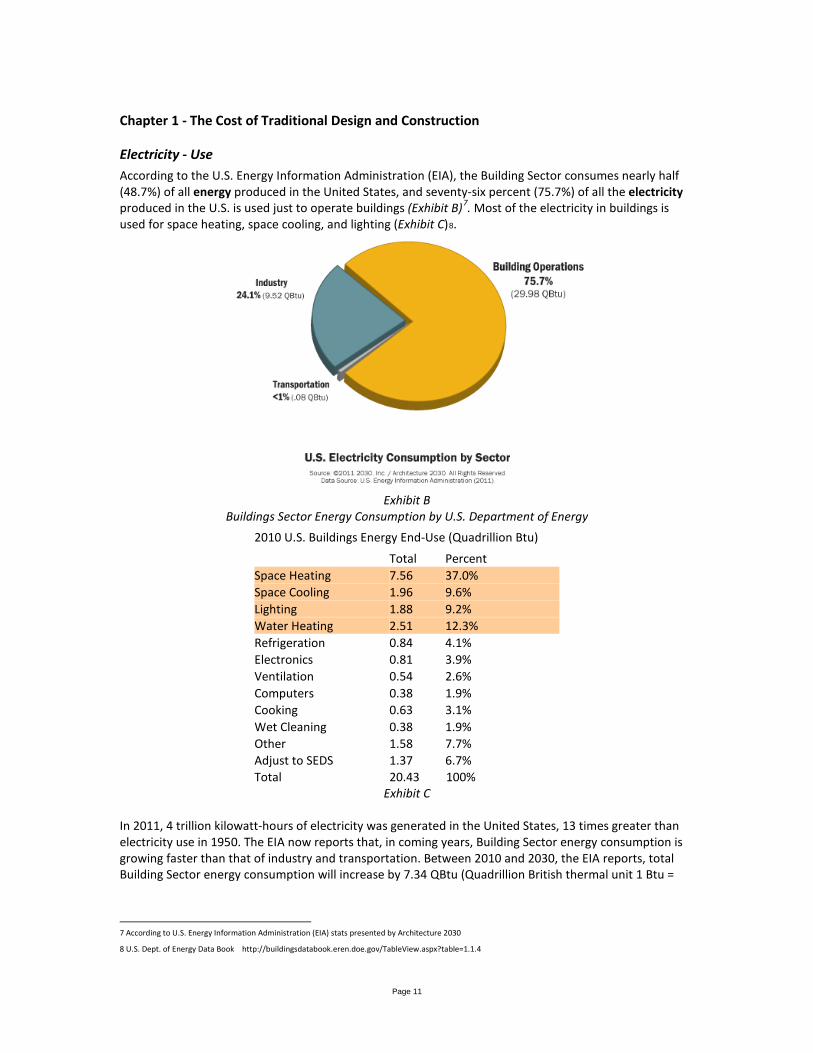
Electricity - Use According to the U.S. Energy Information Administration (EIA), the Building Sector consumes nearly half (48.7%) of all energy produced in the United States, and seventy-six percent (75.7%) of all the electricity produced in the U.S. is used just to operate buildings (Exhibit B)7. Most of the electricity in buildings is used for space heating, space cooling, and lighting (Exhibit C)8.
Exhibit B
Buildings Sector Energy Consumption by U.S. Department of Energy 2010 U.S. Buildings Energy End-Use (Quadrillion Btu)
Total Percent Space Heating 7.56 37.0% Space Cooling 1.96 9.6% Lighting 1.88 9.2% Water Heating 2.51 12.3% Refrigeration 0.84 4.1% Electronics 0.81 3.9% Ventilation 0.54 2.6% Computers 0.38 1.9% Cooking 0.63 3.1% Wet Cleaning 0.38 1.9% Other 1.58 7.7% Adjust to SEDS 1.37 6.7% Total 20.43 100%
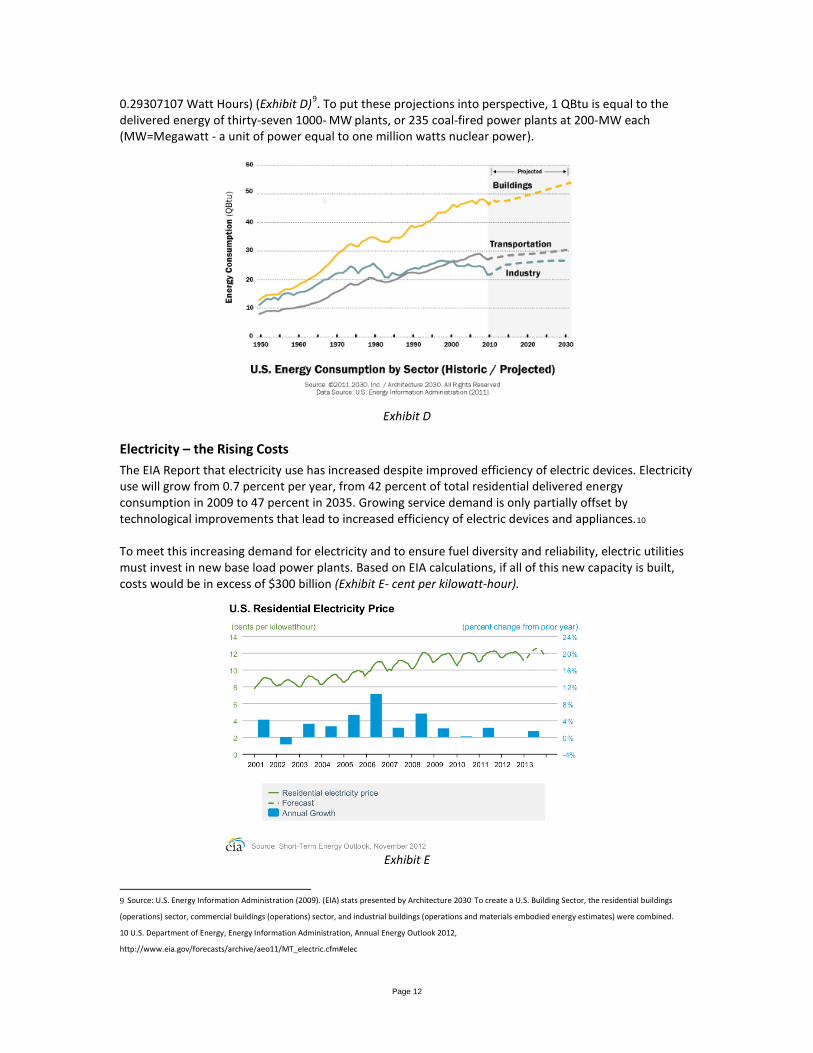
Exhibit C In 2011, 4 trillion kilowatt-hours of electricity was generated in the United States, 13 times greater than electricity use in 1950. The EIA now reports that, in coming years, Building Sector energy consumption is growing faster than that of industry and transportation. Between 2010 and 2030, the EIA reports, total Building Sector energy consumption will increase by 7.34 QBtu (Quadrillion British thermal unit 1 Btu =
7 According to U.S. Energy Information Administration (EIA) stats presented by Architecture 2030
8 U.S. Dept. of Energy Data Book http://buildingsdatabook.eren.doe.gov/TableView.aspx?table=1.1.4
Page 12
0.29307107 Watt Hours) (Exhibit D)9. To put these projections into perspective, 1 QBtu is equal to the delivered energy of thirty-seven 1000- MW plants, or 235 coal-fired power plants at 200-MW each (MW=Megawatt - a unit of power equal to one million watts nuclear power).
Exhibit D
Electricity – the Rising Costs The EIA Report that electricity use has increased despite improved efficiency of electric devices. Electricity use will grow from 0.7 percent per year, from 42 percent of total residential delivered energy consumption in 2009 to 47 percent in 2035. Growing service demand is only partially offset by technological improvements that lead to increased efficiency of electric devices and appliances.10 To meet this increasing demand for electricity and to ensure fuel diversity and reliability, electric utilities must invest in new base load power plants. Based on EIA calculations, if all of this new capacity is built, costs would be in excess of $300 billion (Exhibit E- cent per kilowatt-hour).
Exhibit E
9 Source: U.S. Energy Information Administration (2009). (EIA) stats presented by Architecture 2030 To create a U.S. Building Sector, the residential buildings
(operations) sector, commercial buildings (operations) sector, and industrial buildings (operations and materials embodied energy estimates) were combined. 10 U.S. Department of Energy, Energy Information Administration, Annual Energy Outlook 2012,
http://www.eia.gov/forecasts/archive/aeo11/MT_electric.cfm#elec

Page 13
U.S. Electricity Retail Prices Most industry experts predict that average electricity prices throughout the U.S. will increase significantly over the next decade. Californians in particular should expect to see high price increases, averaging 5-7% per year, given stronger environmental legislation and historical underinvestment. Consequently, businesses should proactively manage future energy costs. In order to better manage these costs, managers must first understand the key indicators and drivers for California electricity rates. These include: • Historical trends point to steep rate increases over time - In California commercial rates have increased 6-8% annually since 2000 and approximately 7.5% in 2008. If the current trends continue, prices are projected to increase by similar amounts in the next decade. • Infrastructure - Over the next 10 years, over $7 billion dollars will need to be injected into the grid to upgrade existing infrastructure and accommodate new capacity and Smart Grid requirements. This will result in 2-2.5% annual rate increases over the next 10 years. • Fuel costs - Fuel costs (e.g., natural gas) are projected to double by 2020, which translates to a 1.5-2% annual increase in average retail electricity prices. • Climate change - The approval of 33% Renewable Portfolio Standard in California will likely increase average electricity rates 2-2.5% annually until 2020. 11 The two largest providers of electricity to the County of Los Angeles are the Los Angeles Department of Water and Power and Southern California Electric. Both utility service providers have proposed a hike in rates for the next two years. See County Service Map (Exhibit F).
Exhibit F.
11 Bloom Energy Report http://c0688662.cdn.cloudfiles.rackspacecloud.com/downloads_pdf_White_Paper_Calif_Elec_Prices.pdf

Page 14
Department of Water and Power (DWP) Electricity Rate Increase On September 12, 2012, The Los Angeles Board of Water and Power Commissioners approved a two-year rate hike that would increase DWP's system average rate by 11 percent, or 1.4 cents per kilowatt-hour, over the next two years. The rate increase would allow the DWP to comply with legal mandates for reduced energy consumption, increased renewable energy use and the elimination of ocean water use at coastal power plants. DPW estimates the cost will be $2.3 billion dollars over the next 17 years.12 Southern California Edison (SCE) Rate Increase Pending Southern California Edison customers are likely to see an increase in electricity rates later in 2012, pending a decision from the California Public Utilities Commission. SCE is proposing a 7.55 percent increase in 2012, a 1.2 percent increase on top of that in 2013 and a 4.5 percent increase on top of that in 2014. Altogether, the proposed increases total $1.5 billion of additional annual revenue for SCE in three years.13 Currently, DPR’s average rate is approximately $0.16 per kilowatt-hour. The total amount DPR paid for electricity for fiscal year 2011/2012 was $4,922,694.92; the proposed price increases will significantly raise our costs in operations.
Water Use Less than 3% of the world’s water is fresh – the rest is seawater and undrinkable, of this 3% over 2.5% is frozen, locked up in Antarctica, the Arctic and glaciers, and not available to man. Thus humanity must rely on this 0.5% for all of man’s and ecosystem’s fresh water needs making clean, fresh, drinking water most valuable commodity in the world today. To top this off freshwater supplies are decreasing, while the world’s population is rapidly growing. The United Nations estimates that the world population, approximately 6.5 billion in 2006, will grow to 9.4 billion by 2050. As the scarcity of safe, clean, freshwater grows so does its value.14 In 2005 an estimated 410 billion gallons of water was use in the United States per day.15 Between 1950 and 2000, the U.S. population nearly doubled. However, in that same period, public demand for water more than tripled! Each American now uses an average of 100 gallons of water each day—enough to fill 1,600 drinking glasses.16
Water - Rising Costs In 2011, the price of water in 30 U.S. metropolitan areas increased an average of 9.4 percent. Prices are increasing because operational inputs such as chemicals, energy, labor, and water itself are getting more expensive. Every trend examined has shown that its likely water costs will increase more than the rate of inflation.17 Pollution-control regulations for coal-fired power plants will, within the next few years, raise energy prices and water prices in Southern California. More stringent water quality regulations—such as tighter controls on arsenic in drinking water—also come with added costs. The arsenic rule, which the Environmental Protection Agency finalized in 2006, forced many utilities to double rates. In addition to higher operating costs, decrepit infrastructure is forcing cities and counties to invest in costly capital-replacement projects.
12 Los Angeles Dept. of Water and Power Connections September 2012
13 Southern California Edison Notice http://www.sce.com/AboutSCE/DocumentLibrary/Customer%20Connection/customer-connection-notices.htm
14 Facts and Trend Water by The United Nations Educational, Scientific and Cultural Organizations
http://www.unwater.org/downloads/Water_facts_and_trends.pdf
15 U.S. Geological Survey 2005 http://pubs.usgs.gov/circ/1344/
16 US EPA report http://www.epa.gov/greenbuilding/pubs/gbstats.pdf
17 The Price of Water 2011: Prices Rise an Average of 9 Percent in Major U.S. Cities By Brett Walton
Circle of Blue

Page 15
The County of Los Angeles has no local source of drinking water; all supplies must be imported from Northern California through Metropolitan Water District of Southern California (MWD), one of the world’s largest water wholesalers. MWD provides water to the local purveyors serving almost 19 million customers and covering 5,200 square miles in Los Angeles, Orange, Riverside, San Bernardino, San Diego, and Ventura Counties providing 40% to 60% of the water within its service area. (See Exhibit G for service area map). There are 43 retail water purveyors supplying water to our parks. The policies adopted by the various water agencies will also significantly affect the retail prices charged to DPR. Some agencies use water prices to fully recover the costs of acquiring the water and delivering supplies, whereas others use a combination of water prices and local property taxes. MWD Rate Increases for 2013-2014 April 10, 2012 - Disregarding public concern over rapidly rising water rates, the Metropolitan Water District of Southern California's board of directors approved raising its “average” water rates by 5 percent in 2013 and another 5 percent in 2014. The rates MWD’s board approved today increase its Tier 1 Treated water rate by 6.7 percent in 2013 and another 5.1 percent in 2014.18
Exhibit G Golden State Water Company Rate Increases for 2013-2014 On July 21, 2011 the Golden State Water Company (GSWC), filed a plan with the California Public Utilities Commission (CPUC) to establish rates for 2013, 2014, and 2015 for its Region 2, which includes the Southwest Los Angeles County. These proposed rate increases are 9.9 percent for 2013, 3 percent for 2014, and 3.5 percent for 2015.19
18 Standards and Poor Rating Service http://www.mwdh2o.com/mwdh2o/pages/finance/PDFs/S&P_Report.pdf
19 Golden State Water company Fact Sheet http://www.gswater.com/csa_homepages/documents/RegionIICentralBasinEastGRCCustomerFactSheet-
August242011.pdf

Page 16
Currently, DPR’s average rate is approximately $2.50 per hundred cubic feet of water. The total amount DPR paid for water for fiscal year 2011/2012 was $6,767,010.16; these proposed price increases coupled with the energy price increases will considerably raise operations costs for DPR. Water Budget and Conservation Letter Sent to All Parks and Recreation Staff from John Wicker The Department is experiencing a dramatic increase in water usage at various facilities. For the first four months of this fiscal year, (July - October 2012) the Department paid $3.9 million of water bills, which is 60 percent of the water budget. If this alarming trend continues, the Department may have a $2 million deficit in the utility budget by the end of the fiscal year. Below are some recommendations that staff should follow immediately to reduce our water consumption:
• Reduce your facility's programmed water use by at least 10 percent (i.e. reduce scheduled water cycles on controllers by 10 percent).
• Test irrigation systems and look for leaks or broken sprinkler heads. • For facilities with smart controllers, ensure that controllers are working properly and repairs are
handled immediately. In addition, do not manually operate the controllers. • For sites without smart controllers, check weather patterns so that watering can be adjusted
accordingly. • Review and analyze utility consumption and landscape layouts for new and or future projects to
ensure that the most cost effective landscapes are installed. • Plant water-friendly trees and plants. • Improve on water management practices that reduce the use of water
(To read complete letter refer to Appendices on page 57).
Materials and Waste LA County has the largest and most complex solid waste system in the nation. In 2011, the County of LA generated approximately 19.3 million tons of disposals. Translating it into per capita generation rate, each person in the County generated 10.69 lbs of solid waste each day. Between 2000 and 2010, the total population of Los Angeles County increased by 299,275 and reached 9,818,605; it is expected to grow to 13 million by 2020. Yard trimmings make up the largest single component of the County’s municipal waste. It is estimated that grass clippings make up about half of all yard trimmings over the course of the year. University studies have shown that the average residential lawn generates 300 to 400 pounds of grass clippings per 1000 square feet annually. This can be as much as eight tons per acre each year. In addition, significant quantities of water, fertilizer, and labor go into producing all those clippings. The major amount of the County’s 2800 acres of irrigated parks land is turf; this represents a potential of 48,787,200 pounds or 24,394 tons of grass clippings annually.
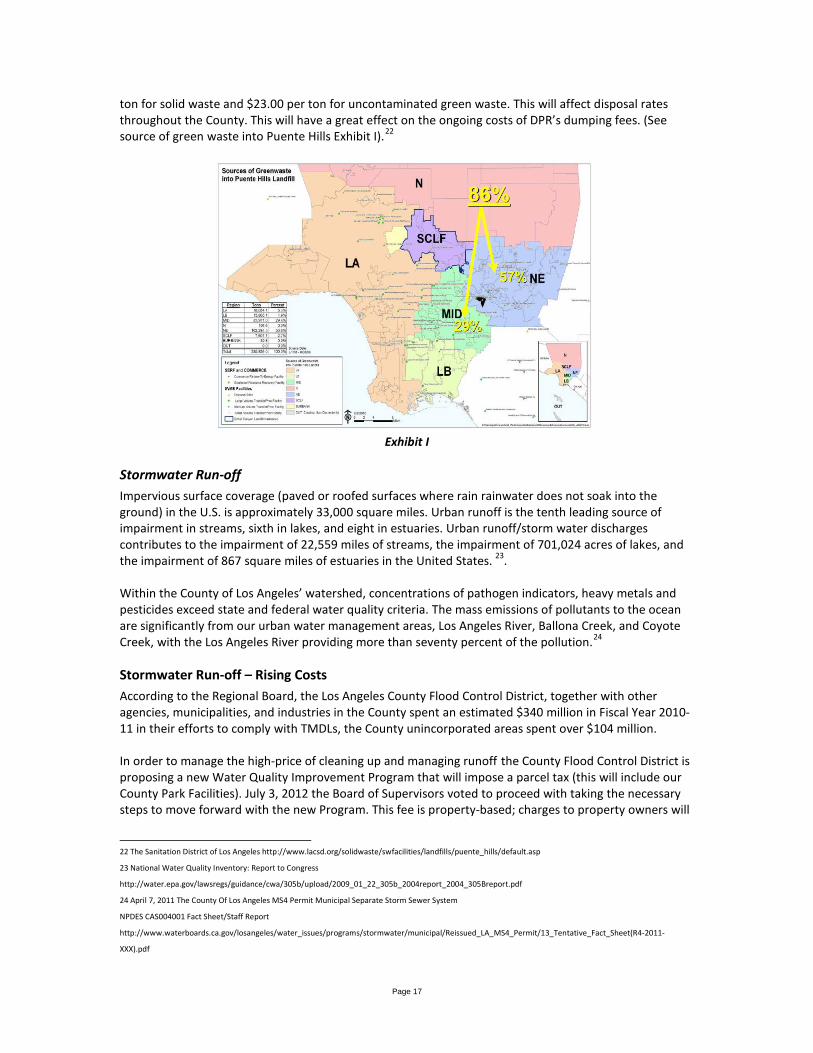
Materials and Waste - Rising Costs Puente Hills Landfill, the County’s largest, receiving close to a third of its solid waste and 46 percent of its green waste is set to close in October 31, 201320, its closure is sure to raise disposal costs. As a result, many private haulers are seeking to try and lock in contracts with current or lower prices over a longer period of time to avoid future rate hikes," The Los Angeles Sanitation Districts´ $450 million waste-by-rail system is expected to haul waste 250 miles away from Los Angeles to Mesquite Regional landfill once Puente Hills is closed. In anticipation of the closure and the more costly rail-haul, tipping fees have doubled over the past several years. These costs are expected to increase an additional 8 to 15 percent per year until they reach the amount required to operate the rail system. The estimated cost to ship trash by rail is $80 per ton, a 50% increase of cost in comparison to of local disposal21. In turn, other landfills will no longer have to maintain lower rates to compete with Puente Hills, which currently charges $35.00 per
20 A New Economy for All http://www.dontwastela.org/wp-content/uploads/2011/01/DWLA_Report_Finalweb.pdf
21 UCLA Zero Waste Plan http://today.ucla.edu/portal/ut/document/UCLA_Zero_Waste_Plan_Final.pdf
Page 17
ton for solid waste and $23.00 per ton for uncontaminated green waste. This will affect disposal rates throughout the County. This will have a great effect on the ongoing costs of DPR’s dumping fees. (See source of green waste into Puente Hills Exhibit I).22
Exhibit I
Stormwater Run-off Impervious surface coverage (paved or roofed surfaces where rain rainwater does not soak into the ground) in the U.S. is approximately 33,000 square miles. Urban runoff is the tenth leading source of impairment in streams, sixth in lakes, and eight in estuaries. Urban runoff/storm water discharges contributes to the impairment of 22,559 miles of streams, the impairment of 701,024 acres of lakes, and the impairment of 867 square miles of estuaries in the United States. 23. Within the County of Los Angeles’ watershed, concentrations of pathogen indicators, heavy metals and pesticides exceed state and federal water quality criteria. The mass emissions of pollutants to the ocean are significantly from our urban water management areas, Los Angeles River, Ballona Creek, and Coyote Creek, with the Los Angeles River providing more than seventy percent of the pollution.24
Stormwater Run-off – Rising Costs According to the Regional Board, the Los Angeles County Flood Control District, together with other agencies, municipalities, and industries in the County spent an estimated $340 million in Fiscal Year 2010-11 in their efforts to comply with TMDLs, the County unincorporated areas spent over $104 million. In order to manage the high-price of cleaning up and managing runoff the County Flood Control District is proposing a new Water Quality Improvement Program that will impose a parcel tax (this will include our County Park Facilities). July 3, 2012 the Board of Supervisors voted to proceed with taking the necessary steps to move forward with the new Program. This fee is property-based; charges to property owners will
22 The Sanitation District of Los Angeles http://www.lacsd.org/solidwaste/swfacilities/landfills/puente_hills/default.asp
23 National Water Quality Inventory: Report to Congress
http://water.epa.gov/lawsregs/guidance/cwa/305b/upload/2009_01_22_305b_2004report_2004_305Breport.pdf
24 April 7, 2011 The County Of Los Angeles MS4 Permit Municipal Separate Storm Sewer System
NPDES CAS004001 Fact Sheet/Staff Report
http://www.waterboards.ca.gov/losangeles/water_issues/programs/stormwater/municipal/Reissued_LA_MS4_Permit/13_Tentative_Fact_Sheet(R4-2011-
XXX).pdf

Page 18
be in proportion to how much water a property sends into the storm drain system. DPR will be included in the parcel tax increase. 25
Carbon Dioxide Emissions and Climate Change Energy use has its related environmental impacts. With so much attention given to transportation emissions, many people are surprised to learn that the Building Sector was responsible for nearly half (46.7%) of U.S. CO2 emissions in 2010. By comparison, transportation accounted for 33.4% of CO2 emissions and industry just 19.9%. Most of these emissions come from the combustion of fossil fuels to provide heating, cooling and lighting, and to power appliances and electrical equipment. Over the next 25 years, CO2 emissions from buildings are growing faster than any other sector, with emissions from commercial buildings growing the fastest—1.8% a year through 2030.26 Coal is responsible for 40% of the CO2 emissions produced by electricity generation; in 2011, it grew by 5%27 , natural gas 17.6% and petroleum 1.5%. In 2011, coal was the fuel for about 42% of the 4 trillion kilowatt-hours of electricity generated in the United States28. The Intergovernmental Panel on Climate Change (IPCC) reports that global warming or “Climate Change” is primarily a problem of too much CO2 emissions in the atmosphere. There are other climate drivers, such as heat-trapping gases but CO2 emissions puts us at the greatest risk of irreversible changes if it continues to accumulate unabated in the atmosphere. 29
Exhibit J
November 2012, the U.S. registered the warmest year on record in the lower 48 states, with two-thirds of the U.S. states suffering drought. 30 IPCC reports that droughts will continue to get worse as the planet heats up. Climate models tend to agree that droughts will get more intense and frequent in the Mediterranean, in central North America, Mexico, northeast Brazil and southern Africa.31
25 County of Los Angeles Department of Public Works http://file.lacounty.gov/bos/supdocs/68637.pdf
26 The US Green Building Council, http://www.documents.dgs.ca.gov/dgs/pio/facts/LA%20workshop/climate.pdf.
27 Trends in global CO2 emissions; 2012 Report © PBL Netherlands Environmental Assessment Agency The Hague/Bilthoven, 2012 PBL publication number:
500114022 http://edgar.jrc.ec.europa.eu/CO2REPORT2012.pdf
28 The U.S. Energy Information Administration (EIA) http://www.eia.gov/energyexplained/index.cfm?page=electricity_in_the_united_states
29 The Intergovernmental Panel on Climate Change (IPCC) a global climate assessment 2007
30 World Meteorological Organization said in a report released in Doha, during the UN climate talks 2012
31 The Washington Post What we know about climate change and drought By Brad Plumer , Updated: July 24, 2012

Page 19
California's water year is measured from July 1 to June 30. As of Feb. 1, 2012, the precipitation had only hit 60 percent of the average. Totals are drastically low in snowpack water content as well, as of March 12; we have only 35 percent of the average for this time of year. According to Richard Seager, a professor at the Lamont-Doherty Earth Observatory at Columbia University and a prominent drought researcher, the lack of snow cover from the 2011-12 winter as another key factor in the drought’s expansion. (Exhibit K).
Conclusion Climate change and drought have a considerable effect on energy and water use. If global warming increases and drought intensifies as predicted, DPR will need more energy to cool buildings, more water to irrigate landscapes, more revenue to pay for the increase in costs. At the same time, we will send more CO2 emissions into the atmosphere accelerating the cycle. Implementing sustainable practices is about much more than the technical, financial, or political—it is about the human factor. The key missing ingredient in the adoption of sustainability measures is organizational and cultural change. This paradigm shift requires a transition from a mechanical, linear management style to an integrated, whole systems approach to resource management. Energy efficiency, water conservation and sustainability, is the only practical solution toward lowering our operations and maintenance costs. A serious effort focused on employee awareness and education as well as establishing and strengthening sustainability programs with clear, measurable, attainable goals and practical, easily executable strategies is the key in creating momentum, commitment, and buy-in to a sustainability program across the Department. Departmental Strategy (Example) • Provide a “Model Sustainable Park” an example of a successful green facility; • Adopt sustainability programs “Sustainable Parks Program” and green building policies for our
facilities; • Educate staff, consultants and all stakeholders about energy efficiency, water conservation and
sustainability through our “Sustainable Parks Program”; • Provide incentives and guidelines for the Field Agencies to participate in the “Sustainable Parks
Program”; • Assess and monitor the effectiveness of green programs and projects; • Specify standards to promoting green design and construction;
Drought Forecast
Exhibit K
Page 20
Chapter 2 - Economic Benefits of Sustainable Construction Unlike residential or commercial developers, the County of Los Angeles is unique in the fact that the County owns, develops and continues to operate their facilities for many years. By modeling, project costs that take into account the projected future operational and maintenance costs savings in addition to the benefits associated with sustainable projects, the project that makes the most sense from a “whole life cycle” 32 perspective are sustainable projects.
Reduced Operating Costs Each of these benefits listed below reflect a potential cost savings, these kinds of costs are not typically considered during the scoping or the design phase, and usually a budget has been derived from and established based on traditional design and construction. If these potential benefits can be realized earlier in the planning and development process, then sustainable projects will truly have an economic advantage over their traditional counterparts.33 The Benefits are:
• Savings on energy and water, typically 30% to 50%, along with reduced “carbon footprint” from energy savings
• Savings on maintenance cost reductions from commissioning and other measures to improve and assure proper systems integration and performance
• Savings from less water use in our irrigated landscape, typically 50% to 70% when climate appropriate plant material is used in place of turf.
• Saving from maintenance labor and materials in the landscape such as mowing and fertilizers. • Recycling construction waste can save tens of thousands of dollars in haul costs, dump fees, and
material costs • Savings from annual waste disposal costs. • Employee productivity improvements, typically 3% to 5% • Tax benefits for specific green building investments • Health benefits, reduced absenteeism, typically 5% or more • Risk management benefits, such as lower employee exposure to odors or the effects of irritating
or toxic chemicals in building materials • Public relations benefits, demonstration of commitment to sustainability and environmental
stewardship; demonstration of shared values with the community
Reduced Energy Costs Green buildings are designed to use 25 to 40 percent less energy than the current codes require. At an operating cost of $1.60 to $2.50 per square foot in electricity, the energy savings could reduce operating costs by 40 cents to $1 per square foot each year. Theses saving can be obtained for the added investment of just $1 to $3 per square foot in initial costs. For Example a 10,000 square foot gym building will save the Department $4,000 to $10,000 of operational costs each year. 34
32 “ life cycle” refers to the view of a building over the course of its entire life - in other words, viewing it not just as an operational building, but also taking into
account the design, installation, commissioning, operation and decommissioning phases. It is useful to use this view when attempting to improve an operational
feature of a building that is related to how a building was designed. For example, overall energy conservation. In the vast majority of cases there is less than
sufficient effort put into designing a building to be energy efficient and hence large inefficiencies are incurred in the operational phase. Current research is ongoing
in exploring methods of incorporating a whole life cycle view of buildings, rather than just focusing on the operational phase as is the current situation.
33 The U.S. Department of Energy resource document “The Business Case for Sustainable Design in Federal Facilities”. This document references case studies of
costs and saving see http://www1.eere.energy.gov/femp/pdfs/buscase_frontmat.pdf
34 The Green Building Revolution By Jerry Yudelson, Island Press Publishers page 31
Page 21
There are great savings to be found in the landscape as well, with the new innovative solar irrigation and lighting systems the reduction of non-renewable energy can be up to 100%.
Reduced Water Costs • Buildings having the “state of the art” rest room fixtures with motion sensors dispensing hand
soap, turning faucets of and on and flushing save a great deal in water costs. • The potentially largest amount of water savings takes place in our irrigated landscapes. By
reducing our turf areas where possible and replacing with climate appropriate drought tolerant plant material, the water and cost savings is potentially 50% to 70% in these specific areas.
Reduced Maintenance Costs • One of the goals of “Green” building is to increase durability and ease of maintenance. Building
“Green” means using durable, long-lasting sustainable materials that are locally manufactured and purchased, decreasing delivery, maintenance and repair costs. Low emitting paints and finishes have the same excellent durability as standard paints and finishes.
• Designing buildings with areas for efficient and convenient collection of recyclable materials and a staging area for composting green waste reduces annual waste disposal costs considerably.
• A building design with daylighting and ventilation will reduce the need of artificial light and possibly HVAC during the day.
• A building designed to use LED fixtures reduces labor costs for maintenance. The LED lamps last about 30,000 hours as opposed to 1,300 hours for incandescent lamps for similar comparative use. Therefore, about 28 lamp changes (and the associated labor costs) are avoided. The LED lamp will use 60 watts over a period of its lifespan 30,000 hours, an incandescent bulb would use 1,800,000 watt over the same 30,000 hours.
• Common incandescent bulbs get hot and contribute to heat build-up in a room. LEDs prevent this heat build-up, thereby helping to reduce air conditioning costs and saving additional energy.
• A “Cool Roof” prolongs a roof's lifetime, the degradation of materials resulting from expansion and contraction and the absorption of ultra-violet light is a temperature-dependent process. In addition to this, cool roofs reduce heat gains and air conditioning costs considerably. Studies have reported cool roofs have decreased building temperatures by 20% to 60% and energy costs by about the same.35
• Using sustainable landscaping techniques typically decreases lawn mowing, fertilizer use and irrigation and has short payback periods. 36
• Managing stormwater through "natural" methods such as drainage ponds that also serve as habitats for wildlife, rather than storm sewers, often exhibits favorable lifecycle costs.
Productivity Benefits • Service employee productivity gains for healthier indoor spaces are worth $3 to $30 per square
foot of leasable or usable space, estimated on an average employee cost of $300 to $600 per square foot (yearly salary of $60,000, benefits and 100 to 200 square feet per person). With energy costs of $2.50 per square foot, productivity gains can equal or exceed energy costs of operating the entire building. A 10% improvement in productivity from a green building ($30 to $60 per square foot) could pay for the building. Another study shows that productivity and health gains of green building provide more than two-thirds of the total benefits in analysis.37
35 Energy Saving Potentials and Air Quality Benefits of Urban Heat Island Mitigation1 Hashem Akbari, Heat Island Group, Lawrence Berkeley National Laboratory
http://www.osti.gov/bridge/servlets/purl/860475-UlHWIq/860475.pdf
36 The Economic Benefits of Sustainable Design http://www1.eere.energy.gov/femp/pdfs/buscase_section2.pdf
37 Eleven case studies have shown that innovative daylighting systems can pay for themselves in less than one year due to energy and productivity savings.
Building Investment Decision Support (BIDS™) Cost-Benefit Tool to Promote High Performance Components, Flexible Infrastructures and Systems Integration for

Page 22
Annual Waste Disposal Fee Savings
• By recycling or productively using construction, demolition, and land-clearing wastes, storing and collecting recyclables, we can divert wastes from landfill disposal giving us the potential saving of $35.00 per ton.
• By reducing our annual grass clippings by 50%, we have the potential annual savings of $22.00 per ton.
Reduce Carbon Dioxide Emissions • Green power is a subset of renewable energy and represents those renewable energy resources
and technologies that provide the highest environmental benefit. The EPA defines green power as electricity produced from solar, wind, geothermal, biogas, biomass, and low-impact small hydroelectric sources. Buying green power has great greenhouse gas reduction CO2 benefits.
• One of the largest sources of CO2 emissions is the combustion of fossil fuels or fossil fuel-based products to produce electricity. In contrast, the emissions from Green Power are biogenic. Biogenic emissions result from natural biological processes, such as the decomposition or combustion of vegetative matter. Biogenic emissions are part of a closed carbon loop. Biogenic CO2 emissions are balanced by the natural uptake of CO2 by growing vegetation, resulting in a net zero contribution of CO2 emissions to the atmosphere. Examples of biogenic emission sources include burning vegetation (biomass) to produce electricity. The Los Angeles Department of Water and Power began the Green Power for a Green LA Program in 1999; energy production is from wind and landfill gas at 3.0¢/kWh. Buyers include a wide variety of organizations including local, state, and federal governments.
Integrated Design Solutions When sustainability is integral to the program and embedded in the design the initial construction costs are less and the savings from operations and maintenance are greater. This strategy involves an inclusion of all design disciplines collaborating to achieve “Integrated Sustainability Solutions”. Using this approach a building and the site is viewed as an interdependent system, as opposed to an accumulation of its separate components. The goal of looking at all the systems together is to make sure they work in harmony rather than against each other. Building energy use as well as the size of energy systems are reduced without the use of sophisticated technologies, through an effective integration of the architectural, landscape architectural, structural, and energy designs. The integrated design approach achieves this improved energy use from looking at the relationship that exists between the building structure, its architecture, the surrounding landscape, and the energy systems. This integrated design approach also achieves fewer construction problems and lower costs. Early commitment and continued participation of all parties throughout all stages of the design process is necessary to optimize overall performance of all systems.38
Sustainable Commercial Buildings and Productive Organizations Vivian Loftness FAIA, Volker Hartkopf PhD, Beran Gurtekin PhD
http://www.aia.org/aiaucmp/groups/ek_public/documents/pdf/aiap080050.pdf
38 Architectural Energy Corpoation http://www.archenergy.com/news/integrated-design-better-buildings-through-collaboration
Page 23
The Costs of Green Building One of the greatest barriers to the adoption of sustainable development is the misconception that the costs of green design, construction, and certification add a large amount to the initial project budget. However, numerous studies and reports have demonstrated that the more experience the design and construction team have in green building and green technologies improve the costs of going green (for basic LEED certification or Silver) become closely aligned with those of conventional design and construction.
New Construction A July 2007 report by Davis Langdon, a construction consulting company, compared the costs of LEED seeking buildings to conventionally designed and constructed counterparts. Eighty-three LEED seeking buildings and 138 conventional buildings were chosen for the study, a total of 221 academic, laboratory, library, community center buildings, and health care facilities. The Davis Langdon report concluded: "As the various methods of analysis showed, there is no 'one size fits all' answer to the question of the cost of green. A majority of the buildings we studied were able to achieve their goals for LEED certification without any additional funding. Others required additional funding, but only for specific sustainable features, such as the installation of a photovoltaic system. Additionally, our analysis suggests that the cost per square foot for buildings seeking LEED certification falls into the existing range of costs for buildings of similar program type. From this analysis we can conclude that many projects can achieve sustainable design within their initial budget, or with very small supplemental funding." 39 The savings generated in energy, water, operations, maintenance, and health costs offer quick investment returns, and ultimately revenues over the life cycle of the building. "The Costs and Financial Benefits of Green Buildings," report produced by the Massachusetts Technology Collaborative for the State of California Sustainable Building Task force presenting a definitive cost benefit analysis of green building based on a review of LEED-certified buildings, states: "While the environmental and human health benefits of green building have been widely recognized, this comprehensive report confirms that minimal increases in upfront costs of about 2% to support green design would, on average, result in life cycle savings of 20% of total construction costs -- more than ten times the initial investment. For example, an initial upfront investment of up to $100,000 to incorporate green building features into a $5 million project would result in a savings of $1 million in today's dollars over the life of the building."40
Existing Buildings Energy and operations account for approximately 75 percent of a building’s costs over its lifetime, whereas design and construction costs are 11 percent and financing is approximately 14 percent in that same period, it is clear why existing buildings make perfect candidates for a green retrofit. In a typical office building, energy use accounts for a minimum of 30 percent of operating costs, the largest single category of controllable costs. If you can upgrade equipment and day-to-day operations to reduce those costs, you save money.41
39 Davis Langdon. "Cost of Green Revisited: Reexamining the Feasibility and Cost Impact of Sustainable Design in the Light of Increased Market Adoption." July
2007 1-25. Available at: http://www.davislangdon.com/upload/images/publications/USA/The%20Cost%20of%20Green%20Revisited.pdf.
40 The Costs and Financial Benefits of Green Buildings A Report to California’s Sustainable Building Task Force
http://www.calrecycle.ca.gov/greenbuilding/design/costbenefit/report.pdf
41 Existing Buildings Hold the Key By Paul von Paumgartten / Alliance for Sustainable Built Environments http://www.awarenessintoaction.com/whitepapers/how-
existing-buildings-high-performing-green-leed-certified.html
Page 24
The amounts of operational savings vary, depending on the existing building’s size, type, use and location. Johnson Controls, an industry leader in retrofitting existing buildings has found that savings average from 5 cents to 15 cents per square foot per year. Some operational savings can pay back in less than six months, such as recycling and other waste management practices. Water efficiencies can show paybacks in less than two years. Traditional energy and lighting upgrades will pay back within two to 10 years; renewable energy technologies take longer, but those payback periods are decreasing as better technology is developed and incentives become more plentiful.42
Landscapes Usually installing sustainable climate appropriate plant material, a well-designed irrigation system and a sustainable stormwater management system will increase the initial cost for a new landscape installation, nevertheless the operations and maintenance savings are tremendous. The cost increase of a sustainable stormwater management system is approximately $157.00 per 1000 square feet, but will provide an annual cost savings of $28.20 per the 1000 square feet with a payback period is 5.8 years. The cost increase of installing a sustainable landscape instead of the traditional approach is $122.00 per 1000 square feet, this includes climate appropriate plant material and state of the art weather-based irrigation system, will give us an annual cost savings of $152.00 per the 1000 square feet and a payback period of 0.8 years.43 By using sustainable Low Impact Design (LID) measures there is a potential for great savings in the initial cost of the landscape project. The following information was taken from a 2008 forum on sustainable development co-sponsored by the American Society of Landscape Architects and the Urban Land Institute.
• Preserving natural areas in the project can save up to $10 per square foot or $435,000 per acre over conventional landscape solutions.
• Balancing cut and fill on site can save up to $100 per cubic yard in haul costs. • Using rain gardens and bio-retention areas can save up to $4,800 per 5,000 square foot lot over
conventional engineered solutions • The use of on-lot bio retention areas can save up to $4,000 per 5,000 square foot lot over
standard stormwater management pond costs • On-lot bio-retention can save up to 75 percent of stormwater fees per 5,000 square foot lot. • Shade trees on the south side of buildings can save up to $47 per tree per year in energy costs. • Green roofs can retain more than 75 percent of rainfall annually, reducing downstream
stormwater management costs. 44 According to the Economic Benefits of Sustainable Design publication developed for the U.S. Department of Energy, sustainable and green design approaches can help minimize some first costs associated with a project, allowing these savings to offset other costs that might be higher.45
Conclusion Whether it is saving money or saving the environment, developing a “Sustainable Parks Program” that helps progress us toward the conservation of our resources through high performing, buildings and sustainable landscapes will be a win-win situation for everyone involved.
42 Paid-from-Savings Guide to Green Existing Buildings http://www.usgbc.org/DisplayPage.aspx?CMSPageID=2204 and
http://www.usgbc.org/ShowFile.aspx?DocumentID=6597
43 The Economic Benefits of Sustainable Design http://www1.eere.energy.gov/femp/pdfs/buscase_section2.pdf
44 A The Case for Sustainable Landscapes http://www.sustainablesites.org/report/The%20Case%20for%20Sustainable%20Landscapes_2009.pdf
45 The Economic Benefits of Sustainable Design http://www1.eere.energy.gov/femp/pdfs/buscase_section2.pdf

Page 25
Chapter 3 – The Sustainable Parks Program
The Sustainable Parks Program Goals The Sustainable Parks Program focuses on one goal for 2015 and 10 goals for 2020.
1. A Model Green Park 2. Energy Conservation 3. Switch to Renewable Energy Sources 4. Water Conservation 5. Waste Management 6. Sustainable Landscape Practices 7. Reduce Toxics Entering the Environment Through Purchasing Environmentally Preferred
Products 8. Reduce Stormwater Run-Off 9. Reduce Carbon Footprint 10. Reduce Heat Island 11. Sustainable Building Practices
1. A Model Green Park - In this age of mass communication, picture is worth a thousand words. Recent
research supports the idea that visual examples can be more powerful than verbal communication to persuade or instruct others. Studies show that people only remember 10% of what they hear and 20% of what they read, but about 80% of what they see and do.46 Developing g a “Model Green Park” that demonstrates the benefits of achieving sustainability and the cost benefits of “Integrated Design Solutions” is crucial to achieve a level of commitment from the agencies toward the goals of the “Sustainable Parks Program”.
Goal: By 2015, The Department will have a “Model Green Park” by re-developing/designing a park site using integrated sustainable design solutions 2. Energy Conservation - There are four major ways to affect the Department’s demand for energy.
• Replace equipment and fixtures with the latest efficiency technology can create significant energy and cost savings.
• Audit or commission the existing buildings to measure energy deficiencies • Repair and retrofit • Encourage those that have control over energy consumption to supports energy conservation as
an operational practice. Goal: by 2020, the Department will have 20 buildings ASHRAE47 audited Level 2, and as a result of the findings, retrofit, modify or upgraded buildings, to reduce its net consumption of electric energy and non-renewable heating fuels (e.g., oil, natural gas, and propane). Refer to page 29 for a detailed explanation of an ASHRAE audit. Reference Chapter 5 for ASHRAE audit costs. 3. Switch to Renewable Energy Sources - One way to make agency operations more sustainable is to
purchase or produce energy generated from renewable sources • Place photovoltaic systems as well as solar water heating systems on building’s rooftops or as
parking lot shade structures where possible. • Replace existing path parking lot and security lighting with solar lighting • Use Solar Smart Controllers • Purchase “green electricity”
Goal: by 2020, the Department will purchase and/or produce 30% of its electrical energy needs from renewable sources.
46 Paul Martin Lester, “Syntactic Theory of Visual Communication,” California State University at Fullerton, 1994–1996.
47 American Society of Heating, Refrigerating and Air-conditioning Engineers
Page 26
4. Water Conservation - To meet future demand for potable water we need to use water wisely, reuse it wherever possible, and return it to the environment in as clean a state as possible. • Replace existing toilets with “Watersense” labeled toilets • Replace existing faucets with 0.5 GPM Faucet w/ Selectronic Technology
There are only three ways to save water in the landscape: 1 Improve System Efficiency 2 Reduce Net ETo Requirement 3 Improve Irrigation Scheduling
Goal: by 2020, the Department will apply water conservation methods, and new irrigation design and technologies at 30 parks.
5. Waste Management - Reduce, reuse, recycle is the core of sustainability. Parks and the people who
visit our parks can work together to reduce the amount of material that is sent to landfills every year. Efficient recycling and composting programs can reduce the waste stream significantly. Construction and demolition (C&D) waste is a large part of the waste stream in America. While there is an increasing rate of recycling of C&D waste, the grinding up, re-melting, and overall re-processing of materials is highly energy intensive. By reusing materials in their original form, you can save energy, and the pollution associated with trucking new and waste materials is greatly reduced. • Reuse materials in their original form when possible • Verify that the refuse/trash pick-up services for your park sorts and recycles. • Maintain and repair durable items • Create a staging area for green waste composting • Compost all green waste • Select products made from recycled materials
Goal: by 2020, Department will divert 80% of current waste from landfills by achieving 100% recycling of metals, plastics, paper products, and glass and by composting at least 50% of organic wastes.
6. Sustainable Landscape Practices - The most sustainable landscapes in any of our parks are those with
the least amount of turf and the most amounts of climate appropriate plant materials. The need for turf in active and passive recreational areas will continue, but we can: • Replace turf with climate appropriate plant materials where possible • Replace turf in active and passive fields with GN-1 or Tifway Hybrid Bermuda Grass • Audit the irrigation systems monthly for repairs • Replace existing irrigation controllers with the WeatherTrak Controller • Apply the County’s Model Water Efficient Landscape Ordinance to all our landscapes.
Goal: by 2020, the Department will reduce water consumption in 10 parks by removing and replacing turf on active fields with Tifway 419 Bermuda Grass, removing turf completely where it is not required replacing it with climate appropriate plants, incorporate low volume irrigation design and technologies.
7. Purchasing Environmentally Preferred Products From recycled paper to cleaning products that are
non-toxic and biodegradable, Environmentally Preferred Products (EPP) advance sustainability in several ways. These products are easier to recycle, reduce energy consumption, and lessen release of toxins into the environment. Purchase and use of EPP helps support green industry, reduces pollution, and lessens threats to human health. • Purchase “Green” products by LEED approved organizations Green Seal, Greenguard, and
Scientific Certification Systems or products certified under the Institute for Market Transformation to Sustainability's Sustainable Materials Rating Technology (SMaRT) rating system.
Goal: by 2020, the Department will apply only paints with low amounts of volatile organic compounds. Practice the Counties EPP policy for cleaning, painting, and other maintenance-related chemical products. Adopt a policy on use of toxic substances in parks and agency facilities. Provide appropriate training to all staff who handles toxic substances
Page 27
8. Reduce Stormwater Run-Off - A large amount of water run-off occurs during the dry season caused
by overly irrigation landscape or badly designed systems. This has the same impact on the contamination of our watersheds as stormwater runoff. Impervious surfaces do not allow infiltration of water from both rain and irrigation contributing to the problem. • Replacing impervious hardscape with a pervious surface will mitigate run-off • The County’s Low Impact Design (LID) guidelines strategies can be optimized to retain 100% run-
off • The County’s Model Water Efficient Landscape Ordinance will help lower water use and dry
weather run-off. Goal: by 2020, the Department will, where possible, remove the existing hardscape impervious surfaces, replace with permeable surfaces, and apply LID techniques and retain 100% runoff on 10 park sites.
9. Reduce Our Carbon Footprint - With worldwide concern over global climate change, we need to
make decisions that consider and, to the greatest extent possible, reduce release of carbon dioxide and other greenhouse gasses into the air. Approximately 43% of America’s carbon emissions come from the operation of buildings. • A single tree can absorb CO2 at a rate of 48 lb. per year. • An acre of trees absorbs enough CO2 over one year to equal the amount produced by driving a
car 26,000 miles. • Planting trees remains one of the cheapest, most effective means of drawing excess CO2 from
the atmosphere. • One large tree strategically placed in a yard can replace 10 room-size air conditioners operating
20 hours per day. Goal: by 2020, the Department will install 500 additional trees in County Parks Facilities. 10. Reduce Heat Island Effect - One study estimates that the heat island effect is responsible for 5–10%
of peak electricity demand for cooling buildings in cities.48 We can take a number of steps to reduce the heat island effect, using four main strategies: • increasing tree and vegetative cover; • creating green roofs • installing cool—mainly reflective—roofs • Using cool pavements.
Goal: by 2020, the Department will install shade trees, where possible, to shade 40% (at maturity of trees) of the parking lots at 20 County Parks Facilities.
11. Sustainable Building Practices - The County of Los Angeles already requires that buildings over
10,000 square feet to have LEED Silver certificate (a requirement). Community, gyms, office buildings, and multipurpose structures in our parks rarely reach this threshold. • A system similar to the LEED rating system can be developed and applied to small buildings.
Goal: by 2020, the Department will devise a system similar to Leadership in Energy and Environmental Design (LEED) to apply to our smaller buildings to ensure they are as sustainable and as energy efficient as possible.
48 Akbari, H. 2005. Energy Saving Potentials and Air Quality Benefits of Urban Heat Island Mitigation (PDF) (19 pp, 251K). Lawrence Berkeley National Laboratory.
http://escholarship.org/uc/item/4qs5f42s#page-14
Page 28
The Report Card The following form is a means to track our performance, a minimum of 20% should be achieved each year to accomplish the goal by 2020. Objective Goals Percentage of goal achieved year 2014
East Agency
North Agency
South Agency
Regional Agency
Energy Conservation
ASHRAE Level 2 audit for 20 buildings, to reduce net consumption of electric energy and non-renewable heating fuels (e.g., oil, natural gas, and propane) by 20% or more.
Switch to Renewable Energy Sources
Purchase and/or produce 30% of electrical energy needs from renewable sources.
Water Conservation Apply water conservation methods, and new irrigation design and technologies at 30 parks.
Waste Management
Divert 80% of current waste from landfills by achieving 100% recycling of metals, plastics, paper products, and glass and by composting at least 50% of organic wastes.
Sustainable Landscape Practices
Reduce water consumption in 10 parks by removing and replacing turf on active fields with Tifway 419 Bermuda Grass, removing turf completely where it is not required replacing it with climate appropriate plants, incorporate low volume irrigation design and technologies.
Purchasing Environmentally Preferred Products
Apply only paints with low amounts of volatile organic compounds. Practice the Counties EPP policy for cleaning, painting, and other maintenance-related chemical products. Adopt a policy on use of toxic substances in parks and agency facilities. Provide appropriate training to all staff who handle toxic substances
Reduce Stormwater Run-Off
Remove the existing hardscape impervious surfaces, replace with permeable surfaces, and apply LID techniques and retain 100% runoff on 10 park sites.
Reduce Our Carbon Footprint
Install 500 additional trees in County Parks Facilities.
Reduce heat Island effect
Install shade trees, where possible, to shade 40% (at maturity of trees) of the parking lots at 20 County Parks Facilities.
Sustainable Building Practices
Devise a system similar to Leadership in Energy and Environmental Design (LEED) to apply to our smaller buildings to ensure they are as sustainable and as energy efficient as possible.

Page 29
Chapter 4 - How to achieve the 10 Sustainable Parks Program Goals
Goal 2 - Energy Conservation
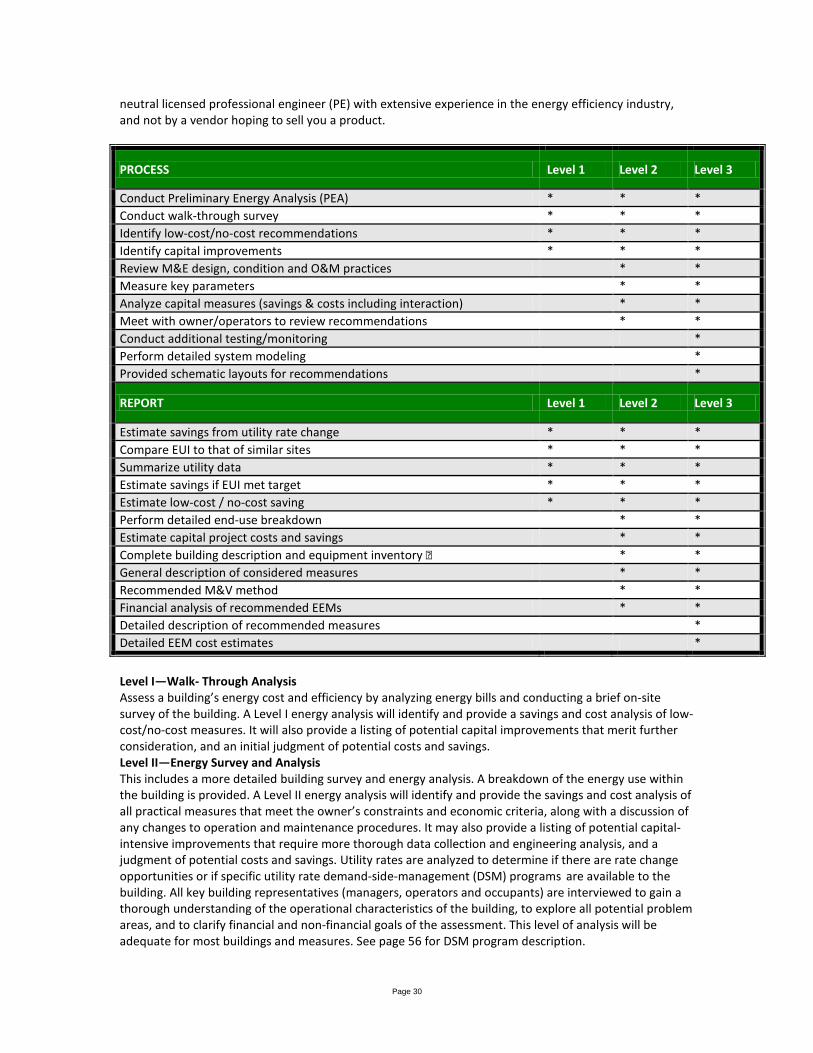
ASHRAE49 Audit Level 2 American Society of Heating, Refrigerating and Air-conditioning Engineers (ASHRE) Energy Audits A commercial energy audit conducted by an ASHRAE certified engineer is a critical step towards understanding how energy is used, wasted and how our department can take control of future price increases. ASHRAE certified engineers conduct their audits in accordance with the standards developed by the American Society of Heating, Refrigerating, and Air-Conditioning Engineers and include Preliminary Energy Use Analysis, Level I – Walk-Through Analysis, Level II – Energy Survey and Engineering Analysis, and Level III – Detailed Analysis of Capital-Intensive Modifications. All levels of effort are led by a vendor-
49 American Society of Heating, Refrigerating and Air-conditioning Engineers
Goals and Actions
Goals Ac
tions
AS
HRAE
Aud
it Le
vel
2 up
grad
e re
pair
or
repl
ace
base
d on
au
dit’s
resu
lt
Purc
hase
Gre
en P
ower
In
stal
l Pho
tovo
ltaic
Pa
nels
Asso
ciat
ion
(IA)
Cert
ified
Irrig
atio
n Au
dito
r Aud
it
Redu
ce N
et E
To
Requ
irem
ent
Redu
ce Im
perv
ious
Su
rfac
es
Plan
t Tre
es
Inst
all C
ool R
oofs
and
Co
ol P
avem
ents
2. Energy Conservation √ √ √ 3. Switch to Renewable Energy
Sources √ √ 4. Water Conservation √ √
5. Waste Management √ √
6. Sustainable Landscape Practices √ √ √ √
7. Purchasing Environmentally Preferred Products √
8. Reduce Run-Off √ √ √ √ 9. Reduce Our Carbon Footprint √ √ √ √
10. Reduce heat Island Effect √ √
11. Sustainable Building Practices √ √
Page 30
neutral licensed professional engineer (PE) with extensive experience in the energy efficiency industry, and not by a vendor hoping to sell you a product.
PROCESS Level 1 Level 2 Level 3
Conduct Preliminary Energy Analysis (PEA) * * * Conduct walk-through survey * * * Identify low-cost/no-cost recommendations * * * Identify capital improvements * * * Review M&E design, condition and O&M practices * * Measure key parameters * * Analyze capital measures (savings & costs including interaction) * * Meet with owner/operators to review recommendations * * Conduct additional testing/monitoring * Perform detailed system modeling * Provided schematic layouts for recommendations *
REPORT Level 1 Level 2 Level 3
Estimate savings from utility rate change * * * Compare EUI to that of similar sites * * * Summarize utility data * * * Estimate savings if EUI met target * * * Estimate low-cost / no-cost saving * * * Perform detailed end-use breakdown * * Estimate capital project costs and savings * * Complete building description and equipment inventory � * * General description of considered measures * * Recommended M&V method * * Financial analysis of recommended EEMs * * Detailed description of recommended measures * Detailed EEM cost estimates *
Level I—Walk- Through Analysis Assess a building’s energy cost and efficiency by analyzing energy bills and conducting a brief on-site survey of the building. A Level I energy analysis will identify and provide a savings and cost analysis of low-cost/no-cost measures. It will also provide a listing of potential capital improvements that merit further consideration, and an initial judgment of potential costs and savings. Level II—Energy Survey and Analysis This includes a more detailed building survey and energy analysis. A breakdown of the energy use within the building is provided. A Level II energy analysis will identify and provide the savings and cost analysis of all practical measures that meet the owner’s constraints and economic criteria, along with a discussion of any changes to operation and maintenance procedures. It may also provide a listing of potential capital-intensive improvements that require more thorough data collection and engineering analysis, and a judgment of potential costs and savings. Utility rates are analyzed to determine if there are rate change opportunities or if specific utility rate demand-side-management (DSM) programs are available to the building. All key building representatives (managers, operators and occupants) are interviewed to gain a thorough understanding of the operational characteristics of the building, to explore all potential problem areas, and to clarify financial and non-financial goals of the assessment. This level of analysis will be adequate for most buildings and measures. See page 56 for DSM program description.

Page 31
Level III—Detailed Analysis of Capital-Intensive Modifications This level of engineering analysis focuses on potential capital-intensive projects identified during the Level II analysis and involves more detailed field data gathering as well as a more rigorous engineering analysis. It provides detailed project cost and savings calculations with a high level of confidence sufficient for major capital investment decisions. The Vert Group recommended a Level II audit for our park buildings the cost is dependent on the complications of the building. For example to have a 10,000 square foot gym audited that is without HVAC or heating would cost 5 cents per square foot ($500). Auditing a more complex building with HVAC, heating and other energy using appliances would cost up to 25 cents a square foot, for example a 5,000 square foot community building ($1250.00). There is no charge for refuge and utility bill audits. They are done on a contingency basis a percent of any savings we help you achieve. Therefore, there is no risk for those. Costs supplied by Anthony C. Olivas VP BUSINESS DEVELOPMENT, B.A. Vert Energy Group, Inc. Main: (800) 585-2690 x 101 Direct: (323) 272-6980 [email protected] www.VertEnergyGroup.com
Goal 3 - Switch to Renewable Energy Sources Those Parks receiving electricity from Los Angeles Department of Water and Power can sign up for Green Power Renewable energy, or Green Power, is electricity produced from clean, sustainable energy sources such as the wind, water, and the sun. Some examples of the renewable technology include wind turbines, small hydroelectric turbines, and photovoltaic (solar) cells. The Green Power for a Green L.A. program gives Los Angeles residents, businesses, and governmental agencies a stake in helping to preserve and protect our environment through their voluntary contribution to support additional renewable energy. This program has helped LADWP customers achieve individual and organizational environmental goals such as reducing their carbon footprint and establishing themselves as environmental leaders in the community. Customers who sign up for Green Power choose to have all, or a portion, of their electricity needs generated from renewable energy sources. Contribution Information Since electricity generated from renewable sources generally cost more than conventional non-green fuel sources, there is an additional charge of 3 cents per kilowatt-hour applied only to the portion of renewable energy that is selected. Any percentage above the minimum amount may be chosen up to 100% of total electric consumption. Large Non-Residential (Rate A-3) electric customers: The minimum purchase is 1,000 kilowatt-hours per month ($30.00 a month). If you have questions, you may call (213) 367-4854 or email at [email protected]. Install Photovoltaic Panels Southern California Edison Government agencies that are customers of Southern California Edison (SCE) are eligible for incentives provided through the California Solar Initiative for solar energy systems from 1 kilowatt (kW) up to 1 MW. Customers of municipal utilities may also qualify for similar incentives through their municipal service provider. CSI Application Process 1. Complete a Free Energy Efficiency Audit By understanding where and how your energy dollars are spent; you can take energy efficiency actions that are key to saving energy and money while providing lasting benefits to the environment. Replacing old, inefficient appliances and changing incandescent light bulbs to compact fluorescent lights reduce your energy demand and the need for a larger, more expensive solar system. While some contractors may help with an energy efficiency audit, it is more typical for non-residential customers to receive assistance from their account representative and for residential customers to conduct the online assessment themselves.

Page 32
2. Select the Right Solar Installer Qualified licensed contractors are your key to getting the most productive solar energy system for your home or business. Typically, the installer will apply for CSI incentives on your behalf and arrange for your system to be interconnected to SCE’s electric grid. The installer may also apply for necessary local permits. A licensed contractor should be able to evaluate factors that will impact your PV system performance, such as the roof size, orientation (tilt and direction) of the system, shading and other factors. Contractors typically provide free site evaluations, comprehensive quick quotes and payback information. To ensure you receive the most competitive bid for your project, contact at least three licensed contractors for bids. A database of registered solar installers, contractors and retailers in California is available online. Though uncommon, self-installations are allowed. 3. Submit an Application To reserve your solar incentive, you or your solar installer must complete the CSI Application and return it to SCE. After SCE receives your completed application, and in some cases an application fee, you will receive a letter confirming your reservation and the incentive funds reserved for you, which are based upon the size of your solar project (your contractor will help you determine the correct system size). These funds will be reserved for a specified period of time during which you must install your solar system, interconnect it to SCE’s power grid and submit your Incentive Claim Form (ICF). Reserving your incentive early ensures your access to the highest applicable incentive. As more solar systems are purchased and installed by California consumers, the amount of available incentive dollars decreases and the incentive rate decreases, too. 4. Installing & Inspecting Your System As part of the installation process, your solar installer generally handles any permitting required by the city or county. Once the required permits are acquired, a typical residential installation can be completed in three to five days. Once construction is complete, the city or county and SCE may inspect it. After your new solar system passes inspection, you will need SCE’s written authorization to connect it to SCE’s power grid and to collect your incentive under the CSI program. To expedite this process, you or your installer should complete the interconnection application and submit it to SCE as early as possible. Download the application from SCE’s web site, address below To get your system inspected by SCE, please download the CSI Inspection Protocol at the same web site. http://www.sce.com/solarleadership/gosolar/california-solar-initiative/getting-started-with-solar.htm 5. Collect Your Incentive Once your new solar system passes inspection, you or your installer will need to submit to SCE a completed ICF for payment. Then you (or your installer) will receive a check from SCE for the incentive amount. For more information about the California Solar Initiative, visit GoSolarCalifornia.ca.gov. The Los Angeles Department of Water and Power Government agencies that are customers of Los Angeles Department of Water and Power's (LADWP) are eligible for the Solar Photovoltaic Incentive Program. This program provides an incentive payment to LADWP customers who purchase and install their own solar power PV systems. Most recently, LADWP is currently developing a FiT program to allow customers to sell renewable energy produced from their own systems. LADWP’s 10-year, $313 million Revised Solar Photovoltaic Rebate Program began in 2007 and will remain in effect through December 31, 2017, or until the total installed MW goal has been reached. Non-residential systems may be eligible for bonus incentives if they utilize equipment manufactured in LA or if the systems is building-integrated PV.
• Incentive Type: Utility Rebate Program • Eligible Renewable/Other Technologies: Photovoltaics

Page 33
• Applicable Sectors include Local Government • The program reopens on July 1, 2013 for government agencies • Maximum Incentive: Up to 75% of project costs for government installations. • The maximum system size for incentive payment is 1 MW AC per per government per year, 2
MW may be reserved depending on fund availability • Eligible System Size: Minimum system size of 1 kW Maximum system size of 5 MW • Equipment Requirements: Must use CEC-certified PV modules and inverters. • Custom modules not certified by UL 1703 may seek certification by the LA Department of
Building and Safety Materials Test Lab. Specifications for solar equipment not listed by the CEC must be provided to the LADWP Solar Group.
• Warranty requirements: panels – 20 years; components – 10 years • Installation Requirements: The installer must be a properly licensed California contractor with an
active A, B, C-10 or C-46 license. • Ownership of Renewable Energy Credits: RECs become the property of LADWP. Participants may
elect to take a significantly smaller incentive than the base incentive in exchange for ownership of the RECs.
• Funding Source: Public Benefits Fund • Program Budget: $30 million per year • Expiration Date: 12/31/2017, or when total installed MW goal has been reached. • Web Site: https://www.ladwp.com/ladwp/faces/wcnav_externalId/r-gg-inst-solr
Contact: Solar Program Los Angeles Department of Water and Power 111 N. Hope St Room 940 Los Angeles, CA 90051 Phone: (213) 367-4122 E-Mail: [email protected] Web Site: http://www.ladwp.com/solar
Goal 4 - Water Conservation There are only three ways to save water in the landscape: 1. Improve System Efficiency – Have an Irrigation Association (IA) Certified irrigation Auditor audit the
irrigation system. Repair and re-adjust the system based on the auditor’s recommendations.
2. Improve Irrigation Scheduling - Replace existing irrigation controllers with the with County’s standard WeatherTrak Controller. A watering schedule developed by an irrigation auditor supported with a weather-based controller will help in water conservation.
3. Reduce Net ETo Requirement - Remove existing turf (where possible) and replace with climate
appropriate plants material. Where the County will find the greatest savings in water is in replacing (where possible) existing turf with drought tolerant plant material. • By taking a close look at how our parks are used we can determine if there are areas of our parks
where the turf can be replaced by drought tolerant plant material. By looking at the park’s irrigation as built, an entire valve zone can be chosen and in this way instead of redesigning and replacing the irrigation system, the scheduling and amount of time in that zone can simply be reduced.
• Replace turf in active and passive fields with GN-1 or Tifway Hybrid Bermuda Grass, these grasses were developed for active recreational use and use 40% less water than the tall fescue grasses typically used in our parks. Both grasses are available at Pacific Sod Southern California 305 West Hueneme Rd. Camarillo, CA 93012, 800.942.LAWN 800.942.5296 Email: [email protected]
To be incompliance with Los Angeles County Code Chapter 71, entitled "WATER-EFFICIENT LANDSCAPING, 7105.9 Landscape Irrigation Audit Schedules. A schedule of landscape irrigation audits of at least once every five years must be established, for all but single-family residences, and other projects with a landscape area less than 1 acre. At a minimum, audits shall be in accordance with the latest Irrigation Audit Guidelines provided by the Irrigation Association.

Page 34
A typical irrigation audit will include many of the following procedures:
• Visual inspection of irrigation system An irrigation auditor observes each zone in a sprinkler system and the landscape surrounding sprinkler heads to identify sources of inefficient water use: broken, damaged, or leaking heads; improperly positioned sprinklers watering streets and sidewalks; sprinkler heads too low or off vertical; sprinkler heads improperly spaced or arranged in pentagon patterns instead of water-conserving triangle or square patterns (Whiting et al, 2003); misting around sprinkler heads (excessive water pressure) or large water droplets falling close to heads (low water pressure); and poor system design features (no automatic or manual shut-off during rainy weather, non-uniform sprinkler heads used).
• Evaluation of distribution uniformity (DU) While many of the problems described above affect DU, a catch can test is routinely used to quantify whether or not irrigation water is being uniformly applied to the landscape. To perform a catch can test; an auditor places collection containers in a grid pattern on the surface of an irrigated zone, runs the irrigation system through a typical timed cycle, and collects and records the amount of water in each catch container. The data gathered is then used to identify areas of over- and under-irrigation (relative to the targeted application amount); results of a catch can test may also be correlated to observations of plant health in the test area.
• Determination of precipitation rate Data from a catch can test is also used to determine the rate at which water is applied by the irrigation system. Since individual site conditions, specifically water pressure and sprinkler head spacing, may alter a system’s performance, using catch can test results is more accurate than relying on the system manufacturer’s performance specifications (TAES, accessed May 2006). Knowing the rate of application is important for developing appropriate irrigation schedules.
• Determination of landscape’s watering needs An evaluation of the landscape features present at a site provides a great deal of information about that site’s water requirements. Factors to consider in developing a watering schedule include the types of plants present and the depth of their roots; whether they are growing in sun or shade, on flat areas or slopes; the presence or absence of a thatch layer in turf; whether or not non-turf plantings are mulched; soil texture and structure; and evidence of compaction and drainage problems.
• Review and development of irrigation schedule An irrigation auditor will review a site’s current irrigation schedule (amount of water applied and the interval between watering events), and make recommendations based on catch can test results, soil conditions, and plant water requirements, taking into account local climate and rainfall patterns (TAES, accessed May 2006). Because an irrigation audit is only a tool, audit recommendations must be put into practice for water conservation to be realized.
The cost of an irrigation audit is approximately $90.00 and hour. A Certified Landscape Irrigation auditor can simply look at a site plan or go to the site and give a probable cost estimate. The county’s current water rate is $2.5 per each 100 cubic feet (water), 1000 square feet of turf is costs $46.75. If the turf is replaced with drought tolerant plant material, the same 1000 square feet the cost of water is reduced to $10.00.
Goal 5 - Waste Management Apply Goal 2 - With a Level 2 ASHRAE Audit from The Vert Group will include recommendations for to minimize refuge at no additional up front costs. They are performed on a contingency basis, a percent of any savings achieved. Apply Goal 4 - By removing existing turf and replacing with drought tolerant plant material will also minimize the green waste produced by mowing. Other recommendations:
Page 35
• Shred untreated wood and leaf wastes into chips and use them as mulch on garden beds to prevent weed growth, retain moisture, regulate soil temperature, and add nutrients back to the soil.
• When you mow, "grasscycle" by leaving grass clippings on your lawn instead of bagging them, or use a mulching mower. The clippings will return nutrients to the soil instead of taking up space in landfills.
Goal 6 - Sustainable Landscape Practices Apply Goal 4 –
• Replace turf with climate appropriate plant materials where possible • Replace turf in active and passive fields with GN-1 or Tifway Hybrid Bermuda Grass • Perform an in-house monthly audit on the irrigation systems for repairs. • Replace existing irrigation controllers with the County’s standard WeatherTrak Controller.
Contact Mozaffar Bahrami, Planning and Development, for all information regarding our WeatherTrak Controller Program.
• Apply the County’s Model Water Efficient Landscape Ordinance to all our landscapes. In addition,
• Preserve existing native vegetation: especially mature trees, to the extent possible. The functions of mature trees are difficult to replace with new plantings that will not reach maturity for several years.
• Use appropriate, non-invasive plants: Plants that are non-invasive and appropriate for local site conditions, climate, and design intent should be used to improve landscape performance and reduce resource use. Plants/seeds that are appropriate for site conditions, climate, and design intent and are nursery grown, legally harvested, or salvaged for reuse should be used.
• Prevent, detect, control, and manage invasive plants: As feasible, identify and remove all invasive species on-site and develop and implement an active management plan to prevent new introductions.
• Develop a comprehensive invasive plant management plan (either as a separate plan or as part of a larger natural resources or operations management plan) that addresses early detection, removal, prevention, and long-term management. This plan should also incorporate Integrated Pest Management Plan (IPM) practices and guidelines including treatments, long-term control (including monitoring), and best management practices for disposal of invasive plant materials to prevent spread. Invasive and/or non-invasive plants may be a character-defining part of a historic landscape or planting. If invasive non-native plants are to be maintained for historic reasons, they should be actively managed so that they do not spread or cause harm to the region.
• Maintain existing historic landscapes and plantings: Existing plantings and landscapes should be maintained if they are historic in their existing form and/or protect historic properties, extend the life cycle of existing stock, conserve resources, or reduce waste. In some cases, invasive plants may have cultural or historic value and are appropriate to be used in a new design, but should be actively managed to prevent spread.
• Use native plants: Where practicable, use vegetation native to the eco region. • Conserve plant communities native to the eco region: Plant communities native to the eco region
of the site that contribute to regional diversity of flora and provide habitat for native wildlife should be conserved.
• Restore plant communities native to the eco region: As feasible, restoration of the vegetated area should be pursued. Restoration of plants and plant communities native to the eco region of the site contributes to regional diversity of flora and provides habitat for native wildlife.
• Use vegetation to minimize building heating and cooling requirements: Vegetation and/or vegetated structures should be placed in strategic locations to shade buildings during the cooling season, thereby reducing energy consumption associated with indoor climate control. Windbreaks for buildings should be established to effectively block wind, but also not result in
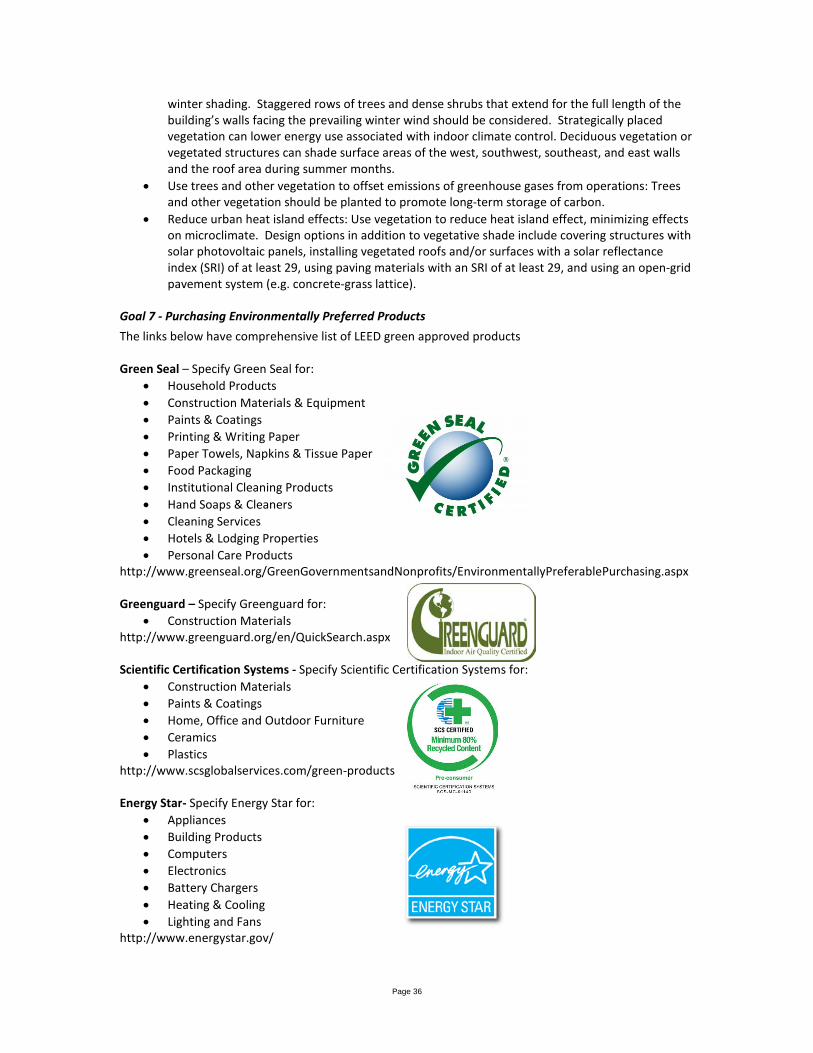
Page 36
winter shading. Staggered rows of trees and dense shrubs that extend for the full length of the building’s walls facing the prevailing winter wind should be considered. Strategically placed vegetation can lower energy use associated with indoor climate control. Deciduous vegetation or vegetated structures can shade surface areas of the west, southwest, southeast, and east walls and the roof area during summer months.
• Use trees and other vegetation to offset emissions of greenhouse gases from operations: Trees and other vegetation should be planted to promote long-term storage of carbon.
• Reduce urban heat island effects: Use vegetation to reduce heat island effect, minimizing effects on microclimate. Design options in addition to vegetative shade include covering structures with solar photovoltaic panels, installing vegetated roofs and/or surfaces with a solar reflectance index (SRI) of at least 29, using paving materials with an SRI of at least 29, and using an open-grid pavement system (e.g. concrete-grass lattice).
Goal 7 - Purchasing Environmentally Preferred Products The links below have comprehensive list of LEED green approved products Green Seal – Specify Green Seal for:
• Household Products • Construction Materials & Equipment • Paints & Coatings • Printing & Writing Paper • Paper Towels, Napkins & Tissue Paper • Food Packaging • Institutional Cleaning Products • Hand Soaps & Cleaners • Cleaning Services • Hotels & Lodging Properties • Personal Care Products
http://www.greenseal.org/GreenGovernmentsandNonprofits/EnvironmentallyPreferablePurchasing.aspx Greenguard – Specify Greenguard for:
• Construction Materials http://www.greenguard.org/en/QuickSearch.aspx Scientific Certification Systems - Specify Scientific Certification Systems for:
• Construction Materials • Paints & Coatings • Home, Office and Outdoor Furniture • Ceramics • Plastics
http://www.scsglobalservices.com/green-products Energy Star- Specify Energy Star for:
• Appliances • Building Products • Computers • Electronics • Battery Chargers • Heating & Cooling • Lighting and Fans
http://www.energystar.gov/

Page 37
Forest Certified Council –Specify Forest Certified Council for: • All product made from wood
https://us.fsc.org/
Goal 8 - Reduce
Stormwater Run-Off Reduce impervious surfaces and increase the vegetated land cover of the Park. Impervious surfaces include your roofs, driveways, paths, parking lots and lawn.
• Reduce rooftop runoff by directing building downspouts to vegetated areas, and not to the storm drain.
• For driveways, paths, parking lots, put in permeable concrete or sand set pavers (both are ADA) compliant are an alternative to non-permeable concrete.
Dry-weather urban runoff is a major source of pollution of bacteria, nutrients, and metals into our watersheds. These elements may be of particular concern in arid, urban watersheds where dry weather flow entirely consists of wastewater effluent and/or urban non-point source runoff. The source of dry weather run-off includes car washing, street and landscape washing and seepage of natural ground water. Yet the major source is the urban irrigation systems.
• Make sure the park irrigation heads are not throwing water onto the hardscape sidewalk or street. This is accomplished by completing Goal 4.
• Verify that the irrigation system’s watering schedule is developed by a certified irrigation professional and is followed. This is accomplished by completing Goal 4.
Goal 9 - Reduce Carbon Footprint Plant Trees Energy conservation as well as using clean energy sources is the key in reducing our carbon footprint, in realizing goals 2 and 3 the Department will be well on their way in reducing our carbon footprint. However, once the CO2 in the atmosphere the best way to sequester green house gases is by planting trees. A tree will absorb 50% of its weight in CO2 within it lifetime. Trees and vegetation that directly shade buildings decreasing demand for air conditioning and. By reducing energy demand, trees and vegetation decrease the production of associated air pollution and greenhouse gas emissions and improve the air quality. The County of Los Angeles Sheriff’s Department runs the PDC Nursery. This nursery has approximately 40,000 trees and plants in stock. These are provided to the Department’s facilities, saving the Department the cost of purchasing these items from outside vendors. Additionally, the Jail Enterprises Unit is able to generate additional revenues for the Department by selling the nursery products to other government agencies, nonprofit organizations, and Department members at significant savings. For location and availability of trees call: Los Angeles County Sheriff’s Department Correctional Services Division Jail Enterprises Unit Pitchess Detention Center 29300 The Old Road, BOQ 1, Room1 Castaic, CA 91384 [email protected] Phone: (661) 294-6311 (661) 294-6312 Fax: (661) 294-6315

Page 38
Goal 10 - Reduce Heat Island effect Plant Trees Just as trees help reduce our carbon footprint trees and other plants help cool the environment, making vegetation a simple and effective way to reduce urban heat islands. Trees and vegetation lower surface and air temperatures by providing shade and through evapotranspiration. Shaded surfaces, for example, may be 20–45°F (11–25°C) cooler than the peak temperatures of un-shaded materials. Evapotranspiration, alone or in combination with shading, can help reduce peak summer temperatures by 2–9°F (1–5°C).2, 3. Planting trees in strategic locations, e.g. around buildings or pavement in parking lots for shading and cooling. Researchers have found that planting deciduous trees or vines to the west is typically most effective for cooling a building, especially if they shade windows and part of the building’s roof. Shading in parking lot medians can provide extensive shading coverage Costs Although the benefits of urban forestry can vary considerably by community and tree species, they are usually higher than the costs. The five-city study discussed above found that, on a per-tree basis, the cities accrued benefits ranging from about $1.50–$3.00 for every dollar invested. These cities spent roughly $15–$65 annually per tree, with net annual benefits ranging from approximately $30–$90 per tree. Cool Roofs A high solar reflectance—or albedo—is the most important characteristic of a cool roof as it helps to reflect sunlight and heat away from a building, reducing roof temperatures. A high thermal emittance also plays a role, particularly in climates that are warm and sunny. Together, these properties help roofs to absorb less heat and stay up to 50–60°F (28–33°C) cooler than conventional materials during peak summer weather. Costs Although costs will vary greatly depending on location and local circumstances, cool roof coatings on a low-slope roof might cost $0.75–$1.50 per square foot, while single-ply cool roof membrane costs vary from $1.50–$3.00 per square foot. The cost premium for cool roofs versus conventional roofing materials ranges from zero to 5 or 10 cents per square foot for most products, or from 10–20 cents for a built-up roof with a cool coating used in place of smooth asphalt or aluminum coating.50 A California study found that cool roofs provide an average yearly net savings of almost 50 cents per square foot. This number includes the price premium for cool roofing products and increased heating costs in the winter as well as summertime energy savings, savings from downsizing cooling equipment, and reduced labor and material costs over time due to the longer life of cool roofs compared with conventional roofs. Cool Pavements Cool pavements include a range of established and emerging technologies that communities are exploring as part of their heat island reduction efforts. The term currently refers to paving materials that reflect more solar energy, enhance water evaporation, or have been otherwise modified to remain cooler than conventional pavements. Conventional paving materials can reach peak summertime temperatures of 120–150°F (48–67°C), transferring excess heat to the air above them and heating stormwater as it runs off the pavement into local waterways. Due to the large area covered by pavements in urban areas (nearly 30–45% of land cover based on an analysis of four geographically diverse cities1), they are an important element to consider in heat island mitigation.
50 http://www.epa.gov/hiri/mitigation/coolroofs.htm#2

Page 39
Goal 11 - Sustainable Building Practices Los Angeles County, CA: On January 16, 2007, the Los Angeles County Board of Supervisors adopted the Los Angeles County Sustainable Design Program, requiring all new County buildings over 10,000 square feet to earn LEED Silver certification. Nevertheless, if all our building were built with similar requirement the future expense increases for operations and maintenance would be reduced considerably. New construction or renovation we need to apply a system similar to Leadership in Energy and Environmental Design (LEED) to our smaller buildings to ensure they are as sustainable and as energy efficient as possible. The following list includes the requirements (applicable in parks) for LEED certification: USGBC is the leading authority for LEED green building education They have developed The LEED 2009 Reference Guide for Green Building Design and Construction which is the most comprehensive guide for the design, construction and major renovations of commercial and institutional buildings. This guide will provide our Agency with detailed information on the process for achieving the highest energy and water efficiencies and guide us toward sustainable construction and renovation.

Page 40

Page 41
Chapter 5 – Funding Sources Grants and Local Services California Department of Parks and Recreation, Office of Grants and Local Services (OGALS) provides funds to local and state agencies for park, recreation and resources related projects.
Land and Water Conservation Fund (LWCF) – Up to $2 million available for 2013 This year, the LWCF program is expected to provide nearly $2 million for grants to cities, counties and districts for the acquisition or development of outdoor recreation areas and facilities. Property acquired or developed under the program is federally protected in perpetuity for public outdoor recreation use. Habitat Conservation Fund (HCF) - $2 million available for 2013 The HCF program allocates approximately $2 million each year for grants to cities, counties, and districts to provide for nature interpretation and other non-capital outlay programs which bring urban residents into park and wildlife areas, to protect various plant and animal species or to acquire or develop wildlife corridors and trails.
The California Protection Agency Clean Beaches Initiative Grant Program
The CBI Grant Program provides funding for projects that restore and protect the water quality and the environment of coastal waters, estuaries, bays, and near shore waters. The CBI Grant Program was initiated in response to the poor water quality and significant exceedences of bacterial indicators revealed by Assembly Bill (AB) 411 (Stats. 1997, Ch. 765) monitoring at California’s beaches. Scientific studies have shown that water with high bacteria levels can cause infections rashes, and gastrointestinal and respiratory illnesses. The CBI Grant Program has provided about $100 million from voter-approved bonds for approximately 100 projects since it was started under the 2001 Budget Act. Typical projects include the construction of disinfecting facilities, diversions that prevent polluted storm water from reaching the beach, and scientific research that will enable early notification of unhealthy swimming conditions. The State Water Board adopted Resolution No. 2012-0020, which adopted revised Guidelines for this program.
Clean Water State Revolving Fund Program (CWSRF) The Federal Water Pollution Control Act (Clean Water Act or CWA), as amended in 1987, established the Clean Water State Revolving Fund (CWSRF) program. The CWSRF program offers low interest financing agreements for water quality projects. Annually, the program disburses between $200 and $300 million to eligible projects. The Green Project Reserve, or GPR, requires all Clean Water State Revolving Fund (CWSRF) programs to direct a portion of their capitalization grant toward projects that address green infrastructure, water efficiency, energy efficiency, or other environmentally innovative activities. Innovative environmental activities are those that demonstrate new and/or innovative approaches to managing water resources to prevent or remove water pollution in an economically and environmentally sustainable way, such as: decentralized wastewater treatment solutions, projects that facilitate adaptation of clean water facilities to climate change, and projects that identify and quantify the benefits of using integrated water resources management approaches.
The State of California Coastal Conservancy Program

Page 42
Conservancy Grant The Coastal Conservancy announces the availability of grants to government agencies and nonprofit organizations. Some examples of the kinds of projects the Coastal Conservancy may fund include trails and other public access to and along the coast, natural resource protection and restoration in the coastal zone or affecting coastal areas, restoration of coastal urban waterfronts, protection of coastal agricultural land, and resolution of land use conflicts.
The Conservancy’s GHG Climate Change Policy The Conservancy staff will work with applicants to identify, evaluate, and incorporate reasonable measures to reduce the greenhouse gas emissions of Conservancy-funded projects. The Conservancy will encourage use of best management practices and innovative designs that reduce greenhouse gas emissions and, as possible will support the development of such practices and designs through funding and other actions. The Conservancy’s Project Selection Criteria includes the following: Minimization of Greenhouse Gas Emissions (project design and construction methods include measures to avoid or minimize greenhouse gas emissions to the extent feasible and consistent with the project objectives.
Proposition 84 Storm Water Grant Program Proposition 84 Storm Water Grant Program funds is used to provide matching grants to local public agencies for the reduction and prevention of Storm Water contamination of rivers, lakes, and streams. Approximately $32 million will be available in the second round of Implementation funding in 2013/2014. Energy Efficiency and Conservation Block Grant Program Amount California Energy Commission Allocated: $49.6 million The EECBG Program helps cities and counties implement projects and programs that will:
• Reduce fossil fuel emissions in a manner that is environmentally sustainable, and to the greatest extent possible, maximize benefits for local and regional communities.
• Reduce total energy use. • Improve energy efficiency in the building sector, the transportation sector, and other appropriate
sectors. The EECBG Program was created by the Energy Independence and Security Act of 2007 (EISA). It is funded by the American Recovery and Reinvestment Act of 2009 (ARRA), which provides $787 billion in economic investment nationally to stimulate the economy. ARRA appropriates funding to the U.S. Department of Energy (DOE) to issue formula-based block grants to states, U.S. territories, large cities and counties, and Indian tribes. Under this program, states are required to use not less than 60 percent of the EECBG Program funds for small cities and counties. The Statewide Energy Efficiency Collaborative (SEEC) SEEC is a new alliance to help cities and counties reduce greenhouse gas emissions and save energy. SEEC provides education and tools for climate action planning, venues for peer-to-peer networking, technical assistance and recognition for local agencies that reduce greenhouse gas emissions and energy use. SEEC is collaboration between California’s four Investor Owned Utilities and three statewide non-profit organizations:
ICLEI – Local Governments for Sustainability ICLEI - Local Governments for Sustainability is a nation-wide local government membership association focused on climate protection and sustainability. ICLEI conducts workshops and training for local governments on key steps, they can take to reduce greenhouse gas emissions. ICLEI also develops and delivers a suite of resources to aid local governments in implementing measures that increase energy efficiency and reduce greenhouse gas emissions.
Page 43
The Institute for Local Government (ILG) ILG is the research and education affiliate of the California State Association of Counties and the League of California Cities. ILG’s California Climate Action Network provides the Beacon Award to recognize and celebrate cities and counties for saving energy, conserving resources, promoting sustainability and reducing greenhouse gas emissions. The Local Government Commission (LGC) LGC offers inspiration and networking opportunities to local elected officials and other dedicated community leaders who are working to create healthy, resource-efficient communities. LGC holds webinars on energy efficiency strategies, annual statewide conferences on greenhouse gas reduction and energy efficiency best practices, and provides peer-to-peer networking opportunities.
Utility Programs
California Investor Owned Utilities (IOUs) are required by the California Public Utilities Commission (CPUC) to offer energy efficiency programs to their customers. Each IOU program is unique; generally, the programs offer rebates, financing assistance, design assistance, educational seminars, and other forms of assistance. Rebates are typically a set amount of financial assistance for a specific energy efficiency technology though most utilities also offer custom rebate programs that are more flexible. Southern California Edison (SCE) SCE offers “Energy Management Solutions” for Government and Institutions. In Partnership with SCE, the county can develop a long-term energy management strategy that combines Energy Efficiency and Demand Response solutions to lower energy demand, as well as operating and capital costs. SCE's Energy Efficiency partnership program provides incentives to local governments toward achieving a joint vision of sustainability. SCE provides support to local governments to identify and address energy efficiency opportunities in municipal facilities, take actions supporting the California Long Term Energy Efficiency Strategic Plan and increase community awareness and participation in demand-side-management (DSM) opportunities. A key goal in SCE's local government partnerships is helping counties lead by example in addressing energy efficiency first in their own municipal facilities. In addition, the program strives to expand the policies and the energy management capacity at local governments to maintain a long-term sustainability focus. SCE currently has over 100 cities and counties participating in the local government partnership program.51 Refer to page 56 for a description of a DSM program. (SCE) Incentive Program Southern California Edison (SCE) offers incentives for non-residential customers, regardless of size and energy usage. [Express Efficiency] rebates for lighting, refrigeration, food service, agricultural equipment, premium efficiency motors, and air conditioning technologies are available for various non-residential customer types. Applicants may complete the necessary forms that can be found on the program website. In addition, SCE has a Custom Contracting program in which non-residential users have the option of designing an energy retrofit conservation measure. Incentives are based on the type of measure installed and the kWh saved and peak demand reduction over a 12-month period. Applicants are eligible to receive up to 50% of the cost for each measure type. The maximum incentive is $2,400,000 annually, per customer site. SCE targeted incentives customer type include government agencies. Rebate Amount
Lighting: Varies widely on type • Evaporative Coolers: $123/ton • Variable Frequency Drives: $80/HP • Package A/C and Heat Pumps: $100/unit
51 Government / Institutions Energy Management Solutions Guide and Incentives Application http://www.sce.com/nrc/ems/download/government.pdf

Page 44
• Customized HVAC/Cooling Applications: $0.15/kWh or $100/kW • Kitchen Ventilation: $300-$325/HP • Cooking Appliances: $200-$1250 unit • Holding Cabinet: $200-$300/unit • Ice Machine: $50-$500/unit • Refrigerator/Freezer: $50-$1000/unit • Refrigeration Controls: $75-$100/controller • Reflective Window Film: $1.35/sq. ft. • Electric Storage Water Heater: $30/unit • Plug load occupancy: $15/sensor • PC Network Software: $15/PC • Express Motors: $35-$1260/motor • Efficient Irrigation: $1.50/low pressure nozzle; $44/acre for drip irrigation • High-efficiency Copier: $100/unit • Customized Refrigeration, Cooking, Insulation, Motors, Office, and Miscellaneous:
$0.09/kWh saved; $100/kW saved Continuous Energy Improvement Program: Free Energy Efficiency Consulting Services Retro-commissioning Program: Free building screening, scoping, building operations investigation, documentation and training. For specific incentives under each non-residential category, see program web site. SCE also offers a Retro commissioning Program and Continuous Energy Improvement Program. The Retro commissioning Program is meant to identify various ways to cut energy usage in commercial buildings, saving customers money. SCE representatives will work with customers to identify specific, cost-effective energy efficiency solutions and improvements. Training will be provided to building managers, as well as a benchmark target for energy reduction. The Continuous Energy Improvement Program offers free energy consulting to customers to help them continue to implement energy efficient measures. Contact: Program Administrator - SCE Business Programs Southern California Edison Business Incentives & Services P.O. Box 300 Rosemead, CA 91772-0001 Phone: (800) 736-4777 E-Mail: [email protected] Web Site: www.sce.com/onbill Local Water Agencies Most local water agencies provide tips on water conservation and rebates for water saving technologies. While rebates vary across each water agency, local governments can take advantage of many of these programs including incentives for installing low flow toilets and efficient landscape irrigation systems. Check with the local water utility, as each is different. Some examples of conservation programs include those run by Metropolitan water District of Southern California, Santa Clara Valley Water District, and East Bay Municipal Utility District. California Public Utilities Commission (CPUC) The CPUC regulates privately owned electric, natural gas, water, and transit companies in California to ensure the provision of safe, reliable utility service and infrastructure. Two of the CPUC’s programs offer significant funding opportunities for local government sustainability efforts.
Page 45
The California Solar Initiative52 offers incentives to local governments that are customers Southern California Edison (SCE) in five easy steps earning incentives for solar energy is simple. Just follow these five easy steps:
Step 1: Energy Efficiency Audit- Complete energy efficiency audit and make sure to take advantage of all the cost-effective ways to save energy and money in your home or business. Step 2: Find a Solar Installer- Qualified contractors are your key to getting the most productive solar energy system for your home or business. Step 3: Apply for Rebates- Qualified contractors will handle the CSI application process for your rebates in two or three steps. Step 4: Install Your System- If you have received your reservation confirmation letter, you are ready to install your system and interconnect to the utility's power grid. Step 5: Claim Your Incentive- When your project is installed and operational you may submit the Incentive Claim Form.
Self-Generation Incentive Program (SGIP) provides incentives to support existing, new, and emerging distributed energy resources. Funding for non-solar electric generation is available for local governments that are customers of SCE or Southern California Gas (SCG). Qualifying technologies include wind turbines, waste heat to power technologies, pressure reduction turbines, internal combustion engines, micro turbines, gas turbines, fuel cells, and advanced energy storage systems.
Other Funding Opportunities Property Assessed Clean Energy (PACE) Financing. California allows local governments to set up loans for renewable energy and energy efficiency improvements to be paid back through property tax payments over a 20-year period. The loans carry a fixed interest rate and stay with the property, if the tenant or owner moves, the next tenant or owner continues to pay for the loan through property taxes. The U.S. Department of Energy (DOE) offers a guide for local governments on PACE financing.53 U.S. Department of Energy (DOE) The DOE Office of Energy Efficiency and Renewable Energy (EERE) operate most of DOE’s sustainability programs. EERE invests in clean energy technologies that strengthen the economy, protect the environment, and reduce dependence on foreign oil. The Solar America Cities program provides a guidebook that introduces a range of policy and program options that can help local governments build a sustainable local solar infrastructure and market. The Clean Cities program providing access to information and incentives from federal agencies and industry partners for high-impact projects.54 Strategic Growth Council (SGC) The SGC is tasked with coordinating the sustainable growth activities of multiple state agencies. Among the SGC’s tasks are to assist state and local entities in the planning of sustainable communities and meeting AB 32 goals. This includes providing SGC Grants for sustainable community planning, urban greening, and modeling. Other tasks of the SGC include improving air and water quality, protecting natural resource and agriculture lands, increasing the availability of affordable housing, improving infrastructure systems, and promoting public health. Energy Savings Performance Contracting (ESPC) Energy Savings Performance Contracting is a wide-ranging building retrofit option developed in the private sector. ESPCs are typically performed by an Energy Services Company (ESCO) and include a
52 About the California Solar Initiative (CSI) http://www.gosolarcalifornia.ca.gov/about/csi.php
53 Solar Powering your Community “A Guide for Local Govenments” http://www4.eere.energy.gov/solar/sunshot/resource_center/sites/default/files/solar-
powering-your-community-guide-for-local-governments.pdf
54 Clean Cities program http://www1.eere.energy.gov/cleancities/
Page 46
comprehensive building energy audit, a financial analysis of upgrade options, arrangement of project financing, installation of building upgrades, and post-installation performance monitoring and equipment maintenance. ESPCs are typically designed to be cash flow neutral, where the amount of monthly energy savings are at least equal to the amount of the monthly payment needed to finance the improvements. Most ESCOs guarantee the projected energy savings, and will reimburse the customer if the savings are not realized. ESPCs do not require public subsidies to operate successfully. However, a state or local government can encourage interest in ESPCs by offering rebates or subsidized financing, which may require public-sector funds. Governments with the ability to issue bonds at attractive rates can also aggregate and help raise capital for many smaller projects, passing along the lower interest rate from the large bond issuance to the smaller projects, particularly if the projects will be installed around the same time and have similar payback periods. Performance Contracting Characteristics
• Technology Focus Energy Efficiency and Renewable Energy (Limited) • Type of Measures Financed Whole-Building Upgrades • Target Sector(s) Public, Non-Profit, and Commercial & Industrial • Compatible Funding Sources Private Financing, Public Funds, Bonds • Security Required of Borrower Varies (often a UCC Filing on the financed equipment) • Repayment Mechanism Monthly Loan Payment to ESCO or Financial Institution • Complexity to Implement Simple to Complex • Role for State/Local Governments Public subsidies can enable projects and deep retrofits that
might otherwise not be viable • Impact per Dollar of Public Funds High
Considerations for State and Local Governments
• ESPCs are best suited to comprehensive building retrofits and upgrades to multiple building systems at the same time. If a building owner only wishes to replace a boiler, for example, an ESPC may not be the best option.
• ESPCs are traditionally energy-efficiency oriented, although more ESCOs are offering renewable energy options as part their standard services.
• ESPCs are an excellent choice for upgrading state or local government buildings. • Most ESPC projects consist of two agreements: (1) a guaranteed energy savings agreement
(GESA) between the customer and the ESCO that covers the engineering, equipment selection, installation, commissioning, and ongoing measurement and verification costs and project costs; and (2) a financing agreement between the customer and the lender or investors funding the project.
• Many states have legislation in place to authorize ESPCs and confirm that financing would be treated as an operating expense rather than debt (www.ornl.gov/info/esco/legislation/newesco.shtml).
Advantages Disadvantages
• ESPCs are well established, have strong private-sector support, and have a proven track record of success.
• The ESCO guarantee reduces customer risk.
• Most projects do not require any public subsidy.
• ESPCs are suitable for larger buildings only, where the project size is sufficient to be of interest to an ESCO (typically $1 million or more).
• These are negotiated contracts that require an understanding of how energy efficiency projects work.
When to Use Performance Contracting
Performance contracting is for large, whole-building retrofits. Performance contracting works well for public and non-profit buildings and engages the private-sector industry. ESPC is best for programs where energy efficiency is the priority, rather than renewable energy. Building owners are most likely to use an ESPC when they do not have available cash to make improvements, lack the expertise or time to implement retrofit projects on their own, or need the performance guarantees to obtain approval to do the project. Rebates can also be used to encourage more extensive retrofit projects. Power Purchase Agreement (PPA) In a Power Purchase Agreement, a developer or independent financier pays for and installs renewable energy equipment on the property of an end-user. The property owner then buys the electricity produced by the renewable energy at some pre-determined rate (either fixed or variable) for a set amount of time (typically between 10 and 20 years). Tax credits stay with the developer, and are usually reflected in lower energy prices for the user. A solar lease is similar to a PPA, but instead of purchasing power, the property owner rents the installed equipment. The combination of the lease payment and the reduced energy bill is typically less than the old bill. Power Purchase Agreements & Solar Leasing Characteristics
• Technology Focus Renewable Energy • Type of Measures Financed Solar, Geothermal, Wind, Biomass, Landfill Gas, etc. • Target Sector(s) Commercial & Industrial, Residential, Public, and Non-Profit • Compatible Funding Sources Private Investors or Lenders (for Developer Capital) • Security Required of Borrower UCC Filing • Repayment Mechanism PPAs –Through Negotiated Price per kWh; Solar Lease –
Monthly Payments to Equipment Owner • Complexity to Implement Simple (Solar Leases) to Complex (PPAs) • Role for State/Local Governments If PPAs and solar leasing are not viable, a small public subsidy
may be enough to make a difference • Impact per Dollar of Public Funds Moderate to High
Considerations for State and Local Governments
• PPAs are attractive to any institution on a tight budget and that wishes to keep the assets off their balance sheet. No down payment is needed and the capital is provided by the developer/investor, who owns the project.
• The ability to capture the tax benefits makes PPAs attractive to public-sector clients who might otherwise have to give them up.
• Larger projects may generate more electricity than the property owner can use. In states where net metering is allowed, excess energy can perhaps be sold to the local utility.
Tax-Exempt Lease-Purchase Agreements Also known as, municipal leases, these agreements presume that the state or local government will own the asset after the lease expires. Further, the effective interest rate is reduced because interest payments received from the government are exempt from federal income tax. In most states, tax-exempt lease-purchase agreements are not considered debt and rarely require public approval. If funds are not appropriated to pay, the lease in future budgets, the equipment is returned and the lease is terminated. For this reason, these leases are usually limited to equipment that is essential to the operation of the entity. In New Hampshire, a Master Lease Program (MLP) was combined with a Performance Contract to consolidate several projects under one lease agreement and achieve a lower cost of financing.
Page 48
Chapter 6- The Site Criteria, Site Selection for the “Model Green Park” The choice of existing park site for the development of a “Model Green Park” should be considered the first step of the design process. Finding the best site for the project enhances design, construction, and educational opportunities. Project Selection Criteria Promotion of the “Sustainable Parks Program” goals and purposes
• How well can the site accommodate the aspirations of the “Sustainable Parks Program” • Support from the managing Department Field Agency • Support from the surrounding community • Location – dense urban setting • Need (e.g. existing buildings, irrigation, or infrastructure needs to be replaced, upgraded or
repaired) • Urgency (highest in need of existing buildings, irrigation, or infrastructure needing to be
replaced, upgraded or repaired) • Public educational opportunities (the selected park has a high potential of making a major impact
on the public) • The potential range of sustainability method and material that can be implemented (e.g. building
upgrade, landscape and irrigation redesign and replacement, stormwater management, heat island reduction).
• To what degree could the facility be made sustainable • Leverage (available funding) • Opportunity for innovation (e.g. demonstration of environmental conservation) • Readiness (ability to start and finish the project in a timely manner) • Cooperation (extent to which the Dept. of Parks and Recreation will support and contribute to
the project)

Page 49
Appendices
The County Energy and Environmental Policy The following is a brief description of the County's Energy and Environmental Policy's The Energy and Environmental Team Different aspects of the County's energy and environmental policy programs are housed in various County departments. There is no single agency responsible for all aspects of these programs. Towards this end, a multi-departmental Energy and Environmental Team will be established to further develop existing energy and environmental policy goals and objectives and to monitor the policy's programs. The Team shall be chaired by the ISD and shall include representatives from the CAO, DPW, Regional Planning Department and other key County departments. The Team shall also work with all County departments, other public agencies, and industry organizations to recommend to the Board new energy and environmental programs to be included under this policy. With the Board's approval, the Team shall develop new program initiatives, goals and objectives. The Team shall provide semiannual reports to the Board of Supervisors on the status of all County energy and environmental programs and, periodically, provide information to the public and other entities on program accomplishment Program Areas: Energy and Water Efficiency This program area focuses on reducing the County's consumption of energy (electricity and natural gas) and water to achieve the goal of reducing energy consumption in County facilities by 20% by the year 2015. This goal is consistent with the Governor's Green Building Executive Order (S-20-04) and the State Energy Action Plan, which establishes a similar goal for state facilities. County departments shall reduce energy and water consumption through initiatives that include:
• Implementing and monitoring energy and water conservation practices The Internal Services Department (ISD), the Department of Public Works (DPW) and the Chief Administrative Office (CAO) shall help County departments conserve electricity, natural gas and water through conservation efforts. These programs focus on reducing energy consumption during expensive, "peak-usage" periods. They include such items as setting thermostats (heating and cooling) at more appropriate levels, turning off unused lighting and other measures, watering at ideal times of the day and other changes in behavior and programs. • Implementing energy and water efficiency projects ISD and the CAO shall assist County departments conserve electricity and natural gas by optimizing building systems (also referred to as -retro-commissioning) and implementing energy efficiency projects. Retro commissioning essentially means returning buildings to their peak energy performance through the repair and tune-up of energy systems, such as cooling, heating and ventilation. In the area of water, the DPW Recycled Water Task Force will make policy recommendations to the Board, which, if adopted, shall assist departments meet water conservation objectives by increasing the use of recycled water for irrigation and other uses at County facilities. ISO and
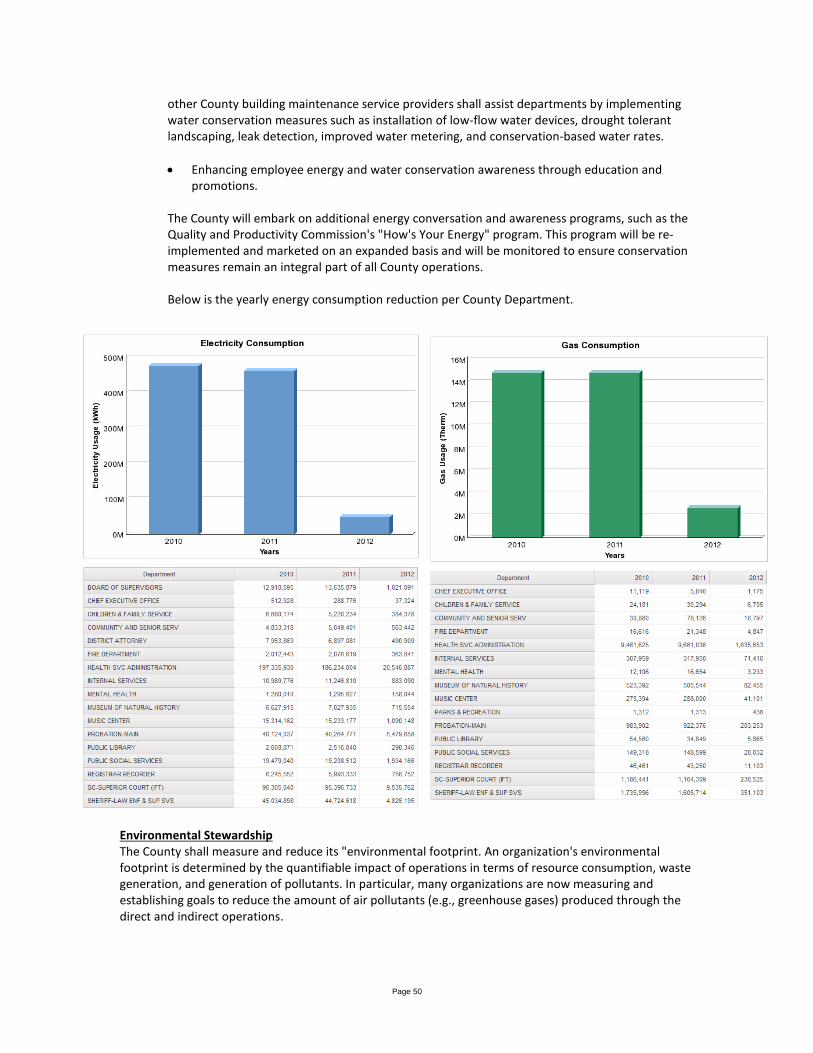
Page 50
other County building maintenance service providers shall assist departments by implementing water conservation measures such as installation of low-flow water devices, drought tolerant landscaping, leak detection, improved water metering, and conservation-based water rates. • Enhancing employee energy and water conservation awareness through education and
promotions. The County will embark on additional energy conversation and awareness programs, such as the Quality and Productivity Commission's "How's Your Energy" program. This program will be re-implemented and marketed on an expanded basis and will be monitored to ensure conservation measures remain an integral part of all County operations. Below is the yearly energy consumption reduction per County Department.
Environmental Stewardship The County shall measure and reduce its "environmental footprint. An organization's environmental footprint is determined by the quantifiable impact of operations in terms of resource consumption, waste generation, and generation of pollutants. In particular, many organizations are now measuring and establishing goals to reduce the amount of air pollutants (e.g., greenhouse gases) produced through the direct and indirect operations.

Page 51
This program area of the Energy and Environmental Policy shall prepare the County for adherence to potential greenhouse gas reduction legislation requirements and participation in future emission reduction credit markets. Towards this end, the County shall join the California Climate Action Registry (Registry), a non-profit public/private partnership that serves as a voluntary greenhouse gas registry to protect, encourage, and promote early actions to reduce greenhouse gas emissions. ISO shall work with the Registry to assist the County in developing measurement and reporting protocols and establishing goals for reduction of greenhouse gases. This reporting will be sent to the Registry and to the Board of Supervisors as part of regular updates by the Energy and Environmental Team (Team). This type of emissions monitoring and reporting may be required by the state as part of the implementation of the Greenhouse Gas Reduction Act (AB 32) which became California law this year. The Environmental Stewardship Program will maximize the potential to "green" basic County operations. This program includes such areas as: • Environmentally Responsible Purchasing Standards. The Team will investigate requirements and
preferences for environmentally friendly packaging, greater emphasis on recycled products, minimum energy efficiency standards (e.g., "Energy Star"), for appliances, etc.
• Recycling Programs. Although the County, through DPW, has placed a great deal of emphasis on
recycling and landfill volume reduction for County constituents there needs to be more emphasis on recycling and waste reduction within County buildings. As an example, all County buildings should have recycling bins in visible areas for the segregation of paper, plastic, glass and other recyclables from normal waste areas for the segregation of paper, plastic, glass and other recyclables from normal waste.
• Environmentally Friendly Products. The Team will investigate practices such as requiring the use of
environmentally friendly cleaners and solvents (i.e., as opposed to chemicals) in the County's custodial operations.
• Existing County Operations. To support environmental initiatives, the Team will investigate the
utilization of existing resources. As an example of this, ISO will be exploring the feasibility of using its messenger operations as the primary pick-up for batteries and ink cartridges.
The above items will complement the initiatives that the Board has already implemented in this area including the HHW/E-Waste Management Programs (Household Hazardous Waste/Electronic-Waste), Clean Fuels Program, Flexible Fuel Vehicles initiative, and the Off-Peak Delivery of supplies and commodities policy. Public Outreach and Education The Public Outreach and Education Program shall utilize County communication and outreach channels to share utility industry information, facilitate implementation of assistance programs, and spread information and education on energy conservation practices through the region. The Team, in coordination with the region's utility companies, shall implement a program, which provides County residents with energy related information to include:
o Energy and Water Conservation practices, o Utility rates and rate changes, o Rotating power outage information, o Emergency power outage information, o Energy efficiency incentives.

Page 52
The Team shall seek collaborations with local governments, public agencies and County affiliates to strengthen regional, centralized energy and environmental management resources and identify and develop opportunities for information and cost sharing in energy management and environmental activities. Sustainable Design The purpose of the County's Sustainable Design Program is to optimize the performance and extend the useful life of the County's buildings through the integration of sustainable, "green" features into the design of the County's capital improvement and refurbishment projects. Toward this end, the program seeks to:
• Enhance building sustainability through the integration of green, sustainable principles into the planning, design, and construction of County capital projects which:
o Complement the functional objectives of the project; o Extend the life cycle/useful life of buildings and sites; o Optimize energy and water use efficiency; o Improve indoor environmental quality and provide healthy work environments; o Reduce ongoing building maintenance requirements; and o Encourage use and reuse of environmentally friendly materials and resources.
• Establish a management approach that instills and reinforces the integration of sustainable
design principles into the core competency skill set of the County's planners, architects, engineers, and project managers.
• Establish practical performance measures to determine the level of sustainability achieved
relative to the objectives targeted for the individual project and overall capital program. The feasibility of incorporating sustainable design features will be determined for each County capital improvement and refurbishment project, based upon the following criteria:
o Consistency with project objectives o Design innovation o Potential environmental benefit o Development and implementation costs o Potential economic benefit/cost avoidance o Available funding
Feasibility assessments will be conducted by a Sustainable Design Evaluation Team comprised of professionals from the DPW that are certified under the Leadership in Energy and Environmental Design (LEED) Program and staff from the CAD. Projects will be categorized as follows:
• Capital improvement and refurbishment projects that can feasibly incorporate sustainable design features to a certain degree.
• Capital improvement and refurbishment projects that are eligible for certification under the LEED
Program. • Capital improvement and refurbishment projects that cannot feasibly accommodate sustainable
design features.
Recommendations regarding the categorization of each project and the nature and level of sustainability to be achieved will be developed by the CAO and DPW for approval by the Board of Supervisors.
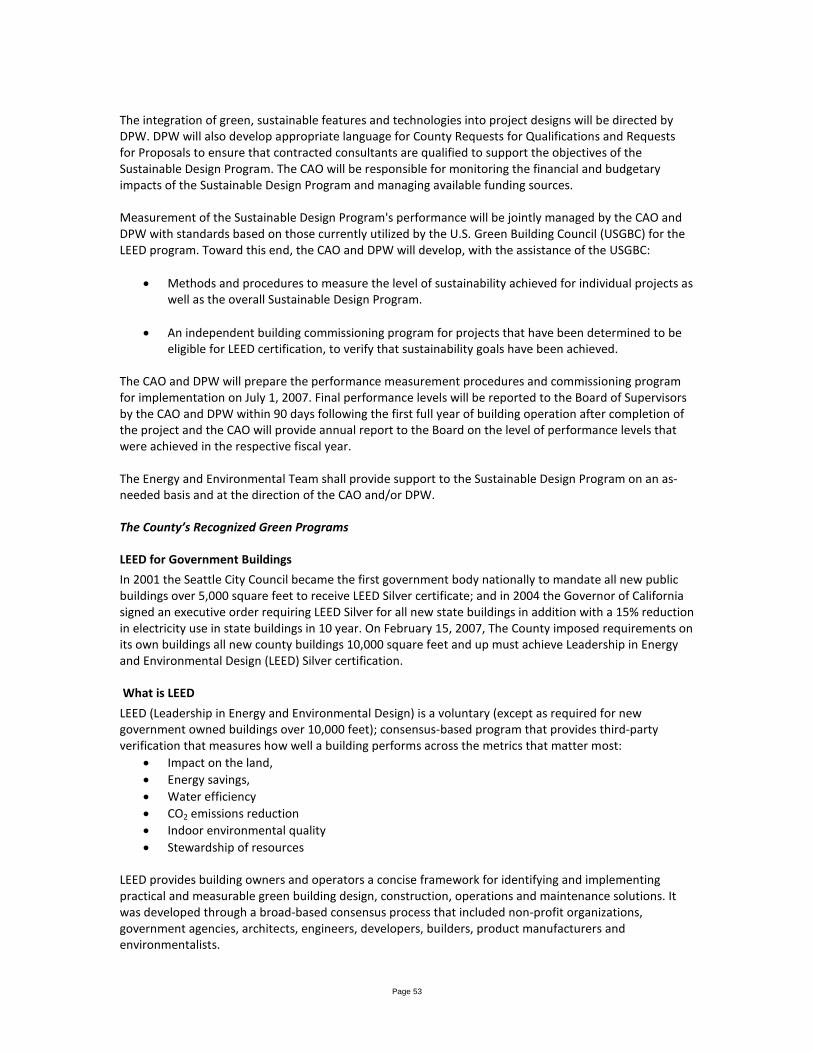
Page 53
The integration of green, sustainable features and technologies into project designs will be directed by DPW. DPW will also develop appropriate language for County Requests for Qualifications and Requests for Proposals to ensure that contracted consultants are qualified to support the objectives of the Sustainable Design Program. The CAO will be responsible for monitoring the financial and budgetary impacts of the Sustainable Design Program and managing available funding sources. Measurement of the Sustainable Design Program's performance will be jointly managed by the CAO and DPW with standards based on those currently utilized by the U.S. Green Building Council (USGBC) for the LEED program. Toward this end, the CAO and DPW will develop, with the assistance of the USGBC:
• Methods and procedures to measure the level of sustainability achieved for individual projects as well as the overall Sustainable Design Program.
• An independent building commissioning program for projects that have been determined to be
eligible for LEED certification, to verify that sustainability goals have been achieved. The CAO and DPW will prepare the performance measurement procedures and commissioning program for implementation on July 1, 2007. Final performance levels will be reported to the Board of Supervisors by the CAO and DPW within 90 days following the first full year of building operation after completion of the project and the CAO will provide annual report to the Board on the level of performance levels that were achieved in the respective fiscal year. The Energy and Environmental Team shall provide support to the Sustainable Design Program on an as-needed basis and at the direction of the CAO and/or DPW.
The County’s Recognized Green Programs
LEED for Government Buildings In 2001 the Seattle City Council became the first government body nationally to mandate all new public buildings over 5,000 square feet to receive LEED Silver certificate; and in 2004 the Governor of California signed an executive order requiring LEED Silver for all new state buildings in addition with a 15% reduction in electricity use in state buildings in 10 year. On February 15, 2007, The County imposed requirements on its own buildings all new county buildings 10,000 square feet and up must achieve Leadership in Energy and Environmental Design (LEED) Silver certification.
What is LEED LEED (Leadership in Energy and Environmental Design) is a voluntary (except as required for new government owned buildings over 10,000 feet); consensus-based program that provides third-party verification that measures how well a building performs across the metrics that matter most:
• Impact on the land, • Energy savings, • Water efficiency • CO2 emissions reduction • Indoor environmental quality • Stewardship of resources
LEED provides building owners and operators a concise framework for identifying and implementing practical and measurable green building design, construction, operations and maintenance solutions. It was developed through a broad-based consensus process that included non-profit organizations, government agencies, architects, engineers, developers, builders, product manufacturers and environmentalists.
Page 54
Points are credited to the project in several categories for new construction and existing buildings, they include:
• Sustainable Sites (SS) promotes responsible, innovative, and practical site maintenance strategies that are sensitive to plants, wildlife, water, and air quality. These credits also mitigate some of the negative effects buildings have on the local and regional environment. Environmentally sensitive site maintenance practices reduce site operations and maintenance costs while creating and maintaining outdoor spaces that are attractive and healthy for both building occupants and local flora and fauna.
• Water Efficiency (WE) encourages the use of strategies and technologies that reduce the amount of potable water consumed in facilities. Many water conservation strategies are no cost; others provide rapid payback. Some, such as biological wastewater treatment systems and gray-water plumbing systems, require investments that are more substantial and are cost-effective only under certain building and site conditions.
• Energy and Atmosphere (EA) addresses the reduction of energy consumption through a performance-based approach that allows owners and managers to tailor energy reduction measures to their buildings. Improving the energy performance of facilities lowers operating costs, reduces pollution, and enhances occupant comfort. Many energy efficiency measures have a rapid payback because of the rising cost of energy.
• Materials and Resources (MR) sets the foundation for developing, implementing, and documenting policies and practices that support effective waste management and responsible procurement. The MR credit category focuses on two main issues: the environmental impact of materials brought into the facility and the minimization of landfill and incinerator disposal for materials taken out of the facility.
• Indoor Environmental Quality (IEQ) addresses concerns relating to indoor air quality; occupant’s health, safety, and comfort; air change effectiveness; and air contaminant management. The IEQ credit category encourages improvements to ventilation, indoor CO2levels, daylighting and lighting quality, and thermal comfort – all of which have the potential to impact occupant health and performance.
• Innovation & Design/Innovation & Operations (ID/IO) recognizes projects for innovative and exemplary technologies, methods, project planning, and project execution.
• Regional Priority (RP) addresses environmental concerns that are local priorities for each region of the country, as identified by USGBC’s regional councils, chapters, and affiliates. A project that earns a regional priority credit will earn one bonus point in addition to any points already awarded for that credit. Up to four extra points can be earned in this way.
The Sustainable Sites Initiative The Sustainable Sites Initiative™ (SITES™) is an interdisciplinary effort by the American Society of Landscape Architects, the Lady Bird Johnson Wildflower Center at The University of Texas at Austin and the United States Botanic Garden to create voluntary national guidelines and performance benchmarks for sustainable land design, construction and maintenance practices. The U.S. Green Building Council (USGBC), a stakeholder in the Initiative, anticipates incorporating these guidelines and performance benchmarks into future iterations of the LEED® (Leadership in Energy and Environmental Design) Green Building Rating System™ Similar to LEED points are credited to the project in several categories, they include: Site Selection – encourages selecting locations to preserve existing resources and repair damaged systems. Limits development of soils designated as prime farmland, unique farmland, and farmland of statewide importance. Protects floodplain functions, preserves wetlands, preserves threatened or endangered species and their habitats. Encourages the selection brownfields or greyfields for
Page 55
redevelopment, sites within existing communities, sites that encourage non-motorized transportation and use of public transit.
• Site Design - Water - Protect and restore processes and systems associated with a site’s hydrology
• Site Design -Soil and Vegetation • Site Design - Materials Selection - Reuse/recycle existing materials and support sustainable
production practices • Site Design - Human Health and Well-Being - Build strong communities and a sense of
stewardship • Construction - Minimize effects of construction-related activities • Operations and Maintenance - Maintain the site for long-term sustainability • Monitoring and Innovation - Reward exceptional performance and improve the body of
knowledge on long-term sustainability
Energy Star ENERGY STAR®is a U.S. Environmental Protection Agency program helping businesses and individuals fight global warming through superior energy efficiency.
Energy Star for Local Government Program Collaborating with ENERGY STAR is a commitment to your taxpayers as well as the environment. Local and state governments, as well as federal agencies, that partner with EPA and take the ENERGY STAR Challenge demonstrate their commitment to taxpayers as well as the environment. State and local officials can leverage EPA’s no-cost ENERGY STAR Portfolio Manager Tool to assess the energy use of buildings to identify their best opportunities for improvement, track performance over time, and document savings results. Visit www.energystar.gov/benchmark to get started using Portfolio Manager. What is Energy Stars Portfolio Manager Projects Portfolio Manager is an interactive energy management tool that allows users to track and assess energy and water consumption in individual buildings—and across entire portfolios of buildings—in a secure online environment. Portfolio Manager enables users to compare the energy use of similar buildings. Enter energy use data into the tool to:
• Identify under-performing buildings to target for energy efficiency improvements. • Prioritize efforts by identifying under-performing buildings. • Establish baselines to set goals and measure progress for energy efficiency improvement projects
over time. Portfolio Manager allows users to track key consumption, performance, and cost information during energy efficiency improvement projects. Use Portfolio Manager to:
• Monitor energy efficiency improvements compared to a baseline. • Track reductions in greenhouse gas emissions. • Monitor energy and water cost savings.
Portfolio Manager can help users quickly document reductions in energy use, greenhouse gas emissions, water use, and costs for an individual building or an entire portfolio. This valuable information can be used to provide a level of transparency and accountability to help demonstrate strategic use of ARRA 2009 funding. With Portfolio Manager, you can:
• Generate a Statement of Energy Performance (SEP) for each building, summarizing important performance indicators, including energy use intensity and greenhouse gas emissions associated with building energy use.
• Download all performance metrics into Microsoft®Excel.
Page 56
• Request an Energy Performance Report that shows reductions in key performance indicators over a user specified time period.
Demand-Side-Management (DSM) Programs When we think about our local electric utility (and most of us do that only rarely), we likely envision power plants, transmission lines, the meter on the side of our house, and, of course, our monthly electric bill. Mostly, we view utilities as providers of electric power. However, more and more utilities now provide both electricity and related services to help customers reduce their electric bills. Such services also have a social benefit: because energy demand is controlled, emissions of carbon dioxide are reduced, slowing global warming. These services are provided by demand-side management (DSM) programs. Using DSM, utilities can affect the amount and timing of electricity use. They can reduce the amount of electricity use by improving the technical and operational efficiency of electricity use. The timing of electricity use can be influenced by direct-load control programs in which the utility controls equipment at the customer site and by electricity-pricing options that vary the price of electricity with time of use. DSM programs are supported by the U. S. Department of Energy and its predecessor agencies since 1970.
SCE, one of the County’s largest electricity provider, offers a variety of Demand Response Programs to help qualifying customers reduce their energy usage during peak times while lowering their electricity costs. Qualifying customers who can reduce power when statewide energy supplies are low (or when energy prices rise) may earn financial incentives, and/or other benefits by participating in these programs. While saving money, your participation can make a difference in California's energy and economic well-being. For additional opportunities to reduce energy costs, you may enroll in more than one demand response program at a time. 10 For 10 Program
• Agricultural and Pumping Interruptible Program (AP-I) • Automated Demand Response (Auto-DR) Customized and Express Technology Incentives • Time-of-Use Base Interruptible Program (TOU-BIP) • Capacity Bidding Program (CBP) • Summer Advantage Incentive (SAI) also known as Critical Peak Pricing (CPP) • Demand Bidding Program (DBP) • Demand Response Contracts • Optional Binding Mandatory Curtailment Program (OBMC) • Summer Discount Plan (SDP) • Real-Time Pricing (RTP-2) • Pumping and Agricultural Real-Time Pricing (PA-RTP) • Scheduled Load Reduction Program (SLRP)
Sub metering Finding Opportunities for Sub metering In general, there are two ways the Department can encourage reductions in energy or water use: through increased resource efficiency or through resource conservation. Resource efficiency is usually increased through the installation of new technologies that deliver the same service (lighting, heating and cooling, hand washing, etc.) while using less energy or water. Resource conservation, on the other hand, is achieved through improved operation and maintenance (O&M) practices and/or occupant behaviors such as reducing unnecessary lighting or heating loads and reprogramming energy control systems. By using submeters, resource use can be measured from an entire campus down to an individual building, from a building system or interior space, or even at the scale of an occupant’s end-use load. Submetering is capable of providing data at near-continuous time resolution and at a sub-building scale. As an example,

Page 57
end-use loads from electrical devices used by building occupants represent the area of largest demand growth in buildings. Through the use of submeters, these plug loads may be quantified using an individual measuring device at each plug outlet or at multiple outlets along a single distribution line. This provides insight into daily, weekly, or seasonal O&M issues, occupant behaviors, performance of installed equipment (e.g., HVAC and lighting), and verification of installed efficiency technologies. This approach also provides the necessary insight to drive conservation through changes in occupant behaviors or continual improvements to building O&M procedures as conditions change over time.
Water Budget and Conservation Letter Sent to all Parks and Recreation Staff from John Wicker December 26, 2012 TO: All Parks and Recreation Staff FROM: John Wicker- Chief Deputy Director SUBJECT: WATER BUDGET AND CONSERVATION The Department is experiencing a dramatic increase in water usage at various facilities. For the first four months of this fiscal year, (July - October 2012) the Department paid $3.9 million of water bills, which is 60 percent of the water budget. If this alarming trend continues, the Department may have a $2 million deficit in the utility budget by the end of the fiscal year. Below are some recommendations that staff should follow immediately to reduce our water consumption:
• Reduce your facility's programmed water use by at least 10 percent (i.e. reduce scheduled water cycles on controllers by 10 percent).
• Test irrigation systems and look for leaks or broken sprinkler heads. • For facilities with smart controllers, ensure that controllers are working properly and repairs are
handled immediately. In addition, do not manually operate the controllers. • For sites without smart controllers, check weather patterns so that watering can be adjusted
accordingly. • Review and analyze utility consumption and landscape layouts for new and or future projects to
ensure that the most cost effective landscapes are installed. • Plant water-friendly trees and plants. • Improve on water management practices that reduce the use of water.
Please ensure that this memo is posted at each facility. Water and energy conservation is a priority for the Department. Your cooperation in implementing the above recommendations is appreciated. If you have any questions or need utility usage data to better monitor your facility, please contact Ross Varone of Management Services at [email protected] or at (213) 738-3037.

Page 58