Embed Size (px)
Citation preview

PROJECT DESIGN DOCUMENT FORM (CDM PDD) - Version 03 .1. CDM – Executive Board page 1
CLEAN DEVELOPMENT MECHANISM
PROJECT DESIGN DOCUMENT FORM (CDM-PDD) Version 03 - in effect as of: 28 July 2006
CONTENTS
A. General description of project activity B. Application of a baseline and monitoring methodology C. Duration of the project activity / crediting period D. Environmental impacts E. Stakeholders’ comments
Annexes Annex 1: Contact information on participants in the project activity Annex 2: Information regarding public funding Annex 3: Baseline information
Annex 4: Monitoring plan Annex 5: Environmental Impact Assessment

PROJECT DESIGN DOCUMENT FORM (CDM PDD) - Version 03 .1. CDM – Executive Board page 2 SECTION A. General description of project activity A.1 Title of the project activity: Quezon City Controlled Disposal Facility Biogas Emission Reduction Project (QCCDFBERP), herein referred to as the project activity Version 11 Date of the document: 30/11/2007
A.2. Description of the project activity : The Project activity involves the extraction, collection, processing and flaring, including the conversion of the biogas emissions at the Quezon City Controlled Disposal Facility (“Facility”) located in Area 2, Barangay Payatas, Quezon City, Philippines into electricity. This project activity was developed primarily to address the environment, health and safety concerns of the local government of Quezon City for its constituents, particularly those residing in the immediate surroundings of the Facility. A pioneering project activity in the Philippines, it also aims to promote the application of appropriate technology and know-how for the extraction, collection and processing of biogas from solid urban wastes and as a result demonstrate its environmental, social and economic benefits For controlled dumpsites such as the Quezon City Controlled Disposal Facility, the Philippine rules and regulations do not require the management of the Facility’s biogas emissions, so the Quezon City government does not need to undertake this type of projects. However, aware of the adverse impacts of the biogas coming from the dumpsite, on the health of its people and on the environment as a whole, and also considering the relevant safety hazard to the nearby community, Quezon City deemed it necessary to immediately address the situation. In May 2006, Pangea Green Energy S.r.l., together with Pangea Green Energy Philippines Incorporated, expressed its interest to develop and implement the Project for Quezon City. After a thorough evaluation of the technical and financial capability of the two companies (collectively called “Pangea”), Quezon City granted Pangea the right to fully and exclusively implement, manage and operate the Project through the signing of a Memorandum of Agreement (MOA) in February 14, 2007. In the MOA, Pangea was given the right to extract, collect and process the biogas produced by the Facility for a minimum of 10 years in order to mitigate the pollution caused by the biogas emissions. Detailed obligations of Pangea under the MOA include the planning, building, management, operation and maintenance of the biogas extraction, collection and processing plant. Pangea will provide the necessary investment to accomplish its obligations. The Quezon City Local Government Unit (LGU) will continue to be the owner and operator of the disposal facility. As such, the LGU will be responsible for the overall management of the disposal facility according to the Philippine laws, rules and regulations, and ensure Pangea’s uninterrupted implementation of the Project. The project will be implemented in two phases. During phase 1, the combustion plant will be composed of a biogas extraction system (wells and blower), a high-temperature torch for flaring the methane extracted and an electrical engine for on-site power supply. The electrical engine will be fed by biogas during plant operation (about 7,500 hours/year). An electrical connection to the local grid will be

PROJECT DESIGN DOCUMENT FORM (CDM PDD) - Version 03 .1. CDM – Executive Board page 3 provided in order to supply electricity requirement of the plant during engine maintenance and start-up operations. Phase 2 will begin on the third year, depending on the actual availability of biogas and the financial and technical viability of the project, Pangea will install a bigger biogas electrical engine (about 700 kW) for the conversion of a portion of the methane to electricity that will be delivered to the local grid. A.3. Project participants:
Name of the Party involved
Private and/or public entity(ies) project participants (as applicable)
Kindly indicate if the Party involved wishes to be considered as project
participant Quezon City Government
(Public entity) No
Philippines (host) Pangea Green Energy Philippines, Incorporated
(Private entity) No
Italy Pangea Green Energy S.r.l.
(Private entity) No
A.4. Technical description of the project activity: A.4.1. Location of the project activity: Area 2, Barangay Payatas, Quezon City, Metro Manila, Philippines (see Figure 2) A.4.1.1. Host Party(ies): Republic of the Philippines (see Figure 2) A.4.1.2. Region/State/Province etc.: Metro Manila (see Figure 2) A.4.1.3. City/Town/Community etc: Barangay Payatas, Quezon City (see Figure 2) A.4.1.4. Detail of physical location, including information allowing the unique identification of this project activity (maximum one page): The Project is located in Area 2, Barangay Payatas, Quezon City (see Figure 1). The 22-hectare disposal facility was the disposal site for Metro Manila’s municipal solid waste (MSW) from 1973 until July 10th 2000, when, after a period of heavy rain, a trash slide occurred in the Payatas open dump, which was consequently closed. Figure 1 indicates the portion of the landfill affected by trash slide and the layout of the proposed biogas collection system and energy recovery plant.

PROJECT DESIGN DOCUMENT FORM (CDM PDD) - Version 03 .1. CDM – Executive Board page 4
Figure 1 - Payatas landfill plant (in red it is pointed out the area interested by the 2000 trashslide) –the
location and the layout of the proposed LFG recovery and treatment plant are showed However, due to lack of alternative disposal sites, it was reopened in November 2000 pursuant to an Executive Order signed by President Joseph Estrada instructing the conversion of this open dump to a controlled dump and making it an exclusive dumpsite of Quezon City. In response to this, the Quezon City government created the Payatas Operations Group (POG) on 12 November 2000 specifically to manage, operate and secure the dumpsite. From then up to present, the Facility has received an average of 2.4 million cubic meters of MSW per year. It is scheduled for closure at the end of 2007.
Area interested by the trashslide on 2000, July 10
LFG treatment plant (combustion and power plant)
Mound 1 (old) Mound 2 (new)

PROJECT DESIGN DOCUMENT FORM (CDM PDD) - Version 03 .1. CDM – Executive Board page 5
Figure 2 – Location of Quezon City Controlled Disposal Facility The CDM project activity will interest only the wastes which were disposed after the reopening of the landfill as a “controlled dumpsite”, in particular from January 2001, as reported in Table 14 Annex 3 of the PDD, until the cut off date of the landfill at the end of 2007. Please note that for the 2007 it has been foreseen a disposal value equal to 2006. In other words, for the forecasted LFG calculation production, we only considered the waste filled in the two mounds after January 2001 (see B in the cross section showed in figure 2). Since January 2001 the landfill has been filled up with new wastes, which have been disposed on both the existing mounds, as represented in Figure 3:
Figure 3 - Schematic section of the Payatas dumpsite in relation to waste disposal before and after 2000 closure
Wastes disposed on both mounds after January 2001
Wastes disposed on both mounds from 1973 to 2000
B
A

PROJECT DESIGN DOCUMENT FORM (CDM PDD) - Version 03 .1. CDM – Executive Board page 6 The conversion of the landfill from an open dump to a controlled dumpsite (see Figure 4) was made through the implementation of the following technical operations in order to protect the environment and to ensure the safety of the dumpsite and the communities surrounding the site:
• slope reprofiling � dumpsite slopes were re-profiled from a 50°-70° steep to a more stable 23°-25° steep range through side cutting and benching;
• soil capping � re-profiled slope is covered with 0,60 m soil (before soil compacting); • greening of slopes � mongo beans were used to enrich and condition the soil before grass and
shrub were planted on the reprofiled slopes; • perimeter fence � a perimeter fence was installed for the security of the facility.
Figure 4 - Payatas disposal site before (up) and after (below) the conversion to a controlled dumpsite
The landfill management operations doesn’t include the use of HDPE bottom liner on the natural terrain. The regular dumpsite operations consist of the following phases: waste truck inspection at the site entry; garbage is tipped at designated dumping area; residual waste is pushed and leveled at the final dumping area: no landfill compactors are used, and so a compaction degree of about 55% is foreseeable. A leachate drainage system has been implemented on both mounds, through the collection pipes connected to the pump station. Actually no biogas collection system is operating on the landfill.

PROJECT DESIGN DOCUMENT FORM (CDM PDD) - Version 03 .1. CDM – Executive Board page 7 A.4.2. Category(ies) of project activity: The category for the project activity according to the UNFCCC’s CDM Project Activities list is:
• Sectoral Scope 13 – Waste handling and disposal (Landfill Gas Project Activity) • Sectoral Scope 1 – Energy industries , Type I: Renewable energy projects, Category D:
Renewable electricity generation for a grid. A.4.3. Technology to be employed by the project activity : The project activity involves the extraction, collection, processing, and flaring of biogas produced from the decomposition of the solid wastes dumped at the Quezon City Controlled Disposal Facility in order to reduce its adverse impacts on both the local and global environment. This will be accomplished through the construction and installation of the following: � biogas collection network, consisting of appropriate wells, pipes and gravel filter to allow transport
of the gas from the dump to the substations; � biogas aspiration and conditioning system, which consists of blowers and purification and
dehumidification equipment to transport and clean gas of impurities that can damage the system; � biogas flare, which is a high temperature torch that will burn the methane and convert it to less
harmful carbon dioxide, water and other trace gases; � energy production plant, composed of electricity generating equipment utilizing methane from biogas
as fuel to produce electricity and distribution lines for delivery of electricity to end users (plant equipment and grid);
� monitoring and control system that would allow measurement, monitoring and control of significant parameters.
The LFG collection system designed in the frame of our project will be composed by 49 wells (drilled in the body of the waste) connected by HDPE pipes (DN 200) to three substations. From these three substation will start three main manifolds transporting LFG to the burning and power plant (the layout is reported in Figure 1). No leakage will be allowed nor during O&M neither during the construction period. Until the start up of the plant, all our biogas collection network will be kept sealed in order to avoid methane escape. Payatas Landfill area is surrounded by poor population living in shanties and working in waste separate collection in waste disposal area. The landfill closure is expected for the end of the year 2007 and so there is no risk due to pickers activities beside our wells or pipes. In any case since today the pickers are located in the actual dumping area that is in the middle of the two mounds and so there is no risk for our extraction plant, because the wells, the pipes and all the equipment necessary in order to extract LFG will be located in areas covered by soil and so without the risk represented by pickers that are collecting recoverable wastes (metal, glass, plastic) only in the restricted area where the fresh waste is filled. The centralized burning and power plant will be located in a safe area and is secured by a 2 meter reinforced concrete fence. The plant counts on a 24 hours security service. All the necessary equipment for the evaluation of the methane captured and flared, the electricity produced (on the basis of the monitoring procedures that lead to the calculation of the produced CERs), are located in the above mentioned secured and fenced area and most of them, in particular, inside of the main container van where is located the suction section.

PROJECT DESIGN DOCUMENT FORM (CDM PDD) - Version 03 .1. CDM – Executive Board page 8 In terms of the Philippine baseline, this type of project activity represents an innovative technology considering the state of landfill methane recovery system in the country. Local workers will need to be trained and specialists such as engineers and other professionals will need to be employed for project implementation. Furthermore, high efficiency flare suppliers are not available in the Philippine market so many components of the facility will be provided from abroad (Europe, in particular), recurring to the best available technologies. As such, a “state of the art” technology transfer will occur from countries with environmentally safe and sound technologies to the Philippines, resulting in a very positive contribution to the environment.
A.4.4 Estimated amount of emission reductions over the chosen crediting period: For the project activity a crediting period of 10 years shall be applied, during which the total emission reductions are expected to be about 1,163,394 t CO2 eq, as summarized in Table 1.
Table 1 – Estimated amount of emission reductions over the crediting period
YEAR ANNUAL ESTIMATION OF EMISSION REDUCTIONS IN TONNES OF CO2 E
2007 135,367
2008 148338
2009 141,505
2010 131,027
2011 121,355
2012 112,426
2013 104,183
2014 96,575
2015 89,551
2016 83,067 Total estimated reductions
(t CO2 e) 1,163,394
Total number of crediting years 10 Annual average over the crediting period of
estimated reductions (t CO2 e)
116,339
A.4.5. Public funding of the project activity: There is no public funding of the project activity.

PROJECT DESIGN DOCUMENT FORM (CDM PDD) - Version 03 .1. CDM – Executive Board page 9 SECTION B. Application of a baseline and monitoring methodology B.1. Title and reference of the approved baseline and monitoring methodology applied to the project activity : The baseline and monitoring methodology used for the project activity is: ACM0001 – “Consolidated baseline methodology for landfill gas project activities” – Version 05, hereinafter referred to as the Baseline and Monitoring Methodology AMS-I.D. “Grid connected renewable electricity generation” – Version 10
B.2 Justification of the choice of the methodology and why it is applicable to the project activity: The approved consolidated baseline methodology ACM0001 version 5 is applicable to landfill gas capture project activities, where the baseline scenario is the partial or total atmospheric release of the gas and the project activity include the following situation: a) the captured gas is flared; or b) the captured gas is used to produce energy (e.g. electricity/thermal energy), but no emission
reductions are claimed for displacing or avoiding energy from other sources; or c) the captured gas is used to produce energy (e.g. electricity/thermal energy), and emission reductions
are claimed for displacing or avoiding energy from other sources. The project activity involves both a) flaring and c) production of energy to displace grid electricity produced from more polluting sources, as stated above. The capacity of the power plant that will be constructed shall be 700 kW in which case it is indicated in ACM0001 (ver 5) that AMS-I.D. ”Grid connected renewable electricity generation” – Version 10 can be used to estimate the CO2 emissions from the project activity since the power plant capacity is only 700 kW, which is less than 15 MW, the maximum capacity for a small-scale AMS-I.D. project activity. B.3. Description of the sources and gases included in the project boundary The project boundary of the Project activity is the Payatas dumpsite. The boundary includes biogas collection at the old and new sites as well as activities including flaring of biogas, electricity generation and electricity transmission to the local distributor of electricity, Manila Electric Company (MERALCO). Possible CO2 emissions resulting from combustion of other fuels than the methane recovered should be accounted as project emissions. Such emissions may include fuel combustion due to pumping and collection of biogas. In addition, electricity required for the operation of the project activity, should be
PROJECT DESIGN DOCUMENT FORM (CDM PDD) - Version 03 .1. CDM – Executive Board page 10 accounted and monitored. Where the project activity involves electricity generation, only the net quantity of electricity fed into the grid should be used to account for emission reductions due to displacement of electricity in other power plants.
Source Gas Included? Justification/Explanation CO2 No Not included because
these GHG emissions are part of the natural carbon cycle
CH4 Yes Included because it is the
main component of the LFG that is being combusted
Bas
elin
e
Wastes
N2O No Not applicable
CO2 No Not included because these GHG emissions are part of the natural carbon cycle
CH4 Yes Included because it is the
main component of the LFG that is being burned
Flare
N2O No Not applicable
CO2 Yes It is included because of the displacement of fossil fuel-fired electricity that otherwise would have been generated in the grid to which the project activity will be interconnected.
CH4 Yes Included because it is the
main component of the LFG that is being combusted
Pro
ject
Act
ivity
Electricity production
N2O No Not applicable

PROJECT DESIGN DOCUMENT FORM (CDM PDD) - Version 03 .1. CDM – Executive Board page 11 B.4. Description of how the baseline scenario is identified and description of the identified baseline scenario: In the Philippines, there are no contractual requirements or regulations mandating the capture of the methane generated from solid waste disposal sites. Therefore, the baseline is the total atmospheric release of all the methane generated by the Payatas waste disposal site, which is classified as controlled dumpsite and so no gas control systems are required by the law. Due to the regulations reported in the above mentioned Implementing Rules and Regulations (IRR), the operation of a controlled dumpsite (like Payatas landfill ) doesn’t require the installation of a biogas collection network, that in absence of the CDM project activity might not have been implemented because it wouldn’t be requested by the Philippine regulation. B.5. Description of how the anthropogenic emissions of GHG by sources are reduced below those that would have occurred in the absence of the registered CDM project activity (assessment and demonstration of additionality): The additionality of the project activity will be demonstrated and assessed using the latest version of the “Tool for the demonstration and assessment of additionality” Version 3 agreed by the CDM Executive Board, which is available on the UNFCCC CDM web site. Step 1 – Identification of alternatives to the project activity consistent with current laws and regulations Sub-step 1a. Define alternatives to the project activity The proposed project activity involves the construction of facilities for LFG collection, flaring, electricity generation and selling of the net electricity produced to the Luzon grid and also getting revenues from CERs. An alternative scenario to the CDM project activity is the baseline scenario wherein there is no capture of methane gas produced in the controlled dumpsite. The Quezon City dumpsite closes in 2007 and uncontrolled LFG emissions will occur until the organic component of the MSW is completely decomposed. Another alternative scenario to the project activity is a scenario which constructs facilities for LFG collection, electricity generation and flaring of any excess LFG and sells the (net) produced electricity to the Luzon grid in the absence of the Clean Development Mechanism and revenues for the CERs sales. This is an economically unattractive scenario because of the lack of the economic incentives from CERs revenues. Otherwise, a scenario which constructs facilities for LFG collection and complete biogas flaring, without electricity generation, also by the means of the Clean Development Mechanism (and the subsequent revenues for the CERs sales) is economically unviable. Other possible scenario can be identified as the sale of raw gas directly to customers: this scenario implies the realization of the biogas extraction plant combined with a biogas treatment unit. This alternative cannot be considered viable because there is no local gas demand for an on-site utilization.
PROJECT DESIGN DOCUMENT FORM (CDM PDD) - Version 03 .1. CDM – Executive Board page 12 Other alternative project scenarios in Philippines for methane recovery and destruction do not have any economic drivers for an investor to implement and cannot be considered plausible or credible. Sub-step 1b.Consistency with mandatory laws and regulations According to the Implementing Rules and Regulations (IRR) of Republic Act 9003 (also known as Philippine Ecological Solid Waste Management Act of 2000), at Rule III are reported the definitions of a controlled dump and of a sanitary landfill: "Controlled dump" shall refer to a disposal site at which solid waste is deposited in accordance with the minimum prescribed standards of site operation. "Sanitary landfill" shall refer to a waste disposal site designed, constructed, operated and maintained in a manner that exerts engineering control over significant potential environmental impacts arising from the development and operation of the facility”. Regarding to a controlled dump, at Rule XIII - Operations of controlled dumpsites – Section 2 (Minimum Requirements for Operation of Controlled Dumpsites) it is pointed out: “The following minimum requirements shall be applied in siting, designing and operation of controlled dumpsites: a) Daily cover consisting of inert materials or soil of al least 6 inches in thickness shall be applied at the end of the working day; where there is a lack of onsite soil material, other alternative materials may be used subject to the prior written approval of the enforcement authority and the Department; b) Drainage and runoff control shall be designed and managed such that storm water does not come in contact with waste and that discharge of sediments into the receiving body of water is minimized. Appropriate erosion protection shall be installed at storm discharge outfalls; c) Provision for aerobic and anaerobic decomposition shall be instituted to control odor; d) Working areas shall be minimized and kept at no more than a ratio of 1.5 square meter (sqm) or less per ton/day (tpd) of waste received on a daily basis, e.g. 30 sqm working area for a 20 tpd facility; e) Security fencing shall be provided to prevent illegal entries, trespassing and large animal entries. Large animals shall include but not limited to adult domesticated or feral animals such as dogs, cats, cattle, pigs, carabaos and horses. Provisions for litter control including the use of litter fences and daily picking of litter shall be included; f) Basic record keeping including volume of waste received daily, special occurrences such as fires, accidents, spills, unauthorized loads (maintain record of unauthorized and rejected loads, name and address of hauler and generator of such unauthorized waste), and daily waste inspection logs; g) Provision of maintained all-weather access roads; h) Controlled waste picking and trading, if allowed by owner/operator, in order to facilitate daily covering and compliance to Subsections (a) through (e) above; i) Provision of at least 0.60 m final soil cover at closure, and post-closure maintenance of cover, drainage and vegetation; Post-closure maintenance shall be for a period of ten (10) years; j) Site shall not be located in flood plains and areas subject to periodic flooding and it shall be hydro-geologically suitable, i.e., adequate separation or clearance between waste and underlying groundwater and any surface body of water shall be provided. Engineering controls shall be provided otherwise. k) Open dumpsites that do not comply with siting requirements of this Section shall be closed immediately. A replacement facility shall be, at a minimum, a controlled dump and shall meet the

PROJECT DESIGN DOCUMENT FORM (CDM PDD) - Version 03 .1. CDM – Executive Board page 13 requirements of Rule XIII, and other applicable provisions of the Implementing Rules and Regulations (IRR).” Not managing and controlling methane gas produced in controlled dumpsites like the Quezon City Controlled Disposal Facility do not violate current laws and regulations. Republic Act No. 8749, otherwise known as the Philippine Clean Air Act of 1999, does not specify maximum permissible limits for methane, landfill gas or biogas coming from dumpsites. The Republic Act No. 9003 mentioned above does not require LFG collection/combustion for controlled dumpsites. According to this law, only in sanitary landfills with waste in place amounting to more than 500,000 tons should a gas control system be installed. The requirements are in any case general and is not specified the final treatment of LFG; the only requirement is that “the owner/operator shall consider recovery and conversion of methane gas into usable energy if economically viable”, but in any case this is applicable only for sanitary landfill whereas Payatas landfill is a controlled dumpsite. The Payatas landfill is a controlled dumpsite, and on the basis of the Solid Waste Inventory available on line in the following address (http://www.denr.gov.ph/nswmc/6.php), Payatas landfill is in the list of the “Closure and Rehabilitation Plans”. Taking into account the DENR Administrative Order N.9 of 14 September 2006 (General Guidelines in the closure and Rehabilitation of Open Dumpsites and Controlled Dump Facilities), the rehabilitation plan for Controlled Dump Facilities shall include (see paragraph 6.3, letter f) a gas management made of gas vents installed in order to give the possibility to LFG to go in the atmosphere in order to avoid LFG migration in the underground. This is clear also because the materials suggested (such as bamboo or PVC pipes) are not compliant to the technical requirements necessary in order to extract LFG to burn it or to transform it in electric energy. The above mentioned DENR Administrative Order N.9 of 14 September 2006 doesn’t give any requirements in order to destroy LFG. In other words the proposed project is by sure additional respect the actual Philippine laws. Hence, the alternative scenario, corresponding to final disposal of solid waste without any activity of methane recovery or destruction is in compliance with all the Philippines laws and regulations. Since alternatives to the project, consistent with current laws and regulations, have been identified, the project is additional under Step 1. Step 2 – Investment analysis Sub-step 2a. Determine appropriate analysis method Other than CDM related income, the proposed project activity will generate financial and economic benefits from the sale of electricity. Therefore, the Simple Cost Analysis method (Option I) cannot be applied. Furthermore, the Investment Comparison Analysis (Option II) has a reasonable application for those cases which involve project alternatives comparable with the project activity. In this case the only plausible alternative is the continuation of the current situation and so Option II is not applicable. Therefore the “Apply Benchmark Analysis” (Option III) will be used. It has been chosen an assessment period of 10 years for the investment analysis. According to the biogas evaluation model (“IPCC 1996”) that had been used to forecast the quantity of biogas generated by the landfill that will be captured and flared, the biogas annual quantity will increase until the end of year 2008 and then decrease significantly until year 2017. According to this natural reduction trend (confirmed by the above mentioned model) the PP decided to choose the “Fixed crediting period” option with a length of 10 years which is in line with the expected duration of the proposed project. In order to

PROJECT DESIGN DOCUMENT FORM (CDM PDD) - Version 03 .1. CDM – Executive Board page 14 be consistent with the lapse of time, 10 years, that represents both the natural length of the project and the crediting period, in the Investment Analysis, the 10 year assessment period was taken in consideration. Sub-step 2b – Option III. Apply benchmark analysis The Internal Rate of Return (IRR) is a capital budgeting tool used to determine the attractiveness of a long-term investment. A project is a good investment if its IRR is greater than the rate of interest that might be earned from alternative investments, in this case the minimum IRR that would be considered acceptable is the yield granted by the Republic of Philippines 10 Years Treasury Bond, which is 7.10%1. For the purpose of this analysis, the yield of the 10 Years Treasury Bond will be used as a benchmark, even if the benchmark could be significantly higher if following risk factors would be kept in considerations: • Country and term risk premium • Private risk premium • Project risk premium • Market risk premium Sub-step 2c – Calculation and comparison of financial indicators In calculating the Project IRR, the following assumptions were made:
Table 2 – Parameters needed for the calculation of the financial indicator IRR (CERs revenues are not considered)
PARAMETER UNIT OF
MEASURE VALUE
Investment costs € 1,386,000 Operation & Maintenance costs (first 2 years)
€/Year 95,670
Operation & Maintenance costs (from 3rd year)
€/Year 180.670
Electricity exported (10 years) MWh 42.000 Electricity exported (x year) MWh 5.250 Exchange Rate EUR/PHP 0.01618 Electricity price MWh PHP 4,867 Electricity price MWh EUR 78,75 Project Life Year 10
PROJECT IRR -6,11 %
Data assumptions:
1 Asian Bond On line quotation of May 24th 2007 - http://asianbondsonline.adb.org/philippines/philippines.php

PROJECT DESIGN DOCUMENT FORM (CDM PDD) - Version 03 .1. CDM – Executive Board page 15
• The Investment costs as well as the Operation & Maintenance costs for the landfill gas equipment and plant were supplied by the project developer based on its experience in the sector, and consultation with landfill gas primary suppliers.
• The tariff rate of electricity which is used in calculations is 0.078748 EUR/kWh2
• The LFG production rate will become minimal after 10 years and it will not be economically viable to continue the project.
On this basis the project is not viable. The Investment Costs are too high and the revenue generated by the electricity sale does not guarantee an acceptable return. The Project IRR of -6,11 % is far below the acceptable benchmark IRR value of 7.10%. Scenario considering also the CERs If revenues from the selling of the CERs are considered the project IRR increases up to 59,8 % , making the project viable as shown in the following table:
Table 3 Parameters needed for the calculation of the financial indicator IRR (CERs revenues are included)
PARAMETER UNIT OF
MEASURE VALUE
Investment costs € 1,386,000 Operation & Maintenance costs (first 2 years)
€/Year 95,670
Operation & Maintenance costs (from 3rd year)
€/Year 180.670
Electricity exported (10 years) MWh 42.000 Electricity exported (x year) MWh 5.250 Exchange Rate EUR/PHP 0.01618 Electricity price MWh PHP 4,867 Electricity price MWh EUR 78,75 Project Life Year 10 Annual expected emission reductions (CERs)
t CO2 116.339
Predictable CER price €/CER 10 Average annual CERs revenues € 1.116.339
PROJECT IRR 59,8%
Data assumptions:
• The Investment costs as well as the Operation & Maintenance costs for the landfill gas equipment and plant were supplied by the project developer based on its experience in the sector, and consultation with landfill gas primary suppliers.
• The tariff rate of electricity which is used in calculations is 0.078748 EUR/kWh3 2 Source: current NPC Luzon grid rate (http://www.napocor.gov.ph/npc5.asp)

PROJECT DESIGN DOCUMENT FORM (CDM PDD) - Version 03 .1. CDM – Executive Board page 16
• The CERs value which is used in calculations is 10,00 EUR • The average Annual expected CERs production is 116.339, • The LFG production rate will become minimal after 10 years and it will not be economically
viable to continue the project. Sub-step 2d – Sensitivity analysis The sensitivity analysis constitutes a valid approach for demonstrating the reliability of the investment analysis (see Sub-step 2c). For the proposed project activity, the following parameters have been indicated as “sensitive factors” in terms of financial attractiveness:
1. Total investment (I); 2. Operating & Maintenance Costs (O&M); 3. Electricity selling price (E).
The project IRR was calculated for each of the above parameter, testing sensitivity at values at a range of ±10%, at increments of 2.50%. The results are shown in Table 3.
Table 4 – Sensitivity analysis of the proposed project activity
-10.00% -7.50% -5.00% -2.50% 0.00% 2.50% 5.00% 7.50% 10.00%
I -5,29% -5,50% -5,71% -5,92% -6,11% -6,30% -6,48% -6,65% -6,82% O&M -4,55% -4,93% -5,32% -5,71% -6,11% -6,51% -6,92% -7,34% -7,76%
E -8,60% -7,95% -7,32% -6,71% -6,11% -5,53% -4,96% -4,40% -3,86%
As shown in Table 3, the Project IRR values fluctuate between -8.60 % and -3.86 %, according to the variability of the 3 parameters within the range of ±10%. On the basis of the results obtained, it is clear that both the investment costs I and the Operation and Maintenance Costs O&M haven’t got a relevant influence on the IRR and they are not a critical factor in the investment analysis. On the other hand, the O&M estimation was done conservatively, however, the maximum expected value of Project IRR is only -4,55 % (related to a decrease of 10% of the O&M) which is way below the benchmark value of 7,10 %. The price of electricity is also an important factor in the evaluation of the Project IRR. If the electricity tariff increases by 10%, the Project IRR value goes up to about -8,60 %. In conclusion, the sensitivity analysis shows how the project in not financially attractive, showing a maximum Project IRR value (related to an increase of 10% of the electricity price), still far lower than the benchmark value used by Pangea. Step 3 Barrier analysis
3 Source: current NPC Luzon grid rate (http://www.napocor.gov.ph/npc5.asp)

PROJECT DESIGN DOCUMENT FORM (CDM PDD) - Version 03 .1. CDM – Executive Board page 17 This step is used to determine whether the proposed project activity faces barriers that:
a. Prevent the implementation of this type of proposed project activity; and b. Do not prevent the implementation of at least one of the alternatives.
Use the following sub-steps: Sub-step 3a. Identify barriers that would prevent the implementation of type of the proposed project activity Establish that there are barriers that would prevent the implementation of the type of proposed project activity from being carried out if the project activity was not registered as a CDM activity. Such barriers may include, among others: TECHNOLOGY BARRIERS The sole revenue for the Project, electricity sales, is dependent on biogas availability. On the 3rd year the LFG will be used as fuel to a power generator unit and excess LFG will be flared. Forecasts for LFG production are based on a model that has not been proven in the Philippines. Thus the model parameters may not effectively factor in the rapid decomposition of organic matter in a hot/moist tropical environment. In this case, a greater amount of LFG production could be expected in the first two years; however, if the decomposition of the garbage occurs faster than the trend predicted by the model, revenues from electricity sales will be lower than expected. This will produce a negative impact on the Project IRR, which is already lower than the benchmark value. The lack of prior experience on this kind of project in the Philippines could indirectly translate into unforeseen problems with the technology. This could adversely affect the financial outcome of the Project. BARRIER DUE TO PREVAILING PRACTICES As this project is a pioneering commercial LFG collection operation in the Philippines, there is a general lack of personnel skilled in this kind of technology. New staff may require extensive training in the operation and maintenance of the equipment. Proper maintenance of the equipment and machinery is very important in preventing unexpected damages. Problems and delays with staff training could negatively impact the Project schedule and therefore the project returns. Sub-step 3b. Show that the identified barriers would not prevent the implementation of at least one of the alternatives (except the proposed project activity) The identified barriers would not prevent the alternative scenario which is the baseline for the project activity. The above analysis clearly shows that the proposed project activity faces barriers that prevent its implementation and do not prevent the implementation of at least one of the alternatives. Hence, the proposed project activity may be considered “additional”. Step 4 – Common practice analysis
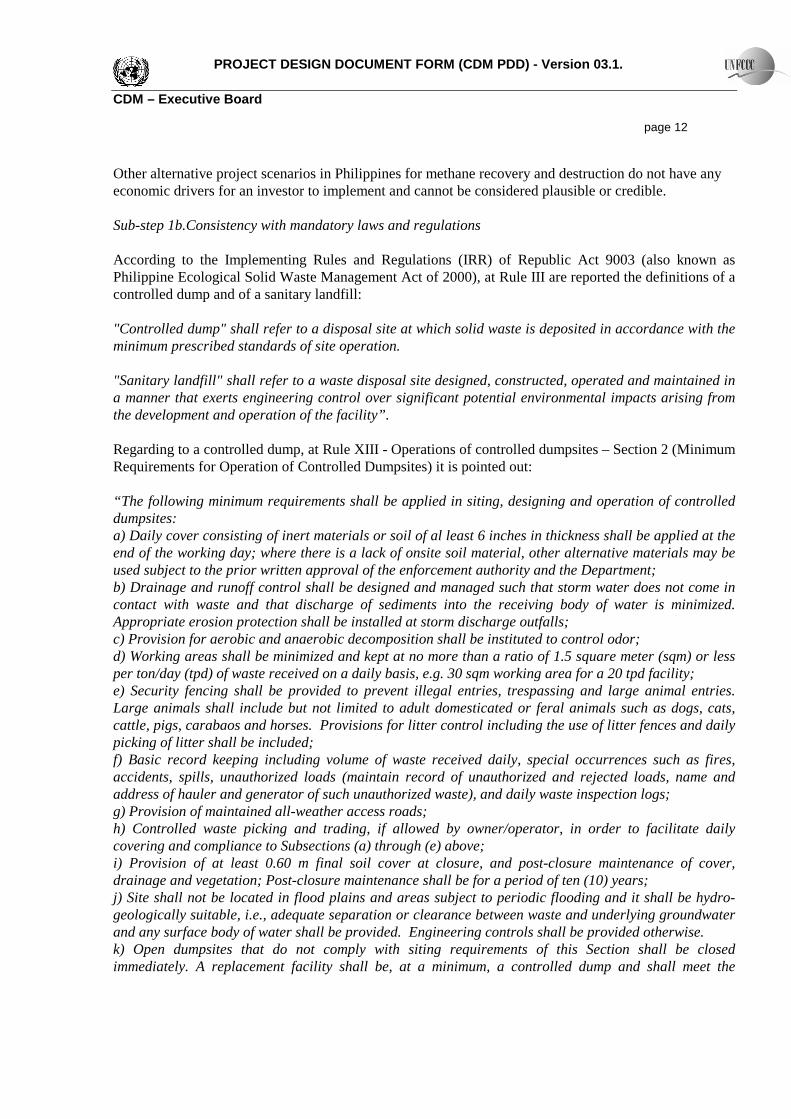
PROJECT DESIGN DOCUMENT FORM (CDM PDD) - Version 03 .1. CDM – Executive Board page 18 Sub-step 4a. Analyze other activities similar to the proposed activity According to the National Solid Waste Management Commission, at the end of 2006, the Philippines had 713 dumpsites. There are 309 controlled dumpsites and only 9 sanitary landfills. Metro Manila reportedly generates over 6,700 tonnes of solid waste per day, approximately 5,600 tonnes of which enters the municipal collection systems of the 17 cities and municipalities. With the current economic growth rate and population increase, it is estimated that wastes generated by Metro Manila may double to 11,000 tonnes per day by 2014. This waste is reportedly dumped at 9 dumpsites (among which is the Payatas controlled dumpsite) throughout Metro Manila. The dumpsites cause serious public health, environmental and social impacts. They have inadequate fencing, signage and security provisions. Unrestricted access is prevalent. The presence of 4,000 waste pickers at the dumpsites is dangerous. They are poorly protected and at severe public health risk.
Figure 5 – Metro Manila dumpsites facilities
Sub-step 4b. Discuss any similar options that are occurring On the basis of the Philippine Ecological Solid Waste Management Act of 2000 (Republic Act No. 9003), according to which is not required a LFG collection/combustion for controlled dumpsites (like Payatas landfill), and the National Solid Waste Management Commission (updated to the end of 2006, http://www.denr.gov.ph/nswmc/), it is foreseeable that no similar project activity has been implemented in the Philippines. This type of project activity can therefore be considered a pioneering activity and the transfer of technology should encourage the implementation of similar project activities elsewhere in the Philippines.
PROJECT DESIGN DOCUMENT FORM (CDM PDD) - Version 03 .1. CDM – Executive Board page 19 B.6. Emission reductions:
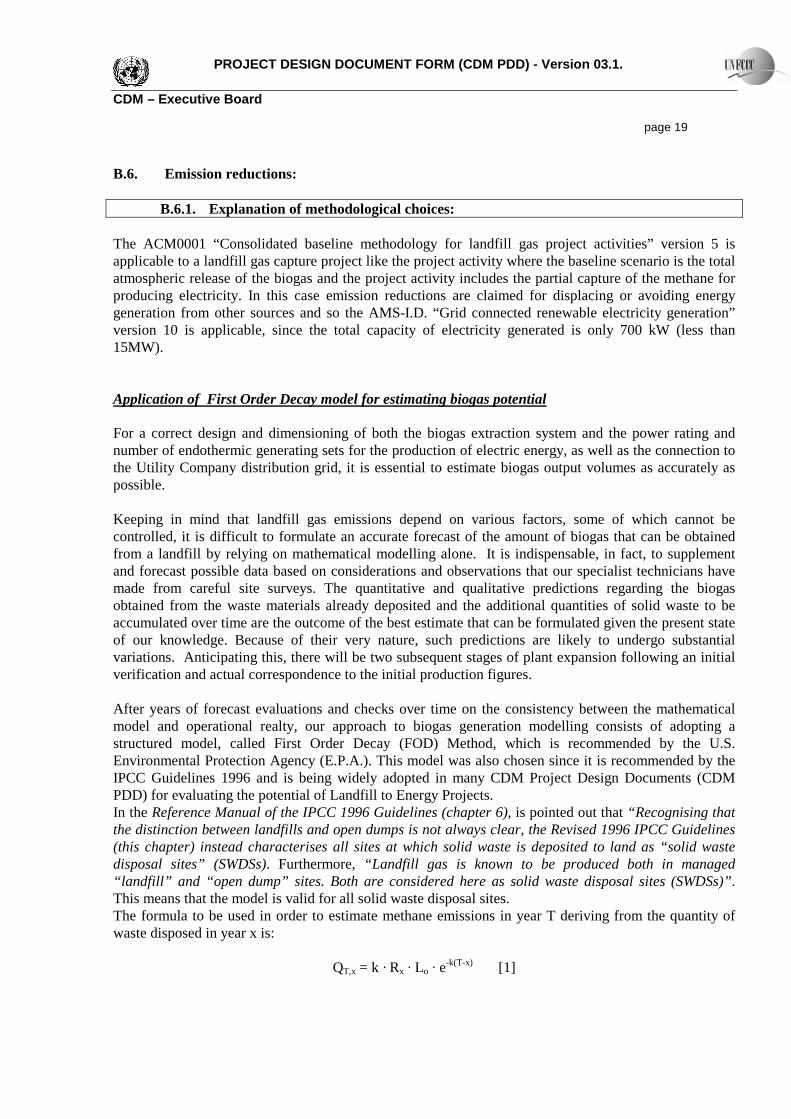
B.6.1. Explanation of methodological choices: The ACM0001 “Consolidated baseline methodology for landfill gas project activities” version 5 is applicable to a landfill gas capture project like the project activity where the baseline scenario is the total atmospheric release of the biogas and the project activity includes the partial capture of the methane for producing electricity. In this case emission reductions are claimed for displacing or avoiding energy generation from other sources and so the AMS-I.D. “Grid connected renewable electricity generation” version 10 is applicable, since the total capacity of electricity generated is only 700 kW (less than 15MW). Application of First Order Decay model for estimating biogas potential For a correct design and dimensioning of both the biogas extraction system and the power rating and number of endothermic generating sets for the production of electric energy, as well as the connection to the Utility Company distribution grid, it is essential to estimate biogas output volumes as accurately as possible. Keeping in mind that landfill gas emissions depend on various factors, some of which cannot be controlled, it is difficult to formulate an accurate forecast of the amount of biogas that can be obtained from a landfill by relying on mathematical modelling alone. It is indispensable, in fact, to supplement and forecast possible data based on considerations and observations that our specialist technicians have made from careful site surveys. The quantitative and qualitative predictions regarding the biogas obtained from the waste materials already deposited and the additional quantities of solid waste to be accumulated over time are the outcome of the best estimate that can be formulated given the present state of our knowledge. Because of their very nature, such predictions are likely to undergo substantial variations. Anticipating this, there will be two subsequent stages of plant expansion following an initial verification and actual correspondence to the initial production figures. After years of forecast evaluations and checks over time on the consistency between the mathematical model and operational realty, our approach to biogas generation modelling consists of adopting a structured model, called First Order Decay (FOD) Method, which is recommended by the U.S. Environmental Protection Agency (E.P.A.). This model was also chosen since it is recommended by the IPCC Guidelines 1996 and is being widely adopted in many CDM Project Design Documents (CDM PDD) for evaluating the potential of Landfill to Energy Projects. In the Reference Manual of the IPCC 1996 Guidelines (chapter 6), is pointed out that “Recognising that the distinction between landfills and open dumps is not always clear, the Revised 1996 IPCC Guidelines (this chapter) instead characterises all sites at which solid waste is deposited to land as “solid waste disposal sites” (SWDSs). Furthermore, “Landfill gas is known to be produced both in managed “landfill” and “open dump” sites. Both are considered here as solid waste disposal sites (SWDSs)”. This means that the model is valid for all solid waste disposal sites. The formula to be used in order to estimate methane emissions in year T deriving from the quantity of waste disposed in year x is:
QT,x = k · Rx · Lo · e-k(T-x) [1]

PROJECT DESIGN DOCUMENT FORM (CDM PDD) - Version 03 .1. CDM – Executive Board page 20 where:
k : methane generation kinetic constant: this is function of the humidity of the waste material, availability of nutrients for the methanogenic bacteria, pH and temperature [1/yr]; Lo : methane generation potential of the landfill: this depends on the quantity of cellulose contained in the waste mass cellulose, in fact, contains the greatest quantity of carbon capable of being changed into methane; accordingly, methane production becomes dependent on the hydrolysis of cellulose [m3-CH4/ton] QT,x : the amount of methane generated in the current year (T) by the waste Rx [m3-CH4/yr]; x : the year of waste input; Rx : the amount of waste disposed in year x [t/yr]; T : year of interest.
Methane generation is accordingly characterized by the two parameters: k and Lo. The methane generation rate constant (k), expressed in [1/year] is a function of the environment in which the landfill is located. Higher value corresponds to greater moisture in the landfill and this value may range from less than 0.005 to 0.4: it has been referred to IPCC default values in function of the hydrologic regime of the area. For the baseline emission estimates for the project activity, a k= 0.08 1/yr is used. The methane generation potential L0 depends upon the composition of the waste. According to 1996 IPCC Guidelines (chapter 6), values for L0 can vary widely, in a range from less than 100 to over 200 m3/tons. The L0 value can be calculated by the following formula (as reported in 1996 IPCC Guidelines):
DOCD
FDOCMCFLCH
CHf ⋅⋅⋅⋅⋅=4
40
11216
[2]
where:
MCF = methane correction factor, that reflects the way in which the landfill is managed (IPCC values are used); MCF=1. This value is relevant to managed solid waste disposal sites, defined as follows: “These must have controlled placement of waste (i.e., waste directed to specific deposition areas and a degree of control of scavenging and a degree of control of fires) and will include at least one of the following:
o cover material (present in Payatas landfill); o mechanical compacting; or o leveling of the waste (present in Payatas landfill).
DOCf = fraction of DOC dissimilated, equal to the portion of DOC that is converted to landfill gas, depending in particular from the temperature inside the landfill; IPCC 1996 default value = 0.77 FCH4 = fraction of CH4 in landfill gas DCH4 = density of the methane (equal to 0.0007168 t/m3) DOC = degradable organic carbon
and:

PROJECT DESIGN DOCUMENT FORM (CDM PDD) - Version 03 .1. CDM – Executive Board page 21
4321 %30,0%15,0%17,0%4,0 WSWSWSWSDOC ⋅+⋅⋅⋅+⋅= [3]
with: WS1 = solid waste percentage of paper and textiles WS2 = solid waste percentage of garden waste, park waste or other non-food organic putrescibles WS3 = solid waste percentage of food waste WS4 = solid waste percentage of wood or straw According to the formulation expressed above it has been calculated a value of L0 equal to 135 m3/ton. For the determination of biogas emissions, it is assumed that the content by volume of the methane generated is 50% and WSi used are data from the MMDA included in Annex 3. The model provides a quantitative estimate of the annual amount of biogas arising from a ton of urban solid waste, from which, knowing the quantity of waste materials landfilled over time, we can work out total annual output and the future evolution of production figures, according to the following formula:
QT = Σx QT,x [4]
where x varies from the year of waste disposal to T (year of interest). Application of ACM0001 “Consolidated baseline methodology for landfill gas project activities” ver 5 The greenhouse gas emission reduction achieved by the project activity during a given year y (ERy) are estimated as follows:
[5] where: ERy = emissions reduction, in tonnes of CO2 equivalents (tCO2e). MDproject,y = the amount of methane that would have been destroyed/combusted during the year, in tonnes of methane (tCH4) MDreg,y = the amount of methane that would have been destroyed/combusted during the year in the absence of the project, in, tonnes of methane (tCH4); considering that there are no specific regulatories with regards to that, it can be assumed an adjustment factor AF=0, so MD reg,y =MDproject,y*AD=0 GWPCH4 = Global Warming Potential value for methane for the first commitment period is 21 tCO2e/tCH4
ELy = net quantity of electricity exported during year y, in megawatt hours (MWh). CEFelectricity,y, = CO2 emissions intensity of the electricity displaced, in tCO2e/MWh. This can be estimated using either ACM0002 or AMSI.D, if the capacity is within the small scale threshold values, when grid electricity is used or displaced. ETy = incremental quantity of fossil fuel, defined as difference of fossil fuel used in the baseline and fossil use during project, for energy requirement on site under project

PROJECT DESIGN DOCUMENT FORM (CDM PDD) - Version 03 .1. CDM – Executive Board page 22 activity during the year y, in TJ; ETy= 0, i.e. no production of thermal or mechanical energy in the project activity CEFthermal,y CO2 emissions intensity of the fuel used to generate thermal/mechanical energy, in tCO2e/TJ; CEF thermal,y = 0
As mentioned above, actually there are no regulatory/contractual requirements regarding methane emissions from landfill and so MDreg,y can be assumed equal to 0. Thus, the equation used is: ERy = MD project, y * GWP CH4 + EL y * CEF electricity, y [5a] In the first phase of the project activity, there is an initial requirement for electricity from the grid to run the equipment of the facility and this is accounted for. The second phase for the project will generate electricity that will be supplied to the grid. For the project activity, the net quantity of electricity exported during year y is given as:
[6] where: ELEX,LFG = net quantity of electricity exported during year y, produced using landfill gas, in megawatt hours (MWh) ELIMP = net incremental electricity imported, defined as difference of project imports less any imports of electricity in the baseline, to meet the project requirements, in MWh For the project activity, the calculation of the net quantity of electricity exported yearly ELEX,LFG is based on an assumed period of electricity generation of about 7,500 hours/year. For the baseline scenario EL y = 0 (no electricity is imported in the baseline scenario) while during the project activity it is foreseable that an electricity import ELIMP from the local grid is estimated for the downtime (1,260 hours/year). For the CEFelectricity estimation the equation prescribed in AMS.I.D. is used (see below). The amount of methane that would have been destroyed/combusted during the year MDproject,y is given as:
[7] where: MDflared,y = the quantity of methane destroyed by flaring; MDelectricity,y = the quantity of methane destroyed by generation of electricity; MDthermal,y = the quantity of methane destroyed for the generation of thermal energy (in this case
this value is equal to 0).
[8] where:

PROJECT DESIGN DOCUMENT FORM (CDM PDD) - Version 03 .1. CDM – Executive Board page 23 LFGflare,y = the quantity of landfill gas fed to the flare during the year measured in cubic meters
(m3); wCH4,y = the average methane fraction of the landfill gas as measured during the year and
expressed as a fraction (in m³ CH4 / m³ LFG); w CH4,y = 0.5 (using IPCC default value) DCH4 = the methane density (0,0007168 t CH4/m
3); PEflare,y = the project emissions from flaring of the residual gas stream in year y (tCO2e); Considering the type of waste disposal the IPCC default methane fraction wCH4=0.5 is used. The project emissions from flaring PEflare,y are determined following the procedure described in the “Tool to determine project emissions from flaring gases containing Methane”. Application of the “Tool to determine project emissions from flaring gases containing Methane” This tool provides procedures to calculate project emissions from flaring of a residual gas stream (RG) containing methane. This tool is applicable under the following conditions:
- the residual gas stream to be flared contains no other combustible gases than methane, carbon monoxide and hydrogen;
- the residual gas stream to be flared shall be obtained from decomposition of organic material (through landfills, bio-digesters or anaerobic lagoons, among others) or from gases vented in coal mines (coal mine methane and coal bed methane).
This tool provides procedures to determine the following parameters:
The following data are required by this tool:
Project emissions from flaring of the residual gas stream are calculated based on the flare efficiency and the mass flow rate of methane in the residual gas stream that is flared. The flare efficiency depends on both the actual efficiency of combustion in the flare and the time that the flare is operating. The

PROJECT DESIGN DOCUMENT FORM (CDM PDD) - Version 03 .1. CDM – Executive Board page 24 efficiency of combustion in the flare is calculated from the methane content in the exhaust gas of the flare, corrected for the air used in the combustion process, and the methane content in the residual gas. In the project activity, the torch used is an enclosed flare and so the temperature in the exhaust gas of the flare is measured to determine whether the flare is operating or not. Furthermore, for flare efficiency ex-post, a continuous monitoring of the methane destruction efficiency will be adopted. This tool involves the following 7 steps:
� STEP 1: Determination of the mass flow rate of the residual gas that is flared � STEP 2: Determination of the mass fraction of carbon, hydrogen, oxygen and nitrogen in the
residual gas � STEP 3: Determination of the volumetric flow rate of the exhaust gas on a dry basis � STEP 4: Determination of methane mass flow rate of the exhaust gas on a dry basis � STEP 5: Determination of methane mass flow rate of the residual gas on a dry basis � STEP 6: Determination of the hourly flare efficiency � STEP 7: Calculation of annual project emissions from flaring based on measured hourly values
or based on default flare efficiencies. The calculation procedure in this tool determines the flow rate of methane before and after the destruction in the flare, taking into account the amount of air supplied to the combustion reaction and the exhaust gas composition (oxygen and methane). The flare efficiency is calculated for each hour of a year based either on measurements or default values plus operational parameters. Project emissions are determined by multiplying the methane flow rate in the residual gas with the flare efficiency for each hour of the year. The specific equations used for Steps 1-7 of the tool are given in the “Tool to determine project emissions from flaring gases containing Methane” Application of AMS-I.D. “Grid connected renewable electricity generation” in conjunction with ACM0002 “Consolidated baseline methodology for grid-connected electricity generation from renewable sources” This methodology regards renewable energy generation units, such as photovoltaic, hydro, tidal/wave, wind, geothermal and renewable biomass, that supply electricity to and/or displace electricity from an electricity distribution system that is or would have been supplied by at least one fossil fuel fired generating unit. This is applicable to the project activity since emission reductions can be achieved by the displacement of grid electricity that would have been supplied by at least one fossil fuel fired generating unit. The project boundary encompasses the physical, geographical site of the renewable generation source that corresponds to landfill boundaries. The project emission reduction is the kWh produced by the renewable generating unit multiplied by an emission coefficient (measured in kg CO2e/kWh) calculated in a transparent and conservative manner as:
� a combined margin (CM), consisting of the combination of operating margin (OM) and build margin (BM) according to the procedures prescribed in the approved methodology ACM0002. The Simple OM method was chosen to calculate the operating margin.
PROJECT DESIGN DOCUMENT FORM (CDM PDD) - Version 03 .1. CDM – Executive Board page 25
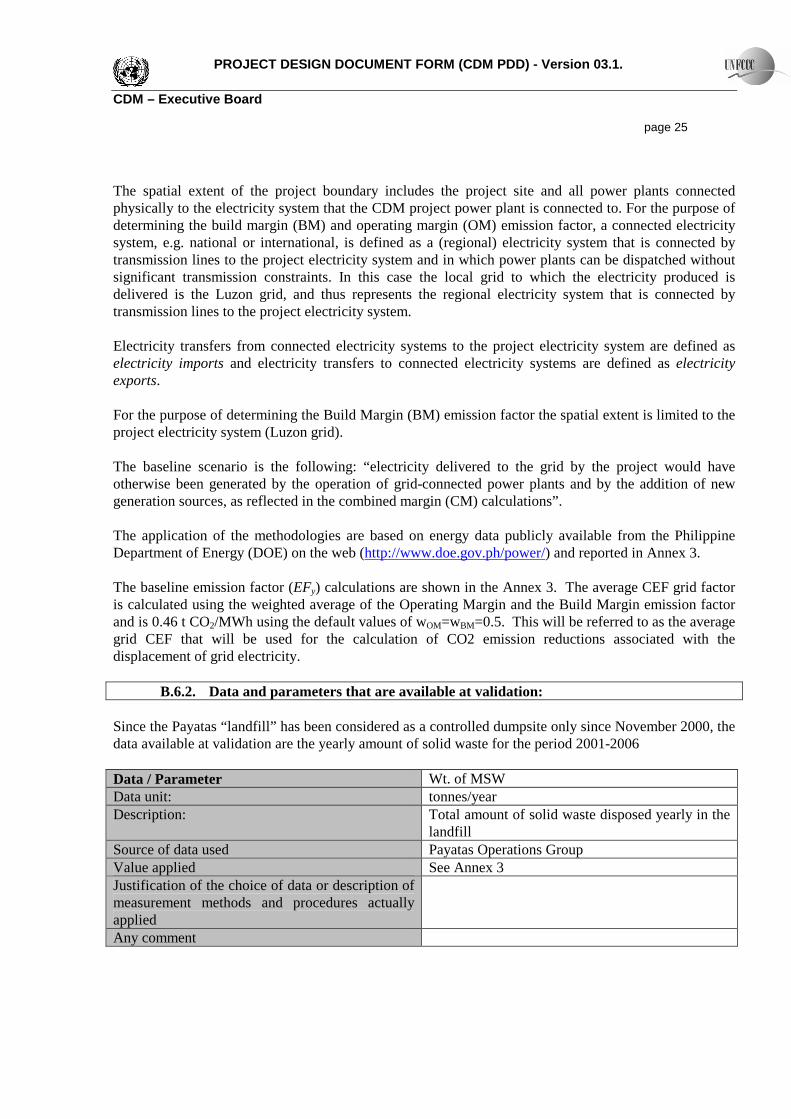
The spatial extent of the project boundary includes the project site and all power plants connected physically to the electricity system that the CDM project power plant is connected to. For the purpose of determining the build margin (BM) and operating margin (OM) emission factor, a connected electricity system, e.g. national or international, is defined as a (regional) electricity system that is connected by transmission lines to the project electricity system and in which power plants can be dispatched without significant transmission constraints. In this case the local grid to which the electricity produced is delivered is the Luzon grid, and thus represents the regional electricity system that is connected by transmission lines to the project electricity system. Electricity transfers from connected electricity systems to the project electricity system are defined as electricity imports and electricity transfers to connected electricity systems are defined as electricity exports. For the purpose of determining the Build Margin (BM) emission factor the spatial extent is limited to the project electricity system (Luzon grid). The baseline scenario is the following: “electricity delivered to the grid by the project would have otherwise been generated by the operation of grid-connected power plants and by the addition of new generation sources, as reflected in the combined margin (CM) calculations”. The application of the methodologies are based on energy data publicly available from the Philippine Department of Energy (DOE) on the web (http://www.doe.gov.ph/power/) and reported in Annex 3. The baseline emission factor (EFy) calculations are shown in the Annex 3. The average CEF grid factor is calculated using the weighted average of the Operating Margin and the Build Margin emission factor and is 0.46 t CO2/MWh using the default values of wOM=wBM=0.5. This will be referred to as the average grid CEF that will be used for the calculation of CO2 emission reductions associated with the displacement of grid electricity.
B.6.2. Data and parameters that are available at validation: Since the Payatas “landfill” has been considered as a controlled dumpsite only since November 2000, the data available at validation are the yearly amount of solid waste for the period 2001-2006 Data / Parameter Wt. of MSW Data unit: tonnes/year Description: Total amount of solid waste disposed yearly in the
landfill Source of data used Payatas Operations Group Value applied See Annex 3 Justification of the choice of data or description of measurement methods and procedures actually applied
Any comment

PROJECT DESIGN DOCUMENT FORM (CDM PDD) - Version 03 .1. CDM – Executive Board page 26
B.6.3 Ex-ante calculation of emission reductions: Using the baseline methodology in ACM0001 ver 5, ex-ante emission reduction estimates for methane collection/destruction are projected for reference purposes only. The project activity, once implemented will determine ex-post basis by measuring data as mentioned in the monitoring plan. The data will be used to determine emission reductions for the project activity. The calculation of emission reductions from the project activity is conducted distinguishing 2 operational phases:
� PHASE 1 (first 2 years) � the combustion plant is composed by a biogas extraction system (wells and blower), a high-temperature torch for flaring the methane extracted and an electrical engine for on-site power supply (about 40 kW). The electrical engine will be fed by biogas during the operational period (about 7,500 hours/year), while it shall be provided an electrical conjunction with the local grid in order to supply electricity during engine maintenance and starting operations.
� PHASE 2 (starting from the 3rd year) � on the basis of the actual availability of biogas and the financial and technical viability of the project, a larger size biogas electricity engine (about 700 kW) is installed for the conversion of a portion of the methane to electricity, that shall be delivered to the local grid (Luzon grid).
On the basis of the available waste disposal data for the period 2001-2006 (see Annex 3), the baseline emissions were computed by applying a First Order Decay model (refer to equation 1 in B.6.1) for evaluating the amount of biogas potentially extractable from the landfill during the crediting period (hereinafter indicated as LFGextracted), as reported in Table 4. The % waste composition from MMDA in Annex 3 is used and for the biogas potential of each fraction, the default values for DOC for each fraction recommended by IPCC 1996 are used. Likewise, the IPCC default value for methane percentage in the biogas extracted (wCH4) equal to 50% and a gas collection efficiency of 54% are assumed. Capture efficiency represents the maximum amount of biogas susceptible of being captured due to certain technical limitations: this conservative value has been estimated on the basis of experience in landfill projects, taking into account the actual conditions of the Payatas site.
Table 4 – Expected biogas production during the crediting period.
YEAR LFG extracted
[Nm3/h] LFG extracted
[Nm3/y] LFG electricity
[Nm3/y] LFG flare,y [Nm3/y]
2007 2,269 19,880,380 825,000 19,055,380 2008 2,488 21,795,231 825,000 20,970,231 2009 2,297 20,119,534 3,217,500 16,902,034 2010 2,120 18,572,671 3,217,500 15,355,171 2011 1,957 17,144,736 3,217,500 13,927,236 2012 1,807 15,826,586 3,217,500 12,609,086 2013 1,668 14,609,781 3,217,500 11,392,281 2014 1,540 13,486,527 3,217,500 10,269,027 2015 1,421 12,449,634 3,217,500 9,232,134 2016 1,312 11,492,460 3,217,500 8,274,960

PROJECT DESIGN DOCUMENT FORM (CDM PDD) - Version 03 .1. CDM – Executive Board page 27 For an ex-ante calculation, a constant hourly volumetric flow rate of methane FVRG (calculated from LFGflare,y in Table 4, expressed in hourly values) is assumed and with a value of volumetric fraction of methane in the residual gas fvCH4,RG,h equal to 0.5, TMRG,h is calculated. The default value for the flare efficiency for enclosed flares continuously monitored is ηflare,h = 0.9 (see the Methodological “Tool to determine project emissions from flaring gases containing methane”) and
( )1000
219,018760 ,, ⋅−⋅⋅= hRGyflare TMPE [9]
(see Table 5).
Table 5 –Project emissions from flaring, PEflare,y tons CO2eq/y
YEAR TM RG,h [Nm3/h]
PEflare,y [t CO2 eq]
2007 774 14,238 2008 852 15,679 2009 669 12,314 2010 606 11,150 2011 548 10,075 2012 494 9,083 2013 444 8,167 2014 398 7,322 2015 356 6,542 2016 316 5,821
Using Equation 8 and an average methane fraction of the landfill gas wCH4 = 0.5, MDflared,y is calculated. Similarly, MDelectricity is calculated as:
44,, CHCHyyelectricityyelectricit DwLFGMD ⋅⋅= [10]
The total methane destroyed by the project activity, MDproject is calculated (please see Table 6).
Table 6 – Methane flared/combusted, MDproject,y tCH4/y
YEAR MD flared,y [t CH 4/y]
MD electricity,y [t CH 4/y]
MD project,y [t CH 4/y]
2007 6,151 296 6,447 2008 6,769 296 7,065 2009 5,471 1,153 6,624 2010 4,972 1,153 6,125 2011 4,512 1,153 5,665 2012 4,087 1,153 5,240
PROJECT DESIGN DOCUMENT FORM (CDM PDD) - Version 03 .1. CDM – Executive Board page 28
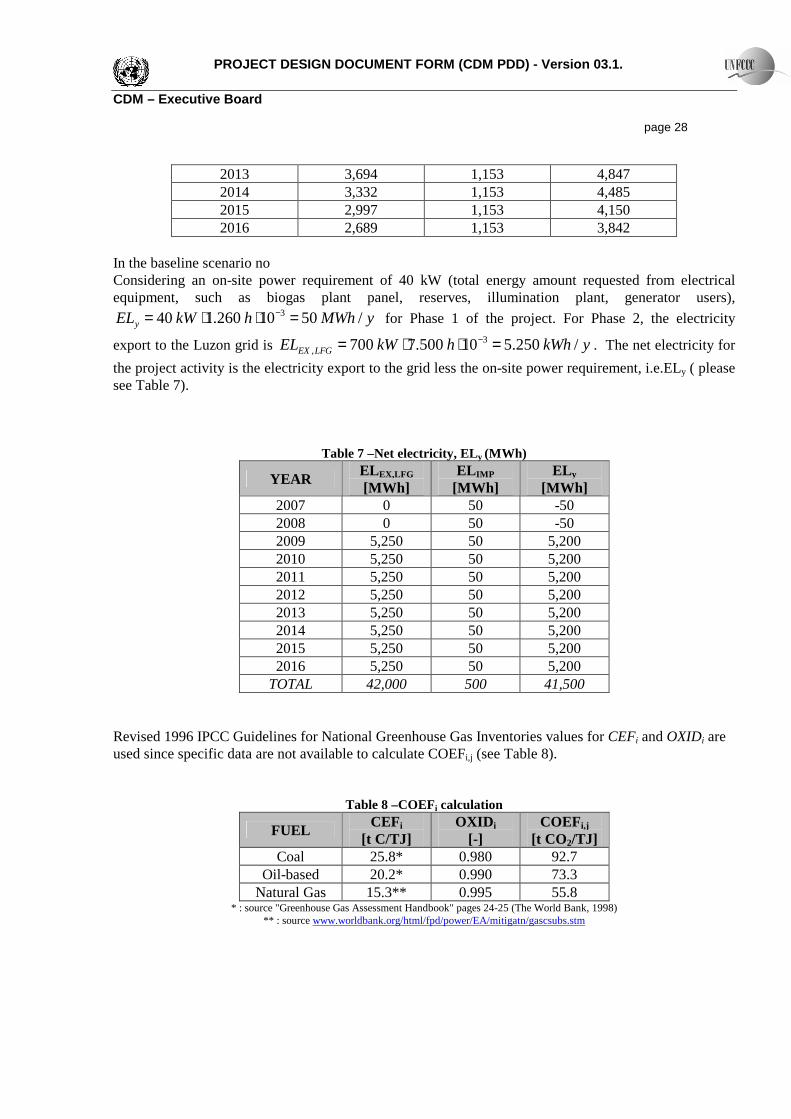
2013 3,694 1,153 4,847 2014 3,332 1,153 4,485 2015 2,997 1,153 4,150 2016 2,689 1,153 3,842
In the baseline scenario no Considering an on-site power requirement of 40 kW (total energy amount requested from electrical equipment, such as biogas plant panel, reserves, illumination plant, generator users),
yMWhhkWELy /5010260.140 3 =⋅⋅= − for Phase 1 of the project. For Phase 2, the electricity
export to the Luzon grid is ykWhhkWEL LFGEX /250.510500.7700 3, =⋅⋅= − . The net electricity for
the project activity is the electricity export to the grid less the on-site power requirement, i.e.ELy ( please see Table 7).
Table 7 –Net electricity, ELy (MWh)
YEAR ELEX,LFG
[MWh] EL IMP
[MWh] EL y
[MWh] 2007 0 50 -50 2008 0 50 -50 2009 5,250 50 5,200 2010 5,250 50 5,200 2011 5,250 50 5,200 2012 5,250 50 5,200 2013 5,250 50 5,200 2014 5,250 50 5,200 2015 5,250 50 5,200 2016 5,250 50 5,200
TOTAL 42,000 500 41,500 Revised 1996 IPCC Guidelines for National Greenhouse Gas Inventories values for CEFi and OXIDi are used since specific data are not available to calculate COEFi,j (see Table 8).
Table 8 –COEFi calculation
FUEL CEFi
[t C/TJ] OXID i
[-] COEFi,j
[t CO2/TJ] Coal 25.8* 0.980 92.7
Oil-based 20.2* 0.990 73.3 Natural Gas 15.3** 0.995 55.8
* : source "Greenhouse Gas Assessment Handbook" pages 24-25 (The World Bank, 1998) ** : source www.worldbank.org/html/fpd/power/EA/mitigatn/gascsubs.stm

PROJECT DESIGN DOCUMENT FORM (CDM PDD) - Version 03 .1. CDM – Executive Board page 29 F*i,j has been calculated (see Table 9).
Table 9 –F*i,j calculation 2005 2004 2003
FUEL MWh PCE TJ MWh PCE TJ MWh PCE TJ
Coal 14,653,275 33% 159,854 15,548,335 33% 169,618 14,351,121 33% 156,558 Oil-
based 2,021,641 33% 22,054 4,590,814 33% 50,082 3,595,860 33% 39,228
Natural Gas
16,860,917 50% 121,399 12,384,467 50% 89,168 13,139,410 50% 94,604
EFOM,y has been calculated (see Table 10).
Table 10 –EFOM,y calculation
ANNO 2005 GENj OXID Fi CEFi Fi*OXID i*CEF i*(44/12) Coal 14,653,275 0.980 159,854 25.8 14,819,736 Oil-based 2,021,641 0.990 22,054 20.2 1,617,151 Natural Gas 16,860,917 0.995 121,399 15.3 6,776,409 Geothermal 2,742,203 TOTAL 23,213,297 Hydro 4,331,224 Wind 17,469 TOTAL 40,626,729
ANNO 2004 GENj OXID Fi CEFi Fi*OXID i*CEF i*(44/12) Coal 15,548,335 0.980 169,618 25.8 15,724,964 Oil-based 4,590,814 0.990 50,082 20.2 3,672,284 Natural Gas 12,384,467 0.995 89,168 15.3 4,977,322 Geothermal 3,033,417 TOTAL 24,374,570 Hydro 4,296,879 Wind 0 TOTAL 39,853,912
ANNO 2003 GENj OXID Fi CEFi Fi*OXID i*CEF i*(44/12) Coal 14,351,121 0.980 156,558 25.8 14,514,150 Oil-based 3,595,860 0.990 39,228 20.2 2,876,400 Natural Gas 13,139,410 0.995 94,604 15.3 5,280,734 Geothermal 2,600,465 TOTAL 22,671,284 Hydro 3,847,774 Wind 0 TOTAL 37,534,630 EFOM

PROJECT DESIGN DOCUMENT FORM (CDM PDD) - Version 03 .1. CDM – Executive Board page 30 0.595
The annual electricity generation for each of the power plant group (in MWh) is calculated assuming a conservative operational period of 7,500 h/y; the fuel consumption and EFBM is calculated (see Table 11).

PROJECT DESIGN DOCUMENT FORM (CDM PDD) - Version 03 .1. CDM – Executive Board page 31
Table 11 EFBM,y calculation
Plant name Year Type Electricity generation [MWh/y]
Fuel consumption
[TJ] OXID CEFi F i*OXID i*CEF i*(44/12)
Ilijan 2002 Natural
gas 9,000,000 64,800 0.995 15.3 3,617,104
First Gas B (San Lorenzo)
2002 Natural
gas 3,750,000 27,000 0.995 15.3 1,507,127
San Roque 2003 Hydro 637,500 0 0 Kalayaan 3&4 2004 Hydro 2,625,000 0 0 North Wind
Power 2006 Wind 17,500 0 0
TOTAL
16,030,000
TOTAL 5,124,230
BM 0.320
EFy has been calculated (see Table 12).
Table 12 – Emission Factor, EFy EFOM,y
[t CO2/MWh] wOM
[-] EFBM,y
[t CO2/MWh] wBM
[-] EFy
[t CO2/MWh] 0,595 0,5 0,320 0,5 0,46
Emission reductions ERy are calculated (See Table 13).
Table 13 – Emission Reductions ERy for project activity YEAR MD project,y
[t CH 4] MD reg,y
[t CH 4] EL y
[MWh] CEFelectricity,y
[t CO2 eq/MWh]
ERy [t CO2 eq]
2007 6,447 0 -50 0.46 135,367 2008 7,065 0 -50 0.46 148,338 2009 6,624 0 5,200 0.46 141,505 2010 6,125 0 5,200 0.46 131,027 2011 5,665 0 5,200 0.46 121,355 2012 5,240 0 5,200 0.46 112,426 2013 4,847 0 5,200 0.46 104,183 2014 4,485 0 5,200 0.46 96,575 2015 4,150 0 5,200 0.46 89,551 2016 3,842 0 5,200 0.46 83,067

PROJECT DESIGN DOCUMENT FORM (CDM PDD) - Version 03 .1. CDM – Executive Board page 32
B.6.4 Summary of the ex-ante estimation of emission reductions:
Year Estimation of
project emissions [t CO2 eq]
Estimation of baseline
emissions [t CO2 eq]
Estimation of leakage
[t CO2 eq]
Estimation of overall emission
reductions [t CO2 eq]
2007 14,238 149,628 not considered 135,367 2008 15,679 164,047 not considered 148,338 2009 12,314 151,428 not considered 141,505 2010 11,150 139,785 not considered 131,027 2011 10,075 129,038 not considered 121,355 2012 9,083 119,117 not considered 112,426 2013 8,167 109,959 not considered 104,183 2014 7,322 101,505 not considered 96,575 2015 6,542 93,701 not considered 89,551 2016 5,821 86,497 not considered 83,067
B.7 Application of the monitoring methodology and description of the monitoring plan:
B.7.1 Data and parameters monitored:
Data / Parameter: LFGTOTAL,y Data unit: m3 Description: Total amount of landfill gas captured Source of data to be used:
Measurements by project participants using a continuous flow meter.
Value of data applied for the purpose of calculating expected emission reductions in section B.5
16.537.754 (average annual data in the crediting period of ten years)
Description of measurement methods and procedures to be applied:
The data will be achieved using a continuous flow meter and archived by electronic way during the crediting period and two years after
QA/QC procedures to be applied:
Any comment: Flow meter should be subject to a regular maintenance and testing regime to ensure accuracy.

PROJECT DESIGN DOCUMENT FORM (CDM PDD) - Version 03 .1. CDM – Executive Board page 33 Data / Parameter: LFGflare,y
Data unit: m3 Description: Amount of landfill gas flared Source of data to be used:
Measurements by project participants using a continuous flow meter.
Value of data applied for the purpose of calculating expected emission reductions in section B.5
13.798.754 (average annual data in the crediting period of ten years)
Description of measurement methods and procedures to be applied:
The data will be achieved using a continuous flow meter and archived by electronic way during the crediting period and two years after
QA/QC procedures to be applied:
Any comment: Flow meter should be subject to a regular maintenance and testing regime to ensure accuracy.
Data / Parameter: LFGelectricity,y
Data unit: m3 Description: Amount of landfill gas combusted in power plant Source of data to be used:
Measurements by project participants using a continuous flow meter
Value of data applied for the purpose of calculating expected emission reductions in section B.5
2.739.000 (average annual data in the crediting period of ten years)
Description of measurement methods and procedures to be applied:
The data will be achieved using a continuous flow meter and archived by electronic way during the crediting period and two years after
QA/QC procedures to be applied:
Any comment: Flow meter should be subject to a regular maintenance and testing regime to ensure accuracy.

PROJECT DESIGN DOCUMENT FORM (CDM PDD) - Version 03 .1. CDM – Executive Board page 34 Data / Parameter: fvi,h
Data unit: - Description: Volumetric fraction of component i in the residual gas in the hour h where i =
CH4, CO, CO2, O2, H2, N2 Source of data to be used:
Measurements by project participants using a continuous gas analyser
Value of data applied for the purpose of calculating expected emission reductions in section B.5
Because the flare combustion efficiency was fixed equal to 0.9, there is not a value input of this parameter. During the crediting period this parameter will be measured in continuous in order to calculate the real value of flare combustion efficiency
Description of measurement methods and procedures to be applied:
Ensure that the same basis (dry or wet) is considered for this measurement and the measurement of the volumetric flow rate of the residual gas (FVRG,h) when the residual gas temperature exceeds 60 ºC
QA/QC procedures to be applied:
Analysers must be periodically calibrated according to the manufacturer’s recommendation. A zero check and a typical value check should be performed by comparison with a standard certified gas.
Any comment: As a simplified approach it will only measured the methane content of the residual gas and consider the remaining part as N2.
Data / Parameter: FVRG,h
Data unit: m3/h Description: Volumetric flow rate of the residual gas in dry basis at normal conditions in the
hour h Source of data to be used:
Measurements by project participants using a flow meter
Value of data applied for the purpose of calculating expected emission reductions in section B.5
Because the flare combustion efficiency was fixed equal to 0.9, there is not a value input of this parameter. During the crediting period this parameter will be measured in continuous in order to calculate the real value of flare combustion efficiency
Description of measurement methods and procedures to be applied:
Ensure that the same basis (dry or wet) is considered for this measurement and the measurement of volumetric fraction of all components in the residual gas (fvi,h) when the residual gas temperature exceeds 60 ºC. The value will be continuously monitored on an hourly basis.
QA/QC procedures to be applied:
Flow meters are to be periodically calibrated according to the manufacturer’s recommendation.
Any comment:

PROJECT DESIGN DOCUMENT FORM (CDM PDD) - Version 03 .1. CDM – Executive Board page 35 Data / Parameter: tO2,h
Data unit: - Description: Volumetric fraction of O2 in the exhaust gas of the flare in the hour h Source of data to be used:
Measurements by project participants using a continuous gas analyser
Value of data applied for the purpose of calculating expected emission reductions in section B.5
Because the flare combustion efficiency was fixed equal to 0.9, there is not a value input of this parameter. During the crediting period this parameter will be measured in continuous in order to calculate the real value of flare combustion efficiency
Description of measurement methods and procedures to be applied:
Extractive sampling analysers with water and particulates removal devices or in situ analysers for wet basis determination. The point of measurement (sampling point) shall be in the upper section of the flare (80% of total flare height). Sampling shall be conducted with appropriate sampling probes adequate to high temperatures level (e.g. inconel probes). The value will be continuously monitored on an hourly basis.
QA/QC procedures to be applied:
Analysers must be periodically calibrated according to the manufacturer’s recommendation. A zero check and a typical value check should be performed by comparison with a standard gas.
Any comment:
Data / Parameter: fvCH4,FG,h Data unit: mg/m3 Description: Volumetric flow rate of the exhaust gas in dry basis at normal conditions in the
hour h Source of data to be used:
Measurements by project participants using a continuous gas analyser
Value of data applied for the purpose of calculating expected emission reductions in section B.5
Because the flare combustion efficiency was fixed equal to 0.9, there is not a value input of this parameter. During the crediting period this parameter will be measured in continuous in order to calculate the real value of flare combustion efficiency
Description of measurement methods and procedures to be applied:
Extractive sampling analysers with water and particulates removal devices or in situ analyser for wet basis determination. The point of measurement (sampling point) shall be in the upper section of the flare (80% of total flare height). Sampling shall be conducted with appropriate sampling probes adequate to high temperatures level (e.g. inconel probes). The value will be continuously monitored on an hourly basis.
QA/QC procedures to be applied:
Analysers must be periodically calibrated according to manufacturer’s recommendation. A zero check and a typical value check should be performed by comparison with a standard gas.
Any comment: Measurement instruments may read ppmv or % values.

PROJECT DESIGN DOCUMENT FORM (CDM PDD) - Version 03 .1. CDM – Executive Board page 36 Data / Parameter: Tflare Data unit: °C Description: Temperature in the exhaust gas of the flare Source of data to be used:
Measurements by project participants
Value of data applied for the purpose of calculating expected emission reductions in section B.5
Not applicable
Description of measurement methods and procedures to be applied:
Continuous measure the temperature of the exhaust gas stream in the flare by a Type N thermocouple. A temperature above 500 ºC indicates that a significant amount of gases are still being burnt and that the flare is operating.
QA/QC procedures to be applied:
Thermocouples should be replaced or calibrated every year.
Any comment:
Data / Parameter: T
Data unit: °C Description: Temperature of the landfill gas Source of data to be used:
Measurements by project participants using a temperature probe
Value of data applied for the purpose of calculating expected emission reductions in section B.5
Not applicable
Description of measurement methods and procedures to be applied:
The value will be continuously monitored by a temperature probe during the crediting period and 2 years after.
QA/QC procedures to be applied:
Any comment:

PROJECT DESIGN DOCUMENT FORM (CDM PDD) - Version 03 .1. CDM – Executive Board page 37 Data / Parameter: P
Data unit: Pa Description: Pressure of the landfill gas Source of data to be used:
Measurements by project participants using an manometer
Value of data applied for the purpose of calculating expected emission reductions in section B.5
Not applicable
Description of measurement methods and procedures to be applied:
The value will be continuously monitored by an manometer during the crediting period and 2 years after.
QA/QC procedures to be applied:
Any comment:
Data / Parameter: ELEX,LFG
Data unit: MWh Description: Total amount of electricity exported out of the project boundary
Source of data to be used:
Measurements by project participants using an electricity meter
Value of data applied for the purpose of calculating expected emission reductions in section B.5
5.250
Description of measurement methods and procedures to be applied:
The value will be continuously monitored by an electricity meter during the crediting period and 2 years after.
QA/QC procedures to be applied:
Any comment:

PROJECT DESIGN DOCUMENT FORM (CDM PDD) - Version 03 .1. CDM – Executive Board page 38 Data / Parameter: ELIMP
Data unit: MWh Description: Total amount of electricity imported to meet project requirements Source of data to be used:
Measurements by project participants using an electricity meter
Value of data applied for the purpose of calculating expected emission reductions in section B.5
50
Description of measurement methods and procedures to be applied:
The value will be continuously monitored by an electricity meter during the crediting period and 2 years after.
QA/QC procedures to be applied:
Any comment:
Data / Parameter: H
Data unit: Hours Description: Operation of the energy plant Source of data to be used:
Measurements by project participants by periodical recording
Value of data applied for the purpose of calculating expected emission reductions in section B.5
7500
Description of measurement methods and procedures to be applied:
The value will be annually recorded during the crediting period and 2 years after.
QA/QC procedures to be applied:
Any comment: B.7.2 Description of the monitoring plan:
The chosen monitoring methodology is based on direct measurement of the amount of landfill gas captured and destroyed at the flare platform and the electricity generating unit(s) to determine the quantities. The monitoring plan provides for continuous measurement of the quantity and quality of LFG generated. The main variables that need to be determined are the quantity of methane actually captured (MDproject,y), quantity of methane flared (MDflared,y), the quantity of methane generated (MDtotal,y) and, when Phase 2 of the project starts, the quantity of methane used to generate electricity (MDelectricity,y).

PROJECT DESIGN DOCUMENT FORM (CDM PDD) - Version 03 .1. CDM – Executive Board page 39 To determine these variables, the following parameters will be monitored:
� the amount of landfill gas generated (LFGtotal,y) (in m³, using a continuous flow meter); � the amount of gas fed to the flare (LFGflare,y): in this case the flow meter used will be calibrated
periodically by an official accredited entity; � the fraction of methane in the landfill gas (wCH4,y) will be measured with a continuous analyzer; � the flare project emissions (PEflare), calculated by continuous monitoring of the exhaust gases
(fv i,h, FVRG, tO2 h, fvCH4,FG,h, Tflare); � temperature (T) and pressure (P) of the landfill, required to determine the density of methane in
the landfill gas; � external energy (electricity) is required only for plant start-up and on-site generator maintenance:
that amount of power supply is taken into account under the term ELIMP; � no relevant regulations for LFG project activities will be foreseeable (MDreg=0); � the quantity of methane fed to the generator for the production of electricity for internal
consumption (LFGelectricity,y). When PHASE 2 is operational, the following will be monitored:
� the quantity of methane fed to the energy plant for exportation (to be added to LFGelectricity,y); � the quantity of electricity exported (ELEX,LFG); � the operating hours of the energy plant.
The technical characteristics of the high temperature combustion unit are:
� feeding pressure : 50 mbar � min CH4 percentage : 30% � min calorific capacity : 2.500 kW � flow rate : 500 – 2.500 Nm3/h � combustion temperature : >850 °C, retention time > 0,3 sec � critical temperature : 1.260 °C � combustion coefficient (CO2/CO+CO2) : min. 99% � temperature control : continuous, by a thermocouple Pt-Rh-Pt with output signal 4÷20 mA

PROJECT DESIGN DOCUMENT FORM (CDM PDD) - Version 03 .1. CDM – Executive Board page 40
Figure 6 – Schematic monitoring plan of the Quezon City controlled disposal facility biogas project In order to implement the monitoring plan, a local staff of technicians will be trained in order to ensure a correct monitoring practice. A minimum of 2 people will be trained in order to:
� learn general knowledge about the equipment used in the landfill; � read and record data; � learn calibration methodology; � learn equipment maintenance procedures; � manage emergency situations (for instance too high oxygen level or electricity breakdown).
Landfill
Biogas collection
system
Power generation unit
CH4 T P F
F
F
Flare fvi,h
FVRG,h
tO2,h
fvCH4,FG,h
Tflare
Luzon grid
ELEX,LFG
ELIMP
On site power generator
F
MONITORING STRUMENTATION CH4 = fraction of CH4
T = temperature (°C) P = pressure (Pa) F = flow of LFG (m3)

PROJECT DESIGN DOCUMENT FORM (CDM PDD) - Version 03 .1. CDM – Executive Board page 41 Pangea Green Philippines will be the entity responsible for the plant operations and will hire trainees which will be employed for the plant operational management. The chosen trainees will have a good understanding of the process and installation technology of the landfill gas extraction. Verification and training will start at the same time with preliminary works for the installation. A guidebook in English about landfill gas extraction and utilization will also be made available. The guidebook will have:
� operation manual; � drawings; � maintenance instructions; � description of parts of the equipment; � parameters for landfill gas composition, temperature and pressure.
Data collection will occur in electronic format and all the data will be stored in a personal computer (located inside the office building) that will be available for remote-control from Italy, where experts of Pangea Green Energy s.r.l. can give technical advices. As it is the Quezon City Controlled Disposal Facility complies with environmental policies and standards regarding management of dumpsite gas emissions. The Project activity is “additional” and actually not a requirement in terms of the City in complying with environmental policies and standards, in particular RA 9003 (Solid Waste Management Act of 2000) but the City nevertheless decided to undertake the Project activity with the Pangea Green Energy to further improve the environment, health and safety of the people residing in the vicinity of the disposal facility. No new effluents will be produced by the Project. Only leachate trapped in wells and moisture entrained by the biogas is the expected effluents from the plant. These will be discharged using appropriate collection and disposal system. Harmful atmospheric emissions will be reduced since the biogas will be collected thereby preventing its harmful components from contaminating groundwater, damaging existing vegetation and polluting the air. All consumables will be properly disposed. Pangea will also ensure that all equipment that will be acquired for the Project will meet national standards for safety and noise. Further Pangea guarantees the observance of environmental regulations for emissions and other plant discharges in accordance with the Clean Air Act and Effluent Regulations by making periodic analyses and inspections. Biogas not only contains methane and carbon dioxide but also toxic gases that have various adverse effects on people’s health. Health risks and unpleasant odor releases related to these biogas constituents will be eliminated or reduced by the Project. The Project will also prevent subsurface gas migration which could cause the dissolution in groundwater of certain biogas components such as toxic volatile organic compounds (VOCs) and carbon dioxide that can render the groundwater acidic or corrosive. Prevention of subsurface migration means prevention of migration of the biogas in root zones thereby decreasing the possibility of damage to existing vegetation on the dumpsite and nearby areas. This will accelerate re-use of the land covered by the dumpsite. Safety risks such as fire or instantaneous combustion and explosion hazards will be eliminated or reduced.

PROJECT DESIGN DOCUMENT FORM (CDM PDD) - Version 03 .1. CDM – Executive Board page 42 B.8 Date of completion of the application of the baseline study and monitoring methodology and the name of the responsible person(s)/entity(ies) The baseline study and the monitoring methodology was concluded on 20 May 2007. The entity responsible of the baseline study and the monitoring methodology is Pangea Green Energy s.r.l.(see Section A.3.) in the role of project participant: Pangea Green Energy s.r.l. Corso Vittorio Emanuele 83 10128 Torino +3901119507611 [email protected] SECTION C. Duration of the project activity / crediting period C.1 Duration of the project activity: C.1.1. Starting date of the project activity: 23/07/2007
C.1.2. Expected operational lifetime of the project activity: 10 years 0 months C.2 Choice of the crediting period and related information: C.2.1. Renewable crediting period Not applicable. C.2.1.1. Starting date of the first crediting period: C.2.1.2. Length of the first crediting period: C.2.2. Fixed crediting period: C.2.2.1. Starting date: 01/01/2008 C.2.2.2. Length:

PROJECT DESIGN DOCUMENT FORM (CDM PDD) - Version 03 .1. CDM – Executive Board page 43 10 years 0 months SECTION D. Environmental impacts D.1. Documentation on the analysis of the environmental impacts, including transboundary impacts: According to the Department of Environment and Natural Resources (DENR) Administrative Order No. 30 Series of 2003, the Project activity falls under Category C – projects that directly enhance environmental quality or address existing environmental problems. Category C projects are not covered by the Philippine EIS System and are therefore not required to secure an Environmental Compliance Certificate (ECC). Hence, as required in the said Administrative Order, Pangea submitted an application for Certificate of Non-Coverage in February 15, 2007 to the Environmental Management Bureau (EMB) of the Philippines, the government office in-charge of implementing the Philippine EIS System.
In the Project Description attached to the application, Pangea described the environmental impacts of the Project activity from pre-construction phase to abandonment phase. An environmental management plan discussing how the Project activity will improve air, water and soil quality was also prepared. Based on these documents submitted, EMB issued a letter to Pangea (see Annex 5) explaining that they have issued a Certificate of Non-Coverage (CNC) for the same project in 2005 and that this CNC covers the Project activity. Attached in Annex 5 is a copy of the CNC for the 1MW Payatas Landfill Gas to Energy Project.
D.2. If environmental impacts are considered significant by the project participants or the host Party, please provide conclusions and all references to support documentation of an environmental impact assessment undertaken in accordance with the procedures as required by the host Party: The project activity which involves the mitigation of a potent GHG presents no significant negative environment impacts. On the other hand, the collection, combustion and flaring of the methane gas will contribute to the reduction of methane resulting in reduced instances of onsite fires, gas migration to nearby communities and will help immensely in stabilizing the Quezon City dumpsite. For further information about environmental aspects see section B.7.2. SECTION E. Stakeholders’ comments E.1. Brief description how comments by local stakeholders have been invited and compiled: As part of the process to gather stakeholders’ comments for the Project, Pangea consulted with the Department of Energy, Department of Environment and Natural Resources on the national level and with the Quezon City local government unit on numerous occasions. In cooperation with the Payatas Operations Group (POG), Pangea invited stakeholders from the local community to a public consultation for the Project. On February 16, 2007, Pangea sent out letters to the

PROJECT DESIGN DOCUMENT FORM (CDM PDD) - Version 03 .1. CDM – Executive Board page 44 officials of the Payatas Operations Group (POG) and the Environmental Protection and Waste Management Department (EPWMD) of Quezon City (QC), the local community, and various organizations or groups operating in the Project activity area to invite them to attend and participate in the Stakeholders’ Meeting that was scheduled to be conducted on February 23, 2007. Two versions of the invitation letter were prepared, one in English and one in Pilipino, the national language of the Philippines. POG assisted Pangea in the delivery of the invitations to the identified participants. The event took place on Friday, 23 February 2007 at the POG office at the dumpsite. Thirty two (32) community leaders attended the forum, representing the twenty one (21) groups from various sectors, associations, and cooperatives – urban poor, scavengers, recyclers, junk shops, transport, school, and the QC LGU. The session was conducted in English and Pilipino.
Pangea gave a slide presentation to inform the stakeholders about the project activity. The presentation is in Pilipino. The English version is also provided immediately after it. During the meeting, participants were invited to express their opinions through an open forum (question and answer) session. E.2. Summary of the comments received: In general, the participants were aware and some were involved in the on-going conversion of Payatas from an open to a controlled dumpsite, and know of the 100kW test plant. They were supportive of the Project and understood the numerous benefits to the local community. The community participants were particularly interested in the Project’s environmental, health, and safety impacts, participation of dumpsite workers (scavengers) and employment opportunities. There were no negative comments in regards to the Project. E.3. Report on how due account was taken of any comments received: The minutes of the consultation, as well as the summary of issues and concerns and proposed measures was taken during the stakeholders meeting.
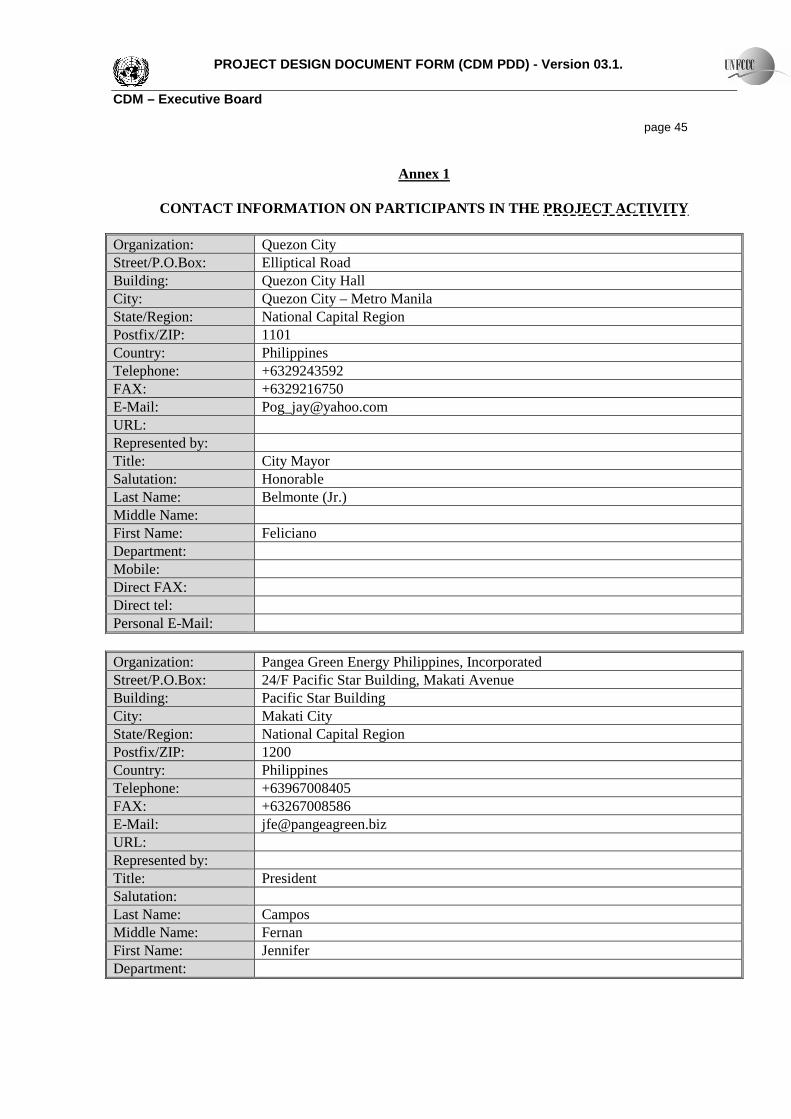
PROJECT DESIGN DOCUMENT FORM (CDM PDD) - Version 03 .1. CDM – Executive Board page 45
Annex 1
CONTACT INFORMATION ON PARTICIPANTS IN THE PROJECT ACTIVITY Organization: Quezon City Street/P.O.Box: Elliptical Road Building: Quezon City Hall City: Quezon City – Metro Manila State/Region: National Capital Region Postfix/ZIP: 1101 Country: Philippines Telephone: +6329243592 FAX: +6329216750 E-Mail: [email protected] URL: Represented by: Title: City Mayor Salutation: Honorable Last Name: Belmonte (Jr.) Middle Name: First Name: Feliciano Department: Mobile: Direct FAX: Direct tel: Personal E-Mail: Organization: Pangea Green Energy Philippines, Incorporated Street/P.O.Box: 24/F Pacific Star Building, Makati Avenue Building: Pacific Star Building City: Makati City State/Region: National Capital Region Postfix/ZIP: 1200 Country: Philippines Telephone: +63967008405 FAX: +63267008586 E-Mail: [email protected] URL: Represented by: Title: President Salutation: Last Name: Campos Middle Name: Fernan First Name: Jennifer Department:

PROJECT DESIGN DOCUMENT FORM (CDM PDD) - Version 03 .1. CDM – Executive Board page 46 Mobile: +639175351030 Direct FAX: Direct tel: Personal E-Mail: [email protected]
Organization: Pangea Green Energy s.r.l. Street/P.O.Box: Corso Vittorio Emanuele II 83 Building: City: Turin State/Region: Postfix/ZIP: 10128 Country: Italy Telephone: +3901119507611 FAX: +39011549644 E-Mail: [email protected] URL: www.pangeagreen.biz Represented by: Title: President Salutation: Last Name: Micheli Middle Name: First Name: Federico Department: Mobile: +393357242420 Direct FAX: Direct tel: Personal E-Mail: [email protected]

PROJECT DESIGN DOCUMENT FORM (CDM PDD) - Version 03 .1. CDM – Executive Board page 47
Annex 2
INFORMATION REGARDING PUBLIC FUNDING
THERE IS NO PUBLIC FUNDING OF THE PROJECT ACTIVITY.
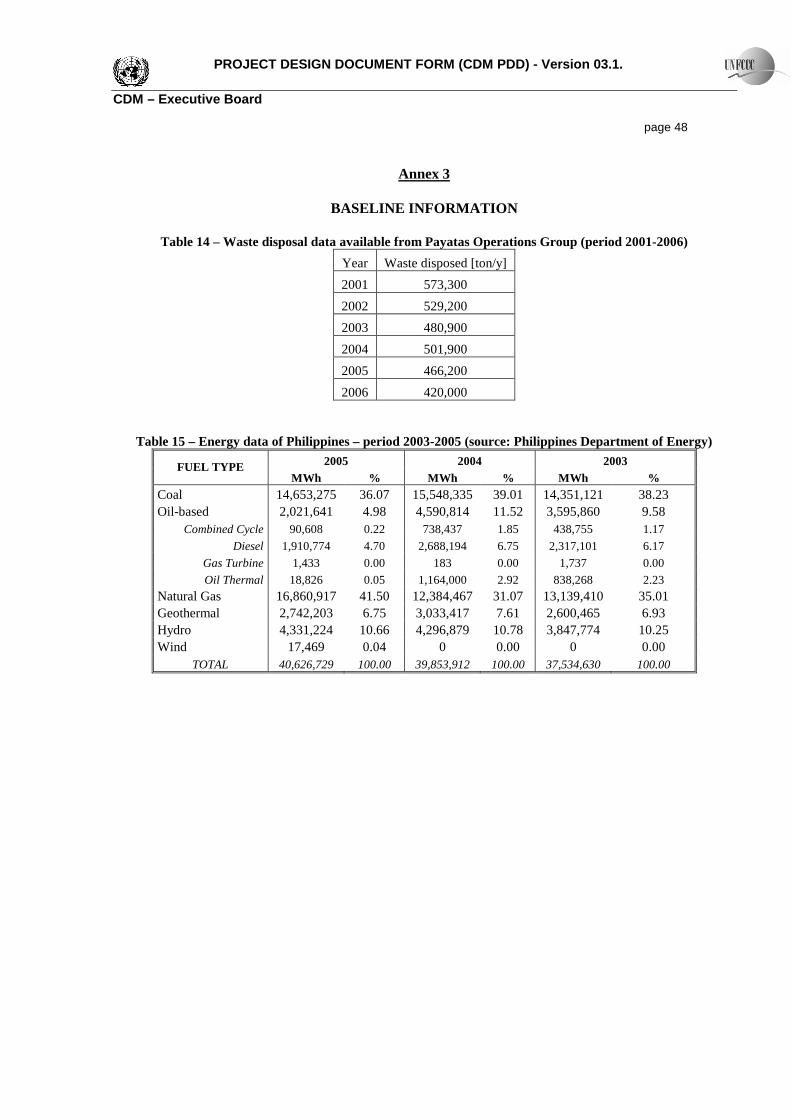
PROJECT DESIGN DOCUMENT FORM (CDM PDD) - Version 03 .1. CDM – Executive Board page 48
Annex 3
BASELINE INFORMATION
Table 14 – Waste disposal data available from Payatas Operations Group (period 2001-2006)
Year Waste disposed [ton/y]
2001 573,300
2002 529,200
2003 480,900
2004 501,900
2005 466,200
2006 420,000
Table 15 – Energy data of Philippines – period 2003-2005 (source: Philippines Department of Energy)
2005 2004 2003 FUEL TYPE MWh % MWh % MWh %
Coal 14,653,275 36.07 15,548,335 39.01 14,351,121 38.23 Oil-based 2,021,641 4.98 4,590,814 11.52 3,595,860 9.58
Combined Cycle 90,608 0.22 738,437 1.85 438,755 1.17
Diesel 1,910,774 4.70 2,688,194 6.75 2,317,101 6.17
Gas Turbine 1,433 0.00 183 0.00 1,737 0.00
Oil Thermal 18,826 0.05 1,164,000 2.92 838,268 2.23 Natural Gas 16,860,917 41.50 12,384,467 31.07 13,139,410 35.01 Geothermal 2,742,203 6.75 3,033,417 7.61 2,600,465 6.93 Hydro 4,331,224 10.66 4,296,879 10.78 3,847,774 10.25 Wind 17,469 0.04 0 0.00 0 0.00
TOTAL 40,626,729 100.00 39,853,912 100.00 37,534,630 100.00

PROJECT DESIGN DOCUMENT FORM (CDM PDD) - Version 03 .1. CDM – Executive Board page 49 Table 16 – List of Luzon grid power plants as of December 2005 (source: Philippines Department of Energy)
POWER PLANT CAPACITY
[MW] LOCATION OWNER
STARTING DATE
Coal 3,287.34
Pagbilao Unit 1 364.00 Pagbilao, Quezon Mirant (Pagbilao) 07/03/1996
Pagbilao Unit 2 364.00 Pagbilao, Quezon Mirant (Pagbilao) 26/05/1996
Calaca 1 174.10 Calaca, Batangas Far East Livingston (Singapore) 05/09/1984
Calaca 2 152.58 Calaca, Batangas Far East Livingston (Singapore) 05/06/1995
Masinloc I 290.33 Masinloc, Zambales NPC 18/06/1998
Masinloc II 290.33 Masinloc, Zambales NPC 01/12/1998
Sual I 576.00 Sual, Pangasinan Mirant (Sual) 23/10/1999
Sual II 576.00 Sual, Pangasinan Mirant (Sual) 05/10/1999
Quezon Power 500.00 Mauban, Quezon Quezon Power Phils. 01/05/2000
Diesel 768.60 Enron Subic 2 100.00 Subic, Olongapo City Enron Power Corp. (USA) 22/02/1994
Edison Global (BEPZA) 50.00 Mariveles, Bataan Edison Global (Hongkong) 07/08/1994
Duracom 113.00 Navotas, Metro Manila First Private Power Corp. 01/09/1995
East Asia Diesel 109.00 Navotas, Metro Manila East Asia Diesel Power Corp. 01/09/1995
Angeles PI DPP 30.00 Angeles City Angeles Electric Corporation 05/12/1994
FPPC- Bauang Dsl 210.00 Bauang, La Union First Private Power Corp. 30/08/1994
FELS II Diesel (North Harbor) North Harbor, Manila Far East Livingston (Singapore) July 1994
Magellan Cogen (CEPZA) 60.00 Rosario, Cavite Magellan Cogen Utilities 7/1/1995 1/1/1997
FCVC DPP 32.00 Cabanatuan City Cabanatuan Electric Corp. 15/01/1996
Tarlac Electric 12.60 Capas, Tarlac Tarlac Electric Inc. 17/06/1905
Trans Asia Power 52.00 La Union Trans Asia Power
Natural Gas 2,703.00
San Antonio 3.00 Echague, Isabela Non-NPC 01/07/1994
Sta. Rita Natural Gas 1,000.00 Sta. Rita, Batangas First Gas Power Corp 6/2000 10/2001
Ilijan 1,200.00 Ilijan, Batangas City KEPCO (Ilijan) 05/06/2002
First Gas B (San Lorenzo) 500.00 Sta. Rita, Batangas First Gas Power Corp 01/09/2002
Gas Turbine 640.00
Hopewell GT 100.00 Navotas, Metro Manila Mirant (Navotas) Corp. 8/16/1990 3/18/1993
Limay CCGT 540.00 Limay, Bataan ABB/Marubeni/Kawasaki Consortium 5/14/1993 , 12/10/1994
Geothermal 726.90 MakBan 1 62.00 Calauan, Laguna NPC 26/04/1979
MakBan 2 62.00 Calauan, Laguna NPC 25/07/1979
MakBan 3 62.00 Calauan, Laguna NPC 22/04/1980
MakBan 4 62.00 Calauan, Laguna NPC 25/06/1980
MakBan 5 38.97 Calauan, Laguna NPC 05/06/1984
MakBan 6 38.97 Calauan, Laguna NPC 10/09/1984
MakBan 7 (D) 19.48 Calauan, Laguna NPC 16/10/1995
MakBan 8(D) 19.48 Calauan, Laguna NPC 12/11/1995
MakBan 9(E) 19.48 Calauan, Laguna NPC 22/05/1996

PROJECT DESIGN DOCUMENT FORM (CDM PDD) - Version 03 .1. CDM – Executive Board page 50
Makban 10(E) 19.48 Calauan, Laguna NPC 27/05/1996
Bac Man I-1 27.97 Manito, Albay NPC 10/09/1993
Bac Man I-2 27.97 Manito, Albay NPC 12/12/993
Bac Man II-1 11.19 Manito, Albay NPC 15/03/1994
Bac Man II (Botong) 11.19 Manito, Albay NPC 17/03/1998
Tiwi 1 41.10 Tiwi, Albay NPC 11/01/1979
Tiwi 2 56.50 Tiwi, Albay NPC 25/05/1979
Tiwi 3 37.42 Tiwi, Albay NPC 08/01/1980
Tiwi 4 0.00 Tiwi, Albay NPC 01/04/1980
Tiwi 5 51.70 Tiwi, Albay NPC 20/12/1981
Tiwi 6 50.50 Tiwi, Albay NPC 16/03/1984
MakBan Ormat 6.00 Bitin, Bay Laguna Ormat Inc. USA 28/02/1994
Manito 1.50 Albay Non-NPC 01/10/1998
Hydro 1,811.26
San Roque 85.00 Benguet San Roque Corporation 01/05/2003
HEDCOR 25.35 La Trinidad, Benguet Hydro Electric Dev't. Corp. (Phils.) 01/01/1993
Mini-Hydro 16.21 Luzon NON-NPC
NIA-Baligatan 6.00 Benguet NON-NPC 1979
NMHC 6.00 La Trinidad, Benguet NMHC 01/01/1993
Kalayaan 300.00 Kalayaan, Laguna CBK Power 8/13/1982 4/25/1982
Magat 360.00 Ramon, Isabela NPC 8/14/1983 10/24/1983
Masiway 11.00 Pantabangan, Nueva Ecija NPC 27/02/1981
Caliraya 23.50 Lumban, Laguna CBK Power 1942 / 1947 / 1950
Botocan 10.00 Laguna CBK Power 1946-48
Angat 226.00 Norzagaray, Bulacan NPC 10/16/1967 6/16/1986
Pantabangan 80.00 Pantabangan, Nueva Ecija NPC 4/1/1977 5/1/1977
Buhi-Barit 1.80 Buhi, Camarines Sur Ramon Constancio 01/09/1957
Ambuklao 0.00 Bokud, Benguet MIESCOR 23/12/1956
Binga 100.00 Itogon, Benguet Chiang Jiang Energy Corp. 19/01/1960
Bakun 70.00 Alilem, Ilocos Sur HEDCOR (Bakun) 2/6/2001 10/10/2000
Casecnan 140.00 Pantabangan, Nueva Ecija NIA Philippines 05/04/2002
Cawayan 0.40 Guinlajon, Sorsogon SORECO II 01/06/2002
Kalayaan 3&4 350.00 Kalayaan, Laguna CBK Power 01/05/2004
Oil Thermal 650.00
Malaya 1 300.00 Pililla, Rizal NPC 15/09/1995
Malaya 2 350.00 Pililla, Rizal NPC 15/09/1995
Sucat 3 0.00 Sucat, Paranaque NPC Retired
Sucat 2 0.00 Sucat, Paranaque NPC Retired
Wind 8.75
North Wind Power 8.75 Bangui Bay,Ilocos Norte North Wind Power Dev.Corp. June 2006
The baseline emission factor (EFy) is calculated according to the following three steps.

PROJECT DESIGN DOCUMENT FORM (CDM PDD) - Version 03 .1. CDM – Executive Board page 51 STEP 1. Calculate the Operating Margin emission factor (EFOM,y) For the calculation of the Operating Margin emission factor EFOM,y it has been used the Simple OM method, because low-cost/must run resources (like hydro, geothermal, wind, low-cost biomass, nuclear and solar generation) constitute less than 50% of total grid generation in average of the five most recent years (see Table).
Table 17 – List of the most recent power plants in the Luzon grid (low-cost/must run plants are in red)
PLANT SOURCE POWER
INSTALLED [MW] LOCATION OWNER
STARTING DATE
Casecnan Hydroelectric 140 Pantabangan, Nueva Ecija
NIA Philippines 05/04/2002
Cawayan Hydroelectric 0.4 Guinlajon, Sorsogon
SORECO II 01/06/2002
Ilijan Natural gas 1,200 Ilijan, Batangas
City KEPCO (Ilijan) 05/06/2002
First Gas B (San Lorenzo)
Natural gas 500 Sta. Rita, Batangas
First Gas Power Corp
01/09/2002
San Roque Hydroelectric 85 Benguet San Roque Corporation
01/05/2003
Kalayaan 3&4 Hydroelectric 350 Kalayaan, Laguna CBK Power 01/05/2004
North Wind Power Wind 8.75 Bangui Bay,Ilocos
Norte
North Wind Power
Dev.Corp. June 2006
TOTAL 2,284
The Simple OM emission factors has been calculated ex-ante on the basis of the full generation-weighted average for the most recent 3 years for which data are available (period 2003-2005). The Simple OM emission factor (EFOM,simple,y) is calculated as the generation-weighted average emissions per electricity unit (tCO2/MWh) of all generating sources serving the system, not including low-operating cost and must-run power plants:
[11] where:
Fi ,j, y is the amount of fuel i (in a mass or volume unit) consumed by relevant power sources j in year y; j refers to the power sources delivering electricity to the grid, not including low-operating cost and must-run power plants, and including imports to the grid; COEFi,j y is the CO2 emission coefficient of fuel i (tCO2 / mass or volume unit of the fuel), taking into account the carbon content of the fuels used by relevant power sources j and the percent oxidation of the fuel in year y; GENj,y is the electricity (MWh) delivered to the grid by source j.
The CO2 emission coefficient COEFi is obtained as:

PROJECT DESIGN DOCUMENT FORM (CDM PDD) - Version 03 .1. CDM – Executive Board page 52
[12] where:
NCVi is the net calorific value (energy content) per mass or volume unit of a fuel i; OXIDi is the oxidation factor of the fuel (source: Revised 1996 IPCC Guidelines for National Greenhouse Gas Inventories); EFCO2,i is the CO2 emission factor per unit of energy of the fuel i.
The fuel consumption Fi,j,y can be also expressed in TJ (F* i,j,y) rather than in a mass or volume unit:
PCEFF elyjiyji
0036,0,,,
*,, ⋅= [13]
where: Fi,j,y,el is the fuel i consumption expressed in MWh/y; 0,0036 is a conversion unit factor (TJ/kWh); PCE is the conservative plant conversion efficiency By expressing fuel consumption in TJ (F* i,j,y), Equation 12 can be written as:
12
44, ⋅⋅= iiji OXIDCEFCOEF [14]
where: CEFi is the carbon emission factor for the fuel i [t C/TJ] 44/12 is the conversion factor of carbon to full molecular weight of CO2 Thus Equation 11 can be written as:
∑
∑ ⋅⋅⋅=
jyj
jiiiji
yOM GEN
OXIDCEFF
EF,
,
*,
,
1244
[15]
STEP 2. Calculate the Build Margin emission factor (EFBM,y) The Build Margin emission factor EFBM,y has to be calculated as the generation-weighted average emission factor (tCO2/MWh) of a sample of power plants m, as follows:
[16] where Fi,m,y , COEFi,m and GENm,y are analogous to the variables described in the STEP 1. The Build Margin emission factor EFBM,y has been calculated ex-ante on the basis of the most recent information available on plants already built for a sample group m at the time of PDD submission. The sample group m consists of the five power plants that have been built most recently (see Table 18). This

PROJECT DESIGN DOCUMENT FORM (CDM PDD) - Version 03 .1. CDM – Executive Board page 53 criteria is more conservative (comprising the larger annual generation) than the most recently power plant capacity additions in the electricity system that comprise 20% of the system generation (in MWh).
Table 18 – List of the last five power plants built in Luzon grid
PLANT SOURCE POWER
INSTALLED [MW] LOCATION
STARTING DATE
Ilijan Natural gas 1,200 Ilijan, Batangas
City 05/06/2002
First Gas B (San Lorenzo)
Natural gas 500 Sta. Rita, Batangas
01/09/2002
San Roque Hydroelectric 85 Benguet 01/05/2003 Kalayaan 3&4 Hydroelectric 350 Kalayaan, Laguna 01/05/2004
North Wind Power Wind 8.75 Bangui Bay,Ilocos
Norte June 2006
TOTAL 2,143.75
STEP 3. Calculate the baseline emission factor EFy(
The baseline emission factor EFy is calculated as the weighted average of the Operating Margin emission factor (EFOM,y) and the Build Margin emission factor (EFBM,y):
[17] where the weights wOM and wBM, by default are wOM = wBM = 0,5 and EFOM,y and EFBM,y are calculated as described in Steps 1 and 2 above and are expressed in tCO2/MWh.

PROJECT DESIGN DOCUMENT FORM (CDM PDD) - Version 03 .1. CDM – Executive Board page 54
Table 19 – Waste Characterization

PROJECT DESIGN DOCUMENT FORM (CDM PDD) - Version 03 .1. CDM – Executive Board page 55
Annex 4
MONITORING INFORMATION
Introduction Monitoring will be carried out following the procedures set by the Approved Consolidated Methodology ACM0001. The Monitoring methodology is based on direct measurement of the amount of flared CH4 in biogas to determine avoided CO2eq. An operations manual of the project will be written. This manual will have the applicative documents of the monitoring plan (description of the project and responsibilities, operating procedures for measurement and handling of data and details about internal audits). Two operators will collect necessary data for the monitoring plan and a Project Manager will verify the correct application of the operative procedures written in the manual. Monitoring The amount of CH4 used is determined by monitoring the following: • Amount of captured biogas (m3) using a continuous flow meter and monitoring temperature and pressure; • Percentage of CH4 in biogas using a continuous analyzer. In addition: • the CH4 content of the emission flares will be analyzed continuously to determine the fraction of the CH4 destroyed; • The amount of electricity generated will be continuously measured. • The electricity used will be monitored and a conservative grid coefficient will be adopted in case of generator failure. • The national grid electricity used by the plant will be monitored. Calculation on the amount of ERs The amount of Nm3 captured from biogas will be multiplied by the CH4 content of that time period. The amount of ERs will be calculated on the basis of continuously calculated and logged amounts of combusted CH4 in Nm3: • Calculate tonnes of burnt CH4 by multiplying the volume of burnt CH4 (Nm3) with the density of CH4 • Obtain emission reductions by multiplying tonnes of burnt CH4 with the global warming potential of CH4. CO2eq = M * Sp * F * (Qf * FE + Qe) CO2eq = CO2-equivalents [tonnes CO2eq] M = methane content [Vol.%] Sp = specific mass methane (constant) = 0.0007168 t/Nm3 F = equivalent factor methane (constant) = 21 tonnes CO2eq/tonnes CH4 Qf = quantity of landfill gas flared [Nm3] FE = Flare efficiency = 97 % Qe = quantity of landfill gas in engine[Nm3] Flow meter The biogas quantity will be measured by means of a flow meter, a counter which counts every m3 of biogas.

PROJECT DESIGN DOCUMENT FORM (CDM PDD) - Version 03 .1. CDM – Executive Board page 56 The method of operation of the mechanical flow meter is based on the measurement of the gas velocity. The velocity of the gas flowing through the gas meter is increased in the flow straightener and the gas strikes the turbine wheel in a defined flow cross section. In the flow straightener, unwanted vortices, turbulences and asymmetries are removed or reduced. The turbine wheel is mounted axially, while the blades of the turbine wheel are arranged at a certain angle to the gas flow. The rotational speed of the turbine wheel is almost proportional to the mean gas velocity and, therefore, to the rate of flow. The number of rotations is a measure of the volume that has flowed through. The flow meters are flow meters which can be used for custody transfer metering. All turbine meters measure the quantity of gas flowing through them in units of volume at prevailing pressure and temperature. Therefore, the units of volume are determined at flowing conditions. The volume of the gas flowing through is indicated by a mechanical totalizer in cubic meters at flowing conditions. The counted gas quantity will be provided to the data-logger of the degassing installation. The electronic volume adapter is given an alphanumeric password to protect possible tampering, besides the instrumentation will be installed inside a locked box. The biogas quantity will be logged and transferred to the database of the monitoring system. To tackle the problem of data-handling, the authorized validator reads the biogas quantity from the on-site flow meter once a year. This biogas quantity will be written on an official document and signed by the validator. To prove the correctness of the logging procedure and database, the quantity recorded by the flow meter must be higher than the flow quantity logged earlier and lower than the flow quantity logged later. The flow meter does not require calibrations according to its specifications. To limit the time of operation with no flow signal in case of failure, the flow meter will be replaced by a spare flow meter as soon as possible. Despite this quick exchange the degassing installation operates a short time without flow signal and CO2eq values. To determine the flow during this time span, the average flow of the last 7 days will be used and so it is possible to calculate the reduced CO2eq quantity. The chance of failure of the flow meter is very small. CH4 analyzer The CH4 content of the biogas will be measured by means of a CH4 analyzer, whose accuracy is ± 2.0 Vol.% CH4. The CH4 analyzer has to be calibrated according to its calibration protocol. The CH4 content will be sampled and stored in the data logger of the installation and these data will be transferred to the monitoring system. The correctness of logged CH4-values relies on the proper calibration of the CH4 analyzer according to the calibration protocol. In the calibration protocol main issues important for a correct calibration are: 1. The calibration frequency has to be correct. 2. The quality of the calibration gas has to be according to the standard. 3. The calibration procedure, carried out by the operator, has to be correct. The calibration frequency can easily be checked in the database. Before calibration the analyzing system has to be switched to calibration position. The calibration gases will be purchased from certified gas suppliers. All calibration gases will have quality certificate which can be found on their labels. The quality certificate indicates the quality of calibration gas is according to the standard. To prove that the calibration procedure will be carried out correctly, the skilled operator will demonstrate this procedure to the authorized validator at the installation. The operators are well trained and possess the necessary certificates.

PROJECT DESIGN DOCUMENT FORM (CDM PDD) - Version 03 .1. CDM – Executive Board page 57 At the end of the yearly visit to the installation the authorized validator writes the CH4-content of that moment on an official document. Additional the frequency of calibration and the correct demonstration of calibration will be written down on this official document. The validator signs this document. To limit the time of operation with no methane analyzer in case of failure, this analyzer will be replaced with a spare analyzer as soon as possible. Despite this quick exchange, the degassing installation operates a short time without CH4- signal. To determine the CH4-content during this time span the average CH4-content of the last 7 days will be used. Possible failure: No electrical power When there is no electrical power the blower of the degassing installation cannot operate, so no biogas stream is available. The flow-meter detects no biogas stream and no CO2eq will be counted and no special actions are possible to avoid this. Validator The following parameters and items will be checked by the authorized validator at the installation once a year. No. Parameter / item Unit 1 biogas quantity Nm3 2 Generated electrical power kWh 3 CH4 content biogas Vol.% CH4 4 Calibration procedure CH4 analyzer 5 Log book operating and maintenance The parameters will be written down on a special document by the validator. Additionally the statement “the calibration protocol is carried out correctly” will be mentioned on this document.

PROJECT DESIGN DOCUMENT FORM (CDM PDD) - Version 03 .1. CDM – Executive Board page 58
Annex 5
ENVIRONMENTAL IMPACT ASSESSMENT

PROJECT DESIGN DOCUMENT FORM (CDM PDD) - Version 03 .1. CDM – Executive Board page 59