Embed Size (px)
Citation preview
Integration Project
Faculty of Science and Engineering
SWOT Analysis: Developing the keyfigure Overall Equipment Effectiveness
(OEE)
Group 14
Author
M.H.M. Ahmed | S3296342
Supervisors
dr. Alexander Hubl
dr. M. Munoz Arias
June 11, 2020

Integration Project
i
Integration Project
Abstract
OEE is considered the key performance measurement for successful implementation of
Total Productive Maintenance (TPM) activities, combining its three main pillars in one
metric. OEE is and still becoming increasingly popular, being used as a quantitative tool
essential for measuring productivity and improving their asset utilization. Despite its
many benefits, like all available business metrics, the key figure OEE has received a lot
of criticism both in literature and application, whilst researchers are yet to comprehen-
sively address this issue. As such, this research will aim to address this knowledge gap via
exploring the strengths, weaknesses, threats, and possible opportunities as to how to fur-
ther develop or redesign this metric to overcome some of its limitations. This research’s
findings are valuable as it provides production managers with a better understanding of
OEE, and a more comprehensive tool acting as an extension to the maturity of OEE for
successful implementation and use of this performance indicator.
From the SWOT analysis, two main weaknesses of OEE were chosen to focus on: it
categorizes losses in a way that merges all downtime events, inhibiting a more detailed
loss classification scheme, and it does not account for changes in market demand. Con-
sequently, two new factors, usability and customer requirement rate, were incorporated
into the original OEE method to overcome its identified limitations. A three-case numer-
ical example was used to demonstrate the benefits of the proposed OEE. It was applied
and compared with the original OEE method using a one-machine model, representing a
generic bottleneck process, with the parameters customer demand andplanned downtime
being manipulated throughout the three cases. The new OEE measurement’s value can
mainly be attributed to its more meticulous classifications of losses, and its recognition of
customer demand fluctuations. These two additional characteristics of OEE contribute to
its expansion and maturity as a TPM performance measurement system.
Keywords: Overall EquipmentEffectiveness (OEE); Performancemeasurement; Per-
formance evaluation; Production equipment; Effectiveness;Manufacturing; Operations
management; Total productive maintenance (TPM)
ii
Contents Integration Project
Contents
1 Introduction 1
1.1 Problem Context . . . . . . . . . . . . . . . . . . . . . . . . . . . . . . . . . 2
1.2 Problem Statement . . . . . . . . . . . . . . . . . . . . . . . . . . . . . . . 3
1.3 Aim and Research Question . . . . . . . . . . . . . . . . . . . . . . . . . . . 3
1.4 Research Scope . . . . . . . . . . . . . . . . . . . . . . . . . . . . . . . . . . 4
1.5 Research Outline . . . . . . . . . . . . . . . . . . . . . . . . . . . . . . . . . 4
2 Literature Review 6
2.1 Methodology . . . . . . . . . . . . . . . . . . . . . . . . . . . . . . . . . . . 6
2.2 Total Productive Maintenance (TPM) . . . . . . . . . . . . . . . . . . . . . 7
2.3 Overall Equipment Effectiveness (OEE) . . . . . . . . . . . . . . . . . . . . 8
2.3.1 Introduction to OEE . . . . . . . . . . . . . . . . . . . . . . . . . . . 9
2.3.2 Conceptual Model . . . . . . . . . . . . . . . . . . . . . . . . . . . . 10
2.3.3 OEE Indicators . . . . . . . . . . . . . . . . . . . . . . . . . . . . . . 10
2.3.4 Six Big Losses . . . . . . . . . . . . . . . . . . . . . . . . . . . . . . 11
2.3.5 OEE Evolution . . . . . . . . . . . . . . . . . . . . . . . . . . . . . . 12
2.3.6 Data Collection . . . . . . . . . . . . . . . . . . . . . . . . . . . . . . 13
3 SWOT Analysis 15
3.1 Strengths . . . . . . . . . . . . . . . . . . . . . . . . . . . . . . . . . . . . . 16
3.2 Weaknesses . . . . . . . . . . . . . . . . . . . . . . . . . . . . . . . . . . . . 17
3.3 Opportunities . . . . . . . . . . . . . . . . . . . . . . . . . . . . . . . . . . . 18
3.4 Threats . . . . . . . . . . . . . . . . . . . . . . . . . . . . . . . . . . . . . . 19
3.5 Discussion . . . . . . . . . . . . . . . . . . . . . . . . . . . . . . . . . . . . 21
4 Proposed OEE Calculation Methodology 24
4.1 Two New Variables: Usability and Customer Requirement Rate . . . . . . 24
4.2 Availability Rate . . . . . . . . . . . . . . . . . . . . . . . . . . . . . . . . . 25
4.3 Usability . . . . . . . . . . . . . . . . . . . . . . . . . . . . . . . . . . . . . 26
4.3.1 Running Time . . . . . . . . . . . . . . . . . . . . . . . . . . . . . . 26
4.4 Performance Rate . . . . . . . . . . . . . . . . . . . . . . . . . . . . . . . . 26
4.5 Quality Rate . . . . . . . . . . . . . . . . . . . . . . . . . . . . . . . . . . . 26
4.6 Requirement Rate . . . . . . . . . . . . . . . . . . . . . . . . . . . . . . . . 27
4.7 Modified Overall Equipment Effectiveness (OEE) . . . . . . . . . . . . . . 27
5 Research Design 28
5.1 Model Description . . . . . . . . . . . . . . . . . . . . . . . . . . . . . . . . 28
5.2 Numerical Example: Three Cases . . . . . . . . . . . . . . . . . . . . . . . 29
iii
Contents Integration Project
6 Results and Discussion 31
6.1 Results . . . . . . . . . . . . . . . . . . . . . . . . . . . . . . . . . . . . . . 31
6.2 Discussion . . . . . . . . . . . . . . . . . . . . . . . . . . . . . . . . . . . . 32
6.2.1 The Role and Impact of Usability . . . . . . . . . . . . . . . . . . . . 32
6.2.2 The Role and Impact of Customer Requirement Rate . . . . . . . . 33
7 Conclusion 34
8 References 35
9 Appendix 41
9.1 Appendix 1: Experimental Setup in MS-Excel . . . . . . . . . . . . . . . . . 41
9.2 Appendix 2: Original OEE Elements Results . . . . . . . . . . . . . . . . . 43
9.3 Appendix 3: Proposed OEE Elements Results . . . . . . . . . . . . . . . . . 43
9.4 Appendix 4: Final OEE Results . . . . . . . . . . . . . . . . . . . . . . . . . 44
iv

Contents Integration Project
v
Integration Project
1 Introduction
The prevailing trend of corporate globalization has led companies to be pressured to seek
continuous improvements in their production facilities in order to continue to survive (Ng,
Chong and Goh, 2014; Mahmood et al., 2016). Consumers, as an external pressure, are
becoming more focused on quality, delivery time, and cost of products (Gupta and Garg,
2012). This resulted in the expansion of the competition base for businesses in all indus-
tries (Muchiri Pintelon, 2008), and as a consequence, shorter time tomarket and product
life cycles (Hubl and Gmainer, 2008). In order to stay competitive, companies are forced
to implement a broad range of productivity improvement programs, such as developing
and implementing total productivemaintenance initiatives (TPM) (Muchiri and Pintelon,
2008). (Nakajima, 1989) defines TPM as ”a plant improvement methodology which en-
ables continuous and rapid improvement of the manufacturing process through the use
of employee involvement, employee empowerment, and closed-loopmeasurement of re-
sults.”
(Ljungberg, 1998) argues that TPM is built upon threemainpillars: maximizing equip-
ment effectiveness, autonomous maintenance by operators, and small group activities.
One of the most commonly used tools of TPM is the key figure Overall Equipment Effec-
tiveness (OEE), which is responsible for combining all three TPM targets in one metric
(Ljungberg, 1998; Hubl and Gmainer, 2008). It is considered in both literature and prac-
tice as the key performancemeasurement for successful implementation of TPMactivities
(Ng et al., 2014). According to Bamber et al. (2003), Dal et al. (2000), Lijunberg (1998),
De Ron and Rooda (2006), Muchiri and Pintelon (2008) and Hubl et al. (2009), OEE is
and still becoming increasingly popular, used by more and more companies as a quan-
titative tool essential for measuring productivity; companies in various industries have
adopted it to improve their asset utilization (Muchiri and Pintelon, 2008).
Mahmood et al., (2016) argue that OEE can be considered the starting point for pro-
ductivity optimization of manufacturing equipment, and therefore it is a main driver to-
wards operational excellence. It is a significant metric that mainly focuses onmaximizing
equipment effectiveness and reducing losses that negatively affect the production pro-
cess. In practice, OEE is not only used as an operational measure, but also as a process
improvement indicator within the confines of the production system or plant (Ng et al.,
2014). (De Ron and Rooda, 2006) emphasize that metrics are absolutely necessary to
measure production performance as it improves control, sets clear quantifiable responsi-
bilities and objectives, enables strategic alignment of objectives, assists in understanding
business processes, and helps determine process capability.
Like all available business metrics, frameworks, or strategies, the key figure OEE has
1
1.1 Problem Context Integration Project
received a lot of criticism both in literature and application, whilst researchers are yet to
comprehensively address this issue. This research will aim to address this knowledge gap
via exploring the strengths, weaknesses, threats, and possible opportunities as to how to
further develop or redesign this metric to overcome some of its weaknesses or limitations.
Even though this is a theory-oriented research, the practical relevance of the project is ev-
ident as it provides organizations, and their managers, with a better understanding of the
OEE metric in the midst of the vast pool of literature and controversy surrounding it and
a more comprehensive tool acting as an extension to the maturity of OEE for successful
implementation and use of this performance indicator.
1.1 Problem Context
In spite of the fact that the OEE measurement is widely recognized as a proficient robust
key performance indicator, it is not without criticism prompting further investigation.
The first limitation of OEE, which is heavily cited in literature, can be credited to the dif-
ferent definitions of OEE elements and calculation methods, which hinder the efforts of
identifying optimum OEE figures and benchmarking (Jonsson and Leeshammar, 1999).
Also, the OEE calculation does not factor in all variables that may affect utilisation, such
as planned downtime and lack of material input (Ljungberg, 1998), hence a substantial
part of losses is neglected. Yalagi et al. (2016) state that the definitions and conditions of
use of OEE have been up for debate in literature since it was first introduced by Nakajima
(1989); the abundance of definitions and suggested uses of OEE has resulted in significant
confusion formanagement practice, especially when attempted to be used for benchmark-
ing or comparingmachines, plants, and even companies. Many researchers advocate that
OEE may be applied to any individual work center, or rolled up to department or plant
levels for internal and external benchmarking and identification of theworstmachine per-
formance to dedicate TPM efforts and activities to (Dal et al., 2000; Hubl and Gmainer,
2008; Mahmood et al., 2016); on the contrary, some studies emphasize that OEE was not
designed for benchmarking purposes and that it has just evolved to accommodate these
levels of misuse (Yalagi et al., 2016).
Moreover, expanding the purpose of OEE from solely as performance indicator to an
improvement driver is not utilized to its fullest potential due to the ambiguities of OEE’s
definitions and interpretations (Andersson and Belgrann, 2015). Furthermore, OEE is
not a statistically valid metric, but has been used as such for the past decade or so, and
it does not provide root causes regarding machine inefficiency, but just contributes in
categorizing the losses or areas for improvement activities (Yalagi et al., 2016). Other
limitations exist in respect to the implementation of OEE, which uncovers that the nature
of the OEE metric encourages users to maximize utilization with total disregard to cus-
tomer demand (Hubl et al., 2009), which has potential negative implications on logistical
2
1.2 Problem Statement Integration Project
drivers, such as lead-time, inventory, and delivery reliability (Puvanasvaran et al., 2013;
Hubl and Gmainer, 2008). (Puvanasvaran et al., 2019) argue for yet another limitation
in OEE’s visualization of wastes; in despite of its identification and categorization of the
six big losses, it still was not able to pinpoint the exact areas of improvement effectively,
which further induces the need and urgency for a modified OEE calculation or metric.
OEE provides a quantitative metric based on availability, performance, and quality el-
ements only for assessing the performance of equipment or processes. Despite the signif-
icance of these three performance indicators, OEE neglects other important performance
factors such as the efficient usage of raw materials, production system, logistics, labour,
etc., parameters that may have a significant effect or contribution to the performance of
the machine or process being examined (Garza-Reyes, 2015). This prompted numerous
studies that have attempted to expand the scope of OEE through the inclusion of more
elements of performance. An overview of a few of these efforts will be discussed in the
following chapter.
1.2 Problem Statement
From the problem context and preliminary problem analysis, the following problem state-
ment has been deduced:
The global pace of market uncertainty within the manufacturing industry
has compelled companies in all sectors to seek continuous improvements in
their productionperformance. Consequently, performancemeasurement sys-
temsare crucial for initiatinganddirecting the drive for production improve-
ment. OEE is one of the key performance indicators (KPI) of TPM activities.
However, the potential of using this measure in industry as an essential op-
timization driver is not fully utilized as a result, for example, of OEE’s lack of
certain factors that may significantly affect process performance.
1.3 Aim and Research Question
The research objective is to further develop the current OEE metric, by conducting a
SWOT analysis to critically evaluate OEE as a performance indicator, and the proposed
modified OEEmetric, acting as an extension to the maturing of OEE, that mitigates some
of its identified limitations. Extensive literature review, supported with mathematical
modelling through numerical examples, is conducted in order to realize this goal within 3
months. As such, the subsequent research question has been formulated for steering and
guiding the research:
• In what way can the original OEE metric’s scope be expanded in order to better
represent production performance?
3
1.4 Research Scope Integration Project
1.4 Research Scope
As illustrated in the problem context, the problems involved with the current OEE mea-
surement are so extensive and complex which requires this research to isolate a specific
problem or set of problems to focus on in order to contribute towards a solution to the
overall problem, the inefficiency of the current OEE metric. Hence, one of the objectives
of this research is to assess OEE as a performance measurement system and delineate
and identify certain areas that this research can address. It is important to emphasize
that the OEE principle is still becoming more and more accepted in the manufacturing
industry, in many sectors like in semiconductor and electronic equipment, pharmaceu-
tical, or even the food industry. Consequently, the researcher decided to delineate the
problem context to evaluate the OEEmetric in themanufacturing industry in general, not
specifying a certain sector, customer order decoupling point, or geographical region. This
decision is validated upon reviewing acclaimed journal articles (Ljungberg, 1998; Jons-
son and Lesshammar, 1999; Kwon and Lee, 2004; De Ron and Rooda, 2006; Ferko and
Znidarsic, 2007; Badiger and Gandhinathan, 2008; Puvanasvaran et al., 2013; Sivasel-
vam and Gajendran, 2014; Binti Aminuddin et al., 2016) which evaluated and developed
the OEEmetric without specifying or limiting their findings to any of the aforementioned
scopes or lenses.
1.5 Research Outline
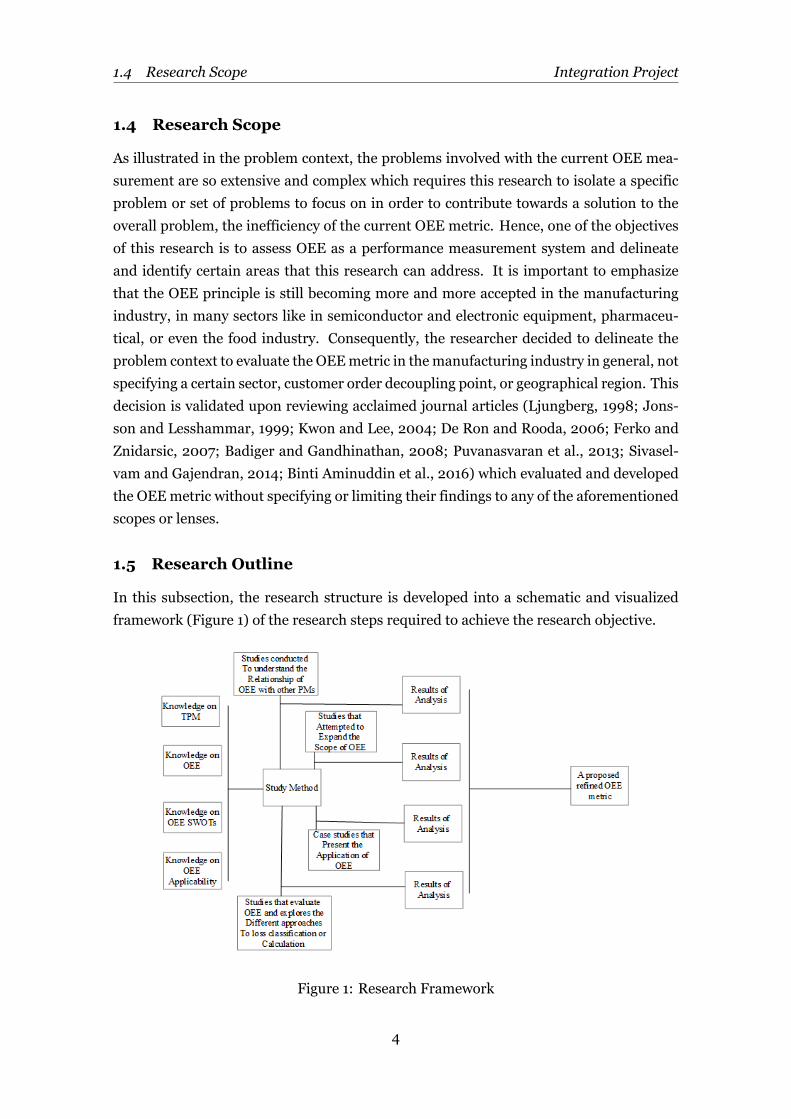
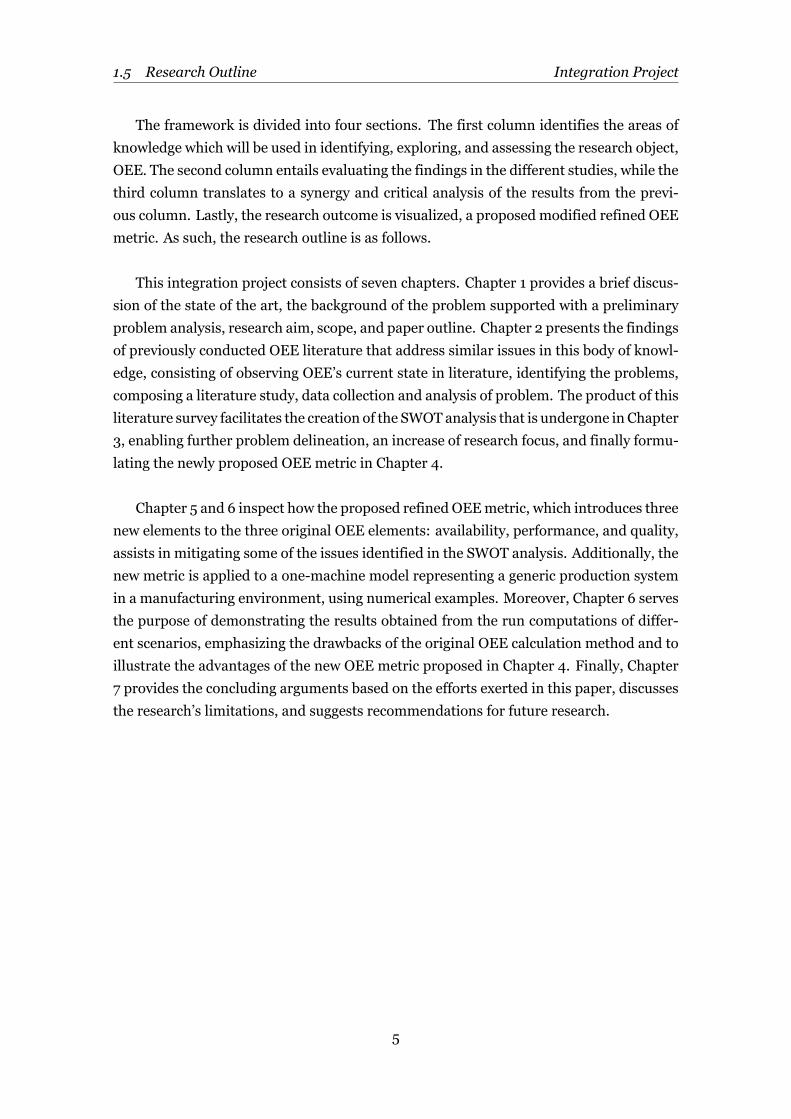
In this subsection, the research structure is developed into a schematic and visualized
framework (Figure 1) of the research steps required to achieve the research objective.
Figure 1: Research Framework
4
1.5 Research Outline Integration Project
The framework is divided into four sections. The first column identifies the areas of
knowledge which will be used in identifying, exploring, and assessing the research object,
OEE. The second column entails evaluating the findings in the different studies, while the
third column translates to a synergy and critical analysis of the results from the previ-
ous column. Lastly, the research outcome is visualized, a proposed modified refined OEE
metric. As such, the research outline is as follows.
This integration project consists of seven chapters. Chapter 1 provides a brief discus-
sion of the state of the art, the background of the problem supported with a preliminary
problem analysis, research aim, scope, and paper outline. Chapter 2 presents the findings
of previously conducted OEE literature that address similar issues in this body of knowl-
edge, consisting of observing OEE’s current state in literature, identifying the problems,
composing a literature study, data collection and analysis of problem. The product of this
literature survey facilitates the creation of the SWOTanalysis that is undergone in Chapter
3, enabling further problem delineation, an increase of research focus, and finally formu-
lating the newly proposed OEE metric in Chapter 4.
Chapter 5 and 6 inspect how the proposed refined OEEmetric, which introduces three
new elements to the three original OEE elements: availability, performance, and quality,
assists in mitigating some of the issues identified in the SWOT analysis. Additionally, the
new metric is applied to a one-machine model representing a generic production system
in a manufacturing environment, using numerical examples. Moreover, Chapter 6 serves
the purpose of demonstrating the results obtained from the run computations of differ-
ent scenarios, emphasizing the drawbacks of the original OEE calculation method and to
illustrate the advantages of the new OEE metric proposed in Chapter 4. Finally, Chapter
7 provides the concluding arguments based on the efforts exerted in this paper, discusses
the research’s limitations, and suggests recommendations for future research.
5
Integration Project
2 Literature Review
2.1 Methodology
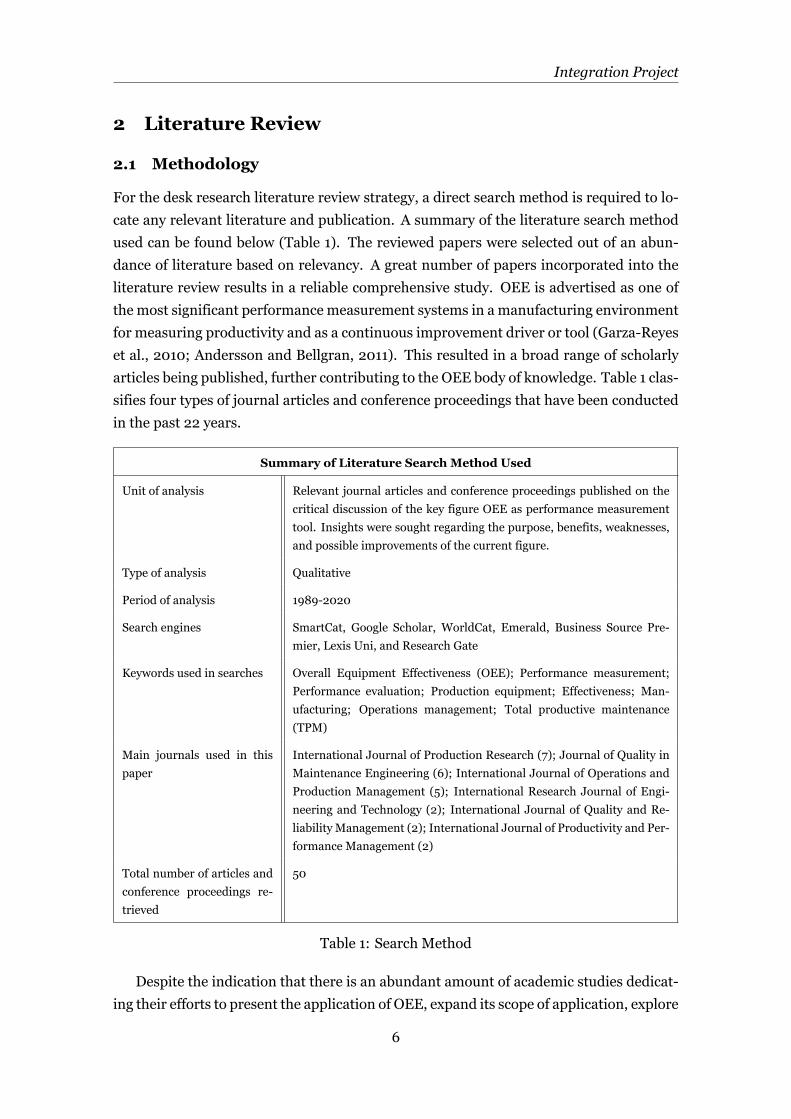
For the desk research literature review strategy, a direct search method is required to lo-
cate any relevant literature and publication. A summary of the literature search method
used can be found below (Table 1). The reviewed papers were selected out of an abun-
dance of literature based on relevancy. A great number of papers incorporated into the
literature review results in a reliable comprehensive study. OEE is advertised as one of
the most significant performance measurement systems in a manufacturing environment
for measuring productivity and as a continuous improvement driver or tool (Garza-Reyes
et al., 2010; Andersson and Bellgran, 2011). This resulted in a broad range of scholarly
articles being published, further contributing to the OEE body of knowledge. Table 1 clas-
sifies four types of journal articles and conference proceedings that have been conducted
in the past 22 years.
Summary of Literature Search Method Used
Unit of analysis Relevant journal articles and conference proceedings published on the
critical discussion of the key figure OEE as performance measurement
tool. Insights were sought regarding the purpose, benefits, weaknesses,
and possible improvements of the current figure.
Type of analysis Qualitative
Period of analysis 1989-2020
Search engines SmartCat, Google Scholar, WorldCat, Emerald, Business Source Pre-
mier, Lexis Uni, and Research Gate
Keywords used in searches Overall Equipment Effectiveness (OEE); Performance measurement;
Performance evaluation; Production equipment; Effectiveness; Man-
ufacturing; Operations management; Total productive maintenance
(TPM)
Main journals used in this
paper
International Journal of Production Research (7); Journal of Quality in
Maintenance Engineering (6); International Journal of Operations and
Production Management (5); International Research Journal of Engi-
neering and Technology (2); International Journal of Quality and Re-
liability Management (2); International Journal of Productivity and Per-
formance Management (2)
Total number of articles and
conference proceedings re-
trieved
50
Table 1: Search Method
Despite the indication that there is an abundant amount of academic studies dedicat-
ing their efforts to present the application of OEE, expand its scope of application, explore
6
2.2 Total Productive Maintenance (TPM) Integration Project
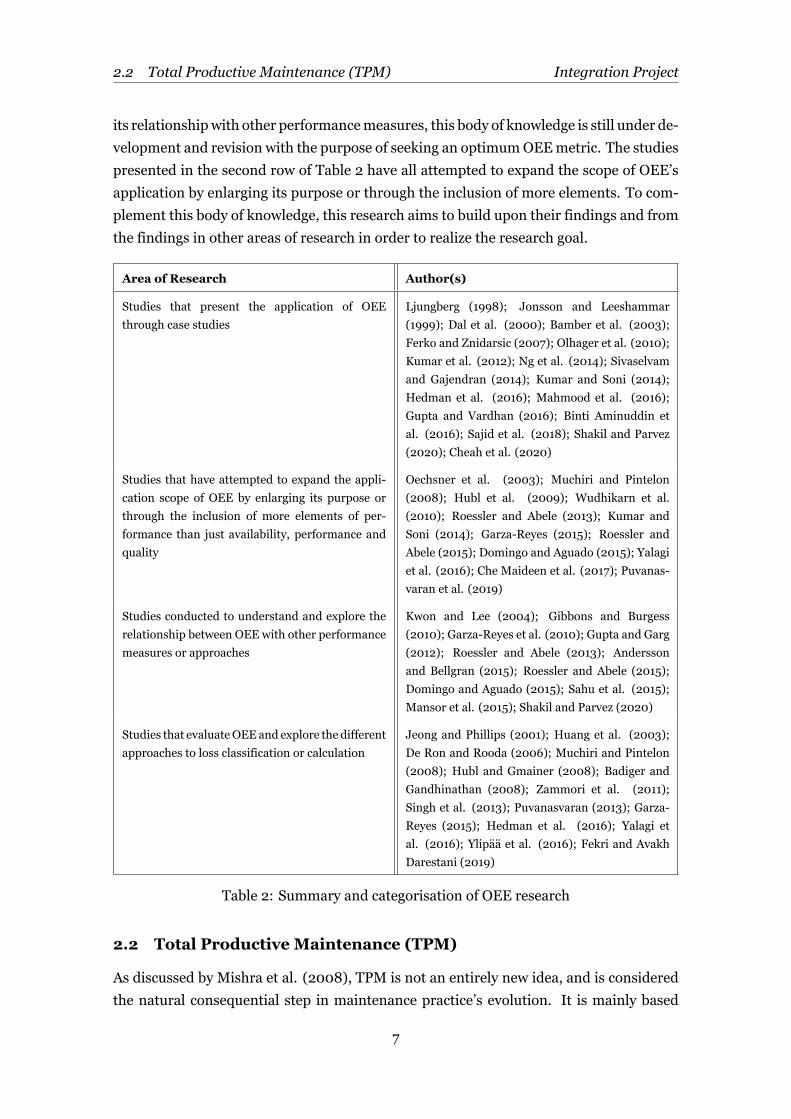
its relationshipwith other performancemeasures, this body of knowledge is still under de-
velopment and revision with the purpose of seeking an optimumOEEmetric. The studies
presented in the second row of Table 2 have all attempted to expand the scope of OEE’s
application by enlarging its purpose or through the inclusion of more elements. To com-
plement this body of knowledge, this research aims to build upon their findings and from
the findings in other areas of research in order to realize the research goal.
Area of Research Author(s)
Studies that present the application of OEE
through case studies
Ljungberg (1998); Jonsson and Leeshammar
(1999); Dal et al. (2000); Bamber et al. (2003);
Ferko and Znidarsic (2007); Olhager et al. (2010);
Kumar et al. (2012); Ng et al. (2014); Sivaselvam
and Gajendran (2014); Kumar and Soni (2014);
Hedman et al. (2016); Mahmood et al. (2016);
Gupta and Vardhan (2016); Binti Aminuddin et
al. (2016); Sajid et al. (2018); Shakil and Parvez
(2020); Cheah et al. (2020)
Studies that have attempted to expand the appli-
cation scope of OEE by enlarging its purpose or
through the inclusion of more elements of per-
formance than just availability, performance and
quality
Oechsner et al. (2003); Muchiri and Pintelon
(2008); Hubl et al. (2009); Wudhikarn et al.
(2010); Roessler and Abele (2013); Kumar and
Soni (2014); Garza-Reyes (2015); Roessler and
Abele (2015); Domingo and Aguado (2015); Yalagi
et al. (2016); Che Maideen et al. (2017); Puvanas-
varan et al. (2019)
Studies conducted to understand and explore the
relationship between OEE with other performance
measures or approaches
Kwon and Lee (2004); Gibbons and Burgess
(2010); Garza-Reyes et al. (2010); Gupta and Garg
(2012); Roessler and Abele (2013); Andersson
and Bellgran (2015); Roessler and Abele (2015);
Domingo and Aguado (2015); Sahu et al. (2015);
Mansor et al. (2015); Shakil and Parvez (2020)
Studies that evaluateOEEand explore the different
approaches to loss classification or calculation
Jeong and Phillips (2001); Huang et al. (2003);
De Ron and Rooda (2006); Muchiri and Pintelon
(2008); Hubl and Gmainer (2008); Badiger and
Gandhinathan (2008); Zammori et al. (2011);
Singh et al. (2013); Puvanasvaran (2013); Garza-
Reyes (2015); Hedman et al. (2016); Yalagi et
al. (2016); Ylipää et al. (2016); Fekri and Avakh
Darestani (2019)
Table 2: Summary and categorisation of OEE research
2.2 Total Productive Maintenance (TPM)
As discussed by Mishra et al. (2008), TPM is not an entirely new idea, and is considered
the natural consequential step in maintenance practice’s evolution. It is mainly based
7
2.3 Overall Equipment Effectiveness (OEE) Integration Project
on preventive maintenance theory and its techniques and methods that have been ini-
tially introduced in Japan, providing a thorough life cycle approach to the management
of equipment that minimises production losses (Gupta and Garg, 2012). TPM aims to
maximize equipment effectiveness, by improving an equipment’s function and design, in
order to optimally utilize companies’ hardware (Mishra et al., 2008). Moreover, it is a
labour-intensive maintenance system, which involves all departments and employees in
a firm (Jeong and Phillips, 2001; Mishra et al., 2008). It enables production managers to
optimize their manufacturing processes, by producing products with good quality while
maintaining a high-level of customer satisfaction; this allows companies to benefit from
several competitive advantages and as a result, reap greater profits (Ahuja and Khamba,
2008; Bon et al., 2012). Evidence of TPM initiatives’ effectiveness has been explored
in previous studies, showing a reduction in machine breakdown frequency, defects, and
other production losses, which potentially saves companies millions of dollars (Huang et
al., 2003; Gupta and Vardhan, 2016). In the preliminary stages, TPM efforts are directed
towards the identification and analysis of the six major losses, which are considered sig-
nificantly responsible for lowering equipment effectiveness (Ahuja and Khamba, 2008).
Overall Equipment Effectiveness (OEE) is mainly used as a measure to assess the effects
of TPM activities (Bon et al., 2011).
Performance measurement is a significant prerequisite for the realisation of true con-
tinuous improvement of processes; hence, it is imperative for production managers to es-
tablish and utilize the needed metrics for production data collection and analysis (Gupta
andGarg, 2012). TPMutilizes OEE as a quantitativemeasurement system of a production
process’ performance, determining the success of failure or TPM initiatives (Jeong and
Phillips, 2001; Huang et al., 2003). Generically, OEE is capable of representing the com-
bination of the maintenance, management, and availability of equipment and resources
(Gupta and Garg, 2012). OEE is highly recognized in nearly all TPM-implemented in-
dustries (Gupta and Vardhan, 2016); this, in return, complements the explicit connection
between TPM with OEE, and continuous improvement as it enables the effective imple-
mentation of TPM, and as a result the fostering of a lean culture (Binti Aminuddin et al.,
2016). Even though, OEE was first introduced as part of TPM, its usage has evolved past
the maintenance paradigm, where it has also been used extensively for the optimization
of machine productivity (Kuman and Soni, 2014).
2.3 Overall Equipment Effectiveness (OEE)
Before the advent of OEE, only availability was considered in equipment utilization, which
resulted in the constant overestimation of equipment utilization (Ljungberg, 1998). OEE
methodology assists production managers optimize equipment effectiveness and reduce
cost of ownership, through incorporating a set of manufacturing performance key indica-
8
2.3 Overall Equipment Effectiveness (OEE) Integration Project
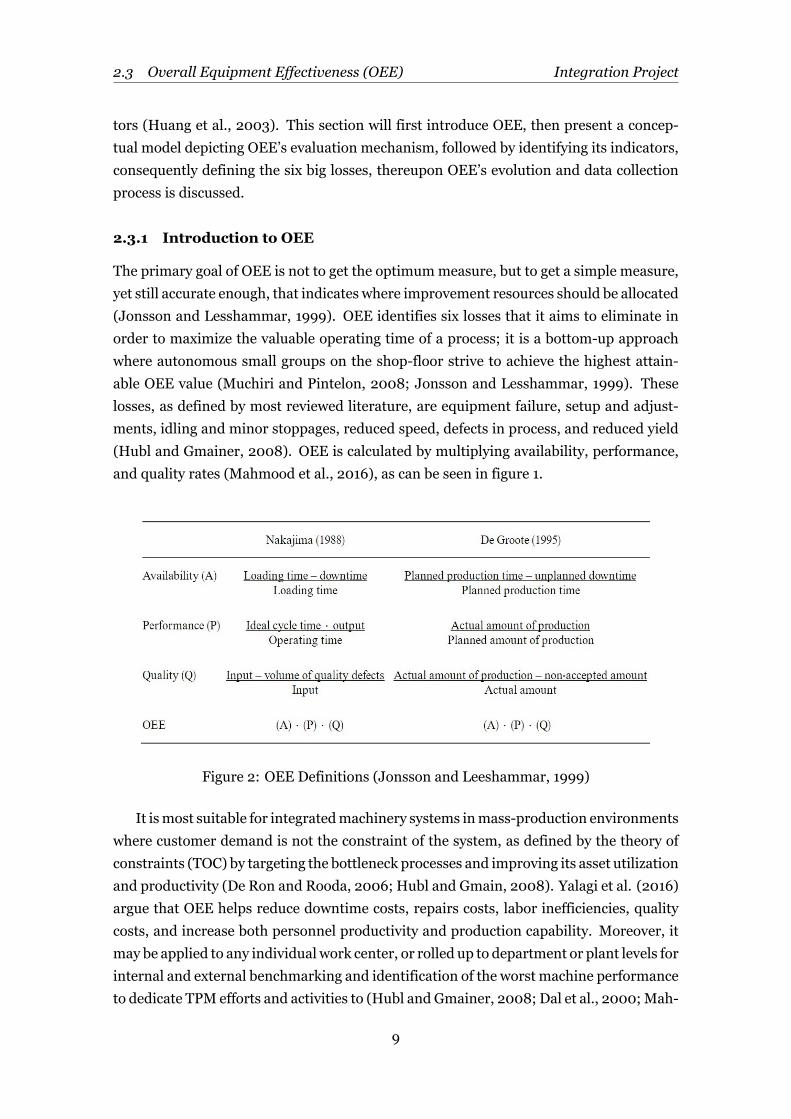
tors (Huang et al., 2003). This section will first introduce OEE, then present a concep-
tual model depicting OEE’s evaluation mechanism, followed by identifying its indicators,
consequently defining the six big losses, thereupon OEE’s evolution and data collection
process is discussed.
2.3.1 Introduction to OEE
The primary goal of OEE is not to get the optimummeasure, but to get a simple measure,
yet still accurate enough, that indicates where improvement resources should be allocated
(Jonsson and Lesshammar, 1999). OEE identifies six losses that it aims to eliminate in
order to maximize the valuable operating time of a process; it is a bottom-up approach
where autonomous small groups on the shop-floor strive to achieve the highest attain-
able OEE value (Muchiri and Pintelon, 2008; Jonsson and Lesshammar, 1999). These
losses, as defined by most reviewed literature, are equipment failure, setup and adjust-
ments, idling and minor stoppages, reduced speed, defects in process, and reduced yield
(Hubl and Gmainer, 2008). OEE is calculated by multiplying availability, performance,
and quality rates (Mahmood et al., 2016), as can be seen in figure 1.
Figure 2: OEE Definitions (Jonsson and Leeshammar, 1999)
It ismost suitable for integratedmachinery systems inmass-production environments
where customer demand is not the constraint of the system, as defined by the theory of
constraints (TOC) by targeting the bottleneck processes and improving its asset utilization
and productivity (De Ron and Rooda, 2006; Hubl and Gmain, 2008). Yalagi et al. (2016)
argue that OEE helps reduce downtime costs, repairs costs, labor inefficiencies, quality
costs, and increase both personnel productivity and production capability. Moreover, it
may be applied to any individual work center, or rolled up to department or plant levels for
internal and external benchmarking and identification of the worst machine performance
to dedicate TPM efforts and activities to (Hubl and Gmainer, 2008; Dal et al., 2000; Mah-
9
2.3 Overall Equipment Effectiveness (OEE) Integration Project
mood et al., 2016). It also has measurable benefits that significantly improve the bottom
line of production operations, enhancing companies’ competitive edge (Muchiri Pintelon,
2008).
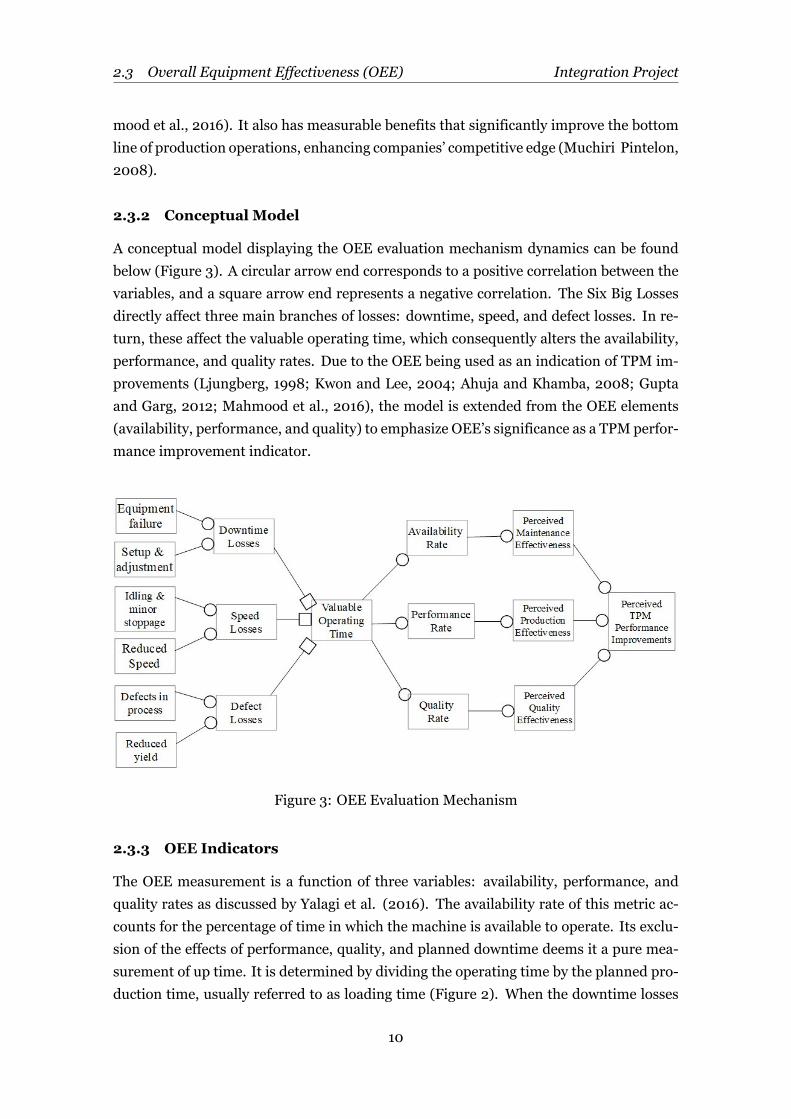
2.3.2 Conceptual Model
A conceptual model displaying the OEE evaluation mechanism dynamics can be found
below (Figure 3). A circular arrow end corresponds to a positive correlation between the
variables, and a square arrow end represents a negative correlation. The Six Big Losses
directly affect three main branches of losses: downtime, speed, and defect losses. In re-
turn, these affect the valuable operating time, which consequently alters the availability,
performance, and quality rates. Due to the OEE being used as an indication of TPM im-
provements (Ljungberg, 1998; Kwon and Lee, 2004; Ahuja and Khamba, 2008; Gupta
and Garg, 2012; Mahmood et al., 2016), the model is extended from the OEE elements
(availability, performance, and quality) to emphasize OEE’s significance as a TPM perfor-
mance improvement indicator.
Figure 3: OEE Evaluation Mechanism
2.3.3 OEE Indicators
The OEE measurement is a function of three variables: availability, performance, and
quality rates as discussed by Yalagi et al. (2016). The availability rate of this metric ac-
counts for the percentage of time in which the machine is available to operate. Its exclu-
sion of the effects of performance, quality, and planned downtime deems it a pure mea-
surement of up time. It is determined by dividing the operating time by the planned pro-
duction time, usually referred to as loading time (Figure 2). When the downtime losses
10
2.3 Overall Equipment Effectiveness (OEE) Integration Project
sum up to zero, the availability becomes 100% or 1. 100 percent availability implies that
the process under examination runs without any recorded disturbances or stops, during
the time of analysis.
The performance portion of the OEE metric includes speed losses. Performance is
computed by dividing the net operating time by the operating time, representing the per-
centage at which the equipment runs in contrast to a predefined optimummeasurement.
This part of themetric excludes the effects of availability and quality related losses, mean-
ing it is not penalized for rejects, for instance. It can also be computed by dividing the
product of the ideal cycle time and total number of units produced by the operating time
(Figure 2). Ideal cycle time is the minimum amount of time required for a process to start
and finish with optimal conditions. As with availability, performance is capped at 100
percent, and if reached, it is an indication that the equipment has been consistently work-
ing at its optimum speed.
The quality metric is responsible for determining the percentage of good units pro-
duced of the total pieces produced. It excludes the effects of both former metrics, making
it a pure measurement of process yield. To calculate the quality rate, the valuable oper-
ating time is divided by the net operating time. Another way to compute this is by the
quotient of good unit produced and total amount of unit that were being produced. As
with its former rates, it cannot exceed 100%; a 100 percent quality rate indicates that no
units have been rendered defected or needed rework. These three performance indicators
facilitate the OEE Factors method to take place by multiplying the three rates, to finally
attain an OEE value (Figure 2).
2.3.4 Six Big Losses
Nakajima (1989) defines the six big losses as equipment failure, setup and adjustment,
idling and minor stoppages, reduced speed, defects in process, and reduced yield (Hed-
man et al., 2016). These sources of wastes can be classified as chronic or sporadic distur-
bances, occurrences in which resources are being consumed without adding value. OEE
aims to identify these losses, using a bottom-up approach where the entire work force
seeks maintaining a high OEE level by continuously eliminating the six big losses. It is
however important to note that the exact definitions of OEE and the six big losses differs
between authors and applications (Bamber et al., 2003). Below is a brief summary of the
widely-accepted and cited definitions of each loss.
Breakdown Losses
Bamber et al. (2003), Kumar and Soni (2014), and Hedman et al. (2016) categorize
breakdown losses as time losses that hinder productivity, and quantity losses as a result
11
2.3 Overall Equipment Effectiveness (OEE) Integration Project
of products being rendered defective.
Setup and adjustments
Kumar and Soni (2014) define setup and adjustment as time losses that occur as a con-
sequence of downtime and defective products, in order to accommodate the production
requirements of another item to be produced, following the end of production of a certain
item (Bamber et al., 2003; Hedman et al., 2016).
Idling and minor stoppages
Idling andminor stop losses are defined as wastes that occur because of the halt or in-
terruption of production by a temporary malfunction or when an equipment is idle (Bam-
ber et al., 2003; Kumar and Soni, 2014; Hedman et al., 2016).
Reduced speed
Reduced speed refers to the difference between ideal or expected speed of production
or processing time and the actual operating speed (Bamber et al., 2003; Kumar and Soni,
2014; Hedman et al., 2016).
Defects in process
Quality defects and rework losses can be simply defined as losses in quality caused by
malfunctioning of production machinery (Bamber et al., 2003; Kumar and Soni, 2014;
Hedman et al., 2016).
Reduced yield
Reduced yield refers to start-up losses that occur in the early stages of production from
machine startup to, and until, stabilization (Bamber et al., 2003; Kumar and Soni, 2014;
Hedman et al., 2016).
2.3.5 OEE Evolution
Several efforts were made by many researchers to develop OEE with the aim to mitigate
the insufficiency of theOEE tool to cover a broader perspective as deemed important in the
production system (Muchiri Pintelon, 2008). The OEE tool’s definition has evolved in lit-
erature to different other terms in order to broaden its scope of application, evolving into
overall factory effectiveness (OFE), overall plant effectiveness (OPE), overall throughput
effectiveness (OTE), production equipment effectiveness (PEE), overall asset effective-
ness (OAE), and total equipment effectiveness performance (TEEP). Figure 4, attached
below, displays schematically the ’evolved’ OEE metrics that have taken additional fac-
tors, losses, or approaches into account. An extensive literature review of OEE literature
has highlighted the abundance of numerous derived methods for calculating OEE in or-
12
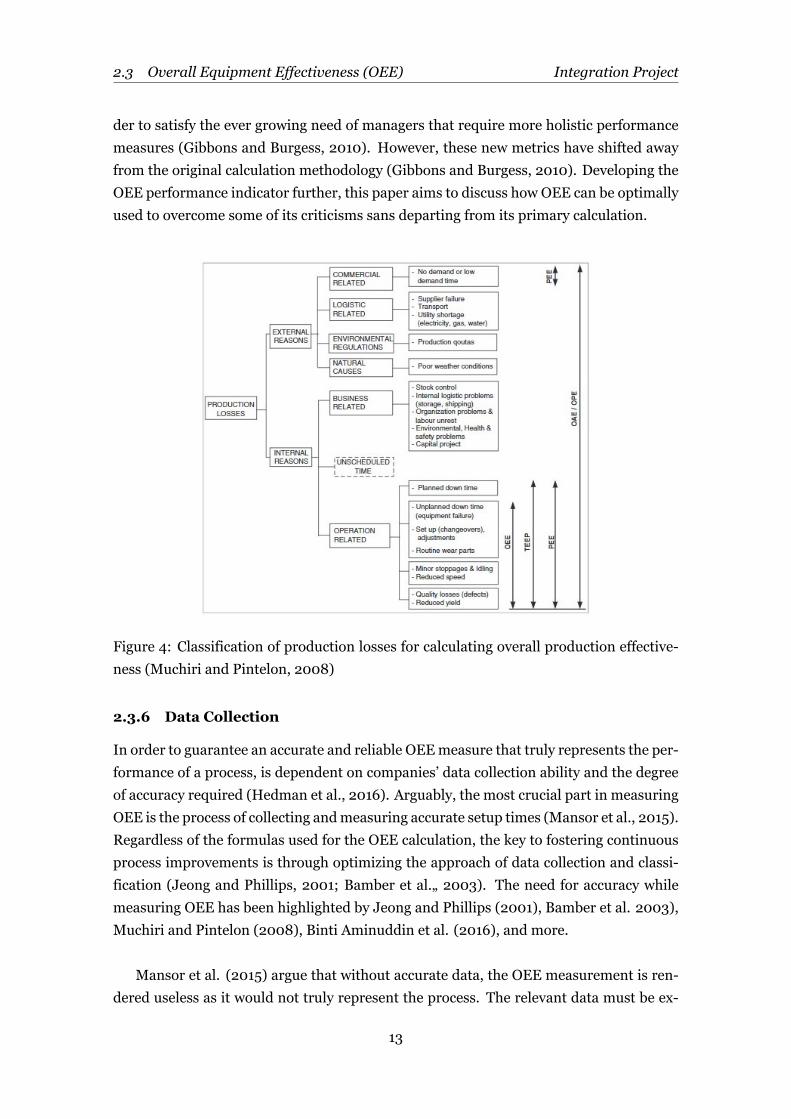
2.3 Overall Equipment Effectiveness (OEE) Integration Project
der to satisfy the ever growing need of managers that require more holistic performance
measures (Gibbons and Burgess, 2010). However, these new metrics have shifted away
from the original calculation methodology (Gibbons and Burgess, 2010). Developing the
OEE performance indicator further, this paper aims to discuss how OEE can be optimally
used to overcome some of its criticisms sans departing from its primary calculation.
Figure 4: Classification of production losses for calculating overall production effective-
ness (Muchiri and Pintelon, 2008)
2.3.6 Data Collection
In order to guarantee an accurate and reliable OEEmeasure that truly represents the per-
formance of a process, is dependent on companies’ data collection ability and the degree
of accuracy required (Hedman et al., 2016). Arguably, the most crucial part in measuring
OEE is the process of collecting andmeasuring accurate setup times (Mansor et al., 2015).
Regardless of the formulas used for the OEE calculation, the key to fostering continuous
process improvements is through optimizing the approach of data collection and classi-
fication (Jeong and Phillips, 2001; Bamber et al.„ 2003). The need for accuracy while
measuring OEE has been highlighted by Jeong and Phillips (2001), Bamber et al. 2003),
Muchiri and Pintelon (2008), Binti Aminuddin et al. (2016), and more.
Mansor et al. (2015) argue that without accurate data, the OEE measurement is ren-
dered useless as it would not truly represent the process. The relevant data must be ex-
13
2.3 Overall Equipment Effectiveness (OEE) Integration Project
tracted in real time after a task has concluded, which requires a convenient and not too
complex system to avoid recording errors (Roessler and Abele, 2013). Also, resistance
from employees responsible for the data collection process has been widely cited, which
leads to inaccuracies in the collected data, and as a result a drop in employee morale.
This, in return, threatens the effective implementation of OEE as a TPM tool, implying
that management has a key role in managing its implementation by synthesizing opera-
tor assistance and data collection automation to ensure data collection in an accurate and
timely fashion (Binti Aminuddin et al., 2016).
To ensure significant improvements in the data collection process needed to calcu-
late OEE, plant data acquisition systems can be employed, or for less capital-intensive
machinery manually through operator logs (Roessler and Abele, 2013). In some cases, a
plant data collection system is utilized with partial assistance from operators, rendering
the data collection process semi-automatic. Automated data collection has been tested
and proven to provide a high degree of accuracy and reliability, resulting in more perfor-
mance improvements (Binti Aminuddin et al., 2016). Bamber et al. (2003) have seen im-
mense improvements in equipment performance of companies that use a consistent mea-
surement methodology for determining the six big losses and company-specific method
of calculating OEE. Finally, it is important to emphasize that the data recording process
itself may lead to process disruptions if operators are overburdened in the case of a rise
of the frequency of short-term disruptions that take place throughout the shift (Roessler
and Abele, 2013).
14
Integration Project
3 SWOT Analysis
A SWOT analysis has been chosen to be the focal studymethod of this research as ameans
to diagnose, assess, and essentially provide room for further research to develop the key
figure OEE. This technique traditionally appears to have been originated as a product of
corporate management literature efforts, specifically at Stanford Research Institute. It
was developed as a tool to assist in dissecting the underlying reasons behind business
planning failure. SWOT is an acronym for an organization’s internal strengths and weak-
nesses, in addition to its external opportunities, and threats. Moreover, it is considered a
key business tool, claiming the title ’design school model’ as it aims to use the assessment
of a corporation’s strengths, weaknesses, opportunities, and threats, enabling strategic
formulation (Mishra et al., 2008).
SWOT has been used as a key tool in previously conducted research, ranging all the
way back to the 1980s. In agreement with SWOT’s advocates, ’strengths’ correspond to
ingrained competencies, while ’weaknesses’ refer to intrinsic drawbacks that inhibit per-
formance. In contrast, ’opportunities’ identify the potential for improvement or growth,
whilst ’threats’ express the external barriers that repress strengths, accommodate weak-
nesses, and impede opportunities. Undoubtedly, a precondition for success can be at-
tributed to utilizing strengths and threats in order to realize opportunities and unlock
further capabilities, overcoming inherent weaknesses. The four aforementioned elements
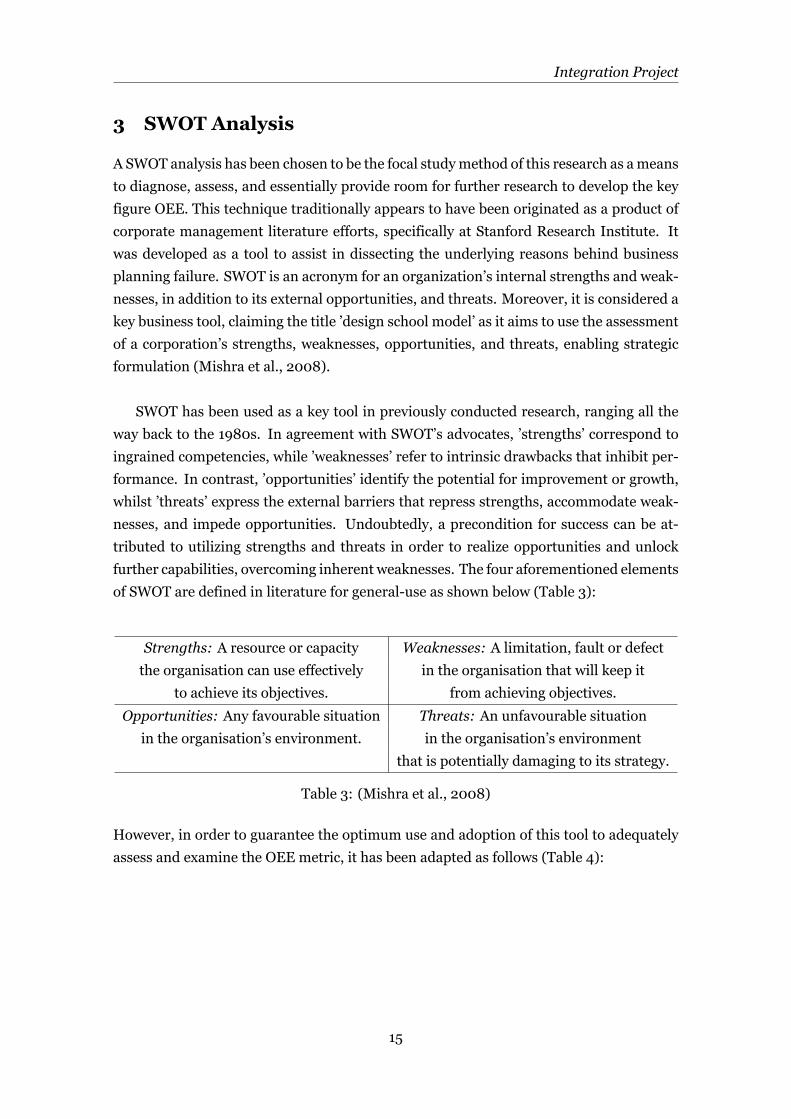
of SWOT are defined in literature for general-use as shown below (Table 3):
Strengths: A resource or capacity Weaknesses: A limitation, fault or defect
the organisation can use effectively in the organisation that will keep it
to achieve its objectives. from achieving objectives.
Opportunities: Any favourable situation Threats: An unfavourable situation
in the organisation’s environment. in the organisation’s environment
that is potentially damaging to its strategy.
Table 3: (Mishra et al., 2008)
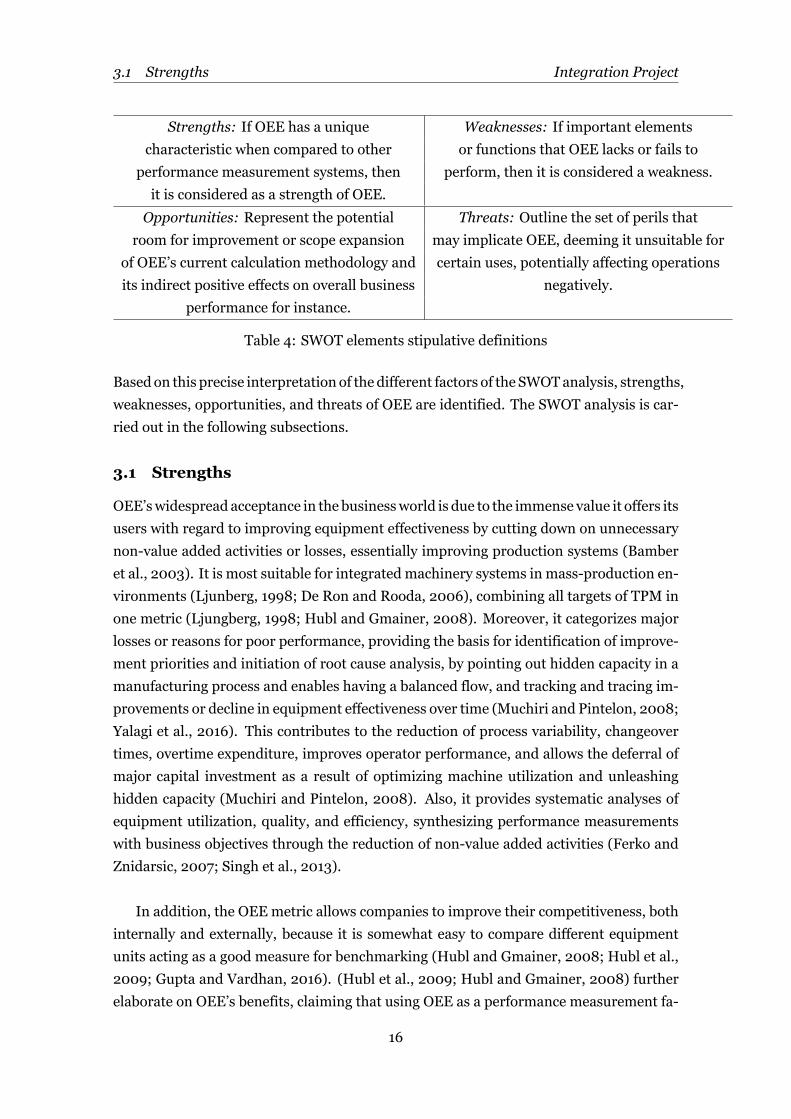
However, in order to guarantee the optimum use and adoption of this tool to adequately
assess and examine the OEE metric, it has been adapted as follows (Table 4):
15
3.1 Strengths Integration Project
Strengths: If OEE has a unique Weaknesses: If important elements
characteristic when compared to other or functions that OEE lacks or fails to
performance measurement systems, then perform, then it is considered a weakness.
it is considered as a strength of OEE.
Opportunities: Represent the potential Threats: Outline the set of perils that
room for improvement or scope expansion may implicate OEE, deeming it unsuitable for
of OEE’s current calculation methodology and certain uses, potentially affecting operations
its indirect positive effects on overall business negatively.
performance for instance.
Table 4: SWOT elements stipulative definitions
Basedon this precise interpretation of the different factors of the SWOTanalysis, strengths,
weaknesses, opportunities, and threats of OEE are identified. The SWOT analysis is car-
ried out in the following subsections.
3.1 Strengths
OEE’swidespread acceptance in the businessworld is due to the immense value it offers its
users with regard to improving equipment effectiveness by cutting down on unnecessary
non-value added activities or losses, essentially improving production systems (Bamber
et al., 2003). It is most suitable for integrated machinery systems in mass-production en-
vironments (Ljunberg, 1998; De Ron and Rooda, 2006), combining all targets of TPM in
one metric (Ljungberg, 1998; Hubl and Gmainer, 2008). Moreover, it categorizes major
losses or reasons for poor performance, providing the basis for identification of improve-
ment priorities and initiation of root cause analysis, by pointing out hidden capacity in a
manufacturing process and enables having a balanced flow, and tracking and tracing im-
provements or decline in equipment effectiveness over time (Muchiri and Pintelon, 2008;
Yalagi et al., 2016). This contributes to the reduction of process variability, changeover
times, overtime expenditure, improves operator performance, and allows the deferral of
major capital investment as a result of optimizing machine utilization and unleashing
hidden capacity (Muchiri and Pintelon, 2008). Also, it provides systematic analyses of
equipment utilization, quality, and efficiency, synthesizing performance measurements
with business objectives through the reduction of non-value added activities (Ferko and
Znidarsic, 2007; Singh et al., 2013).
In addition, the OEEmetric allows companies to improve their competitiveness, both
internally and externally, because it is somewhat easy to compare different equipment
units acting as a good measure for benchmarking (Hubl and Gmainer, 2008; Hubl et al.,
2009; Gupta and Vardhan, 2016). (Hubl et al., 2009; Hubl and Gmainer, 2008) further
elaborate on OEE’s benefits, claiming that using OEE as a performance measurement fa-
16
3.2 Weaknesses Integration Project
cilitates the improvement of bottleneck performances, benefiting the production output
of the entire system. Further, OEE reflects performance from various dimensions: avail-
ability, quality, and performance, utilizing simple and thorough visualization of informa-
tion (Mahmood et al., 2016). OEE is considered a simple, yet comprehensive, measure
of equipment effectiveness (Jonsson and Lesshammar, 1999) that improves total asset
performance and reliability (Gupta and Vardhan, 2016). Mahmood et al. (2016) assert
OEE as the starting point for productivity optimization and the drive towards operational
excellence.
3.2 Weaknesses
Like any other existing business metric, OEE suffers from a number of pitfalls that have
implications of great magnitudes as briefly discussed in chapter 1, creating the urgency
and need for this paper and other further research efforts, in order to optimize this key
figure. For starters, OEE is not a good performance measurement for stand-alone equip-
ment (De Ron and Rooda, 2006). This same weakness is challenged and contradicted by
other researchers who claim that one of the drawbacks of OEE is that it is only capable
of describing the productivity behaviour of individual machines (Muchiri and Pintelon,
2008). Another issue is resultant from the existence of common confusion in literature
whether OEE measures effectiveness or efficiency of machinery (Muchiri and Pintelon,
2008). Furthermore, using OEE for benchmarking purposes is complicated and many
difficulties may arise while attempting to do so (Hubl and Gmainer, 2008); this can be at-
tributed to the abundance of different OEE definitions in literature and other varying cir-
cumstances between companies, making it burdensome to identify optimumOEE figures
and therefore difficult to compare OEE between firms, shops, and stand-alone machines
(Jonsson and Lesshammar, 1999; De Ron and Rooda, 2006; Hedman et al., 2016).
Arguably, the most pressing issue with OEE as a performance measurement system is
that it leaves out some factors that affect capacity utilization such as planned downtime,
lack of material and labour resources, breaks in production schedule, precautionary rest-
ing times, and daily shop floor meetings (Ljungberg, 1998; Hubl et al., 2009), creating
the need for a more appropriate time basis (De Ron and Rooda, 2006). (Ljungberg, 1998)
discusses the omission of significant types of losses due to the OEE evaluation method,
for example major losses due to setup and adjustments are usually regarded as produc-
tive time as opposed to being treated as losses. Also, only quality losses within the defined
system under evaluation are taken into consideration (Jonsson and Lesshammar, 1999).
Adding to these complications, there is no accepted consensus with respect to the mag-
nitude and classification of different types of losses and the underlying reasons for their
occurrence. This is seen whilst examining OEE’s limitation when it comes to indicating
the influence of downtime and rework on the valuable operating time, for instance (De
17
3.3 Opportunities Integration Project
Ron and Rooda, 2006).
Moreover, some important measures are not accounted for in the OEE calculation
such as cost, flexibility, usability, market demand, etc. which requires OEE to be comple-
mented by other performance measuring tools (Jonsson and Lesshammar, 1999; Muchiri
and Pintelon, 2008; Hubl et al., 2009). OEE renders a product acceptable solely based on
quality requirements (Hubl et al., 2009), without evaluating whether the right product is
produced at the right time (Hubl and Gmainer, 2008). As a performance measurement
system, its use is not appropriate for situations where the market demand is the con-
straint for the production system as defined by the theory of constraints (TOC) (Hubl et
al., 2009), low-volume job shops and some bath processes (Muchiri and Pintelon, 2008),
and non-bottleneck processes (Hubl and Gmainer, 2008). It seems that the OEE calcula-
tionmethod is not effectivewhen employed in oil, gas, and petrochemical prcoesses (Fekri
and Avakh Darestani, 2019). Being a deterministic measurement, OEE is not equipped to
recognize the variability of a process, which is a rather important drawback as variability
is one of themain causes of wastes (Zammori et al., 2011). Also, it requires certain param-
eters to be constants, such as investment, cycle times, etc. (Hubl and Gmainer, 2008). In
practice, a high degree of complexity and lack of continuous improvement is witnessed
due to the incorrect use and implementation of OEE (Muchiri and Pintelon, 2008); com-
panies’ missions is usually too focused on results and not on the improvement (TPM)
activities itself that are taking place (Ljungberg, 1998).
3.3 Opportunities
OEE provides its users with a broad range of opportunities as both an effective perfor-
mancemeasurement system and as a driver for continuous improvements in a company’s
production line. The OEEmetric initiates the development of quantitative variables, link-
ing maintenance measurement to corporate strategy (Ahuja and Khamba, 2008). It has
the potential to improve the production output of the entire production plant, via target-
ing bottleneck processes (Hubl et al., 2009). Also, itmay be applied to any individual work
center, or rolled up to department or plant levels for internal and external benchmarking
and identification of theworstmachine performance to dedicate TPMefforts and activities
to (Dal et al., 2000; Hubl and Gmainer, 2008; Mahmood et al., 2016). Hubl and Gmainer
(2008) also argue that OEE assists companies in avoiding unnecessary purchase due to
better usage of operating assets, facilitating the maximising of productivity via evading
extra shifts, while creating capacity for extra shifts and maximizing return on investment
for major capital equipment.
As discussed in earlier sections, OEE serves as an indicator of process improvement
activities, specifically TPM and lean initiatives, within the manufacturing environment
18
3.4 Threats Integration Project
(Ng et al., 2014). (Dal et al., 2000; Ng et al., 2014) argue that applying lean Six Sigma
methodology has enhanced the performance and OEE, improving the overall manufac-
turing performances. Moreover, it has measurable benefits that significantly improve the
bottom line of production operations, enhancing companies’ competitive edge (Muchiri
and Pintelon, 2008). Further research is needed to truly unravel the dynamics of trans-
lating equipment effectiveness in terms of cost; this will result in even more value and
significance to management (Muchiri Pintelon, 2008). Other available opportunities for
the use of OEE exists in combination with an open and decentralized organization de-
sign could improve several production weaknesses; when ”applied by autonomous small
groups on the shop-floor together with quality control tools, it is an important comple-
ment to the traditional top-down oriented performance measurement systems” (Jons-
son and Lesshammar, 1999; Ahuja and Khamba, 2008). Also, dividing availability losses
into stops due to and not due to machine failure made the status of losses more clear and
simplified the analysis (Jonsson and Lesshammar, 1999).
The use of technology, a simulation as a tool for instance, for analysing losses offers
further room for flexible OEE use and benefit (ljunberg, 1998). The losses taking a large
part of production capacity should be focused on and further divided into sub-groups. The
use of automated production data acquisition (PDA) for collecting and categorizing losses
has been proven to achieve high accuracy and reliability (Hubl andGmainer, 2008). (ljun-
berg, 1998) argue that the design of the data collection form or method should be carried
out with cooperation from the operators responsible for actually using it. Computerised
systems for collecting OEE can be really accurate, but tend to be difficult to assess the un-
derlying reasons for failure; a combination of both automatic and manual data collection
could prove to be optimal (ljunberg, 1998).
Kumar and Soni (2014) identify the following as strategies for potentially improving
the OEEmetric: training shop floor operators, regularmeasurement and analysis of OEE,
performancemonitoring usingOEE, and benchmarking against a desiredOEE value. Sev-
eral authors have explored the advantages of using OEE with some lean initiatives and
tools, such as 5-WHYs (Benjamin et al., 2015), 5S (Sahu et al., 2015), Single-Minute Ex-
change of Die or SMED (Mansor et al., 2015), and Value-streammapping or VSM (Shakil
and Parvez, 2020).
3.4 Threats
Aside from OEE’s opportunities, several threats can be identified that may deem OEE
usage unsuitable for certain purposes, potentially becoming counterproductive, affecting
operations negatively. For instance, if used for purposes other than a measure of equip-
ment effectiveness, it has potential negative implications on logistical drivers, such as
19
3.4 Threats Integration Project
lead-time, inventory, and delivery reliability (Hubl and Gmainer, 2008). Also, when the
conditions between two production systems are not the same, wrong conclusions may be
drawn if OEE is used as a benchmark for comparisons; so, awareness of using OEE as a
benchmark measure is crucial (Hubl and Gmainer, 2008; Hubl et al., 2009). The lack of
cross-functional teams (operation, maintenance, and management) may hinder the abil-
ity to effectively utilize the OEE measurement to materialize continuous improvements
in bottleneck processes (Bamber et al., 2003; Ahuja and Khamba, 2008; Sivaselvam and
Gajendran, 2014).
In practice, while using OEE, most companies focus on downtime losses, especially
breakdowns, whilst many losses like planned downtime, cycle time losses, and minor
stoppages are not addressed or accounted for (Hubl and Gmainer, 2008; Benjamin et al.,
2015). (Muchiri and Pintelon, 2008) also shed light on this problem that in practice, spe-
cialized attention of important losses was lacking or left out completely. Ljunberg (1998)
discusses the lack of focus of companies on performance losses whilst conducting OEE
analyses for their equipment. Performance losses are, in certain situations, difficult to
define and eliminate, whilst making up a large proportion of the total downtime (Jons-
son and Lesshammar, 1999; Benjamin et al., 2015). The root cause of this issue stems
from the fact that measuring the actual cycle time is challenging for several businesses,
especially when the same production equipment are used to process or manufacture dif-
ferent products. This is significant due to the importance of the identification of theweight
and underlying causes for losses, allowing the TPM activities to optimally solve the major
losses (Ljunerg, 1998).
Furthermore, loopholes for increasing the OEE measurement for production systems
exist, even if no actual improvements take place (Hubl and Gmainer, 2008). The problem
of monitoring only the good parts is that the logistic key figure, lead time, utilization and
inventory levels can get worse (Hubl et al., 2009). It is possible to increase OEE value
of a production system by increasing lot sizes; however, this results in lower delivery re-
liability, and an increase both tied-up capital and throughput time (Hubl and Gmainer,
2008). Moreover, the quality rate measurement is considered general and brief; how-
ever, a more specific definition of the quality parameter would decrease the simplicity of
the metric, which goes against the predefined stakes in the previous subsection (Jonsson
and Lesshammar, 1999). In practice, there is usually a lack of coordination in deploying
available resources (labour, information systems, and tools) to manage production effi-
ciently (Muchiri and Pintelon, 2008). Also, inflexible working schemes will hinder the
use of OEE as a TPM tool (Hubl et al., 2009).
Finally, data gathering and analysis treats exist which highly risk OEE’s reliability
as a performance measurement system. If data is calculated manually, there is risk of
20
3.5 Discussion Integration Project
losses not being categorized properly or at all, which makes it harder to optimally solve
the problems in the process or machinery under examination (Hubl and Gmainer, 2008).
Sometimes the operators believe that some disturbances have a major impact on the OEE
measurement, later analysis can show that this was completely wrong; on the other hand,
there are times that completely different views of the pattern of disturbances arewitnesses
by different stakeholders (Ljunerg, 1998). In many industries, a resistance from opera-
tors and foremen against data collection can be seen (Ljunerg, 1998). This is considered
a major threat as the reliability of OEE is highly dependent on the quality of the collected
data (De Ron and Rooda, 2006). Other common threats that may hinder OEE’s accuracy
and effective use are human perturbation in the recording process, discrepancies in loss
classification, missing recognition of sporadic losses due to limited data capturing time
window (Roessler and Abele, 2013; 2015).
3.5 Discussion
Upon exploring and evaluating the different characteristics of OEE, it was found that its
definition, condition for use, purpose, calculation methodology, and scope of application
differ slightly in both literature and in practice. This presents a problem formanagers and
practitioners, when they decide to use OEE as a key TPMmetric to improve their produc-
tion processes. Since, choosing and implementing optimum performance measurement
systems is a crucial aspect of any production line’s success, this is an urgent issue that
needs to be addressed further. Hence, this paper conducts a SWOT analysis of the differ-
ent aspects of OEE, namely, its strengths, weaknesses, opportunities, and threats. Based
on the analysis, it was evident that OEE as a TPM key performance metric has its own
strengths and weaknesses. It can also be concluded that the implementation of OEE is
absolutely not a simple task, as it is heavily limited by weaknesses and threats; however,
if businesses can optimally integrate and use OEE in their processes, it can potentially
provide considerable strengths and opportunities in order to attain a competitive edge
(Mishra et al., 2008).
In order to overcome some of theweaknesses andminimize the threats of OEE, several
research efforts have been dedicated (Table 2) to expanding the scope of OEE by enlarging
its purpose or through the inclusion of more elements of performance other than avail-
ability, performance, and quality. In addition to this, other studies were conducted to
understand and explore the relationship between OEE with other performance measures
or approaches, while other researchers attempted to evaluate OEE and explore the differ-
ent approaches to loss classification or calculation. Below is a brief summary of some of
the significant research findings and products that have been published in the past two
decades.
• (Ljunberg, 1998) used and tested a two-step model that can be used to ease the pro-
21
3.5 Discussion Integration Project
cess of data collection; also further optimization of the data collection procedurewas
proposed to solve this issue as well.
• Oechsner et al. (2003) expanded the OEE metric to overall factory effectiveness
(OFE), that is designed to focus on the plant-wide picture. It takes into account the
OEE factors, in addition to responsiveness, costs, and technological changes.
• KwonandLee (2004) developed amodel estimating the quantitativemonetaryman-
agerial effects by cause of TPM activties, by ”calculating the monetary total sum
saved composed of contribution of profit and saving costs that are obtained by
improving the OEE”.
• (De Ron and Rooda, 2006) developed a metric that is suitable for measuring equip-
ment effectiveness, EE, for standalone machines, whilst reporting the influence of
downtime and rework.
• Badiger and Gandhinathan (2008) introduced a new OEE metric, with a fourth el-
ement: usability.
• Muchiri and Pintelon (2008) provided an overview of the different versions of OEE,
such asOFE, overall plant effectiveness (OPE), overall throughput effectiveness (OTE),
production equipment effectiveness (OPE), overall asset effectiveness (OAE), and
total equipment effectiveness performance (TEEP). These metrics have been devel-
oped to include more losses that the original OEE did not account for.
• (Hubl et al., 2009) developed the OEE metric, which takes into account market de-
manded production,focusing on both the effective use of equipment and on cus-
tomer demand, making it able to identify changes in the customer demand.
• Gibbons and Burgess (2010) proposed an OOE framework, with an enhanced avail-
ability element, having three additional measures: reliability, maintainability, and
overall asset management effectiveness.
• Wudhikarn et al. (2010) rectfied the weaknesses of (Kwon and Lee, 2004), by show-
ing all production elements’ losses in monetary unit not only just overall loss.
• Zammori et al, (2011) presented a stochastic methdology of OEE, as opposed to its
deterministic nature, evolving OEE to take variability in its calculation.
• Samat et al. (2012) integratedOEEwith the reliability principle, proposing an equip-
ment performance and reliability model based on equipment effectiveness.
• (Roessler and Abele, 2013; 2015) proposes an OEE metric that takes into account
variability by combining the fuzzy set theory and OEE.
22
3.5 Discussion Integration Project
• Garza-Reyes (2015) presents a new metric derived from OEE, overall resource ef-
fectiveness (ORE), which takes into acount the three OEE elements and other per-
formance parameters: the efficient use of raw materials and the production envi-
ronment.
• Domingo and Aguado (2015) integrated sustainbility and OEE, producing a metric
of lean and green manufacturing systems, overall environmental equipment effec-
tiveness (OEEE), allowing sustainability to be included in decision-making.
• (Mahmood et al., 2016) developed an OEE analyzing tool that helps in identification
of root causes, determines the weakest area or hurdle in a machine’s optimal per-
formance, and helps to find out how much overtime is being performed against the
time lost due to availability, performance, and quality issues.
• Yalagi et al. (2016) added one more factor in OEE calculation, usability. This allows
a higher degree of analysis of losses and facilitates setting up the initiatives to tackle
these losses.
• Che Maideen et al. (2017) proposed a top-down framework to evaluate current per-
formance of themachine using OEE, as opposed to its current status as a bottom-up
approach.
• Puvanasvaran et al. (2019) integrated the Maynard Operation Sequence Technique
(MOST) to the OEE calculation to develop an alternative OEEmethod, ”introducing
two new factors, usability and human factor that distinguish setup losses into the
frequency of the setup process and excessive work performed by workers.”
• Cheah et al. (2020) introduce an integrated OEE framework, outlining a set of
guidelines for OEE improvement activities’ implementation, with loss prioritization
and benchmarking aspects.
As could be seen, immense efforts are being dedicated towards optimizing OEE as key
performance indicator in the manufacturing industry. However, the amount of OEE’s
weaknesses and threats discussed throughout the chapter is a lot for one research to ad-
dress. Consequently, all previously conducted research papers have aimed at contributing
to the solution of an issue or a set of issues that OEE faces. As such, this research is highly
influenced by the findings of Badiger and Gandhinathan (2008), Yalagi et al. (2016), and
Puvanasvaran et al. (2019) who all attempted incorporating the extra element ’usability’
in their newly proposed OEE calculation methodologies. Likewise, Hubl et al. (2009) is
used as another cornerstone journal article due to its great value in their efforts to inte-
grate the market into the original OEE metric.
23
Integration Project
4 Proposed OEE Calculation Methodology
TPM efforts are dedicated towards addressing major losses that take place in a produc-
tion process, and its associated wastes by implementing and fostering an environment of
continuous and systematic evaluations, and thereby improvement in companies’ manu-
facturing processes (Ahuja and Khamba, 2008). OEE is used in practice as a driver for
such performance improvement activities through diagnosing quality, productivity and
machine utilisation issues and, in return, contributes to decreasing wastes often inher-
ent in manufacturing processes (Bamber et al., 2003). As discussed earlier, OEE does
not identify specific reasons why a machine is not operating optimally; however, it con-
tributes in classifying the different areas that prompt improvements in the subjected pro-
cess. As reviewed in chapter 2, Nakajima (1989) presented the original OEEmetric where
its availability element takes into account the total time that a machine is not operating
due to breakdowns, setups and adjustments, and other stoppages. This way of categoriz-
ing losses merges all downtime events, both equipment- and process-related. This is a
major drawback of OEE as it inhibits the a more detailed identification of losses (Badiger
and Gandhinathan, 2008).
Even though different loss classifications ultimately should do not affect the final value
of OEE, it is still of immense significance that specific definitions of the different OEE
elements are addressed and aimed at delineating loss categorization further. This should
be achieved while neither deeming the new OEEmetric too complex for use nor deviating
from OEE’s original calculation methods as other researchers have done. Moreover, it
was also deduced from the SWOT analysis that another major limitation of OEE lies in its
inability to recognize changes inmarket demand (Hubl et al., 2009). This may potentially
cost companies unnecessary resources due to certain logistical drivers not beingmanaged
properly, as a result of a lack of relevant and important process insights.
4.1 Two New Variables: Usability and Customer Requirement Rate
The newly proposed calculation methodology of OEE contrasts the original approach in
that, twonew factors called usability and customer requirement have been incorporated in
the OEE calculation. The value of the usability factor stems from its ability to further cat-
egorize unplanned downtime occurrences into: equipment related downtime, needed for
the calculation of the availability element of OEE and the stop time attributed to the pro-
duction process, used to determine the usability element. The adoption of this factor re-
sults in more meticulous classifications of machinery and process losses that are formally
associated to the availability element only. Within this context, equipment downtime is
split into planned and unplanned stops, i.e. operational and induced stoppages. Further-
more, this new factor assists in identifying induced downtime lossesmore accurately, sans
24
4.2 Availability Rate Integration Project
castigating the availability element of OEE. This allows the OEE metric to truly describe
the availability factor of the machine under examination, enabling the assessment of both
operational and induced time losses separately (Badiger and Gandhinathan, 2008).
The significance of the second proposed term, customer requirement rate, is that it
includes the market in the OEE calculation as proposed by (Hubl et al., 2009). This mit-
igates one of the major limitations of OEE, the performance measurement’s sole focus
on acceptably produced products according to quality parameters without accounting for
market demanded production. This is undergone via only considering the products that
directly fulfill a customer order. This is important as it enables production managers to
adjust their production plants’ loading times based on the customer demand. Customer
requirement losses can be defined as all activities in which production takes place for
products that are yet to be assigned an owner; for example, production orders for restock-
ing inventory levels or production of bigger batch sized than the customer requires due to
technological and economic reasons. Upon subtracting the customer requirement losses
from the valuable operating time of the original OEE method, the resultant is customer
required operating time (CROT). The data required to assess the new OEE metric is dis-
cussed further in the ensuing sections, and Table 5 outlines the proposed classification of
losses.
OEE Element Proposed Classification
Availability Equipment Failure
Usability Stop time
Stop time induced
Stop time operational
Performance Idling and minor stops
Reduced speed
Quality Defects in process
Reduced yield
Customer Requirement Customer requirement loss
Table 5: Proposed Loss Classification
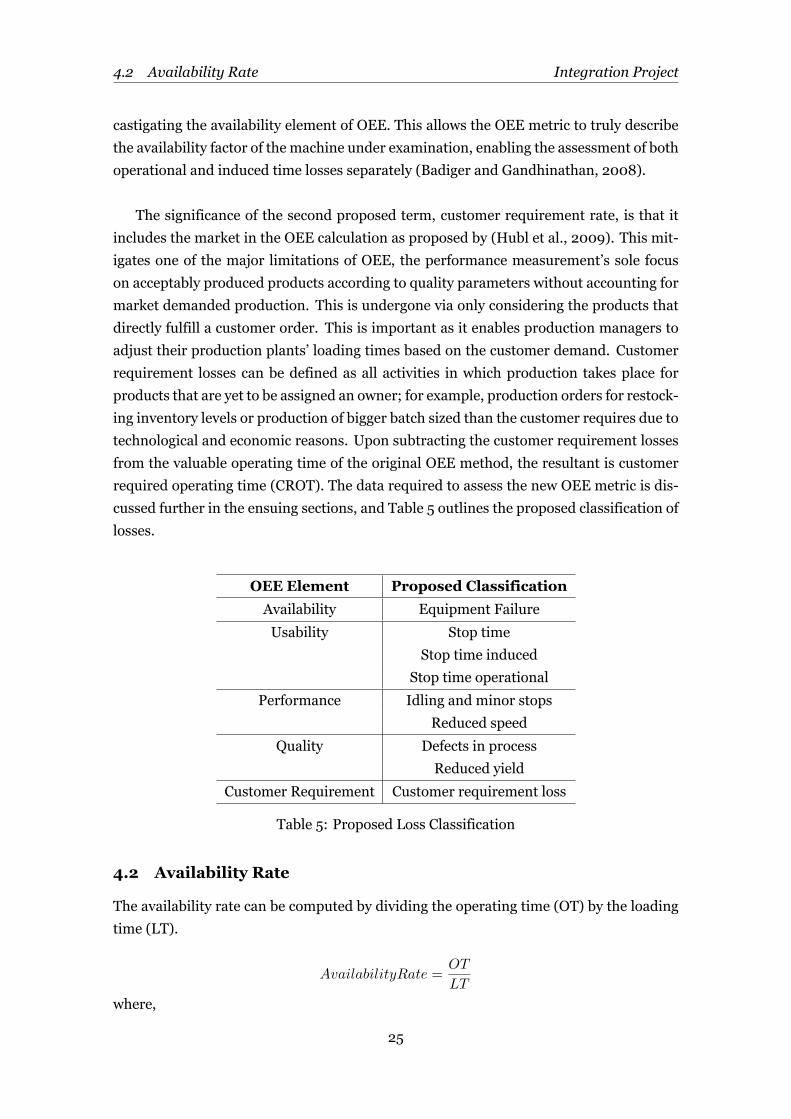
4.2 Availability Rate
The availability rate can be computed by dividing the operating time (OT) by the loading
time (LT).
AvailabilityRate =OT
LT
where,
25
4.3 Usability Integration Project
• LT = TotalAvailableTime - PlannedDowntime
• OT = (1 - (%ofEquipmentFailure/100)) * TotalAvailableTime - PlannedDowntime
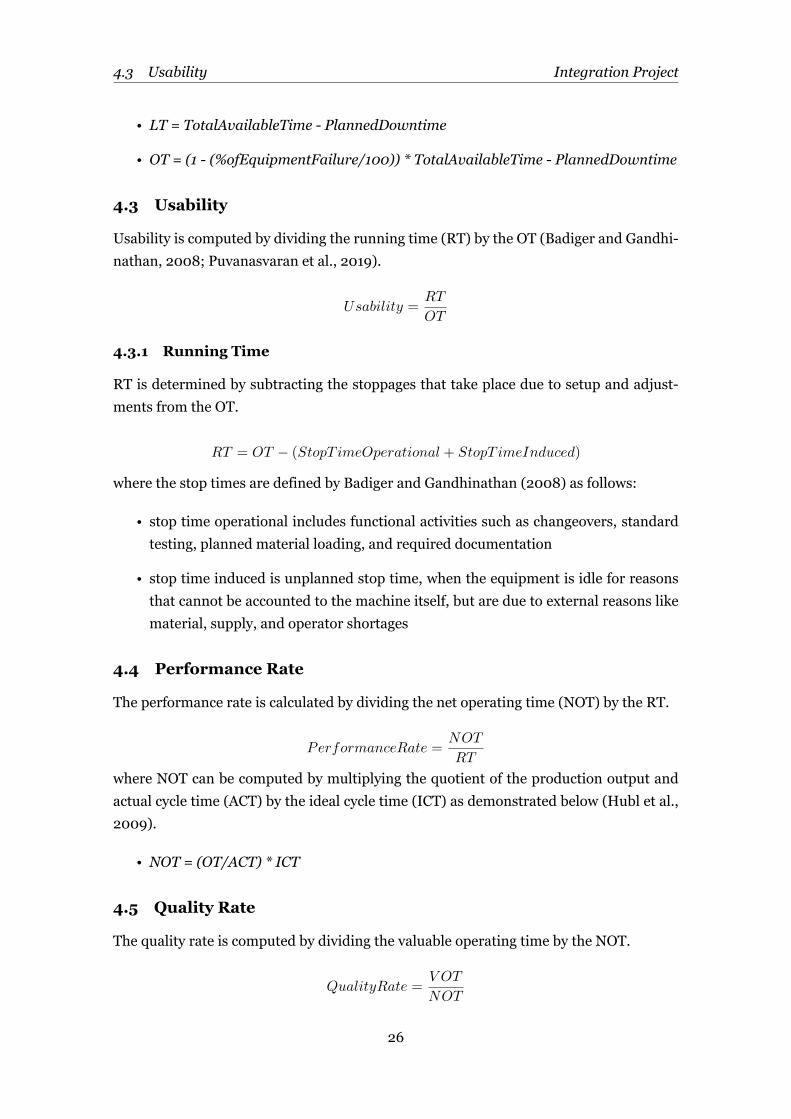
4.3 Usability
Usability is computed by dividing the running time (RT) by the OT (Badiger and Gandhi-
nathan, 2008; Puvanasvaran et al., 2019).
Usability =RT
OT
4.3.1 Running Time
RT is determined by subtracting the stoppages that take place due to setup and adjust-
ments from the OT.
RT = OT − (StopT imeOperational + StopT imeInduced)
where the stop times are defined by Badiger and Gandhinathan (2008) as follows:
• stop time operational includes functional activities such as changeovers, standard
testing, planned material loading, and required documentation
• stop time induced is unplanned stop time, when the equipment is idle for reasons
that cannot be accounted to the machine itself, but are due to external reasons like
material, supply, and operator shortages
4.4 Performance Rate
The performance rate is calculated by dividing the net operating time (NOT) by the RT.
PerformanceRate =NOT
RT
where NOT can be computed by multiplying the quotient of the production output and
actual cycle time (ACT) by the ideal cycle time (ICT) as demonstrated below (Hubl et al.,
2009).
• NOT = (OT/ACT) * ICT
4.5 Quality Rate
The quality rate is computed by dividing the valuable operating time by the NOT.
QualityRate =V OT
NOT
26
4.6 Requirement Rate Integration Project
The quality element can also be attained by subtracting the actual output during running
time by rejects that require reworking, followed with dividing by the output.
QualityRate =ActualOutput−Rejects
ActualOutput
4.6 Requirement Rate
The last element is computed by determining the ratio between customer required op-
erating time (CROT) and VOT, representing the quotient relationship between the actual
output of the product process and the actual customer demandper unit (Hubl et al., 2009).
RequirementRate =CROT
V OTwhere,
• CROT = CustomerDemand * Ideal Cycle Time
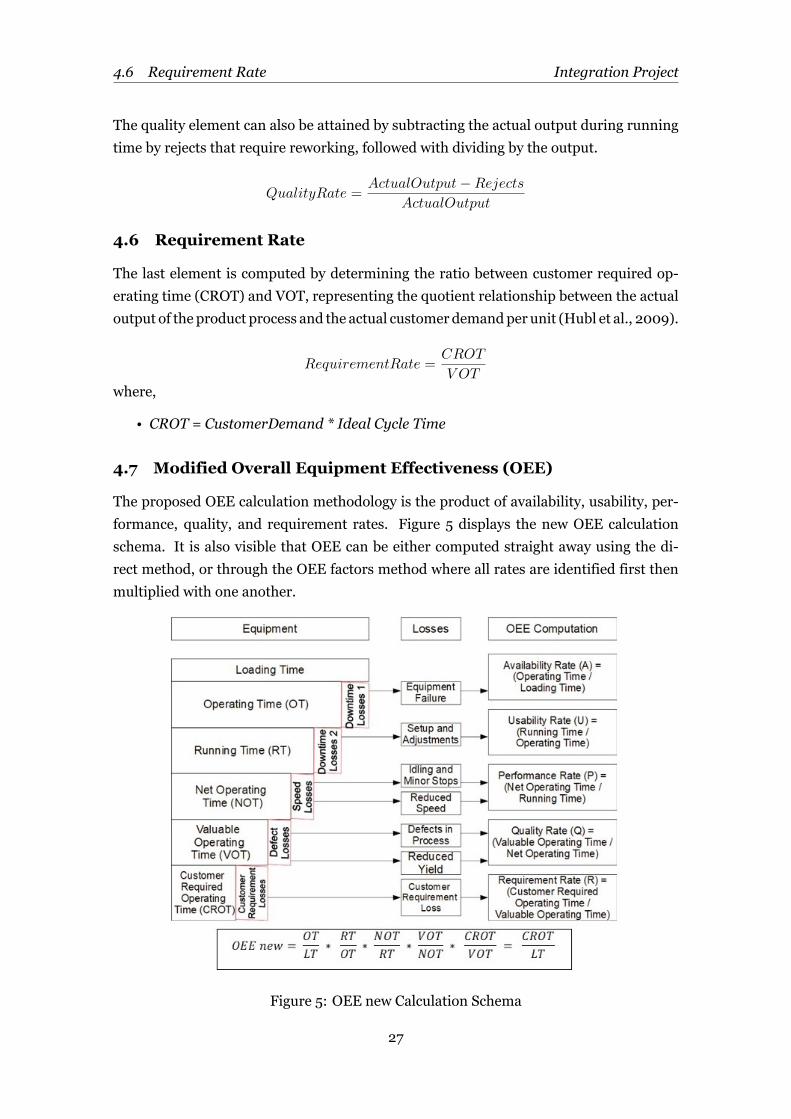
4.7 Modified Overall Equipment Effectiveness (OEE)
The proposed OEE calculation methodology is the product of availability, usability, per-
formance, quality, and requirement rates. Figure 5 displays the new OEE calculation
schema. It is also visible that OEE can be either computed straight away using the di-
rect method, or through the OEE factors method where all rates are identified first then
multiplied with one another.
Figure 5: OEE new Calculation Schema
27
Integration Project
5 Research Design
To demonstrate the benefits of the proposedOEEnewmetric formeasuring overall equip-
ment effectiveness in a manufacturing setting, it was applied, tested, and compared with
the original OEE calculation method using a one-machine model representing a generic
real-world production line. Despite the conceptualization of the experiments that are con-
ducted, the run numerical example’s input values adequately resemble the characteristics
of an actual production line in a manufacturing plant. Hence, the application of this pa-
per’s findings are validated and deemed reliable to a high degree beyond conceptual analy-
sis. The purpose of this case study is to showcase themodified OEE and test its prevalence
over the originalmethod by usingMicrosoft Excel as utilized by Bon et al. (2011) andHed-
man et al. (2016) in their data collection and analyses of their respective case studies in
order to evaluate OEE. It being a deterministic value, OEE is not capable to account for
process variability (Zammori et al., 2011), secluding the absolute necessity for applying
this investigation to a modelled stochastic production line, which further justifies using
deterministic numerical examples as opposed to stochastic process simulations. Even if
stochastic models are used, it will rely on averages only for the analysis of the modelled
system.
5.1 Model Description
In order to epitomize the proposed calculationmethodology, a production plant of cutting
tools is studied. This case study and the simulated data used were adopted and developed
from Badiger and Gandhinathan (2008), Hubl et al. (2009), and Yalagi et al. (2016) due
to the high resemblance of these research efforts’ methodology and goal with this paper’s
attempt, expanding the scope of OEE in order to mitigate some of its drawbacks via the
addition of extra elements. The manufacturing line treated is assumed to originally con-
sist of the following subsequent processes: cutting, facing, centring, fluting and grinding.
Each operation is characterized by different production capabilities, such as reliability and
cycle times, requiring a synthesized set of models that illustrate the interactions between
the different processes in order to assiduously examine the OEE of the different processes
and of the entire production line as a whole. Consequently, a simplified one machine
model is considered as the bottleneck process, fulfilling the purpose of this evaluation.
This is validated as OEE’s application is most suitable when dealing with one-machine
bottleneck processes, as any process improvementsmade based onOEE analysis of a non-
bottleneck process will not result in a higher overall manufacturing performance (Bamber
et al., 2003; De Ron and Rooda, 2006; Hubl and Gmainer, 2008; Sivaselvam and Gajen-
dran, 2014).
For the sake of simplicity, the model encompasses one process, representing all four
28
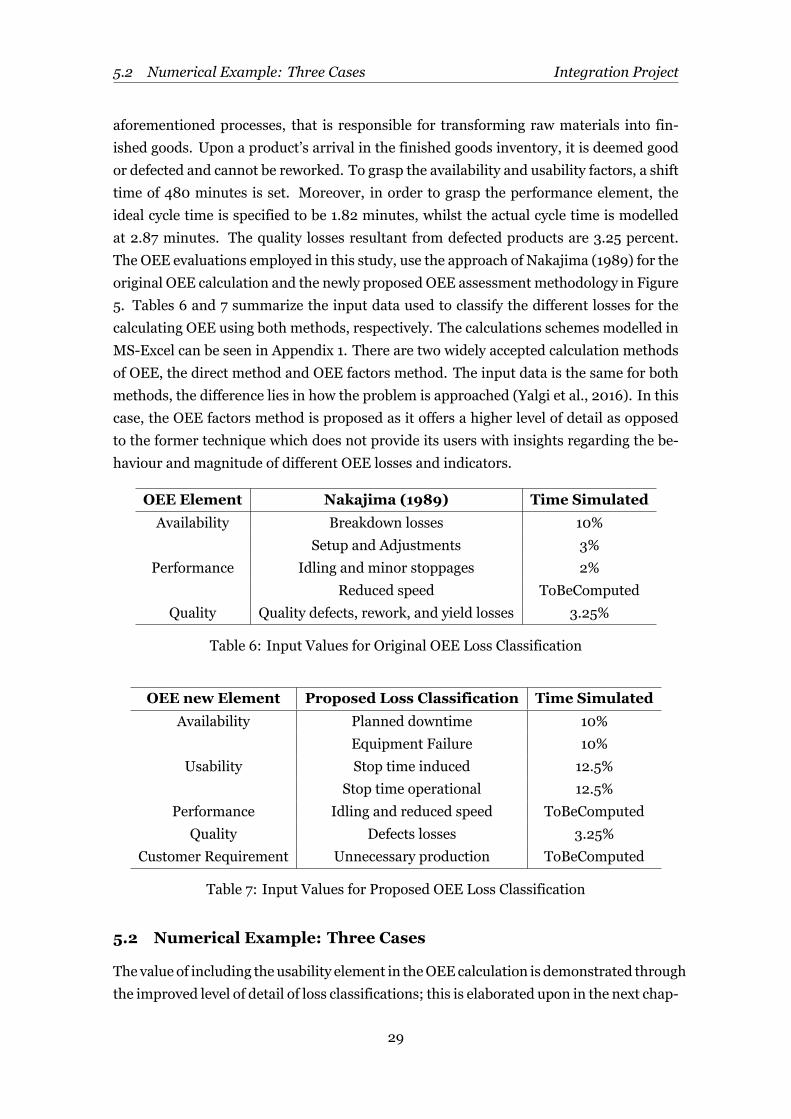
5.2 Numerical Example: Three Cases Integration Project
aforementioned processes, that is responsible for transforming raw materials into fin-
ished goods. Upon a product’s arrival in the finished goods inventory, it is deemed good
or defected and cannot be reworked. To grasp the availability and usability factors, a shift
time of 480 minutes is set. Moreover, in order to grasp the performance element, the
ideal cycle time is specified to be 1.82 minutes, whilst the actual cycle time is modelled
at 2.87 minutes. The quality losses resultant from defected products are 3.25 percent.
The OEE evaluations employed in this study, use the approach of Nakajima (1989) for the
original OEE calculation and the newly proposed OEE assessment methodology in Figure
5. Tables 6 and 7 summarize the input data used to classify the different losses for the
calculating OEE using both methods, respectively. The calculations schemes modelled in
MS-Excel can be seen in Appendix 1. There are two widely accepted calculation methods
of OEE, the direct method and OEE factors method. The input data is the same for both
methods, the difference lies in how the problem is approached (Yalgi et al., 2016). In this
case, the OEE factors method is proposed as it offers a higher level of detail as opposed
to the former technique which does not provide its users with insights regarding the be-
haviour and magnitude of different OEE losses and indicators.
OEE Element Nakajima (1989) Time Simulated
Availability Breakdown losses 10%
Setup and Adjustments 3%
Performance Idling and minor stoppages 2%
Reduced speed ToBeComputed
Quality Quality defects, rework, and yield losses 3.25%
Table 6: Input Values for Original OEE Loss Classification
OEE new Element Proposed Loss Classification Time Simulated
Availability Planned downtime 10%
Equipment Failure 10%
Usability Stop time induced 12.5%
Stop time operational 12.5%
Performance Idling and reduced speed ToBeComputed
Quality Defects losses 3.25%
Customer Requirement Unnecessary production ToBeComputed
Table 7: Input Values for Proposed OEE Loss Classification
5.2 Numerical Example: Three Cases
The value of including the usability element in theOEEcalculation is demonstrated through
the improved level of detail of loss classifications; this is elaborated upon in the next chap-
29
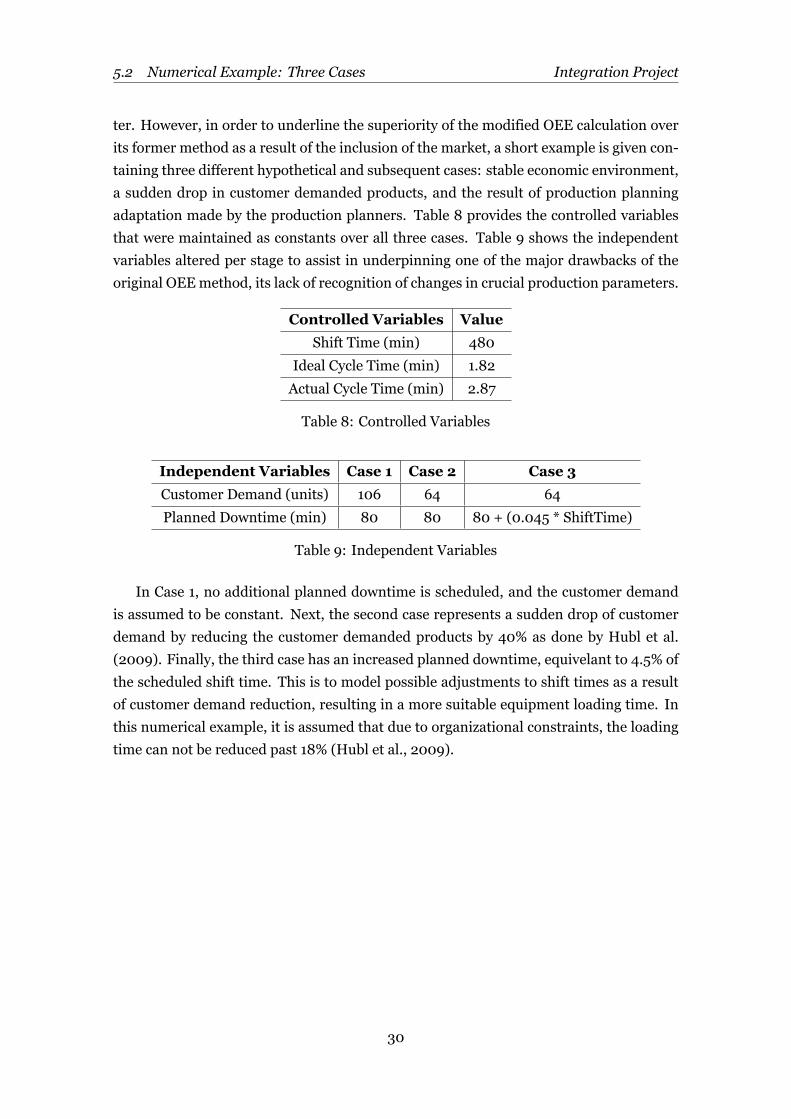
5.2 Numerical Example: Three Cases Integration Project
ter. However, in order to underline the superiority of the modified OEE calculation over
its former method as a result of the inclusion of the market, a short example is given con-
taining three different hypothetical and subsequent cases: stable economic environment,
a sudden drop in customer demanded products, and the result of production planning
adaptation made by the production planners. Table 8 provides the controlled variables
that were maintained as constants over all three cases. Table 9 shows the independent
variables altered per stage to assist in underpinning one of the major drawbacks of the
original OEEmethod, its lack of recognition of changes in crucial production parameters.
Controlled Variables Value
Shift Time (min) 480
Ideal Cycle Time (min) 1.82
Actual Cycle Time (min) 2.87
Table 8: Controlled Variables
Independent Variables Case 1 Case 2 Case 3
Customer Demand (units) 106 64 64
Planned Downtime (min) 80 80 80 + (0.045 * ShiftTime)
Table 9: Independent Variables
In Case 1, no additional planned downtime is scheduled, and the customer demand
is assumed to be constant. Next, the second case represents a sudden drop of customer
demand by reducing the customer demanded products by 40% as done by Hubl et al.
(2009). Finally, the third case has an increased planned downtime, equivelant to 4.5% of
the scheduled shift time. This is to model possible adjustments to shift times as a result
of customer demand reduction, resulting in a more suitable equipment loading time. In
this numerical example, it is assumed that due to organizational constraints, the loading
time can not be reduced past 18% (Hubl et al., 2009).
30
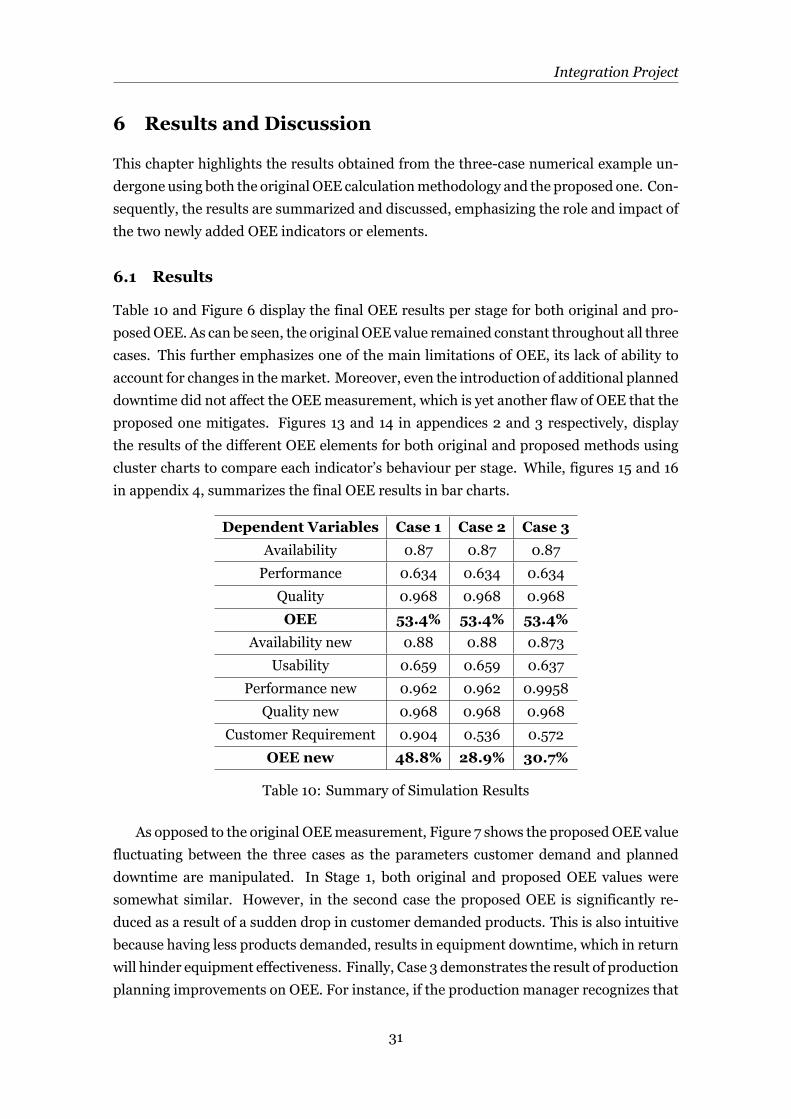
Integration Project
6 Results and Discussion
This chapter highlights the results obtained from the three-case numerical example un-
dergone using both the original OEE calculationmethodology and the proposed one. Con-
sequently, the results are summarized and discussed, emphasizing the role and impact of
the two newly added OEE indicators or elements.
6.1 Results
Table 10 and Figure 6 display the final OEE results per stage for both original and pro-
posedOEE. As can be seen, the original OEE value remained constant throughout all three
cases. This further emphasizes one of the main limitations of OEE, its lack of ability to
account for changes in themarket. Moreover, even the introduction of additional planned
downtime did not affect the OEEmeasurement, which is yet another flaw of OEE that the
proposed one mitigates. Figures 13 and 14 in appendices 2 and 3 respectively, display
the results of the different OEE elements for both original and proposed methods using
cluster charts to compare each indicator’s behaviour per stage. While, figures 15 and 16
in appendix 4, summarizes the final OEE results in bar charts.
Dependent Variables Case 1 Case 2 Case 3
Availability 0.87 0.87 0.87
Performance 0.634 0.634 0.634
Quality 0.968 0.968 0.968
OEE 53.4% 53.4% 53.4%
Availability new 0.88 0.88 0.873
Usability 0.659 0.659 0.637
Performance new 0.962 0.962 0.9958
Quality new 0.968 0.968 0.968
Customer Requirement 0.904 0.536 0.572
OEE new 48.8% 28.9% 30.7%
Table 10: Summary of Simulation Results
As opposed to the original OEEmeasurement, Figure 7 shows the proposedOEE value
fluctuating between the three cases as the parameters customer demand and planned
downtime are manipulated. In Stage 1, both original and proposed OEE values were
somewhat similar. However, in the second case the proposed OEE is significantly re-
duced as a result of a sudden drop in customer demanded products. This is also intuitive
because having less products demanded, results in equipment downtime, which in return
will hinder equipment effectiveness. Finally, Case 3 demonstrates the result of production
planning improvements on OEE. For instance, if the production manager recognizes that
31
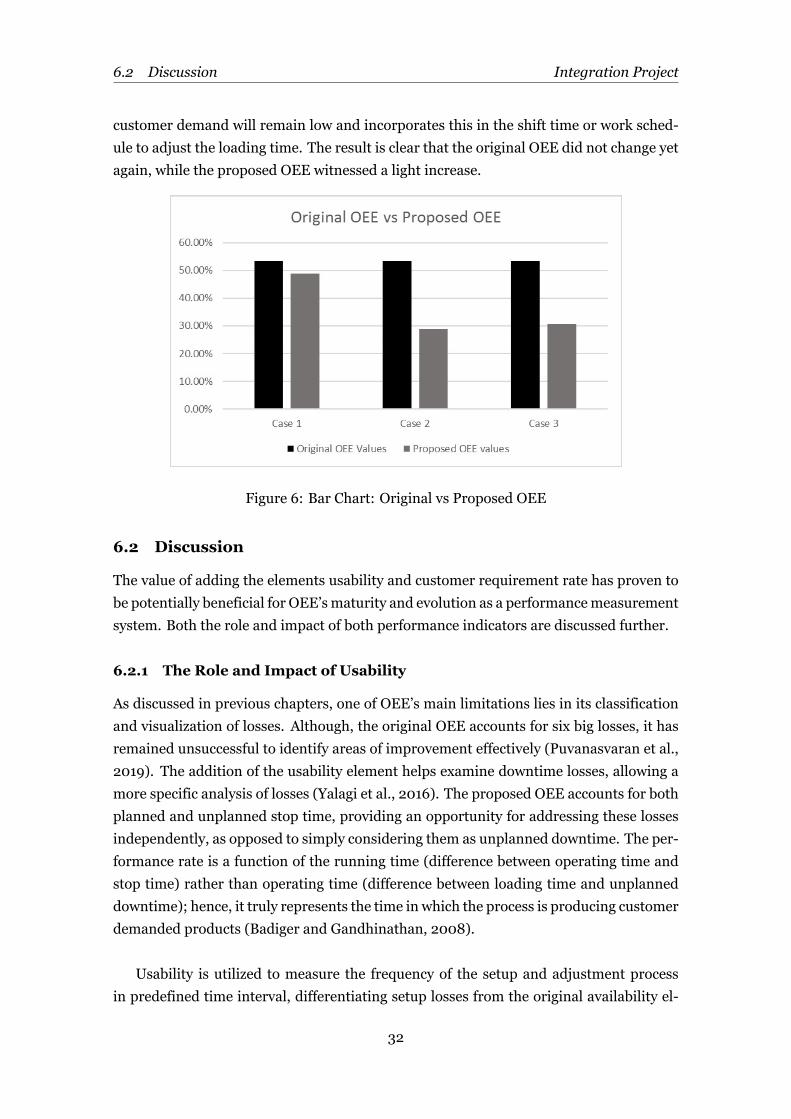
6.2 Discussion Integration Project
customer demand will remain low and incorporates this in the shift time or work sched-
ule to adjust the loading time. The result is clear that the original OEE did not change yet
again, while the proposed OEE witnessed a light increase.
Figure 6: Bar Chart: Original vs Proposed OEE
6.2 Discussion
The value of adding the elements usability and customer requirement rate has proven to
be potentially beneficial for OEE’smaturity and evolution as a performancemeasurement
system. Both the role and impact of both performance indicators are discussed further.
6.2.1 The Role and Impact of Usability
As discussed in previous chapters, one of OEE’s main limitations lies in its classification
and visualization of losses. Although, the original OEE accounts for six big losses, it has
remained unsuccessful to identify areas of improvement effectively (Puvanasvaran et al.,
2019). The addition of the usability element helps examine downtime losses, allowing a
more specific analysis of losses (Yalagi et al., 2016). The proposed OEE accounts for both
planned and unplanned stop time, providing an opportunity for addressing these losses
independently, as opposed to simply considering them as unplanned downtime. The per-
formance rate is a function of the running time (difference between operating time and
stop time) rather than operating time (difference between loading time and unplanned
downtime); hence, it truly represents the time in which the process is producing customer
demanded products (Badiger and Gandhinathan, 2008).
Usability is utilized to measure the frequency of the setup and adjustment process
in predefined time interval, differentiating setup losses from the original availability el-
32
6.2 Discussion Integration Project
ement of OEE, facilitating the user to identify the areas of improvement (Puvanasvaran
et al., 2019). In addition, the setup and changeover losses are classified as stop time in-
duced and stop time operational. This was done with the intention to further assist pro-
duction teams to fully use OEE to help dedicate TPM efforts for setup and adjustment
losses reduction. This can also motivate strategies for OEE users to reduce planned ma-
terial loading, changeovers, shortage of materials, people, and information (Badiger and
Gandhinathan, 2008). The numerical example results have shownhow the proposedOEE
encourages directing TPM initiatives on the usability factor of OEEdue to its relatively low
value, rather than the availability or performance rates. Therefore, the low OEE can be
attributed mainly to equipment stop time induced and stop time operations, rather than
equipment failure or breakdowns. Consequently, this serves as an opportunity for pro-
duction managers to improve their processes. In this example, the stop time losses effect
is dominant and examining it separately will help direct and steer process improvement
efforts, focusing on the usability of equipment availability.
6.2.2 The Role and Impact of Customer Requirement Rate
Contrary to the limitation of OEE, the proposed OEE can clearly shows that it is capable
of identifying changes in customer demand through the new performance indicator, cus-
tomer requirement rate, as demonstrated by the three-case numerical example. Also, OEE
is improved by accounting for adjustments made in equipment loading time, as a result of
manipulating planned downtime. This is why the new OEE is suggested for use by TPM-
driven production responsible managers (Hubl et al., 2009). From the results of Case 2, it
is seen that the drop of demand affects OEE negatively, prompting improvements for the
process by adjusting shift times, as was done in Case 3. The new rate allows comparing
the time used to actually produce high quality products that directly satisfy a customer
order, and the adjustable loading time. Despite the importance of both original and pro-
posedOEEmetrics, it is up for company personnel to further investigate production losses
and wastes with the help of OEE, to optimally steer TPM initiatives (Puvanasvaran et al.,
2019). Production managers are advised to address each OEE indicator alone in order to
facilitate the needed focus to eliminate specific process losses.
33
Integration Project
7 Conclusion
OEE is a significant performance measurement system for successful implementation of
TPM activities. Despite its many benefits, the key figure OEE has received a lot of crit-
icism both in literature and application. As such, this research explored the strengths,
weaknesses, threats, and possible opportunities as to how to further develop or redesign
this metric to overcome some of its limitations. It was clear from the conducted SWOT
analysis that OEE arguably suffers from two main limitations: its inability to adequately
visualize losses and inability to account for changes inmarket demandedproducts. Conse-
quently, two new performance indicators, usability and customer requirement rate, were
incorporated into the original OEE method to overcome its identified limitations. This
research’s findings are valuable as it provides production managers with a better under-
standing of OEE, and a more comprehensive tool acting as an extension to the maturity
of OEE for successful implementation and use of this performance indicator. The new
OEE measurement’s value can mainly be attributed to its more meticulous categoriza-
tion of losses, and its recognition of customer demand changes. These two additional
characteristics of OEE contribute to its expansion and maturity as a TPM performance
measurement system. However, it is still important to note that the proposed OEE is not
without a flaw and actually several drawbacks of the original OEE will be also shared with
the proposed one. This research aims to contribute to the OEE literature by offering a new
improvedOEEversionwhich overcomes someof the limitations of the traditionalmethod.
Despite the fact that conducting a case studywith a real assembly line would have been
ideal, this is seldom feasible (Huang et al., 2003). Usually, the costs associates with alter-
ing a system’s design, parameters, and available resources in each process being analyzed
are high due to financial constraints for realizing change and losses that take place due
to process disruptions. Testing different scenarios with an existing real-life manufactur-
ing process is impractical in most cases, because in reality most activities and disruptions
take place in many different forms and degrees of magnitude. Even highly automated
processes witness uncertainties and variability, and with the addition of labour resources,
the potential for process variation increases evenmore. Hence, simulation, or in this case
numerical examples, offers a unique opportunity to the researcher to attempt to model a
system that represents a real production line using secondary data from previously con-
duced OEE case studies that provides approximations of the effects of process variations
and disruptions that impede system performance (Huang et al., 2003). Nonetheless, fur-
ther research should aim to improve the validity and reliability of the proposed OEE by
applying it to real life case studies that use primary data, as opposed to secondary as done
in this case. Moreover, future research efforts can exploreOEE frommore specialized per-
spectives using one of the scopes mentioned in the limitations section in the first chapter
of this paper.
34
Integration Project
8 References
Ahuja, I. and Khamba, J., 2008. Total productive maintenance: literature review and di-
rections. International Journal of Quality and Reliability Management, 25(7), pp.709-
756.
Andersson, C. and Bellgran, M., 2015. On the complexity of using performancemeasures:
Enhancing sustained production improvement capability by combining OEE and produc-
tivity. Journal of Manufacturing Systems, 35, pp.144-154.
Badiger, A. and Gandhinathan, R., 2008. A proposal: evaluation of OEE and impact of six
big losses on equipment earning capacity. International Journal of ProcessManagement
and Benchmarking, 2(3), pp.234-248.
Bamber, C., Castka, P., Sharp, J. and Motara, Y., 2003. Cross�functional team working
for overall equipment effectiveness (OEE). Journal of Quality in Maintenance Engineer-
ing, 9(3), pp.223-238.
Benjamin, S., Marathamuthu, M. andMurugaiah, U., 2015. The use of 5-WHYs technique
to eliminate OEE’s speed loss in amanufacturing firm. Journal of Quality inMaintenance
Engineering, 21(4), pp.419-435.
Binti Aminuddin, N., Garza-Reyes, J., Kumar, V., Antony, J. and Rocha-Lona, L., 2016.
An analysis of managerial factors affecting the implementation and use of overall equip-
ment effectiveness. International Journal of ProductionResearch, 54(15), pp.4430-4447.
Cheah, C., Prakash, J. and Ong, K., 2020. An integrated OEE framework for structured
productivity improvement in a semiconductormanufacturing facility. International Jour-
nal of Productivity and Performance Management, ahead-of-print (ahead-of-print).
Che Maideen, N., Budin, S., Sahudin, S. and Ab Samat, H., 2017. Synthesizing the Ma-
chine’s Availability inOverall Equipment Effectiveness (OEE). Journal ofMechanical En-
gineering, 4(3), pp.89-99.
Dal, B., Tugwell, P. and Greatbanks, R., 2000. Overall equipment effectiveness as a mea-
sure of operational improvement – A practical analysis. International Journal of Opera-
tions Production Management, 20(12), pp.1488-1502.
De Ron, A. and Rooda, J., 2006. OEE and equipment effectiveness: an evaluation. Inter-
national Journal of Production Research, 44(23), pp.4987-5003.
35
Integration Project
Domingo, R. and Aguado, S., 2015. Overall Environmental Equipment Effectiveness as a
Metric of a Lean and Green Manufacturing System. Sustainability, 7(7), pp.9031-9047.
Fekri Sari, M. and Avakh Darestani, S., 2019. Fuzzy overall equipment effectiveness and
line performance measurement using artificial neural network. Journal of Quality in
Maintenance Engineering, 25(2), pp.340-354.
Ferko, R. andZnidarsic, A., 2007. UsingOEEApproach for improvingmanufacturing per-
formance. Journal of Microelectronics, Electronic Components, and Materials, pp.105-
111.
Garza Reyes, J., 2015. From measuring overall equipment effectiveness (OEE) to over-
all resource effectiveness (ORE). Journal of Quality in Maintenance Engineering, 21(4),
pp.506-527.
Garza Reyes, J., Eldridge, S., Barber, K. and Soriano Meier, H., 2010. Overall equipment
effectiveness (OEE) and process capability (PC) measures: A relationship analysis. Inter-
national Journal of Quality Reliability Management, 27(1), pp.48-62.
Gibbons, P. and Burgess, S., 2010. Introducing OEE as a measure of lean Six Sigma capa-
bility. International Journal of Lean Six Sigma, [online] 1(2), pp.134-156.
Globerson, S., 1985. Issues in developing a performance criteria system for an organiza-
tion. International Journal of Production Research, 23(4), pp.639-646.
Gupta, A. and Garg, R., 2012. OEE Improvement by TPM Implementation: A Case Study.
International Journal of Engineering and Applied Sciences Research (IJIEASR), 1(1),
pp.115-124.
Gupta, P. and Vardhan, S., 2016. Optimizing OEE, productivity and production cost for
improving sales volume in an automobile industry through TPM: a case study. Interna-
tional Journal of Production Research, 54(10), pp.2976-2988.
Hedman, R., Subramaniyan, M. and Almstrom, P., 2016. Analysis of Critical Factors for
Automatic Measurement of OEE. In: 49th CIRP Conference on Manufacturing Systems.
Elsevier B.V., pp.128-133.
Huang, S., Dismukes, J., Shi, J., Su, Q., Razzak, M., Bodhale, R. and Robinson, D., 2003.
Manufacturing productivity improvement using effectivenessmetrics and simulation anal-
36
Integration Project
ysis. International Journal of Production Research, 41(3), pp.513-527.
Hubl, A. and Gmainer, R., 2008. Critical discussion of OEE.
Hubl, A., Altendorfer, K., Pilstl, J. and Jodlbauer, H., 2009. Equipment Performance
Measurement in Production Plants Based on Customer Demand. In: 2009 2nd Interna-
tional Symposium on Logistics and Industrial Informatics. Steyr: Institute of Electrical
and Electronics Engineers.
Jeong, K. and Phillips, D., 2001. Operational efficiency and effectiveness measurement.
International Journal of Operations Production Management, 21(11), pp.1404-1416.
Jonsson, P. and Lesshammar, M., 1999. Evaluation and improvement of manufacturing
performance measurement systems � the role of OEE. International Journal of Opera-
tions and Production Management, [online] 19(1), pp.55-78.
Kumar, J. and Soni, V., 2014. An Exploratory Study of OEE Implementation in Indian
Manufacturing Companies. Journal of The Institution of Engineers (India): Series C,
96(2), pp.205-214.
Kumar, J., Sujatha, G. and Thyagarajan, D., 2012. Assessment of overall equipment effec-
tiveness, efficiency and energy consumption of breakfast cereal. International Journal of
Applied Engineering and Technology, 2(2), pp.39-48.
Kwon, O. and Lee, H., 2004. Calculation methodology for contributive managerial effect
by OEE as a result of TPM activities. Journal of Quality in Maintenance Engineering,
10(4), pp.263-272.
Ljungberg, Õ., 1998. Measurement of overall equipment effectiveness as a basis for TPM
activities. International Journal of Operations ProductionManagement, 18(5), pp.495-
507.
Lkiya, L. and Kushwaha, D., 2015. OPTIMIZING and ANALYZING OVERALL EQUIP-
MENT EFFECTIVENESS THROUGH TPM APPROACH: A CASE STUDY IN CEMENT
INDUSTRY. International Journal of Advance Engineering and Research Development,
2(05).
Mahmoud, K., Otto, T., Shevtshenko, E. andKaraulova, T., 2016. Performance Evaluation
By Using Overall Equipment Effectiveness (OEE): An Analyzing tool. In: International
Conference on Innovative Technologies, IN-TECH 2016, Prague, 6. - 8. 9. 2016. [online]
37
Integration Project
Tallinn, pp.185-188.
Mansor, M., Ismail, A., Yasin, M. and Halim, A., 2015. A Framework for Measuring The
Effect of Changeover Time To Overall Equipment Effectiveness. UniversityMalaysia Pa-
hang 2015.
Mishra, R., Anand, G. and Kodali, R., 2008. A SWOT analysis of total productive mainte-
nance frameworks. International Journal of Management Practice, 3(1), p.51.
Muchiri, P. and Pintelon, L., 2008. Performance measurement using overall equipment
effectiveness (OEE): literature review and practical application discussion. International
Journal of Production Research, [online] 46(13), pp.3517-3535.
Nakajima, S., 1989. Implementing Total Productive Maintenance. Portland: Productive
Press.
Ng, K., Chong, K. and Goh, G., 2014. Improving Overall Equipment Effectiveness (OEE)
through the six sigma methodology in a semiconductor firm: A case study. In: 2014
IEEE International Conference on Industrial Engineering and Engineering Manage-
ment. [online] Melaka: Institute of Electrical and Electronics Engineers, pp.833-837.
Oechsner, R., Pfeffer, M., Pfitzner, L., Binder, H., Müller, E. and Vonderstrass, T., 2002.
From overall equipment efficiency (OEE) to overall Fab effectiveness (OFE). Materials
Science in Semiconductor Processing, 5(4-5), pp.333-339.
Olhager, J., Prajogo, D., Sohal, A. and O’neill, P., 2010. Implementation of OEE – issues
and challenges.
Puvanasvaran, A., Yoong, S. and Tay, C., 2019. NEW OVERALL EQUIPMENT EFFEC-
TIVENESS FRAMEWORK DEVELOPMENT WITH INTEGRATION OF MAYNARD OP-
ERATIONSEQUENCETECHNIQUE. Journal of EngineeringandApplied Science, 14(20),
pp.3600-3608.
Puvanasvaran, P., Y.S., T. and C.C., T., 2013. Consideration of demand rate in overall
equipment effetiveness (OE) on equipment with constant process time. Journal of In-
dustrial Engineering and Management, 6(2), pp.507-524.
Roessler, M. and Abele, E., 2013. Uncertainty in the analysis of the overall equipment
effectiveness on the shop floor. In: IOP Conference Series: Materials Science and Engi-
neering 46. IOP Publishing Ltd.
38
Integration Project
Roessler, M. and Abele, E., 2015. Enhancement of the overall equipment effectiveness
measure: a contribution for handling uncertainty in shop floor optimisation and pro-
duction planning. International Journal of Industrial and Systems Engineering, 20(2),
pp.141-154.
Sahu, S., Patidar, L. and Soni, P., 2015. 5S TRANSFUSION TO OVERALL EQUIPMENT
EFFECTIVENESS (OEE) FOR ENHANCING MANUFACTURING PRODUCTIVITY. In-
ternational Research Journal of Engineering and Technology (IRJET), 2(7), pp.1211-
1216.
Sajid, M., Wasim, A., Hussain, S. and Jahanzaib, M., 2018. A Framework for Improving
Overall Equipment Efficiency: A Case Study of Manufacturing Setup of Pakistan. Inter-
national Journal of Lean Thinking, 9(2).
Shakil, S. and Parvez, M., 2020. Application of Value StreamMapping (VSM) in a Sewing
Line for Improving Overall Equipment Effectiveness (OEE): A Case Study. In: Proceed-
ings of ICIMES 2019: Intelligent Manufacturing and Energy Sustainability, pp.249-
260.
Singh, R., Shah, D., Gohil, A. and Shah, M., 2013. Overall Equipment Effectiveness (OEE)
Calculation: Automation throughHardware Software Development. Procedia Engineer-
ing, 51, pp.579-584.
Sivaselvam, E. andGajendran, S., 2014. Improvement ofOverall EquipmentEffectiveness
In a Plastic Injection Moulding Industry. Journal of Mechanical and Civil Engineering,
pp.12-16.
Wudhikarn, R., Smithikul, C. andManopiniwes, W., 2010. Developing overall equipment
cost loss indicator. In: 6th International Conference of Digital Enterprise Technology.
[online] Hong Kong. Available at: <http://10.1007/978-3-642-10430-543> [Accessed 15
March 2020].
Yalagi, S., A R, D. and Naik, C., 2016. Overall Equipment Effectiveness. International
Journal of Engineering Research And Advanced Technology, 2(1), pp.521-528.
Ylipää, T., Skoogh, A., Bokrantz, J. and Gopalakrishnan, M., 2017. Identification of main-
tenance improvement potential using OEE assessment. International Journal of Produc-
tivity and Performance Management, 66(1), pp.126-143.
39

Integration Project
Zammori, F., Braglia, M. and Frosolini, M., 2011. Stochastic overall equipment effective-
ness. International Journal of Production Research, 49(21), pp.6469-6490.
40
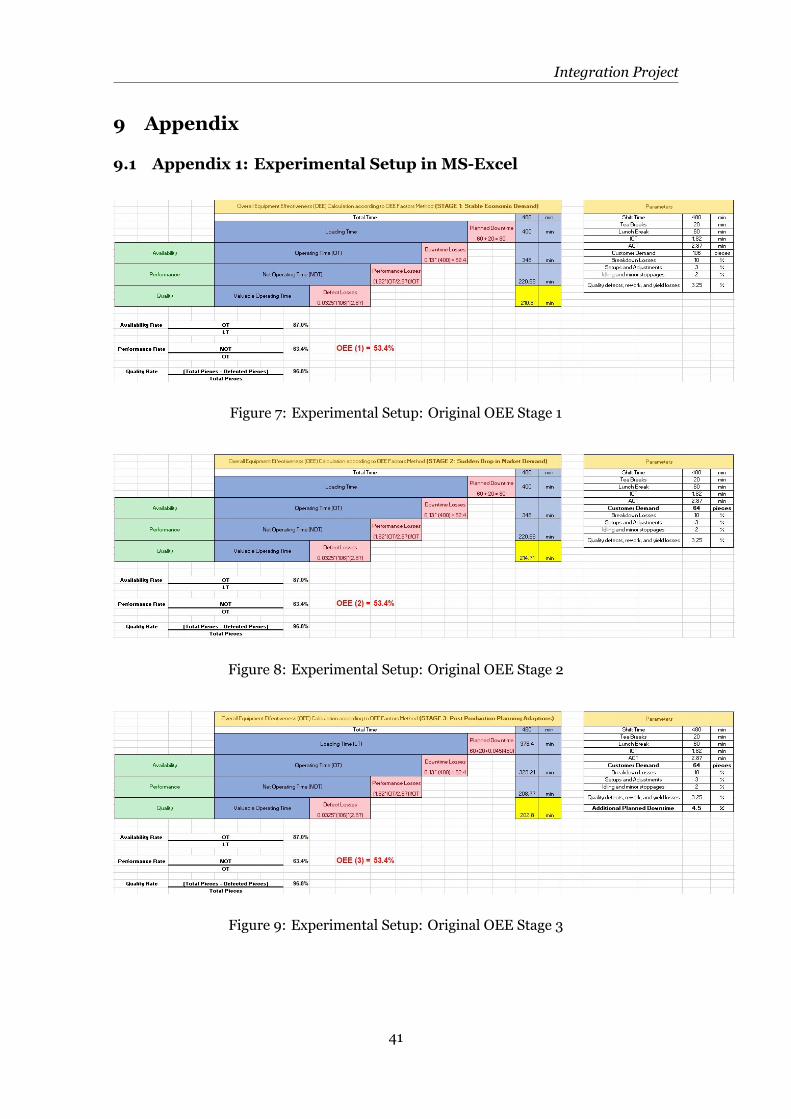
Integration Project
9 Appendix
9.1 Appendix 1: Experimental Setup in MS-Excel
Figure 7: Experimental Setup: Original OEE Stage 1
Figure 8: Experimental Setup: Original OEE Stage 2
Figure 9: Experimental Setup: Original OEE Stage 3
41
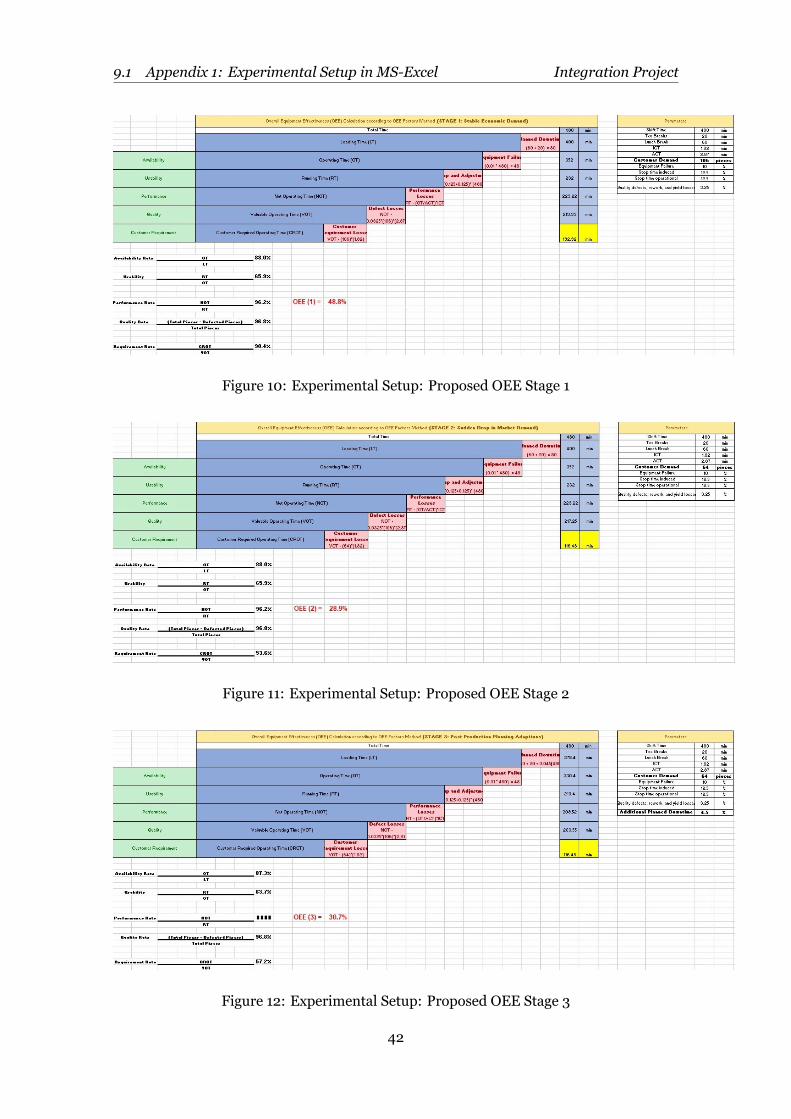
9.1 Appendix 1: Experimental Setup in MS-Excel Integration Project
Figure 10: Experimental Setup: Proposed OEE Stage 1
Figure 11: Experimental Setup: Proposed OEE Stage 2
Figure 12: Experimental Setup: Proposed OEE Stage 3
42
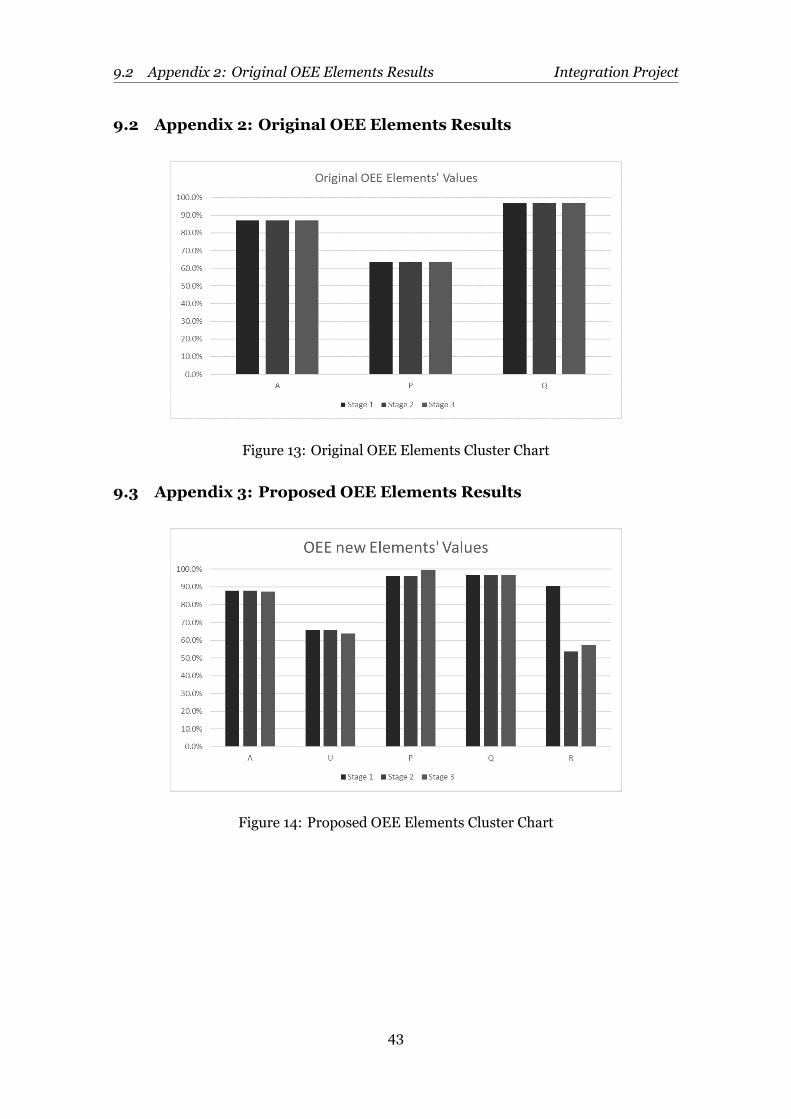
9.2 Appendix 2: Original OEE Elements Results Integration Project
9.2 Appendix 2: Original OEE Elements Results
Figure 13: Original OEE Elements Cluster Chart
9.3 Appendix 3: Proposed OEE Elements Results
Figure 14: Proposed OEE Elements Cluster Chart
43
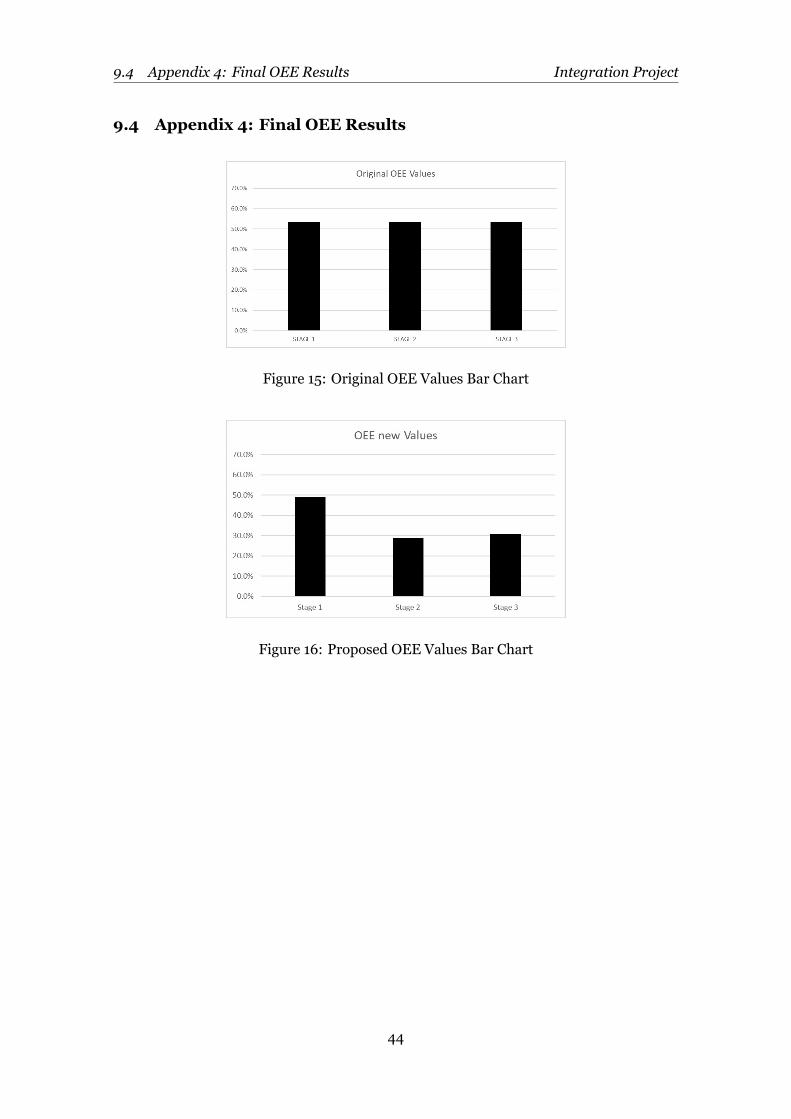
9.4 Appendix 4: Final OEE Results Integration Project
9.4 Appendix 4: Final OEE Results
Figure 15: Original OEE Values Bar Chart
Figure 16: Proposed OEE Values Bar Chart
44