Embed Size (px)
Citation preview

Linköping Studies in Science and Technology Thesis No. 1254
De Novo Design and Characterization of Surface Binding
Peptides – Steps toward Creation of Functional Surfaces
Patrik Nygren
LIU-TEK-LIC-2006:35
Division of Molecular Biotechnology Department of Physics, Chemistry and Biology
Linköpings universitet, SE-581 83 Linköping, Sweden
Linköping 2006

© 2006 Patrik Nygren
LIU-TEK-LIC-2006:35
ISBN: 91-85523-57-7
ISSN: 0280-7971
Printed in Sweden by LiU-Tryck, Linköping 2006

The only way - Is all the way
OH - MY – GOD
It's judgement day and I'm not prepared
Everybody out there's running scared
So - Take a little bit off the top
I don't care, just make it stop
Slipknot Opium for the People

4

Abstract
The ability to create surfaces with well-defined chemical properties is a major research field. One possibility to do this is to design peptides that bind with a specific secondary structure to silica nanoparticles. The peptides discussed in this thesis are constructed to be random coil in solution, but are “forced” to become helical when adsorbed to the particles. The positively charged side-chains on the peptides strongly disfavor an ordered structure in solution due to electrostatic repulsion. When the peptides are introduced to the particles these charges will strongly favor the structure because of ion pair bonding between the peptide and the negatively charged nanoparticles. The peptide-nanoparticle system has been thoroughly investigated by systematic variations of the side-chains. In order to determine which factors that contributes to the induced structure, several peptides with different amino acid sequences have been synthesized. Factors that have been investigated include 1) the positive charge density, 2) distribution of positive charges, 3) negative charge density, 4) increasing hydrophobicity, 5) peptide length, and 6) by incorporating amino acids with different helix propensities. Moreover, pH dependence and the effect of different nanoparticle curvature have also been investigated. It will also be shown that the system can be modified to incorporate a catalytic site that is only active when the helix is formed. This research will increase our understanding of peptide-surface interactions and might be of importance for both nanotechnology and medicine.
iii

iv
Publications
1 Induction of Structure and Chemical Functionality in a de novo
Designed Peptide upon Adsorption to a Silica Nanoparticle.
Martin Lundqvist, Patrik Nygren, Bengt-Harald Jonsson and Klas Broo Submitted to Angewandte Chemie International Edition
2 Optimizing Surface Induced Helical Structure by Rational Changes in
Amino Acid Sequence.
Patrik Nygren, Martin Lundqvist, Klas Broo and Bengt-Harald Jonsson In manuscript
v

vi

Abbreviations
AUC Analytical Ultracentrifugation Boc t-Butoxycarbonyl CD Circular Dichroism DCM Dichloromethane DIPEA N,N’-Diisopropyl Ethylamine DMF N,N’-Dimethylformamide EDT Ethanedithiol Fmoc Fluorenylmethoxycarbonyl HF Hydrofluoric Acid HPLC High Performance Liquid Chromatography MALDI-Tof Matrix-Assisted Laser Desorption Ionization Time of Flight MeOH Methanol NMR Nuclear Magnetic Resonance SPPS Solid Phase Peptide Synthesis TBTU O-Benzotriazol-1-yl-N,N,N’,N’-tetramethyluronium
Tetrafluoroborate TFA Trifluoroacetic Acid TIS Triisopropylsilane UV Ultraviolet
Peptide Nomenclature
vii

viii

Table of Contents
1 Introduction _______________________________________________________ 1
2 Designig Surfaces Binding Peptides ____________________________________ 3 2.1 Introduction to the Field of Peptides_____________________________________ 3 2.2 The Original Designs _________________________________________________ 6
2.2.1 The initial design, R2A _____________________________________________________ 6 2.2.2 Characterization of R2A ____________________________________________________ 7 2.2.3 Decreasing Charge Density, R1A _____________________________________________ 9 2.2.4 Characterization of R1A ____________________________________________________ 9
2.3 Design Optimization _________________________________________________ 10 2.3.1 Reduced Complexity in R2Ae _______________________________________________ 10 2.3.2 Characterization of R2Ae __________________________________________________ 11
3 Investigating Design Elements _______________________________________ 14 3.1 The Surface Binding Amino Acids _____________________________________ 14
3.1.1 Decreasing the Positive Charge Density _______________________________________ 14 3.1.2 Characterization of R1Ae and R2Z ___________________________________________ 15 3.1.3 Increasing and altering the positive charge _____________________________________ 17 3.1.4 Characterization of R3A and K2A____________________________________________ 18
3.2 The Impact of the Negative Side _______________________________________ 20 3.2.1 Introduction of a Catalytic Site ______________________________________________ 20 3.2.2 Total changes in the negative side ____________________________________________ 24 3.2.3 Characterization of R2AeK and R2AeDN______________________________________ 25
3.3 Increasing Hydrophobicity____________________________________________ 27 3.3.1 Characterization of R2AeL and R2AeV _______________________________________ 27
3.4 Peptide length dependence ____________________________________________ 29 3.4.1 Characterization of R2Ae56 and its parts ______________________________________ 30
4 Methods _________________________________________________________ 32 4.1 Peptide Synthesis____________________________________________________ 32 4.2 Circular Dichroism __________________________________________________ 34 4.3 Analytical Ultracentrifugation_________________________________________ 36 4.4 Silica Nanoparticles__________________________________________________ 37
5 Conclusion and future perspectives ___________________________________ 39
6 Appendix_________________________________________________________ 40
7 References _______________________________________________________ 48
8 Acknowledgements_________________________________________________ 51
ix


1 Introduction
The ability to tailor make surfaces, down to the molecular level, has become a major
research field in recent years. The use of well-defined surfaces makes it possible to
develop systems on the micro- and nano-scale. With the techniques available this systems
can be used to investigate protein-surface interactions [1-4], to create nano-devices such as
nanobelts and semi-conductors[5, 6], to design micro-patterns[7], the use of nanopens[8] and
nanotrains[9]. It also enables for the understanding of biological systems, such as the
growth of organisms on marine surfaces[10-12], the growth of inorganic crystals on
SAMs[13] or to understand the growth of ice[14, 15]. It is likely that several applications will
have an impact on everyday life.
There are several kinds of surfaces that can be used, usually it is pure metal surfaces[16,
17] but also metal oxides[18], plastic[19] and glass[20] should be mentioned. In this project,
the surface has been silicon oxide.
By combining organic synthesis and surface science one gets a very powerful tool, and
by further including molecular biology, inorganic chemistry, medicine and/or biology the
possibilities become almost endless. There are many methods that can be used to analyze
chemically modified surfaces, such as IR-spectroscopy[21], x-ray photoelectron
spectroscopy (XPS)[22], surface plasmon resonance (SPR)[23], ellipsometry[24] and atomic
force microscopy (AFM)[25]. Information that can be provided by these methods includes,
thickness of the modification, the interactions with surfactants, the physical properties of
the molecules, hydrogen bonding between molecules, charged interactions and structural
information.
By creating well-defined surfaces on a molecular scale, one can further introduce
functional groups with known distances. This enables for the construction of molecular
probes[26], catalysts[27] or selective molecular traps[28]. The achievement of a surface
bound or surface initiated system would be useful in large scale chemical synthesis, were
the reactant can pass over the surface, react and thereby reduce the by-products present in
the purification step, or were the addition of the surface initiates a reaction and the

surface is then easily removed. It can also be used in order to create miniaturized
analytical tools, which would be useful in medicine and crime laboratories. Another
advantage of a surface attached system is both prize and size. It is useful if the surface
area can be washed and reused, and if the surface is micro-patterned, the total surface
area exceeds the seen area many times over.
One way to create well-defined surfaces is to use nature as a source of inspiration. By
combining nature’s fine solutions and organic chemistry, one gets a powerful tool.
The work done in this thesis is mostly concerned with the use of peptides, and one
might ask, “Why use peptides and not other organic molecules”? To answer that question
one has to consider multiple aspects. From the organic chemists point of view the first
would be that the synthesis of peptides is relatively easy; it can be automatized with a
peptide synthesizer machine using a solid support as a starting point and gives a high
yield. Secondly, since there is no purification step between the couplings it is less time
consuming.
There are other advantages of using peptides for surface modification besides those
described above. The natural occurring amino acids contain a number of chemically
modifiable side-chains that gives the possibility to incorporate other functionalities. One
can also incorporate artificial amino acids and other compounds that can form amide
bonds.
Supramolecular systems can be created by designing peptides that binds to each other
with high specificity. These systems can pre-organize in solution prior to the surface
modification or as will be described in this thesis, adopt a well-defined structure when
introduced to the surface.
Investigating peptide folding in the vicinity or at a surface can give vital information on
the mechanisms that is working in an organism when protein folding occur and also help
in the understanding of how diseases due to missfolding work and how they can be
prevented. One might also hypothesize that it can give an insight in how life on earth
were initiated, as the most abundant interaction sites in the primordial ooze would have
been inorganic surfaces[29].
This is the first time that a peptide has been designed that adopts a specific secondary
structure upon binding to a specific surface. This system is also very robust, it is stable at
high temperatures and one can introduce reactive sites with only minor changes in helical
stability.
2
2 Designing Surfaces Binding Peptides
2.1 Introduction to the Field of Peptides
Using the amino acids as building blocks for molecular design, produces some
limitations but also a vast number of possibilities, as can be seen with naturally occurring
enzymes and proteins. Unless one uses non-naturally occurring amino acids, one has 20
different building blocks, which in turn can adopt a secondary structure when connected
in a long chain. With the synthetic methods available today those 20 amino acids can,
with the use of special protection groups and a cunning chemist, be used to synthesize
everything from a protein[30] to a small drug candidate[31]. The possibility to achieve
protein folding offers a controlled way to get catalysis[32], attach a molecular probe[33],
make self-replication[34] etc.
When designing a peptide one has to consider multiple interactions and different
behaviors of the constituting amino acids and although a lot of research has been made in
this field[35, 36] it has not been fully examined. A useful tool when trying to predict the
outcome of the secondary structure in a peptide chain is to use Chou-Fasmans rules[37]
which statistically shows the preference the 20 natural amino acids has for a certain
conformation. Although called rules they should be regarded as guidelines.
The most important aspect of a peptide and its behavior is the peptide backbone. A
simplified depiction of the backbone is to describe it as composed of amides and α-
carbons. The backbone becomes stabilized by the partial double bond of the amides.
Interactions between amide carbonyl and amide hydrogen stabilize the different
secondary structures encountered in peptides and proteins.
The peptide chain is also affected by the side-chains of the constituting amino acids,
their geometry as well as their functional groups. The geometry of side-chains has a
tendency to make the amino acids more suitable for different secondary structures and/or
interactions with neighboring molecules. The side-chain interactions is the most
3

important aspect in the folding process of peptides, the formation of salt-bridges,
hydrophobic interactions, disulfides and hydrogen bonding all contributes to the stability
of secondary and, foremost, tertiary structures.
Hydrophobic interactions may cause a peptide to collapse to form unwanted
hydrophobic cores, cysteines can form unwanted disulfides and bind metal ions, and
unfortunately, peptides and their side-chains have an attraction towards surfaces. These
three attributes affects the functions of peptides and disrupts structures[38, 39].
In this work, peptides have been constructed to use the attraction of surfaces to induce
structure, in contradiction to what is generally observed. Utilizing de novo design the
peptides are made to behave as unstructured random-coils in solution and when
introduced to a negatively charged surface adopt a helical structure (fig. 1). Some of the
designs include well placed amino acids that will form an active site[32], only active when
the peptides are folded into a helix.
i. ii. iii.
Figure 1. Schematic picture of the random coil to helix peptide. (i.) The peptide in
solution. (ii.) Introduction of the negatively charge surface. (iii.) Helix formed on the
surface.
To be able to enhance the understanding of folding and peptide-surface interactions the
peptides only contains naturally occurring amino acids (fig. 2), which also have the added
benefit of making it possible if needed to use biotechnological methods to create these
peptides. The constituting amino acids have been chosen for their chemical and physical
properties and their roles in the over-all design have been evaluated by rational changes
in the sequence composition.
4

Fig
ure
2. P
ictu
ring
the
20 n
atur
al a
min
o ac
ids,
divi
ded
in ty
pes o
f fun
ctio
nalit
y; re
d sq
uare
con
tain
s pos
itive
am
ino
acid
s, gr
een
cont
ains
ne
gativ
e, p
urpl
e th
e am
ino
acid
gly
cine
, dar
k bl
ue c
onta
ins
the
pola
r am
ino
acid
s an
d th
erei
n lig
ht b
lue
high
-ligh
ting
cyst
eine
and
the
blac
k sq
uare
con
tain
s the
hyd
roph
obic
am
ino
acid
s. G
iven
bel
ow e
ach
are
nam
e, a
bbre
viat
ion
and
pKa.
HO
NH
2O
HO
NH
2O
HO
NH
2O
NN
HN
H2
NH N
H2
HN
HO
NH
2O
HO
NH
2O
OH
OO
HO
HO
NH
2O
HO
NH
2O
SHH
ON
H2
OH
ON
H2
OH
ON
H2
OH
ON
H2
OH
ON
H2
O
OH
OH
HO
NH
2
ON
H2
O
HO
NH
2O
HO
NH
2O
HO
NH
2O
HO
NH
2O
HO
H NO
HO
NH
2O
HO
NH
2O
NH
S
HO
NH
2O
Leuc
ine
Leu
, L p
K a =
-
Isol
euci
ne
Ile,
I
pKa
= -
Met
hion
ine
M
et, M
pK
a =
-
Prol
ine
Pro
, PpK
a =
-
Phen
ylal
anin
e
Ph
e, F
p
K a =
-
Tryp
toph
an
Trp
, W
pKa
= -
Valin
eVa
l, V
pKa
= -
Tyr
osin
e
Tyr
, YpK
a =
10.1
3
Ser
ine
Ser
, SpK
a =
~13
Thre
onin
e
Thr,
T p
K a =
~13
Glu
amin
e G
ln, Q
pK a
= -
Aspa
ragi
ne
Asn,
N p
K a =
-
Alan
ine
Ala
, ApK
a =
-
His
tidin
e
His
, HpK
a =
6.04
Ar
gini
ne
Arg
, RpK
a =
12.4
8
L
ysin
e
Lys
, KpK
a =
10.7
9
Glu
tam
ic a
cid
G
lu, E
pK a
= 4
.07
Aspa
rtic
acid
A
sp, D
pK a
= 3
.90
Cys
tein
e
Cys
, C p
K a =
8.3
3
Gly
cine
Gly
, GpK
a =
-
5

2.2 The Original Designs
2.2.1 The initial design, R2A
The starting point for the design was to choose the length of the peptide. To allow for a
obvious helix to form it was decided that the peptide should consist of 28 amino acids,
this would under optimal conditions form 7 complete turns[40-42], a helical length often
observed in natural proteins.
The peptides were intended to form helical structures upon interaction with a negatively
charged silica surface and therefore positively charged amino acids were chosen to favor
this interaction. Among the natural amino acids three may have a positive charge;
arginine, histidine, and lysine. The
tendency for silica nanoparticles to
aggregate at pH below 7 limits the
experimental pH range and render the
use of positively charged histidine (pKa
= 6.04) impossible. Lysine (pKa =10,79)
suited the system but the risk of reducing
pKa due to a vicinity of other lysines[43]
made it a poor candidate as well.
Arginine on the other hand seemed as a
good choice. It have a high pKa of 12.48,
the guanidine group gives it a
delocalized charge i.e. a larger charged
surface, and low reactivity. To get as
much interaction between the peptide and the surface as possible at least one arginine
should be present in every helical turn. It was thought that a high concentration of
positive charges on one side of the helix would favor the attachment on the surface.
Hence, eight arginines were incorporated in the peptide; filling rows 3 and 6 (fig. 3).
Besides the favorable interaction with the surface, the eight arginines would prevent the
peptide chain from adopting a helical structure in solution due to the electrostatic
repulsion that would exist in a helix that was formed in absence of stabilizing negative
charges from the silica surface.
Figure 3. Helical wheel depicting R2A.
COO-
NH3+
Gly7Leu14
Val21Leu28
Arg6Arg13
Arg20Arg27
Ser5Gln12
Gln19Ser26
Thr4Thr11Asn18Ser25
Asp1Cys8Asp15Gln22
Arg24Arg17Arg10Arg3
Leu2Ile9Val16Ala23
Row 1
Row 4Row 7
Row 3
Row 6
Row 2
Row 5
6

Hydrophobic amino acids were placed in the adjacent rows (2 and 7, fig. 3). By
introducing them next to the arginines and pointing obliquely down towards the surface,
they were to fulfill two objectives. Firstly, when the peptide folded on a surface their
hydrophobic nature would decrease the interaction between the solution and the arginines
and secondly, when helixes had formed they would be able to interact through
hydrophobic interactions with other helixes in close vicinity.
When a helix is formed, rows 4 and 5 (fig. 3) will be facing away from the surface
towards the solution. Since the solvent would be water based the amino acids
incorporated in these two rows would preferably be polar. This enabled them to interact
with the solution through hydrogen bonds, and possibly, hydrogen bonds could form
between peptides and thereby further favor the helical formation.
Since row 1 (fig. 3) was intended to point away from the surface and face the solution it
needed to contain amino acids that would interact well with water and at the same time
not be attracted to the negative charges on the silica surface. Silicone oxide at the pH
used in this work contains a net negative charge[44] taking this into consideration the most
effective amino acids would be either glutamic acid or aspartic acid. Their negatively
charged side-chains would be repelled by the surface, this would twist the peptide
backbone towards the solution and thereby facilitating the helical formation. In row 1 a
cysteine was introduced which could be used for an eventual labeling.
2.2.2 Characterization of R2A
After the synthesis and purification, the peptide was to undergo measurements as to see
how successful the design was. The amount of helicity was measured using circular
dichroism (CD) in the wavelength region of ~190-260 nm. The measurements were made
in room temperature at pH 9.8 and 9 nm particle were used with a ratio of 1:1 (peptide:
particle). The spectra were corrected using a reference solution lacking the peptide but
otherwise identical.
Figure 4 shows CD-spectra of R2A in solution (black line) which corresponds well with
a spectrum of a random-coil structure and agrees with the design. The spectrum of the
peptide-particle complex showed a shift indicates the presence of helical structure.
Although not an obvious helix, the shift was enough to investigate the impact that the
particles had on the peptides. To determine if the shift was due to a change in the
chemical environment or if it was because the peptides had bound to the particles. This
7

was investigated with analytical ultracentrifugation (AUC) sedimentation equilibrium
experiments.
CD-spectrum for R2A
-6
-4
-2
0
2
4
185 192,5 200 207,5 215 222,5 230 237,5 245 252,5 260
Wavelength (nm)
Del
ta E
psilo
n
Figure 4. The CD-spectrum of R2A. The black line depicts free peptide in
absence of particles and the gray line depicts the peptide particle complex
(9 nm).
The sedimentation equilibrium experiments show that (fig. 5 (i.)) when R2A is in
solution it does not sediment until 40000 rpm has been reached, indicating that the
peptide is monomeric in solution. The AUC-results (fig. 5(ii.)) show that the peptide is
strongly bound to the nanoparticles since it sediments with the particles at 3000 rpm.
Thus, the structural change is indeed due to the interaction between the surface and the
peptide.
(i.)
0,3
0,4
0,5
0,6
0,7
0,8
0,9
6,8 6,85 6,9 6,95 7 7,05 7,1 7,15
Radius
Abs
orba
nce
(ii.)
00,20,40,60,8
11,21,41,6
6,3 6,35 6,4 6,45 6,5 6,55 6,6 6,65
Radius
Abso
rban
ce
30003500 30004000 35006000 40008000 600012000 800020000 1200040000 2000044000 400004600048000
Figure 5. (i.) AUC results of free R2A. (ii.) AUC results of R2A with 6 nm particles.
8

2.2.3 Decreasing Charge Density, R1A
In order to increase the helical content
the results produced by R2A were
interpreted as a step in the right direction
and therefore used as a template for re-
design. The sequence of R1A has many
similarities to that of R2A. Rows 2 and 7
containing hydrophobic alanine to shield
the surface interacting rows, in rows 4
and 5 polar amino acids, such as
tyrosine, glutamine, serine and
threonine, were placed to interact with
the solution thru hydrogen bonds and
row 1were negatively charged.
As for the surface binding rows (3 and
6), there was a major change. While in R2A, both rows had been filled with arginines,
R1A only row 3 contained arginine, whereas row 6 was filled with asparagine (fig. 6).
The idea was to decrease the net positive charge and thereby reduce the electrostatic
repulsion between the positive charged side-chains. The choice of asparagine were made
due to the δ-positive nature of the side-chain amide hydrogen which would hopefully be
attracted by the surface but not be positive enough to disturb the helical formation due to
electrostatic repulsion with the arginines.
The constitution of the hydrophobic rows (2 and 7) differed in one aspect, the
complexity of the amino acids were reduced to the use of only one. The peptide R2A (fig.
3) had a mixture of alanine, isoleucine, leucine, and valine in these two rows, which
could increase the risk of unwanted hydrophobic interactions. Therefore, in R1A, only
alanine that has high helix forming capability was used, keeping a small hydrophobic
barrier but reducing hydrophobicity.
Figure 6. Helical wheel depicting R1A
COO-
NH3+
Gly7Ala14
Ala21Ala28
Asn6Asn13
Asn20Asn27
Ser5Gln12
Gln19Ser26
Thr4Tyr11Gln18
Tyr25
Asp1Cys8Asp15Gln22
Arg24Arg17Arg10Arg3
Ala2Ala9Ala16Ala23
Row 4Row 7
Row 3
Row 6
Row 2
Row 5
Row 1
2.2.4 Characterization of R1A
As for R2A the helicity of R1A were measured with CD-spectroscopy in the wavelength
region of ~190-260 nm. This time the ratio between peptide and particle were not 1:1 but
instead the total surface area of the different particle sizes was equal. This change were
9

made due to the fact that when the ratio were 1:1 the pH of the sample were altered, even
though the particles were dialyzed at the same pH as the sample, this change in pH is
probably due to the chemical properties of the particle.
CD-spectrum for R1A
-5
-4
-3
-2
-1
0
1
190
195
199
204
208
213
217
222
226
231
235
240
244
249
253
258
Wavelength (nm)
Del
ta E
psilo
n
Figure 7. The CD-spectrum for R1A. The black line depicts free peptide in
absence of particles and the gray line depicts the peptide particle complex
(9 nm).
The conformational changes induced by the particles in R1A turned out to be even
smaller than for R2A (fig. 7). The reason to why R1A exhibited a lesser helical induction
than R2A probably lies in the reduction of positive charges in the peptide, which have
decreased the number of possible interaction sites with the charges on the silica surface.
2.3 Design Optimization
2.3.1 Reduced Complexity in R2Ae
As a starting point for the optimization of the design it were presumed that the general
idea of the design were correct, meaning that each point in the helical wheel had the right
chemical nature and that the problem could be found in the rather complex sequence of
the peptide. Therefore, the number of different amino acids used in the design was
reduced. Another presumption was that, since R2A had a higher helical content than
R1A, it was used as the starting point in the redesign.
10
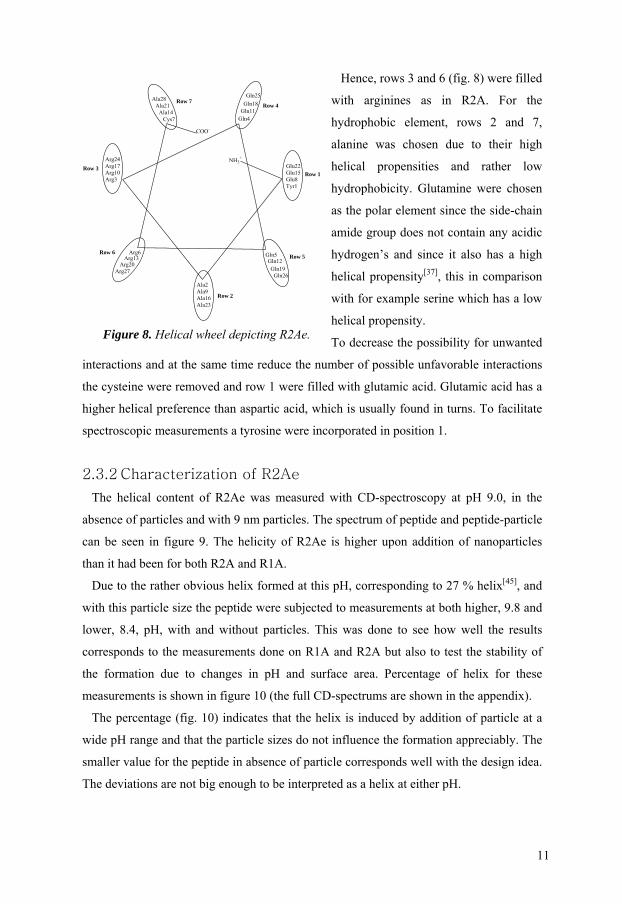
Hence, rows 3 and 6 (fig. 8) were filled
with arginines as in R2A. For the
hydrophobic element, rows 2 and 7,
alanine was chosen due to their high
helical propensities and rather low
hydrophobicity. Glutamine were chosen
as the polar element since the side-chain
amide group does not contain any acidic
hydrogen’s and since it also has a high
helical propensity[37], this in comparison
with for example serine which has a low
helical propensity.
COO-
NH3+
Cys7Ala14
Ala21Ala28
Arg6Arg13
Arg20Arg27
Gln5Gln12Gln19
Gln26
Gln4Gln11Gln18Gln25
Glu22Glu15Glu8Tyr1
Arg24Arg17Arg10Arg3
Ala2Ala9Ala16Ala23
Ro
Row 4Row 7
Row 3
Row 6
Row 2
Row 5
To decrease the possibility for unwanted
interactions and at the same time reduce the number of possible unfavorable interactions
the cysteine were removed and row 1 were filled with glutamic acid. Glutamic acid has a
higher helical preference than aspartic acid, which is usually found in turns. To facilitate
spectroscopic measurements a tyrosine were incorporated in position 1.
w 1
Figure 8. Helical wheel depicting R2Ae.
2.3.2 Characterization of R2Ae
The helical content of R2Ae was measured with CD-spectroscopy at pH 9.0, in the
absence of particles and with 9 nm particles. The spectrum of peptide and peptide-particle
can be seen in figure 9. The helicity of R2Ae is higher upon addition of nanoparticles
than it had been for both R2A and R1A.
Due to the rather obvious helix formed at this pH, corresponding to 27 % helix[45], and
with this particle size the peptide were subjected to measurements at both higher, 9.8 and
lower, 8.4, pH, with and without particles. This was done to see how well the results
corresponds to the measurements done on R1A and R2A but also to test the stability of
the formation due to changes in pH and surface area. Percentage of helix for these
measurements is shown in figure 10 (the full CD-spectrums are shown in the appendix).
The percentage (fig. 10) indicates that the helix is induced by addition of particle at a
wide pH range and that the particle sizes do not influence the formation appreciably. The
smaller value for the peptide in absence of particle corresponds well with the design idea.
The deviations are not big enough to be interpreted as a helix at either pH.
11

R2Ae pH 9,0
-5
-4
-3
-2
-1
0
1
200 205 210 215 220 225 230 235 240 245 250 255 260
Wavelength (nm)
Delta
Eps
ilon
Figure 9. CD-spectrum for R2Ae at pH 9.0. The black line depicts free
peptide in absence of particles and the gray line depicts the peptide-particle
complex (9 nm).
Percentage helix of R2Ae
0
5
10
15
20
25
30
35
40
Peptide 6 nm 9 nm 15 nm
% h
elix
Figure 10. Percentage helix forR2Ae in absence of particle and with 6, 9 and 15 nm
particles. Black = pH 9.8, gray = pH 9.0 and white = 8.4.
12

It is interesting to note that the highest helical content is observed for the peptide when
introduced to the 6 nm particle at the lowest pH (8.4). The results contradict the
expectations that the steep curvature of these particles (fig. 11) would put a strain on the
backbone hydrogen bonds, which would disfavor a helix.
Figure 11. The length of a fully twisted helix compared with the three different
particle sizes.
Encouraged by the good results it was realized that further design optimization was
needed. Although there are, numerous possible interactions to take into consideration, in
the following chapter the result of five different types of modifications will be presented.
13

3 Investigating Design Elements
3.1
of arginines were synthesized based on R2Ae, with the reduced complexity of the
The Surface Binding Amino Acids
From the initial investigation, it was clear that the number of positive charges and their
distribution strongly affected the tendency to form helical structure on silica surfaces.
Therefore, several peptides were designed to investigate these factors in detail.
3.1.1 Decreasing the Positive Charge Density
In the two original designs, the sequence incorporated either one or two rows of
arginine. Although the peptide containing two rows showed higher helical content and
that the first design optimization therefore contain two rows, it were not proven that it
were the best choice. The electrostatic repulsion would be decreased with only one row of
arginines and this might still prove to be better, therefore a simpler version with one row
Figure 12.To the left, helical wheel depicting R1Ae and to the right R2Z.
COO-
NH3+
Ala7Ala14
Ala21Ala28
Asn6Asn13
Asn20Asn27
Gln5Lys12
Gln19Gln26
Gln4Gln11Gln18Gln25
Glu1His8Glu15Tyr22
Arg24Arg17Arg10Arg3
Ala2Ala9Ala16Ala23
Row 1
Row 4Row 7
Row 3
Row 6
Row 2
Row 5
COO-
NH3+
Ala7Ala14
Ala21Ala28
Asn6Arg13
Asn20Arg27
Gln5Gln12Gln19
Gln26
Gln4Gln11Gln18
Gln25
Asn24Arg17Asn10Arg4
Ala3Ala9Ala16Ala23
Glu1Glu8Glu15Glu22
Row 1
Row 4Row 7
Row 3
Row 6
Row 2
Row 5
14

sequence but incorporating asparagine in row 6 instead of arginine (fig. 12). Row 3 were
filled with arginines, alanines in rows 7 and 3, in rows 4 and 5 glutamine were placed and
glutamic acid in row 1. The peptide was named R1Ae, meaning one row of arginines and
a simple amino acid composition.
To further investigate the influence that a reduced positive charged peptide would have
on the helical formation a peptide, R2Z, were constructed. R2Z have the same amino acid
composition in rows 1, 2, 4, 5 and 7 as R2Ae with the reduced complexity, but differs in
rows 3 and 7 in the aspect that instead of filled rows of arginine every other amino acid
are arginine and every other is asparagine. This makes the charges located in a zigzag
pattern (fig. 12).
3.1.2 Characterization of R1Ae and R2Z
Figure 13 shows the CD-spectrums of R1Ae and R2Z in pH 9.0 buffer with and without
particles. The addition of particles produce a conformational change in the peptides
pushing the minima towards 208 nm and another minimum is forming at 222 nm. The
changes in R1Ae are smaller than the changes in R2Z and compared with R2Ae both
form less helical structures. R1Ae corresponds to 6 % helix in absence of particle and
with particle added, 8 %; none of these values describes an obvious helix[45]. The same
values for R2Z are 7 % when the peptide is free in solution and 22 % when the particles
have been added.
The peptides were also investigated with all three particle sizes and at pH 9.8 and 8.4
(full CD-spectrums can be found in the appendix). The percentage helix values can be
found in figure 14. For most of the systems, the helical formation is higher for R2Z,
although it does not produce as good helixes as R2Ae. The values lies in between 8 and
20 percentage, with the exception of the peptide-particle complex formed for R2Z with 9
nm particles in the 9.8 buffer. This might be explained when taking into consideration
that the surface charge is largest at this pH. As to why the content for the 15 nm particle
is not as high as for the other particle sizes, can be due to the small repulsive force
generated between the surface and the carbonyl oxygen in the asparagine. This small
repulsive force might also explain why R1Ae exhibits such low structural affect when
introduced to the particles.
15

R1Ae and R2Z pH 9,0
-6
-5
-4
-3
-2
-1
0
1
200 205 210 215 220 225 230 235 240 245 250 255 260
Wavelength (nm)
Delta
Eps
ilon
Figure 13. CD-spectra of R1Ae and R2Z in pH 9.0. Black dashed line = R1Ae in absence of particle. Black line = R1Ae with 9 nm particles. Gray dashed line = R2Z in absence of
particles. Gray line = R2Z with 9 nm particles.
Percentage helix of R1Ae and R2Z
0
5
10
15
20
25
30
35
Peptide 6 nm 9 nm 15 nm
% h
elix
Figure 14. Percentage helix for R1Ae and R2Z, in absence of particle and with 6, 9
and 15 nm particles. Left black = R1Ae in pH 9.8. Left gray = R1Ae in pH 9.0. Left white = R1Ae in pH 8.4. Right black = R2Z in pH 9.8. Right gray = R2Z in pH 9.0.
Right white = R2Z in pH 8.4.
16

3.1.3 Increasing and altering the positive charge
To investigate the contribution the positive charges have on the formation of the helixes
further, a peptide with an increased number of arginines were synthesized, incorporating
a third row of arginines. This would give yet another handle for the peptide to adsorb to
the surface. By introducing a third row the overall design of the peptide had to be
changed, as one row that were occupied by alanines, glutamines or the glutamic acids
were lost.
It was believed that the repulsion the glutamic acids exhibited from the surface were a
crucial part of the design and that the hydrophobic element in the design played a larger
role than the hydrophilic. Therefore, the design of R3A, besides having three rows of
arginines, was to contain two rows of alanine and two rows of glutamic acid (fig 15).
o far, arginine has been used as the anchor to get the peptide to adsorb to the surface
an
Figure 15. To the left, helical wheel depicting R3A and to the right K2A.
Glu7Glu14Glu21Tyr28
Arg5Arg12Arg19Arg26
Glu4Glu11
Glu18Glu25
Arg6Arg13Arg20Arg27
C-Term.
N-Term.
Arg2Arg9
Arg16Arg23
Ala24Ala17
Ala10Ala3
Cys1Ala8
Ala15Ala22
Row 4
Row 3
Row 5
Row 6
Row 7
Row 1
Row 2
C-Term.
N-Term.
Ala7Ala14
Ala21Ala28
Lys6Lys13
Lys20Lys27
Gln5Gln12Gln19
Gln26
Gln4Gln11Gln18Gln25
Glu1Glu8Glu15Glu22
Lys24Lys17Lys10Lys3
Ala2Ala9Ala16Ala23
Ro
Row 4Row 7
Row 3
Row 6
Row 2
Row 5
w 1
S
d this has proven to be successful. In the pH range used, lysine, with a pKa of 10.79,
would also be positively charged and by replacing the arginines with lysine, the impact
that the guanidine group have on the structural change would be tested. The design of
K2A were a duplicate of R2Ae with the exception of the replaced arginines (fig. 15)
17

3.1.4 Characterization of R3A and K2A
CD-spectrum of R3A (fig. 16) in pH 9.0 corresponds to a well-defined helix, with a
calculated helix content of 73 % for the peptide interacting with the particle while free
R3A in solution only had 4 %[45]. This indicated that more arginines did not produce a too
high repulsion but instead increased the binding to the particles and also helped in the
structural formation. Looking at how R3A behaves with changes in pH and surface size it
is apparent that a smaller particle induces more structure in the peptide and that a pH of
9.0 induces the most apparent helical structure at all particle sizes (fig. 17). This might be
because as the particle size increases the number possible attachment points for the
arginine increases and thereby increasing the strain in the backbone, which would distort
the helix. As to why pH 9.0 gives the best helical content most probably has to do with
the equilibrium between the charges on the arginines and on the surface. As the pH
decreases, the surface charge becomes reduced thus decreasing the number of possible
interaction sites, which disfavors formation, and when pH increases, the surface becomes
more negatively charge that enables the arginines to interact at a larger interaction
surface, which smears the peptide to the surface, rather than induce structure.
R3A and K2A pH 9,0
-8
-7
-6
-5
-4
-3
-2
-1
0
1
200 205 210 215 220 225 230 235 240 245 250 255 260
Wavelength (nm)
Delta
Eps
ilon
Figure 16. CD-spectra of R3A and K2A in pH 9.0. Black dashed line = R3A in absence of particle. Black line = R3A with 9 nm particles. Gray dashed line = K2A in
absence of particles. Gray line = K2A with 9 nm particles.
18

K2A when introduced to the silica particles clearly changes toward a helical structure
minima are forming at both 208 and 222 nm (fig. 16), although the overall change is
almost not visible, the calculate helical content goes from 8 % when K2A acts as a free
peptide to 12 % when particles were added. Looking at the CD-measurements for K2A at
the three pHs used it is apparent that it gets a higher helical content as pH is increases
(fig. 17).
Percentage helix of R3A and K2A
0
10
20
30
40
50
60
70
80
90
Peptide 6 nm 9 nm 15 nm
% h
elix
Figure 17. Percentage helix for R3A and K2A, in absence of particle and with 6, 9 and 15 nm particles. Left black = R3A in pH 9.81. Left gray = R3A in pH 9.0. Left white = R3A in pH 8.4. Right black = K2A in pH 9.8. Right gray = K2A in pH 9.0.
Right white = K2A in pH 8.4.
The helical formation of K2A also increases with decreasing particle sizes. The
increased helical structure induced by the higher pH most probably derives from the
increased negative charge of the surface making it easier for the amine to find an
attachment point. The reason to why smaller particles give a better helical formation
might lie in the fact the lysines in close vicinity tend to reduce the pKa of the side-chain
amine[43]. As this happened the side-chains become deprotonated that could lead to a
1 R3A precipitate when introduced to 15 nm particles at pH 9.8.
19

helical formation due to hydrophobic interactions and therefore the need for a large
surface interaction diminishes.
3.2
put in a i, i+4 position in a helix this pair produces a active site for ester hydrolysis[32]
The Impact of the Negative Side
In the above-described designs, glutamic acid and glutamine have been used to interact
with the solution. Glutamic acid would also be repelled by the surface that would help
inducing the helix formation as it twists the peptide backbone. To test this, four peptides
were synthesized containing various changes in these rows.
3.2.1 Introduction of a Catalytic Site
A catalytic His-Lys pair was incorporated in the sequences of R2Ae and R3A. When
where the imidazole of the histidine will initiate the hydrolysis by an attack on the ester
carbonyl and the lysine amine would stabilize the negative charge that will develop in the
R2Aecat and R3Acat pH 9,0
-4
-3,5
-3
-2,5
-2
-1,5
-1
-0,5
0
0,5
200 205 210 215 220 225 230 235 240 245 250 255 260
Wavelength (nm)
Delta
Eps
ilon
Figure 18. CD-spectra of R2Aecat and R3Acat in pH 9.0. Black dashed line = R2Aecat in absence of particle. Black line = R2Aecat with 9 nm particles. Gray
dashed line = R3Acat in absence of particles. Gray line = R3Acat with 9 nm particles.
20
acylintermediate. In the peptide based on R2A, called R2Aecat, the histidine was inserted
in position 15 and the lysine in position 19. R3Acat, based on R3A, the histidine was
inserted in position 14 and the lysine in position 18. The His-Lys pair would also disrupt
the negative side of the peptides
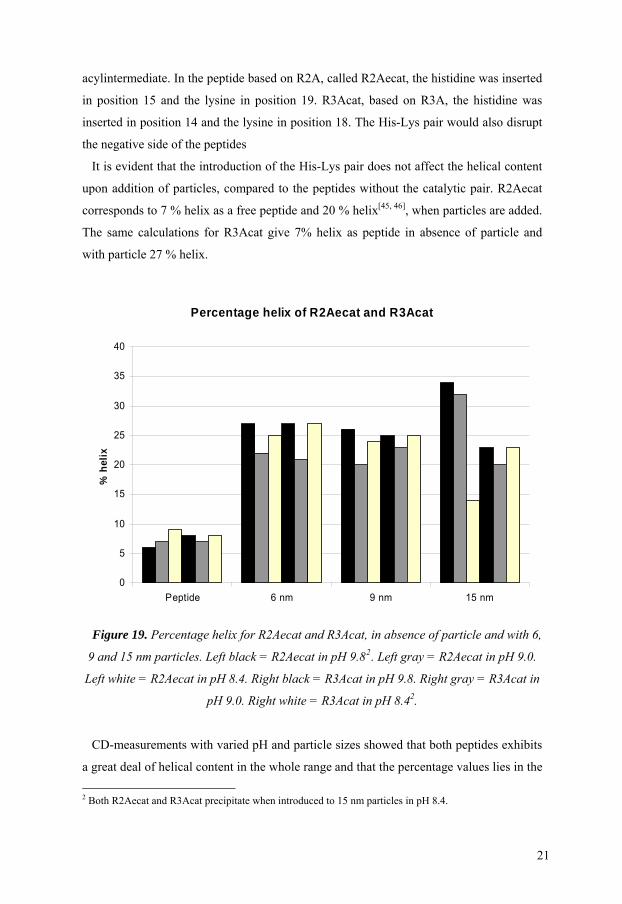
It is evident that the introduction of the His-Lys pair does not affect the helical content
upon addition of particles, compared to the peptides without the catalytic pair. R2Aecat
corresponds to 7 % helix as a free peptide and 20 % helix[45, 46], when particles are added.
The same calculations for R3Acat give 7% helix as peptide in absence of particle and
with particle 27 % helix.
Percentage helix of R2Aecat and R3Acat
0
5
10
15
20
25
30
35
40
Peptide 6 nm 9 nm 15 nm
% h
elix
Figure 19. Percentage helix for R2Aecat and R3Acat, in absence of particle and with 6
9
D-measurements with varied pH and particle sizes showed that both peptides exhibits
a great deal of helical content in the whole range and that the percentage values lies in the
,
and 15 nm particles. Left black = R2Aecat in pH 9.82. Left gray = R2Aecat in pH 9.0.
Left white = R2Aecat in pH 8.4. Right black = R3Acat in pH 9.8. Right gray = R3Acat in
pH 9.0. Right white = R3Acat in pH 8.42.
C
2 Both R2Aecat and R3Acat precipitate when introduced to 15 nm particles in pH 8.4.
21

sa
showed that
th
me range independent of pH and particle size, with the exception of R2Aecat that have
a obvious increase when subjected to the 15 nm particles at the higher pHs.
R2Aecat were further analyzed with AUC as to see whether it was bound to the
particles or not. The AUC measurement of the peptide in absence of particles
e peptide were in solution, whereas the measurement of the peptide-particle system
showed that the peptide have adsorbed to the colloidal particles (fig. 20).
(i.)
0,1850,19
(ii.)
0,4
-0,1
0
0,1
0,2
0,3
6,3 6,35 6,4 6,45 6,5 6,55 6,6
2500
0,1550,16
0,1650,17
0,1750,18
6,8 6,85 6,9 6,95 7 7,05 7,1 7,15
25003500
35004500
45008000
8000
Figure 20. (i.) AUC results of free R2Aecat. (ii.) AUC results of R2Aecat with 9 nm
particles.
To further analyze the stability of e-particle system, a 1 ml sample of
R2Aecat mixed with 9 nm particles were dialyzed for 60 minutes in 1000 ml, pH 9,0,
c
the peptid
arbonate buffer at room temperature. An equal amount of sample was treated with a pH
2 hydrochloric acid solution under the same conditions. After these treatments were both
samples analyzed with AUC (fig. 21).
(i.)
0,60,7
(ii.)
0
0,05
0,1
0,15
0,2
0,25
6,85 6,9 6,95 7 7,05 7,1 7,15
2500 2500
00,10,20,30,40,5
6,3 6,35 6,4 6,45 6,5 6,55 6,6 6,65
3500 35004500 45008000 8000
Figure 21. (i.) AUC results of R2Aecat dialyzed for 1 hour. (ii.) AUC results of
R2Aecat after treatment with hydrochloric acid
It is apparent that t hour of dialysis, as
shown in figure 21 (i.) where the peptides sediments at the same rotor speed as the
p
reatment displays a free peptide (fig. 21(ii.). Whether this is because the
he peptide-particle complex is retained after one
articles.
Treating the complex with strong acid breaks the interaction and the results obtained
after this t
22

peptide-particle interaction has been broken and they exist in the solution, or if the
particles have dissolved, have not been investigated.
Figure 22. (4-sulfamoyl-benzoylamino)-acetic acid 3-nitorphenyl ester
Since th or ester
hydrolysis R2Aecat were chosen to investigate if it worked. UV-measurements were
m
e His-Lys pair incorporated in the design would work as a reactive site f
ade on the buffer, buffer containing particles, buffer containing R2Aecat and the
peptide-particle complex, all containing the substrate (4-sulfamoyl-benzoylamino)-acetic
acid 3-nitorphenyl ester (fig. 22).
Figure 23. Ester bond hydrolysis by: the peptide-particle complex in buffer (◊); peptide
in buffer (▲); particles in buffer (■); buffer (♦). The reaction product m-nitro phenol was
The peptide-particle complex sh ase over the background reaction.
Addition of more substrate showed that the activity were not terminated due to amide
fo
rement showed
that the helical content were stable to around 55 ºC.
monitored at A357.6.
owed a 10-fold incre
rmation on the lysine amine which has been observed in similar systems[46, 47]. This
could also be verified by MALDI-Tof which did not show any sulfonylated product after
the reaction. This finding makes it possible to use the system as a man-made catalyst and
if combined with a gentler way of detaching the peptides from the particle it could be
used as a molecular switch. These results are further discussed in Paper 1.
The temperature dependence of R2ecat was determined by raising the temperature ten
ºC at a time starting at 25 ºC and going to 75 ºC (fig. 24). The CD-measu
23
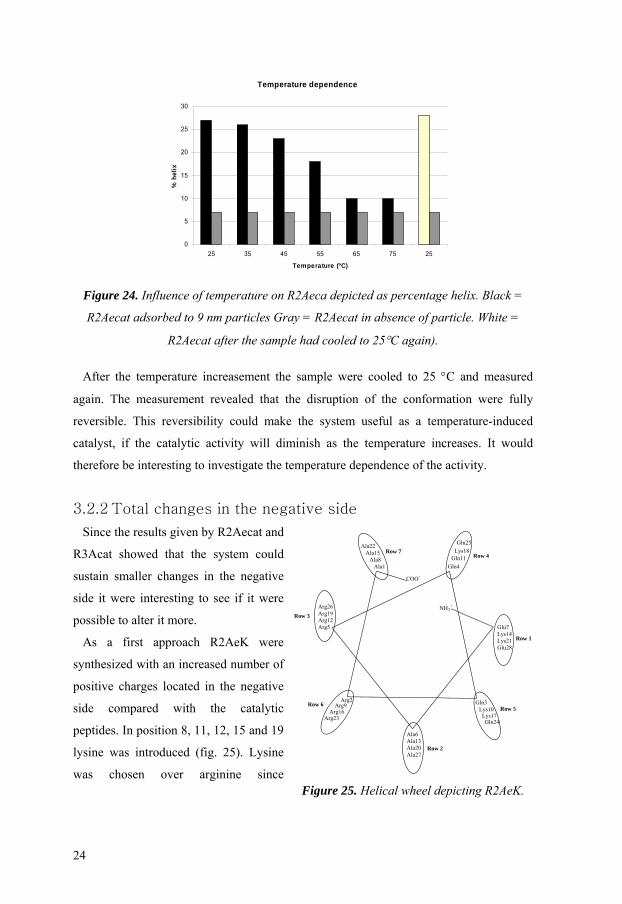
Temperature dependence
25
30
0
5
10
15
20
25 35 45 55 65 75 25
Temperature (ºC)
% h
elix
Figure 24. Influence of temperature on R2Aeca depicted as percentage helix. Black =
R2Aecat adsorbed to 9 nm particles Gray = R2Aecat in absence of particle. White =
R2Aecat after the sample had cooled to 25°C again).
A d
again. The measu ation were fully
reversible. This reversibility could make the system useful as a temperature-induced
c
R3Acat showed that the system could
si
egative
si
fter the temperature increasement the sample were cooled to 25 °C and measure
rement revealed that the disruption of the conform
atalyst, if the catalytic activity will diminish as the temperature increases. It would
therefore be interesting to investigate the temperature dependence of the activity.
3.2.2 Total changes in the negative side
Since the results given by R2Aecat and
sustain smaller changes in the negative
de it were interesting to see if it were
possible to alter it more.
As a first approach R2AeK were
synthesized with an increased number of
positive charges located in the n
de compared with the catalytic
peptides. In position 8, 11, 12, 15 and 19
lysine was introduced (fig. 25). Lysine
was chosen over arginine since
COO-
NH3+
Ala1Ala8
Ala15Ala22
Arg2Arg9
Arg16Arg23
Gln3Lys10
Lys17Gln24
Gln4Gln11
Lys18Gln25
Glu7Lys14Lys21Glu28
Arg26Arg19Arg12Arg5
Ala6Ala13Ala20Ala27
Row 1
Row 4Row 7
Row 3
Row 6
Row 2
Row 5
Figure 25. Helical wheel depicting R2AeK.
24

measurement on K2A showed that the side-chain did not have a large effect on the
structural formation. In the case of a pKa decrease it would most probably favour the
formation. If this major change in the peptide would be able to sustain the helical
formation when introduced to the particles it could also be used as a decarboxylation
agent for oxaloacetate[43].
In the design of R2Ae most of the amino acids have a propensity for helixes and to see
h
3.2.3 Characterization of R2AeK and R2AeDN
structure independent of
w
ow a decrease in this propensity would affect the formation, R2AeDN were made. In
this peptide row 1 were filled with aspartic acid and asparagine were inserted in rows 4
and 5. This replacement exchanged the glutamic acid and glutamines residues, both
having high preferences for helixes whereas aspartic acid and asparagine both are
considered to be helix breakers[37].
Introduction of particles to R2AeK showed no changes in the
hich pH or which particle sizes were used (fig. 26 and 27). The probable cause for this
is the lysines which initially will be attracted by the surface making it impossible to form
Figure 26. CD-spectra of R2AeK and R2AeDN in pH 9.0. Black dashed line =
R2AeK in absence of particle. Black line = R2AeK with 9 nm particles. Gray
dashed line = R2AeDN in absence of particles. Gray line = R2AeDN with 9 nm
particles.
R2AeK and R2AeDN pH 9,0
-5
-4,5
-4
-3,5
-3
-2,5
-2
-1,5
-1
-0,5
0
0,5
200 205 210 215 220 225 230 235 240 245 250 255 26
Wavelength (nm)
Delta
Eps
ilon
0
25

a helix. This means that both the arginines and the lysines might be attached to the
surface, which would make the peptide smeared to the particle with both the positive and
the former the negative side. This in turn would make the helical formation impossible.
R2AeDN on the other hand displays a rather fine helical formation upon addition of the
particles in pH 9.8. The degree of helical formation lies in the same vicinity as R2Aecat
and R3Acat, were R2Aecat shown good enough helix formation to enable a catalytic
activity. As for most of the other peptides investigated R2AeDN exhibits a lower degree
of helicity when introduced to the particles at lower pH. At pH 9.8 the percentage of helix
does not change to a higher extent over the different particle sizes. Compared with the
measurements on both 8.4 and 9.0 were helix formation is almost nonexistent, with the
exception of pH 9 when 9 nm particles is added.
Percentage helix of R2AeK and R2AeDN
0
5
10
15
20
25
30
Peptide 6 nm 9 nm 15 nm
% h
elix
Figure 27. Percentage helix for R2AeK and R2AeDN, in absence of particle and with 6,
9 and 15 nm particles. Left black = R2AeK in pH 9.8. Left gray = R2AeK in pH 9.0. Left
white = R2AeK in pH 8.4. Right black = R2AeDN in pH 9.8. Right gray = R2AeDN in pH
9.0. Right white = R2AeDN in pH 8.43
3 R2AeDN precipitate when introduced to 15 nm particles at pH 8.4.
26

3.3 Increasing Hydrophobicity
Alanine have been used in the earlier designs since it has a high helical propensity and a
low hydrophobicity, promoting helical formation and decreasing the risk of getting the
peptides to interact through hydrophobic interactions. As with all other elements, the role
of the alanines was to be investigated and this was done by synthesizing two peptides
with a higher degree of hydrophobicity. The first were synthesized exchanging the
alanines with leucine. Leucine has, as alanine, a high preference for the helix structure
and the exchange would therefore test only the influence of the hydrophobicity. The
peptide, based of R2Ae, called R2AeL where L denotes the exchange of alanine to
leucine. A second peptide, R2AeV, was synthesized with valine placed in the positions
otherwise held by alanine. Valine has a higher preference for the β-sheet structure[37]
compared to helical structures, but is also more hydrophobic than alanine.
3.3.1 Characterization of R2AeL and R2AeV
Mixing R2AeL with 9 nm particles give the CD-spectra of an obvious helix (fig. 28),
R2AeL and R2AeV pH 9,0
-5
-4,5
-4
-3,5
-3
-2,5
-2
-1,5
-1
-0,5
0
0,5
200 205 210 215 220 225 230 235 240 245 250 255 26
Wavelength (nm)
Delta
Eps
ilon
0
Figure 28. CD-spectra of R2AeL and R2AeV in pH 9.0. Black dashed line =
R2AeL in absence of particle. Black line = R2AeL with 9 nm particles. Gray
dashed line = R2AeV in absence of particles. Gray line = R2AeV with 9 nm
particles.
27

compared with the template, R2Ae; it is even better. Analysis of R2AeL at all pH and
with all particles shows that it has good helical content in the whole range. At pH 9.0 it is
has a percentage of helix above 25 with all particle sizes. At pH 8.4, a somewhat lesser
degree of helicity is observed but obvious helixes can bee seen independent of particle
size.
The most promising result is given for R2AeL in pH 9.8 were the percentage helix lies
between 89 and 96, which corresponds to an almost perfect helixes[45]. This shows that
the hydrophobic interactions facilitates the formation of the helix and probably makes the
peptides closely packed on the surface of the particles.
Percentage helix of R2AeL and R2AeV
0
20
40
60
80
100
120
Peptide 6 nm 9 nm 15 nm
% h
elix
Figure 29. Percentage helix for R2AeL and R2AeV, in absence of particle and with 6, 9
and 15 nm particles. Left black = R2AeL in pH 9.8. Left gray = R2AeL in pH 9.0. Left
white = R2AeL in pH 8.4. Right black = R2AeV in pH 9.8. Right gray = R2AeV in pH
9.0. Right white = R2AeV in pH 8.4
The valine containing peptide shows a small conformational change at pH 9.8. At pH
9.0 it has a higher helical content as a peptide in absence of particle than when particles
are added, and is unaffected by the introduction of particles at pH 8.4. Most probably the
chemical nature of valine has a too great influence on the entire chain and therefore the
peptide is almost unaffected by the addition of particles. At pH 9.8, the increased surface
28

charge becomes large enough to compete with the valine making the peptide fold into a
helix, although increase in structure is almost negligible.
By combining the results gained from R2AeL and R2AeV it can be said that increased
hydrophobicity affects the formation in a positive way but that the amino acids propensity
for helix structure plays an important role.
3.4 Peptide length dependence
Variations in the length of a polypeptide chain have a tendency to influence the stability
of a formed helix[40-42], where longer length usually means higher stability. As to see how
different length would affect the system, a peptide twice as long as the template were
synthesized, R2Ae56. This peptide were to contain exactly the same amino acid
composition as the template, but in order to facilitate the SPPS the peptide were divided
in two parts synthesized separately.
The two fragments, A and B, were after synthesis going to be coupled using a Kent
ligation[30]. Part A were synthesized as the first 25 amino acids in the sequence using an
orthogonally protected glutamic acid for the first coupling, this would yield a glutamine
when cleaved from the resin. The orthogonal protective group was removed and the
carboxyl was activated with benzylmercaptan before cleavage. The amino terminal on
part B, containing the remaining amino acids, was left as a free amine. These two
changes from the normal synthetic rout make a Kent ligation possible (fig. 30).
Part A OH
O
Part A S
O
PhHS Ph -S Ph
Part A S
OPh
Part A S
OPart B
NH2
H2N Part B
HS
Part A NH
O
Part B
SH
Figure 30. Schematic picture of the Kent ligation.
29

3.4.1 Characterization of R2Ae56 and its parts
Although the interaction between a longer peptide and the particles were the goal of this
investigation, the two parts used to synthesis it was also investigated as to how they
behaved when introduced to the particles.
CD-measurements revealed that R2Ae56 and both part A, after addition of
benzylmercaptan, and B formed well-defined helixes when introduced to the particles.
R2Ae56 showed a smaller shift in the helical region than expected due to its length, this
might be due just to the length and the influence the curvature of the particles will have
on the helix. The curvature will put a strain on the helical backbone that will deform the
helix. Even though this might have happened, R2Ae56 still showed a higher helical
content than the template R2Ae.
R2Ae56 and part A and B pH 9,0
-8
-7
-6
-5
-4
-3
-2
-1
0
1
200 205 210 215 220 225 230 235 240 245 250 255 260
Wavelength (nm)
Delta
Eps
ilon
Figure 31. CD-spectra of R2Ae56 and part A and B in pH 9.0. Black dashed line =
R2Ae56 in absence of particle. Black line = R2Ae56 with 9 nm particles. Dark gray dashed line = part A in absence of particles. Dark gray line = part A with 9 nm particles. Light gray dashed line = part B in absence of particles. Light gray line = part B with 9
nm particles. Part A shows more helicity than both R2Ae and R2Ae56, although it is shorter. This
might have something to do with the benzyl group attached to the C-terminal as it might
work as a helix inducer or a helix C-capping group[36]. As for most other peptides
30

described part A exhibits higher helical contents at the higher pH, but its noteworthy that
it has as good helical content as R2Ae in pH 8.4.
For part B the high helical content might be due to the extended length factor, as it is
composed of 31 amino acids compared with 28 as the earlier described peptides has been,
and that this length still is short enough to not be to influenced by the curvature. The
helical content for part B is high throughout the pHs, although it is clear that pH 8.4 have
a lesser affect on the formation than the higher pHs. It should be noted that part B have a
free amine in the N-terminal, and even though this is present, the helical formation is not
disturbed. The reason to this is probably the dipole moment produced by the helix that
will decrease the pKa of the amine making it deprotonated and therefore unable to
interact with the surface.
Percentage helix of R2Ae56 and part A and B
0
10
20
30
40
50
60
70
Peptide 6 nm 9 nm 15 nm
% h
elix
Figure 32. Percentage helix for R2Ae56 and part A and B, in absence of particle and
with 6, 9 and 15 nm particles. Left black is omitted due to lack of material. Left gray =
R2Ae56 in pH 9.0. Left white = R2Ae56 in pH 8.4. Middle black = part A in pH 9.8.
Middle gray = part A in pH 9.0. Middle left = part A in pH 8.4. Right black = part B in
pH 9.8. Right gray = part B in pH 9.0. Right white = part B in pH 8.4
31

4 Methods
4.1 Peptide Synthesis
All peptides investigated in this work have been synthesized using solid-phase peptide
synthesis (SPPS). The groundbreaking work of solid-phase synthesis was developed by
Merrifield[48, 49] et al. and is now used in the synthesis of biopolymers, combinatorial
solid-phase organic chemistry, synthesis of natural products, catalyst selection, chemical
ligation and material development[50]. The solid supports are usually polystyrene beads
with a low degree of cross-linking by divinylbenzene, incorporating a linker with one of
many different functional groups used as an anchor for the synthesis. The low cross-
linking used enables the resins to swell which in turn allows the growing peptide chain to
accommodate therein. There are many advantages of solid phase synthesis over the
solution based. 1) high excess of added reagents drives reactions to completion, 2) easy
removal of surplus as well as reaction by-products by washing, 3) negligible loss of
product during synthesis since it is bound to the resin, 4) use of different protection
groups enables for branched peptides and a wide variety of functionalization, 5) the
possibility to make the synthesis automated and thereby decrease manual work.
The increasing interest in peptide chemistry and the use of SPPS forced the
development of protection groups to move from the unpleasant Boc-chemistry, which
utilizes TFA and HF for deprotection respectively cleavage, to the more user friendly
Fmoc-chemistry, where piperidine is used for deprotection and TFA is used to cleave the
peptide from the resin. Since most peptides are synthesized as long chains of unbranched
amide bonds, the use of automation for synthesis is preferred. In this work, peptides have
been synthesized on a PioneerTM Peptide Synthesis System, which is fully automated.
This SPPS-system uses DMF as wash and base-solvent, Fmoc deprotection have been
done with 20% piperidine. Activators for coupling are TBTU and DIPEA.
32

OHOH
CR1
NH
NH
HCR2
O
OOH
CR1
NH
X
H2NHCR2Y
O
OOH
CR1
NH
X
Fmoc NH
HCR2Y
O
Fmoc NH
HCR2Y
OAct O
OHCR1
NH
Fmoc
X
Fmoc NH
HCR2Y
OOH O
OHCR1
NH
Fmoc
X
Activator Piperidine
Activation Deprotection
Coupling
Repeat of deprotectionand coupling cycles
Final deprotection
Cleavage
OHCRn
H2N
Figure 33. Schematic picture of SPPS. R1, R2 and Rn represent the amino acid side-
chains. X, Y and Z represent eventual protection groups.
During the synthesis, amino acids are kept in test tubes placed in an amino acid
dispenser sledge. Before coupling to the resin, the amino acids are pre-activated with
TBTU and DIPEA. Thereafter the activated amino acids are flown past the resin several
times during the coupling cycle. This cycle is followed by a washing cycle to rinse the
resin from unreacted amino acids and the reaction by-products. After wash, there is an
Fmoc deprotection cycle preparing the growing chain to couple the next amino acid.
Unless the newly added amino acid is the last of the sequence in which case one of the
following three termination steps are possible. 1) Fmoc on, leaving the Fmoc group on
33

the chain, 2) Fmoc off, giving a free amine at the N-terminal, or 3) cap on, where the N-
terminal amine is reacted with acetic acid anhydride giving an acetoamide N-terminal.
(Fig. 33)
Before cleavage, the resin is removed from the synthesizer system and washed with
acetic acid, DCM and MeOH, and dried under high vacuum. Depending on the
constituting amino acids, the cleavage cocktail used differs but the main part is TFA. To
prevent that the side-chain protection groups undergoes unwanted side reactions with the
peptide chain, scavengers such as TIS, water and in case the sequence contains cysteine
EDT is added to the cocktail (fig 34). The resin is removed by filtration and washed with
TFA. To ease the precipitation the filtrate TFA is evaporated with N2-gas before cold
ether is added. The precipitate is centrifuged and the ether phase is removed, the peptide
is dissolved in water and lyophilized before purification.
PEG CH2 NH
O(CH2)4 O
OMe
OMe
NH
O HN
OO
ONH
O HN
O
O
OH
TFA
TFA
TFA
Piperidine
Figure 34. The Fmoc-PAL-PEG-PS resin and showing are also the cleavage sites for
piperidine and TFA.
4.2 Circular Dichroism
When one wants to deduce the secondary structure of a peptide there are three different
techniques that precedes all others; X-ray crystallography, nuclear magnetic resonance
(NMR) and circular dichroism (CD). Of these, X-ray crystallography gives the best
results for proteins that can be crystallized, that is not possible with the system
investigated in this thesis. NMR requires high sample concentration; it is time consuming
and sometimes requires isotope labeled nuclei’s (13C, 15N) which is very expensive. CD
measurements are rapid and require small amounts of analyst, which may be recovered
for later use. CD measures the difference in absorption of left and right circularly
polarized light from plane-polarized light. Optically active chromophores make this
34

absorption effect occur when 1) its structure permits it, or 2) if it is covalently coupled to
a chiral center, or 3) it is placed in an asymmetric environment.[51]
180 190 200 210 220 230 240 250
Wavelength (nm)
Del
ta E
psilo
nα-helixβ-sheetRandom coil
Figure 35. Depicting the typical CD-spectrum of the different structures in the far-UV
region.
The spectral range most often used in investigation of peptides and proteins lies
between 180-300 nm. The region below 240 nm is referred to as far-UV and the region
from 260-300 nm is referred to as near-UV. In the far-UV region, information is gained
of the secondary structure of the peptide chain. The different spectra’s obtained in this
region derives from the orientation of the back-bone amide in the different secondary
structures (i.e. α-helix, β-sheet and turn, figure 35) CD makes use of the fact that left and
right polarized light exhibits chirality and by doing that interacts differently with chiral
molecules. The dominating absorption in a CD spectrum in the range of 190-240 nm
derives from the amide bond in the peptide backbone. This adsorption is different for the
different secondary structures.
The values of CD spectroscopy are often given in ellipticity. The ellipticity is calculated
using this formula:
θ = 3298* Δε
35

where Δε is the difference in molar extinction coefficients of right, εR, and left, εL,
polarized light (Δε = εR – εL).
A right-handed α-helix has a distinctive double minimum at 208 and 222 nm. The
minimum at 222 nm is a good measurement of the helical content of a peptide that
contains mostly of helices.
The CD data gathered in this thesis were collected at 0.5 nm intervals with an
integration time of 2 s for the region between ~190-240 nm and with 2 nm intervals
between 240-260 nm. The spectrum represents an average of three consecutive scans and
before summation; the three separate scans were compared to detect possible alterations
of the sample during the scan period.
4.3 Analytical Ultracentrifugation
0
0,1
0,2
0,3
0,4
0,5
0,6
0,7
0,8
6 6,2 6,4 6,6 6,8 7
Radius (cm)
Abso
rban
ce 20001500050000
Figure 36. Schematic picture of concentration gradients at three different rotor
speeds.
The simplest way of describing the principles of analytical ultracentrifugation (AUC) is
to compare it with when sand is dropped into a glass of water. The sand will descend at
different speeds down to the bottom of the glass depending on the relative size and
weight. The same is true for macromolecules and particles although in their cases, an
external force will be needed, and in AUC, this force is the centrifugal. Varying the
36

conditions used in the AUC makes it possible to determine sample purity, molecular
weight, analysis of associating systems, detection of conformational changes but usually
AUC is used for equilibrium sedimentation and velocity sedimentation. In this work
equilibrium sedimentation has been used[52].
The centrifugal force affecting the sample molecules will force them to move towards
the outer wall of the sample compartment. At the same time an opposing, diffusion, force
will retain the molecules in the solution. After some time the two forces will reach
equilibrium, which in turn will reestablish a uniform concentration. By monitoring the
changes in absorbance of the sample the sedimentation rate of the sample can be depicted
as a function of absorbance versus radius (fig. 36) and this can give information of the
above mentioned parameters[53].
In this work rotor speeds between 2500-50000 rpm have been used. Equilibrium was
reached after 20 hours and the sedimentation were monitored at 230, 240 and 280 nm.
The samples had a 1:1 ratio between peptide and particle. The temperature was kept at 20
°C for all experiments
4.4 Silica Nanoparticles
Figure 37. Stability diagram of colloidal silica nanoparticles[44].
37

The silica nanoparticles used as surfaces in these studies were kindly provided by EKA-
Chemicals, Stenungsund, Sweden, as colloidal solutions. The particles are stable in a
narrow pH range from around 7.5 to 10.5 (fig. 37) and in moderate salt concentrations.
The surface charge density of the three particle sizes (6, 9 and 15 nm) used in this thesis
is the same at each pH[54]. At pH 8.4, the surface charge is around 0.5 OHӨ/nm-2, at pH
9.0 around 0.7 OHӨ/nm-2, and at pH 9.8 around 1 OHӨ/nm-2[55].
Silica nanoparticle solutions are transparent and the concentrations used in the CD-
measurements scatters light negligibly[39, 56, 57], making them suitable not only for CD but
also for techniques such as IR and fluorescence.
38

5 Conclusion and future perspectives
This thesis have shown that it is possible to, by rational design, induce a secondary
structure in a polypeptide chain upon binding to an inorganic surface. By controlled
changes in the amino acid sequence, the contributions of the constituting amino acids and
their role in the conformational change have been verified. It has also been shown,
through AUC-measurements and by dialysis, that the peptide adsorbs strongly to the
silica particles used to initiate the induced structure. Furthermore, it has been shown that
the conformational changes are stable in a wide range of pH as well as through a wide
temperature range. As a final test it have been shown that induction of structure in a
peptide can be used to get catalytic activity.
It seems that among the most important factors contributing to induce a helical structure
in a peptide with the use of silica nanoparticles is. A) a large number of arginines placed
close together, B) a higher degree of hydrophobicity and C) the use of amino acids with
high helical propensities.
Although the system has been rather extensively investigated, there are still many
openings for further experiments. For example, one can replace the silicon oxide with
gold nanoparticles functionalized with a negatively charged thiol-containing reagent or
use a macroscopic surface instead of the nanoparticles used herein. It would also be of
great interest to investigate if it is possible to use a current to induce the structure helical
structure in the peptide.
This research will hopefully give us an insight into the interaction between surfaces and
biomolecules, and how this might affect the everyday research in systems related to these
interactions. It might also help us understand the forces driving protein folding.
The ability to make nanostructures on surfaces is extremely important in the ever-
growing field of nanoscience, and with a system like this it could in the future be possible
to use it as an organic memory, were, for example, the random coil represents a 0 and the
helix makes a 1.
39

6 Appendix
Sequences of the peptides described in this thesis. Peptide 1 2 3 4 5 6 7 8 9 10 11 12 13 14 15 16 17 18 19 20 21 22 23 24 25 26 27 28 29 30 31R2A Q A R S T R L D V R N Q R V C I R T Q R L D L R T S R GR1A Q A R Y S N A D A R Q Q N A C A R Y Q N A D A R T S N GR2Ae Y A R Q Q R A E A R Q Q R A E A R Q Q R A E A R Q Q R CR1Ae Y A R Q Q N A E A R Q Q N A H A R Q K N A E A R Q Q N AR2Z R Q Q N A E A N Q Q R A E A R Q Q N A E A N Q Q R A E A RR3A C R A E R R E A R A E R R E A R A E R R E A R A E R R YK2A E A K Q Q K A E A K Q Q K A E A K Q Q K A E A K Q Q K AR2Aecat Y A R Q Q R A E A R Q Q R A H A R Q K R A E A R Q Q R AR3Acat Y R A E R R E A R A E R R H A R A K R R E A R A E R R ER2AeK E A R Q Q R A K A R K K R A K A R Q K R A E A R Q Q R AR2AeDN Y A R N N R A D A R N N R A D A R N N R A D A R N N R AR2AeL Y L R Q Q R L E L R Q Q R L E L R Q Q R L E L R Q Q R LR2AeV Y V R Q Q R V E V R Q Q R V E V R Q Q R V E V R Q Q R VR2Ae56 E A R Q Q R A E A R Q Q R A E A R Q Q R A E A R Q C R A
E A R Q Q R A E A R Q Q R A E A R Q Q R A E A R Q Q R APart A E A R Q Q R A E A R Q Q R A E A R Q Q R A E A R Q*BenzylPart B C R A E A R Q Q R A E A R Q Q R A E A R Q Q R A E A R Q Q R A Percentage helix calculated with K2d[45] for all peptides, particle sizes and
pH.
pH - > 9.8 9.0 8.4Peptide Free peptide 6 nm 9 nm 15 nm Free peptide 6 nm 9 nm 15 nm Free peptide 6 nm 9 nm 15 nmR2A 8 8 8 9 N/A N/A N/A N/A N/A N/A N/A N/AR1A 8 8 8 8 N/A N/A N/A N/A 8 9 9 9R2Ae 7 27 28 29 5 27 27 33 8 34 29 27R1Ae 6 7 7 7 6 8 8 8 8 8 8 9R2Z 7 16 29 9 7 10 22 8 3 15 9 18R3A 5 30 34 13 4 83 73 32 7 29 29 29K2A 6 37 29 27 8 9 12 13 7 7 8 8R2Aecat 8 27 26 34 7 22 20 32 9 25 24 14R3Acat 8 27 25 23 7 21 23 20 7 27 28 9R2AeK 8 9 8 9 8 8 8 8 8 8 9 9R2AeDN 7 26 24 22 8 9 27 10 8 8 8 5R2AeL 27 92 89 96 8 27 29 30 7 26 24 25R2AeV 19 28 28 28 12 8 8 9 7 7 7 9R2Ae56 N/A N/A N/A N/A 7 38 33 31 8 23 20 15Part A 3 59 60 54 1 58 62 50 1 28 29 28Part B 7 56 56 57 5 46 41 61 6 28 28 28
40
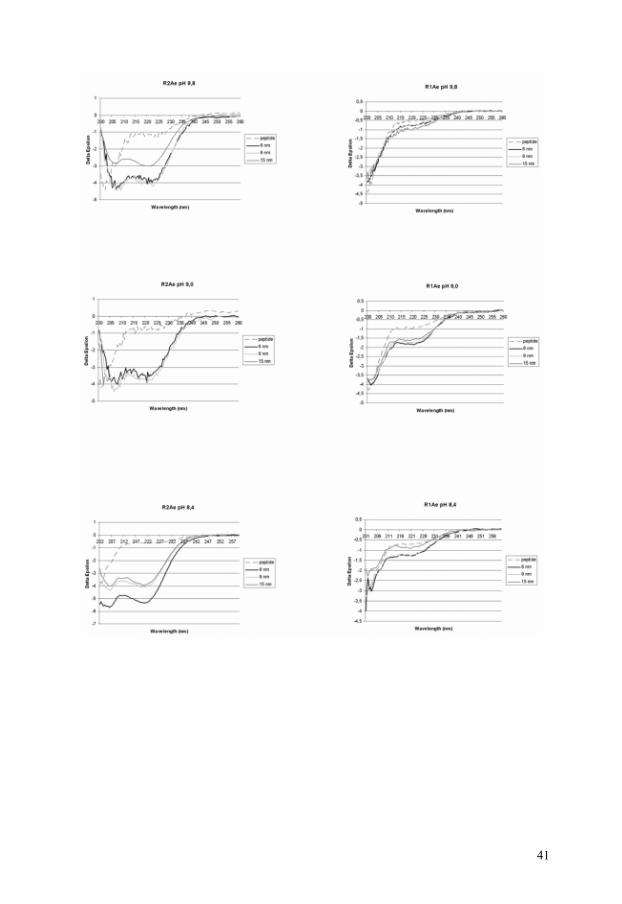
41
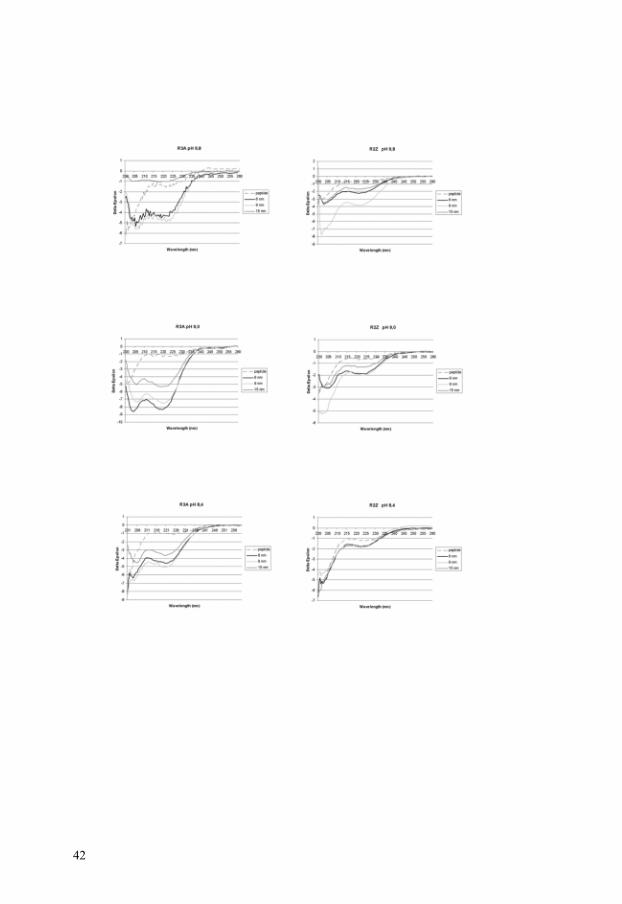
42

43

44

45

46

47

7 References
[1] A. L. Hook, H. Thissen, J. P. Hayes, N. H. Voelcker, Biosensors & Bioelectronics 2006, 21, 2137.
[2] M. Steukers, J.-M. Schaus, R. van Gool, A. Hoyoux, P. Richalet, D. J. Sexton, A. E. Nixon, M. Vanhove, Journal of Immunological Methods 2006, 310, 126.
[3] S. J. Van Laere, G. G. Van den Eynden, I. Van der Auwera, M. Vandengerghe, P. van Dam, E. A. Van Marck, K. L. van Golen, P. B. Vermulen, L. Y. Dirix, Breast Cancer Research and Treatment 2006, 95, 243.
[4] D.-P. Tang, R. Yuan, Y.-Q. Chai, Bioprocess and Biosystems Engineering 2006, 28, 315.
[5] M. Zhao, C. Jiang, S. Li, S. X. Mao, Materials Science and Engineering A 2005, 409, 223.
[6] W. C. Lee, Y. J. Lee, Y. D. Wu, P. Chang, Y. L. Huang, Y. L. Hsu, J. P. Mannaerts, R. L. Lo, F. R. Chen, S. Maikap, L. S. Lee, W. Y. Hsieh, M. J. Tsai, S. Y. Lin, T. Gustffson, M. Hong, J. Kwo, Journal of Crystal Growth 2005, 278, 619.
[7] F. C. M. J. M. van Delft, F. C. van den Heuvel, A. E. T. Kuiper, P. C. Thune, J. W. Niemantsverdriet, Microelectronic Engineering 2004, 73-74, 202.
[8] M. Peter, X. M. Li, J. Huskens, D. N. Reinhoudt, Journal of the American Chemical Society 2004, 126, 11684.
[9] C. R. Lowe, Current Opinion in Structural Biology 2000, 10, 428. [10] A. R. Statz, R. J. Meagher, A. E. Barron, P. B. Messersmith, Journal of the
American Chemical Society 2005, 127, 7972. [11] C. S. Gudipati, J. A. Finlay, J. A. Callow, M. E. Callow, K. L. Wooley, Langmuir
2005, 21, 3044. [12] M. Sjögren, U. Göransson, A.-L. Johnson, M. Dahlström, R. Andersson, J.
Bergman, P. R. Jonsson, L. Bohlin, Journal of Natural Products 2004, 67, 368. [13] A. M. Travaille, L. Kaptijn, P. Verwer, B. Hulsken, J. A. A. W. Elemans, R. J. M.
Nolte, H. van Kempen, Journal of the American Chemical Society 2003, 125, 11571.
[14] M. Ostblom, R. Valiokas, P. Konradsson, S. C. T. Svensson, B. Liedberg, M. Garrett, D. L. Allara, Journal of Physical Chemistry B 2006, 110, 1830.
[15] M. Hederos, P. Konradsson, A. Borgh, B. Liedberg, Journal of Physical Chemistry B 2005, 109, 15849.
[16] A. K. Mahapatro, A. Scott, A. Manning, D. B. Janes, Applied Physics Letters 2006, 88.
[17] N. Neel, J. Kroger, R. Berndt, Applied Physics Letters 2006, 88. [18] G. Oskam, Journal of Sol-Gel Science and Technology 2006, 37, 161. [19] Y. F. Gao, A. Nagai, Y. Masuda, F. Sato, W. S. Seo, K. Koumoto, Langmuir
2006, 22, 3521. [20] M. Beyer, T. Felgenhauer, F. R. Bischoff, F. Breitling, V. Stadler, Biomaterials
2006, 27, 3505. [21] S. Sarkar, S. Sampath, Langmuir 2006, 22, 3396. [22] R. M. Petoral, K. Wermelin, E. Dahlstedt, J. Hellberg, K. Uvdal, Journal of
Colloid and Interface Science 2005, 287, 388. [23] R. Ziblat, V. Lirtsman, D. Davidov, B. Aroeti, Biophysical Journal 2006, 90,
2592.
48

[24] A. Erbe, K. Tauer, R. Sigel, Physical Review E 2006, 73. [25] A. Ramanaviciene, W. Schuhmann, A. Ramanavicius, Colloids and Surfaces B-
Biointerfaces 2006, 48, 159. [26] W. Lee, M. Hara, H. Lee, Materials Science & Engineering C-Biomimetic and
Supramolecular Systems 2004, 24, 315. [27] M. Hino, M. Kurashige, H. Matsuhashi, K. Arata, Thermochimica Acta 2006, 441,
35. [28] C. Bresson, M. J. Menu, M. Dartiguenave, Y. Dartiguenave, Journal of
Environmental Monitoring 2000, 2, 240. [29] A. Hunding, F. Kepes, D. Lancet, A. Minsky, V. Norris, D. Raine, K. Sriram, R.
Root-Bernstein, Bioessays 2006, 28, 399. [30] G. G. Kochendoerfer, S.-Y. Chen, F. Mao, S. Cressman, S. Traviglia, H. Shao, C.
L. Hunter, D. W. Low, E. N. Cagle, M. Carnevali, V. Gueriguian, P. J. Keogh, H. Porter, S. M. Stratton, M. C. Wiedeke, J. Wilken, J. Tang, J. J. Levy, L. P. Miranda, M. M. Crnogorac, S. Kalbag, P. Botti, J. Schindler-Horvat, L. Savatski, J. W. Adamson, A. Kung, S. B. H. Kent, J. A. Bradburne, Science 2003, 299, 884.
[31] M. B. Ström, Ö. Rekdal, J. S. Svendsen, Journal of Peptide Science 2002, 8, 431. [32] K. Broo, L. Brive, A.-C. Lundh, P. Ahlberg, L. Baltzer, Journal of the American
Chemical Society 1996, 118, 8172. [33] K. Enander, G. T. Dolphin, L. Baltzer, Journal of the American Chemical Society
2004, 128, 4464. [34] S. Yao, I. Ghosh, R. Zutshi, J. Chmielewski, Angewandte Chemie International
Edition 1998, 37, 478. [35] J. Venkatraman, S. C. Shankaramma, P. Balaram, Chemical Reviews 2001, 101,
3131. [36] C. A. Rohl, R. L. Baldwin, Methods in Enzymology 1998, 295, 1. [37] P. Y. Chou, G. D. Fasman, Biochemistry 1974, 13, 211. [38] S. H. Mollmann, L. Jorgensen, J. T. Bukrinsky, U. Elofsson, W. Norde, S.
Frokjaer, European Journal of Pharmaceutical Sciences 2006, 27, 194. [39] W. Norde, J. P. Favier, Colloids and Surfaces 1992, 64, 87. [40] T. Wang, Y. Zhu, Z. Getahun, D. Du, C.-Y. Huang, W. F. DeGrado, F. Gai,
Journal of Physical Chemistry, B 2004, 108, 15301. [41] J. M. Scholtz, D. Barrick, E. J. York, J. M. Stewart, R. L. Baldwin, Proceedings
of the National Academy of Sciences of the United States of America 1995, 92, 185.
[42] D. K. Graff, B. Pastrana-Rios, S. Y. Venyaminov, F. G. Prendergast, Journal of the American Chemical Society 1997, 119, 11282.
[43] K. Johnsson, R. K. Allemann, H. Widmer, S. A. Benner, Nature 1993, 365, 530. [44] www.ekachemicals.se. [45] www.embl-heidelberg.de/~andrade/k2d.html. [46] L. Baltzer, A. C. Lundh, K. Broo, S. Olofsson, P. Ahlberg, Journal of the
Chemical Society-Perkin Transactions 2 1996, 1671. [47] L. K. Andersson, G. T. Dolphin, L. Baltzer, Chembiochem 2002, 3, 741. [48] R. B. Merrifield, Journal of the American Chemical Society 1963, 85, 2149. [49] R. B. Merrifield, Science 1965, 150, 178. [50] G. R. Marshall, Journal of Peptide Science 2003, 9, 534. [51] S. M. Kelly, N. C. Price, Current Protein and Peptide Science 2000, 1, 349. [52] J. W. McBain, Chemical Reviews 1939, 24, 289. [53] G. Ralston, Introduction to Analytical Ultracentrifugation, Beckman, Fullerton,
1993.
49

[54] M. Lundqvist, Linköping (Linköping), 2005. [55] R. K. Iler, The Chemistry of Silica, Vol. 1, Wiley, New York, 1979. [56] A. Kondo, S. Oku, K. Higashitani, Journal of Colloid and Interface Science 1991,
143, 214. [57] S. R. Clark, P. Billsten, H. Elwing, Colloids and Surfaces B - Biointerfaces 1994,
2, 457.
50

8 Acknowledgements
I would like to thank some folks how in one way or the other contributed a lot to the
work presented in this thesis.
Bosse, Klas and Nalle, my three supervisors, for the trust they had in me and for all
encouragement, help and discussions, I have learned a lot.
Martin Lundqvist, for discussions, help, coffee, whiskey and all the wonderful results
we have produced together.
My diploma workers, Lan, Leffe and Irina for the work they contributed with to make
my burden a bit lighter.
A special thanks to Jonas Carlsson for the pictures on the random coil and α-helix.
Finally, I would like to thank all the people that I have worked, talked, had a drink,
eaten, been to concert, traveled, or done something else with that have made my time as a
student at this university a good one. You know who you are.
51


Paper 1
Induction of Structure and Chemical Functionality in a de novo
Designed Peptide upon Adsorption to a Silica Nanoparticle
Martin Lundqvist, Patrik Nygren, Bengt-Harald Jonsson and Klas Broo
Submitted to Angewandte Chemie International Edition


1
Induction of Structure and Chemical Functionality in a de novo Designed Peptide upon Adsorption to a Silica Nanoparticle.
Martin Lundqvista#, Patrik Nygrena#, Bengt-Harald Jonssona* and Klas Broob,c*
aDivision of Molecular Biotechnology, IFM, Linköping University, SE-58183
Linköping, Sweden
bDivision of Applied Optics, IFM, Linköping University, SE-58183 Linköping, Sweden
cDepartment of Occupational and Environmental Medicine, Sahlgrenska Academy at
Göteborg University, Göteborg, Sweden
#These authors contributed equally to this work
The ability to regulate biological processes is essential for cellular homeostasis, and
regulation at the molecular level is often performed by controlling the function of
proteins. Efficient use of proteins and peptides in industrial processes and
diagnostic tools also requires means to induce and maintain their functional
conformations. Interestingly, the current discussion1 on the origin of life have
highlighted that reactions such as vesicle creation2 and peptide formation3,4 are
promoted by clay particles. In this context it is interesting to investigate if silica
(which is a main constituent of most clay surfaces) could have a role to induce
functional conformations of peptides. In this study we present a novel approach in
which adsorption to silica nanoparticles are used to induce a well-defined structure
in a designed peptide. The ability to generate stable well-defined structures on
surfaces open up possibilities to create closely regulated systems with a variety of
potential functionalities, which we demonstrate by introduction of a catalytic site.
Introduction of functionality into designed peptides have earlier been achieved by
Benner and co-workers5 who constructed an efficient oxaloacetate decarboxylase
and by Ghadiri and co-workers6,7 who constructed a self replicating peptide and

2
an efficient catalytic synthetic peptide ligase. Chmielewski and co-workers has
designed a replicating peptide system in which the reactivity is under control of pH
or salt8,9. An additional background for our approach is the observation that DNA
recognition modules like the basic region leucine zipper is unfolded in solution but
adopt a stable ordered conformation upon interaction with DNA10-12. DeGrado and
co-workers13 analysed the leucine zipper proteins and found fundamental
principles for design of peptides that adopt helical structure upon interaction with
recognition sites in DNA. One important factor for induction of helical structure is
charge-charge interaction between basic residues and negative charges (phosphate
groups) on DNA. Thus, it should be possible to induce helical structure in a
designed peptide, which contains a motif of basic residues by providing a surface
with appropriately spaced negative charges. From these considerations a peptide
was constructed using de novo design, which would be unstructured in solution,
but “forced” to adopt a well-defined helical structure upon adsorption to silica
nanoparticles. In addition, the design included precisely placed amino acids,
intended to form a functional catalytic site14 upon folding of the helix on the
surface of the nanoparticles. To ensure that the induction of structure by
interaction with silica nanoparticles will have switch-like properties it is essential
to incorporate a combination of positive and negative design elements, i.e. the
design should strongly favour formation of helical structure upon binding to the
nanoparticles and strongly disfavour an ordered structure in solution. For this
reason we decided to use electrostatic interactions as the structure-determining
factor. This letter focuses on the interactions between a silica nanoparticle and a
peptide with two rows of positively charged side chains and residues that can form
a reactive site (figure 1).
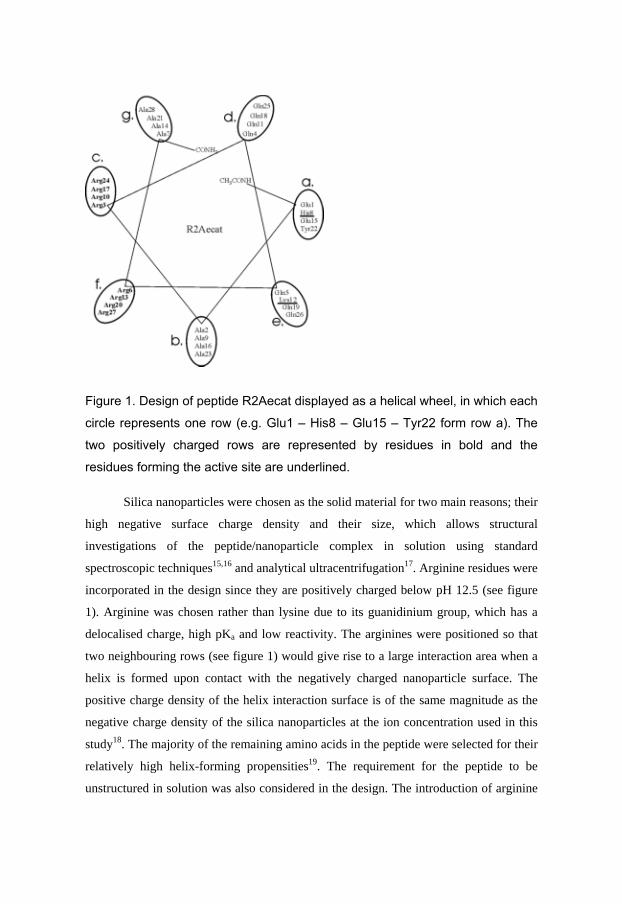
3
Figure 1. Design of peptide R2Aecat displayed as a helical wheel, in which each
circle represents one row (e.g. Glu1 – His8 – Glu15 – Tyr22 form row a). The
two positively charged rows are represented by residues in bold and the
residues forming the active site are underlined.
Silica nanoparticles were chosen as the solid material for two main reasons; their
high negative surface charge density and their size, which allows structural
investigations of the peptide/nanoparticle complex in solution using standard
spectroscopic techniques15,16 and analytical ultracentrifugation17. Arginine residues were
incorporated in the design since they are positively charged below pH 12.5 (see figure
1). Arginine was chosen rather than lysine due to its guanidinium group, which has a
delocalised charge, high pKa and low reactivity. The arginines were positioned so that
two neighbouring rows (see figure 1) would give rise to a large interaction area when a
helix is formed upon contact with the negatively charged nanoparticle surface. The
positive charge density of the helix interaction surface is of the same magnitude as the
negative charge density of the silica nanoparticles at the ion concentration used in this
study18. The majority of the remaining amino acids in the peptide were selected for their
relatively high helix-forming propensities19. The requirement for the peptide to be
unstructured in solution was also considered in the design. The introduction of arginine

4
side chains at positions c and f should efficiently prevent helix formation in solution
because of the strong electrostatic repulsion between them, i.e. in solution the arginine
residues tend to elongate the peptide. Lys10 and His14 (see figure 1) were also included
in the sequence, in order to introduce a reactive site for ester hydrolysis upon induction
of helical structure14.
Figure 2. Sedimentation equilibrium analysis of R2Aecat by ultracentrifugation
monitored at A280 (a) without and (b) with 9 nm silica particles at pH 9. The
colours represent different rotor speeds (rpm).
To determine the aggregation states of the free peptide in solution and its binding
to the nanoparticles, sedimentation equilibrium experiments using analytical
ultracentrifugation were conducted. The data in figure 2b show that a mixture of peptide
and particles sediment between 2500-8000 rpm, i.e. all peptide molecules binds to the
particles. The nanoparticles used in this study have a particle weight of ~425 kDa and
sediment completely at 8000 rpm as previously shown17. In the absence of particles the
peptide does not sediment at these rotor speeds, i.e. the peptide does not form large
aggregates in solution (figure 2 a)). Additional sedimentation equilibrium experiments

5
at higher rotor speeds indicated that the peptide behaves as a monomer in solution (data
not shown).
In additional experiments a sample of peptide-particles was dialysed against a
1000-fold excess of sample buffer for 1 hour before the sedimentation equilibrium
experiments were started. The results were undistinguishable from those shown in
figure 2b, i.e. virtually all peptide molecules were still bound to the nanoparticles after 1
hour of dialysis. An experiment on a peptide-particle sample which was acidified to
pH~2 by addition of HCl gave indistinguishable results from those in figure 2a, i.e. all
peptides dissociated from the particles at low pH because the silica nanoparticles are
near neutral at this pH. The results indicate that the interaction between the peptide and
particles at high pH is dominated by electrostatic interactions.
In order to determine the extent of the secondary structure formation, samples of
free peptide and peptide bound to the nanoparticles were analyzed by far-UV circular
dichroism (CD). The small diameter (9 nm) of the silica nanoparticles allows UV-light
to penetrate the sample without scattering and therefore conventional light spectroscopy
can be used to characterize these systems20-22. As illustrated in figure 3a the CD signals
indicate that the free peptide in solution has no defined secondary structure, irrespective
of the pH used in this study (pH 7.9 – 9.8). However, addition of nanoparticles to the
solution gave rise to a CD spectrum that is typical of helical conformation (figure 3a)
i.e. the nanoparticles induced formation of helical structure upon interaction with the
peptide. There was a clear correlation between the amount of induced secondary
structure in the peptide and the pH of the solution (figure 3b).

6
Figure 3. (a): CD-data for R2Aecat at pH 9.0. Black = peptide and red = peptide
with 9 nm particles. (b): CD-data for R2Aecat at pH 7.9, 9.0 and 9.8 with 9 nm
silica particles. Blue = pH 9.8, red = pH 9.0 and green = pH 7.9. (c):
Temperature melting of Peptide 7 adsorbed to 9 nm particles (■) (the ♦
represent the observed CD value after the sample cooled down to 25°C again).
The nanoparticles induce more secondary structure at higher pH, probably because the
density of negative charges on the surface is increased by raising the pH18. The results
of temperature melting experiments (figure 3c) clearly suggest that the helical structure
content decreases gradually (non-cooperatively) upon increasing the temperature from

7
25 to 85°C. The data also reveal that the temperature-dependent structural change is
fully reversible, i.e. when the sample has cooled down to 25°C the original amount of
helix is observed in the sample.
The design of the peptide included introduction of a histidine-lysine pair that
would form a catalytic unit for ester hydrolysis, provided that the peptide becomes
helical. Thus, a strong proof of a successful design would be a significant rate
enhancement in ester hydrolysis in samples containing both peptide and nano particles.
Experiments in which the peptide or the nanoparticles was dissolved in buffer showed
no detectable rate enhancement over the background reaction in buffer alone. Notably,
samples containing the peptide-nanoparticle complex show a dramatically higher
catalytic efficiency. The activity of 0.1 mM R2Aecat in the presence of nanoparticles is
ten times higher than the background autocatalysis in the phosphate buffer23. Clearly,
the nanoparticles can be used as an efficient switch to turning on catalysis.
Figure 4. Ester bond hydrolysis by: the peptide-nanoparticle complex in buffer
(◊); peptide in buffer (▲); nanoparticles in buffer (■); buffer (♦). The reaction
product m-nitrophenol was monitored at A357.6.
The results of the experiments collectively show that the designed peptide adsorbs
efficiently and binds strongly to silica nanoparticles, and that it adopts a defined helical
structure upon binding. Moreover, the design strategy also successfully incorporated the
planned functional properties since the observed catalysis of ester hydrolysis shows that
the formation of a helix leads to a functional catalytic unit that is oriented away from the
surface of the nanoparticles so that catalysis can proceed unhindered.

8
The described method has potential use in the creation of novel recognition
elements and catalysts that can be switched on by the introduction of nanoparticles. By
adjusting the design it might be possible to construct a two-state system (helix/random
coil) with high cooperativity which would allow the activity to be switched on and off
by small changes in temperature.
The ability to create surfaces with well-defined properties (such as chemical
reactivity’s arranged at predetermined distances on the nanometer scale) would have
several important applications in areas such as bio-catalysis, bio-sensing and nano-
technology.
Moreover, the results might support the idea that inorganic clays played an
important part of the pre-biotic chemistry that lead to the origin of life.
Methods
CD-experiments. CD spectra were recorded using a CD6 spectrodichrograph
(Jobin-Yvon Instruments SA, Longjumeau, France), employing constant N2 flushing.
The instrument was calibrated with an aqueous solution of d10-(+)-camphorsulfonic
acid. The samples consisted of ~ 0.1 mM peptide with 9 nm silica particles added to a
1:0.25 peptide:nanoparticle ratio. The data were collected at 0.5 nm intervals with an
integration time of 2 s for the region between 185-240 nm and with 2 nm intervals
between 240-260 nm using a 0.01 cm quartz cell. Each spectrum represented an average
of three consecutive scans and before summation the three separate scans were
compared to detect possible alterations in the sample during the scan period. The
peptide spectra were corrected by subtracting the spectrum of a reference solution that
lacked the peptide but was otherwise identical.
Analytical Ultracentrifugation. All ultracentrifugation experiments were
performed using a Beckman Coulter Optima XL-I Analytical ultracentrifuge equipped
with an An-50 Ti Rotor and six-sector cells. The sedimentation equilibrium experiments

9
were conducted using rotor speeds between 2500-8000 rpm. Equilibrium at each rotor
speed was reached after 20 hours. The sedimentation was monitored by measuring the
absorbance at 280 nm. The samples were the same as those used in the CD analysis. For
the peptide samples the reference solution was pure buffer. For samples containing both
peptide and particles the reference solution was identical except that the peptide was
omitted. The temperature was kept at 22 °C for all experiments. The sedimentation
properties were analyzed using the self-association model in the Beckman software
package.
Kinetic measurements. Esterase activity was measured using 4-sulfamoyl-
benzoylamino)-acetic acid 3-nitro-phenyl-ester (mNPS) as substrate, following the
reaction at the isobestic point for m-nitrophenol, 357.6 nm.
Peptide synthesis and purification. The peptides were synthesised using an
Applied Biosystems Pioneer™ Peptide Synthesis System and fmoc protection group
chemistry. Fmoc-PAL-PEG-PS was used as the solid support, and was purchased from
Applied Biosystems. All amino acids were in their natural conformation, and purchased
from Nova Biochem. Each coupling cycle was set to 2 hours, and both the N- and C-
termini were capped. The peptides were then purified using reverse phase HPLC
(Varian ProStar Solvent Delivery Module) with a UV-detector (Varian ProStar PDA
Detector) at 230 nm, using a C18 column and going from 14-17, 2% ACN in H2O
acidified with 0.1% TFA. The purity of the peptides was monitored using MALDI
(PerSeptive Biosystems Voyager - DE™ STR BioSpectrometry™ Workstation).
Acknowledgment
The silica particles were kindly provided by EKA-Chemicals, Stenungsund, Sweden. This work was
supported by a grant from the Swedish National Science Research Council to B-H. J. (K5104-5999) and
to K. B. for financial support from Knut and Alice Wallenberg Foundation.

10
References
*Correspondence and requests for materials should be addressed to B-H. J. (e-mail: [email protected]) or
K.B. (e-mail: [email protected]).
1. Russell, M. J. The importance of being alkaline. Science 302, 580-581 (2003).
2. Hanczyc, M. M., Fujikawa, S. M. & Szostak, J. W. Experimental models of primitive cellular
compartments: Encapsulation, growth, and division. Science 302, 618-622 (2003).
3. Huber, C. & Wachtershauser, G. Peptides by activation of amino acids with CO on (Ni,Fe)S
surfaces: Implications for the origin of life. Science 281, 670-672 (1998).
4. Huber, C., Eisenreich, W., Hecht, S. & Wachtershausher, G. A possible primordial peptide
cycle. Science 301, 938-940 (2003).
5. Johnsson, K., Allemann, R. K., Widmer, H. & Benner, S. A. Synthesis, Structure and Activity of
Artificial, Rationally Designed Catalytic Polypeptides. Nature 365, 530-532 (1993).
6. Severin, K., Lee, D. H., Kennan, A. J. & Ghadiri, M. R. A synthetic peptide ligase. Nature 389,
706-709 (1997).
7. Lee, D. H., Granja, J. R., Martinez, J. A., Severin, K. & Ghadiri, M. R. A self-replicating
peptide. Nature 382, 525-528 (1996).
8. Yao, S., Ghosh, I., Zutshi, R. & Chmielewski, J. A self-replicating peptide under ionic control.
Angewandte Chemie-International Edition 37, 478-481 (1998).
9. Yao, S., Ghosh, I., Zutshi, R. & Chmielewski, J. Selective amplification by auto- and cross-
catalysis in a replicating peptide system. Nature 396, 447-450 (1998).
10. Patel, L., Abate, C. & Curran, T. Altered Protein Conformation on DNA-Binding by Fos and
Jun. Nature 347, 572-575 (1990).
11. Talanian, R. V., McKnight, C. J. & Kim, P. S. Sequence-Specific DNA-Binding by a Short
Peptide Dimer. Science 249, 769-771 (1990).

11
12. Weiss, M. A. et al. Folding Transition in the DNA-Binding Domain of Gcn4 on Specific Binding
to DNA. Nature 347, 575-578 (1990).
13. O'Neil, K. T., Hoess, R. H. & Degrado, W. F. Design of DNA-Binding Peptides Based on the
Leucine Zipper Motif. Science 249, 774-778 (1990).
14. Broo, K., Brive, L., Lundh, A. C., Ahlberg, P. & Baltzer, L. The mechanism of self-catalyzed
site-selective functionalization of a designed helix-loop-helix motif. Journal of the American
Chemical Society 118, 8172-8173 (1996).
15. Billsten, P., Freskgård, P. O., Carlsson, U., Jonsson, B. H. & Elwing, H. Adsorption to silica
nanoparticles of human carbonic anhydrase II and truncated forms induce a molten-globule-like
structure. FEBS Letters 402, 67-72 (1997).
16. Karlsson, M., Mårtensson, L. G., Jonsson, B. H. & Carlsson, U. Adsorption of human carbonic
anhydrase II variants to silica nanoparticles occur stepwise: Binding is followed by successive
conformational changes to a molten-globule-like state. Langmuir 16, 8470-8479 (2000).
17. Lundqvist, M., Sethson, I. & Jonsson, B. H. Protein adsorption onto silica nanoparticles:
conformational changes depend on the particles' curvature and protein stability. Langmuir 20,
10639-10647 (2004).
18. Sonnefeld, J. Determination of surface charge density constants for spherical silica particles
using a linear transformation. Journal of Colloid and Interface Science 183, 597-599 (1996).
19. Anthonycahill, S. J. et al. Molecular characterization of helix-loop-helix peptides. Science 255,
979-983 (1992).
20. Kondo, A., Oku, S. & Higashitani, K. Structural-changes in protein molecules adsorbed on
ultrafine silica particles. Journal of Colloid and Interface Science 143, 214-221 (1991).
21. Norde, W. & Favier, J. P. Structure of adsorbed and desorbed proteins. Colloids and Surfaces
64, 87-93 (1992).
22. Clark, S. R., Billsten, P. & Elwing, H. A fluorescence technique for investigating protein
adsorption phenomena at a colloidal silica surface. Colloids and Surfaces B: Biointerfaces 2,
457-461 (1994).
23. The test substrate, (4-sulfamoyl-benzoylamino)-acetic acid 3-nitro-phenyl-ester (mNPS), was
selected because of the leaving group properties of m-nitrophenol and the fact that the hydrolysis
of the ester can be easily monitored using UV-spectrometry. Due to base catalysis at the high pH
it is not possible to detect a small contribution of the imidazole moiety to the overall reaction

12
rate in the particle-free peptide solution. Thus the rate enhancement upon formation of a peptide-
nanoparticle complex is probably much higher than the observed ten fold increase over the
autocatalysis in phosphate buffer. No acetylation of the lysine residue could be detected by
MALDI-MS.

Paper 2
Optimizing Surface Induced Helical Structure in a De Novo Designed Peptide
by Rational Changes in Amino Acid Sequence
Patrik Nygren, Martin Lundqvist, Klas Broo and Bengt-Harald Jonnsson
In manuscript.


Optimizing Nanoparticle Induced Helical Structure in a
De Novo Designed Peptide by Rational Changes in
Amino Acid Sequence
Patrik Nygren†, Martin Lundqvist†, Klas Broo‡1, Bengt-Harald Jonsson†2
†Division of Molecular Biotechnology, IFM, Linköping University, SE-58183 Linköping, Sweden
‡Department of Occupational and Environmental Medicine, Sahlgrenska Academy at Göteborg
University, Göteborg, Sweden
EMAIL: K.B.1 [email protected] or B-J.H.2 [email protected]
1

Introduction
Efficient use of proteins and peptides in medical therapy, industrial processes and as diagnostic tools
requires means to maintain or induce their functional conformations. In this context, it is fundamental to
use carrier systems that allow for easy handling, and contribute to robustness and high stability.
Nanoparticles of silica are attractive candidates as carriers of functional proteins or peptides because of
their high stability and the ease of handling. However, it is well known that proteins tend to deform
upon binding to silica. Notably the distribution of charges on natural proteins is not optimized for “lock
and key “fit with the negative charges on the surface of silica. Hence, charged surfaces tend to deform
the proteins upon binding and consequently the biological functions of the proteins are often abolished
or their efficiency is lowered. In a previous study, we have shown that it is possible to consider the
charge distribution on the silica surface and design peptides that interact favourably with these charges,
so that peptide adsorption to silica nanoparticles induced a well-defined structure. The ability to
generate stable well-defined structures on surfaces of nanoparticles also opened up the possibility to
create closely regulated systems with a variety of potential functionalities, which was demonstrated by
introduction of a catalytic site in one of the peptides. In that study a peptide was constructed using de
novo design, which was unstructured in solution, but was “forced” to adopt a well-defined helical
structure upon adsorption to silica nanoparticles. To ensure that it is the binding to the silica
nanoparticles that causes the formation of helical structure (allowing regulation by adsorption to the
nanoparticles) it is essential to incorporate a combination of positive and negative design elements, i.e.
the design should strongly favour formation of helical structure upon binding to the nanoparticles and
strongly disfavour an ordered structure in solution. The electrostatic interactions (repulsive and
attractive) are important for both positive and negative design. In the present study, we optimize the
properties of the peptide-nanoparticle system by a systematic variation of the design parameters. Thus,
we have synthesized peptides to investigate the effects of: i. density of positive charges ii. spatial
distribution of positive charges iii. the distribution of positive and negative charges for orientation of the
helix on the surface iv. the role of amino acid helix propensities v. the role of altering the size of the
hydrophobic residues vi. the role of peptide length. In addition, we have investigated the dependence of
pH and the effect of altering the surface curvature of the nanoparticle by using particles with 6, 9, and
15 nm diameters.
2

Experimental Section
Chemicals. Fmoc-Ala-OH, Fmoc-Arg(Pbf)-OH, Fmoc-Asp(OtBu)-OH, Fmoc-Asn(Trt)-OH, Fmoc-
Cys(Trt)-OH, Fmoc-Gln(Trt)-OH, Fmoc-Glu(OH)-OAl, Fmoc-Glu(OtBu)-OH, Fmoc-His(Trt)-OH,
Fmoc-Leu-OH, Fmoc-Lys(Boc)-OH, Fmoc-Tyr(tBu)-OH and Fmoc-Val-OH were purchased from
Novabiochem. 20% piperidine in N,N-dimethylformamide (DMF), Fmoc-PAL-PEG-PS and
diisopropylethylamine (DIPEA) were purchased from Applied Biosystems. O-Benzotriazol-1-yl-
N,N,N’,N’-tetramethyluronium tetrafluoroborate (TBTU) were purchased from Alexis. DMF and
methanol were purchased from VWR. Acetonitrile (ACN), Trifluoroacetic acid (TFA),
triisopropylsilane (TIS), acetic acid anhydride (Ac2O), 1-(3-Dimethylaminopropyl)-3-ethylcarbodiimide
hydrochloride (EDC), guanidinum hydrochloride, sodium phosphate, disodium phosphate, thiophenol,
diethyl ether and ethanedithiol (EDT) were purchased from Sigma-Aldrich. 1-Hydroxybenzotriazole
was purchased from Peptide Industries Inc.
Peptide synthesis. All peptides were synthesized on a PioneerTM Peptide Synthesis System and
purified on a C8 reversed-phase HPLC Dynamax® Solvent Delivery System Model SD-1 with a
Dynamax® Absorbance Detector Model UV-1.
All peptides were synthesized using 2 hour coupling cycles without monitor wash. Activators in all
couplings were TBTU 0,5 M and DIPEA 1 M except for the eventual final capping where 0,3 M Ac2O
were used. Peptide 10 lacks final capping thus having a free amine N-terminal. All peptides were
synthesized on a resin yielding a C-terminal amide. In the case of Peptide 9 the C-terminal glutamic acid
were orthogonally allyl protected and thus yielding a glutamine after cleavage.
The peptides were cleaved using TFA/TIS/H2O/EDT (94/2,5/2,5/1), or in case they did not contain a
cystein TFA/TIS/H2O (95/2,5/2,5)1. Cleaved peptides were precipitated with -20ºC diethyl ether,
dissolved in water and lyophilized to be purification by HPLC. The purity of the peptide was confirmed
by MALDI (PerSeptive Biosystems Voyager – DETM STR BioSpectrometryTM Workstation).
Peptide 10 was made by coupling two peptide fragments, part A and B, in a Kent ligation. Part A was
activated with a thiobenzyl at the C-terminal and was the first 25 amino acids of peptide 10. Whereas
part B, with a total length of 31 amino acids, had a free N-terminal cysteine. The C-terminal Glu(OAl)
allyl protection group on part A was selectively removed using 3 equivalents
tetrakis(triphenylphosphine)palladium(0) in CHCl3/AcOH/NMM (37/2/1). After de-protection the
terminal carboxylic acid were treated with EDC/HOBt and thereafter reacted with benzylmercaptan
before cleavage from the resin. Part A and B were dissolved in 0,1 M phosphate buffer, pH 6,3,
containing 6 M guanidinium hydrochloride and an excess of thiophenol was added. Peptide 10 was then
purified as described above.
CD-experiments. CD spectra were recorded using a CD6 spectrodichrograph (Jobin-Yvon
3

Instruments SA, Longjumeau, France), employing constant N2 flushing. The instrument was calibrated
with an aqueous solution of d10-(+)-camphorsulfonic acid. The samples consisted of ~ 0.1 mM peptide
with 6, 9 and 15 nm silica particles added so the total available particle surface area should be the same
regardless of the particle. The data were collected at 0.5 nm intervals with an integration time of 2 s for
the region between 185-240 nm and with 2 nm intervals between 240-260 nm using a 0.01 cm quartz
cell or at 0.5 nm intervals with an integration time of 2 s for the region between 200-240 nm and with 2
nm intervals between 240-260 nm using a 0.05 cm quartz cell. Each spectrum represented an average of
three consecutive scans and before summation, the three separate scans were compared to detect
possible alterations in the sample during the scan period. The peptide spectra were corrected by
subtracting the spectrum of a reference solution that lacked the peptide but was otherwise identical. The
ellipticity is reported as mean residue molar ellipticity ([θ], in degree cm2 dmol-1) according to Eq. 1:
[θ] = [θ]obs • mrw/10lc
where [θ]obs is the ellipticity (degrees), mrw is the mean residue molecular weight, c is the protein
concentration (g/ml) and l is the optical path length of the cell (cm).
Analytical Ultracentrifugation. All ultracentrifugation experiments were performed using a
Beckman Coulter Optima XL-I Analytical ultracentrifuge equipped with an An-50 Ti Rotor and six-
sector cells. The sedimentation equilibrium experiments were conducted using rotor speeds between
2500-50000 rpm. Equilibrium at each rotor speed was reached after 20 hours. The sedimentation was
monitored by measuring the absorbance at 280 nm. The samples were prepared as the 6 and 9 nm silica
particles samples used in the CD analysis. For the peptide samples, the reference solution was pure
buffer. For samples containing peptide and particles, the reference solution was identical except that the
peptide was omitted. The temperature was kept at 22 °C for all experiments. The sedimentation
properties were analyzed using the self-association model in the Beckman software package.
Silica Particles. The colloidal, negatively charged silica particles (food grade quality) used in this
study were kindly provided by EKA-Chemicals, Stenungsund, Sweden. Before use, the particles were
extensively dialyzed against sample buffer (20 mM Tris, 20-40 mM NaCl, pH 8.4). The particles are
stable in solutions at pH above 8 and in moderate salt concentrations2. The stock solutions contained
1.12E+17 particles /ml with an average diameter of 15 nm, 5.09E+17 particles/ml with an average
diameter of 9 nm and 7.30E+17 particles/ml with an average diameter of 6 nm.
4

Results and discussion
In a previous study, it was shown that it is possible to design peptides that will form a well-structured
helix as a result of binding to the surface of a silica nanoparticle. The design was based on the following
considerations:
a. The dominating factor in the interaction between the peptide and the silica surface should be
electrostatic interactions between the negatively charged surface of the nanoparticle and a
positively charged side of a helix. Therefore, arginine residues were incorporated in positions
that would constitute one side of the induced helix. Arginine was chosen over lysine due to its
guanidine group having a delocalized charge, high pKa, and a low reactivity. In the original
construct (peptides 1 and 2) the arginines were incorporated in rows 3 and 6 (figure 2), two
neighboring rows that when the helix were formed would give rise to a large interaction area with
the particles. The charge density of the helix and of the surface is in the same magnitude, at the
pH used in this study3. Besides being responsible for the peptide-surface interaction, the
arginines were also used to prevent the peptide from adopting a helical structure in solution, due
to electrostatic repulsion between the side chains in the absence of appropriately spaced negative
charges.
b. To increase the tendency to form a helical structure alanines were inserted in the adjacent rows (2
and 7) because of their high helix-forming propensities4.
c. In the design rows 1, 4 and, 5 were going to be directed away from the silica surface and facing
the solution. Therefore, glutamine residues were placed in rows 4 and 5 since their polar side-
chains would interact favorably with the solution. To further increase the effect of the negatively
charged silica surface on formation of a helix, glutamic acid were incorporated in row 1, i.e. the
glutamic acid carboxyl group would be repelled by the silica surface and thereby help in the twist
of the peptide back-bone towards helical conformation.
Peptide N-term 1 2 3 4 5 6 7 8 9 10 11 12 13 14 15 16 17 18 19 20 21 22 23 24 25 26 27 28 C-term
1 CH3CO Y A R Q Q R A E A R Q Q R A E A R Q Q R A E A R Q Q R C CONH22 CH3CO Y A R Q Q R A E A R Q Q R A H A R Q K R A E A R Q Q R A CONH23 CH3CO Y A R Q Q N A E A R Q Q N A H A R Q K N A E A R Q Q N A CONH24 CH3CO R Q Q N A E A N Q Q R A E A R Q Q N A E A N Q Q R A E A R CONH25 CH3CO C R A E R R E A R A E R R E A R A E R R E A R A E R R Y CONH26 CH3CO E A K Q Q K A E A K Q Q K A E A K Q Q K A E A K Q Q K A CONH27 CH3CO Y R A E R R E A R A E R R H A R A K R R E A R A E R R E CONH28 CH3CO E A R Q Q R A K A R K K R A K A R Q K R A E A R Q Q R A CONH29 CH3CO Y A R N N R A D A R N N R A D A R N N R A D A R N N R A CONH210 CH3CO E A R Q Q R A E A R Q Q R A E A R Q Q R A E A R Q C R A
E A R Q Q R A E A R Q Q R A E A R Q Q R A E A R Q Q R A CONH2A CH3CO E A R Q Q R A E A R Q Q R A E A R Q Q R A E A R Q* SBenzylB NH3+ C R A E A R Q Q R A E A R Q Q R A E A R Q Q R A E A R Q Q R A CONH211 CH3CO Y L R Q Q R L E L R Q Q R L E L R Q Q R L E L R Q Q R L CONH212 CH3CO Y V R Q Q R V E V R Q Q R V E V R Q Q R V E V R Q Q R V CONH2
5

Figure 1. Amino acid sequences of Peptide 1 to 12, with parts A and B of peptide 10 shown. Amino
acids designed to interact with the surface are highlighted in gray and cysteines in dark gray. * marks
the Fmoc-Glu(OAl)-OH used for Kent ligation.
C-Term.
N-Term.
Ala7Ala14
Ala21Cys28
Arg6Arg13
Arg20Arg27
Gln5Gln12Gln19
Gln26
Gln4Gln11Gln18Gln25
Tyr1Glu8Glu15Glu22
Arg24Arg17Arg10Arg3
Ala2Ala9Ala16Ala23
Row 1
Row 4Row 7
Row 3
Row 6
Row 2
Row 5
Figure 2. Amino acid sequence of Peptide 1 depicted as a helical wheel. Each point gives rise to a
row of amino acids and each row are given a number.
In addition, a tyrosine residue was introduced at position 1 to facilitate spectroscopic measurements,
and in position 28 a cysteine was placed, because it can easily be modified with selective labeling
reagents. Both the N- and C-terminal were capped, the N-terminal with an acetic group and the C-
terminal as an amide. Parallel to peptide 1, peptide 2 was synthesized. The sequence of peptide 2 were
the same as for peptide 1 with the exceptions of a histidine in position 15, a lysine in position 19 and the
cysteine were replaced with an alanine. These changes had two functions; one was to test the stability of
the designs towards small changes and the other were to incorporate a reactive site for ester hydrolysis
which only works when a helix are formed[1](Lundqvist et al. 2006(?)).

CD-spectrum Peptide 1 and Peptide 2
-5
-4
-3
-2
-1
0
1
200 205 210 215 220 225 230 235 240 245 250 255 260
Wavelength (nm)
Del
ta E
psilo
n
Figure 3. CD spectrum for Peptide 1 at pH 9.0 Black line = Peptide 1, gray line = Peptide 1 with 9 nm
particles, dashed black line = Peptide 2 with 9 nm particles.
CD-measurements on peptide 1 and 2 shows that a pronounced helix is formed for both peptides upon
addition of nanoparticles, which clearly shows that the design idea is working. However, a comparison
between peptide 1 and 2 show that the introduction of the His-Lys pair leads to slightly lower fraction of
formed helix. The formation of helix upon addition of nanoparticles might be due to binding of the
peptide to the particle or it might emanate from the simple changes in the peptide-solution environment
upon addition of particles. Therefore, the interaction between peptides and nanoparticles were
investigated by sedimentation equilibrium analysis using analytical ultracentrifugation (AUC).
Figure 4. Sedimentation equilibrium analysis of peptide 2 by ultracentrifugation monitored at A280 (a)
without and (b) with 9 nm silica particles at pH 9. The colours represent different rotor speeds (rpm)
7

(from Lundqvist et al).
The analytical ultracentrifugation experiments were used to determine the aggregation states of the
free peptide and the formation of peptide-nanoparticle complexes. It has been shown that the particles
used, having a weight of ~425 kDa, sediments completely at 8000 rpm. The data in figure 4b show that,
in the presence of particles, the peptides sediments with a pattern that is virtually identical with particles
only, showing that the peptide is strongly bound to the particle. The AUC experiment on free peptide in
solution (figure 4a) and sedimentation experiments at higher rotor speeds (data not shown) show that the
peptide exists as a monomer and also that the peptide does not form large aggregates in solution.
The results presented so far clearly showed that it is possible to design peptides that adopt a helical
conformation upon binding to silica nanoparticles. Thus, it is now possible to systematically investigate
the different elements in the design in order to optimize the structure, function and stability of the
peptide-nanoparticle complexes. The amino acid sequence of peptide 1 is the template that is varied in
the different peptides that are synthesized to test different design elements.
The role of the density of positive charges and their spatial distribution
In the original design, (peptide 1) two neighboring rows (row 3 and 6 in the helix) were filled with 8
arginine residues in order to form positive interactions with the silica surface upon formation of helix.
The interaction with the silica surface might depend on the precise spatial distribution of the positive
charges and on how densely they are situated. Therefore, 3 peptides (Peptide 3, 4 and 5) that differ in
these respects were investigated. Two peptides were made where the total number of charges were
reduced (compared to peptide 1) by replacing some of the arginine residues. In peptide 3 the arginine
residues in row 6 were replaced with asparagines residues which results in a putative helix with one row
that contains 4 arginine residues. In peptide 4 the arginine residues in position 6, 10, 20 and 24 were
replaced by asparagines residues giving a remaining zigzag pattern with 4 arginine residues. The other
rows were left un-tampered. The number of positive charges in peptide 5 was increased to 12 by
introducing a third row of arginine residues. The increase of positive charges would give a larger
interaction surface for the peptide once a helix were formed so to increase the repulsion of the opposite
side of the helix two rows of glutamic acid were introduced. Between the positive and the negative side,
alanines were placed and the glutamines were discarded (figure 5).
8

Glu7Glu14Glu21Tyr28
Arg5Arg12Arg19Arg26
Glu4Glu11
Glu18Glu25
Arg6Arg13Arg20Arg27
C-Term.
N-Term.
Arg2Arg9
Arg16Arg23
Ala24Ala17
Ala10Ala3
Cys1Ala8
Ala15Ala22
Row 4
Row 3
Row 5
Row 6
Row 7
Row 1
Row 2
Figure 5. Peptide 5 represented as a helical wheel.
From the CD analysis converted to percentage helix in figure 6 it is clear that the amount of helix that
is formed upon binding to the nanoparticles is strongly dependent on the density of positive charges on
the side of the helix that faces the silica surface. The comparison of peptides 1, 3, 4, and 5 show that the
helix content is positively correlated to the charge density because peptide 5, which has 12 arginine
residues, has the strongest tendency to form a helix, while peptides 3 and 4, which have 4 arginine
residues each, have a weaker tendency to form helices.
5 6 74
8
27
8
22
73
12
0
10
20
30
40
50
60
70
80
Peptide 18 Arg
Peptide 34 Arg
Peptide 44 Arg
Peptide 512 Arg
Peptide 68 Lys
Perc
enta
ge h
elix
Figure 6. Percentage helix formed with 9 nm silica nanoparticles in pH 9.0. Blue = peptide in buffer.
Purple = peptide-particle complex. Peptides compared with peptide 1.
A comparison of peptides 3 and 4, which both have 4 arginine residues but differ in the distribution of
these (a straight row and a zigzag pattern respectively), indicate that the precise spatial distribution have
a higher influence on the tendency to form helix than the number of charges.

In the peptides discussed so far arginine residues have been used as the positive anchor in the helix
formation. In peptide 6, 8 lysine residues (figure 2) replaced the arginine residues in rows 3 and 6. The
effect on the induced structure by this replacement clearly shows that the helix formation is lowered
with lysine residues. A comparison (figure 6) of peptide l and peptide 6, which both have 8 positive
charges in the interaction area show a much lower helical content with lysine residues. The amount of
helix formed lies in the vicinity of the peptides with only 4 arginine residues in one row. The reason for
the difference can be that the pKa of closely spaced lysine side chains is lowered6 leading to a neutral
species at the pH of the experiment, or the more delocalized charge on the guanidinium group in
arginine might interact more favorably with the negative charges on silica. Thus, it is clear that one or
both of these factors have a major role in the formation of the helixes. Regardless of the detailed
understanding of these factors, it seems clear that arginine residues should be used in the design of
peptides that form helices on silica surfaces. If arginine residues are optimal for helix-forming
interactions with other types of negatively charged surfaces remains to be investigated.
The importance of the helix-forming propensities of glutamine and glutamic acid
In the original design (peptide 1) the rows 1, 4 and 5, which point out from the particle surface
towards the solution, were filled with glutamine (row 4 and row 5) and glutamic acid (row 1). These
amino acid residues were chosen because they have high helix-forming propensities7, which might aid
in stabilizing the helix on the surface. In addition, the glutamic acid residues were chosen because their
negative charge would be repelled by the silica surface, which might aid in orienting the helix on the
surface. In order to test the importance of the helix-forming propensities a peptide (peptide 9) was
synthesized in which all asparagine and aspartic acid residues replaced the glutamine and glutamic acid
residues, respectively. By introducing aspartic acid and asparagines, which both are more commonly
found in loops and turns, the net charge of the peptide is preserved. A comparison between peptide 1
and peptide 9 (figure 7) show only a slight decrease in helical content (from 27 to 24 % helix) as a result
of the replacement. Thus, it seems as if the helix-forming propensities of glutamine and glutamic acid
residues have only a minor role in stabilizing the surface-bound helix.
The importance of charged residues at the exposed side of the bound peptide
The importance of orienting the helix on the surface, by introducing a total negative charge on the side
that point away from the silica surface and facing the solution, were tested by investigating the peptides
2, 3, 7, and 8. The original peptide 1 contains 3 glutamic acid residues, leading to a total charge of –3
on the solution face. By replacing glutamic acid 15 and glutamine 19, in peptides 2 and 3, with histidine
10

and lysine these peptides get a net charge of -1 on the solution face.
Peptide 5 contains 7 glutamic acid residues while the replacement of glutamic acid 15 and glutamine
19 with histidine and lysine in peptide 7 result in a net charge of –5 on the solution face.
Finally in peptide 8 two glutamic acids, at position 8 and 15, and three glutamines, at position 11, 12
and 19, were replaced with lysine, altering the net charge from -3 to +3 on the solution face.
A comparison of peptides 2 and 3 with its template (peptide 1), show a dramatic decrease in helical
content when the net charge is altered from –3 to –1 on the solution face. A similar comparison of
peptide 7 with its parent peptide (peptide 5) give the same pattern, i.e. altering the net charge on the
solution face from –7 to –5 leads to a decrease in helical content from 73% to 23%. A peptide (no 8)
with a net charge of +3 on the solution face does not form a helix upon addition of nanoparticles. Taken
together, these results show a strong correlation between the net negative charge on the solution face of
the helix and the amount of formed helix. Apparently, the repulsion between the negative charges on the
silica surface and the negatively charged amino acid residues on the solution face of the helix is a major
factor for efficient induction and stabilization of a bound helix.
57 6
47 8 8
27
20
8
73
23
8
27
0
10
20
30
40
50
60
70
80
Peptide 1 Peptide 2 Peptide 3 Peptide 5 Peptide 7 Peptide 8 Peptide 9
Perc
enta
ge h
elix
Figure 7. The role of glutamic acid, glutamine, and the number of the same. Percentage helix with 9
nm nanoparticles, in pH 9.0. Peptide 1 is shown as reference. Blue = free peptide in solution. Purple =
peptide-particle complex.
The dependence on peptide length
The original design of peptide 1 includes 28 amino acids that together would form a helix with four
full turns or 7 twists of 3.6 amino acids. Although this would constitute a fairly long helix it has been
proposed that the longer the helix the more stable it will become8-10. Therefore, a doubled length peptide
11

(no 10) was synthesized. Due to problems with the side-chain protection groups of the amino acid used
the synthesis of peptide 10 was divide into two steps. First, the peptides, A and B, were synthesized and
in a subsequent step these peptides was assembled by a Kent ligation.
57
15
27
33
62
41
0
10
20
30
40
50
60
70
Peptide 1 Peptide 10 Part A Part B
Perc
enta
ge h
elix
Figure 8. Length dependence on helical structure. Percentage helix with 9 nm nanoparticles, in pH
9.0. Peptide 1 is shown as reference. Blue = free peptide in solution. Purple = peptide-particle complex.
Prior to the ligation were both fragments part A and part B subjects to CD-measurements as to be able
to compare the results of the parts with the target peptide (number 10). The measurements (figure 8)
showed that the shorter benzyl-containing peptide A produced a better helix than the reference peptide 1
upon binding to the particles, indicating that the bulky C-terminal of peptide A affects the helix
formation in a positive way. Peptide B also forms a well-defined helix.
The observed increase in helical content for peptide 10 when compared to the parent peptide 1 is
rather modest (33 and 27 % helix, respectively). The small effect may be due the curvature of the
particles and the strain this induces in the backbone hydrogen bonds. The amount of helix may therefore
be increased if the peptide is subjected to a flatter surface.
The role of hydrophobic residues on the “sides” of the helix
A known trick when designing helix-forming peptides is to use alanine rich sequences because alanine
residues have a high helix propensity and its side-chain is to small to induce unwanted aggregation due
to hydrophobic interactions. Most of the peptides that are investigated in this paper contain alanine
residues in row 2 and row 7. To investigate the contribution to helix stabilization from the alanine
residues and the influence of placing different hydrophobic residues in these positions, peptides 11 and
12 were synthesized. The alanine residues were replaced with leucine residues in peptide 11 and with
valine residues in peptide 12. The leucine residues would increase the hydrophobicity on the “sides” of
12

the helix and leucine has a higher propensity to form helix than alanine. The introduction of valine
residues would also increase hydrophobicity on the “sides” of the helix but valine has a lower
propensity to form helix than alanine.
5
8
12
2729
8
0
5
10
15
20
25
30
35
Peptide 1 Peptide 11 Peptide 12
Perc
enta
ge h
elix
Figure 9. The role of hydrophobic side chains. Percentage helix with 9 nm particles, in pH 9.0.
Peptide 1 is shown as a reference. Blue = peptide in absence of particle, purple = peptide particle
complex.
The effect of introducing leucine instead of alanine is very small as shown by comparison with
peptide 1 in figure 9. The hope that the helix would be stabilized by hydrophobic interactions with
neighboring helices on the surface is not supported by this observation. The replacement of the alanine
residues with valine residues totally abolished the ability to form helical structure on the particle
surface. Apparently, the valine side-chains stabilize peptide conformations that are incompatible with
productive interactions with the particles.
The effect of varying the pH
The interactions that are important for formation of helix seem to be predominately of electrostatic
nature and therefore changes in pH should have an effect on the helical content. As pH increases the
charge density on the particles will be larger and this ought to favor the formation of helix, to the point
where the positive side-chains of the peptide becomes deprotonated. The highest pH that can be used is
around 10.5 since the particles starts to dissolve above that pH. A lower limit is pH 8 because the
particles aggregate at lower pH. Thus the different peptide-particle systems where investigated at three
different pH’s 9.8 9.0 and 8.4. Changes in this pH-range in general have only small effects on the helical
content although a small decrease is observed for most peptides at pH 8.4(fig 10). The large increase in
helical content of peptide 5 at pH 9 and for peptide 11 at pH 9.8 is not presently understood.
13

28 26
7
2934
2925
8
24
0
6056
89
282720
8
22
73
12
23
8
2733
62
41
29
8
2924
8 9
29
8
28
9 8
20
29 2824
7
0
10
20
30
40
50
60
70
80
90
100
Peptid
e 1
Peptid
e 2
Peptid
e 3
Peptid
e 4
Peptid
e 5
Peptid
e 6
Peptid
e 7
Peptid
e 8
Peptid
e 9
Peptid
e 10
Part A
Part B
Peptid
e 11
Peptid
e 12
Perc
enta
ge h
elix
Figure 10. Effect of pH on the formation of helixes. Results in percentage helix for the peptide-
particle (9 nm) complex at pH, blue = pH 9.8, purple = pH 9.0, and green = pH 8.4.
The role of surface curvature
Since silica nanoparticles were used as surface the helix-formation may be influenced by the
curvature, a small radius will probably bend the helix whereas a larger radius will work more like a
macroscopic surface. To investigate the dependence on particle curvature all peptide constructs were
allowed to interact with particles of three different sizes, going from a diameter of 6 nm to 9 and 15 nm.
As each helical turn contributes approximately 5,4 Å to the length of a helix and most of the peptides
reported here can form 7 turns resulting in a helical length of 37,8 Å, given that they are perfect helices.
On comparing a perfect helix with the different particles, as in figure 11, one can see that the peptides
will most probably become less helical with 6 nm particles than with the larger particles.
14

Figure 11. Full helical length compared with surface size.
The peptides were analyzed at pH 9.0 for all three particle sizes. For most peptides, the best helices
were formed with the 9 nm particles, although some of the peptides show highest helical content with 15
nm particles (figure 12). As expected, all peptides have a lower helical content with 6 nm particles than
with 9 and 15 nm particles.
2722
8 10
83
9
21
8 9
38
58
46
27
8
27
20
8
22
73
12
23
8
2733
62
41
29
8
33 32
8 8
32
13
20
8 10
31
50
61
30
9
0
10
20
30
40
50
60
70
80
90
Peptid
e 1
Peptid
e 2
Peptid
e 3
Peptid
e 4
Peptid
e 5
Peptid
e 6
Peptid
e 7
Peptid
e 8
Peptid
e 9
Peptid
e 10
Part A
Part B
Peptid
e 11
Peptid
e 12
Perc
enta
ge h
elix
15

Figure X. The role of particle curvature on the helical formation. Results in percentage helix, in pH
9.0 for the three different particle sizes. Blue = 6 nmØ, Purple = 9 nmØ, Yellow = 15 nmØ.
Conclusions
We have shown that it is possible to use a silica nanoparticle to induce helical structure in a rationally
designed peptide. From a systematic variation of the amino acid composition in the designed peptides,
we have found some factors that are important for a successful design. We found that the ability to form
helical structure upon binding to the silica surface is dominated by two factors. First, the helical content
is strongly correlated to the net positive charge on the side of the helix that interacts with the silica and
arginine residues are strongly favored over lysine residues in these positions. The second important
factor is to maximize the net negative charge on the side of the helix that faces the solution. Apparently,
both attractive and repulsive electrostatic forces dominate the induction and stabilization of a bound
helix.
1. Novabiochem, Novabiochem 2004/5 Catalog. Merck: 2004/5. 2. www.ekachemicals.se. 3. Sonnefeld, J., Determination of surface charge density constants for spherical silica particles using a linear transformation. Journal of Colloid and Interface Science 1996, 183, (2), 597-599. 4. Anthonycahill, S. J.; Benfield, P. A.; Fairman, R.; Wasserman, Z. R.; Brenner, S. L.; Stafford, W. F.; Altenbach, C.; Hubbell, W. L.; Degrado, W. F., Molecular characterization of helix-loop-helix peptides. Science 1992, 255, (5047), 979-983. 5. Broo, K.; Brive, L.; Lundh, A.-C.; Ahlberg, P.; Baltzer, L., The Mechanism of Self-Catalyzed Site-Selective Functionalization of a Designed Helix-Loop-Helix Motif. Journal of the American Chemical Society 1996, 118, (34), 8172-8173. 6. Johnsson, K.; Allemann, R. K.; Widmer, H.; Benner, S. A., Synthesis, structure and activity of artificial, rationally designed catalytic polypeptides. Nature 1993, 365, (6446), 530-532. 7. Chou, P. Y.; Fasman, G. D., Conformational Parameters for Amino Acids in Helical, β-Sheet, and Random Coil Regions Calculated from Proteins. Biochemistry 1974, 13, (2), 211-222. 8. Wang, T.; Zhu, Y.; Getahun, Z.; Du, D.; Huang, C.-Y.; DeGrado, W. F.; Gai, F., Length Dependent Helix-Coil Transition Kinetics of Nine Alanine-Based Peptides. Journal of Physical Chemistry, B 2004, 108, (39), 15301-15310. 9. Graff, D. K.; Pastrana-Rios, B.; Venyaminov, S. Y.; Prendergast, F. G., The Effects of Chain Lenght and Thermal Denaturation on Helix-Forming Peptides: A Mode-Specific Analysis Using 2D FT-IR. Journal of the American Chemical Society 1997, 119, (46), 11282-11294. 10. Scholtz, J. M.; Barrick, D.; York, E. J.; Stewart, J. M.; Baldwin, R. L., Urea Unfolding of Peptide Helices as a Model for Interpreting Protein Unfolding. Proceedings of the National Academy of Sciences of the United States of America 1995, 92, (1), 185-189.
16


 XXX](https://img.pdfslide.net/doc/110x75/6333b1ef4cd921f2410cfc3a/european-commission-brussels-xxx-2022-xxx-.jpg)


 XXX](https://img.pdfslide.net/doc/110x75/6356b8f561775b033a0af404/european-commission-brussels-xxx-2020-xxx-.jpg)

 XXX](https://img.pdfslide.net/doc/110x75/63280410cedd78c2b50ddce4/european-commission-brussels-xxx-2017-xxx-.jpg)


