Embed Size (px)
Citation preview
Neuropsychologia 42 (2004) 142–157
Temporal processing in poor adult readers
Elizabeth Conlon∗, Mary Sanders, Siggi ZapartSchool of Applied Psychology, Griffith University, PMB 50 Gold Coast Mail Centre, Gold Coast, Qld 9726, Australia
Received 1 November 2001; received in revised form 4 September 2002; accepted 22 July 2003
Abstract
The aim of this study was to investigate the relationships between two different temporal processing tasks and word identificationperformance in skilled, dyslexic and poor adult readers. In Experiment 1 spatial and temporal sequencing tasks were conducted. It wasfound that adult dyslexics were significantly less accurate than skilled readers across all conditions in the temporal sequencing task, andwhen higher numbers of stimuli were presented in the spatial task. Experiment 2 replicated Experiment 1 in the temporal sequencing taskand also found that poor readers had significantly higher motion coherence thresholds than those found in the skilled reader group. Tenpercent of the variance in coherence thresholds was accounted for by performance on the temporal sequencing task. Multiple regressionanalyses determined that performance on the two temporal tasks could explain seventy percent of the variance in word identification scores,with the temporal sequencing task making the larger independent contribution. Experiment 3 replicated the findings of Experiment 2, whiletaking into account IQ, verbal memory and processing speed. Three things were concluded. First, the temporal tasks measure differentaspects of temporal processing. The contribution to performance of higher-level perceptual and attentional components of the temporalsequencing task accounts for the relatively weak correlation found between the two measures. While sensory sensitivity to motion ismeasured at MT, the involvement of this area and PPC in higher-level perceptual and attentional processes is suggested by the findings ofthis study. Second, the association between temporal sequencing and reading skills may provide a stronger link between neural processingand poor reading skills than basic sensory processing measures alone, suggesting that a sensory magnocellular (M) system deficit cannotfully explain the relationship found between reading and visual neural processing. Third, problems with rapid sequential processing arepredicted to be a generalised problem in poor adult readers, whether they are formally classified as dyslexic, or are poor performers onmeasures of word identification. Temporal processing may follow a distribution similar to that found for word identification skills.© 2003 Elsevier Ltd. All rights reserved.
Keywords: Temporal processing; Rapid sequencing; Motion coherence; Attention; Dyslexia
1. Introduction
It has been estimated that between 5 and 17.5% of theEnglish speaking population experience significant prob-lems with the acquisition of reading skills (Rutter & Yule,1975; Shaywitz, Escobar, Shaywitz, Fletcher, & Makugh,1992). Shaywitz et al. (1992)argue that this group formsthe lower tail of the normal distribution. While there isconsiderable evidence of a core difficulty in phonologicalprocessing (Snowling, 2000), the evidence of a deficit intemporal processing in either or both the auditory (Farmer& Klein, 1995; Hari & Kiesila, 1996; Witton et al., 1998)and visual domains (Habib, 2000; Hari & Renvall, 2001;Talcott et al., 1998) is less consistent. Some of the moreconsistent evidence of a temporal processing deficit in thevisual domain has found differences between dyslexic andnon-impaired reader groups on measures of supra-threshold
∗ Corresponding author. Tel.:+61-755-528981; fax:+61-755-528291.E-mail address: [email protected] (E. Conlon).
sensory processing (Talcott et al., 1998) and on tasks thatmeasure processing of rapidly presented stimulus sequences(Hari & Renvall, 2001; Laasonen, Service, & Virsu, 2001;Laasonen, Tomma-Halmer, Lahti-Nuuttila Service, & Virsu,2000). These effects have been found in both children andadults. Relationships have also been found in the normalpopulation between measures of temporal processing andword identification (Au & Lovegrove, 2001; Conlon, Mellor,& Wright, 2001; Talcott et al., 2000b). These findingsdemonstrate that the association between visual temporalprocessing and word identification skills may be an indi-vidual difference, with poor word identifiers less efficienttemporal processors, regardless of whether a formal classi-fication of dyslexia is warranted. In this study, Experiment1 will use participants with a specific childhood classifica-tion of dyslexia with Experiments 2 and 3 using poor wordidentification skills as a basis for reader group classification.
The second focus of the studies reported is the natureof the deficits found in the visual temporal processingsystem. A deficit in rapid sequential processing has been
0028-3932/$ – see front matter © 2003 Elsevier Ltd. All rights reserved.doi:10.1016/j.neuropsychologia.2003.07.004
E. Conlon et al. / Neuropsychologia 42 (2004) 142–157 143
linked to a temporal processing deficit (Habib, 2000; Hari& Renvall, 2001; Stein & Walsh, 1997) in both the auditory(Tallal, 1980) and visual domains (Eden, Stein, Wood, &Wood, 1995; Hansen, Stein, Orde, Winter, & Talcott, 2001;Laasonen et al., 2000; Williams & LeCluyse, 1990). Theseeffects may occur as a result of a direct sensory impairment(Slaghuis & Ryan, 1999; Stein, 2001; Talcott, Hansen,Assoku, & Stein, 2000a), attention deficits (Facoetti &Massimo, 2001; Steinman, Steinman, & Lehmkuhle, 1997)or in the perceptual requirements of the temporal tasks used(Amitay, Ben-Yehudah, Banai, & Ahissar, 2002; Hill &Raymond, 2002; Laasonen et al., 2001). Differences in thecontribution of these variables to performance may accountfor some of the inconsistent findings found in the literature.
In the visual system, physiological evidence has shownthat the larger M-cells project from the magnocellular (M)layers of the lateral geniculate nucleus (LGN) through V1to some extrastriate areas including MT and MT+, with theposterior parietal cortex (PPC) as the endpoint (Merigan &Maunsell, 1993). The early description that an M deficit indyslexia originated in the M layers of the LGN and occurredas a result of a neural abnormality (Livingstone, Rosen,Drislane, & Galaburda, 1991) has not been consistently sup-ported. Some studies of contrast threshold have shown a tem-poral processing deficit among dyslexics (e.g.Ben-Yehudah,Sackett, Malchi-Ginzberg, & Ahissar, 2001; Felmingham& Jakobson, 1995; Martin & Lovegrove, 1988) with someshowing no between group differences (e.g.Skottun, 2000;Stuart, McAnally, & Castles, 2001; Williams, Stuart, Castles,& McAnally, 2003). More consistent evidence of this deficithas been found at MT. Examples of stimuli that have pro-duced between group differences on psychophysical tasksinclude motion coherence (Everatt, Bradshaw, & Hibbard,1999; Raymond & Sorensen, 1998; Talcott et al., 1998)flicker fusion (Talcott et al., 1998), speed discrimination(Demb, Boynton, Best, & Heeger, 1998; Demb, Boynton, &Heeger, 1998) and motion transparency (Hill & Raymond,2002). Investigation using functional MRI has found differ-ences in activation between dyslexic and control groups atMT and MT+ on a speed discrimination task. In addition,a strong correlation has been found between individual dif-ferences in MT+ activity and reading rate (Demb, Boynton,Best, & Heeger, 1998; Demb, Boynton, & Heeger, 1998).Using the same technologyEden et al. (1996)found lessactivation at MT in a dyslexic than a control group on a mo-tion coherence task. When a task that selectively activatesthe form processing system was used, no between group dif-ferences were found. These data demonstrate a relationshipbetween temporal processing at MT and MT+ and reading.
In studies of motion coherence, where the dyslexic grouprequires a greater percentage of coherently moving dots tocorrectly identify the direction of stimulus motion, a num-ber of parameters have been manipulated to determine thestimulus characteristics that explain between group differ-ences.Talcott et al. (1998)have demonstrated that regardlessof stimulus duration or dot size, a group of adult dyslex-
ics has poorer motion coherence thresholds than a controlgroup. With manipulation of dot density, performance ofthe dyslexic group improved as dot density increased withthe highest dot density (12.2 dots/degree2) producing no be-tween group differences. Poorer summation of signal dots aswell as poor temporal integration was used to explain thesedata. In a recent study that also used a high dot density, nobetween group differences were found (Hill & Raymond,2002). Raymond and Sorensen (1998)manipulated the num-ber of frames and frame duration, finding no between groupdifferences with presentation of two-frames at short or longframe durations. Between group differences were found withpresentation of four or seven-frames. Poorer temporal in-tegration of visual signals has been used to explain poorerperformance of the dyslexic group (Raymond & Sorensen,1998; Talcott et al., 2000a).
In studies of motion coherence some overlap in perfor-mance between dyslexic and control groups has been found.Some data have led to predictions that efficiency of tempo-ral processing may exist along a continuum, with increas-ing sensory sensitivity co-existing with word identificationskills (Cornelissen, Richardson, Mason, Fowler, & Stein,1995; Talcott et al., 2000a; Witton et al., 1998). Using anunselected sample of 10-year olds,Cornelissen and Hansen(1998) demonstrated that children with increasingly poormotion coherence thresholds make a greater number of or-thographic letter errors.Talcott et al. (1998)have found ahigh correlation between non-word reading, motion coher-ence thresholds and flicker fusion thresholds in a sample ofadult developmental dyslexics and controls. A measure oforthographic processing was not obtained in the study. Us-ing discriminant function analysis, 72.2% of the dyslexicgroup were successfully discriminated from controls usingthe two measures of visual processing. When a sample of32, 10-year olds were used,Talcott et al. (2000b)found sig-nificant correlations between motion coherence thresholdsand orthographic processing, phonological processing andsegmentation skills. In a more recent study with a largersample of school children, these relationships, while stillfound, were substantially smaller (Talcott et al., 2002). In asample of dyslexic and control adultsDemb, Boynton, Best,and Heeger (1998)found a high correlation (r = −0.84)between reading rate and speed discrimination thresholds.Together these findings demonstrate a link between differentaspects of skilled reading and sensory processing of motionsignals.
One recent study (Ben-Yehudah et al., 2001) has com-bined the presentation of sensory stimuli at a threshold levelwith different forms of two alternative forced choice (2AFC)techniques. In this method two panels are presented, eitherspatially or temporally, with the target stimulus presentedin one panel only. The participant is required to determinein which of the two panels the stimulus is presented. Inthe spatial condition, two panels are presented simultane-ously and in the temporal task the two panels are sepa-rated by an ISI of up to 1 s. Significant between reader
144 E. Conlon et al. / Neuropsychologia 42 (2004) 142–157
group differences in the temporal contrast sensitivity func-tion (CSF) were only found when the temporal presentationformat was used.Ben-Yehudah et al. (2001)concluded that atemporal sequencing component contributes to or enhancesthe visual temporal processing deficit because of a need tobriefly store information concerning the temporal signalspresented (Bisley & Pasternak, 2000). This finding may rec-oncile some negative results found previously (e.g.Skottun,2000) with measurements of temporal contrast sensitivity.
A number of researchers have predicted that impaired pro-cessing of stimuli presented in rapid succession can accountfor less accurate processing of temporal information amongpoor readers (Farmer & Klein, 1995; Habib, 2000; Hari &Renvall, 2001; Stein & Walsh, 1997; Tallal, 1980). The in-terstimulus interval (ISI), which is the time between pre-sentations of individual stimuli, stimulus duration and thetype of stimulus used have all been manipulated in thesestudies. In the auditory domain initial reports found poorreaders were selectively impaired on tasks with presentationof a short but not long ISIs between stimulus presentations(Reed, 1989; Tallal, 1980). Using similar stimulus config-urations other researchers have found reduced accuracy inpoor reader groups relative to control groups on rapid se-quencing tasks regardless of ISIs used (Waber et al., 2001).Changes in the perceptual load of the task may provide a vi-able explanation of different outcomes (Amitay et al., 2002;Laasonen et al., 2001; Waber et al., 2001; Walker, Shinn,Cranford, Givens, & Holbert, 2002). Negative results havealso been found, withNittroeur (1999)failing to find any au-ditory temporal processing difficulties among dyslexic chil-dren with severe phonological deficits.
The impact of rapid sequencing has also been found inthe visual domain.Slaghuis and Lovegrove (1985)foundthat a group of reading disabled children required a signif-icantly longer ISI than a control group to reliably perceivea gap between presentation of two low spatial frequencystimulus patterns. Recently, this result has been replicatedusing groups of average and above average adult readers.On average the above average reader group required anISI of 153.15 ms with average readers requiring on aver-age 183 ms to reliably detect the gap (Au & Lovegrove,2001). Using a version of this task where skilled and dyslexicreaders were required to determine if the percept of flickerwas perceived between two stimulus presentations,Chiappe,Stringer, Siegel and Stanovich (2002)reported that overallthe dyslexic group were less accurate than a control group,regardless of the ISI used.
Attentional blink tasks require participants to identify twoor more stimuli, generally different letters, presented amongan array of rapidly presented stimuli. The attentional blinkis the length of time required between presentation of theinitial stimulus and target stimulus for accurate identifica-tion of both stimuli. One study using groups of dyslexic andcontrol adults has found that the dyslexic group requires onaverage 160 ms longer than the control group to accuratelyperform the task (Hari, Valta, & Uutela, 1999). When using
groups of adults with and without dyslexiaLaasonen et al.(2001) failed to find significant between group differenceson measures of visual temporal order judgement and tempo-ral acuity. They argued that increasing the perceptual load ofthe temporal tasks used would result in poorer performanceamong poor readers due to increases in the signal to noiseratio produced with increasing stimulus presentations. Thisfinding would suggest sequencing tasks of greater complex-ity should produce more robust between group differences.
Eden et al. (1995)demonstrated that reading disabledchildren are significantly less accurate than controls whencounting sequences of rapidly presented stimuli separatedby ISIs of between 200 and 400 ms. The correlation betweenreading skill and performance on this task was 0.40. A cor-responding spatial task where the stimuli were presented si-multaneously for 500 ms failed to find significant betweengroup differences, although a trend was found for poor read-ers to perform less accurately with presentation of a largernumber of stimuli. There were a number of controls incorpo-rated intoEden et al.’s (1995)study. First, the ISIs betweenpresentations of the temporal stimuli controlled for the mini-mum gap in visible persistence required for skilled readers todifferentiate between presentations of two separate stimuli.Second, ISIs were randomised to avoid rhythmic counting ofstimuli, so that any differences found could be attributed topoorer visual task performance. Third, inclusion of the spa-tial condition controlled for attention and memory as there isconsiderable evidence demonstrating that short-term mem-ory is impaired in poor readers (e.g.Snowling, 2000). Thesestudies of sequential processing demonstrate that those withpoor reading skills have a slower rate of visual processingwhen stimuli are presented rapidly, particularly when per-ceptual load is high.
Experiment 1 aimed to replicateEden et al.’s (1995)find-ings using groups of skilled and dyslexic adult readers. Thedyslexic group consisted of adults with a childhood historyof dyslexia. In addition, due to recent findings that a temporalprocessing deficit is found in readers with poor orthographicand phonological skills (Borsting et al., 1996; Slaghuis &Ryan, 1999) only those readers with poor phonological andorthographic skills were included. This experiment will de-termine if difficulties with rapid temporal sequencing extendto the adult population.
2. Experiment 1
2.1. Method
2.1.1. ParticipantsThere were 24 volunteers, 12 of these were registered
as dyslexic with the disability office at either Griffith Uni-versity or the University of Queensland. The control groupwas recruited from the student population at Griffith Univer-sity. All participants were screened for reading level usingthe Boder Test of Reading and Spelling Ability (Boder &
E. Conlon et al. / Neuropsychologia 42 (2004) 142–157 145
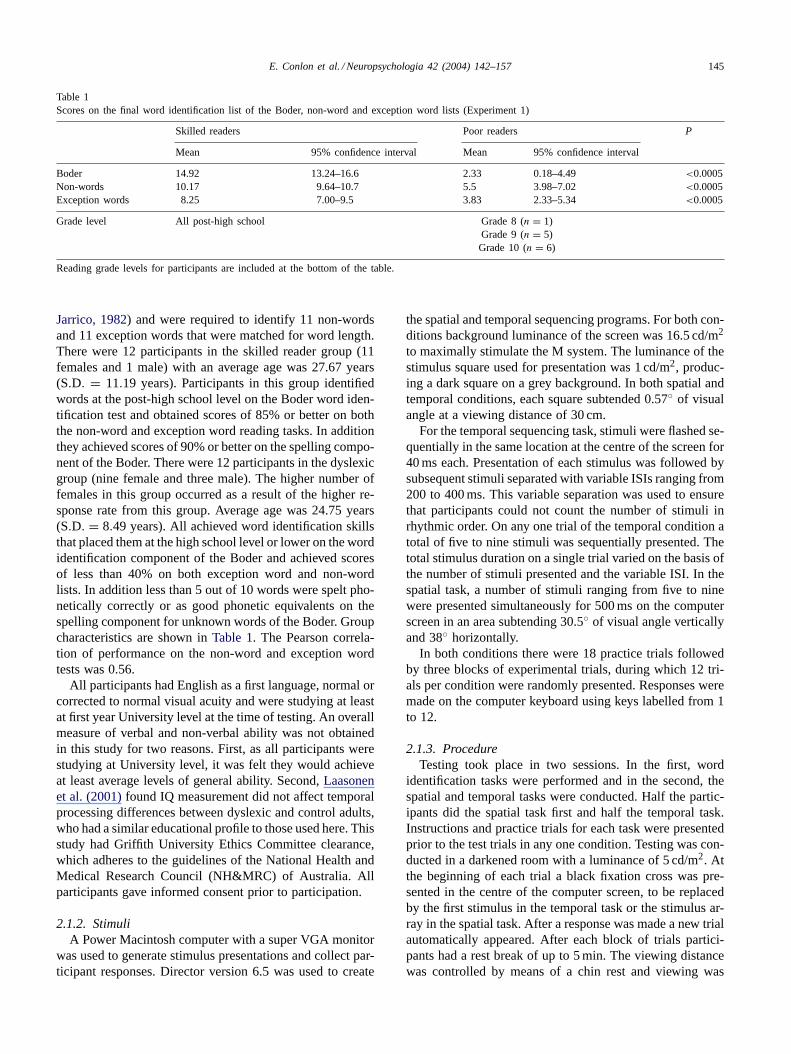
Table 1Scores on the final word identification list of the Boder, non-word and exception word lists (Experiment 1)
Skilled readers Poor readers P
Mean 95% confidence interval Mean 95% confidence interval
Boder 14.92 13.24–16.6 2.33 0.18–4.49 <0.0005Non-words 10.17 9.64–10.7 5.5 3.98–7.02 <0.0005Exception words 8.25 7.00–9.5 3.83 2.33–5.34 <0.0005
Grade level All post-high school Grade 8 (n = 1)Grade 9 (n = 5)Grade 10 (n = 6)
Reading grade levels for participants are included at the bottom of the table.
Jarrico, 1982) and were required to identify 11 non-wordsand 11 exception words that were matched for word length.There were 12 participants in the skilled reader group (11females and 1 male) with an average age was 27.67 years(S.D. = 11.19 years). Participants in this group identifiedwords at the post-high school level on the Boder word iden-tification test and obtained scores of 85% or better on boththe non-word and exception word reading tasks. In additionthey achieved scores of 90% or better on the spelling compo-nent of the Boder. There were 12 participants in the dyslexicgroup (nine female and three male). The higher number offemales in this group occurred as a result of the higher re-sponse rate from this group. Average age was 24.75 years(S.D. = 8.49 years). All achieved word identification skillsthat placed them at the high school level or lower on the wordidentification component of the Boder and achieved scoresof less than 40% on both exception word and non-wordlists. In addition less than 5 out of 10 words were spelt pho-netically correctly or as good phonetic equivalents on thespelling component for unknown words of the Boder. Groupcharacteristics are shown inTable 1. The Pearson correla-tion of performance on the non-word and exception wordtests was 0.56.
All participants had English as a first language, normal orcorrected to normal visual acuity and were studying at leastat first year University level at the time of testing. An overallmeasure of verbal and non-verbal ability was not obtainedin this study for two reasons. First, as all participants werestudying at University level, it was felt they would achieveat least average levels of general ability. Second,Laasonenet al. (2001)found IQ measurement did not affect temporalprocessing differences between dyslexic and control adults,who had a similar educational profile to those used here. Thisstudy had Griffith University Ethics Committee clearance,which adheres to the guidelines of the National Health andMedical Research Council (NH&MRC) of Australia. Allparticipants gave informed consent prior to participation.
2.1.2. StimuliA Power Macintosh computer with a super VGA monitor
was used to generate stimulus presentations and collect par-ticipant responses. Director version 6.5 was used to create
the spatial and temporal sequencing programs. For both con-ditions background luminance of the screen was 16.5 cd/m2
to maximally stimulate the M system. The luminance of thestimulus square used for presentation was 1 cd/m2, produc-ing a dark square on a grey background. In both spatial andtemporal conditions, each square subtended 0.57◦ of visualangle at a viewing distance of 30 cm.
For the temporal sequencing task, stimuli were flashed se-quentially in the same location at the centre of the screen for40 ms each. Presentation of each stimulus was followed bysubsequent stimuli separated with variable ISIs ranging from200 to 400 ms. This variable separation was used to ensurethat participants could not count the number of stimuli inrhythmic order. On any one trial of the temporal condition atotal of five to nine stimuli was sequentially presented. Thetotal stimulus duration on a single trial varied on the basis ofthe number of stimuli presented and the variable ISI. In thespatial task, a number of stimuli ranging from five to ninewere presented simultaneously for 500 ms on the computerscreen in an area subtending 30.5◦ of visual angle verticallyand 38◦ horizontally.
In both conditions there were 18 practice trials followedby three blocks of experimental trials, during which 12 tri-als per condition were randomly presented. Responses weremade on the computer keyboard using keys labelled from 1to 12.
2.1.3. ProcedureTesting took place in two sessions. In the first, word
identification tasks were performed and in the second, thespatial and temporal tasks were conducted. Half the partic-ipants did the spatial task first and half the temporal task.Instructions and practice trials for each task were presentedprior to the test trials in any one condition. Testing was con-ducted in a darkened room with a luminance of 5 cd/m2. Atthe beginning of each trial a black fixation cross was pre-sented in the centre of the computer screen, to be replacedby the first stimulus in the temporal task or the stimulus ar-ray in the spatial task. After a response was made a new trialautomatically appeared. After each block of trials partici-pants had a rest break of up to 5 min. The viewing distancewas controlled by means of a chin rest and viewing was
146 E. Conlon et al. / Neuropsychologia 42 (2004) 142–157
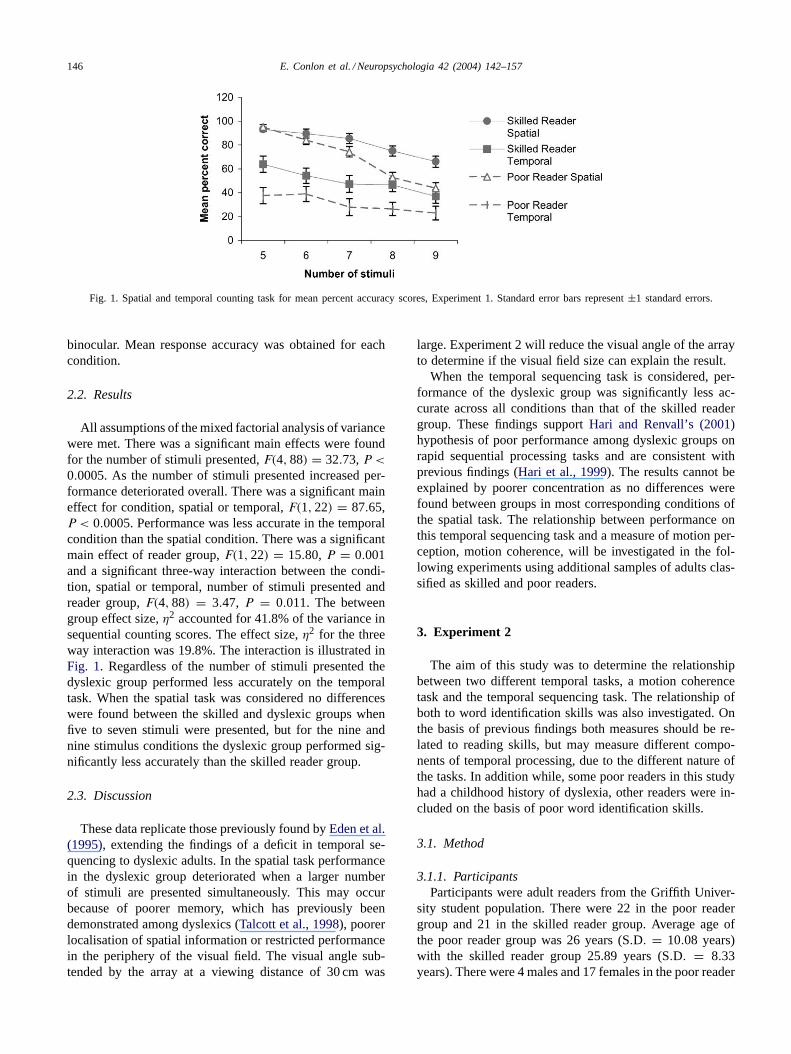
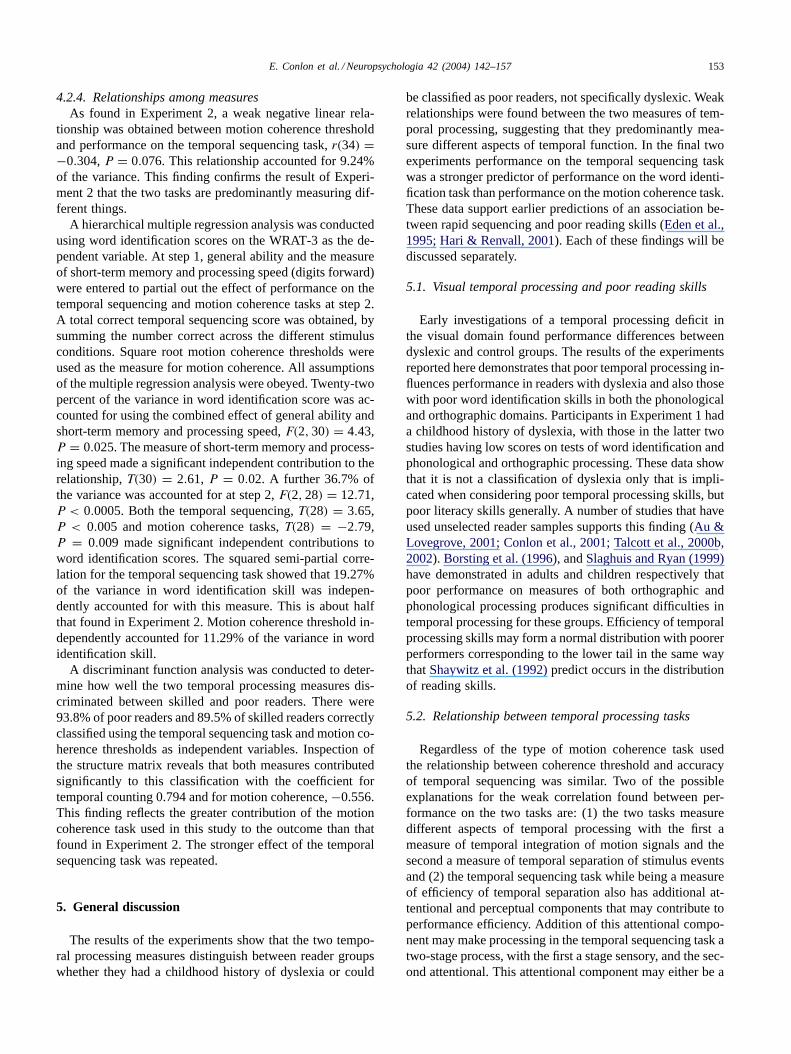
Fig. 1. Spatial and temporal counting task for mean percent accuracy scores, Experiment 1. Standard error bars represent±1 standard errors.
binocular. Mean response accuracy was obtained for eachcondition.
2.2. Results
All assumptions of the mixed factorial analysis of variancewere met. There was a significant main effects were foundfor the number of stimuli presented,F(4, 88) = 32.73,P <
0.0005. As the number of stimuli presented increased per-formance deteriorated overall. There was a significant maineffect for condition, spatial or temporal,F(1, 22) = 87.65,P < 0.0005. Performance was less accurate in the temporalcondition than the spatial condition. There was a significantmain effect of reader group,F(1, 22) = 15.80, P = 0.001and a significant three-way interaction between the condi-tion, spatial or temporal, number of stimuli presented andreader group,F(4, 88) = 3.47, P = 0.011. The betweengroup effect size,η2 accounted for 41.8% of the variance insequential counting scores. The effect size,η2 for the threeway interaction was 19.8%. The interaction is illustrated inFig. 1. Regardless of the number of stimuli presented thedyslexic group performed less accurately on the temporaltask. When the spatial task was considered no differenceswere found between the skilled and dyslexic groups whenfive to seven stimuli were presented, but for the nine andnine stimulus conditions the dyslexic group performed sig-nificantly less accurately than the skilled reader group.
2.3. Discussion
These data replicate those previously found byEden et al.(1995), extending the findings of a deficit in temporal se-quencing to dyslexic adults. In the spatial task performancein the dyslexic group deteriorated when a larger numberof stimuli are presented simultaneously. This may occurbecause of poorer memory, which has previously beendemonstrated among dyslexics (Talcott et al., 1998), poorerlocalisation of spatial information or restricted performancein the periphery of the visual field. The visual angle sub-tended by the array at a viewing distance of 30 cm was
large. Experiment 2 will reduce the visual angle of the arrayto determine if the visual field size can explain the result.
When the temporal sequencing task is considered, per-formance of the dyslexic group was significantly less ac-curate across all conditions than that of the skilled readergroup. These findings supportHari and Renvall’s (2001)hypothesis of poor performance among dyslexic groups onrapid sequential processing tasks and are consistent withprevious findings (Hari et al., 1999). The results cannot beexplained by poorer concentration as no differences werefound between groups in most corresponding conditions ofthe spatial task. The relationship between performance onthis temporal sequencing task and a measure of motion per-ception, motion coherence, will be investigated in the fol-lowing experiments using additional samples of adults clas-sified as skilled and poor readers.
3. Experiment 2
The aim of this study was to determine the relationshipbetween two different temporal tasks, a motion coherencetask and the temporal sequencing task. The relationship ofboth to word identification skills was also investigated. Onthe basis of previous findings both measures should be re-lated to reading skills, but may measure different compo-nents of temporal processing, due to the different nature ofthe tasks. In addition while, some poor readers in this studyhad a childhood history of dyslexia, other readers were in-cluded on the basis of poor word identification skills.
3.1. Method
3.1.1. ParticipantsParticipants were adult readers from the Griffith Univer-
sity student population. There were 22 in the poor readergroup and 21 in the skilled reader group. Average age ofthe poor reader group was 26 years (S.D. = 10.08 years)with the skilled reader group 25.89 years (S.D. = 8.33years). There were 4 males and 17 females in the poor reader
E. Conlon et al. / Neuropsychologia 42 (2004) 142–157 147
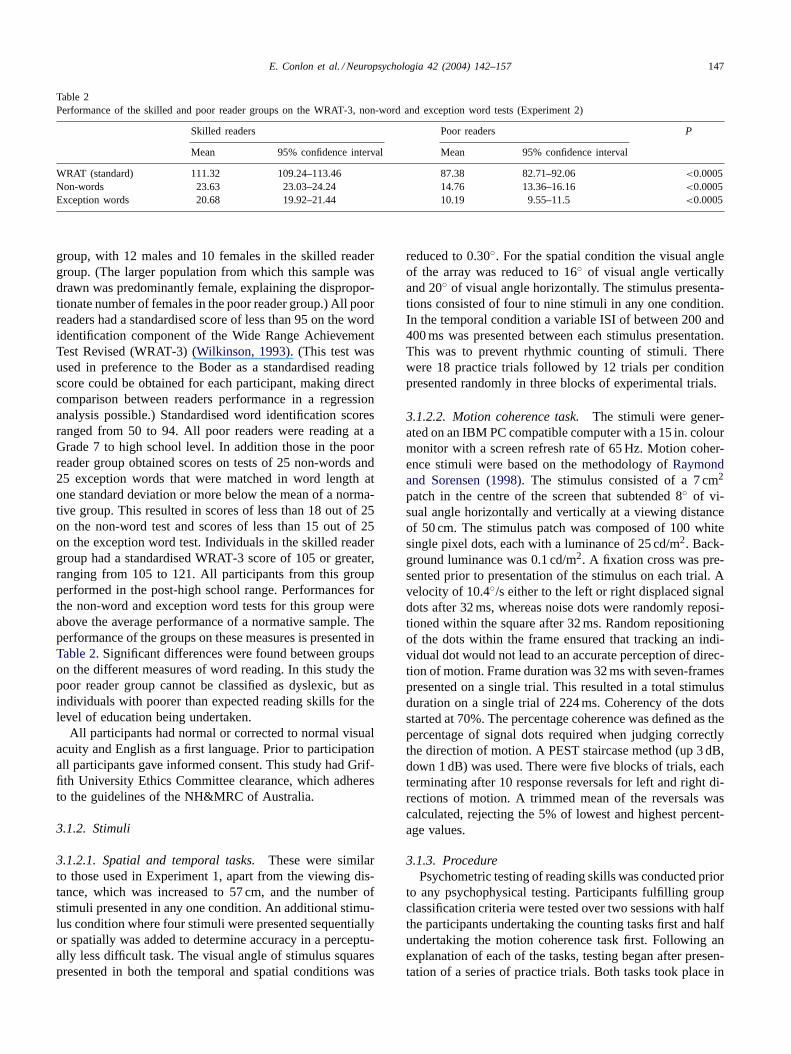
Table 2Performance of the skilled and poor reader groups on the WRAT-3, non-word and exception word tests (Experiment 2)
Skilled readers Poor readers P
Mean 95% confidence interval Mean 95% confidence interval
WRAT (standard) 111.32 109.24–113.46 87.38 82.71–92.06 <0.0005Non-words 23.63 23.03–24.24 14.76 13.36–16.16 <0.0005Exception words 20.68 19.92–21.44 10.19 9.55–11.5 <0.0005
group, with 12 males and 10 females in the skilled readergroup. (The larger population from which this sample wasdrawn was predominantly female, explaining the dispropor-tionate number of females in the poor reader group.) All poorreaders had a standardised score of less than 95 on the wordidentification component of the Wide Range AchievementTest Revised (WRAT-3) (Wilkinson, 1993). (This test wasused in preference to the Boder as a standardised readingscore could be obtained for each participant, making directcomparison between readers performance in a regressionanalysis possible.) Standardised word identification scoresranged from 50 to 94. All poor readers were reading at aGrade 7 to high school level. In addition those in the poorreader group obtained scores on tests of 25 non-words and25 exception words that were matched in word length atone standard deviation or more below the mean of a norma-tive group. This resulted in scores of less than 18 out of 25on the non-word test and scores of less than 15 out of 25on the exception word test. Individuals in the skilled readergroup had a standardised WRAT-3 score of 105 or greater,ranging from 105 to 121. All participants from this groupperformed in the post-high school range. Performances forthe non-word and exception word tests for this group wereabove the average performance of a normative sample. Theperformance of the groups on these measures is presented inTable 2. Significant differences were found between groupson the different measures of word reading. In this study thepoor reader group cannot be classified as dyslexic, but asindividuals with poorer than expected reading skills for thelevel of education being undertaken.
All participants had normal or corrected to normal visualacuity and English as a first language. Prior to participationall participants gave informed consent. This study had Grif-fith University Ethics Committee clearance, which adheresto the guidelines of the NH&MRC of Australia.
3.1.2. Stimuli
3.1.2.1. Spatial and temporal tasks. These were similarto those used in Experiment 1, apart from the viewing dis-tance, which was increased to 57 cm, and the number ofstimuli presented in any one condition. An additional stimu-lus condition where four stimuli were presented sequentiallyor spatially was added to determine accuracy in a perceptu-ally less difficult task. The visual angle of stimulus squarespresented in both the temporal and spatial conditions was
reduced to 0.30◦. For the spatial condition the visual angleof the array was reduced to 16◦ of visual angle verticallyand 20◦ of visual angle horizontally. The stimulus presenta-tions consisted of four to nine stimuli in any one condition.In the temporal condition a variable ISI of between 200 and400 ms was presented between each stimulus presentation.This was to prevent rhythmic counting of stimuli. Therewere 18 practice trials followed by 12 trials per conditionpresented randomly in three blocks of experimental trials.
3.1.2.2. Motion coherence task. The stimuli were gener-ated on an IBM PC compatible computer with a 15 in. colourmonitor with a screen refresh rate of 65 Hz. Motion coher-ence stimuli were based on the methodology ofRaymondand Sorensen (1998). The stimulus consisted of a 7 cm2
patch in the centre of the screen that subtended 8◦ of vi-sual angle horizontally and vertically at a viewing distanceof 50 cm. The stimulus patch was composed of 100 whitesingle pixel dots, each with a luminance of 25 cd/m2. Back-ground luminance was 0.1 cd/m2. A fixation cross was pre-sented prior to presentation of the stimulus on each trial. Avelocity of 10.4◦/s either to the left or right displaced signaldots after 32 ms, whereas noise dots were randomly reposi-tioned within the square after 32 ms. Random repositioningof the dots within the frame ensured that tracking an indi-vidual dot would not lead to an accurate perception of direc-tion of motion. Frame duration was 32 ms with seven-framespresented on a single trial. This resulted in a total stimulusduration on a single trial of 224 ms. Coherency of the dotsstarted at 70%. The percentage coherence was defined as thepercentage of signal dots required when judging correctlythe direction of motion. A PEST staircase method (up 3 dB,down 1 dB) was used. There were five blocks of trials, eachterminating after 10 response reversals for left and right di-rections of motion. A trimmed mean of the reversals wascalculated, rejecting the 5% of lowest and highest percent-age values.
3.1.3. ProcedurePsychometric testing of reading skills was conducted prior
to any psychophysical testing. Participants fulfilling groupclassification criteria were tested over two sessions with halfthe participants undertaking the counting tasks first and halfundertaking the motion coherence task first. Following anexplanation of each of the tasks, testing began after presen-tation of a series of practice trials. Both tasks took place in
148 E. Conlon et al. / Neuropsychologia 42 (2004) 142–157
a darkened room (5 cd/m2) and viewing was binocular. Theviewing distance was controlled by means of a chin rest.
In the sequencing tasks responses were made using keysmarked 1–12 on the computer keyboard. The percentage ofcorrect responses was obtained for each stimulus conditionfor both the spatial and temporal tasks.
For the motion coherence task participants selected eithera left or right arrow key on the keyboard to respond to thedirection of motion. Each block of trials resulted in two es-timates of threshold, one for leftward and one for rightwardmotion. These were combined to produce an overall coher-ence threshold.
3.2. Results and discussion
3.2.1. Spatial and temporal tasksPerformance of the skilled and poor reader groups on the
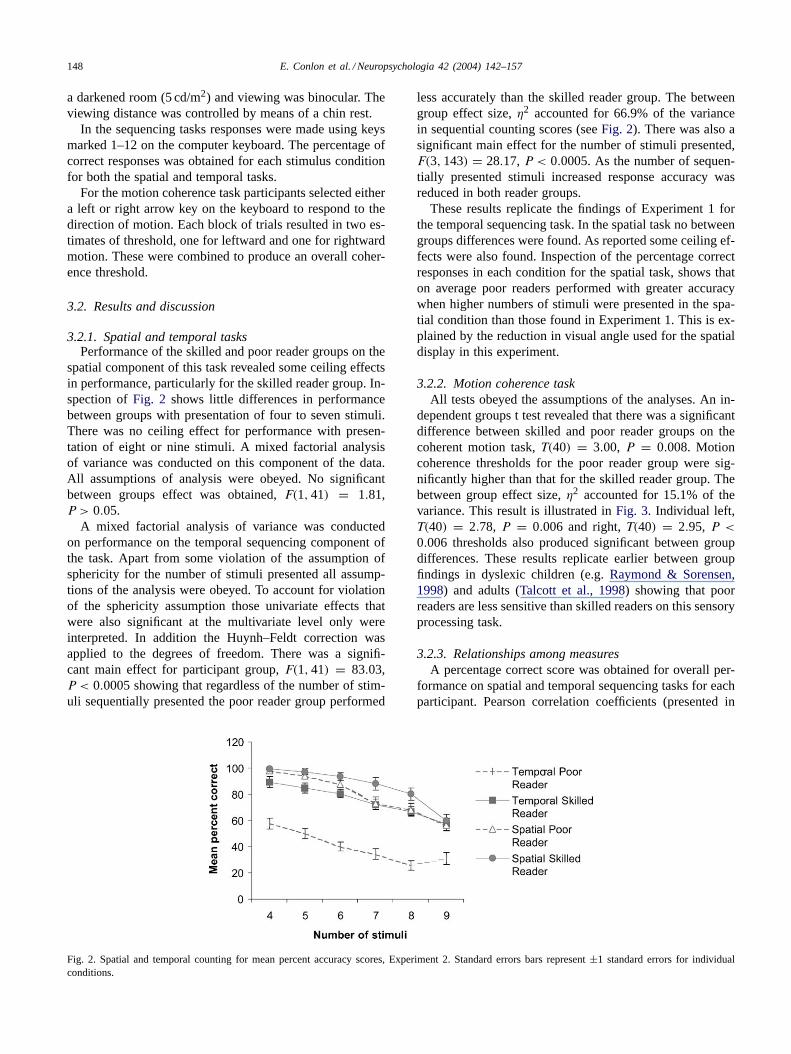
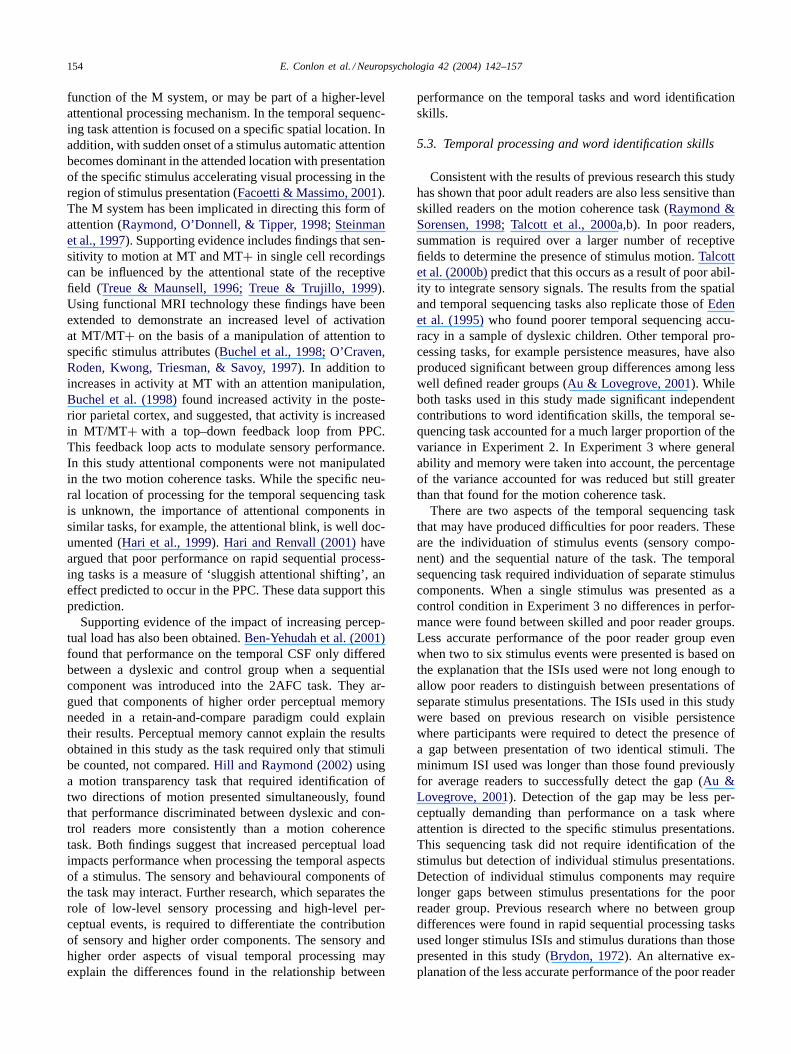
spatial component of this task revealed some ceiling effectsin performance, particularly for the skilled reader group. In-spection ofFig. 2 shows little differences in performancebetween groups with presentation of four to seven stimuli.There was no ceiling effect for performance with presen-tation of eight or nine stimuli. A mixed factorial analysisof variance was conducted on this component of the data.All assumptions of analysis were obeyed. No significantbetween groups effect was obtained,F(1, 41) = 1.81,P > 0.05.
A mixed factorial analysis of variance was conductedon performance on the temporal sequencing component ofthe task. Apart from some violation of the assumption ofsphericity for the number of stimuli presented all assump-tions of the analysis were obeyed. To account for violationof the sphericity assumption those univariate effects thatwere also significant at the multivariate level only wereinterpreted. In addition the Huynh–Feldt correction wasapplied to the degrees of freedom. There was a signifi-cant main effect for participant group,F(1, 41) = 83.03,P < 0.0005 showing that regardless of the number of stim-uli sequentially presented the poor reader group performed
Fig. 2. Spatial and temporal counting for mean percent accuracy scores, Experiment 2. Standard errors bars represent±1 standard errors for individualconditions.
less accurately than the skilled reader group. The betweengroup effect size,η2 accounted for 66.9% of the variancein sequential counting scores (seeFig. 2). There was also asignificant main effect for the number of stimuli presented,F(3, 143) = 28.17, P < 0.0005. As the number of sequen-tially presented stimuli increased response accuracy wasreduced in both reader groups.
These results replicate the findings of Experiment 1 forthe temporal sequencing task. In the spatial task no betweengroups differences were found. As reported some ceiling ef-fects were also found. Inspection of the percentage correctresponses in each condition for the spatial task, shows thaton average poor readers performed with greater accuracywhen higher numbers of stimuli were presented in the spa-tial condition than those found in Experiment 1. This is ex-plained by the reduction in visual angle used for the spatialdisplay in this experiment.
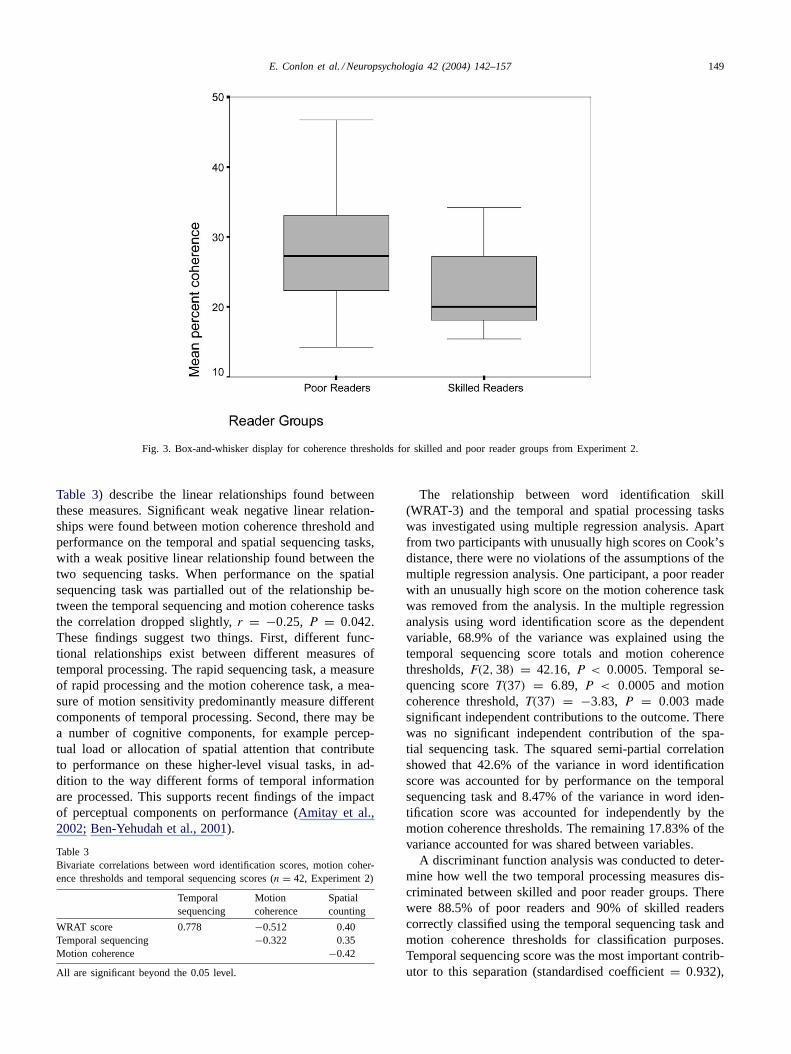
3.2.2. Motion coherence taskAll tests obeyed the assumptions of the analyses. An in-
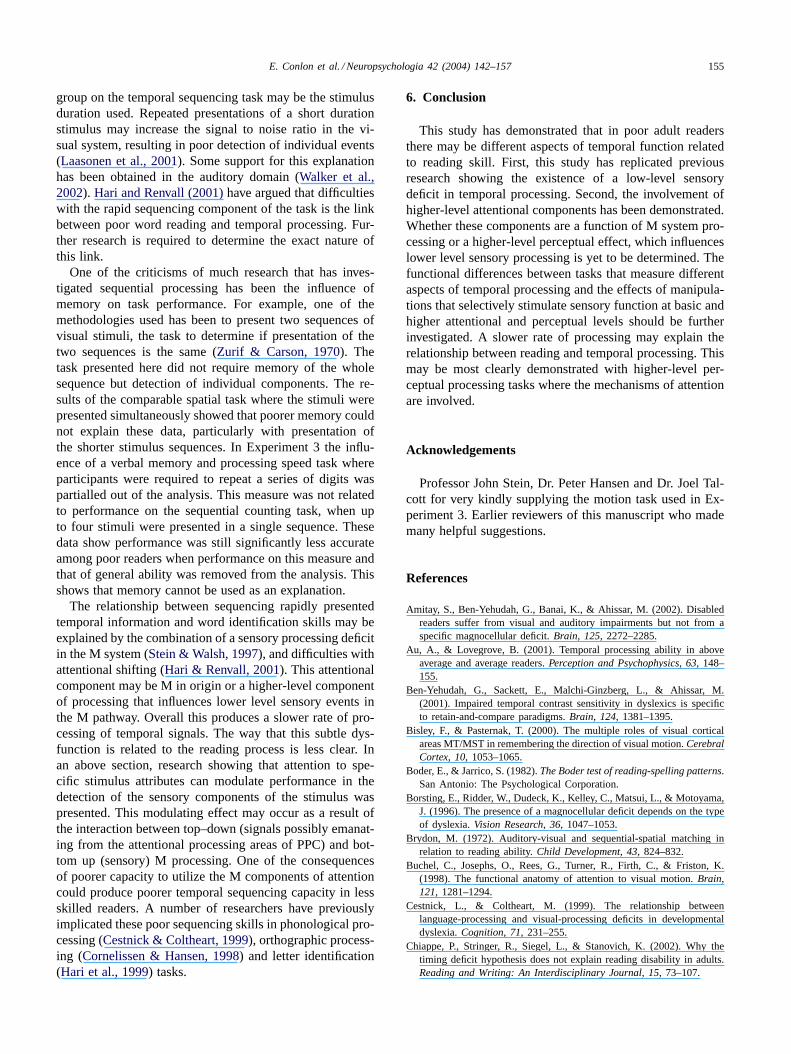
dependent groups t test revealed that there was a significantdifference between skilled and poor reader groups on thecoherent motion task,T(40) = 3.00, P = 0.008. Motioncoherence thresholds for the poor reader group were sig-nificantly higher than that for the skilled reader group. Thebetween group effect size,η2 accounted for 15.1% of thevariance. This result is illustrated inFig. 3. Individual left,T(40) = 2.78, P = 0.006 and right,T(40) = 2.95, P <
0.006 thresholds also produced significant between groupdifferences. These results replicate earlier between groupfindings in dyslexic children (e.g.Raymond & Sorensen,1998) and adults (Talcott et al., 1998) showing that poorreaders are less sensitive than skilled readers on this sensoryprocessing task.
3.2.3. Relationships among measuresA percentage correct score was obtained for overall per-
formance on spatial and temporal sequencing tasks for eachparticipant. Pearson correlation coefficients (presented in
E. Conlon et al. / Neuropsychologia 42 (2004) 142–157 149
Fig. 3. Box-and-whisker display for coherence thresholds for skilled and poor reader groups from Experiment 2.
Table 3) describe the linear relationships found betweenthese measures. Significant weak negative linear relation-ships were found between motion coherence threshold andperformance on the temporal and spatial sequencing tasks,with a weak positive linear relationship found between thetwo sequencing tasks. When performance on the spatialsequencing task was partialled out of the relationship be-tween the temporal sequencing and motion coherence tasksthe correlation dropped slightly,r = −0.25, P = 0.042.These findings suggest two things. First, different func-tional relationships exist between different measures oftemporal processing. The rapid sequencing task, a measureof rapid processing and the motion coherence task, a mea-sure of motion sensitivity predominantly measure differentcomponents of temporal processing. Second, there may bea number of cognitive components, for example percep-tual load or allocation of spatial attention that contributeto performance on these higher-level visual tasks, in ad-dition to the way different forms of temporal informationare processed. This supports recent findings of the impactof perceptual components on performance (Amitay et al.,2002; Ben-Yehudah et al., 2001).
Table 3Bivariate correlations between word identification scores, motion coher-ence thresholds and temporal sequencing scores (n = 42, Experiment 2)
Temporalsequencing
Motioncoherence
Spatialcounting
WRAT score 0.778 −0.512 0.40Temporal sequencing −0.322 0.35Motion coherence −0.42
All are significant beyond the 0.05 level.
The relationship between word identification skill(WRAT-3) and the temporal and spatial processing taskswas investigated using multiple regression analysis. Apartfrom two participants with unusually high scores on Cook’sdistance, there were no violations of the assumptions of themultiple regression analysis. One participant, a poor readerwith an unusually high score on the motion coherence taskwas removed from the analysis. In the multiple regressionanalysis using word identification score as the dependentvariable, 68.9% of the variance was explained using thetemporal sequencing score totals and motion coherencethresholds,F(2, 38) = 42.16, P < 0.0005. Temporal se-quencing scoreT(37) = 6.89, P < 0.0005 and motioncoherence threshold,T(37) = −3.83, P = 0.003 madesignificant independent contributions to the outcome. Therewas no significant independent contribution of the spa-tial sequencing task. The squared semi-partial correlationshowed that 42.6% of the variance in word identificationscore was accounted for by performance on the temporalsequencing task and 8.47% of the variance in word iden-tification score was accounted for independently by themotion coherence thresholds. The remaining 17.83% of thevariance accounted for was shared between variables.
A discriminant function analysis was conducted to deter-mine how well the two temporal processing measures dis-criminated between skilled and poor reader groups. Therewere 88.5% of poor readers and 90% of skilled readerscorrectly classified using the temporal sequencing task andmotion coherence thresholds for classification purposes.Temporal sequencing score was the most important contrib-utor to this separation (standardised coefficient= 0.932),
150 E. Conlon et al. / Neuropsychologia 42 (2004) 142–157
with motion coherence threshold less important (standard-ised coefficient= −0.270).
While it is tempting to argue from these data that rapidsequential processing is the strongest indicator of the rela-tionship between word identification skills and temporal pro-cessing, verbal memory, rapid processing and generalisedverbal skills may contribute. To determine the impact ofthese variables a further experiment was conducted. A mea-sure of general ability was obtained using verbal and non-verbal tests from the Wechsler Scales of Adult Intelligence(WAIS-3) (Wechsler, 1998). Measures of verbal memory andprocessing speed (the digit span from the Wechsler Scales)and spatial memory, the spatial span task from the WechslerMemory Scales (WMSs) (Wechsler, 1997) were obtained.
4. Experiment 3
4.1. Method
4.1.1. ParticipantsThis study used adult readers from the Griffith Univer-
sity pool of staff and students. No participant took part ineither Experiment 1 or 2. There were 17 participants in thepoor reader group and 19 participants in the skilled readergroup. Average age of the poor reader group was 24.61years (S.D. = 9.33 years) with the skilled reader group23.95 years (S.D. = 7.81 years). There were 6 males and11 females in the poor reader group, with 8 males and 11females in the skilled reader group. All poor readers hada standardised score of 94 or less on the word identifica-tion component of the WRAT-3 (Steinman et al., 1997) andscores on the non-word and exception word tests conductedin Experiment 2 of at least one standard deviation below themean performance of a normative sample. Individuals in theskilled reader group had a standardised WRAT-3 score of105 or greater. In addition, those in the skilled reader groupobtained scores on tests of non-word and exception wordreading at least one standard deviation or more above themean of a normative sample. Significant differences werefound between groups on all measures of word identifica-tion. An estimated general ability score using one verbal
Table 4Performance of the skilled and poor reader groups on the WRAT-3, non-word and exception word tests, memory and tests of general ability (Experiment 3)
Skilled readers Poor readers P
Mean 95% confidence interval Mean 95% confidence interval
WRAT (standard) 109.69 109.24–113.46 89.18 82.71–92.06 <0.0005Non-words/25 23.63 23.03–24.24 13.82 13.36–16.16 <0.0005Exception words/25 20.68 19.92–21.44 11.94 9.55–11.5 <0.0005Digit span (scale) 12.47 11.02–13.93 9.12 8.24–10.31 <0.05Digits backward 8.63 7.41–9.86 5.76 4.95–6.12 <0.0005Digits forward 12.00 10.83–13.17 9.88 8.81–11.08 <0.05Spatial span forward 9.74 8.8–10.67 8.35 7.48–9.41 <0.05General ability (IQ) 111.85 105.86–116.98 109.69 102.17–115.39 >0.05
(vocabulary) and one performance (picture completion) testfrom the WAIS-3 (Wechsler, 1998) was obtained. No differ-ences were found between groups on measures of generalability. These group characteristics are displayed inTable 4.
All participants had normal or corrected to normal visualacuity and English as a first language. Prior to participationall volunteers gave informed consent. This study had GriffithUniversity Ethics Committee clearance, which adheres tothe guidelines of the NH&MRC of Australia.
4.1.2. Stimuli
4.1.2.1. Temporal sequencing task. This was similar tothat presented in Experiment 2. Additional conditions wereadded, with presentation of stimuli ranging from a singlestimulus (a control condition to determine that the task countbe undertaken successfully with a 40 ms stimulus presenta-tion) up to presentation of nine stimuli in a sequence. Otherstimulus parameters were the same as those presented inExperiment 2. There were 12 trials presented per stimuluscondition and 18 practice trials.
4.1.2.2. Motion coherence task. This is the same motioncoherence task as that used byHansen et al. (2001). Twopatches of 300 high luminance (130 cd/m2) white dots werepresented on a black background. One patch contained avariable percentage of target dots that moved coherently ei-ther to the left or right, with the second panel containingnoise elements only. The direction of motion was reversedevery 572 ms, with noise dots randomly changing directionin a Brownian manner with each screen refresh. Lifetime ofa single dot was three animation frames (85 ms). Dots woulddisappear and then regenerate at a randomly selected stimu-lus location within the same stimulus patch. Motion coher-ence percent was corrected for this finite lifetime (Hansenet al., 2001).
Each patch subtended 10◦ × 14◦ of visual angle andwas separated by a dark stripe subtending 5◦ of visual an-gle, at a viewing distance of 57 cm. The stimulus programrandomly selected the stimulus patch that contained themotion signal. Stimulus duration for each trial was 2.3 s,followed by a response based on which panel contained
E. Conlon et al. / Neuropsychologia 42 (2004) 142–157 151
the coherently moving stimuli. The psychophysical proce-dure used was an adaptive three up, one down staircasetechnique, which was based on the percentage of targetdots (angular velocity= 7.0◦/s) within a single anima-tion frame of 28.6 ms. Catch trials at 66.7% coherencewere presented randomly at least once every five trials.Two blocks of test trials were conducted. The smallestproportion of coherently moving stimuli needed to de-tect coherent motion was defined as the threshold. Meancoherency was the geometric average of 8 of the last 10reversals for each block of trials. Beginning coherency was66.7%.
4.1.3. ProcedureEach participant was tested individually over two ses-
sions. In the first session all psychometric measures of wordidentification, general ability and memory and processingspeed were obtained. In the second, the temporal sequencingand motion coherence tasks were conducted. Psychophysi-cal testing took place in a darkened room with a mean lu-minance of 5 cd/m2. Half the participants did the motioncoherence task first and half the temporal sequencing task.Viewing distance was controlled by means of a chin rest andviewing was binocular.
4.2. Results and discussion
4.2.1. Memory and processing speedInitial analysis of the different forms of memory and pro-
cessing speed tasks revealed that the poor reader group per-formed less accurately on all components of the verbal digitspan tasks. Significant differences were found in digits for-ward, a verbal task similar to that used in the temporal se-quencing task,T(34) = 2.66, P = 0.012, digits backward,T(34) = 4.24, P < 0.0005, a measure of working mem-ory, and scaled verbal memory scores,T(34) = 3.96, P <
0.0005. The poor reader group also performed significantlyless accurately on the forward component of the spatialspan task,T(34) = 2.10, P = 0.041. With the spatial spanbackwards task and the scaled scores, which combined bothcomponents of the task, no between group differences werefound. Descriptive statistics for these measures are foundin Table 4. These data confirm previous findings of poorerperformance on tasks of memory and processing speed. Todetermine the impact of these different measures on perfor-mance on the temporal sequencing task, correlations wereinitially obtained between each measure and the individualstimulus conditions from the task. The verbal digits forwardcondition produced the strongest relationships with the tem-poral sequencing task. No significant relationships betweenthe two measures were found using accuracy scores on theone to four stimuli conditions. When five and six stimuliwere presented weak correlations were found, and whenseven to nine stimuli were presented the correlation betweenperformance on the two measures was stronger. These dataare presented inTable 5.
Table 5Correlations between number of stimuli presented in the temporal se-quencing task and the digits forward memory task (Experiment 3)
No. of stimuli insequence
Digits forward
1 0.1302 0.1173 0.2894 0.2195 0.382∗6 0.359∗7 0.544∗∗8 0.478∗∗9 0.556∗∗
∗ Significant at 0.05 level.∗∗ Significant at 0.01 level.
4.2.2. Temporal sequencing taskFor the single stimulus control condition of the tempo-
ral sequencing task all participants obtained accuracy scoresclose to 100%. No between group differences were found.Due to the ceiling effect found on performance, this condi-tion was not used in further analyses. The results demon-strate that when rapid sequencing is not required poor read-ers have no difficulty in target detection.
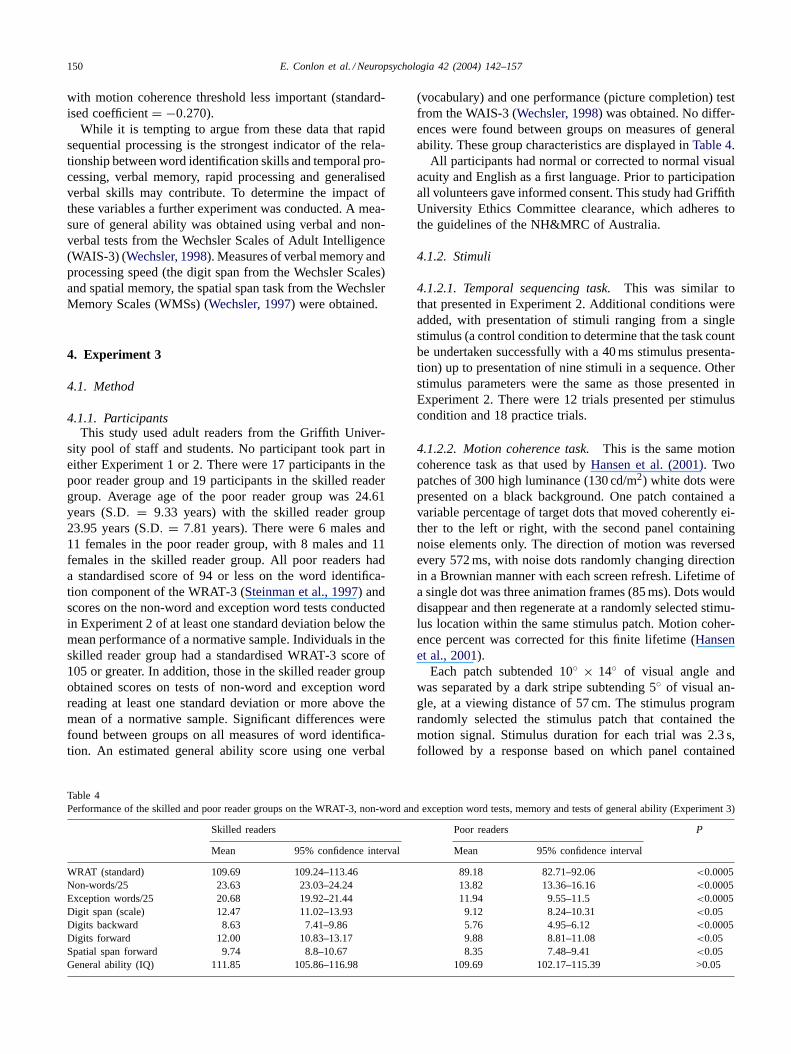
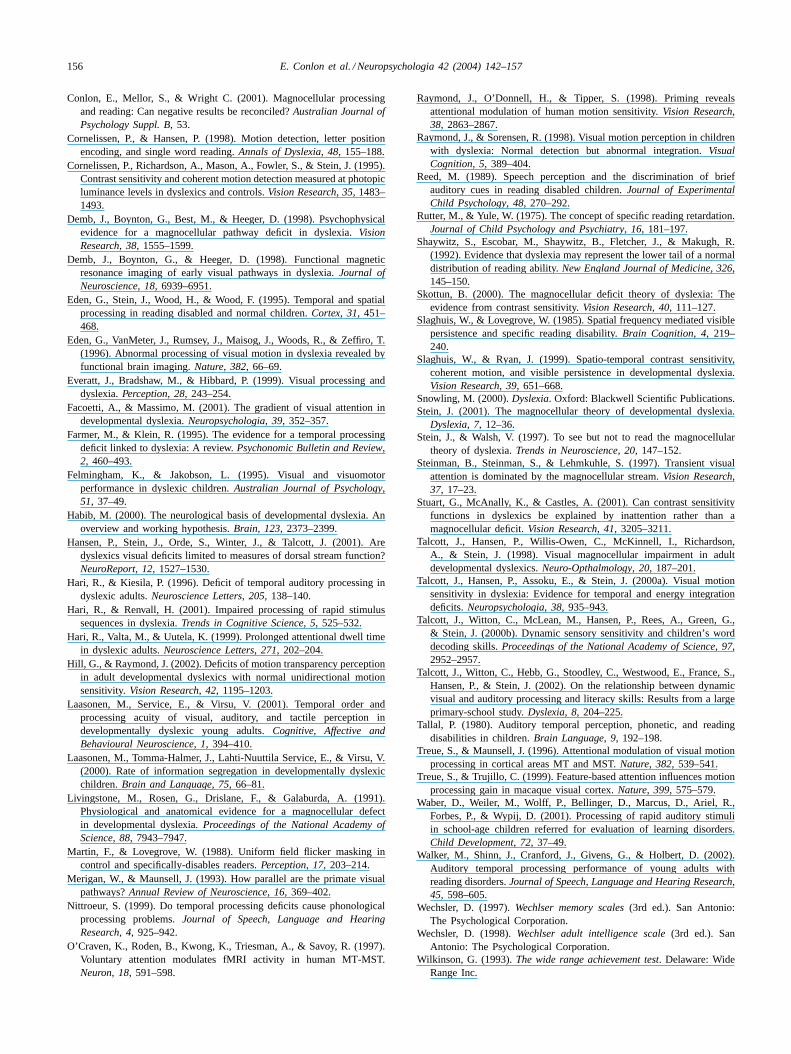
A mixed repeated measures analysis of covariance wasconducted on the remaining data. General ability and thedigits forward component of the digit span task were usedas covariates with the number correct for each of the stim-ulus conditions between two and nine used as repeatedmeasures. Reader group was the between groups factor.Evaluation of the assumptions of the analysis of covariancerevealed violation of the assumption of homogeneity ofregression between the different stimulus conditions andthe digits forward task. To deal with this violation, twoanalyses were conducted. The first used conditions that pre-sented between two and six stimuli. The second used theremaining three stimulus conditions. Using this techniqueall assumptions of the analyses were obeyed. In the anal-ysis using the two to six stimulus conditions, there was asignificant main effect for reader group,F(1, 29) = 20.94,P < 0.0005. There were no significant effects of the co-variates general ability,F(1, 32) = 0.365,P > 0.05 or thedigits forward task,F(1, 32) = 0.841, P > 0.05. No sig-nificant interactions were found. The between group effectsize,η2 accounted for 41.9% of the variance. In the secondanalysis a significant between groups effect was found,F(1, 29) = 6.24, P = 0.02. There was also a significanteffect of the covariate digits forward,F(1, 29) = 8.01,P = 0.008. The between group effect size,η2 accountedfor 17.7% of the variance. These results are presentedin Fig. 4. These data demonstrate that when groups donot differ on IQ and the effect of the short-term mem-ory and processing speed is removed from the analysisthe poor reader group still performs significantly less ac-curately than the skilled reader group across all stimuluspresentations.
152 E. Conlon et al. / Neuropsychologia 42 (2004) 142–157
Fig. 4. Temporal sequencing task showing performance of skilled and poor reader groups, Experiment 3. Adjusted means for general ability and verbalmemory and processing speed. Standard errors shown are the actual standard errors.
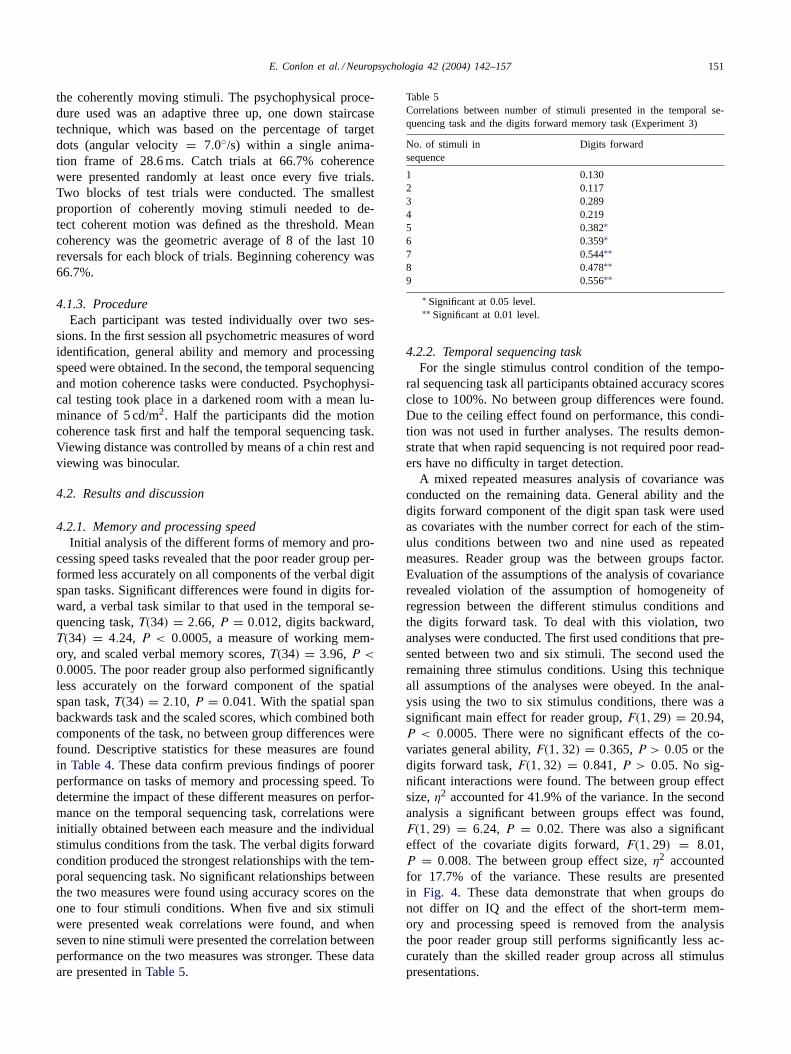
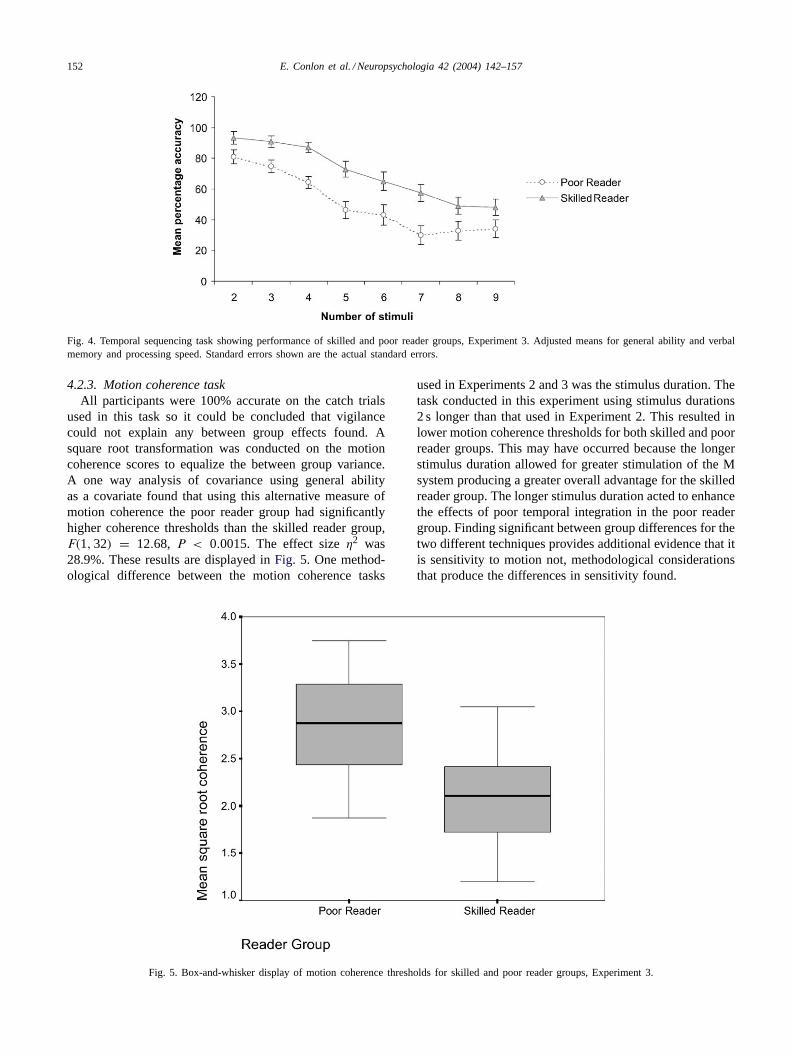
4.2.3. Motion coherence taskAll participants were 100% accurate on the catch trials
used in this task so it could be concluded that vigilancecould not explain any between group effects found. Asquare root transformation was conducted on the motioncoherence scores to equalize the between group variance.A one way analysis of covariance using general abilityas a covariate found that using this alternative measure ofmotion coherence the poor reader group had significantlyhigher coherence thresholds than the skilled reader group,F(1, 32) = 12.68, P < 0.0015. The effect sizeη2 was28.9%. These results are displayed inFig. 5. One method-ological difference between the motion coherence tasks
Fig. 5. Box-and-whisker display of motion coherence thresholds for skilled and poor reader groups, Experiment 3.
used in Experiments 2 and 3 was the stimulus duration. Thetask conducted in this experiment using stimulus durations2 s longer than that used in Experiment 2. This resulted inlower motion coherence thresholds for both skilled and poorreader groups. This may have occurred because the longerstimulus duration allowed for greater stimulation of the Msystem producing a greater overall advantage for the skilledreader group. The longer stimulus duration acted to enhancethe effects of poor temporal integration in the poor readergroup. Finding significant between group differences for thetwo different techniques provides additional evidence that itis sensitivity to motion not, methodological considerationsthat produce the differences in sensitivity found.
E. Conlon et al. / Neuropsychologia 42 (2004) 142–157 153
4.2.4. Relationships among measuresAs found in Experiment 2, a weak negative linear rela-
tionship was obtained between motion coherence thresholdand performance on the temporal sequencing task,r(34) =−0.304,P = 0.076. This relationship accounted for 9.24%of the variance. This finding confirms the result of Experi-ment 2 that the two tasks are predominantly measuring dif-ferent things.
A hierarchical multiple regression analysis was conductedusing word identification scores on the WRAT-3 as the de-pendent variable. At step 1, general ability and the measureof short-term memory and processing speed (digits forward)were entered to partial out the effect of performance on thetemporal sequencing and motion coherence tasks at step 2.A total correct temporal sequencing score was obtained, bysumming the number correct across the different stimulusconditions. Square root motion coherence thresholds wereused as the measure for motion coherence. All assumptionsof the multiple regression analysis were obeyed. Twenty-twopercent of the variance in word identification score was ac-counted for using the combined effect of general ability andshort-term memory and processing speed,F(2, 30) = 4.43,P = 0.025. The measure of short-term memory and process-ing speed made a significant independent contribution to therelationship,T(30) = 2.61, P = 0.02. A further 36.7% ofthe variance was accounted for at step 2,F(2, 28) = 12.71,P < 0.0005. Both the temporal sequencing,T(28) = 3.65,P < 0.005 and motion coherence tasks,T(28) = −2.79,P = 0.009 made significant independent contributions toword identification scores. The squared semi-partial corre-lation for the temporal sequencing task showed that 19.27%of the variance in word identification skill was indepen-dently accounted for with this measure. This is about halfthat found in Experiment 2. Motion coherence threshold in-dependently accounted for 11.29% of the variance in wordidentification skill.
A discriminant function analysis was conducted to deter-mine how well the two temporal processing measures dis-criminated between skilled and poor readers. There were93.8% of poor readers and 89.5% of skilled readers correctlyclassified using the temporal sequencing task and motion co-herence thresholds as independent variables. Inspection ofthe structure matrix reveals that both measures contributedsignificantly to this classification with the coefficient fortemporal counting 0.794 and for motion coherence,−0.556.This finding reflects the greater contribution of the motioncoherence task used in this study to the outcome than thatfound in Experiment 2. The stronger effect of the temporalsequencing task was repeated.
5. General discussion
The results of the experiments show that the two tempo-ral processing measures distinguish between reader groupswhether they had a childhood history of dyslexia or could
be classified as poor readers, not specifically dyslexic. Weakrelationships were found between the two measures of tem-poral processing, suggesting that they predominantly mea-sure different aspects of temporal function. In the final twoexperiments performance on the temporal sequencing taskwas a stronger predictor of performance on the word identi-fication task than performance on the motion coherence task.These data support earlier predictions of an association be-tween rapid sequencing and poor reading skills (Eden et al.,1995; Hari & Renvall, 2001). Each of these findings will bediscussed separately.
5.1. Visual temporal processing and poor reading skills
Early investigations of a temporal processing deficit inthe visual domain found performance differences betweendyslexic and control groups. The results of the experimentsreported here demonstrates that poor temporal processing in-fluences performance in readers with dyslexia and also thosewith poor word identification skills in both the phonologicaland orthographic domains. Participants in Experiment 1 hada childhood history of dyslexia, with those in the latter twostudies having low scores on tests of word identification andphonological and orthographic processing. These data showthat it is not a classification of dyslexia only that is impli-cated when considering poor temporal processing skills, butpoor literacy skills generally. A number of studies that haveused unselected reader samples supports this finding (Au &Lovegrove, 2001; Conlon et al., 2001; Talcott et al., 2000b,2002). Borsting et al. (1996), andSlaghuis and Ryan (1999)have demonstrated in adults and children respectively thatpoor performance on measures of both orthographic andphonological processing produces significant difficulties intemporal processing for these groups. Efficiency of temporalprocessing skills may form a normal distribution with poorerperformers corresponding to the lower tail in the same waythatShaywitz et al. (1992)predict occurs in the distributionof reading skills.
5.2. Relationship between temporal processing tasks
Regardless of the type of motion coherence task usedthe relationship between coherence threshold and accuracyof temporal sequencing was similar. Two of the possibleexplanations for the weak correlation found between per-formance on the two tasks are: (1) the two tasks measuredifferent aspects of temporal processing with the first ameasure of temporal integration of motion signals and thesecond a measure of temporal separation of stimulus eventsand (2) the temporal sequencing task while being a measureof efficiency of temporal separation also has additional at-tentional and perceptual components that may contribute toperformance efficiency. Addition of this attentional compo-nent may make processing in the temporal sequencing task atwo-stage process, with the first a stage sensory, and the sec-ond attentional. This attentional component may either be a
154 E. Conlon et al. / Neuropsychologia 42 (2004) 142–157
function of the M system, or may be part of a higher-levelattentional processing mechanism. In the temporal sequenc-ing task attention is focused on a specific spatial location. Inaddition, with sudden onset of a stimulus automatic attentionbecomes dominant in the attended location with presentationof the specific stimulus accelerating visual processing in theregion of stimulus presentation (Facoetti & Massimo, 2001).The M system has been implicated in directing this form ofattention (Raymond, O’Donnell, & Tipper, 1998; Steinmanet al., 1997). Supporting evidence includes findings that sen-sitivity to motion at MT and MT+ in single cell recordingscan be influenced by the attentional state of the receptivefield (Treue & Maunsell, 1996; Treue & Trujillo, 1999).Using functional MRI technology these findings have beenextended to demonstrate an increased level of activationat MT/MT+ on the basis of a manipulation of attention tospecific stimulus attributes (Buchel et al., 1998; O’Craven,Roden, Kwong, Triesman, & Savoy, 1997). In addition toincreases in activity at MT with an attention manipulation,Buchel et al. (1998)found increased activity in the poste-rior parietal cortex, and suggested, that activity is increasedin MT/MT+ with a top–down feedback loop from PPC.This feedback loop acts to modulate sensory performance.In this study attentional components were not manipulatedin the two motion coherence tasks. While the specific neu-ral location of processing for the temporal sequencing taskis unknown, the importance of attentional components insimilar tasks, for example, the attentional blink, is well doc-umented (Hari et al., 1999). Hari and Renvall (2001)haveargued that poor performance on rapid sequential process-ing tasks is a measure of ‘sluggish attentional shifting’, aneffect predicted to occur in the PPC. These data support thisprediction.
Supporting evidence of the impact of increasing percep-tual load has also been obtained.Ben-Yehudah et al. (2001)found that performance on the temporal CSF only differedbetween a dyslexic and control group when a sequentialcomponent was introduced into the 2AFC task. They ar-gued that components of higher order perceptual memoryneeded in a retain-and-compare paradigm could explaintheir results. Perceptual memory cannot explain the resultsobtained in this study as the task required only that stimulibe counted, not compared.Hill and Raymond (2002)usinga motion transparency task that required identification oftwo directions of motion presented simultaneously, foundthat performance discriminated between dyslexic and con-trol readers more consistently than a motion coherencetask. Both findings suggest that increased perceptual loadimpacts performance when processing the temporal aspectsof a stimulus. The sensory and behavioural components ofthe task may interact. Further research, which separates therole of low-level sensory processing and high-level per-ceptual events, is required to differentiate the contributionof sensory and higher order components. The sensory andhigher order aspects of visual temporal processing mayexplain the differences found in the relationship between
performance on the temporal tasks and word identificationskills.
5.3. Temporal processing and word identification skills
Consistent with the results of previous research this studyhas shown that poor adult readers are also less sensitive thanskilled readers on the motion coherence task (Raymond &Sorensen, 1998; Talcott et al., 2000a,b). In poor readers,summation is required over a larger number of receptivefields to determine the presence of stimulus motion.Talcottet al. (2000b)predict that this occurs as a result of poor abil-ity to integrate sensory signals. The results from the spatialand temporal sequencing tasks also replicate those ofEdenet al. (1995)who found poorer temporal sequencing accu-racy in a sample of dyslexic children. Other temporal pro-cessing tasks, for example persistence measures, have alsoproduced significant between group differences among lesswell defined reader groups (Au & Lovegrove, 2001). Whileboth tasks used in this study made significant independentcontributions to word identification skills, the temporal se-quencing task accounted for a much larger proportion of thevariance in Experiment 2. In Experiment 3 where generalability and memory were taken into account, the percentageof the variance accounted for was reduced but still greaterthan that found for the motion coherence task.
There are two aspects of the temporal sequencing taskthat may have produced difficulties for poor readers. Theseare the individuation of stimulus events (sensory compo-nent) and the sequential nature of the task. The temporalsequencing task required individuation of separate stimuluscomponents. When a single stimulus was presented as acontrol condition in Experiment 3 no differences in perfor-mance were found between skilled and poor reader groups.Less accurate performance of the poor reader group evenwhen two to six stimulus events were presented is based onthe explanation that the ISIs used were not long enough toallow poor readers to distinguish between presentations ofseparate stimulus presentations. The ISIs used in this studywere based on previous research on visible persistencewhere participants were required to detect the presence ofa gap between presentation of two identical stimuli. Theminimum ISI used was longer than those found previouslyfor average readers to successfully detect the gap (Au &Lovegrove, 2001). Detection of the gap may be less per-ceptually demanding than performance on a task whereattention is directed to the specific stimulus presentations.This sequencing task did not require identification of thestimulus but detection of individual stimulus presentations.Detection of individual stimulus components may requirelonger gaps between stimulus presentations for the poorreader group. Previous research where no between groupdifferences were found in rapid sequential processing tasksused longer stimulus ISIs and stimulus durations than thosepresented in this study (Brydon, 1972). An alternative ex-planation of the less accurate performance of the poor reader
E. Conlon et al. / Neuropsychologia 42 (2004) 142–157 155
group on the temporal sequencing task may be the stimulusduration used. Repeated presentations of a short durationstimulus may increase the signal to noise ratio in the vi-sual system, resulting in poor detection of individual events(Laasonen et al., 2001). Some support for this explanationhas been obtained in the auditory domain (Walker et al.,2002). Hari and Renvall (2001)have argued that difficultieswith the rapid sequencing component of the task is the linkbetween poor word reading and temporal processing. Fur-ther research is required to determine the exact nature ofthis link.
One of the criticisms of much research that has inves-tigated sequential processing has been the influence ofmemory on task performance. For example, one of themethodologies used has been to present two sequences ofvisual stimuli, the task to determine if presentation of thetwo sequences is the same (Zurif & Carson, 1970). Thetask presented here did not require memory of the wholesequence but detection of individual components. The re-sults of the comparable spatial task where the stimuli werepresented simultaneously showed that poorer memory couldnot explain these data, particularly with presentation ofthe shorter stimulus sequences. In Experiment 3 the influ-ence of a verbal memory and processing speed task whereparticipants were required to repeat a series of digits waspartialled out of the analysis. This measure was not relatedto performance on the sequential counting task, when upto four stimuli were presented in a single sequence. Thesedata show performance was still significantly less accurateamong poor readers when performance on this measure andthat of general ability was removed from the analysis. Thisshows that memory cannot be used as an explanation.
The relationship between sequencing rapidly presentedtemporal information and word identification skills may beexplained by the combination of a sensory processing deficitin the M system (Stein & Walsh, 1997), and difficulties withattentional shifting (Hari & Renvall, 2001). This attentionalcomponent may be M in origin or a higher-level componentof processing that influences lower level sensory events inthe M pathway. Overall this produces a slower rate of pro-cessing of temporal signals. The way that this subtle dys-function is related to the reading process is less clear. Inan above section, research showing that attention to spe-cific stimulus attributes can modulate performance in thedetection of the sensory components of the stimulus waspresented. This modulating effect may occur as a result ofthe interaction between top–down (signals possibly emanat-ing from the attentional processing areas of PPC) and bot-tom up (sensory) M processing. One of the consequencesof poorer capacity to utilize the M components of attentioncould produce poorer temporal sequencing capacity in lessskilled readers. A number of researchers have previouslyimplicated these poor sequencing skills in phonological pro-cessing (Cestnick & Coltheart, 1999), orthographic process-ing (Cornelissen & Hansen, 1998) and letter identification(Hari et al., 1999) tasks.
6. Conclusion
This study has demonstrated that in poor adult readersthere may be different aspects of temporal function relatedto reading skill. First, this study has replicated previousresearch showing the existence of a low-level sensorydeficit in temporal processing. Second, the involvement ofhigher-level attentional components has been demonstrated.Whether these components are a function of M system pro-cessing or a higher-level perceptual effect, which influenceslower level sensory processing is yet to be determined. Thefunctional differences between tasks that measure differentaspects of temporal processing and the effects of manipula-tions that selectively stimulate sensory function at basic andhigher attentional and perceptual levels should be furtherinvestigated. A slower rate of processing may explain therelationship between reading and temporal processing. Thismay be most clearly demonstrated with higher-level per-ceptual processing tasks where the mechanisms of attentionare involved.
Acknowledgements
Professor John Stein, Dr. Peter Hansen and Dr. Joel Tal-cott for very kindly supplying the motion task used in Ex-periment 3. Earlier reviewers of this manuscript who mademany helpful suggestions.
References
Amitay, S., Ben-Yehudah, G., Banai, K., & Ahissar, M. (2002). Disabledreaders suffer from visual and auditory impairments but not from aspecific magnocellular deficit.Brain, 125, 2272–2285.
Au, A., & Lovegrove, B. (2001). Temporal processing ability in aboveaverage and average readers.Perception and Psychophysics, 63, 148–155.
Ben-Yehudah, G., Sackett, E., Malchi-Ginzberg, L., & Ahissar, M.(2001). Impaired temporal contrast sensitivity in dyslexics is specificto retain-and-compare paradigms.Brain, 124, 1381–1395.
Bisley, F., & Pasternak, T. (2000). The multiple roles of visual corticalareas MT/MST in remembering the direction of visual motion.CerebralCortex, 10, 1053–1065.
Boder, E., & Jarrico, S. (1982).The Boder test of reading-spelling patterns.San Antonio: The Psychological Corporation.
Borsting, E., Ridder, W., Dudeck, K., Kelley, C., Matsui, L., & Motoyama,J. (1996). The presence of a magnocellular deficit depends on the typeof dyslexia.Vision Research, 36, 1047–1053.
Brydon, M. (1972). Auditory-visual and sequential-spatial matching inrelation to reading ability.Child Development, 43, 824–832.
Buchel, C., Josephs, O., Rees, G., Turner, R., Firth, C., & Friston, K.(1998). The functional anatomy of attention to visual motion.Brain,121, 1281–1294.
Cestnick, L., & Coltheart, M. (1999). The relationship betweenlanguage-processing and visual-processing deficits in developmentaldyslexia.Cognition, 71, 231–255.
Chiappe, P., Stringer, R., Siegel, L., & Stanovich, K. (2002). Why thetiming deficit hypothesis does not explain reading disability in adults.Reading and Writing: An Interdisciplinary Journal, 15, 73–107.
156 E. Conlon et al. / Neuropsychologia 42 (2004) 142–157
Conlon, E., Mellor, S., & Wright C. (2001). Magnocellular processingand reading: Can negative results be reconciled?Australian Journal ofPsychology Suppl. B, 53.
Cornelissen, P., & Hansen, P. (1998). Motion detection, letter positionencoding, and single word reading.Annals of Dyslexia, 48, 155–188.
Cornelissen, P., Richardson, A., Mason, A., Fowler, S., & Stein, J. (1995).Contrast sensitivity and coherent motion detection measured at photopicluminance levels in dyslexics and controls.Vision Research, 35, 1483–1493.
Demb, J., Boynton, G., Best, M., & Heeger, D. (1998). Psychophysicalevidence for a magnocellular pathway deficit in dyslexia.VisionResearch, 38, 1555–1599.
Demb, J., Boynton, G., & Heeger, D. (1998). Functional magneticresonance imaging of early visual pathways in dyslexia.Journal ofNeuroscience, 18, 6939–6951.
Eden, G., Stein, J., Wood, H., & Wood, F. (1995). Temporal and spatialprocessing in reading disabled and normal children.Cortex, 31, 451–468.
Eden, G., VanMeter, J., Rumsey, J., Maisog, J., Woods, R., & Zeffiro, T.(1996). Abnormal processing of visual motion in dyslexia revealed byfunctional brain imaging.Nature, 382, 66–69.
Everatt, J., Bradshaw, M., & Hibbard, P. (1999). Visual processing anddyslexia.Perception, 28, 243–254.
Facoetti, A., & Massimo, M. (2001). The gradient of visual attention indevelopmental dyslexia.Neuropsychologia, 39, 352–357.
Farmer, M., & Klein, R. (1995). The evidence for a temporal processingdeficit linked to dyslexia: A review.Psychonomic Bulletin and Review,2, 460–493.
Felmingham, K., & Jakobson, L. (1995). Visual and visuomotorperformance in dyslexic children.Australian Journal of Psychology,51, 37–49.
Habib, M. (2000). The neurological basis of developmental dyslexia. Anoverview and working hypothesis.Brain, 123, 2373–2399.
Hansen, P., Stein, J., Orde, S., Winter, J., & Talcott, J. (2001). Aredyslexics visual deficits limited to measures of dorsal stream function?NeuroReport, 12, 1527–1530.
Hari, R., & Kiesila, P. (1996). Deficit of temporal auditory processing indyslexic adults.Neuroscience Letters, 205, 138–140.
Hari, R., & Renvall, H. (2001). Impaired processing of rapid stimulussequences in dyslexia.Trends in Cognitive Science, 5, 525–532.
Hari, R., Valta, M., & Uutela, K. (1999). Prolonged attentional dwell timein dyslexic adults.Neuroscience Letters, 271, 202–204.
Hill, G., & Raymond, J. (2002). Deficits of motion transparency perceptionin adult developmental dyslexics with normal unidirectional motionsensitivity.Vision Research, 42, 1195–1203.
Laasonen, M., Service, E., & Virsu, V. (2001). Temporal order andprocessing acuity of visual, auditory, and tactile perception indevelopmentally dyslexic young adults.Cognitive, Affective andBehavioural Neuroscience, 1, 394–410.
Laasonen, M., Tomma-Halmer, J., Lahti-Nuuttila Service, E., & Virsu, V.(2000). Rate of information segregation in developmentally dyslexicchildren.Brain and Language, 75, 66–81.
Livingstone, M., Rosen, G., Drislane, F., & Galaburda, A. (1991).Physiological and anatomical evidence for a magnocellular defectin developmental dyslexia.Proceedings of the National Academy ofScience, 88, 7943–7947.
Martin, F., & Lovegrove, W. (1988). Uniform field flicker masking incontrol and specifically-disables readers.Perception, 17, 203–214.
Merigan, W., & Maunsell, J. (1993). How parallel are the primate visualpathways?Annual Review of Neuroscience, 16, 369–402.
Nittroeur, S. (1999). Do temporal processing deficits cause phonologicalprocessing problems.Journal of Speech, Language and HearingResearch, 4, 925–942.
O’Craven, K., Roden, B., Kwong, K., Triesman, A., & Savoy, R. (1997).Voluntary attention modulates fMRI activity in human MT-MST.Neuron, 18, 591–598.
Raymond, J., O’Donnell, H., & Tipper, S. (1998). Priming revealsattentional modulation of human motion sensitivity.Vision Research,38, 2863–2867.
Raymond, J., & Sorensen, R. (1998). Visual motion perception in childrenwith dyslexia: Normal detection but abnormal integration.VisualCognition, 5, 389–404.
Reed, M. (1989). Speech perception and the discrimination of briefauditory cues in reading disabled children.Journal of ExperimentalChild Psychology, 48, 270–292.
Rutter, M., & Yule, W. (1975). The concept of specific reading retardation.Journal of Child Psychology and Psychiatry, 16, 181–197.
Shaywitz, S., Escobar, M., Shaywitz, B., Fletcher, J., & Makugh, R.(1992). Evidence that dyslexia may represent the lower tail of a normaldistribution of reading ability.New England Journal of Medicine, 326,145–150.
Skottun, B. (2000). The magnocellular deficit theory of dyslexia: Theevidence from contrast sensitivity.Vision Research, 40, 111–127.
Slaghuis, W., & Lovegrove, W. (1985). Spatial frequency mediated visiblepersistence and specific reading disability.Brain Cognition, 4, 219–240.
Slaghuis, W., & Ryan, J. (1999). Spatio-temporal contrast sensitivity,coherent motion, and visible persistence in developmental dyslexia.Vision Research, 39, 651–668.
Snowling, M. (2000).Dyslexia. Oxford: Blackwell Scientific Publications.Stein, J. (2001). The magnocellular theory of developmental dyslexia.
Dyslexia, 7, 12–36.Stein, J., & Walsh, V. (1997). To see but not to read the magnocellular
theory of dyslexia.Trends in Neuroscience, 20, 147–152.Steinman, B., Steinman, S., & Lehmkuhle, S. (1997). Transient visual
attention is dominated by the magnocellular stream.Vision Research,37, 17–23.
Stuart, G., McAnally, K., & Castles, A. (2001). Can contrast sensitivityfunctions in dyslexics be explained by inattention rather than amagnocellular deficit.Vision Research, 41, 3205–3211.
Talcott, J., Hansen, P., Willis-Owen, C., McKinnell, I., Richardson,A., & Stein, J. (1998). Visual magnocellular impairment in adultdevelopmental dyslexics.Neuro-Opthalmology, 20, 187–201.
Talcott, J., Hansen, P., Assoku, E., & Stein, J. (2000a). Visual motionsensitivity in dyslexia: Evidence for temporal and energy integrationdeficits.Neuropsychologia, 38, 935–943.
Talcott, J., Witton, C., McLean, M., Hansen, P., Rees, A., Green, G.,& Stein, J. (2000b). Dynamic sensory sensitivity and children’s worddecoding skills.Proceedings of the National Academy of Science, 97,2952–2957.
Talcott, J., Witton, C., Hebb, G., Stoodley, C., Westwood, E., France, S.,Hansen, P., & Stein, J. (2002). On the relationship between dynamicvisual and auditory processing and literacy skills: Results from a largeprimary-school study.Dyslexia, 8, 204–225.
Tallal, P. (1980). Auditory temporal perception, phonetic, and readingdisabilities in children.Brain Language, 9, 192–198.
Treue, S., & Maunsell, J. (1996). Attentional modulation of visual motionprocessing in cortical areas MT and MST.Nature, 382, 539–541.
Treue, S., & Trujillo, C. (1999). Feature-based attention influences motionprocessing gain in macaque visual cortex.Nature, 399, 575–579.
Waber, D., Weiler, M., Wolff, P., Bellinger, D., Marcus, D., Ariel, R.,Forbes, P., & Wypij, D. (2001). Processing of rapid auditory stimuliin school-age children referred for evaluation of learning disorders.Child Development, 72, 37–49.
Walker, M., Shinn, J., Cranford, J., Givens, G., & Holbert, D. (2002).Auditory temporal processing performance of young adults withreading disorders.Journal of Speech, Language and Hearing Research,45, 598–605.
Wechsler, D. (1997).Wechlser memory scales (3rd ed.). San Antonio:The Psychological Corporation.
Wechsler, D. (1998).Wechlser adult intelligence scale (3rd ed.). SanAntonio: The Psychological Corporation.
Wilkinson, G. (1993).The wide range achievement test. Delaware: WideRange Inc.

E. Conlon et al. / Neuropsychologia 42 (2004) 142–157 157
Williams, M., & LeCluyse, K. (1990). Perceptual consequences of atemporal processing deficit in reading disabled children.Journal of theAmerican Optometric Association, 61, 111–121.
Williams, M., Stuart, G., Castles, A., & McAnally, K. (2003). Contrastsensitivity in subgroups of developmental dyslexics.Vision Research,43, 467–477.
Witton, C., Talcott, J., Hansen, P., Richardson, A., Griffiths, T., Rees,A., Stein, J., & Green, G. (1998). Sensitivity to dynamic auditory andvisual stimuli predicts non-word reading ability in both dyslexic andnormal readers.Current Biology, 8, 791–797.
Zurif, E., & Carson, G. (1970). Dyslexia in relation to cerebral dominanceand temporal analysis.Neuropsychologia, 8, 351–361.