Embed Size (px)
Citation preview

ORIGINAL PAPER
Temporal variation in the arsenic and metal accumulationin the maritime pine tree grown on contaminated soils
P. J. C. Favas • J. Pratas • M. N. V. Prasad
Received: 13 November 2011 / Revised: 28 April 2012 / Accepted: 9 October 2012 / Published online: 31 October 2012
� CEERS, IAU 2012
Abstract The uptake of arsenic and other metals (iron,
manganese, copper, zinc, lead, nickel and tungsten) by Pinus
pinaster Aiton (the maritime pine tree) growing in soils and
tailings around an abandoned mine (northern Portugal) was
investigated. Aerial parts of Pinus pinaster trees were sam-
pled from three substrate areas: a background area, in mine
contaminated soils and in tailings. Vegetation material was
separated into needles and stems and subdivided into tissues
of different maturities (1-, 2-, 3- and 4-years-old). The
sampling of the substrate in each area was also undertaken.
In general, vegetation concentrations were strongly related to
substrate concentrations. The results show that the contents
of several elements depend as much on the plant organ as on
the age of the tissue. For the researched elements, this species
shows a great variability in behavior depending on the age of
the organ. The data indicate that the older needles constitute
the best samples for use in a conjunct biogeochemical anal-
ysis of these elements.
Keywords Bioaccumulation � Bioindicator �Biogeochemistry � Biomonitoring � Mine tailings �Pinus pinaster Aiton. � Vale das Gatas mine
Introduction
The use of vegetal species as contamination indicators usually
takes into account the abilities of these species to accumulate
heavy metals and other chemical elements or compounds
(e.g., Kabata-Pendias 2010; Wittig 1993). Meanwhile, this
accumulation generally does not change linearly with time,
and varies either seasonally or with the age of the sampled
organs (Kuang et al. 2007; Pratas et al. 2004, 2005). In the first
case of variation, the solution to characterizing the variation
of the accumulation of compounds lies in the orientation of
the sampling campaign for a certain period of time, and in the
second case of variation the introduction of the factor ‘‘age of
the material collected’’ reveals the need for detailed studies.
During the last two decades, there has been an increase in
the study of tree leaves as bioaccumulators of trace elements
in the vicinity of industrial plants (e.g., Dmuchowski et al.
2011; Oliva and Mingorance 2006; Rodriguez et al. 2012)
and in urban environments (e.g., Baycu et al. 2006; Gueguen
et al. 2012; Kord et al. 2010; Liu et al. 2007; Sawidis et al.
2011). In addition, although not as numerous, there have also
been studies of tree leaves as bioaccumulators in rural and
background areas (e.g., Chiarenzelli et al. 2001; Coskun
2006). Besides the potential use for biogeochemical pros-
pecting and environmental biomonitoring, those metal-tol-
erant perennials plants with high biomass and bioproductivity
can also be useful in phytostabilization and mine restoration
(Hooper and Vitousek 1997; Pratas et al. 2005).
According to Aboal et al. (2004), there is a large amount
of information available on the concentrations of trace
P. J. C. Favas (&)
Department of Geology, School of Life Sciences and the
Environment, University of Tras-os-Montes e Alto Douro,
5001-801 Vila Real, Portugal
e-mail: [email protected]
P. J. C. Favas � J. Pratas
IMAR-CMA Marine and Environmental Research Centre,
Faculty of Sciences and Technology, University of Coimbra,
3001-401 Coimbra, Portugal
J. Pratas
Department of Earth Sciences, Faculty of Sciences and
Technology, University of Coimbra, 3001-401 Coimbra,
Portugal
M. N. V. Prasad
Department of Plant Sciences, University of Hyderabad,
Hyderabad 500046, India
123
Int. J. Environ. Sci. Technol. (2013) 10:809–826
DOI 10.1007/s13762-012-0115-x

elements in the leaves and needles of trees commonly used
as biomonitors such as Pinus sylvestris, Picea abies and
Quercus ilex. All of these species are common in either
northern Europe or southern Europe but are not found at
more temperate latitudes; therefore, similar alternative
species must be selected to allow studies of this type in
these areas. According to Aboal et al. (2004), from among
the possible alternatives, Quercus robur and Pinus pinaster
are good candidates because of their distribution; however,
to date, biomonitoring studies involving these species have
been very limited.
Bargagli (1993) used the needles of Pinus pinaster as
biomonitors of natural and anthropogenic emissions of
mercury (Hg). Aboal et al. (2004) used the needles of Pinus
pinaster as biomonitors of airborne trace element pollution.
Pinus pinaster needles have been reported to accumulate
aluminum (Al), arsenic (As), cadmium (Cd), copper (Cu),
chromium (Cr), iron (Fe), Hg, manganese (Mn), nickel
(Ni), lead (Pb) and zinc (Zn). Pratas et al. (2004, 2005)
studied the needles and stems of Pinus pinaster as the
indicators for delineating areas of anomalous soil compo-
sition in the biogeochemical prospecting of As, antimony
(Sb) and tungsten (W).
In biogeochemical studies, the application of the bio-
logical absorption coefficient (BAC) is very common as a
bioaccumulation indicator of the chemical elements. The
BAC is one of the most important biogeochemical param-
eters for the verification of the relationships between plants
and soil for each element, and Kovalevskii (1979) and
Brooks (1983) defined the BAC as the relationship between
the concentration of an element in the ashes or in the dry
plant material, Cp, and the concentration of the same ele-
ment in the substrate, Cs, (BAC = Cp/Cs). Nagaraju and
Karimulla (2002) reported that Perelman classified the
values of BAC into five groups (intensive absorption, BAC
10–100; strong absorption, BAC 1–10; intermediate
absorption, BAC 0.1–1; weak absorption, BAC 0.01–0.1;
and very weak absorption, BAC 0.001–0.01).
The objective of the present study was to evaluate the
temporal variation of As and heavy metals (Fe, Mn, Cu,
Zn, Pb, Ni and W) in tissues of different ages of maritime
pine trees (Pinus pinaster Aiton) grown on mine tailings
and soils in the area surrounding the abandoned Vale das
Gatas mine (N Portugal).
Studied area
The Vale das Gatas mine is located in the district of Vila
Real in northern Portugal (Fig. 1). The geological units that
emerge in this sector are metasedimentary rocks (Schist-
Metagraywacke Complex), Hercynian granites and veinous
rocks (mineralized and non-mineralized) (Fig. 1).
The Vale das Gatas granite (VGG) is affected by frac-
ture families that are distributed according to preferential
directions. Some of these fractures are filled with quartz,
aplite and pegmatite, which support W, tin (Sn) and sulfide
mineralizations.
The paragenesis defined for the deposition stages
indicated that wolframite is the most plentiful mineral;
cassiterite, scheelite, several sulfides (pyrite, chalcopy-
rite, sphalerite, galena, arsenopyrite, pyrrhotite, stannite,
covellite, marcasite), silver (Ag), Pb and bismuth (Bi)
sulfosalts and native Bi were also present. The minerals
that support mineralization are essentially quartz, fluorite
and muscovite.
Topographic elevations in the Vale das Gatas mine area
vary between 310 and 815 m. In recent years, the average
annual precipitation was 816 mm and the average annual
temperature was 13.9 �C. The annual precipitation in the
area varied from a minimum of 12.8 mm in August to a
maximum of 142 mm in January and the temperature
varies between 5.4 �C in January and 23 �C in August. In
this region, the characteristic soil units are Leptosols,
Cambisols and Anthrosols. The dominant soil unit of the
studied area is the Leptosol type, which consists of soils
whose principal characteristic is the presence of bedrock at
20 cm below the surface. These soils are divided into a
distric (acid) sub-unit associated with the metasedimentary
rocks and an umbric (acid and organic-rich) sub-unit
associated with granitic rocks.
The Vale das Gatas mine, exploited in the past by the
Romans, was in regular operation between 1883 and 1992.
The mining operation was conducted underground. Wol-
framite and scheelite were mined for W, and cassiterite was
mined for Sn. However, there has been no mining in the
area since 1992, and the mine was abandoned without any
environmental remediation. The tailings, which still con-
tain metals, were deposited on the ground. Exposure of
these materials to air and water produces acidic water,
facilitating the release of contaminants into the surrounding
environments (Avila et al. 2005; Favas 2002; Salgueiro
et al. 2008). In this mine site, tailings and acid drainage
from the mine galleries (Fig. 2) are the major sources of
metallic pollution. The area is crossed by a stream which
contributes to the dispersion of contamination.
Materials and methods
Sampling and sample preparation
The samples of Pinus pinaster were collected in five
sampling areas: three sampling areas outside of the mine
influence (A, B and C); in one area (D) in which contam-
ination resulting from the dispersion of the tailings was
810 Int. J. Environ. Sci. Technol. (2013) 10:809–826
123

previously detected (Favas 2002) and in one area with
tailings (Fig. 2). The sampling methodology followed the
orientations defined by Brooks (1983), Ozdemir (2005) and
Sun et al. (2009). The needles, stems and rooting soils of
Pinus pinaster were collected at the five locations in late
July and early August, during the dry season of the year.
Fig. 1 Location of the Vale das Gatas mine area on the map of Portugal and a simplified geological map of the abandoned Vale das Gatas mine
Int. J. Environ. Sci. Technol. (2013) 10:809–826 811
123
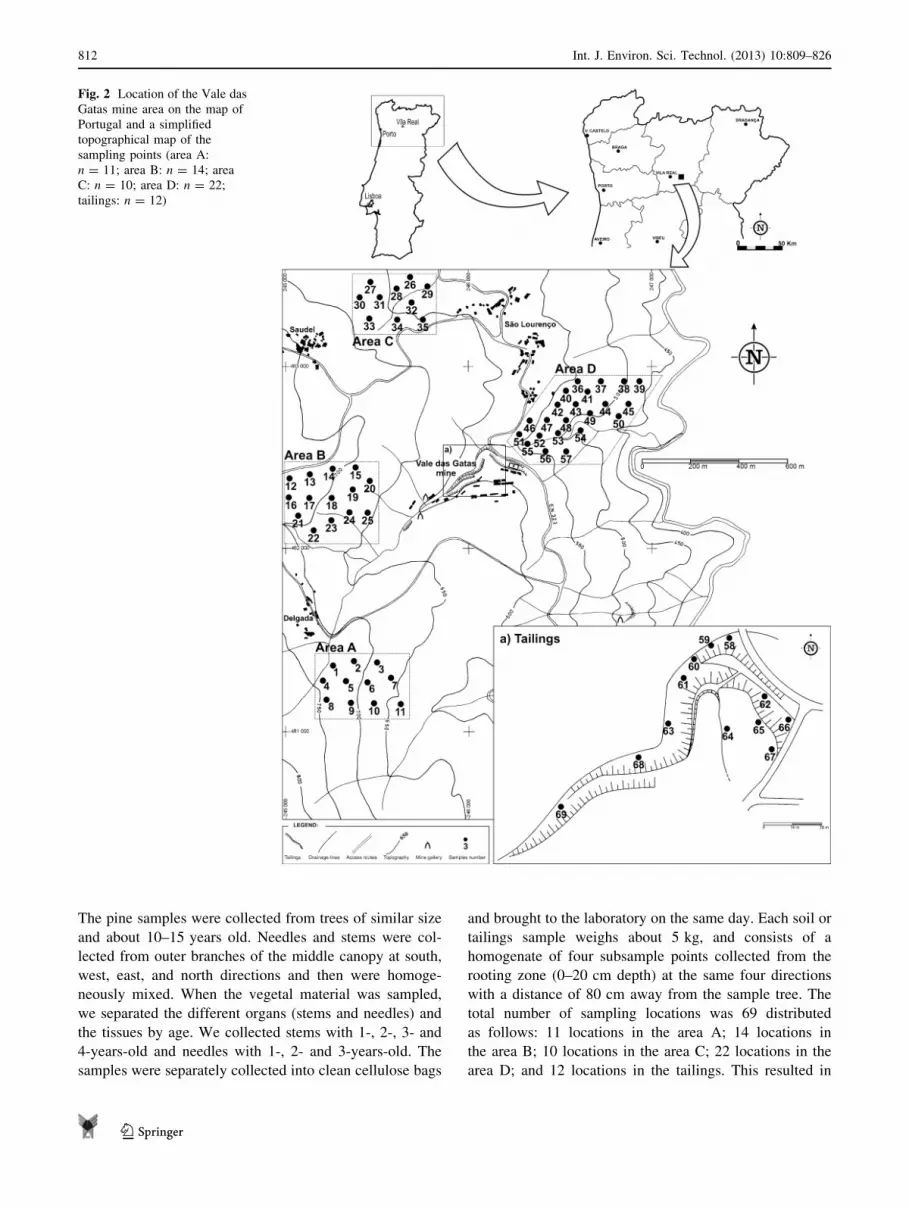
The pine samples were collected from trees of similar size
and about 10–15 years old. Needles and stems were col-
lected from outer branches of the middle canopy at south,
west, east, and north directions and then were homoge-
neously mixed. When the vegetal material was sampled,
we separated the different organs (stems and needles) and
the tissues by age. We collected stems with 1-, 2-, 3- and
4-years-old and needles with 1-, 2- and 3-years-old. The
samples were separately collected into clean cellulose bags
and brought to the laboratory on the same day. Each soil or
tailings sample weighs about 5 kg, and consists of a
homogenate of four subsample points collected from the
rooting zone (0–20 cm depth) at the same four directions
with a distance of 80 cm away from the sample tree. The
total number of sampling locations was 69 distributed
as follows: 11 locations in the area A; 14 locations in
the area B; 10 locations in the area C; 22 locations in the
area D; and 12 locations in the tailings. This resulted in
Fig. 2 Location of the Vale das
Gatas mine area on the map of
Portugal and a simplified
topographical map of the
sampling points (area A:
n = 11; area B: n = 14; area
C: n = 10; area D: n = 22;
tailings: n = 12)
812 Int. J. Environ. Sci. Technol. (2013) 10:809–826
123

69 soil/tailings samples and 69 sampled pine trees. We
collected 483 plant tissues (stems and needles with dif-
ferent ages).
In the laboratory, the vegetal material was washed
thoroughly, first in running water and then in distilled
water, and then dried in a glasshouse at a temperature of
50 �C. When dry, the material was milled into a homoge-
nous powder. Soil and tailings samples were oven-dried at
a constant temperature of 40 �C, manually homogenized
and quartered. Two equivalent fractions were obtained
from each quartered sample. One fraction was used for the
determination of physico-chemical properties, and the
other fraction was used for chemical analysis. The samples
for chemical analysis were sieved using a 2 mm mesh sieve
to remove plant matter, and subsequently screened to pass
through a 250 lm screen (Brooks 1983); this fraction was
then milled to below 74 lm.
Analytical methods
The main physico-chemical properties of the samples
(\2 mm fraction) were characterized at the UTAD Soil
Analysis Laboratory (Portugal) using the following meth-
ods: the pH was determined in water extracts (1:2.5 v/v);
organic carbon was determined with an elemental analyzer
(Primacs SCN Analyzer, Skalar); and a conversion factor
of 1.724 was used to convert organic carbon (C) into
organic matter based on the assumption that organic matter
contains 58 % organic C (Nelson and Sommers 1996). The
chemical analyses were performed at the Chemical Labo-
ratory at the Department of Earth Sciences, University of
Coimbra (Portugal) using current analytical methods. Dried
soil/tailings samples (1.0 g) were placed in Teflon cruci-
bles. Ten ml of concentrated nitric acid (HNO3) was added
to the samples, which were then heated in a water bath until
dry. Then 5 ml of perchloric acid (HClO4) and 10 ml of
hydrofluoric acid (HF) was added and the evaporation was
repeated. The residue was dissolved in 10 ml of hydro-
chloric acid (HCl) and diluted to 100 ml by adding de-
ionized water (Walsh et al. 1997). Heavy metal (Fe, Mn,
Cu, Zn, Pb, Ni) concentrations were measured by the
atomic absorption spectrophotometry (AAS, Perkin Elmer
2380). To determine the concentrations of As, a hydride
generation system (HGS) linked to an atomic absorption
device was used.
As for the plant material, dried samples (5.0 g) were
placed in porcelain crucibles and reduced to ash in a muffle
furnace over 12 h to a maximum temperature of 450 �C.
Ash samples were cooled and weighed. Ten ml of HCl was
added to the ash and evaporated in an oven. The residue was
re-dissolved in 5 ml of HCl and diluted to 25 ml by adding
de-ionized water (Brooks 1983; Van Loon 1985). The
solution was analyzed for Fe, Mn, Cu, Zn, Pb and Ni by the
AAS. For the analysis of As in plant samples, 2 g were
placed in porcelain crucibles with 20 ml of HNO3 (30 %),
which were then heated in a water bath until completely
macerated. The residue was dissolved and diluted to 25 ml
by adding de-ionized water (Fletcher 1981; Van Loon
1985). The determinations were made by HGS. For the
analysis of W in soil/tailings and plant samples the colori-
metric method was used. Dried soil samples (0.2 g) were
placed in test tubes and were added 1 g of potassium
bisulfate. Then the material was calcined in a muffle fur-
nace to a maximum temperature of 570 �C. Ten ml of HCl
was added to the samples, which were then heated in a water
bath (85 �C). Transferred 5 ml of the supernatant solution
to other test tubes with 5 ml of tin chloride (SnCl2, 20 %)
were then heated in a water bath (85 �C) for 10 min. Then
1 ml of dithiol solution was added and heated for at least
6 h. After cooling, 5 ml of petroleum was added and was
measured the absorbance at 630 nm (Quin and Brooks
1972). Dried plant samples (2.0 g) were placed in porcelain
crucibles, and reduced to ash in a muffle furnace over 12 h
to a maximum temperature of 450 �C. Ten ml of SnCl2(10 %) was added to the ash, which were then heated in a
water bath (85 �C) for 20 min. Then 1 ml of dithiol solution
was added and heated for at least 6 h. After cooling, 1 ml of
petroleum was added and was measured the absorbance at
630 nm (Quin and Brooks 1972).
The data quality control was performed by inserting
triplicate samples into each batch. Analytical precision,
defined as the percent relative variation at the 95 % confi-
dence level, ranged from 2 to 6 %, depending on the con-
centration levels. The detection limits for trace elements in
soil samples were 0.025 mg kg-1 for As; 2.5 mg kg-1 for
Mn, Cu and Ni; 5 mg kg-1 for Fe and Pb; 0.5 mg kg-1 for
Zn; and 0.1 mg kg-1 for W. The detection limits for trace
elements in plant samples were 0.005 mg kg-1 for As;
1 mg kg-1 for Fe; 0.5 mg kg-1 for Mn, Cu, Pb and Ni;
0.1 mg kg-1 for Zn; and 0.01 mg kg-1 for W.
Statistical testing
We used principal components analysis (PCA) to interpret
the data. A PCA is used to reduce the data dimensionality
while preserving the variance–covariance structure of the
data. The analysis begins with p random variables X1,
X2… Xp, where no assumption of multivariate normality is
required. If the principal components are derived from
multivariate normal random variables, then they have a
noteworthy geometric property. The axes of the constant
density ellipsoids correspond to the principal components.
In our study, PCA was performed using the AnDad
(v. 7.10) software.
The influences of organ age and their interaction on
chemical elements distribution were tested with a one-way
Int. J. Environ. Sci. Technol. (2013) 10:809–826 813
123

analysis of variance (ANOVA) to detect significant dif-
ferences between means (for p B 0.05). ANOVA test was
performed using the SPSS statistical program (IBM SPSS
Statistics 19). When the null hypothesis was rejected,
ANOVA was followed by a comparison to identify which
factor levels had different means. The separation of means
was performed by a post hoc comparison test (LSD-test) at
the p B 0.05 significance level.
Results and discussion
The results of the soil and tailings analysis are presented in
Table 1 in terms of averages, contents variations and stan-
dard deviations. The basic characteristics (pH and organic
matter) of the tested soils and tailings are presented in
Table 1. In Tables 2 and 3, the averages, contents variations
and standard deviations found in the analyzed samples of
P. pinaster are presented by sampling areas and organ ages.
With the aim of determining the plant-soil relationships, the
BAC was determined for each element. The statistical
summaries of BAC values are presented in Tables 2 and 3.
Soils and tailings in the Vale das Gatas mine area were
acidic and contained a low percentage of organic matter
(Table 1). The chemical data (soil/tailings and plant) were
analyzed by the PCA. For the soil/tailings samples, the data
matrix used in the analysis consisted of 69 samples and 10
variables (pH, organic matter, As, Fe, Mn, Cu, Zn, Pb, Ni
and W).The first two principal components explain more
than 79 % of the total variance in the data (Fig. 3). The first
principal component (axis 1), which explains 56.1 % of the
total data variance, defines a pH-organic matter association
with positive loadings and a Cu-Mn-W-As-Pb-Zn associ-
ation with negative loadings. The second component (axis
2), explaining 23.0 % of the total data variance, reveals a
Ni–Fe association with positive loadings.
Thus, the data of total element concentrations mainly
show two element associations. The Cu-Mn-W-As-Pb-Zn
association, which is inversely correlated with pH and
organic matter, reflects the presence of mineralised veins in
the area. The Ni–Fe association, which reveals the inde-
pendent behavior that of the first group and that of the pH-
organic matter group, maybe exists because of the similar
geochemical behaviors and interdependence of these ele-
ments (i.e., in geochemical cycles, the behavior of Ni
resemble those of Fe) (Adriano 2001).
The PCA highlighted sample ‘‘populations’’, which are
clearly distinct from one another (Fig. 4). Population A
consists of samples that can be considered to have geo-
chemical background values. This population is composed
by samples from the studied areas A, B and C. Populations
B and C reflect geochemical anomalies. Population B
consist of all tailings samples and is primarily linked to a
Cu-Mn-W-As-Pb-Zn association. Population C, consisting
of the all samples from the studied area D and one sample
from area A, is primarily associated with a Ni-Fe associ-
ation with affinities to other elements such as Mn and Zn.
For the plant samples, the data matrix used in the
analysis consisted of 483 samples and 8 variables (As, Fe,
Mn, Cu, Zn, Pb, Ni and W). The result of three principal
axes, which explained more than 82 % of the total vari-
ance, is shown in Fig. 5. Considering the retained axes and
given coordinate values, the following variable associa-
tions were verified: a group composed of Pb, Zn, W, Fe,
As, Cu and in some way, Ni (axis 1); however, Ni is mainly
explained by axis 2, as opposed to Mn; in turn, Mn is best
explained by axis 3 revealing an independent behavior of
the Pb-Zn-W-Fe-As-Cu association.
The PCA also highlighted plant sample ‘‘populations’’,
which are mostly distinct from one another (Fig. 6). Pop-
ulation A is composed of all plant samples from the studied
areas A, B and C. This population represents the local
biogeochemical background. No significant differences
between needles and stems or between tissue ages in this
population were calculated. Population B results from the
association of the most Ni-Cu contaminated samples. This
population is essentially composed by the 1-year-old nee-
dles and stems both on the tailings and area D. Population
C is composed of the samples situated under the influence
of the Pb-Zn-W-Fe-As group. This population is essentially
composed by the 2- and 3-years-old needles both on the
tailings and area D. Population D, consisting of the
remaining samples from tailings and area D (2-, 3- and
4-years-old stems), seems to establish the transition
between the B and C populations.
The content variations in vegetal materials were, in
general, strongly related to the content variations in soils. It
has also been verified that in contaminated locations or
tailings, the concentration of metals in plant tissues is
high due to the high metal concentrations in the soil.
The maritime pine trees growing in the tailings and in the
contaminated soils (area D) accumulated the various
researched chemical elements in quantities greater than
those verified in the plants of the representative areas of
the local geochemical background (areas A, B, C), and
than those that are typically observed in this species.
The observed values also allowed us to verify that the
contents of several elements in the vegetal material depend
as much on the plant organ as on its age (Fig. 7a, b). In the
contaminated sampling locations (tailings and area D),
the older needles (2- and 3-years-old) show a tendency to
accumulate higher concentrations of As, Fe, Zn, Pb and W.
While the Ni and Cu were preferentially accumulated in
young needles and stems (1-year-old). This was confirmed
by PCA analysis (Fig. 6) and ANOVA analysis (Table 4).
In Table 5, the result of post hoc comparison test
814 Int. J. Environ. Sci. Technol. (2013) 10:809–826
123

(LSD-test) for separation of means of the different ages of
needles and stems is reported: the different letters close to
the means indicate which ones are significantly different,
according to the comparison test. Therefore, there were
some significant differences in accumulation of chemi-
cal elements depending on the age and type of biological
tissue.
Arsenic is not essential for vegetal metabolism, and
is highly toxic to plants with a toxicity level of approxi-
mately 2 mg kg-1 (Kabata-Pendias 2010). Given this
toxicity level, the concentrations observed may be con-
sidered high (Tables 2 and 3). The observed values allowed
us to verify that the greatest concentrations of As were
present in the foliar material, both in the soils, represen-
tative of the geochemical background, and in the tailings
and contaminated soils. The concentration of this element
always increases with the age of the needle, though not as
drastically in plants that are not subjected to strong con-
tamination (Fig. 7a). This relationship is more significant
when the soils are contaminated by As. In contrast, the
concentrations of As in the stems decreased with age
(Fig. 7b). This behavior might be related to a plant defense
mechanism against high concentrations of this toxic ele-
ment, which is the translocation of As to the older needles
that eventually fall from the plant.
Considering to the plant/soil relations and Perelman’s
classification, it was verified that all of the woody
material and the youngest foliar material were charac-
terized by BAC values (Tables 2 and 3) indicating very
weak to weak absorption of As, while the older foliar
material (3-years-old) had BAC values indicative of very
weak and intermediate absorption with the particular trait
that the lowest plant/soil ratios (very weak absorption)
were found in the most contaminated area (tailings).
Thus, in this species, there is a limiting behavior for very
high concentrations of As in the substrate or in the
influence of a factor related to soil conditions such as the
pH or the presence of Mn and Fe oxides, which have been
reported to limit As bioavailability. The bioavailability of
As and metals can be affected mainly by the three fol-
lowing factors (e.g., Adriano 2001; Mani et al. 2012): (1)
soil capacity (pH, cation exchange capacity, organic
matter, amount and type of clay, ion interactions, amount
of Fe and Mn oxides and redox potential); (2) plant
capacity, which depends on the species, cultivar and
age of plant part; and (3) the plant-trace element inter-
actions.
The concentration of Fe in P. pinaster needles increased
progressively with the age of the organ (Fig. 7a, b).
Kabata-Pendias (2010) reported that Dolobovskaya also
observed Fe retention by the oldest needles in exemplars of
Pinus sibirica Turcz (Siberia pine tree) and P. pinaster,
respectively. The use and retention of Fe in the needles do
Table 1 Statistical summaries of pH, organic matter and total con-
centrations of studied elements in soils and tailings samples
Parameter Samplingarea
Mean Minimum Maximum Standarddeviation
pH Tailings 3.7 3.5 4.2 0.35
Area A 5.9 5.6 6.3 0.36
Area B 5.5 5.2 6.1 0.44
Area C 4.9 4.5 5.2 0.31
Area D 4.9 4.7 5.1 0.28
Organicmatter (%)
Tailings 0.30 0.26 0.36 0.05
Area A 2.52 0.31 3.88 1.93
Area B 4.65 3.13 6.10 1.51
Area C 4.35 3.31 6.31 1.34
Area D 1.90 0.49 3.31 1.99
As (mg kg-1) Tailings 1,963 541 5,770 2,175
Area A 37.7 26.7 48.1 10.1
Area B 47.8 37.4 66.8 16.5
Area C 56.7 45.5 69.1 11.8
Area D 128 122 134 8.39
Fe (mg kg-1) Tailings 36,483 28,600 46,859 6,689
Area A 32,816 20,531 60,100 18,613
Area B 24,355 22,267 26,077 2,049
Area C 22,684 18,482 30,350 6,720
Area D 49,298 44,618 53,975 6,608
Mn (mg kg-1) Tailings 667 406 898 208
Area A 243 132 565 214
Area B 139 119 167 25.6
Area C 120 103 146 22.6
Area D 507 457 558 71.2
Cu (mg kg-1) Tailings 259 164 352 75.2
Area A 24.5 11.7 31.0 8.78
Area B 24.4 23.0 26.7 2.01
Area C 20.8 12.0 29.0 8.52
Area D 112 40.0 184 102
Zn (mg kg-1) Tailings 302 187 469 103
Area A 123 107 134 11.3
Area B 119 73.3 159 43.2
Area C 85.8 63.1 98.1 19.7
Area D 275 117 433 224
Pb (mg kg-1) Tailings 2,152 584 6,299 2,372
Area A 85.5 63.0 102 19.6
Area B 84.4 63.3 103 19.9
Area C 66.1 55.4 78.0 11.3
Area D 110 105 115 7.29
Ni (mg kg-1) Tailings 21.1 11.6 30.8 6.94
Area A 32.1 18.2 61.2 19.9
Area B 23.6 23.1 24.5 0.74
Area C 22.4 17.8 29.0 5.88
Area D 54.4 49.8 59.0 6.50
W (mg kg-1) Tailings 287 11.0 636 290
Area A 9.83 5.00 12.0 3.28
Area B 4.57 2.00 7.09 2.55
Area C 4.07 3.20 5.10 0.96
Area D 62.4 59.2 65.6 4.48
Int. J. Environ. Sci. Technol. (2013) 10:809–826 815
123

Ta
ble
2S
tati
stic
alsu
mm
arie
so
fel
emen
tco
nte
nts
inth
en
eed
les
of
P.
pin
ast
ersa
mp
les
dis
pla
yed
by
org
anag
ean
dsa
mp
lin
gar
ea(m
gk
g-
1,
val
ues
on
dry
wei
gh
tb
asis
,D
W)
Org
anag
eE
lem
ent
Tai
lin
gs
Are
aA
Are
aB
Are
aC
Are
aD
Mea
nM
inM
axS
DM
ean
Min
Max
SD
Mea
nM
inM
axS
DM
ean
Min
Max
SD
Mea
nM
inM
axS
D
1st
yea
rA
s9
.09
3.1
09
.47
1.8
03
.39
0.2
91
0.8
0.9
13
.81
0.2
09
.50
0.6
24
.52
3.2
06
.06
0.9
61
0.1
5.9
61
5.1
1.7
7
BA
C0
.00
40
.00
10
.00
90
.00
30
.09
50
.00
60
.24
40
.08
70
.05
70
.00
50
.25
40
.09
90
.09
00
.04
60
.11
40
.02
70
.08
20
.04
50
.11
80
.02
9
Fe
11
03
9.3
18
15
0.2
55
.74
8.6
63
.85
.43
66
.35
5.2
78
.68
.29
49
.84
5.7
53
.52
.77
14
01
10
15
21
5.6
BA
C0
.00
30
.00
10
.00
50
.00
10
.00
20
.00
10
.00
30
.00
10
.00
30
.00
20
.00
50
.00
00
.00
20
.00
10
.00
30
.00
10
.00
30
.00
20
.00
40
.00
0
Mn
11
04
4.9
17
54
6.1
20
81
53
24
73
4.5
13
58
5.6
15
22
5.1
24
12
13
26
91
9.8
13
51
05
18
12
6.9
BA
C0
.13
10
.05
00
.27
10
.08
41
.12
40
.39
41
.81
60
.55
01
.04
00
.51
11
.13
70
.24
01
.95
41
.84
22
.33
70
.18
20
.29
50
.20
80
.39
50
.07
1
Cu
26
.17
.12
45
.26
.51
4.1
12
.87
5.1
30
.81
4.3
82
.62
5.1
00
.92
2.6
92
.33
3.0
10
.24
10
.76
.40
14
.12
.73
BA
C0
.07
60
.02
30
.15
90
.05
10
.23
30
.09
30
.43
80
.13
60
.19
00
.11
10
.21
70
.03
90
.11
00
.08
00
.22
50
.05
30
.26
80
.03
50
.35
30
.12
5
Zn
18
84
6.1
33
01
0.0
26
.32
2.4
32
.53
.76
25
.02
0.1
29
.63
.36
17
.91
7.1
18
.40
.49
35
.32
6.9
44
.36
.16
BA
C0
.64
70
.09
81
.19
70
.42
00
.21
80
.18
20
.24
20
.02
30
.34
50
.15
70
.35
30
.07
60
.23
40
.17
70
.29
10
.05
50
.30
40
.08
20
.32
50
.08
7
Pb
10
.99
.13
12
.61
.23
4.9
14
.78
5.1
30
.14
2.7
41
.32
4.2
31
.03
1.5
01
.02
1.9
70
.34
9.7
44
.12
13
.03
.19
BA
C0
.00
50
.00
10
.01
90
.00
70
.06
40
.04
70
.07
60
.01
30
.04
30
.01
50
.04
90
.01
30
.02
20
.01
80
.02
70
.00
30
.08
40
.03
80
.11
80
.02
9
Ni
2.8
81
.84
3.8
70
.72
1.1
00
.81
1.4
40
.22
1.3
10
.75
1.9
50
.43
0.9
90
.86
1.1
10
.09
1.4
40
.93
2.6
00
.62
BA
C0
.20
80
.08
00
.33
50
.10
20
.04
10
.01
30
.07
10
.02
30
.05
50
.03
10
.08
00
.01
70
.04
60
.03
00
.06
20
.01
20
.02
40
.01
70
.04
80
.01
2
W1
.17
0.2
72
.07
0.4
40
.04
0.0
30
.05
0.0
10
.07
0.0
30
.11
0.0
30
.09
0.0
70
.12
0.0
21
.42
0.8
62
.01
0.4
1
BA
C0
.00
50
.00
10
.10
60
.05
20
.00
40
.00
30
.00
80
.00
20
.03
40
.00
40
.04
10
.01
10
.02
10
.01
80
.02
80
.00
40
.02
40
.01
40
.03
20
.00
7
2n
dy
ear
As
10
.87
.35
12
.51
.13
3.5
50
.39
4.3
60
.57
4.2
51
.50
5.4
30
.45
5.0
14
.62
7.2
90
.98
13
.24
.60
17
.61
.42
BA
C0
.00
60
.00
10
.01
40
.00
50
.09
90
.00
80
.14
90
.05
10
.06
40
.03
80
.11
40
.03
00
.09
90
.07
20
.16
00
.03
50
.10
80
.03
40
.14
40
.04
5
Fe
25
41
46
36
17
5.9
78
.77
0.9
89
.06
.61
12
58
7.6
14
11
9.8
78
.36
9.2
88
.36
.75
27
81
86
34
05
5.0
BA
C0
.00
70
.00
40
.01
00
.00
20
.00
30
.00
10
.00
40
.00
10
.00
50
.00
30
.00
60
.00
10
.00
40
.00
20
.00
50
.00
10
.00
50
.00
30
.00
70
.00
1
Mn
24
42
01
28
83
0.9
46
03
87
59
58
3.0
40
63
05
59
71
06
62
05
46
69
35
1.9
15
41
25
18
62
1.6
BA
C0
.28
20
.24
30
.60
10
.14
22
.30
21
.05
33
.27
60
.92
13
.13
51
.82
13
.56
50
.69
05
.02
34
.74
86
.01
30
.46
70
.33
80
.27
40
.36
70
.03
7
Cu
11
.59
.01
13
.91
.73
2.7
22
.42
3.2
90
.34
2.2
11
.60
2.8
30
.43
2.1
11
.95
2.3
30
.14
8.7
15
.25
10
.71
.97
BA
C0
.03
50
.02
60
.07
00
.01
60
.13
80
.08
10
.20
70
.05
00
.09
70
.06
80
.12
00
.01
90
.08
80
.06
70
.17
50
.04
00
.26
80
.04
70
.31
80
.06
9
Zn
21
71
13
32
01
7.3
29
.82
1.4
35
.65
.20
24
.01
9.5
33
.65
.19
26
.12
1.4
31
.33
.52
24
61
86
29
83
9.7
BA
C0
.54
60
.41
01
.16
00
.26
90
.24
80
.17
40
.33
20
.05
60
.32
30
.15
10
.36
50
.07
50
.33
20
.26
50
.41
20
.05
42
.11
50
.56
92
.59
70
.37
8
Pb
19
.91
2.2
27
.62
.44
4.7
74
.31
5.3
30
.37
3.2
02
.60
3.8
00
.42
2.7
92
.41
3.1
30
.25
21
.21
7.6
25
.82
.91
BA
C0
.01
00
.00
20
.03
40
.01
30
.06
30
.04
20
.08
50
.01
60
.05
00
.03
00
.06
20
.00
90
.04
20
.04
00
.05
00
.00
40
.18
50
.15
30
.23
50
.02
9
Ni
1.1
80
.95
1.3
70
.15
0.8
20
.60
1.1
00
.18
0.8
90
.63
1.1
30
.18
0.9
20
.81
1.0
70
.09
1.0
50
.91
1.1
90
.10
BA
C0
.07
10
.03
90
.08
20
.01
50
.02
90
.01
30
.05
40
.01
70
.03
80
.02
60
.04
60
.00
70
.04
40
.02
80
.06
00
.01
20
.01
80
.01
70
.02
10
.00
2
W2
.35
1.4
03
.29
0.4
70
.06
0.0
40
.07
0.0
10
.10
0.0
50
.21
0.0
60
.08
0.0
50
.11
0.0
22
.45
2.1
12
.79
0.2
4
BA
C0
.00
80
.00
30
.21
30
.10
60
.00
50
.00
30
.01
20
.00
30
.05
00
.00
70
.06
40
.01
60
.01
70
.01
20
.02
50
.00
50
.04
70
.03
60
.05
30
.00
2
816 Int. J. Environ. Sci. Technol. (2013) 10:809–826
123

Ta
ble
2co
nti
nu
ed
Org
anag
eE
lem
ent
Tai
lin
gs
Are
aA
Are
aB
Are
aC
Are
aD
Mea
nM
inM
axS
DM
ean
Min
Max
SD
Mea
nM
inM
axS
DM
ean
Min
Max
SD
Mea
nM
inM
axS
D
3rd
yea
rA
s1
2.0
7.9
01
3.9
1.2
04
.12
0.7
08
.64
0.8
35
.43
4.2
56
.30
0.7
35
.64
4.4
06
.10
0.7
01
4.7
6.2
21
6.5
1.0
7
BA
C0
.00
60
.00
10
.02
20
.00
90
.11
40
.01
50
.32
40
.11
50
.08
10
.06
40
.16
10
.03
80
.11
20
.08
60
.11
90
.00
70
.12
10
.04
90
.13
50
.03
3
Fe
30
02
14
38
76
1.4
10
71
00
11
55
.53
25
11
63
28
44
5.3
10
61
03
11
54
.55
29
82
11
37
55
8.0
BA
C0
.00
80
.00
60
.01
00
.00
20
.00
40
.00
20
.00
60
.00
20
.01
10
.00
60
.01
60
.00
20
.00
50
.00
40
.00
60
.00
10
.00
60
.00
40
.00
80
.00
1
Mn
41
02
04
61
71
46
40
12
50
54
51
05
45
94
13
49
52
9.1
55
74
80
63
55
4.8
15
71
06
23
54
6.2
BA
C0
.46
70
.24
71
.01
00
.28
31
.95
10
.96
52
.99
50
.85
23
.55
02
.46
63
.86
70
.54
14
.50
24
.34
95
.40
20
.40
10
.34
30
.23
20
.46
30
.08
7
Cu
8.4
15
.56
11
.32
.04
2.1
21
.88
2.5
80
.27
2.7
52
.10
3.5
20
.50
4.3
91
.82
6.9
21
.80
5.5
04
.85
8.7
11
.53
BA
C0
.02
60
.01
60
.05
10
.01
30
.10
80
.06
30
.16
00
.03
90
.11
90
.08
90
.15
00
.02
30
.19
30
.06
30
.36
70
.11
90
.21
80
.04
30
.33
80
.04
0
Zn
37
71
41
61
21
6.7
25
.91
7.1
33
.45
.80
24
.11
8.6
31
.24
.51
27
.82
3.8
31
.92
.87
47
13
86
56
26
2.2
BA
C0
.90
80
.51
22
.01
50
.53
30
.21
80
.13
90
.31
20
.06
20
.32
20
.14
80
.37
20
.07
40
.37
60
.24
70
.50
60
.10
94
.04
11
.08
74
.51
30
.82
5
Pb
22
.51
3.5
31
.53
.34
5.3
84
.80
6.1
10
.48
3.7
63
.15
3.9
80
.31
2.8
72
.35
3.4
00
.37
24
.21
9.6
29
.73
.58
BA
C0
.01
20
.00
20
.03
90
.01
50
.06
90
.05
30
.08
20
.01
10
.05
90
.03
60
.09
20
.00
90
.04
30
.04
10
.05
20
.00
40
.21
10
.17
00
.27
00
.03
6
Ni
1.0
80
.83
1.3
50
.18
0.8
50
.67
1.1
70
.20
1.0
80
.98
1.1
60
.06
1.3
90
.95
1.8
50
.32
1.0
40
.76
1.2
20
.16
BA
C0
.06
50
.03
50
.07
10
.01
30
.03
10
.01
10
.05
80
.01
90
.04
70
.04
00
.05
10
.00
30
.06
80
.03
30
.10
40
.02
60
.01
80
.01
40
.02
10
.00
3
W2
.37
1.6
43
.09
0.4
10
.16
0.0
90
.29
0.0
80
.23
0.1
60
.25
0.0
30
.17
0.1
40
.20
0.0
22
.79
2.4
52
.98
0.1
9
BA
C0
.00
80
.00
30
.21
50
.10
70
.01
40
.00
90
.03
20
.01
00
.11
30
.02
30
.12
60
.03
50
.03
90
.02
80
.05
30
.01
10
.04
10
.03
70
.04
80
.00
4
BA
Cb
iolo
gic
alab
sorp
tio
nco
effi
cien
t,co
nce
ntr
atio
nin
pla
nt/
con
cen
trat
ion
inso
il;
SD
stan
dar
dd
evia
tio
n
Int. J. Environ. Sci. Technol. (2013) 10:809–826 817
123

Ta
ble
3S
tati
stic
alsu
mm
arie
so
fel
emen
tco
nte
nts
inth
est
ems
of
P.
pin
ast
ersa
mp
les
dis
pla
yed
by
org
anag
ean
dsa
mp
lin
gar
ea(m
gk
g-
1,
val
ues
on
dry
wei
gh
tb
asis
,D
W)
Org
anag
eE
lem
ent
Tai
lin
gs
Are
aA
Are
aB
Are
aC
Are
aD
Mea
nM
inM
axS
DM
ean
Min
Max
SD
Mea
nM
inM
axS
DM
ean
Min
Max
SD
Mea
nM
inM
axS
D
1st
yea
rA
s8
.69
4.2
89
.50
1.0
92
.67
0.2
83
.01
0.1
23
.80
2.1
04
.40
0.8
74
.17
3.5
35
.03
0.5
31
0.1
6.4
01
4.1
1.7
2
BA
C0
.00
40
.00
20
.01
60
.00
70
.07
80
.00
60
.11
30
.03
90
.05
70
.05
40
.10
20
.02
00
.08
30
.06
00
.09
10
.01
10
.08
20
.04
80
.11
60
.02
4
Fe
18
01
64
19
51
1.2
48
.24
6.4
50
.31
.38
13
55
6.5
15
63
8.6
51
.94
5.3
58
.24
.55
12
61
00
16
92
4.6
BA
C0
.00
50
.00
40
.00
60
.00
10
.00
20
.00
10
.00
20
.00
10
.00
60
.00
20
.00
80
.00
20
.00
20
.00
10
.00
30
.00
10
.00
20
.00
20
.00
30
.00
0
Mn
90
.93
1.8
15
01
1.7
12
61
07
16
21
2.5
14
71
25
16
51
4.2
13
51
30
14
03
.72
24
.21
6.3
32
.55
.73
BA
C0
.10
30
.03
90
.22
40
.07
00
.73
20
.19
01
.19
40
.38
31
.13
30
.74
61
.23
80
.18
51
.11
00
.96
21
.30
90
.13
60
.05
30
.03
20
.07
10
.01
4
Cu
70
.12
8.5
11
29
.41
6.0
04
.37
7.1
51
.02
6.4
23
.40
7.6
01
.68
2.7
11
.90
3.5
40
.58
33
.12
1.9
46
.44
.68
BA
C0
.20
50
.09
10
.42
70
.12
30
.33
40
.14
10
.61
00
.18
40
.27
90
.13
90
.32
30
.07
20
.10
50
.08
90
.22
50
.05
10
.82
80
.11
91
.16
00
.41
3
Zn
15
96
5.0
25
31
6.6
27
.12
3.0
33
.74
.04
32
.82
2.1
38
.45
.94
14
.31
2.6
16
.51
.68
50
.23
9.5
76
.51
3.8
BA
C0
.52
90
.13
90
.91
90
.30
90
.22
30
.20
30
.25
10
.01
80
.44
40
.17
70
.48
20
.10
40
.18
70
.14
60
.22
80
.03
10
.42
90
.11
60
.65
70
.22
6
Pb
16
.21
5.5
17
.00
.55
6.4
25
.34
7.2
20
.69
2.5
51
.50
3.5
00
.71
2.5
01
.79
3.1
90
.50
11
.97
.62
15
.41
.76
BA
C0
.00
70
.00
30
.02
80
.01
10
.08
30
.06
30
.10
70
.01
70
.04
00
.01
70
.05
10
.01
00
.03
70
.03
20
.04
50
.00
50
.10
30
.06
60
.14
00
.02
6
Ni
3.6
12
.35
4.8
80
.60
1.5
91
.15
1.8
60
.27
2.1
61
.83
2.6
80
.31
1.6
21
.44
1.8
50
.15
1.8
31
.25
2.5
20
.45
BA
C0
.26
20
.10
20
.42
20
.12
90
.05
60
.01
90
.08
80
.02
80
.09
10
.07
50
.10
90
.01
20
.07
70
.05
00
.10
40
.02
00
.03
10
.02
10
.04
60
.00
9
W2
.12
0.8
93
.34
0.3
70
.05
0.0
40
.06
0.0
10
.07
0.0
40
.09
0.0
20
.05
0.0
30
.08
0.0
22
.82
1.7
83
.15
0.1
2
BA
C0
.00
80
.00
20
.19
30
.09
50
.00
50
.00
40
.01
00
.00
30
.03
40
.00
60
.03
40
.01
00
.01
10
.00
70
.01
60
.00
40
.04
80
.02
90
.05
30
.00
9
2n
dy
ear
As
7.5
37
.12
9.2
00
.80
2.5
22
.31
3.9
70
.68
3.8
23
.10
4.7
90
.60
3.9
23
.40
4.8
00
.50
8.1
87
.30
9.1
00
.64
BA
C0
.00
40
.00
20
.01
40
.00
50
.07
60
.05
20
.14
90
.04
00
.05
70
.04
60
.12
80
.03
00
.07
70
.05
70
.08
70
.01
10
.06
70
.05
70
.07
50
.00
6
Fe
40
02
93
50
87
6.0
63
.14
5.7
73
.21
0.7
14
09
5.6
16
32
4.5
30
.22
7.3
33
.52
.21
39
12
83
45
36
1.4
BA
C0
.01
10
.00
80
.01
40
.00
30
.00
20
.00
10
.00
30
.00
10
.00
60
.00
40
.00
60
.00
10
.00
10
.00
10
.00
20
.00
00
.00
70
.00
50
.00
90
.00
2
Mn
10
63
9.4
17
31
7.3
12
91
24
13
85
.14
11
51
05
12
67
.43
89
.17
0.9
10
71
2.9
30
.32
1.5
42
.67
.52
BA
C0
.12
00
.04
80
.26
10
.08
00
.72
60
.22
41
.04
40
.34
00
.89
00
.62
70
.96
90
.13
10
.71
20
.68
80
.86
30
.06
70
.06
60
.04
70
.08
40
.01
4
Cu
51
.74
3.1
60
.35
.11
4.7
74
.07
5.1
80
.43
4.5
84
.03
5.0
30
.36
2.2
11
.96
2.4
90
.19
21
.91
8.3
33
.12
.64
BA
C0
.15
50
.13
80
.31
50
.06
80
.25
30
.13
10
.42
80
.11
80
.20
00
.17
10
.21
40
.01
80
.08
90
.08
60
.18
30
.04
00
.82
80
.24
50
.95
80
.11
9
Zn
27
01
91
34
91
5.6
30
.02
7.6
34
.22
.56
21
.91
5.4
25
.63
.84
7.9
84
.99
11
.02
.12
14
79
5.3
19
61
3.6
BA
C0
.83
60
.40
81
.44
30
.39
60
.25
10
.21
00
.31
90
.04
20
.31
20
.12
30
.34
60
.07
30
.09
60
.07
90
.12
60
.02
11
.26
30
.58
81
.81
80
.18
4
Pb
37
.92
1.9
53
.91
.31
5.3
94
.53
6.5
70
.75
3.1
32
.61
3.8
60
.45
1.7
80
.69
2.8
30
.76
41
.43
3.6
48
.62
.31
BA
C0
.02
00
.00
30
.06
50
.02
50
.07
20
.04
40
.10
40
.02
30
.04
80
.03
00
.05
30
.00
80
.02
40
.01
20
.03
60
.00
90
.36
00
.29
20
.44
20
.05
4
Ni
2.4
02
.26
2.5
30
.10
1.0
20
.90
1.1
40
.08
1.4
61
.15
1.6
30
.17
0.7
60
.58
1.7
60
.47
1.8
81
.32
2.2
40
.34
BA
C0
.15
30
.07
80
.19
50
.04
30
.03
50
.01
50
.05
60
.01
60
.06
30
.04
70
.06
70
.00
80
.03
20
.02
80
.08
70
.02
30
.03
30
.02
20
.04
10
.00
7
W1
.27
0.5
81
.95
0.2
80
.12
0.0
90
.13
0.0
10
.12
0.0
80
.14
0.0
20
.10
0.0
70
.13
0.0
21
.33
0.6
11
.46
0.2
4
BA
C0
.00
50
.00
10
.11
50
.05
70
.01
00
.00
80
.02
40
.00
60
.06
10
.01
10
.07
20
.01
90
.02
10
.01
70
.03
10
.00
60
.02
20
.01
00
.02
50
.00
6
818 Int. J. Environ. Sci. Technol. (2013) 10:809–826
123

Ta
ble
3co
nti
nu
ed
Org
anag
eE
lem
ent
Tai
lin
gs
Are
aA
Are
aB
Are
aC
Are
aD
Mea
nM
inM
axS
DM
ean
Min
Max
SD
Mea
nM
inM
axS
DM
ean
Min
Max
SD
Mea
nM
inM
axS
D
3rd
yea
rA
s6
.34
5.1
99
.48
0.6
12
.02
1.2
03
.32
0.7
63
.37
1.9
64
.20
0.8
13
.71
3.4
24
.78
0.5
35
.70
5.5
46
.30
0.2
9
BA
C0
.00
30
.00
10
.01
20
.00
40
.05
90
.03
80
.12
40
.03
60
.05
00
.02
90
.10
70
.03
00
.07
30
.05
40
.08
60
.01
20
.04
70
.04
30
.05
20
.00
4
Fe
21
82
08
22
86
.98
58
.95
1.3
65
.14
.97
24
82
15
27
32
0.6
26
.62
4.9
28
.41
.24
16
01
26
19
62
4.8
BA
C0
.00
60
.00
50
.00
80
.00
10
.00
20
.00
10
.00
30
.00
10
.01
10
.00
80
.01
40
.00
10
.00
10
.00
10
.00
10
.00
00
.00
30
.00
20
.00
40
.00
1
Mn
80
.82
4.8
13
71
9.6
12
69
8.6
14
11
6.7
12
21
14
13
67
.94
70
.85
8.2
83
.58
.96
19
.11
4.7
26
.84
.37
BA
C0
.09
10
.03
00
.19
90
.06
40
.75
20
.17
51
.04
40
.37
90
.94
40
.68
11
.02
80
.13
20
.56
80
.56
40
.68
70
.05
10
.04
20
.03
20
.05
30
.00
8
Cu
27
.71
5.5
40
.04
.64
3.6
52
.73
4.3
10
.58
3.4
43
.12
3.9
50
.30
1.5
81
.14
2.0
20
.31
11
.98
.64
22
.32
.21
BA
C0
.08
20
.05
00
.16
90
.04
30
.19
60
.08
80
.33
40
.09
50
.14
90
.12
90
.16
80
.01
60
.06
20
.05
30
.13
20
.03
00
.29
90
.06
50
.31
60
.06
6
Zn
20
81
41
27
61
7.8
27
.72
2.2
37
.15
.75
24
.72
3.4
34
.64
.61
7.2
14
.90
9.5
41
.64
10
87
6.5
15
91
9.6
BA
C0
.65
00
.30
01
.11
20
.31
50
.23
00
.16
60
.30
10
.04
80
.33
60
.15
50
.34
70
.07
30
.08
80
.07
30
.11
40
.01
70
.92
90
.25
00
.99
70
.16
3
Pb
22
.61
9.4
25
.82
.25
5.0
34
.63
5.6
60
.39
4.1
03
.67
4.8
60
.43
1.5
00
.85
2.1
50
.46
19
.81
6.4
24
.62
.92
BA
C0
.01
00
.00
30
.03
90
.01
50
.06
60
.04
70
.09
00
.01
70
.06
50
.04
00
.07
60
.01
00
.02
10
.01
50
.02
80
.00
50
.17
20
.14
30
.22
40
.02
9
Ni
1.3
81
.34
1.4
30
.03
0.9
30
.80
1.0
90
.10
1.3
31
.29
1.3
50
.02
0.7
20
.54
0.9
10
.13
1.0
30
.96
1.1
00
.05
BA
C0
.09
10
.04
50
.12
30
.03
00
.03
20
.01
30
.05
10
.01
50
.05
80
.05
30
.06
20
.00
20
.03
10
.03
00
.04
00
.00
40
.01
70
.01
60
.02
10
.00
2
W1
.01
0.8
31
.20
0.1
30
.13
0.0
70
.19
0.0
40
.21
0.1
70
.36
0.0
70
.06
0.0
30
.09
0.0
20
.84
0.8
00
.96
0.0
6
BA
C0
.00
30
.00
20
.09
20
.04
50
.01
10
.00
60
.02
60
.00
70
.10
60
.02
40
.11
30
.03
10
.01
40
.00
60
.02
20
.00
60
.01
40
.01
30
.01
50
.00
1
4th
yea
rA
s5
.74
5.3
77
.30
0.7
61
.78
0.9
23
.80
0.0
72
.10
1.2
05
.10
0.4
93
.41
3.1
84
.63
0.5
84
.54
4.2
16
.11
0.7
5
BA
C0
.00
20
.00
10
.01
10
.00
40
.05
00
.02
10
.14
20
.04
70
.03
10
.01
80
.13
00
.04
20
.06
70
.04
90
.08
40
.01
30
.03
70
.03
40
.04
80
.00
6
Fe
18
01
58
20
21
5.6
48
.03
4.3
62
.19
.85
14
71
24
16
51
4.6
38
.23
3.6
44
.53
.88
12
11
14
14
61
2.3
BA
C0
.00
50
.00
40
.00
60
.00
10
.00
20
.00
10
.00
20
.00
10
.00
70
.00
50
.00
80
.00
10
.00
20
.00
10
.00
20
.00
00
.00
20
.00
20
.00
30
.00
0
Mn
73
.42
2.2
12
61
6.7
11
46
0.3
14
91
3.4
11
19
6.5
12
91
1.5
67
.25
6.6
78
.37
.67
17
.01
3.6
25
.34
.35
BA
C0
.08
20
.02
70
.18
00
.05
80
.73
80
.10
71
.13
00
.41
20
.85
60
.57
60
.93
50
.13
40
.54
30
.53
60
.65
00
.04
60
.03
70
.03
00
.05
00
.00
8
Cu
19
.41
1.5
29
.13
.23
3.1
22
.92
3.4
40
.19
2.6
32
.46
2.9
50
.18
1.2
91
.11
1.4
40
.12
8.9
06
.45
10
.61
.48
BA
C0
.05
70
.03
70
.11
80
.02
90
.16
00
.09
70
.24
90
.06
10
.11
40
.09
80
.12
50
.01
00
.05
20
.05
00
.10
80
.02
40
.22
20
.04
80
.26
10
.04
2
Zn
17
71
19
24
31
3.7
24
.92
1.1
30
.93
.74
22
.01
9.4
32
.65
.15
6.8
44
.64
8.5
41
.40
92
.38
6.2
10
56
.94
BA
C0
.55
10
.25
50
.94
60
.27
40
.20
70
.15
70
.25
10
.03
40
.30
10
.13
80
.32
40
.07
00
.08
80
.07
10
.11
10
.01
60
.78
90
.21
20
.84
00
.20
0
Pb
20
.41
9.3
23
.51
.57
5.2
74
.14
6.2
30
.74
3.0
32
.45
4.2
50
.66
1.9
11
.11
2.7
50
.58
14
.91
2.5
16
.91
.56
BA
C0
.00
80
.00
40
.03
50
.01
30
.06
90
.05
20
.09
90
.02
00
.04
80
.02
80
.04
90
.01
00
.02
70
.02
00
.03
50
.00
60
.12
90
.11
40
.14
70
.01
3
Ni
1.1
01
.01
1.1
90
.06
0.8
00
.67
0.9
20
.09
0.8
30
.71
0.9
50
.08
0.7
10
.54
0.9
00
.13
0.7
90
.66
0.9
50
.10
BA
C0
.07
20
.03
60
.10
30
.02
60
.02
80
.01
10
.04
60
.01
40
.03
60
.02
90
.03
90
.00
40
.03
00
.02
80
.03
90
.00
40
.01
30
.01
10
.01
70
.00
2
W1
.68
1.4
21
.99
0.2
00
.50
0.1
21
.22
0.1
40
.23
0.1
60
.32
0.0
60
.20
0.0
80
.35
0.1
01
.35
1.2
11
.42
0.0
8
BA
C0
.00
50
.00
30
.05
30
.07
60
.04
30
.01
00
.10
50
.04
50
.11
30
.02
30
.12
40
.03
40
.04
20
.02
00
.06
90
.01
90
.02
30
.02
00
.02
30
.00
1
BA
Cb
iolo
gic
alab
sorp
tio
nco
effi
cien
t,co
nce
ntr
atio
nin
pla
nt/
con
cen
trat
ion
inso
il;
SD
stan
dar
dd
evia
tio
n
Int. J. Environ. Sci. Technol. (2013) 10:809–826 819
123

not seem to be controlled by factors inherent to the level of
contamination, given that the retention behaviors were
similar in the different sampling areas. Meanwhile, in the
woody parts, it seems to be interference from those factors
in the bioutilization of this element. Thus, it was verified
that the stems of the plants that grew in the tailings and in
the contaminated area exhibit a high level of retention of
this element in the tissues with 2-years-old, manifesting,
from then on, a behavior close to that of the plants growing
in the soils, representative of the geochemical background.
For Fe, we observed very low plant/soil ratios (Tables 2
and 3), revealing weak to very weak absorption, despite the
fact that Fe is an essential nutrient. This behavior, however,
seems to be common in soils that are very rich in Fe, and
where the geochemical forms are very poorly soluble
making the availability of the element very low.
Fig. 3 Projection of the variables in the first factorial plan of the
principal components analysis (PCA) (soil/tailings samples)
Fig. 4 Projection of the samples in the first factorial plan of the
principal components analysis (PCA) (soil/tailings samples)
Fig. 5 Projection of the variables in the two first factorial plans of the principal components analysis (PCA) (plant samples)
Fig. 6 Projection of the samples in the first factorial plan of the
principal components analysis (PCA) (plant samples)
820 Int. J. Environ. Sci. Technol. (2013) 10:809–826
123

TailingsArea AArea BArea CArea D
TailingsArea AArea BArea CArea D
TailingsArea AArea BArea CArea D
TailingsArea AArea BArea CArea D
TailingsArea AArea BArea CArea D
TailingsArea AArea BArea CArea D
TailingsArea AArea BArea CArea D
TailingsArea AArea BArea CArea D
a
Fig. 7 a Variations in the levels of As, Fe, Mn, Cu, Zn, Pb, Ni and W
in the needles of P. pinaster samples considering the organ age and
the sampling area (mean ± SD). b Variations in the levels of As, Fe,
Mn, Cu, Zn, Pb, Ni and W in the stems of P. pinaster samples
considering the organ age and the sampling area (mean ± SD)
Int. J. Environ. Sci. Technol. (2013) 10:809–826 821
123

TailingsArea AArea BArea CArea D
TailingsArea AArea BArea CArea D
TailingsArea AArea BArea CArea D
TailingsArea AArea BArea CArea D
TailingsArea AArea BArea CArea D
TailingsArea AArea BArea CArea D
TailingsArea AArea BArea CArea D
TailingsArea AArea BArea CArea D
b
Fig. 7 continued
822 Int. J. Environ. Sci. Technol. (2013) 10:809–826
123

The variation in the contents of Mn revealed identical
behaviors in the different sampling areas; therefore, the
utilization and retention of this element, both in the needles
and in the stems, seem to be indifferent to the factors
inherent to the contamination. Meanwhile, the plants that
grew on the tailings showed a low percentage of retained
Mn in growing needles. This fact might be related to
several factors, namely the occurrence of Mn in forms that
render its difficulty for absorption through the roots
(immobile oxides) and a high rate of bioutilization of the
quantities absorbed, given that the Mn is a micronutrient
essential for photosynthesis and necessary in chlorophyll
synthesis (Nagaraju and Karimulla 2002; Silva and Wil-
liams 2001). The needles always showed strong to intense
absorption of Mn, and the stems had BAC values indicative
of intermediate to strong absorption in almost all of the
samples (Tables 2 and 3). This result can also help to
explain the low ratios for Fe because according to Nagaraju
and Karimulla (2001), when Mn is present in the soil in
medium to high concentrations, it can induce deficiencies
Table 4 Result of statistical analysis of variance (ANOVA), for test the influences of organ age on chemical elements concentration
Plant
organ
Variables Sum of squares
between groups
df Mean square
between groups
Sum of squares
within groups
df Mean square
within groups
F Significant
level
Needles As 174.68 2 87.34 3103.05 204 15.21 5.74 0.004*
Fe 568706.63 2 284353.31 1360522.59 204 6669.23 42.64 0.000*
Mn 2422058.05 2 1211029.02 3883559.74 204 19037.06 63.61 0.000*
Cu 888.71 2 444.35 9177.09 204 44.99 9.88 0.000*
Zn 535542.47 2 267771.23 4268173.74 204 20922.42 12.80 0.000*
Pb 1300.32 2 650.16 13441.62 204 65.89 9.87 0.000*
Ni 14.28 2 7.137 53.32 204 0.26 27.31 0.000*
W 12.23 2 6.11 224.16 204 1.10 5.563 0.004*
Stems As 129.76 3 43.25 1504.32 272 5.53 7.82 0.000*
Fe 410778.41 3 136926.14 2817127.95 272 10357.09 13.22 0.000*
Mn 29923.97 3 9974.66 507668.62 272 1866.43 5.34 0.001*
Cu 11023.01 3 3674.34 94888.77 272 348.86 10.53 0.000*
Zn 56882.56 3 18960.85 1751212.58 272 6438.28 2.95 0.033*
Pb 3973.57 3 1324.52 35296.78 272 129.77 10.21 0.000*
Ni 70.68 3 23.559 84.65 272 0.31 75.70 0.000*
W 10.93 3 3.64 165.87 272 0.61 5.98 0.001*
* Significant difference between the samples (p B 0.05)
Table 5 Result of post hoc
comparison test (LSD-test), for
separation of means of the
different ages of needles and
stems
The letters A, B, C and D
characterize the mean
differences. The means
significantly different from the
others (p B 0.05) are indicated
with a different letter. The two
paired letters refer to similitude
with more a two groups
Plant organ Variables 1-year-old
(n = 69)
2-years-old
(n = 69)
3-years-old
(n = 69)
4-years-old
(n = 69)
Needles As 5.68 A 6.21 A 7.84 B –
Fe 82.45 A 160.20 B 209.81 C –
Mn 164.15 A 384.45 B 401.80 B –
Cu 9.40 A 5.34 B 4.74 B –
Zn 58.85 A 107.28 A 182.48 B –
Pb 5.79 A 10.31 B 11.65 B –
Ni 1.57 A 0.97 B 1.08 B –
W 0.55 A 0.99 B 1.11 B –
Stems As 5.49 A 5.30 A 4.37 B 3.81 B
Fe 105.55 A 200.82 B 142.28 C 107.37 A
Mn 105.43 A 95.16 AB 85.14 BC 77.81 C
Cu 23.28 A 17.34 A 9.99 B 7.13 B
Zn 56.93 A 95.26 B 76.37 AB 65.24 A
Pb 7.89 A 17.67 B 10.60 A 9.09 A
Ni 2.18 A 1.53 B 1.08 C 0.85 D
W 0.96 A 0.55 BC 0.45 B 0.79 AC
Int. J. Environ. Sci. Technol. (2013) 10:809–826 823
123
in Fe in plants as the result of competition in the absorption
and translocation of these elements.
The concentrations of Cu were higher in the younger
material, both foliar and woody, with the woody material
showing a less marked variation over time. In contrast, in
the needles, the concentration was visibly higher in newly
formed needles than in the older needles (Fig. 7a, b). This
behavior was identical in the different areas mentioned and
is likely inherent to vegetal metabolism, corresponding to
what was documented by Dolobovskaya for P. sibirica
(Kabata-Pendias 2010). The samples of different organs
and ages had BAC values that indicated weak to interme-
diate absorption of Cu (Tables 2 and 3). We also verified
for all of the exemplars that, in the tailings, although the
content of Cu in the substrate was high, the Cu content in
the plant was not. This result may be related to the reduced
bioavailability of Cu in these soils, reflecting the ability of
Cu to be adsorbed and co-precipitated with oxy-hydroxides
of Fe, Mn and Al (Adriano 2001).
For Zn, we verified behavior differences according to
the sampling area. We observed similar patterns in the
plants from the tailings and area D (Fig. 7a, b), verifying
that in the needles the concentration of Zn increases with
age, while in the stems the concentration increases in the
second year and then decreases with age. The behavior in
these two areas might reflect the performance of physio-
logical mechanisms attempting to re-establish balance in
response to disturbances caused by the presence of toxic
elements in excessive quantities. The BAC results allowed
us to verify that the absorption of Zn can be classified as
intermediate for all of the samples, which had high BAC
values, especially the exemplars growing in the tailings
(Table 2 and 3). This fact should reflect, on one hand, the
high quantities of this element existing in the substrate
(Table 1), and on the other hand, the easy utilization of this
element by the plants, given that Zn is an element endowed
with great mobility in soils with low contents of organic
matter (Kabata-Pendias 2010). However, the highest
BAC values (strong absorption) were observed in area D,
in 2- and 3-years-old needles and in 2-years-old stems.
The variation in the content of Pb also demonstrates
some differences in behavior between plants outside and
inside the contaminated area. In the plants that grew in the
tailings and in area D (Fig. 7a, b), the concentrations of Pb
in the needles were shown to increase with age, whereas
the stems showed an increase in the concentrations of this
metal in the second year and then a decrease with age. For
Pb, the values of BAC (Tables 2 and 3) indicated, for all
organs and ages, very weak to weak absorption. However,
it is necessary to bear in mind that, in this study, only the
aerial parts of the plant were sampled, given that there is a
general consensus that Pb is mainly accumulated in the
roots and is barely translocated to the other parts of the
plant. The exception was the exemplars grown in the
contaminated area, for which the BAC values indicated
intermediate absorption values.
The variation in the content of Ni was identical to that
for Cu, especially in the tailings (Fig. 7a, b) with a
decrease with age in the needles and the stems. Thus, in the
plants that grow in highly contaminated soils, the translo-
cation of Ni appears to be inhibited, with possible accu-
mulation in the cellular vacuoles, perhaps due to the
antagonism between Ni and other trace elements that are
present in excess in the plants. For Ni, the BAC values
indicate weak to intermediate absorption.
The variations in the contents of W showed differences
in behavior between areas outside and inside the contam-
inated area (Fig. 7a, b). In the areas representative of the
geochemical background, the concentrations of W increased
with the age, both in the foliar and in the woody material. In
contrast, in the tailings and in the contaminated soils, it was
verified that there was an increase in the concentration of this
metal in woody material with 1-year-old, and a significant
decrease after the first year of age with an increase being
observed again in the oldest material (4-years-old). The W
contents were higher in older needles (2- and 3-years-old).
The BAC values for W revealed very weak to weak absorption
for all areas.
Those specimens of P. pinaster growing in tailings and
contaminated soils shows tolerance to imposed stress
conditions (metal-contamination and nutrient deficiency)
and can fulfill the objectives of stabilization, pollution
attenuation and visual improvement. Besides, this species
is drought-resistant and has high biomass and bioproduc-
tivity. In fact, the constraints related to plant establishment
and amendment of the physical–chemical properties of the
metalliferous soils depends upon the choice of appropriate
plant species. Therefore, the plant community tolerant to
toxic trace elements play a major role in remediation of
degraded mine soils. Thus, for the Vale das Gatas mine
area, this type of approach requires more information about
plant communities growing on these soils and tailings to
assess their potential for mine restoration and minimization
of mining impacts.
Conclusion
The values obtained allowed us to conclude that the content
of chemical elements of the needles and stems of maritime
pine tree (P. pinaster) depend as much on the plant organ
as on the age, especially in the most contaminated loca-
tions. Thus, in sampling campaigns for biogeochemical
studies, it is important to consider both the organ and
the age of the sample. Therefore, it is not convenient to
use a mix of foliar and woody material in the same
824 Int. J. Environ. Sci. Technol. (2013) 10:809–826
123
biogeochemical sample. The age of the organ is also
important, because for the researched elements (As, Fe,
Mn, Cu, Zn, Pb, Ni, W) this species showed a great vari-
ability in the accumulation behavior with age. For each
particular element that was studied, there is a plant organ
and an age that may be more suited for sampling to reflect
higher bioaccumulated concentrations. Thus, the 1-year-old
needles and stems accumulated higher levels of Ni and Cu.
While the older needles accumulated higher levels of As,
Fe, Zn, Pb, and W. The 2-years-old stems may also be
appropriate samples to detect higher levels of Fe, Zn and
Pb.
However, more studies are needed on the plant com-
munities that are growing on these metal-contaminated
soils and tailings to evaluate their potential for biogeo-
chemical exploration and environmental biomonitoring,
but also for mine stabilization/remediation.
Acknowledgments The authors gratefully acknowledge the instru-
mental support of the Geosciences Centre at Coimbra University and
the financial support from Portuguese Foundation for Science and
Technology presented as a grant (Project PTDC/CTE-GEX/66710/
2006). Finally, we would like to thank the anonymous reviewers and
the editor for their constructive comments and helpful suggestions.
References
Aboal JR, Fernandez JA, Carballeira A (2004) Oak leaves and pine
needles as biomonitors of airborne trace elements pollution.
Environ Exp Bot 51:215–225
Adriano D (2001) Trace Elements in Terrestrial Environments.
Biogeochemistry, Bioavailability and Risks of Metals. Springer,
New York, pp 219–261, 499–546, 677–705
Avila PF, Oliveira JMS, Silva EF, Fonseca EC (2005) Geochemical
signatures and mechanisms of trace elements dispersion in the
area of the Vale das Gatas mine (Northern Portugal). J Geochem
Explor 85:17–29
Bargagli R (1993) Plant leaves and lichens as biomonitors of natural
or anthropogenic emissions of mercury. In: Markert B (ed)
Plants as biomonitors: indicators for heavy metals in the
terrestrial environment. VCH, Weinheim, pp 461–484
Baycu G, Tolunay D, Ozden H, Gunebakan S (2006) Ecophysiolog-
ical and seasonal variations in Cd, Pb, Zn, and Ni concentrations
in the leaves of urban deciduous trees in Istanbul. Environ Pollut
143:545–554
Brooks R (1983) Biological methods of prospecting for minerals.
Wiley, New York
Chiarenzelli J, Aspler L, Dunn C, Cousens B, Ozarko D, Powis K
(2001) Multi-element and rare earth element composition of
lichens, mosses, and vascular plants from the Central Barren-
lands, Nunavut, Canada. Appl Geochem 16:245–270
Coskun M (2006) Toxic metals in the Austrian pine (Pinus nigra)
bark in the Thrace region, Turkey. Environ Monit Assess
121:173–179
Dmuchowski W, Gozdowski D, Baczewska AH (2011) Comparison
of four bioindication methods for assessing the degree of
environmental lead and cadmium pollution. J Hazard Mater
197:109–118
Favas P (2002) Restrictions to the farming use of the soils in the
surroundings of an abandoned mine (Vale das Gatas Mines,
Sabrosa, Vila Real). Revista de Ciencias Agrarias 25:280–292
(in Portuguese)
Fletcher WK (1981) Analytical methods in geochemical prospecting.
In: Govett GJS (ed) Handbook of exploration geochemistry, vol
1. Elsevier, Amsterdam
Gueguen F, Stille P, Geagea ML, Boutin R (2012) Atmospheric
pollution in an urban environment by tree bark biomonitoring—
part I: trace element analysis. Chemosphere 86:1013–1019
Hooper DU, Vitousek PM (1997) The effects of plant composition
and diversity on ecosystem processes. Science 277:1302–1305
Kabata-Pendias A (2010) Trace Elements in Soils and Plants, 4th edn.
CRC Press, Boca Raton
Kord B, Mataji A, Babaie S (2010) Pine (Pinus eldarica Medw.)
needles as indicator for heavy metals pollution. Int J Environ Sci
Tech 7(1):79–84
Kovalevskii A (1979) Biogeochemical Exploration for Mineral
Deposits. Amerind Publishing, New Delhi
Kuang YW, Wen DZ, Zhou GY, Liu SZ (2007) Distribution of
elements in needles of Pinus massoniana (Lamb.) was uneven
and affected by needle age. Environ Pollut 145:730–737
Liu Y-J, Zhu Y-G, Ding H (2007) Lead and cadmium in leaves of
deciduous trees in Beijing, China: development of a metal
accumulation index (MAI). Environ Pollut 145:387–390
Mani D, Sharma B, Kumar C, Pathak N, Balak S (2012) Phytoreme-
diation potential of Helianthus annuus L in sewage-irrigated
Indo-Gangetic alluvial soils. Int J Phytoremediat 14:235–246
Nagaraju A, Karimulla S (2001) Geobotany and biogeochemistry of
Gymnosporia montana—a case study from Nellore Mica Belt,
Andhra Pradesh. Environ Geol 41:167–173
Nagaraju A, Karimulla S (2002) Accumulation of elements in plants
and soils in and around Nellore mica belt, Andhra Pradesh,
India—a biogeochemical study. Environ Geol 41:852–860
Nelson DW, Sommers LE, (1996) Total carbon, organic C and
organic matter. In: Page AL, Miller RH, Keeney DR (eds)
Methods of Soil Analysis, Part 2, 2nd. Agronomy Monograph 9.
Soil Science Society of America, Madison WI, pp 961–1010
Oliva SR, Mingorance MD (2006) Assessment of airborne heavy
metal pollution by aboveground plant parts. Chemosphere 65:
177–182
Ozdemir Z (2005) Pinus brutia as a biogeochemical medium to detect
iron and zinc in soil analysis, chromite deposits of the area
Mersin, Turkey. Chem Erde 65:79–88
Pratas J, Prasad MNV, Freitas H, Conde L (2004) Pinus pinasterAiton (maritime pine): a reliable indicator for delineating areas
of anomalous soil composition for biogeochemical prospecting
of As (Arsenic), Sb (Antimony) and W (Tungsten). Eur J Miner
Process Environ Protect 4:136–143
Pratas J, Prasad MNV, Freitas H, Conde L (2005) Plants growing in
abandoned mines of Portugal are useful for biogeochemicalexploration of arsenic, antimony, tungsten and mine reclamation.
J Geochem Explor 85:99–107
Quin BF, Brooks RR (1972) The rapid determination of tungsten in
soils, stream sediments, rocks and vegetation. Anal Chim Acta
58:301–309
Rodriguez JH, Wannaz ED, Salazar MJ, Pignata ML, Fangmeier A,
Franzaring J (2012) Accumulation of polycyclic aromatic
hydrocarbons and heavy metals in the tree foliage of Eucalyptusrostrata, Pinus radiata and Populus hybridus in the vicinity of a
large aluminium smelter in Argentina. Atmos Environ 55:35–42
Salgueiro AR, Avila PF, Pereira HG, Oliveira JMS (2008) Geosta-
tistical estimation of chemical contamination in stream sedi-
ments: the case study of Vale das Gatas mine (northern
Portugal). J Geochem Explor 98:15–21
Sawidis T, Breuste J, Mitrovic M, Pavlovic P, Tsigaridas K (2011)
Trees as bioindicator of heavy metal pollution in three European
cities. Environ Pollut 159:3560–3570
Int. J. Environ. Sci. Technol. (2013) 10:809–826 825
123

Silva JJRF, Williams RJP (2001) The biological chemistry of the
elements. The inorganic chemistry of life, 2nd. Oxford Univer-
sity Press, New York, pp 450–470
Sun FF, Wen DZ, Kuang YW, Li J, Zhang JG (2009) Concentrations
of sulphur and heavy metals in needles and rooting soils of
Masson pine (Pinus massoniana L.) trees growing along an
urban-rural gradient in Guangzhou. China. Environ Monit
Assess 154:263–274
Van Loon JC (1985) Selected methods of trace metal analysis:
biological and environmental samples. Wiley, London
Walsh JN, Gill R, Thirlwall MF (1997) Dissolution procedures for
geological and environmental samples. In: Gill R (ed) Modern
analytical geochemistry. An introduction to quantitative chem-
ical analysis techniques for earth, environmental and materials
scientists. Longman, Essex, pp 29–40
Wittig R (1993) General aspects of biomonitoring heavy metals by
plants. In: Markert B (ed) Plants as biomonitors: indicators for
heavy metals in the terrestrial environment. VCH, Weinheim,
pp 3–27
826 Int. J. Environ. Sci. Technol. (2013) 10:809–826
123