Embed Size (px)
Citation preview

Testing femtosecond delay line for diffractive imaging and atomic, molecular and
optical sciences at ELI Beamlines
Michaela Lastovickova, Headington School Oxford Secondary School Student
RAD 9 Conference, June 2021
❑ Objectives❑ Scientific motivation❑ fs-laser facility: ELI Beamlines (Dolní Břežany, CZ)❑ The Delay Line❑ The Michelson Interferometer Test❑ Vibration Stability❑ Test Results❑ Measurements with Attocube Sensors❑ Summary ❑ Acknowledgements❑ About Author
Outline

Objectives
❏ To design à scientific tool for research and educational purposes and develop à test which would combine two different forms of interferometry (the Michelson interferometer and Fabry-Perot Interferometry).
❏ To conduct à feasibility study for its utilization.❏ To test to validate both the validity and reliability of the tool.❏ To identify any possible problems and ways of resolving them.

Scientific Motivation❏ The research group for application in molecular, biomedical and material science at ELI Beamlines needs to control
the delay of synchronized laser beams down to femtosecond precision. ❏ For this purpose, there will be a precise delay line installed on the laser beam path to the experimental
end-station, called MAC (consisting of a precise linear stage and optical elements).❏ The MAC end-station will support experiments in AMO (Atomic, Molecular and Optical) science and CDI
(Coherent Diffractive Imaging) using radiation from highly synchronized pulsed light sources in the wide range of the electromagnetic spectrum.
Visualization of the MAC end-station in Experimental Hall 1.
❏ The MAC user end-station is equipped with electron/ion spectrometers, detectors for coherent diffractive imaging and state-of-the-art sample delivery systems in order to allow advanced photon science experiments to take place.
Experiments at MAC station include: plasma channel formation in dense gas targets irradiated with intense NIR laser fields, electron and ion photoemission from laser-irradiated nanoparticles, imaging of nanoparticle explosion by ion velocity map imaging and many more.

European Extreme Light Infrastructure (ELI Beamlines) in Dolní Břežany, CZ ELI Beamlines is a research centre which aspires to both install and run the worlds most intense laser systems. With ultra-high peak powers of up to 10 PW and intensities up to 1024 W/cm2, they intend to offer distinctive sources of synchronized laser beams, radiation and particle beams. It aims to deliver ultra short and intense laser pulses which will last tens of femtoseconds The ELI Project is an integral part of the European plan to build the next generation of large research facilities.
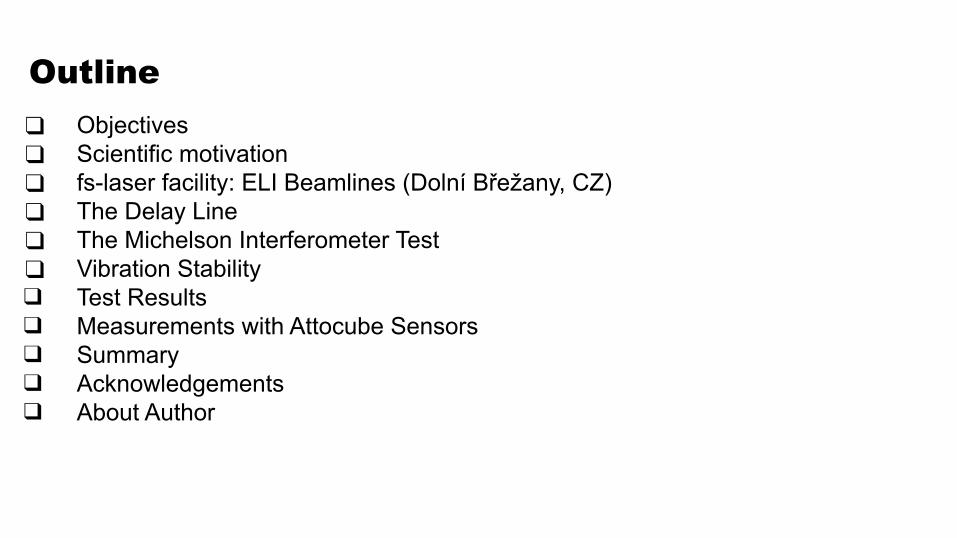
The Delay LineThe translation linear stage used to serve as the main component of the delay line has to fulfill a number of requirements:❏ If the required precision level is 10 fs the path travelled by light in vacuum at speed of c = 299 792 458
m/s is only about 3 μm. Since the light has to travel back and forth then each 1.5 μm movement of the stage corresponds to those 3 μm. ❏ Thus, the required level of precision of these stage movements is about one micrometer.
❏ If the delay happens to reach nanosecond range, then the overall distance travelled by light in a vacuum is approximately 30 cm per 1 ns. ❏ Hence, the overall travel range of the line should be in order of decimeters while maintaining
micrometer precision.
The linear stage selected for tests was the Aerotech PRO190SL/SLE. These stages are used in high-performance applications such as: industrial robots, fiber optics and photonics, vision systems, medical component laser machining etc.
Aerotech PRO190SL/SLE linear translation stage.
According to the data sheet, this model has a travel distance of 500 mm and precision of 13 μm in the Standard version and 1.5 μm in the HALAR version (the version purchased).

The Michelson Interferometer Test❏ The Michelson Interferometer is a common configuration for optical interferometry (a measurement method
using the phenomenon of interference which was invented by Albert Michelson).
❏ The Michelson interferometer, in the configuration built for the test, produces interference fringes by splitting a beam of monochromatic light in order for one split beam to strike a fixed mirror and the other a movable mirror. When the reflected beams are brought back together, an interference pattern results.
❏ ELI in-house resources were used in the building of the Michelson interferometer suitable for the delay line tests. We used a green laser (532 nm wavelength). A one arm mirror was mounted on the Aerotech linear stage. ❏ Therefore, when the stage moved, the difference between the distances of the two arms changed
twice as much, which also meant that the fringes moved too.
❏ Precise measurements could be gathered by moving the mirror and counting the fringes which moved by a certain point. Therefore the formula regarding distance d associated with m fringes is d = mλ/2 .
❏ One of the downfalls to this experiment was that, the further the movable mirror was moved, the less fringes were visible until there were no interference fringes visible.❏ This potentially happened due to the coherence length of the laser pointer. When a distance longer than
the coherence length is travelled then the fringes gradually disappear.

Michelson interferometer as build in room LB.1.19 in the Laboratory Building of ELI Beamlines.
The Michelson interferometer interferogram as observed on an imaging plate.The interferometer was originally built in room LB.1.19 in the Laboratory Building. However, the
interferogram was flickering and moving at least half the wavelength thus making the test overly complicated. This was either due to the laser itself (regarding coherence or stability issues) or due to the vibrations of the optical table and thus of the optical components.

Vibration StabilityAs a consequence of the flickering of the interferogram issue, the level of vibrations was measured in LB.1.19, on both the room floor and the optical table, in order to find the cause of the problem and so the solution. We used the Bruel & Kjaer 2250 analyser along with a seismic accelerometer which had the sensitivity of 10 V/g, in order to measure the acceleration.
Vibrations were measured not only in LB.1.19 but also in another room in the basement of the Laboratory Building LB.02.14 (a ISO 7 Cleanroom Assembly Area) where the level of vibrations was expected to be significantly lower. The displacement values were derived from the frequency spectrum in Bruel & Kjaer BZ-5503 Measurement Partner Suite.The ISO 7 area (which is a cleanroom area as previously mentioned), was certainly significantly better in low frequencies which, as was suspected, were mostly responsible for causing the interferogram flickering.
The experimental setup was moved to the LB.02.14 (also known as ISO 7 Assembly Area), a clean area, and the interferogram flickering issues were resolved.
Integrated displacement RMS for frequency range between 1 Hz and 100 Hz.

Displacement RMS in meters as a function of vibration frequency in Hz for both rooms, ie LB.1.19 and LB.02.14 ISO 7 Assembly Area.

Acceleration PSD in g2/Hz units as a function of vibration frequency in Hz for both rooms, ie LB.1.19 and LB.02.14 ISO 7 Assembly Area.

Test ResultsThe stage movement was read from the interference pattern using a photodiode connected to an oscilloscope.❏ The photodiode used was a fast 2GHz Thorlabs DET025A/M with
400-1000 nm sensitivity range and rise/fall times 150 ps.❏ A 100 um circular pinhole was placed in front of the diode, to select
the signal area with higher precision than the size of the diode active area.❏ However, this step turned out to be unnecessary due to the large
size of the fringes. ❏ It was difficult to count fringes on the oscilloscope, especially when the
stage suddenly quickly moved at very high speeds.❏ It was impossible to find any pattern from the scope
regarding the direction in which the stage moved. ❏ The oscilloscope doesn't know which direction it is being
moved in. ❏ Although the Michelson interferometer setup was very useful from
the educational point of view, it was decided to use the Attocube interferometric sensors for the final test at a very high precision level. ❏ It also revealed that the stage control software executes
some non-trivial processes when moving the stage from one position to another.
Photodiode signal as seen on Keysight InfiniiVision DSO-X 6004A oscilloscope. Each wave corresponds to half a wavelength (266 nm) movement of the tested stage.
Thorlabs DET025A/M photodiode with additional 100 μm diameter circular pin hole.

Measurements with Attocube SensorsThe Attocube model used was the IDS3010, see Figure 10. This ultra precise Displacement Sensor measures positions, movements and vibrations in real time and with a data acquisition bandwidth of 10 MHz. This specific model was able to simultaneously track targets at velocities of up to 2 m/s.
Attocube IDS3010 main unit with one sensor head connected.
The two locations where the positioning precision was tested referred to as “right” (top) and “left” (bottom). The image is blurred at the right side due to IP protection reasons.
❏ The Attocube head was first aligned with a mirror on the linear stage, this was the same mirror as used for the Michelson interferometer test.
❏ It was decided that the positioning accuracy will follow the expected model of use for the MAC end station;❏ i.e. short stepping in both directions, and this was to be
done at two distinct locations of the stage at 300 mm distance from each other, referred to as “left” and “right”.
❏ The stage was moved in 50 μm movements at 10 μm/s speeds in a number of steps.

The blue line corresponds to the position measured by the Attocube sensor, downscaled to 50 Hz data acquisition rate. The red dots are the positions as reported by the linear stage controller. The difference between the two was used to calculate its mean and standard deviation
The relative position of the stage as measured by Attocube sensor (blue line) and as recorded from the stage control software (red points) for the “right” position at the stage.

The relative position of the stage as measured by Attocube sensor (blue line) and as recorded from the stage control software (red points) for the “left” position at the stage.

The mean values for both “left” and “right” locations are smaller than 1 μm and 95% confidence level band, as calculated from 6 times the standard deviation, is 1.8 μm and 0.996 μm. Hence the stage indeed features the HALAR calibration option and it is suitable for the application previously described.
❏ There were a couple of interesting features of the stage movements interesting to note. ❏ During the movement from one position to another, the ultra precise recordings of the industrial sensor
showed approximately 22 um offsets with a slow drift on the level of seconds scale and at the sub-micrometer level at the end. ❏ This was unexpected as the cause to the offsets hadn’t yet been noted. ❏ The beginning of the movement as well as its end, before the slow drift, was accompanied by a major
vibration with audible sound. ❏ The previous graphs also clearly demonstrate why the Michelson Interferometer setup could not have been
used for the test: it was unable to reliably follow these fast vibrations and it was mixing directions of the movements.
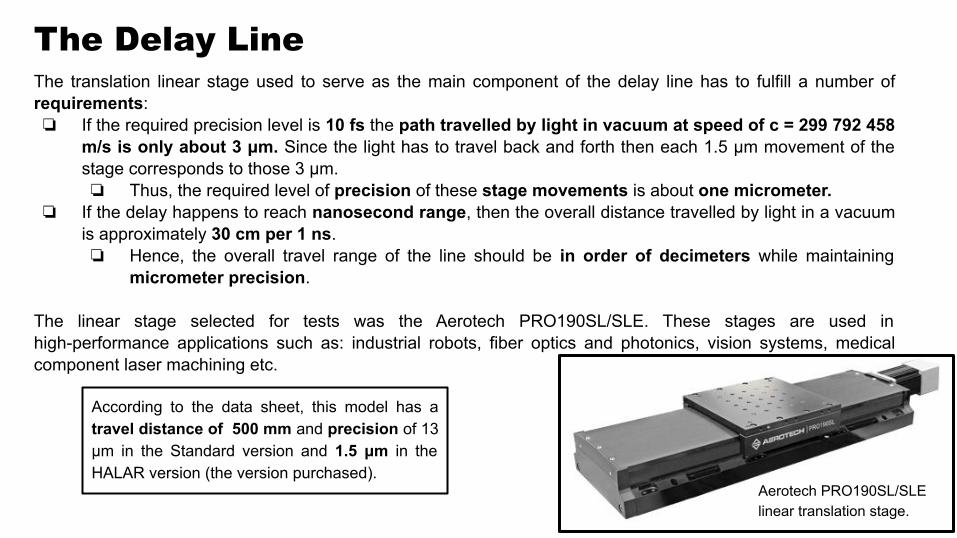
The relative position of the stage as measured by the Attocube sensor (blue line) for the “right” position at the stage. The figure corresponds to a zoom into the previous figure area where the stage audibly vibrates just after a move was finished and before the stage stabilization.
Another example of the position measurement after the stage position stabilization. There are minor oscillations visible in the position measurement with a standard deviation of about 90 nm and frequency close to 42 Hz.
No hysteresis, due to the mechanical tolerances on the moving thread, was observed when moving the stage in one direction or the other. The reported values showed no bias and corresponded to the measured position within minor error.Additional tests were performed with the Attocube sensor head being placed further away (350 mm) from the mirror on the stage also showing similar results. The motivation for these tests was the so called “double pass” and “single pass” mode in which the Attocube sensor operates and can lead to potentially biased measurements.

Summary
Based on the presented results i concluded that the Aerotech PRO190SL-500-ES190082 linear stage is indeed suitable for the femtosecond delay line application as described in the previous slides and provides one with an ultra precise range of answers. It fulfills both the range of movement required as well as the requirement on the precision of the delays. I also concluded that the stage was purchased in the HALAR version which includes the high precision factory calibration therefore allowing it to be able to suppress hysteresis effects of the stage moving thread and its thermal expansion.
Acknowledgements
I would like to express my very great appreciation to Dr Eva Klimešová from the Research Program 4 for her help in the delay line tests . I would like to offer my special thanks to Ing. Petr Pivonka who in fact started the tests with the Michelson interferometer. I am particularly grateful for the assistance given by the BIS team members for moving the optical table, setting up the oscilloscope, opto-mechanical help, cabling, help with the Attocube and overall great general help which I am most grateful and thankful for. I am hugely grateful for the help provided by Dr Michael Morrissey and Dr Tomas Lastovicka whose assistance I appreciate a lot and without whom this project would not have been possible.

About the Author
My name is Michaela Lastovickova and I am a year 12 student at Headington School Oxford.
Interested in: cancer therapy and the application of biomedical engineering techniques, gene therapy, biomechanics and bio-nanotechnology to treat diseases. I am fascinated by DNA sequencing of T cells and the use of AI in gene editing. I aspire to set up à start up for cancer research and microbiology with a facility for DNA sequencing of T cells including setting up à data bank.
Languages: English, Serbian, German, French, Czech (passively)
Inspiration to science: I come from a scientific family where the accent is in fundamental research in particle physics and so I grew up always wondering about the world; but now I want to make an independent contribution.