Embed Size (px)
Citation preview

Testing the LISA optical benchM. Trobs∗, L. d’Arcio†, S. Barke∗, J. Bogenstahl∗, I. Bykov∗, M. Dehne∗, C. Diekmann∗,
E. D. Fitzsimons¶, R. Fleddermann∗, O. Gerberding∗, J.-S. Hennig∗, F. G. Hey‡, H. Hogenhuis§,C. J. Killow¶, E. Kochkina∗, J. Kullmann∗, M. Lieser∗, S. Lucarelli‡, M. Perreur-Lloyd¶, J. Pijnenburg§,
D. I. Robertson¶, A. Shoda∗, A. Sohmer‡, A. Taylor¶, G. Wanner∗, H. Ward¶, D. Weise‡,G. Heinzel∗, K. Danzmann∗
∗Albert Einstein Institute, Callinstrasse 38, 30167 Hannover, Germany Email: [email protected]†ESA/ESTEC, Postbus 299, 2200 AG Noordwijk, The Netherlands‡EADS Astrium GmbH – Satellites, 88039 Friedrichshafen, Germany
§TNO Science & Industry, P.O. Box 155, 2600 AD Delft, The Netherlands¶University of Glasgow, Glasgow G12 8QQ, Scotland, UK
Abstract—The Laser Interferometer Space Antenna (LISA)aims to detect gravitational-waves down to mHz frequencies. Itwill consist of three spacecraft forming an equilateral triangle inan Earth-like orbit around the sun. Drag-free test masses definethe arms of a Michelson interferometer that is implementedby mutual laser links between the satellites in a transponderconfiguration. Each LISA satellite carries optical benches, onefor each test mass, that measure the distance variations to thelocal test mass and to the remote optical bench on the distantsatellite. In addition, the optical bench includes an acquisitionsensor and mechanisms for laser redundancy switching and pointahead angle correction.
Currently, an elegant bread board of the optical bench isdeveloped and will be characterised. This requires to completeexternally the two interferometers mentioned above by simulators- a test mass simulator and a telescope simulator. We will givean overview of the test infrastructure including the overall setup,the simulators, and the phase measurement system.
I. INTRODUCTION
The Laser Interferometer Space Antenna (LISA) [1] aimsto detect gravitational waves in the frequency range from0.1 mHz to 1 Hz. The mission will consist of three satellitesthat orbit the sun in a heliocentric orbit, following the earth.Each satellite will carry free-flying test masses that define theendpoints of the interferometer arms. Laser light transmittedbetween the satellites will be used to read out the armlengthchanges with picometre/
√Hz accuracy. For this purpose the
main optical instrument on the satellite, the optical bench(OB), contains a test mass interferometer that measures thedistance between test mass and OB and a so-called scienceinterferometer, that measures the distance between local OBand the OB on the remote satellite. In addition, the OB housesa reference interferometer for the test mass readout and anauxiliary interferometer, that measures pathlength changes bythe so-called point ahead angle mechanism (PAAM) [2].
Currently, an elegant breadboard of the LISA OB is in devel-opment by a consortium consisting of EADS Astrium GmbH– Satellites as prime contractor to the European Space Agency(ESA), TNO Science & Industry, University of Glasgow andAlbert Einstein Institute [3]. Although this project was initiatedwhile LISA was the L1 candidate mission, the basic metrology
TX light
LO light
reference ifo
test mass ifo
scienceifo
PAAM ifo
to telescopeRX, TX light
Fig. 1. Layout of the LISA optical bench.
functions implemented and the results are also applicable toNGO/eLISA [4], [5].
Figure 1 shows the layout of the OB. The TX laserinjects about 1.6 W of light at 1064 nm wavelength on theleft hand side. The main fraction of this light will be sentto the telescope and from there to the distant satellite. Afraction of the light is used for local interferometer readoutsand another fraction is transmitted to the second OB on thesame satellite. In the same way, light from the other OB onthe satellite is injected to the OB on the top in Fig. 1 via theso-called backlink fiber. On the OB this so-called LO light isused with the TX light in the reference, PAAM, and test massinterferometer (in the upper left, lower left, and upper rightin the figure, respectively). The science interferometer (in thelower right) interferes light from the distant satellite (RX light)with local TX light. Heterodyne interferometry will be used

TSOB
3x
frequency counter
phasemeter
PLL
power stabilisation
power stabilisation
temperaturereadout
pressurereadout
LTX
LR
LBLFA
LRX
Fig. 2. Schematic layout of the test setup with optical bench, test mass and telescope simulator, lasers, temperature measurement system, and phasemeasurement system.
with heterodyne frequencies in the range from 2 to 20 MHz.Characterisation of the OB requires to externally close the
test mass interferometer and the science interferometer bysimulators and read-out of the respective photo detectors witha phase measurement system. In the following sections we givean overview of the experimental setup, the phase measurementsystem and the test mass and telescope simulator.
II. EXPERIMENTAL SETUP
Figure 2 shows a simplified schematic of the experimentalsetup that will be used to test the performance of the scienceinterferometer. Optical bench as well as telescope and testmass simulator will be placed inside the vacuum chamber(the simulator will be placed on top of the optical benchthrough Zerodur legs for pathlength stability). A combinationof scroll pump and turbo pump is connected via diaphragmbellows to the chamber and keeps the pressure at a levelbelow 10−5 mbar. The chamber rests on a self-levelling vi-bration isolation system that is also used for optical tables.It decouples the chamber from vibrations caused by e.g. thevacuum pumps. Laser LTX is a commercial nonplanar ringoscillator laser (Prometheus 20 by Innolight), that generatesabout 700 mW of output power at 1064 nm and uses a non-linear crystal in single-pass transmission to generate laserlight of a few mW at the second harmonic frequency. Thisgreen light is used for frequency stabilisation of the laser tomolecular iodine using modulation-transfer spectroscopy [6].The laser output is amplified by an Ytterbium-doped fiberamplifier (PSFA-1064-01-5W-1-3 by Nufern). About 1.6 Wof optical power will be injected to the optical bench. LaserLR is an identical frequency stabilised laser system (withoutamplifier) that is used for frequency noise characterisation. Thedifferential frequency noise between both stabilised lasers is
about 300 Hz/√
Hz×uPL(f) where the shape factor uPL(f) isgiven by
uPL(f) =
√1 +
(2.8 mHz
f
)4
.
The output of laser LBL is transmitted to the optical benchand is required for operation of reference, test mass andPAAM interferometers. When used, the frequency of laserLBL will be offset-phase-locked to laser LTX to a differencefrequency in the 2 to 20 MHz range. For operation of thescience interferometer lasers LTX and LRX are required. LaserLRX is then transmitted to the telescope simulator. The signalfrom the transponder interferometer is used to offset-phase-lock laser LRX to laser LTX. In the beam path of laserLRX up to three mirror pairs can be inserted to attenuate thebeam power. Mirror pairs with 45 angle of incidence werechosen because the beam direction and location is not alteredupon insertion of the attenuators. A fraction of the powertransmitted to optical bench and telescope simulator will besplit off and measured with photodetectors. Their signals willbe used to stabilise the laser output powers by feeding back tothe fiber amplifier pump current and the laser pump current,respectively. The photodetector signals of the interferometersin use will be input to the phase measurement system, alsocalled phasemeter, that is described in Sec. III. As auxiliarydata, temperature sensors will be placed at different locationsand the pressure in the vacuum chamber and the differencefrequency between both stabilised lasers can be recorded.
Figure 3 shows a schematic side view of the vacuumchamber. It will contain the optical bench with the telescopesimulator on top. They will be surrounded by a thermalshield. The shield consists of walls of sheet Aluminum onan Aluminum baseplate. The optical bench and the thermal

Fig. 3. Schematic of the vacuum chamber with thermal shield.
10−4
10−3
10−2
10−1
100
10−6
10−5
10−4
10−3
10−2
10−1
100
Tem
per
atu
re n
ois
e (K
/√H
z)
Frequency (Hz)
1. Thermal Shield free PT10k2. Thermal shield bottom 10k3. Chamber Wall PT10k4. AL PT10k5. ULE PT10k6. AL NTC7. ULE NTC8. Actuator NTCRead−out limit PT10k (4−5)Read−out limit NTC (6−7)Goal
Fig. 4. Temperature noise in the vacuum chamber at different locations.
shield baseplate will rest on ceramic spacers made of Macor.Shield and spacer act as thermal low pass for heat conduction.The shield acts as a thermal capacitor, the spacers as thermalresistors. The metal shield is completely covered by multi-layer insulation (ten pairs of reflecting foil and spacer) toincrease the thermal resistance for thermal radiation. Thethermal shield is surrounded by an intermediate mass made ofAluminum resting on Macor spacers. All cables connected tooptical bench or simulator will be brought into contact with theintermediate mass before they are connected to feedthroughsin the vacuum chamber walls. The intermediate mass reducestemperature fluctuations of the cables originating from thelaboratory environment.
Figure 4 shows the temperature noise in the vacuumchamber at different locations. During the temperature noisemeasurement, the LISA optical bench was replaced by anoptical bench that was used for interferometric actuator char-acterisation. The trace labelled ‘goal’ shows the temperaturenoise nT(f) we aim for during LISA optical bench testing,which is given by
nT(f) = 9.1 · 10−8 K√Hz× uT(f), (1)
where uT(f) is given by
uT(f) =
√1 +
(20 mHzf
)4
.
Two different types of temperature sensors were used: Nega-tive temperature coefficient thermistors (NTCs, dashed lines)
1 kHz
1 kHz
1 kHz
0 s fLO fmirror frequency
Fig. 5. Mixing of noise to interferometer heterodyne frequency. White noisepresent at the mirror frequency is folded to the downmixed signal, increasingits noise level by a factor of
√2.
and platinum sensors (PT, solid lines) both with resistancesof 10 kΩ at 25 C. The traces labelled ‘read-out limit’ weregenerated from the differences of two sensors each. They showthe uncorrelated noise between these two channels and are ameasure for the sensitivity of the temperature measurementsystem. With PT and NTC sensors, temperature noise floors of10−5 K/
√Hz and 3 · 10−6 K/
√Hz were reached, respectively.
For frequencies below 1 mHz, the measured temperature noisewithin the thermal shield was compliant with the goal, forhigher frequencies the measurement was sensor-noise limited.
III. PHASE MEASUREMENT SYSTEM
Initially we planned to use the phase measurement system(PMS) of LISA Pathfinder [7] for input signal frequencies inthe kHz range. This would have required to mix the heterodynesignals generated on the optical bench from MHz frequenciesto kHz frequencies. However, such a downmixing increases thephase readout noise by a factor of
√2 when an additive white
noise floor is present. This is caused by the folding of mirrorfrequencies, containing noise, to the downmixed signal as isshown in Fig. 5. Although filtering of the mirror frequencies ispossible in theory, it is not a practical solution. Figure 6 showsthat the phase noise requirement of the science interferometercannot be met with signal downmixing from MHz to kHz.With downmixing, shot noise, electronic noise and laser powernoise completely use the allocated noise, leaving no roomfor the other noise sources (see discussion in Section IV-E).Instead of the PMS of LISA Pathfinder, a LISA-style MHztracking PMS will be used of which a prototype becameavailable during the course of this activity. The LISA PMSdirectly digitises analog signals at MHz frequencies, and trackstheir phase via an all-digital phase-locked loop. This allowsto measure the signal frequency, phase and amplitude with ahigh bandwidth [8].
Figure 7 shows the schematic of one channel of the LISAPMS [8]. Externel to the PMS, two laser beams are interferedand detected by a photodiode. The current of the photodiode

10-12
10-11
10-10
10-9
10-8
10-4 10-3 10-2 10-1 1
Opt
ical
pat
hlen
gth
nois
e (m
/√H
z)
Frequency (Hz)
Science ifo + Telsim Requirements.+e.+p. noise w. downmixingshot+electronic+power noise
Fig. 6. Effect of downmixing on predicted telescope simulator performance.
RAAF
ADC Q
I
PIRPA
PI
fhet50MHz fref
TIA + Filter
Phasemeter (LISA Prototype)
FPGA
OPA
1064nmanalogdigitalReadout
cossin
Fig. 7. Schematic of LISA phase measurement system
is converted to a voltage by the transimpendance amplifier(TIA) and filtered by an anti-aliasing filter (AAF) before beingdigitised by an analog-to-digital converter (ADC). The digitalsignal is mixed with sine and cosine local oscillator signals ofthe same frequency. This yields quadrature (Q) and in-phase (I)signals, respectively. The latter is a measure for the amplitudeof the heterodyne signal, the former is the phase differencebetween input signal and local oscillator. This phase differenceis used in a control loop to adjust the frequency and phase ofthe local oscillator signal to the input signal. For this purposethe Q signal is amplified by a proportional-integral amplifier,a constant reference frequency is added and the sum is inputto the phase increment register (PIR). The PIR, the phaseaccumulator (PA), and the lookup table for sine/cosine forma numerically controlled oscillator (NCO). The main outputsof the PMS are the values of the PIR and the PA registers,that correspond to frequency and phase of the input signal,respectively.
A prototype PMS operating as described above has shownsufficient performance for LISA optical bench testing whenoperated with electrically generated signals. For optical benchtesting sixteen analog input channels will be processed by theFPGA.
IV. TEST MASS AND TELESCOPE SIMULATOR
The telescope simulator receives a fraction of TX lightemitted from the optical bench and interferes it with light
that is sent to the science interferometer in the so-calledtransponder interferometer. The latter acts as reference forthe science interferometer. In addition to the transponderinterferometer, the telescope simulator houses the so-calledcommissioning interferometer. It can be used to verify thepathlength noise performance of the telescope simulator itself.
A. Purpose and requirements
The test mass simulator should allow optical pathlengthnoise measurements to verify 2.82 pm/
√Hz×uPL(f) accuracy
for a well aligned test mass, which means the returned beamis misaligned to the reference beam by up to 10µrad. Inaddition to that, a working interferometer readout should bedemonstrated for misalignments up to 500µrad.
The purpose of the telescope simulator is to• enable optical pathlength measurements of the science
interferometer for beam angles within ±10µrad with ameasurement noise below 10.5 pm/
√Hz×uPL(f)
• enable beam angle measurement noise of lessthan 12.2 nrad/
√Hz for beam angles within
±10µrad assuming maximum RX beam tilt jitterof 448 nrad/
√Hz×uPL(f)
• provide an RX beam with tilt angles within ±100µradfor functional testing of the science interferometer
• provide an RX beam with tilt angles within ±16 mrad fortesting of the acquisition sensor
We allow for a 10% increase of the requirements by testmass simulator and telescope simulator, respectively.
B. Design considerations
Tilt actuators are required in the telescope simulator for twopurposes:
1) The RX beam generated by the telescope simulator mustbe aligned to the TX beam in the science interferometeron the optical bench and
2) the light interfering with the TX light on the telescopesimulator must be aligned to the TX beam.
For both purposes, four degrees of freedom are required each.This is achieved by using pairs of mirrors on tip-tilt mounts,of which the first one is used to set the reflection point on thesecond one, which in turn sets the direction of the beam.
In the test mass simulator for the LISA technology package(LTP) it was observed that PZT stacks only fulfill the LTPlength noise requirement for low actuation voltages not suffi-cient for the complete angle range. Hence, we restricted thechoice to those commercially available actuators that do notneed a voltage applied to them to stay at an arbitrary angle(set-and-forget devices). Here, the AG-M100N-V6 by Newportwas chosen as baseline actuator.
The requirements on the RX beam generated by the tele-scope simulator restrict its power to about 300 pW beingdetected in the science interferometer. Such small light powersare not detectable by IR-viewer cards commonly used to tracethe beam path of IR laser beams. The photo diodes to be usedin the science interferometer also exhibit a dark current higher

than the current that would be generated by a beam of this lightpower, also rendering them useless in alignment of this beam.
These properties of the beam and possible detectors showthat no signal can be produced to guide the alignment. Theonly remaining alternative for alignment is to scan the beamacross all possible angles and positions and wait for a “bychance” alignment of the two interfering beams within 500µrad to allow for efficient heterodyne detection and the genera-tion of differential wavefront sensing (DWS) alignment signals[9], [10]. Obviously, this would be a lengthy and cumbersomeprocedure which calls for a better way of aligning the twobeams.
One way to achieve a better alignment is to increase beampower during the alignment stage and then reduce light powerafterwards with as little change of geometry and alignmentof the RX beam as possible. This allows to detect the beamusing conventional methods (IR viewer card and DC-currentof photodiode) during the alignment phase and to switch overto heterodyne detection and the use of DWS signals enabledthrough this pre-alignment.
Further information on design and construction of test massand telescope simulator can be found in [11].
C. Layout
Figure 8 shows the layout of the test mass and telescopesimulator. It defines the positions of all optics to be bondedon the Zerodur base plate using hydroxide-catalysis bonding[12] to provide the necessary stability. Due to the adjustableoptics the tolerances on these positions are sufficiently looseto enable the use of a template for the positioning duringthe bonding process which greatly eases and speeds up thebuilding process.
The test mass simulator consists of optical componentsTMSim1 and Mtm. A pick-up mirror will be placed on theLISA OB between PBS2 and the out-of-plane mirror to sendlight to mirror TMSim1 that reflects the light to mirror Ttm.The latter uses a reflective gold coating and is placed on atilt actuator and linear actuator to simulate the test mass. Thisactuator assembly is described in more detail in Sec. IV-D.
All other components on the Zerodur baseplate belong tothe telescope simulator, that is described in the following.The mainly s-polarised output beam from the Fibre InjectorOptical Subassembly (FIOS) Telsim in the upper right corneris reflected from polarising beam splitter PBS101 to cleanthe polarisation. Beam splitter BS101 splits the beam intotwo equal parts. One part is magnified by lens1 and lens2to 5 mm diameter and reflected by mirrors M4 and M3 (45
angle of incidence). Beam combiner BS6 reflects 1% of thepower towards the out-of-plane mirror Mup that sends the RXbeam towards the science interferometer on the optical bench.M4 and M3 are mounted in actuator assemblies described inSection IV-D below. They are used to align the RX beam to thescience interferometer. The other part of the beam is reflectedby mirrors M101 and M102 (41.5 angle of incidence) anddirected to beam combiner BS103. There, the beam from theTelsim FIOS interferes with a fraction of the TX beam from
the optical bench. One percent of the p-polarised TX beamis reflected by BS6, reduced in diameter by lens2 and lens1,transmitted through PBS102 and rotated to s polarisation byhalf-wave plate HWP1. The interference signals of TX beamand RX beam are detected by photo detectors PD1 and PD2.Mirrors M101 and M102 are used to align the transponderinterferometer.
A second FIOS, FIOS com, has been placed in the centralupper part. It is used for commissioning of the telescopesimulator. Its s-polarised output beam is split by BS104 intotwo parts. The reflected part propagates towards BS6. Forcommissioning a mirror and quarter-wave plate will be placedbetween M3 and BS6, that reflect all light back and rotate itspolarisation by 90, such that it is transmitted through PBS102and interferes at BS103 with light from FIOS Telsim. The parttransmitted through BS104 is interfered at BS106 with lightfrom FIOS Telsim. The interference signals in this commis-sioning interferometer are detected by photo detectors PD3and PD4. Polarisation cleaning for the light from FIOS comis performed by PBS102 and PBS105. For commissioning, thebeam path between BS102 and BS104 has to be blocked. Thiswill be achieved by insertion of a mirror that reflects the lightcoming from FIOS Telsim to the space between beam dumpsBD1 and BD2 where an additional beam dump will be placed.
A fraction of the power emitted from FIOS Telsim and FIOScom is detected by photo detectors behind BS107 and BS105,respectively, to monitor and or stabilise the output power fromthe FIOSes.
D. Actuator assemblies
The optical paths on telescope and test mass simulatormust be stable to pm/
√Hz for the temperature noise during
mesurements (nT(f), cf (1)). In order to achieve stable mirrorpositions, the tilt actuators for mirrors M3, M4, M101, andM102, and the tilt and linear actuators for the test mass mirror,Mtm, have been mounted on temperature-compensating brassmounts. Figure 9 shows a side view of the assembly for the testmass simulator. The linear actuator (AG-LS25V6 by Newport)is screwed onto the brass mount. It translates the tilt mount(AG-M100N-V6 by Newport) that is screwed on top of it tothe left and right. A steel adapter plate with the mirror attachedto it is glued to the front side of the tilt mount (facing to theright in Fig. 9) The assembly has been designed to keep themirror front surface at the same position when the temperaturevaries. The brass mount has three spring leaf-shaped feet, thatare glued to the telescope simulator baseplate. When the lengthof the brass mount changes with temperature, the two feet atthe position of the mirror (only one if visible in Fig. 9) stay inposition. The foot at the back then bends. The distances a, b,c, d and the thermal expansion coefficients of the respectivematerials have been chosen, such that the mirror surface staysat the same location. More precisely, for given materials andgiven distances a, c, and d we will adjust the thickness bof the steel adapter plate to fine-tune the thermal expansioncoefficient dsAct
dT of the actuator assembly. We aim to achievedsActdT ≤ 1 · 10−8 m/K.

−0.1 0.0 0.1 0.2 0.3
−0.1
0.0
0.1
0.2
TMSim1 Mtm
M9BD6
BD7
FIOS TELSIM
FIOS COM
PBS101BS101BS102
BS104
M101
PBS102
BD5
HWP1
M102
BS103
M5 M6
BS107
M8
PBS105
BD8
BS105
BS106
BD1 BD2 BD3
BD4
Power
Power
PD3
PD4
baseplate
PD1
PD2
BS6
BD3
BD4
MUP
M3
LSM1 LSM2
lens1 lens2 M4
Fig. 8. Schematic layout of test mass and telescope simulator
Fig. 9. Side view of actuator assembly
The actuator assemblies for mirrors M101, M102, M3, andM4 use a metal adapter instead of the linear actuator shownin Fig. 9.
E. Performance prediction
In this section we predict the pathlength noise performanceof the telescope simulator in combination with the opticalbench. We also provide the data required to predict theperformance in commissioning mode and of optical bench andtelescope simulator individually.
1) Local noise sources: First, we consider noise sourcesthat are local to an interferometric readout: shot noise, elec-tronic noise, and relative power noise. They add to the signalat the heterodyne frequency and degrade the interferometricpathlength measurement. Given a signal and a noise of aninterferometer readout, its pathlength noise ∆s is given by
∆s =λ
2π
noisesignal
(2)
where λ is the laser wavelength. We consider the signal andthe noise from both ports of the interferometer, i.e. fromthe combined signals of two quadrant photodiodes with foursegments each. The rms signal of the combined photocurrents(in A) is given by
signal = η√
2γPsigPlo (3)
where η is the efficiency of the photodiodes, γ the modeoverlap (heterodyne efficiency) of the interfering beams andPsig and Plo are the signal and local oscillator power beforethe recombination beamsplitter, respectively. The shot noise,electronic noise, and relative power noise of the combinedphotocurrents in (A/
√Hz) are given by
noiseshot =√
2qeη (Psig + Plo) (4)
noiseel =√
8nel (5)noiseRPN = nRPNη (Psig + Plo) , (6)
where qe is the elementary charge, nel is the electronic noiseper QPD segment, and nRPN is the relative power noise ofsignal and local oscillator beam. We use nel = 3.5 pA/
√Hz
and nRPN = 2 · 10−8/√
Hz in the following.Inserting (3) and (4), (5), (6) into (2) yields the pathlength
noise due to shot noise, electronic noise and relative powernoise for interferometer I .
∆sshot(I) =λ
2π
√qe (Psig(I) + Plo(I))
ηγPsig(I)Plo(I)(7)
∆sel(I) =λ
π
nel
η√γPsig(I)Plo(I)
, (8)
∆sRPN(I) =λ
2π
nRPN (Psig(I) + Plo(I))√2γPlo(I)Psig(I)
, (9)
These three noise sources are independent and hence addquadratically. Their combined pathlength noise ∆sL(I) isgiven by
∆sL(I) =√
∆sshot(I)2 + ∆sel(I)2 + ∆sRPN(I)2. (10)
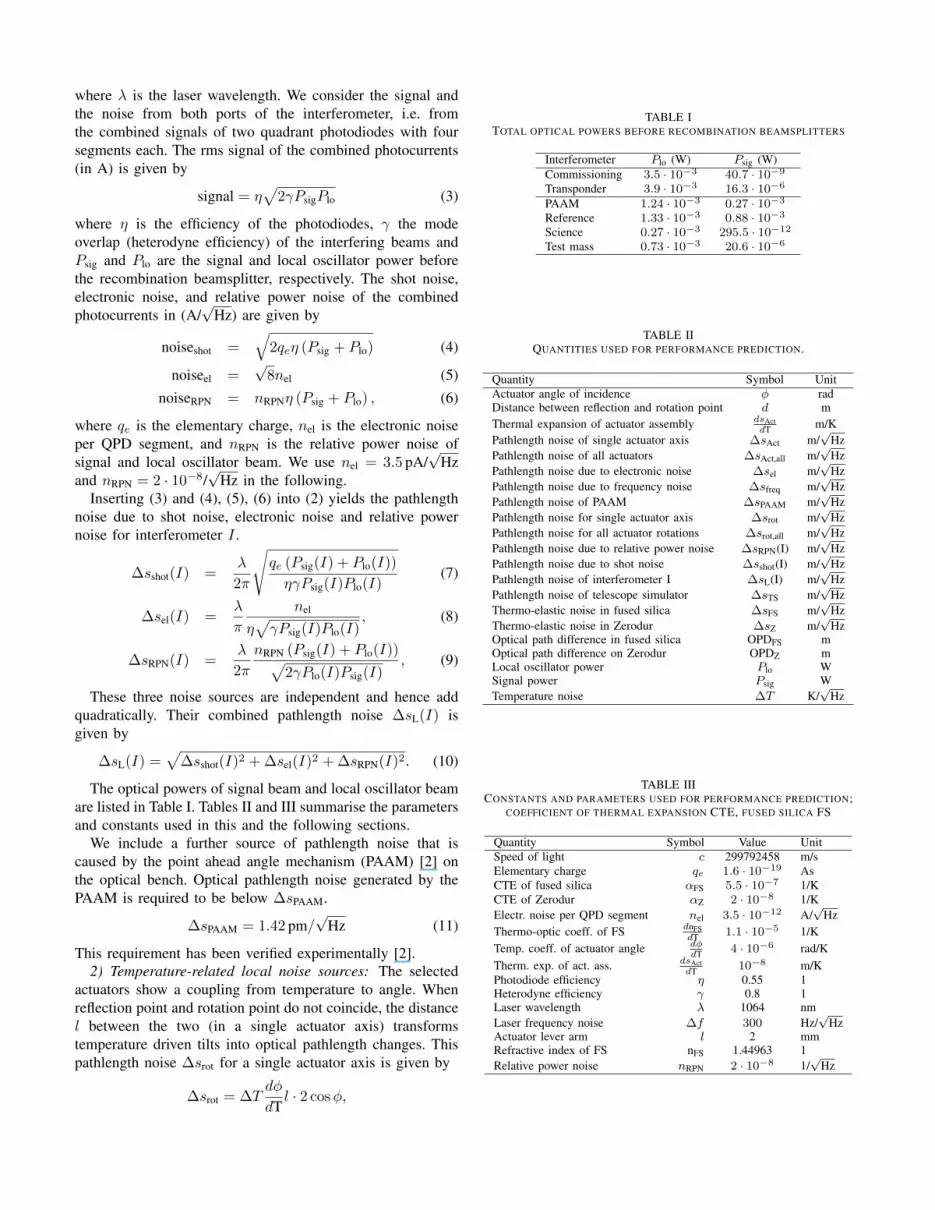
The optical powers of signal beam and local oscillator beamare listed in Table I. Tables II and III summarise the parametersand constants used in this and the following sections.
We include a further source of pathlength noise that iscaused by the point ahead angle mechanism (PAAM) [2] onthe optical bench. Optical pathlength noise generated by thePAAM is required to be below ∆sPAAM.
∆sPAAM = 1.42 pm/√
Hz (11)
This requirement has been verified experimentally [2].2) Temperature-related local noise sources: The selected
actuators show a coupling from temperature to angle. Whenreflection point and rotation point do not coincide, the distancel between the two (in a single actuator axis) transformstemperature driven tilts into optical pathlength changes. Thispathlength noise ∆srot for a single actuator axis is given by
∆srot = ∆Tdφ
dTl · 2 cosφ,
TABLE ITOTAL OPTICAL POWERS BEFORE RECOMBINATION BEAMSPLITTERS
Interferometer Plo (W) Psig (W)Commissioning 3.5 · 10−3 40.7 · 10−9
Transponder 3.9 · 10−3 16.3 · 10−6
PAAM 1.24 · 10−3 0.27 · 10−3
Reference 1.33 · 10−3 0.88 · 10−3
Science 0.27 · 10−3 295.5 · 10−12
Test mass 0.73 · 10−3 20.6 · 10−6
TABLE IIQUANTITIES USED FOR PERFORMANCE PREDICTION.
Quantity Symbol UnitActuator angle of incidence φ radDistance between reflection and rotation point d mThermal expansion of actuator assembly dsAct
dT m/KPathlength noise of single actuator axis ∆sAct m/
√Hz
Pathlength noise of all actuators ∆sAct,all m/√
HzPathlength noise due to electronic noise ∆sel m/
√Hz
Pathlength noise due to frequency noise ∆sfreq m/√
HzPathlength noise of PAAM ∆sPAAM m/
√Hz
Pathlength noise for single actuator axis ∆srot m/√
HzPathlength noise for all actuator rotations ∆srot,all m/
√Hz
Pathlength noise due to relative power noise ∆sRPN(I) m/√
HzPathlength noise due to shot noise ∆sshot(I) m/
√Hz
Pathlength noise of interferometer I ∆sL(I) m/√
HzPathlength noise of telescope simulator ∆sTS m/
√Hz
Thermo-elastic noise in fused silica ∆sFS m/√
HzThermo-elastic noise in Zerodur ∆sZ m/
√Hz
Optical path difference in fused silica OPDFS mOptical path difference on Zerodur OPDZ mLocal oscillator power Plo WSignal power Psig WTemperature noise ∆T K/
√Hz
TABLE IIICONSTANTS AND PARAMETERS USED FOR PERFORMANCE PREDICTION;
COEFFICIENT OF THERMAL EXPANSION CTE, FUSED SILICA FS
Quantity Symbol Value UnitSpeed of light c 299792458 m/sElementary charge qe 1.6 · 10−19 AsCTE of fused silica αFS 5.5 · 10−7 1/KCTE of Zerodur αZ 2 · 10−8 1/KElectr. noise per QPD segment nel 3.5 · 10−12 A/
√Hz
Thermo-optic coeff. of FS dnFSdT 1.1 · 10−5 1/K
Temp. coeff. of actuator angle dφdT 4 · 10−6 rad/K
Therm. exp. of act. ass. dsActdT 10−8 m/K
Photodiode efficiency η 0.55 1Heterodyne efficiency γ 0.8 1Laser wavelength λ 1064 nmLaser frequency noise ∆f 300 Hz/
√Hz
Actuator lever arm l 2 mmRefractive index of FS nFS 1.44963 1Relative power noise nRPN 2 · 10−8 1/
√Hz

where φ is the angle of incidence and dφdT is the angle change
per temperature change. The derivation of the factor 2 cosφcan be found in [13, pp. 102]. This coupling from temper-ature to pathlength in the tilt actuator requires to minimisethe leverarm l, when the pathlength noise of the test massinterferometer is to be characterised. This will be achievedby replacing the linear actuator by a metal adapter of lowerheight. We assume that we can keep l ≤ 2 mm both in thetest mass simulator as well as in the actuators in the telescopesimulator.
Optical pathlength noise due to thermal expansion of theactuator assemblies ∆sAct is given by
∆sAct = ∆TdsAct
dT· 2 cosφ,
where dsActdT is the expansion coefficient of the actuator assem-
blies.3) Noise sources coupled to two interferometers: Some
noise sources couple via a path imbalance in the length mea-surement. Interferometric testing of the LISA optical benchrequires to read out two interferometers simultaneously. Inthis case, the coupling factor is given by a length differencebetween the two interferometers. In this section we discuss therelevant length differences and allocate them to either opticalbench or telescope simulator. We quantify the influence oflaser frequency noise, thermal expansion of the setup (thermo-elastic noise) and temperature-driven pathlength changes infused silica (thermo-optic noise) on the length measurement.
Optical pathlength noise due to thermo-optical noise withinfused silica ∆sFS is given by
∆sFS =
∣∣∣∣∆T · OPDFS · αFS (nFS − 1) +dnFS
dT
∣∣∣∣ (12)
where ∆T is the temperature noise, OPDFS the effective imbal-ance in fused silica, αFS the coefficient of thermal expansionof fused silica, nFS its refractive index, and dnFS
dT the changein refractive index with temperature. The −1 in (12) takesinto account, that although a temperature increase increasesthe geometrical path through fused silica (for a positive αFS)but at the same time decreases the pathlength in vacuum.
Optical pathlength noise due to thermo-elastic noise ofZerodur ∆sZ is given by
∆sZ = |∆T (OPDZ − OPDFS · αFS)αZ| , (13)
where OPDZ and αZ are the path imbalance and coefficient ofthermal expansion of Zerodur.
Optical pathlength noise due to laser frequency noise ∆sfreqis given by
∆sfreq =
∣∣∣∣λc · OPDZ ·∆f∣∣∣∣ , (14)
where c is the speed of light and ∆f is the laser frequencynoise. Figure 10 shows a schematic view on optical bench andtelescope simulator. The TX laser is input to the optical bench,the RX laser is input to the telescope simulator. On the opticalbench the science interferometer is shown (BS17), on thetelescope simulator the transponder interferometer is shown
LISA OB Telescope simulator
TX laser
RX laserscience ifo
transponder ifo
LTT LRS
LRTLTTOB
LTTTS
LRSOB
LRSTS
BS13 BS17
BS101
PBS102BS103TIM
LTS
Fig. 10. Schematic view of optical bench and telescope simulator for noisepartitioning.
TABLE IVPATHLENGTH IMBALANCES AND THEIR ENDPOINTS; CF. FIG. 10
Distance EndpointsLTS BS13, BS17LTT BS13, BS103LTTOB BS13, TIMLTTTS TIM, BS103LRT BS101, BS103LRS BS101, BS17LRSTS BS101, TIMLRSOB TIM, BS17
(BS103). We define path imbalances ∆LS and ∆LT betweenTX and RX laser in science and transponder interferometer,respectively.
∆LS = LTS − LRS (15)∆LT = LTT − LRT (16)
Table IV lists the endpoints of LTS, LRS, LTT and LRT and allother lengths to be used in this section.
We do not consider the lengths between TX laser andBS13 and RX laser and BS101 because they are commonto science and transponder interferometer and hence cancel inthe difference of the two. For measurements utilising scienceand transponder interferometer, the effective length imbalance∆L is given by
∆L = ∆LS −∆LT. (17)
By inserting (15), (16), (18) and (19) into (17)
LRS = LRSOB + LRSTS (18)LTT = LTTOB + LTTTS (19)
we find∆L = ∆LOB + ∆LTS, (20)

TABLE VEFFECTIVE PATH MISMATCH ON ZERODUR AND IN FUSED SILICA;
OPTICAL BENCH OB, TELESCOPE SIMULATOR TS, TRANSPONDER MODETRANSP., COMMISSIONING MODE COMM.
OPDZ(mm) OPDFS(mm)OB -564.6 -29.1TS transp. -1040.4 -20.3OB+TS transp. -1605.1 -49.4TS comm. 665.1 33.6
with
∆LOB = LTS − LRSOB − LTTOB (21)∆LTS = LRT − LRSTS − LTTTS. (22)
We have partitioned the effective path imbalance ∆L into apart on the optical bench (∆LOB) and a part on the telescopesimulator (∆LTS). This scheme was used to produce theeffective path imbalances on Zerodur and in fused silica aslisted in Table V.
4) Combinations of noise sources: In this section we com-bine the individual noise sources discussed in the previoussections. We assume, all actuator assemblies are identical andexhibit the same temperature noise. Then their pathlengthnoises add linearly. In the horizontal axis the pathlength noisesof M101 and M102 and M3 and M4 cancel each other. In thevertical axis the noises add up:
∆srot,all = ∆Tdφ
dTl · 2 (2 cos 41.5 − 2 cos 45 − 2 cos 45)
(23)The factor of two outside the round brackets in (23) takes twoactuators each into account.
The same is true for the combined effect of longitudinalactuator noise with temperature on the optical pathlength noise∆sAct,all:
∆sAct,all = ∆TdsAct
dT· 2 (2 cos 41.5 − 2 cos 45 − 2 cos 45)
(24)Now we combine the noise sources discussed previously.
Optical pathlength noise associated with the telescope simu-lator ∆sTS is given by
∆sTS =[(∆srot,all + ∆sAct,all + ∆sZ + ∆sFS)
2
+∆sL(T ) + ∆s2PAAM + ∆s2freq
]1/2.
(25)
Depending on what path imbalance data from Table V isused, both the pathlength noise performance of the telescopesimulator in transponder mode or in commissioning mode canbe predicted.
The noise attributed to the optical bench ∆sOB is given by
∆sOB =√
(∆sZ + ∆sFS)2
+ ∆sL(S) + ∆s2freq. (26)
Finally, we combine the noise sources of optical bench andtelescope simulator and obtain
∆sOB+TS =[(∆srot,all + ∆sAct,all + ∆sZ + ∆sFS)
2
+∆sL(S) + ∆sL(T ) + ∆s2PAAM + ∆s2freq
]1/2 (27)
10-13
10-12
10-11
10-10
10-9
10-6 10-5 10-4
Opt
ical
pat
hlen
gth
nois
e (m
/√H
z)
Temperature noise (K/√Hz)
Requirementsources below combined|300 Hz/√Hz|shot noise Transppower noise Transpelectronic noise Transpshot noise Science
power noise Scienceelectronic noise Science|fused silica||actuators longitudinal||tilt coupling||Zerodur|
Fig. 11. Performance prediction for optical bench and telescope simulatoras function of temperature noise.
for the noise of optical bench and the telescope simulator intransponder mode ∆sOB+TS.
Figure 11 shows this predicted pathlength noise perfor-mance over temperature noise. For temperature noise below10−5 K/
√Hz the combined noise is below the requirement.
For higher temperature noise thermo-optic noise in fused silicais the dominant noise source followed by electronic noise andshot noise in the science interferometer.
5) Frequency dependencies: In Fig. 11 we have consideredpathlength noise as function of temperature noise. Now wefix the temperature noise to a specific value and look at thefrequeny dependencies of the noise contributions.
Pathlength noise due to electronic noise, relative powernoise and shot noise has a uniform frequency distribution. Wecan use (8), (9), (7), and (10) for a fixed temperature noisewithout modification.
For the local temperature-dependent noise sources tilt cou-pling ∆srot and thermal expansion ∆sAct of actuator assem-blies we define an additional noise shape uM(f)
uM(f) =
√1 +
(2 mHzf
)4
that we multiply with (23) and (24). We use a temperaturenoise of 10−5 K/
√Hz as approximation to the measured tem-
perature noise shapes shown in Fig. 4.For the pathlength noise due to the PAAM, ∆sPAAM, and
frequency noise induced pathlength noise, ∆sfreq, we multiply(11) and (14) with the shape factor uPL(f).
For pathlength noise on Zerodur, ∆sZ, and pathlength noisein fused silica, ∆sFS, (13) and (12) are multiplied with uM(f).
Figure 12 shows the resulting predicted pathlength noise asfunction of frequency for 10−5 K/
√Hz×uM(f) temperature
noise. Since we have demonstrated such temperature noise inthe environment foreseen for LISA optical bench testing itseems possible to verify pathlength noise performance of thescience interferometer within requirements. At about 3 mHz

10-13
10-12
10-11
10-10
10-9
10-4 10-3 10-2 0.1 1
Opt
ical
pat
hlen
gth
nois
e (m
/√H
z)
Frequency (Hz)
10-5 K/√Hz
Requirementsources below combined|300 Hz/√Hz TS|shot noise Transppower noise Transpelectronic noise Transpshot noise Sciencepower noise Scienceelectronic noise Science|fused silica||actuators longitudinal||tilt coupling||Zerodur|
Fig. 12. Performance prediction for optical bench and telescope simulatoras function frequency for 10−5 K/
√Hz temperature noise.
the pathlength noise might be slightly higher, depending onthe temperature noise during the measurements.
V. CONCLUSION
Testing of the LISA optical bench elegant breadboard re-quires to externally complete the test mass and science interfer-ometers by simulators. We have presented such simulators thatwill be implemented on a common Zerodur baseplate. The testmass simulator consists of a gold-coated mirror on a tilt andlinear actuator. The telescope simulator works as a transponderand provides a reference for the science interferometer onthe LISA OB. Both simulators employ tilt actuators for beamalignment that are held in thermally compensating mounts. Thepathlength noise performance of the telescope simulator canbe verified independently from the LISA OB by means of adedicated interferometer on the simulator. In the experiments,temperature noise control will be crucial. On the basis of themeasured temperature noise and the performance predictionspresented above characterisation of the LISA optical bench toits requirements seems possible.
A tracking phasemeter implemented in a field-programmable gate array (FPGA) will be used as phasemeasurement system. Prototypes of this phasemeter haveshown the required phase noise performance using electricalsignals. A 16 channel version of the phasemeter will be used,sufficient to read out two fully redundant interferometersequipped with quadrant photo detectors.
ACKNOWLEDGMENT
We acknowledge funding by the European Space Agencywithin the project “Optical Bench Development for LISA”,support from STFC and UKSA, and support by DeutschesZentrum fur Luft und Raumfahrt (DLR) with funding fromthe Bundesministerium fur Wirtschaft und Technologie (DLRproject reference 50 OQ 0601). We thank the German Re-search Foundation for funding the cluster of ExcellenceQUEST - Centre for Quantum Engineering and Space-TimeResearch.
REFERENCES
[1] O. Jennrich, “LISA technology and instrumentation,” Class. QuantumGrav., vol. 26, no. 15, AUG 7 2009.
[2] N. R. J.A.C.M. Pijnenburg, “Picometer stable scan mechanism forgravitational wave detection in space: LISA PAAM,” in Proc. of theInternational Conference on Space Optics, 2010.
[3] L. d’Arcio, J. Bogenstahl, M. Dehne, C. Diekmann, E. D. Fitzsimons,R. Fleddermann, E. Granova, G. Heinzel, H. Hogenhuis, C. J. Killow,M. Perreur-Lloyd, J. Pijnenburg, D. I. Robertson, A. Shoda, A. Sohmer,A. Taylor, M. Trobs, G. Wanner, H. Ward, and D. Weise, “OPTICALBENCH DEVELOPMENT FOR LISA,” in Proc. of the InternationalConference on Space Optics, 2010.
[4] “LISA Assessment Study Report,” ESA document ESA/SRE (2011)3,2011.
[5] “NGO Assessment Study Report,” ESA document ESA/SRE (2011)19,2012.
[6] J. H. Shirley, “Modulation transfer processes in optical heterodynesaturation spectroscopy,” Opt. Lett., vol. 7, no. 11, pp. 537–539, Nov1982. [Online]. Available: http://ol.osa.org/abstract.cfm?URI=ol-7-11-537
[7] G. Heinzel, V. Wand, A. Garcia, O. Jennrich, C. Braxmaier, D. Robert-son, K. Middleton, D. Hoyland, A. Rudiger, R. Schilling, U. Johann,and K. Danzmann, “The LTP interferometer and phasemeter,” Class.Quantum Grav., vol. 21, pp. S581–S587, 2004.
[8] I. Bykov, J. J. E. Delgado, A. F. G. Marin, G. Heinzel, and K. Danzmann,“LISA phasemeter development: Advanced prototyping,” Journal ofPhysics: Conference Series, vol. 154, no. 1, p. 012017, 2009. [Online].Available: http://stacks.iop.org/1742-6596/154/i=1/a=012017
[9] E. Morrison, B. J. Meers, D. I. Robertson, and H. Ward, “Automaticalignment of optical interferometers,” Appl. Opt., vol. 33, pp. 5041–5049, 1994.
[10] ——, “Experimental demonstration of an automatic alignment systemfor optical interferometers,” Appl. Opt., vol. 33, pp. 5037–5040, 1994.
[11] J. Bogenstahl, M. Trobs, L. dArcio, C. Diekmann, E. D. Fitzsimons, J.-S.Hennig, F. G. Hey, C. J. Killow, M. Lieser, S. Lucarelli, M. Perreur-Lloyd, J. Pijnenburg, D. I. Robertson, A. Taylor, H. Ward, D. Weise,G. Heinzel, and K. Danzmann, “Design and construction of a telescopesimulator for LISA optical bench testing,” in Proc. of the InternationalConference on Space Optics, 2012.
[12] E. J. Elliffe, J. Bogenstahl, A. Deshpande, J. Hough, C. Killow,S. Reid, D. Robertson, S. Rowan, H. Ward, and G. Cagnoli,“Hydroxide-catalysis bonding for stable optical systems for space,”Classical and Quantum Gravity, vol. 22, no. 10, p. S257, 2005.[Online]. Available: http://stacks.iop.org/0264-9381/22/i=10/a=018
[13] F. Guzman Cervantes, “Gravitational wave observation from space:Optical measurement techniques for LISA and LISA Pathfinder,” Ph.D.dissertation, Leibniz Universitat Hannover, 2009.