Embed Size (px)
Citation preview
Implementation of a physio-
chemical approach coupled with a
data fingerprinting methodology
for the characterization of the
Lebanese extra-virgin olive oils
Thèse de doctorat de l'université Paris-Saclay
École doctorale n° 581, Agriculture, alimentation, biologie, environnement et santé (ABIES)
Spécialité de doctorat : Chimie Analytique
Unité de recherche : Université Paris-Saclay, AgroParisTech, INRAE, UMR PNCA,
75005, Paris, France.
Référent : AgroParisTech
Thèse présentée et soutenue à Paris-Saclay, le
28/01/2021, par
Omar DIB Composition du Jury
Olivier DONARD
Directeur de Recherche, CNRS (Université de Pau) Président
Nathalie DUPUY
Professeur, Université Aix-Marseille Rapporteur & Examinatrice
Imad TOUFEILI
Professor, American University of Beirut Rapporteur & Examinateur
Jérôme VIAL
Maitre de Conférences, ESPCI – PSL Université Examinateur
Christophe CORDELLA
Ingénieur de Recherche, INRAE (Centre Jouy-en-Josas) Directeur de thèse
ALi BASSAL
Professor, Lebanese University Co-Directeur & Examinateur
Luc EVELEIGH
Maître de Conférences, AgroParisTech Co-Encadrant & Examinateur
Rita YAACOUB
Associate Professor, Lebanese University Co-Encadrante & Examinatrice T
hèse d
e d
octo
rat
NN
T : 2
021U
PASB
004

2
3
Acknowledgments
This work was carried out in Lebanon (Faculty of Agricultural Sciences, Lebanese
University) and in France (Laboratoire de Chimie Analytique, AgroParisTech) under the
supervision of Prof. Ali Bassal and Dr. Christophe Cordella. To whom I address my sincere
thanks and gratitude for their scientific advice and encouragement. Thank you from the bottom
of my heart for directing me throughout this thesis. Never to mention your support and, above
all, your confidence in me. My respectful gratitude to CNRS-Lebanon and Lebanese University (UL) for their
financial support throughout the whole Ph.D. program. I would like to thank the ABIES Doctoral School and its director Dr. Alexandre Perry
and the EDST doctoral school, and its Dean, Dr. Omar Fawaz. Without them, my journey as a
Ph.D. candidate wouldn’t be possible. My thanks go to the jury members Dr. Nathalie Dupuy, Dr. Imad Toufeili, Dr. Olivier
Donard, and Dr. Jérôme Vial, for giving the time to criticize and improve my work and for
accepting to be members of the defense committee. I won’t forget my thesis committee, which accompanied me throughout the work. My sincere thanks to Dr. Rita Yaacouub and Dr. Luc Eveleigh for granting their time
and assistance in realizing this work. Thank you for always being there to help me and for
answering my questions. I express my deep gratitude to Dr. Ali Toufeil, Dr. Audrey Solgadi and Dr. Milad
Riyachi. Thank you for welcoming me to the SAMM and LARI Laboratories and for giving the
time to pass on the knowledge of spectroscopy, chromatography and olive oil extraction. My thanks also go to Dr. Jad Rizkalah for providing me with his knowledge of statistical
studies and MATLAB software. Thank you for offering your help, answer my questions, and for
all the advice over the years. I would also like to thank all the laboratory members and assistants, particularly Mrs.
Nathalie Locquet and Mr. Ghassan Menhem, for their technical assistance. A big thank you to the AgroParisTech team, Prof. Douglas Rutledge, Dr. Delphine
Bouveresse, Roberto Garcia, Yann Padellec, Camille Cassin, and Dr.Hervé This. Thank you, Marguerite, Rita, Layth, Hisham, Sophia, Tala, Dina, Ola, Grégoire,
Miguel, Béninia, Fransesc, Antoine, Alberto, Emma, Lilhou, Bastien, Marie-Charlotte, James,
Asma and Daniela. I will never forget your support and the good times we had together. My affection goes to my family, Dad, Mom, and my brothers, who have supported me
throughout these years. I hope you will always be in good health. Be sure I will always make
you proud, in Lebanon, France, or any other country in the world. Because of you, I have found
the strength to face all obstacles and make it this far. A special thanks to Dr. Hussein Dib, my
Dad, my Mentor and soon my colleague. Without you and your continuous support, I could not
have made it through this challenging experience.
I love you all!

4
*Allah is the Light of the heavens and the earth. The
example of His light is that of a niche, in which there
is a lamp; the lamp is in a glass – the glass looks like a brilliant star – it is lit by (the oil of) a blessed tree,
the olive, which is neither eastern, nor western. Its oil
is about to emit light even though the fire has not
touched it – (it is) light upon light. Allah guides to His light whomsoever He wills; Allah describes
examples for the people, and Allah knows everything
well. *Quran al Karim, An-Nur, Verse 35, Page 354
(Translated by: Mufti Taqi Usmani)
اھیف ةاكشمك هرون لثم ضرألاو تاوامسلا رون &*
بكوك اھنأك ةجاجزلا ةجاجز يف حابصملا حابصم
الو ةیقرش ال ةنوتیز ةكرابم ةرجش نم دقوی يرد
رون ران ھسسمت مل ولو ءيضی اھتیز داكی ةیبرغ
& برضیو ءاشی نم هرونل & يدھی رون ىلع
میلع ءيش لكب &و سانلل لاثمألا
354 ةحفص ،35 ةیآ ،رونلا ةروس ،میركلا نآرقلا*
5
Table of Contents
List of Formation ................................................................................................................. 9
List of Publications ............................................................................................................ 10
List of Abbreviations ......................................................................................................... 12
List of Symbols .................................................................................................................. 14
List of Figures .................................................................................................................... 16
List of Tables ..................................................................................................................... 17
General Introduction ......................................................................................................... 18
Chapter 1: Literature Review ............................................................................................. 23
1. A general overview on olive oil .................................................................................... 23
1.1. Olive oil: an introduction .................................................................................................... 23
1.2. Geographic distribution of olive oil production and consumption ....................................... 24
1.3. The rise of regulation .......................................................................................................... 25
1.4. Chemical Composition ........................................................................................................ 27
1.4.1. Fatty acids .......................................................................................................................................... 27
1.4.2. Sterols ................................................................................................................................................ 28
1.4.3. Polyphenols ........................................................................................................................................ 28
1.4.4. Chlorophylls ....................................................................................................................................... 28
1.4.5 Aromatic compounds .......................................................................................................................... 29
2. Lebanese olive oil sector overview .............................................................................. 31
2.1. Main Geographical features ................................................................................................ 31
2.2. Olive oil production ............................................................................................................ 32
2.3 Imports and exports ............................................................................................................ 33
3. Fluctuation of EVOO/VOO components due to factors of different origins ................... 34
3.1. Agronomical variables ........................................................................................................ 34
3.1.2. Climate and elevation ........................................................................................................................ 35
3.1.3 Fruit maturity ...................................................................................................................................... 36
6
3.1.4 Other agronomical factors .................................................................................................................. 37
3.2. Technological variables ....................................................................................................... 38
3.2.1. Olive transport and storage ............................................................................................................... 38
3.2.2. Processing methods ........................................................................................................................... 38
3.2.3. Storage conditions ............................................................................................................................. 41
4. Rapid & non-destructive analysis techniques ............................................................... 42
4.1. Spectroscopy ...................................................................................................................... 42
4.1.1 Fluorescence spectroscopy ................................................................................................................. 43
4.1.2. Fluorescence spectra ......................................................................................................................... 45
4.1.3. Application of fluorescence in olive oil analysis ................................................................................. 46
4.2. Flash GC .............................................................................................................................. 47
4.2.1. Sampling ............................................................................................................................................. 47
4.2.2. Chromatographic separation ............................................................................................................. 48
4.2.3 Sensory and chemical characterization .............................................................................................. 49
5. Chemometrics ............................................................................................................. 50
5.1 Principal component analysis ............................................................................................... 50
5.2 Parallel factor analysis ......................................................................................................... 51
5.3 Independent components analysis ....................................................................................... 52
5.3 Regression ........................................................................................................................... 54
Chapter 2: Materials and Methods .................................................................................... 57
1. Sampling ..................................................................................................................... 57
1.1. Olive fruit and oil sampling ................................................................................................. 57
1.2. Olive fruit sampling technique ............................................................................................ 58
1.3. Olive oil extraction ............................................................................................................. 59
2. Conventional chemical analysis of olive oil .................................................................. 60
2.1. Quality Indices .................................................................................................................... 60
2.1.1. Acidity ................................................................................................................................................ 60
2.1.2. Peroxide value .................................................................................................................................... 61
2.1.3. UV spectrophotometric investigation ................................................................................................ 62
2.2. Pigments in olive oil ............................................................................................................ 63
7
2.2.1. Total chlorophylls and β-carotene ..................................................................................................... 63
2.2.2. Total polyphenols ............................................................................................................................... 64
2.3. Fatty acids analysis ............................................................................................................. 65
2.3.1. Preparation of the fatty acid methyl esters from olive oil (acid value ≤ 2.0 %) ................................. 65
2.3.2. Preparation of the fatty acid methyl esters from olive oil (acid value > 2.0 %) ................................. 65
2.3.3. Analysis of FAME by GC-FID ............................................................................................................... 66
2.3.4. Method of calculation ........................................................................................................................ 67
2.4. Sterol analysis ..................................................................................................................... 67
2.4.1. Preparation of the unsaponifiable matter ......................................................................................... 67
2.4.2. Preparation of the basic thin layer chromatography plates .............................................................. 68
2.4.3. Preparation of the trimethylsilyl ethers ............................................................................................ 70
2.4.4. Sterol analysis by GC-MS .................................................................................................................... 71
2.4.5. Method of calculation ........................................................................................................................ 71
3. Rapid techniques for olive oil analysis ......................................................................... 72
3.1. 3D front-face fluorescence spectroscopy ............................................................................ 72
3.2. Flash-GC ............................................................................................................................. 73
4. Chemometrics prerequisites ........................................................................................ 74
4.1 Notation .............................................................................................................................. 74
4.2 Three-way arrays ................................................................................................................. 74
4.3 Preprocessing ...................................................................................................................... 74
4.3.1. Unfolding ........................................................................................................................................... 74
4.3.2. Scaling ................................................................................................................................................ 75
4.3.3. Rayleigh scatter .................................................................................................................................. 76
4.3.4. Warping for chromatographic signal alignment (GC-FID) .................................................................. 77
4.3.5. Outlier detection ................................................................................................................................ 78
Chapter 3: Impact of Growing Area and Technological Aspects on Lebanese Olive Oil:
Characterization by unsupervised methods ....................................................................... 79
Chapter 4: Conventional and Ultra-fast Analysis Exposing the Harvest Date Impact on
Lebanese Olive Oil: The Soury Variety ............................................................................... 97
Chapter 5: Does Variability Affect the Performance of Front-Face Fluorescence
Spectroscopy? A Study Case on Commercial Lebanese Olive Oil ....................................... 121
8
Chapter 6: General Results and Discussion ...................................................................... 147
1. Results ...................................................................................................................... 147
1.1. Impact of growing area and technological aspects on Lebanese olive oil ........................... 147
1.2 Harvest Date effect on the Lebanese Olive Oil from the Soury Variety ............................... 148
1.3 A rapid technique replacing the conventional analytical methods ...................................... 149
2. Discussion .................................................................................................................. 150
Conclusion & Perspectives ............................................................................................... 155
Résumé en Français…………………………………………………………………………………………………......157
References ...................................................................................................................... 168
Annexes .......................................................................................................................... 183
Annex 1. Olive oil sampling filling form ................................................................................................... 183
Annex 2. Olive fruit sampling filling form ................................................................................................. 184
Annex 3. Olive oil data (Sample) ............................................................................................................... 185
Annex 4. Olive Fruit Data (Sample) ........................................................................................................... 186
9
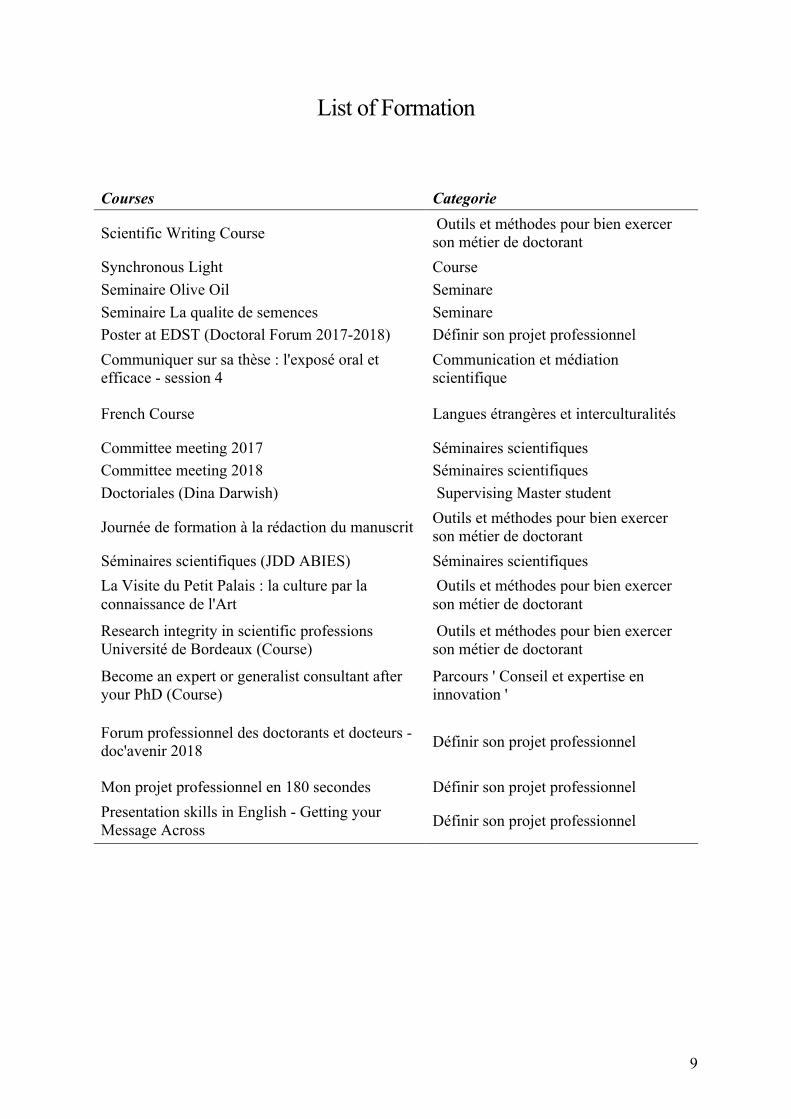
List of Formation
Courses Categorie
Scientific Writing Course Outils et méthodes pour bien exercer son métier de doctorant
Synchronous Light Course Seminaire Olive Oil Seminare Seminaire La qualite de semences Seminare Poster at EDST (Doctoral Forum 2017-2018) Définir son projet professionnel
Communiquer sur sa thèse : l'exposé oral et efficace - session 4
Communication et médiation scientifique
French Course Langues étrangères et interculturalités
Committee meeting 2017 Séminaires scientifiques Committee meeting 2018 Séminaires scientifiques Doctoriales (Dina Darwish) Supervising Master student
Journée de formation à la rédaction du manuscrit Outils et méthodes pour bien exercer son métier de doctorant
Séminaires scientifiques (JDD ABIES) Séminaires scientifiques
La Visite du Petit Palais : la culture par la connaissance de l'Art
Outils et méthodes pour bien exercer son métier de doctorant
Research integrity in scientific professions Université de Bordeaux (Course)
Outils et méthodes pour bien exercer son métier de doctorant
Become an expert or generalist consultant after your PhD (Course)
Parcours ' Conseil et expertise en innovation '
Forum professionnel des doctorants et docteurs - doc'avenir 2018
Définir son projet professionnel
Mon projet professionnel en 180 secondes Définir son projet professionnel
Presentation skills in English - Getting your Message Across
Définir son projet professionnel
10
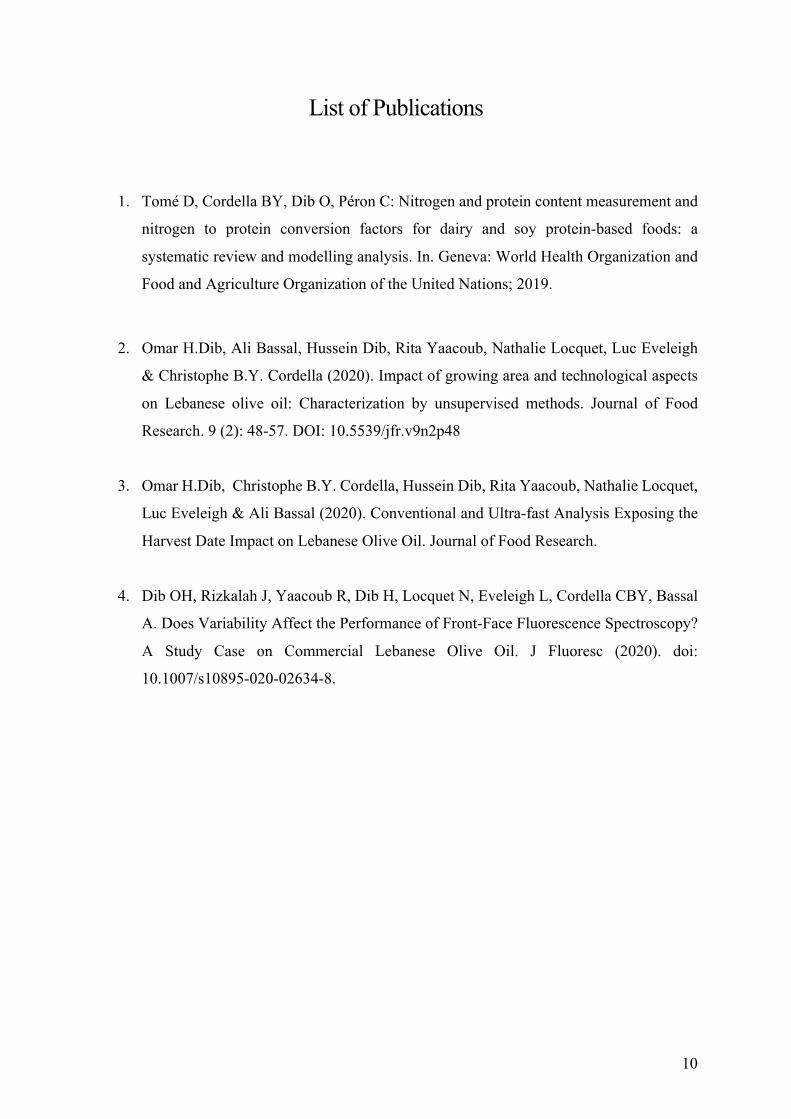
List of Publications
1. Tomé D, Cordella BY, Dib O, Péron C: Nitrogen and protein content measurement and
nitrogen to protein conversion factors for dairy and soy protein-based foods: a
systematic review and modelling analysis. In. Geneva: World Health Organization and
Food and Agriculture Organization of the United Nations; 2019.
2. Omar H.Dib, Ali Bassal, Hussein Dib, Rita Yaacoub, Nathalie Locquet, Luc Eveleigh
& Christophe B.Y. Cordella (2020). Impact of growing area and technological aspects
on Lebanese olive oil: Characterization by unsupervised methods. Journal of Food
Research. 9 (2): 48-57. DOI: 10.5539/jfr.v9n2p48
3. Omar H.Dib, Christophe B.Y. Cordella, Hussein Dib, Rita Yaacoub, Nathalie Locquet,
Luc Eveleigh & Ali Bassal (2020). Conventional and Ultra-fast Analysis Exposing the
Harvest Date Impact on Lebanese Olive Oil. Journal of Food Research.
4. Dib OH, Rizkalah J, Yaacoub R, Dib H, Locquet N, Eveleigh L, Cordella CBY, Bassal
A. Does Variability Affect the Performance of Front-Face Fluorescence Spectroscopy?
A Study Case on Commercial Lebanese Olive Oil. J Fluoresc (2020). doi:
10.1007/s10895-020-02634-8.
11
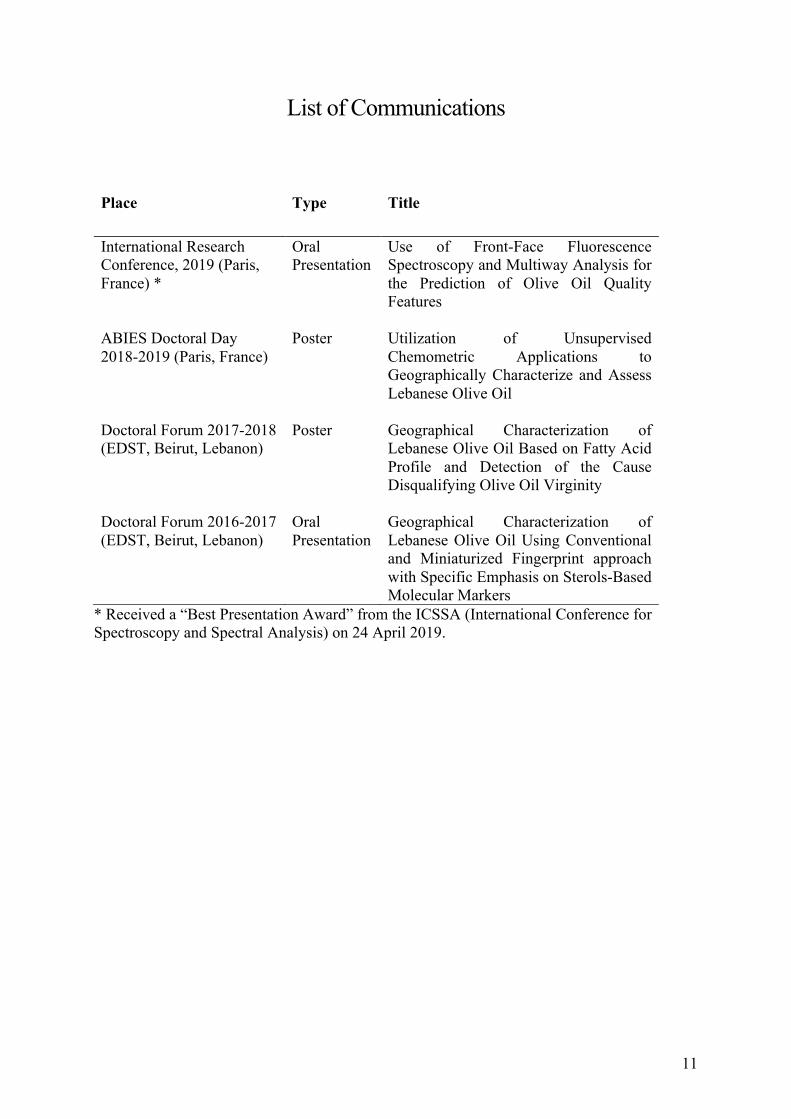
List of Communications
Place Type Title
International Research Conference, 2019 (Paris, France) *
Oral Presentation
Use of Front-Face Fluorescence Spectroscopy and Multiway Analysis for the Prediction of Olive Oil Quality Features
ABIES Doctoral Day 2018-2019 (Paris, France)
Poster Utilization of Unsupervised Chemometric Applications to Geographically Characterize and Assess Lebanese Olive Oil
Doctoral Forum 2017-2018 (EDST, Beirut, Lebanon)
Poster Geographical Characterization of Lebanese Olive Oil Based on Fatty Acid Profile and Detection of the Cause Disqualifying Olive Oil Virginity
Doctoral Forum 2016-2017 (EDST, Beirut, Lebanon)
Oral Presentation
Geographical Characterization of Lebanese Olive Oil Using Conventional and Miniaturized Fingerprint approach with Specific Emphasis on Sterols-Based Molecular Markers
* Received a “Best Presentation Award” from the ICSSA (International Conference for Spectroscopy and Spectral Analysis) on 24 April 2019.
12
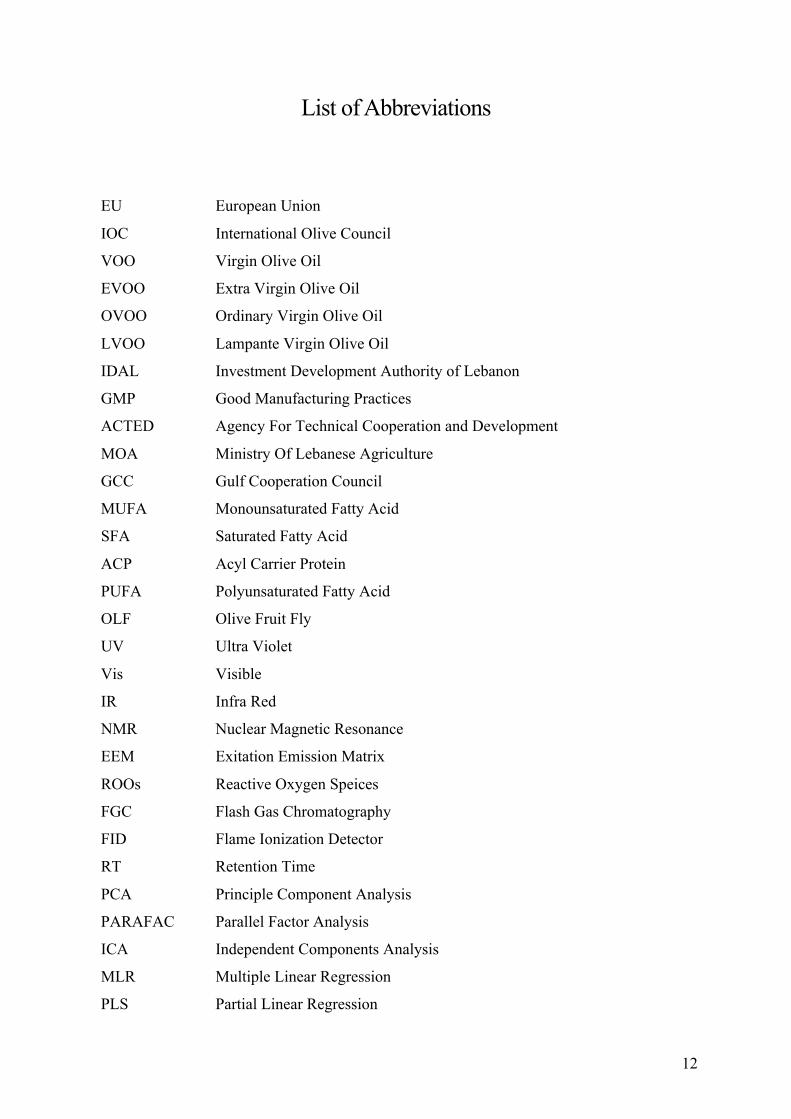
List of Abbreviations
EU European Union
IOC International Olive Council
VOO Virgin Olive Oil
EVOO Extra Virgin Olive Oil
OVOO Ordinary Virgin Olive Oil
LVOO Lampante Virgin Olive Oil
IDAL Investment Development Authority of Lebanon
GMP Good Manufacturing Practices
ACTED Agency For Technical Cooperation and Development
MOA Ministry Of Lebanese Agriculture
GCC Gulf Cooperation Council
MUFA Monounsaturated Fatty Acid
SFA Saturated Fatty Acid
ACP Acyl Carrier Protein
PUFA Polyunsaturated Fatty Acid
OLF Olive Fruit Fly
UV Ultra Violet
Vis Visible
IR Infra Red
NMR Nuclear Magnetic Resonance
EEM Exitation Emission Matrix
ROOs Reactive Oxygen Speices
FGC Flash Gas Chromatography
FID Flame Ionization Detector
RT Retention Time
PCA Principle Component Analysis
PARAFAC Parallel Factor Analysis
ICA Independent Components Analysis
MLR Multiple Linear Regression
PLS Partial Linear Regression
13
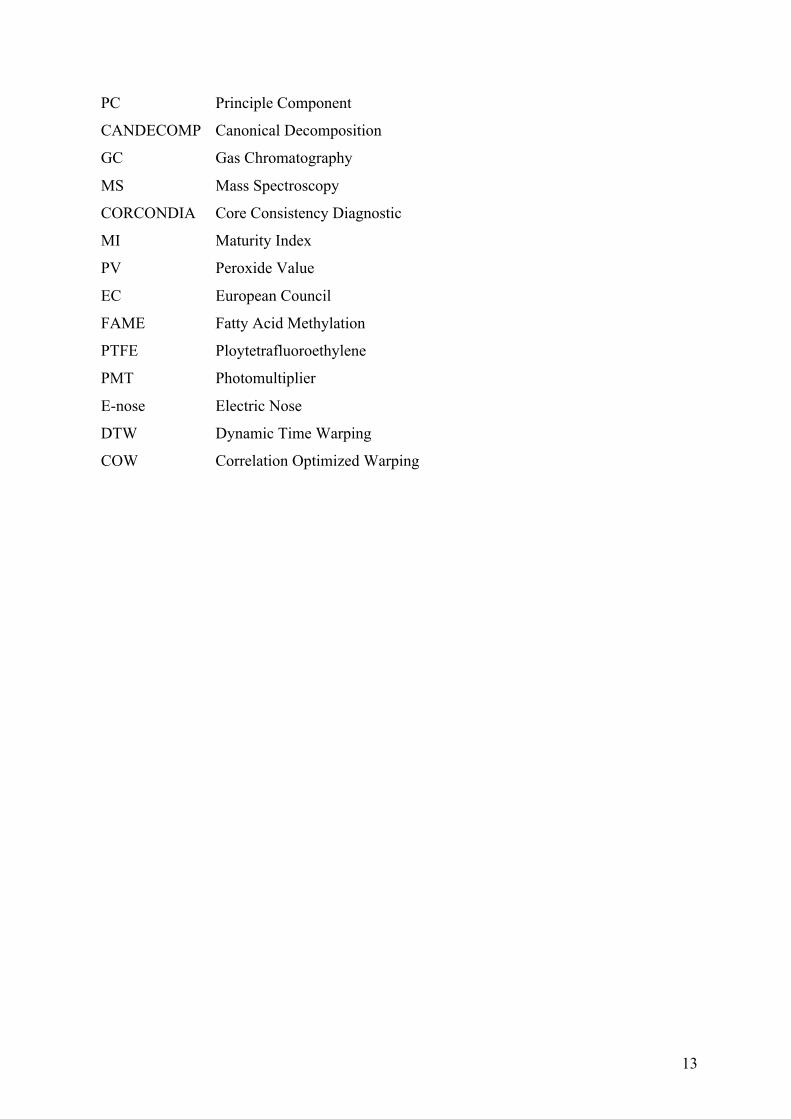
PC Principle Component
CANDECOMP Canonical Decomposition
GC Gas Chromatography
MS Mass Spectroscopy
CORCONDIA Core Consistency Diagnostic
MI Maturity Index
PV Peroxide Value
EC European Council
FAME Fatty Acid Methylation
PTFE Ploytetrafluoroethylene
PMT Photomultiplier
E-nose Electric Nose
DTW Dynamic Time Warping
COW Correlation Optimized Warping
14
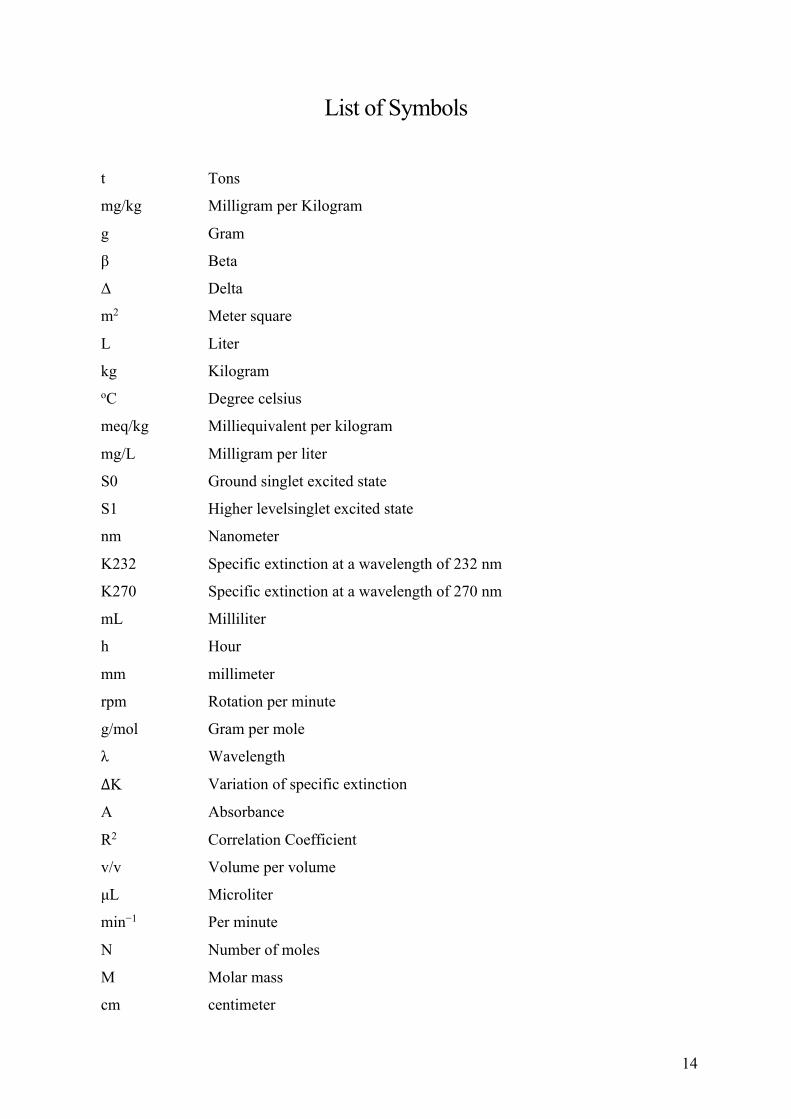
List of Symbols
t Tons
mg/kg Milligram per Kilogram
g Gram
β Beta
Δ Delta
m2 Meter square
L Liter
kg Kilogram oC Degree celsius
meq/kg Milliequivalent per kilogram
mg/L Milligram per liter
S0 Ground singlet excited state
S1 Higher levelsinglet excited state
nm Nanometer
K232 Specific extinction at a wavelength of 232 nm
K270 Specific extinction at a wavelength of 270 nm
mL Milliliter
h Hour
mm millimeter
rpm Rotation per minute
g/mol Gram per mole
λ Wavelength
∆K Variation of specific extinction
A Absorbance
R2 Correlation Coefficient
v/v Volume per volume
μL Microliter
min−1 Per minute
N Number of moles
M Molar mass
cm centimeter

15
V volt oC /s Degree Celsius per second
16
List of Figures
Figure 1. World olive oil production (Source: International Olive Council, 2018/2019) ........ 25
Figure 2. Chemical composition of olive oil ............................................................................ 27
Figure 3. Main Olive groves distribution along the map of Lebanon ...................................... 31
Figure 4. Yearly olive oil production in Lebanon (in tons) (Source: International Olive
Council, 2018) .......................................................................................................................... 32
Figure 5. Export value of Lebanese olive oil (USD) (Source: Investment Development
Authority of Lebanon, 2017) .................................................................................................... 34
Figure 6. Diagram of olive oil extraction by different mechanical techniques (Giovacchino,
2000) ......................................................................................................................................... 40
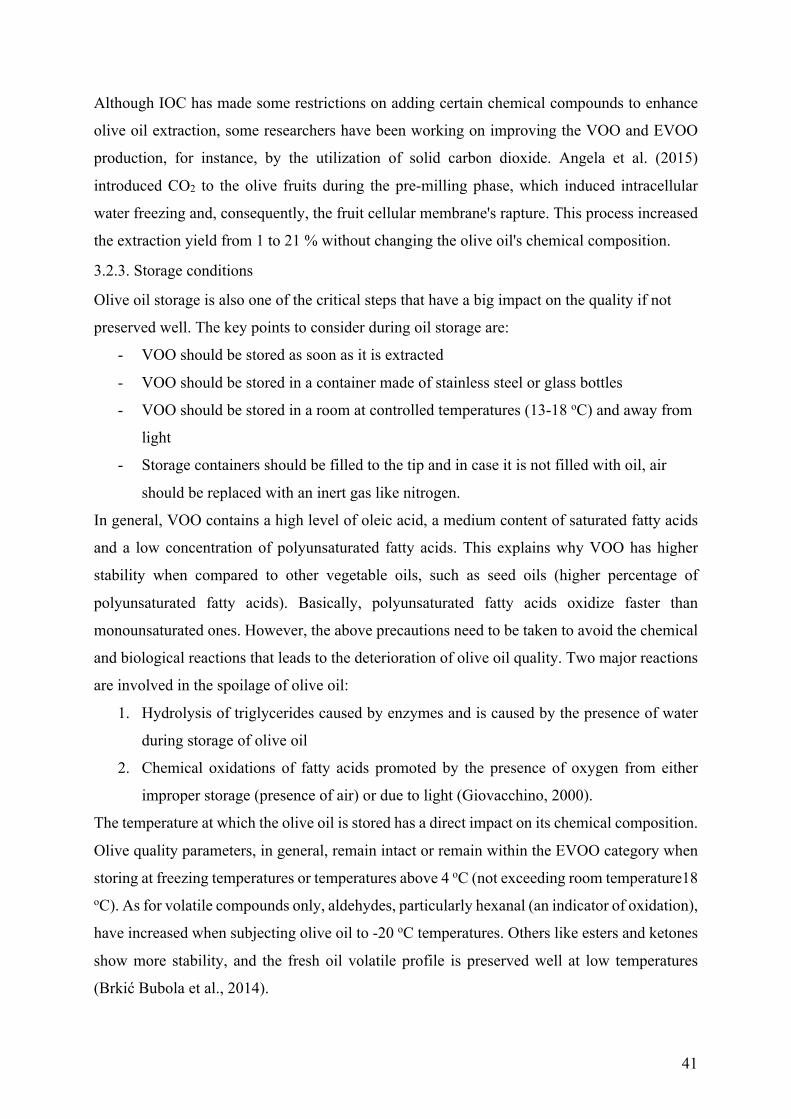
Figure 7. Mechanism of oil deterioration and oil’s quality degradation .................................. 42
Figure 8. Jablonski diagram (Frackowiak, 1988) ................................................................... 44
Figure 9: Basic elements required for obtaining a fluorescence spectrum ............................... 45
Figure 10. Three-dimensional fluorescence (3D-EEM) ........................................................... 46
Figure 11. Flash GC chromatogram of virgin olive oil volatile compounds ........................... 49
Figure 12. PCA decomposition principle ................................................................................. 50
Figure 13. Sampling locations across Lebanon (more than 40 locations) ................................ 58
Figure 14. Olive oil extraction process .................................................................................... 60
Figure 15: Triglyceride Hydrolysis. Source: (Díaz et al., 2014) .............................................. 61
Figure 16. B-carotene calibration curve ................................................................................... 64
Figure 17. Total polyphenol calibration curve ......................................................................... 65
Figure 18. Olive oil saponification process .............................................................................. 67
Figure 19. Developing chamber for TLC plates ....................................................................... 69
Figure 20. Sterol band identification under UV Light ............................................................. 70
Figure 21. Sterol powder before adding the silylation agents .................................................. 70
Figure 22. FGC step by step for identifying olive oil volatile compounds .............................. 73
Figure 23. Three-way arrangement .......................................................................................... 74
Figure 24. Graphical representation of unfolding a three-way array ....................................... 75
Figure 25. A spectrum showing the interference of first and second-order Rayleigh .............. 77
Figure 26. Alignment of chromatograms before and after warping ......................................... 78
Figure 27. Flowchart detailing the control plan for all conducted studies ............................. 150
17
List of Tables
Table 1. Olive oil categories. .................................................................................................... 26
Table 2. Standard quality parameters of olive oil based on IOC, 2011 ................................... 29
Table 3. Micro and Macro-components of olive oil (Source: International Olive Council,
2011) ......................................................................................................................................... 29
Table 4. Lebanese olive oil varieties and their distribution across Lebanon ........................... 32
Table 5. Average value of key indicators on olive oil quality obtained by different types of
mechanical systems (Di Giovacchino et al., 1996). ................................................................. 40
Table 6. Average values (%) of some the volatile contents of oils obtained by pressing and 3-
phase centrifugation system (Di Giovacchino et al., 1996). .................................................... 40
Table 7. An example on a list of some of the possible olive oil volatile compounds based on
Kovats indices calculated on RT for two columns ................................................................... 49
Table 8. Excitation and emission maxima (nm) of the 7 PARAFAC factors .......................... 52
18
General Introduction
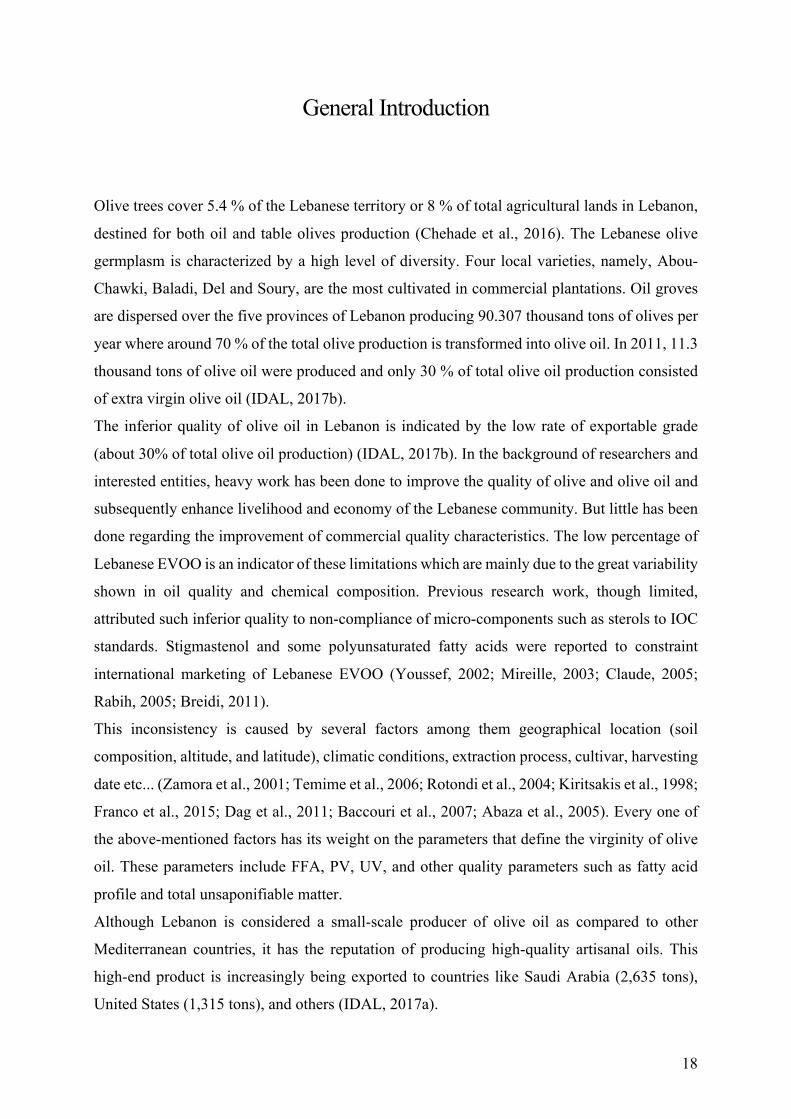
Olive trees cover 5.4 % of the Lebanese territory or 8 % of total agricultural lands in Lebanon,
destined for both oil and table olives production (Chehade et al., 2016). The Lebanese olive
germplasm is characterized by a high level of diversity. Four local varieties, namely, Abou-
Chawki, Baladi, Del and Soury, are the most cultivated in commercial plantations. Oil groves
are dispersed over the five provinces of Lebanon producing 90.307 thousand tons of olives per
year where around 70 % of the total olive production is transformed into olive oil. In 2011, 11.3
thousand tons of olive oil were produced and only 30 % of total olive oil production consisted
of extra virgin olive oil (IDAL, 2017b).
The inferior quality of olive oil in Lebanon is indicated by the low rate of exportable grade
(about 30% of total olive oil production) (IDAL, 2017b). In the background of researchers and
interested entities, heavy work has been done to improve the quality of olive and olive oil and
subsequently enhance livelihood and economy of the Lebanese community. But little has been
done regarding the improvement of commercial quality characteristics. The low percentage of
Lebanese EVOO is an indicator of these limitations which are mainly due to the great variability
shown in oil quality and chemical composition. Previous research work, though limited,
attributed such inferior quality to non-compliance of micro-components such as sterols to IOC
standards. Stigmastenol and some polyunsaturated fatty acids were reported to constraint
international marketing of Lebanese EVOO (Youssef, 2002; Mireille, 2003; Claude, 2005;
Rabih, 2005; Breidi, 2011).
This inconsistency is caused by several factors among them geographical location (soil
composition, altitude, and latitude), climatic conditions, extraction process, cultivar, harvesting
date etc... (Zamora et al., 2001; Temime et al., 2006; Rotondi et al., 2004; Kiritsakis et al., 1998;
Franco et al., 2015; Dag et al., 2011; Baccouri et al., 2007; Abaza et al., 2005). Every one of
the above-mentioned factors has its weight on the parameters that define the virginity of olive
oil. These parameters include FFA, PV, UV, and other quality parameters such as fatty acid
profile and total unsaponifiable matter.
Although Lebanon is considered a small-scale producer of olive oil as compared to other
Mediterranean countries, it has the reputation of producing high-quality artisanal oils. This
high-end product is increasingly being exported to countries like Saudi Arabia (2,635 tons),
United States (1,315 tons), and others (IDAL, 2017a).
19
To keep up with such high-quality product, particularly in terms of olive oil nutritional and
sensory properties, specialized institutions such as the International Olive Council (IOC) has
set explicit olive oil quality controls where the complexity of some is reflected in the ample
time and materials required to determine olive oil genuineness and quality (Guzman et al.,
2015). Nowadays, the presence of new sample-holder accessories, software and numerous
chemometrics applications gave way for faster and simpler analytical techniques, particularly
front-face fluorescence spectroscopy and ultra-fast gas-chromatography (Flash-GC).
Fluorescence spectroscopy has been successfully used as a rapid, non-invasive and highly
sensitive technique for analysis of olive oil quality and showed to be more cost-efficient
compared to other analytical procedures (Lleo et al., 2016). Never to mention the diversity of
fluorescence applications especially in the field of olive oil analysis (Locquet et al., 2019).
These include studies on detection of olive oil adulteration with vegetable oils or pomace oil
(Dankowska & Małecka, 2009; Sayago et al., 2007), on monitoring thermal oxidation
(Cheikhousman et al., 2005a; Poulli et al., 2009; Sikorska et al., 2008; Tena et al., 2012; Tena
et al., 2009), on prediction of origin (Dupuy et al., 2005), and on quality parameters evaluation
(Guimet et al., 2004a; Guzman et al., 2015). As for flash GC, it is a highly selective and sensitive
technique used for analyzing volatile compound present in olive oil in matter of seconds. This
type of chromatography has been used in discriminating geographical origins (Melucci et al.,
2016), in detecting adulteration (Jabeur et al., 2014) and in determining quality grades of olive
oil (Barbieri et al., 2020). These types of rapid analytical tools can be particularly useful as
routine quality control especially with the aid of chemometric tools.
This work investigates the use of chemometrics like PCA, PARAFAC, ICA, MLR, and PLS to
highlight the effect of growing area on the Lebanese olive oil based on the resulting
physicochemical parameters, to detect the technological and agricultural factors leading to
disqualification of Lebanese olive oil virginity and to test the usefulness of rapid analysis
techniques in the grading of olive oil samples.
Objectives
The overall objectives may be summarized as:
§ Elaboration of a control plan to evaluate the physico-chemical characteristics and
quality grades of EVOO in comparison to an international set reference
§ Improve the production, quality and eventually marketability and competitiveness of
Lebanese produced EVOO in the international markets
20
The specific objectives include:
(1) Identifying sources and causes of non-conformities in the cultivation and/or
processing of Lebanese olive oil while finding applicable solutions to fit with
international requirements,
(2) Investigating the effect of growing area on the chemical composition of Lebanese
olive oil.
(3) Development of a rapid assessment tool in order to replace the conventional
analytical methods.
Study structure
The carried work is presented in the manuscript in six chapters. A general introduction is
presented at the beginning of the manuscript.
Chapter 1 includes a bibliographic review to understand the situation of Lebanese olive oil, the
impact of several environmental/ agricultural / technological factors on the main constituents
of olive oil, and the alternatives for conventional analytical tests.
Chapter 2 presents the sampling locations, the protocols for collecting and preparing olive fruit
and oil samples, as well as the different analysis techniques.
Chapter 31 deals with the influence of growing-area and technological aspects on the Lebanese
Soury variety. The pedoclimatic conditions, quality parameters, and fatty acids of oil samples
were examined using chemometric tools (PCA and ICA) to demonstrate the typicality of
Lebanese olive oil.
Chapter 42 shows the impact of harvest date on the quality parameters, polyphenols, fatty acids,
sterols, and volatile compounds of Lebanese olive oil from the Soury variety.
Chapter 53 presents the capability of front-face fluorescence spectroscopy coupled with
chemometric techniques, namely multiple linear regression (MLR) applied on parallel factor
(PARAFAC) scores and partial least squares (PLS), to predict Lebanese olive oil chemical
parameters in spite of the variability present between the samples.
Chapter 6 provides a review of the main results and a general discussion around the main
addressed scientific questions in addition to the drawn conclusions.
21
Chapters 3, 4, and 5 are presented under the article form. The first two articles have been
published in international scientific journals and the last one has been accepted.
1 Omar H.Dib, Ali Bassal, Hussein Dib, Rita Yaacoub, Nathalie Locquet, Luc Eveleigh & Christophe B.Y.
Cordella (2020). Impact of growing area and technological aspects on Lebanese olive oil: Characterization by
unsupervised methods. Journal of Food Research. 9 (2): 48-57. DOI: 10.5539/jfr.v9n2p48
2 Omar H.Dib, Christophe B.Y. Cordella, Hussein Dib, Rita Yaacoub, Nathalie Locquet, Luc Eveleigh & Ali
Bassal (2020). Conventional and Ultra-fast Analysis Exposing the Harvest Date Impact on Lebanese Olive Oil
Journal of Food Research.
3 Dib OH, Rizkalah J, Yaacoub R, Dib H, Locquet N, Eveleigh L, Cordella CBY, Bassal A. Does Variability Affect
the Performance of Front-Face Fluorescence Spectroscopy? A Study Case on Commercial Lebanese Olive Oil. J
Fluoresc (2020). doi: 10.1007/s10895-020-02634-8.

22
23
Chapter 1: Literature Review
This chapter includes a bibliographic review to understand the situation of Lebanese olive oil,
the impact of several environmental/ agricultural / technological factors on the main
constituents of olive oil, and the alternatives for conventional analytical tests. In addition to an
overview on the main preprocessing tools and chemometric methods that had been utilized in
this work.
1. A general overview on olive oil
1.1. Olive oil: an introduction
Olive oil, a natural fatty liquid, is reported as one of the traditional crops in the world, in
particular, in the Mediterranean region. Till now, the origin of the crop is still not known, but it
can be traced to areas along the Mediterranean coast such as Syria, Lebanon, Turkey, Greece,
and others as the olive tree can live for hundreds of years (Vossen, 2007). Olive cultivation
(culture of olive trees, olive groves, and olive oil with oil mills) dates back to the period of the
invention of agriculture and the cultivation of vines and wine, about 8,000 years ago, in the
fertile crescent region of the Levant in the Near East and Mesopotamia (Recep et al., 2011).
Olive oil is solely produced from the fruit of the olive tree, Olea europaea L., by mechanical
means. Extraction, i.e., separating oil from the other fruit contents, is done merely through three
main steps:
- Step one includes grinding the fruit into an olive paste.
- Step two is malaxation, where the resulting paste is slowly mixed to allow droplets of
oil to aggregate.
- Step three is the collection of oil by centrifugation and decantation.
The end product of this process is primarily intended for human consumption and represents
one of the emerging dietary trends worldwide (Souilem et al., 2017). Olive oil is well known
for its nutritional and health protective characteristics. It is mainly composed of
monounsaturated fatty acids, in particular, oleic acid, representing about 55-80 % of olive oil.
Oleic acid is studied extensively due to its broad range of health benefits commencing from
protecting against cardiovascular diseases (Kris-Etherton et al., 1999), high blood pressure
(Gnoni et al., 2010), and to suppression of skin pigmentation (Ruiz et al., 2010). In addition to
oleic acid, olive oil’s minor chemical components like squalene, tocopherols, lipophilic and
24
hydrophilic phenols play an essential role in fighting cancerogenic cells due to their antioxidant
capabilities (Cicerale et al., 2009). These functional bioactive compounds have rendered olive
oil also to be used in the medical and pharmaceutical fields leading to a global increase in its
production and consumption.
1.2. Geographic distribution of olive oil production and consumption
Consumers are motivated more and more by the nutritional and health assets of olive oil. The
increase in demand has boosted its production, tripling over the last 60 years, reaching around
3,379,000 t in the 2017/2018 crop year. Countries responsible for olive oil production is mainly
distributed across three groups (Figure 1):
1. Group one includes 28 EU countries, members of the international olive council (IOC),
which dominates world production.
2. Group two is composed of 16 other current IOC member countries (Turkey, Tunisia,
Syria, Morocco Albania, Algeria, Argentina, Croatia, Egypt, Iran, Iraq, Israel, Jordan,
Lebanon, Libya, and Montenegro).
3. Group three is the non-IOC members (USA, China, Japan, Russia, etc.…).
Among the EU countries and based on the latest data (5-year average, i.e., 2014/15 –
2018/2019) provided by the IOC, Spain stands out with 44.5 % of the world total production
followed by Italy, Greece, and Portugal. Outside the EU, Tunisia has the highest production and
constitutes around 7 % of the world total, followed by Turkey, Morocco, Algeria, and Egypt
(IOC, 2018).
25
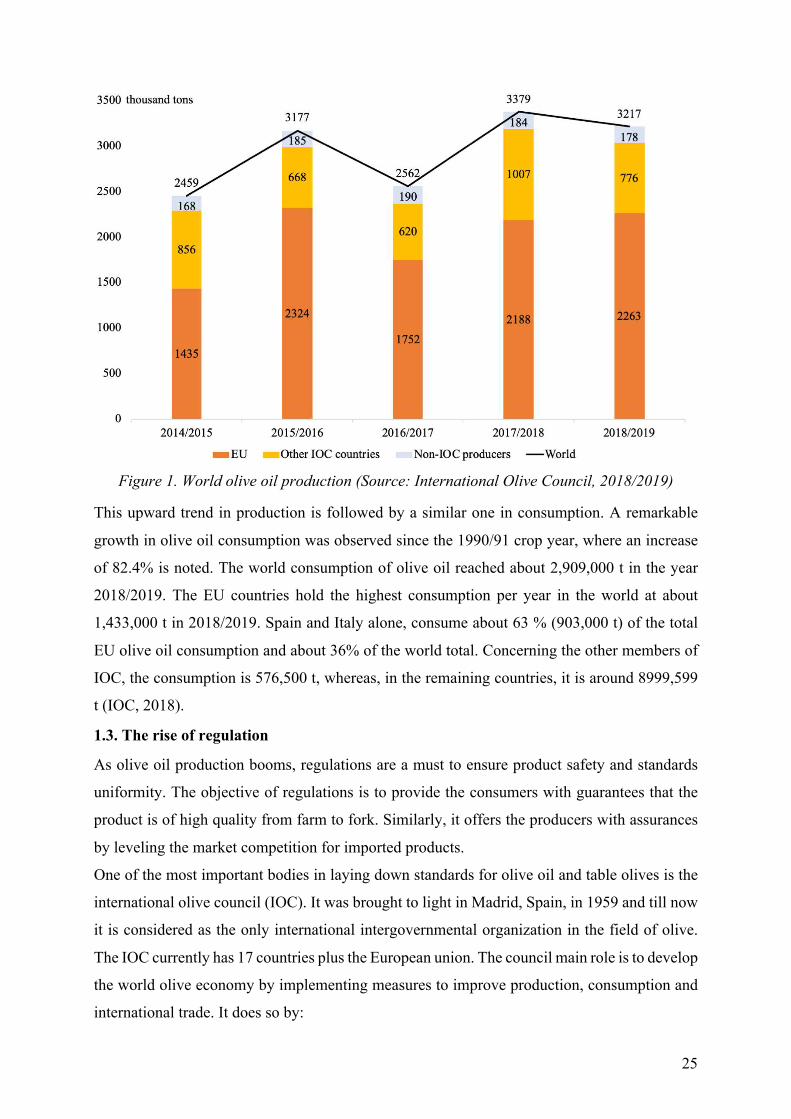
Figure 1. World olive oil production (Source: International Olive Council, 2018/2019)
This upward trend in production is followed by a similar one in consumption. A remarkable
growth in olive oil consumption was observed since the 1990/91 crop year, where an increase
of 82.4% is noted. The world consumption of olive oil reached about 2,909,000 t in the year
2018/2019. The EU countries hold the highest consumption per year in the world at about
1,433,000 t in 2018/2019. Spain and Italy alone, consume about 63 % (903,000 t) of the total
EU olive oil consumption and about 36% of the world total. Concerning the other members of
IOC, the consumption is 576,500 t, whereas, in the remaining countries, it is around 8999,599
t (IOC, 2018).
1.3. The rise of regulation
As olive oil production booms, regulations are a must to ensure product safety and standards
uniformity. The objective of regulations is to provide the consumers with guarantees that the
product is of high quality from farm to fork. Similarly, it offers the producers with assurances
by leveling the market competition for imported products.
One of the most important bodies in laying down standards for olive oil and table olives is the
international olive council (IOC). It was brought to light in Madrid, Spain, in 1959 and till now
it is considered as the only international intergovernmental organization in the field of olive.
The IOC currently has 17 countries plus the European union. The council main role is to develop
the world olive economy by implementing measures to improve production, consumption and
international trade. It does so by:
26
- Encouraging research and development projects to modernize olive growing and oil
production technology, consequently improving fruit and oil quality, lowering costs,
and sustaining the environment;
- Raising awareness through campaigns and expanding international trade to promote the
consumptions of olive oil and table olives;
- Laying down trade standards and policies to ensure the fairness of the competition and
improve the overall quality of the end product (IOC, 2020).
The application of these measures and principles is obligatory in international and domestic
trade especially those related to olive oil trade. IOC has classified olive oil into several
categories depending on the olive processing method and qualitative characteristics of the end
product (Table 1).
Table 1. Olive oil categories.
Physical or mechanical extraction (virgin oils)
Mechanical and chemical extraction (refined oils)
Extra virgin olive oil Refined olive oil
Virgin olive oil Olive oil (mix of virgin + refined oils)
Ordinary virgin olive oil Crude olive-pomace oil
Lampante virgin olive oil Refined olive-pomace oil
Olive-pomace oil
Most olive oil is produced with physical means without undergoing any treatment other than
washing, grinding, malaxing, decantation, centrifugation and filtration. Although thermal
treatment is applied (during malaxation), however, the application of the latter should not lead
to alteration in the oil chemical composition. The finished product of such process is called
virgin olive oil that is fit for human consumption and includes the following:
- Extra virgin olive oil is a VOO having an acidity (expressed as oleic acid) of not more
than 0.8 g per 100 g;
- Virgin olive oil is an oil whose acidity is not more than 2 g per 100 g;
- Ordinary virgin olive oil is a VOO whose acidity is less than 3.3 per 100 g;
- Lampante virgin olive oil is an oil which has an acidity of more than 3.3 g per 100 g and
it is not fit for human consumption. It is mostly used for refining purposes (IOC, 2011b);
Moreover, IOC lays down the standards detailing the minimum quality and purity criteria for
each of the above olive oil grades. In addition, it also put standards pertaining to hygiene,
27
packaging, and labelling and it also sets analytical methods for determining various chemical
parameters.
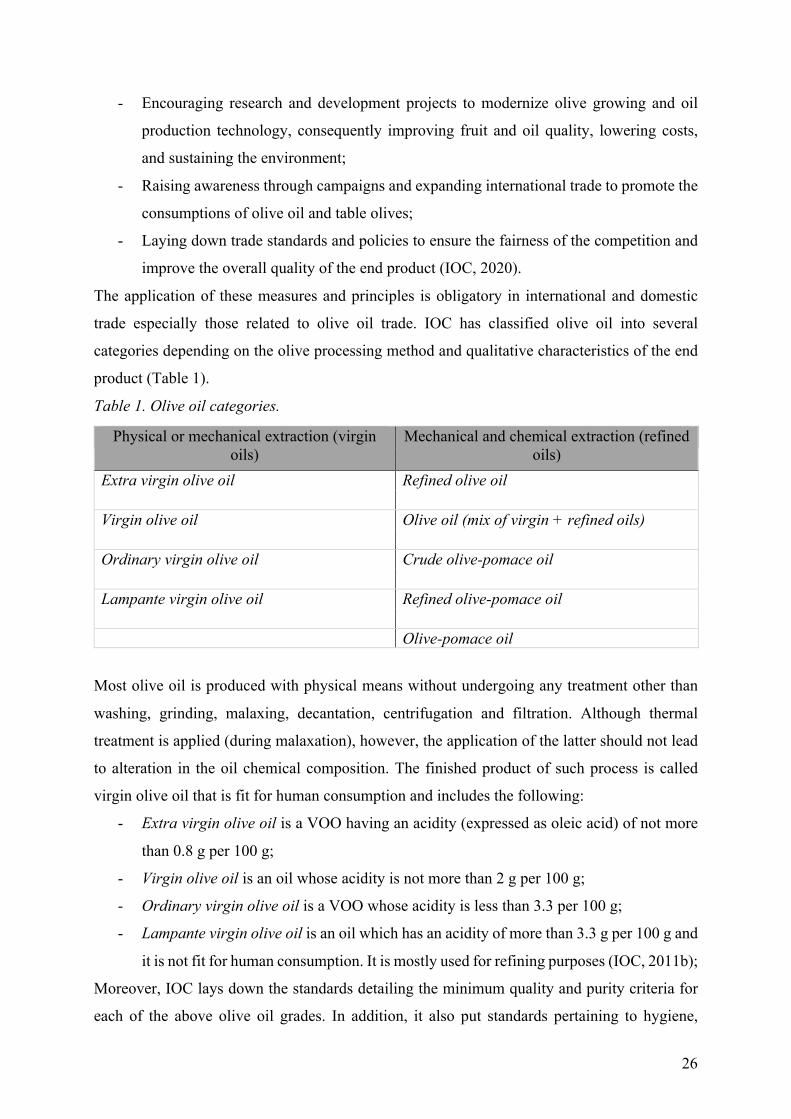
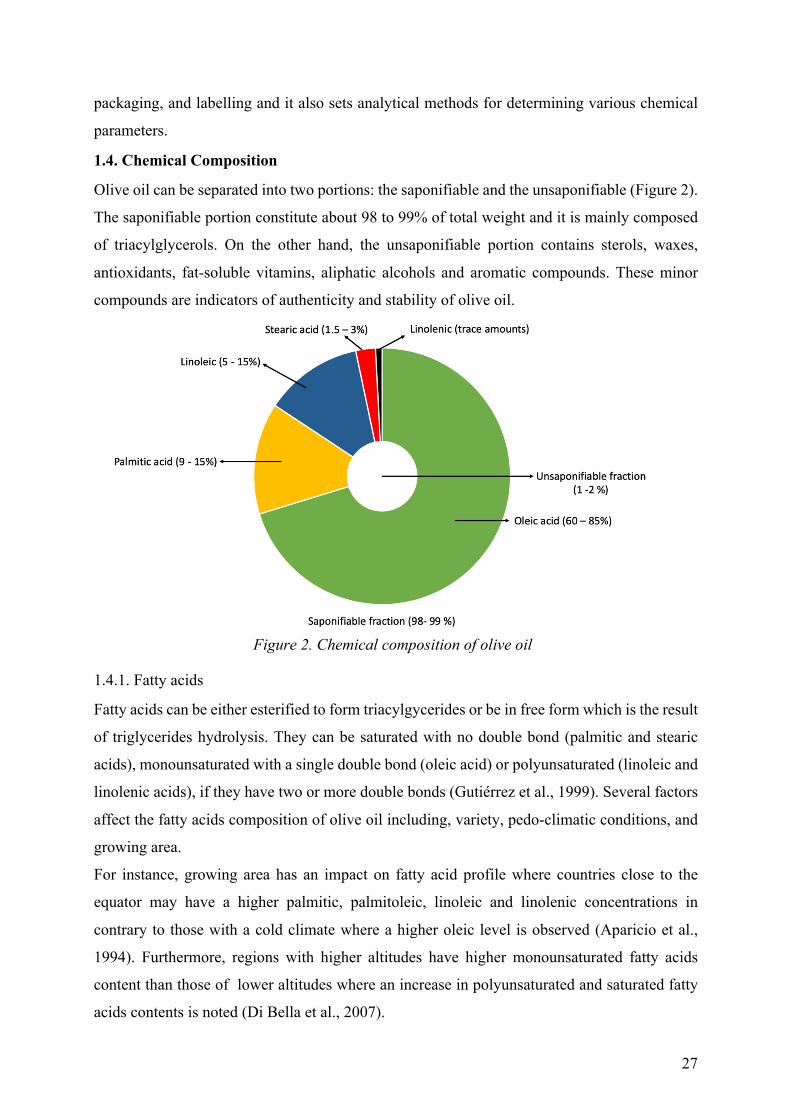
1.4. Chemical Composition
Olive oil can be separated into two portions: the saponifiable and the unsaponifiable (Figure 2).
The saponifiable portion constitute about 98 to 99% of total weight and it is mainly composed
of triacylglycerols. On the other hand, the unsaponifiable portion contains sterols, waxes,
antioxidants, fat-soluble vitamins, aliphatic alcohols and aromatic compounds. These minor
compounds are indicators of authenticity and stability of olive oil.
1.4.1. Fatty acids
Fatty acids can be either esterified to form triacylgycerides or be in free form which is the result
of triglycerides hydrolysis. They can be saturated with no double bond (palmitic and stearic
acids), monounsaturated with a single double bond (oleic acid) or polyunsaturated (linoleic and
linolenic acids), if they have two or more double bonds (Gutiérrez et al., 1999). Several factors
affect the fatty acids composition of olive oil including, variety, pedo-climatic conditions, and
growing area.
For instance, growing area has an impact on fatty acid profile where countries close to the
equator may have a higher palmitic, palmitoleic, linoleic and linolenic concentrations in
contrary to those with a cold climate where a higher oleic level is observed (Aparicio et al.,
1994). Furthermore, regions with higher altitudes have higher monounsaturated fatty acids
content than those of lower altitudes where an increase in polyunsaturated and saturated fatty
acids contents is noted (Di Bella et al., 2007).
Figure 2. Chemical composition of olive oil
28
1.4.2. Sterols
Plant sterols or particularly phytosterols, are structurally equivalent to cholesterols. Phytosterols
are in the plant world what cholesterol is to the animal world. An essential element in the
construction of cell walls and play a key role in the cell membrane function. In olive oil, they
are one of the micro-components found in the unsaponifiable portion (Figure 2). The chief
components are beta sitosterol, campesterol and stigmasterol. These sterol compounds are
known for their stability even under prolonged storage of olive oil and are unique for each oily
fruit (Thanh et al., 2006; Soupas et al., 2004). For this reason, their content in olive oil is
regulated by the European Union legislations (EEC, 1991) and by the trade standards set by the
IOC (IOC, 2011b) since these compounds are an important tool for the authentication of olive
oil genuineness. As fatty acids, sterol compounds are also affected by the cultivar, climate,
altitude, agronomic factors and other variables and can also be used for geographical
discrimination (Giacalone et al., 2015).
1.4.3. Polyphenols
Phenolic compounds are of great organoleptic and nutritional interest. Several classes of
phenolic compounds exist, mainly, phenolic acids, phenyl ethyl alcohols, flavonoids, hydroxy-
iso-chromans and secoiridoids. That latter constitutes the main compounds of the phenolic
fraction of Oleaceae plants. Polyphenols are generally linked to the bitter and pungency sensory
attributes perceived when tasting olive oil. They have been also associated to color and to the
stability of the oil due to their antioxidant properties (Nergiz & Ünal, 1991; Maga, 1978).
Phenolic compounds such as gallic, vanillic, caffeic syringic, ferulic and cinnamic acids, inhibit
the oxidation of triglycerides during storage (Kachouri & Hamdi, 2004). Thus, polyphenols
influence long shelf-life compared to other vegetable oils. These compounds were also
recognized as potential markers for geographical origin or olive fruit variety (Segura-Carretero
et al., 2010).
1.4.4. Chlorophylls
In general, chlorophylls are responsible for the green color of olive fruits and their byproducts.
The chlorophyll fraction present in the olive fruit decreases during the ripening of the fruit, as
the color progresses from green, light green, red-spotted, purple to black, and during oil
extraction process where 80 % of total chlorophylls are lost. These chemical and physical
changes are the major influencers on the quantity/quality of the chlorophyll pigment profile
present in olive oil. In both cases, most of the chlorophyll pigments (chlorophylls a and b) are
lost either by converting the latter into pheophytins a and b due to prolonged ripening
29
throughout fruit milling or due to retention of the chlorophyll pigments in the pomace during
extraction (Giuliani et al., 2011).
Chlorophyll pigments retained in olive oil can have either a negative or a positive effect on the
stability of packaged olive oil. In presence of light and high temperatures, chlorophylls can act
as prooxidant enhancing autooxidation by forming a singlet state oxygen. However, in suitable
conditions, i.e. storage of olive oil in the dark and at low temperature, chlorophylls act as
antioxidants preserving olive oil quality (Anniva et al., 2006).
1.4.5 Volatile compounds
Odor plays a significant role in virgin olive oil sensory quality and consumer acceptance.
Volatile compounds are responsible for the odor/ fragrant and delicate flavor that virgin olive
oil possess. The main precursors of the volatile formation are lipids, particularly linoleic and
linolenic acids. Volatile compounds reach their maximum and mostly form during malaxation
process through the so-called lipoxygenase pathway. The major volatile compounds formed by
the oxidation of polyunsaturated fatty acids are aldehydes, alcohols and their corresponding
esters. For instance, hexan-1-ol (Green), hexanal (Green – sweet), E-2-hexenal (Green, apple-
like), and 3-methylbutan-1-ol (woody, sweet), are mostly present in extra virgin olive oils
(EVOO) originating from the Mediterranean region (Salas et al., 1999; Morales et al., 1999;
Aparicio et al., 1996).
A poorer quality of olive oil has a more complex volatile profile with higher number of volatiles
particularly branched aldehydes and alcohols. These compounds which is a result of chemical
oxidation (Morales et al., 1999) contribute to VOO organoleptic defects such as rancid, winey,
vinegary, fusty and musty (Morales et al., 2005). Olive fruit maturity (Salas et al., 1999) and
inadequate conditions in olive oil extraction especially during the malaxation step (Ranalli et
al., 2001), are considered the most decisive parameters in the production of volatiles responsible
for aromas appreciated by consumers.
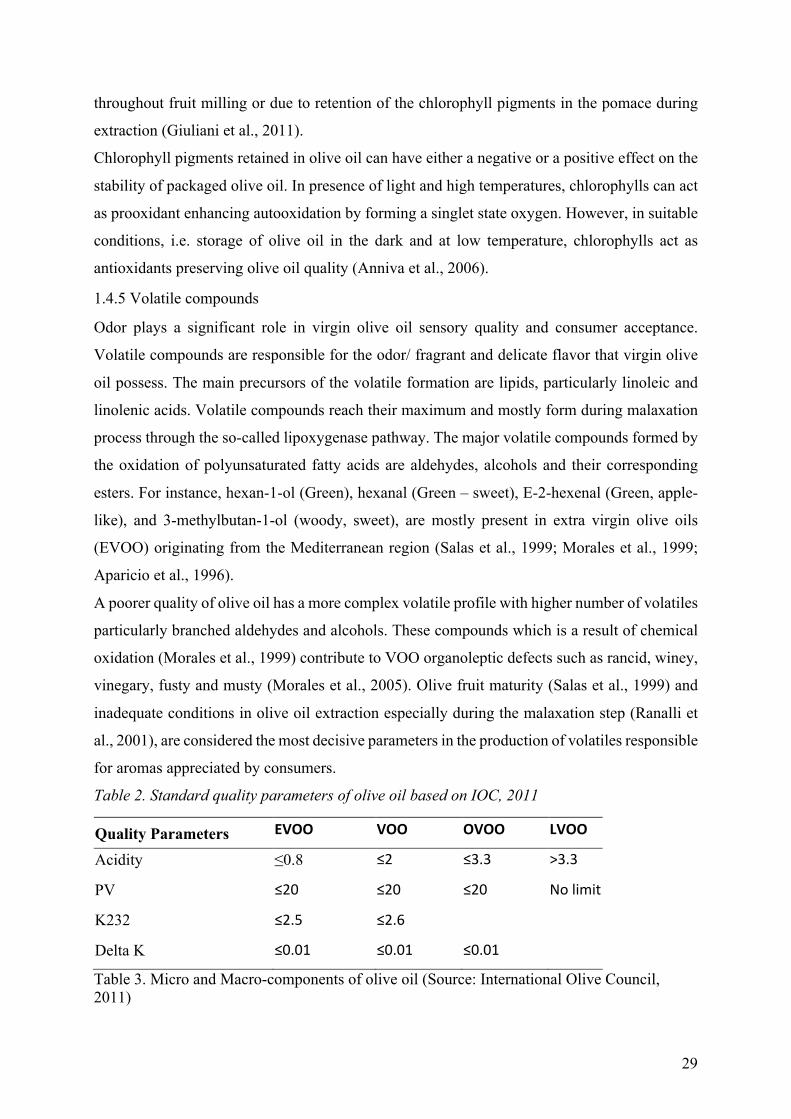
Table 2. Standard quality parameters of olive oil based on IOC, 2011
Quality Parameters EVOO VOO OVOO LVOO
Acidity ≤0.8 ≤2 ≤3.3 >3.3
PV ≤20 ≤20 ≤20 No limit
K232 ≤2.5 ≤2.6
Delta K ≤0.01 ≤0.01 ≤0.01
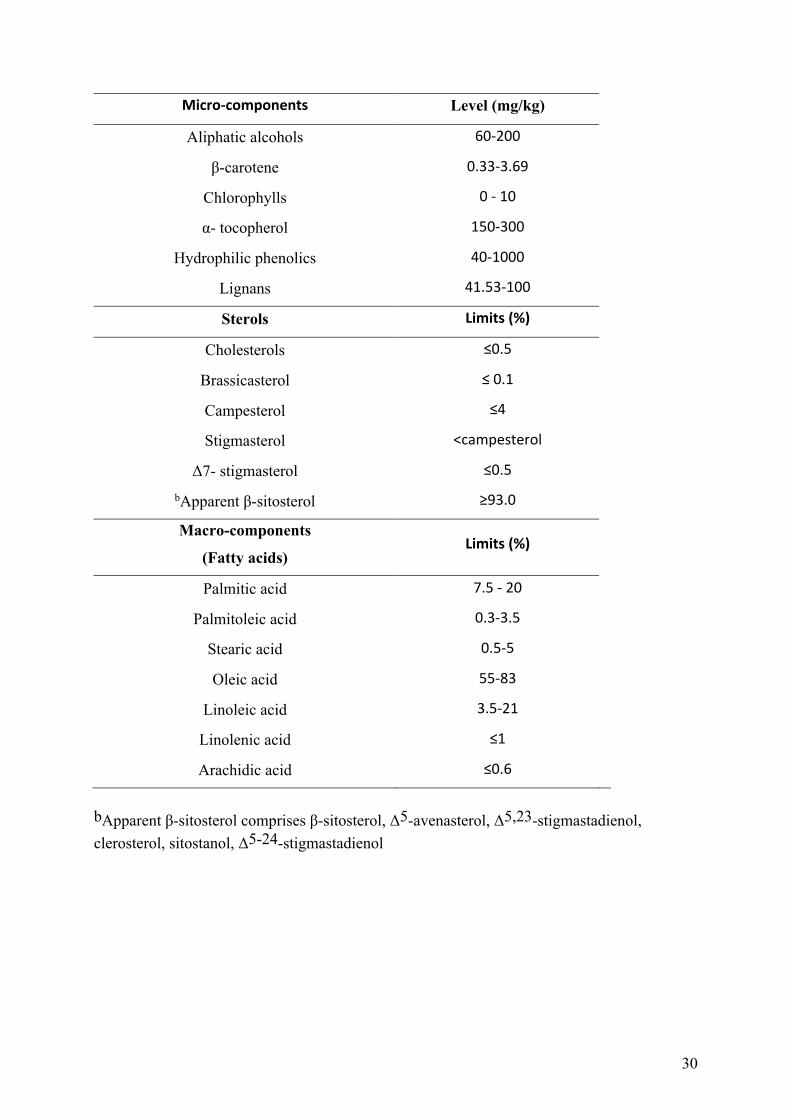
Table 3. Micro and Macro-components of olive oil (Source: International Olive Council, 2011)
30
Micro-components Level (mg/kg)
Aliphatic alcohols 60-200
β-carotene 0.33-3.69
Chlorophylls 0 - 10
α- tocopherol 150-300
Hydrophilic phenolics 40-1000
Lignans 41.53-100
Sterols Limits (%)
Cholesterols ≤0.5
Brassicasterol ≤ 0.1
Campesterol ≤4
Stigmasterol <campesterol
Δ7- stigmasterol ≤0.5
bApparent β-sitosterol ≥93.0
Macro-components
(Fatty acids) Limits (%)
Palmitic acid 7.5 - 20
Palmitoleic acid 0.3-3.5
Stearic acid 0.5-5
Oleic acid 55-83
Linoleic acid 3.5-21
Linolenic acid ≤1
Arachidic acid ≤0.6
bApparent β-sitosterol comprises β-sitosterol, Δ5-avenasterol, Δ5,23-stigmastadienol, clerosterol, sitostanol, Δ5-24-stigmastadienol
31
2. Lebanese olive oil sector overview
2.1. Main Geographical features
Lebanon is a home to the oldest olive trees dating back centuries (at least 1,500 years). It has
been renowned for its trade in crop products including olive and olive oil along the
Mediterranean Basin (Mahfoud, 2007; Beayno et al., 2002; Thalman, 2000). The country’s
topography consists of a coast and two mountains running in parallel and separated by an
agricultural plateau called Bekaa. Although landscape variations may give a rise to
differentiated climatic conditions, Lebanon is characterized by a moderate Mediterranean
climate where the average rainfall of 2.2 billion cubic meter per year allows the growth of olive
trees.
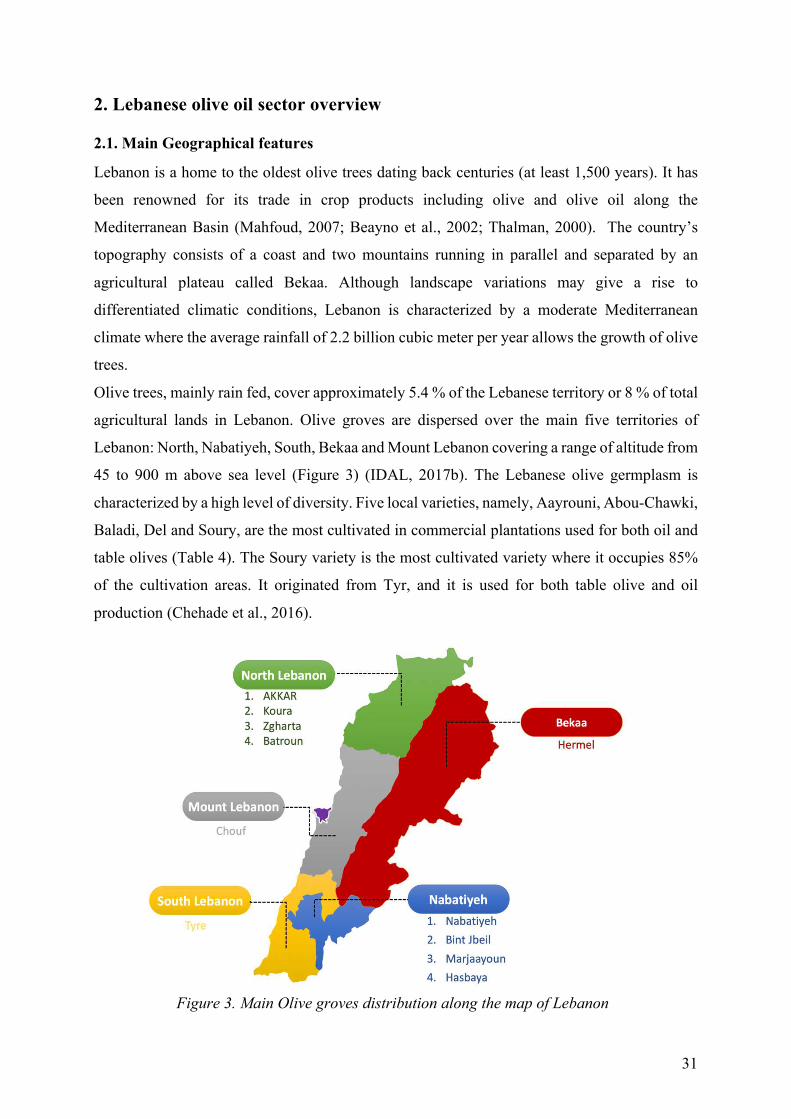
Olive trees, mainly rain fed, cover approximately 5.4 % of the Lebanese territory or 8 % of total
agricultural lands in Lebanon. Olive groves are dispersed over the main five territories of
Lebanon: North, Nabatiyeh, South, Bekaa and Mount Lebanon covering a range of altitude from
45 to 900 m above sea level (Figure 3) (IDAL, 2017b). The Lebanese olive germplasm is
characterized by a high level of diversity. Five local varieties, namely, Aayrouni, Abou-Chawki,
Baladi, Del and Soury, are the most cultivated in commercial plantations used for both oil and
table olives (Table 4). The Soury variety is the most cultivated variety where it occupies 85%
of the cultivation areas. It originated from Tyr, and it is used for both table olive and oil
production (Chehade et al., 2016).
Figure 3. Main Olive groves distribution along the map of Lebanon
32
Table 4. Lebanese olive oil varieties and their distribution across Lebanon
Olive trees
varieties
Main areas of
cultivation Purpose Productivity
Tolerance to
abiotic stress
Aayrouni North and
Mount Lebanon
Oil Medium –
High
High to drought
Abou chawkeh North of bekaa Dual Purpose Medium –
High
High to drought
Baladi All Lebanon Oil High High to drought
Smoukmoki Mount Lebanon Oil High High to drought
Del West bekaa Dual Purpose High High to drought
Soury North and
South
Dual Purpose Medium to
High
High to drought
Teliani All Bekaa Dual Purpose High High to drought
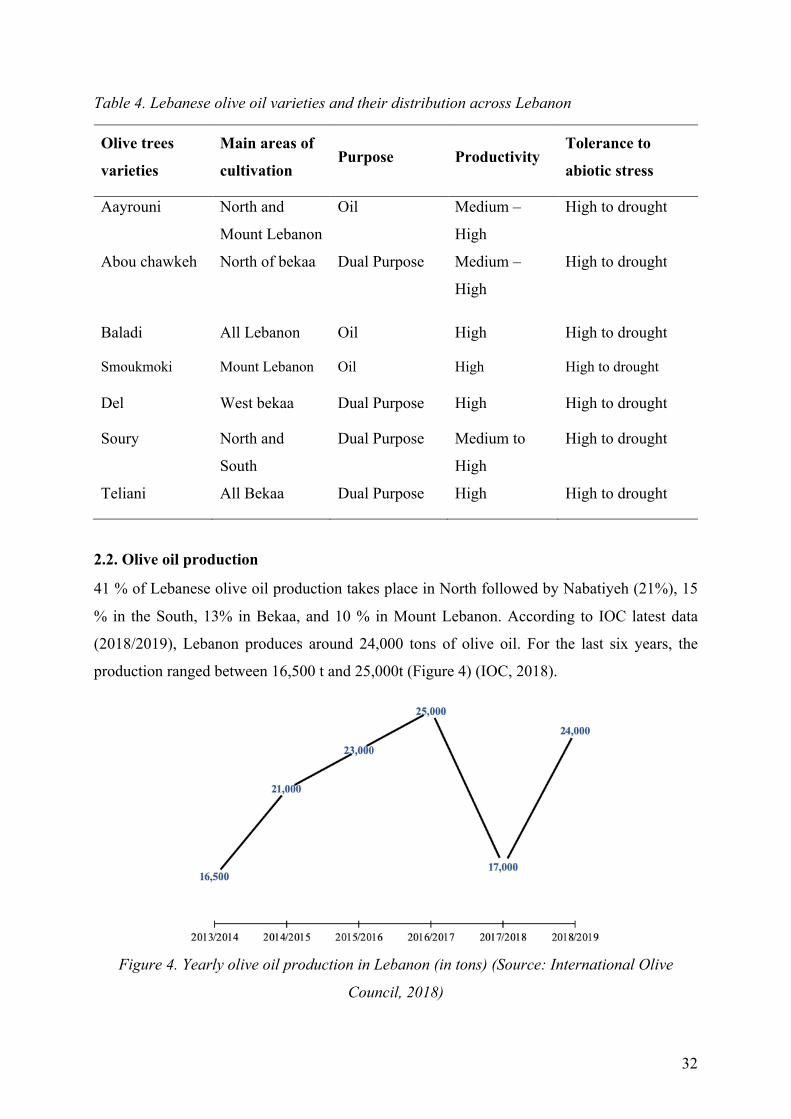
2.2. Olive oil production
41 % of Lebanese olive oil production takes place in North followed by Nabatiyeh (21%), 15
% in the South, 13% in Bekaa, and 10 % in Mount Lebanon. According to IOC latest data
(2018/2019), Lebanon produces around 24,000 tons of olive oil. For the last six years, the
production ranged between 16,500 t and 25,000t (Figure 4) (IOC, 2018).
Figure 4. Yearly olive oil production in Lebanon (in tons) (Source: International Olive
Council, 2018)
33
This fluctuation in production is due to several factors, among them are the following:
- The fact that olive trees are mostly rain fed. This would subject oil productivity to global
warming affects and amount of rain fall per year.
- Farmers practices, especially those related to harvest time and to type of olive oil
extraction method
- Most of the small growers (6,000 – 10,000 m2), representing around 77% of olive
producers in Lebanon, adopt traditional practices thus leading to a lower efficiency and
productivity.
- Heavy alternate bearing phenomena, the tendency of olive trees to bear fruit in two-year
cycles consisting of a large crop followed by a small crop, has a massive effect on
Lebanese olive oil production.
- High cost of production
- Inadequate implementation of GMP and storage practices (ACTED, 2018).
This production is being managed through 485 registered mills scattered in Lebanon. About
85% of the mills still rely on traditional-extraction systems, particularly pressing method. The
other 15 % rely on modern systems including 2-phase and 3-phase extractors (MOA, 2012).
As for olive oil consumption in Lebanon, it is about 4.3 L per capita. it is considered relatively
low when compared to other countries in the region like Greece (10 L /capita) and Syria (20 L
/ capita). Lebanese consumers tend to buy olive oil in bulk from trusted family or neighbors,
i.e. directly from the producers. Olive oil is also available in retail outlets; however, their
demand is somehow low (ACTED, 2018).
2.3 Imports and exports
Lebanese olive oil holds the highest commercial prospects amongst all the other crops covering
about 21% of the total cultivated area and 69% of the land cultivated with fruits. Although
Lebanon is considered a small-scale producer of olive oil as compared to other Mediterranean
countries, it has the reputation of producing high-quality artisanal oils. Exports of Lebanese
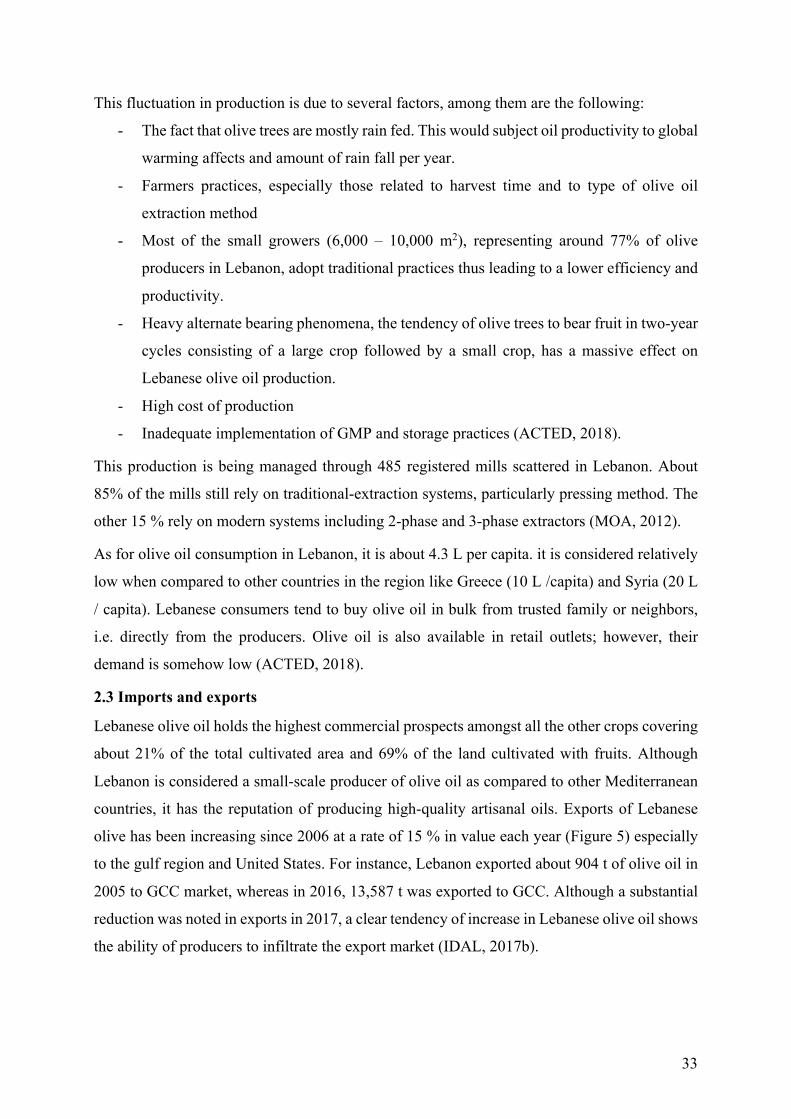
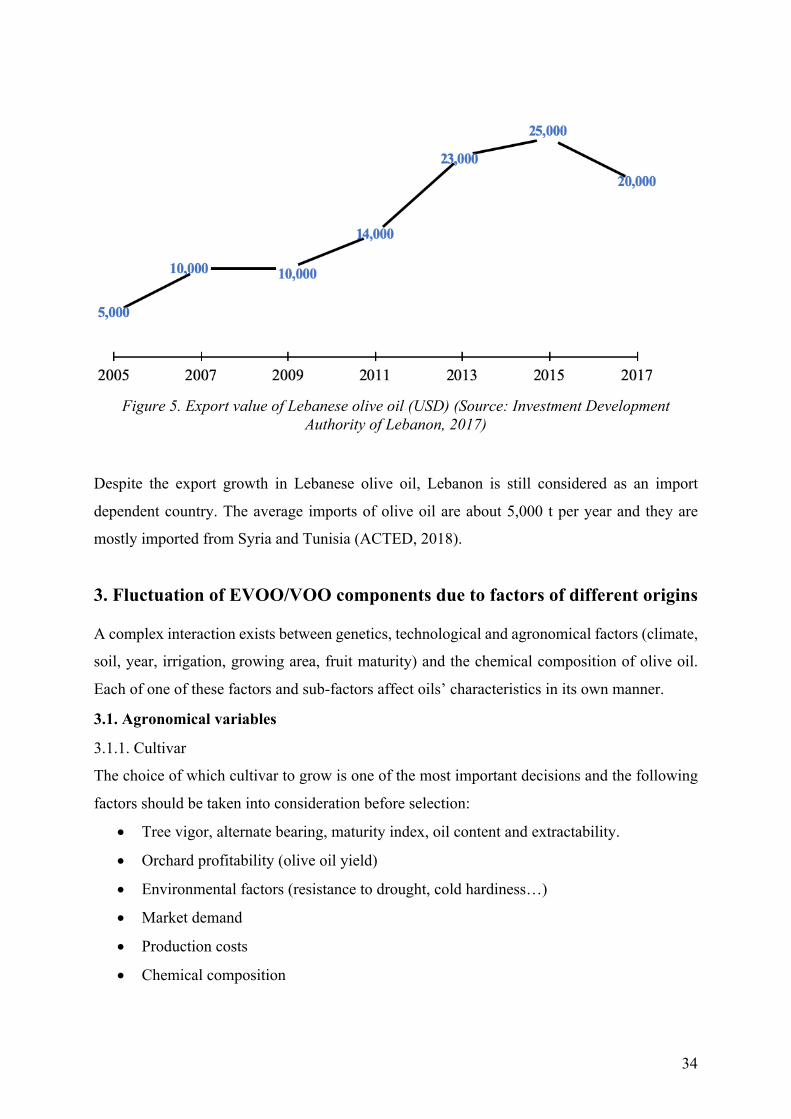
olive has been increasing since 2006 at a rate of 15 % in value each year (Figure 5) especially
to the gulf region and United States. For instance, Lebanon exported about 904 t of olive oil in
2005 to GCC market, whereas in 2016, 13,587 t was exported to GCC. Although a substantial
reduction was noted in exports in 2017, a clear tendency of increase in Lebanese olive oil shows
the ability of producers to infiltrate the export market (IDAL, 2017b).
34
Figure 5. Export value of Lebanese olive oil (USD) (Source: Investment Development Authority of Lebanon, 2017)
Despite the export growth in Lebanese olive oil, Lebanon is still considered as an import
dependent country. The average imports of olive oil are about 5,000 t per year and they are
mostly imported from Syria and Tunisia (ACTED, 2018).
3. Fluctuation of EVOO/VOO components due to factors of different origins
A complex interaction exists between genetics, technological and agronomical factors (climate,
soil, year, irrigation, growing area, fruit maturity) and the chemical composition of olive oil.
Each of one of these factors and sub-factors affect oils’ characteristics in its own manner.
3.1. Agronomical variables
3.1.1. Cultivar
The choice of which cultivar to grow is one of the most important decisions and the following
factors should be taken into consideration before selection:
• Tree vigor, alternate bearing, maturity index, oil content and extractability.
• Orchard profitability (olive oil yield)
• Environmental factors (resistance to drought, cold hardiness…)
• Market demand
• Production costs
• Chemical composition
35
Each cultivar has its own chemical fingerprint. The triglyceride structure of olive oil is unique
for each cultivar. For instance, 73 of the world’s most common cultivars were compared and
differences in the fatty acid content were found. For example, palmitic fatty acid percent ranged
from 8.49 to 16.46, palmitoleic from 0.41 to 2.26, stearic from 1.46 to 3.79, oleic from 56.12 to
78.34, linoleic from 4.44 to 13.34 (Lombardo et al., 2008; Mannina et al., 2003; Zarrouk et al.,
2009)
Minor components such as sterols and polyphenols are also highly influenced by the cultivar.
The polyphenol content of olive oil varies from 182 to 1240 ppm depending on the cultivar as
long as the olives and the extraction process are in excellent conditions and following good
manufacturing processes guidelines (García-González et al., 2010; Tura et al., 2007). As for
sterols, it constitutes the majority of the unsaponifiable fraction where an increased interest in
the latter has been noticed due to its importance in the quality regulation of olive oil. Each
cultivar has its own fingerprint represented by the sterol profile. A study by Kyçyk et al. (2016)
showed that each of the 43 olive cultivars has their own distinct sterol profile. Because of this
variability, sterols can be used as a discrimination tool among monovarietal VOOs. It can also
be used in olive breeding projects to obtain new olive cultivars with improved sterol fraction.
3.1.2. Climate and elevation
Olive oil is mainly composed of fatty acids, especially monounsaturated fatty acids (oleic acids)
in addition to polyunsaturated fatty acids like linoleic and linolenic (Salvador et al., 2003). The
fatty acids profile of oils produced from the same cultivar is the same in oils produced in similar
climates and growing conditions. However, a difference in the climate or altitude between
regions has led to cases where large differences have been observed in the fatty acids
composition of oil (Aparicio et al., 1994). Çetinkaya et al. (2017) have found that a difference
in altitude has an effect on oleic acid, palmitic acid, linoleic acid and stearic acid. Other authors
like Nergiz and Ergönül (2009) also found out that olives planted in high-altitude locations are
rich in monounsaturated fatty acids (MUFA), while olives planted in low-altitude locations are
rich in saturated fatty acids (SFA).
Furthermore, the change in altitude correspond to a decrease or increase in the environment
temperature, relative humidity and thus the modification of the underlying physiological
metabolic processes at the level of olive fruit, in particular, the process of fatty acid synthesis.
Oleate desaturase, an enzyme responsible for desaturation of Oleoyl-ACP (precursor of longer-
chain unsaturated fatty acids) into linoleate-ACP might be the reason behind the notable
difference in the MUFA and PUFA concentrations between these two groups. This enzyme has
been extensively discussed in seed oils. In sunflower seed, the low temperature lead to the
36
activation of the desaturase enzymes and the level of desaturated fatty acids such as linoleic
acid increase as a mechanism to tolerate low temperatures during pod filling. However, at high
temperatures (30 oC), desaturases enzymes are partially and reversibly inhibited reducing the
linoleic acid content in the oil. This mechanism, known in sunflower, and the information
regarding the desaturase enzymes responses to change in climatic conditions in olive is limited
(Hernandez et al., 2011) Several studies reported that the gradual decrease in temperature from
October to January, as olive ripening advances, may increase the linoleic acid content in the
olive fruit (Inglese et al., 2011; Gutiérrez et al., 1999). In addition, García-Inza et al. (2014)
studied the effect of high temperature especially at the beginning of oil accumulation, by placing
fruiting branches in transparent plastic chambers with individualized temperature control. The
results showed that high temperatures could decrease the oleic acid content and increase
palmitic, palmitoleic, linoleic, and linoleic acid.
Micro-components also are affected by the climatic conditions. Several studies have shown that
oil produced in warm coastal areas has fewer total polyphenols than those grown at higher
altitudes and lower temperature regions (Osman, 1994). Sterols on the other hand are mostly
related to fruit maturity and cultivar.
3.1.3 Fruit maturity
The effect of fruit maturity on olive oil chemical composition is significant. As olive fruit
matures, the color of the fruit shifts from green at the beginning of the harvest period to small
reddish-green spots to purple and lastly to black at the end of the harvest period (Motilva &
Romero, 2010). Each stage imparts chemical variations on the level of metabolic processes of
several compounds such as triglycerides, fatty acids, polyphenols, sterols and chlorophylls,
which in turn have an impact on olive oil quality (Gargouri et al., 2016). These variations not
only influence the quality but also the nutritional and organoleptic characteristics and the
oxidative stability of olive oil (Maaitah et al., 2009). For instance, polyphenols and chlorophyll
content decrease as fruit maturity increase especially when the olive fruit turns completely into
black (last stage of fruit maturation).
As for fatty acids, Issaoui et al. (2010) related the increase in polyunsaturated fatty acids with
fruit maturation. This is mainly due to continuing biosynthesis of triglycerides and to the
actively desaturation of oleic acid into linoleic by oleate desaturase as the fruit ripens.
However, the variation based on the fruit maturity somehow depends on the cultivar. In some
cases, the level of monosaturated fatty acids increases, whereas the level of saturated and
polyunsaturated fatty acids increased as in the case of Barnea variety. Conversely, the delay of
harvest has a detrimental effect on the quality of olive oil especially on the most widely spread
37
cultivar in Lebanon, the Souri variety. Lodolini et al. (2017) have reported that the latter variety
should be harvested early. As it ripens, oleic content declines and linoleic increases, quality
indices especially free fatty acids are negatively affected, while polyphenol levels and oxidative
stability drop sharply (Noorali et al., 2014). Also, it has been reported that the sterol content
decreases sharply from 2850 g/kg to 1644 g/kg. Moreover, fruit maturation has also been shown
to affect olive oil quality parameters such as free fatty acids, peroxide value, specific UV
absorbances and sensory attributes (Dag et al., 2011; Famiani et al., 2002b; Gomez et al., 2011;
Lazzez et al., 2008; Mailer et al., 2010; Varzakas et al., 2010).
Several methods have been recommended to determine the exact or ideal harvest time with
respect to the quantity and quality of olive oil. These methods have been developed using
organic acids such as malic and citric ratio (Donaire et al., 1975), degree brix (Migliorini et al.,
2011), sugars such as mannitol (Marsilio et al., 2001), fruit respiration (Ranalli et al., 1998) or
dry matter (Mickelbart & James, 2003). Other methods have related a connection between fruit
maturity and specific fatty acids and sterols present in the pulp. However, the most common
used method to determine fruit maturity, recommended by IOC, is the measurement of the fruit
external and internal colors allowing the calculation of maturity index.
3.1.4 Other agronomical factors
Other agronomical factors have an effect on olive oil’s quality and quantity, and these include:
- Pest damages: oil obtained from olives damaged by olive fruit fly (Bacrocera oleae)
show an increase in carbonyl and alcohol compounds. In addition, polyphenols contents
decrease which leads to the lowering of the oxidative stability and in turn leads to the
increase in free fatty acids and peroxide values. OLF attacks the fruit by consumption
of the pulp which increases fruit drop and leads to the loss of the oil quality due to
oxidation phenomena.
- Freeze injury prior to harvest can also reduce oil quality by decreasing the concentration
of phenolic compounds and thus lower oxidative stability. Water within the fruit can
crystallize and leads to the rupture of skin the olive fruit thus exposing it to oxidation
phenomena (Trentacoste et al., 2020).
- Irrigation and rainfall: Both a deficit and a surplus of irrigation regimes have their own
effect on the quality of olive oil. A deficit in water leads to early maturation and lower
the accumulation of oil in the fruit. Whereas a surplus of water can lead to an oil with
lower polyphenol content, bitterness and lower fruity, floral and herbaceous flavors. The
latter flavors are enhanced in drought-stressed or deficit – irrigation trees (Gomez-Rico
et al. 2007). In some cases, the fatty acid profile could be affected as a result of irrigation,
38
where the concentration of monounsaturated fatty acid witnessed an increase and those
of polyunsaturated fatty acids and saturated fatty acids endorsed a decrease in
concentration (Mailer et al., 2010; Mailer, 2005; Ben-Gal et al., 2011; Berenguer et al.,
2006; Ceci & Carelli, 2007; Faci et al., 2002; Grattan et al., 2006; Pérez-López et al.,
2007; Rapoport et al., 2004; Ripa et al., 2008; Servili et al., 2007; Stefanoudaki et al.,
2009)
- Crop load and pruning mostly affect the quantity of olive oil obtained at harvest. The
ratio of leaves to fruit and amount of fruits per tree (either heavy load or light load) can
dramatically affect the fruit oil content. On the level of the olive oil components, heavy
crop load can decrease the levels of palmitic and linoleic acids, and has no effect on free
fatty acids, peroxide value or sensory characteristics.
3.2. Technological variables
3.2.1. Olive transport and storage
The period between harvesting and milling are critical for oil quality. Improper conditions
during handling and storage of olives may trigger a chain of degrading reactions such as
lipolysis, lipid oxidation and the secretion of lipolytic and oxidative enzymes. For instance, the
transport of olive fruits in plastic sacks that stay for several days in the mill before being pressed
favor the enzymatic lipolysis of the fruit triacylglycerol and majorly affect the quality indicators
of olive oil (Kiritsakis et al., 1998). Instead rigid plastic containers are used (15–20 kg crates or
200–300 kg bins) with olives in layers not thicker than 30cm. The crate should also have holes
to ensure air circulation.
Therefore, two critical conditions should be taken into consideration during storage and
transport of olive fruits:
- Avoid mechanical damage at any cost
- Control time and temperature
Olive fruits should be processed as soon as they arrive to the mill especially if they are ripened.
In case of processing delay, limitation of the duration of the storage is a necessity taking into
consideration the best practices during storage to conserve product quality (Famiani et al.,
2002a).
3.2.2. Processing methods
The aim of olive processing is to acquire VOO as stated by the IOC. Until now, three mechanical
systems are involved in olive oil extraction:
- Pressing method
39
- Percolation method
- Centrifugation method
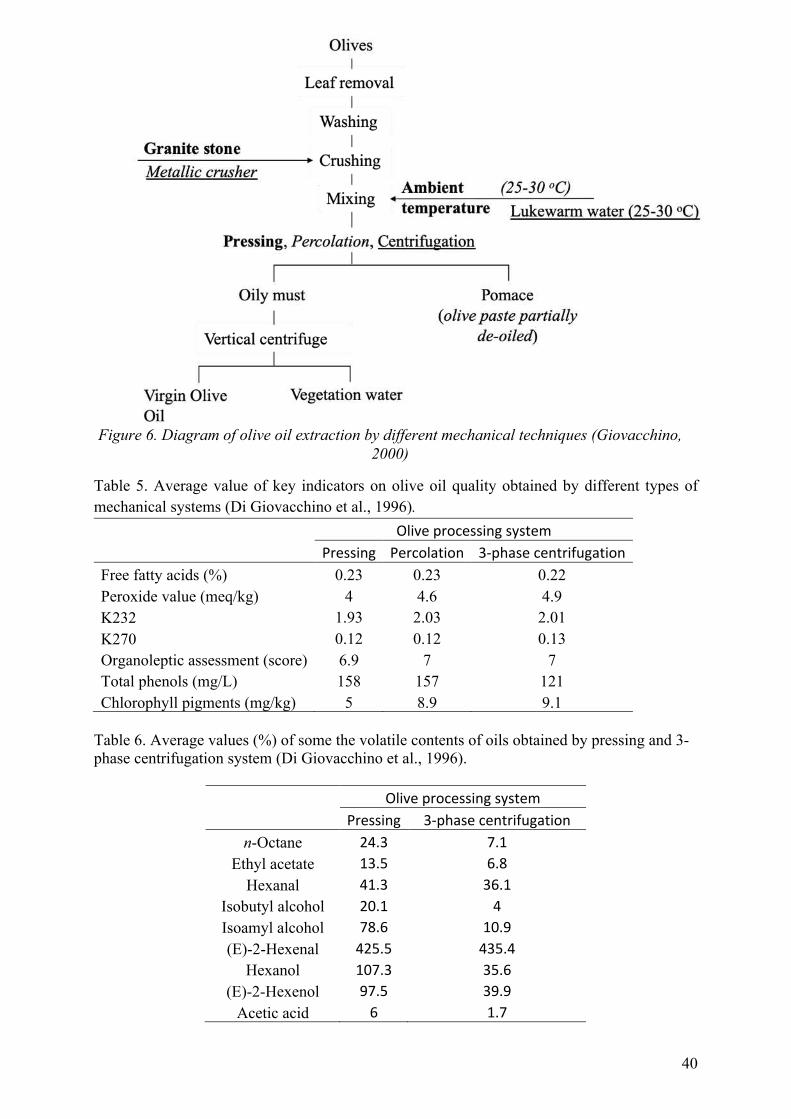
All methods are supposedly to give olive oil with good quality (Figure 6). However, the
distinctive features of each method have an effect on the micro components of olive oil unless
contamination is a problem if necessary, precautions weren’t taken into consideration, like in
the pressing method. Pressing method uses granite millstones and mats (filtering diaphragms of
nylon fiber) for olive fruit crushing and olive oil extraction. Olive paste is stacked in layers on
pressing mats which are difficult to be kept clean and exempt from oxidized oil and
fermentation defects possibly transferable to the oils. However, this method has an advantage
over other methods by yielding the highest amount of extracted olive oil (Di Giovacchino et al.,
1994; Di Giovacchino et al., 1996).
Percolation method is dated back to 1911, and it is based on the surface tension difference
between oil and vegetation water. This method relies on a semi-cylindrical grating with small
blades moving slowly through the slits, plunging into the olive paste, and oil drips off the blades
when they are withdrawn. The percolation method doesn’t give high oil yields, but it is
considered as the most natural process as it takes place at ambient temperatures and without
using water or employing mats (Mascolo, 1980).
Centrifugation method is the newest and most applied method. It is a continuous process using
centrifugal force to separate VOO from vegetation water and pomace. Two types of this
decanters are used in this method, the three-phase and the two-phase centrifugal systems. The
latter reduce the amount of water added to the olive paste and improve the quality of olive oil.
Table 5 shows the values of some parameters obtained by oil produced the several extraction
systems present above. As mentioned earlier, all systems give EVOOs when good quality olives
are processed, and the mill is clean. However, the centrifugation system produces oil with lower
content of phenols. In addition, the processing system can affect the content of some volatile
compounds as present in Table 6 (Di Giovacchino et al., 1996).
40
Table 5. Average value of key indicators on olive oil quality obtained by different types of mechanical systems (Di Giovacchino et al., 1996).
Olive processing system
Pressing Percolation 3-phase centrifugation
Free fatty acids (%) 0.23 0.23 0.22 Peroxide value (meq/kg) 4 4.6 4.9 K232 1.93 2.03 2.01 K270 0.12 0.12 0.13 Organoleptic assessment (score) 6.9 7 7 Total phenols (mg/L) 158 157 121 Chlorophyll pigments (mg/kg) 5 8.9 9.1
Table 6. Average values (%) of some the volatile contents of oils obtained by pressing and 3-phase centrifugation system (Di Giovacchino et al., 1996).
Olive processing system
Pressing 3-phase centrifugation
n-Octane 24.3 7.1
Ethyl acetate 13.5 6.8
Hexanal 41.3 36.1
Isobutyl alcohol 20.1 4
Isoamyl alcohol 78.6 10.9
(E)-2-Hexenal 425.5 435.4
Hexanol 107.3 35.6
(E)-2-Hexenol 97.5 39.9
Acetic acid 6 1.7
Figure 6. Diagram of olive oil extraction by different mechanical techniques (Giovacchino, 2000)
41
Although IOC has made some restrictions on adding certain chemical compounds to enhance
olive oil extraction, some researchers have been working on improving the VOO and EVOO
production, for instance, by the utilization of solid carbon dioxide. Angela et al. (2015)
introduced CO2 to the olive fruits during the pre-milling phase, which induced intracellular
water freezing and, consequently, the fruit cellular membrane's rapture. This process increased
the extraction yield from 1 to 21 % without changing the olive oil's chemical composition.
3.2.3. Storage conditions
Olive oil storage is also one of the critical steps that have a big impact on the quality if not
preserved well. The key points to consider during oil storage are:
- VOO should be stored as soon as it is extracted
- VOO should be stored in a container made of stainless steel or glass bottles
- VOO should be stored in a room at controlled temperatures (13-18 oC) and away from
light
- Storage containers should be filled to the tip and in case it is not filled with oil, air
should be replaced with an inert gas like nitrogen.
In general, VOO contains a high level of oleic acid, a medium content of saturated fatty acids
and a low concentration of polyunsaturated fatty acids. This explains why VOO has higher
stability when compared to other vegetable oils, such as seed oils (higher percentage of
polyunsaturated fatty acids). Basically, polyunsaturated fatty acids oxidize faster than
monounsaturated ones. However, the above precautions need to be taken to avoid the chemical
and biological reactions that leads to the deterioration of olive oil quality. Two major reactions
are involved in the spoilage of olive oil:
1. Hydrolysis of triglycerides caused by enzymes and is caused by the presence of water
during storage of olive oil
2. Chemical oxidations of fatty acids promoted by the presence of oxygen from either
improper storage (presence of air) or due to light (Giovacchino, 2000).
The temperature at which the olive oil is stored has a direct impact on its chemical composition.
Olive quality parameters, in general, remain intact or remain within the EVOO category when
storing at freezing temperatures or temperatures above 4 oC (not exceeding room temperature18 oC). As for volatile compounds only, aldehydes, particularly hexanal (an indicator of oxidation),
have increased when subjecting olive oil to -20 oC temperatures. Others like esters and ketones
show more stability, and the fresh oil volatile profile is preserved well at low temperatures
(Brkić Bubola et al., 2014).
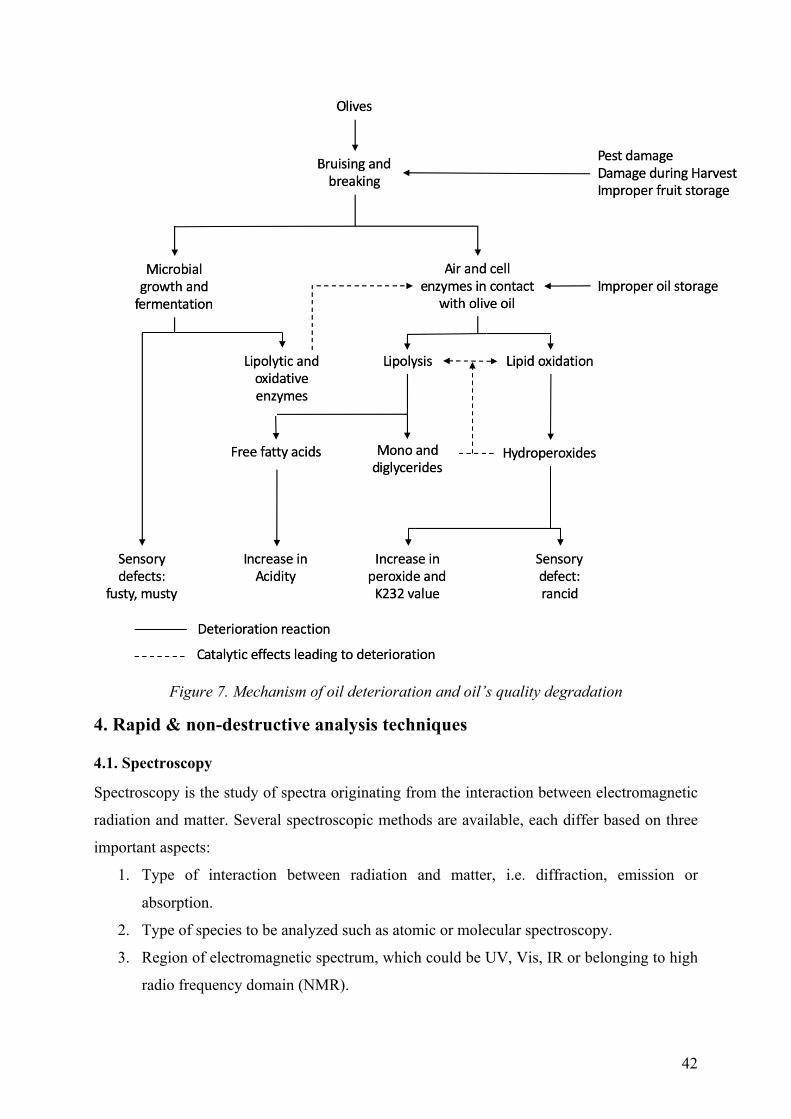
42
Figure 7. Mechanism of oil deterioration and oil’s quality degradation
4. Rapid & non-destructive analysis techniques
4.1. Spectroscopy
Spectroscopy is the study of spectra originating from the interaction between electromagnetic
radiation and matter. Several spectroscopic methods are available, each differ based on three
important aspects:
1. Type of interaction between radiation and matter, i.e. diffraction, emission or
absorption.
2. Type of species to be analyzed such as atomic or molecular spectroscopy.
3. Region of electromagnetic spectrum, which could be UV, Vis, IR or belonging to high
radio frequency domain (NMR).
43
Spectroscopic methods are used by scientists from many disciplines, it is an informative
technique and could be used for both qualitative and quantitative analyses. One of the
spectroscopic techniques that is witnessing a flourishing, or a dramatic growth in the field of
olive oil, is fluorescence spectroscopy (Penner, 2017).
Fluorescence is one of the categories of Luminescence. The phenomenon of luminescence has
been known since ancient times. It is defined as the emission of light of any substance and it
happens from electronically excited states. In case of fluorescence, it occurs as a result of a
singlet excited states (Lakowicz, 2006).
4.1.1 Fluorescence spectroscopy
Fluorescence spectroscopy has been successfully used as a rapid, non-invasive and highly
sensitive technique for analysis of olive oil quality and showed to be more cost-efficient
compared to other analytical procedures (Lleo et al., 2016). This type of spectroscopy can be
particularly useful as routine quality control since the analysis is carried out directly on the
intact samples without any pre-treatment or usage of chemical reagents (Sikorska et al., 2004).
These advantages have rendered front face fluorescence as an important tool in the evaluation
of olive oils properties.
So, what is fluorescence? In simple words, it is a phenomenon resulting from the emission of
light by the matter after absorption of light. Upon absorption of light in the UV or Vis range,
the analyte absorbs a photon or is activated and reaches a higher energy level called the excited
state. Jablonski’s diagram (Figure 8), is often used to illustrate the processes occurring between
absorption and emission of light (Szudy & Toruniu, 1998). Based on this diagram, a molecule
resting at the ground state absorbs energy at an excitation wavelength (that is specific property
to the molecule itself), and it gets excited. This will gradually transfer the molecule to a one or
higher energy levels (S1). The next stage will be vibrational relaxation which permits the
electron to return to its lowest energy level, from S1 to S0 (ground state).
The return to the ground state emits a photon, at a wavelength higher than that of the excitation
state, thus producing the fluorescence phenomenon. This phenomenon which is called
fluorescence takes about a few picoseconds or even a few nanoseconds. The only limitation to
this phenomenon, is that it only works with fluorophore compounds mainly those consisting of
aromatic molecules or into those having enough electronic density (high conjugated chemical
structure).
44
Figure 8. Jablonski diagram (Frackowiak, 1988)
Fluorescence spectroscopy instrument consists of:
• a light source, generally xenon or mercury lamp;
• two monochromators, used for selection of narrow band of excitation and emission
wavelength
• a sample holder;
• a detector or a photodetector, used for converting the emitted light to an electric signal;
• a data acquisition and analysis unit (Figure 9).
To obtain a fluorescence spectrum, light is emitted from an excitation source and passes through
a monochromator. Then the narrow band of excitation wavelength selected by the latter strikes
the sample. The incident light is absorbed by the sample, where some of the molecules in the
sample fluoresce. It should be noted that light only penetrates some um inside the matter as it
can do in an ATY mode in infrared spectroscopy. It is more like a surface analysis than a
comprehensive and deep analysis. The emitted fluorescent light passes through the second
monochromator, reaches the detector and gets recorded by the data acquisition unit (Locquet et
al., 2019).
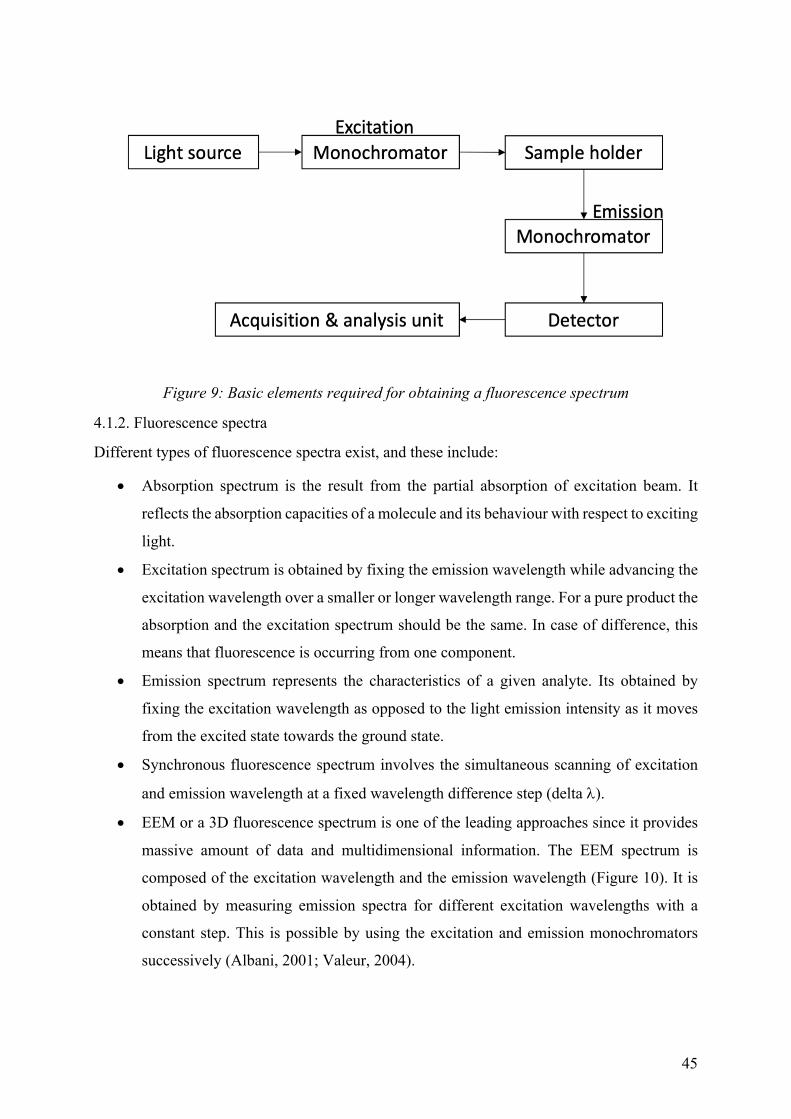
45
Figure 9: Basic elements required for obtaining a fluorescence spectrum
4.1.2. Fluorescence spectra
Different types of fluorescence spectra exist, and these include:
• Absorption spectrum is the result from the partial absorption of excitation beam. It
reflects the absorption capacities of a molecule and its behaviour with respect to exciting
light.
• Excitation spectrum is obtained by fixing the emission wavelength while advancing the
excitation wavelength over a smaller or longer wavelength range. For a pure product the
absorption and the excitation spectrum should be the same. In case of difference, this
means that fluorescence is occurring from one component.
• Emission spectrum represents the characteristics of a given analyte. Its obtained by
fixing the excitation wavelength as opposed to the light emission intensity as it moves
from the excited state towards the ground state.
• Synchronous fluorescence spectrum involves the simultaneous scanning of excitation
and emission wavelength at a fixed wavelength difference step (delta l).
• EEM or a 3D fluorescence spectrum is one of the leading approaches since it provides
massive amount of data and multidimensional information. The EEM spectrum is
composed of the excitation wavelength and the emission wavelength (Figure 10). It is
obtained by measuring emission spectra for different excitation wavelengths with a
constant step. This is possible by using the excitation and emission monochromators
successively (Albani, 2001; Valeur, 2004).
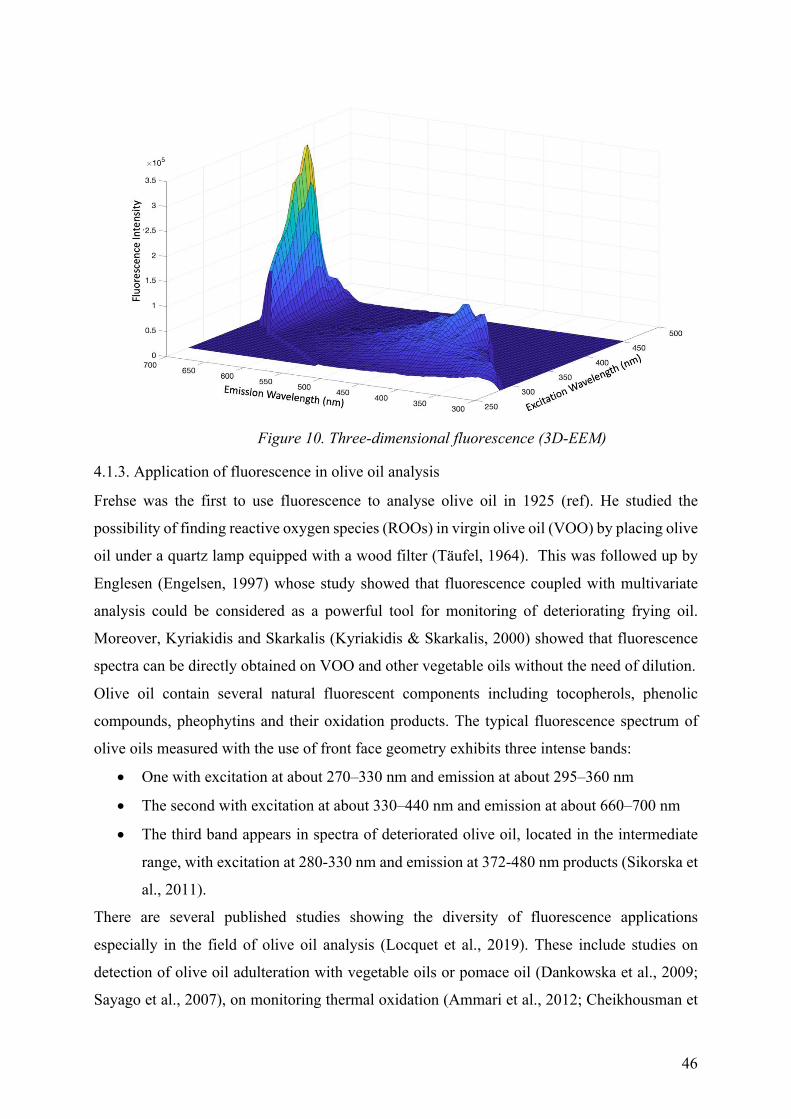
46
4.1.3. Application of fluorescence in olive oil analysis
Frehse was the first to use fluorescence to analyse olive oil in 1925 (ref). He studied the
possibility of finding reactive oxygen species (ROOs) in virgin olive oil (VOO) by placing olive
oil under a quartz lamp equipped with a wood filter (Täufel, 1964). This was followed up by
Englesen (Engelsen, 1997) whose study showed that fluorescence coupled with multivariate
analysis could be considered as a powerful tool for monitoring of deteriorating frying oil.
Moreover, Kyriakidis and Skarkalis (Kyriakidis & Skarkalis, 2000) showed that fluorescence
spectra can be directly obtained on VOO and other vegetable oils without the need of dilution.
Olive oil contain several natural fluorescent components including tocopherols, phenolic
compounds, pheophytins and their oxidation products. The typical fluorescence spectrum of
olive oils measured with the use of front face geometry exhibits three intense bands:
• One with excitation at about 270–330 nm and emission at about 295–360 nm
• The second with excitation at about 330–440 nm and emission at about 660–700 nm
• The third band appears in spectra of deteriorated olive oil, located in the intermediate
range, with excitation at 280-330 nm and emission at 372-480 nm products (Sikorska et
al., 2011).
There are several published studies showing the diversity of fluorescence applications
especially in the field of olive oil analysis (Locquet et al., 2019). These include studies on
detection of olive oil adulteration with vegetable oils or pomace oil (Dankowska et al., 2009;
Sayago et al., 2007), on monitoring thermal oxidation (Ammari et al., 2012; Cheikhousman et
Figure 10. Three-dimensional fluorescence (3D-EEM)
47
al., 2005a; Cheikhousman et al., 2005b; Poulli et al., 2009; Sikorska et al., 2008; Tena et al.,
2012; Tena et al., 2009; Valderrama et al., 2011), and on quality parameters evaluation (Guimet
et al., 2004a; Guzman et al., 2015).
4.1.3.1 Quality parameters evaluation
Olive oil is considered as an economically important product and its quality control is of great
interest. The potential of fluorescence as being a rapid, non-invasive and highly sensitive
technique and the data obtained from the analysis of its excitation-emission spectra, reveals
notable information on olive oil’s quality parameters such as acidity, peroxide value, UV
absorbance at 232 nm (K232) and 270 nm (K270).
Acidity, based on IOC recommendations, is one of the crucial quality parameters for
classification of olive oil into different categories. The increase in acidity is due to free fatty
acids (palmitic, oleic and linoleic acids) resulting from triglyceride decomposition. Studies on
this parameter have focused on the fluorescence band at 429-545 nm which is due to oleic acid
(Poulli et al., 2005). Kyriakidis and Skarkalis (Kyriakidis et al., 2000) also suggested that the
low fluorescence intensities at 445 and 475 nm are attributable to the high content of
monounsaturated fatty acids (oleic acid). The study by Poulli, Mousdis, and Georgiou (Poulli
et al., 2005) also showed the link between the fluorescent bands at 273 and 325 nm and palmitic
and linoleic acids respectively. Other important quality parameters are peroxide value and
K270. These two latter which are the precursors of primary and secondary oxidation products
and have also been linked to high fluorescent intensities at 450-460 nm and 470 nm respectively
(Guimet et al., 2005; Guzman et al., 2015). The increase in the fluorescence intensity in these
regions is due to the oxidation of fatty acids into conjugated hydrogen peroxides and conjugated
triene and diene systems. The fluorescence emission spectra also contain information on
fluorescent molecules such as chlorophyll (600-700 nm), Vit E (525 nm), polyphenols and α-
tocopherol (300–390 nm) (Kyriakidis et al., 2000).
4.2. Flash GC
Flash gas chromatography (FGC), or Ultra Fast-GC, is a rapid technique used for analyzing
volatiles present in olive oil and other materials. In general, FGC process depends on the
volatilization of chemical compounds and then their separation through chromatographic
analysis.
4.2.1. Sampling
Samples introduced into FGC can be either diluted which require larger volumes samples, or
concentrated, like in the case of olive oil, where smaller sample size is required and
48
consequently shorter sample times. Then the samples are injected, and then concentrated in a
colder trap zone.
Before entering into the trap and at the end of the inject time, a carrier gas flows through the
trap and out to vent to remove excess air, moisture, or solvent.
Samples are then injected and concentrated in the trap, where the latter starts heating to the
appropriate desorption temperature under no-flow conditions. The advantages of the trap zone
are:
• Avoid the mismatch between the internal gas flow with the flows through the capillary
columns
• Provide flexibility in the type of the samples accepted for analysis as well as sample
concentration.
When pre-heating time elapses, the sample is injected into the capillary column for
chromatographic analysis.
4.2.2. Chromatographic separation
After the trap reaches its desorption temperature, the desorbed sample passes back out of the
trap into two separation columns (one is polar DB5 and the second is semi-polar DB1701) and
the carrier gas is established again.
The amount of sample that enters the columns is determined by the split flow rate. High split
flow results in narrower injection and sharper peaks whereas a lower split flow results in wider
injection plugs, which allows larger quantities of the sample to be injected.
Split flow depends on the partition coefficients of the compounds to be eluted. For instance, if
a low split flow is used and if the compounds have a low partition coefficient, which in other
words, have significant column migration at the column’s initial temperature, their peak shapes
will be broader, resulting in possible lower resolution. However, if the compounds have larger
partition coefficient, a lower split flow results in greater loading of the column and lower
detection limits. Usually, splitless conditions are used to analyse aroma/odor compounds from
food samples in order to recover the maximum quantity of volatile compounds inside the
detection chamber.
After establishing the correct split flow rate, the compounds are eluted at a different time
(known as retention time) and detected using two flame ionization detectors (FID).
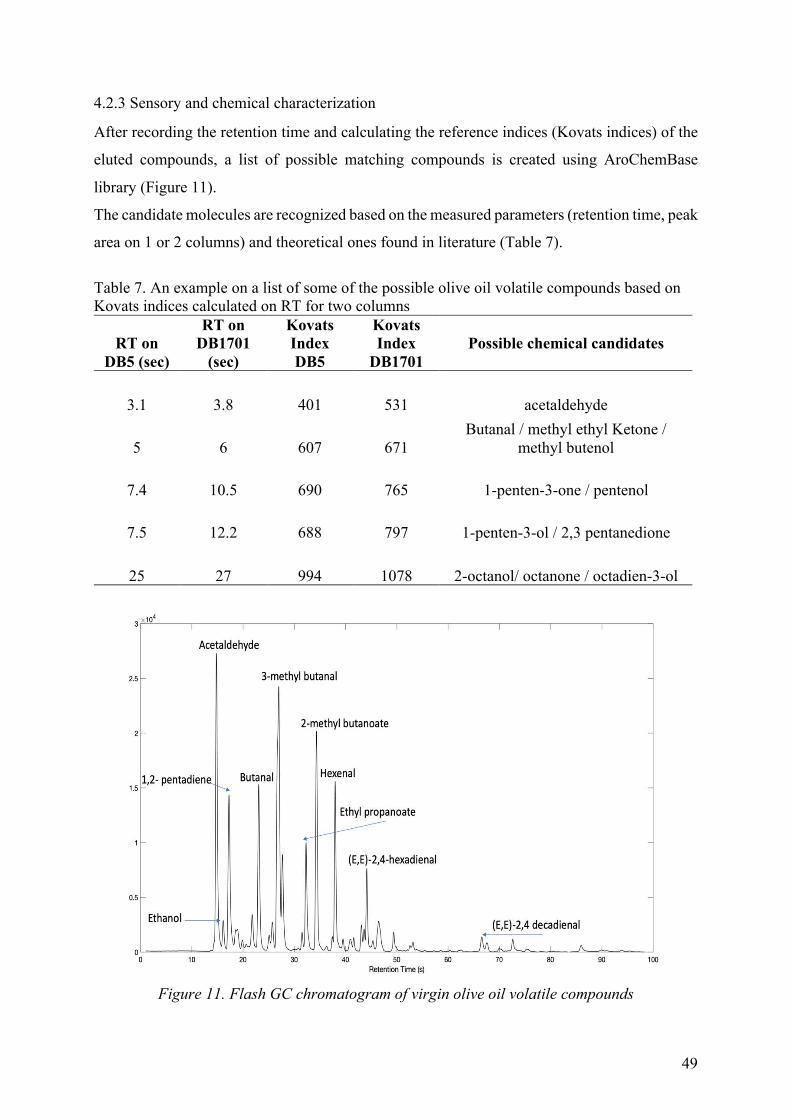
49
4.2.3 Sensory and chemical characterization
After recording the retention time and calculating the reference indices (Kovats indices) of the
eluted compounds, a list of possible matching compounds is created using AroChemBase
library (Figure 11).
The candidate molecules are recognized based on the measured parameters (retention time, peak
area on 1 or 2 columns) and theoretical ones found in literature (Table 7).
Table 7. An example on a list of some of the possible olive oil volatile compounds based on Kovats indices calculated on RT for two columns
RT on
DB5 (sec)
RT on
DB1701
(sec)
Kovats
Index
DB5
Kovats
Index
DB1701
Possible chemical candidates
3.1 3.8 401 531 acetaldehyde
5 6 607 671 Butanal / methyl ethyl Ketone /
methyl butenol
7.4 10.5 690 765 1-penten-3-one / pentenol
7.5 12.2 688 797 1-penten-3-ol / 2,3 pentanedione
25 27 994 1078 2-octanol/ octanone / octadien-3-ol
Figure 11. Flash GC chromatogram of virgin olive oil volatile compounds
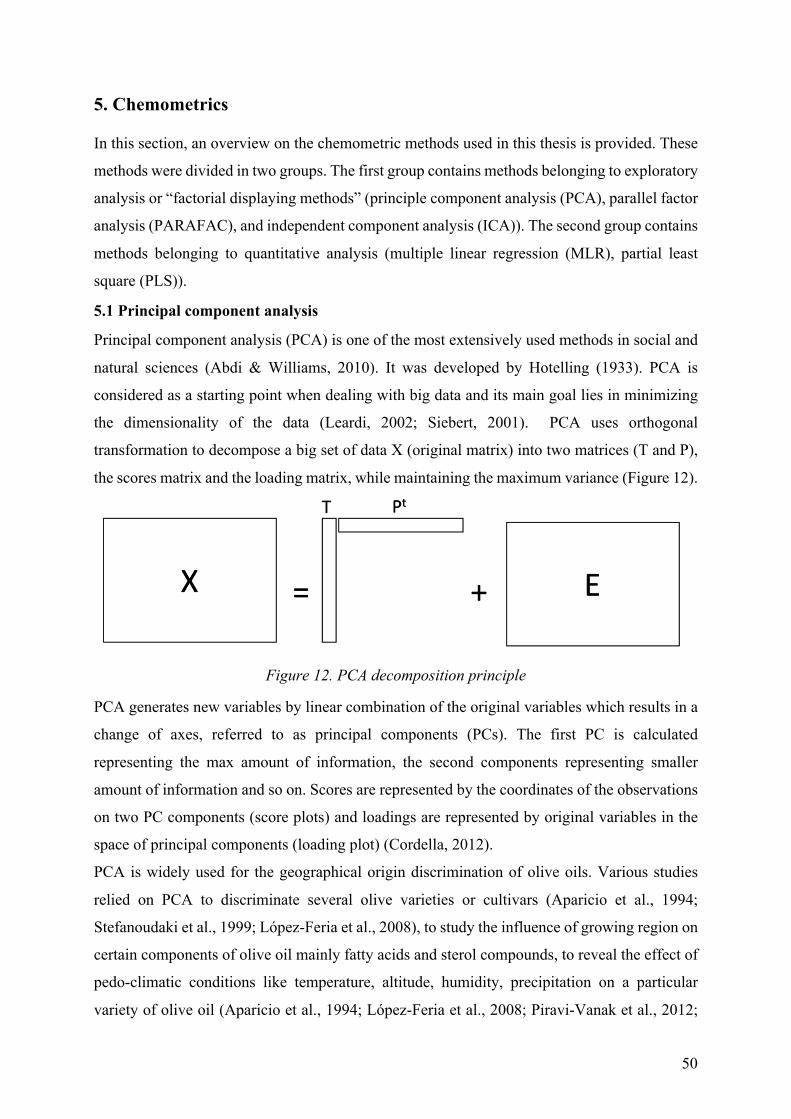
50
5. Chemometrics
In this section, an overview on the chemometric methods used in this thesis is provided. These
methods were divided in two groups. The first group contains methods belonging to exploratory
analysis or “factorial displaying methods” (principle component analysis (PCA), parallel factor
analysis (PARAFAC), and independent component analysis (ICA)). The second group contains
methods belonging to quantitative analysis (multiple linear regression (MLR), partial least
square (PLS)).
5.1 Principal component analysis
Principal component analysis (PCA) is one of the most extensively used methods in social and
natural sciences (Abdi & Williams, 2010). It was developed by Hotelling (1933). PCA is
considered as a starting point when dealing with big data and its main goal lies in minimizing
the dimensionality of the data (Leardi, 2002; Siebert, 2001). PCA uses orthogonal
transformation to decompose a big set of data X (original matrix) into two matrices (T and P),
the scores matrix and the loading matrix, while maintaining the maximum variance (Figure 12).
Figure 12. PCA decomposition principle
PCA generates new variables by linear combination of the original variables which results in a
change of axes, referred to as principal components (PCs). The first PC is calculated
representing the max amount of information, the second components representing smaller
amount of information and so on. Scores are represented by the coordinates of the observations
on two PC components (score plots) and loadings are represented by original variables in the
space of principal components (loading plot) (Cordella, 2012).
PCA is widely used for the geographical origin discrimination of olive oils. Various studies
relied on PCA to discriminate several olive varieties or cultivars (Aparicio et al., 1994;
Stefanoudaki et al., 1999; López-Feria et al., 2008), to study the influence of growing region on
certain components of olive oil mainly fatty acids and sterol compounds, to reveal the effect of
pedo-climatic conditions like temperature, altitude, humidity, precipitation on a particular
variety of olive oil (Aparicio et al., 1994; López-Feria et al., 2008; Piravi-Vanak et al., 2012;
51
Hlima et al., 2017). Other studies used PCA to analyze how several agronomic factors such as
fruit ripening, harvest time, oil content affects the micro and macro components of olive oil
(Gomez et al., 2011; Lukić et al., 2013)
All studies show that PCA is an important starting tool and is of great usefulness for the
geographical characterization of olive oil. It gives an overview on the relationship of
quantitative/qualitative olive oil’s chemical profiles and geographical origin of olives.
5.2 Parallel factor analysis
Parallel factor analysis (PARAFAC) was developed by Harshman (1970) and by Carroll and
Chang (1970) who referred to it as CANDECOMP (CANonical DECOMPosition). It is a multi-
way method used in the decomposition of 3-way data arrays. The purpose of this decomposition
tool is to facilitate the identification and quantification of the underlying signals or in another
word the “components or factors”. PARAFAC is used in diverse research fields (medical,
environmental, social, pharmaceutical and food) and applied to a wide range of data (spectral,
GC-MS, sensory, NMR, etc.…). However, its main practice lies in analyzing fluorescence
excitation emission matrices (EEMs) (Bro, 1997).
The PARAFAC model is written as:
"!"#=%&!%'"%(#% + *!"#&
%'(
Equation (1)
where:
- xijk is the intensity of the ith sample (mode 1) at the jth (mode 2) and kth variables (mode
3).
- aif is the relative concentration of compound f in sample i (on the first mode of X),
- bjf is the fth loading of variable j (estimated emission spectrum),
- ckf is the fth loading of variable k (estimated excitation spectrum),
- eijk contain the variation not accounted by the model.
- F is the number of extracted signals or components,
F is an important parameter, as determining the number of factors or PARAFAC components
is crucial to perfectly reconstruct the data. There are several ways to determine this parameter
among which the scree plot, residual investigation, cross validation, etc. Core Consistency
Diagnostic (CORCONDIA) is another interesting method, where a core array is estimated from
the PARAFAC loadings and from the data, and then compared to the ideal PARAFAC core
array (composed of 0's and 1's). If the computed core array is appropriate, another PARAFAC
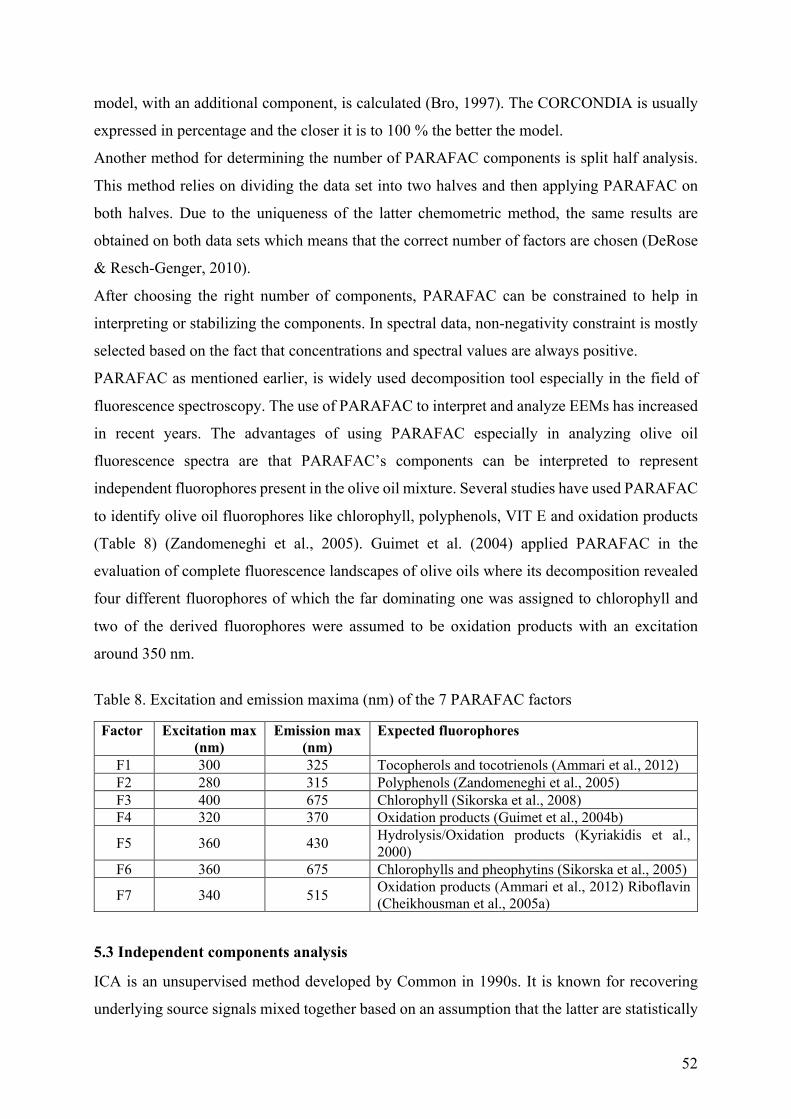
52
model, with an additional component, is calculated (Bro, 1997). The CORCONDIA is usually
expressed in percentage and the closer it is to 100 % the better the model.
Another method for determining the number of PARAFAC components is split half analysis.
This method relies on dividing the data set into two halves and then applying PARAFAC on
both halves. Due to the uniqueness of the latter chemometric method, the same results are
obtained on both data sets which means that the correct number of factors are chosen (DeRose
& Resch-Genger, 2010).
After choosing the right number of components, PARAFAC can be constrained to help in
interpreting or stabilizing the components. In spectral data, non-negativity constraint is mostly
selected based on the fact that concentrations and spectral values are always positive.
PARAFAC as mentioned earlier, is widely used decomposition tool especially in the field of
fluorescence spectroscopy. The use of PARAFAC to interpret and analyze EEMs has increased
in recent years. The advantages of using PARAFAC especially in analyzing olive oil
fluorescence spectra are that PARAFAC’s components can be interpreted to represent
independent fluorophores present in the olive oil mixture. Several studies have used PARAFAC
to identify olive oil fluorophores like chlorophyll, polyphenols, VIT E and oxidation products
(Table 8) (Zandomeneghi et al., 2005). Guimet et al. (2004) applied PARAFAC in the
evaluation of complete fluorescence landscapes of olive oils where its decomposition revealed
four different fluorophores of which the far dominating one was assigned to chlorophyll and
two of the derived fluorophores were assumed to be oxidation products with an excitation
around 350 nm.
Table 8. Excitation and emission maxima (nm) of the 7 PARAFAC factors
Factor Excitation max
(nm) Emission max
(nm) Expected fluorophores
F1 300 325 Tocopherols and tocotrienols (Ammari et al., 2012) F2 280 315 Polyphenols (Zandomeneghi et al., 2005) F3 400 675 Chlorophyll (Sikorska et al., 2008) F4 320 370 Oxidation products (Guimet et al., 2004b)
F5 360 430 Hydrolysis/Oxidation products (Kyriakidis et al.,
2000) F6 360 675 Chlorophylls and pheophytins (Sikorska et al., 2005)
F7 340 515 Oxidation products (Ammari et al., 2012) Riboflavin
(Cheikhousman et al., 2005a)
5.3 Independent components analysis
ICA is an unsupervised method developed by Common in 1990s. It is known for recovering
underlying source signals mixed together based on an assumption that the latter are statistically
53
independent In recent years, the number of applications of the ICA technique has increased
significantly (Comon, 1994). It has been applied to medical signal processing (Makeig et al.,
2002), batch process monitoring (Yoo et al., 2004), speech recognition (Brown et al., 2001;
Kim et al., 2003), fault detection (Kano et al., 2003), statistical process monitoring (Lee et al.,
2003), and spectroscopic data (Chen & Wang, 2001; Shao et al., 2004; Visser & Lee, 2004). Its
application in analytical signals has also expanded especially when it comes in analyzing
fluorescence spectroscopy (Bouveresse et al., 2007; Valderrama et al., 2011), NIR (Chen et al.,
2001; Garcia et al., 2016; Mishra et al., 2016), MIR (Visser et al., 2004), and GC/MS data (Shao
et al., 2004).
So far PCA shares the same applications as ICA. However, several differences lie between these
two factorials displaying methods:
- The interpretations of PCA loadings vector doesn’t describe physical reality and is often
more complicated than those of ICA. On the other hand, ICA loading vectors describes
statistically independent phenomenon. ICs describe a more “chemically pure” vectorial
space.
- PCA calculates principal components to describe the maximum sample dispersion
(maximum variance direction) where there not all PCA loading vectors (eigenvectors)
corresponds to the underlying signals. ICA calculates independent components (ICs)
where the variation in one pure signal is as much as possible not related to the variations
in another signal.
- PCA uses the Variance-Covariance matrix to calculate vectors, whereas ICA uses higher
order statistics (4th cumulants for JADE algorithm).
The general model of ICA is:
X = AS + E
Equation (2)
where
X: the matrix of the recorded signals,
S: the matrix of “pure” source signals,
A: the unknown mixing matrix corresponding to the “proportions” (“scores”) of source signals
in each mixture.
E: error (all remaining information not taken into account in A.S)
54
5.3 Regression
The main purpose of regression analysis is to study the relation between a dependent variable
and an independent one. The result of this regression is a linear relation equation explaining the
correlation between the involved variables and making predictions for the topic in hand.
5.3.1 Multiple linear regression
Regression models having more than one independent variable and one dependent variable are
called multiple linear regression. The most important assumptions of MLR are:
- Normal distribution,
- Linearity,
- Collinearity or no ties between the independent variables (Tabachnick et al., 2018).
The MLR model is same as the univariate analysis, however with addition of more than one
independent variables
+ = '(,) + '*,+ +⋯+ ',,- +'. + .
Equation (3)
where
y = dependent variable
ai = independent variable
b0 = intercept
bi = regression coefficient
. = error 5.3.2 Partial least squares
Partial least squares (PLS) have the same principle as MLR, however more than one dependent
variable can be included in the PLS model. It is a generalization of the above method (MLR)
(Wold et al., 2001). The algorithms for PLS was put by Herman Wold in 1982 (Wold, 1982).It
is designed to deal with multiple regression when the data has more variables than observations
or has missing values or if multicollinearity problem is present.
The goal of PLS is to predict Y from X by identification of the underlying factors that are a
linear combination of the independent variables or X (which may also be known as latent
variables) which best model the dependent variables or Y (Abdi, 2004).
Several studies have conducted MLR and PLS prediction models to show the suitability of
fluorescence in detecting the quality parameters of olive oil. For instance, Guimet et al. (2005)
studied the relation between fluorescence EEM and some quality parameters (peroxide value,
K232, and K270) of different oil qualities (13 extra virgin, 2 virgin, 16 pure and 2 pomace olive
oils). Sikorska et al. (2008) demonstrated the use of fluorescence spectroscopy for monitoring

55
the effect of light on the chlorophyll and total polyphenols content of extra virgin olive oil.
Also, Tena et al. (2012) showed the potential of EEM to study virgin olive oils thermo-oxidized
at a fixed pattern (190°C for 94 h, where a sample of 40 mL was collected every 2 h).

56
57
Chapter 2: Materials and Methods
Planning of the sampling strategy as well as preparation of oil samples, essential in the
development of the work plan, are presented in this chapter. In order to understand the behavior
of the macro-and micro-components found in olive oil, the physico-chemical parameters are
measured. The techniques for analyzing the various elements are also presented in this chapter.
1. Sampling
1.1. Olive fruit and oil sampling
About 100 samples of proposed extra-virgin olive oil and olive fruits were collected (harvesting
seasons 2016 and 2017) from the following locations:
• Mount Lebanon (Chouf) • South Lebanon (Tyre, Hasbaya, Marjaayoun, Bint Jbeil) • North Lebanon (Zgharta, Koura, Batroun, Akkar) (Figure 13)
in order to screen oil for their forensic quality characterization as an introductory step toward
geographical indication and molecular fingerprint. These included major and minor chemical
components.
During the first harvesting season, which extended from 1st of November 2016 till January
2017, farmers were interviewed, questionnaires were filled, fields and mills were assessed and
about 54 samples of olive oil were collected. In addition, interviews were conducted with the
Ministry of Agriculture regional officers of each province to have a wider prospective on the
condition of this culture.
In 2017, field visits were conducted to each of the designated regions twice. During the visit,
which extended from 2nd of October till October 29th, 2017, olive fruits were picked from two
fields within the same area. Then the fruits were transferred to LARI in Riyaak for oil extraction
using an Abencor analyzer.
Afterward, olive oil samples were collected during the second round of visits which extended
from November 12th, 2017 until January 2018. During both phases, the farmers were
interviewed, questionnaires were filled, and fields and mills were assessed.
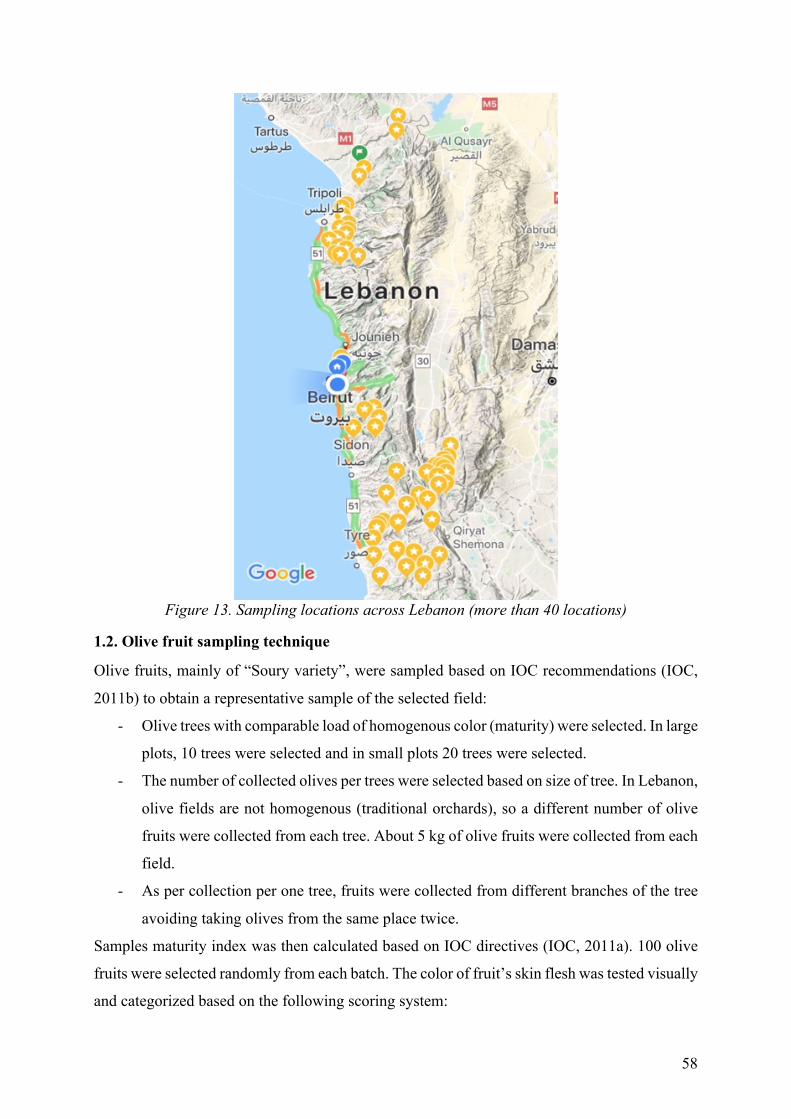
58
Figure 13. Sampling locations across Lebanon (more than 40 locations)
1.2. Olive fruit sampling technique
Olive fruits, mainly of “Soury variety”, were sampled based on IOC recommendations (IOC,
2011b) to obtain a representative sample of the selected field:
- Olive trees with comparable load of homogenous color (maturity) were selected. In large
plots, 10 trees were selected and in small plots 20 trees were selected.
- The number of collected olives per trees were selected based on size of tree. In Lebanon,
olive fields are not homogenous (traditional orchards), so a different number of olive
fruits were collected from each tree. About 5 kg of olive fruits were collected from each
field.
- As per collection per one tree, fruits were collected from different branches of the tree
avoiding taking olives from the same place twice.
Samples maturity index was then calculated based on IOC directives (IOC, 2011a). 100 olive
fruits were selected randomly from each batch. The color of fruit’s skin flesh was tested visually
and categorized based on the following scoring system:
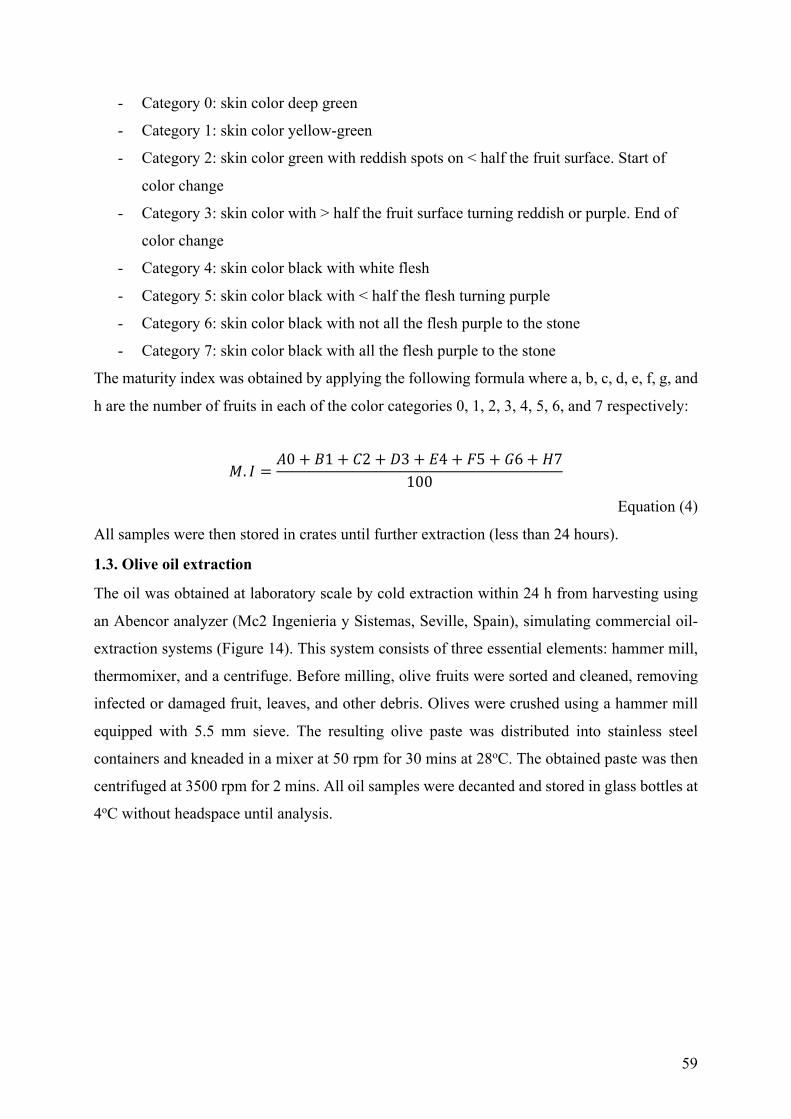
59
- Category 0: skin color deep green
- Category 1: skin color yellow-green
- Category 2: skin color green with reddish spots on < half the fruit surface. Start of
color change
- Category 3: skin color with > half the fruit surface turning reddish or purple. End of
color change
- Category 4: skin color black with white flesh
- Category 5: skin color black with < half the flesh turning purple
- Category 6: skin color black with not all the flesh purple to the stone
- Category 7: skin color black with all the flesh purple to the stone
The maturity index was obtained by applying the following formula where a, b, c, d, e, f, g, and
h are the number of fruits in each of the color categories 0, 1, 2, 3, 4, 5, 6, and 7 respectively:
2. 4 = 50 + 71 + 92 + ;3 + =4 + ?5 + A6 + C7100
Equation (4)
All samples were then stored in crates until further extraction (less than 24 hours).
1.3. Olive oil extraction
The oil was obtained at laboratory scale by cold extraction within 24 h from harvesting using
an Abencor analyzer (Mc2 Ingenieria y Sistemas, Seville, Spain), simulating commercial oil-
extraction systems (Figure 14). This system consists of three essential elements: hammer mill,
thermomixer, and a centrifuge. Before milling, olive fruits were sorted and cleaned, removing
infected or damaged fruit, leaves, and other debris. Olives were crushed using a hammer mill
equipped with 5.5 mm sieve. The resulting olive paste was distributed into stainless steel
containers and kneaded in a mixer at 50 rpm for 30 mins at 28oC. The obtained paste was then
centrifuged at 3500 rpm for 2 mins. All oil samples were decanted and stored in glass bottles at
4oC without headspace until analysis.
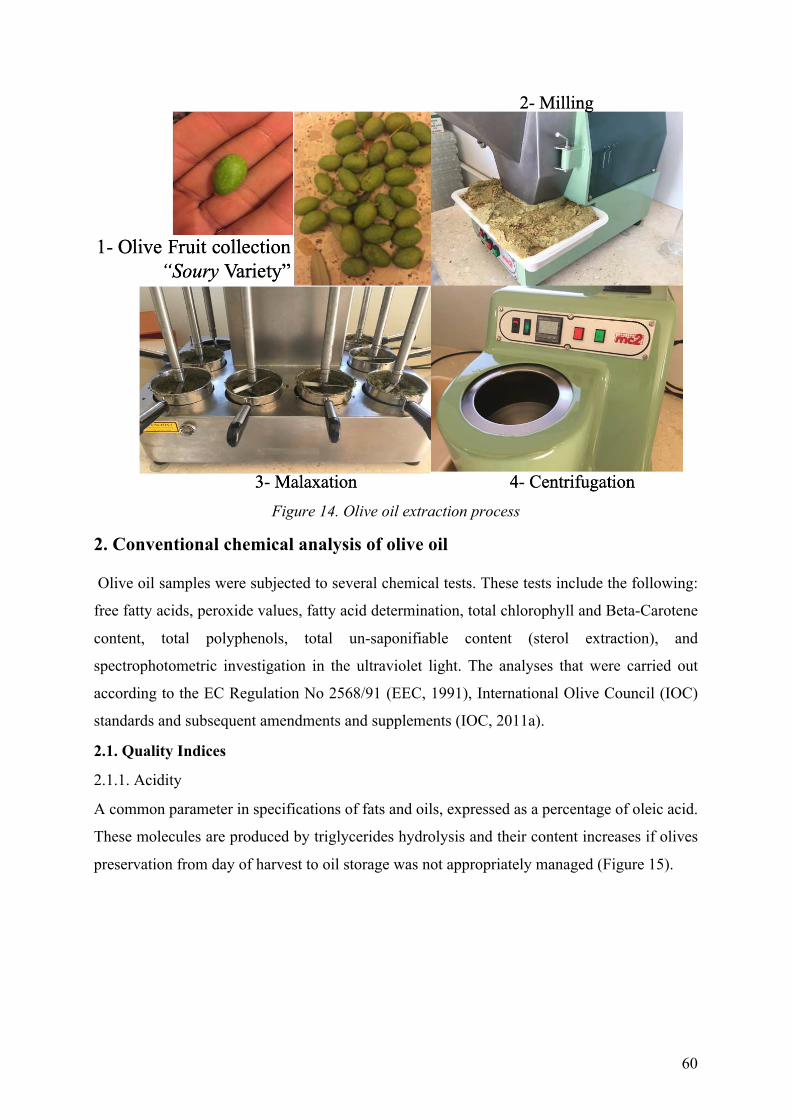
60
Figure 14. Olive oil extraction process
2. Conventional chemical analysis of olive oil
Olive oil samples were subjected to several chemical tests. These tests include the following:
free fatty acids, peroxide values, fatty acid determination, total chlorophyll and Beta-Carotene
content, total polyphenols, total un-saponifiable content (sterol extraction), and
spectrophotometric investigation in the ultraviolet light. The analyses that were carried out
according to the EC Regulation No 2568/91 (EEC, 1991), International Olive Council (IOC)
standards and subsequent amendments and supplements (IOC, 2011a).
2.1. Quality Indices
2.1.1. Acidity
A common parameter in specifications of fats and oils, expressed as a percentage of oleic acid.
These molecules are produced by triglycerides hydrolysis and their content increases if olives
preservation from day of harvest to oil storage was not appropriately managed (Figure 15).
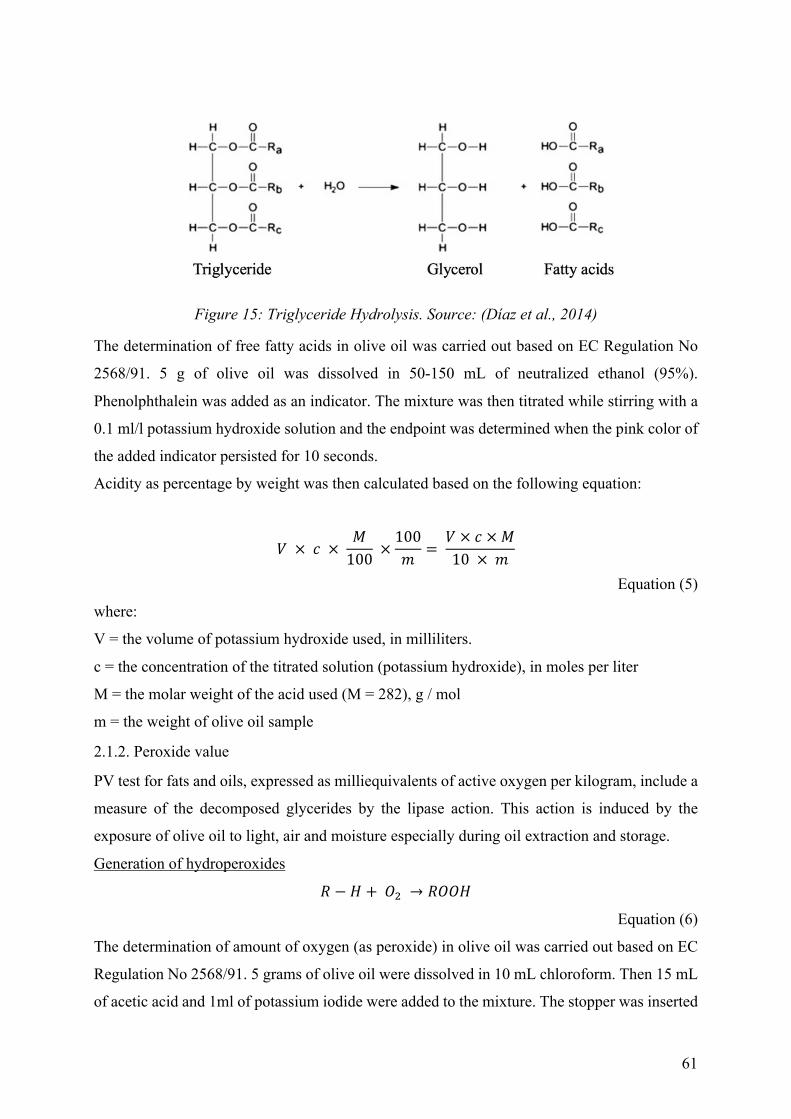
61
Figure 15: Triglyceride Hydrolysis. Source: (Díaz et al., 2014)
The determination of free fatty acids in olive oil was carried out based on EC Regulation No
2568/91. 5 g of olive oil was dissolved in 50-150 mL of neutralized ethanol (95%).
Phenolphthalein was added as an indicator. The mixture was then titrated while stirring with a
0.1 ml/l potassium hydroxide solution and the endpoint was determined when the pink color of
the added indicator persisted for 10 seconds.
Acidity as percentage by weight was then calculated based on the following equation:
E × ( × 2100× 100G =E × ( × 210 × G
Equation (5)
where:
V = the volume of potassium hydroxide used, in milliliters.
c = the concentration of the titrated solution (potassium hydroxide), in moles per liter
M = the molar weight of the acid used (M = 282), g / mol
m = the weight of olive oil sample
2.1.2. Peroxide value
PV test for fats and oils, expressed as milliequivalents of active oxygen per kilogram, include a
measure of the decomposed glycerides by the lipase action. This action is induced by the
exposure of olive oil to light, air and moisture especially during oil extraction and storage.
Generation of hydroperoxides
H − C +J* → HJJC
Equation (6)
The determination of amount of oxygen (as peroxide) in olive oil was carried out based on EC
Regulation No 2568/91. 5 grams of olive oil were dissolved in 10 mL chloroform. Then 15 mL
of acetic acid and 1ml of potassium iodide were added to the mixture. The stopper was inserted
62
as quick as possible to avoid entrance of air, and the solution was shaken for one minute and
left for five minutes away from light at a temperature between 15 to 25 oC.
After 5 mins, 75 mL of distilled water is added, and the liberated iodine was titrated with 0.002
N sodium thiosulfate solution using starch as an indicator. Titration was done in artificial light
avoiding direct sunlight.
Generation of iodine
L4 +9C/9JJC → C4 +9C/9JJ0L1
HJJC + 2C4 → HJC +4* + MN&O(ℎQRSQ(&NTO
Equation (7)
Titration
4*(VWOVX*) + 2Z&*[*J/ + 2Z&X((TXTWOX*MM) Equation (8)
PV was calculated using the following equation:
\E = E × ] × 1000G
Equation (9)
where:
V is the volume of sodium thiosulphate solution in mL
T = the normality of sodium thiosulphate solution
m = the weight of olive oil sample.
2.1.3. UV spectrophotometric investigation
This kind of examination in the UV wavelength range provide information on the quality of fat
present in olive oil especially those related to the presence of diene and triene conjugated fatty
acids. These kinds of fatty acids if present in virgin olive oil are the results of oxidation or
refining processes and can be detected by light absorption at specified wavelengths. These
absorptions are expressed by K also referred to as extinction coefficients.
Spectrophotometric determinations were carried out based on IOC Regulation COI/T.20/Doc.
No 19/Rev. 3 and were made using a UV spectrophotometer (Hitachi U-2900,
Spectrophotometer, Japan). 0.25 g of olive oil was dissolved in 25 mL cyclohexane in a
graduated cylinder for absorbance measurements at 268 nm and 270 nm whereas 0.05 g of olive
oil diluted in 25 mL cyclohexane for absorbance measurements at 232 nm. In both
measurements, the solution was homogenized properly. Before introducing the sample into the
UV spectrophotometer, the baseline (220-290 nm) was corrected with solvent (cyclohexane) in
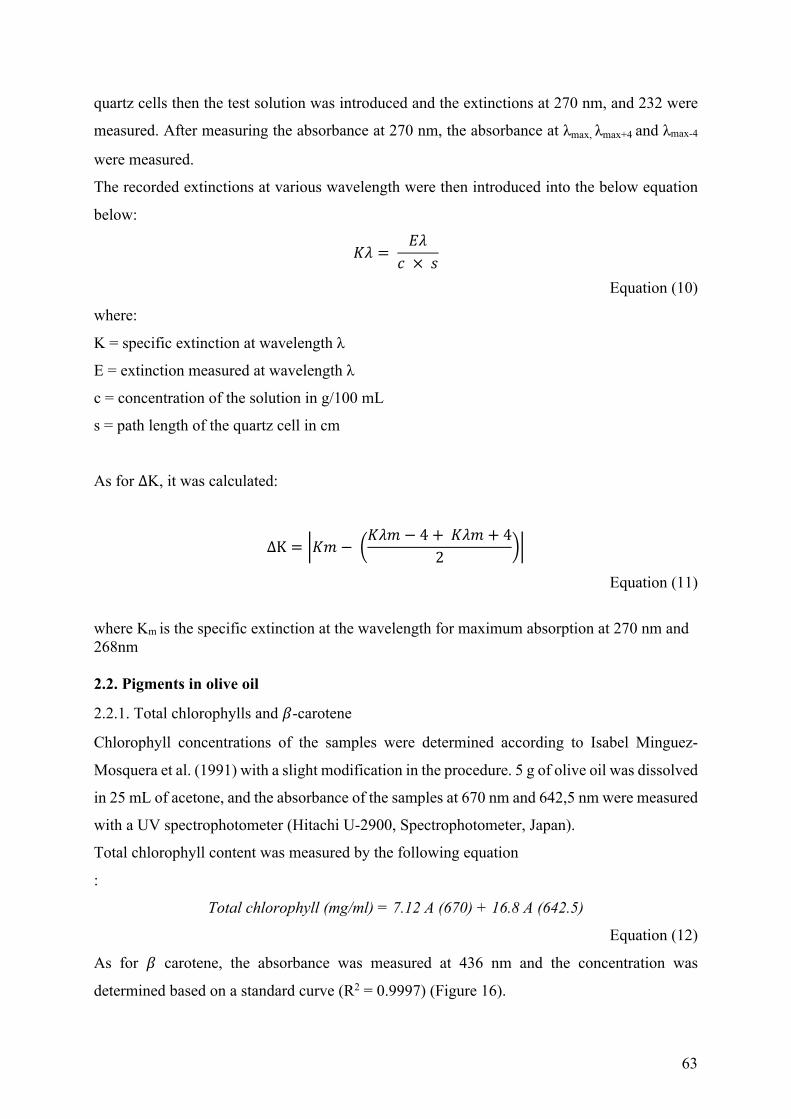
63
quartz cells then the test solution was introduced and the extinctions at 270 nm, and 232 were
measured. After measuring the absorbance at 270 nm, the absorbance at λmax, λmax+4 and λmax-4
were measured.
The recorded extinctions at various wavelength were then introduced into the below equation
below:
L^ = =^( × M
Equation (10)
where:
K = specific extinction at wavelength λ
E = extinction measured at wavelength λ
c = concentration of the solution in g/100 mL
s = path length of the quartz cell in cm
As for ∆K, it was calculated:
∆K = `LG −aL^G − 4 + L^G + 42 b` Equation (11)
where Km is the specific extinction at the wavelength for maximum absorption at 270 nm and 268nm
2.2. Pigments in olive oil
2.2.1. Total chlorophylls and c-carotene
Chlorophyll concentrations of the samples were determined according to Isabel Minguez-
Mosquera et al. (1991) with a slight modification in the procedure. 5 g of olive oil was dissolved
in 25 mL of acetone, and the absorbance of the samples at 670 nm and 642,5 nm were measured
with a UV spectrophotometer (Hitachi U-2900, Spectrophotometer, Japan).
Total chlorophyll content was measured by the following equation
:
Total chlorophyll (mg/ml) = 7.12 A (670) + 16.8 A (642.5)
Equation (12)
As for c carotene, the absorbance was measured at 436 nm and the concentration was
determined based on a standard curve (R2 = 0.9997) (Figure 16).
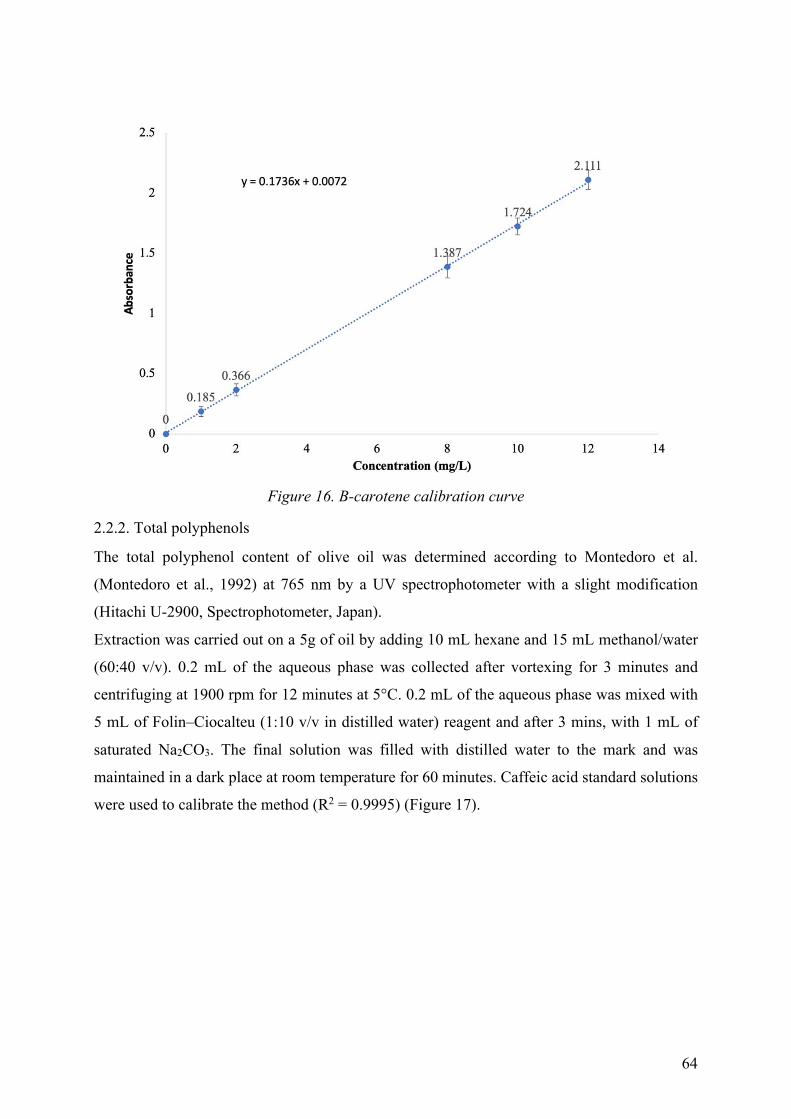
64
Figure 16. B-carotene calibration curve
2.2.2. Total polyphenols
The total polyphenol content of olive oil was determined according to Montedoro et al.
(Montedoro et al., 1992) at 765 nm by a UV spectrophotometer with a slight modification
(Hitachi U-2900, Spectrophotometer, Japan).
Extraction was carried out on a 5g of oil by adding 10 mL hexane and 15 mL methanol/water
(60:40 v/v). 0.2 mL of the aqueous phase was collected after vortexing for 3 minutes and
centrifuging at 1900 rpm for 12 minutes at 5°C. 0.2 mL of the aqueous phase was mixed with
5 mL of Folin–Ciocalteu (1:10 v/v in distilled water) reagent and after 3 mins, with 1 mL of
saturated Na2CO3. The final solution was filled with distilled water to the mark and was
maintained in a dark place at room temperature for 60 minutes. Caffeic acid standard solutions
were used to calibrate the method (R2 = 0.9995) (Figure 17).
65
Figure 17. Total polyphenol calibration curve
2.3. Fatty acids analysis
The fatty acid methyl esters (FAME) of olive oil were extracted according to the International
Olive Council (IOC) method COI/T.20/Doc. No 33 (IOC, 2017) and EC Regulation No
2568/91. The FAME was prepared according to Part I and Part II of this method.
2.3.1. Preparation of the fatty acid methyl esters from olive oil (acid value ≤ 2.0 %)
0.1 g of olive oil was added to a 5 mL screw-top test tube. 2 mL of heptane were then added to
the test tube and the latter was shaken using a vortex.0.2 mL of the methanolic potassium
hydroxide solution was then added, the cap fitted with a PTFE joint was put on, tightened, and
shaken vigorously for 30 seconds. The solution was left to stratify until the upper solution
becomes clear. The upper layer containing the methyl esters was decanted and the heptane
solution was ready for injection into the gas chromatograph.
The solution was kept in the refrigerator until gas chromatographic analysis not exceeding the
12 hours limit.
2.3.2. Preparation of the fatty acid methyl esters from olive oil (acid value > 2.0 %)
2g of olive oil was placed in a 100 mL flask. 35 mL of methanol was added, and the condenser
was placed in a water bath for few minutes.
The condenser was then removed, and 3.5 mL of sodium methylate solution were added, and
the condenser was refitted and boiling under reflux was initiated for 3 hours. The methylation
66
process was stopped when all fatty substances were liquified and the mixture looked perfectly
clear at room temperature.
The mixture was then transferred to 250 mL separating funnel. 30 mL of diethyl ether, 100 mL
of water and 5 mL of 10 % sodium chloride solution were added to the mixture. The separating
funnel was shaken and left for few minutes for layers formation. The resulting aqueous solution
was transferred to a second separating funnel and 25 mL of diethyl ether was added for a second
extraction.
Water present in the aqueous solution was then removed by adding 50 mL of 40 to 60 oC
petroleum ether. The resulting ether phase was then washed three times with 15 mL of distilled
water, then dried on sodium sulphate and filtered using a filter paper. The filtrate was collected
in 200 mL flask. The solvent was then evaporated to 20 mL under current of nitrogen.
2.3.3. Analysis of FAME by GC-FID
Gas chromatography (GC) is a commonly used in analytical chemistry for separating and
analyzing compounds that can be vaporized without changing or decomposing the analyte
chemical’s composition.
The mobile and the stationary phases constitute the core of gas chromatography. The carrier gas
(mobile phase), usually is an inert gas such as helium or hydrogen. The stationary phase is
composed of a minute layer of liquid or polymer on a solid support, presented inside a piece of
glass or metal tubing called a column.
The gaseous compounds to be analyzed interact with the stationary phase. This causes each
compound to elute at a different time, known as the retention time. The comparison of retention
times of the different compounds is what gives GC its analytical importance.
GC is mostly used in testing the purity or separating the different components of a mixture and
in some situations, it may help in identifying a compound.
A gas chromatograph Shimadzu GC-2025 (Kyoto, Japan) equipped with a capillary column SP-
2380 (30 m × 0.32 mm i.d. x 0.20 μm film thickness; Supelco, Bellefonte, PA, USA) and a
flame ionization detector was used for the determination of fatty acid profile. Helium was
employed as the carrier gas at a flow rate of 1 mL/min. Injector and detector temperatures were
held at 230°C and 240°C, respectively. The injection volume into a split GC port was 1 μL, and
a split injection mode (1/100) was used. The following oven temperature program was used:
initial temperature 165°C held for 10 min; ramped at 1.5°C min−1 up to 200°C. Fatty acids were
identified by comparing the retention time of experimental peaks with those obtained by the
external standard mixture.
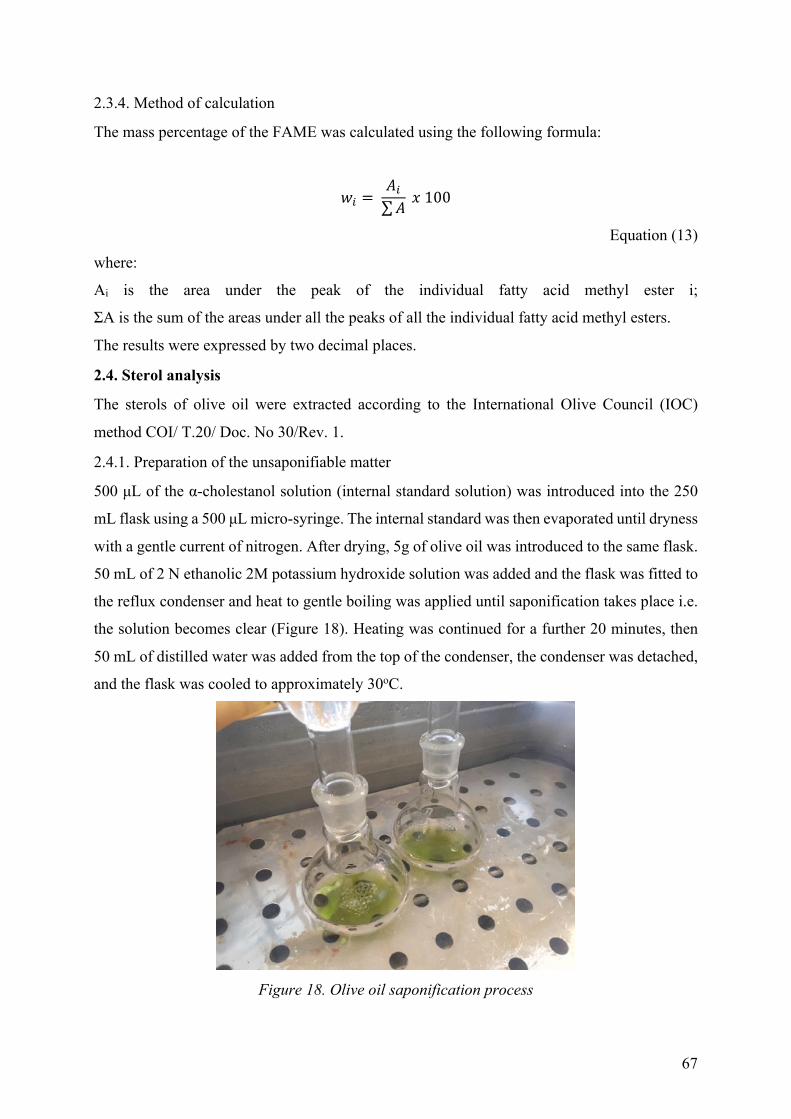
67
2.3.4. Method of calculation
The mass percentage of the FAME was calculated using the following formula:
d! = 5!∑5 "100
Equation (13)
where:
Ai is the area under the peak of the individual fatty acid methyl ester i;
ΣA is the sum of the areas under all the peaks of all the individual fatty acid methyl esters.
The results were expressed by two decimal places.
2.4. Sterol analysis
The sterols of olive oil were extracted according to the International Olive Council (IOC)
method COI/ T.20/ Doc. No 30/Rev. 1.
2.4.1. Preparation of the unsaponifiable matter
500 μL of the α-cholestanol solution (internal standard solution) was introduced into the 250
mL flask using a 500 μL micro-syringe. The internal standard was then evaporated until dryness
with a gentle current of nitrogen. After drying, 5g of olive oil was introduced to the same flask.
50 mL of 2 N ethanolic 2M potassium hydroxide solution was added and the flask was fitted to
the reflux condenser and heat to gentle boiling was applied until saponification takes place i.e.
the solution becomes clear (Figure 18). Heating was continued for a further 20 minutes, then
50 mL of distilled water was added from the top of the condenser, the condenser was detached,
and the flask was cooled to approximately 30oC.
Figure 18. Olive oil saponification process
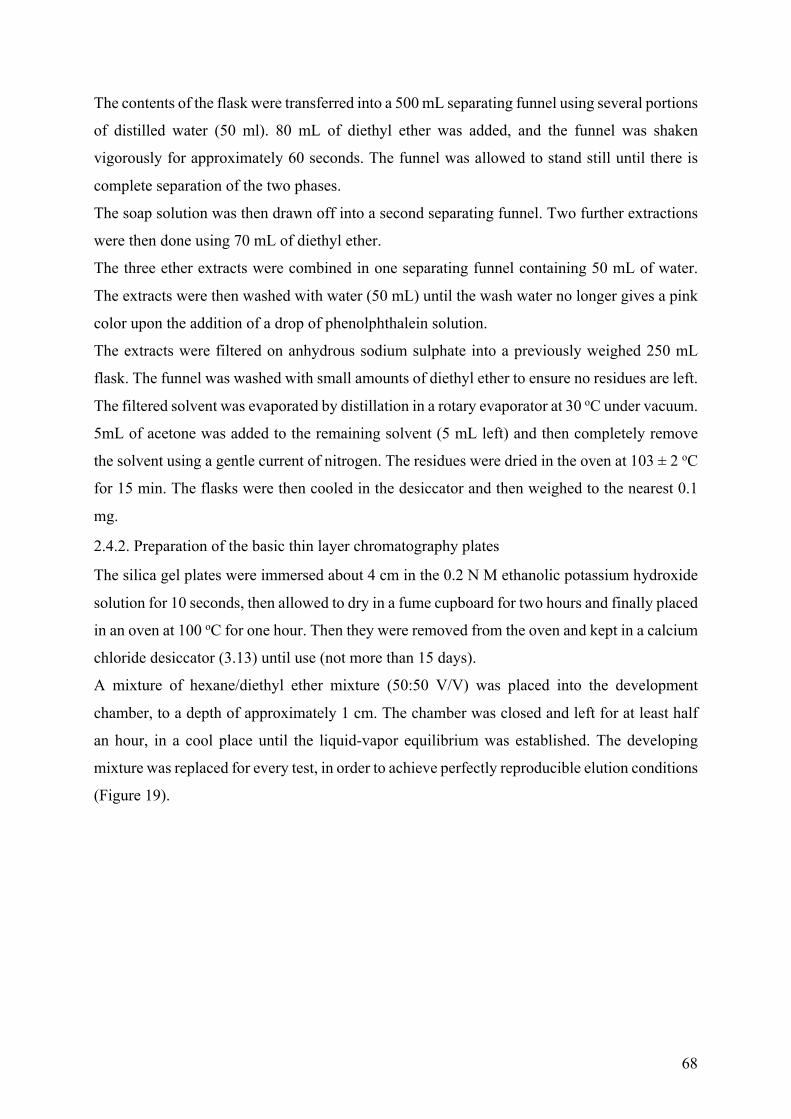
68
The contents of the flask were transferred into a 500 mL separating funnel using several portions
of distilled water (50 ml). 80 mL of diethyl ether was added, and the funnel was shaken
vigorously for approximately 60 seconds. The funnel was allowed to stand still until there is
complete separation of the two phases.
The soap solution was then drawn off into a second separating funnel. Two further extractions
were then done using 70 mL of diethyl ether.
The three ether extracts were combined in one separating funnel containing 50 mL of water.
The extracts were then washed with water (50 mL) until the wash water no longer gives a pink
color upon the addition of a drop of phenolphthalein solution.
The extracts were filtered on anhydrous sodium sulphate into a previously weighed 250 mL
flask. The funnel was washed with small amounts of diethyl ether to ensure no residues are left.
The filtered solvent was evaporated by distillation in a rotary evaporator at 30 oC under vacuum.
5mL of acetone was added to the remaining solvent (5 mL left) and then completely remove
the solvent using a gentle current of nitrogen. The residues were dried in the oven at 103 ± 2 oC
for 15 min. The flasks were then cooled in the desiccator and then weighed to the nearest 0.1
mg.
2.4.2. Preparation of the basic thin layer chromatography plates
The silica gel plates were immersed about 4 cm in the 0.2 N M ethanolic potassium hydroxide
solution for 10 seconds, then allowed to dry in a fume cupboard for two hours and finally placed
in an oven at 100 oC for one hour. Then they were removed from the oven and kept in a calcium
chloride desiccator (3.13) until use (not more than 15 days).
A mixture of hexane/diethyl ether mixture (50:50 V/V) was placed into the development
chamber, to a depth of approximately 1 cm. The chamber was closed and left for at least half
an hour, in a cool place until the liquid-vapor equilibrium was established. The developing
mixture was replaced for every test, in order to achieve perfectly reproducible elution conditions
(Figure 19).
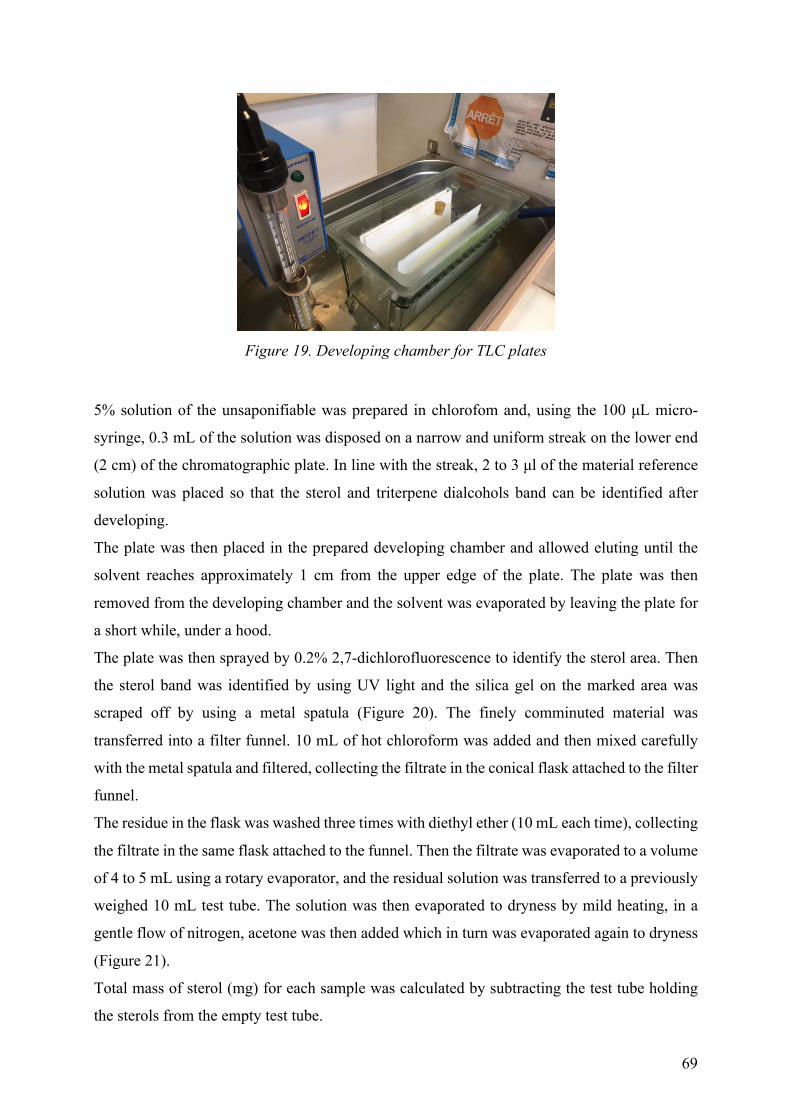
69
Figure 19. Developing chamber for TLC plates
5% solution of the unsaponifiable was prepared in chlorofom and, using the 100 μL micro-
syringe, 0.3 mL of the solution was disposed on a narrow and uniform streak on the lower end
(2 cm) of the chromatographic plate. In line with the streak, 2 to 3 μl of the material reference
solution was placed so that the sterol and triterpene dialcohols band can be identified after
developing.
The plate was then placed in the prepared developing chamber and allowed eluting until the
solvent reaches approximately 1 cm from the upper edge of the plate. The plate was then
removed from the developing chamber and the solvent was evaporated by leaving the plate for
a short while, under a hood.
The plate was then sprayed by 0.2% 2,7-dichlorofluorescence to identify the sterol area. Then
the sterol band was identified by using UV light and the silica gel on the marked area was
scraped off by using a metal spatula (Figure 20). The finely comminuted material was
transferred into a filter funnel. 10 mL of hot chloroform was added and then mixed carefully
with the metal spatula and filtered, collecting the filtrate in the conical flask attached to the filter
funnel.
The residue in the flask was washed three times with diethyl ether (10 mL each time), collecting
the filtrate in the same flask attached to the funnel. Then the filtrate was evaporated to a volume
of 4 to 5 mL using a rotary evaporator, and the residual solution was transferred to a previously
weighed 10 mL test tube. The solution was then evaporated to dryness by mild heating, in a
gentle flow of nitrogen, acetone was then added which in turn was evaporated again to dryness
(Figure 21).
Total mass of sterol (mg) for each sample was calculated by subtracting the test tube holding
the sterols from the empty test tube.
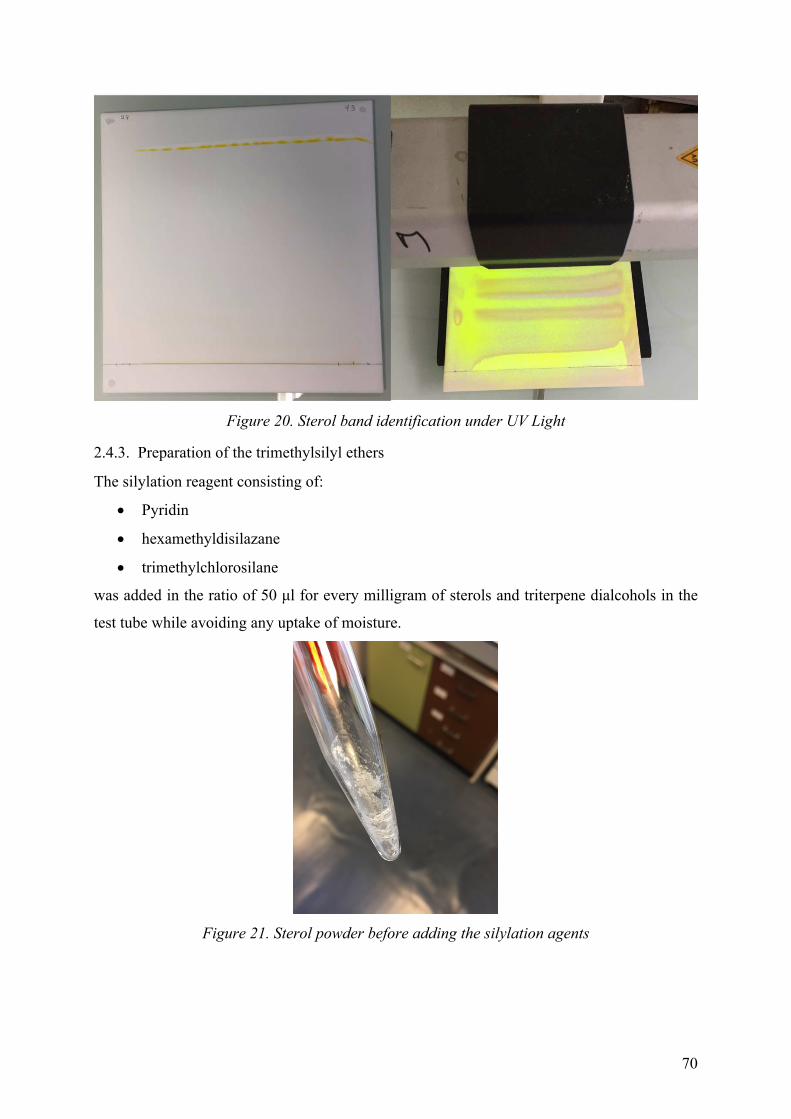
70
Figure 20. Sterol band identification under UV Light
2.4.3. Preparation of the trimethylsilyl ethers
The silylation reagent consisting of:
• Pyridin
• hexamethyldisilazane
• trimethylchlorosilane
was added in the ratio of 50 μl for every milligram of sterols and triterpene dialcohols in the
test tube while avoiding any uptake of moisture.
Figure 21. Sterol powder before adding the silylation agents
71
The test tube was closed and shaken carefully (without overturning) until the compounds are
completely dissolved. Then it was left to stand for at least 15 minutes at ambient temperature
and then centrifuged for few minutes. Then the clear solution was injected in the GC-MS.
2.4.4. Sterol analysis by GC-MS
Sterols analysis was conducted using ITQ 900 GC-MS (Trace 1310 GC, Thermo Scientific,
USA) system with quadrupole ion trap mass analyzer supplied with split/splitless injection and
autosampler (Thermo Scientific AI/AS 1310).
A DB-5 MS fused-silica capillary column (5% phenyl–95% methyl polysiloxane), (30 m x 0.25
mm x 0.25 um, Agilent Technologies, USA), was chosen for testing of the different sterol
samples.
After column condition, several chromatographic and mass spectrometer conditions trials were
conducted to find the best peak resolution and method sensitivity. The best separation was
attained under the following GC-MS conditions. Helium carrier gas was used at a flowrate of
1.2 ml/min. The oven temperature was initially set at 100 oC for 2 mins, then gradually raised
to 267 oC at 40 oC min1 rate and held for 40 mins. Injection was spitless at 280 oC. The ion
source temperature was set at 230 oC and the transfer line was at 290 oC. No calibration ranges
were needed as all samples have an internal standard (α-cholestanol). Sterols were identified by
comparing the retention time of the obtained peaks with the retention time of IOC reference
peaks (similar experimental conditions were executed).
2.4.5. Method of calculation
The areas of the α-cholestanol and the sterol and triterpene dialcohols peaks were calculated
using Xcalibur software (ThermoFisher, USA).
The concentration of each individual sterol (mg/kg) was calculated as follows:
" = 52 . G3. 100053. G
Equation (14)
where:
Ax = peak area for sterol x
As = area of the α-cholestanol peak.
ms = mass of added α-cholestanol, in milligrams;
m = mass of the sample used for determination, in grams.
The percentage of each individual sterol (%) was calculated as follows:
72
MN*OTX" = 52∑5
Equation (15)
where:
Ax = peak area for x;
ΣA = total peak area for sterols
As for the percentage of erythrodiol and uvaol, it was calculated as follows:
=OfNℎOTSQTX + gh&TX = =O. +gh.=O. +gh.+∑5 "100
Equation (16)
where:
ΣA = sum area for sterol
Er = area of Erythrodiol
Uv = area of Uvaol
The results for individual sterols and that of erythrodiol and uvaol were expressed by one
decimal point. As for total sterol concentration it was expressed without any decimal point.
3. Rapid techniques for olive oil analysis
3.1. 3D front-face fluorescence spectroscopy
3D front-face spectra were measured directly on the olive oil samples without prior preparation
using a fluorescence spectrophotometer (Hitachi, F-7000 FL, 2240-001) equipped with a xenon
lamp, excitation and emission monochromators and a front-face cell holder. Measurements
were carried out on the samples filled in quartz cuvettes. As for the front-face angle, it was set
at 56 oC. This angle maximize signal to noise ratio and overcome the drawbacks of right-angle
fluorescence spectroscopy especially when using highly viscous samples such as olive oil. The
excitation wavelengths ranged from 280 to 540 nm and emission wavelengths from 280 to 700
nm, with 20 and 5 nm intervals in excitation and emission acquisitions respectively.
Excitation and emission monochromator slit widths were set at 4 nm and the scan rate was 240
nm.min-1. The photomultiplier (PMT) detector voltage of 350 V was used. All samples were
analyzed in duplicates on two different sides of the cuvette. The excitation-emission matrices
(EEMs) were placed in a in a 3-way cubic array with the sample in the first mode [96 x 14 x
85] x 2 duplicates.
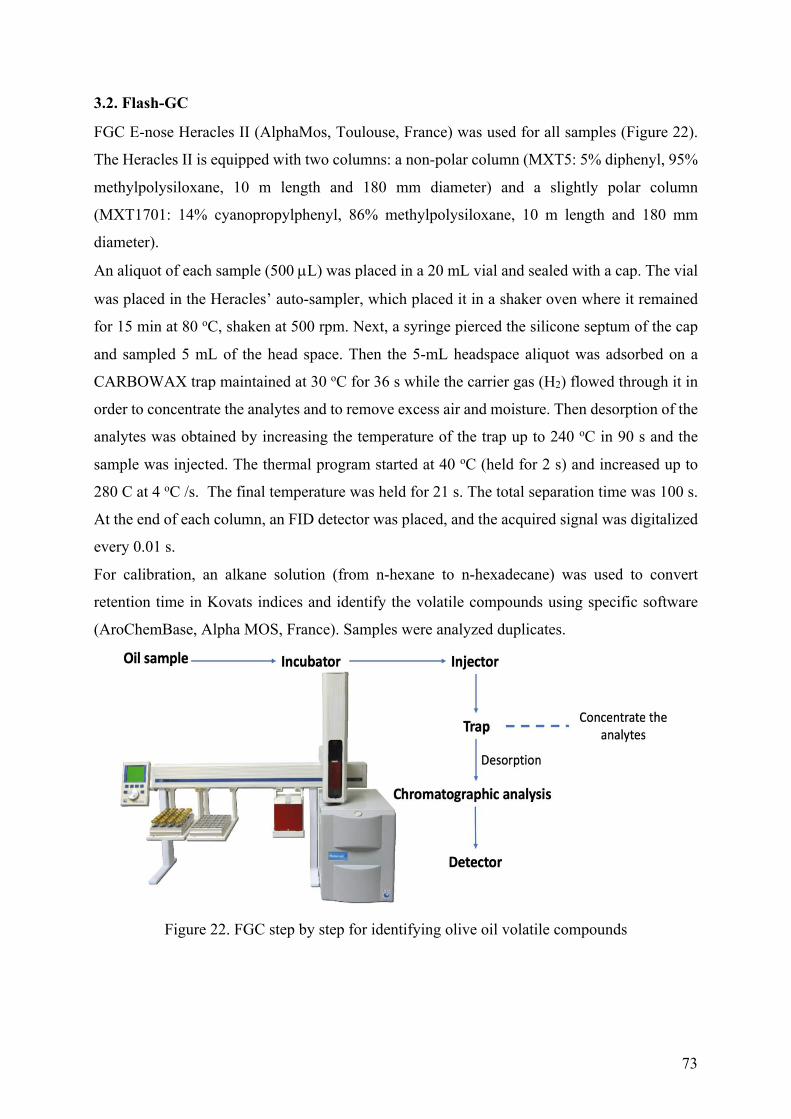
73
3.2. Flash-GC
FGC E-nose Heracles II (AlphaMos, Toulouse, France) was used for all samples (Figure 22).
The Heracles II is equipped with two columns: a non-polar column (MXT5: 5% diphenyl, 95%
methylpolysiloxane, 10 m length and 180 mm diameter) and a slightly polar column
(MXT1701: 14% cyanopropylphenyl, 86% methylpolysiloxane, 10 m length and 180 mm
diameter).
An aliquot of each sample (500 µL) was placed in a 20 mL vial and sealed with a cap. The vial
was placed in the Heracles’ auto-sampler, which placed it in a shaker oven where it remained
for 15 min at 80 oC, shaken at 500 rpm. Next, a syringe pierced the silicone septum of the cap
and sampled 5 mL of the head space. Then the 5-mL headspace aliquot was adsorbed on a
CARBOWAX trap maintained at 30 oC for 36 s while the carrier gas (H2) flowed through it in
order to concentrate the analytes and to remove excess air and moisture. Then desorption of the
analytes was obtained by increasing the temperature of the trap up to 240 oC in 90 s and the
sample was injected. The thermal program started at 40 oC (held for 2 s) and increased up to
280 C at 4 oC /s. The final temperature was held for 21 s. The total separation time was 100 s.
At the end of each column, an FID detector was placed, and the acquired signal was digitalized
every 0.01 s.
For calibration, an alkane solution (from n-hexane to n-hexadecane) was used to convert
retention time in Kovats indices and identify the volatile compounds using specific software
(AroChemBase, Alpha MOS, France). Samples were analyzed duplicates.
Figure 22. FGC step by step for identifying olive oil volatile compounds
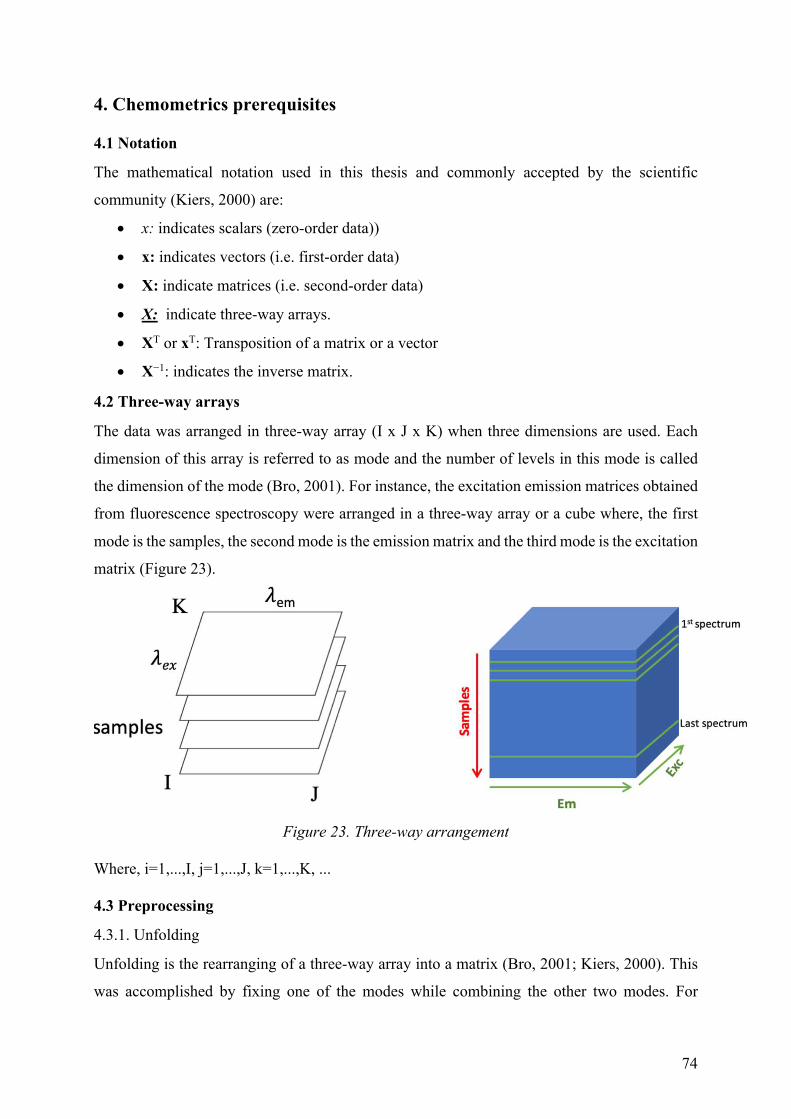
74
4. Chemometrics prerequisites
4.1 Notation
The mathematical notation used in this thesis and commonly accepted by the scientific
community (Kiers, 2000) are:
• x: indicates scalars (zero-order data))
• x: indicates vectors (i.e. first-order data)
• X: indicate matrices (i.e. second-order data)
• X: indicate three-way arrays.
• XT or xT: Transposition of a matrix or a vector
• X−1: indicates the inverse matrix.
4.2 Three-way arrays
The data was arranged in three-way array (I x J x K) when three dimensions are used. Each
dimension of this array is referred to as mode and the number of levels in this mode is called
the dimension of the mode (Bro, 2001). For instance, the excitation emission matrices obtained
from fluorescence spectroscopy were arranged in a three-way array or a cube where, the first
mode is the samples, the second mode is the emission matrix and the third mode is the excitation
matrix (Figure 23).
Figure 23. Three-way arrangement
Where, i=1,...,I, j=1,...,J, k=1,...,K, ...
4.3 Preprocessing
4.3.1. Unfolding
Unfolding is the rearranging of a three-way array into a matrix (Bro, 2001; Kiers, 2000). This
was accomplished by fixing one of the modes while combining the other two modes. For
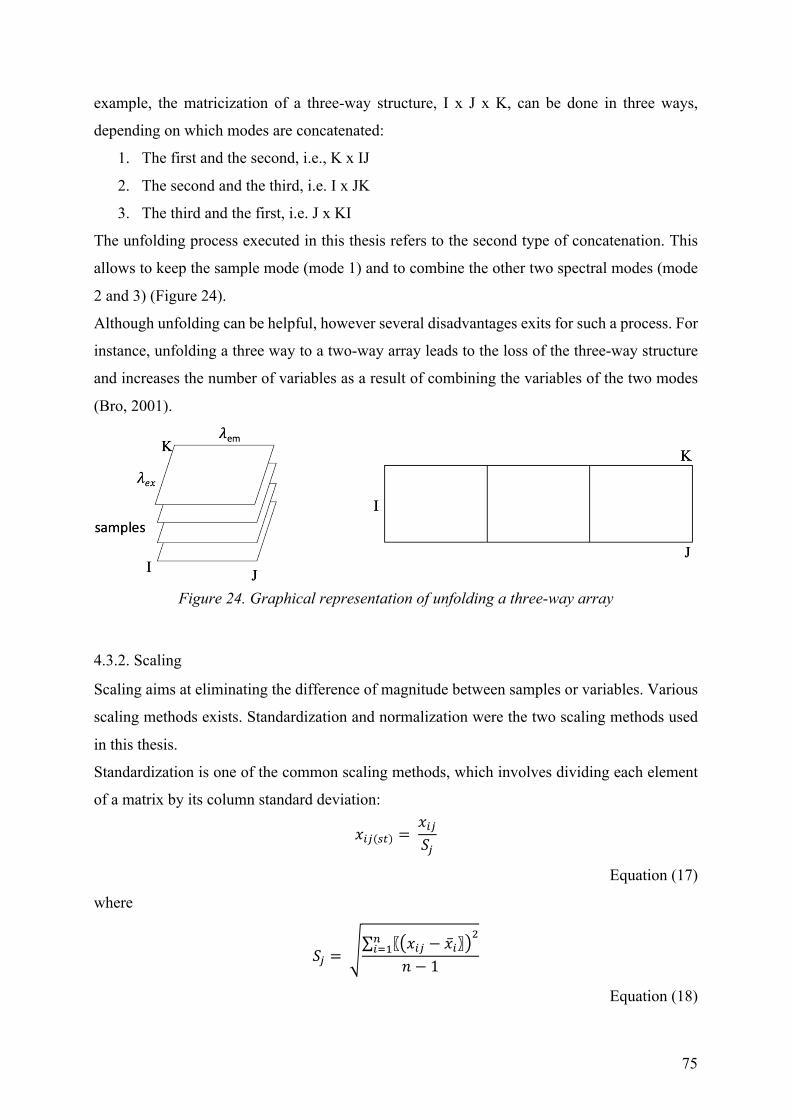
75
example, the matricization of a three-way structure, I x J x K, can be done in three ways,
depending on which modes are concatenated:
1. The first and the second, i.e., K x IJ
2. The second and the third, i.e. I x JK
3. The third and the first, i.e. J x KI
The unfolding process executed in this thesis refers to the second type of concatenation. This
allows to keep the sample mode (mode 1) and to combine the other two spectral modes (mode
2 and 3) (Figure 24).
Although unfolding can be helpful, however several disadvantages exits for such a process. For
instance, unfolding a three way to a two-way array leads to the loss of the three-way structure
and increases the number of variables as a result of combining the variables of the two modes
(Bro, 2001).
Figure 24. Graphical representation of unfolding a three-way array
4.3.2. Scaling
Scaling aims at eliminating the difference of magnitude between samples or variables. Various
scaling methods exists. Standardization and normalization were the two scaling methods used
in this thesis.
Standardization is one of the common scaling methods, which involves dividing each element
of a matrix by its column standard deviation:
"!"(35) ="!"["
Equation (17)
where
[" =i∑ 〖k"!" − "!〗n*7!'( R − 1
Equation (18)
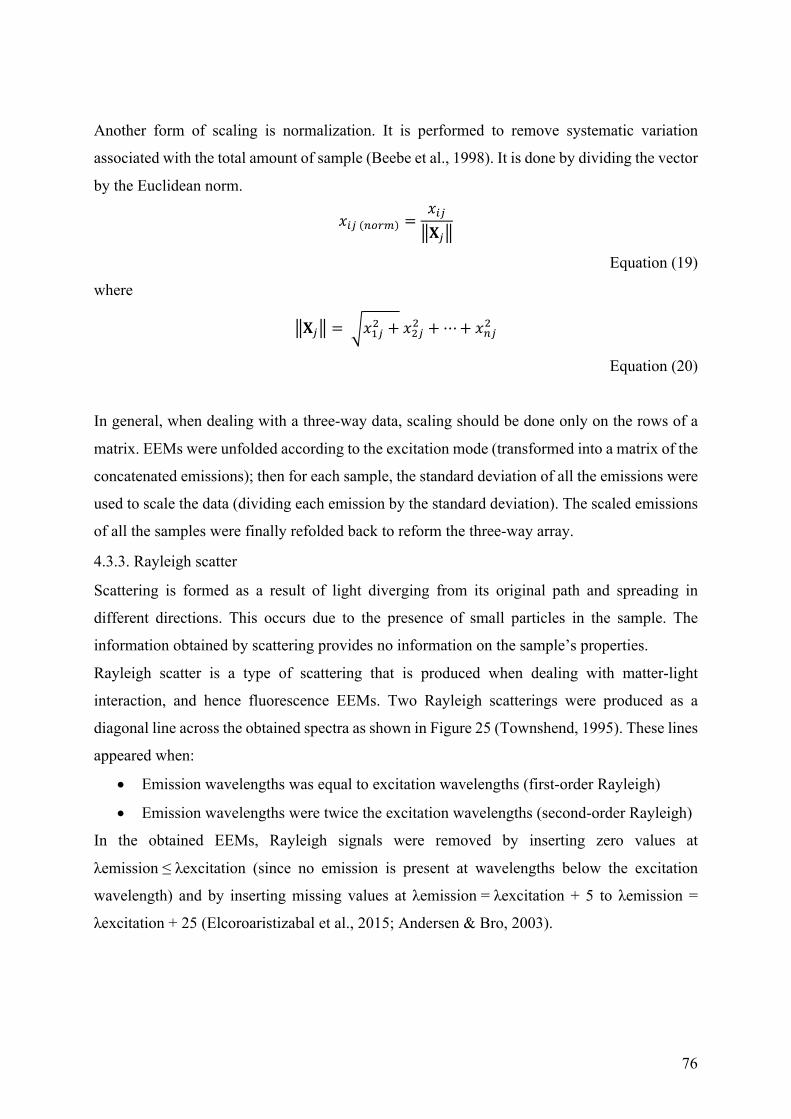
76
Another form of scaling is normalization. It is performed to remove systematic variation
associated with the total amount of sample (Beebe et al., 1998). It is done by dividing the vector
by the Euclidean norm.
"!"(789:) = "!"op"o
Equation (19)
where
op"o = q"("* + "*"* +⋯+ "7"*
Equation (20)
In general, when dealing with a three-way data, scaling should be done only on the rows of a
matrix. EEMs were unfolded according to the excitation mode (transformed into a matrix of the
concatenated emissions); then for each sample, the standard deviation of all the emissions were
used to scale the data (dividing each emission by the standard deviation). The scaled emissions
of all the samples were finally refolded back to reform the three-way array.
4.3.3. Rayleigh scatter
Scattering is formed as a result of light diverging from its original path and spreading in
different directions. This occurs due to the presence of small particles in the sample. The
information obtained by scattering provides no information on the sample’s properties.
Rayleigh scatter is a type of scattering that is produced when dealing with matter-light
interaction, and hence fluorescence EEMs. Two Rayleigh scatterings were produced as a
diagonal line across the obtained spectra as shown in Figure 25 (Townshend, 1995). These lines
appeared when:
• Emission wavelengths was equal to excitation wavelengths (first-order Rayleigh)
• Emission wavelengths were twice the excitation wavelengths (second-order Rayleigh)
In the obtained EEMs, Rayleigh signals were removed by inserting zero values at
λemission ≤ λexcitation (since no emission is present at wavelengths below the excitation
wavelength) and by inserting missing values at λemission = λexcitation + 5 to λemission =
λexcitation + 25 (Elcoroaristizabal et al., 2015; Andersen & Bro, 2003).
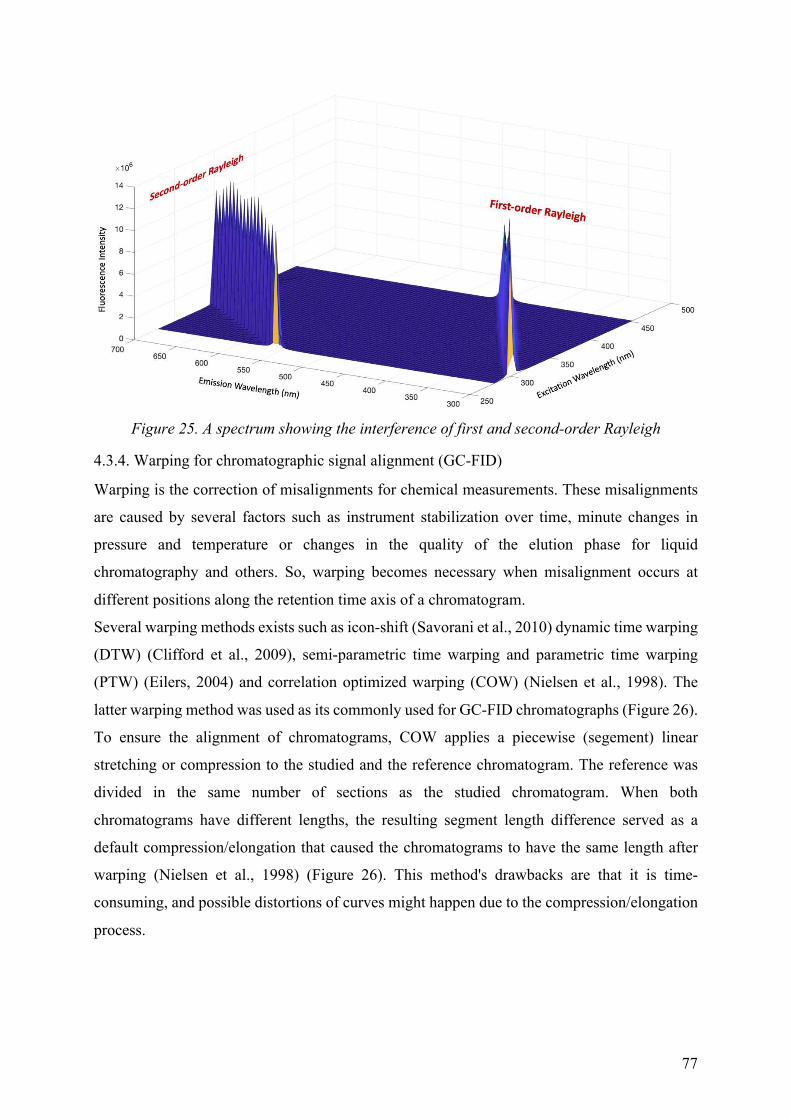
77
Figure 25. A spectrum showing the interference of first and second-order Rayleigh
4.3.4. Warping for chromatographic signal alignment (GC-FID)
Warping is the correction of misalignments for chemical measurements. These misalignments
are caused by several factors such as instrument stabilization over time, minute changes in
pressure and temperature or changes in the quality of the elution phase for liquid
chromatography and others. So, warping becomes necessary when misalignment occurs at
different positions along the retention time axis of a chromatogram.
Several warping methods exists such as icon-shift (Savorani et al., 2010) dynamic time warping
(DTW) (Clifford et al., 2009), semi-parametric time warping and parametric time warping
(PTW) (Eilers, 2004) and correlation optimized warping (COW) (Nielsen et al., 1998). The
latter warping method was used as its commonly used for GC-FID chromatographs (Figure 26).
To ensure the alignment of chromatograms, COW applies a piecewise (segement) linear
stretching or compression to the studied and the reference chromatogram. The reference was
divided in the same number of sections as the studied chromatogram. When both
chromatograms have different lengths, the resulting segment length difference served as a
default compression/elongation that caused the chromatograms to have the same length after
warping (Nielsen et al., 1998) (Figure 26). This method's drawbacks are that it is time-
consuming, and possible distortions of curves might happen due to the compression/elongation
process.
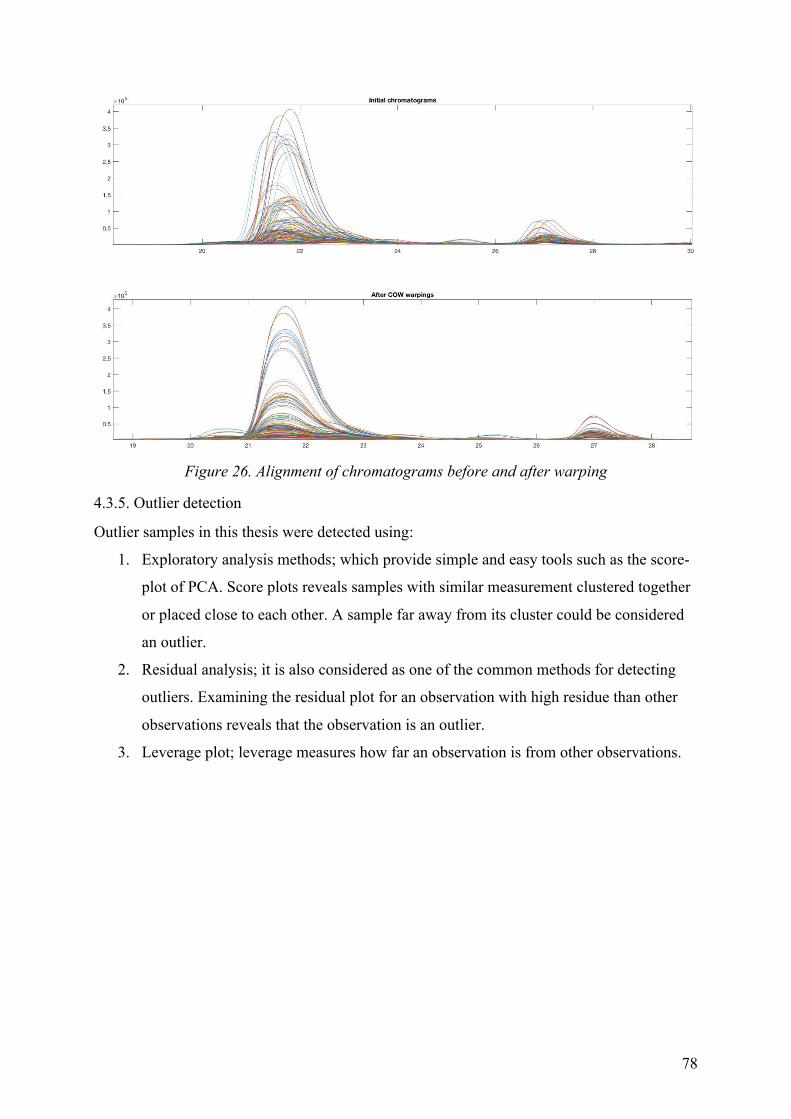
78
Figure 26. Alignment of chromatograms before and after warping
4.3.5. Outlier detection
Outlier samples in this thesis were detected using:
1. Exploratory analysis methods; which provide simple and easy tools such as the score-
plot of PCA. Score plots reveals samples with similar measurement clustered together
or placed close to each other. A sample far away from its cluster could be considered
an outlier.
2. Residual analysis; it is also considered as one of the common methods for detecting
outliers. Examining the residual plot for an observation with high residue than other
observations reveals that the observation is an outlier.
3. Leverage plot; leverage measures how far an observation is from other observations.
79
Chapter 3: Impact of Growing Area and Technological Aspects on
Lebanese Olive Oil: Characterization by unsupervised methods
Lebanon was off the chart when it comes to geographical characterization / indication. It is time
to set the grounds for such possibility as this will improve the image of Lebanese olive oil and
creates an access to international markets. There by, giving an opportunity for the Lebanese
olive farmers for a better market access. For this to happen, the major quality affecting
parameters need to be identified.
This chapter, under article form, demonstrates that geographical indication is possible in
Lebanon, mostly attributed to the climatic effect and the altitude of the growing area. It also
reveals the two key parameters affecting Lebanese olive oil quality: the improper storage
practices and olive oil processing practices.
80
Impact of Growing Area and Technological Aspects on Lebanese Olive Oil:
Characterization by unsupervised methods
Omar H. Dib1,2*, Ali Bassal2, Hussein Dib2, Rita Yaacoub 2, Nathalie Locquet1, Luc Eveleigh3 and Christophe B. Y. Cordella1
1 UMR PNCA, AgroParisTech, INRA, Université Paris-Saclay, Paris, France, 75005 2 Department of Food Science and Technology, Lebanese University, Beirut, Dekweneh,
Lebanon, 1003 3 Ingénierie Procédés Aliments, INRA, AgroParisTech, Université Paris-Saclay, Massy, France,
91300 * Correspondance (Omar H. Dib) UMR PNCA, AgroParisTech, INRA, Université Paris-Saclay, Paris, France, 75005. Department of Food Science and Technology, Lebanese University, Beirut, Dekweneh, Lebanon, 1003. Email address: [email protected],
Tel: +961 3 821834 / +33 6 86 69 81 85
Abstract
The influence of growing-area and technological aspects on the Lebanese Soury variety is
presented. The pedoclimatic conditions, quality parameters, and fatty acids of oil samples were
examined using chemometric tools to demonstrate the typicality of Lebanese olive oil.
Furthermore, the effect of several technological factors on olive oil quality was studied.
Accordingly, olive oil samples were collected across Lebanon corresponding to two climatic
zones (Zone A: Low-altitude regions; Zone B: High-altitude regions). Principal component
analysis was capable of discriminating the two zones with distinct fatty acid profiles. Zone A
exhibited a fatty acid profile mostly dominated by linoleic, linolenic, palmitic, and palmitoleic
acid content. As for zone B, it showed a unique fatty acid profile distinguished by oleic acid.
These results are mostly attributed to the climatic effect and the altitude of the growing area.
Moreover, independent component analysis, coupled to one-way ANOVA, demonstrated that
significant differences (p<0.05) were found in quality indices (acidity and peroxide value) as
well as fatty acid contents (oleic and linoleic acid) when comparing uncontrolled to controlled
extraction methods. This study provides a baseline for future intensive characterization of
Lebanese olive oil and detects the non-compliances attributed to the disqualification of olive oil
virginity.
Keywords: chemometric tools, fatty acid, growing area, olive oil, quality assessment
81
1. Introduction
Olive trees cover 5.4 % of the Lebanese territory or 8 % of total agricultural lands in Lebanon
(Investment Development Authority in Lebanon [IDAL], 2017). Olive groves, almost solely
rain-fed, are dispersed over the provinces of Lebanon, producing 24,000 tons of olive oil per
year (International Olive Council [IOC], 2018). This production is being conducted by 485
registered mills scattered throughout Lebanon. About 85% of the mills still rely on traditional-
extraction systems, particularly pressing method (Lebanese Ministry of Agriculture [MOA],
2012).
Granite millstones and nylon fiber mats, the basic components of the pressing mill, are still
being used despite their high susceptibility to contamination, and most prominently, their effect
on olive oil components (Giovacchino, 2000). Olive paste remnants on mats can initiate several
biological and chemical processes affecting the virginity of olive oil. Olive quality may
deteriorate by other technological variables occurring before and after processing. Irrational
practices during fruit transport and olive and olive oil storage may lead to the lipolysis of
triglycerides and to the chemical oxidation of fatty acids affecting the major constituents of
olive oil (Gharbi et al., 2015).
Besides the technological aspect, a wide variety of factors such as olive cultivar (Aguilera et
al., 2005), fruit maturity (Amanpour et al., 2019), and growing area (Arslan et al., 2013) have
a significant influence on olive oil chemical composition. Among these factors, the effect of the
growing area is undeniably of primary importance, especially on the fatty acid profile (Aguilera
et al., 2005). In most studies, altitude and climate have a vast impact on the profile of fatty
acids. For example, countries close to the equator tend to have a higher palmitic, palmitoleic,
linoleic and alpha-linolenic concentrations in contrary to those with a very cool climate where
a higher oleic level is observed (Aparicio et al., 1994). Furthermore, differences between
regions with distinct altitudes were noticed, as higher altitudes increase monounsaturated fatty
acids, and lower altitudes increase polyunsaturated and saturated fatty acids (Di Bella et al.,
2007).
Lebanon’s diverse topographies, stretching mainly in a north-south direction, and
Mediterranean climate establishes the potential for fatty acid profiles discrimination. Studies
targeting the fatty acid composition of Lebanese olive oil originating from different growing
areas are scarce. Still, some authors have indicated the possibility that the pedoclimatic
conditions of some Lebanese olive growing areas can influence both saturated and
monounsaturated fatty acids (Merchak et al., 2017; Riachy et al., 2018).
82
This study investigates the use of chemometrics to highlight the effect of growing area on the
Lebanese olive oil based on the resulting physicochemical parameters (mainly fatty acids) and
to detect the technological variables leading to disqualification of Lebanese olive oil virginity.
The correlation between the micro and macro-components in olive oil and technological
variables are examined using two main chemometric tools, principle component analysis
(PCA), and independent components analysis (ICA).
2. Methodology
2.1 Sampling
A total of seventy-eight olive oil samples of Soury variety were collected during the years 2016
and 2017. The samples were divided into two groups, uncontrolled and controlled.
The uncontrolled group is composed of 58 extra virgin olive oil (EVOO) and virgin olive oil
(VOO) samples (500 ml) collected from nine sampling-locations across Lebanon. These
locations include Akkar, Hasbaya, Bint Jbail, Tyr, Marjaayoun, Batroun, Koura, Nabatiyeh, and
Zgharta and are identified by the EU to have the potential for geographical indications (United
Nations [UN], 2010). These samples are referred to as uncontrolled since the olive oil samples
were directly collected from farmers (Table 1).
Table 1. Practices applied before, during and after extraction of olive oil
Harvesting
date
Olive
fruit
storage
Fruit
storage
duration
(days)
Extraction method Olive oil
storage
Uncontrolled Mid-End
October
Plastic
Bags 2-3 days
Granite Stone/Pressing mats/
Vertical Centrifuge
Stainless
steel
container
Controlled Early – End
October Crates < One day
Hammer/
thermomixer/Centrifuge
Dark Glass
bottles
The remaining 20 samples were extracted from 5 kg of healthy Soury olive fruits of a maturity
index of 1.76 based on the Uceda et al. (1975) procedure. The fruits were carefully hand-
harvested, excluding infected or physically damaged fruits, from randomly selected olive trees
in olive orchards located in the above-stated regions. The latter set of samples will be referred
to as controlled.
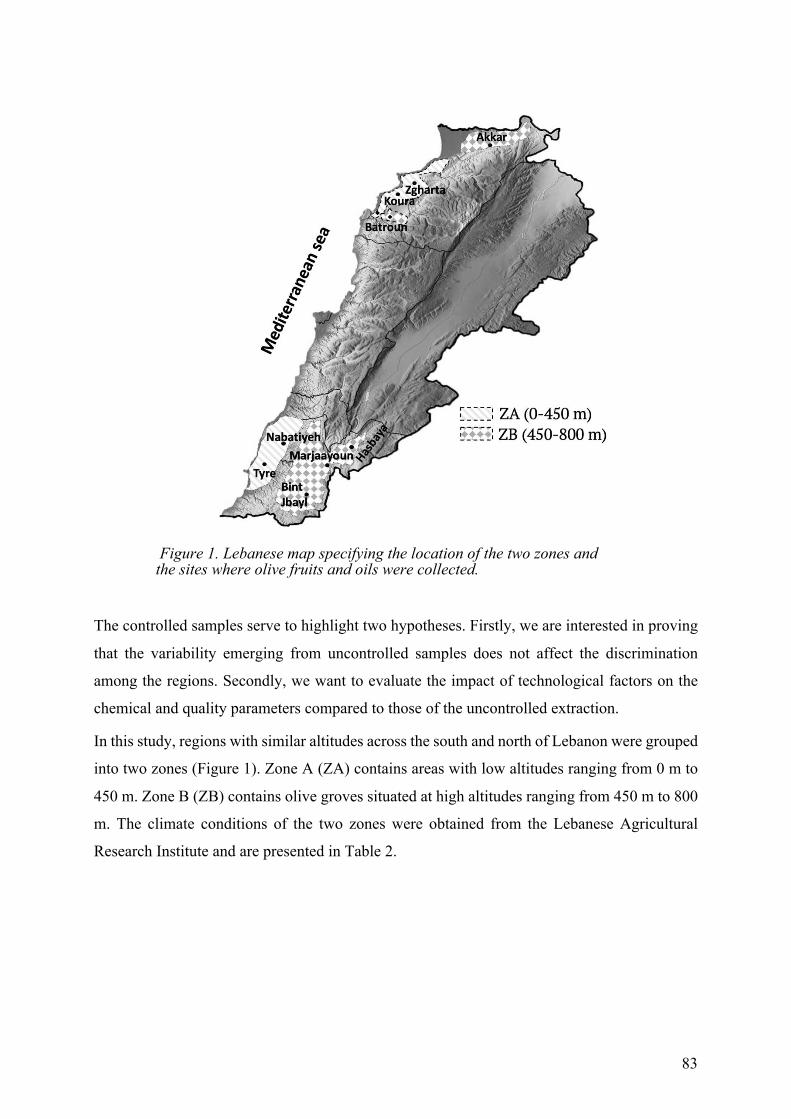
83
The controlled samples serve to highlight two hypotheses. Firstly, we are interested in proving
that the variability emerging from uncontrolled samples does not affect the discrimination
among the regions. Secondly, we want to evaluate the impact of technological factors on the
chemical and quality parameters compared to those of the uncontrolled extraction.
In this study, regions with similar altitudes across the south and north of Lebanon were grouped
into two zones (Figure 1). Zone A (ZA) contains areas with low altitudes ranging from 0 m to
450 m. Zone B (ZB) contains olive groves situated at high altitudes ranging from 450 m to 800
m. The climate conditions of the two zones were obtained from the Lebanese Agricultural
Research Institute and are presented in Table 2.
Figure 1. Lebanese map specifying the location of the two zones and the sites where olive fruits and oils were collected.
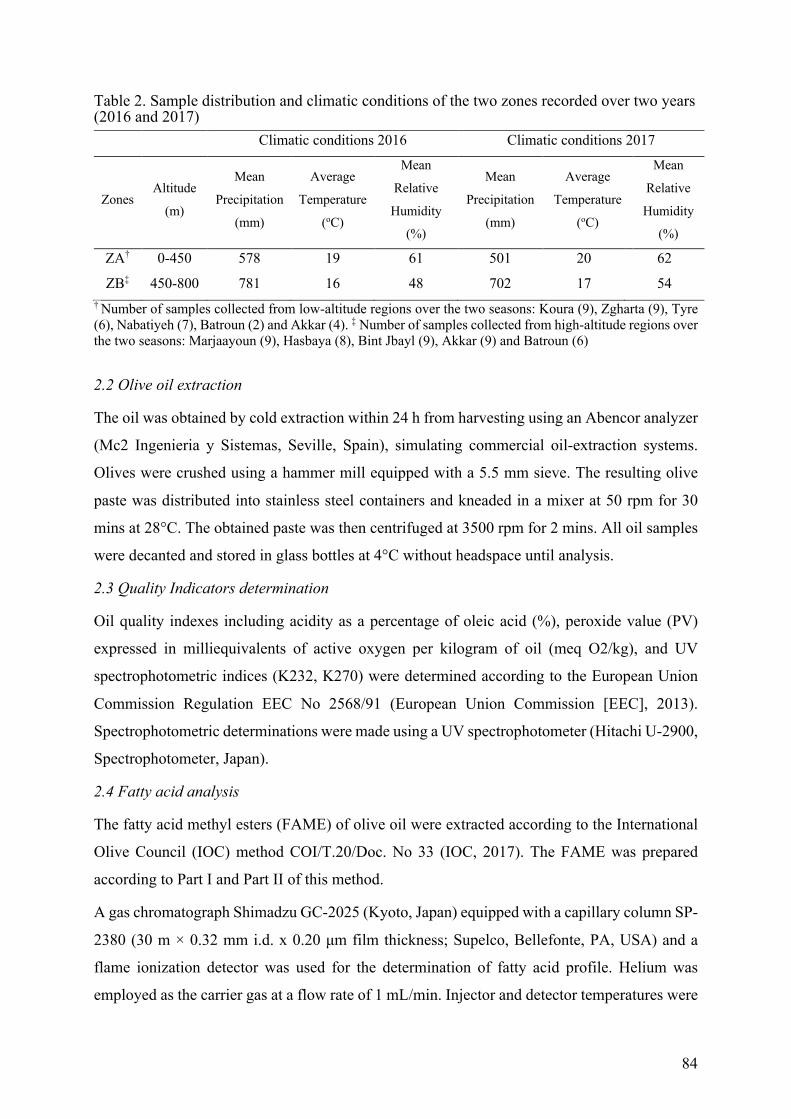
84
Table 2. Sample distribution and climatic conditions of the two zones recorded over two years (2016 and 2017) Climatic conditions 2016 Climatic conditions 2017
Zones Altitude
(m)
Mean
Precipitation
(mm)
Average
Temperature
(oC)
Mean
Relative
Humidity
(%)
Mean
Precipitation
(mm)
Average
Temperature
(oC)
Mean
Relative
Humidity
(%)
ZA† 0-450 578 19 61 501 20 62
ZB‡ 450-800 781 16 48 702 17 54
† Number of samples collected from low-altitude regions over the two seasons: Koura (9), Zgharta (9), Tyre
(6), Nabatiyeh (7), Batroun (2) and Akkar (4). ‡ Number of samples collected from high-altitude regions over
the two seasons: Marjaayoun (9), Hasbaya (8), Bint Jbayl (9), Akkar (9) and Batroun (6)
2.2 Olive oil extraction
The oil was obtained by cold extraction within 24 h from harvesting using an Abencor analyzer
(Mc2 Ingenieria y Sistemas, Seville, Spain), simulating commercial oil-extraction systems.
Olives were crushed using a hammer mill equipped with a 5.5 mm sieve. The resulting olive
paste was distributed into stainless steel containers and kneaded in a mixer at 50 rpm for 30
mins at 28°C. The obtained paste was then centrifuged at 3500 rpm for 2 mins. All oil samples
were decanted and stored in glass bottles at 4°C without headspace until analysis.
2.3 Quality Indicators determination
Oil quality indexes including acidity as a percentage of oleic acid (%), peroxide value (PV)
expressed in milliequivalents of active oxygen per kilogram of oil (meq O2/kg), and UV
spectrophotometric indices (K232, K270) were determined according to the European Union
Commission Regulation EEC No 2568/91 (European Union Commission [EEC], 2013).
Spectrophotometric determinations were made using a UV spectrophotometer (Hitachi U-2900,
Spectrophotometer, Japan).
2.4 Fatty acid analysis
The fatty acid methyl esters (FAME) of olive oil were extracted according to the International
Olive Council (IOC) method COI/T.20/Doc. No 33 (IOC, 2017). The FAME was prepared
according to Part I and Part II of this method.
A gas chromatograph Shimadzu GC-2025 (Kyoto, Japan) equipped with a capillary column SP-
2380 (30 m × 0.32 mm i.d. x 0.20 μm film thickness; Supelco, Bellefonte, PA, USA) and a
flame ionization detector was used for the determination of fatty acid profile. Helium was
employed as the carrier gas at a flow rate of 1 mL/min. Injector and detector temperatures were
85
held at 230°C and 240°C, respectively. The injection volume into a split GC port was one μL,
and a split injection mode (1/100) was used. The following oven temperature program was used:
initial temperature 165°C held for 10 min; ramped at 1.5°C min−1 up to 200°C. Fatty acids were
identified by comparing the retention time of experimental peaks with those obtained by the
external standard mixture.
2.5 Statisitcal analysis
2.5.1 One-way Analysis
ANOVA was applied to the chemical parameters of olive oil to study the effect of the growing
area on the oil characteristics. Also, ANOVA was carried out on the independent components
scores to establish statistical interpretation. Tukey’s test was used to establish the significance
of difference at a 5 % level among means.
2.5.2 Principle Component Analysis
PCA was developed by Harold Hotelling in the 1930s (Hotelling, 1936). The core idea behind
PCA is to represent the initial data matrix by a product of two smaller matrices, the scores
matrix (T), and loadings matrices respectively (P) in such a way the product of:
TPt + E = X (1)
With Pt corresponds to the transposed matrix of P, and E is the residues matrix.
T and P matrices describe the original data in a lower-dimensional space to get a more readable
overview of the data. Columns of T are factorial coordinates of samples (called scores), and
lines of Pt are factorial contributions of variables (called loadings) (Cordella, 2012).
2.5.3 Independent Component Analysis
ICA was developed in the 1990s (Comon, 1994). ICA is known primarily as a method of blind
source separation (BSS) and can recover N unknown source signals mixed together, in unknown
proportions, in a set of P observed mixtures. A key point of ICA is that each observation is a
mixture of these sources. In most cases, including the case of analytical chemistry data, it is
assumed that the part related to the non-linear mixed signals is negligible compared to the linear
portion, and we work with a linear mathematical model, which simplifies calculations. This
BSS method relies on the assumption that the source signals are statistically independent.
The general model of ICA is:
X = AS + E (2)
86
where X is the matrix of the recorded signals, S is the matrix of “pure” source signals, and A is
the unknown mixing matrix corresponding to the “proportions” (“scores”) of source signals in
each mixture. In recent years, the number of applications of the ICA technique has increased
significantly in analytical chemistry, and especially in the treatment of signals acquired during
food analysis (Ammari et al., 2012).
Data were analyzed using Matlab version R2015b (The Mathworks Inc., MA, USA).
3. Results and Discussion
3.1 Growing area effect on Lebanese olive oil
3.1.1 Fatty acid composition & quality indices
Table 3 shows the fatty acid composition and quality indices of uncontrolled and controlled
samples for ZA and ZB.
The main olive growing areas in Lebanon are mainly distributed along ZA and ZB (Figure 1).
Regions belonging to ZA, located on low altitude areas, had higher palmitic, palmitoleic,
linoleic, linolenic, and lower oleic acid content when compared to ZB high-altitude regions for
both uncontrolled and controlled (Table 3). This is due to the growing area effect, as stated by
studies published earlier (Stefanoudaki et al., 1999; Issaoui et al., 2010). For instance, ZA
scored a linoleic acid content of 11.37%, a linolenic acid content of 0.64%, and an oleic acid
content of 69.94 %. As for ZB, an increase in oleic acid (73.24%) and a decrease in linoleic
acid and linolenic acid were observed (10.46 %, 0.59%). These results are per the outcomes
described by other studies for oils extracted from olives grown at different altitudes. For
instance, Aguilera et al. (2005) showed that oils obtained from high altitudes have a greater
content of oleic acid, whereas, at low altitudes, the oils have higher linoleic content, which is
the case for ZA and ZB for both controlled and uncontrolled.
In Lebanon, high-altitude areas have a cooler climate compared to low-altitude areas (Table 2).
The temperature has an impact on the fatty acid profile of olive oil, as established by several
authors (Di Bella et al., 2007; García-Inza et al., 2014). High temperatures increase the content
of several fatty acids, such as palmitic, palmitoleic, linoleic and, linolenic, and decrease that of
oleic acid. This observation is also noted in ZA and ZB of both groups.
Regarding the quality indices, only the acidity of the samples belonging to ZA showed a
significant difference from ZB in the uncontrolled group (Table 3). However, the acidity of ZA
and ZB of controlled samples showed no significant difference meaning that this quality
parameter is not affected by the growing area. The increase in acidity noticed in ZA may be due
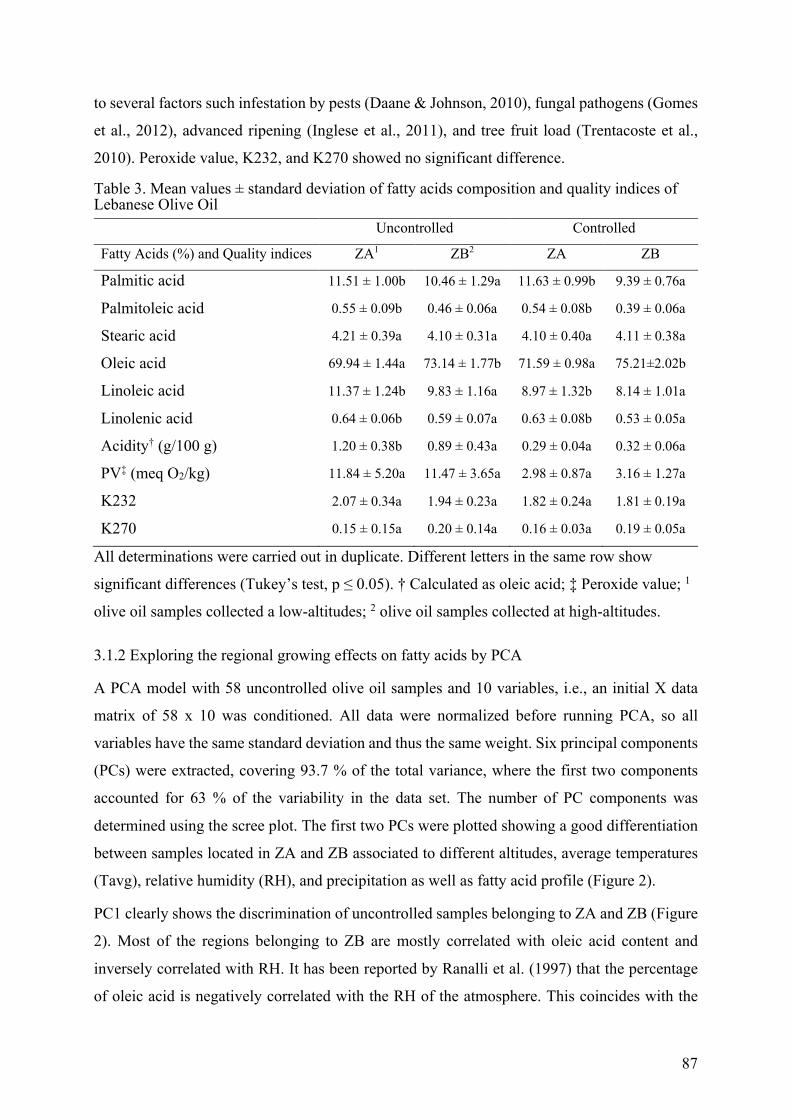
87
to several factors such infestation by pests (Daane & Johnson, 2010), fungal pathogens (Gomes
et al., 2012), advanced ripening (Inglese et al., 2011), and tree fruit load (Trentacoste et al.,
2010). Peroxide value, K232, and K270 showed no significant difference.
Table 3. Mean values ± standard deviation of fatty acids composition and quality indices of Lebanese Olive Oil
Uncontrolled Controlled
Fatty Acids (%) and Quality indices ZA1 ZB2 ZA ZB
Palmitic acid 11.51 ± 1.00b 10.46 ± 1.29a 11.63 ± 0.99b 9.39 ± 0.76a
Palmitoleic acid 0.55 ± 0.09b 0.46 ± 0.06a 0.54 ± 0.08b 0.39 ± 0.06a
Stearic acid 4.21 ± 0.39a 4.10 ± 0.31a 4.10 ± 0.40a 4.11 ± 0.38a
Oleic acid 69.94 ± 1.44a 73.14 ± 1.77b 71.59 ± 0.98a 75.21±2.02b
Linoleic acid 11.37 ± 1.24b 9.83 ± 1.16a 8.97 ± 1.32b 8.14 ± 1.01a
Linolenic acid 0.64 ± 0.06b 0.59 ± 0.07a 0.63 ± 0.08b 0.53 ± 0.05a
Acidity† (g/100 g) 1.20 ± 0.38b 0.89 ± 0.43a 0.29 ± 0.04a 0.32 ± 0.06a
PV‡ (meq O2/kg) 11.84 ± 5.20a 11.47 ± 3.65a 2.98 ± 0.87a 3.16 ± 1.27a
K232 2.07 ± 0.34a 1.94 ± 0.23a 1.82 ± 0.24a 1.81 ± 0.19a
K270 0.15 ± 0.15a 0.20 ± 0.14a 0.16 ± 0.03a 0.19 ± 0.05a
All determinations were carried out in duplicate. Different letters in the same row show
significant differences (Tukey’s test, p ≤ 0.05). † Calculated as oleic acid; ‡ Peroxide value; 1
olive oil samples collected a low-altitudes; 2 olive oil samples collected at high-altitudes.
3.1.2 Exploring the regional growing effects on fatty acids by PCA
A PCA model with 58 uncontrolled olive oil samples and 10 variables, i.e., an initial X data
matrix of 58 x 10 was conditioned. All data were normalized before running PCA, so all
variables have the same standard deviation and thus the same weight. Six principal components
(PCs) were extracted, covering 93.7 % of the total variance, where the first two components
accounted for 63 % of the variability in the data set. The number of PC components was
determined using the scree plot. The first two PCs were plotted showing a good differentiation
between samples located in ZA and ZB associated to different altitudes, average temperatures
(Tavg), relative humidity (RH), and precipitation as well as fatty acid profile (Figure 2).
PC1 clearly shows the discrimination of uncontrolled samples belonging to ZA and ZB (Figure
2). Most of the regions belonging to ZB are mostly correlated with oleic acid content and
inversely correlated with RH. It has been reported by Ranalli et al. (1997) that the percentage
of oleic acid is negatively correlated with the RH of the atmosphere. This coincides with the
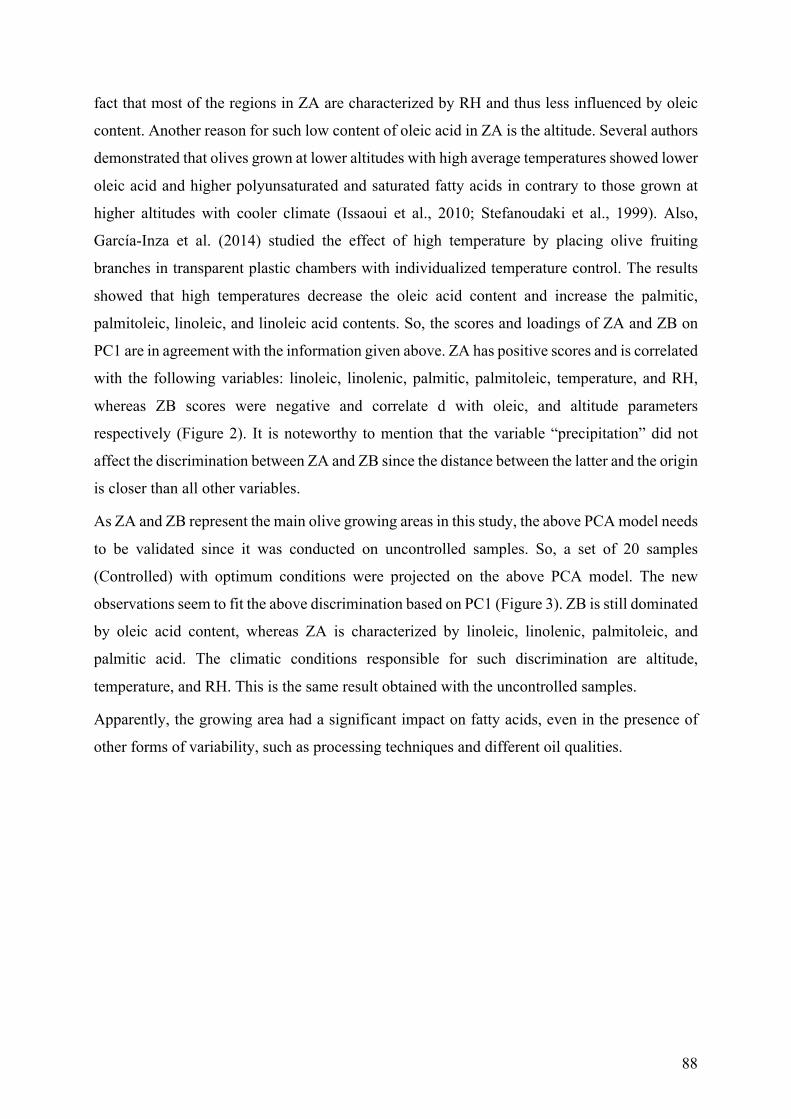
88
fact that most of the regions in ZA are characterized by RH and thus less influenced by oleic
content. Another reason for such low content of oleic acid in ZA is the altitude. Several authors
demonstrated that olives grown at lower altitudes with high average temperatures showed lower
oleic acid and higher polyunsaturated and saturated fatty acids in contrary to those grown at
higher altitudes with cooler climate (Issaoui et al., 2010; Stefanoudaki et al., 1999). Also,
García-Inza et al. (2014) studied the effect of high temperature by placing olive fruiting
branches in transparent plastic chambers with individualized temperature control. The results
showed that high temperatures decrease the oleic acid content and increase the palmitic,
palmitoleic, linoleic, and linoleic acid contents. So, the scores and loadings of ZA and ZB on
PC1 are in agreement with the information given above. ZA has positive scores and is correlated
with the following variables: linoleic, linolenic, palmitic, palmitoleic, temperature, and RH,
whereas ZB scores were negative and correlate d with oleic, and altitude parameters
respectively (Figure 2). It is noteworthy to mention that the variable “precipitation” did not
affect the discrimination between ZA and ZB since the distance between the latter and the origin
is closer than all other variables.
As ZA and ZB represent the main olive growing areas in this study, the above PCA model needs
to be validated since it was conducted on uncontrolled samples. So, a set of 20 samples
(Controlled) with optimum conditions were projected on the above PCA model. The new
observations seem to fit the above discrimination based on PC1 (Figure 3). ZB is still dominated
by oleic acid content, whereas ZA is characterized by linoleic, linolenic, palmitoleic, and
palmitic acid. The climatic conditions responsible for such discrimination are altitude,
temperature, and RH. This is the same result obtained with the uncontrolled samples.
Apparently, the growing area had a significant impact on fatty acids, even in the presence of
other forms of variability, such as processing techniques and different oil qualities.
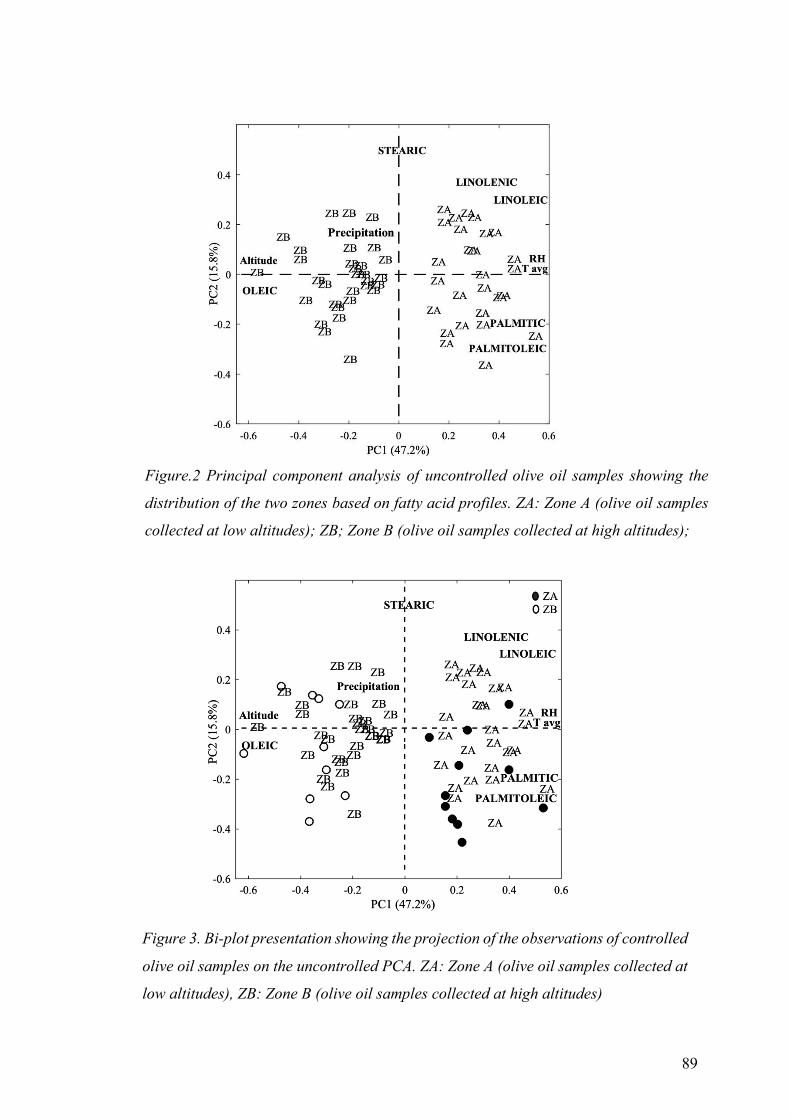
89
Figure.2 Principal component analysis of uncontrolled olive oil samples showing the
distribution of the two zones based on fatty acid profiles. ZA: Zone A (olive oil samples
collected at low altitudes); ZB; Zone B (olive oil samples collected at high altitudes);
Figure 3. Bi-plot presentation showing the projection of the observations of controlled
olive oil samples on the uncontrolled PCA. ZA: Zone A (olive oil samples collected at
low altitudes), ZB: Zone B (olive oil samples collected at high altitudes)
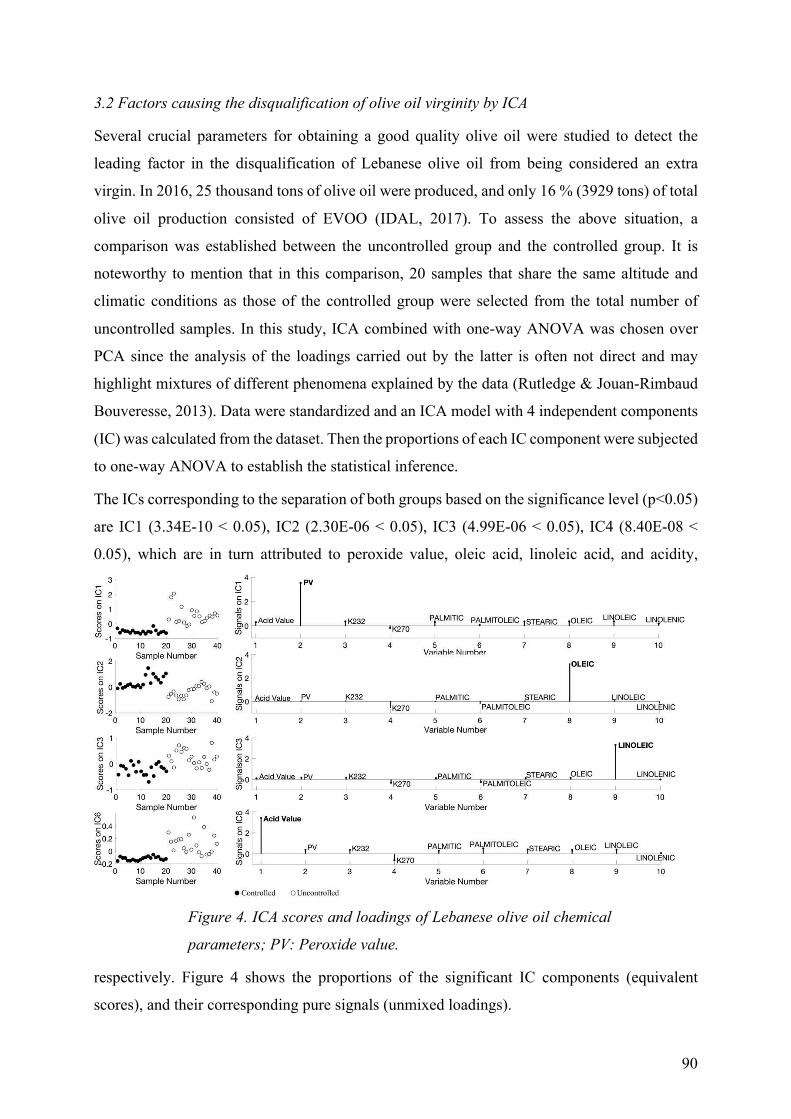
90
3.2 Factors causing the disqualification of olive oil virginity by ICA
Several crucial parameters for obtaining a good quality olive oil were studied to detect the
leading factor in the disqualification of Lebanese olive oil from being considered an extra
virgin. In 2016, 25 thousand tons of olive oil were produced, and only 16 % (3929 tons) of total
olive oil production consisted of EVOO (IDAL, 2017). To assess the above situation, a
comparison was established between the uncontrolled group and the controlled group. It is
noteworthy to mention that in this comparison, 20 samples that share the same altitude and
climatic conditions as those of the controlled group were selected from the total number of
uncontrolled samples. In this study, ICA combined with one-way ANOVA was chosen over
PCA since the analysis of the loadings carried out by the latter is often not direct and may
highlight mixtures of different phenomena explained by the data (Rutledge & Jouan-Rimbaud
Bouveresse, 2013). Data were standardized and an ICA model with 4 independent components
(IC) was calculated from the dataset. Then the proportions of each IC component were subjected
to one-way ANOVA to establish the statistical inference.
The ICs corresponding to the separation of both groups based on the significance level (p<0.05)
are IC1 (3.34E-10 < 0.05), IC2 (2.30E-06 < 0.05), IC3 (4.99E-06 < 0.05), IC4 (8.40E-08 <
0.05), which are in turn attributed to peroxide value, oleic acid, linoleic acid, and acidity,
respectively. Figure 4 shows the proportions of the significant IC components (equivalent
scores), and their corresponding pure signals (unmixed loadings).
Figure 4. ICA scores and loadings of Lebanese olive oil chemical
parameters; PV: Peroxide value.
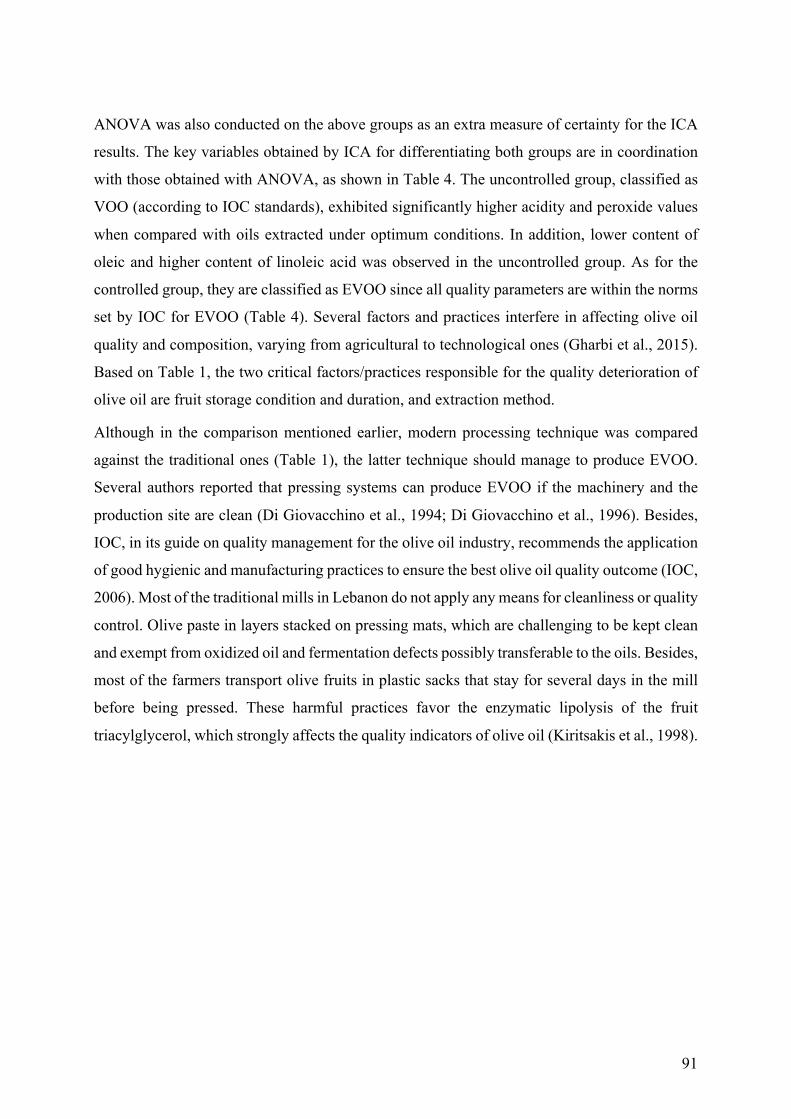
91
ANOVA was also conducted on the above groups as an extra measure of certainty for the ICA
results. The key variables obtained by ICA for differentiating both groups are in coordination
with those obtained with ANOVA, as shown in Table 4. The uncontrolled group, classified as
VOO (according to IOC standards), exhibited significantly higher acidity and peroxide values
when compared with oils extracted under optimum conditions. In addition, lower content of
oleic and higher content of linoleic acid was observed in the uncontrolled group. As for the
controlled group, they are classified as EVOO since all quality parameters are within the norms
set by IOC for EVOO (Table 4). Several factors and practices interfere in affecting olive oil
quality and composition, varying from agricultural to technological ones (Gharbi et al., 2015).
Based on Table 1, the two critical factors/practices responsible for the quality deterioration of
olive oil are fruit storage condition and duration, and extraction method.
Although in the comparison mentioned earlier, modern processing technique was compared
against the traditional ones (Table 1), the latter technique should manage to produce EVOO.
Several authors reported that pressing systems can produce EVOO if the machinery and the
production site are clean (Di Giovacchino et al., 1994; Di Giovacchino et al., 1996). Besides,
IOC, in its guide on quality management for the olive oil industry, recommends the application
of good hygienic and manufacturing practices to ensure the best olive oil quality outcome (IOC,
2006). Most of the traditional mills in Lebanon do not apply any means for cleanliness or quality
control. Olive paste in layers stacked on pressing mats, which are challenging to be kept clean
and exempt from oxidized oil and fermentation defects possibly transferable to the oils. Besides,
most of the farmers transport olive fruits in plastic sacks that stay for several days in the mill
before being pressed. These harmful practices favor the enzymatic lipolysis of the fruit
triacylglycerol, which strongly affects the quality indicators of olive oil (Kiritsakis et al., 1998).
92
Table 4. Fatty acid composition and quality indices of olive oil obtained either by controlled
or uncontrolled extraction.
Fatty Acids (%) and Quality indices Uncontrolled Controlled
Palmitic acid 10.95 ± 1.27a 10.51 ± 1.40a
Palmitoleic acid 0.50 ± 0.09a 0.46 ± 0.10a
Stearic acid 4.11 ± 0.35a 4.10 ± 0.30a
Oleic acid 71.65 ± 2.28a 73.40 ± 2.36b
Linoleic acid 10.54 ± 1.43b 8.56 ± 1.19a
Linolenic acid 0.61 ± 0.07a 0.58 ± 0.08a
Acidity† (g/100 g) 1.04 ± 0.43b 0.30 ± 0.05a
PV‡ (meq O2/kg) 11.64 ± 4.40b 3.07 ± 1.07a
K232 1.94 ± 0.27a 1.81 ± 0.20a
K270 0.18 ± 0.07a 0.18 ± 0.04a
Percentage of samples classified as EVOO 33.30% 100%
All determinations were carried out in duplicate and mean value ± standard deviation.
Different letters in the same row show significant differences (p ≤ 0.05). † Calculated as oleic
acid; ‡ Peroxide value.
Conclusion
PCA and one-way ANOVA were able to reveal a correlation between the fatty acid profile
and the pedoclimatic conditions of the main olive growing regions in Lebanon. Low altitudes
regions were characterized by palmitic, palmitoleic, linoleic, and linolenic acid, whereas high-
altitude regions were represented by their high oleic acid content.
On the other hand, ICA facilitated the chemical interpretation by providing chemically pure
components that crossed the parameters sets by IOC for EVOO. Fruit storage
condition/duration and the non-hygienic conditions of the extraction method were identified
as the major quality affecting parameters. The solution for such non-compliances would rely
on good management/hygienic practices which include, ensuring suitable pre-processing and
post-processing storage conditions and providing basic hygiene.
93
Acknowledgments
The authors would like to acknowledge the National Council for Scientific Research of Lebanon
[5/2106] and the Lebanese University [504/12/CU] for their financial support and for granting
a doctoral fellowship to “Omar Dib”. We also thank all olive farmers; whose assistance was
essential to this study execution. All authors contributed equally in experiment conception,
conduction, data analysis and manuscript writing and final correction.
References
Aguilera, M. P., Beltrán, G., Ortega, D., Fernández, A., Jiménez, A., & Uceda, M. (2005).
Characterisation of virgin olive oil of Italian olive cultivars: `Frantoio' and `Leccino',
grown in Andalusia. Food Chemistry 89(3), 387-391.
https://doi.org/10.1016/j.foodchem.2004.02.046
Amanpour, A., Kelebek, H., & Selli, S. (2019). Characterization of aroma, aroma-active
compounds and fatty acids profiles of cv. Nizip Yaglik oils as affected by three maturity
periods of olives. Journal of the Science of Food and Agriculture 99(2), 726-740.
https://doi.org/10.1002/jsfa.9241
Ammari, F., Jouan-Rimbaud-Bouveresse, D., Boughanmi, N., & Rutledge, D. N. (2012). Study
of the heat stability of sunflower oil enriched in natural antioxidants by different analytical
techniques and front-face fluorescence spectroscopy combined with Independent
Components Analysis. Talanta 99, 323-329. https://doi.org/10.1016/j.talanta.2012.05.059
Aparicio, R., Ferreiro, L., & Alonso, V. (1994). Effect of climate on the chemical composition
of virgin olive oil. Analytica Chimica Acta 292(3), 235-241. https://doi.org/10.1016/0003-
2670(94)00065-4
Arslan, D., Karabekir, Y., & Schreiner, M. (2013). Variations of phenolic compounds, fatty
acids and some qualitative characteristics of Sarıulak olive oil as induced by growing area.
Food Research International 54(2), 1897-1906.
https://doi.org/10.1016/j.foodres.2013.06.016
Comon, P. (1994). Independent component analysis, A new concept?. Signal Processing 36(3),
287-314. https://doi.org/10.1016/0165-1684(94)90029-9
Cordella, C. B. Y. (2012). Prinicple Component Analysis: The Basic Building Block of
Chemometrics. L'Actualité Chimique, 13-18. https://doi.org/10.5772/51429
94
Daane, K. M., & Johnson, M. W. (2010). Olive fruit fly: managing an ancient pest in modern
times. Annu Rev Entomol 55. 151-169.
https://doi.org/10.1146/annurev.ento.54.110807.090553
Di Bella, G., Maisano, R., La Pera, L., Lo Turco, V., Salvo, F., & Dugo, G. (2007). Statistical
Characterization of Sicilian Olive Oils from the Peloritana and Maghrebian Zones
According to the Fatty Acid Profile. Journal of Agricultural and Food Chemistry 55(16),
6568-6574. https://doi.org/10.1021/jf070523r
Di Giovacchino, L., Angerosa, F., & Di Giacinto, L. (1996). Effect of mixing leaves with olives
on organoleptic quality of oil obtained by centrifugation. Journal of the American Oil
Chemists’ Society 73(3), 371-374. https://doi.org/10.1007/bf02523433
Di Giovacchino, L., Solinas, M., & Miccoli, M. (1994). Effect of extraction systems on the
quality of virgin olive oil. Journal of the American Oil Chemists’ Society 71(11), 1189-
1194. https://doi.org/10.1007/bf02540535
EEC. (2013). Implementing Regulation No 1348/2013 amending Regulation (EEC) No 2568/91
on the characteristics of olive oil and olive-residue oil and on the relevant methods of
analysis. Official Journal of the European Union, 31-67.
García-Inza, G. P., Castro, D. N., Hall, A. J., & Rousseaux, M. C. (2014). Responses to
temperature of fruit dry weight, oil concentration, and oil fatty acid composition in olive
(Olea europaea L. var. ‘Arauco’). European Journal of Agronomy 54, 107-115.
https://doi.org/10.1016/j.eja.2013.12.005
Gharbi, I., Issaoui, M., Mehri, S., Cheraief, I., Sifi, S., & Hammami, M. (2015). Agronomic and
Technological Factors Affecting Tunisian Olive Oil Quality. Agricultural Sciences 06(15).
https://doi.org/10.4236/as.2015.65051
Giovacchino, L. D. (2000). Technological Aspects: Handbook of Olive Oil: Analysis and
Properties. Gaithersburg, MD (USA): Aspen Publisher, 17-59.
https://doi.org/10.1007/978-1-4614-7777-8
Gomes, S. n., Prieto, P., Carvalho, T., Guedes-Pinto, H., & Martins-Lopes, P. (2012). Olive –
Colletotrichum acutatum: An Example of Fruit-Fungal Interaction. Rijeka, Croatia:
IntechOpen (CY). https://doi.org/10.5772/27965
Hotelling, H. (1936). Relations Between Two Sets of Variates. Biometrika 28, 321-377.
https://doi.org/10.2307/2333955
95
IDAL. (2017). Olive Oil Industry in Lebanon. Investment Development Authority in Lebanon.
Retrieved August,02, 2019,
https://investinlebanon.gov.lb/Content/uploads/CorporatePageRubric/180123031939637
~Olive%20Oil%20factsheet%202017.pdf
Inglese, P., Famiani, F., Galvano, F., Servili, M., Esposto, S., & Urbani, S. (2011). Factors
Affecting Extra-Virgin Olive Oil Composition: Horticultural Reviews. Hoboken, New
Jersey: Wiley‐Blackwell, 83-147. https://doi.org/10.1002/9780470872376.ch3
IOC. (2006). Quality management guide for the olive oil industry: olive oil mills. International
Olive Council. T.33/Doc. No. 2-4.
IOC. (2017). Method of Analysis, Determination of fatty acid methyl esters by gas
chromatography. International Olive Council. COI/T.20/Doc. No. 33
IOC. (2018). World olive oil figures. International Olive Council. Retrieved August, 02, 2019,
http://www.internationaloliveoil.org/estaticos/view/131-world-olive-oil-figures
Issaoui, M., Flamini, G., Brahmi, F., Dabbou, S., Hassine, K. B., Taamali, A., Chehab, H.,
Ellouz, M., Zarrouk, M. ... Hammami, M. (2010). Effect of the growing area conditions
on differentiation between Chemlali and Chétoui olive oils. Food Chemistry 119(1), 220-
225. https://doi.org/10.1016/j.foodchem.2009.06.012
Kiritsakis, A., Nanos, G. D., Polymenopulos, Z., Thomai, T., & Sfakiotakis, E. M. (1998).
Effect of fruit storage conditions on olive oil quality. Journal of the American Oil
Chemists' Society 75(6), 721-724. https://doi.org/10.1007/s11746-998-0212-7
Merchak, N., El Bacha, E., Bou Khouzam, R., Rizk, T., Akoka, S., & Bejjani, J. (2017).
Geoclimatic, morphological, and temporal effects on Lebanese olive oils composition and
classification: A 1H NMR metabolomic study. Food Chemistry 217(3), 79-388.
https://doi.org/10.1016/j.foodchem.2016.08.110
MOA. (2012). Overview of the Lebanese Olive Sector Report, Lebanese Republic Ministry of
Agriculture.
Ranalli, G., G. de Mattia, M.L. Ferrante, & Giansante, L. (1997). Incidence of Olive Cultivation
Area on the Analytical Characteristics of the Oil. Riv. Ital. Sostanze Grasse 74, 501–508.
Riachy, M., Bou Mitri, C., Youssef, A., Andary, R., & Skaff, W. (2018). Chemical and
Sensorial Characteristics of Olive Oil Produced from the Lebanese Olive Variety ‘Baladi’.
Sustainability 10, 1-21. https://doi.org/10.3390/su10124630
96
Rutledge, D. N., & Jouan-Rimbaud Bouveresse, D. (2013). Independent Components Analysis
with the JADE algorithm. TrAC Trends in Analytical Chemistry 50, 22-32.
https://doi.org/10.1016/j.trac.2013.03.013
Stefanoudaki, E., Kotsifaki, F., & Koutsaftakis, A. (1999). Classification of virgin olive oils of
the two major cretan cultivars based on their fatty acid composition. Journal of the
American Oil Chemists' Society 76(5), 623-626. https://doi.org/10.1007/s11746-999-
0013-7
Trentacoste, E. R., Puertas, C. M., & Sadras, V. O. (2010). Effect of fruit load on oil yield
components and dynamics of fruit growth and oil accumulation in olive (Olea europaea
L.). European Journal of Agronomy 32(4), 249-254.
https://doi.org/10.1016/j.eja.2010.01.002
Uceda, M., & Frías, L. (1975). Evolución del contenido graso del fruto y de la composición y
calidad del aceite. IOOC (ed) Proc. of II Seminario Oleícola International. Córdoba,
Spain.
97
Chapter 4: Conventional and Ultra-fast Analysis Exposing the
Harvest Date Impact on Lebanese Olive Oil: The Soury Variety
Choosing the harvest date is the most important decision taken by the olive farmer every year.
Picking up earlier than expected or delaying it may affect the chemical composition of the
resulting olive oil. It sets the limits on the qualities of olive oil.
As known, delaying the harvest means that ripening is advancing and thus some physical
changes will occur to the fruit. This including changing color, softening of the tissues and lastly
falling of the fruits from the tree. As olive fruit ripens, several minor and major constituents of
the olive oil change as for example and in some varieties the oleic acid content decrease. This
particular monounsaturated fatty acid represents around 55-80 % of olive oil and it is known
for its broad range of health benefits like protecting against cardiovascular diseases. Never to
mention the decrease in total polyphenol content where they act as antioxidants.
This chapter shows the impact of harvest period on the quality parameters, polyphenols, fatty
acids, sterols, and volatile compounds on Lebanese olive oil from the Soury variety. It also
presents the appropriate period for the Lebnanese farmers to pick the olive fruit and thus obtain
an olive oil with the highest quality grade
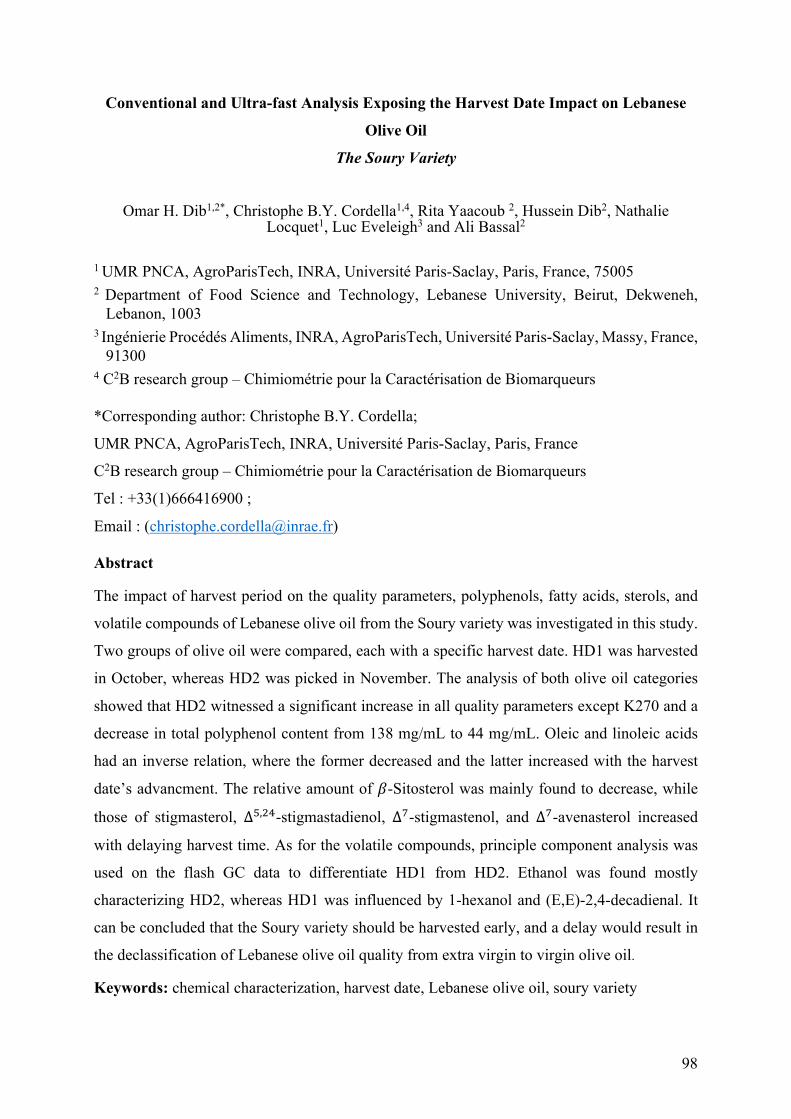
98
Conventional and Ultra-fast Analysis Exposing the Harvest Date Impact on Lebanese
Olive Oil
The Soury Variety
Omar H. Dib1,2*, Christophe B.Y. Cordella1,4, Rita Yaacoub 2, Hussein Dib2, Nathalie Locquet1, Luc Eveleigh3 and Ali Bassal2
1 UMR PNCA, AgroParisTech, INRA, Université Paris-Saclay, Paris, France, 75005 2 Department of Food Science and Technology, Lebanese University, Beirut, Dekweneh,
Lebanon, 1003 3 Ingénierie Procédés Aliments, INRA, AgroParisTech, Université Paris-Saclay, Massy, France,
91300 4 C2B research group – Chimiométrie pour la Caractérisation de Biomarqueurs *Corresponding author: Christophe B.Y. Cordella;
UMR PNCA, AgroParisTech, INRA, Université Paris-Saclay, Paris, France
C2B research group – Chimiométrie pour la Caractérisation de Biomarqueurs
Tel : +33(1)666416900 ;
Email : ([email protected])
Abstract
The impact of harvest period on the quality parameters, polyphenols, fatty acids, sterols, and
volatile compounds of Lebanese olive oil from the Soury variety was investigated in this study.
Two groups of olive oil were compared, each with a specific harvest date. HD1 was harvested
in October, whereas HD2 was picked in November. The analysis of both olive oil categories
showed that HD2 witnessed a significant increase in all quality parameters except K270 and a
decrease in total polyphenol content from 138 mg/mL to 44 mg/mL. Oleic and linoleic acids
had an inverse relation, where the former decreased and the latter increased with the harvest
date’s advancment. The relative amount of c-Sitosterol was mainly found to decrease, while
those of stigmasterol, ∆;,*=-stigmastadienol, ∆,-stigmastenol, and ∆,-avenasterol increased
with delaying harvest time. As for the volatile compounds, principle component analysis was
used on the flash GC data to differentiate HD1 from HD2. Ethanol was found mostly
characterizing HD2, whereas HD1 was influenced by 1-hexanol and (E,E)-2,4-decadienal. It
can be concluded that the Soury variety should be harvested early, and a delay would result in
the declassification of Lebanese olive oil quality from extra virgin to virgin olive oil.
Keywords: chemical characterization, harvest date, Lebanese olive oil, soury variety
99
1. Introduction
Lebanon is home to the oldest olive trees dating back centuries (at least 1,500 years). It has been
distinguished for its trade-in crop products, including olive and olive oil along the
Mediterranean Basin (Thalman, 2000, Beayno, Mattar et al., 2002, Mahfoud, 2007). Lebanon
produces around 24,000 tons of olive oil. For the last six years, the production ranged between
16,500 t and 25,000t (International Olive Council [IOC], 2018). This fluctuation in production
can be induced by several agronomical (El Antari, Hilal et al., 2000, Stefanoudaki,
Chartzoulakis et al., 2001) and technological factors (García, Seller et al., 1996, Koutsaftakis,
Kotsifaki et al., 1999). Among these factors, an agronomical factor that is recognized as the one
having the most detrimental effect on olive oil chemical composition is the harvest date (De La
Torre, Lopez et al., 1985, Fiorino & Nizzi 1991, Koutsaftakis, Kotsifakis et al., 2000).
As olive fruit matures, the color of the fruit shifts from green at the start of the harvest period
to small reddish-green spots to purple and lastly to black at the end of the harvest period
(Motilva & Romero, 2010). Each stage imparts its chemical variations on the level of macro
and minor components of olive oil, such as triglycerides, fatty acids, polyphenols, sterols, and
chlorophylls, which in turn have an impact on olive oil quality (Gargouri, Rouina et al., 2016).
Besides, these variations influence not only the quality but also the nutritional, the organoleptic
characteristics, and the oxidative stability of olive oil (Maaitah, Al-Absi et al., 2009). However,
the variation based on fruit maturity depends also on the cultivar in the study.
For instance, Issaoui, Flamini et al., (2010) related the increase of polyunsaturated and the
decrease of monounsaturated fatty acid to fruit maturation. In other cases, the level of
monounsaturated fatty acids increased, along with the level of saturated and polyunsaturated
fatty acids, as in Barnea variety. As for the Soury variety, Lodolini, Polverigiani et al., (2017)
showed that the delay of harvest has a detrimental effect on olive oil quality. As it ripens, oleic
content declines, and linoleic increases, quality indices, mostly free fatty acids, are negatively
affected, while polyphenol levels and oxidative stability drop sharply. Also, it has been reported
that the sterol content decreases sharply from 2850 g/kg to 1644 g/kg (Noorali, Barzegar et al.,
2014). Moreover, fruit maturation has also been shown to affect olive oil quality parameters
such as free fatty acids, peroxide value, specific UV absorbances, and volatile
compounds(Famiani, Proietti et al., 2002, Lazzez, Perri et al., 2008, Mailer, Ayton et al., 2010,
Varzakas, Zakynthinos et al., 2010, Dag, Kerem et al., 2011, Gomez, Ruiz et al., 2011)
Because the macro and minor compounds of the Lebanese olive oil have not been studied
extensively, we are interested in identifying some minor and macro components characterizing
100
the Soury variety and studying the harvest date’s impact on their evolution. Also, this study
stresses the volatiles as a research gap in Lebanese olive oil.
2. Methodology
2.1 Sampling
Sixty-three olive oil samples of Soury variety were used in this study. The samples were divided
into two groups (HD1 and HD2) according to their harvest date.
HD1 includes 21 extra virgin olive oil samples (EVOO), each extracted from 5 kg of healthy
Soury olive fruits picked from mid of October till the first week of November. The color of the
olive fruits of this group was green with purple dots. Oil samples were obtained by cold
extraction using an Abencor analyzer (Mc2 Ingenieria y Sistemas, Seville, Spain) with a
hammer mill (5.5 mm sieve), a mixer (50 rpm for 30 mins at 28°C), and a centrifuge (3500 rpm
for 2 mins). All oil samples were stored in glass bottles at 4°C without headspace till analysis.
HD2 is composed of 42 virgin olive oil (VOO) samples (500 mL) collected from Lebanese olive
farmers. The olive fruits were harvested from mid of November till the end of November. The
color of the olive fruits of this group was purple to black.
2.2 Quality parameters
The determination of olive oil quality indices, such as acidity (calculated as oleic acid), peroxide
value (PV), and UV spectrophotometric indices (K232, K270), was carried out according to the
European Union Commission Regulation EEC No 2568/91 (European Union Commission
[EEC], 2013).
2.3 Total polyphenols
The analysis of total polyphenol content was carried out based on Montedoro, Servili et al.,
(1992). The phenols were isolated from oil in hexane by double extraction with methanol-water
(60:40, v/v). Total polyphenols were determined by a UV spectrophotometer (Hitachi U-2900,
Spectrophotometer, Japan) at 765 nm using a Folin-Ciocalteu reagent. Caffeic acid standard
solutions were used as a means of method calibration (R2 = 0.9995).
2.3 Fatty acids
The fatty acid profile of olive oil was determined by gas chromatography (GC) after methyl
esterification of the acids, according to the International Olive Council (IOC) method
COI/T.20/Doc. No 33 (IOC, 2017). Chromatographic analysis was performed using Shimadzu
GC-2025 (Kyoto, Japan) equipped with a capillary column SP-2380 (30 m × 0.32 mm i.d. x
0.20 μm film thickness; Supelco, Bellefonte, PA, USA) and an FID detector. Injector and
101
detector temperatures were held at 230°C and 240°C, respectively. The injection volume into a
split GC port was 1μL, and a split injection mode (1/100) was used. Helium was employed as
the carrier gas at a flow rate of 1 mL/min. The following oven temperature program was used:
initial temperature of 165°C held for 10 min, ramped at 1.5°C min−1 up to 200°C. Fatty acids
were identified by comparing the retention time of experimental peaks with those obtained by
the standard external mixture.
2.4 Sterols
The sterols of olive oil were extracted according to the International Olive Council (IOC, 2013).
5g of olive oil were introduced to a 250 mL flask, already containing α-cholestanol solution
(internal standard solution), and saponified with 2 N ethanolic 2M potassium hydroxide
solution. After boiling the solution, 100 mL of distilled water was added, and three extractions
of the same unsaponifiable fraction were carried out using diethyl ether (80ml, 70ml, 70 ml).
The extracts were then washed with water (50 mL) until the wash water no longer gives a pink
color upon the addition of phenolphthalein solution. The extracts were filtered on anhydrous
sodium sulfate, and the filtered solvent was evaporated by distillation in a rotary evaporator at
30 oC under vacuum.
Separation of the sterol and triterpene dialcohols fraction (erythrodiol + uvaol). 5% solution
of the unsaponifiable was prepared in chloroform and using the 100 μL microsyringe, 0.3 mL
of the solution was disposed on a narrow and uniform streak on the lower end (2 cm) of the
TLC plate. The plate was then placed in the prepared developing chamber and allowed eluting
until the solvent reaches approximately 1 cm from the plate's upper edge. The plate was then
sprayed with 0.2% 2,7-dichlorofluorescein to identify the sterol area. The sterol band was then
identified using UV light, and the silica gel on the marked area was scraped off using a metal
spatula, dissolved in chloroform and diethyl ether, and evaporated to dryness. The obtained
sterols and triterpene dialcohols were transformed into trimethylsilyl ethers by adding a 9:3:1
(v/v/v) mixture of pyridine/hexamethyldisilazane/trimethylchlorosilane (in the ratio of 50 �L
for every milligram of sterols).
GC-MS Analysis. The mixture was analyzed using ITQ 900 GC-MS (Trace 1310 GC, Thermo
Scientific, USA) system with a quadrupole ion trap mass analyzer supplied with split/splitless
injection autosampler (Thermo Scientific AI/AS 1310). A DB-5 type 5% phenyl–95% methyl
polysiloxane fused- silica capillary column, DB-5MS (30 m x 0.25 mm x 0.25 um, Agilent
Technologies, USA), non-polar, low bleed, and with high-temperature limits (up to 350 oC),
was chosen for testing sterol samples. The helium carrier gas was used at a flow rate of 1.2
102
mL/min. The oven temperature was initially set at 100 oC for 2 mins, then gradually raised to
267 oC at 40 oC /min rate and held for 40 mins. The injection was spitless at 280 oC. The ion
source temperature was set at 230 oC, and the transfer line was at 290 oC. No calibration ranges
were needed, as all samples have an internal standard (α-cholestanol). Sterols were identified
by comparing the retention time of the obtained peaks with the retention time of IOC reference
peaks (similar experimental conditions were executed).
Sterol relative amounts (%) were expressed with respect to the internal standard and proportions
of total sterols. The apparent c-Sitosterol was calculated as the sum of c-sitosterol, ∆;-
avenasterol, clerosterol, sitostanol, and ∆;,*=-stigmastadienol.
2.5 Volatile compounds
Volatile compounds of olive oil samples were analyzed using FGC E-nose Heracles II
(AlphaMos, Toulouse, France), equipped with two columns: a non-polar column (MXT5: 5%
diphenyl, 95% methylpolysiloxane, 10 m length and 180 mm diameter) and a slightly polar
column (MXT1701: 14% cyanopropylphenyl, 86% methylpolysiloxane, 10 m length and 180
mm diameter).
500 μL of olive oil was placed in a 20 mL vial and sealed with a cap. The vial present in
Heracles’ auto-samples was then transferred to a shaker oven for 15 min at 80 oC, shaken at 500
rpm. Next, a syringe pierced the cap's silicone septum and sampled 5 mL of the headspace,
which were then adsorbed on a CARBOWAX trap, maintained at 30 oC for 36 s, while the
carrier gas (H2) flowed through it to concentrate the analytes by removing excess air and
moisture. The analytes were then desorbed by increasing the trap's temperature to 240 oC in 90
s, and the sample was injected. The thermal program started at 40 oC (held for 2 s) and increased
to 280 °C at 4 oC /s. The final temperature was held for 21 s. The total separation time was 100
s. At the end of each column, an FID detector was placed, and the acquired signal was
digitalized every 0.01 s.
For calibration, an alkane solution (from n-hexane to n-hexadecane) was used to convert
retention time in Kovats indices and identify the volatile compounds using specific software
(AroChemBase, Alpha MOS, France).
3. Results and Discussion
3.1 Quality parameters and total polyphenol content
The results illustrated in Table 1 show the fundamental differences in the analyzed
physicochemical parameters between olive fruits harvested in October and those in November.
103
The quality parameters of olive oils (acidity and peroxide value) were found to be significantly
different during the two notable harvest dates in Lebanon. On average, acidity values were
0.31% and 1.21 % for HD1 and HD2, respectively, exceeding the limit established by the
International Olive Council (IOC) for oils to be considered extra virgin (0.8 %) for the latter.
The observed increase in November corroborates with other authors (Youssef, Zarrouk et al.,
2010, Fuentes de Mendoza, De Miguel Gordillo et al., 2013). It can be explained by the increase
in lipolytic activity as the olives become more sensitive to mechanical damage and pathogenic
infections (Anastasopoulos, Kalogeropoulos et al., 2011).
Peroxide value of olive oils harvested in November showed a significant increase of about 9.34
meq O2/kg compared to those picked in October. However, the delay in harvesting olive fruits
should show a lower level of peroxide due to the decrease in lipoxygenase activity (Salvador,
Aranda et al., 2001, Alowaiesh, Singh et al., 2016). The significant increase observed in HD2
was unexpected and required further examination. Although an increase was noticed, all olive
oils presented peroxide values that did not exceed the maximum acceptable limit for their
classification as extra virgin olive oils (< 20mEq O2/kg).
K232 and K270 are the markers of olive oil alteration. K232 is in direct relation with poly-
unsaturated fatty acids and peroxide value, whereas K270 relates to aldehyde and ketone
substances. As the harvest date is delayed, the value of K232 increases, while K270 decreases
(Hamidoghli, Jamalizadeh et al., 2008). However, a study by Bengana et al., (2013) showed an
inverse pattern as olive fruit ripens, while in other studies, both indicators decreased with
maturity and depended on olive cultivar and harvest date. In our case, a decrease in K232 and
an increase in K270 were observed for the studied Soury variety shown in Table 1. All studied
samples had K232 and K270 values consistent with the limit defined by IOC for extra virgin
olive oil.
Phenolic compounds are of great organoleptic and nutritional interest. They are associated with
the taste and the oil's stability due to their antioxidant properties (Maga 1978, Nergiz & Ünal
1991). As the harvest time is delayed, oleuropein, the main bitterness-producing component in
olives, progressively decreases (Amiot, Fleuriet et al., 1986, Amiot, Tacchini et al., 1990). This
was confirmed by our results (Table 1), as the total polyphenol content observed for HD1 was
significantly higher than that for HD2. These findings suggest a decline in the oil's oxidative
stability as harvesting is delayed (Gutiérrez, Jímenez et al., 1999, Trentacoste et al., 2020). The
observed decline as ripening advance may be attributed to the polyphenol oxidase that
dominates the final stage of the ripening process and to the fusion of the phenolic acids into the
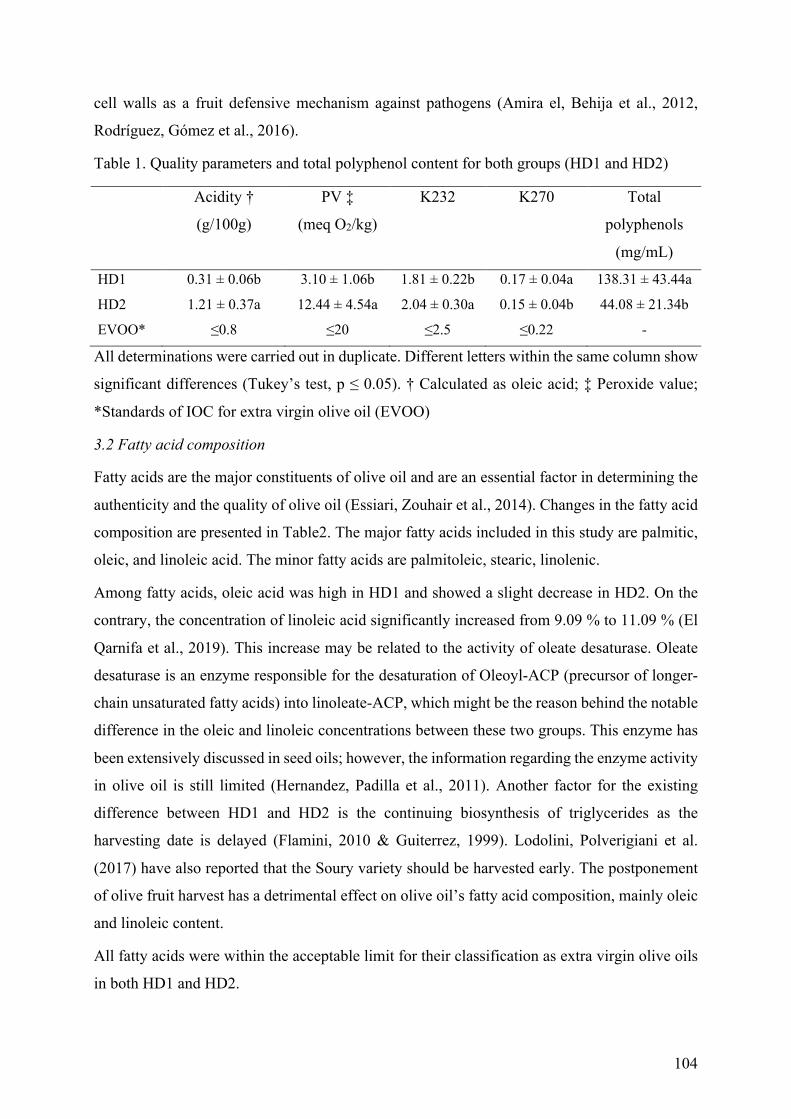
104
cell walls as a fruit defensive mechanism against pathogens (Amira el, Behija et al., 2012,
Rodríguez, Gómez et al., 2016).
Table 1. Quality parameters and total polyphenol content for both groups (HD1 and HD2)
Acidity †
(g/100g)
PV ‡
(meq O2/kg)
K232 K270 Total
polyphenols
(mg/mL)
HD1 0.31 ± 0.06b 3.10 ± 1.06b 1.81 ± 0.22b 0.17 ± 0.04a 138.31 ± 43.44a
HD2 1.21 ± 0.37a 12.44 ± 4.54a 2.04 ± 0.30a 0.15 ± 0.04b 44.08 ± 21.34b
EVOO* ≤0.8 ≤20 ≤2.5 ≤0.22 -
All determinations were carried out in duplicate. Different letters within the same column show
significant differences (Tukey’s test, p ≤ 0.05). † Calculated as oleic acid; ‡ Peroxide value;
*Standards of IOC for extra virgin olive oil (EVOO)
3.2 Fatty acid composition
Fatty acids are the major constituents of olive oil and are an essential factor in determining the
authenticity and the quality of olive oil (Essiari, Zouhair et al., 2014). Changes in the fatty acid
composition are presented in Table2. The major fatty acids included in this study are palmitic,
oleic, and linoleic acid. The minor fatty acids are palmitoleic, stearic, linolenic.
Among fatty acids, oleic acid was high in HD1 and showed a slight decrease in HD2. On the
contrary, the concentration of linoleic acid significantly increased from 9.09 % to 11.09 % (El
Qarnifa et al., 2019). This increase may be related to the activity of oleate desaturase. Oleate
desaturase is an enzyme responsible for the desaturation of Oleoyl-ACP (precursor of longer-
chain unsaturated fatty acids) into linoleate-ACP, which might be the reason behind the notable
difference in the oleic and linoleic concentrations between these two groups. This enzyme has
been extensively discussed in seed oils; however, the information regarding the enzyme activity
in olive oil is still limited (Hernandez, Padilla et al., 2011). Another factor for the existing
difference between HD1 and HD2 is the continuing biosynthesis of triglycerides as the
harvesting date is delayed (Flamini, 2010 & Guiterrez, 1999). Lodolini, Polverigiani et al.
(2017) have also reported that the Soury variety should be harvested early. The postponement
of olive fruit harvest has a detrimental effect on olive oil’s fatty acid composition, mainly oleic
and linoleic content.
All fatty acids were within the acceptable limit for their classification as extra virgin olive oils
in both HD1 and HD2.
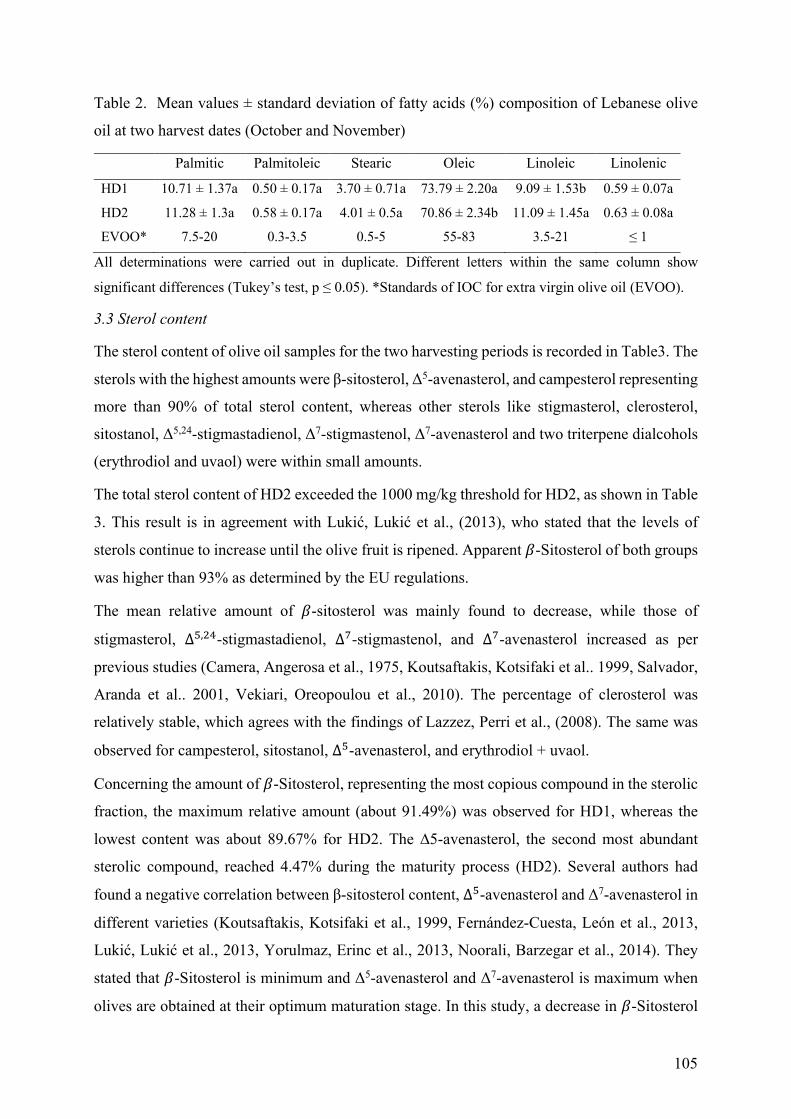
105
Table 2. Mean values ± standard deviation of fatty acids (%) composition of Lebanese olive
oil at two harvest dates (October and November)
Palmitic Palmitoleic Stearic Oleic Linoleic Linolenic
HD1 10.71 ± 1.37a 0.50 ± 0.17a 3.70 ± 0.71a 73.79 ± 2.20a 9.09 ± 1.53b 0.59 ± 0.07a
HD2 11.28 ± 1.3a 0.58 ± 0.17a 4.01 ± 0.5a 70.86 ± 2.34b 11.09 ± 1.45a 0.63 ± 0.08a
EVOO* 7.5-20 0.3-3.5 0.5-5 55-83 3.5-21 ≤ 1
All determinations were carried out in duplicate. Different letters within the same column show
significant differences (Tukey’s test, p ≤ 0.05). *Standards of IOC for extra virgin olive oil (EVOO).
3.3 Sterol content
The sterol content of olive oil samples for the two harvesting periods is recorded in Table3. The
sterols with the highest amounts were β-sitosterol, Δ5-avenasterol, and campesterol representing
more than 90% of total sterol content, whereas other sterols like stigmasterol, clerosterol,
sitostanol, Δ5,24-stigmastadienol, Δ7-stigmastenol, Δ7-avenasterol and two triterpene dialcohols
(erythrodiol and uvaol) were within small amounts.
The total sterol content of HD2 exceeded the 1000 mg/kg threshold for HD2, as shown in Table
3. This result is in agreement with Lukić, Lukić et al., (2013), who stated that the levels of
sterols continue to increase until the olive fruit is ripened. Apparent c-Sitosterol of both groups
was higher than 93% as determined by the EU regulations.
The mean relative amount of c-sitosterol was mainly found to decrease, while those of
stigmasterol, ∆;,*=-stigmastadienol, ∆,-stigmastenol, and ∆,-avenasterol increased as per
previous studies (Camera, Angerosa et al., 1975, Koutsaftakis, Kotsifaki et al.. 1999, Salvador,
Aranda et al.. 2001, Vekiari, Oreopoulou et al., 2010). The percentage of clerosterol was
relatively stable, which agrees with the findings of Lazzez, Perri et al., (2008). The same was
observed for campesterol, sitostanol, ∆;-avenasterol, and erythrodiol + uvaol.
Concerning the amount of c-Sitosterol, representing the most copious compound in the sterolic
fraction, the maximum relative amount (about 91.49%) was observed for HD1, whereas the
lowest content was about 89.67% for HD2. The ∆5-avenasterol, the second most abundant
sterolic compound, reached 4.47% during the maturity process (HD2). Several authors had
found a negative correlation between β-sitosterol content, ∆;-avenasterol and Δ7-avenasterol in
different varieties (Koutsaftakis, Kotsifaki et al., 1999, Fernández-Cuesta, León et al., 2013,
Lukić, Lukić et al., 2013, Yorulmaz, Erinc et al., 2013, Noorali, Barzegar et al., 2014). They
stated that c-Sitosterol is minimum and Δ5-avenasterol and Δ7-avenasterol is maximum when
olives are obtained at their optimum maturation stage. In this study, a decrease in c-Sitosterol
106
content and an increase in Δ7-avenasterol was observed. This complements the results obtained
by the latter authors. However, ∆5-avenasterol content showed no significant differences
between HD1 and HD2 in disagreement with the same research.
The third sterolic compound, the campesterol, reached the highest of 2.10% for HD2. Our
samples presented low levels of this sterol (less than the 4% limit value), and no significant
difference was observed between HD1 and HD2. As for the stigmasterol, the authors found its
high content to be an indicator for lower olive oil/olive fruit quality (JM, S et al., 1996,
Koutsaftakis, Kotsifaki et al., 1999, Gutiérrez and Fernández 2002, Temime, Manai et al.,
2008). This is in agreement with the results shown in Table 1 and Table 3. HD2 (VOO) has a
lower quality than HD1 (EVOO) and thus higher stigmasterol content. The
campesterol/stigmasterol ratio, another parameter classified as a quality index of olive oils
(Koutsaftakis, Kotsifaki et al., 1999), also decreased as the harvest date is delayed. The ∆,-
Stigmastenol and Δ5,24-stigmastadienol witnessed a significant increase in HD2. The primary
factor of this increase is the delay in the harvest. Erythrodiol + uvaol content in all the oil
samples studied was below the limit of 4.5% and was not affected by the delay of harvest time.
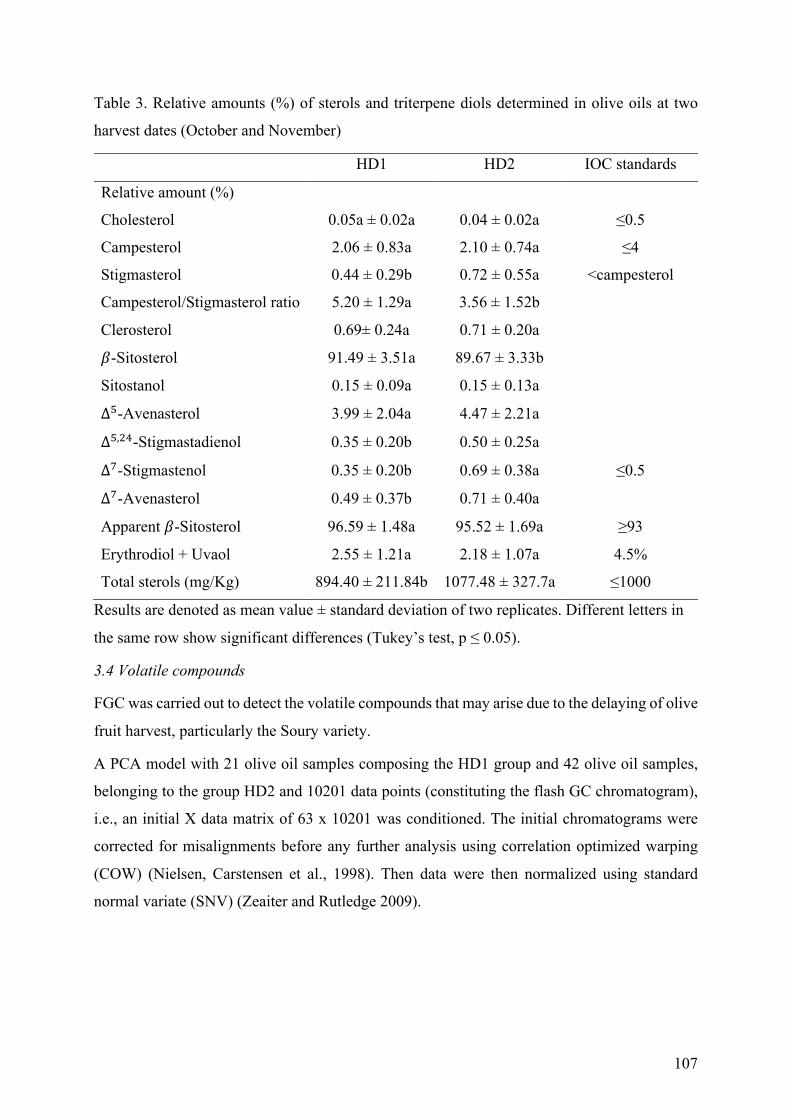
107
Table 3. Relative amounts (%) of sterols and triterpene diols determined in olive oils at two
harvest dates (October and November)
HD1 HD2 IOC standards
Relative amount (%)
Cholesterol 0.05a ± 0.02a 0.04 ± 0.02a ≤0.5
Campesterol 2.06 ± 0.83a 2.10 ± 0.74a ≤4
Stigmasterol 0.44 ± 0.29b 0.72 ± 0.55a <campesterol
Campesterol/Stigmasterol ratio 5.20 ± 1.29a 3.56 ± 1.52b
Clerosterol 0.69± 0.24a 0.71 ± 0.20a
c-Sitosterol 91.49 ± 3.51a 89.67 ± 3.33b
Sitostanol 0.15 ± 0.09a 0.15 ± 0.13a
∆;-Avenasterol 3.99 ± 2.04a 4.47 ± 2.21a
∆;,*=-Stigmastadienol 0.35 ± 0.20b 0.50 ± 0.25a
∆,-Stigmastenol 0.35 ± 0.20b 0.69 ± 0.38a ≤0.5
∆,-Avenasterol 0.49 ± 0.37b 0.71 ± 0.40a
Apparent c-Sitosterol 96.59 ± 1.48a 95.52 ± 1.69a ≥93
Erythrodiol + Uvaol 2.55 ± 1.21a 2.18 ± 1.07a 4.5%
Total sterols (mg/Kg) 894.40 ± 211.84b 1077.48 ± 327.7a ≤1000
Results are denoted as mean value ± standard deviation of two replicates. Different letters in
the same row show significant differences (Tukey’s test, p ≤ 0.05).
3.4 Volatile compounds
FGC was carried out to detect the volatile compounds that may arise due to the delaying of olive
fruit harvest, particularly the Soury variety.
A PCA model with 21 olive oil samples composing the HD1 group and 42 olive oil samples,
belonging to the group HD2 and 10201 data points (constituting the flash GC chromatogram),
i.e., an initial X data matrix of 63 x 10201 was conditioned. The initial chromatograms were
corrected for misalignments before any further analysis using correlation optimized warping
(COW) (Nielsen, Carstensen et al., 1998). Then data were then normalized using standard
normal variate (SNV) (Zeaiter and Rutledge 2009).
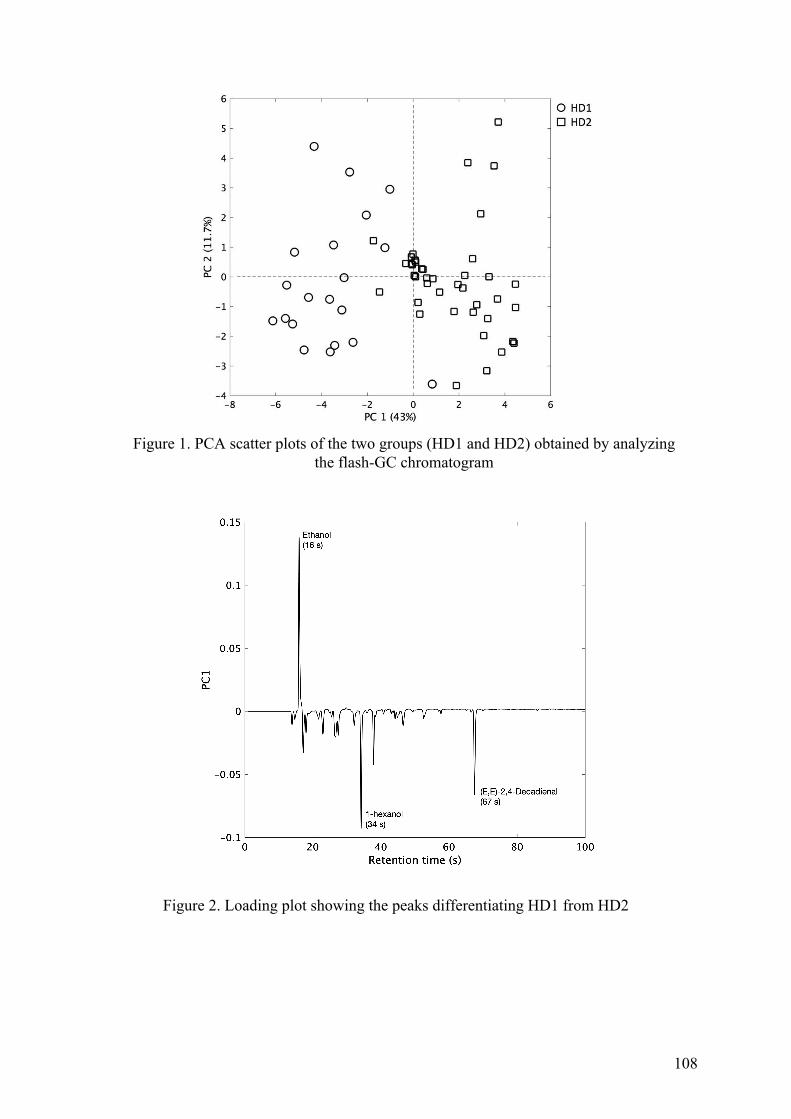
108
Figure 2. Loading plot showing the peaks differentiating HD1 from HD2
Figure 1. PCA scatter plots of the two groups (HD1 and HD2) obtained by analyzing the flash-GC chromatogram
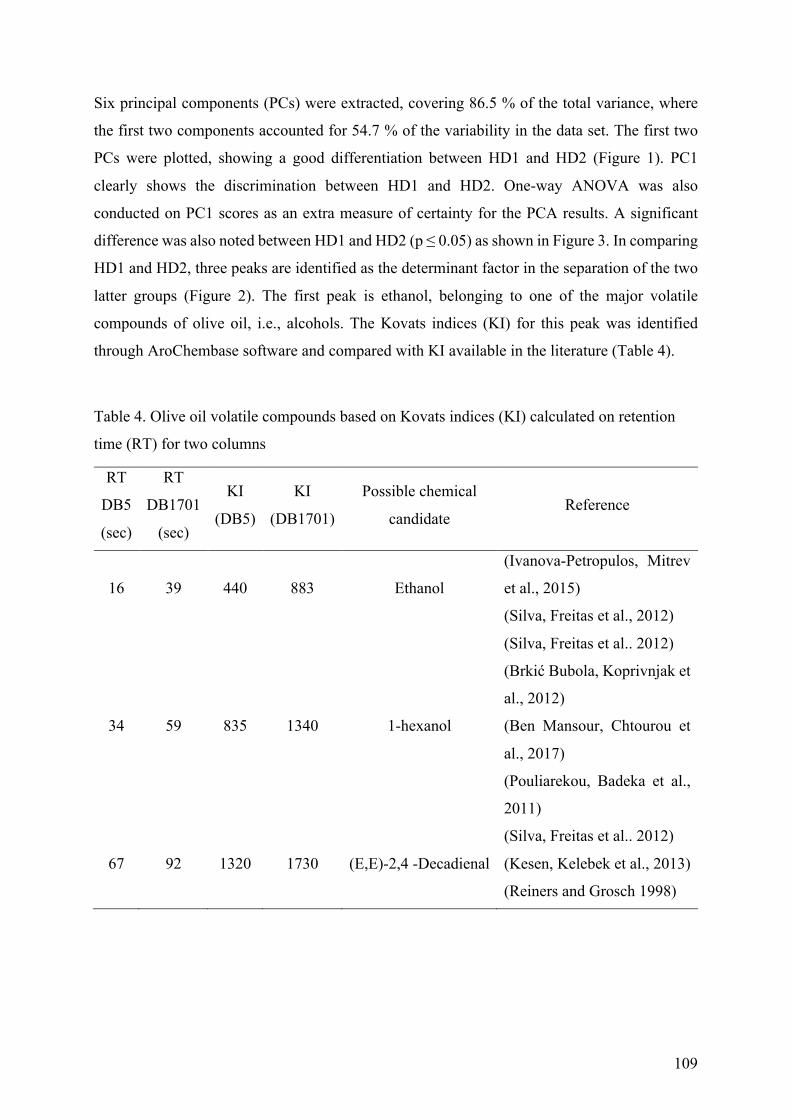
109
Six principal components (PCs) were extracted, covering 86.5 % of the total variance, where
the first two components accounted for 54.7 % of the variability in the data set. The first two
PCs were plotted, showing a good differentiation between HD1 and HD2 (Figure 1). PC1
clearly shows the discrimination between HD1 and HD2. One-way ANOVA was also
conducted on PC1 scores as an extra measure of certainty for the PCA results. A significant
difference was also noted between HD1 and HD2 (p ≤ 0.05) as shown in Figure 3. In comparing
HD1 and HD2, three peaks are identified as the determinant factor in the separation of the two
latter groups (Figure 2). The first peak is ethanol, belonging to one of the major volatile
compounds of olive oil, i.e., alcohols. The Kovats indices (KI) for this peak was identified
through AroChembase software and compared with KI available in the literature (Table 4).
Table 4. Olive oil volatile compounds based on Kovats indices (KI) calculated on retention
time (RT) for two columns
RT
DB5
(sec)
RT
DB1701
(sec)
KI
(DB5)
KI
(DB1701)
Possible chemical
candidate Reference
16 39 440 883 Ethanol
(Ivanova-Petropulos, Mitrev
et al., 2015)
(Silva, Freitas et al., 2012)
34 59 835 1340 1-hexanol
(Silva, Freitas et al.. 2012)
(Brkić Bubola, Koprivnjak et
al., 2012)
(Ben Mansour, Chtourou et
al., 2017)
(Pouliarekou, Badeka et al.,
2011)
67 92 1320 1730 (E,E)-2,4 -Decadienal
(Silva, Freitas et al.. 2012)
(Kesen, Kelebek et al., 2013)
(Reiners and Grosch 1998)
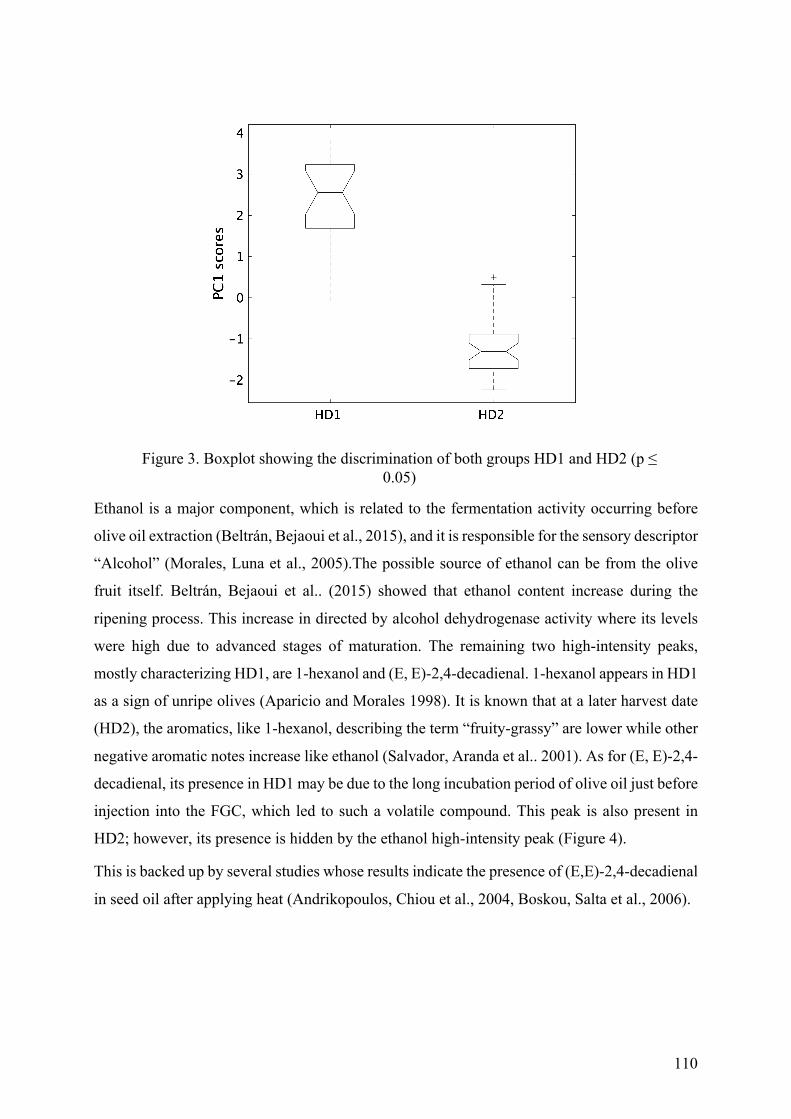
110
Ethanol is a major component, which is related to the fermentation activity occurring before
olive oil extraction (Beltrán, Bejaoui et al., 2015), and it is responsible for the sensory descriptor
“Alcohol” (Morales, Luna et al., 2005).The possible source of ethanol can be from the olive
fruit itself. Beltrán, Bejaoui et al.. (2015) showed that ethanol content increase during the
ripening process. This increase in directed by alcohol dehydrogenase activity where its levels
were high due to advanced stages of maturation. The remaining two high-intensity peaks,
mostly characterizing HD1, are 1-hexanol and (E, E)-2,4-decadienal. 1-hexanol appears in HD1
as a sign of unripe olives (Aparicio and Morales 1998). It is known that at a later harvest date
(HD2), the aromatics, like 1-hexanol, describing the term “fruity-grassy” are lower while other
negative aromatic notes increase like ethanol (Salvador, Aranda et al.. 2001). As for (E, E)-2,4-
decadienal, its presence in HD1 may be due to the long incubation period of olive oil just before
injection into the FGC, which led to such a volatile compound. This peak is also present in
HD2; however, its presence is hidden by the ethanol high-intensity peak (Figure 4).
This is backed up by several studies whose results indicate the presence of (E,E)-2,4-decadienal
in seed oil after applying heat (Andrikopoulos, Chiou et al., 2004, Boskou, Salta et al., 2006).
Figure 3. Boxplot showing the discrimination of both groups HD1 and HD2 (p ≤ 0.05)
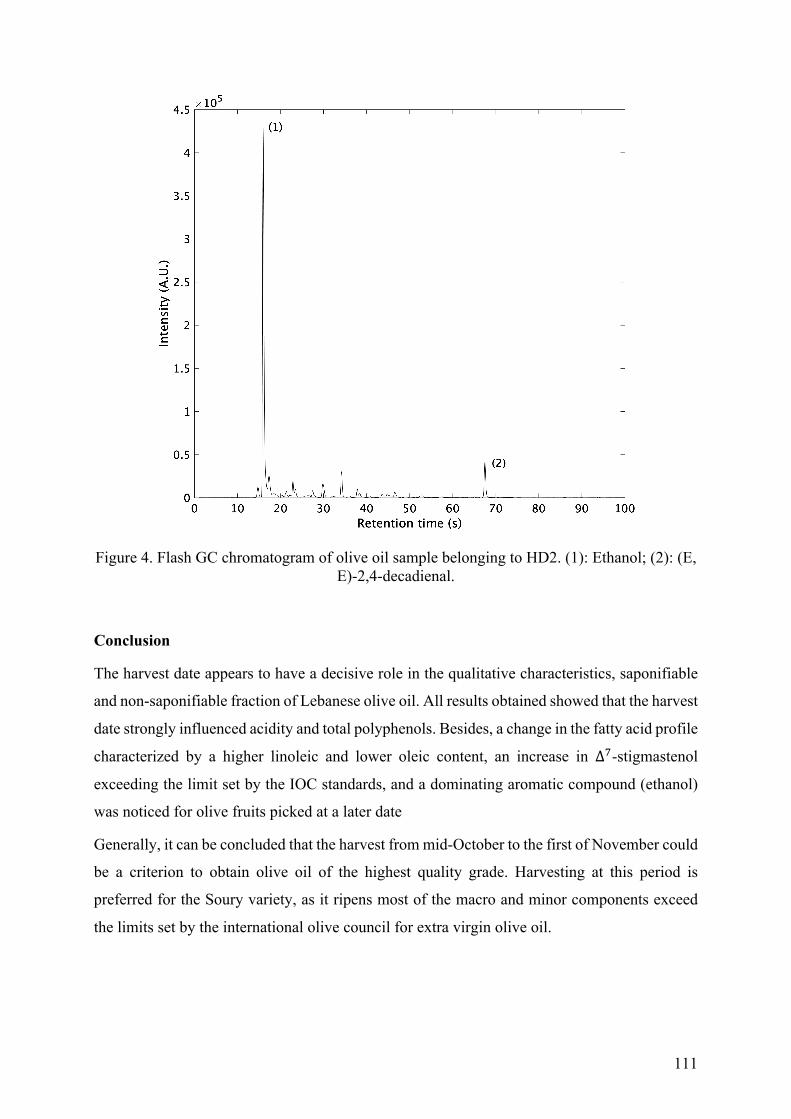
111
Figure 4. Flash GC chromatogram of olive oil sample belonging to HD2. (1): Ethanol; (2): (E, E)-2,4-decadienal.
Conclusion
The harvest date appears to have a decisive role in the qualitative characteristics, saponifiable
and non-saponifiable fraction of Lebanese olive oil. All results obtained showed that the harvest
date strongly influenced acidity and total polyphenols. Besides, a change in the fatty acid profile
characterized by a higher linoleic and lower oleic content, an increase in ∆,-stigmastenol
exceeding the limit set by the IOC standards, and a dominating aromatic compound (ethanol)
was noticed for olive fruits picked at a later date
Generally, it can be concluded that the harvest from mid-October to the first of November could
be a criterion to obtain olive oil of the highest quality grade. Harvesting at this period is
preferred for the Soury variety, as it ripens most of the macro and minor components exceed
the limits set by the international olive council for extra virgin olive oil.
112
Acknowledgments
The authors would like to acknowledge the Lebanese University [504/12/CU] and the National
Council for Scientific Research of Lebanon [5/2106] for their financial support and for granting
a doctoral fellowship to “Omar Dib.” All authors contributed equally to experiment conception,
conduction, data analysis, manuscript writing, and final correction.
References
Alowaiesh, B., Singh, Z. & Kailis, S. (2016). Harvesting time influences fruit removal force,
moisture, oil content, free fatty acids and peroxide in the oil of Frantoio and Manzanilla olive
cultivars. Australian Journal of Crop Science 10: 1662-1668.
http://doi.org/10.21475/ajcs.2016.10.12.p7737
Amiot, M. J., Fleuriet, A. & Macheix, J. J. (1986). Caractérisation des produits de dégradation
de l’oleuropein (Technological debittering process of olives: characterization of fruits before
and during alkaline treatment). Groupe Phenolic: 364-369.
Amiot, M. J., Tacchini, M., Fleuriet, A. & Macheix, J. J. (1990). Le processus téchnologique
de désamérization des olives: caractérisation des fruits avant et pendant le traitement alcalin.
Sci. Alim 10: 619-631.
Amira el, A., et al. (2012). Effects of the ripening stage on phenolic profile, phytochemical
composition and antioxidant activity of date palm fruit. J Agric Food Chem 60(44): 10896-
10902. http://doi.org/10.1021/jf302602v
Anastasopoulos, E., Kalogeropoulos, N., Kaliora, A., Kountouri, A. & Andrikopoulos, N.
(2011). Quality indices, polyphenols, terpenic acids, squalene, fatty acid profile, and sterols in
virgin olive oil produced by organic versus non-organic cultivation method. 152: 135-143.
http://doi.org/10.2495/FENV110141
Andrikopoulos, N., Chiou, A., Mylona, A., Boskou, G. & Dedoussis, G. (2004). Monitoring of
2,4‐decadienal in oils and fats used for frying in restaurants in Athens, Greece. European
Journal of Lipid Science and Technology 106: 671-679. http://doi.org/10.1002/ejlt.200401001
Aparicio, R. & Morales, M. T. (1998). Characterization of Olive Ripeness by Green Aroma
Compounds of Virgin Olive Oil. Journal of Agricultural and Food Chemistry 46(3): 1116-
1122. http://doi.org/10.1021/jf970540o
113
Beayno, F., Mattar, C. & Abdul-Nour, H. (2002). Mgharet al-Houriye (Karm Sadde, caza de
Zgharta): rapport Pre liminaire de la fouille de 2001. Bull Arche ol Archit Liban 6: 135-178.
Beltrán, G., Bejaoui, M. A., Jimenez, A. & Sanchez-Ortiz, A. (2015). Ethanol in Olive Fruit.
Changes during Ripening. Journal of Agricultural and Food Chemistry 63(22): 5309-5312.
http://doi.org/10.1021/acs.jafc.5b01453
Ben Mansour, A., Chtourou, F., Khbou, W., Flamini, G. & Bouaziz, M. (2017). Phenolic and
volatile compounds of Neb Jmel olive oil cultivar according to their geographical origin using
chemometrics. European Food Research and Technology 243(3): 403-418.
http://doi.org/10.1007/s00217-016-2754-5
Bengana, M., et al. (2013). Influence of olive ripeness on chemical properties and phenolic
composition of Chemlal extra-virgin olive oil. Food Research International 54(2): 1868-1875.
https://doi.org/10.1016/j.foodres.2013.08.037
Boskou, G., Salta, F., Chiou, A., Troullidou, E. & Andrikopoulos, N. (2006). Content of
trans,trans‐2,4‐decadienal in deep‐fried and pan‐fried potatoes. European Journal of Lipid
Science and Technology 108: 109-115. http://doi.org/10.1002/ejlt.200500236
Brkić Bubola, K., Koprivnjak, O. & Sladonja, B. (2012). Influence of filtration on volatile
compounds and sensory profile of virgin olive oils. Food Chemistry 132(1): 98-103.
https://doi.org/10.1016/j.foodchem.2011.10.038
Camera, L., Angerosa, F. & Cucurachi, A. (1975). L’evoluzione della frazione sterolica
dell’olio con il procedere della maturazione delle oliv. Estratto Dagli Annali Dell’lnstituto
Sperimentale per la Elaiotecnia Pescara 5: 3-36.
Cordella, C. B. Y. & Bertrand, D. (2013). SAISIR: a new general chemometric toolbox. TrAC
Trends in Analytical Chemistry 54. http://doi.org/10.1016/j.trac.2013.10.009
Dag, A., et al. (2011). Influence of time of harvest and maturity index on olive oil yield and
quality. Scientia Horticulturae 127(3): 358-366. https://doi.org/10.1016/j.scienta.2010.11.008
De La Torre, M. C., Lopez, M. C. & Coleil, J. (1985). Evolución de la fracción esterólica
durante la maduración de las aceitunas. Grasas y Aceites 36(3): 198-202.
114
EEC (2013). Implementing Regulation No 1348/2013 amending Regulation (EEC) No 2568/91
on the characteristics of olive oil and olive-residue oil and on the relevant methods of analysis.
Official Journal of the European Union, 31-67.
El Antari, A., Hilal, A., Boulouha, B. & El Moudni, A. (2000). Etude de l’influence de la variété,
de l’environnement et des techniques culturales sur les caractéristiques des fruits et la
composition chimique de l’huile d’olive vierge extra au Maroc. Olivae.
El Qarnifa, S., El Antari, A., & Hafidi, A. (2019). Effect of Maturity and Environmental
Conditions on Chemical Composition of Olive Oils of Introduced Cultivars in Morocco. Journal
of Food Quality. https://doi.org/10.1155/2019/1854539
Essiari M, Zouhair R & H, C. (2014). Contribution to the study of the typical characteristics of
the virgin olive oils produced in the region of Sais (Morocco). Off J Int Olive Counc 119: 8-21.
Famiani, F., Proietti, P., Farinelli, D. & Tombesi, A. (2002). Oil quality in relation to olive
ripening, International Society for Horticultural Science (ISHS), Leuven, Belgium.
Fernández-Cuesta, A., León, L., Velasco, L. & De la Rosa, R. (2013). Changes in squalene and
sterols associated with olive maturation. Food Research International 54(2): 1885-1889.
https://doi.org/10.1016/j.foodres.2013.07.049
Fiorino, P. & Nizzi, F. (1991). Maturation des olives et variations de certains composants de
l’huile. Olivae 35: 25-33.
Fuentes de Mendoza, M., et al. (2013). Chemical composition of virgin olive oils according to
the ripening in olives. Food Chemistry 141(3): 2575-2581.
https://doi.org/10.1016/j.foodchem.2013.05.074
García, J. M., Seller, S. & Pérez-Camino, M. C. (1996). Influence of Fruit Ripening on Olive
Oil Quality. Journal of Agricultural and Food Chemistry 44(11): 3516-3520.
http://doi.org/10.1021/jf950585u
Gargouri, O. D., et al. (2016). Comparative Study of Oil Quality and Aroma Profiles from
Tunisian Olive Cultivars Growing in Saharian Oasis Using Chemometric Analysis. J Oleo Sci
65(12): 1033-1044. http://doi.org/10.5650/jos.ess15286
115
Gomez, G., Ruiz, J. & Luque de Castro, M. (2011). Oil Content and Fatty Acid Profile of
Spanish Cultivars During Olive Fruit Ripening. Journal of the American Oil Chemists' Society
88(11): 1737-1745. http://doi.org/10.1007/s11746-011-1840-x
Gutiérrez, F. & Fernández, J. L. (2002). Determinant parameters and components in the storage
of virgin olive oil. Prediction of storage time beyond which the oil is no longer of "extra"
quality. J Agric Food Chem 50(3): 571-577. http://doi.org/10.1021/jf0102158
Gutiérrez, F., Jímenez, B., Ruíz, A. & Albi, M. A. (1999). Effect of Olive Ripeness on the
Oxidative Stability of Virgin Olive Oil Extracted from the Varieties Picual and Hojiblanca and
on the Different Components Involved. Journal of Agricultural and Food Chemistry 47(1): 121-
127. http://doi.org/10.1021/jf980684i
Hamidoghli, Y., Jamalizadeh, S. & Malakroudi, M. (2008). Determination of harvesting time
effect on quality and quantity of olive (Olea europea L.) oil in Roudbar regions. J Food Agric
Environ 6. http://world-food.net/download/journals/2008-issue_2/a20.pdf
Hernandez, M. L., Padilla, M. N., Sicardo, M. D., Mancha, M. & Martinez-Rivas, J. M. (2011).
Effect of different environmental stresses on the expression of oleate desaturase genes and fatty
acid composition in olive fruit. Phytochemistry 72(2-3): 178-187.
http://doi.org/10.1016/j.phytochem.2010.11.026
IOC. (2013). Determination of the composition and content of sterols and triterpene dialcohols
by capillary column gas chromatography. International Olive Coucil. COI/ T.20/ Doc. No
30/Rev.1.
IOC. (2017). Method of Analysis, Determination of fatty acid methyl esters by gas
chromatography, International Olive Council. International Olive Coucil. COI/T.20/Doc. No.
33.
IOC. (2018). World olive oil figures. Internation Olive Council, Retrieved 1/04/2020,
http://www.internationaloliveoil.org/estaticos/view/131-world-olive-oil-figures.
Issaoui, M., et al. (2010). Effect of the growing area conditions on differentiation between
Chemlali and Chétoui olive oils. Food Chemistry 119(1): 220-225.
https://doi.org/10.1016/j.foodchem.2009.06.012
116
Ivanova-Petropulos, V., et al. (2015). Characterisation of traditional Macedonian edible oils by
their fatty acid composition and their volatile compounds. Food Research International 77:
506-514. https://doi.org/10.1016/j.foodres.2015.08.014
JM, G., S, S. & MC, P.-C. (1996). Influence of fruit ripening on olive oil quality. Agric Food
Chem 44(11): 3516-3520. https://doi.org/10.1021/jf950585u
Kesen, S., Kelebek, H., Sen, K., Ulas, M. & Selli, S. (2013). GC–MS–olfactometric
characterization of the key aroma compounds in Turkish olive oils by application of the aroma
extract dilution analysis. Food Research International 54(2): 1987-1994.
https://doi.org/10.1016/j.foodres.2013.09.005
Koutsaftakis, A., Kotsifaki, F. & Stefanoudaki, E. (1999). Effect of extraction system, stage of
ripeness, and kneading temperature on the sterol composition of virgin olive oils. Journal of the
American Oil Chemists' Society 76(12): 1477-1481. http://doi.org/10.1007/s11746-999-0188-y
Koutsaftakis, A., Kotsifakis, F. & Stefanoudaki, E. (2000). La caractérisation des huiles d'olive
vierges extra crétoises obtenues à partir de la variété Koroneiki Influence du site d'origine sur
plusieurs paramètres chimiques. Olivae 81: 20-25.
Lazzez, A., Perri, E., Caravita, M. A., Khlif, M. & Cossentini, M. (2008). Influence of Olive
Maturity Stage and Geographical Origin on Some Minor Components in Virgin Olive Oil of
the Chemlali Variety. Journal of Agricultural and Food Chemistry 56(3): 982-988.
http://doi.org/10.1021/jf0722147
Lodolini, E. M., et al. (2017). Oil Characteristics of Four Palestinian Olive Varieties. J Oleo Sci
66(5): 435-441. http://doi.org/10.5650/jos.ess16184
Lukić, M., Lukić, I., Krapac, M., Sladonja, B. & Piližota, V. (2013). Sterols and triterpene diols
in olive oil as indicators of variety and degree of ripening. Food Chem 136(1): 251-258.
http://doi.org/10.1016/j.foodchem.2012.08.005
Maaitah, M., Al-Absi, K. & Al-Rawashdeh, A. (2009). Oil Quality and Quantity of Three Olive
Cultivars as Influenced by Harvesting Date in the Middle and Southern Parts of Jordan. Int. J.
Agr. Biol. 11: 266-272
Maga, J. A. (1978). Simple phenol and phenolic compounds in food flavor. CRC Crit Rev Food
Sci Nutr 10(4): 323-372. http://doi.org/10.1080/10408397809527255
117
Mahfoud, S. (2007). Olive oil: where it all began. Green Gold, the story of Lebanese olive oil.
W. F. Beirut, Turning Point.
Mailer, R. J., Ayton, J. & Graham, K. (2010). The Influence of Growing Region, Cultivar and
Harvest Timing on the Diversity of Australian Olive Oil. Journal of the American Oil Chemists'
Society 87(8): 877-884. http://doi.org/10.1007/s11746-010-1608-8
Montedoro, G., Servili, M., Baldioli, M. & Miniati, E. (1992). Simple and hydrolyzable
phenolic compounds in virgin olive oil. 1. Their extraction, separation, and quantitative and
semiquantitative evaluation by HPLC. Journal of Agricultural and Food Chemistry 40(9):
1571-1576. http://doi.org/10.1021/jf00021a019
Morales, M. T., Luna, G. & Aparicio, R. (2005). Comparative study of virgin olive oil sensory
defects. Food Chemistry 91(2): 293-301. https://doi.org/10.1016/j.foodchem.2004.06.011
Motilva, M.-J. & Romero, M.-P. (2010). Olives and Olive Oil in Health and Disease
Prevention: The Effect of the Ripening Process of the Olive Fruit on the Chlorophyll and
Carotenoid Fractions of Drupes and Virgin Oils. Cambridge: Academic Press, 59-68.
https://doi.org/10.1016/B978-0-12-374420-3.00007-3.
Nergiz, C. & Ünal, K. (1991). Determination of phenolic acids in virgin olive oil. Food
Chemistry 39(2): 237-240. https://doi.org/10.1016/0308-8146(91)90164-J
Nielsen, N.-P. V., Carstensen, J. M. & Smedsgaard, J. (1998). Aligning of single and multiple
wavelength chromatographic profiles for chemometric data analysis using correlation optimised
warping. Journal of Chromatography A 805(1): 17-35. https://doi.org/10.1016/S0021-
9673(98)00021-1
Noorali, M., Barzegar, M. & Sahari, M. A. (2014). Sterol and Fatty Acid Compositions of Olive
Oil as an Indicator of Cultivar and Growing Area. Journal of the American Oil Chemists' Society
91(9): 1571-1581. http://doi.org/10.1007/s11746-014-2497-z
Pouliarekou, E., et al. (2011). Characterization and classification of Western Greek olive oils
according to cultivar and geographical origin based on volatile compounds. Journal of
Chromatography A 1218(42): 7534-7542. https://doi.org/10.1016/j.chroma.2011.07.081
Reiners, J. & Grosch, W. (1998). Odorants of Virgin Olive Oils with Different Flavor Profiles.
Journal of Agricultural and Food Chemistry 46(7): 2754-2763.
http://doi.org/10.1021/jf970940b
118
Rodríguez, J. C., et al. (2016). Effects of the Fruit Ripening Stage on Antioxidant Capacity,
Total Phenolics, and Polyphenolic Composition of Crude Palm Oil from Interspecific Hybrid
Elaeis oleifera x Elaeis guineensis. Journal of Agricultural and Food Chemistry 64(4): 852-
859. http://doi.org/10.1021/acs.jafc.5b04990
Salvador, M. D., Aranda, F. & Fregapane, G. (2001). Influence of fruit ripening on ‘Cornicabra’
virgin olive oil quality A study of four successive crop seasons. Food Chemistry 73(1): 45-53.
https://doi.org/10.1016/S0308-8146(00)00276-4
Silva, M., Freitas, A. M., Cabrita, M. & Garcia, R. (2012). Olive Oil: Olive Oil Composition,
Volatile Compounds. Rijeka: IntechOpen,18-46. https://doi.org/10.5772/28512
Stefanoudaki, E., Chartzoulakis, K., Koutsaftakis, A. & Kotsifaki, F. (2001). Effect of drought
stress on qualitative characteristics of olive oil of cv Koroneiki. Grasas y Aceites 52(3-4): 202-
206. http://doi.org/10.3989/gya.2001.v52.i3-4.358
Temime, S. B., et al. (2008). Sterolic composition of Chétoui virgin olive oil: Influence of
geographical origin. Food Chem 110(2): 368-374.
http://doi.org/10.1016/j.foodchem.2008.02.012
Thalman, J. P. (2000). ‘Tell Arqa’, BAAL. 4: 5-74.
Trentacoste, E. R., Banco, A. P., Piccoli, P., N., & Monasterio, R., P. (2020). Olive oil
characterization of cv. ‘Arauco’ harvested at different times in areas with early frost in
Mendoza, Argentina. J Sci Food Agric 100 (3): 953:960. https://doi.org/10.1002/jsfa.10029
Varzakas, T. H., Zakynthinos, G. & Arapoglou, D. (2010). Fruit ripening in relationship to oil
quality and some quality characteristics of the Greek olive cultivar koroneiki. Italian Journal
of Food Science: IJFS 22: 401-407.
Vekiari, S. A., et al. (2010). Characterization and seasonal variation of the quality of virgin
olive oil of the Throumbolia and Koroneiki varieties from southern Greece. Grasas y Aceites
61(3): 221-231. http://doi.org/10.3989/gya.108709
Yorulmaz, A., Erinc, H. & Tekin, A. (2013). Changes in Olive and Olive Oil Characteristics
During Maturation. Journal of the American Oil Chemists' Society 90(5): 647-658.
http://doi.org/10.1007/s11746-013-2210-7
119
Youssef, N. B., et al. (2010). Effect of olive ripeness on chemical properties and phenolic
composition of chétoui virgin olive oil. Journal of the Science of Food and Agriculture 90(2):
199-204. http://doi.org/10.1002/jsfa.3784
Zeaiter, M. & Rutledge, D. (2009). Preprocessing Methods: Comprehensive Chemometrics.
Oxford: Elsevier, 121-231.

120
121
Chapter 5: Does Variability Affect the Performance of Front-Face
Fluorescence Spectroscopy? A Study Case on Commercial
Lebanese Olive Oil
Fluorescence spectroscopy is known as a rapid, non-invasive and highly sensitive technique for
analysis of food. It is known to be more cost-efficient where analysis can be carried out directly
on the intact samples without any-pretreatment or usage of chemical. This type of spectroscopy
is useful for routine quality control.
This chapter presents the potential of front-face fluorescence spectroscopy coupled with
chemometric techniques, namely multiple linear regression (MLR) applied on parallel factor
(PARAFAC) scores and partial least squares (PLS), to predict Lebanese olive oil samples
possessing a wide range of variability. This variability includes samples harvested at different
dates and from two seasons, processed using different extraction methods, collected from
different altitudes and other factors. Would fluorescence spectroscopy prove its usefulness
again in the grading of olive oil samples with significant savings of analytical measurements?
122
Does Variability Affect the Performance of Front-Face Fluorescence Spectroscopy? A
Study Case on Commercial Lebanese Olive Oil
Omar H. Dib1,2*, Jad Rizkalah2, Rita Yaacoub2, Hussein Dib2, Nathalie Locquet1,4, Luc
Eveleigh3 and Christophe B. Y. Cordella1,4, Ali Bassal2 1 UMR PNCA, AgroParisTech, INRA, Université Paris-Saclay, Paris, France 2 Department of Food Science and Technology, Lebanese University, Beirut, Dekweneh,
Lebanon 3 Ingénierie Procédés Aliments, INRA, AgroParisTech, Université Paris-Saclay, Massy, France 4 C2B research group – Chimiométrie pour la Caractérisation de Biomarqueurs
*Corresponding author: Christophe B.Y. Cordella;
UMR PNCA, AgroParisTech, INRA, Université Paris-Saclay, Paris, France
C2B research group – Chimiométrie pour la Caractérisation de Biomarqueurs
Tel: +33(1)666416900;
Email: ([email protected])
Author contributions
All authors contributed to the study conception and design. Material preparation, data collection
and analysis were performed by Omar H. Dib, Jad Rizkalah, Rita Yaacoub, Hussein Dib,
Nathalie Locquet, Luc Eveleigh, Christophe B. Y. Cordella, and Ali Bassal. The first draft of
the manuscript was written by Omar H.Dib and all authors commented on previous versions of
the manuscript. All authors read and approved the final manuscript.
Acknowledgments
The authors would like to acknowledge the National Council for Scientific Research of Lebanon
(CNRS-L) and the Lebanese University (UL) for their financial support and for granting a
doctoral fellowship to “Omar Dib”. We also would like to thank all olive farmers; whose
assistance was essential to this study execution.
123
Abstract
The potential of front-face fluorescence spectroscopy coupled with chemometric techniques,
namely multiple linear regression (MLR) applied on parallel factor (PARAFAC) scores and
partial least squares (PLS), was tested on Lebanese olive oil samples possessing natural
variability within their chemical parameters. Ninety-six olive oil samples have been harvested
at different dates and from two seasons, processed using different extraction methods, collected
from different altitudes and other factors that can increase the variability of the samples’
chemical composition. Fluorescence excitation-emission matrices (EEM) of the collected
samples were measured, and the relationship between them and the chemical parameters was
examined. Twenty-two MLR regression models based on PARAFAC scores were generated,
the majority of which showed a good correlation coefficient (R>0.7 for ten predicted variables).
A second model using PLS on the unfolded EEM was also conducted to improve the regression
and to assess if it can handle the variability in hand. However, similar results, with a slight
improvement over the MLR model, were obtained. In a non-experimental design, such
variability may hinder the potentials of front-face fluorescence; however average to good MLR
and PLS models were obtained, predicting the Lebanese olive oil deterioration quality
parameters and fatty acid content.
Keywords: Front-face fluorescence; PARAFAC; Lebanese olive oils; Multiple Linear
Regression; Partial Least Square; Variability;
124
Introduction
Lebanese olive oil holds the highest commercial prospects amongst all the other crops covering
about 21% of the cultivated area and 69% of the land cultivated with fruits. Although Lebanon
is considered a small-scale producer of olive oil compared to other Mediterranean countries, it
has the reputation of producing high-quality artisanal oils. This high-end product is increasingly
being exported to countries like Saudi Arabia (2,635 tons), United States (1,315 tons), and
others [1].
To keep up with such high-quality product, particularly olive oil’s nutritional and sensory
properties, specialized institutions such as the International Olive Council (IOC) have set
explicit olive oil quality controls and regulations [2]. These strict controls require diverse
analytical methods of different complexities, ranging from simple procedures (UV
spectrophotometric indices determination) to more complex ones (e.g., determination of the
composition and content of sterols and triterpene dialcohols). The complexity of some of the
procedures is also reflected in the ample time and materials required to determine olive oil
genuineness and quality [3]. Nowadays, the presence of new sample-holder accessories,
software, and numerous chemometrics applications gave way for faster and simpler analytical
tools, i.e., spectroscopic techniques, principally front-face fluorescence spectroscopy.
Front-face fluorescence spectroscopy has been successfully used as a rapid, non-invasive, and
highly sensitive technique for analysis of olive oil quality and showed to be more cost-efficient
compared to other analytical procedures [4]. This type of spectroscopy can be particularly useful
as routine quality control since the analysis is carried out directly on the intact samples without
any-pretreatment or usage of chemical reagents [5]. These advantages have rendered front-face
fluorescence as an important tool in the evaluation of olive oils properties. There are several
published studies showing the diversity of fluorescence applications [6]. These include studies
on the detection of olive oil adulteration with vegetable oils or pomace oil [7,8], on monitoring
thermal oxidation [9-13], on the prediction of origin [14], and quality parameters evaluation
[3,15]. As for the latter application, several studies have showed that the fluorescence
excitation-emission spectra of olive oils contain information on quality parameters such as
acidity, peroxide value, and UV absorbance at 232 nm (K232) and 270 nm (K270).
Acidity, based on IOC, is one of the crucial quality parameters for classification of olive oil into
different categories. The increase in acidity is due to free fatty acids (palmitic, oleic, and linoleic
acids) resulting from triglyceride decomposition. Studies on this parameter have focused on the
fluorescence band at 429-545 nm, which is due to oleic acid [16]. Kyriakidis and Skarkalis [17]
also suggested that the low fluorescence intensities at 445 and 475 nm are attributable to the
125
high content of monounsaturated fatty acids (oleic acid). The study by Poulli, Mousdis, and
Georgiou [16] also showed the link between the fluorescent bands at 273 and 325 nm and
palmitic and linoleic acids, respectively. Other important quality parameters are peroxide value
and K270. These two precursors of primary and secondary oxidation products have also been
linked to high fluorescent intensities at 450-460 nm and 470 nm, respectively [3,18]. The
increase in the fluorescence intensity in these regions is due to the oxidation of fatty acids into
conjugated hydrogen peroxides and conjugated triene and diene systems. The fluorescence
emission spectra also contain information on fluorescent molecules such as chlorophyll (600-
700 nm), Vit E (525 nm), polyphenols, and α-tocopherol (300–390 nm) [17].
A lot of emphasis has been put on the evaluation of olive oil quality using fluorescence
spectroscopy. However, most of the samples in the studies have been altered so that mostly two
groups of olive oil are present: natural state and oxidized state. Thus, a controlled experimental
design, whether in the extraction of olive oil or oxidizing the oil at an incremental temperature,
is consistent throughout the studies [3,9,10,13,19]. Such patterns have probably highlighted the
utmost fluorescence role in predicting olive oil quality (R2 as high as 0.99). However, in a non-
experimental design, several variables exist, such as mode of extraction, harvest time, season
effect, maturity index, storage conditions, etc. that significant affect olive oil quality. The lack
of consistency or fixed pattern might alter the predictive models’ capability of olive oil quality
by fluorescence spectroscopy.
In light of the above, this study offers a practical case in which the efficiency of fluorescence
spectroscopy combined with multi-way and multivariate chemometric tools is used for rapid
quantitative and qualitative characterization of un-altered samples of Lebanese olive oil.
Materials and Methods
Samples
Ninety-six samples of Lebanese olive oil were evaluated in this study. The first two groups of
samples, namely, uncontrolled-2016 (n= 54) and uncontrolled-2017 (n = 20) compromised of
different olive oil qualities, were obtained directly from the farmers during the harvesting
seasons 2016 and 2017. These two groups are referred to as “Uncontrolled” since all the
variables involved in producing olive oil starting from harvesting date to olive oil storage, are
based on the farmers’ practices (Online Resource 1).
The third group (n=22), referred to as controlled, included olive oil that was extracted using an
Abencor analyzer (Mc2 Ingenieria y Sistemas, Seville, Spain) from healthy olive fruits
(collected in 2017 harvesting season) of a maturity index of 1.76 [20]. Olives were crushed
using a hammer mill where the resulting olive paste was distributed into stainless steel
126
containers and kneaded in a mixer at 50 rpm for 30 mins at 28oC. The obtained paste was then
centrifuged at 3500 rpm for 2 mins.
All oils were stored in dark glass bottles at 4oC without headspace until analysis. The
characteristics of all of the studied samples are presented in Table 1.
Physico-chemical parameters determination
Quality indicators
Acidity defined as a percentage of oleic acid (%), peroxide value expressed in milliequivalents
of active oxygen per kilogram of oil (meq O2/kg), and UV spectrophotometric indices (K232,
K270) were determined according to the European Union Commission Regulation EEC No
2568/91 [21]. Spectrophotometric determinations were made using a UV spectrophotometer
(Hitachi U-2900, Spectrophotometer, Japan).
Total polyphenols
The total polyphenol content of olive oil was determined according to Montedoro, Servilli and
Baldiolo et al. [22] at 765 nm by a UV spectrophotometer with a slight modification (Hitachi
U-2900, Spectrophotometer, Japan).
Extraction was carried out on a 5g of oil by adding 10 ml hexane and 15 ml methanol/water
(60:40 v/v). 0.2 ml of the aqueous phase was collected after vortexing for 3 minutes and
centrifuged at 1900 rpm for 12 minutes at 5°C. The aqueous phase was mixed with 5 ml of
Folin–Ciocalteu (1:10 V/V in distilled water) reagent and after 3 mins, with 1 ml of saturated
Na2CO3. The final solution was maintained in a dark place at room temperature for 60 minutes.
Caffeic acid standard solutions were used to calibrate the method (R2 = 0.9995).
Chlorophyll
Chlorophyll concentrations of the samples were determined according to Isabel, Rejano-
Navarro, and Gandul-Rojas et al. [23] with a slight modification in the procedure. 5 g of olive
oil was dissolved in 25 mL of acetone, and the absorbance of the samples at 670 nm and 642,5
nm were measured with a UV spectrophotometer (Hitachi U-2900, Spectrophotometer, Japan).
Fatty acid
The fatty acid methyl esters (FAME) of olive oil were extracted according to the International
Olive Council (IOC) method COI/T.20/Doc. No 33. [24]. The FAME was prepared according
to Part I and Part II of this method.
The fatty acid profile was determined using a gas chromatograph (GC) Shimadzu GC-2025
(Kyoto, Japan) equipped with a capillary column SP-2380 (30 m × 0.32 mm i.d. x 0.20 μm film
thickness; Supelco, Bellefonte, PA, USA) and a flame ionization detector (FID). Injector and
127
detector temperatures were held at 230°C and 240°C, respectively. The injection volume into a
split GC port was 1 μL, and a split injection mode (1/100) was used. The following oven
temperature program was used: initial temperature 165°C held for 10 min; ramped at 1.5°C
min−1 up to 200°C. Helium was employed as the carrier gas at a flow rate of 1 mL/min. Fatty
acids were identified by comparing the retention time of experimental peaks with those obtained
by the external standard mixture.
All physicochemical analyses were performed in duplicates for each sample.
3D front-face fluorescence spectroscopy
3D front-face spectra were measured directly on the olive oil samples without prior preparation
using a fluorescence spectrophotometer (Hitachi, F-7000 FL, 2240-001) equipped with a xenon
lamp, excitation and emission monochromators, and a front-face cell holder. Measurements
were carried out on the samples filled in quartz cuvettes. The front-face angle was set at 56o to
maximize signal to noise ratio. The excitation wavelengths ranged from 280 to 540 nm and
emission wavelengths from 280 to 700 nm, with 20 and 5 nm intervals in excitation and
emission acquisitions, respectively.
Excitation and emission monochromator slit widths were set at 4 nm, and the scan rate was 240
nm.min-1. The photomultiplier (PMT) detector voltage of 350 V was used. All samples were
analyzed in duplicates on two different sides of the cuvette. The excitation-emission matrices
(EEMs) were placed in a 3-way cubic array with the sample in the first mode. [96 x 14 x 85] x
2 duplicates.
Data Processing
Spectral Pretreatment
Rayleigh signals were removed by inserting zero values at λemission ≤ λexcitation (since no emission
is present at wavelengths below the excitation wavelength) and by inserting missing values at
λemission = λexcitation + 5 to λemission = λexcitation + 25 [25,26]. The insertion of zeros and missing
values were performed with homemade algorithms.
Unfold scaling pretreatment
All the EEMs in the pretreated cube were unfolded according to the excitation mode
(transformed into a matrix of the concatenated emissions). Then for each sample, the norm of
all the emissions is used to scale the data (dividing each emission by the norm). The scaled
emissions of all the samples are finally refolded back to reform the three-way array (Fig. 1).
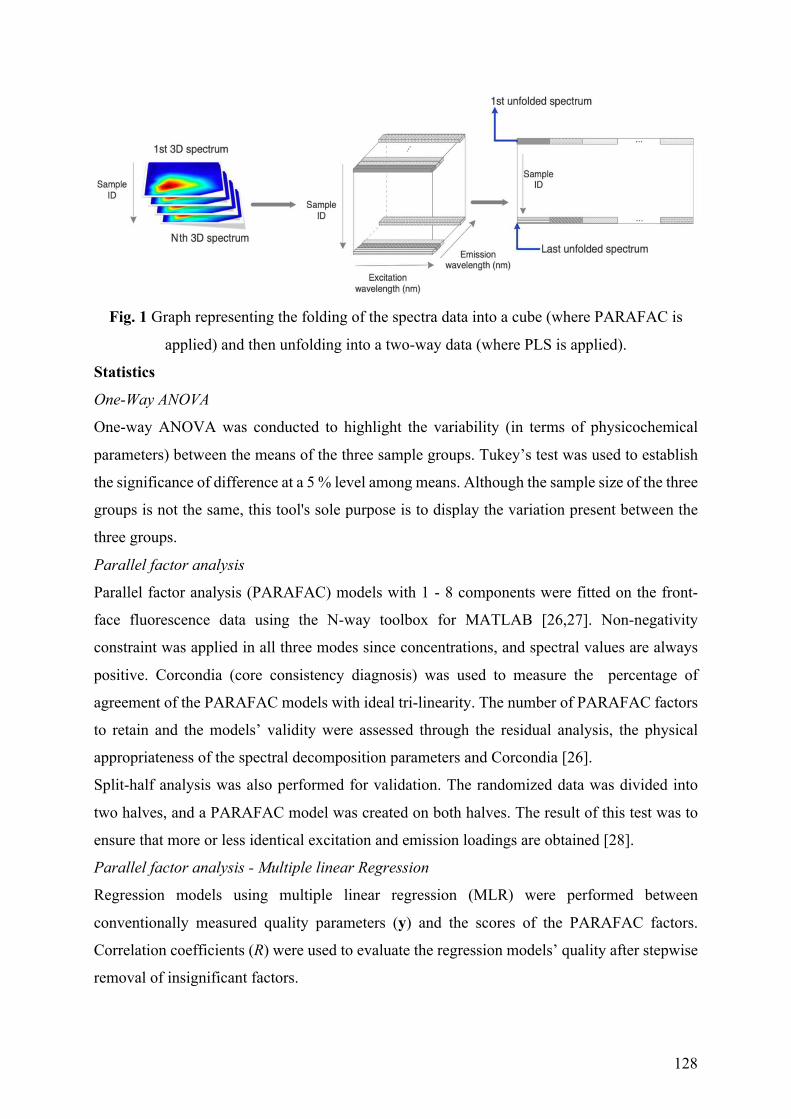
128
Fig. 1 Graph representing the folding of the spectra data into a cube (where PARAFAC is
applied) and then unfolding into a two-way data (where PLS is applied).
Statistics
One-Way ANOVA
One-way ANOVA was conducted to highlight the variability (in terms of physicochemical
parameters) between the means of the three sample groups. Tukey’s test was used to establish
the significance of difference at a 5 % level among means. Although the sample size of the three
groups is not the same, this tool's sole purpose is to display the variation present between the
three groups.
Parallel factor analysis
Parallel factor analysis (PARAFAC) models with 1 - 8 components were fitted on the front-
face fluorescence data using the N-way toolbox for MATLAB [26,27]. Non-negativity
constraint was applied in all three modes since concentrations, and spectral values are always
positive. Corcondia (core consistency diagnosis) was used to measure the percentage of
agreement of the PARAFAC models with ideal tri-linearity. The number of PARAFAC factors
to retain and the models’ validity were assessed through the residual analysis, the physical
appropriateness of the spectral decomposition parameters and Corcondia [26].
Split-half analysis was also performed for validation. The randomized data was divided into
two halves, and a PARAFAC model was created on both halves. The result of this test was to
ensure that more or less identical excitation and emission loadings are obtained [28].
Parallel factor analysis - Multiple linear Regression
Regression models using multiple linear regression (MLR) were performed between
conventionally measured quality parameters (y) and the scores of the PARAFAC factors.
Correlation coefficients (R) were used to evaluate the regression models’ quality after stepwise
removal of insignificant factors.
129
Elimination of outliers was achieved by inspection of leverages and residues, where
observations having high residues and leverages were crossed out to improve the models.
Partial least squares
Partial least squares regression (PLS) is a generalization of the above method (MLR) [29].
However, PLS was used to test the correlation on the unfolded EEM (192 x 1192), i.e.,
unfolding the cube structure from 3-way to 2-way array, unlike the case in MLR where
PARAFAC scores were generated based on the original 3-way array. The unfolded EEM was
then linked to the chemical parameters of the olive oil samples. Data treatment involved mean
centering, and outliers were eliminated by inspecting leverages and residues to improve the PLS
model [30].
Data were analyzed using Matlab version R2015b (The Mathworks Inc., MA, USA).
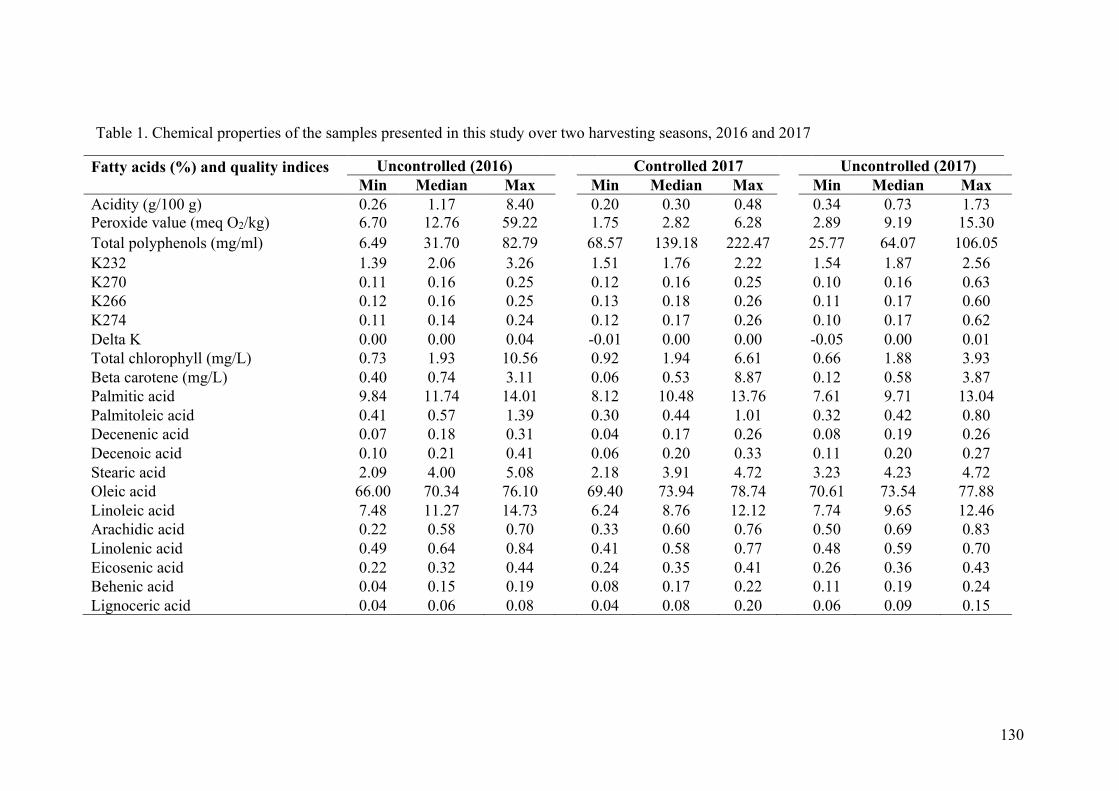
130
Table 1. Chemical properties of the samples presented in this study over two harvesting seasons, 2016 and 2017
Fatty acids (%) and quality indices Uncontrolled (2016) Controlled 2017 Uncontrolled (2017)
Min Median Max Min Median Max Min Median Max
Acidity (g/100 g) 0.26 1.17 8.40 0.20 0.30 0.48 0.34 0.73 1.73
Peroxide value (meq O2/kg) 6.70 12.76 59.22 1.75 2.82 6.28 2.89 9.19 15.30
Total polyphenols (mg/ml) 6.49 31.70 82.79 68.57 139.18 222.47 25.77 64.07 106.05
K232 1.39 2.06 3.26 1.51 1.76 2.22 1.54 1.87 2.56
K270 0.11 0.16 0.25 0.12 0.16 0.25 0.10 0.16 0.63
K266 0.12 0.16 0.25 0.13 0.18 0.26 0.11 0.17 0.60
K274 0.11 0.14 0.24 0.12 0.17 0.26 0.10 0.17 0.62
Delta K 0.00 0.00 0.04 -0.01 0.00 0.00 -0.05 0.00 0.01
Total chlorophyll (mg/L) 0.73 1.93 10.56 0.92 1.94 6.61 0.66 1.88 3.93
Beta carotene (mg/L) 0.40 0.74 3.11 0.06 0.53 8.87 0.12 0.58 3.87
Palmitic acid 9.84 11.74 14.01 8.12 10.48 13.76 7.61 9.71 13.04
Palmitoleic acid 0.41 0.57 1.39 0.30 0.44 1.01 0.32 0.42 0.80
Decenenic acid 0.07 0.18 0.31 0.04 0.17 0.26 0.08 0.19 0.26
Decenoic acid 0.10 0.21 0.41 0.06 0.20 0.33 0.11 0.20 0.27
Stearic acid 2.09 4.00 5.08 2.18 3.91 4.72 3.23 4.23 4.72
Oleic acid 66.00 70.34 76.10 69.40 73.94 78.74 70.61 73.54 77.88
Linoleic acid 7.48 11.27 14.73 6.24 8.76 12.12 7.74 9.65 12.46
Arachidic acid 0.22 0.58 0.70 0.33 0.60 0.76 0.50 0.69 0.83
Linolenic acid 0.49 0.64 0.84 0.41 0.58 0.77 0.48 0.59 0.70
Eicosenic acid 0.22 0.32 0.44 0.24 0.35 0.41 0.26 0.36 0.43
Behenic acid 0.04 0.15 0.19 0.08 0.17 0.22 0.11 0.19 0.24
Lignoceric acid 0.04 0.06 0.08 0.04 0.08 0.20 0.06 0.09 0.15
131
Results and Discussion
One-Way ANOVA
Olive oil quality is usually based on chemical parameters such as acidity, peroxide value, fatty
acids, total polyphenol content and many others. The IOC lay down trade standards and policies
to improve the overall quality of the end product and to ensure the fairness of the competition
[31]. For instance, acidity is one of the leading parameters in classifying olive oil into different
quality categories. This parameter is calculated based on free fatty acids that result from the
triglyceride hydrolysis. Samples with an acidity of ≤0.8 are recognized as the best olive oil
quality (EVOO), as in the case of controlled 2017. The remaining groups have a higher acidity,
thus lower quality, and are recognized as VOO (Table 2). Peroxide value is the second most
important quality parameter and it is used to determine the rancidity of the samples subjected
to oxidation. This parameter is linked to most olive oil chemical parameters like K232, total
polyphenols (antioxidants), and fatty acids. For instance, the increase in peroxide value
coefficient lead to the decrease of polyphenol content in olive oil. This is clearly presented in
Table 2, as the controlled group has the highest total polyphenol content and the lowest PV.
As for fatty acids, the mean concentration of behenic acid, arachidic, and palmitic acid are
different for each of the three groups. As noticed in Table 2, the mean concentration of oleic,
eiconsenic and lignoceric acids is the highest in olive oil samples belonging to controlled and
uncontrolled 2017, and the remaining fatty acids (except for stearic) are the highest in olive oil
samples from uncontrolled 2016. Among the remaining fatty acids are the oleic and linoleic
acids. These two have an inverse relation, where the deterioration in olive oil quality lead to the
increase in linoleic and decrease in oleic acid content, as observed in the uncontrolled group
2016.
According to Table 2, controlled 2017 represents the samples with the best olive oil quality
(EVOO) followed by uncontrolled 2017 and uncontrolled 2016, based on IOC trade standards
for olive oil [31]. For the uncontrolled groups, the variation in the quality indices and fatty acids
results from various factors affecting all stages, from oil formation up to storage. They can be
divided into factors affecting oil before extraction (environmental and climatic conditions, olive
ripeness), or those affecting during oil extraction (milling, oil extraction system) or variables
acting after oil extraction (oil storage, temperature, light) [32]. These factors affect the minor
and major chemical constituents of olive oil, each in its own way. For example, the harvest date
has a determinantal effect on both quality indices and fatty acid profile. In general, as fruit
matures, total polyphenol content decrease, and the amount of polyunsaturated fatty acids like
linoleic and linolenic acids increases [33]. This kind of variation presented within the three
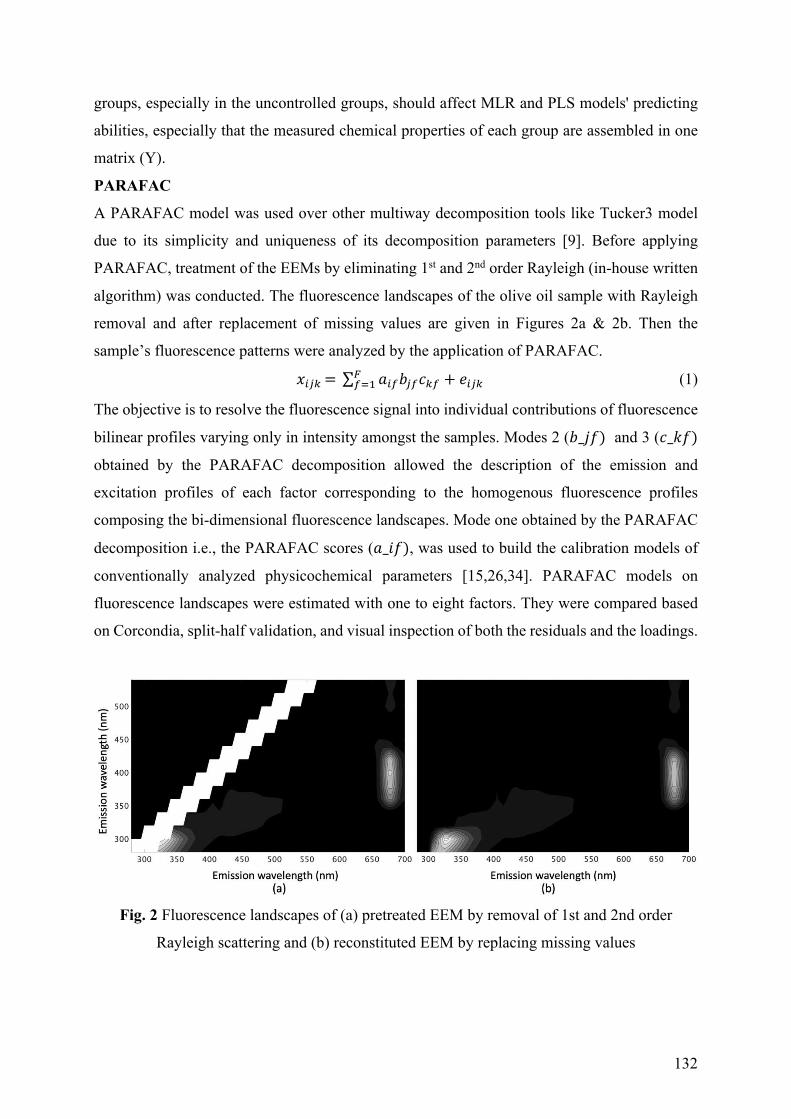
132
groups, especially in the uncontrolled groups, should affect MLR and PLS models' predicting
abilities, especially that the measured chemical properties of each group are assembled in one
matrix (Y).
PARAFAC
A PARAFAC model was used over other multiway decomposition tools like Tucker3 model
due to its simplicity and uniqueness of its decomposition parameters [9]. Before applying
PARAFAC, treatment of the EEMs by eliminating 1st and 2nd order Rayleigh (in-house written
algorithm) was conducted. The fluorescence landscapes of the olive oil sample with Rayleigh
removal and after replacement of missing values are given in Figures 2a & 2b. Then the
sample’s fluorescence patterns were analyzed by the application of PARAFAC.
!!"#=∑ %!%&"%'#% + )!"#&%'( (1)
The objective is to resolve the fluorescence signal into individual contributions of fluorescence
bilinear profiles varying only in intensity amongst the samples. Modes 2 (&_+,) and 3 ('_.,)
obtained by the PARAFAC decomposition allowed the description of the emission and
excitation profiles of each factor corresponding to the homogenous fluorescence profiles
composing the bi-dimensional fluorescence landscapes. Mode one obtained by the PARAFAC
decomposition i.e., the PARAFAC scores (%_/,), was used to build the calibration models of
conventionally analyzed physicochemical parameters [15,26,34]. PARAFAC models on
fluorescence landscapes were estimated with one to eight factors. They were compared based
on Corcondia, split-half validation, and visual inspection of both the residuals and the loadings.
Fig. 2 Fluorescence landscapes of (a) pretreated EEM by removal of 1st and 2nd order
Rayleigh scattering and (b) reconstituted EEM by replacing missing values
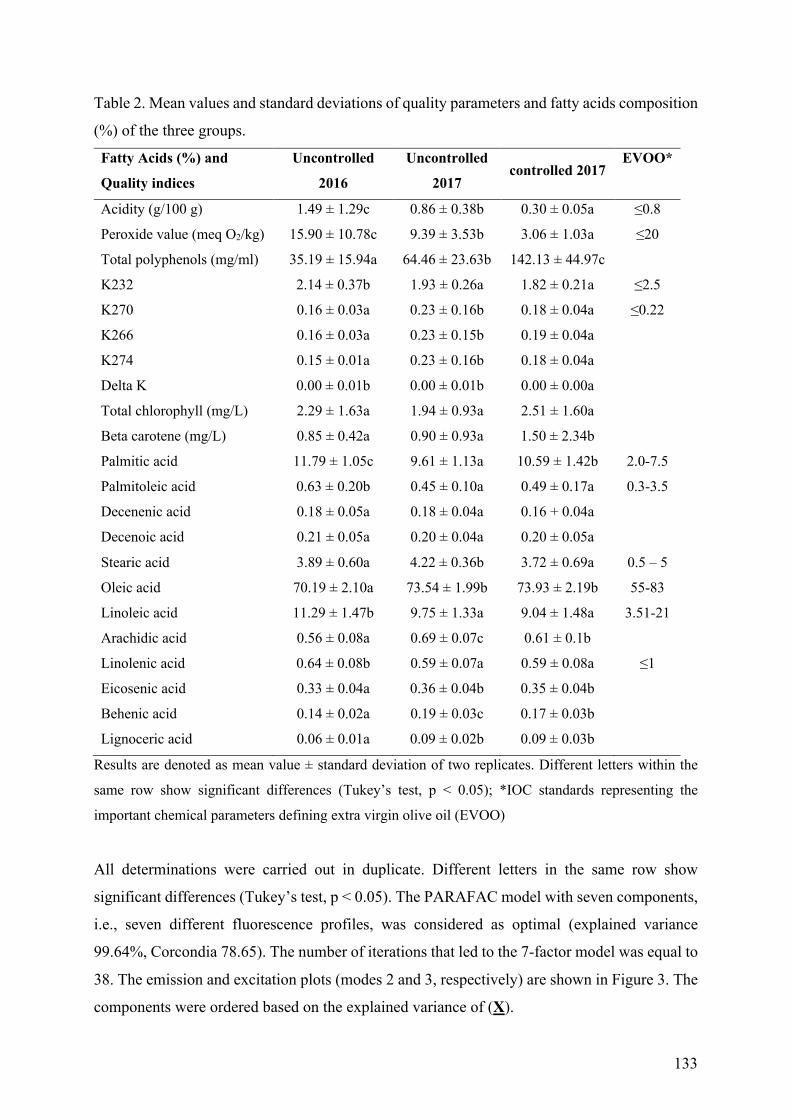
133
Table 2. Mean values and standard deviations of quality parameters and fatty acids composition
(%) of the three groups.
Fatty Acids (%) and
Quality indices
Uncontrolled
2016
Uncontrolled
2017 controlled 2017
EVOO*
Acidity (g/100 g) 1.49 ± 1.29c 0.86 ± 0.38b 0.30 ± 0.05a ≤0.8
Peroxide value (meq O2/kg) 15.90 ± 10.78c 9.39 ± 3.53b 3.06 ± 1.03a ≤20
Total polyphenols (mg/ml) 35.19 ± 15.94a 64.46 ± 23.63b 142.13 ± 44.97c
K232 2.14 ± 0.37b 1.93 ± 0.26a 1.82 ± 0.21a ≤2.5
K270 0.16 ± 0.03a 0.23 ± 0.16b 0.18 ± 0.04a ≤0.22
K266 0.16 ± 0.03a 0.23 ± 0.15b 0.19 ± 0.04a
K274 0.15 ± 0.01a 0.23 ± 0.16b 0.18 ± 0.04a
Delta K 0.00 ± 0.01b 0.00 ± 0.01b 0.00 ± 0.00a
Total chlorophyll (mg/L) 2.29 ± 1.63a 1.94 ± 0.93a 2.51 ± 1.60a
Beta carotene (mg/L) 0.85 ± 0.42a 0.90 ± 0.93a 1.50 ± 2.34b
Palmitic acid 11.79 ± 1.05c 9.61 ± 1.13a 10.59 ± 1.42b 2.0-7.5
Palmitoleic acid 0.63 ± 0.20b 0.45 ± 0.10a 0.49 ± 0.17a 0.3-3.5
Decenenic acid 0.18 ± 0.05a 0.18 ± 0.04a 0.16 + 0.04a
Decenoic acid 0.21 ± 0.05a 0.20 ± 0.04a 0.20 ± 0.05a
Stearic acid 3.89 ± 0.60a 4.22 ± 0.36b 3.72 ± 0.69a 0.5 – 5
Oleic acid 70.19 ± 2.10a 73.54 ± 1.99b 73.93 ± 2.19b 55-83
Linoleic acid 11.29 ± 1.47b 9.75 ± 1.33a 9.04 ± 1.48a 3.51-21
Arachidic acid 0.56 ± 0.08a 0.69 ± 0.07c 0.61 ± 0.1b
Linolenic acid 0.64 ± 0.08b 0.59 ± 0.07a 0.59 ± 0.08a ≤1
Eicosenic acid 0.33 ± 0.04a 0.36 ± 0.04b 0.35 ± 0.04b
Behenic acid 0.14 ± 0.02a 0.19 ± 0.03c 0.17 ± 0.03b
Lignoceric acid 0.06 ± 0.01a 0.09 ± 0.02b 0.09 ± 0.03b
Results are denoted as mean value ± standard deviation of two replicates. Different letters within the
same row show significant differences (Tukey’s test, p < 0.05); *IOC standards representing the
important chemical parameters defining extra virgin olive oil (EVOO)
All determinations were carried out in duplicate. Different letters in the same row show
significant differences (Tukey’s test, p < 0.05). The PARAFAC model with seven components,
i.e., seven different fluorescence profiles, was considered as optimal (explained variance
99.64%, Corcondia 78.65). The number of iterations that led to the 7-factor model was equal to
38. The emission and excitation plots (modes 2 and 3, respectively) are shown in Figure 3. The
components were ordered based on the explained variance of (X).
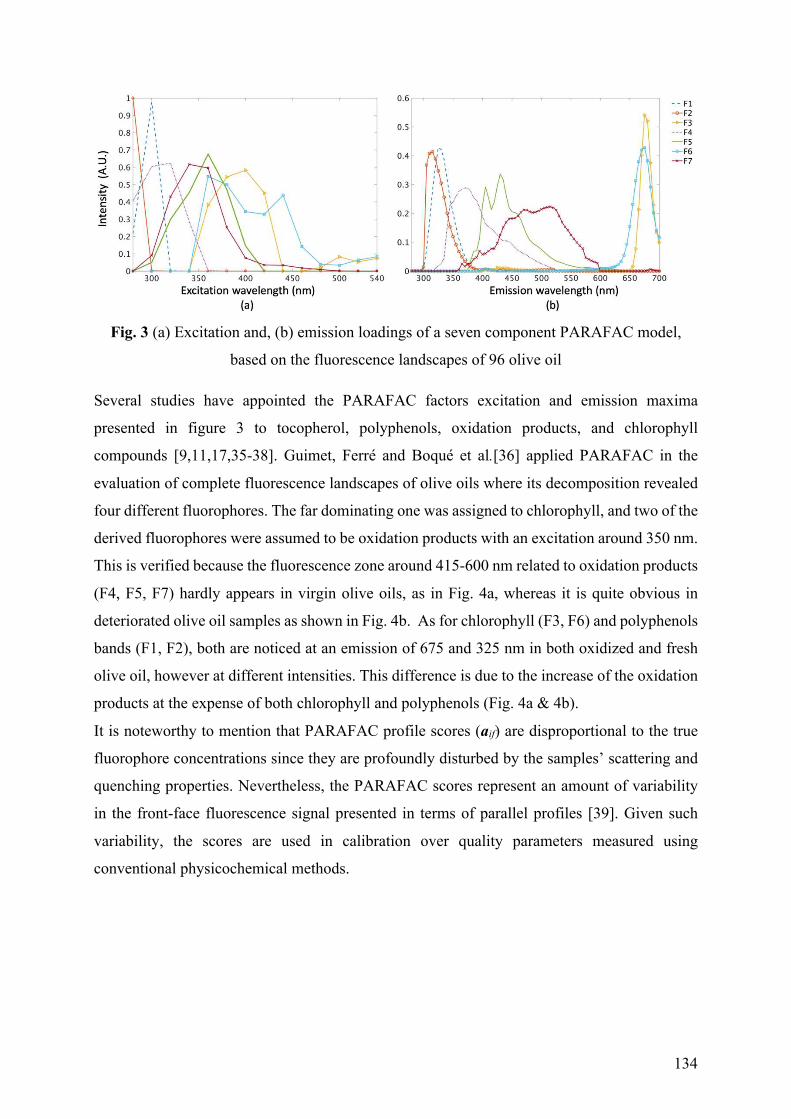
134
Fig. 3 (a) Excitation and, (b) emission loadings of a seven component PARAFAC model,
based on the fluorescence landscapes of 96 olive oil
Several studies have appointed the PARAFAC factors excitation and emission maxima
presented in figure 3 to tocopherol, polyphenols, oxidation products, and chlorophyll
compounds [9,11,17,35-38]. Guimet, Ferré and Boqué et al.[36] applied PARAFAC in the
evaluation of complete fluorescence landscapes of olive oils where its decomposition revealed
four different fluorophores. The far dominating one was assigned to chlorophyll, and two of the
derived fluorophores were assumed to be oxidation products with an excitation around 350 nm.
This is verified because the fluorescence zone around 415-600 nm related to oxidation products
(F4, F5, F7) hardly appears in virgin olive oils, as in Fig. 4a, whereas it is quite obvious in
deteriorated olive oil samples as shown in Fig. 4b. As for chlorophyll (F3, F6) and polyphenols
bands (F1, F2), both are noticed at an emission of 675 and 325 nm in both oxidized and fresh
olive oil, however at different intensities. This difference is due to the increase of the oxidation
products at the expense of both chlorophyll and polyphenols (Fig. 4a & 4b).
It is noteworthy to mention that PARAFAC profile scores (aif) are disproportional to the true
fluorophore concentrations since they are profoundly disturbed by the samples’ scattering and
quenching properties. Nevertheless, the PARAFAC scores represent an amount of variability
in the front-face fluorescence signal presented in terms of parallel profiles [39]. Given such
variability, the scores are used in calibration over quality parameters measured using
conventional physicochemical methods.
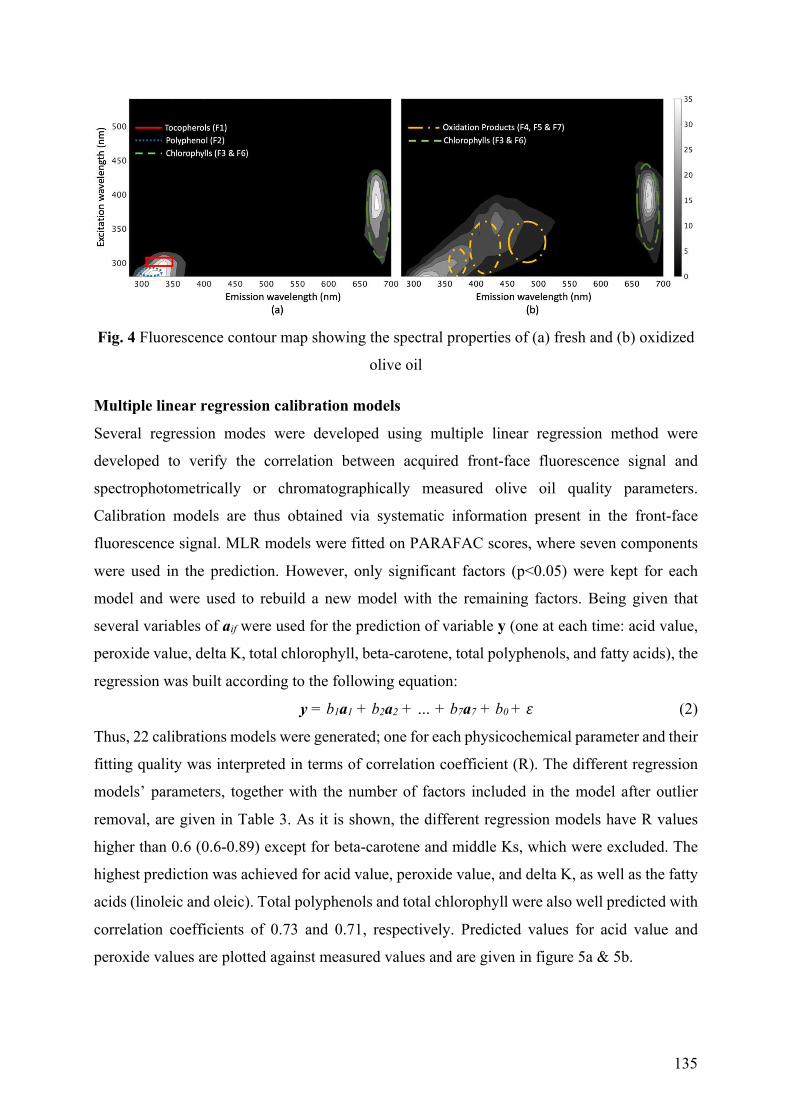
135
Fig. 4 Fluorescence contour map showing the spectral properties of (a) fresh and (b) oxidized
olive oil
Multiple linear regression calibration models
Several regression modes were developed using multiple linear regression method were
developed to verify the correlation between acquired front-face fluorescence signal and
spectrophotometrically or chromatographically measured olive oil quality parameters.
Calibration models are thus obtained via systematic information present in the front-face
fluorescence signal. MLR models were fitted on PARAFAC scores, where seven components
were used in the prediction. However, only significant factors (p<0.05) were kept for each
model and were used to rebuild a new model with the remaining factors. Being given that
several variables of aif were used for the prediction of variable y (one at each time: acid value,
peroxide value, delta K, total chlorophyll, beta-carotene, total polyphenols, and fatty acids), the
regression was built according to the following equation:
y = b1a1 + b2a2 + … + b7a7 + b0 + 0 (2)
Thus, 22 calibrations models were generated; one for each physicochemical parameter and their
fitting quality was interpreted in terms of correlation coefficient (R). The different regression
models’ parameters, together with the number of factors included in the model after outlier
removal, are given in Table 3. As it is shown, the different regression models have R values
higher than 0.6 (0.6-0.89) except for beta-carotene and middle Ks, which were excluded. The
highest prediction was achieved for acid value, peroxide value, and delta K, as well as the fatty
acids (linoleic and oleic). Total polyphenols and total chlorophyll were also well predicted with
correlation coefficients of 0.73 and 0.71, respectively. Predicted values for acid value and
peroxide values are plotted against measured values and are given in figure 5a & 5b.
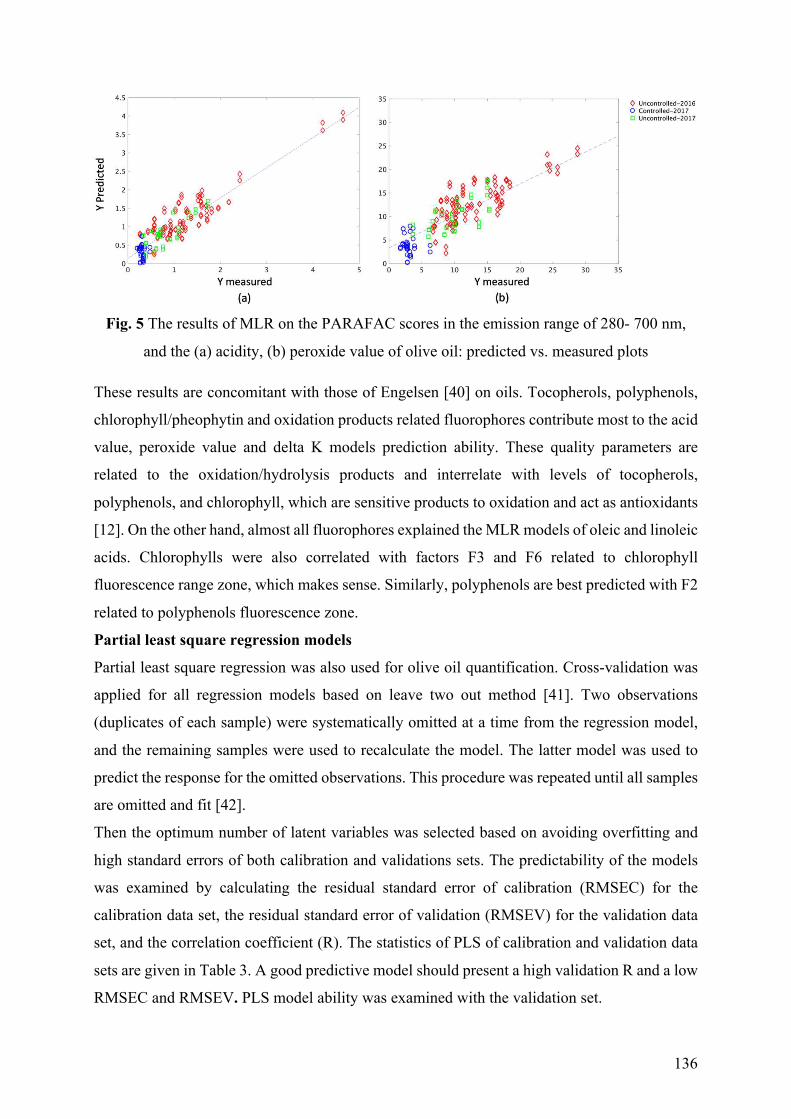
136
Fig. 5 The results of MLR on the PARAFAC scores in the emission range of 280- 700 nm,
and the (a) acidity, (b) peroxide value of olive oil: predicted vs. measured plots
These results are concomitant with those of Engelsen [40] on oils. Tocopherols, polyphenols,
chlorophyll/pheophytin and oxidation products related fluorophores contribute most to the acid
value, peroxide value and delta K models prediction ability. These quality parameters are
related to the oxidation/hydrolysis products and interrelate with levels of tocopherols,
polyphenols, and chlorophyll, which are sensitive products to oxidation and act as antioxidants
[12]. On the other hand, almost all fluorophores explained the MLR models of oleic and linoleic
acids. Chlorophylls were also correlated with factors F3 and F6 related to chlorophyll
fluorescence range zone, which makes sense. Similarly, polyphenols are best predicted with F2
related to polyphenols fluorescence zone.
Partial least square regression models
Partial least square regression was also used for olive oil quantification. Cross-validation was
applied for all regression models based on leave two out method [41]. Two observations
(duplicates of each sample) were systematically omitted at a time from the regression model,
and the remaining samples were used to recalculate the model. The latter model was used to
predict the response for the omitted observations. This procedure was repeated until all samples
are omitted and fit [42].
Then the optimum number of latent variables was selected based on avoiding overfitting and
high standard errors of both calibration and validations sets. The predictability of the models
was examined by calculating the residual standard error of calibration (RMSEC) for the
calibration data set, the residual standard error of validation (RMSEV) for the validation data
set, and the correlation coefficient (R). The statistics of PLS of calibration and validation data
sets are given in Table 3. A good predictive model should present a high validation R and a low
RMSEC and RMSEV. PLS model ability was examined with the validation set.
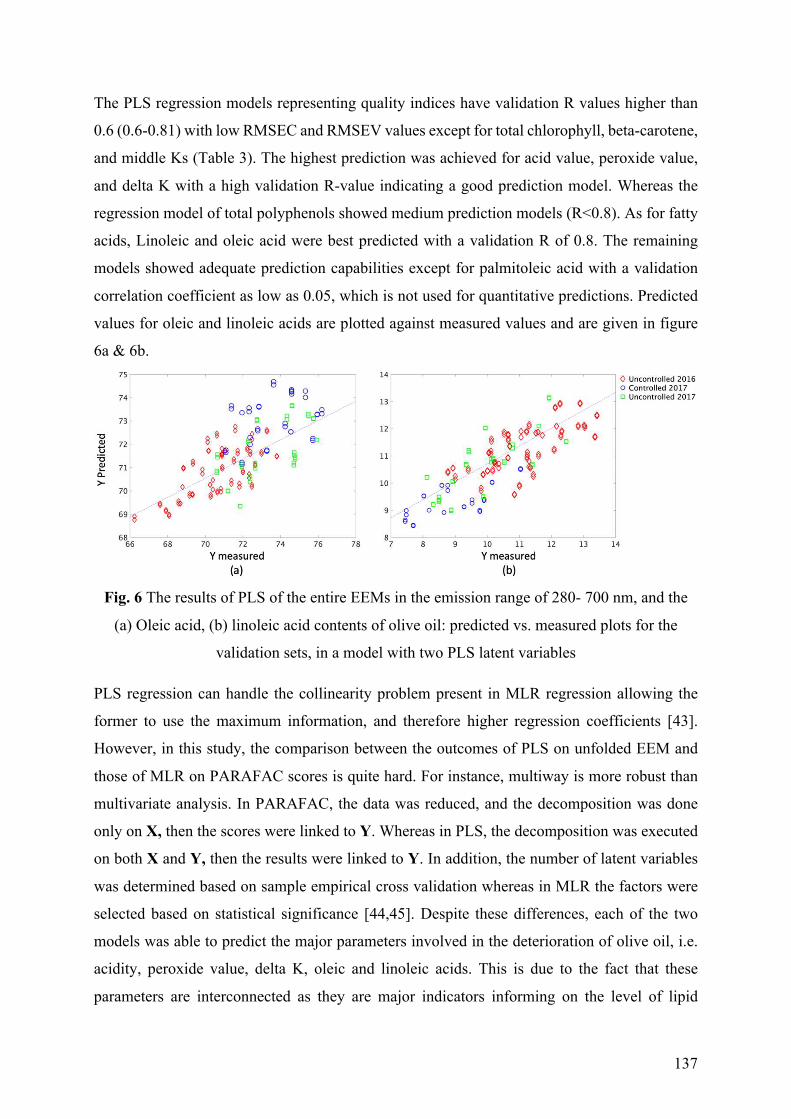
137
The PLS regression models representing quality indices have validation R values higher than
0.6 (0.6-0.81) with low RMSEC and RMSEV values except for total chlorophyll, beta-carotene,
and middle Ks (Table 3). The highest prediction was achieved for acid value, peroxide value,
and delta K with a high validation R-value indicating a good prediction model. Whereas the
regression model of total polyphenols showed medium prediction models (R<0.8). As for fatty
acids, Linoleic and oleic acid were best predicted with a validation R of 0.8. The remaining
models showed adequate prediction capabilities except for palmitoleic acid with a validation
correlation coefficient as low as 0.05, which is not used for quantitative predictions. Predicted
values for oleic and linoleic acids are plotted against measured values and are given in figure
6a & 6b.
Fig. 6 The results of PLS of the entire EEMs in the emission range of 280- 700 nm, and the
(a) Oleic acid, (b) linoleic acid contents of olive oil: predicted vs. measured plots for the
validation sets, in a model with two PLS latent variables
PLS regression can handle the collinearity problem present in MLR regression allowing the
former to use the maximum information, and therefore higher regression coefficients [43].
However, in this study, the comparison between the outcomes of PLS on unfolded EEM and
those of MLR on PARAFAC scores is quite hard. For instance, multiway is more robust than
multivariate analysis. In PARAFAC, the data was reduced, and the decomposition was done
only on X, then the scores were linked to Y. Whereas in PLS, the decomposition was executed
on both X and Y, then the results were linked to Y. In addition, the number of latent variables
was determined based on sample empirical cross validation whereas in MLR the factors were
selected based on statistical significance [44,45]. Despite these differences, each of the two
models was able to predict the major parameters involved in the deterioration of olive oil, i.e.
acidity, peroxide value, delta K, oleic and linoleic acids. This is due to the fact that these
parameters are interconnected as they are major indicators informing on the level of lipid
138
lipolysis or oxidation either when oil is inside the fruit or outside during the extraction process
and storage [29].
It is worth mentioning that the variability presented within the samples (Table 1 & 2) inflicted
both models’ prediction capabilities. Several studies have conducted MLR and PLS prediction
models to show the suitability of fluorescence in detecting the quality parameters of olive oil,
and a correlation coefficient between 0.8 and 0.99 was obtained. However, most of these studies
have examined one or two variables while keeping other variables fixed. For instance, Guimet,
Ferré, and Boqué et al.[18] studied the relation between fluorescence EEM and some quality
parameters (peroxide value, K232, and K270) of different oil qualities (13 extra virgin, 2 virgin,
16 pure and 2 pomace olive oils), keeping the harvest year and storage conditions as fixed
variables. Sikorska, Khmelinskii, and Sikorski et al. [11] demonstrated the use of fluorescence
spectroscopy for monitoring the effect of light on the chlorophyll and total polyphenols content
of extra virgin olive oil, while maintaining the extraction method and harvesting date as constant
variables. Also, Tena, Aparicio, and García-Gonzàlez [12] showed the potential of EEM to
study virgin olive oils thermo-oxidized at a fixed pattern (190°C for 94 h, where a sample of 40
ml was collected every 2 h). The incremental variability aims to add more quality variations,
however, based on the core asset (virgin olive oil). The difference between this study and other
studies is that numerous factors, ranging from agricultural to technological ones, have affected
the minor and major constituents of olive oil in a natural way (Online Resource 1, Tables 1 &
2). In a non-experimental design, this variability cannot be controlled, and thus a random pattern
may appear as a result, which leads to the increase in the number of outliers and the lowering
of the prediction capacity of multivariate models, as shown by MLR and PLS.
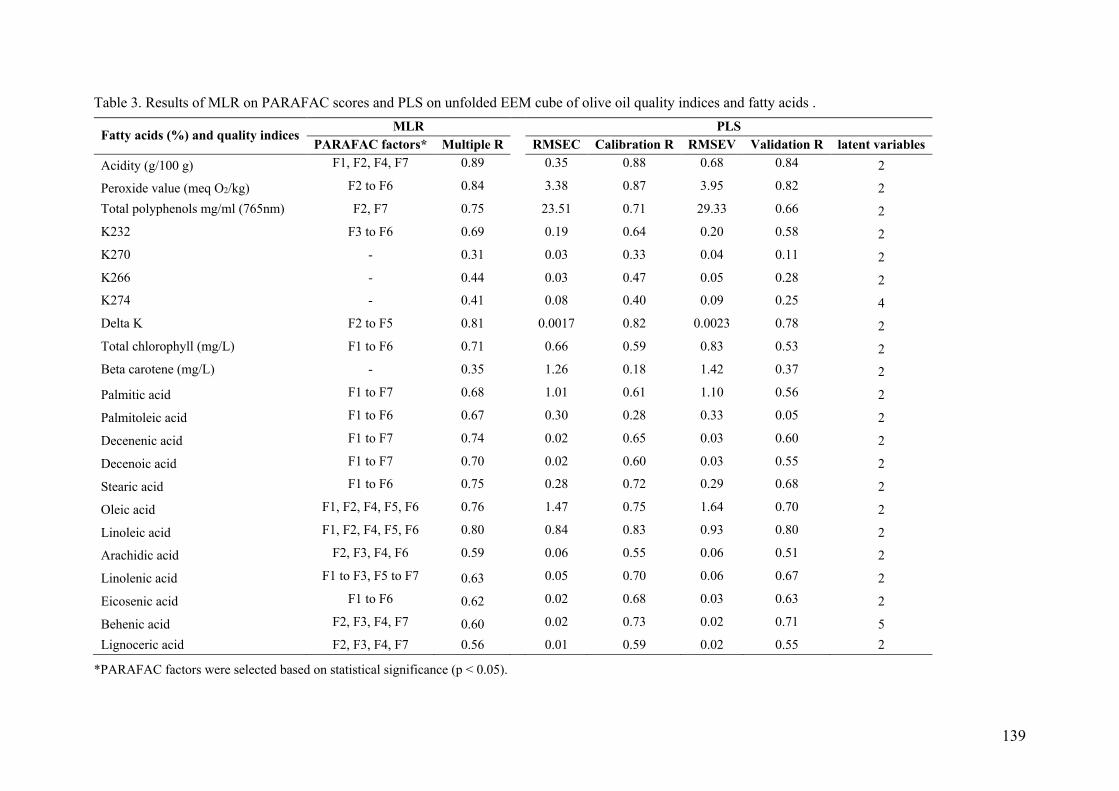
139
Table 3. Results of MLR on PARAFAC scores and PLS on unfolded EEM cube of olive oil quality indices and fatty acids .
*PARAFAC factors were selected based on statistical significance (p < 0.05).
Fatty acids (%) and quality indices MLR PLS
PARAFAC factors* Multiple R RMSEC Calibration R RMSEV Validation R latent variables
Acidity (g/100 g) F1, F2, F4, F7 0.89 0.35 0.88 0.68 0.84 2
Peroxide value (meq O2/kg) F2 to F6 0.84 3.38 0.87 3.95 0.82 2
Total polyphenols mg/ml (765nm) F2, F7 0.75 23.51 0.71 29.33 0.66 2
K232 F3 to F6 0.69 0.19 0.64 0.20 0.58 2
K270 - 0.31 0.03 0.33 0.04 0.11 2
K266 - 0.44 0.03 0.47 0.05 0.28 2
K274 - 0.41 0.08 0.40 0.09 0.25 4
Delta K F2 to F5 0.81 0.0017 0.82 0.0023 0.78 2
Total chlorophyll (mg/L) F1 to F6 0.71 0.66 0.59 0.83 0.53 2
Beta carotene (mg/L) - 0.35 1.26 0.18 1.42 0.37 2
Palmitic acid F1 to F7 0.68 1.01 0.61 1.10 0.56 2
Palmitoleic acid F1 to F6 0.67 0.30 0.28 0.33 0.05 2
Decenenic acid F1 to F7 0.74 0.02 0.65 0.03 0.60 2
Decenoic acid F1 to F7 0.70 0.02 0.60 0.03 0.55 2
Stearic acid F1 to F6 0.75 0.28 0.72 0.29 0.68 2
Oleic acid F1, F2, F4, F5, F6 0.76 1.47 0.75 1.64 0.70 2
Linoleic acid F1, F2, F4, F5, F6 0.80 0.84 0.83 0.93 0.80 2
Arachidic acid F2, F3, F4, F6 0.59 0.06 0.55 0.06 0.51 2
Linolenic acid F1 to F3, F5 to F7 0.63 0.05 0.70 0.06 0.67 2
Eicosenic acid F1 to F6 0.62 0.02 0.68 0.03 0.63 2
Behenic acid F2, F3, F4, F7 0.60 0.02 0.73 0.02 0.71 5
Lignoceric acid F2, F3, F4, F7 0.56 0.01 0.59 0.02 0.55 2
140
Conclusion
This study was dedicated to demonstrating the capabilities of front-face fluorescence coupled
to chemometric tools such as PARAFAC, MLR, and PLS to predict inconsistent qualities of
Lebanese olive oil. Despite the challenging variability present in the Y matrix, certain
deterioration quality parameters and fatty acids were predicted using front-face fluorescence
spectroscopy. Again, this technique proves its usefulness in grading of olive oil samples with
significant savings of analytical measurements specified in the regulations. It makes it possible
to easily link the fluorophores content with the degradation of the samples’ main
physicochemical parameters.
Funding
This research was funded by the National Council for Scientific Research of Lebanon
[5/2106]; and the Lebanese University [504/12/CU].
Conflict of Interest
The authors declare that they have no conflict of interest.
References
1. IDAL (2017) Olive Oil Fact Book. Investment Development Authority of Lebanon.
https://investinlebanon.gov.lb/Content/uploads/SideBlock/171011013554317~Olive%20Oil%
20Factsheet%202017.pdf. Accessed 15 August 2019.
2. IOC (2006) Trade standard applying to olive oils and olive-pomace oils. International Olive
Council COI/T.15/NC No 3/REV. 6. Madrid, Spain
3. Guzman E, Baeten V, Pierna JA, Garcia-Mesa JA (2015) Evaluation of the overall quality of
olive oil using fluorescence spectroscopy. Food Chem 173:927-934. doi:
https://doi.org/10.1016/j.foodchem.2014.10.041
4. Lleo L, Hernandez-Sanchez N, Ammari F, Roger J-M (2016) 3D front-face fluorescence
spectroscopy for characterization of olive oil. Agricultural Engineering International: CIGR
Journal 18:190-199
5. Sikorska E, Romaniuk A, Khmelinskii IV, Herance R, Bourdelande JL, Sikorski M, Kozioł
J (2004) Characterization of Edible Oils Using Total Luminescence Spectroscopy. J, Fluores
14:25-35. doi: https://doi.org/10.1023/B:JOFL.0000014656.75245.62
6. Locquet N, Aït‐Kaddour A, B.Y. Cordella C (2019) 3D Fluorescence Spectroscopy and Its
Applications. Encyclopedia of Analytical Chemistry. pp 1-39. doi:
https://doi.org/10.1002/9780470027318.a9540
141
7. Dankowska A, Małecka M (2009) Application of synchronous fluorescence spectroscopy
for determination of extra virgin olive oil adulteration. Eur J Lipid Sci Technol 111:1233-
1239. doi:https://doi.org/10.1002/ejlt.200800295
8. Sayago A, García-González DL, Morales MT, Aparicio R (2007) Detection of the Presence
of Refined Hazelnut Oil in Refined Olive Oil by Fluorescence Spectroscopy. J Agric Food
Chem 55:2068-2071. doi: https://doi.org/10.1021/jf061875l
9. Cheikhousman R, Zude M, Bouveresse DJ, Leger CL, Rutledge DN, Birlouez-Aragon I
(2005) Fluorescence spectroscopy for monitoring deterioration of extra virgin olive oil during
heating. Anal Bioanal Chem 382 :1438-1443. doi: https://doi.org/10.1007/s00216-005-3286-1
10. Poulli KI, Chantzos NV, Mousdis GA, Georgiou CA (2009) Synchronous fluorescence
spectroscopy: tool for monitoring thermally stressed edible oils. J Agric Food Chem 57:8194-
8201. doi: https://doi.org/10.1021/jf902758d
11. Sikorska E, Khmelinskii IV, Sikorski M, Caponio F, Bilancia MT, Pasqualone A, Gomes T
(2008) Fluorescence spectroscopy in monitoring of extra virgin olive oil during storage. Int J
Food Sci Technol 43:52-61. doi: https://doi.org/10.1111/j.1365-2621.2006.01384.x
12. Tena N, Aparicio R, García-González DL (2012) Chemical changes of thermoxidized virgin
olive oil determined by excitation–emission fluorescence spectroscopy (EEFS). Food Res Int
45:103-108. doi:https://doi.org/10.1016/j.foodres.2011.10.015
13. Tena N, García-González DL, Aparicio R (2009) Evaluation of Virgin Olive Oil Thermal
Deterioration by Fluorescence Spectroscopy. J Agric Food Chem 57:10505-10511. doi:
https://doi.org/10.1021/jf902009b
14. Dupuy N, Le Dréau Y, Ollivier D, Artaud J, Pinatel C, Kister J (2005) Origin of French
Virgin Olive Oil Registered Designation of Origins Predicted by Chemometric Analysis of
Synchronous Excitation−Emission Fluorescence Spectra. J Agric Food Chem 53:9361-9368.
doi: https://doi.org/10.1021/jf051716m
15. Guimet F, Boqué R, Ferré J (2004) Cluster Analysis Applied to the Exploratory Analysis of
Commercial Spanish Olive Oils by Means of Excitation−Emission Fluorescence Spectroscopy.
J Agric Food Chem 52 :6673-6679. doi: https://doi.org/10.1021/jf040169m
16. Poulli KI, Mousdis GA, Georgiou CA (2005) Classification of edible and lampante virgin
olive oil based on synchronous fluorescence and total luminescence spectroscopy. Anal Chim
Acta 542:151-156. doi:https://doi.org/10.1016/j.aca.2005.03.061
17. Kyriakidis NB, Skarkalis P (2000) Fluorescence spectra measurement of olive oil and other
vegetable oils. J AOAC Int 83:1435-1439
142
18. Guimet F, Ferre J, Boque R, Vidal M, Garcia J (2005) Excitation-emission fluorescence
spectroscopy combined with three-way methods of analysis as a complementary technique for
olive oil characterization. J Agric Food Chem 53:9319-9328. doi:
https://doi.org/10.1021/jf051237n
19. Aparicio-Ruiz R, Tena N, Romero del Río I, Aparicio R, L. García-González D, Morales
M (2018) Predicting extra virgin olive oil freshness during storage by fluorescence
spectroscopy. Grasas Aceites 68:219. doi: https://doi.org/10.3989/gya.0332171
20. Uceda M, Frías L (1975) Evolución del contenido graso del fruto y de la composición y
calidad del aceite. In: IOOC (ed) Proc. of II Seminario Oleícola International. , Córdoba, Spain.
21. EEC (2013) Implementing Regulation No 1348/2013 amending Regulation (EEC) No
2568/91 on the characteristics of olive oil and olive-residue oil and on the relevant methods of
analysis. Official Journal of the European Union 31-67.
22. Montedoro G, Servili M, Baldioli M, Miniati E (1992) Simple and hydrolyzable phenolic
compounds in virgin olive oil. 1. Their extraction, separation, and quantitative and
semiquantitative evaluation by HPLC. J Agric Food Chem 40:1571-1576. doi:
https://doi.org/10.1021/jf00021a019
23. Isabel Minguez-Mosquera M, Rejano-Navarro L, Gandul-Rojas B, SanchezGomez AH,
Garrido-Fernandez J (1991) Color-pigment correlation in virgin olive oil. J Am Oil Chem Soc
68:332-336. doi: https://doi.org/10.1007/BF02657688
24. IOC (2017) Method of Analysis, Determination of fatty acid methyl esters by gas
chromatography. International Olive Council ,COI/T.20/Doc. No. 33. Madrid, Spain
25. Elcoroaristizabal S, Bro R, García JA, Alonso L (2015) PARAFAC models of fluorescence
data with scattering: A comparative study. Chemometrics Intellig Lab Syst 142:124-130.
doi:https://doi.org/10.1016/j.chemolab.2015.01.017
26. Andersen CM, Bro R (2003) Practical aspects of PARAFAC modeling of fluorescence
excitation-emission data. J Chemom 17:200-215. doi: https://doi.org/10.1002/cem.790
27. Andersson CA, Bro R (2000) The N-way Toolbox for MATLAB. Chemometrics Intellig
Lab Syst 52:1-4. doi:https://doi.org/10.1016/S0169-7439(00)00071-X
28. Harshman RA, Lundy ME (1994) PARAFAC: Parallel factor analysis. Comput Stat Data
Anal 18:39-72. doi:https://doi.org/10.1016/0167-9473(94)90132-5
29. Wold S, Sjostrom M, Eriksson L (2001) PLS-regression: A Basic Tool of Chemometrics.
Chemometrics Intellig Lab Syst 58:109-130. doi: https://doi.org/10.1016/S0169-
7439(01)00155-1
143
30. Martens H, Næs T (1984) Multivariate Calibration. In: Kowalski BR (ed) Chemometrics:
Mathematics and Statistics in Chemistry. Springer Netherlands, Dordrecht, pp 147-156.
31. IOC (2011) Trade standards applying to olive oils and olive-pomace oils. International Olive
Council, COI/T.15/ NC, No. 3/Rev. 6, 4–5. Madrid, Spain
32. Velasco J, Dobarganes C (2002) Oxidative stability of virgin olive oil. Eur J Lipid Sci
Technol 104:661-676. doi: https://doi.org/10.1002/1438-9312(200210)104:9/10<661::AID-
EJLT661>3.0.CO;2-D
33. Ayton J, Mailer RJ, Haigh A, Tronson D, Conlan D (2007) Quality and oxidative stability
of australian olive oil according to harvest date and irrigation. J Food Lipids 14:138-156.
https://doi.org/doi:10.1111/j.1745-4522.2007.00076.x
34. Durán Merás I, Domínguez Manzano J, Airado Rodríguez D, Muñoz de la Peña A (2018)
Detection and quantification of extra virgin olive oil adulteration by means of autofluorescence
excitation-emission profiles combined with multi-way classification. Talanta 178:751-762.
doi:https://doi.org/10.1016/j.talanta.2017.09.095
35. Ammari F, Cordella CBY, Boughanmi N, Rutledge DN (2012) Independent components
analysis applied to 3D-front-face fluorescence spectra of edible oils to study the antioxidant
effect of Nigella sativa L. extract on the thermal stability of heated oils. Chemometrics Intellig
Lab Syst 113:32-42. doi:https://doi.org/10.1016/j.chemolab.2011.06.005
36. Guimet F, Ferré J, Boqué R, Rius FX (2004) Application of unfold principal component
analysis and parallel factor analysis to the exploratory analysis of olive oils by means of
excitation–emission matrix fluorescence spectroscopy. Anal Chim Acta 515:75-85.
doi:https://doi.org/10.1016/j.aca.2004.01.008
37. Sikorska E, Górecki T, Khmelinskii IV, Sikorski M, Kozioł J (2005) Classification of edible
oils using synchronous scanning fluorescence spectroscopy. Food Chem 89:217-225.
doi:https://doi.org/10.1016/j.foodchem.2004.02.028
38. Zandomeneghi M, Carbonaro L, Caffarata C (2005) Fluorescence of vegetable oils: olive
oils. J Agric Food Chem 53:759-766. doi: https://doi.org/10.1021/jf048742p
39. Zude-Sasse M (2009) Optical Monitoring of Fresh and Processed Agricultural Crops. ISBN
9781420054026.
40. Engelsen SB (1997) Explorative spectrometric evaluations of frying oil deterioration. J Am
Oil Chem Soc 74:1495. doi: https://doi.org/10.1007/s11746-997-0068-2
41. Haaland DM, Thomas EV (1988) Partial least-squares methods for spectral analyses. 1.
Relation to other quantitative calibration methods and the extraction of qualitative information.
Anal Chem 60:1193-1202. doi: https://doi.org/10.1021/ac00162a020
144
42. Gurdeniz G, Tokatli F, Ozen B (2007) Differentiation of mixtures of monovarietal olive oils
by mid‐infrared spectroscopy and chemometrics. Eur J Lipid Sci Technol 109:1194-1202. doi:
https://doi.org/10.1002/ejlt.200700087
43. Put R, Vander Heyden Y (2007) Review on modelling aspects in reversed-phase liquid
chromatographic quantitative structure-retention relationships. Anal Chim Acta 602:164-172.
doi: https://doi.org/10.1016/j.aca.2007.09.014
44. Alexopoulos EC (2010) Introduction to multivariate regression analysis. Hippokratia 14
:23-28
45. Wold S, Sjöström M, Eriksson L (2001) PLS-regression: a basic tool of chemometrics.
Chemometrics Intellig Lab Syst 58:109-130. doi:https://doi.org/10.1016/S0169-
7439(01)00155-1
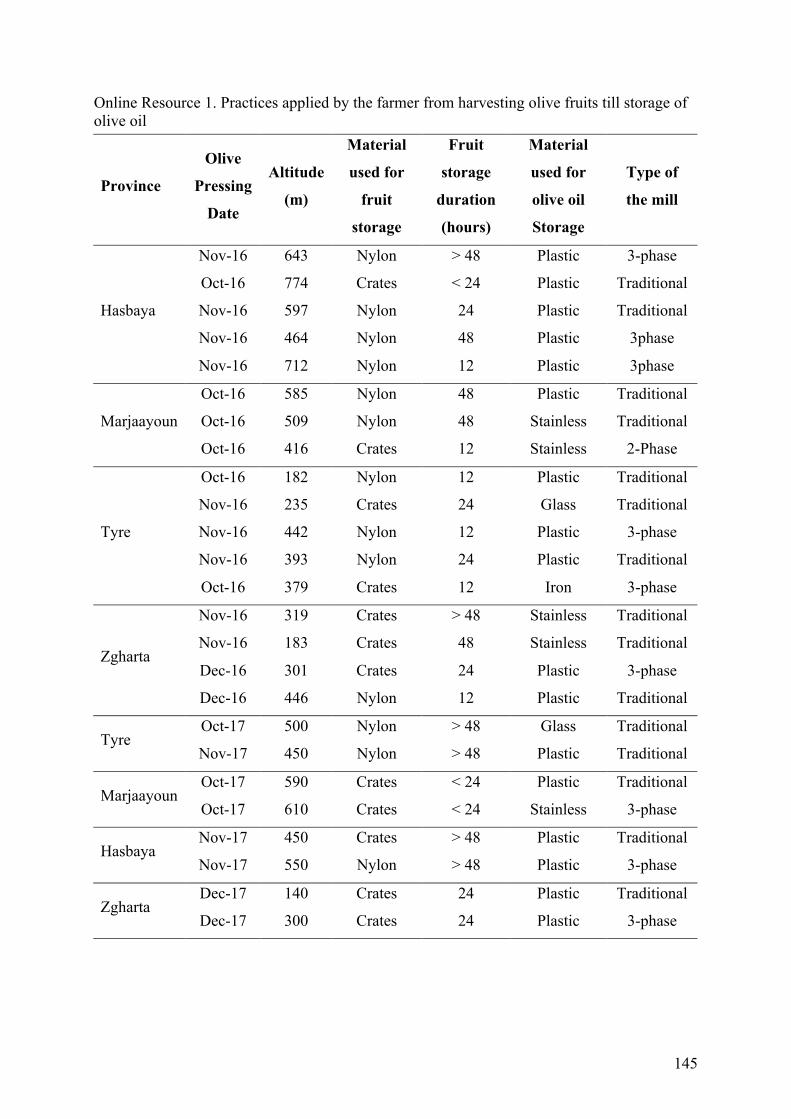
145
Online Resource 1. Practices applied by the farmer from harvesting olive fruits till storage of olive oil
Province
Olive
Pressing
Date
Altitude
(m)
Material
used for
fruit
storage
Fruit
storage
duration
(hours)
Material
used for
olive oil
Storage
Type of
the mill
Hasbaya
Nov-16 643 Nylon > 48 Plastic 3-phase
Oct-16 774 Crates < 24 Plastic Traditional
Nov-16 597 Nylon 24 Plastic Traditional
Nov-16 464 Nylon 48 Plastic 3phase
Nov-16 712 Nylon 12 Plastic 3phase
Marjaayoun
Oct-16 585 Nylon 48 Plastic Traditional
Oct-16 509 Nylon 48 Stainless Traditional
Oct-16 416 Crates 12 Stainless 2-Phase
Tyre
Oct-16 182 Nylon 12 Plastic Traditional
Nov-16 235 Crates 24 Glass Traditional
Nov-16 442 Nylon 12 Plastic 3-phase
Nov-16 393 Nylon 24 Plastic Traditional
Oct-16 379 Crates 12 Iron 3-phase
Zgharta
Nov-16 319 Crates > 48 Stainless Traditional
Nov-16 183 Crates 48 Stainless Traditional
Dec-16 301 Crates 24 Plastic 3-phase
Dec-16 446 Nylon 12 Plastic Traditional
Tyre Oct-17 500 Nylon > 48 Glass Traditional
Nov-17 450 Nylon > 48 Plastic Traditional
Marjaayoun Oct-17 590 Crates < 24 Plastic Traditional
Oct-17 610 Crates < 24 Stainless 3-phase
Hasbaya Nov-17 450 Crates > 48 Plastic Traditional
Nov-17 550 Nylon > 48 Plastic 3-phase
Zgharta Dec-17 140 Crates 24 Plastic Traditional
Dec-17 300 Crates 24 Plastic 3-phase

146
147
Chapter 6: General Results and Discussion
The purpose of this work is to search and demonstrate the link between environmental aspects
(region, climate, altitude and soil conditions) in Lebanon and cultivation/harvesting techniques
(processing, harvest date, time, cultivar) and the resulting physico-chemical characteristics of
Lebanese olive oil. The three main research questions addressed are:
(1) Investigate and identify potential specific molecular markers reflecting oil geographical
typicality.
(2) Development of a rapid assessment tool in order to replace the conventional analytical
methods, as well as,
(3) Identifying sources and causes of non-conformities in the cultivation and/or processing of
Lebanese olive oil
1. Results
1.1. Impact of growing area and technological aspects on Lebanese olive oil
In this part, the effect of growing area (altitude and temperature) and technological factors
(practices applied to olive fruit just before processing, and extraction method) on Lebanese
olive oil chemical composition is highlighted.
Principal component analysis was able to show that altitude is an important influencer,
especially when it comes to fatty acids. For instance, low altitude areas, had higher palmitic,
palmitoleic, linoleic, linolenic, and lower oleic acid content when compared to high-altitude
regions. These results are per the outcomes described by other studies for oils extracted from
olives grown at different altitudes (Aguilera et al. 2005). Temperature and relative humidity
also played an important part in discriminating both regions as high-altitude areas in Lebanon
have a cooler climate compared to low-altitude areas. Olive oil collected from low altitude,
exhibited a fatty acid profile mostly dominated by linoleic, linolenic, palmitic, and palmitoleic
acid content. Whereas, high altitude areas, showed a unique fatty acid profile distinguished by
oleic acid (Di Bella et al., 2007; García-Inza et al., 2014). It is noteworthy to mention that
precipitation did not affect the discrimination between high and low altitude regions.
Moreover, independent component analysis, coupled to one-way ANOVA, demonstrated the
sources and causes of non-conformities in Lebanese olive oil specifically unproper fruit storage,
and bad hygienic manufacturing practices. Significant differences (p<0.05) were found in
148
quality indices (acidity and peroxide value) as well as fatty acid contents (oleic and linoleic
acid) when comparing olive oil extracted under controlled condition to those extracted under
farmers supervision. The increase in the latter chemical parameters would disqualify olive oil
grade from extra virgin to virgin olive oil.
1.2 Harvest Date effect on the Lebanese Olive Oil from the Soury Variety
This study shows the impact of the harvest period on the major and minor chemical components
of Lebanese olive oil from the Soury variety. The major components included total polyphenols
and fatty acids whereas the minors were sterols in addition to volatile coumpounds.
The analysis of olive oil with different harvest dates has proved that delaying harvest is critical
and has determental effects on Lebanese olive oil. For instance, acidity had increased from
0.31% to 1.21 % exceeding the limit established by the International Olive Council (IOC) for
EVOO (0.8 %). Peroxide value and K232 showed a significant increase whereas K270 and
total polyphenols values decreased as harvest is delayed. All olive oils presented peroxide and
K coefficients values that did not exceed the maximum acceptable limit for their classification
as extra virgin olive oils.
As for fatty acids, monounsaturated fatty acids decreased, polyunsaturated fatty acids increased
whereas saturated fatty acids remained stable with increased maturity. The concentration of
linoleic acid significantly increased from 9.09 % to 11.09 % whereas the concentration of oleic
acid decreased from 73.79 % to 70.86 %. All fatty acids were in the acceptable limit for their
classification as extra virgin olive oils except for palmitic acid. Palmitic acid concentration
remained the same with the advancement of harvest date, however, it exceeded the standards
set by IOC for extra virgin olive oil.
The relative amount of !-Sitosterol was mainly found to decrease, while those of stigmasterol,
∆!,#$-stigmastadienol, ∆%-avenasterol and ∆%-stigmastenol, increased with delaying harvest
time.
As for the volatile compounds, principle component analysis was used on the flash GC data to
study the impact of harvest date and its delay. Ethanol was found to mostly characterize olive
oil sampled at an advanced harvest date. On the other hand, olive fruits harvested at an early
date were mostly dominated by 1-hexenol. (E,E)-2,4-decadienal was found in all samples due
to the high temperature in the incubation period lying just before injection of the volatiles into
the FGC columns.
149
1.3 A rapid technique replacing the conventional analytical methods
In this study, the potential of front-face fluorescence spectroscopy coupled with chemometric
techniques, namely multiple linear regression (MLR) applied on parallel factor (PARAFAC)
scores and partial least squares (PLS), was tested on Lebanese olive oil samples. The objective
was to check if this technique can prove its usefulness again in grading olive oil samples
possessing natural variability within their chemical parameters
Fluorescence excitation-emission matrices (EEM) of the collected samples were measured, and
the relationship between them and the chemical parameters was examined. Two models were
created. The first model was based on MLR performed on PARAFAC scores while the second
was based on PLS regression applied directly on the unfolded EEM.
Twenty-two MLR regression models were generated (one for each physicochemical parameter),
the majority of which showed a good correlation coefficient (R>0.7 for 10 predicted variables).
The highest prediction was achieved for acid value (R = 0.89), peroxide value (R = 0.84), and
delta K (R = 0.81), as well as linoleic (R = 0.80) and oleic acids (R = 0.76). Total polyphenols
and total chlorophyll were also well predicted with correlation coefficients of 0.73 and 0.71.
The remaining models showed adequate prediction capabilities except for palmitoleic acid with
a validation correlation coefficient as low as 0.05, which is not useable for quantitative
predictions.
As for PLS, similar results with slight improvement over the MLR models were obtained. The
PLS regression models over quality indices showed validation R values higher than 0.6 (0.6-
0.81) with low RMSEC and RMSEV values except for total chlorophyll, beta-carotene and
middle Ks. The highest prediction was achieved for acid value, peroxide value and delta K with
a high validation R value (R>0.8) indicating a good prediction model; whereas the regression
model for total polyphenols showed lower prediction quality (R<0.8). As for fatty acids, linoleic
and oleic acids were best predicted with a validation R of 0.8.
The flowchart below gives an overall image on how all elaborated studies were approached
(Figure 27).
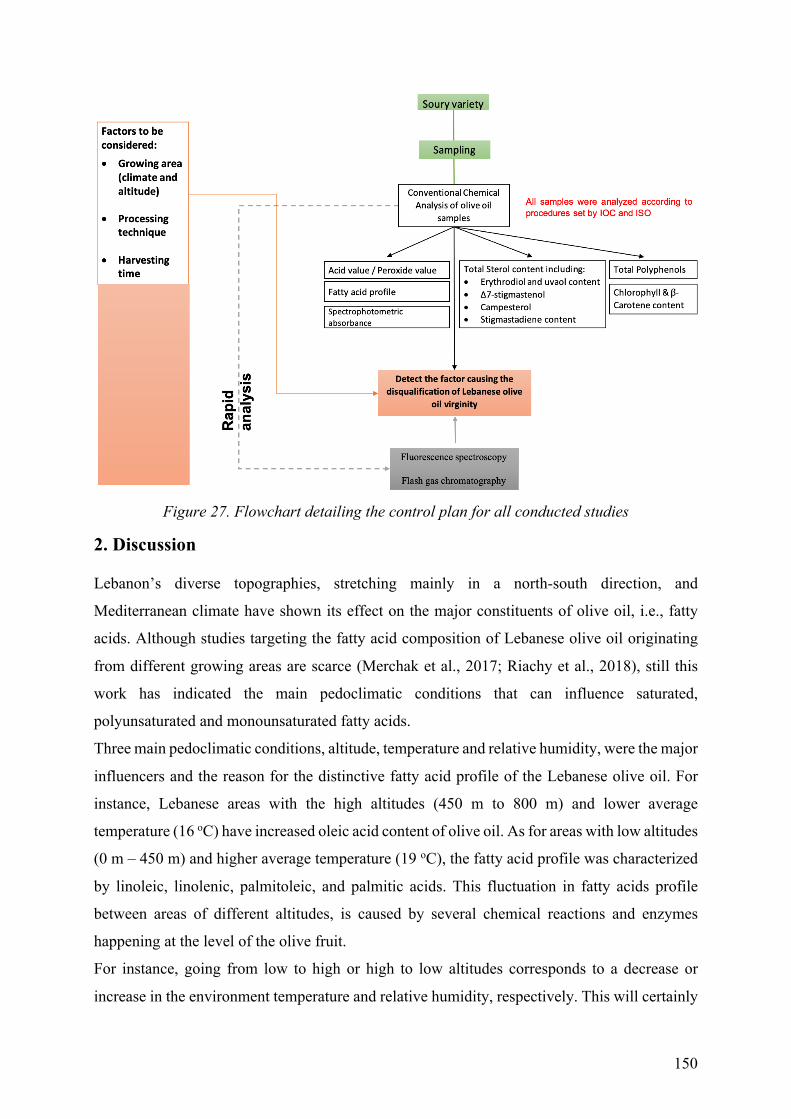
150
Figure 27. Flowchart detailing the control plan for all conducted studies
2. Discussion
Lebanon’s diverse topographies, stretching mainly in a north-south direction, and
Mediterranean climate have shown its effect on the major constituents of olive oil, i.e., fatty
acids. Although studies targeting the fatty acid composition of Lebanese olive oil originating
from different growing areas are scarce (Merchak et al., 2017; Riachy et al., 2018), still this
work has indicated the main pedoclimatic conditions that can influence saturated,
polyunsaturated and monounsaturated fatty acids.
Three main pedoclimatic conditions, altitude, temperature and relative humidity, were the major
influencers and the reason for the distinctive fatty acid profile of the Lebanese olive oil. For
instance, Lebanese areas with the high altitudes (450 m to 800 m) and lower average
temperature (16 oC) have increased oleic acid content of olive oil. As for areas with low altitudes
(0 m – 450 m) and higher average temperature (19 oC), the fatty acid profile was characterized
by linoleic, linolenic, palmitoleic, and palmitic acids. This fluctuation in fatty acids profile
between areas of different altitudes, is caused by several chemical reactions and enzymes
happening at the level of the olive fruit.
For instance, going from low to high or high to low altitudes corresponds to a decrease or
increase in the environment temperature and relative humidity, respectively. This will certainly
151
impact the underlying physiological metabolic processes, in particular, the process of fatty acid
synthesis (Arslan et al., 2013; Çetinkaya et al., 2017; Issaoui et al., 2010; Nergiz et al., 2009;
Stefanoudaki et al., 1999). For example, García-Inza et al. (2014) studied the effect of high
temperature by placing olive fruiting branches in transparent plastic chambers with
individualized temperature control. The results showed that high temperatures decrease the
oleic acid content and increase the palmitic, palmitoleic, linoleic, and linoleic acid contents.
The latter is in accordance with the fatty acid profile of regions with low altitude and high
temperatures.
These preliminary results will help set the ground for advanced work to be done in this field. It
also can present a guide for Protected Geographical Indication (PGI). This will improve the
image of Lebanese olive oil and creates an access to international markets, thereby giving an
opportunity for the Lebanese olive farmers for a better market access (See Chapter 3 for in-
depth discussion).
However, several challenges face the application of PGI. One of these critical challenges is the
inferior quality of olive oil in Lebanon indicated by the low rate of exportable grade (about 30%
of total olive oil production) (IDAL, 2017b). The quality of oil varies according to and within
geographical designation due to variables such as agricultural practices (Gargouri et al., 2016),
pre and post-harvest operations (Kiritsakis et al., 1998) and processing (Di Giovacchino et al.,
1994; Di Giovacchino et al., 1996). The negligence of such practices is strongly related to the
marketability of the oil.
A control plan was established to link the cultivation/harvesting techniques (processing,
maturity index, time, cultivar) to the resulting physicochemical of olive oil from the Soury
variety with the aid of several chemometric techniques like ICA and PCA. This plan generated
more than one agronomical and technological factor causing the disqualification of Lebanese
EVOO starting with the first factor which is harvest date and ending with the extraction process.
Delaying the harvest of the Soury variety beyond mid-November had an intense effect on
Lebanese olive oil quality. It has showed that the main quality parameter such as acidity
responsible for grading olive oil had exceeded the standards set by the IOC for EVOO and that
the olive oil has lost its oxidative stability due to the drop in total polyphenol content.
Oleic and linoleic acids were also affected by the delay of harvest. The increase of linoleic on
the expense of oleic acid is due to two main factors. The first factor may be related to the activity
of oleate desaturase enzyme which desaturates the Oleoyl-ACP (precursor of longer-chain
unsaturated fatty acids) into linoleate-ACP (Hernandez et al., 2011). The second factor lies in
the continuing biosynthesis of triglycerides as the harvesting date is delayed (Flamini, 2010 &
152
Guiterrez, 1999). Lodolini et al. (2017) have also reported that the Soury variety in particular,
should be harvested early. As it ripens, oleic content declines, and linoleic increases, quality
indices, mostly free fatty acids, are negatively affected, while polyphenol levels and oxidative
stability drop sharply.
∆%-stigmastenol is one of the causes of the virginity disqualification of Lebanese olive oil. It’s
obvious that the factor responsible for the increase of this sterol content is the delay in harvest
time where it increased dramatically in November. As for other sterols, the relative amount of
!-Sitosterol was mainly found to decrease, while those of stigmasterol, ∆!,#$-stigmastadienol,
and ∆%-avenasterol increased with delaying harvest time.
Never to mention that ethanol was the volatile compound dominating most samples harvested
in November. The increase in ethanol content is directed by the increase of alcohol
dehydrogenase activity during advanced stages of maturation (Beltrán et al., 2015). It is worthy
to mention that (E,E)-2,4-decadienal was present in olive oil harvested at optimum and at a
delayed harvest date. Its presence is due to the long incubation period of olive oil just before
injection into the FGC, which led to the appearance of such a volatile compound (See Chapter
4 for in-depth discussion).
In addition to harvest date, two major factors are linked to this disqualification which are the
unproper fruit storage condition/duration practices and the lack of good hygienic and
manufacturing practices during oil extraction. Both factors favor the enzymatic lipolysis of the
fruit triacylglycerol strongly affecting the quality indicators and fatty acid content of olive oil
(Kiritsakis et al., 1998). Generally, it can be concluded that picking the olive fruit from mid-
October to the first of November could be a criterion to obtain olive oil of the highest quality
grade. Also adhering to good hygienic / storage practices while extracting olive oil would
preserve its virginity (See Chapter 3 for in-depth discussion).
As for the olive oils extracted from Soury olive fruits harvested at an optimum date (mid-Oct
to mid-Nov) and under optimum extraction conditions, all quality parameters were in range of
EVOO category. The extracted oil has a high content of polyphenol and monounsaturated fatty
acids and low polyunsaturated and unsaturated fatty acids. As for sterols, all were within the
standards set by the IOC, even the ∆%-stigmastenol content. Also this oil was dominated by the
volatile compound 1-hexanol, describing the term “fruity-grassy”, which appears as a sign of
unripe olives (Aparicio & Morales, 1998) (See Chapter 4 for in-depth discussion).
Although in the above studies conventional analytical methods were used, a rapid technique
was tested to demonstrate its capabilities for predicting the inconsistent qualities of Lebanese
olive. A front-face fluorescence coupled to chemometric tools such as PARAFAC, MLR, and
153
PLS proved its usefulness in the grading of olive oil samples with significant savings of
analytical measurements specified in the regulations. On the qualitative side, this technique with
the help of some chemometric tools like PARAFAC made it possible to easily link the
fluorophores content with the degradation of the main physicochemical parameters of the
samples especially that olive oil contains fluorophores that are connected directly and indirectly
to some of the physicochemical properties like polyphenols, free fatty acids, chlorophylls etc
(Ammari et al., 2012; Cheikhousman et al., 2005a; Guimet et al., 2004b; Kyriakidis et al., 2000;
Sikorska et al., 2005; Sikorska et al., 2008; Zandomeneghi et al., 2005). Whereas, on the
quantitative side, good prediction models were obtained. In both models, acid value, peroxide
value and delta K models were highly predicted since these quality parameters are related to the
oxidation/hydrolysis products and interrelate with levels of tocopherols, polyphenols, and
chlorophyll, which are sensitive products to oxidation and act as antioxidants (Tena et al.
(2012). The same was applied to oleic and linoleic models where almost all fluorophores
contributed to the two latter prediction models. However, it is worthy to mention that the
variability presented within the samples inflicted on some level the prediction capabilities of
both models (MLR and PLS) as the challenge itself was to overcome the variability present in
the oil samples that were harvested at different dates and from two seasons, processed using
different extraction methods, collected from different altitudes and other factors. Several studies
have conducted MLR and PLS prediction models to show the suitability of fluorescence in
detecting the quality parameters of olive oil, and a correlation coefficient between 0.8 and 0.99
was obtained. However, most of these studies have examined one or two variables while
keeping other variables fixed. For instance, Sikorska et al. (2008) demonstrated the use of
fluorescence spectroscopy for monitoring the effect of light on the chlorophyll and total
polyphenols content of extra virgin olive oil, while maintaining the extraction method and
harvesting date as constant variables. Guimet, Ferré, and Boqué et al., 2005 studied the relation
between fluorescence EEM and some quality parameters (peroxide value, K232, and K270) of
different oil qualities (13 extra virgin, 2 virgin, 16 pure and 2 pomace olive oils), keeping the
harvest year and storage conditions as fixed variables. In a non-experimental design, this
variability cannot be controlled, and thus a random pattern may appear as a result, which leads
to the increase in the number of outliers and to the lowering of the prediction capacity of
multivariate models, as shown by MLR and PLS.
In addition to fluorescence spectroscopy, flash GC, an analytical process which depends on the
volatilization of olive oil volatile compounds and then their separation through chromatographic
analysis was utilized as another rapid test. The results of this analysis gave an overview on the
154
main volatiles characterizing the Soury variety in matter of seconds. Also, it clearly presented
the impact of delaying harvest date on olive oil quality by identifying a specific volatile
compound, i.e. ethanol 3.
The impact of both rapid techniques is unquestionable as they strongly contribute to the
enhancement of the analytical productivity, such as reducing costs and time, and to the
minimization of risks for the analyst. The real deal here was to create a dependable bypass to
the exhaustive conventional analysis operations. Difficulties has been encountered with both
techniques and future work should rely on, adapting new chemometric models like PLSDA,
and on utilizing standards to identify and quantify using the resulting olive oil volatile
compounds to improve the quantitative aspect of fluorescence spectroscopy and flash gas
chromatography, respectively (See Chapter 5 for in-depth discussion).
155
Conclusion & Perspectives
Conclusion
Below summarize the conclusions of the work presented in this thesis:
1. Principal component analysis and one-way ANOVA were able to set the ground for
Protected Geographical Indication by revealing a correlation between the fatty acid
profile and the pedoclimatic conditions of the main olive growing regions in Lebanon.
Altitude was the primary influencer on the Lebanese olive oil’s chemical composition,
particularly the fatty acids. For instance, the fatty acid profile of low-altitude regions
was characterized by palmitic, palmitoleic, linoleic, and linolenic acid. Whereas the
fatty acid profile of high-altitude regions was mostly dominated by oleic acid.
2. The disqualification of Lebanese olive oil virginity is caused by two variables:
a. Agronomical (Harvest date). The harvest date appears to have a decisive role in
the qualitative characteristics, saponifiable and non-saponifiable fraction of
Lebanese olive oil. Picking the olive fruit beyond the first week of November
has negatively affected the chemical compositions of Lebanese olive oil. All
results obtained showed that as the Soury variety ripens, most of the macro and
minor components exceed the limits set by the international olive council for
extra virgin olive oil.
b. Technological. Independent component analysis and one-way ANOVA were
able to identify the technological disqualification factors through facilitating the
chemical interpretation and providing chemically pure components that crossed
the parameters sets by IOC for EVOO. The two major factors are the unproper
fruit storage condition/duration and the lack of good hygienic and manufacturing
practices during oil extraction. The solution for such non-compliances would
rely on good management/hygienic practices which include, ensuring suitable
pre-processing storage conditions and providing basic hygiene.
3. Rapid techniques such as FFFS and Ultra-FGC, and with the aid of chemometric tools
like PARAFAC, MLR, PLS and PCA created a dependable bypass to the exhaustive
conventional analysis operations. The results of their analysis gave an overview on how
it is possible to easily link the fluorophores content with the degradation of the samples’
main physicochemical parameters and on the main volatiles characterizing the variety
156
under study in matter of seconds. Both techniques showed that they strongly contribute
to the enhancement of the analytical productivity by reducing costs and time, and by
minimization of risks for the analyst.
Perspectives
Several perspectives are possible for the rest of this research work:
• This work will set the ground for Protected Geographical Indication (PGI).
o Better market access for olive producers in Lebanon
• Communicate with the responsible entities in Lebanon to disseminate the causes of non-
conformities to olive oil producers in Lebanon
o Improve the exports of Lebanese EVOO
• Improve the quantitative / qualitative aspect of fluorescence spectroscopy and flash gas
chromatography, respectively.
o Adapt new chemometric models like PLSDA to improve the models’
predictability
o Utilize external standards to identify and quantify the rest of olive oil
volatile compounds
157
Résumé en français
1. Introduction
Les oliviers couvrent 5,4 % du territoire libanais et 8 % de l’ensemble des terres agricoles du
Liban, et sont destinés à la fois à la production d'huile et d'olives de table (Chehade et al., 2016).
Le germoplasme de l'olivier libanais se caractérise par une diversité assez importante. Quatre
variétés locales, à savoir Abou-Chawki, Baladi, Del et Soury, sont les plus cultivées dans les
plantations commerciales. Les oliveraies sont dispersées dans les cinq provinces du Liban et
produisent 90 307 000 tonnes d'olives par an, dont environ 70 % de la production totale est
transformée en huile d'olive. En 2011, 11,3 mille tonnes d'huile d'olive ont été produites et
seulement 30 % de la production totale d'huile d'olive était constituée d'huile d'olive extra vierge
(IDAL, 2017b).
La qualité inférieure de l'huile d'olive au Liban est reflétée par un faible taux d’huiles de classes
exportables (environ 30 % de la production totale d'huile d'olive) (IDAL, 2017b). Dans le cadre
de la recherche scientifique et du développement, un travail important a été effectué pour
améliorer la qualité de l'olive et de l'huile d'olive et, par la suite, améliorer les moyens de
subsistance et l'économie de la communauté libanaise. Mais peu a été fait en ce qui concerne
l'amélioration des caractéristiques de la qualité commerciale. Le faible pourcentage d'huiles
d’olive extra-vierges libanaises est un indicateur de ces limitations qui sont principalement dues
à la grande variabilité de la qualité et de la composition chimique de l'huile. Les travaux de
recherche précédents, bien que limités, ont attribué cette qualité inférieure à la non-conformité
des micro-composants tels que les stérols aux normes de la COI. Il a été rapporté que le
stigmasténol et certains acides gras polyinsaturés entravaient la commercialisation
internationale de l'huile d'olive libanaise (Youssef, 2002 ; Mireille, 2003 ; Claude, 2005 ; Rabih,
2005 ; Breidi, 2011).
Cette incohérence est due à plusieurs facteurs parmi lesquels la situation géographique
(composition du sol, altitude et latitude), les conditions climatiques, le processus d'extraction
de l’huile, le cultivar, la date de récolte, etc. (Zamora et al., 2001 ; Temime et al., 2006 ; Rotondi
et al., 2004 ; Kiritsakis et al., 1998 ; Franco et al., 2015 ; Dag et al., 2011 ; Baccouri et al., 2007
; Abaza et al., 2005). Chacun des facteurs mentionnés ci-dessus a son poids sur les paramètres
qui définissent la virginité de l'huile d'olive. Ces paramètres comprennent les acides gras libres,
l’indice de peroxyde, l’absorbance dans UV, ainsi que d'autres paramètres de qualité tels que le
profil des acides gras et la fraction insaponifiable.
158
Bien que le Liban soit considéré comme un petit producteur d'huile d'olive par rapport aux
autres pays méditerranéens, il a la réputation de produire des huiles artisanales de haute qualité.
Ce produit haut de gamme est de plus en plus exporté vers des pays comme l'Arabie saoudite
(2 635 tonnes), les États-Unis (1 315 tonnes) et d'autres pays (IDAL, 2017a).
Pour suivre ce produit de haute qualité, notamment en termes de propriétés nutritionnelles et
sensorielles de l'huile d'olive, des institutions spécialisées telles que le Conseil oléicole
international (COI) ont mis en place des contrôles explicites de la qualité de l'huile d'olive.
L’application de ces derniers se révèle parfois complexe en termes de temps et de matériaux
nécessaires pour déterminer l'authenticité et la qualité de l'huile d'olive (Guzman et al., 2015).
Aujourd'hui, la disponibilité de nouveaux accessoires pour les porte-échantillons, de logiciels
et de nombreuses applications chimiométriques a fait place à des techniques d'analyse plus
rapides et plus simples, notamment la spectroscopie de fluorescence frontale et la
chromatographie en phase gazeuse ultra-rapide (Flash-GC). La spectroscopie de fluorescence a
été utilisée avec succès comme une technique rapide, non invasive et très sensible pour l'analyse
de la qualité de l'huile d'olive et s'est révélée plus rentable que d'autres procédures analytiques
(Lleo et al., 2016) ; sans parler de la diversité de ses applications, en particulier dans le domaine
de l'analyse de l'huile d'olive (Locquet et al., 2019). Il s'agit notamment d'études sur la détection
de l'adultération de l'huile d'olive avec des huiles végétales ou de l'huile de grignons
(Dankowska & Małecka, 2009 ; Sayago et al., 2007), le suivi de l'oxydation thermique
(Cheikhousman et al, 2005a ; Poulli et al., 2009 ; Sikorska et al., 2008 ; Tena et al., 2012 ; Tena
et al., 2009), l’authentification de l'origine (Dupuy et al., 2005), et l'évaluation des paramètres
de qualité (Guimet et al., 2004a ; Guzman et al., 2015). Quant à la GC flash, il s'agit d'une
technique très sélective et sensible utilisée pour analyser en quelques secondes les composés
volatils présents dans l'huile d'olive. Ce type de chromatographie a été utilisé pour la
discrimination des origines géographiques (Melucci et al., 2016), la détection de l'adultération
(Jabeur et al., 2014) et la détermination des grades de qualité de l'huile d'olive (Barbieri et al.,
2020). Ces deux types d'outils analytiques rapides peuvent être particulièrement utiles pour le
contrôle de qualité de routine, notamment à l'aide d'outils chimiométriques.
Ce travail étudie l'utilisation de la chimiométrie comme la PCA, la PARAFAC, l'ICA, la MLR
et la PLS pour mettre en évidence l'effet de la zone de culture sur l'huile d'olive libanaise sur la
base des paramètres physico-chimiques résultants, pour détecter les facteurs technologiques et
agricoles conduisant à la disqualification de la virginité de l'huile d'olive libanaise et pour tester
l'utilité des techniques d'analyse rapide dans le classement des échantillons d'huile d'olive.
159
Objectifs
Les objectifs généraux peuvent être résumés comme suit :
• Elaboration d'un plan de contrôle pour évaluer les caractéristiques physico-chimiques et
les niveaux de qualité des OVE par rapport à une référence internationale
• Améliorer la production, la qualité et, à terme, la commercialisabilité et la compétitivité
de l'HOVE produite au Liban sur les marchés internationaux
Les objectifs spécifiques comprennent :
(1) Identifier les sources et les causes des non-conformités au niveau de la culture et/ou la
transformation de l'huile d'olive libanaise tout en trouvant des solutions applicables afin de
s'adapter aux exigences internationales,
(2) Étude de l'effet de la zone de culture sur la composition chimique de l'huile d'olive libanaise.
(3) Développement d'un outil d'évaluation rapide afin de remplacer les méthodes d'analyse
conventionnelles.
2. Résultats
2.1 Impact de la zone de culture et des aspects technologiques sur l'huile d'olive libanaise
Dans cette partie, l'effet de la zone de culture (altitude et température) et des facteurs
technologiques (pratiques appliquées aux fruits de l'olivier juste avant la transformation, et
méthode d'extraction) sur la composition chimique de l'huile d'olive libanaise est mis en
évidence.
L'analyse en composantes principales a pu montrer que l'altitude est un facteur important,
surtout en ce qui concerne les acides gras. Par exemple, les huiles des régions de basse altitude
présentent une teneur plus élevée en acides palmitique, palmitoléique, linoléique, linolénique
et oléique que celles des régions de haute altitude. Ces résultats sont conformes aux résultats
décrits par d'autres études pour les huiles extraites d'olives cultivées à différentes altitudes
(Aguilera et al. 2005). La température et l'humidité relative ont également joué un rôle important
dans la différenciation des deux régions, car les régions de haute altitude du Liban ont un climat
plus frais que les régions de basse altitude. L'huile d'olive recueillie à basse altitude, présentait
un profil d'acides gras principalement dominé par une teneur en acide linoléique, linolénique,
palmitique et palmitoléique. En revanche, les zones de haute altitude présentaient un profil
d'acides gras unique, caractérisé par la présence d'acide oléique (Di Bella et al., 2007 ; García-
Inza et al., 2014). Il convient de mentionner que les précipitations n'ont pas affecté la
discrimination entre les régions de haute et de basse altitude.
160
De plus, l’analyse en composantes indépendantes, couplée à une ANOVA à un facteur, a
démontré les sources et les causes des non-conformités dans l'huile d'olive libanaise, notamment
un stockage inadapté des fruits et des mauvaises pratiques de fabrication et d’hygiène. Des
différences significatives (p<0,05) ont été constatées au niveau des indices de qualité (acidité
et indice de peroxyde) ainsi que dans les teneurs en acides gras (acide oléique et linoléique) en
comparant l'huile d'olive extraite dans des conditions contrôlées à celle extraite sous la
supervision des agriculteurs. L'augmentation des valeurs de ces derniers paramètres chimiques
aurait pour effet de disqualifier l'huile d'olive de la catégorie "huile d'olive vierge extra" à la
catégorie "huile d'olive vierge".
2.2 Effet de la date de récolte sur l'huile d'olive libanaise de la variété Soury
Cette étude montre l'impact de la période de récolte sur les composants chimiques majeurs et
mineurs de l'huile d'olive libanaise de la variété Soury. Les composants majeurs sont les
polyphénols totaux et les acides gras, tandis que les composants mineurs sont les stérols, en
plus des composés volatils.
L'analyse de l'huile d'olive issues de dates de récolte différentes a prouvé que le retard de la
récolte est critique et a des effets déterminants sur l'huile d'olive libanaise. Par exemple, l'acidité
est passée de 0,31 % à 1,21 %, dépassant la limite fixée par le Conseil oléicole international
(COI) pour l'HOVE (0,8 %). D’autre part, l'indice de peroxyde et le K232 ont connu une
augmentation significative, tandis que le K270 et les teneurs en polyphénols totaux ont diminué
suite à un retard de la récolte. Toutes les huiles d'olive présentaient des valeurs de peroxyde et
de coefficients K qui ne dépassaient pas la limite maximale acceptable pour leur classification
en tant qu'huiles d'olive vierges extra.
En ce qui concerne les acides gras, les acides gras mono-insaturés ont diminué, les acides gras
polyinsaturés ont augmenté alors que les acides gras saturés sont restés stables avec l'évolution
de la maturité. La concentration d'acide linoléique a augmenté de manière significative, passant
de 9,09 % à 11,09 %, tandis que la concentration d'acide oléique a diminué, passant de 73,79 %
à 70,86 %. Tous les acides gras se trouvaient dans la limite acceptable pour la classification des
huiles en tant qu'huiles d'olive vierges extra.
D’un autre côté, la quantité relative de β-Sitostérol a principalement diminué, tandis que celles
de stigmastérol, ∆5,24-stigmastadiénol, ∆7-avenastérol et ∆7-stigmasténol, ont augmenté avec
l'avancement de la date de récolte.
En ce qui concerne les composés volatils, l'analyse en composantes principales a été utilisée sur
les données de GC flash pour étudier l'impact de la date de récolte et de son retard. On a constaté
que l'éthanol caractérisait surtout les huiles d'olive échantillonnées à une date de récolte
161
avancée. D'autre part, les fruits d'olive récoltés à une date précoce étaient principalement
dominés par le 1-hexénol. Du (E,E)-2,4-décadiénal a été trouvé dans tous les échantillons en
raison de la température élevée de la période d'incubation qui se situe juste avant l'injection des
volatiles dans les colonnes de CGF.
2.3 Une technique rapide remplaçant les méthodes d'analyse classiques
Dans cette étude, le potentiel de la spectroscopie de fluorescence frontale couplée à des
techniques chimiométriques, à savoir la régression linéaire multiple (MLR) appliquée sur les
scores de l’analyse factorielle parallèle (PARAFAC) et la régression au sens des moindres
carrés partiels (PLS), a été testé sur des échantillons d'huile d'olive libanaise. L'objectif était de
vérifier si cette technique peut à nouveau prouver son utilité pour classer les échantillons d'huile
d'olive présentant une variabilité naturelle dans leurs paramètres chimiques.
Les matrices d'excitation et d’émission de fluorescence (EEM) des échantillons collectés ont
été mesurées et la relation entre celles-ci et les paramètres chimiques a été examinée. Deux
modèles ont été créés. Le premier modèle était basé sur la MLR réalisée sur les scores
PARAFAC, tandis que le second était basé sur la régression PLS appliquée directement sur
l'EEM dépliée.
Vingt-deux modèles de régression MLR ont été générés (un pour chaque paramètre physico-
chimique), dont la majorité a montré un bon coefficient de corrélation (R>0,7 pour 10 variables
prédites). La prédiction la plus élevée a été obtenue pour l'indice d'acide (R = 0,89), l'indice de
peroxyde (R = 0,84) et le delta K (R = 0,81), ainsi que pour les acides linoléique (R = 0,80) et
oléique (R = 0,76). Les polyphénols totaux et la chlorophylle totale étaient également bien
prédits avec des coefficients de corrélation de 0,73 et 0,71, respectivement. Les autres modèles
ont montré des capacités de prédiction adéquates, sauf pour l'acide palmitoléique avec un
coefficient de corrélation de validation aussi bas que 0,05, non valide pour les prédictions
quantitatives.
Quant à la PLS, des résultats similaires avec une légère amélioration par rapport aux modèles
MLR ont été obtenus. Les modèles de régression PLS sur les indices de qualité ont montré des
valeurs R de validation supérieures à 0,6 (0,6-0,81) avec des erreurs de prédiction RMSEC et
RMSEV faibles, sauf pour la chlorophylle totale, le bêta-carotène et le Ks moyen. La prédiction
la plus élevée a été obtenue pour l'indice d'acide, l'indice de peroxyde et le delta K avec une
valeur R de validation élevée (R>0,8) indiquant un bon modèle de prédiction ; tandis que le
modèle de régression pour les polyphénols totaux a montré une qualité de prédiction inférieure
(R<0,8). En ce qui concerne les acides gras, les acides linoléique et oléique ont été les mieux
prédits avec une valeur R de validation de 0,8.
162
3. Discussion
La topographie diverse du Liban, s'étendant principalement dans une direction Nord-Sud, et le
climat méditerranéen ont montré leur effet sur les principaux constituants de l'huile d'olive,
c'est-à-dire les acides gras. Bien que les études ciblant la composition en acides gras de l'huile
d'olive libanaise provenant de différentes zones de culture soient rares (Merchak et al., 2017 ;
Riachy et al., 2018), ces travaux ont tout de même indiqué les principales conditions
pédoclimatiques pouvant influencer les acides gras saturés, polyinsaturés et monoinsaturés.
Les trois principales conditions pédoclimatiques, l'altitude, la température et l'humidité relative,
ont été les principaux facteurs d'influence et à l’origine d’un profil d'acides gras distinctif de
l'huile d'olive libanaise. Par exemple, les zones libanaises de haute altitude (450 m à 800 m) et
de basse température moyenne (16 oC) ont augmenté la teneur en acide oléique de l'huile d'olive.
Quant aux zones de faible altitude (0 m à 450 m) et de température moyenne plus élevée (19 oC), le profil des acides gras était caractérisé surtout par les acides linoléique, linolénique,
palmitoléique et palmitique. Cette fluctuation du profil des acides gras entre les zones de
différentes altitudes est due à plusieurs réactions chimiques et enzymatiques qui se produisent
au niveau du fruit de l'olivier.
Par exemple, le passage de basse à haute ou de haute à basse altitude correspond à une
diminution ou une augmentation de la température et de l'humidité relative de l'environnement,
respectivement. Cela aurait certainement un impact sur les processus métaboliques
physiologiques sous-jacents, en particulier le processus de synthèse des acides gras (Arslan et
al., 2013 ; Çetinkaya et al., 2017 ; Issaoui et al., 2010 ; Nergiz et al., 2009 ; Stefanoudaki et al.,
1999). Par exemple, García-Inza et al. (2014) ont étudié l'effet de la température élevée en
couvrant les branches d'olivier fructifiant dans des chambres en plastique transparent avec un
contrôle de température individualisé. Les résultats ont montré que les températures élevées
diminuent la teneur en acide oléique et augmentent les teneurs en acides palmitique,
palmitoléique, linoléique et linoléique. Ceci est conforme au profil des acides gras des régions
de basse altitude et de haute température.
Ces résultats préliminaires permettront de jeter les bases de travaux avancés dans ce domaine.
Cette étude pourrait également servir de guide pour les Indications Géographiques Protégées
(IGP). Cela permettra d'améliorer l'image de l'huile d'olive libanaise et de créer un accès aux
marchés internationaux, offrant ainsi aux oléiculteurs libanais la possibilité d'un meilleur accès
au marché (voir le chapitre 3 pour une discussion approfondie).
Toutefois, l'application de l'IGP se heurte à plusieurs difficultés. L'un de ces défis majeurs est
la qualité inférieure de l'huile d'olive au Liban, comme en témoigne le faible taux de qualité
163
exportable (environ 30 % de la production totale d'huile d'olive) (IDAL, 2017b). La qualité de
l'huile varie en fonction de la désignation géographique et au sein de celle-ci en raison de
variables telles que les pratiques agricoles (Gargouri et al., 2016), les opérations avant et après
récolte (Kiritsakis et al., 1998) et la transformation (Di Giovacchino et al., 1994 ; Di
Giovacchino et al., 1996). La négligence de ces pratiques est fortement liée à la qualité
marchande de l'huile.
Un plan de contrôle a été ainsi établi pour relier les techniques de culture/récolte (traitement,
indice de maturité, temps, cultivar) à la physico-chimie de l'huile d'olive de la variété Soury qui
en résulte, à l'aide de plusieurs techniques chimiométriques comme l'ICA et l'ACP. Ce plan a
généré plus d'un facteur agronomique et technologique entraînant la disqualification de l'EVOO
libanaise en commençant par le premier facteur qui est la date de récolte et en terminant par le
processus d'extraction.
Le fait de retarder la récolte de la variété Soury au-delà de la mi-novembre a eu un effet énorme
sur la qualité de l'huile d'olive libanaise. Il a été montré que le principal paramètre de qualité, à
savoir l'acidité, responsable du classement de l'huile d'olive avait dépassé les normes fixées par
le COI pour l'HOVE et que l'huile d'olive avait perdu sa stabilité oxydative en raison de la baisse
de la teneur totale en polyphénols. Les acides oléique et linoléique ont également été affectés
par un délai de la récolte. L'augmentation du linoléique au détriment de l'acide oléique est due
à deux facteurs principaux. Le premier facteur peut être lié à l'activité de l'enzyme oléate
désaturase qui désature l'Oleoyl-ACP (précurseur des acides gras insaturés à longue chaîne) en
linoléate-ACP (Hernandez et al., 2011). Le deuxième facteur réside dans la poursuite de la
biosynthèse des triglycérides, la date de récolte étant retardée (Flamini, 2010 & Guiterrez,
1999). Lodolini et al. (2017) ont également signalé que la variété Soury, en particulier, devrait
être récoltée tôt. À mesure qu'elle mûrit, sa teneur en acide oléique diminue et sa teneur en acide
linoléique augmente, les indices de qualité, principalement les acides gras libres, sont affectés
négativement, tandis que les niveaux de polyphénols et la stabilité oxydative diminuent
fortement.
Le ∆7-stigmastenol est l'une des causes de la disqualification de la virginité de l'huile d'olive
libanaise. Il est évident que le facteur responsable de l'augmentation de cette teneur en stérols
est le retard de la récolte où elle a augmenté de façon spectaculaire en novembre. Comme pour
les autres stérols, la quantité relative de β-Sitostérol a principalement diminué, tandis que celles
de stigmastérol, ∆5,24-stigmastadiénol, et ∆7-avenastérol ont augmenté avec le retard de la
récolte.
164
Sans parler du fait que l'éthanol était le composé volatil qui dominait la plupart des échantillons
récoltés en novembre. L'augmentation de la teneur en éthanol est dirigée par l'augmentation de
l'activité de l'alcool déshydrogénase pendant les stades avancés de la maturation (Beltrán et al.,
2015). Il convient de mentionner que le (E,E)-2,4-décadiénal était présent dans l'huile d'olive
récoltée à la date optimale et à une date de récolte retardée. Sa présence est due à la longue
période d'incubation de l'huile d'olive juste avant l'injection dans la MGF, qui a conduit à
l'apparition d'un composé aussi volatil (voir le chapitre 4 pour une discussion approfondie).
Outre la date de récolte, deux facteurs majeurs sont aussi liés à cette disqualification, à savoir
les mauvaises pratiques en matière de conditions et de durée de stockage des fruits et le manque
de bonnes pratiques d'hygiène et de fabrication lors de l'extraction de l'huile. Ces deux facteurs
favorisent la lipolyse enzymatique du triacylglycérol du fruit, ce qui affecte fortement les
indicateurs de qualité et la teneur en acides gras de l'huile d'olive (Kiritsakis et al., 1998). De
manière générale, on peut conclure que la cueillette des olives de la mi-octobre au premier
novembre pourrait être un critère pour obtenir une huile d'olive de la meilleure qualité. Le
respect des bonnes pratiques d'hygiène/de stockage lors de l'extraction de l'huile d'olive
permettrait également de préserver sa virginité (voir le chapitre 3 pour une discussion
approfondie).
Quant aux huiles d'olive extraites des olives de la variété Soury récoltées à une date optimale
(mi-octobre à mi-novembre) et dans des conditions d'extraction optimales, tous les paramètres
de qualité se situaient dans la catégorie EVOO. L'huile extraite a une teneur élevée en
polyphénols et en acides gras monoinsaturés et une faible teneur en acides gras polyinsaturés et
insaturés. Quant aux stérols, tous étaient conformes aux normes fixées par le CIO, même la
teneur en ∆7-stigmasténol. Cette huile était également dominée par le composé volatil 1-
hexanol, décrivant le terme "fruité-grassé", qui apparaît comme un signe d'olives non mûres
(Aparicio & Morales, 1998) (Voir le chapitre 4 pour une discussion approfondie).
Bien que dans les études ci-dessus, des méthodes d'analyse conventionnelles aient été utilisées,
une technique rapide a été testée pour démontrer ses capacités à prédire les qualités irrégulières
de l'olive libanaise. Une fluorescence frontale couplée à des outils chimiométriques tels que
PARAFAC, MLR et PLS a prouvé son utilité dans le classement des échantillons d'huile d'olive
avec une économie significative au niveau mesures analytiques spécifiées dans les règlements.
Sur le plan qualitatif, cette technique, associée à certains outils chimiométriques comme le
PARAFAC, a permis de relier facilement la teneur en fluorophores à la dégradation des
principaux paramètres physico-chimiques des échantillons, d'autant plus que l'huile d'olive
contient des fluorophores qui sont directement et indirectement liés à certaines propriétés
165
physico-chimiques comme les polyphénols, les acides gras libres, les chlorophylles, etc
(Ammari et al, 2012 ; Cheikhousman et al., 2005a ; Guimet et al., 2004b ; Kyriakidis et al.,
2000 ; Sikorska et al., 2005 ; Sikorska et al., 2008 ; Zandomeneghi et al., 2005). Alors que, sur
le plan quantitatif, de bons modèles de prédiction ont été obtenus. Dans les deux modèles,
l'indice d'acidité, l'indice de peroxyde et le delta K ont fait l'objet de bonnes prédictions, car ces
paramètres qualitatifs sont liés aux produits d'oxydation/hydrolyse et sont en corrélation avec
les niveaux de tocophérols, de polyphénols et de chlorophylle, qui sont des produits sensibles à
l'oxydation et agissent comme agents antioxydants (Tena et al., 2012). De manière similaire,
presque tous les fluorophores ont contribué à l’élaboration des modèles de prédiction des acides
oléique et linoléique. Cependant, la plupart de ces études ont examiné une ou deux variables
tout en gardant d'autres variables fixes. Par exemple, Sikorska et al. (2008) ont démontré
l'utilisation de la spectroscopie de fluorescence pour surveiller l'effet de la lumière sur la teneur
en chlorophylle et en polyphénols totaux de l'huile d'olive vierge extra, tout en maintenant la
méthode d'extraction et la date de récolte comme variables constantes. Guimet, Ferré, et Boqué
et autres, 2005 ont étudié la relation entre la SEE par fluorescence et certains paramètres de
qualité (indice de peroxyde, K232, et K270) de différentes qualités d'huile (13 huiles d'olive
vierges extra, 2 vierges, 16 pures et 2 de grignons), en gardant l'année de récolte et les conditions
de stockage comme variables fixes. Dans un modèle non expérimental, cette variabilité ne peut
être contrôlée, et un modèle aléatoire peut donc apparaître, ce qui entraîne une augmentation du
nombre de valeurs aberrantes et une diminution de la capacité de prédiction des modèles
multivariés, comme le montrent les modèles MLR et PLS.
En plus de la spectroscopie de fluorescence, la GC flash, un processus analytique qui dépend
de la volatilisation des composés volatils de l'huile d'olive puis de leur séparation par analyse
chromatographique, a été utilisée comme autre test rapide. Les résultats de cette analyse ont
donné un aperçu des principaux composés volatils caractérisant la variété Soury en quelques
secondes seulement. En outre, elle a clairement présenté l'impact du délai de la date de récolte
sur la qualité de l'huile d'olive en identifiant un composé volatil spécifique, à savoir l'éthanol 3.
L'impact des deux techniques rapides est incontestable car elles contribuent fortement à
l'amélioration de la productivité analytique, comme la réduction des coûts et du temps, et à la
minimisation des risques pour l'analyste. Il s'agissait en fait de créer un contournement fiable
des opérations d'analyse conventionnelles fastidieuses. Des difficultés ont été rencontrées avec
les deux techniques et les travaux futurs devraient s'appuyer sur l'adaptation de nouveaux
modèles chimiométriques comme la PLSDA, et sur l'utilisation de standards pour mieux
identifier et quantifier les composés volatils de l'huile d'olive qui en résultent afin d'améliorer
166
l'aspect quantitatif de la spectroscopie de fluorescence et de la chromatographie en phase
gazeuse flash, respectivement (voir le chapitre 5 pour une discussion approfondie).
4. Conclusion
Les conclusions des travaux présentés dans cette thèse sont résumées ci-dessous :
1. L'analyse en composantes principales et l'ANOVA à un facteur ont permis de poser les
bases pour une Indication Géographique Protégée en révélant une corrélation entre le profil des
acides gras et les conditions pédoclimatiques des principales régions oléicoles du Liban.
L'altitude a été le principal facteur d'influence sur la composition chimique de l'huile d'olive
libanaise, en particulier les acides gras. Par exemple, le profil des acides gras des régions de
basse altitude était caractérisé par les acides palmitique, palmitoléique, linoléique et
linolénique. Alors que le profil des acides gras des régions de haute altitude était principalement
dominé par l'acide oléique.
2. La disqualification de la virginité de l'huile d'olive libanaise est causée par deux variables :
a. Agronomique (date de récolte). La date de récolte semble avoir un rôle déterminant
dans les caractéristiques qualitatives, la fraction saponifiable et non saponifiable de l'huile
d'olive libanaise. La cueillette des olives au-delà de la première semaine de novembre a eu un
effet négatif sur les compositions chimiques de l'huile d'olive libanaise. Tous les résultats
obtenus ont montré qu'à mesure que la variété Soury mûrit, la plupart des composants macro et
mineurs dépassent les limites fixées par le Conseil oléicole international pour l'huile d'olive
vierge extra.
b. Technologique. L'analyse indépendante des composants et l'ANOVA à un facteur ont
permis d'identifier les facteurs de disqualification technologique en facilitant l'interprétation
chimique et en fournissant des informations sur les composants chimiques purs qui depassent
les limites des paramètres fixés par le COI pour l'EVOO. Les deux principaux facteurs sont les
conditions/durée de stockage des fruits non appropriées et le manque de bonnes pratiques
d'hygiène et de fabrication lors de l'extraction de l'huile. La solution à ces non-conformités
reposerait sur de bonnes pratiques de gestion et d'hygiène, notamment la garantie de conditions
de stockage appropriées avant le traitement et la garantie d'une hygiène de base.
3. Les techniques rapides telles que la FFFS et l'Ultra-FGC, et à l'aide d'outils chimiométriques
comme le PARAFAC, le MLR, le PLS et le PCA ont créé un contournement fiable des
techniques d'analyse conventionnelles laborieuses. Les résultats de leur analyse ont donné un
aperçu sur la manière dont il est possible de relier facilement la teneur en fluorophores à la
dégradation des principaux paramètres physico-chimiques des échantillons et sur les principaux
167
volatils caractérisant la variété étudiée en quelques secondes. Les deux techniques ont montré
qu'elles contribuent fortement à l'amélioration de la productivité analytique en réduisant les
coûts et le temps, et en minimisant les risques pour l'analyste.
5. Perspectives
Plusieurs perspectives sont possibles pour la suite de ces travaux de recherche :
- Ce travail préparera le terrain pour l'Indication Géographique Protégée (IGP).
• Meilleur accès au marché pour les producteurs d'olives au Liban
- Communiquer avec les entités responsables au Liban pour faire connaître les causes des non-
conformités aux producteurs d'huile d'olive au Liban
• Améliorer les exportations de l'HOVE libanaise
- Améliorer l'aspect quantitatif / qualitatif de la spectroscopie de fluorescence et de la
chromatographie en phase gazeuse flash, respectivement.
• Adapter de nouveaux modèles chimiométriques comme la PLSDA pour améliorer la
capacité prédictive des modèles
• Utiliser des standards purs externes pour identifier et quantifier la totalité des composés
volatils de l'huile d'olive.
168
References
Abaza, L., Taamalli, W., Temime, S., Daoud, D., Gutierrez, F., & Zarrouk, M. (2005). Natural antioxidant composition as correlated to stability of some Tunisian virgin olive oils. Rivista italiana delle sostanze grasse 82, 12-18.
Abdi, H. (2004). Partial least squares regression: The SAGE encyclopedia of social science research methods. Thousand Oaks, CA: SAGE Publications, 793-795.
Abdi, H., & Williams, L. J. (2010). Principal component analysis. WIREs Computational Statistics 2(4), 433-459.
ACTED. (2018). Lebanon olive value chain analysis report. Report, Beirut: Consultation and Research Institute and ACTED.
Albani, J.-R. 2001. Absorption et Fluorescence, Principes et Applications.
Ammari, F., Cordella, C. B. Y., Boughanmi, N., & Rutledge, D. N. (2012). Independent components analysis applied to 3D-front-face fluorescence spectra of edible oils to study the antioxidant effect of Nigella sativa L. extract on the thermal stability of heated oils. Chemometrics and Intelligent Laboratory Systems 113, 32-42.
Andersen, C. M., & Bro, R. (2003). Practical aspects of PARAFAC modeling of fluorescence excitation-emission data. Journal of Chemometrics 17(4), 200-215.
Angela, Z., Venturi, F., Sanmartin, C., Taglieri, I., & Andrich, G. (2015). The utilization of solid carbon dioxide in the extraction of extra-virgin olive oil: VOO/EVOO yield and quality as a function of extraction conditions adopted. Agro Food Industry Hi-Tech 26, 24-26.
Anniva, C., Grigoriadou, D., Psomiadou, E., & Tsimidou, M. Z. (2006). Pheophytin α degradation products as useful indices in the quality control of virgin olive oil. Journal of the American Oil Chemists' Society 83(4), 371-375.
Aparicio, R., Ferreiro, L., & Alonso, V. (1994). Effect of climate on the chemical composition of virgin olive oil. Analytica Chimica Acta 292(3), 235-241.
Aparicio, R., & Morales, M. T. (1998). Characterization of Olive Ripeness by Green Aroma Compounds of Virgin Olive Oil. Journal of Agricultural and Food Chemistry 46(3), 1116-1122.
Aparicio, R., Morales, M. T., & Alonso, M. V. (1996). Relationship between volatile compounds and sensory attributes of olive oils by the sensory wheel. Journal of the American Oil Chemists’ Society 73(10), 1253-1264.
169
Arslan, D., Karabekir, Y., & Schreiner, M. (2013). Variations of phenolic compounds, fatty acids and some qualitative characteristics of Sarıulak olive oil as induced by growing area. Food Research International 54(2), 1897-1906.
Baccouri, B., Temime, S. B., Campeol, E., Cioni, P. L., Daoud, D., & Zarrouk, M. (2007). Application of solid-phase microextraction to the analysis of volatile compounds in virgin olive oils from five new cultivars. Food Chemistry 102(3), 850-856.
Barbieri, S., Cevoli, C., Bendini, A., Quintanilla-Casas, B., García-González, D. L., & Gallina Toschi, T. (2020). Flash Gas Chromatography in Tandem with Chemometrics: A Rapid Screening Tool for Quality Grades of Virgin Olive Oils. . Foods 9, 862.
Beayno, F., Mattar, C., & Abdul-Nour, H. (2002). Mgharet al-Houriye (Karm Sadde, caza de Zgharta): rapport Pre liminaire de la fouille de 2001. Bull Arche ol Archit Liban 6, 135-178.
Beebe, K. R., Beebe, K. R., Pell, R. J., Pell, R. J., & Seasholtz, M. B. 1998. Chemometrics: A Practical Guide.
Beltrán, G., Bejaoui, M. A., Jimenez, A., & Sanchez-Ortiz, A. (2015). Ethanol in Olive Fruit. Changes during Ripening. J Agric Food Chem 63(22), 5309-5312.
Ben-Gal, A., Yermiyahu, U., Zipori, I., Presnov, E., Hanoch, E., & Dag, A. (2011). The influence of bearing cycles on olive oil production response to irrigation. Irrigation Science 29(3), 253-263.
Berenguer, M. J., Vossen, P. M., Grattan, S. R., Connell, J. H., & Polito, V. S. (2006). Tree Irrigation Levels for Optimum Chemical and Sensory Properties of Olive Oil. HortScience 41(2), 427-432.
Bouveresse, D. J.-R., Benabid, H., & Rutledge, D. N. (2007). Independent component analysis as a pretreatment method for parallel factor analysis to eliminate artefacts from multiway data. Analytica Chimica Acta 589(2), 216-224.
Breidi, M. (2011). Etude de l’influence de l’irrigation et de la date de récolte sur la qualité de l’huile d’olive. Université libanaise, Lebanon.
Brkić Bubola, K., Koprivnjak, O., Sladonja, B., & Belobrajić, I. (2014). Influence of storage temperature on quality parameters, phenols and volatile compounds of Croatian virgin olive oils. Grasas y Aceites 65(3), 34.
Bro, R. (1997). PARAFAC. Tutorial and applications. Chemometrics and Intelligent Laboratory Systems 38(2), 149-171.
Bro, R. (2001). Multiway analysis in the food industry. Models, algorithms and applications. Ph.D. dissertation, University of Amsterdam, Amsterdam.
170
Brown, G. D., Yamada, S., & Sejnowski, T. J. (2001). Independent component analysis at the neural cocktail party. Trends Neurosci 24(1), 54-63.
Carroll, J. D., & Chang, J.-J. (1970). Analysis of individual differences in multidimensional scaling via an n-way generalization of “Eckart-Young” decomposition. Psychometrika 35(3), 283-319.
Ceci, L., & Carelli, A. (2007). Characterization of Monovarietal Argentinian Olive Oils from New Productive Zones. Journal of the American Oil Chemists' Society 84(12), 1125-1136.
Çetinkaya, H., Kulak, M., Ozkan, A., Çelik, M., & Sekeroglu, N. (2017). INFLUENCE OF GEOGRAPHICAL FACTORS ON THE FATTY ACID PROFILE AND OIL YIELD OF Olea europaea L. Scientific Papers. Series A. Agronomy LX. 468-474.
Chehade, A., Bitar, A. E., Kadri, A., Choueiri, E., Nabbout, R., Youssef, H., Smeha, M., Awada, A., Chami, Z. A., Dubla, E., Trani, A., Mondelli, D. ... Famiani, F. (2016). In situ evaluation of the fruit and oil characteristics of the main Lebanese olive germplasm. J Sci Food Agric 96(7), 2532-2538.
Cheikhousman, R., Zude, M., Bouveresse, D. J., Leger, C. L., Rutledge
, D. N., & Birlouez-Aragon, I. (2005a). Fluorescence spectroscopy for monitoring deterioration of extra virgin olive oil during heating. Anal Bioanal Chem 382(6), 1438-1443.
Cheikhousman, R., Zude, M., Bouveresse, D. J., Léger, C. L., Rutledge, D. N., & Birlouez-Aragon, I. (2005b). Fluorescence spectroscopy for monitoring deterioration of extra virgin olive oil during heating. Anal Bioanal Chem 382(6), 1438-1443.
Chen, J., & Wang, X. Z. (2001). A new approach to near-infrared spectral data analysis using independent component analysis. J Chem Inf Comput Sci 41(4), 992-1001.
Cicerale, S., Conlan, X. A., Sinclair, A. J., & Keast, R. S. (2009). Chemistry and health of olive oil phenolics. Crit Rev Food Sci Nutr 49(3), 218-236.
Claude, M. (2005). Recherche des paramètres d’authentification régionales de l’huile d’olive au sud Liban. Université Saint Esprit de Kaslik, Lebanon.
Clifford, D., Stone, G., Montoliu, I., Rezzi, S., Martin, F.-P., Guy, P., Bruce, S. ... Kochhar, S. (2009). Alignment Using Variable Penalty Dynamic Time Warping. Analytical Chemistry 81(3), 1000-1007.
Comon, P. (1994). Independent component analysis, A new concept? Signal Processing 36(3), 287-314.
171
Cordella, C. B. Y. (2012). Prinicple Component Analysis: The Basic Building Block of Chemometrics. L'Actualité Chimique. Société chimique de France, 13-18.
Dag, A., Kerem, Z., Yogev, N., Zipori, I., Lavee, S., & Ben-David, E. (2011). Influence of time of harvest and maturity index on olive oil yield and quality. Scientia Horticulturae 127(3), 358-366.
Dankowska, A., & Małecka, M. (2009). Application of synchronous fluorescence spectroscopy for determination of extra virgin olive oil adulteration. European Journal of Lipid Science and Technology 111(12), 1233-1239.
DeRose, P. C., & Resch-Genger, U. (2010). Recommendations for Fluorescence Instrument Qualification: The New ASTM Standard Guide. Analytical Chemistry 82(5), 2129-2133.
Di Bella, G., Maisano, R., La Pera, L., Lo Turco, V., Salvo, F., & Dugo, G. (2007). Statistical Characterization of Sicilian Olive Oils from the Peloritana and Maghrebian Zones According to the Fatty Acid Profile. J Agric Food Chem 55(16), 6568-6574.
Di Giovacchino, L., Angerosa, F., & Di Giacinto, L. (1996). Effect of mixing leaves with olives on organoleptic quality of oil obtained by centrifugation. Journal of the American Oil Chemists’ Society 73(3), 371-374.
Di Giovacchino, L., Solinas, M., & Miccoli, M. (1994). Effect of extraction systems on the quality of virgin olive oil. Journal of the American Oil Chemists' Society 71(11), 1189-1194.
Díaz, G. C., Tapanes, N. d. l. C. O., Câmara, L. D. T., & Aranda, D. A. G. (2014). Glycerol conversion in the experimental study of catalytic hydrolysis of triglycerides for fatty acids production using Ni or Pd on Al2O3 or SiO2. Renewable Energy 64, 113-122.
Donaire, J. P., Sánchez, A. J., López-Gorgé, J., & Recalde, L. (1975). Metabolic changes in fruit and leaf during ripening in the olive. Phytochemistry 14(5), 1167-1169.
Dupuy, N., Le Dréau, Y., Ollivier, D., Artaud, J., Pinatel, C., & Kister, J. (2005). Origin of French Virgin Olive Oil Registered Designation of Origins Predicted by Chemometric Analysis of Synchronous Excitation−Emission Fluorescence Spectra. J Agric Food Chem 53(24), 9361-9368.
EEC. (1991). On the characteristics of olive oil and olive-residue oil and on the relevant methods of analysis. EEC Regulation 2568. EEC Official Report L248, 1– 48.
Eilers, P. H. (2004). Parametric time warping. Anal Chem 76(2), 404-411.
Elcoroaristizabal, S., Bro, R., García, J. A., & Alonso, L. (2015). PARAFAC models of fluorescence data with scattering: A comparative study. Chemometrics and Intelligent Laboratory Systems 142, 124-130.
172
Engelsen, S. B. (1997). Explorative spectrometric evaluations of frying oil deterioration. Journal of the American Oil Chemists' Society 74(12), 1495.
Faci, J. M., Berenguer, M. J., Espada, J. L., & Gracia, S. (2002) Effect of variable water irrigation supply in olive (olea europaea l.) Cv. Arbequina in aragon (spain). I. Fruit and oil production. 586 ed.: International Society for Horticultural Science (ISHS), Leuven, Belgium, 341-344.
Famiani, F., Proietti, P., Farinelli, D., & Tombesi, A. 2002a. Oil Quality in Relation to Olive Ripening.
Famiani, F., Proietti, P., Farinelli, D., & Tombesi, A. (2002b). Oil quality in relation to olive ripening. 586 ed.: International Society for Horticultural Science (ISHS), Leuven, Belgium, 671-674.
Frackowiak, D. (1988). The Jablonski diagram. Journal of Photochemistry and Photobiology B: Biology 2(3), 399.
Franco, M., Sánchez Casas, J., Miguel, C., Martínez, M., & Martín-Vertedor, D. (2015). Influence of the Fruit's Ripeness on Virgin Olive Oil Quality. Journal of oleo science 64, 263-273.
Garcia, R., Boussard, A., Rakotozafy, L., Nicolas, J., Potus, J., Rutledge, D. N., & Cordella, C. B. Y. (2016). 3D-front-face fluorescence spectroscopy and independent components analysis: A new way to monitor bread dough development. Talanta 147, 307-314.
García-González, D. L., Romero, N., & Aparicio, R. (2010). Comparative study of virgin olive oil quality from single varieties cultivated in Chile and Spain. J Agric Food Chem 58(24), 12899-12905.
García-Inza, G. P., Castro, D. N., Hall, A. J., & Rousseaux, M. C. (2014). Responses to temperature of fruit dry weight, oil concentration, and oil fatty acid composition in olive (Olea europaea L. var. ‘Arauco’). European Journal of Agronomy 54(107-115.
Gargouri, O. D., Rouina, Y. B., Mansour, A. B., Flamini, G., Rouina, B. B., & Bouaziz, M. (2016). Comparative Study of Oil Quality and Aroma Profiles from Tunisian Olive Cultivars Growing in Saharian Oasis Using Chemometric Analysis. J Oleo Sci 65(12), 1033-1044.
Giacalone, R., Giuliano, S., Gulotta, E., Monfreda, M., & Presti, G. (2015). Origin assessment of EV olive oils by esterified sterols analysis. Food Chem 188(279-285.
Giovacchino, L. D. (2000). Technological Aspects: Handbook of Olive Oil: Analysis and Properties. Gaithersburg, MD (USA): Aspen Publisher, 17-59.
Giuliani, A., Cerretani, L., & Cichelli, A. (2011). Chlorophylls in olive and in olive oil: chemistry and occurrences. Crit Rev Food Sci Nutr 51(7), 678-690.
173
Gnoni, G. V., Natali, F., Geelen, M. J. H., & Siculella, L. (2010). Chapter 152 - Oleic Acid as an Inhibitor of Fatty Acid and Cholesterol Synthesis: Olives and Olive Oil in Health and Disease Prevention. San Diego: Academic Press, 1365-1373.
Gomez, G., Ruiz, J., & Luque de Castro, M. (2011). Oil Content and Fatty Acid Profile of Spanish Cultivars During Olive Fruit Ripening. Journal of the American Oil Chemists' Society 88(11), 1737-1745.
Grattan, S. R., Berenguer, M. J., Connell, J. H., Polito, V. S., & Vossen, P. M. (2006). Olive oil production as influenced by different quantities of applied water. Agricultural Water Management 85(1), 133-140.
Guimet, F., Boqué, R., & Ferré, J. (2004a). Cluster Analysis Applied to the Exploratory Analysis of Commercial Spanish Olive Oils by Means of Excitation−Emission Fluorescence Spectroscopy. J Agric Food Chem 52(22), 6673-6679.
Guimet, F., Ferré, J., Boqué, R., & Rius, F. X. (2004b). Application of unfold principal component analysis and parallel factor analysis to the exploratory analysis of olive oils by means of excitation–emission matrix fluorescence spectroscopy. Analytica Chimica Acta 515(1), 75-85.
Guimet, F., Ferre, J., Boque, R., Vidal, M., & Garcia, J. (2005). Excitation-emission fluorescence spectroscopy combined with three-way methods of analysis as a complementary technique for olive oil characterization. J Agric Food Chem 53(24), 9319-9328.
Gutiérrez, F., Jímenez, B., Ruíz, A., & Albi, M. A. (1999). Effect of Olive Ripeness on the Oxidative Stability of Virgin Olive Oil Extracted from the Varieties Picual and Hojiblanca and on the Different Components Involved. J Agric Food Chem 47(1), 121-127.
Guzman, E., Baeten, V., Pierna, J. A., & Garcia-Mesa, J. A. (2015). Evaluation of the overall quality of olive oil using fluorescence spectroscopy. Food Chem 173(927-934.
Harshman, R. A. 1970. Foundations of the PARAFAC Procedure: Models and Conditions for an "explanatory" Multi-modal Factor Analysis.
Hernandez, M. L., Padilla, M. N., Sicardo, M. D., Mancha, M., & Martinez-Rivas, J. M. (2011). Effect of different environmental stresses on the expression of oleate desaturase genes and fatty acid composition in olive fruit. Phytochemistry 72(2-3), 178-187.
Hlima, H. B., Ayed, R. B., Ennouri, K., & Smaoui, S. (2017). Geographical Discrimination of Virgin Olive Oils from the Tunisian Coasts by Combining Fatty Acids and Phenolic Acids Profiles within a Multivariate Analysis. J Oleo Sci 66(9), 963-971.
Hotelling, H. (1933). Analysis of a Complex of Statistical Variables Into Principal Components. Journal of Educational Psychology 24, 417-441.
174
IDAL. (2017a). Olive Oil Fact Book. Olive Oil 1-25.
IDAL. 2017b. Olive Oil Industry in Lebanon. Available at: https://investinlebanon.gov.lb/Content/uploads/CorporatePageRubric/180123031939637~Olive%20Oil%20factsheet%202017.pdf (accessed 02/08/2019).
Inglese, P., Famiani, F., Galvano, F., Servili, M., Esposto, S., & Urbani, S. (2011). Factors Affecting Extra-Virgin Olive Oil Composition: Horticultural Reviews. Hoboken, New Jersey: Wiley‐Blackwel, 83-147.
IOC (2011a) Guide for the determination of the characteristics of oil-olives. In: Council IO (ed). Madrid. Spain, 1-41.
IOC. (2011b). Trade standards applying to olive oils and olive-pomace oils. COI/T.15/ NC, No. 3/Rev. 6, 4–5.
IOC. 2018. World olive oil figures. Available at: http://www.internationaloliveoil.org/estaticos/view/131-world-olive-oil-figures (accessed 1/04/2020).
IOC. 2020. Available at: https://www.internationaloliveoil.org (accessed 25/03/2020).
Isabel Minguez-Mosquera, M., Rejano-Navarro, L., Gandul-Rojas, B., SanchezGomez, A. H., & Garrido-Fernandez, J. (1991). Color-pigment correlation in virgin olive oil. Journal of the American Oil Chemists Society 68(5), 332-336.
Issaoui, M., Flamini, G., Brahmi, F., Dabbou, S., Hassine, K. B., Taamali, A., Chehab, H., Ellouz, M., Zarrouk, M. ... Hammami, M. (2010). Effect of the growing area conditions on differentiation between Chemlali and Chétoui olive oils. Food Chemistry 119(1), 220-225.
Jabeur, H., Zribi, A., Makni, J., Rebai, A., Abdelhedi, R., & Bouaziz, M. (2014). Detection of Chemlali Extra-Virgin Olive Oil Adulteration Mixed with Soybean Oil, Corn Oil, and Sunflower Oil by Using GC and HPLC. J Agric Food Chem 62(21), 4893-4904.
Kachouri, F., & Hamdi, M. (2004). Enhancement of polyphenols in olive oil by contact with fermented olive mill wastewater by Lactobacillus plantarum. Process Biochemistry 39(7), 841-845.
Kano, M., Tanaka, S., Hasebe, S., Hashimoto, I., & Ohno, H. (2003). Monitoring independent components for fault detection. AIChE Journal 49(4), 969-976.
Kiers, H. A. L. (2000). Towards a standardized notation and terminology in multiway analysis. Journal of Chemometrics 14(3), 105-122.
175
Kim, C. M., Park, H. M., Kim, T., Choi, Y. K., & Lee, S. Y. (2003). FPGA implementation of ICA algorithm for blind signal separation and adaptive noise canceling. IEEE Trans Neural Netw 14(5), 1038-1046.
Kiritsakis, A., Nanos, G. D., Polymenopulos, Z., Thomai, T., & Sfakiotakis, E. M. (1998). Effect of fruit storage conditions on olive oil quality. Journal of the American Oil Chemists' Society 75(6), 721-724.
Kris-Etherton, P. M., Pearson, T. A., Wan, Y., Hargrove, R. L., Moriarty, K., Fishell, V., & Etherton, T. D. (1999). High-monounsaturated fatty acid diets lower both plasma cholesterol and triacylglycerol concentrations. Am J Clin Nutr 70(6), 1009-1015.
Kyçyk, O., Aguilera, M. P., Gaforio, J. J., Jiménez, A., & Beltrán, G. (2016). Sterol composition of virgin olive oil of forty-three olive cultivars from the World Collection Olive Germplasm Bank of Cordoba. J Sci Food Agric 96(12), 4143-4150.
Kyriakidis, N. B., & Skarkalis, P. (2000). Fluorescence spectra measurement of olive oil and other vegetable oils. Journal of AOAC International 83(6), 1435-1439.
Lakowicz, J. R. (2006). Introduction to Fluorescence: Principles of Fluorescence Spectroscopy. Boston, MA: Springer US, 1-26. 10.1007/978-0-387-46312-4_1
Lazzez, A., Perri, E., Caravita, M. A., Khlif, M., & Cossentini, M. (2008). Influence of Olive Maturity Stage and Geographical Origin on Some Minor Components in Virgin Olive Oil of the Chemlali Variety. J Agric Food Chem 56(3), 982-988.
Leardi, R. (2002). Chemometrics: From classical to genetic algorithms. Grasas y Aceites 53(1), 115-127.
Lee, J.-M., Yoo, C., & Lee, I.-B. (2003). Statistical Process Monitoring with Multivariate Exponentially Weighted Moving Average and Independent Component Analysis. Journal of Chemical Engineering of Japan - J CHEM ENG JPN 36, 563-577.
Lleo, L., Hernandez-Sanchez, N., Ammari, F., & Roger, J.-M. (2016). 3D front-face fluorescence spectroscopy for characterization of olive oil. Agricultural Engineering International: CIGR Journal 18, 190-199.
Locquet, N., Aït‐Kaddour, A., & B.Y. Cordella, C. (2019). 3D Fluorescence Spectroscopy and Its Applications: Encyclopedia of Analytical Chemistry. 1-39.
Lodolini, E. M., Polverigiani, S., Ali, S., Mutawea, M., Qutub, M., Arabasi, T., Pierini, F., Abed, M. ... Neri, D. (2017). Oil Characteristics of Four Palestinian Olive Varieties. J Oleo Sci 66(5), 435-441.
Lombardo, N., Marone, E., Alessandrino, M., Godino, G., Madeo, A., & Fiorino, P. (2008). Influence of growing season temperatures in the fatty acids (FAs) of triacilglycerols
176
(TAGs) composition in Italian cultivars of Olea europaea. Advances in Horticultural Science 22, 49-53.
López-Feria, S., Cárdenas, S., García-Mesa, J. A., & Valcárcel, M. (2008). Classification of extra virgin olive oils according to the protected designation of origin, olive variety and geographical origin. Talanta 75(4), 937-943.
Lukić, M., Lukić, I., Krapac, M., Sladonja, B., & Piližota, V. (2013). Sterols and triterpene diols in olive oil as indicators of variety and degree of ripening. Food Chemistry 136(1), 251-258.
Maaitah, M., Al-Absi, K., & Al-Rawashdeh, A. (2009). Oil Quality and Quantity of Three Olive Cultivars as Influenced by Harvesting Date in the Middle and Southern Parts of Jordan. Int. J. Agr. Biol.
Maga, J. A. (1978). Simple phenol and phenolic compounds in food flavor. CRC Crit Rev Food Sci Nutr 10(4), 323-372.
Mahfoud, S. (2007). Olive oil: where it all began: Green Gold, the story of Lebanese olive oil. Beirut: Turning Point.
Mailer, R. J. (2005). Variation in oil quality and fatty acid composition in Australian olive oil. Australian Journal of Experimental Agriculture 45(1), 115-119.
Mailer, R. J., Ayton, J., & Graham, K. (2010). The Influence of Growing Region, Cultivar and Harvest Timing on the Diversity of Australian Olive Oil. Journal of the American Oil Chemists' Society 87(8), 877-884.
Makeig, S., Westerfield, M., Jung, T. P., Enghoff, S., Townsend, J., Courchesne, E., & Sejnowski, T. J. (2002). Dynamic brain sources of visual evoked responses. Science 295(5555), 690-694.
Mannina, L., Dugo, G., Salvo, F., Cicero, L., Ansanelli, G., Calcagni, C., & Segre, A. (2003). Study of the cultivar-composition relationship in Sicilian olive oils by GC, NMR, and statistical methods. J Agric Food Chem 51(1), 120-127.
Marsilio, V., Campestre, C., Lanza, B., & De Angelis, M. (2001). Sugar and polyol compositions of some European olive fruit varieties (Olea europaea L.) suitable for table olive purposes. Food Chemistry 72(4), 485-490.
Mascolo, A. C., A.; Di Giovacchino, L.; Solinas, M.; Seghetti, L.;. (1980). Confronto tra i rendimenti in olio conseguibili con i sistemi della pressione e della centrifugazione nella lavorazione delle olive. Ann Ist Sper Elaiotecnica VIII, 165–174.
Melucci, D., Bendini, A., Tesini, F., Barbieri, S., Zappi, A., Vichi, S., Conte, L. ... Gallina Toschi, T. (2016). Rapid direct analysis to discriminate geographic origin of extra virgin
177
olive oils by flash gas chromatography electronic nose and chemometrics. Food Chem 204, 263-273.
Merchak, N., El Bacha, E., Bou Khouzam, R., Rizk, T., Akoka, S., & Bejjani, J. (2017). Geoclimatic, morphological, and temporal effects on Lebanese olive oils composition and classification: A 1H NMR metabolomic study. Food Chemistry 217, 379-388.
Mickelbart, M. V., & James, D. (2003). Development of a dry matter maturity index for olive (Olea europaea). New Zealand Journal of Crop and Horticultural Science 31(3), 269-276.
Migliorini, M., Cherubini, C., Mugelli, M., Gianni, G., Trapani, S., & Zanoni, B. (2011). Relationship between the oil and sugar content in olive oil fruits from Moraiolo and Leccino cultivars during ripening. Scientia Horticulturae 129(4), 919-921.
Mireille, S. (2003). Recherche des paramètres d’authentification régionales de l’huile d’olive au Nord Liban., Université Saint Esprit de Kaslik, Lebanon.
Mishra, P., Cordella, C. B. Y., Rutledge, D. N., Barreiro, P., Roger, J. M., & Diezma, B. (2016). Application of independent components analysis with the JADE algorithm and NIR hyperspectral imaging for revealing food adulteration. Journal of Food Engineering 168, 7-15.
MOA. (2012). Overview of the Lebanese Olive Sector. Report, Lebanon: Lebanese Republic Ministry of Agriculture.
Montedoro, G., Servili, M., Baldioli, M., & Miniati, E. (1992). Simple and hydrolyzable phenolic compounds in virgin olive oil. 1. Their extraction, separation, and quantitative and semiquantitative evaluation by HPLC. J Agric Food Chem 40(9), 1571-1576.
Morales, M. T., Angerosa, F., & Aparicio, R. (1999). Effect of the extraction conditions of virgin olive oil on the lipoxygenase cascade:Chemical and sensory implications. Grasas y Aceites 50(2), 114-121.
Morales, M. T., Luna, G., & Aparicio, R. (2005). Comparative study of virgin olive oil sensory defects. Food Chemistry 91(2), 293-301.
Motilva, M.-J., & Romero, M.-P. (2010). Chapter 7 - The Effect of the Ripening Process of the Olive Fruit on the Chlorophyll and Carotenoid Fractions of Drupes and Virgin Oils: Olives and Olive Oil in Health and Disease Prevention. San Diego: Academic Press, 59-68.
Nergiz, C., & Ergönül, P. G. (2009). Organic acid content and composition of the olive fruits during ripening and its relationship with oil and sugar. Scientia Horticulturae 122(2), 216-220.
178
Nergiz, C., & Ünal, K. (1991). Determination of phenolic acids in virgin olive oil. Food Chemistry 39(2), 237-240.
Nielsen, N.-P. V., Carstensen, J. M., & Smedsgaard, J. (1998). Aligning of single and multiple wavelength chromatographic profiles for chemometric data analysis using correlation optimised warping. Journal of Chromatography A 805(1), 17-35.
Noorali, M., Barzegar, M., & Sahari, M. A. (2014). Sterol and Fatty Acid Compositions of Olive Oil as an Indicator of Cultivar and Growing Area. Journal of the American Oil Chemists' Society 91(9), 1571-1581.
Osman, M. M., I.; Gerasopoulos, D.; Kiritsakis, A. (1994). Qualitative changes in olive oil of fruits collected from trees grown at two altitudes. Riv Ital Sostanze Grasse 71(187-190.
Penner, M. H. (2017). Basic Principles of Spectroscopy: Food Analysis. Cham: Springer International Publishing, 79-88.
Pérez-López, D., Ribas, F., Moriana, A., Olmedilla, N., & de Juan, A. (2007). The effect of irrigation schedules on the water relations and growth of a young olive (Olea europaea L.) orchard. Agricultural Water Management 89(3), 297-304.
Piravi-Vanak, Z., Ghasemi, J. B., Ghavami, M., Ezzatpanah, H., & Zolfonoun, E. (2012). The Influence of Growing Region on Fatty Acids and Sterol Composition of Iranian Olive Oils by Unsupervised Clustering Methods. Journal of the American Oil Chemists' Society 89(3), 371-378.
Poulli, K. I., Chantzos, N. V., Mousdis, G. A., & Georgiou, C. A. (2009). Synchronous fluorescence spectroscopy: tool for monitoring thermally stressed edible oils. J Agric Food Chem 57(18), 8194-8201.
Poulli, K. I., Mousdis, G. A., & Georgiou, C. A. (2005). Classification of edible and lampante virgin olive oil based on synchronous fluorescence and total luminescence spectroscopy. Analytica Chimica Acta 542(2), 151-156.
Rabih, G. (2005). Influence des systèmes d’extraction sur la qualité de l’huile d’olive. Université Saint Esprit de Kaslik,, Lebanon.
Ranalli, A., Contento, S., Schiavone, C., & Simone, N. (2001). Malaxing temperature affects volatile and phenol composition as well as other analytical features of virgin olive oil. European Journal of Lipid Science and Technology 103(4), 228-238.
Ranalli, A., Tombesi, A., Ferrante, M. L., & De Mattia, G. (1998). Respiratory rate of olive drupes during their ripening cycle and quality of oil extracted. J Sci Food Agric 77(3), 359-367.
179
Rapoport, H. F., Costagli, G., & Gucci, R. (2004). The Effect of Water Deficit during Early Fruit Development on Olive Fruit Morphogenesis. Journal of the American Society for Horticultural Science 129(1), 121-127.
Recep, E., Abdullah, S., Isa, C., & Süleyman, s. (2011). Olive and olive oil culture in the Mediterranean Region: Environment and Ecology in the Mediterranean Region. Cambridge Scholars Publishing, 54-64.
Riachy, M., Bou Mitri, C., Youssef, A., Andary, R., & Skaff, W. (2018). Chemical and Sensorial Characteristics of Olive Oil Produced from the Lebanese Olive Variety ‘Baladi’. Sustainability 10, 1-21.
Ripa, V., De Rose, F., Caravita, M. A., Parise, M. R., Perri, E., Rosati, A., Mennone, C., Paoletti, A., Pannelli, G., Padula, G., Giordani, E., Bellini, E., Buccoliero, A., Pandolfi, S. (2008) Qualitative Evaluation of Olive Oils From New Olive Selections and Effects of Genotype and Environment on Oil Quality.
Rotondi, A., Bendini, A., Cerretani, L., Mari, M., Lercker, G., & Toschi, T. G. (2004). Effect of olive ripening degree on the oxidative stability and organoleptic properties of cv. Nostrana di Brisighella extra virgin olive oil. J Agric Food Chem 52(11), 3649-3654.
Ruiz, M. A., Arias, J. L., & Gallardo, V. (2010). Chapter 124 - Skin Creams Made with Olive Oil: Olives and Olive Oil in Health and Disease Prevention. San Diego: Academic Press, 1133-1141.
Salas, J. J., Willams, M., Harwood, J. L., & Sánchez, J. (1999). Lipoxygenase activity in olive (Olea europaea) fruit. Journal of the American Oil Chemists' Society 76(10), 1163-1168.
Salvador, M., Aranda, F., Gómez-Alonso, S., & Fregapane, G. (2003). Influence of extraction system, production year and area on Cornicabra virgin olive oil: A study of five crop seasons. Food Chemistry 80, 359-366.
Savorani, F., Tomasi, G., & Engelsen, S. B. (2010). icoshift: A versatile tool for the rapid alignment of 1D NMR spectra. J Magn Reson 202(2), 190-202.
Sayago, A., García-González, D. L., Morales, M. T., & Aparicio, R. (2007). Detection of the Presence of Refined Hazelnut Oil in Refined Olive Oil by Fluorescence Spectroscopy. J Agric Food Chem 55(6), 2068-2071.
Segura-Carretero, A., Menéndez-Menéndez, J., & Fernández-Gutiérrez, A. (2010). Chapter 19 - Polyphenols in Olive Oil: The Importance of Phenolic Compounds in the Chemical Composition of Olive Oil: Olives and Olive Oil in Health and Disease Prevention. San Diego: Academic Press, 167-175.
Servili, M., Esposto, S., Lodolini, E., Selvaggini, R., Taticchi, A., Urbani, S., Montedoro, G., Serravalle, M. ... Gucci, R. (2007). Irrigation Effects on Quality, Phenolic Composition,
180
and Selected Volatiles of Virgin Olive Oils Cv. Leccino. J Agric Food Chem 55(16), 6609-6618.
Shao, X., Wang, G., Wang, S., & Su, Q. (2004). Extraction of Mass Spectra and Chromatographic Profiles from Overlapping GC/MS Signal with Background. Analytical Chemistry 76(17), 5143-5148.
Siebert, K. J. (2001). Chemometrics in Brewing—A Review. Journal of the American Society of Brewing Chemists 59(4), 147-156.
Sikorska, E., Górecki, T., Khmelinskii, I. V., Sikorski, M., & Kozioł, J. (2005). Classification of edible oils using synchronous scanning fluorescence spectroscopy. Food Chemistry 89(2), 217-225.
Sikorska, E., Khmelinskii, I. V., Sikorski, M., Caponio, F., Bilancia, M. T., Pasqualone, A., & Gomes, T. (2008). Fluorescence spectroscopy in monitoring of extra virgin olive oil during storage. International Journal of Food Science & Technology 43(1), 52-61.
Sikorska, E., Romaniuk, A., Khmelinskii, I. V., Herance, R., Bourdelande, J. L., Sikorski, M., & Kozioł, J. (2004). Characterization of Edible Oils Using Total Luminescence Spectroscopy. Journal of Fluorescence 14(1), 25-35.
Sikorska, J., Hodkiewicz, M., & Ma, L. (2011). Prognostic modeling options for remaining useful life estimation by industry. Mechanical Systems and Signal Processing 25(1803-1836.
Souilem, S., El-Abbassi, A., Kiai, H., Hafidi, A., Sayadi, S., & Galanakis, C. M. (2017). Chapter 1 - Olive oil production sector: environmental effects and sustainability challenges: Olive Mill Waste. Academic Press, 1-28.
Soupas, L., Juntunen, L., Lampi, A. M., & Piironen, V. (2004). Effects of sterol structure, temperature, and lipid medium on phytosterol oxidation. J Agric Food Chem 52(21), 6485-6491.
Stefanoudaki, E., Kotsifaki, F., & Koutsaftakis, A. (1999). Classification of virgin olive oils of the two major cretan cultivars based on their fatty acid composition. Journal of the American Oil Chemists' Society 76(5), 623-626.
Stefanoudaki, E., Williams, M., Chartzoulakis, K., & Harwood, J. (2009). Effect of Irrigation on Quality Attributes of Olive Oil. J Agric Food Chem 57(15), 7048-7055.
Szudy, J., & Toruniu, U. M. K. w. 1998. Born 100 Years Ago: Aleksander Jabłonski, 1898-1980.
Tabachnick, B. G., Fidell, L. S., & Ullman, J. B. 2018. Using Multivariate Statistics.
181
Täufel, K. (1964). Analysis and Characterization of Oils, Fats and Fat Products. Food. 8(7), 605-606.
Temime, S. B., Baccouri, B., Taamalli, W., Abaza, L., Daoud, D., & Zarrouk, M. (2006). Location effects on oxidative stability of chétoui virgin olive oil. Journal of Food Biochemistry 30(6), 659-670.
Tena, N., Aparicio, R., & García-González, D. L. (2012). Chemical changes of thermoxidized virgin olive oil determined by excitation–emission fluorescence spectroscopy (EEFS). Food Research International 45(1), 103-108.
Tena, N., García-González, D. L., & Aparicio, R. (2009). Evaluation of Virgin Olive Oil Thermal Deterioration by Fluorescence Spectroscopy. J Agric Food Chem 57(22), 10505-10511.
Thalman, J. P. (2000). ‘Tell Arqa’, BAAL. 4,5-74.
Thanh, T. T., Vergnes, M.-F., Kaloustian, J., El-Moselhy, T. F., Amiot-Carlin, M.-J., & Portugal, H. (2006). Effect of storage and heating on phytosterol concentrations in vegetable oils determined by GC/MS. J Sci Food Agric 86(2), 220-225.
Townshend, A. 1995. Encyclopedia of Analytical Science.
Trentacoste, E. R., Banco, A. P., Piccoli, P. N., & Monasterio, R. P. (2020). Olive oil characterization of cv. ‘Arauco’ harvested at different times in areas with early frost in Mendoza, Argentina. J Sci Food Agric 100(3), 953-960.
Tura, D., Gigliotti, C., Pedò, S., Failla, O., Bassi, D., & Serraiocco, A. (2007). Influence of cultivar and site of cultivation on levels of lipophilic and hydrophilic antioxidants in virgin olive oils (Olea Europea L.) and correlations with oxidative stability. Scientia Horticulturae 112(1), 108-119.
Valderrama, P., Março, P. H., Locquet, N., Ammari, F., & Rutledge, D. N. (2011). A procedure to facilitate the choice of the number of factors in multi-way data analysis applied to the natural samples: Application to monitoring the thermal degradation of oils using front-face fluorescence spectroscopy. Chemometrics and Intelligent Laboratory Systems 106(2), 166-172.
Valeur, B. 2004. Invitation à la fluorescence moléculaire.
Varzakas, T. H., Zakynthinos, G., & Arapoglou, D. (2010). Fruit ripening in relationship to oil quality and some quality characteristics of the Greek olive cultivar koroneiki. Italian Journal of Food Science 22, 401-407.
Visser, E., & Lee, T.-W. (2004). An information-theoretic methodology for the resolution of pure component spectra without prior information using spectroscopic measurements. Chemometrics and Intelligent Laboratory Systems 70(2), 147-155.
182
Vossen, P. (2007). Olive Oil: History, Production, and Characteristics of the World's Classic Oils. HortScience 42.
Wold, H. (1982) Soft modelling: The Basic Design and Some Extensions.
Wold, S., Sjostrom, M., & Eriksson, L. (2001). PLS-regression: A Basic Tool of Chemometrics. Chemometrics and Intelligent Laboratory Systems 58, 109-130.
Yoo, C. K., Lee, J.-M., Vanrolleghem, P. A., & Lee, I.-B. (2004). On-line monitoring of batch processes using multiway independent component analysis. Chemometrics and Intelligent Laboratory Systems 71(2), 151-163.
Youssef, F. (2002). Influence de l’irrigation, du cultivar et de la date de récolte sur la qualité de l’huile d’olive. Université Saint Esprit de Kaslik, Lebanon.
Zamora, R., Alaiz, M., & Hidalgo, F. J. (2001). Influence of cultivar and fruit ripening on olive (Olea europaea) fruit protein content, composition, and antioxidant activity. J Agric Food Chem 49(9), 4267-4270.
Zandomeneghi, M., Carbonaro, L., & Caffarata, C. (2005). Fluorescence of vegetable oils: olive oils. J Agric Food Chem 53(3), 759-766.
Zarrouk, W., Baccouri, B., Taamalli, W., Trigui, A., Daoud, D., & Zarrouk, M. (2009). Oil fatty acid composition of eighteen Mediterranean olive varieties cultivated under the arid conditions of Boughrara (southern Tunisia). Grasas y Aceites 60
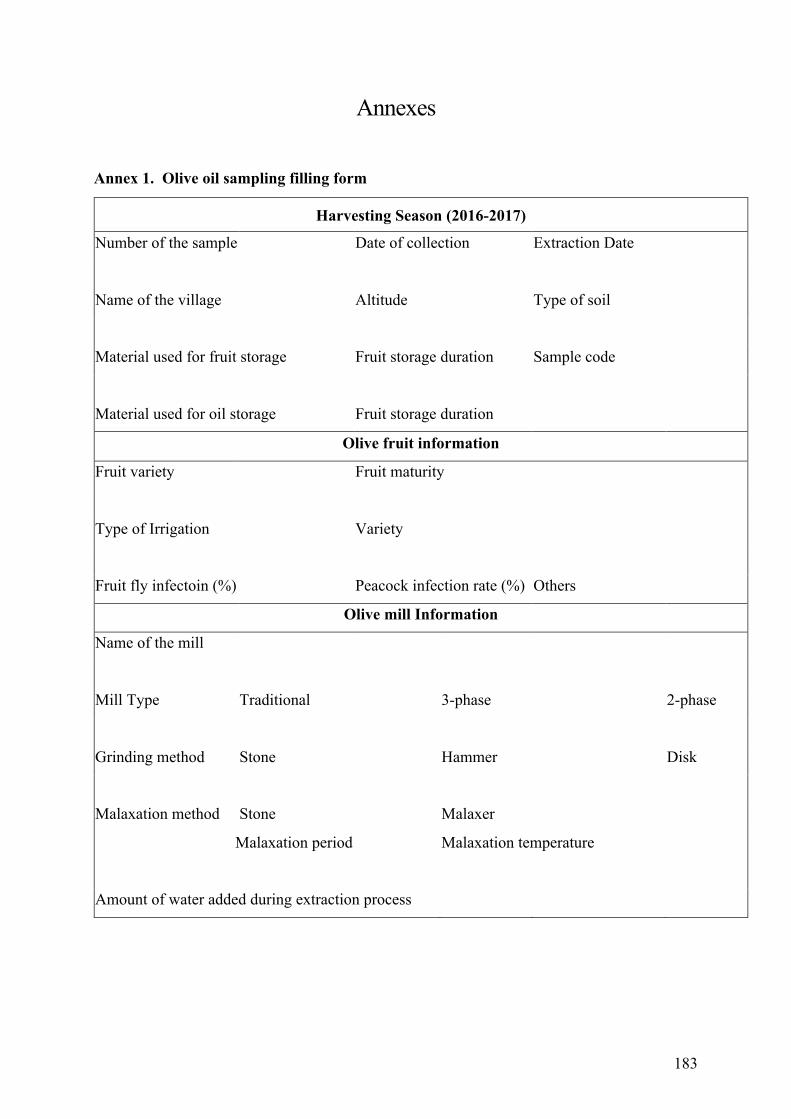
183
Annexes
Annex 1. Olive oil sampling filling form
Harvesting Season (2016-2017)
Number of the sample Date of collection Extraction Date
Name of the village
Altitude
Type of soil
Material used for fruit storage Fruit storage duration Sample code
Material used for oil storage Fruit storage duration
Olive fruit information
Fruit variety
Fruit maturity
Type of Irrigation
Variety
Fruit fly infectoin (%) Peacock infection rate (%) Others
Olive mill Information
Name of the mill
Mill Type Traditional
3-phase
2-phase
Grinding method Stone
Hammer
Disk
Malaxation method Stone
Malaxer
Malaxation period
Malaxation temperature
Amount of water added during extraction process
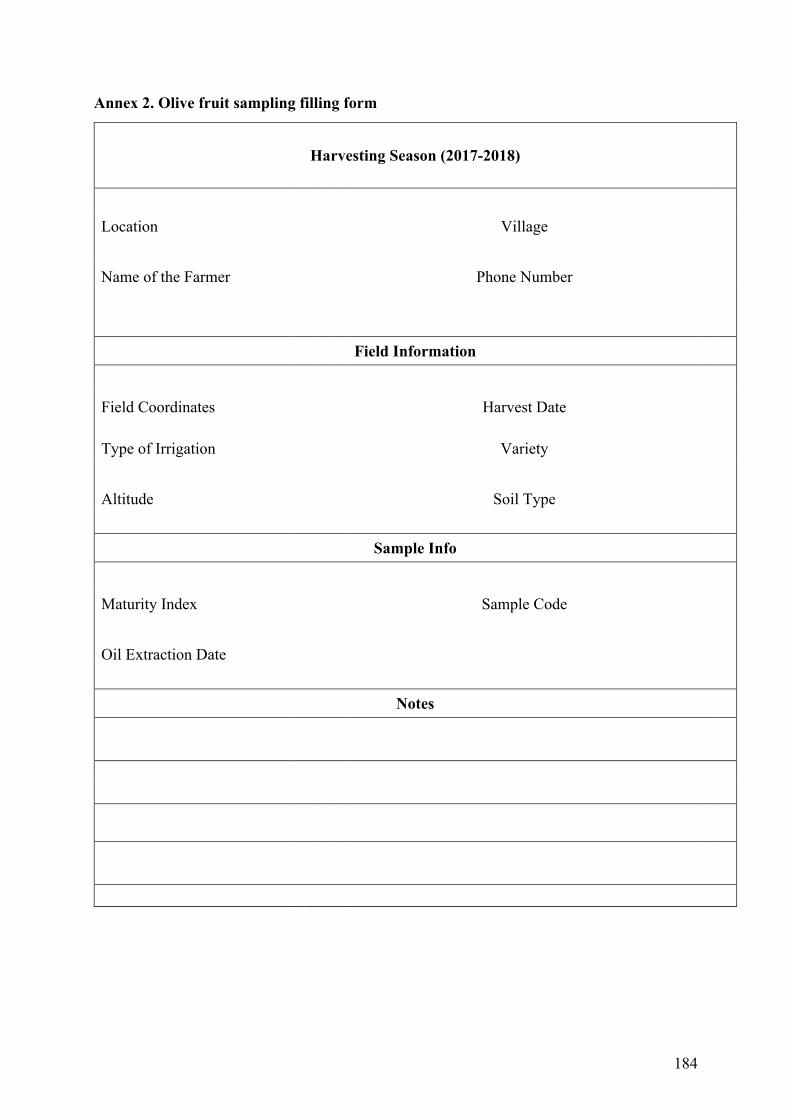
184
Annex 2. Olive fruit sampling filling form
Harvesting Season (2017-2018)
Location Village
Name of the Farmer Phone Number
Field Information
Field Coordinates Harvest Date
Type of Irrigation Variety
Altitude Soil Type
Sample Info
Maturity Index Sample Code
Oil Extraction Date
Notes
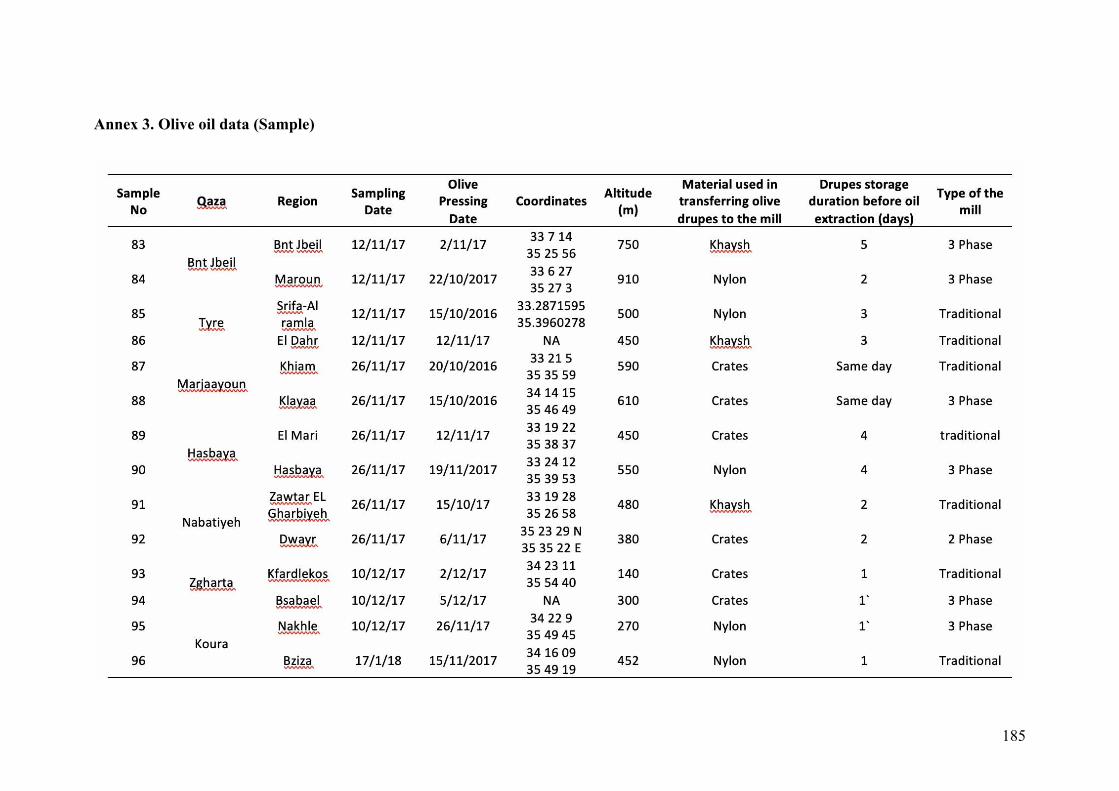
185
Annex 3. Olive oil data (Sample)
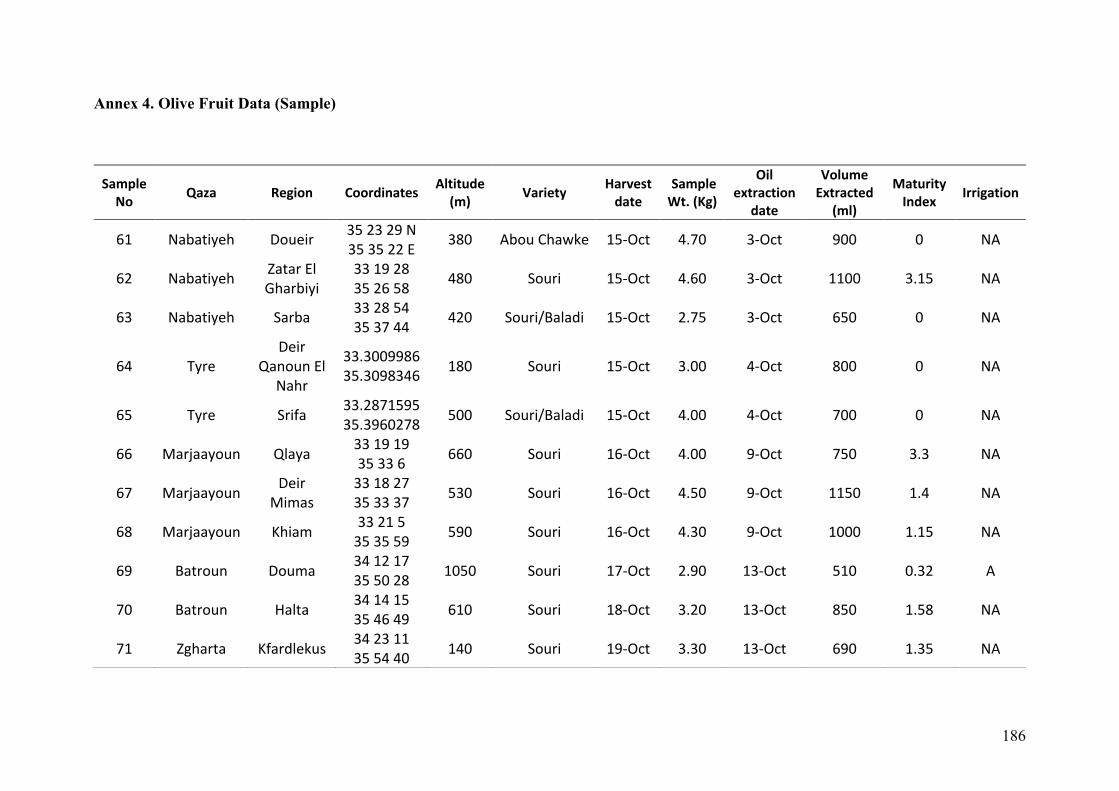
186
Annex 4. Olive Fruit Data (Sample)
Sample
No Qaza Region Coordinates
Altitude
(m) Variety
Harvest
date
Sample
Wt. (Kg)
Oil
extraction
date
Volume
Extracted
(ml)
Maturity
Index Irrigation
61 Nabatiyeh Doueir 35 23 29 N
35 35 22 E 380 Abou Chawke 15-Oct 4.70 3-Oct 900 0 NA
62 Nabatiyeh Zatar El
Gharbiyi
33 19 28
35 26 58 480 Souri 15-Oct 4.60 3-Oct 1100 3.15 NA
63 Nabatiyeh Sarba 33 28 54
35 37 44 420 Souri/Baladi 15-Oct 2.75 3-Oct 650 0 NA
64 Tyre
Deir
Qanoun El
Nahr
33.3009986
35.3098346 180 Souri 15-Oct 3.00 4-Oct 800 0 NA
65 Tyre Srifa 33.2871595
35.3960278 500 Souri/Baladi 15-Oct 4.00 4-Oct 700 0 NA
66 Marjaayoun Qlaya 33 19 19
35 33 6 660 Souri 16-Oct 4.00 9-Oct 750 3.3 NA
67 Marjaayoun Deir
Mimas
33 18 27
35 33 37 530 Souri 16-Oct 4.50 9-Oct 1150 1.4 NA
68 Marjaayoun Khiam 33 21 5
35 35 59 590 Souri 16-Oct 4.30 9-Oct 1000 1.15 NA
69 Batroun Douma 34 12 17
35 50 28 1050 Souri 17-Oct 2.90 13-Oct 510 0.32 A
70 Batroun Halta 34 14 15
35 46 49 610 Souri 18-Oct 3.20 13-Oct 850 1.58 NA
71 Zgharta Kfardlekus 34 23 11
35 54 40 140 Souri 19-Oct 3.30 13-Oct 690 1.35 NA
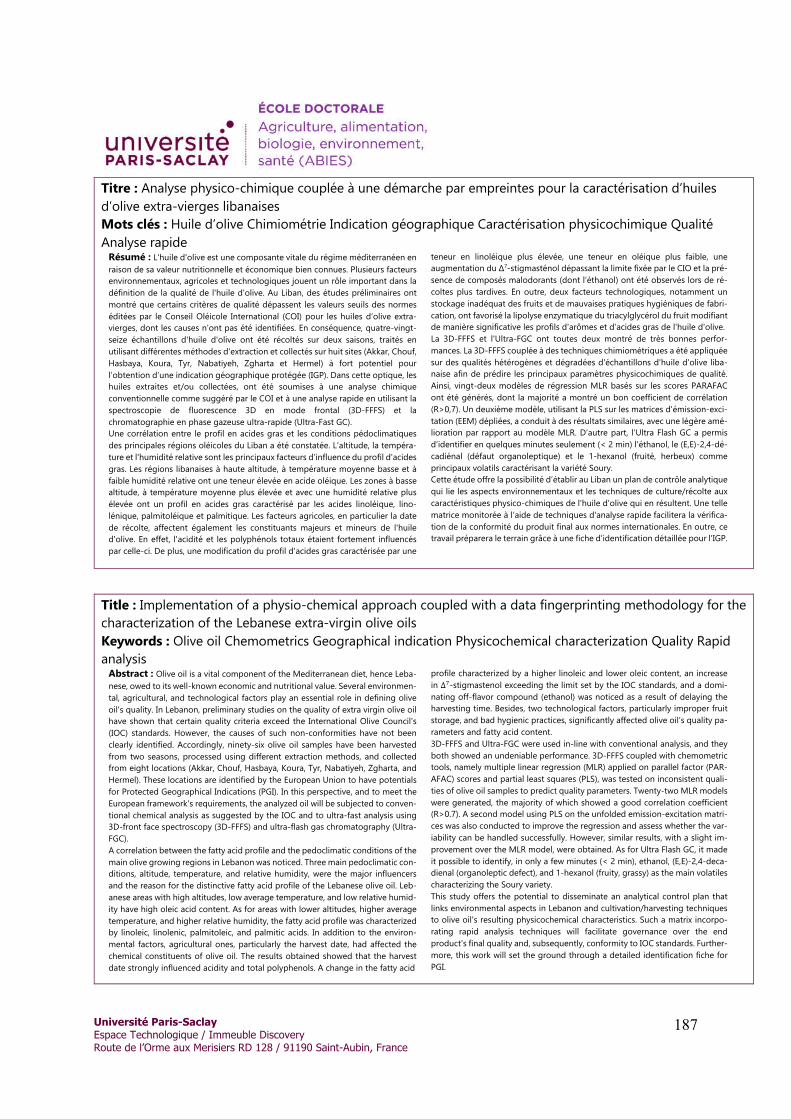
Université Paris-Saclay Espace Technologique / Immeuble Discovery
Route de l’Orme aux Merisiers RD 128 / 91190 Saint-Aubin, France
187
Titre : Analyse physico-chimique couplée à une démarche par empreintes pour la caractérisation d’huiles
d’olive extra-vierges libanaises
Mots clés : Huile d’olive Chimiométrie Indication géographique Caractérisation physicochimique Qualité
Analyse rapide
Résumé : L'huile d'olive est une composante vitale du régime méditerranéen en
raison de sa valeur nutritionnelle et économique bien connues. Plusieurs facteurs
environnementaux, agricoles et technologiques jouent un rôle important dans la
définition de la qualité de l'huile d'olive. Au Liban, des études préliminaires ont
montré que certains critères de qualité dépassent les valeurs seuils des normes
éditées par le Conseil Oléicole International (COI) pour les huiles d’olive extra-
vierges, dont les causes n'ont pas été identifiées. En conséquence, quatre-vingt-
seize échantillons d'huile d'olive ont été récoltés sur deux saisons, traités en
utilisant différentes méthodes d'extraction et collectés sur huit sites (Akkar, Chouf,
Hasbaya, Koura, Tyr, Nabatiyeh, Zgharta et Hermel) à fort potentiel pour
l’obtention d’une indication géographique protégée (IGP). Dans cette optique, les
huiles extraites et/ou collectées, ont été soumises à une analyse chimique
conventionnelle comme suggéré par le COI et à une analyse rapide en utilisant la
spectroscopie de fluorescence 3D en mode frontal (3D-FFFS) et la
chromatographie en phase gazeuse ultra-rapide (Ultra-Fast GC).
Une corrélation entre le profil en acides gras et les conditions pédoclimatiques
des principales régions oléicoles du Liban a été constatée. L'altitude, la tempéra-
ture et l'humidité relative sont les principaux facteurs d’influence du profil d'acides
gras. Les régions libanaises à haute altitude, à température moyenne basse et à
faible humidité relative ont une teneur élevée en acide oléique. Les zones à basse
altitude, à température moyenne plus élevée et avec une humidité relative plus
élevée ont un profil en acides gras caractérisé par les acides linoléique, lino-
lénique, palmitoléique et palmitique. Les facteurs agricoles, en particulier la date
de récolte, affectent également les constituants majeurs et mineurs de l'huile
d'olive. En effet, l'acidité et les polyphénols totaux étaient fortement influencés
par celle-ci. De plus, une modification du profil d'acides gras caractérisée par une
teneur en linoléique plus élevée, une teneur en oléique plus faible, une
augmentation du Δ7-stigmasténol dépassant la limite fixée par le CIO et la pré-
sence de composés malodorants (dont l’éthanol) ont été observés lors de ré-
coltes plus tardives. En outre, deux facteurs technologiques, notamment un
stockage inadéquat des fruits et de mauvaises pratiques hygiéniques de fabri-
cation, ont favorisé la lipolyse enzymatique du triacylglycérol du fruit modifiant
de manière significative les profils d'arômes et d’acides gras de l'huile d'olive.
La 3D-FFFS et l'Ultra-FGC ont toutes deux montré de très bonnes perfor-
mances. La 3D-FFFS couplée à des techniques chimiométriques a été appliquée
sur des qualités hétérogènes et dégradées d'échantillons d'huile d'olive liba-
naise afin de prédire les principaux paramètres physicochimiques de qualité.
Ainsi, vingt-deux modèles de régression MLR basés sur les scores PARAFAC
ont été générés, dont la majorité a montré un bon coefficient de corrélation
(R>0,7). Un deuxième modèle, utilisant la PLS sur les matrices d'émission-exci-
tation (EEM) dépliées, a conduit à des résultats similaires, avec une légère amé-
lioration par rapport au modèle MLR. D’autre part, l’Ultra Flash GC a permis
d’identifier en quelques minutes seulement (< 2 min) l'éthanol, le (E,E)-2,4-dé-
cadiénal (défaut organoleptique) et le 1-hexanol (fruité, herbeux) comme
principaux volatils caractérisant la variété Soury.
Cette étude offre la possibilité d’établir au Liban un plan de contrôle analytique
qui lie les aspects environnementaux et les techniques de culture/récolte aux
caractéristiques physico-chimiques de l'huile d'olive qui en résultent. Une telle
matrice monitorée à l’aide de techniques d'analyse rapide facilitera la vérifica-
tion de la conformité du produit final aux normes internationales. En outre, ce
travail préparera le terrain grâce à une fiche d'identification détaillée pour l'IGP.
Title : Implementation of a physio-chemical approach coupled with a data fingerprinting methodology for the
characterization of the Lebanese extra-virgin olive oils
Keywords : Olive oil Chemometrics Geographical indication Physicochemical characterization Quality Rapid
analysis Abstract : Olive oil is a vital component of the Mediterranean diet, hence Leba-
nese, owed to its well-known economic and nutritional value. Several environmen-
tal, agricultural, and technological factors play an essential role in defining olive
oil's quality. In Lebanon, preliminary studies on the quality of extra virgin olive oil
have shown that certain quality criteria exceed the International Olive Council's
(IOC) standards. However, the causes of such non-conformities have not been
clearly identified. Accordingly, ninety-six olive oil samples have been harvested
from two seasons, processed using different extraction methods, and collected
from eight locations (Akkar, Chouf, Hasbaya, Koura, Tyr, Nabatiyeh, Zgharta, and
Hermel). These locations are identified by the European Union to have potentials
for Protected Geographical Indications (PGI). In this perspective, and to meet the
European framework's requirements, the analyzed oil will be subjected to conven-
tional chemical analysis as suggested by the IOC and to ultra-fast analysis using
3D-front face spectroscopy (3D-FFFS) and ultra-flash gas chromatography (Ultra-
FGC).
A correlation between the fatty acid profile and the pedoclimatic conditions of the
main olive growing regions in Lebanon was noticed. Three main pedoclimatic con-
ditions, altitude, temperature, and relative humidity, were the major influencers
and the reason for the distinctive fatty acid profile of the Lebanese olive oil. Leb-
anese areas with high altitudes, low average temperature, and low relative humid-
ity have high oleic acid content. As for areas with lower altitudes, higher average
temperature, and higher relative humidity, the fatty acid profile was characterized
by linoleic, linolenic, palmitoleic, and palmitic acids. In addition to the environ-
mental factors, agricultural ones, particularly the harvest date, had affected the
chemical constituents of olive oil. The results obtained showed that the harvest
date strongly influenced acidity and total polyphenols. A change in the fatty acid
profile characterized by a higher linoleic and lower oleic content, an increase
in ∆!-stigmastenol exceeding the limit set by the IOC standards, and a domi-
nating off-flavor compound (ethanol) was noticed as a result of delaying the
harvesting time. Besides, two technological factors, particularly improper fruit
storage, and bad hygienic practices, significantly affected olive oil’s quality pa-
rameters and fatty acid content.
3D-FFFS and Ultra-FGC were used in-line with conventional analysis, and they
both showed an undeniable performance. 3D-FFFS coupled with chemometric
tools, namely multiple linear regression (MLR) applied on parallel factor (PAR-
AFAC) scores and partial least squares (PLS), was tested on inconsistent quali-
ties of olive oil samples to predict quality parameters. Twenty-two MLR models
were generated, the majority of which showed a good correlation coefficient
(R>0.7). A second model using PLS on the unfolded emission-excitation matri-
ces was also conducted to improve the regression and assess whether the var-
iability can be handled successfully. However, similar results, with a slight im-
provement over the MLR model, were obtained. As for Ultra Flash GC, it made
it possible to identify, in only a few minutes (< 2 min), ethanol, (E,E)-2,4-deca-
dienal (organoleptic defect), and 1-hexanol (fruity, grassy) as the main volatiles
characterizing the Soury variety.
This study offers the potential to disseminate an analytical control plan that
links environmental aspects in Lebanon and cultivation/harvesting techniques
to olive oil's resulting physicochemical characteristics. Such a matrix incorpo-
rating rapid analysis techniques will facilitate governance over the end
product's final quality and, subsequently, conformity to IOC standards. Further-
more, this work will set the ground through a detailed identification fiche for
PGI.


