Embed Size (px)
Citation preview
STEM Project
11 Atmosphere
12 Meteorology
13 The Nature of Storms
14 Climate
15 Earth’s Oceans
16 The Marine Environment
CHAPTERS
The Atmosphere and the OceansUN
IT 4
278
0278_0279_ESGEU_S_U4_UO_658713.indd 2780278_0279_ESGEU_S_U4_UO_658713.indd 278 2/18/11 11:18 AM2/18/11 11:18 AM
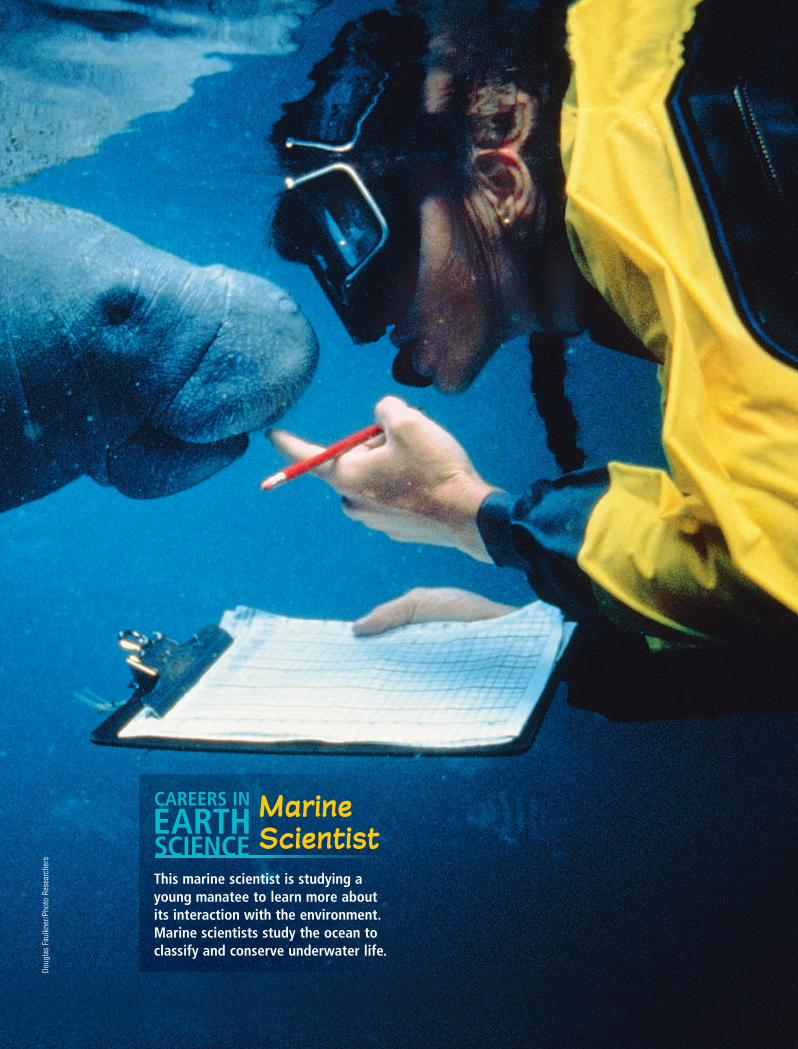
This marine scientist is studying a young manatee to learn more about its interaction with the environment. Marine scientists study the ocean to classify and conserve underwater life.
Marine Scientist
CAREERS IN
SCIENCEEARTHSCIENCE
Doug
las
Faul
kner
/Pho
to R
esea
rche
rs
0278_0279_ESGEU_S_U4_UO_658713.indd 2790278_0279_ESGEU_S_U4_UO_658713.indd 279 2/18/11 11:19 AM2/18/11 11:19 AM
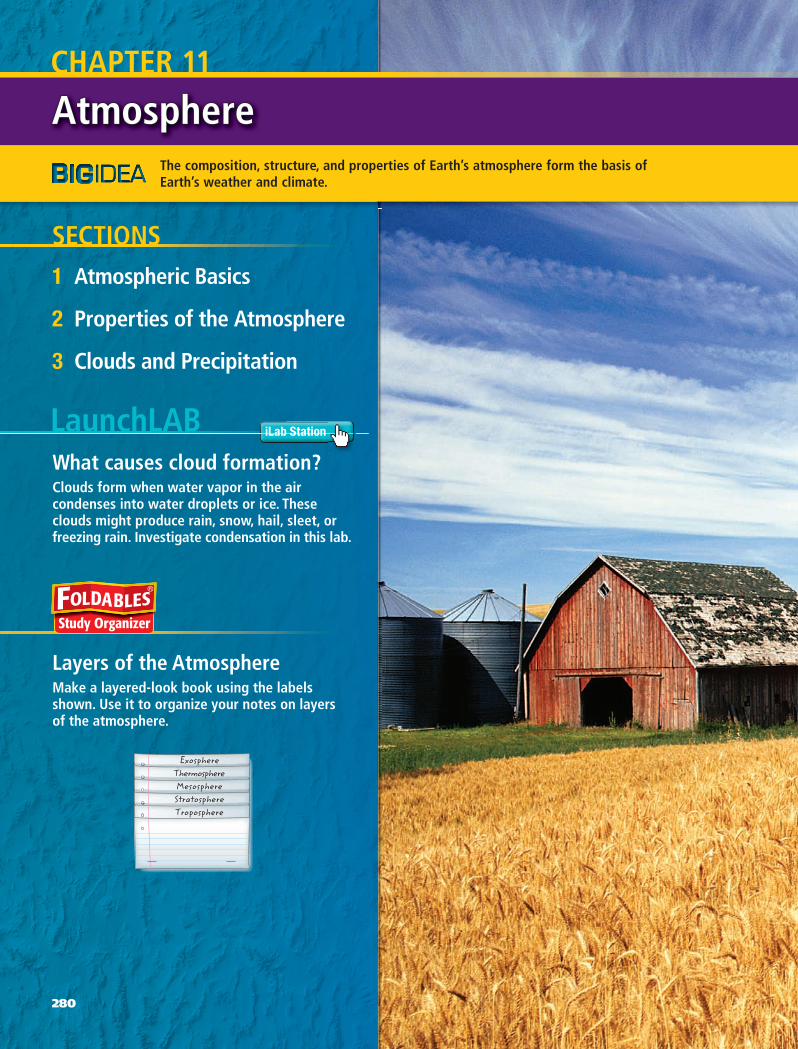
Atmosphere Atmosphere CHAPTER 11
LaunchLAB iLab Station
What causes cloud formation?Clouds form when water vapor in the air condenses into water droplets or ice. These clouds might produce rain, snow, hail, sleet, or freezing rain. Investigate condensation in this lab.
1 Atmospheric Basics
2 Properties of the Atmosphere
3 Clouds and Precipitation
SECTIONS
The composition, structure, and properties of Earth’s atmosphere form the basis of Earth’s weather and climate.
Layers of the Atmosphere Make a layered-look book using the labels shown. Use it to organize your notes on layers of the atmosphere.
ExosphereThermosphereMesosphereStratosphereTroposphere
280
0280_0281_ESGEU_S_C11_CO_658713.indd 2800280_0281_ESGEU_S_C11_CO_658713.indd 280 2/12/11 11:27 AM2/12/11 11:27 AM
(t)B
reck
P. K
ent/A
nim
als
Anim
als
, (b
)Russell
Kig
htley,
(bkg
d)C
raig
Tuttle
/CO
RB
IS
Go online!connectED.mcgraw-hill.comonnect
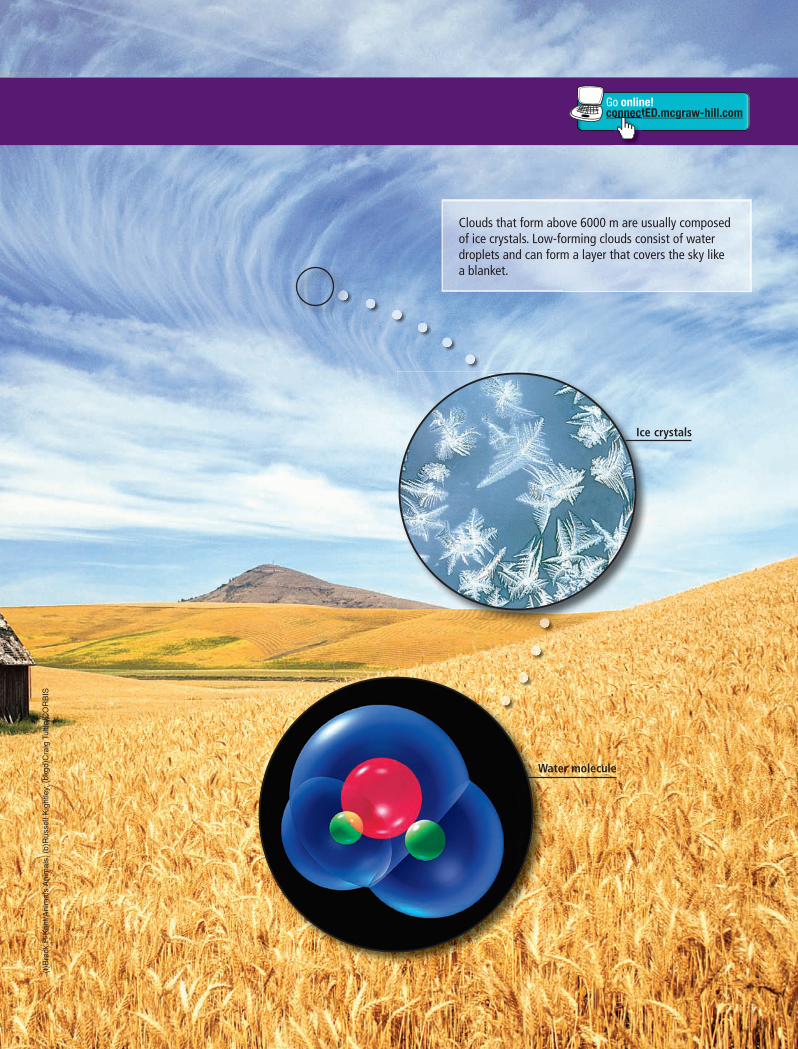
Ice crystals
Water molecule
Clouds that form above 6000 m are usually composed of ice crystals. Low-forming clouds consist of water droplets and can form a layer that covers the sky like a blanket.
0280_0281_ESGEU_S_C11_CO_658713.indd 2810280_0281_ESGEU_S_C11_CO_658713.indd 281 2/12/11 11:27 AM2/12/11 11:27 AM
SECTION 1
Watervapor0.0 – 4.0%
Tracegases0.01%
Nitrogen78%
Oxygen21%
Argon0.93%Carbon
dioxide0.038%
Composition of Earth’s Atmosphere
282 Chapter 11 • Atmosphere
MAINIDEA Energy is transferred throughout Earth’s atmosphere.
SCIENCE
4 YOU
EARTH If you touch something made of metal, it will probably feel cool. Metals feel cool because they conduct thermal energy away from your hand. In a similar way, energy is transferred directly from the Earth’s surface to the air in the lowest layer of the atmosphere.
Atmospheric CompositionThe ancient Greeks thought that air was one of the four fundamen-tal elements from which all other substances were made. In fact, air is a combination of gases, such as nitrogen and oxygen, and parti-cles, such as dust, water droplets, and ice crystals. These gases and particles form Earth’s atmosphere, which surrounds Earth and extends from Earth’s surface to outer space.
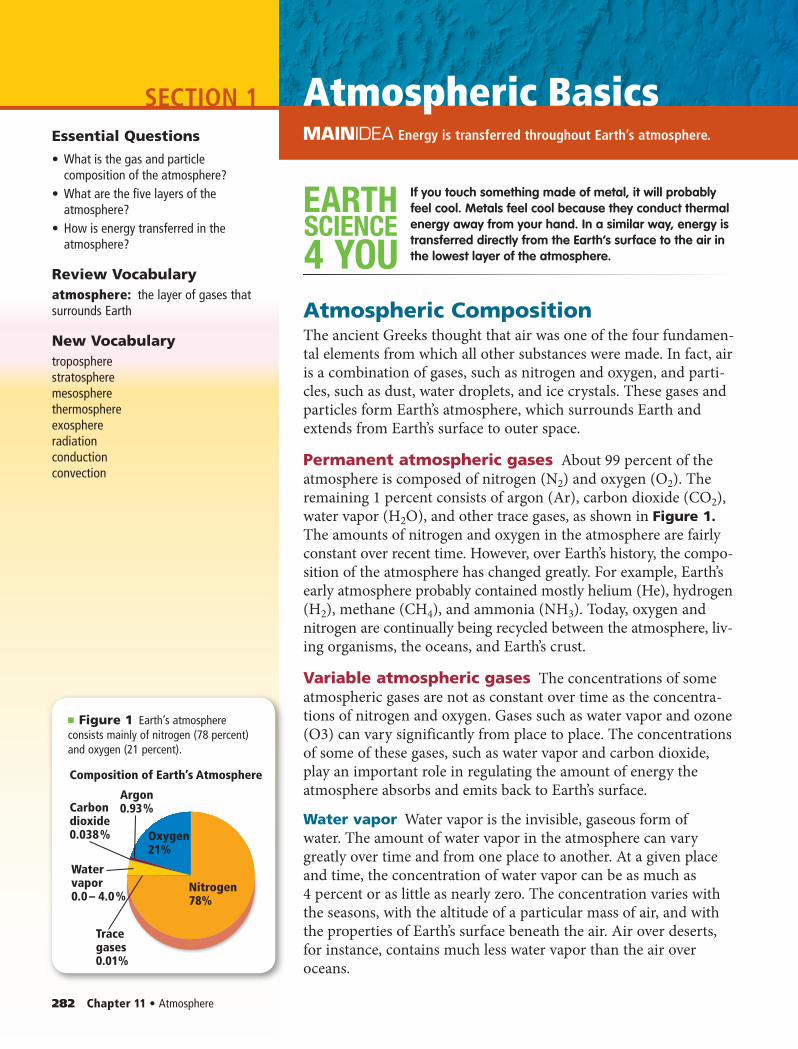
Permanent atmospheric gases About 99 percent of the atmosphere is composed of nitrogen (N2) and oxygen (O2). The remaining 1 percent consists of argon (Ar), carbon dioxide (CO2), water vapor (H2O), and other trace gases, as shown in Figure 1.The amounts of nitrogen and oxygen in the atmosphere are fairly constant over recent time. However, over Earth’s history, the compo-sition of the atmosphere has changed greatly. For example, Earth’s early atmosphere probably contained mostly helium (He), hydrogen (H2), methane (CH4), and ammonia (NH3). Today, oxygen and nitrogen are continually being recycled between the atmosphere, liv-ing organisms, the oceans, and Earth’s crust.
Variable atmospheric gases The concentrations of some atmospheric gases are not as constant over time as the concentra-tions of nitrogen and oxygen. Gases such as water vapor and ozone (O3) can vary significantly from place to place. The concentrations of some of these gases, such as water vapor and carbon dioxide, play an important role in regulating the amount of energy the atmosphere absorbs and emits back to Earth’s surface.
Water vapor Water vapor is the invisible, gaseous form of water. The amount of water vapor in the atmosphere can vary greatly over time and from one place to another. At a given place and time, the concentration of water vapor can be as much as 4 percent or as little as nearly zero. The concentration varies with the seasons, with the altitude of a particular mass of air, and with the properties of Earth’s surface beneath the air. Air over deserts, for instance, contains much less water vapor than the air over oceans.
MAINIDEA Energy is transferred throughout Earth’s atmosphere.
Atmospheric BasicsEssential Questions
• What is the gas and particle composition of the atmosphere?
• What are the five layers of the atmosphere?
• How is energy transferred in the atmosphere?
Review Vocabularyatmosphere: the layer of gases that surrounds Earth
New Vocabularytropospherestratospheremesospherethermosphereexosphereradiationconductionconvection
■ Figure 1 Earth’s atmosphere consists mainly of nitrogen (78 percent) and oxygen (21 percent).
0282_0288_ESGEU_S_C11_S1_658713.indd 2820282_0288_ESGEU_S_C11_S1_658713.indd 282 2/12/11 11:26 AM2/12/11 11:26 AM
Hei
ght
abov
e Ea
rth’
s su
rfac
e (k
m)
Ozone concentration (1012 molecules/cm3)
Change in Ozone with Height
0
10
20
30
40
50
60 The intensity of solar UV radiationdecreases as UV rays pass throughthe ozone layer.
0 2
Ozo
ne
laye
r
4 6 8 10
Oxygenatom
OzoneOxygen
molecule
Section 1 • Atmospheric Basics 283
Carbon dioxide Carbon dioxide, another variable gas, currently makes up about 0.038 percent of the atmosphere. During the past 150 years, measurements have shown that the concentration of atmospheric carbon dioxide has increased from about 0.028 per-cent to its present value. Carbon dioxide is also cycled between the atmosphere, the oceans, living organisms, and Earth’s rocks.
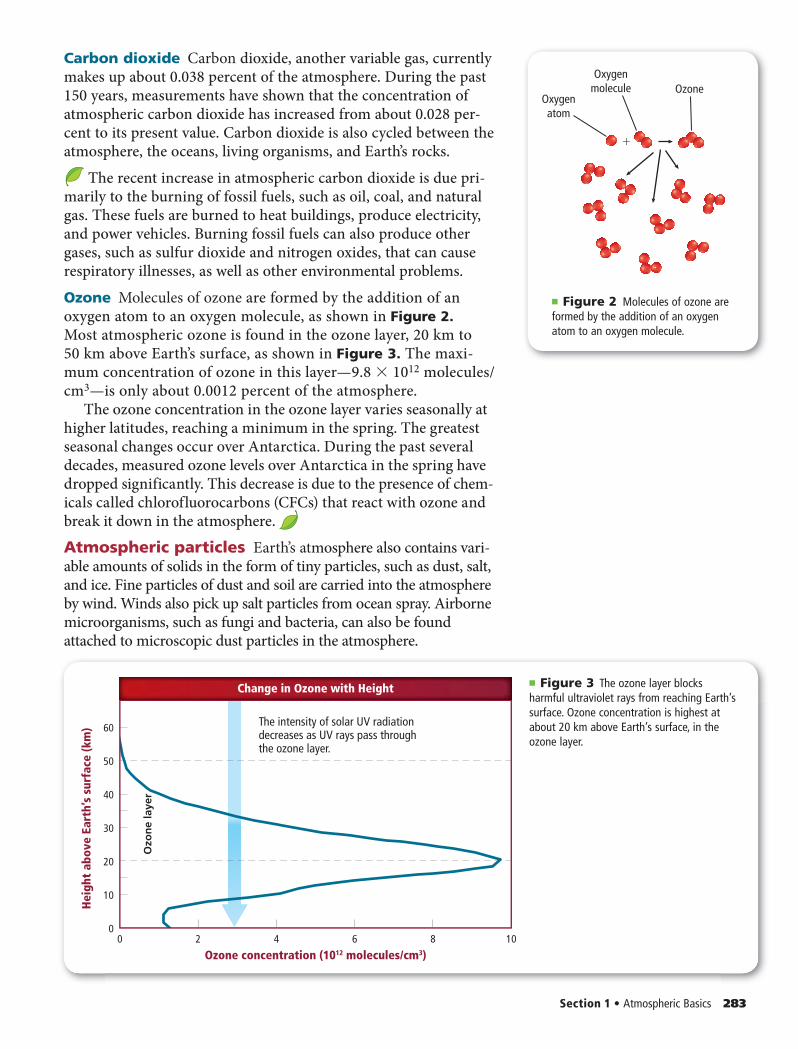
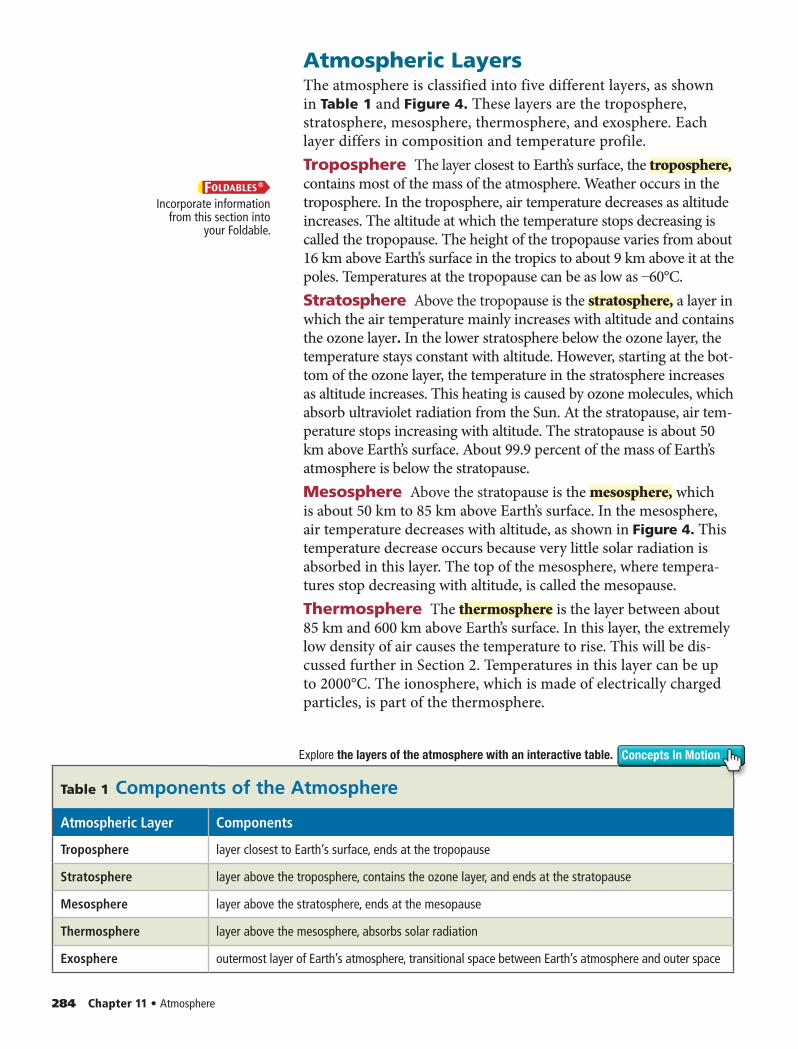
The recent increase in atmospheric carbon dioxide is due pri-marily to the burning of fossil fuels, such as oil, coal, and natural gas. These fuels are burned to heat buildings, produce electricity, and power vehicles. Burning fossil fuels can also produce other gases, such as sulfur dioxide and nitrogen oxides, that can cause respiratory illnesses, as well as other environmental problems. Ozone Molecules of ozone are formed by the addition of an oxygen atom to an oxygen molecule, as shown in Figure 2. Most atmospheric ozone is found in the ozone layer, 20 km to 50 km above Earth’s surface, as shown in Figure 3. The maxi-mum concentration of ozone in this layer—9.8 × 10¹² molecules/cm3—is only about 0.0012 percent of the atmosphere.
The ozone concentration in the ozone layer varies seasonally at higher latitudes, reaching a minimum in the spring. The greatest seasonal changes occur over Antarctica. During the past several decades, measured ozone levels over Antarctica in the spring have dropped significantly. This decrease is due to the presence of chem-icals called chlorofluorocarbons (CFCs) that react with ozone and break it down in the atmosphere. Atmospheric particles Earth’s atmosphere also contains vari-able amounts of solids in the form of tiny particles, such as dust, salt, and ice. Fine particles of dust and soil are carried into the atmosphere by wind. Winds also pick up salt particles from ocean spray. Airborne microorganisms, such as fungi and bacteria, can also be found attached to microscopic dust particles in the atmosphere.
■ Figure 3 The ozone layer blocks harmful ultraviolet rays from reaching Earth’s surface. Ozone concentration is highest at about 20 km above Earth’s surface, in the ozone layer.
■ Figure 2 Molecules of ozone are formed by the addition of an oxygen atom to an oxygen molecule.
0282_0288_ESGEU_S_C11_S1_658713.indd 2830282_0288_ESGEU_S_C11_S1_658713.indd 283 2/12/11 11:26 AM2/12/11 11:26 AM
284 Chapter 11 • Atmosphere
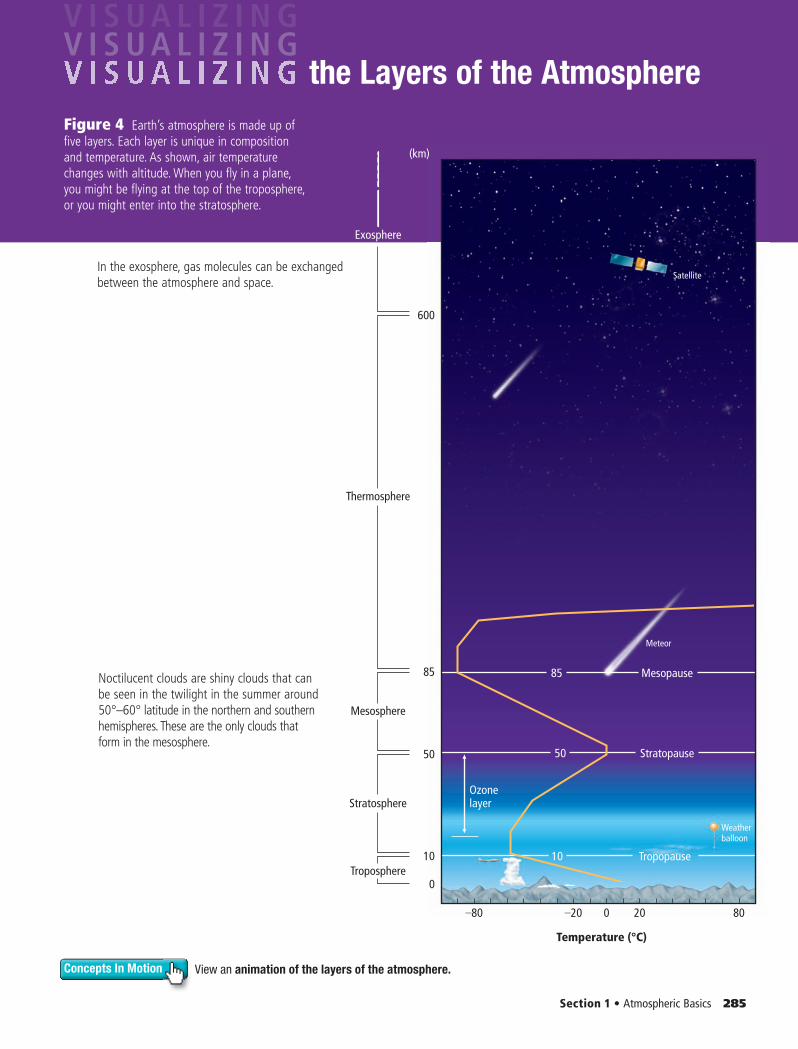
Atmospheric LayersThe atmosphere is classified into five different layers, as shown in Table 1 and Figure 4. These layers are the troposphere, stratosphere, mesosphere, thermosphere, and exosphere. Each layer differs in composition and temperature profile.Troposphere The layer closest to Earth’s surface, the troposphere,contains most of the mass of the atmosphere. Weather occurs in the troposphere. In the troposphere, air temperature decreases as altitude increases. The altitude at which the temperature stops decreasing is called the tropopause. The height of the tropopause varies from about 16 km above Earth’s surface in the tropics to about 9 km above it at the poles. Temperatures at the tropopause can be as low as –60°C.Stratosphere Above the tropopause is the stratosphere, a layer in which the air temperature mainly increases with altitude and contains the ozone layer. In the lower stratosphere below the ozone layer, the temperature stays constant with altitude. However, starting at the bot-tom of the ozone layer, the temperature in the stratosphere increases as altitude increases. This heating is caused by ozone molecules, which absorb ultraviolet radiation from the Sun. At the stratopause, air tem-perature stops increasing with altitude. The stratopause is about 50 km above Earth’s surface. About 99.9 percent of the mass of Earth’s atmosphere is below the stratopause.Mesosphere Above the stratopause is the mesosphere, which is about 50 km to 85 km above Earth’s surface. In the mesosphere, air temperature decreases with altitude, as shown in Figure 4. This temperature decrease occurs because very little solar radiation is absorbed in this layer. The top of the mesosphere, where tempera-tures stop decreasing with altitude, is called the mesopause.Thermosphere The thermosphere is the layer between about 85 km and 600 km above Earth’s surface. In this layer, the extremely low density of air causes the temperature to rise. This will be dis-cussed further in Section 2. Temperatures in this layer can be up to 2000°C. The ionosphere, which is made of electrically charged particles, is part of the thermosphere.
FOLDABLESIncorporate information
from this section into your Foldable.
Table 1 Components of the Atmosphere
Atmospheric Layer Components
Troposphere layer closest to Earth’s surface, ends at the tropopause
Stratosphere layer above the troposphere, contains the ozone layer, and ends at the stratopause
Mesosphere layer above the stratosphere, ends at the mesopause
Thermosphere layer above the mesosphere, absorbs solar radiation
Exosphere outermost layer of Earth’s atmosphere, transitional space between Earth’s atmosphere and outer space
Explore the layers of the atmosphere with an interactive table. Concepts In Motion
0282_0288_ESGEU_S_C11_S1_658713.indd 2840282_0288_ESGEU_S_C11_S1_658713.indd 284 2/12/11 11:27 AM2/12/11 11:27 AM
Exosphere
Satellite
Meteor
Thermosphere
Mesosphere
Stratosphere
Troposphere
(km)
600
50
85
10
0
Weatherballoon
Temperature (°C)
–80 –20 0 20 80
Tropopause10
Mesopause85
Stratopause50
Ozonelayer
Section 1 • Atmospheric Basics 285
Concepts In Motion
In the exosphere, gas molecules can be exchanged between the atmosphere and space.
Noctilucent clouds are shiny clouds that can be seen in the twilight in the summer around 50°–60° latitude in the northern and southern hemispheres. These are the only clouds that form in the mesosphere.
Figure 4 Earth’s atmosphere is made up of five layers. Each layer is unique in composition and temperature. As shown, air temperature changes with altitude. When you fly in a plane, you might be flying at the top of the troposphere, or you might enter into the stratosphere .
the Layers of the Atmosphere
View an animation of the layers of the atmosphere.
0282_0288_ESGEU_S_C11_S1_658713.indd 2850282_0288_ESGEU_S_C11_S1_658713.indd 285 2/12/11 11:27 AM2/12/11 11:27 AM
TroposphereStratosphere
Mesosphere
Apache helicopter (4845 m)747 Airliner (13,716 m)
SpaceShipTwo (100 km)
International Space Station (400 km)
Exosphere
Thermosphere
286 Chapter 11 • Atmosphere
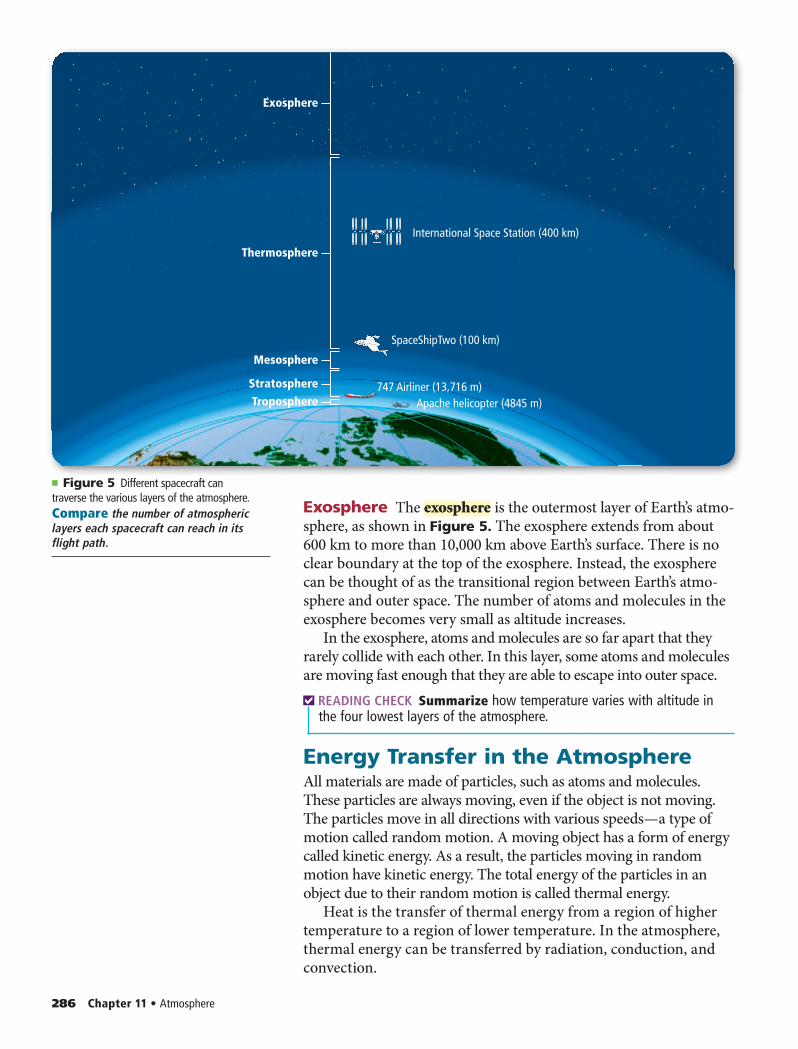
Exosphere The exosphere is the outermost layer of Earth’s atmo-sphere, as shown in Figure 5. The exosphere extends from about 600 km to more than 10,000 km above Earth’s surface. There is no clear boundary at the top of the exosphere. Instead, the exosphere can be thought of as the transitional region between Earth’s atmo-sphere and outer space. The number of atoms and molecules in the exosphere becomes very small as altitude increases.
In the exosphere, atoms and molecules are so far apart that they rarely collide with each other. In this layer, some atoms and molecules are moving fast enough that they are able to escape into outer space.
READING CHECK Summarize how temperature varies with altitude in the four lowest layers of the atmosphere.
Energy Transfer in the AtmosphereAll materials are made of particles, such as atoms and molecules. These particles are always moving, even if the object is not moving. The particles move in all directions with various speeds — a type of motion called random motion. A moving object has a form of energy called kinetic energy. As a result, the particles moving in random motion have kinetic energy. The total energy of the particles in an object due to their random motion is called thermal energy.
Heat is the transfer of thermal energy from a region of higher temperature to a region of lower temperature. In the atmosphere, thermal energy can be transferred by radiation, conduction, and convection.
■ Figure 5 Different spacecraft can traverse the various layers of the atmosphere. Compare the number of atmospheric layers each spacecraft can reach in its flight path.
0282_0288_ESGEU_S_C11_S1_658713.indd 2860282_0288_ESGEU_S_C11_S1_658713.indd 286 2/12/11 11:27 AM2/12/11 11:27 AM
Mic
hael
New
man
/Pho
toEd
it
Solar radiation is absorbed by cloudsand atmosphere.
Solar radiation isreflected by cloudsand atmosphereinto space.
Solar radiation is absorbed by Earth’s surface.
Some radiation is reflected by Earth’s surfaceinto space.
Infrared radiation is emittedfrom atmosphere into space.
Infrared radiation is emitted from Earthinto space.
Infrared radiationemitted from atmosphereis absorbed by Earth.
Atmosphere
Energy is transferedfrom Earth tothe atmosphere.
Sun
Section 1 • Atmospheric Basics 287
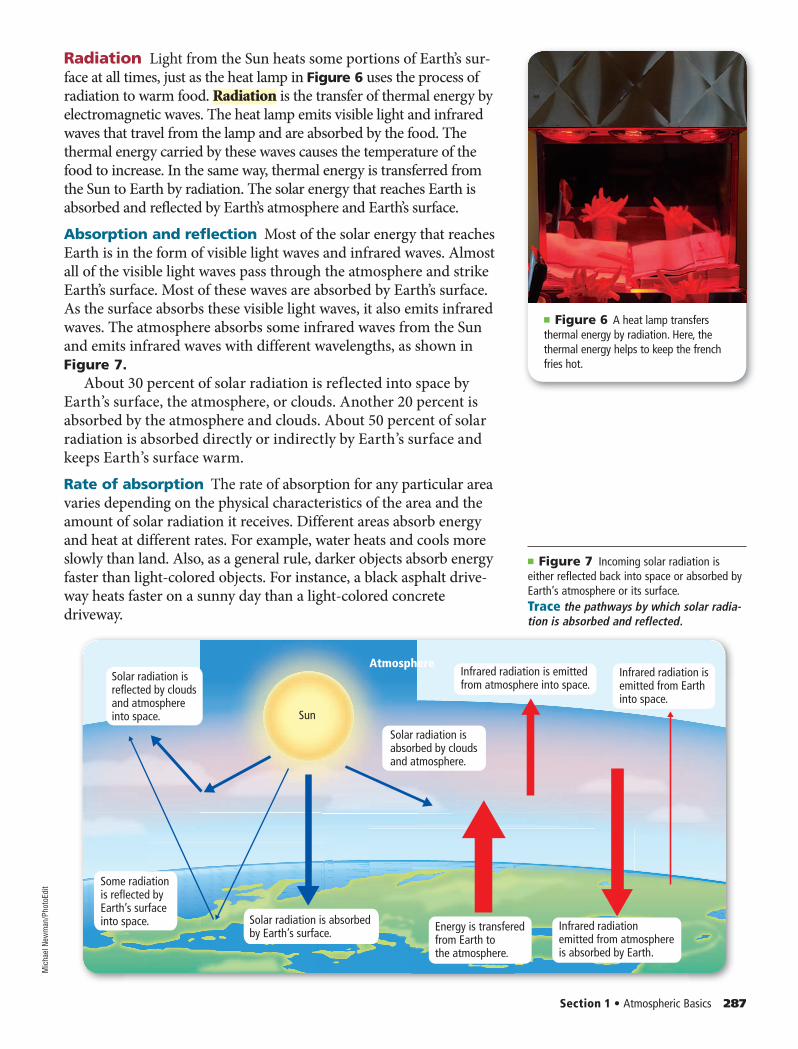
Radiation Light from the Sun heats some portions of Earth’s sur-face at all times, just as the heat lamp in Figure 6 uses the process of radiation to warm food. Radiation is the transfer of thermal energy by electromagnetic waves. The heat lamp emits visible light and infrared waves that travel from the lamp and are absorbed by the food. The thermal energy carried by these waves causes the temperature of the food to increase. In the same way, thermal energy is transferred from the Sun to Earth by radiation. The solar energy that reaches Earth is absorbed and reflected by Earth’s atmosphere and Earth’s surface.Absorption and reflection Most of the solar energy that reaches Earth is in the form of visible light waves and infrared waves. Almost all of the visible light waves pass through the atmosphere and strike Earth’s surface. Most of these waves are absorbed by Earth’s surface. As the surface absorbs these visible light waves, it also emits infrared waves. The atmosphere absorbs some infrared waves from the Sun and emits infrared waves with different wavelengths, as shown in Figure 7.
About 30 percent of solar radiation is reflected into space by Earth’s surface, the atmosphere, or clouds. Another 20 percent is absorbed by the atmosphere and clouds. About 50 percent of solar radiation is absorbed directly or indirectly by Earth’s surface and keeps Earth’s surface warm.Rate of absorption The rate of absorption for any particular area varies depending on the physical characteristics of the area and the amount of solar radiation it receives. Different areas absorb energy and heat at different rates. For example, water heats and cools more slowly than land. Also, as a general rule, darker objects absorb energy faster than light-colored objects. For instance, a black asphalt drive-way heats faster on a sunny day than a light-colored concrete driveway.
■ Figure 6 A heat lamp transfers thermal energy by radiation. Here, the thermal energy helps to keep the french fries hot.
■ Figure 7 Incoming solar radiation is either reflected back into space or absorbed by Earth’s atmosphere or its surface.Trace the pathways by which solar radia-tion is absorbed and reflected.
0282_0288_ESGEU_S_C11_S1_658713.indd 2870282_0288_ESGEU_S_C11_S1_658713.indd 287 2/12/11 11:27 AM2/12/11 11:27 AM
Section Self-CheckSECTION 1 REVIEW
Convection
Radiation
Conduction
288 Chapter 11 • Atmosphere
Section Summary• Earth’s atmosphere is composed of
several gases, primarily nitrogen and oxygen, and also contains small particles.
• Earth’s atmosphere consists of five layers that differ in their composi-tions and temperatures.
• Solar energy reaches Earth’s surface in the form of visible light and infra-red waves.
• Solar energy absorbed by Earth’s sur-face is transferred as thermal energy throughout the atmosphere.
Understand Main Ideas1. Rank the gases in the atmosphere in order from most abundant to
least abundant.
2. Name the four types of particles found in the atmosphere.
3. Compare and contrast the five layers that make up the atmosphere.
4. Explain why temperature increases with height in the stratosphere.
5. Compare how solar energy is absorbed and emitted by Earth’s surface.
Think Critically6. Predict whether a pot of water heated from the top would boil more quickly than
a pot of water heated from the bottom. Explain your answer.
7. Conclude What might surface temperatures be like on a planet with no atmosphere?
Earth ScienceIN8. In the troposphere, temperature decreases with height at an average rate of
6.5°C/km. If temperature at 2.5 km altitude is 7.0°C, what is the temperature at 5.5 km altitude?
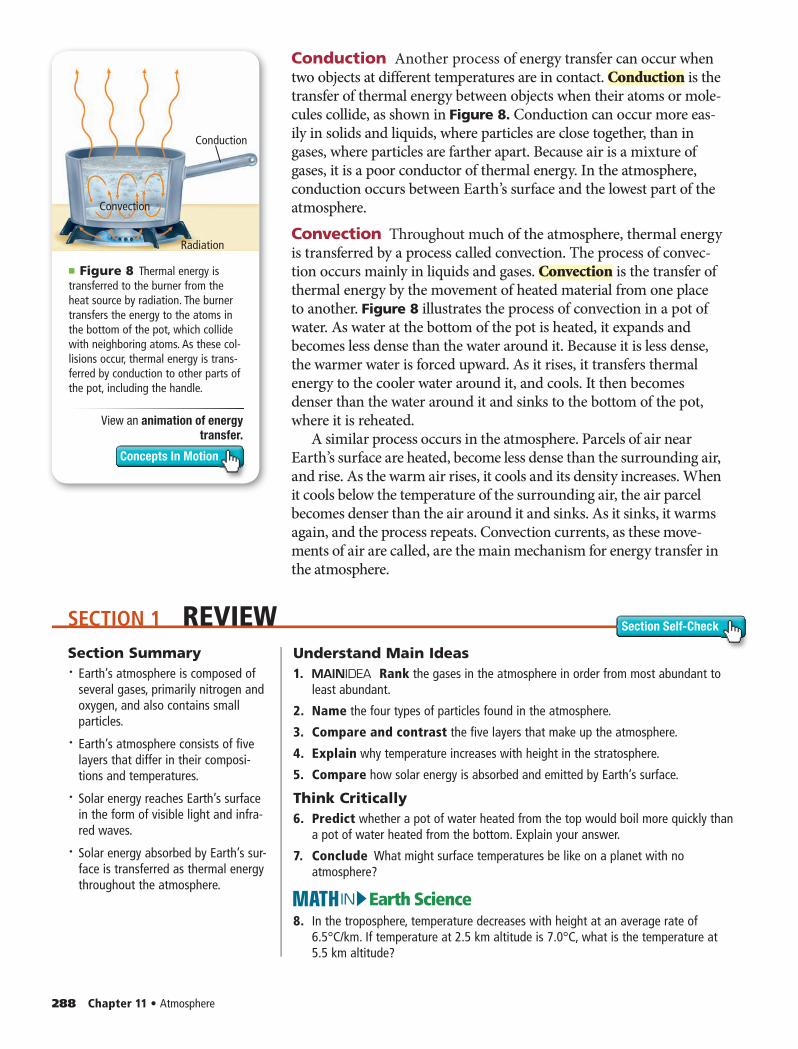
Conduction Another process of energy transfer can occur when two objects at different temperatures are in contact. Conduction is the transfer of thermal energy between objects when their atoms or mole-cules collide, as shown in Figure 8. Conduction can occur more eas-ily in solids and liquids, where particles are close together, than in gases, where particles are farther apart. Because air is a mixture of gases, it is a poor conductor of thermal energy. In the atmosphere, conduction occurs between Earth’s surface and the lowest part of the atmosphere. Convection Throughout much of the atmosphere, thermal energy is transferred by a process called convection. The process of convec-tion occurs mainly in liquids and gases. Convection is the transfer of thermal energy by the movement of heated material from one place to another. Figure 8 illustrates the process of convection in a pot of water. As water at the bottom of the pot is heated, it expands and becomes less dense than the water around it. Because it is less dense, the warmer water is forced upward. As it rises, it transfers thermal energy to the cooler water around it, and cools. It then becomes denser than the water around it and sinks to the bottom of the pot, where it is reheated.
A similar process occurs in the atmosphere. Parcels of air near Earth’s surface are heated, become less dense than the surrounding air, and rise. As the warm air rises, it cools and its density increases. When it cools below the temperature of the surrounding air, the air parcel becomes denser than the air around it and sinks. As it sinks, it warms again, and the process repeats. Convection currents, as these move-ments of air are called, are the main mechanism for energy transfer in the atmosphere.
■ Figure 8 Thermal energy is transferred to the burner from the heat source by radiation. The burner transfers the energy to the atoms in the bottom of the pot, which collide with neighboring atoms. As these col-lisions occur, thermal energy is trans-ferred by conduction to other parts of the pot, including the handle.
View an animation of energy
transfer.
Concepts In Motion
0282_0288_ESGEU_S_C11_S1_658713.indd 2880282_0288_ESGEU_S_C11_S1_658713.indd 288 2/12/11 11:27 AM2/12/11 11:27 AM
Fahrenheit Celsius Kelvin
Waterboils 212 F
32 F
–459 F
100 C
0 C
–273 C 0 K
273 K
373 K
Waterfreezes
Absolutezero
MAINIDEA Energy is transferred throughout Earth’s atmosphere.Essential Questions• What are the three main properties of
the atmosphere and how do they interact?
• Why do atmospheric properties change with changes in altitude?
Review Vocabularydensity: the mass per unit volume of a material
New Vocabularytemperature inversionhumiditysaturationrelative humiditydew pointlatent heat
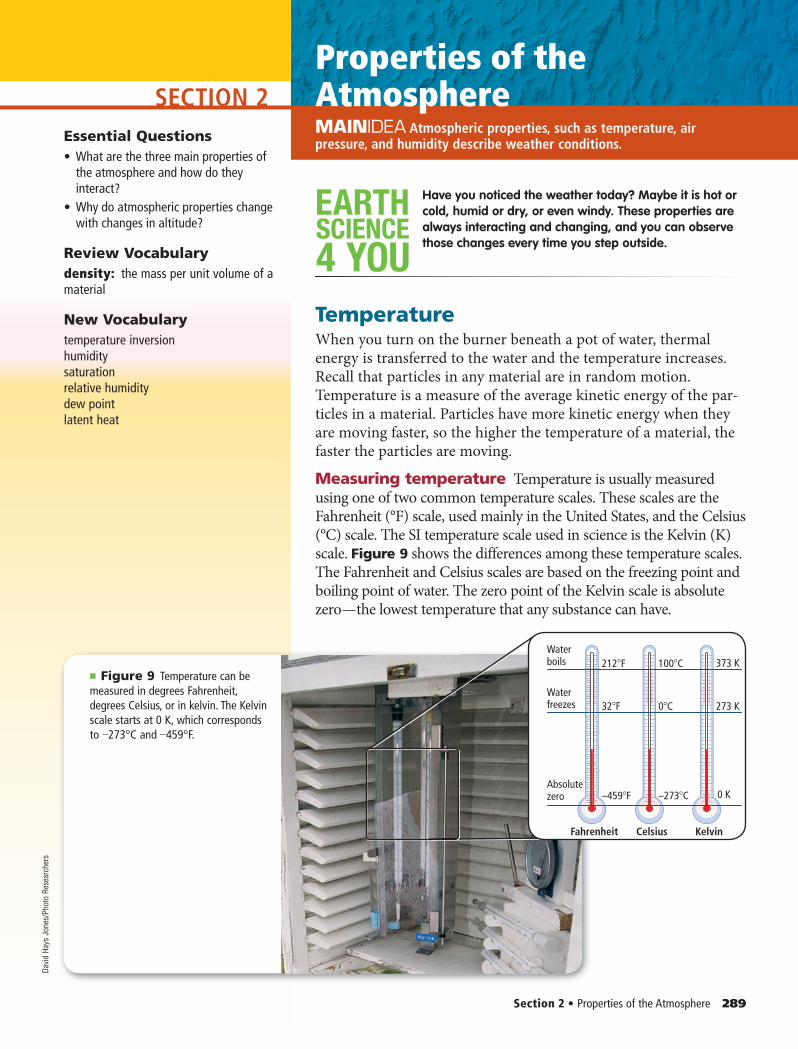
■ Figure 9 Temperature can be measured in degrees Fahrenheit, degrees Celsius, or in kelvin. The Kelvin scale starts at 0 K, which corresponds to –273°C and –459°F.
Section 2 • Properties of the Atmosphere 289
Properties of the AtmosphereMAINIDEA Atmospheric properties, such as temperature, air pressure, and humidity describe weather conditions.
SCIENCE
4 YOU
EARTH Have you noticed the weather today? Maybe it is hot or cold, humid or dry, or even windy. These properties are always interacting and changing, and you can observe those changes every time you step outside.
TemperatureWhen you turn on the burner beneath a pot of water, thermal energy is transferred to the water and the temperature increases. Recall that particles in any material are in random motion. Temperature is a measure of the average kinetic energy of the par-ticles in a material. Particles have more kinetic energy when they are moving faster, so the higher the temperature of a material, the faster the particles are moving.
Measuring temperature Temperature is usually measured using one of two common temperature scales. These scales are the Fahrenheit (°F) scale, used mainly in the United States, and the Celsius (°C) scale. The SI temperature scale used in science is the Kelvin (K) scale. Figure 9 shows the differences among these temperature scales. The Fahrenheit and Celsius scales are based on the freezing point and boiling point of water. The zero point of the Kelvin scale is absolute zero — the lowest temperature that any substance can have.
Davi
d Ha
ys J
ones
/Pho
to R
esea
rche
rs
SECTION 2
0289_0296_ESGEU_S_C11_S2_658713.indd 2890289_0296_ESGEU_S_C11_S2_658713.indd 289 2/12/11 11:26 AM2/12/11 11:26 AM
20
40
60
80
0.0010.000001
0.00001
0.0001
0.001
0.01
0.1
0.25
0.5
1.225
0.01
0.1
1.0
10
100
250500
1013
100
10
30
50
70
90
Alt
itud
e (k
m)
Pressure(mb)
Density(kg/m3)
Thermosphere
Mesosphere
Stratosphere
Troposphere0
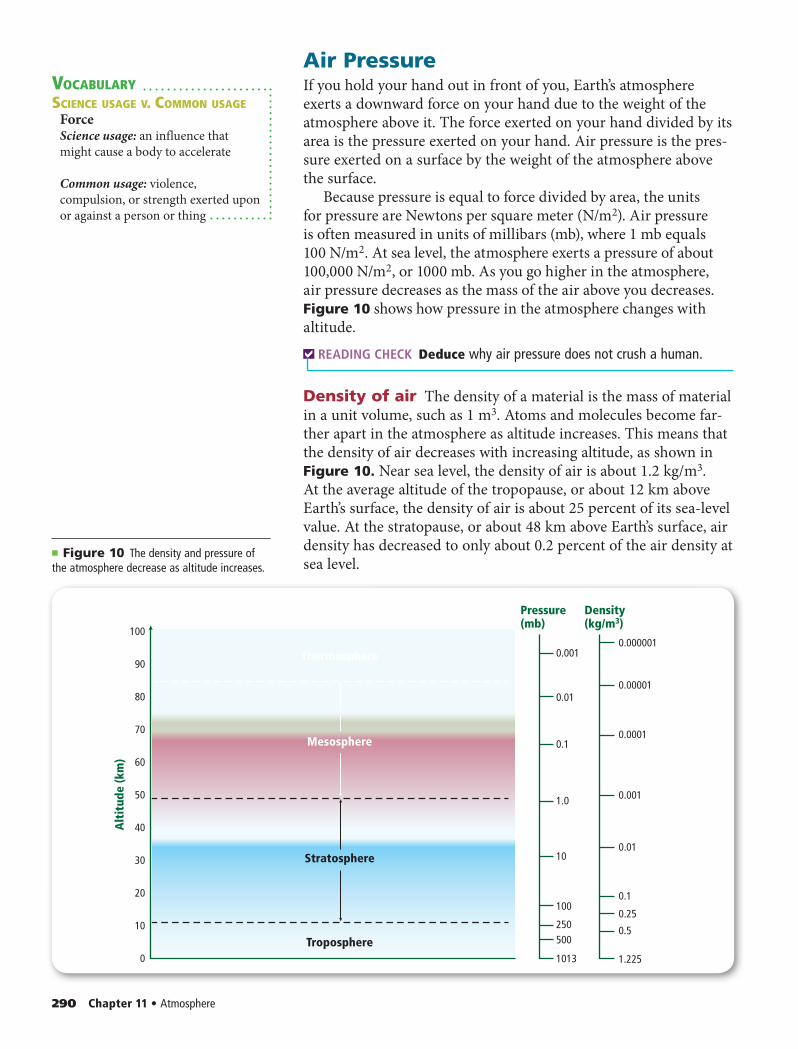
■ Figure 10 The density and pressure of the atmosphere decrease as altitude increases.
VOCABULARYSCIENCE USAGE V. COMMON USAGE
ForceScience usage: an influence that might cause a body to accelerate
Common usage: violence, compulsion, or strength exerted upon or against a person or thing
290 Chapter 11 • Atmosphere
Air PressureIf you hold your hand out in front of you, Earth’s atmosphere exerts a downward force on your hand due to the weight of the atmosphere above it. The force exerted on your hand divided by its area is the pressure exerted on your hand. Air pressure is the pres-sure exerted on a surface by the weight of the atmosphere above the surface.
Because pressure is equal to force divided by area, the units for pressure are Newtons per square meter (N/m2). Air pressure is often measured in units of millibars (mb), where 1 mb equals 100 N/m2. At sea level, the atmosphere exerts a pressure of about 100,000 N/m2, or 1000 mb. As you go higher in the atmosphere, air pressure decreases as the mass of the air above you decreases. Figure 10 shows how pressure in the atmosphere changes with altitude.
READING CHECK Deduce why air pressure does not crush a human.
Density of air The density of a material is the mass of material in a unit volume, such as 1 m3. Atoms and molecules become far-ther apart in the atmosphere as altitude increases. This means that the density of air decreases with increasing altitude, as shown in Figure 10. Near sea level, the density of air is about 1.2 kg/m3. At the average altitude of the tropopause, or about 12 km above Earth’s surface, the density of air is about 25 percent of its sea-level value. At the stratopause, or about 48 km above Earth’s surface, air density has decreased to only about 0.2 percent of the air density at sea level.
0289_0296_ESGEU_S_C11_S2_658713.indd 2900289_0296_ESGEU_S_C11_S2_658713.indd 290 2/12/11 11:26 AM2/12/11 11:26 AM
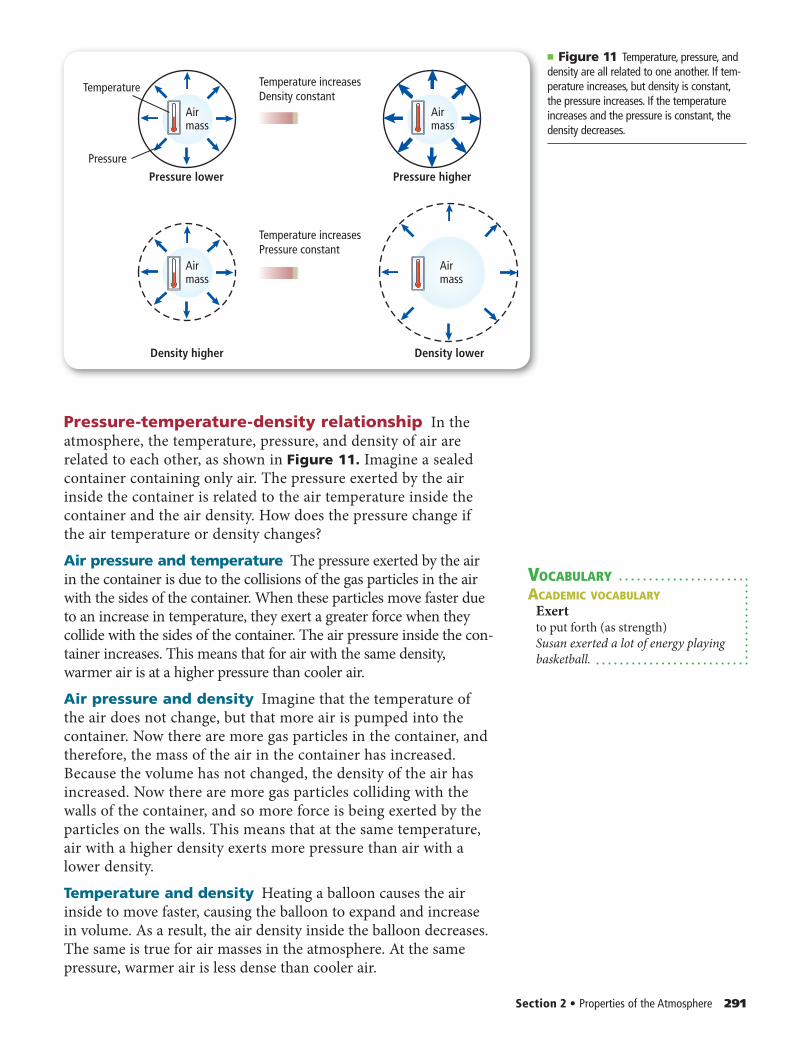
Pressure-temperature-density relationship In the atmosphere, the temperature, pressure, and density of air are related to each other, as shown in Figure 11. Imagine a sealed container containing only air. The pressure exerted by the air inside the container is related to the air temperature inside the container and the air density. How does the pressure change if the air temperature or density changes?Air pressure and temperature The pressure exerted by the air in the container is due to the collisions of the gas particles in the air with the sides of the container. When these particles move faster due to an increase in temperature, they exert a greater force when they collide with the sides of the container. The air pressure inside the con-tainer increases. This means that for air with the same density, warmer air is at a higher pressure than cooler air.Air pressure and density Imagine that the temperature of the air does not change, but that more air is pumped into the container. Now there are more gas particles in the container, and therefore, the mass of the air in the container has increased. Because the volume has not changed, the density of the air has increased. Now there are more gas particles colliding with the walls of the container, and so more force is being exerted by the particles on the walls. This means that at the same temperature, air with a higher density exerts more pressure than air with a lower density.Temperature and density Heating a balloon causes the air inside to move faster, causing the balloon to expand and increase in volume. As a result, the air density inside the balloon decreases. The same is true for air masses in the atmosphere. At the same pressure, warmer air is less dense than cooler air.
VOCABULARYACADEMIC VOCABULARY
Exert to put forth (as strength)Susan exerted a lot of energy playing basketball.
Section 2 • Properties of the Atmosphere 291
Pressure lower
Temperature
Airmass
Airmass
Airmass
Airmass
Pressure
Temperature increasesDensity constant
Temperature increasesPressure constant
Density higher Density lower
Pressure higher
■ Figure 11 Temperature, pressure, and density are all related to one another. If tem-perature increases, but density is constant, the pressure increases. If the temperature increases and the pressure is constant, the density decreases.
0289_0296_ESGEU_S_C11_S2_658713.indd 2910289_0296_ESGEU_S_C11_S2_658713.indd 291 2/12/11 11:26 AM2/12/11 11:26 AM
Temperature inthe troposphere
Temperature inversion in the troposphere
Temperature TrendsIncreasingaltitude
Groundlevel
Cold air
Warm air
Warm air
Cold air
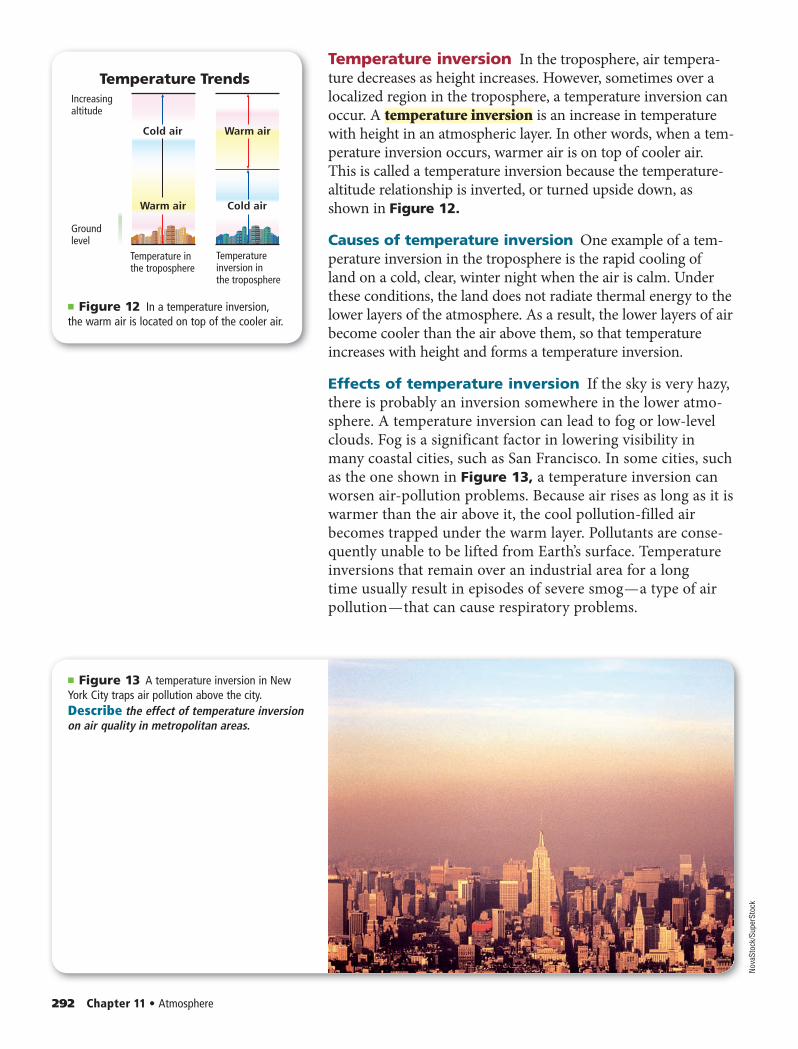
Temperature inversion In the troposphere, air tempera-ture decreases as height increases. However, sometimes over a localized region in the troposphere, a temperature inversion can occur. A temperature inversion is an increase in temperature with height in an atmospheric layer. In other words, when a tem-perature inversion occurs, warmer air is on top of cooler air. This is called a temperature inversion because the temperature-altitude relationship is inverted, or turned upside down, as shown in Figure 12.
Causes of temperature inversion One example of a tem-perature inversion in the troposphere is the rapid cooling of land on a cold, clear, winter night when the air is calm. Under these conditions, the land does not radiate thermal energy to the lower layers of the atmosphere. As a result, the lower layers of air become cooler than the air above them, so that temperature increases with height and forms a temperature inversion.
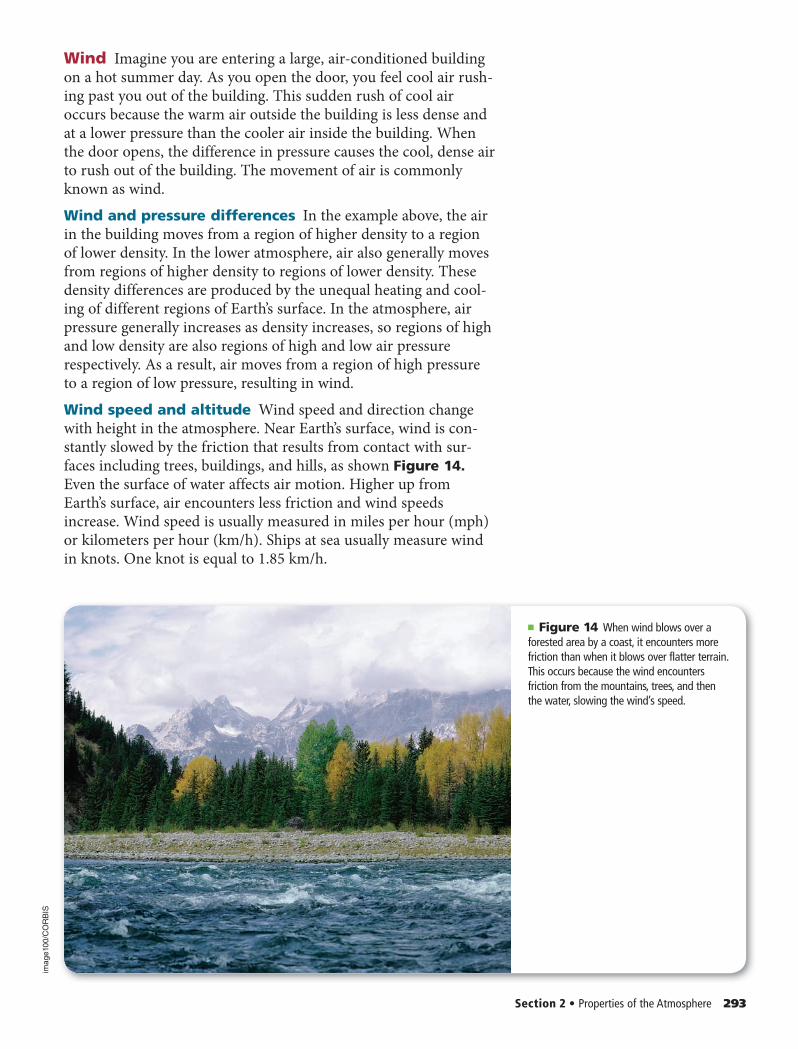
Effects of temperature inversion If the sky is very hazy, there is probably an inversion somewhere in the lower atmo-sphere. A temperature inversion can lead to fog or low-level clouds. Fog is a significant factor in lowering visibility in many coastal cities, such as San Francisco. In some cities, such as the one shown in Figure 13, a temperature inversion can worsen air-pollution problems. Because air rises as long as it is warmer than the air above it, the cool pollution-filled air becomes trapped under the warm layer. Pollutants are conse-quently unable to be lifted from Earth’s surface. Temperature inversions that remain over an industrial area for a long time usually result in episodes of severe smog — a type of air pollution — that can cause respiratory problems.
■ Figure 12 In a temperature inversion, the warm air is located on top of the cooler air.
292 Chapter 11 • Atmosphere
■ Figure 13 A temperature inversion in New York City traps air pollution above the city.Describe the effect of temperature inversion on air quality in metropolitan areas.
Nova
Stoc
k/Su
perS
tock
0289_0296_ESGEU_S_C11_S2_658713.indd 2920289_0296_ESGEU_S_C11_S2_658713.indd 292 2/12/11 11:26 AM2/12/11 11:26 AM
Wind Imagine you are entering a large, air-conditioned building on a hot summer day. As you open the door, you feel cool air rush-ing past you out of the building. This sudden rush of cool air occurs because the warm air outside the building is less dense and at a lower pressure than the cooler air inside the building. When the door opens, the difference in pressure causes the cool, dense air to rush out of the building. The movement of air is commonly known as wind.Wind and pressure differences In the example above, the air in the building moves from a region of higher density to a region of lower density. In the lower atmosphere, air also generally moves from regions of higher density to regions of lower density. These density differences are produced by the unequal heating and cool-ing of different regions of Earth’s surface. In the atmosphere, air pressure generally increases as density increases, so regions of high and low density are also regions of high and low air pressure respectively. As a result, air moves from a region of high pressure to a region of low pressure, resulting in wind.Wind speed and altitude Wind speed and direction change with height in the atmosphere. Near Earth’s surface, wind is con-stantly slowed by the friction that results from contact with sur-faces including trees, buildings, and hills, as shown Figure 14.Even the surface of water affects air motion. Higher up from Earth’s surface, air encounters less friction and wind speeds increase. Wind speed is usually measured in miles per hour (mph) or kilometers per hour (km/h). Ships at sea usually measure wind in knots. One knot is equal to 1.85 km/h.
■ Figure 14 When wind blows over a forested area by a coast, it encounters more friction than when it blows over flatter terrain. This occurs because the wind encounters friction from the mountains, trees, and then the water, slowing the wind’s speed.
Section 2 • Properties of the Atmosphere 293
image100/C
OR
BIS
0289_0296_ESGEU_S_C11_S2_658713.indd 2930289_0296_ESGEU_S_C11_S2_658713.indd 293 2/12/11 11:26 AM2/12/11 11:26 AM
Problem-Solving LAB
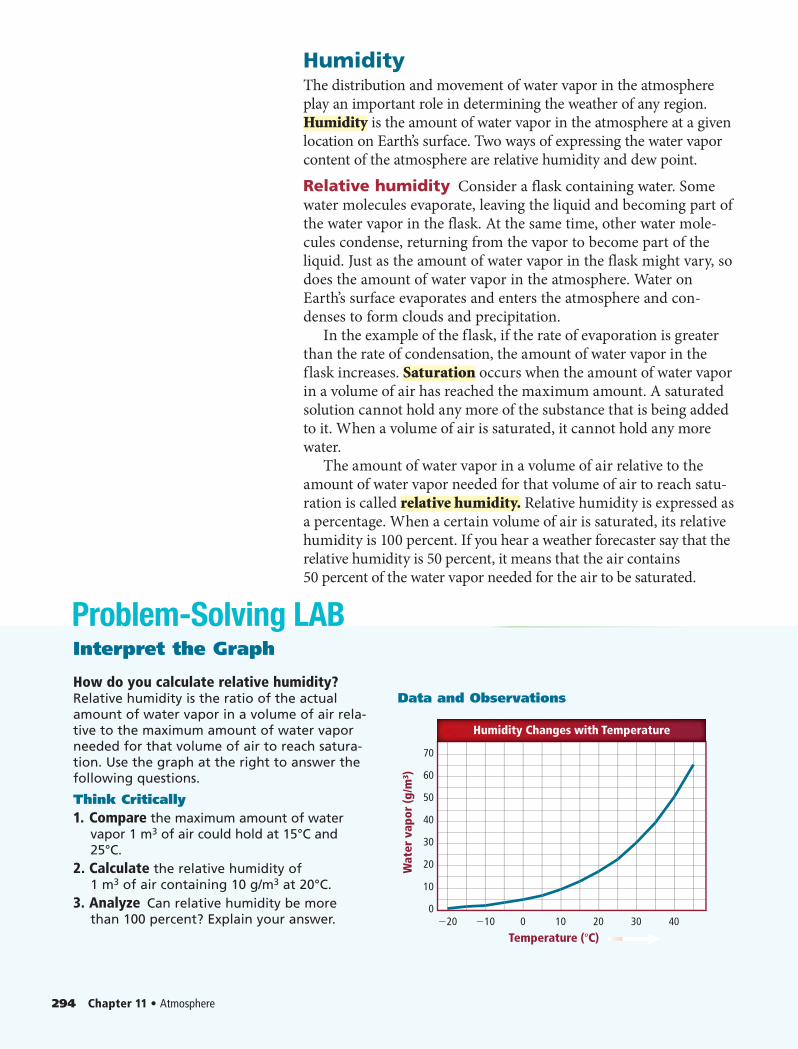
HumidityThe distribution and movement of water vapor in the atmosphere play an important role in determining the weather of any region. Humidity is the amount of water vapor in the atmosphere at a given location on Earth’s surface. Two ways of expressing the water vapor content of the atmosphere are relative humidity and dew point.Relative humidity Consider a flask containing water. Some water molecules evaporate, leaving the liquid and becoming part of the water vapor in the flask. At the same time, other water mole-cules condense, returning from the vapor to become part of the liquid. Just as the amount of water vapor in the flask might vary, so does the amount of water vapor in the atmosphere. Water on Earth’s surface evaporates and enters the atmosphere and con-denses to form clouds and precipitation.
In the example of the flask, if the rate of evaporation is greater than the rate of condensation, the amount of water vapor in the flask increases. Saturation occurs when the amount of water vapor in a volume of air has reached the maximum amount. A saturated solution cannot hold any more of the substance that is being added to it. When a volume of air is saturated, it cannot hold any more water.
The amount of water vapor in a volume of air relative to the amount of water vapor needed for that volume of air to reach satu-ration is called relative humidity. Relative humidity is expressed as a percentage. When a certain volume of air is saturated, its relative humidity is 100 percent. If you hear a weather forecaster say that the relative humidity is 50 percent, it means that the air contains 50 percent of the water vapor needed for the air to be saturated.
294 Chapter 11 • Atmosphere
Temperature (°C)−20 −10 0 10 20 30 40
Wat
er v
apor
(g/m
³)
0
10
20
30
40
50
60
70
Humidity Changes with Temperature
Interpret the Graph
How do you calculate relative humidity? Relative humidity is the ratio of the actual amount of water vapor in a volume of air rela-tive to the maximum amount of water vapor needed for that volume of air to reach satura-tion. Use the graph at the right to answer the following questions.
Think Critically1. Compare the maximum amount of water
vapor 1 m3 of air could hold at 15°C and 25°C.
2. Calculate the relative humidity of 1 m3 of air containing 10 g/m3 at 20°C.
3. Analyze Can relative humidity be more than 100 percent? Explain your answer.
Data and Observations
0289_0296_ESGEU_S_C11_S2_658713.indd 2940289_0296_ESGEU_S_C11_S2_658713.indd 294 2/12/11 11:26 AM2/12/11 11:26 AM
Water molecules begin to evaporate.
Rate of evaporation equals rate of condensationor saturation.
Evaporation continues, and condensation begins.
Time 125 C
Time 225 C
Evaporation-Condensation Equilibrium
Time 325 C
Dew point Another common way of describing the moisture content of air is the dew point. The dew point is the temperature to which air must be cooled at constant pressure to reach saturation. The name dew point comes from the fact that when the temperature falls to this level, water vapor condenses and dew begins to form. If the dew point is nearly the same as the air temperature, then the relative humidity is high.Latent heat As water vapor in the air condenses, thermal energy is released. Where does this energy come from? To change liquid water to water vapor, thermal energy is added to the water by heating it. The water vapor then contains more thermal energy than the liquid water. This is the energy that is released when condensation occurs. The extra thermal energy contained in water vapor compared to liquid water is called latent heat.
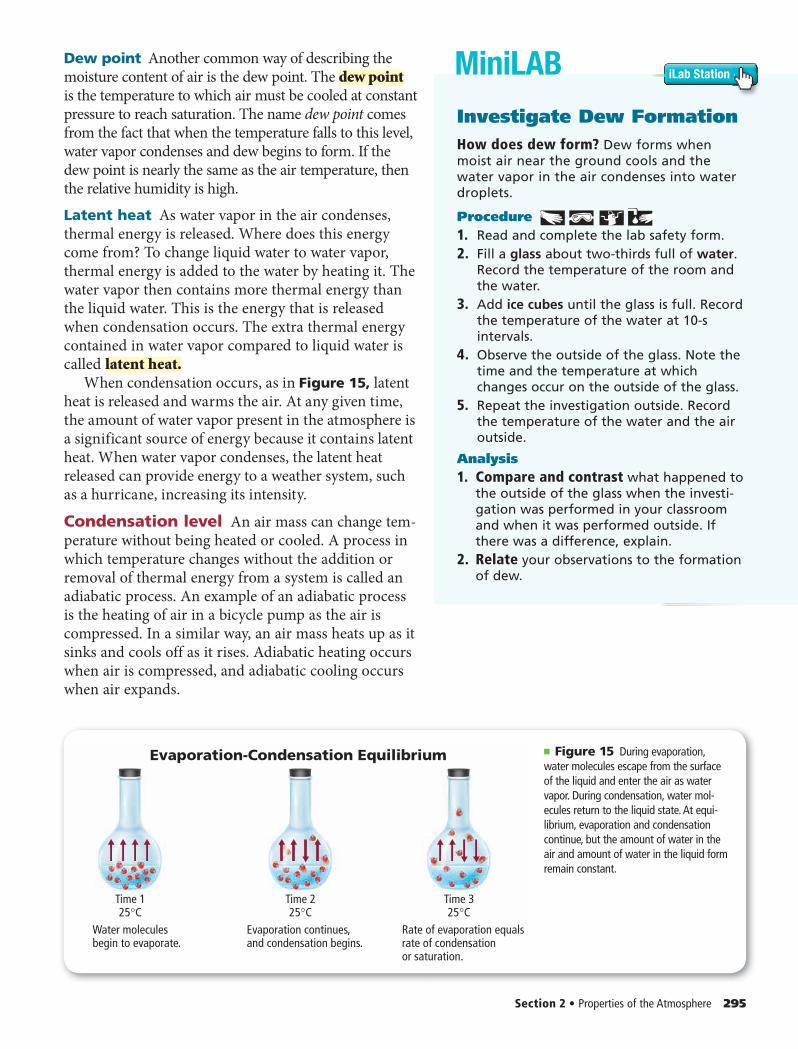
When condensation occurs, as in Figure 15, latent heat is released and warms the air. At any given time, the amount of water vapor present in the atmosphere is a significant source of energy because it contains latent heat. When water vapor condenses, the latent heat released can provide energy to a weather system, such as a hurricane, increasing its intensity.
Condensation level An air mass can change tem-perature without being heated or cooled. A process in which temperature changes without the addition or removal of thermal energy from a system is called an adiabatic process. An example of an adiabatic process is the heating of air in a bicycle pump as the air is compressed. In a similar way, an air mass heats up as it sinks and cools off as it rises. Adiabatic heating occurs when air is compressed, and adiabatic cooling occurs when air expands.
■ Figure 15 During evaporation, water molecules escape from the surface of the liquid and enter the air as water vapor. During condensation, water mol-ecules return to the liquid state. At equi-librium, evaporation and condensation continue, but the amount of water in the air and amount of water in the liquid form remain constant.
Section 2 • Properties of the Atmosphere 295
MiniLAB
Investigate Dew FormationHow does dew form? Dew forms when moist air near the ground cools and the water vapor in the air condenses into water droplets.
Procedure 1. Read and complete the lab safety form.2. Fill a glass about two-thirds full of water.
Record the temperature of the room and the water.
3. Add ice cubes until the glass is full. Record the temperature of the water at 10-s intervals.
4. Observe the outside of the glass. Note the time and the temperature at which changes occur on the outside of the glass.
5. Repeat the investigation outside. Record the temperature of the water and the air outside.
Analysis1. Compare and contrast what happened to
the outside of the glass when the investi-gation was performed in your classroom and when it was performed outside. If there was a difference, explain.
2. Relate your observations to the formation of dew.
iLab Station
0289_0296_ESGEU_S_C11_S2_658713.indd 2950289_0296_ESGEU_S_C11_S2_658713.indd 295 2/12/11 11:26 AM2/12/11 11:26 AM
Temperature ( C)
Moist adiabaticlapse rate(6 C per 1000 m)
Dry adiabaticlapse rate(10 C per 1000 m)
Liftedcondensationlevel
1000
2000
3000
4000
5000
010 10 20 30 40
Alt
itud
e (m
)
Earth'ssurface
Adiabatic Lapse Rates
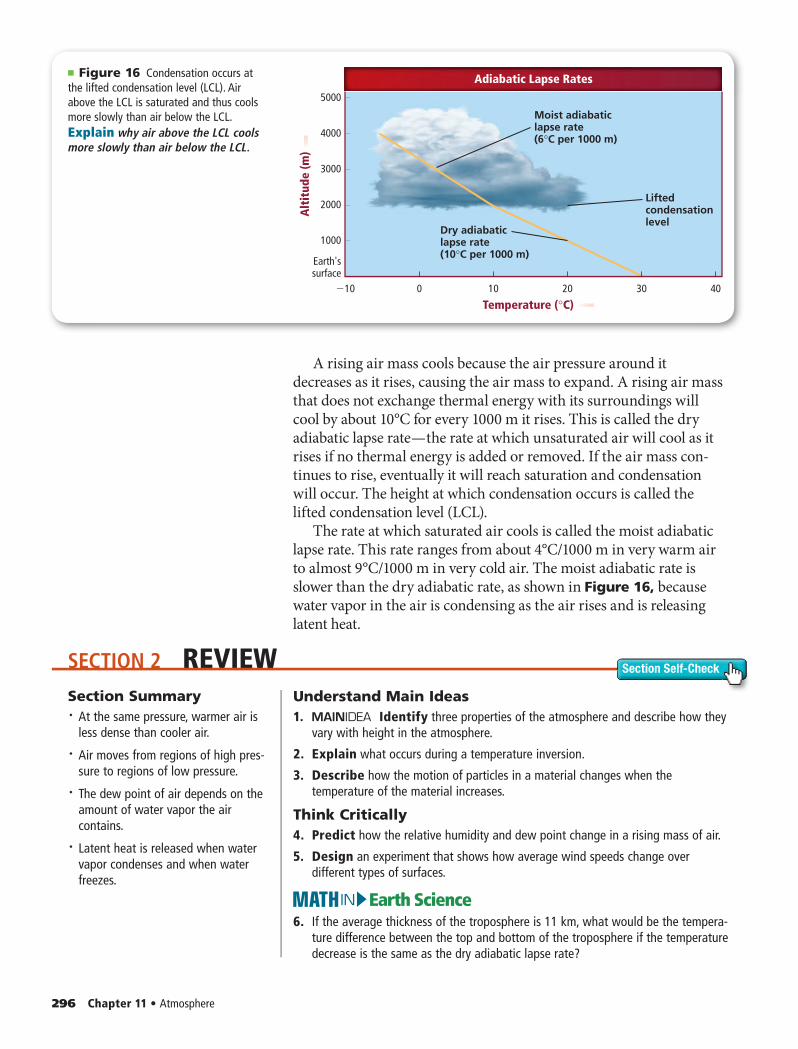
A rising air mass cools because the air pressure around it decreases as it rises, causing the air mass to expand. A rising air mass that does not exchange thermal energy with its surroundings will cool by about 10°C for every 1000 m it rises. This is called the dry adiabatic lapse rate — the rate at which unsaturated air will cool as it rises if no thermal energy is added or removed. If the air mass con-tinues to rise, eventually it will reach saturation and condensation will occur. The height at which condensation occurs is called the lifted condensation level (LCL).
The rate at which saturated air cools is called the moist adiabatic lapse rate. This rate ranges from about 4°C/1000 m in very warm air to almost 9°C/1000 m in very cold air. The moist adiabatic rate is slower than the dry adiabatic rate, as shown in Figure 16, because water vapor in the air is condensing as the air rises and is releasing latent heat.
■ Figure 16 Condensation occurs at the lifted condensation level (LCL). Air above the LCL is saturated and thus cools more slowly than air below the LCL.Explain why air above the LCL cools more slowly than air below the LCL.
296 Chapter 11 • Atmosphere
SECTION 2 REVIEW Section Self-Check
Section Summary• At the same pressure, warmer air is
less dense than cooler air.
• Air moves from regions of high pres-sure to regions of low pressure.
• The dew point of air depends on the amount of water vapor the air contains.
• Latent heat is released when water vapor condenses and when water freezes.
Understand Main Ideas1. Identify three properties of the atmosphere and describe how they
vary with height in the atmosphere.
2. Explain what occurs during a temperature inversion.
3. Describe how the motion of particles in a material changes when the temperature of the material increases.
Think Critically4. Predict how the relative humidity and dew point change in a rising mass of air.
5. Design an experiment that shows how average wind speeds change over different types of surfaces.
Earth ScienceIN6. If the average thickness of the troposphere is 11 km, what would be the tempera-
ture difference between the top and bottom of the troposphere if the temperature decrease is the same as the dry adiabatic lapse rate?
0289_0296_ESGEU_S_C11_S2_658713.indd 2960289_0296_ESGEU_S_C11_S2_658713.indd 296 2/12/11 11:26 AM2/12/11 11:26 AM
SECTION 3
Cloudcondensation
nucleus(particle)or aerosol
Water vapormolecules
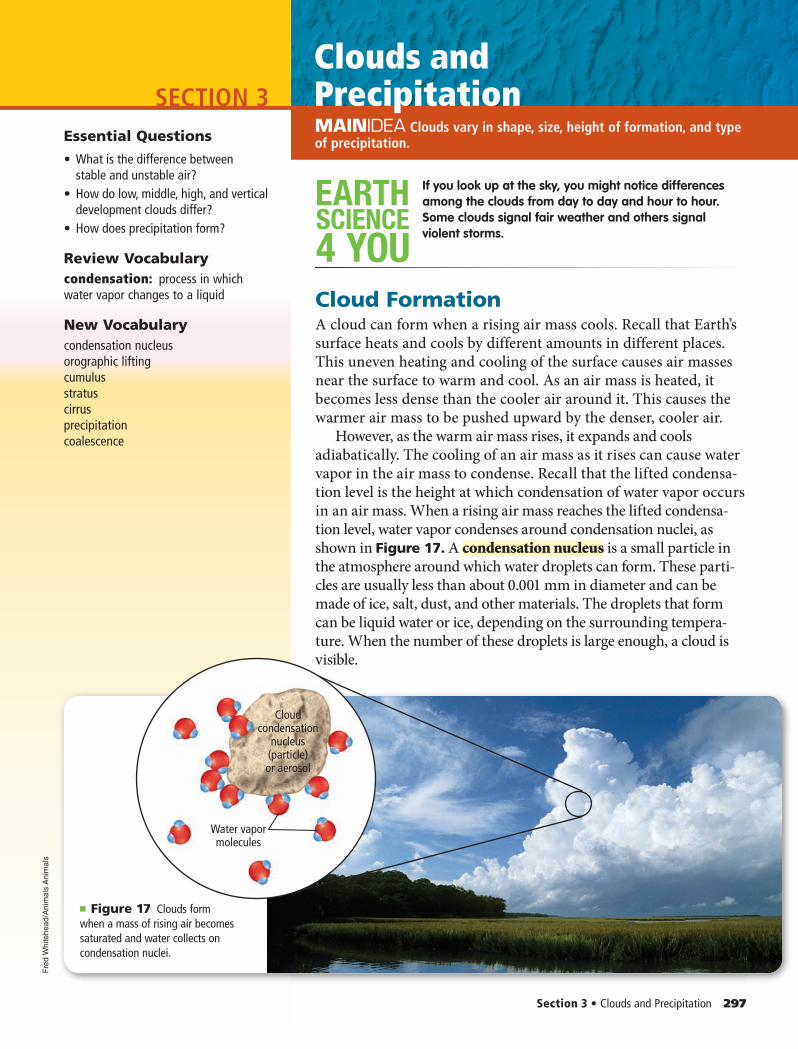
■ Figure 17 Clouds form when a mass of rising air becomes saturated and water collects on condensation nuclei.
Fre
d W
hite
head/A
nim
als
Anim
als
Section 3 • Clouds and Precipitation 297
MAINIDEA Energy is transferred throughout Earth’s atmosphere.
SCIENCE
4 YOU
EARTH If you look up at the sky, you might notice differences among the clouds from day to day and hour to hour. Some clouds signal fair weather and others signal violent storms.
Cloud FormationA cloud can form when a rising air mass cools. Recall that Earth’s surface heats and cools by different amounts in different places. This uneven heating and cooling of the surface causes air masses near the surface to warm and cool. As an air mass is heated, it becomes less dense than the cooler air around it. This causes the warmer air mass to be pushed upward by the denser, cooler air.
However, as the warm air mass rises, it expands and cools adiabatically. The cooling of an air mass as it rises can cause water vapor in the air mass to condense. Recall that the lifted condensa-tion level is the height at which condensation of water vapor occurs in an air mass. When a rising air mass reaches the lifted condensa-tion level, water vapor condenses around condensation nuclei, as shown in Figure 17. A condensation nucleus is a small particle in the atmosphere around which water droplets can form. These parti-cles are usually less than about 0.001 mm in diameter and can be made of ice, salt, dust, and other materials. The droplets that form can be liquid water or ice, depending on the surrounding tempera-ture. When the number of these droplets is large enough, a cloud is visible.
Essential Questions
• What is the difference between stable and unstable air?
• How do low, middle, high, and vertical development clouds differ?
• How does precipitation form?
Review Vocabularycondensation: process in which water vapor changes to a liquid
New Vocabularycondensation nucleusorographic liftingcumulusstratuscirrusprecipitationcoalescence
MAINIDEA Clouds vary in shape, size, height of formation, and type of precipitation.
Clouds and Precipitation
0297_0303_ESGEU_S_C11_S3_658713.indd 2970297_0303_ESGEU_S_C11_S3_658713.indd 297 2/12/11 11:25 AM2/12/11 11:25 AM
Air mass Air mass
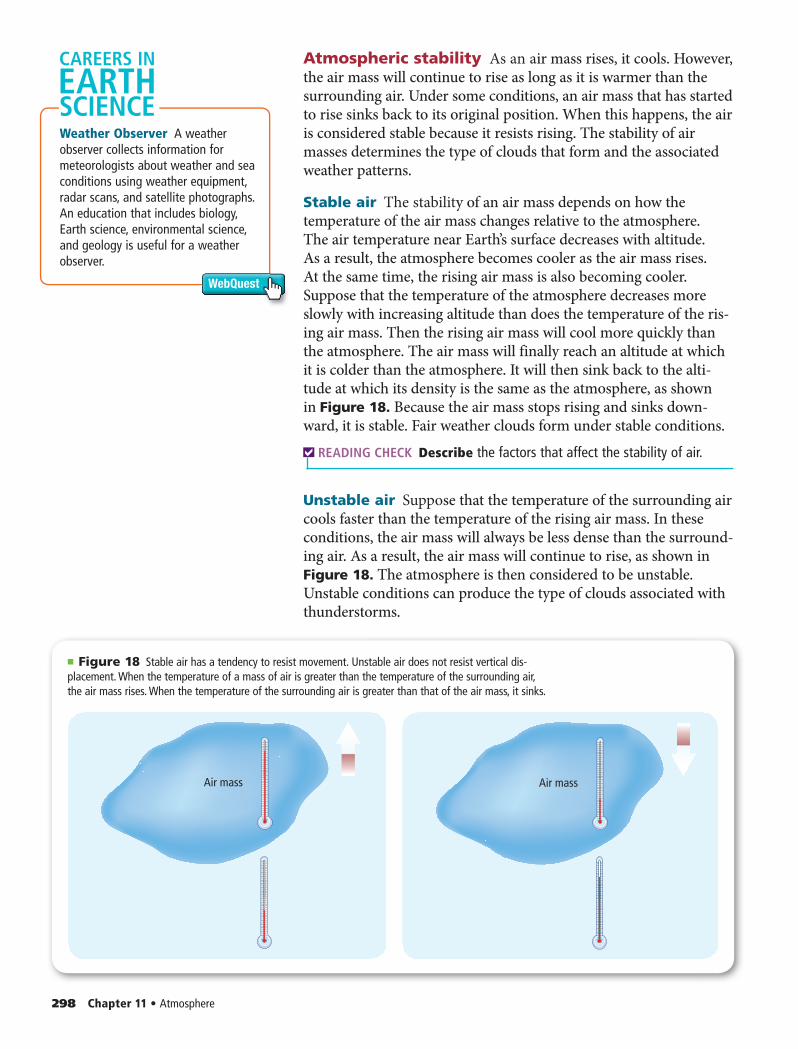
■ Figure 18 Stable air has a tendency to resist movement. Unstable air does not resist vertical dis-placement. When the temperature of a mass of air is greater than the temperature of the surrounding air, the air mass rises. When the temperature of the surrounding air is greater than that of the air mass, it sinks.
298 Chapter 11 • Atmosphere
Weather Observer A weather observer collects information for meteorologists about weather and sea conditions using weather equipment, radar scans, and satellite photographs. An education that includes biology, Earth science, environmental science, and geology is useful for a weather observer.
WebQuest
CAREERS IN
SCIENCEEARTH
Atmospheric stability As an air mass rises, it cools. However, the air mass will continue to rise as long as it is warmer than the surrounding air. Under some conditions, an air mass that has started to rise sinks back to its original position. When this happens, the air is considered stable because it resists rising. The stability of air masses determines the type of clouds that form and the associated weather patterns.
Stable air The stability of an air mass depends on how the temperature of the air mass changes relative to the atmosphere. The air temperature near Earth’s surface decreases with altitude. As a result, the atmosphere becomes cooler as the air mass rises. At the same time, the rising air mass is also becoming cooler. Suppose that the temperature of the atmosphere decreases more slowly with increasing altitude than does the temperature of the ris-ing air mass. Then the rising air mass will cool more quickly than the atmosphere. The air mass will finally reach an altitude at which it is colder than the atmosphere. It will then sink back to the alti-tude at which its density is the same as the atmosphere, as shown in Figure 18. Because the air mass stops rising and sinks down-ward, it is stable. Fair weather clouds form under stable conditions.
READING CHECK Describe the factors that affect the stability of air.
Unstable air Suppose that the temperature of the surrounding air cools faster than the temperature of the rising air mass. In these conditions, the air mass will always be less dense than the surround-ing air. As a result, the air mass will continue to rise, as shown in Figure 18. The atmosphere is then considered to be unstable. Unstable conditions can produce the type of clouds associated with thunderstorms.
0297_0303_ESGEU_S_C11_S3_658713.indd 2980297_0303_ESGEU_S_C11_S3_658713.indd 298 2/12/11 11:25 AM2/12/11 11:25 AM
Section 3 • Clouds and Precipitation 299
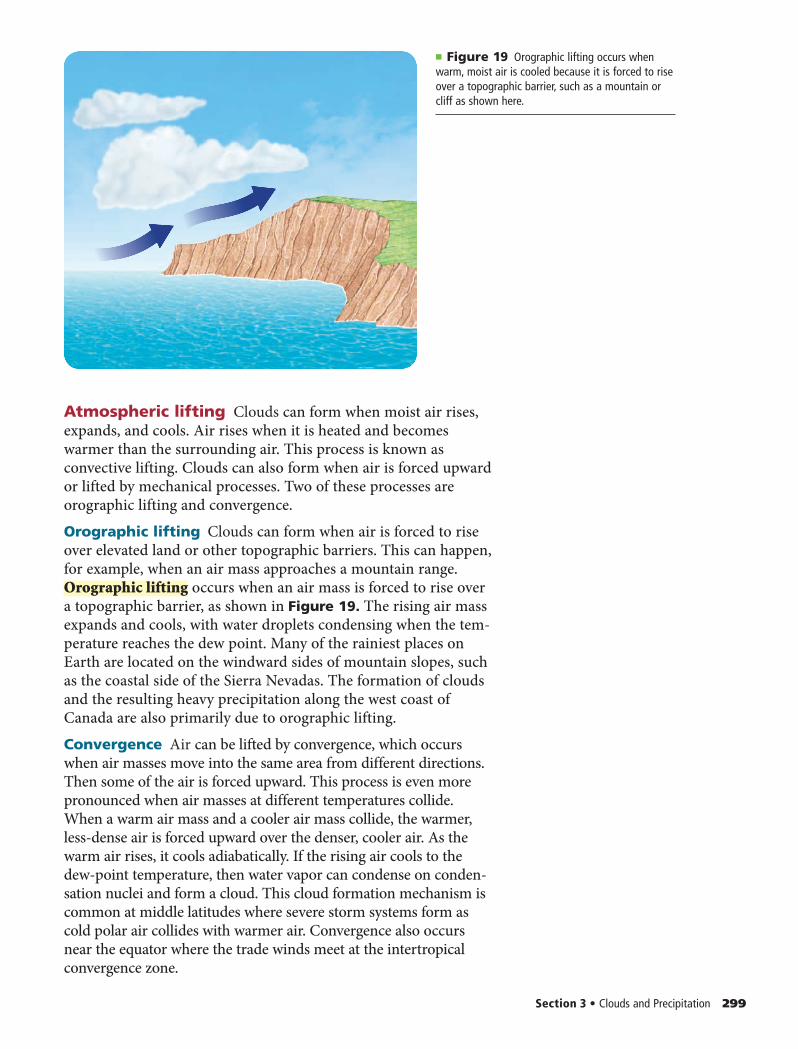
Atmospheric lifting Clouds can form when moist air rises, expands, and cools. Air rises when it is heated and becomes warmer than the surrounding air. This process is known as con vective lifting. Clouds can also form when air is forced upward or lifted by mechanical processes. Two of these processes are orographic lifting and convergence.Orographic lifting Clouds can form when air is forced to rise over elevated land or other topographic barriers. This can happen, for example, when an air mass approaches a mountain range. Orographic lifting occurs when an air mass is forced to rise over a topographic barrier, as shown in Figure 19. The rising air mass expands and cools, with water droplets condensing when the tem-perature reaches the dew point. Many of the rainiest places on Earth are located on the windward sides of mountain slopes, such as the coastal side of the Sierra Nevadas. The formation of clouds and the resulting heavy precipitation along the west coast of Canada are also primarily due to orographic lifting.Convergence Air can be lifted by convergence, which occurs when air masses move into the same area from different directions. Then some of the air is forced upward. This process is even more pronounced when air masses at different temperatures collide. When a warm air mass and a cooler air mass collide, the warmer, less-dense air is forced upward over the denser, cooler air. As the warm air rises, it cools adiabatically. If the rising air cools to the dew-point temperature, then water vapor can condense on conden-sation nuclei and form a cloud. This cloud formation mechanism is common at middle latitudes where severe storm systems form as cold polar air collides with warmer air. Convergence also occurs near the equator where the trade winds meet at the intertropical convergence zone.
■ Figure 19 Orographic lifting occurs when warm, moist air is cooled because it is forced to rise over a topographic barrier, such as a mountain or cliff as shown here.
0297_0303_ESGEU_S_C11_S3_658713.indd 2990297_0303_ESGEU_S_C11_S3_658713.indd 299 2/12/11 11:25 AM2/12/11 11:25 AM
Freezing level, above which clouds consist of ice crystals
Cirrus
12
6
2
Cirrostratus
Cumulonimbus
Stratocumulus
Altocumulus
Cirrocumulus
Cumulus
Nimbostratus
Altostratus
Stratus
Alt
itud
e (k
m)
300 Chapter 11 • Atmosphere
Types of CloudsYou have probably noticed that clouds have different shapes. Some clouds look like puffy cotton balls, while others have a thin, feath-ery appearance. These differences in cloud shape are due to differ-ences in the processes that cause clouds to form. Cloud formation can also take place at different altitudes — sometimes even right at Earth’s surface, in which case the cloud is known as fog.
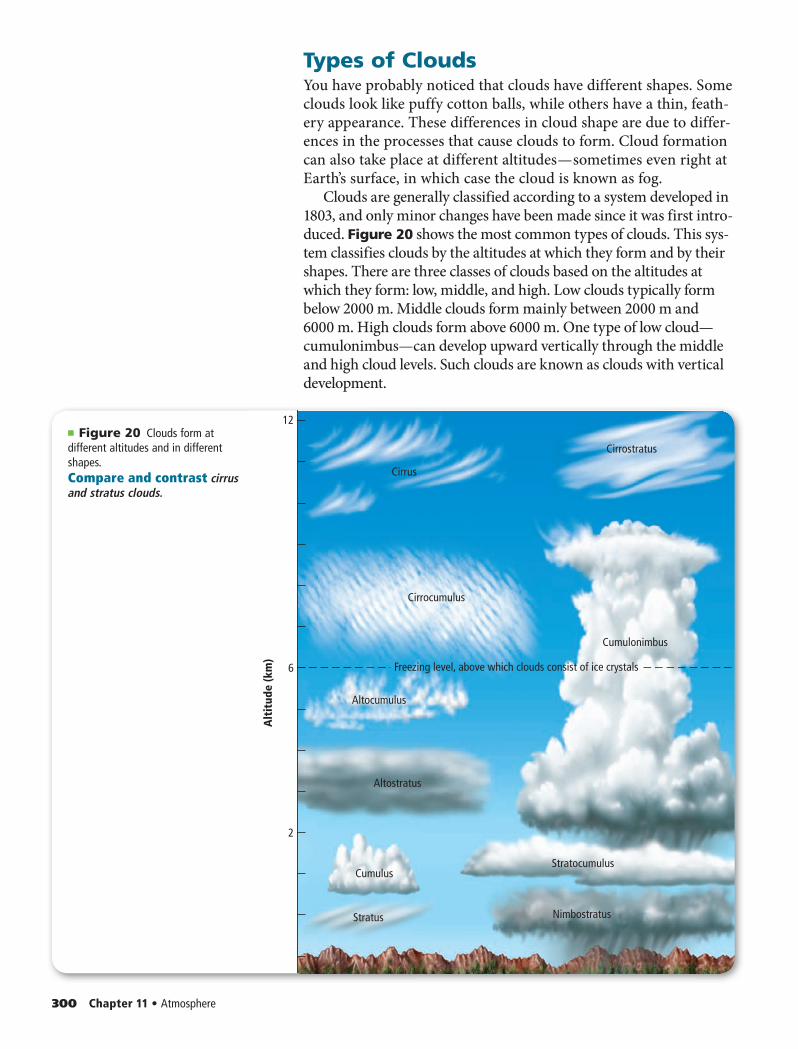
Clouds are generally classified according to a system developed in 1803, and only minor changes have been made since it was first intro-duced. Figure 20 shows the most common types of clouds. This sys-tem classifies clouds by the altitudes at which they form and by their shapes. There are three classes of clouds based on the altitudes at which they form: low, middle, and high. Low clouds typically form below 2000 m. Middle clouds form mainly between 2000 m and 6000 m. High clouds form above 6000 m. One type of low cloud—cumulonimbus—can develop upward vertically through the middle and high cloud levels. Such clouds are known as clouds with vertical development.
■ Figure 20 Clouds form at different altitudes and in different shapes. Compare and contrast cirrus and stratus clouds.
0297_0303_ESGEU_S_C11_S3_658713.indd 3000297_0303_ESGEU_S_C11_S3_658713.indd 300 2/12/11 11:25 AM2/12/11 11:25 AM
Joyc
e P
hoto
gra
phic
s/P
hoto
Researc
hers
Section 3 • Clouds and Precipitation 301
Low clouds Clouds can form when warm, moist air rises, expands, and cools. If conditions are stable, the air mass stops rising at the altitude where its temperature is the same as that of the surrounding air. If a cloud has formed, it will flatten out and winds will spread it hori-zontally into stratocumulus or layered cumulus clouds, as shown in Figure 20. Cumulus (KYEW myuh lus) clouds are puffy, lumpy-looking clouds that usually occur below 2000 m. Also below 2000 m, layered sheet-like stratus (STRAY tus) clouds can cover much or all of the sky in a given area. Stratus clouds often form when fog lifts away from Earth’s surface. A nimbostra-tus cloud produces precipitation.
Middle clouds Altocumulus and altostratus clouds form at altitudes between 2000 m and 6000 m. They are made up of ice crystals and water droplets due to the colder temperatures generally present at these altitudes. Middle clouds are usually layered. Altocumulus clouds are white or gray in color and form large, round masses or wavy rows. Altostratus clouds have a gray appear-ance, and they form thin sheets of clouds. Middle clouds sometimes produce mild precipitation.
High clouds High clouds, made up of ice crystals, form at heights above 6000 m where temperatures are below freezing. Some, such as cirrus (SIHR us) clouds, often have a wispy, indistinct appearance. A second type of high cloud, cirrostratus, forms as a continuous layer in the sky, varying from almost transparent to dense enough to block out the Sun or the Moon. A third type of high cloud, cirrocumulus, has a rippled appearance.
READING CHECK Identify types of low, middle, and high clouds .
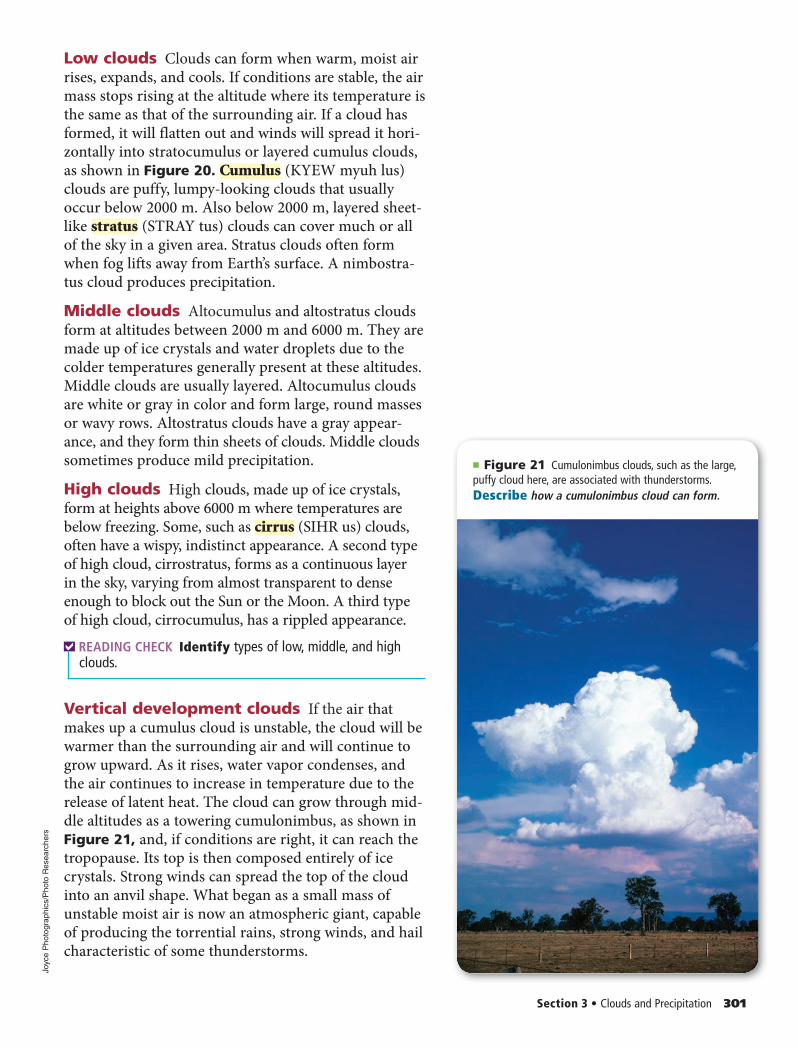
Vertical development clouds If the air that makes up a cumulus cloud is unstable, the cloud will be warmer than the surrounding air and will continue to grow upward. As it rises, water vapor condenses, and the air continues to increase in temperature due to the release of latent heat. The cloud can grow through mid-dle altitudes as a towering cumulonimbus, as shown in Figure 21, and, if conditions are right, it can reach the tropopause. Its top is then composed entirely of ice crystals. Strong winds can spread the top of the cloud into an anvil shape. What began as a small mass of unstable moist air is now an atmospheric giant, capable of producing the torrential rains, strong winds, and hail characteristic of some thunderstorms.
■ Figure 21 Cumulonimbus clouds, such as the large, puffy cloud here, are associated with thunderstorms.Describe how a cumulonimbus cloud can form.
0297_0303_ESGEU_S_C11_S3_658713.indd 3010297_0303_ESGEU_S_C11_S3_658713.indd 301 2/12/11 11:25 AM2/12/11 11:25 AM
(l)NC
AR/T
om S
tack
& A
ssoc
iate
s , (r
)Jim
Ree
d/Ph
oto
Rese
arch
ers
302 Chapter 11 • Atmosphere
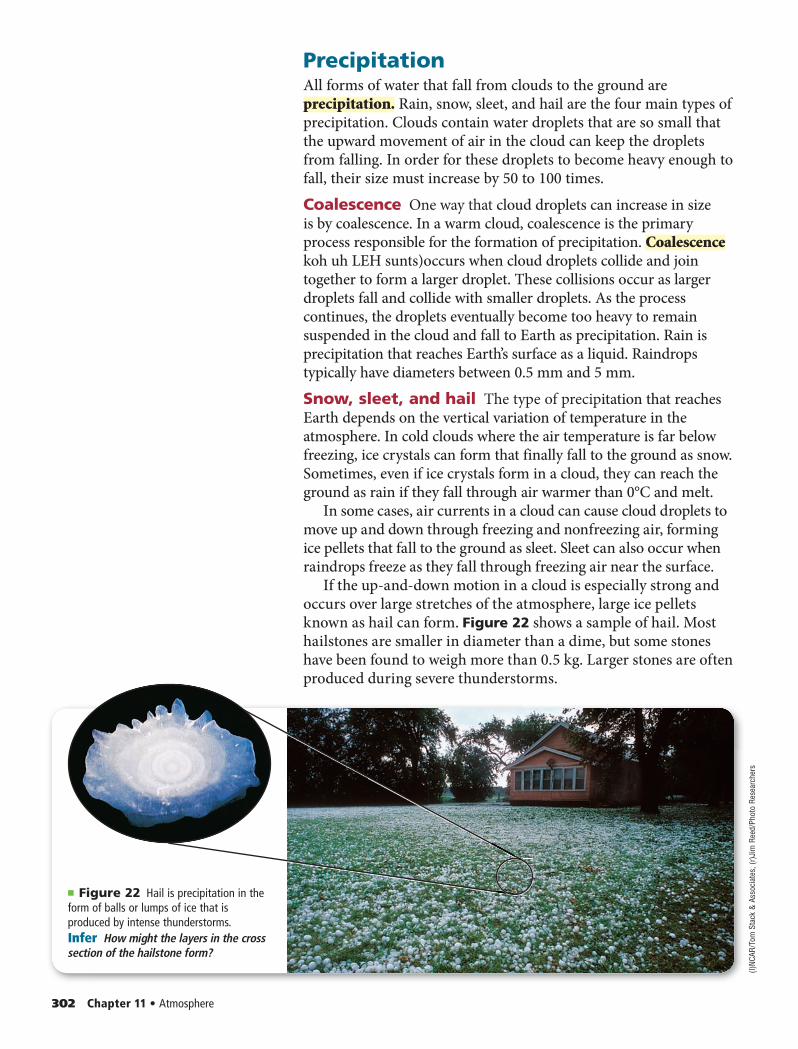
PrecipitationAll forms of water that fall from clouds to the ground are precipitation. Rain, snow, sleet, and hail are the four main types of precipitation. Clouds contain water droplets that are so small that the upward movement of air in the cloud can keep the droplets from falling. In order for these droplets to become heavy enough to fall, their size must increase by 50 to 100 times.Coalescence One way that cloud droplets can increase in size is by coalescence. In a warm cloud, coalescence is the primary process responsible for the formation of precipitation. Coalescencekoh uh LEH sunts)occurs when cloud droplets collide and join together to form a larger droplet. These collisions occur as larger droplets fall and collide with smaller droplets. As the process continues, the droplets eventually become too heavy to remain suspended in the cloud and fall to Earth as precipitation. Rain is precipitation that reaches Earth’s surface as a liquid. Raindrops typically have diameters between 0.5 mm and 5 mm.Snow, sleet, and hail The type of precipitation that reaches Earth depends on the vertical variation of temperature in the atmosphere. In cold clouds where the air temperature is far below freezing, ice crystals can form that finally fall to the ground as snow. Sometimes, even if ice crystals form in a cloud, they can reach the ground as rain if they fall through air warmer than 0°C and melt.
In some cases, air currents in a cloud can cause cloud droplets to move up and down through freezing and nonfreezing air, forming ice pellets that fall to the ground as sleet. Sleet can also occur when raindrops freeze as they fall through freezing air near the surface.
If the up-and-down motion in a cloud is especially strong and occurs over large stretches of the atmosphere, large ice pellets known as hail can form. Figure 22 shows a sample of hail. Most hailstones are smaller in diameter than a dime, but some stones have been found to weigh more than 0.5 kg. Larger stones are often produced during severe thunderstorms.
■ Figure 22 Hail is precipitation in the form of balls or lumps of ice that is produced by intense thunderstorms.Infer How might the layers in the cross section of the hailstone form?
0297_0303_ESGEU_S_C11_S3_658713.indd 3020297_0303_ESGEU_S_C11_S3_658713.indd 302 2/12/11 11:25 AM2/12/11 11:25 AM
Section Self-Check SECTION 3 REVIEW
Evaporation
Runoff
Precipitation
Condensation
Watercycle
Section 3 • Clouds and Precipitation 303
Section Summary• Clouds are formed as warm, moist
air is forced upward, expands, and cools.
• An air mass is stable if it tends to return to its original height after it starts rising.
• Cloud droplets form when water vapor is cooled to the dew point and condenses on condensation nuclei.
• Clouds are classified by their shapes and the altitudes at which they form.
• Cloud droplets collide and coalesce into larger droplets that can fall to Earth as rain, snow, sleet, or hail.
Understand Main Ideas1. Summarize the differences between low clouds, middle clouds, and
high clouds.
2. Describe how precipitation forms.
3. Determine the reason precipitation will fall as snow rather than rain.
4. Compare stable and unstable air.
Think Critically5. Evaluate how a reduction in the number of condensation nuclei in the tropo-
sphere would affect precipitation. Explain your reasoning.
Earth ScienceIN6. Describe the path a drop of rain might follow throughout the water cycle.
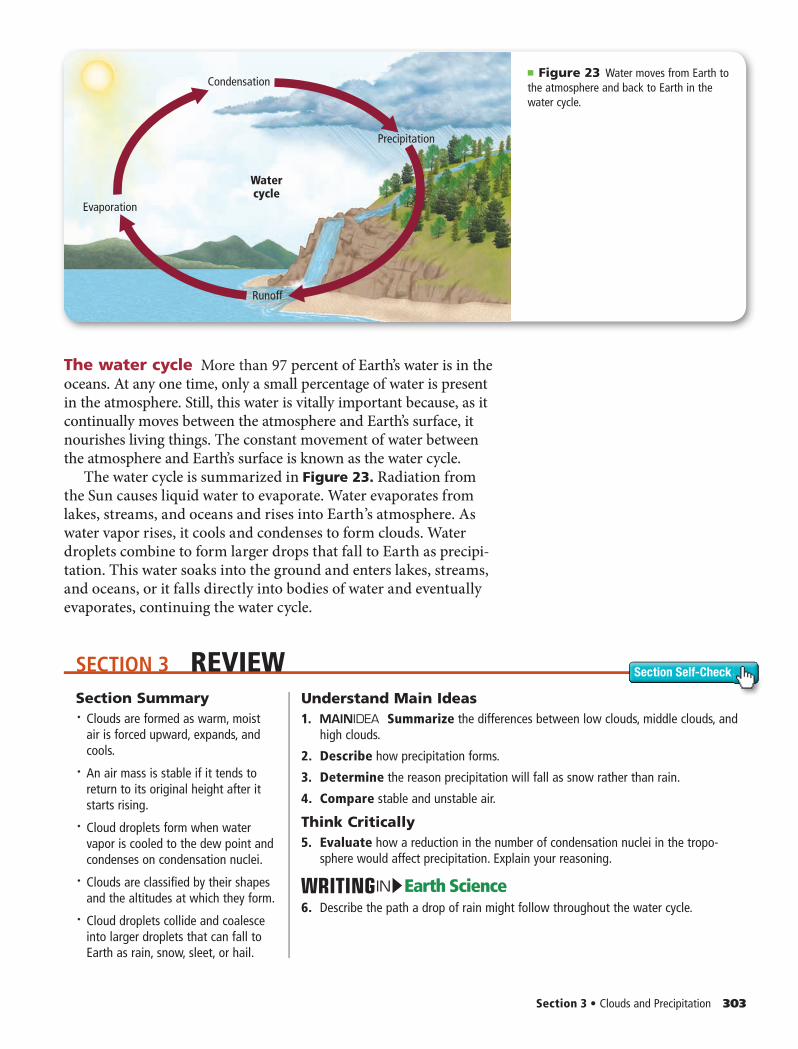
The water cycle More than 97 percent of Earth’s water is in the oceans. At any one time, only a small percentage of water is present in the atmosphere. Still, this water is vitally important because, as it continually moves between the atmosphere and Earth’s surface, it nourishes living things. The constant movement of water between the atmosphere and Earth’s surface is known as the water cycle.
The water cycle is summarized in Figure 23. Radiation from the Sun causes liquid water to evaporate. Water evaporates from lakes, streams, and oceans and rises into Earth’s atmosphere. As water vapor rises, it cools and condenses to form clouds. Water droplets combine to form larger drops that fall to Earth as precipi-tation. This water soaks into the ground and enters lakes, streams, and oceans, or it falls directly into bodies of water and eventually evaporates, continuing the water cycle.
■ Figure 23 Water moves from Earth to the atmosphere and back to Earth in the water cycle.
0297_0303_ESGEU_S_C11_S3_658713.indd 3030297_0303_ESGEU_S_C11_S3_658713.indd 303 2/12/11 11:26 AM2/12/11 11:26 AM
304 Chapter 11 • Atmosphere304 Chapter 11 • Atmosphere
Earth Science &
Atoms, such as chlorine and bromine, when located in the stratosphere, can destroy ozone molecules. The decline in stratospheric ozone measured since the early 1980s is showing signs of recovery perhaps due to a decrease in stratospheric chlorine.
Variations in ozone amounts The total amount of ozone in the atmosphere over Earth’s surface varies with location and also changes with time. Total ozone increases with latitude, being low at the equator and highest in the polar regions. Ozone amounts also vary seasonally, usually decreasing from winter to summer. The largest seasonal changes occur at high latitudes, particularly in the polar regions.
The Antarctic ozone hole Over Antarctica, the lowest ozone amounts occur in early spring. This decrease in ozone over Antarctica is called the Antarctic ozone hole.
The Antarctic ozone hole is caused by chlorofluo-rocarbons (CFCs) and the presence of polar stratospheric clouds (PSCs). These clouds form over Antarctica during the winter in the lower stratosphere. CFCs break down, producing mol-ecules that contain chlorine atoms. These mol-ecules undergo chemical reactions on ice crystals in the PSCs, producing chlorine and other compounds that destroy ozone.
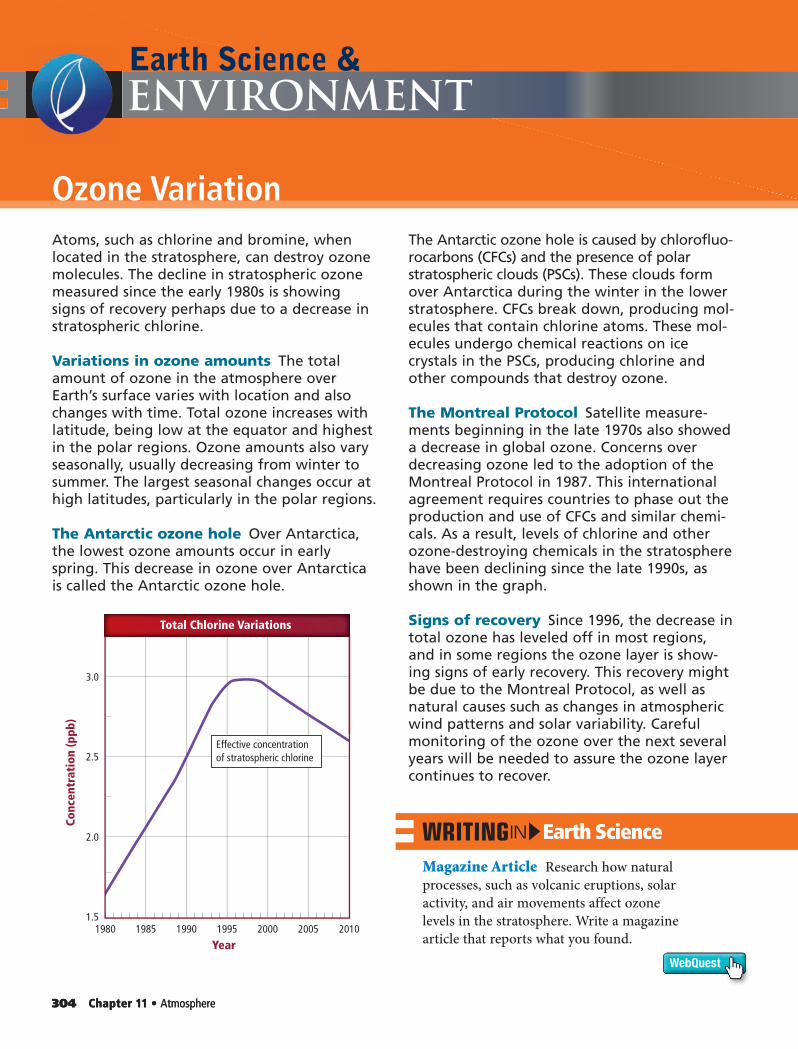
The Montreal Protocol Satellite measure-ments beginning in the late 1970s also showed a decrease in global ozone. Concerns over decreasing ozone led to the adoption of the Montreal Protocol in 1987. This international agreement requires countries to phase out the production and use of CFCs and similar chemi-cals. As a result, levels of chlorine and other ozone-destroying chemicals in the stratosphere have been declining since the late 1990s, as shown in the graph.
Signs of recovery Since 1996, the decrease in total ozone has leveled off in most regions, and in some regions the ozone layer is show-ing signs of early recovery. This recovery might be due to the Montreal Protocol, as well as natural causes such as changes in atmospheric wind patterns and solar variability. Careful monitoring of the ozone over the next several years will be needed to assure the ozone layer continues to recover .
Ozone Variation
ENVIRONMENT
Magazine Article Research how natural processes, such as volcanic eruptions, solar activity, and air movements affect ozone levels in the stratosphere. Write a magazine article that reports what you found.
Earth ScienceIN
Total Chlorine Variations
19851980 1990 1995 2005 20102000
Year
Conc
entr
atio
n (p
pb)
3.0
2.5
2.0
1.5
Effective concentrationof stratospheric chlorine
WebQuest
0304_0305_ESGEU_S_C11_LAB_658713.indd 3040304_0305_ESGEU_S_C11_LAB_658713.indd 304 2/12/11 11:25 AM2/12/11 11:25 AM
Mat
t Mea
dow
s
GeoLab 305
GeoLAB iLab Station
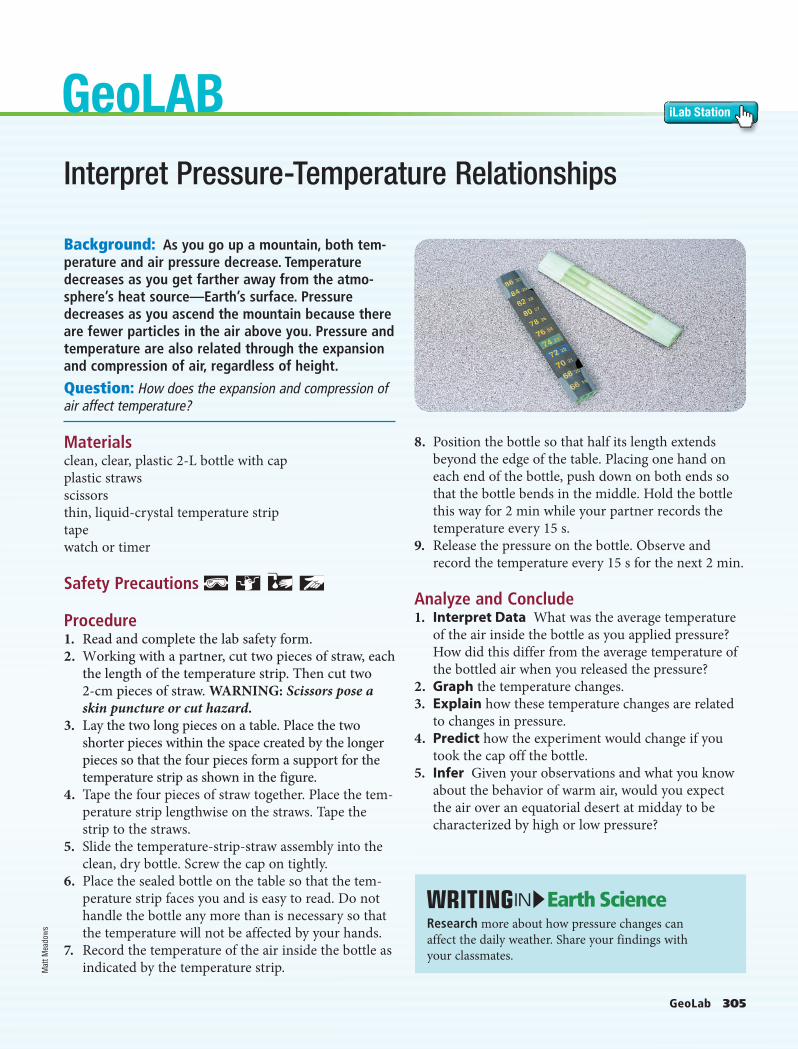
Background: As you go up a mountain, both tem-perature and air pressure decrease. Temperature decreases as you get farther away from the atmo-sphere’s heat source—Earth’s surface. Pressure decreases as you ascend the mountain because there are fewer particles in the air above you. Pressure and temperature are also related through the expansion and compression of air, regardless of height.
Question: How does the expansion and compression of air affect temperature?
Materials clean, clear, plastic 2-L bottle with capplastic strawsscissorsthin, liquid-crystal temperature striptapewatch or timer
Safety Precautions
Procedure1. Read and complete the lab safety form.2. Working with a partner, cut two pieces of straw, each
the length of the temperature strip. Then cut two 2-cm pieces of straw. WARNING: Scissors pose a skin puncture or cut hazard.
3. Lay the two long pieces on a table. Place the two shorter pieces within the space created by the longer pieces so that the four pieces form a support for the temperature strip as shown in the figure.
4. Tape the four pieces of straw together. Place the tem-perature strip lengthwise on the straws. Tape the strip to the straws.
5. Slide the temperature-strip-straw assembly into the clean, dry bottle. Screw the cap on tightly.
6. Place the sealed bottle on the table so that the tem-perature strip faces you and is easy to read. Do not handle the bottle any more than is necessary so that the temperature will not be affected by your hands.
7. Record the temperature of the air inside the bottle as indicated by the temperature strip.
8. Position the bottle so that half its length extends beyond the edge of the table. Placing one hand on each end of the bottle, push down on both ends so that the bottle bends in the middle. Hold the bottle this way for 2 min while your partner records the temperature every 15 s.
9. Release the pressure on the bottle. Observe and record the temperature every 15 s for the next 2 min.
Analyze and Conclude1. Interpret Data What was the average temperature
of the air inside the bottle as you applied pressure? How did this differ from the average temperature of the bottled air when you released the pressure?
2. Graph the temperature changes.3. Explain how these temperature changes are related
to changes in pressure.4. Predict how the experiment would change if you
took the cap off the bottle.5. Infer Given your observations and what you know
about the behavior of warm air, would you expect the air over an equatorial desert at midday to be characterized by high or low pressure?
Interpret Pressure-Temperature Relationships
Earth ScienceINResearch more about how pressure changes can affect the daily weather. Share your findings with your classmates.
0304_0305_ESGEU_S_C11_LAB_658713.indd 3050304_0305_ESGEU_S_C11_LAB_658713.indd 305 2/12/11 11:25 AM2/12/11 11:25 AM
306 Chapter 11 • Assessment 306 Chapter 11 • Study Guide Vocabulary Practice
Download quizzes, key terms, and flash cards from glencoe.com.
306 Chapter 11 • Study Guide
SECTION 1 Atmospheric Basics VOCABULARY• troposphere• stratosphere• mesosphere• thermosphere• exosphere• radiation• conduction• convection
Energy is transferred throughout Earth’s atmosphere.• Earth’s atmosphere is composed of several gases, primarily nitrogen and
oxygen, and also contains small particles.• Earth’s atmosphere consists of five layers that differ in their compositions
and temperatures.• Solar energy reaches Earth’s surface in the form of visible light and infrared
waves.• Solar energy absorbed by Earth’s surface is transferred as thermal energy
throughout the atmosphere.
SECTION 2 Properties of the AtmosphereVOCABULARY• temperature inversion• humidity• saturation• relative humidity• dew point• latent heat
Atmospheric properties, such as temperature, air pressure, and humidity describe weather conditions.
• At the same pressure, warmer air is less dense than cooler air.• Air moves from regions of high pressure to regions of low pressure.• The dew point of air depends on the amount of water vapor the air
contains.• Latent heat is released when water vapor condenses and when water freezes.
SECTION 3 Clouds and PrecipitationVOCABULARY• condensation nucleus• orographic lifting• cumulus• stratus• cirrus• precipitation• coalescence
Clouds vary in shape, size, height of formation, and type of precipitation.
• Clouds are formed as warm, moist air is forced upward, expands, and cools.• An air mass is stable if it tends to return to its original height after it starts
rising.• Cloud droplets form when water vapor is cooled to the dew point and con-
denses on condensation nuclei.• Clouds are classified by their shapes and the altitudes at which they form.• Cloud droplets collide and coalesce into larger droplets that can fall to Earth
as rain, snow, sleet, or hail.
The composition, structure, and properties of Earth’s atmosphere form the basis of Earth’s weather and climate.
Vocabulary Practice
STUDY GUIDECHAPTER 11
0306_0309_ESGEU_S_C11_CA_658713.indd 3060306_0309_ESGEU_S_C11_CA_658713.indd 306 2/12/11 11:24 AM2/12/11 11:24 AM
Chapter 11 • Assessment 307
Chapter Self-CheckASSESSMENT
VOCABULARY REVIEWMatch each description below with the correct vocabu-lary term from the Study Guide.
1. outermost layer of Earth’s atmosphere
2. transfer of energy from a higher to a lower temper-ature by collisions between particles
3. temperature at which condensation of water vapor can occur
4. occurs when the amount of water vapor in a volume of air has reached the maximum amount
5. the amount of water vapor present in air
Complete the sentences below using vocabulary terms from the Study Guide.
6. ________ are small particles in the atmosphere around which water droplets form.
7. The atmospheric layer that is closest to Earth’s surface is the ________.
8. Types of ________ include hail, sleet, and snow.
Each of the following sentences is false. Make each sen-tence true by replacing the italicized words with terms from the Study Guide.
9. Convection occurs when small cloud droplets col-lide to form a larger droplet.
10. Mesosphere is the layer of Earth’s atmosphere that contains the ozone layer.
11. The transfer of energy in matter or space by elec-tromagnetic waves is called latent heat.
12. When the bottom of a pan of water is heated and the water expands, becoming less dense than the surrounding water, it is forced upward. As it rises, the water cools and sinks back to the bottom of the pan. This process is called precipitation.
13. When saturation occurs, an air mass is forced to rise over a topographic barrier.
UNDERSTAND KEY CONCEPTS 14. Which gas has increased in concentration by about
0.011 percent over the past 150 years?A. oxygenB. nitrogenC. carbon dioxideD. water vapor
Use the diagram below to answer Question 15.
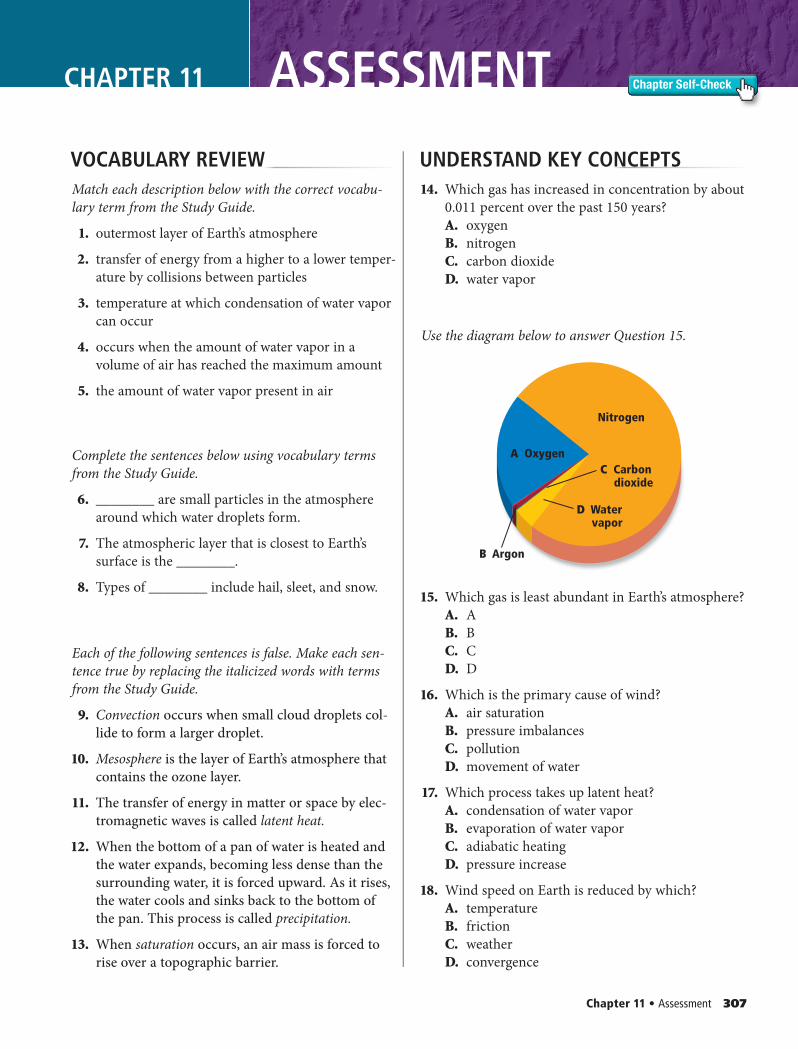
15. Which gas is least abundant in Earth’s atmosphere?A. AB. BC. CD. D
16. Which is the primary cause of wind?A. air saturationB. pressure imbalancesC. pollutionD. movement of water
17. Which process takes up latent heat?A. condensation of water vaporB. evaporation of water vaporC. adiabatic heatingD. pressure increase
18. Wind speed on Earth is reduced by which?A. temperatureB. frictionC. weatherD. convergence
CHAPTER 11
A Oxygen
Nitrogen
B Argon
C Carbon dioxide
D Water vapor
0306_0309_ESGEU_S_C11_CA_658713.indd 3070306_0309_ESGEU_S_C11_CA_658713.indd 307 2/12/11 11:25 AM2/12/11 11:25 AM
308 Chapter 11 • Assessment
ASSESSMENT
Use the diagram below to answer Question 19.
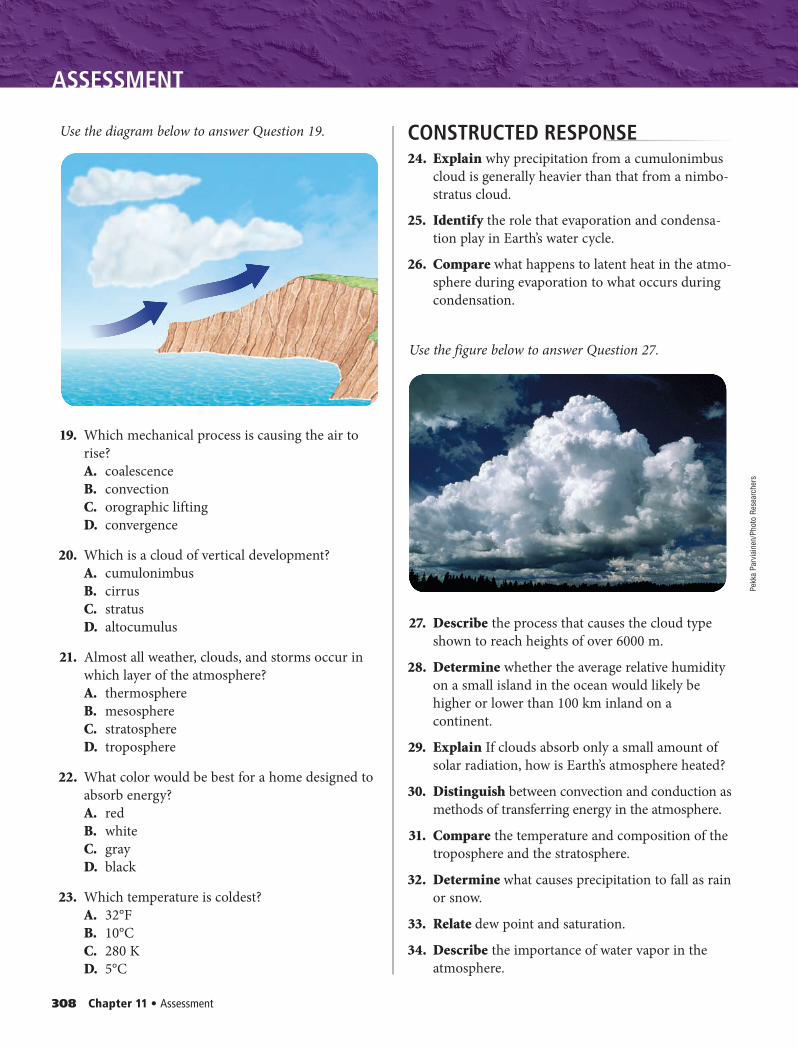
19. Which mechanical process is causing the air to rise?A. coalescenceB. convectionC. orographic liftingD. convergence
20. Which is a cloud of vertical development?A. cumulonimbusB. cirrusC. stratusD. altocumulus
21. Almost all weather, clouds, and storms occur in which layer of the atmosphere?A. thermosphereB. mesosphereC. stratosphereD. troposphere
22. What color would be best for a home designed to absorb energy?A. redB. whiteC. grayD. black
23. Which temperature is coldest?A. 32°FB. 10°CC. 280 KD. 5°C
CONSTRUCTED RESPONSE 24. Explain why precipitation from a cumulonimbus
cloud is generally heavier than that from a nimbo-stratus cloud.
25. Identify the role that evaporation and condensa-tion play in Earth’s water cycle.
26. Compare what happens to latent heat in the atmo-sphere during evaporation to what occurs during condensation.
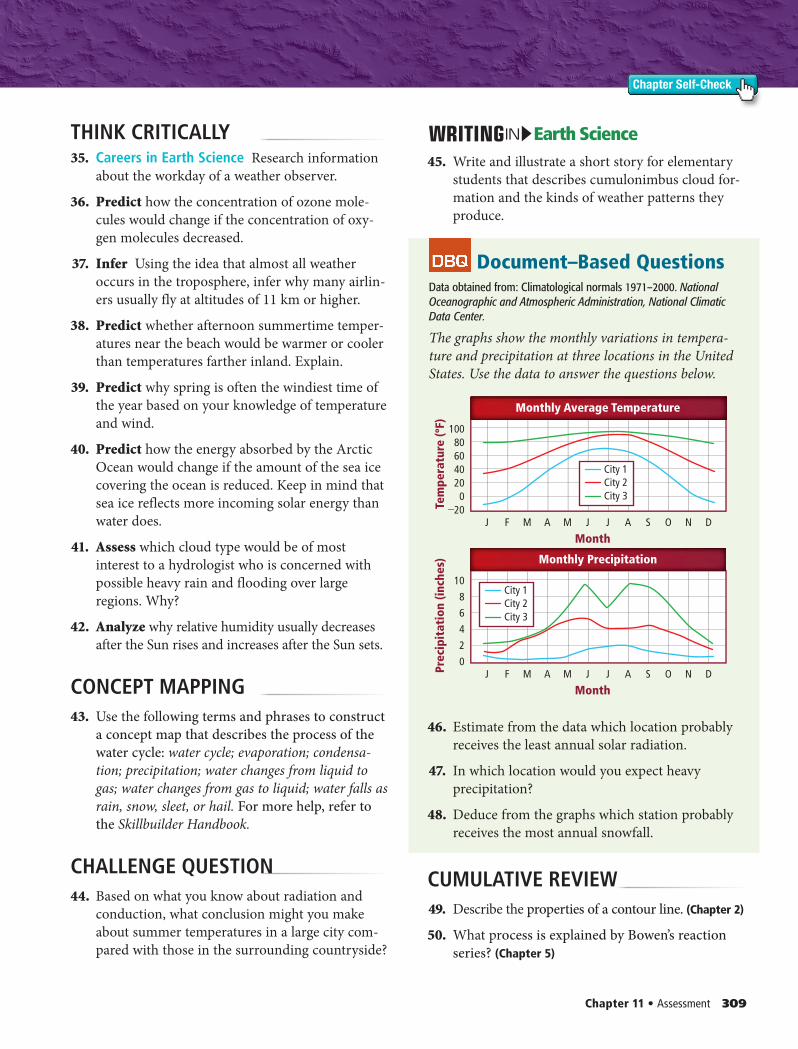
Use the figure below to answer Question 27.
27. Describe the process that causes the cloud type shown to reach heights of over 6000 m.
28. Determine whether the average relative humidity on a small island in the ocean would likely be higher or lower than 100 km inland on a continent.
29. Explain If clouds absorb only a small amount of solar radiation, how is Earth’s atmosphere heated?
30. Distinguish between convection and conduction as methods of transferring energy in the atmosphere.
31. Compare the temperature and composition of the troposphere and the stratosphere.
32. Determine what causes precipitation to fall as rain or snow.
33. Relate dew point and saturation.
34. Describe the importance of water vapor in the atmosphere.
Pekk
a Pa
rvia
inen
/Pho
to R
esea
rche
rs
0306_0309_ESGEU_S_C11_CA_658713.indd 3080306_0309_ESGEU_S_C11_CA_658713.indd 308 2/12/11 11:25 AM2/12/11 11:25 AM
Chapter 11 • Assessment 309
Chapter Self-Check
THINK CRITICALLY 35. Careers in Earth Science Research information
about the workday of a weather observer.
36. Predict how the concentration of ozone mole-cules would change if the concentration of oxy-gen molecules decreased.
37. Infer Using the idea that almost all weather occurs in the troposphere, infer why many airlin-ers usually fly at altitudes of 11 km or higher.
38. Predict whether afternoon summertime temper-atures near the beach would be warmer or cooler than temperatures farther inland. Explain.
39. Predict why spring is often the windiest time of the year based on your knowledge of temperature and wind.
40. Predict how the energy absorbed by the Arctic Ocean would change if the amount of the sea ice covering the ocean is reduced. Keep in mind that sea ice reflects more incoming solar energy than water does.
41. Assess which cloud type would be of most interest to a hydrologist who is concerned with possible heavy rain and flooding over large regions. Why?
42. Analyze why relative humidity usually decreases after the Sun rises and increases after the Sun sets.
CONCEPT MAPPING 43. Use the following terms and phrases to construct
a concept map that describes the process of the water cycle: water cycle; evaporation; condensa-tion; precipitation; water changes from liquid to gas; water changes from gas to liquid; water falls as rain, snow, sleet, or hail. For more help, refer to the Skillbuilder Handbook.
CHALLENGE QUESTION 44. Based on what you know about radiation and
conduction, what conclusion might you make about summer temperatures in a large city com-pared with those in the surrounding countryside?
Earth ScienceIN
45. Write and illustrate a short story for elementary students that describes cumulonimbus cloud for-mation and the kinds of weather patterns they produce.
Document–Based QuestionsData obtained from: Climatological normals 1971–2000. National Oceanographic and Atmospheric Administration, National Climatic Data Center.
The graphs show the monthly variations in tempera-ture and precipitation at three locations in the United States. Use the data to answer the questions below.
46. Estimate from the data which location probably receives the least annual solar radiation.
47. In which location would you expect heavy precipitation?
48. Deduce from the graphs which station probably receives the most annual snowfall.
CUMULATIVE REVIEW 49. Describe the properties of a contour line. (Chapter 2)
50. What process is explained by Bowen’s reaction series? (Chapter 5)
FJ M A J J A S O N DM
Tem
pera
ture
(ºF)
Month
Monthly Average Temperature
100806040200
–20
City 1City 2City 3
FJ M A J J A S O N DMPrec
ipit
atio
n (in
ches
)
Month
Monthly Precipitation
10
8
6
4
2
0
City 1City 2City 3
0306_0309_ESGEU_S_C11_CA_658713.indd 3090306_0309_ESGEU_S_C11_CA_658713.indd 309 2/12/11 11:25 AM2/12/11 11:25 AM
MULTIPLE CHOICE
1. What is the composition of dripstone formations?A. gravelB. limestoneC. clayD. sand
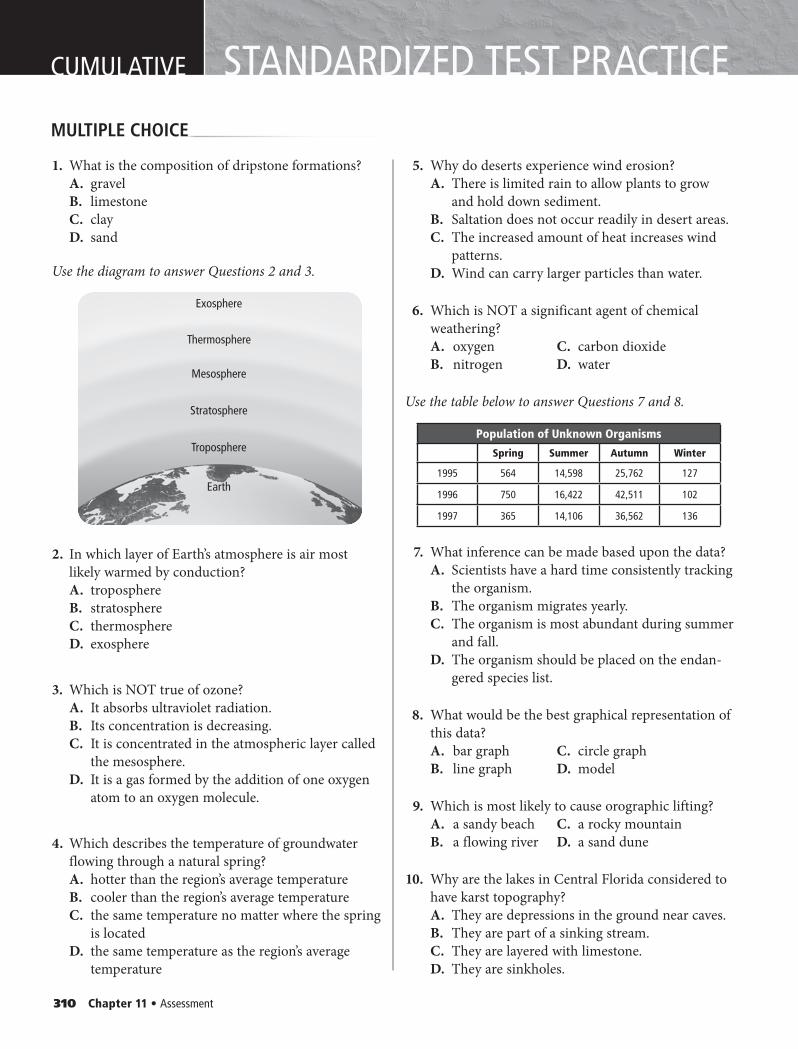
Use the diagram to answer Questions 2 and 3.
2. In which layer of Earth’s atmosphere is air most likely warmed by conduction?A. troposphereB. stratosphereC. thermosphereD. exosphere
3. Which is NOT true of ozone?A. It absorbs ultraviolet radiation.B. Its concentration is decreasing.C. It is concentrated in the atmospheric layer called
the mesosphere.D. It is a gas formed by the addition of one oxygen
atom to an oxygen molecule.
4. Which describes the temperature of groundwater flowing through a natural spring?A. hotter than the region’s average temperatureB. cooler than the region’s average temperatureC. the same temperature no matter where the spring
is locatedD. the same temperature as the region’s average
temperature
5. Why do deserts experience wind erosion?A. There is limited rain to allow plants to grow
and hold down sediment.B. Saltation does not occur readily in desert areas.C. The increased amount of heat increases wind
patterns.D. Wind can carry larger particles than water.
6. Which is NOT a significant agent of chemical weathering?A. oxygen C. carbon dioxideB. nitrogen D. water
Use the table below to answer Questions 7 and 8.
7. What inference can be made based upon the data?A. Scientists have a hard time consistently tracking
the organism.B. The organism migrates yearly.C. The organism is most abundant during summer
and fall.D. The organism should be placed on the endan-
gered species list.
8. What would be the best graphical representation of this data?A. bar graph C. circle graphB. line graph D. model
9. Which is most likely to cause orographic lifting?A. a sandy beach C. a rocky mountainB. a flowing river D. a sand dune
10. Why are the lakes in Central Florida considered to have karst topography?A. They are depressions in the ground near caves.B. They are part of a sinking stream.C. They are layered with limestone.D. They are sinkholes.
CUMULATIVE STANDARDIZED TEST PRACTICE
Exosphere
Thermosphere
Mesosphere
Stratosphere
Troposphere
Earth
Population of Unknown Organisms
Spring Summer Autumn Winter
1995 564 14,598 25,762 127
1996 750 16,422 42,511 102
1997 365 14,106 36,562 136
310 Chapter 11 • Assessment
0310_0311_ESGEU_S_C11_STP_658713.indd 3100310_0311_ESGEU_S_C11_STP_658713.indd 310 2/12/11 11:24 AM2/12/11 11:24 AM
SHORT ANSWER
Online Test Practice
NEED EXTRA HELP?
If You Missed Question . . .
1 2 3 4 5 6 7 8 9 10 11 12 13 14 15 16
Review Section . . . 10.2 11.1 11.1 10.1 8.2 7.1 1.2 1.3 11.3 10.2 6.3 6.3 6.3 11.2 3.1 7.3
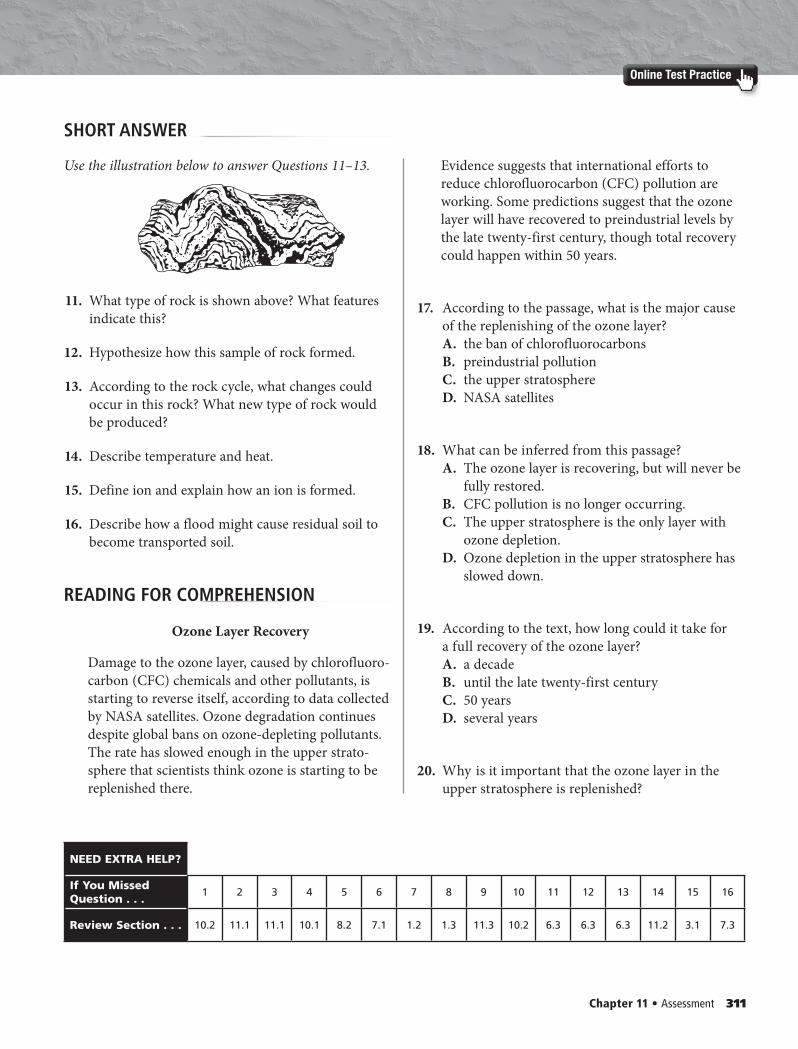
Use the illustration below to answer Questions 11–13.
11. What type of rock is shown above? What features indicate this?
12. Hypothesize how this sample of rock formed.
13. According to the rock cycle, what changes could occur in this rock? What new type of rock would be produced?
14. Describe temperature and heat.
15. Define ion and explain how an ion is formed.
16. Describe how a flood might cause residual soil to become transported soil.
Ozone Layer Recovery
Damage to the ozone layer, caused by chlorofluoro-carbon (CFC) chemicals and other pollutants, is starting to reverse itself, according to data collected by NASA satellites. Ozone degradation continues despite global bans on ozone-depleting pollutants. The rate has slowed enough in the upper strato-sphere that scientists think ozone is starting to be replenished there.
Evidence suggests that international efforts to reduce chlorofluorocarbon (CFC) pollution are working. Some predictions suggest that the ozone layer will have recovered to preindustrial levels by the late twenty-first century, though total recovery could happen within 50 years.
17. According to the passage, what is the major cause of the replenishing of the ozone layer?A. the ban of chlorofluorocarbonsB. preindustrial pollutionC. the upper stratosphereD. NASA satellites
18. What can be inferred from this passage?A. The ozone layer is recovering, but will never be
fully restored.B. CFC pollution is no longer occurring.C. The upper stratosphere is the only layer with
ozone depletion.D. Ozone depletion in the upper stratosphere has
slowed down.
19. According to the text, how long could it take for a full recovery of the ozone layer? A. a decadeB. until the late twenty-first centuryC. 50 yearsD. several years
20. Why is it important that the ozone layer in the upper stratosphere is replenished?
READING FOR COMPREHENSION
Chapter 11 • Assessment 311
0310_0311_ESGEU_S_C11_STP_658713.indd 3110310_0311_ESGEU_S_C11_STP_658713.indd 311 2/12/11 11:24 AM2/12/11 11:24 AM
MeteorologyMeteorologyCHAPTER 12
ColdFronts
Warm
Fronts StationaryFronts
OccludedFronts
Types of FrontsMake a side-tab book using the labels shown. Use it to organize your notes on the four types of fronts.
How does a cold air mass form?An air mass is a large volume of air that has the characteristics of the area over which it formed. Model the formation of a cold air mass in this activity.
LaunchLAB
1 The Causes of Weather
2 Weather Systems
3 Gathering Weather Data
4 Weather Analysis and Prediction
SECTIONS
Weather patterns can be observed, analyzed, and predicted.
iLab Station
312
0312_0313_ESGEU_S_C12_CO_658713.indd 3120312_0313_ESGEU_S_C12_CO_658713.indd 312 2/24/11 12:12 PM2/24/11 12:12 PM
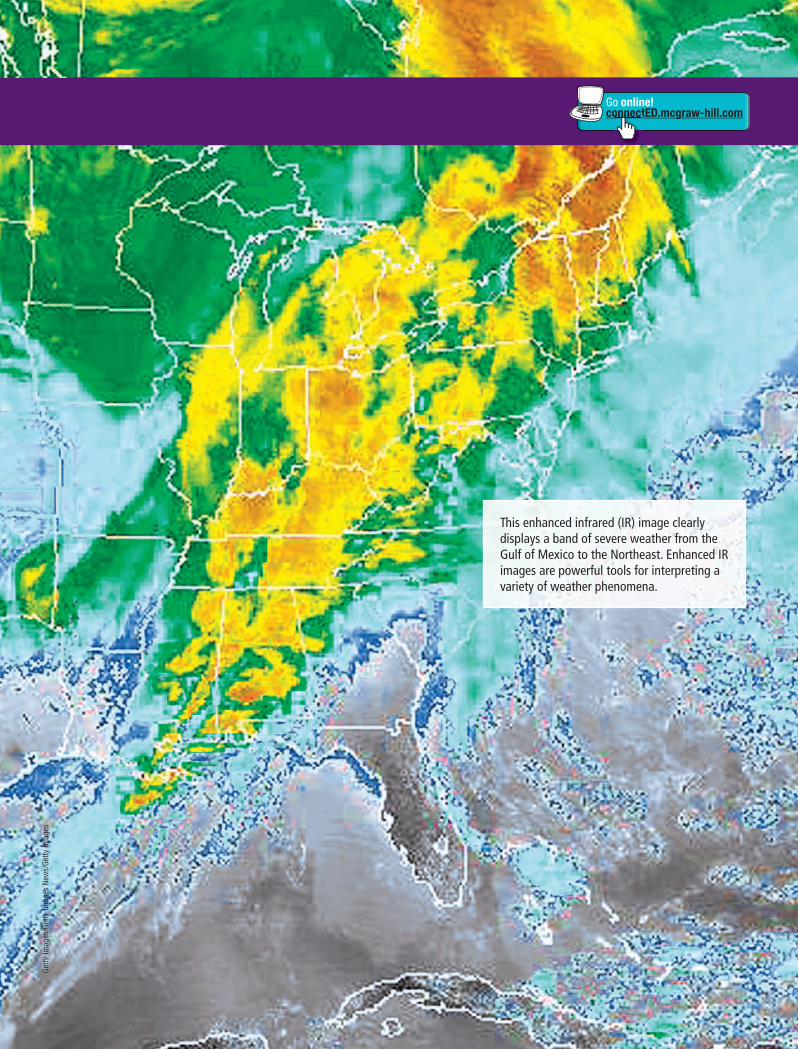
This enhanced infrared (IR) image clearly displays a band of severe weather from the Gulf of Mexico to the Northeast. Enhanced IR images are powerful tools for interpreting a variety of weather phenomena.
Go online!connectED.mcgraw-hill.comonnect
Getty
Imag
es/G
etty
Imag
es N
ews/
Getty
Imag
es
0312_0313_ESGEU_S_C12_CO_658713.indd 3130312_0313_ESGEU_S_C12_CO_658713.indd 313 2/24/11 12:12 PM2/24/11 12:12 PM
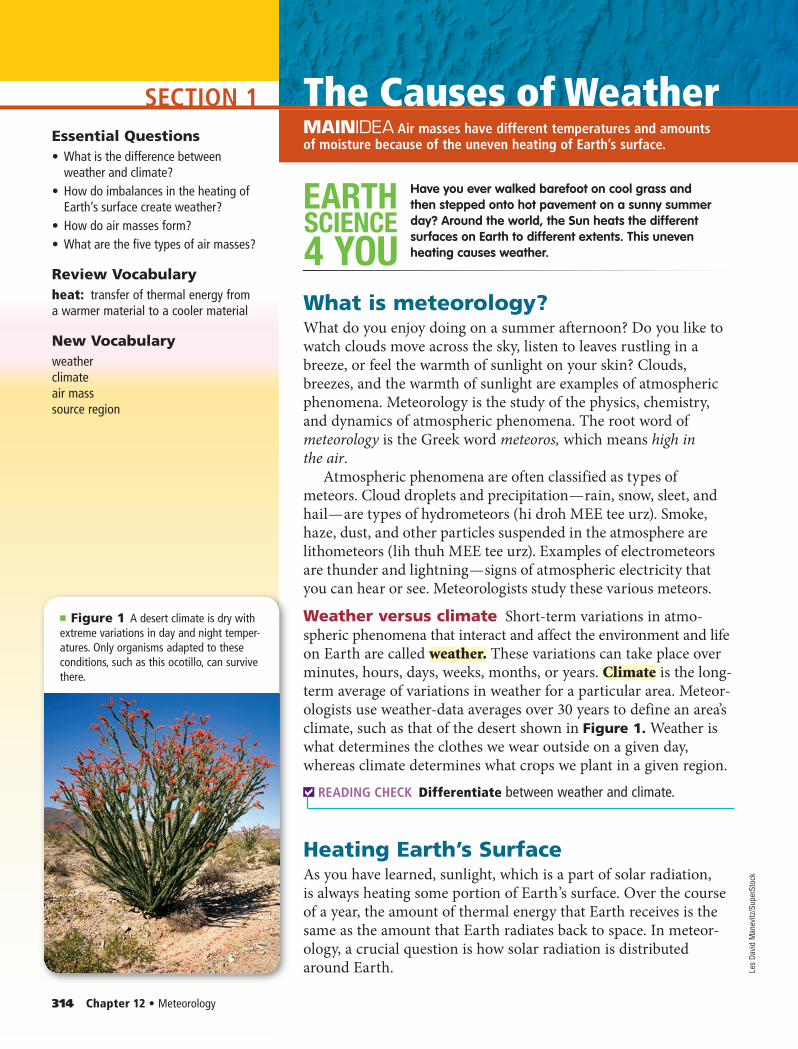
SECTION 1
■ Figure 1 A desert climate is dry with extreme variations in day and night temper-atures. Only organisms adapted to these conditions, such as this ocotillo, can survive there.
The Causes of WeatherMAINIDEA Air masses have different temperatures and amounts of moisture because of the uneven heating of Earth’s surface.
SCIENCE
4 YOU
EARTH Have you ever walked barefoot on cool grass and then stepped onto hot pavement on a sunny summer day? Around the world, the Sun heats the different surfaces on Earth to different extents. This uneven heating causes weather.
What is meteorology?What do you enjoy doing on a summer afternoon? Do you like to watch clouds move across the sky, listen to leaves rustling in a breeze, or feel the warmth of sunlight on your skin? Clouds, breezes, and the warmth of sunlight are examples of atmospheric phenomena. Meteorology is the study of the physics, chemistry, and dynamics of atmospheric phenomena. The root word of meteorology is the Greek word meteoros, which means high in the air.
Atmospheric phenomena are often classified as types of meteors. Cloud droplets and precipitation — rain, snow, sleet, and hail — are types of hydrometeors (hi droh MEE tee urz). Smoke, haze, dust, and other particles suspended in the atmosphere are lithometeors (lih thuh MEE tee urz). Examples of electrometeors are thunder and lightning — signs of atmospheric electricity that you can hear or see. Meteorologists study these various meteors.
Weather versus climate Short-term variations in atmo-spheric phenomena that interact and affect the environment and life on Earth are called weather. These variations can take place over minutes, hours, days, weeks, months, or years. Climate is the long-term average of variations in weather for a particular area. Meteor-ologists use weather-data averages over 30 years to define an area’s climate, such as that of the desert shown in Figure 1. Weather is what determines the clothes we wear outside on a given day, whereas climate determines what crops we plant in a given region.
READING CHECK Differentiate between weather and climate.
Heating Earth’s SurfaceAs you have learned, sunlight, which is a part of solar radiation, is always heating some portion of Earth’s surface. Over the course of a year, the amount of thermal energy that Earth receives is the same as the amount that Earth radiates back to space. In meteor-ology, a crucial question is how solar radiation is distributed around Earth.
Essential Questions• What is the difference between
weather and climate?• How do imbalances in the heating of
Earth’s surface create weather?• How do air masses form?• What are the five types of air masses?
Review Vocabularyheat: transfer of thermal energy from a warmer material to a cooler material
New Vocabularyweatherclimateair masssource region
314 Chapter 12 • Meteorology
Les
Davi
d M
anev
itz/S
uper
Stoc
k
0314_0317_ESGEU_S_C12_S1_658713.indd 3140314_0317_ESGEU_S_C12_S1_658713.indd 314 2/24/11 12:13 PM2/24/11 12:13 PM
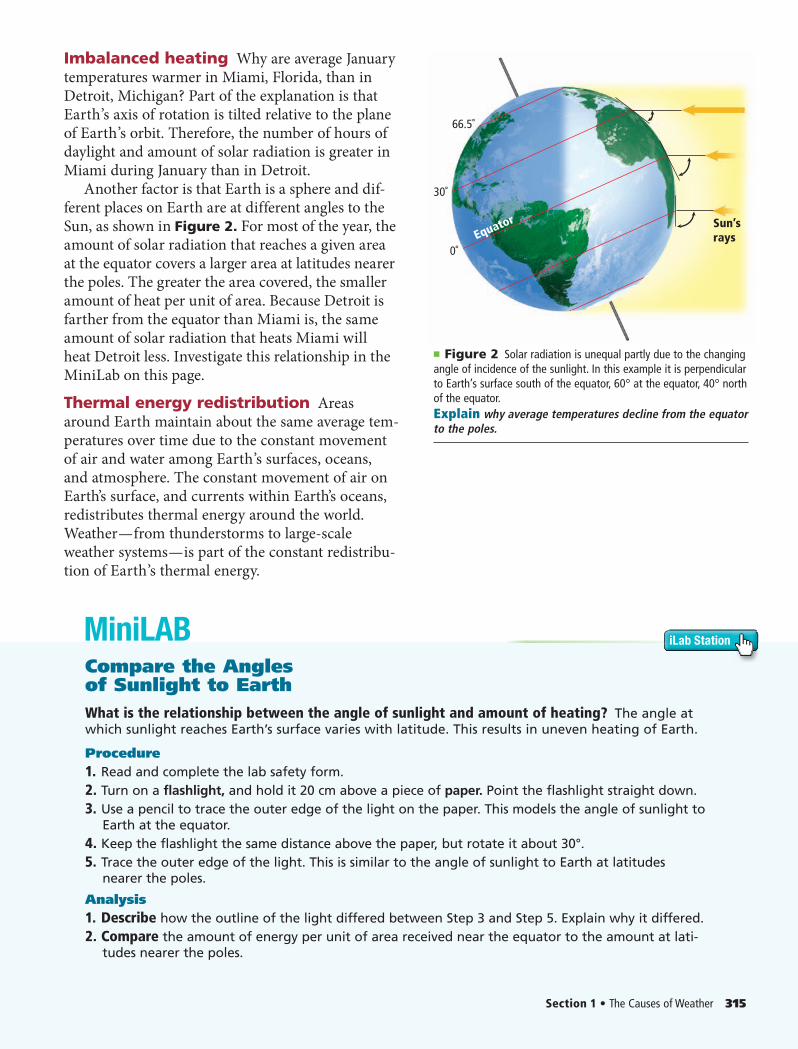
■ Figure 2 Solar radiation is unequal partly due to the changing angle of incidence of the sunlight. In this example it is perpendicular to Earth’s surface south of the equator, 60° at the equator, 40° north of the equator.Explain why average temperatures decline from the equator to the poles.
MiniLAB
Section 1 • The Causes of Weather 315
66.5˚
30˚
0˚
Sun’sraysEquator
Imbalanced heating Why are average January temperatures warmer in Miami, Florida, than in Detroit, Michigan? Part of the explanation is that Earth’s axis of rotation is tilted relative to the plane of Earth’s orbit. Therefore, the number of hours of daylight and amount of solar radiation is greater in Miami during January than in Detroit.
Another factor is that Earth is a sphere and dif-ferent places on Earth are at different angles to the Sun, as shown in Figure 2. For most of the year, the amount of solar radiation that reaches a given area at the equator covers a larger area at latitudes nearer the poles. The greater the area covered, the smaller amount of heat per unit of area. Because Detroit is farther from the equator than Miami is, the same amount of solar radiation that heats Miami will heat Detroit less. Investigate this relationship in the MiniLab on this page.
Thermal energy redistribution Areas around Earth maintain about the same average tem-peratures over time due to the constant movement of air and water among Earth’s surfaces, oceans, and atmosphere. The constant movement of air on Earth’s surface, and currents within Earth’s oceans, redistributes thermal energy around the world. Weather — from thunderstorms to large-scale weather systems — is part of the constant redistribu-tion of Earth’s thermal energy.
iLab Station
Compare the Angles of Sunlight to EarthWhat is the relationship between the angle of sunlight and amount of heating? The angle at which sunlight reaches Earth’s surface varies with latitude. This results in uneven heating of Earth.
Procedure 1. Read and complete the lab safety form.2. Turn on a flashlight, and hold it 20 cm above a piece of paper. Point the flashlight straight down.3. Use a pencil to trace the outer edge of the light on the paper. This models the angle of sunlight to
Earth at the equator.4. Keep the flashlight the same distance above the paper, but rotate it about 30°.5. Trace the outer edge of the light. This is similar to the angle of sunlight to Earth at latitudes
nearer the poles.
Analysis1. Describe how the outline of the light differed between Step 3 and Step 5. Explain why it differed.2. Compare the amount of energy per unit of area received near the equator to the amount at lati-
tudes nearer the poles.
0314_0317_ESGEU_S_C12_S1_658713.indd 3150314_0317_ESGEU_S_C12_S1_658713.indd 315 2/24/11 12:13 PM2/24/11 12:13 PM
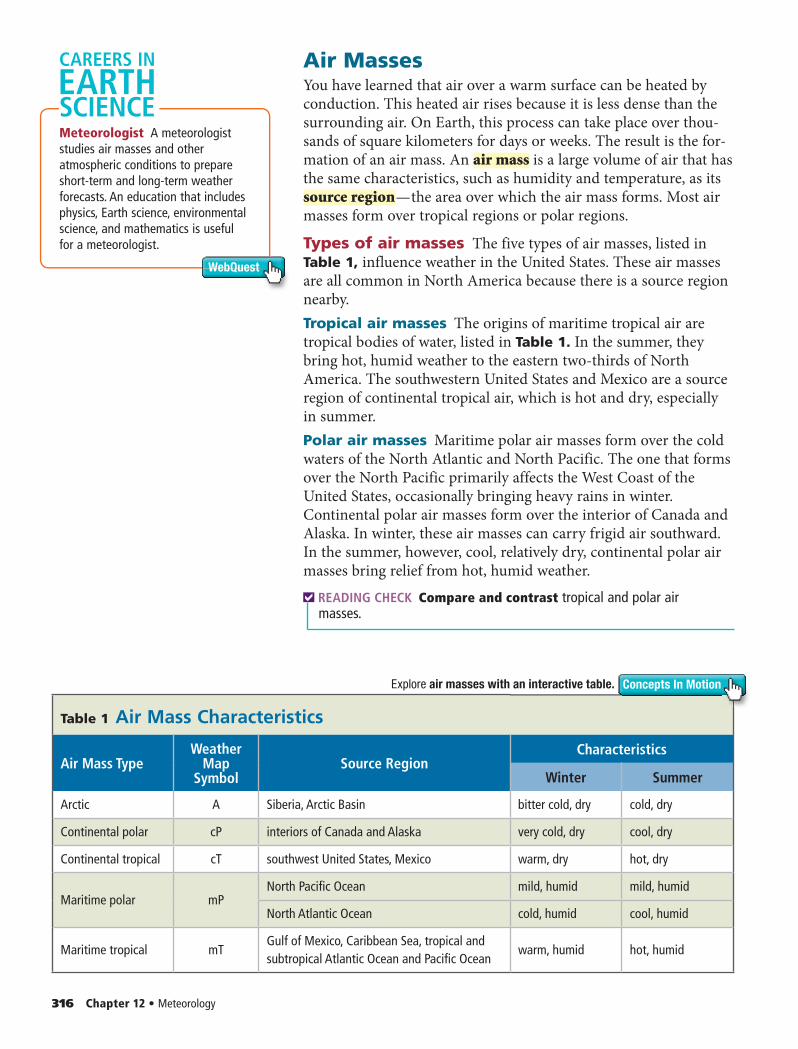
316 Chapter 12 • Meteorology
Air MassesYou have learned that air over a warm surface can be heated by conduction. This heated air rises because it is less dense than the surrounding air. On Earth, this process can take place over thou-sands of square kilometers for days or weeks. The result is the for-mation of an air mass. An air mass is a large volume of air that has the same characteristics, such as humidity and temperature, as its source region — the area over which the air mass forms. Most air masses form over tropical regions or polar regions.
Types of air masses The five types of air masses, listed in Table 1, influence weather in the United States. These air masses are all common in North America because there is a source region nearby.Tropical air masses The origins of maritime tropical air are tropical bodies of water, listed in Table 1. In the summer, they bring hot, humid weather to the eastern two-thirds of North America. The southwestern United States and Mexico are a source region of continental tropical air, which is hot and dry, especially in summer.Polar air masses Maritime polar air masses form over the cold waters of the North Atlantic and North Pacific. The one that forms over the North Pacific primarily affects the West Coast of the United States, occasionally bringing heavy rains in winter. Continental polar air masses form over the interior of Canada and Alaska. In winter, these air masses can carry frigid air southward. In the summer, however, cool, relatively dry, continental polar air masses bring relief from hot, humid weather.
READING CHECK Compare and contrast tropical and polar air masses.
Meteorologist A meteorologist studies air masses and other atmospheric conditions to prepare short-term and long-term weather forecasts. An education that includes physics, Earth science, environmental science, and mathematics is useful for a meteorologist.
WebQuest
CAREERS IN
SCIENCEEARTH
Table 1 Air Mass Characteristics
Air Mass TypeWeather
Map Symbol
Source RegionCharacteristics
Winter Summer
Arctic A Siberia, Arctic Basin bitter cold, dry cold, dry
Continental polar cP interiors of Canada and Alaska very cold, dry cool, dry
Continental tropical cT southwest United States, Mexico warm, dry hot, dry
Maritime polar mPNorth Pacific Ocean mild, humid mild, humid
North Atlantic Ocean cold, humid cool, humid
Maritime tropical mTGulf of Mexico, Caribbean Sea, tropical and subtropical Atlantic Ocean and Pacific Ocean
warm, humid hot, humid
Concepts In MotionExplore air masses with an interactive table.
0314_0317_ESGEU_S_C12_S1_658713.indd 3160314_0317_ESGEU_S_C12_S1_658713.indd 316 2/24/11 12:13 PM2/24/11 12:13 PM
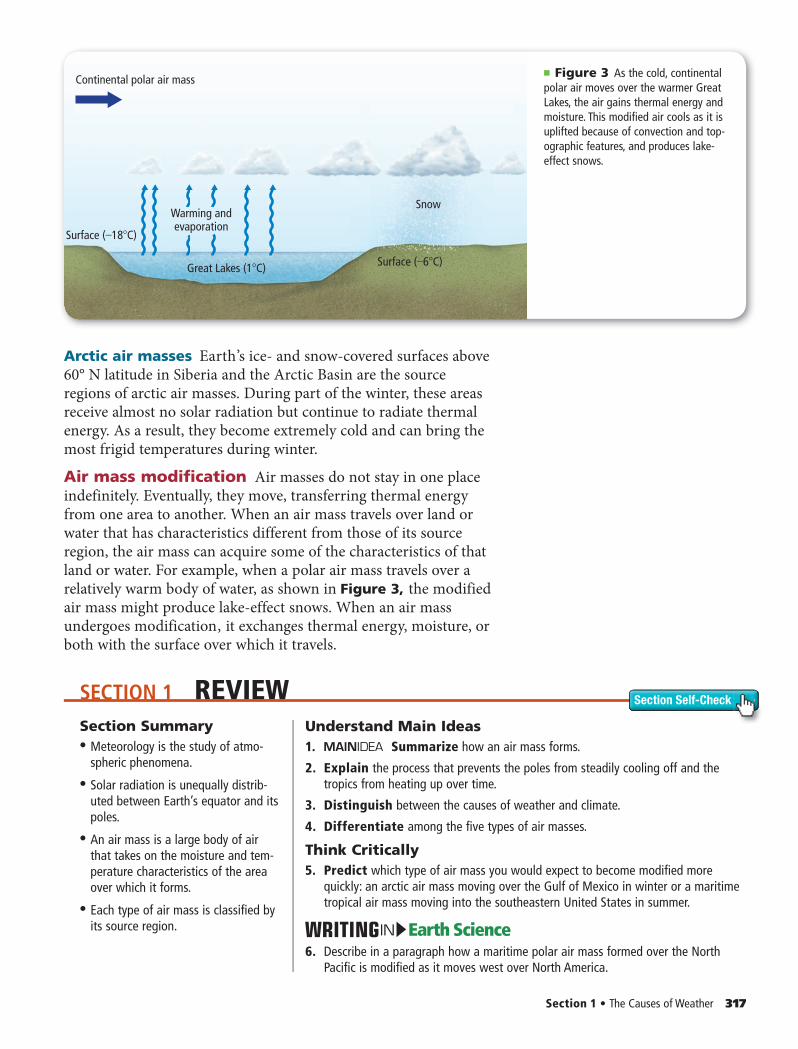
Surface ( 18 C)
Continental polar air mass
Great Lakes (1 C)
Warming andevaporation
Surface ( 6 C)
Snow
■ Figure 3 As the cold, continental polar air moves over the warmer Great Lakes, the air gains thermal energy and moisture. This modified air cools as it is uplifted because of convection and top-ographic features, and produces lake-effect snows.
SECTION 1 REVIEW Section Self-Check
Section 1 • The Causes of Weather 317
Arctic air masses Earth’s ice- and snow-covered surfaces above 60° N latitude in Siberia and the Arctic Basin are the source regions of arctic air masses. During part of the winter, these areas receive almost no solar radiation but continue to radiate thermal energy. As a result, they become extremely cold and can bring the most frigid temperatures during winter.
Air mass modification Air masses do not stay in one place indefinitely. Eventually, they move, transferring thermal energy from one area to another. When an air mass travels over land or water that has characteristics different from those of its source region, the air mass can acquire some of the characteristics of that land or water. For example, when a polar air mass travels over a relatively warm body of water, as shown in Figure 3, the modified air mass might produce lake-effect snows. When an air mass undergoes modification , it exchanges thermal energy, moisture, or both with the surface over which it travels.
Section Summary• • Meteorology is the study of atmo-
spheric phenomena.
• • Solar radiation is unequally distrib-uted between Earth’s equator and its poles.
• • An air mass is a large body of air that takes on the moisture and tem-perature characteristics of the area over which it forms.
• • Each type of air mass is classified by its source region.
Understand Main Ideas 1. Summarize how an air mass forms.
2. Explain the process that prevents the poles from steadily cooling off and the tropics from heating up over time.
3. Distinguish between the causes of weather and climate.
4. Differentiate among the five types of air masses.
Think Critically5. Predict which type of air mass you would expect to become modified more
quickly: an arctic air mass moving over the Gulf of Mexico in winter or a maritime tropical air mass moving into the southeastern United States in summer.
Earth ScienceIN6. Describe in a paragraph how a maritime polar air mass formed over the North
Pacific is modified as it moves west over North America.
0314_0317_ESGEU_S_C12_S1_658713.indd 3170314_0317_ESGEU_S_C12_S1_658713.indd 317 2/24/11 12:13 PM2/24/11 12:13 PM
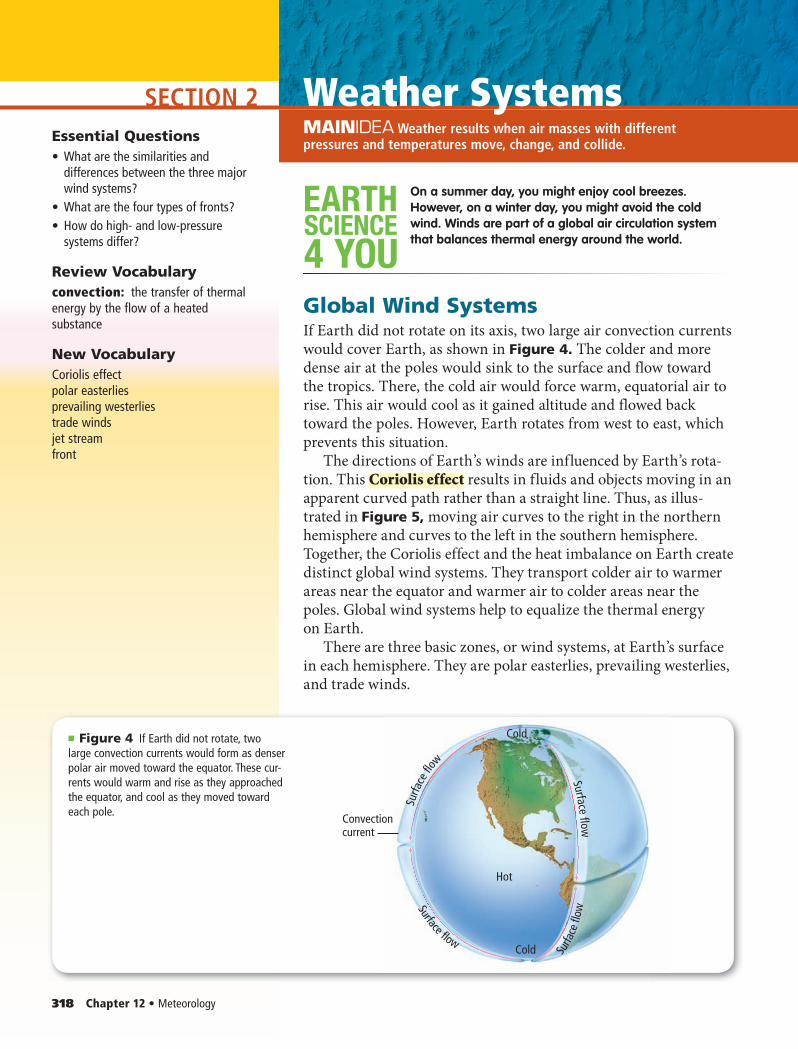
SECTION 2
Hot
Cold
Convectioncurrent
Cold
Surfa
ce fl
ow
Surface flow
Surfa
ce fl
ow
Surface flow
■ Figure 4 If Earth did not rotate, two large convection currents would form as denser polar air moved toward the equator. These cur-rents would warm and rise as they approached the equator, and cool as they moved toward each pole.
318 Chapter 12 • Meteorology
Weather SystemsMAINIDEA Weather results when air masses with different pressures and temperatures move, change, and collide.
SCIENCE
4 YOU
EARTH On a summer day, you might enjoy cool breezes. However, on a winter day, you might avoid the cold wind. Winds are part of a global air circulation system that balances thermal energy around the world.
Global Wind SystemsIf Earth did not rotate on its axis, two large air convection currents would cover Earth, as shown in Figure 4. The colder and more dense air at the poles would sink to the surface and flow toward the tropics. There, the cold air would force warm, equatorial air to rise. This air would cool as it gained altitude and flowed back toward the poles. However, Earth rotates from west to east, which prevents this situation.
The directions of Earth’s winds are influenced by Earth’s rota-tion. This Coriolis effect results in fluids and objects moving in an apparent curved path rather than a straight line. Thus, as illus-trated in Figure 5, moving air curves to the right in the northern hemisphere and curves to the left in the southern hemisphere. Together, the Coriolis effect and the heat imbalance on Earth create distinct global wind systems. They transport colder air to warmer areas near the equator and warmer air to colder areas near the poles. Global wind systems help to equalize the thermal energy on Earth.
There are three basic zones, or wind systems, at Earth’s surface in each hemisphere. They are polar easterlies, prevailing westerlies, and trade winds.
Essential Questions• What are the similarities and
differences between the three major wind systems?
• What are the four types of fronts?• How do high- and low-pressure
systems differ?
Review Vocabularyconvection: the transfer of thermal energy by the flow of a heated substance
New VocabularyCoriolis effectpolar easterliesprevailing westerliestrade windsjet streamfront
0318_0323_ESGEU_S_C12_S2_658713.indd 3180318_0323_ESGEU_S_C12_S2_658713.indd 318 2/24/11 12:13 PM2/24/11 12:13 PM
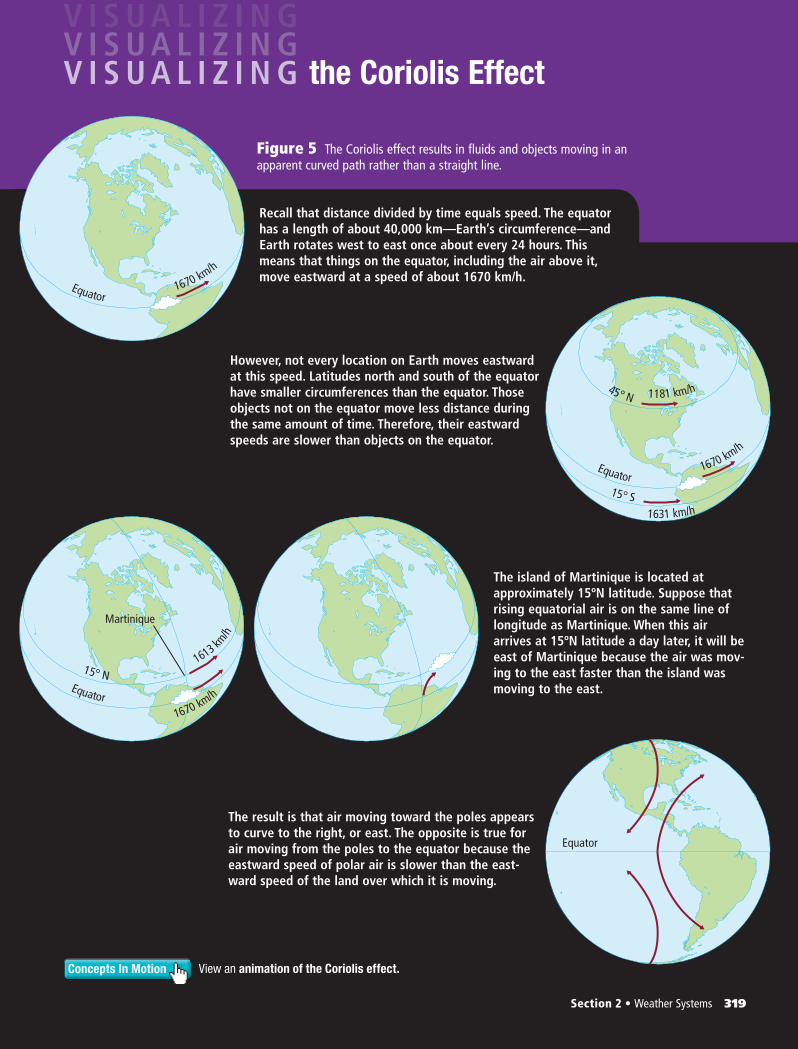
Equator1670 km/h
Martinique
1613 km/h
15° N
Equator1670 km/h
Equator1670 km/h
45° N
15° S1631 km/h
1181 km/h
Equator
Section 2 • Weather Systems 319
Concepts In Motion View an animation of the Coriolis effect.
the Coriolis Effect
Figure 5 The Coriolis effect results in fluids and objects moving in an apparent curved path rather than a straight line.
Recall that distance divided by time equals speed. The equator has a length of about 40,000 km—Earth’s circumference—and Earth rotates west to east once about every 24 hours. This means that things on the equator, including the air above it, move eastward at a speed of about 1670 km/h.
However, not every location on Earth moves eastward at this speed. Latitudes north and south of the equator have smaller circumferences than the equator. Those objects not on the equator move less distance during the same amount of time. Therefore, their eastward speeds are slower than objects on the equator.
The island of Martinique is located at approximately 15ºN latitude. Suppose that rising equatorial air is on the same line of longitude as Martinique. When this air arrives at 15ºN latitude a day later, it will be east of Martinique because the air was mov-ing to the east faster than the island was moving to the east.
The result is that air moving toward the poles appears to curve to the right, or east. The opposite is true for air moving from the poles to the equator because the eastward speed of polar air is slower than the east-ward speed of the land over which it is moving.
0318_0323_ESGEU_S_C12_S2_658713.indd 3190318_0323_ESGEU_S_C12_S2_658713.indd 319 2/24/11 12:13 PM2/24/11 12:13 PM
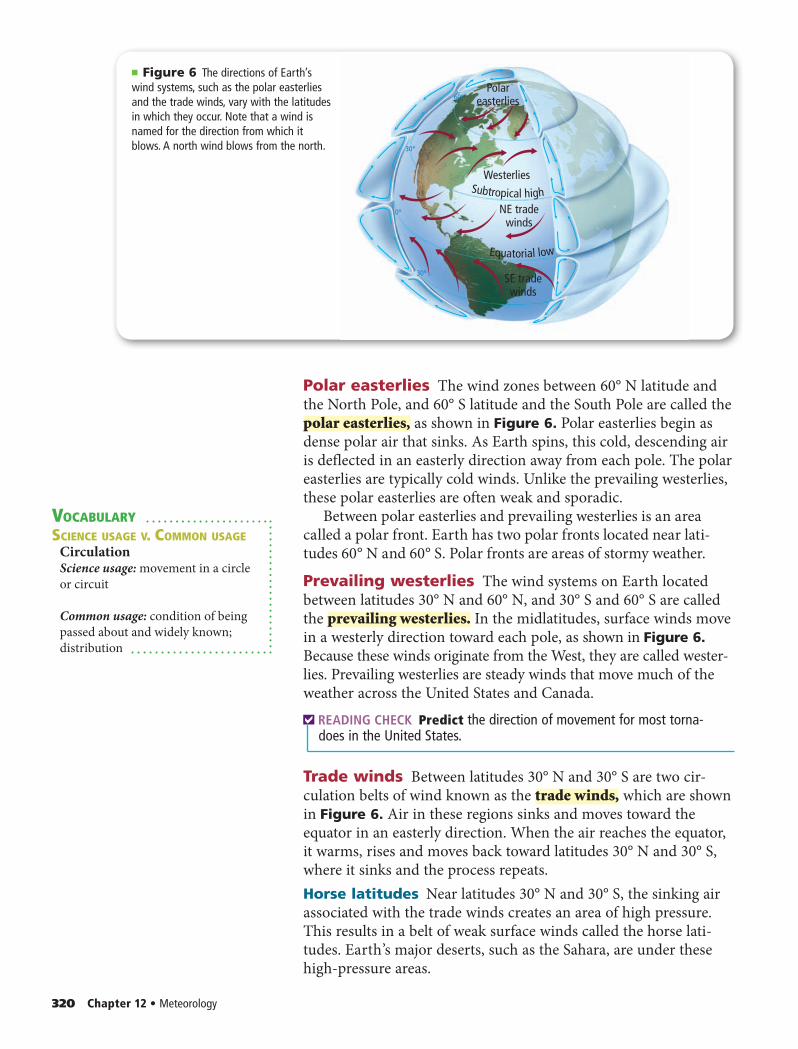
Westerlies
Polareasterlies
NE tradewinds
SE tradewinds
Equatorial low
Subtropical high
30°
60°
30°
0°
■ Figure 6 The directions of Earth’s wind systems, such as the polar easterlies and the trade winds, vary with the latitudes in which they occur. Note that a wind is named for the direction from which it blows. A north wind blows from the north.
320 Chapter 12 • Meteorology
Polar easterlies The wind zones between 60° N latitude and the North Pole, and 60° S latitude and the South Pole are called the polar easterlies, as shown in Figure 6. Polar easterlies begin as dense polar air that sinks. As Earth spins, this cold, descending air is deflected in an easterly direction away from each pole. The polar easterlies are typically cold winds. Unlike the prevailing westerlies, these polar easterlies are often weak and sporadic.
Between polar easterlies and prevailing westerlies is an area called a polar front. Earth has two polar fronts located near lati-tudes 60° N and 60° S. Polar fronts are areas of stormy weather.
Prevailing westerlies The wind systems on Earth located between latitudes 30° N and 60° N, and 30° S and 60° S are called the prevailing westerlies. In the midlatitudes, surface winds move in a westerly direction toward each pole, as shown in Figure 6.Because these winds originate from the West, they are called wester-lies. Prevailing westerlies are steady winds that move much of the weather across the United States and Canada.
READING CHECK Predict the direction of movement for most torna-does in the United States.
Trade winds Between latitudes 30° N and 30° S are two cir-culation belts of wind known as the trade winds, which are shown in Figure 6. Air in these regions sinks and moves toward the equator in an easterly direction. When the air reaches the equator, it warms, rises and moves back toward latitudes 30° N and 30° S, where it sinks and the process repeats.Horse latitudes Near latitudes 30° N and 30° S, the sinking air associated with the trade winds creates an area of high pressure. This results in a belt of weak surface winds called the horse lati-tudes. Earth’s major deserts, such as the Sahara, are under these high-pressure areas.
VOCABULARYSCIENCE USAGE V. COMMON USAGE
CirculationScience usage: movement in a circle or circuit
Common usage: condition of being passed about and widely known; distribution
0318_0323_ESGEU_S_C12_S2_658713.indd 3200318_0323_ESGEU_S_C12_S2_658713.indd 320 2/24/11 12:13 PM2/24/11 12:13 PM
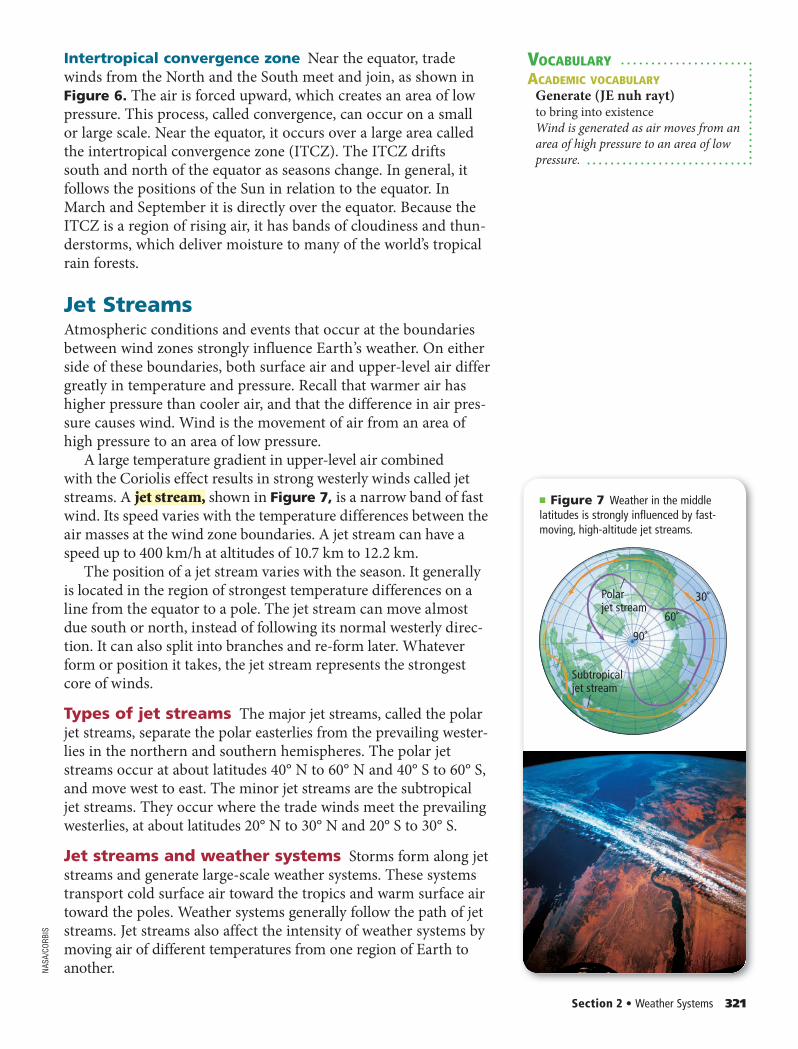
■ Figure 7 Weather in the middle latitudes is strongly influenced by fast-moving, high-altitude jet streams.
VOCABULARYACADEMIC VOCABULARY
Generate (JE nuh rayt)to bring into existenceWind is generated as air moves from an area of high pressure to an area of low pressure.
Subtropicaljet stream
Polarjet stream
90˚
60˚
30˚
Section 2 • Weather Systems 321
Intertropical convergence zone Near the equator, trade winds from the North and the South meet and join, as shown in Figure 6. The air is forced upward, which creates an area of low pressure. This process, called convergence, can occur on a small or large scale. Near the equator, it occurs over a large area called the intertropical convergence zone (ITCZ). The ITCZ drifts south and north of the equator as seasons change. In general, it follows the positions of the Sun in relation to the equator. In March and September it is directly over the equator. Because the ITCZ is a region of rising air, it has bands of cloudiness and thun-derstorms, which deliver moisture to many of the world’s tropical rain forests.
Jet StreamsAtmospheric conditions and events that occur at the boundaries between wind zones strongly influence Earth’s weather. On either side of these boundaries, both surface air and upper-level air differ greatly in temperature and pressure. Recall that warmer air has higher pressure than cooler air, and that the difference in air pres-sure causes wind. Wind is the movement of air from an area of high pressure to an area of low pressure.
A large temperature gradient in upper-level air combined with the Coriolis effect results in strong westerly winds called jet streams. A jet stream, shown in Figure 7, is a narrow band of fast wind. Its speed varies with the temperature differences between the air masses at the wind zone boundaries. A jet stream can have a speed up to 400 km/h at altitudes of 10.7 km to 12.2 km.
The position of a jet stream varies with the season. It generally is located in the region of strongest temperature differences on a line from the equator to a pole. The jet stream can move almost due south or north, instead of following its normal westerly direc-tion. It can also split into branches and re-form later. Whatever form or position it takes, the jet stream represents the strongest core of winds.
Types of jet streams The major jet streams, called the polar jet streams, separate the polar easterlies from the prevailing wester-lies in the northern and southern hemispheres. The polar jet streams occur at about latitudes 40° N to 60° N and 40° S to 60° S, and move west to east. The minor jet streams are the subtropical jet streams. They occur where the trade winds meet the prevailing westerlies, at about latitudes 20° N to 30° N and 20° S to 30° S.
Jet streams and weather systems Storms form along jet streams and generate large-scale weather systems. These systems transport cold surface air toward the tropics and warm surface air toward the poles. Weather systems generally follow the path of jet streams. Jet streams also affect the intensity of weather systems by moving air of different temperatures from one region of Earth to another.NA
SA/C
ORBI
S
0318_0323_ESGEU_S_C12_S2_658713.indd 3210318_0323_ESGEU_S_C12_S2_658713.indd 321 2/24/11 12:13 PM2/24/11 12:13 PM
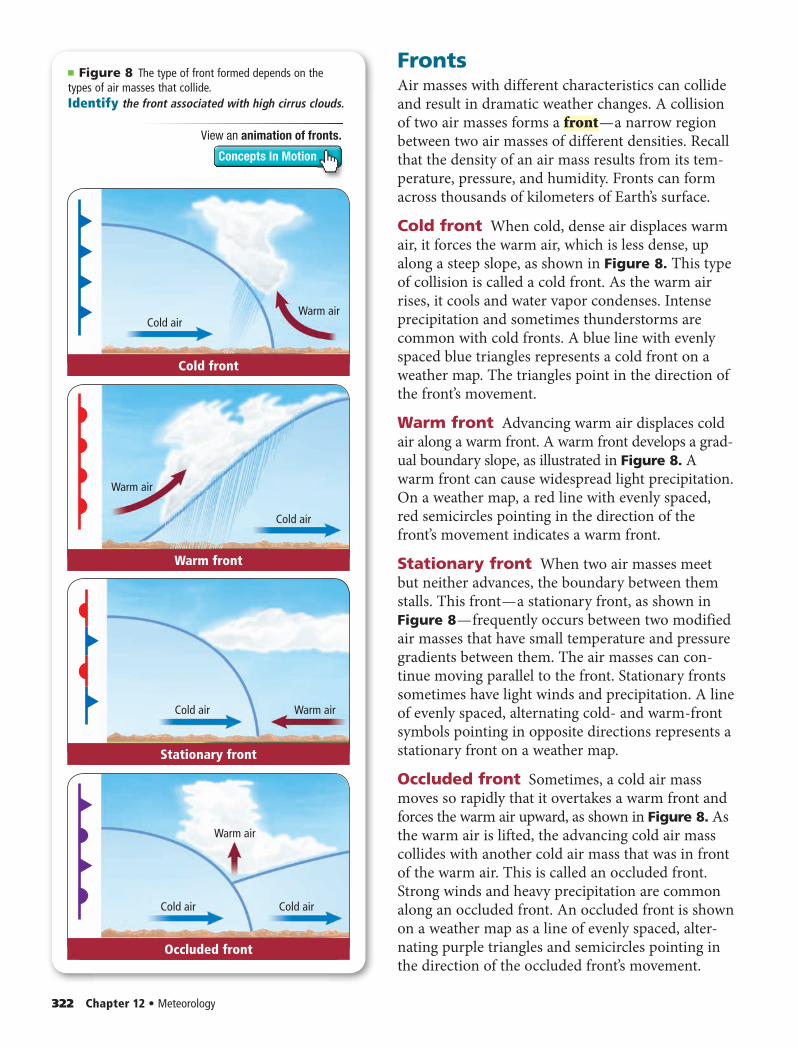
■ Figure 8 The type of front formed depends on the types of air masses that collide.Identify the front associated with high cirrus clouds.
322 Chapter 12 • Meteorology
FrontsAir masses with different characteristics can collide and result in dramatic weather changes. A collision of two air masses forms a front — a narrow region between two air masses of different densities. Recall that the density of an air mass results from its tem-perature, pressure, and humidity. Fronts can form across thousands of kilometers of Earth’s surface.
Cold front When cold, dense air displaces warm air, it forces the warm air, which is less dense, up along a steep slope, as shown in Figure 8. This type of collision is called a cold front. As the warm air rises, it cools and water vapor condenses. Intense precipitation and sometimes thunderstorms are common with cold fronts. A blue line with evenly spaced blue triangles represents a cold front on a weather map. The triangles point in the direction of the front’s movement.
Warm front Advancing warm air displaces cold air along a warm front. A warm front develops a grad-ual boundary slope, as illustrated in Figure 8. A warm front can cause widespread light precipitation. On a weather map, a red line with evenly spaced, red semicircles pointing in the direction of the front’s movement indicates a warm front.
Stationary front When two air masses meet but neither advances, the boundary between them stalls. This front — a stationary front, as shown in Figure 8 — frequently occurs between two modified air masses that have small temperature and pressure gradients between them. The air masses can con-tinue moving parallel to the front. Stationary fronts sometimes have light winds and precipitation. A line of evenly spaced, alternating cold- and warm-front symbols pointing in opposite directions represents a stationary front on a weather map.
Occluded front Sometimes, a cold air mass moves so rapidly that it overtakes a warm front and forces the warm air upward, as shown in Figure 8. As the warm air is lifted, the advancing cold air mass collides with another cold air mass that was in front of the warm air. This is called an occluded front. Strong winds and heavy precipitation are common along an occluded front. An occluded front is shown on a weather map as a line of evenly spaced, alter-nating purple triangles and semicircles pointing in the direction of the occluded front’s movement.
Cold airWarm air
Cold front
Cold air
Warm air
Warm front
Cold air Warm air
Stationary front
Cold air Cold air
Warm air
Occluded front
View an animation of fronts.
Concepts In Motion
0318_0323_ESGEU_S_C12_S2_658713.indd 3220318_0323_ESGEU_S_C12_S2_658713.indd 322 2/24/11 12:14 PM2/24/11 12:14 PM
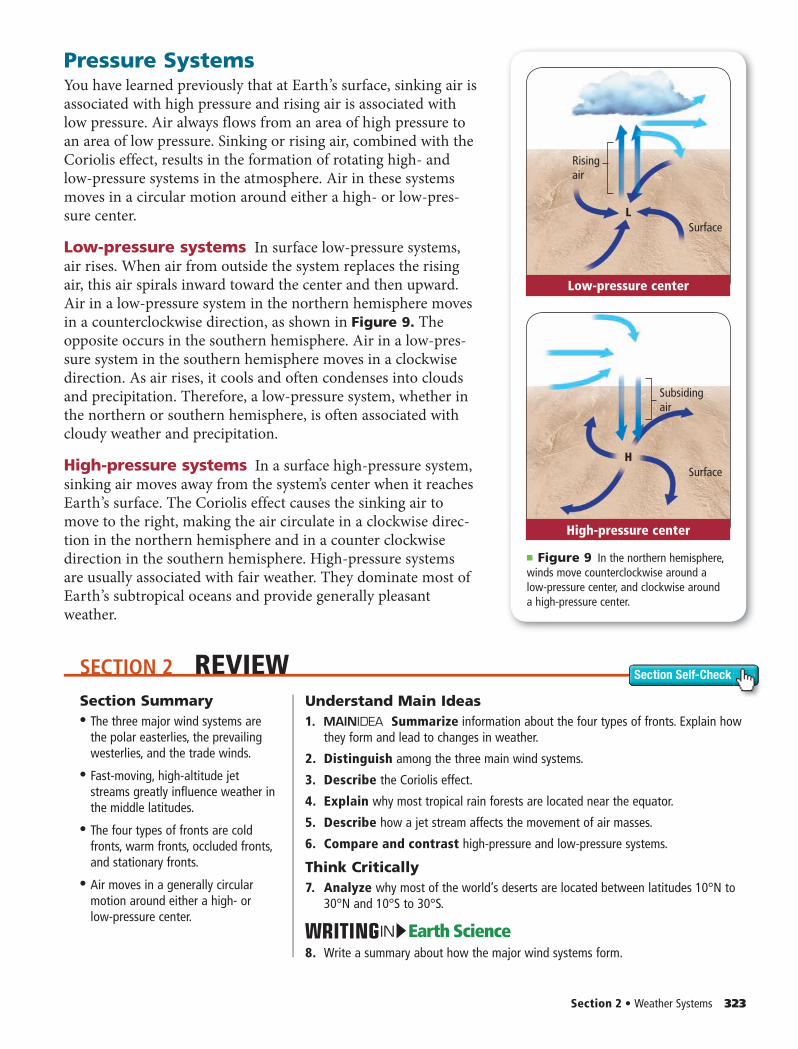
LSurface
Risingair
■ Figure 9 In the northern hemisphere, winds move counterclockwise around a low-pressure center, and clockwise around a high-pressure center.
HSurface
Subsidingair
Low-pressure center
High-pressure center
SECTION 2 REVIEW Section Self-Check
Section 2 • Weather Systems 323
Pressure SystemsYou have learned previously that at Earth’s surface, sinking air is associated with high pressure and rising air is associated with low pressure. Air always flows from an area of high pressure to an area of low pressure. Sinking or rising air, combined with the Coriolis effect, results in the formation of rotating high- and low-pressure systems in the atmosphere. Air in these systems moves in a circular motion around either a high- or low-pres-sure center.
Low-pressure systems In surface low-pressure systems, air rises. When air from outside the system replaces the rising air, this air spirals inward toward the center and then upward. Air in a low-pressure system in the northern hemisphere moves in a counterclockwise direction, as shown in Figure 9. The opposite occurs in the southern hemisphere. Air in a low-pres-sure system in the southern hemisphere moves in a clockwise direction. As air rises, it cools and often condenses into clouds and precipitation. Therefore, a low-pressure system, whether in the northern or southern hemisphere, is often associated with cloudy weather and precipitation.
High-pressure systems In a surface high-pressure system, sinking air moves away from the system’s center when it reaches Earth’s surface. The Coriolis effect causes the sinking air to move to the right, making the air circulate in a clockwise direc-tion in the northern hemisphere and in a counter clockwise direction in the southern hemisphere. High-pressure systems are usually associated with fair weather. They dominate most of Earth’s subtropical oceans and provide generally pleasant weather.
Section Summary• • The three major wind systems are
the polar easterlies, the prevailing westerlies, and the trade winds.
• • Fast-moving, high-altitude jet streams greatly influence weather in the middle latitudes.
• • The four types of fronts are cold fronts, warm fronts, occluded fronts, and stationary fronts.
• • Air moves in a generally circular motion around either a high- or low-pressure center.
Understand Main Ideas1. Summarize information about the four types of fronts. Explain how
they form and lead to changes in weather.
2. Distinguish among the three main wind systems.
3. Describe the Coriolis effect.
4. Explain why most tropical rain forests are located near the equator.
5. Describe how a jet stream affects the movement of air masses.
6. Compare and contrast high-pressure and low-pressure systems.
Think Critically7. Analyze why most of the world’s deserts are located between latitudes 10°N to
30°N and 10°S to 30°S.
Earth ScienceIN8. Write a summary about how the major wind systems form.
0318_0323_ESGEU_S_C12_S2_658713.indd 3230318_0323_ESGEU_S_C12_S2_658713.indd 323 2/24/11 12:14 PM2/24/11 12:14 PM
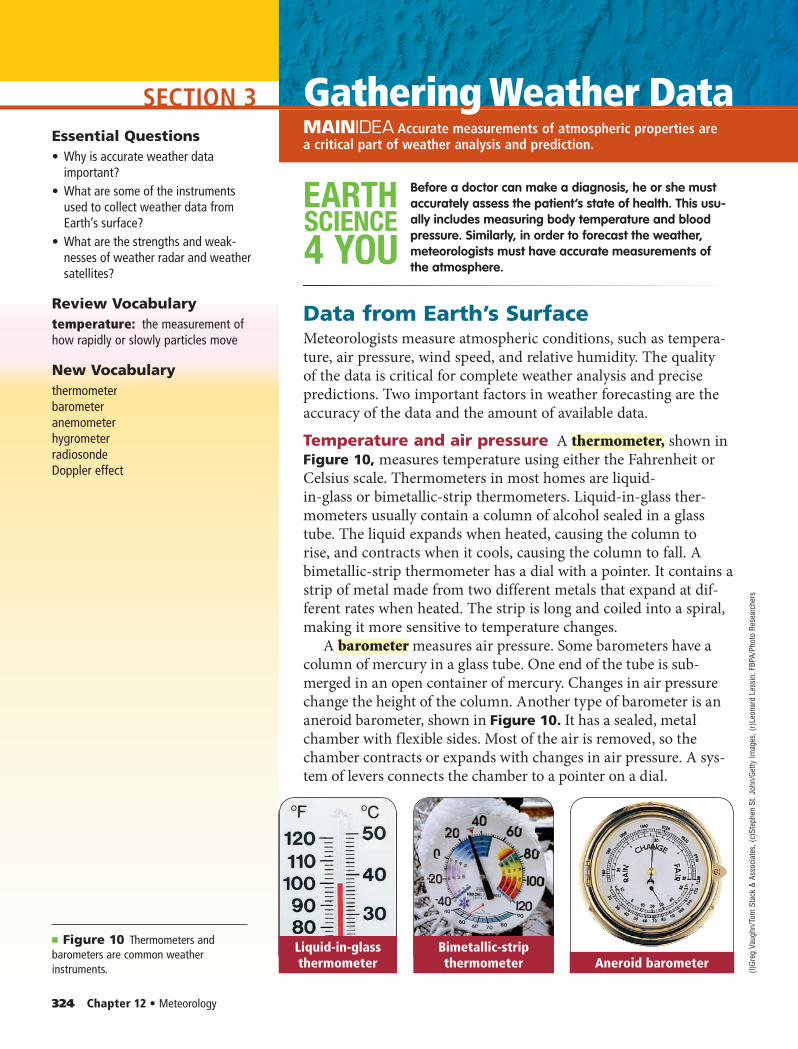
SECTION 3
324 Chapter 12 • Meteorology
Gathering Weather DataMAINIDEA Accurate measurements of atmospheric properties are a critical part of weather analysis and prediction.
SCIENCE
4 YOU
EARTH Before a doctor can make a diagnosis, he or she must accurately assess the patient’s state of health. This usu-ally includes measuring body temperature and blood pressure. Similarly, in order to forecast the weather, meteorologists must have accurate measurements of the atmosphere.
Data from Earth’s SurfaceMeteorologists measure atmospheric conditions, such as tempera-ture, air pressure, wind speed, and relative humidity. The quality of the data is critical for complete weather analysis and precise predictions. Two important factors in weather forecasting are the accuracy of the data and the amount of available data.
Temperature and air pressure A thermometer, shown in Figure 10, measures temperature using either the Fahr en heit or Celsius scale. Thermometers in most homes are liquid-in-glass or bimetallic-strip thermometers. Liquid-in-glass ther-mom eters usually contain a column of alcohol sealed in a glass tube. The liquid expands when heated, causing the column to rise, and contracts when it cools, causing the column to fall. A bimetallic-strip thermometer has a dial with a pointer. It contains a strip of metal made from two different metals that expand at dif-ferent rates when heated. The strip is long and coiled into a spiral, making it more sensitive to temperature changes.
A barometer measures air pressure. Some barometers have a column of mercury in a glass tube. One end of the tube is sub-merged in an open container of mercury. Changes in air pressure change the height of the column. Another type of barometer is an aneroid barometer, shown in Figure 10. It has a sealed, metal chamber with flexible sides. Most of the air is removed, so the chamber contracts or expands with changes in air pressure. A sys-tem of levers connects the chamber to a pointer on a dial.
Essential Questions• Why is accurate weather data
important?• What are some of the instruments
used to collect weather data from Earth’s surface?
• What are the strengths and weak-nesses of weather radar and weather satellites?
Review Vocabularytemperature: the measurement of how rapidly or slowly particles move
New VocabularythermometerbarometeranemometerhygrometerradiosondeDoppler effect
Bimetallic-strip thermometer
Liquid-in-glass thermometer Aneroid barometer
■ Figure 10 Thermometers and barometers are common weather instruments. (l)
Greg
Vau
ghn/
Tom
Sta
ck &
Ass
ocia
tes ,
(c)S
teph
en S
t. Jo
hn/G
etty
Imag
es , (
r)Le
onar
d Le
ssin
, FBP
A/Ph
oto
Rese
arch
ers
0324_0328_ESGEU_S_C12_S3_658713.indd 3240324_0328_ESGEU_S_C12_S3_658713.indd 324 2/24/11 12:14 PM2/24/11 12:14 PM
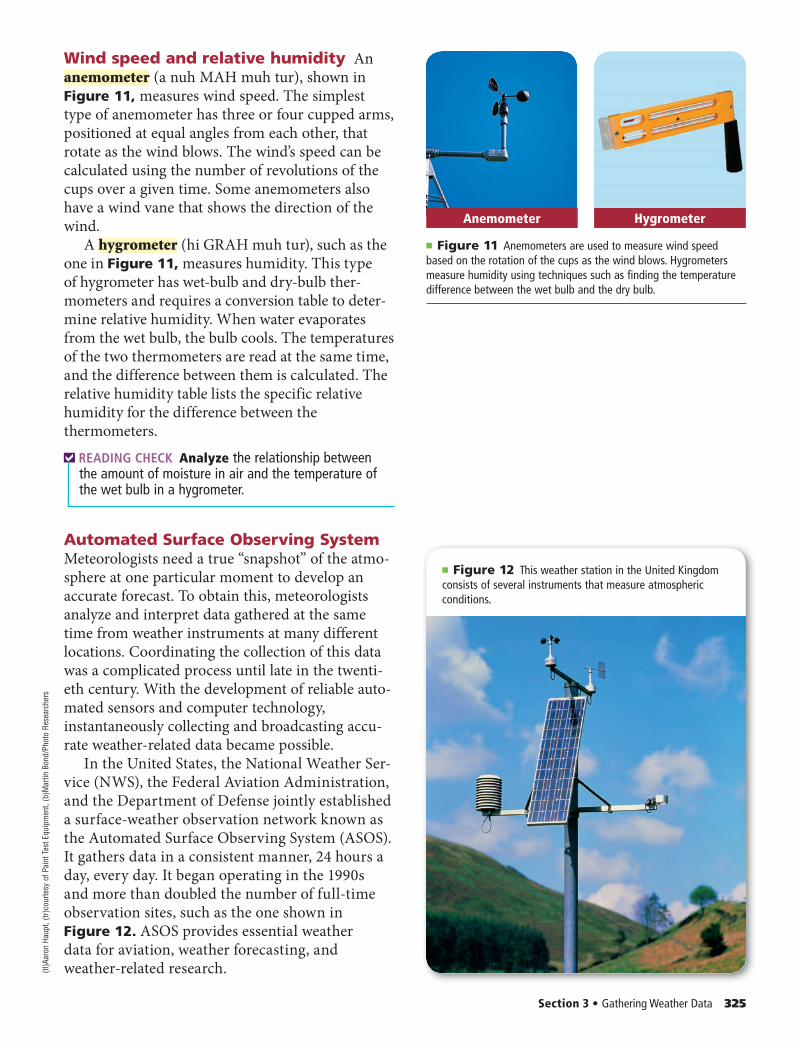
Section 3 • Gathering Weather Data 325
Wind speed and relative humidity An anemometer (a nuh MAH muh tur), shown in Figure 11, measures wind speed. The simplest type of anemometer has three or four cupped arms, positioned at equal angles from each other, that rotate as the wind blows. The wind’s speed can be calculated using the number of revolutions of the cups over a given time. Some anemometers also have a wind vane that shows the direction of the wind.
A hygrometer (hi GRAH muh tur), such as the one in Figure 11, measures humidity. This type of hygrometer has wet-bulb and dry-bulb ther-mometers and requires a conversion table to deter-mine relative humidity. When water evaporates from the wet bulb, the bulb cools. The temperatures of the two thermometers are read at the same time, and the difference between them is calculated. The relative humidity table lists the specific relative humidity for the difference between the thermometers.
READING CHECK Analyze the relationship between the amount of moisture in air and the temperature of the wet bulb in a hygrometer.
Automated Surface Observing System Meteorologists need a true “snapshot” of the atmo-sphere at one particular moment to develop an accurate forecast. To obtain this, meteorologists analyze and interpret data gathered at the same time from weather instruments at many different locations. Coordinating the collection of this data was a complicated process until late in the twenti-eth century. With the development of reliable auto-mated sensors and computer technology, instantaneously collecting and broadcasting accu-rate weather-related data became possible.
In the United States, the National Weather Ser-vice (NWS), the Federal Aviation Administration, and the Department of Defense jointly established a surface-weather observation network known as the Automated Surface Observing System (ASOS). It gathers data in a consistent manner, 24 hours a day, every day. It began operating in the 1990s and more than doubled the number of full-time observation sites, such as the one shown in Figure 12. ASOS provides essential weather data for aviation, weather forecasting, and weather-related research.
■ Figure 12 This weather station in the United Kingdom consists of several instruments that measure atmospheric conditions.
Anemometer
■ Figure 11 Anemometers are used to measure wind speed based on the rotation of the cups as the wind blows. Hygrometers measure humidity using techniques such as finding the temperature difference between the wet bulb and the dry bulb.
Hygrometer
(tl)A
aron
Hau
pt, (
tr)co
urte
sy o
f Pai
nt T
est E
quip
men
t, (b
)Mar
tin B
ond/
Phot
o Re
sear
cher
s
0324_0328_ESGEU_S_C12_S3_658713.indd 3250324_0328_ESGEU_S_C12_S3_658713.indd 325 2/24/11 12:14 PM2/24/11 12:14 PM
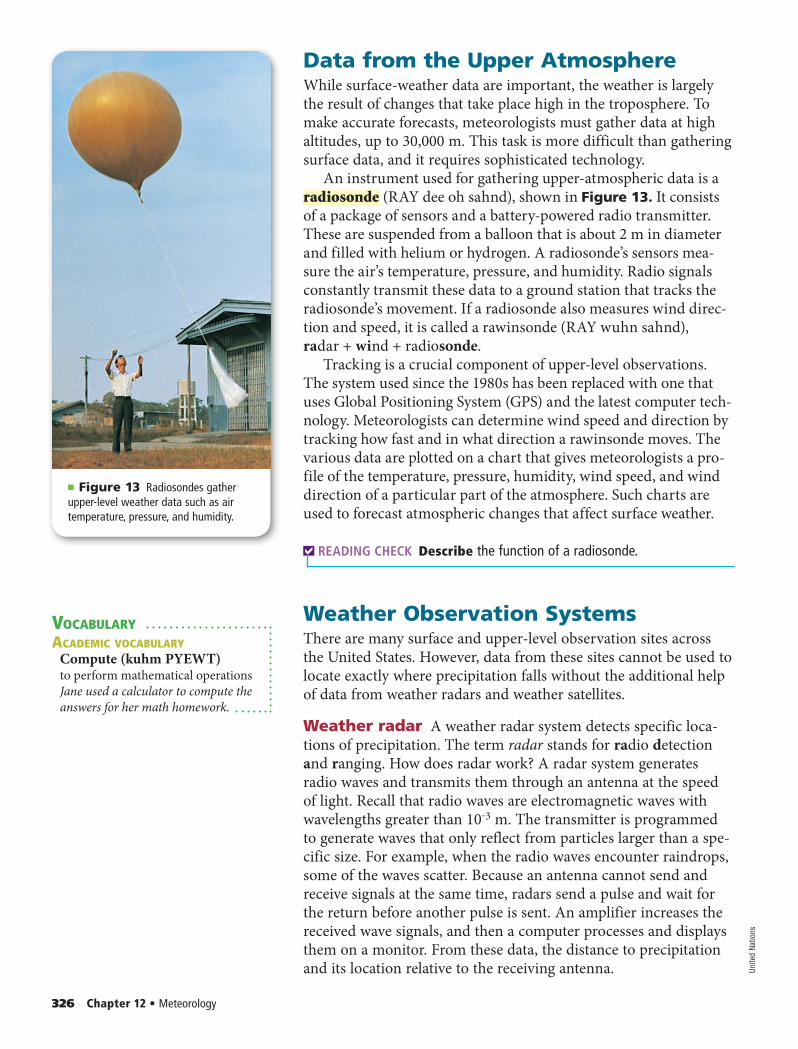
326 Chapter 12 • Meteorology
Data from the Upper AtmosphereWhile surface-weather data are important, the weather is largely the result of changes that take place high in the troposphere. To make accurate forecasts, meteorologists must gather data at high altitudes, up to 30,000 m. This task is more difficult than gathering surface data, and it requires sophisticated technology.
An instrument used for gathering upper-atmospheric data is a radiosonde (RAY dee oh sahnd), shown in Figure 13. It consists of a package of sensors and a battery-powered radio transmitter. These are suspended from a balloon that is about 2 m in diameter and filled with helium or hydrogen. A radiosonde’s sensors mea-sure the air’s temperature, pressure, and humidity. Radio signals constantly transmit these data to a ground station that tracks the radiosonde’s movement. If a radiosonde also measures wind direc-tion and speed, it is called a rawinsonde (RAY wuhn sahnd), radar + wind + radiosonde.
Tracking is a crucial component of upper-level observations. The system used since the 1980s has been replaced with one that uses Global Positioning System (GPS) and the latest computer tech-nology. Meteorologists can determine wind speed and direction by tracking how fast and in what direction a rawinsonde moves. The various data are plotted on a chart that gives meteorologists a pro-file of the temperature, pressure, humidity, wind speed, and wind direction of a particular part of the atmosphere. Such charts are used to forecast atmospheric changes that affect surface weather.
READING CHECK Describe the function of a radiosonde.
Weather Observation SystemsThere are many surface and upper-level observation sites across the United States. However, data from these sites cannot be used to locate exactly where precipitation falls without the additional help of data from weather radars and weather satellites.
Weather radar A weather radar system detects specific loca-tions of precipitation. The term radar stands for radio detection and ranging. How does radar work? A radar system generates radio waves and transmits them through an antenna at the speed of light. Recall that radio waves are electromagnetic waves with wavelengths greater than 10‒3 m. The transmitter is programmed to generate waves that only reflect from particles larger than a spe-cific size. For example, when the radio waves encounter raindrops, some of the waves scatter. Because an antenna cannot send and receive signals at the same time, radars send a pulse and wait for the return before another pulse is sent. An amplifier increases the received wave signals, and then a computer processes and displays them on a monitor. From these data, the distance to precipitation and its location relative to the receiving antenna.
■ Figure 13 Radiosondes gather upper-level weather data such as air temperature, pressure, and humidity.
VOCABULARYACADEMIC VOCABULARY
Compute (kuhm PYEWT)to perform mathematical operationsJane used a calculator to compute the answers for her math homework.
Unite
d Na
tions
0324_0328_ESGEU_S_C12_S3_658713.indd 3260324_0328_ESGEU_S_C12_S3_658713.indd 326 2/24/11 12:14 PM2/24/11 12:14 PM
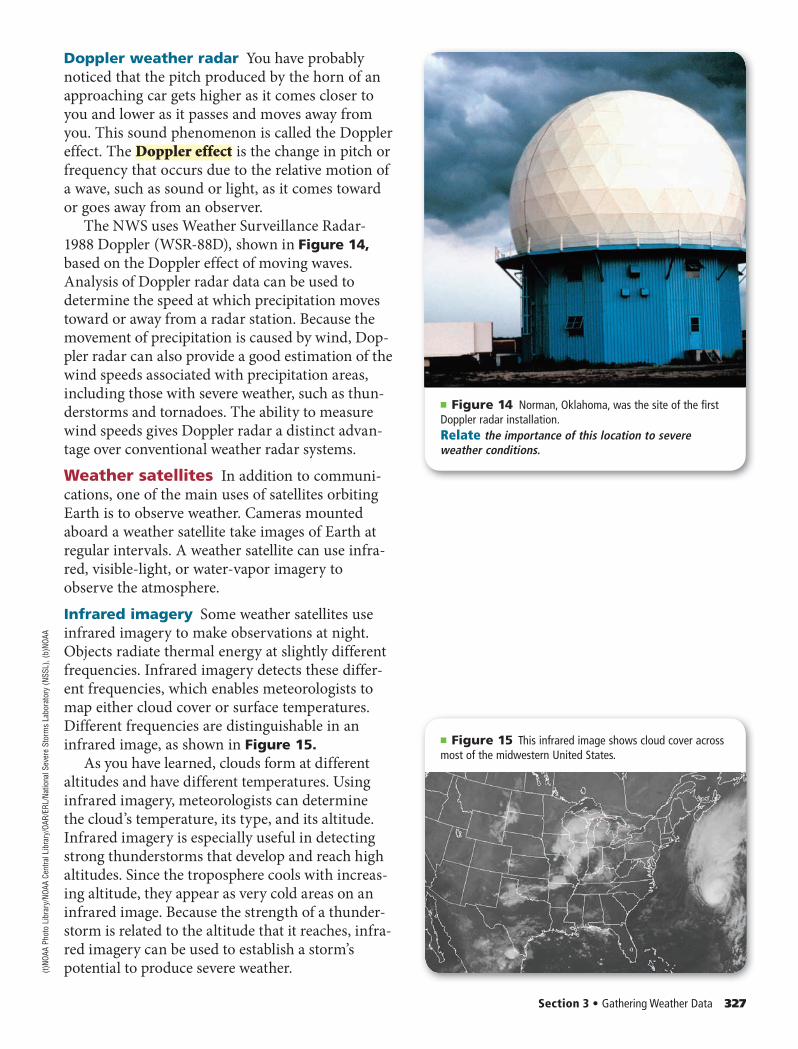
Section 3 • Gathering Weather Data 327
Doppler weather radar You have probably noticed that the pitch produced by the horn of an approaching car gets higher as it comes closer to you and lower as it passes and moves away from you. This sound phenomenon is called the Doppler effect. The Doppler effect is the change in pitch or frequency that occurs due to the relative motion of a wave, such as sound or light, as it comes toward or goes away from an observer.
The NWS uses Weather Surveillance Radar-1988 Doppler (WSR-88D), shown in Figure 14, based on the Doppler effect of moving waves. Analysis of Doppler radar data can be used to determine the speed at which precipitation moves toward or away from a radar station. Because the movement of precipitation is caused by wind, Dop-pler radar can also provide a good estimation of the wind speeds associated with precipitation areas, including those with severe weather, such as thun-derstorms and tornadoes. The ability to measure wind speeds gives Doppler radar a distinct advan-tage over conventional weather radar systems.Weather satellites In addition to communi-cations, one of the main uses of satellites orbiting Earth is to observe weather. Cameras mounted aboard a weather satellite take images of Earth at regular intervals. A weather satellite can use infra-red, visible-light, or water-vapor imagery to observe the atmosphere.Infrared imagery Some weather satellites use infrared imagery to make observations at night. Objects radiate thermal energy at slightly different frequencies. Infrared imagery detects these differ-ent frequencies, which enables meteorologists to map either cloud cover or surface temperatures. Different frequencies are distinguishable in an infrared image, as shown in Figure 15.
As you have learned, clouds form at different altitudes and have different temperatures. Using infrared imagery, meteorologists can determine the cloud’s temperature, its type, and its altitude. Infrared imagery is especially useful in detecting strong thunderstorms that develop and reach high altitudes. Since the troposphere cools with increas-ing altitude, they appear as very cold areas on an infrared image. Because the strength of a thunder-storm is related to the altitude that it reaches, infra-red imagery can be used to establish a storm’s potential to produce severe weather.
■ Figure 14 Norman, Oklahoma, was the site of the first Doppler radar installation.Relate the importance of this location to severe weather conditions.
■ Figure 15 This infrared image shows cloud cover across most of the midwestern United States.
(t)NO
AA P
hoto
Lib
rary
/NOA
A Ce
ntra
l Lib
rary
/OAR
/ERL
/Nat
iona
l Sev
ere
Stor
ms
Labo
rato
ry (N
SSL)
, (b)
NOAA
0324_0328_ESGEU_S_C12_S3_658713.indd 3270324_0328_ESGEU_S_C12_S3_658713.indd 327 2/24/11 12:14 PM2/24/11 12:14 PM
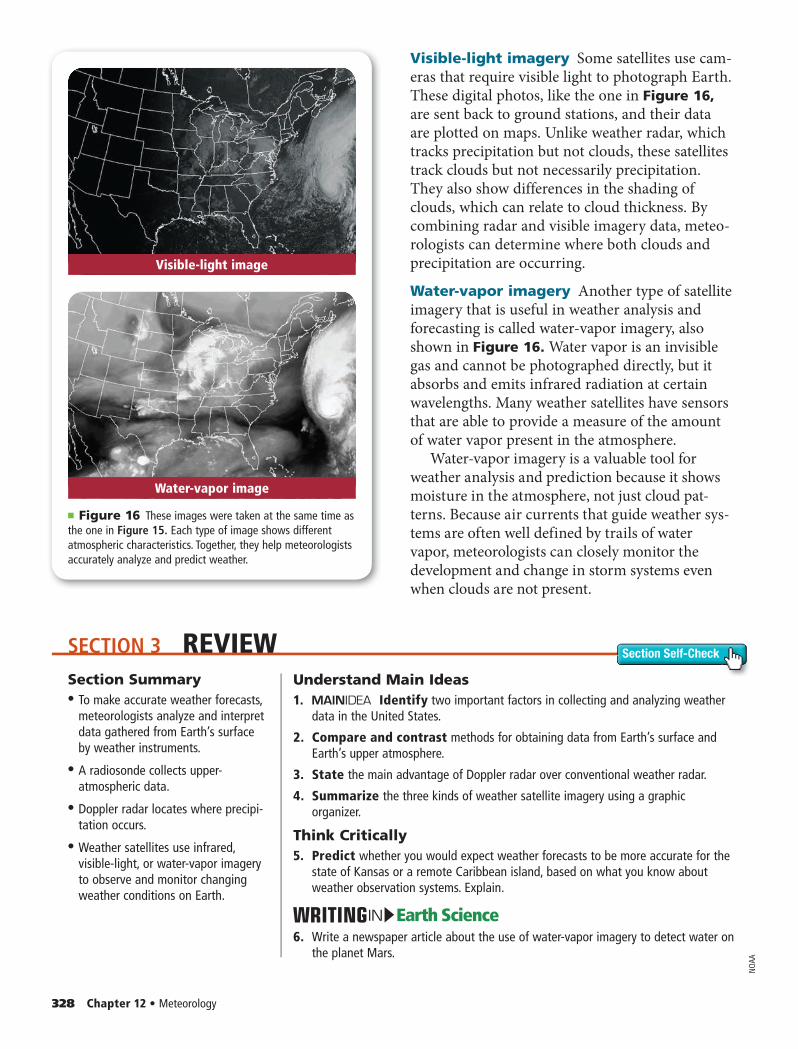
SECTION 3 REVIEW Section Self-Check
328 Chapter 12 • Meteorology
Visible-light imagery Some satellites use cam-eras that require visible light to photograph Earth. These digital photos, like the one in Figure 16, are sent back to ground stations, and their data are plotted on maps. Unlike weather radar, which tracks precipitation but not clouds, these satellites track clouds but not necessarily precipitation. They also show differences in the shading of clouds, which can relate to cloud thickness. By combining radar and visible imagery data, meteo-rologists can determine where both clouds and precipitation are occurring.
Water-vapor imagery Another type of satellite imagery that is useful in weather analysis and forecasting is called water-vapor imagery, also shown in Figure 16. Water vapor is an invisible gas and cannot be photographed directly, but it absorbs and emits infrared radiation at certain wavelengths. Many weather satellites have sensors that are able to provide a measure of the amount of water vapor present in the atmosphere.
Water-vapor imagery is a valuable tool for weather analysis and prediction because it shows moisture in the atmosphere, not just cloud pat-terns. Because air currents that guide weather sys-tems are often well defined by trails of water vapor, meteorologists can closely monitor the development and change in storm systems even when clouds are not present.
■ Figure 16 These images were taken at the same time as the one in Figure 15. Each type of image shows different atmospheric characteristics. Together, they help meteorologists accurately analyze and predict weather.
Visible-light image
Water-vapor image
Section Summary• • To make accurate weather forecasts,
meteorologists analyze and interpret data gathered from Earth’s surface by weather instruments.
• • A radiosonde collects upper-atmospheric data.
• • Doppler radar locates where precipi-tation occurs.
• • Weather satellites use infrared, visible-light, or water-vapor imagery to observe and monitor changing weather conditions on Earth.
Understand Main Ideas1. Identify two important factors in collecting and analyzing weather
data in the United States.
2. Compare and contrast methods for obtaining data from Earth’s surface and Earth’s upper atmosphere.
3. State the main advantage of Doppler radar over conventional weather radar.
4. Summarize the three kinds of weather satellite imagery using a graphic organizer.
Think Critically5. Predict whether you would expect weather forecasts to be more accurate for the
state of Kansas or a remote Caribbean island, based on what you know about weather observation systems. Explain.
Earth ScienceIN6. Write a newspaper article about the use of water-vapor imagery to detect water on
the planet Mars.
NOAA
0324_0328_ESGEU_S_C12_S3_658713.indd 3280324_0328_ESGEU_S_C12_S3_658713.indd 328 2/24/11 12:14 PM2/24/11 12:14 PM
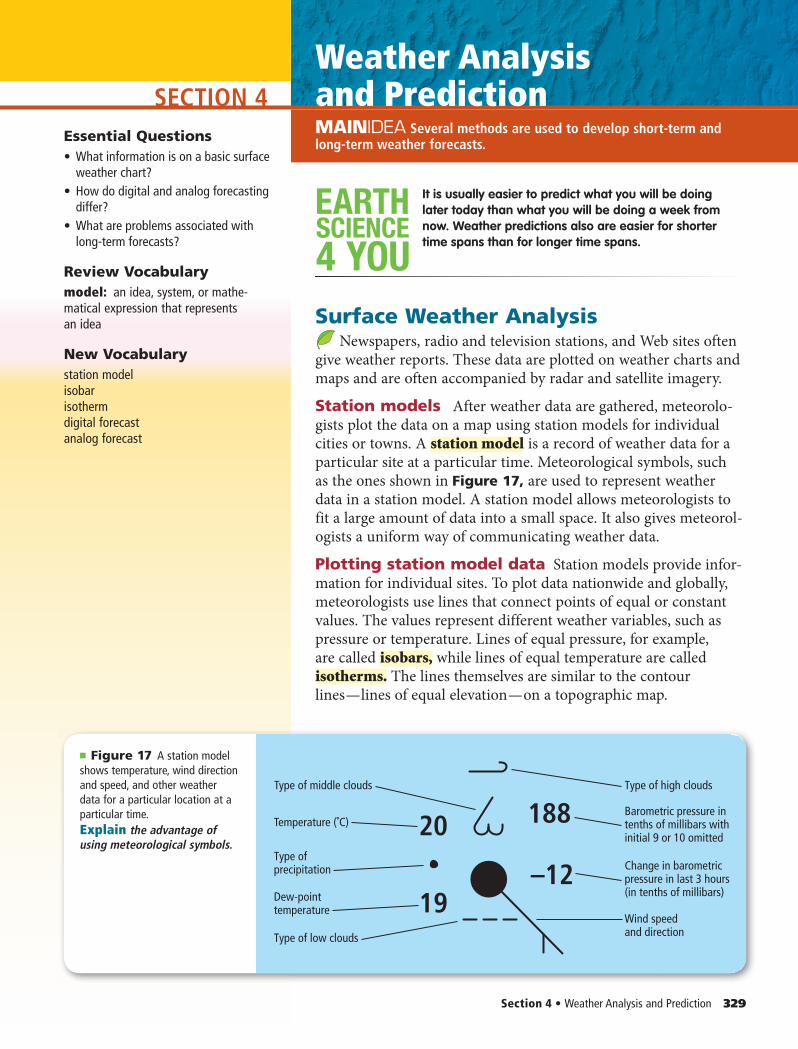
SECTION 4
Section 4 • Weather Analysis and Prediction 329
MAINIDEA Energy is transferred throughout Earth’s atmosphere.
Weather Analysis and PredictionMAINIDEA Several methods are used to develop short-term and long-term weather forecasts.
SCIENCE
4 YOU
EARTH It is usually easier to predict what you will be doing later today than what you will be doing a week from now. Weather predictions also are easier for shorter time spans than for longer time spans.
Surface Weather Analysis Newspapers, radio and television stations, and Web sites often
give weather reports. These data are plotted on weather charts and maps and are often accompanied by radar and satellite imagery.
Station models After weather data are gathered, meteorolo-gists plot the data on a map using station models for individual cities or towns. A station model is a record of weather data for a particular site at a particular time. Meteorological symbols, such as the ones shown in Figure 17, are used to represent weather data in a station model. A station model allows meteorologists to fit a large amount of data into a small space. It also gives meteorol-ogists a uniform way of communicating weather data.
Plotting station model data Station models provide infor-mation for individual sites. To plot data nationwide and globally, meteorologists use lines that connect points of equal or constant values. The values represent different weather variables, such as pressure or temperature. Lines of equal pressure, for example, are called isobars, while lines of equal temperature are called isotherms. The lines themselves are similar to the contour lines — lines of equal elevation — on a topographic map.
Essential Questions• What information is on a basic surface
weather chart?• How do digital and analog forecasting
differ?• What are problems associated with
long-term forecasts?
Review Vocabularymodel: an idea, system, or mathe-matical expression that represents an idea
New Vocabularystation modelisobarisothermdigital forecastanalog forecast
20 188
19–12
Type of high cloudsType of middle clouds
Temperature (˚C)
Type of precipitation
Dew-pointtemperature
Change in barometricpressure in last 3 hours(in tenths of millibars)
Barometric pressure intenths of millibars with initial 9 or 10 omitted
Wind speedand directionType of low clouds
■ Figure 17 A station model shows temperature, wind direction and speed, and other weather data for a particular location at a particular time. Explain the advantage of using meteorological symbols.
0329_0332_ESGEU_S_C12_S4_658713.indd 3290329_0332_ESGEU_S_C12_S4_658713.indd 329 2/24/11 12:15 PM2/24/11 12:15 PM
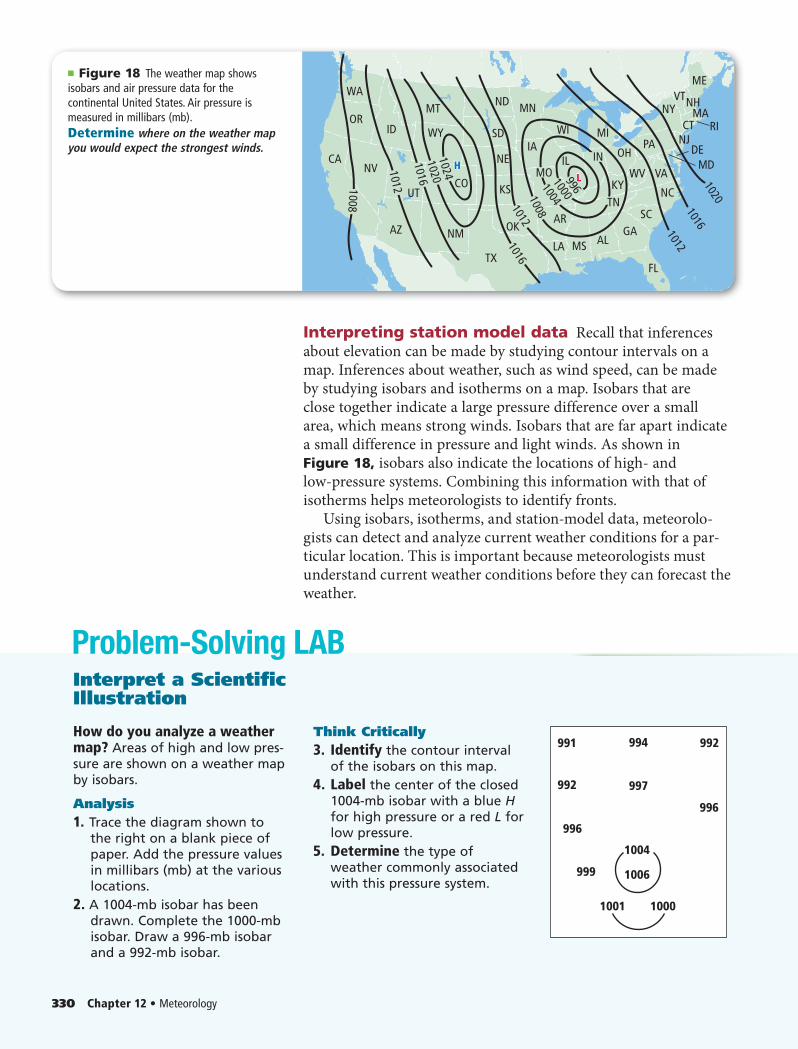
Problem-Solving LAB
330 Chapter 12 • Meteorology
Interpreting station model data Recall that inferences about elevation can be made by studying contour intervals on a map. Inferences about weather, such as wind speed, can be made by studying isobars and isotherms on a map. Isobars that are close together indicate a large pressure difference over a small area, which means strong winds. Isobars that are far apart indicate a small difference in pressure and light winds. As shown in Figure 18, isobars also indicate the locations of high- and low-pressure systems. Combining this information with that of isotherms helps meteorologists to identify fronts.
Using isobars, isotherms, and station-model data, meteorolo-gists can detect and analyze current weather conditions for a par-ticular location. This is important because meteorologists must understand current weather conditions before they can forecast the weather.
TX
NMAZ
NV
IDOR
MT
WY
CO KS
NE
UT
ND MN
WI MIIA OH
IL
SD
WA
CA
FL
1008
1016
10161020
1012
10121008
10041000996
1012
10161020
1024 HHLL
OK
MO
AR
LA MS ALGA
SC
NC
VA
PA
NY
NJ
ME
NHVTMA
CT
DEMD
RI
WVKY
TN
IN
■ Figure 18 The weather map shows isobars and air pressure data for the continental United States. Air pressure is measured in millibars (mb).Determine where on the weather map you would expect the strongest winds.
991
992
992
996
996
999
994
997
1004
1006
1001 1000
Interpret a Scientific Illustration
How do you analyze a weather map? Areas of high and low pres-sure are shown on a weather map by isobars.
Analysis1. Trace the diagram shown to
the right on a blank piece of paper. Add the pressure values in millibars (mb) at the various locations.
2. A 1004-mb isobar has been drawn. Complete the 1000-mb isobar. Draw a 996-mb isobar and a 992-mb isobar.
Think Critically3. Identify the contour interval
of the isobars on this map.4. Label the center of the closed
1004-mb isobar with a blue H for high pressure or a red L for low pressure.
5. Determine the type of weather commonly associated with this pressure system.
0329_0332_ESGEU_S_C12_S4_658713.indd 3300329_0332_ESGEU_S_C12_S4_658713.indd 330 2/24/11 12:15 PM2/24/11 12:15 PM
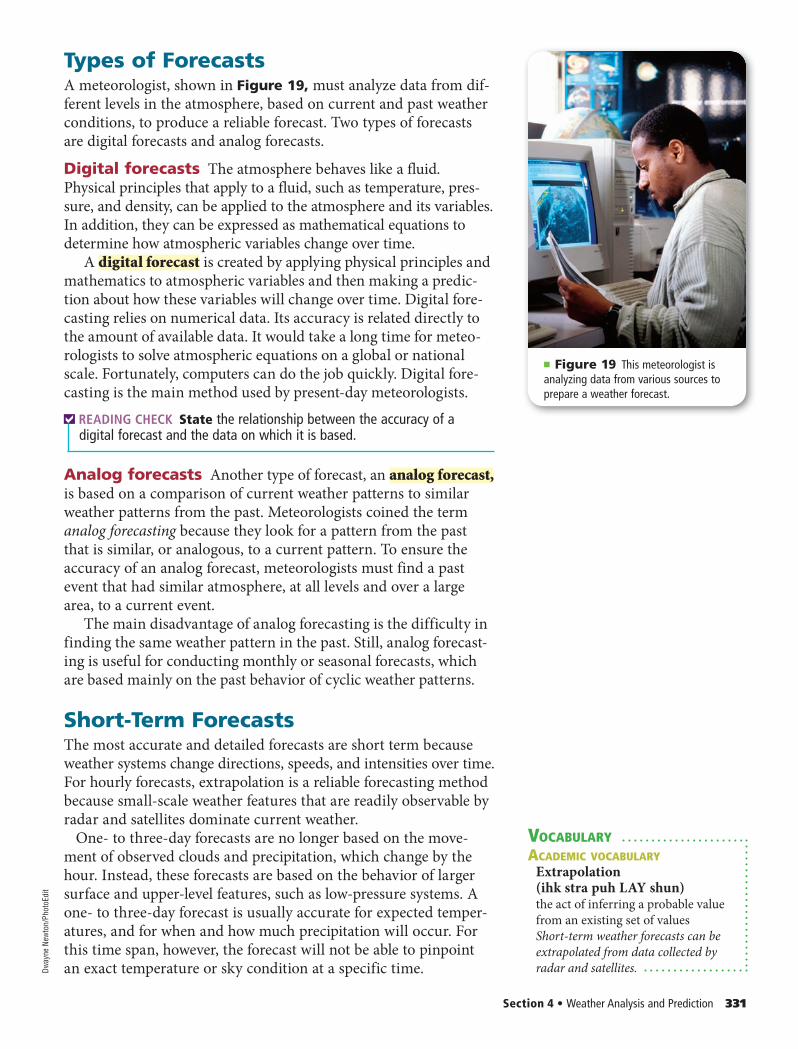
Section 4 • Weather Analysis and Prediction 331
Types of ForecastsA meteorologist, shown in Figure 19, must analyze data from dif-ferent levels in the atmosphere, based on current and past weather conditions, to produce a reliable forecast. Two types of forecasts are digital forecasts and analog forecasts.
Digital forecasts The atmosphere behaves like a fluid. Physical principles that apply to a fluid, such as temperature, pres-sure, and density, can be applied to the atmosphere and its variables. In addition, they can be expressed as mathematical equations to determine how atmospheric variables change over time.
A digital forecast is created by applying physical principles and mathematics to atmospheric variables and then making a predic-tion about how these variables will change over time. Digital fore-casting relies on numerical data. Its accuracy is related directly to the amount of available data. It would take a long time for meteo-rologists to solve atmospheric equations on a global or national scale. Fortunately, computers can do the job quickly. Digital fore-casting is the main method used by present-day meteorologists.
READING CHECK State the relationship between the accuracy of a digital forecast and the data on which it is based.
Analog forecasts Another type of forecast, an analog forecast,is based on a comparison of current weather patterns to similar weather patterns from the past. Meteorologists coined the term analog forecasting because they look for a pattern from the past that is similar, or analogous, to a current pattern. To ensure the accuracy of an analog forecast, meteorologists must find a past event that had similar atmosphere, at all levels and over a large area, to a current event.
The main disadvantage of analog forecasting is the difficulty in finding the same weather pattern in the past. Still, analog forecast-ing is useful for conducting monthly or seasonal forecasts, which are based mainly on the past behavior of cyclic weather patterns.
Short-Term ForecastsThe most accurate and detailed forecasts are short term because weather systems change directions, speeds, and intensities over time. For hourly forecasts, extrapolation is a reliable forecasting method because small-scale weather features that are readily observable by radar and satellites dominate current weather. One- to three-day forecasts are no longer based on the move-ment of observed clouds and precipitation, which change by the hour. Instead, these forecasts are based on the behavior of larger surface and upper-level features, such as low-pressure systems. A one- to three-day forecast is usually accurate for expected temper-atures, and for when and how much precipitation will occur. For this time span, however, the forecast will not be able to pinpoint an exact temperature or sky condition at a specific time.
VOCABULARYACADEMIC VOCABULARY
Extrapolation (ihk stra puh LAY shun)the act of inferring a probable value from an existing set of valuesShort-term weather forecasts can be extrapolated from data collected by radar and satellites.
■ Figure 19 This meteorologist is analyzing data from various sources to prepare a weather forecast.
Dway
ne N
ewto
n/Ph
otoE
dit
0329_0332_ESGEU_S_C12_S4_658713.indd 3310329_0332_ESGEU_S_C12_S4_658713.indd 331 2/24/11 12:15 PM2/24/11 12:15 PM
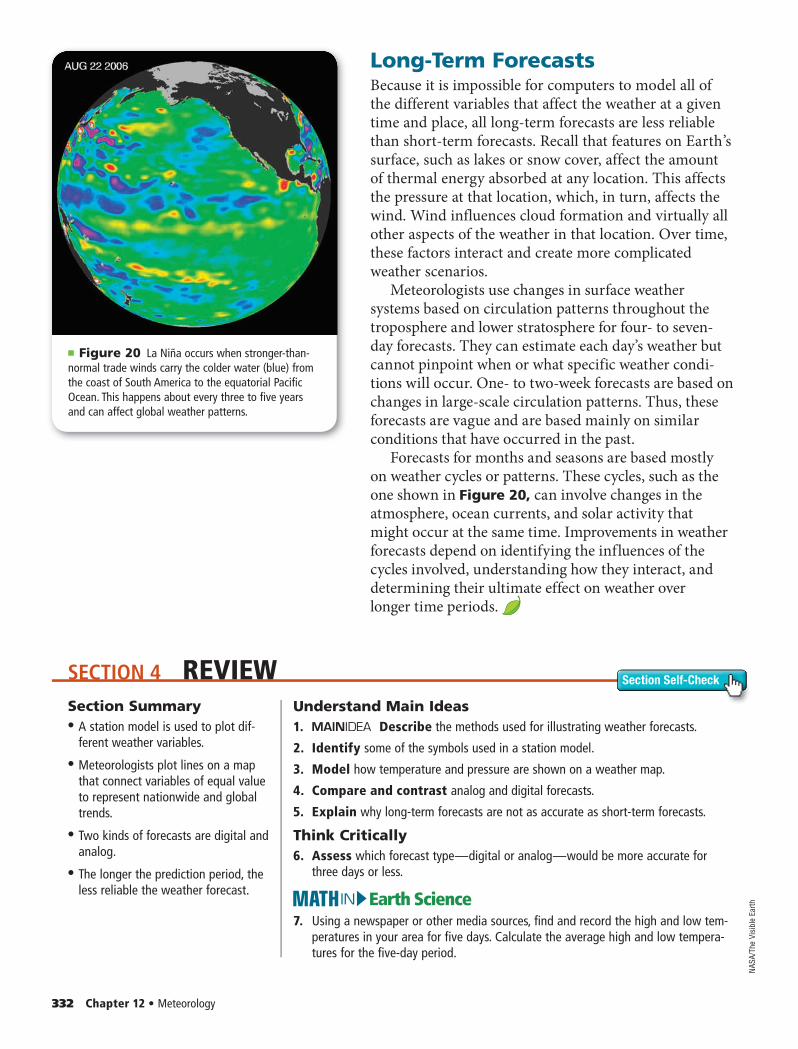
SECTION 4 REVIEW Section Self-Check
332 Chapter 12 • Meteorology
Long-Term ForecastsBecause it is impossible for computers to model all of the different variables that affect the weather at a given time and place, all long-term forecasts are less reliable than short-term forecasts. Recall that features on Earth’s surface, such as lakes or snow cover, affect the amount of thermal energy absorbed at any location. This affects the pressure at that location, which, in turn, affects the wind. Wind influences cloud formation and virtually all other aspects of the weather in that location. Over time, these factors interact and create more complicated weather scenarios.
Meteorologists use changes in surface weather systems based on circulation patterns throughout the troposphere and lower stratosphere for four- to seven-day forecasts. They can estimate each day’s weather but cannot pinpoint when or what specific weather condi-tions will occur. One- to two-week forecasts are based on changes in large-scale circulation patterns. Thus, these forecasts are vague and are based mainly on similar conditions that have occurred in the past.
Forecasts for months and seasons are based mostly on weather cycles or patterns. These cycles, such as the one shown in Figure 20, can involve changes in the atmosphere, ocean currents, and solar activity that might occur at the same time. Improvements in weather forecasts depend on identifying the influences of the cycles involved, understanding how they interact, and determining their ultimate effect on weather over longer time periods.
■ Figure 20 La Niña occurs when stronger-than-normal trade winds carry the colder water (blue) from the coast of South America to the equatorial Pacific Ocean. This happens about every three to five years and can affect global weather patterns.
Section Summary• • A station model is used to plot dif-
ferent weather variables.
• • Meteorologists plot lines on a map that connect variables of equal value to represent nationwide and global trends.
• • Two kinds of forecasts are digital and analog.
• • The longer the prediction period, the less reliable the weather forecast.
Understand Main Ideas1. Describe the methods used for illustrating weather forecasts.
2. Identify some of the symbols used in a station model.
3. Model how temperature and pressure are shown on a weather map.
4. Compare and contrast analog and digital forecasts.
5. Explain why long-term forecasts are not as accurate as short-term forecasts.
Think Critically6. Assess which forecast type — digital or analog — would be more accurate for
three days or less.
Earth ScienceIN7. Using a newspaper or other media sources, find and record the high and low tem-
peratures in your area for five days. Calculate the average high and low tempera-tures for the five-day period.
NASA
/The
Vis
ible
Ear
th
0329_0332_ESGEU_S_C12_S4_658713.indd 3320329_0332_ESGEU_S_C12_S4_658713.indd 332 2/24/11 12:15 PM2/24/11 12:15 PM
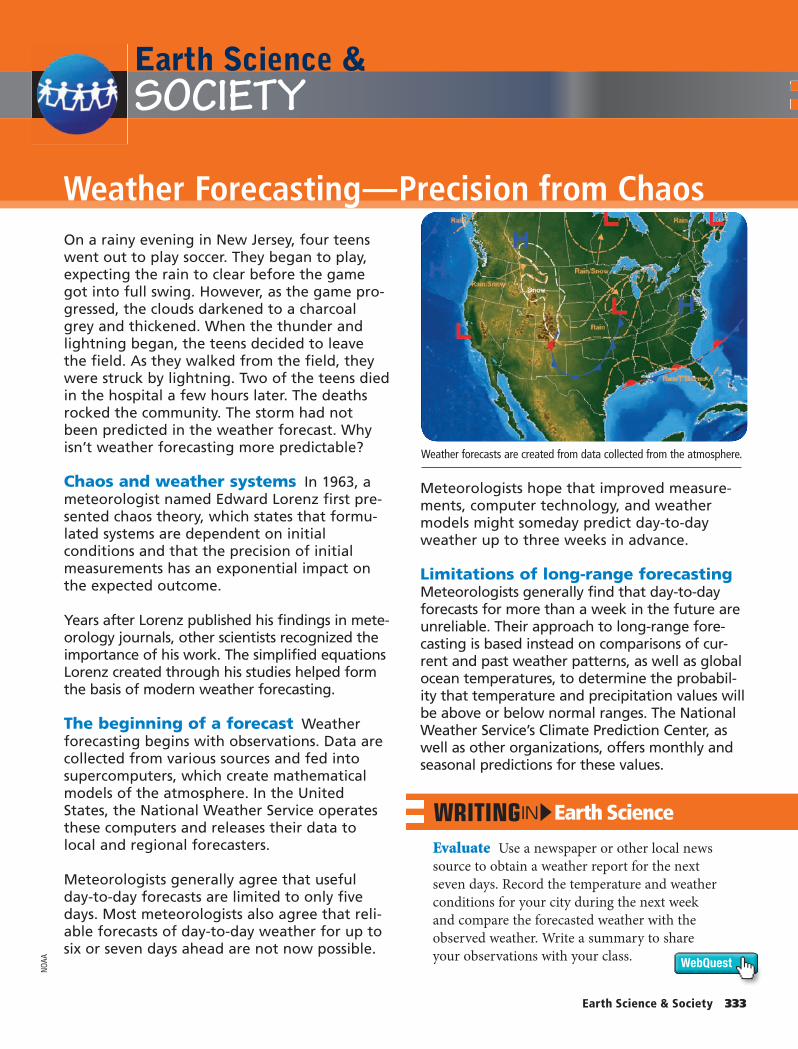
Earth Science &
WebQuest
SOCIETY
Earth ScienceIN
Evaluate Use a newspaper or other local news source to obtain a weather report for the next seven days. Record the temperature and weather conditions for your city during the next week and compare the forecasted weather with the observed weather. Write a summary to share your observations with your class.
On a rainy evening in New Jersey, four teens went out to play soccer. They began to play, expecting the rain to clear before the game got into full swing. However, as the game pro-gressed, the clouds darkened to a charcoal grey and thickened. When the thunder and lightning began, the teens decided to leave the field. As they walked from the field, they were struck by lightning. Two of the teens died in the hospital a few hours later. The deaths rocked the community. The storm had not been predicted in the weather forecast. Why isn’t weather forecasting more predictable?
Chaos and weather systems In 1963, a meteorologist named Edward Lorenz first pre-sented chaos theory, which states that formu-lated systems are dependent on initial conditions and that the precision of initial measurements has an exponential impact on the expected outcome.
Years after Lorenz published his findings in mete-or ol ogy journals, other scientists recognized the importance of his work. The simplified equations Lorenz created through his studies helped form the basis of modern weather forecasting.
The beginning of a forecast Weather forecasting begins with observations. Data are collected from various sources and fed into supercomputers, which create mathematical models of the atmosphere. In the United States, the National Weather Service operates these computers and releases their data to local and regional forecasters.
Meteorologists generally agree that useful day-to-day forecasts are limited to only five days. Most meteorologists also agree that reli-able forecasts of day-to-day weather for up to six or seven days ahead are not now possible.
Weather Forecasting — Precision from Chaos
Meteorologists hope that improved measure-ments, computer technology, and weather models might someday predict day-to-day weather up to three weeks in advance.
Limitations of long-range forecasting Meteorologists generally find that day-to-day forecasts for more than a week in the future are unreliable. Their approach to long-range fore-casting is based instead on comparisons of cur-rent and past weather patterns, as well as global ocean temperatures, to determine the probabil-ity that temperature and precipitation values will be above or below normal ranges. The National Weather Service’s Climate Prediction Center, as well as other organizations, offers monthly and seasonal predictions for these values.
Weather forecasts are created from data collected from the atmosphere.
Earth Science & Society 333
NOAA
0333_ESGEU_S_C12_F_658713.indd 3330333_ESGEU_S_C12_F_658713.indd 333 2/24/11 12:15 PM2/24/11 12:15 PM
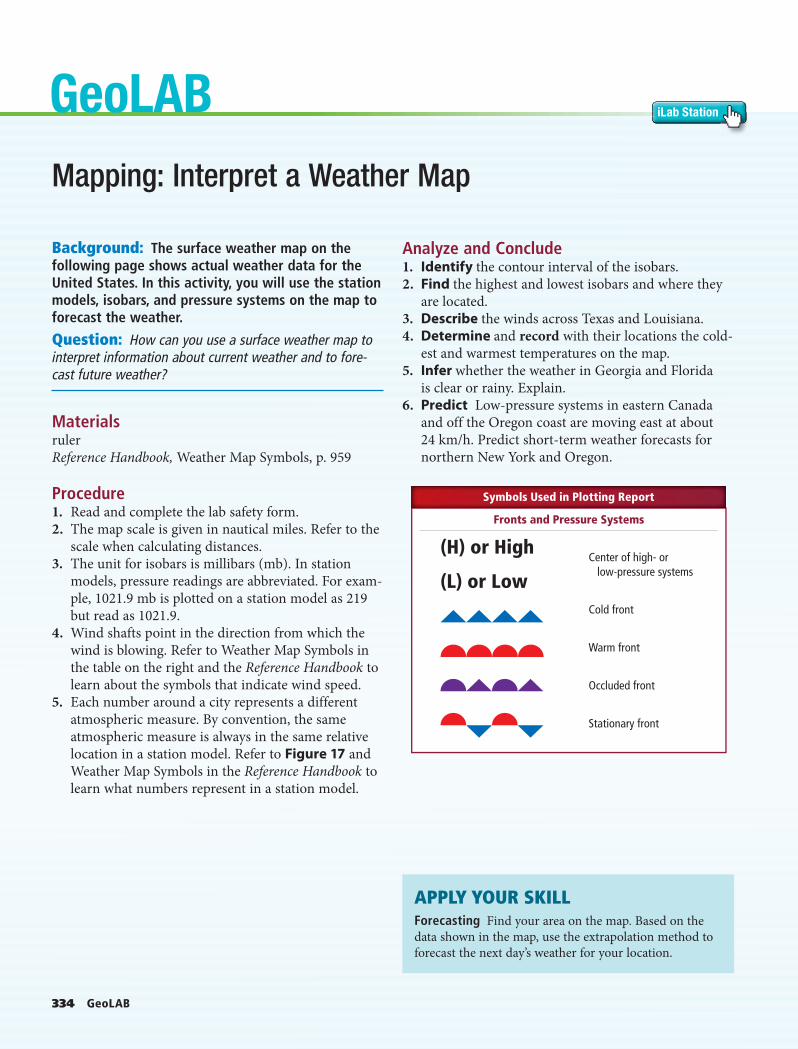
(H) or High
(L) or Low
Fronts and Pressure Systems
Symbols Used in Plotting Report
Center of high- or low-pressure systems
Cold front
Warm front
Occluded front
Stationary front
334 GeoLAB
GeoLAB iLab Station
Mapping: Interpret a Weather Map
Analyze and Conclude1. Identify the contour interval of the isobars.2. Find the highest and lowest isobars and where they
are located.3. Describe the winds across Texas and Louisiana.4. Determine and record with their locations the cold-
est and warmest temperatures on the map.5. Infer whether the weather in Georgia and Florida
is clear or rainy. Explain.6. Predict Low-pressure systems in eastern Canada
and off the Oregon coast are moving east at about 24 km/h. Predict short-term weather forecasts for northern New York and Oregon.
Background: The surface weather map on the following page shows actual weather data for the United States. In this activity, you will use the station models, isobars, and pressure systems on the map to forecast the weather.
Question: How can you use a surface weather map to interpret information about current weather and to fore-cast future weather?
MaterialsrulerReference Handbook, Weather Map Symbols, p. 959
Procedure1. Read and complete the lab safety form.2. The map scale is given in nautical miles. Refer to the
scale when calculating distances.3. The unit for isobars is millibars (mb). In station
models, pressure readings are abbreviated. For exam-ple, 1021.9 mb is plotted on a station model as 219 but read as 1021.9.
4. Wind shafts point in the direction from which the wind is blowing. Refer to Weather Map Symbols in the table on the right and the Reference Handbook to learn about the symbols that indicate wind speed.
5. Each number around a city represents a different atmospheric measure. By convention, the same atmospheric measure is always in the same relative location in a station model. Refer to Figure 17 and Weather Map Symbols in the Reference Handbook to learn what numbers represent in a station model.
APPLY YOUR SKILLForecasting Find your area on the map. Based on the data shown in the map, use the extrapolation method to forecast the next day’s weather for your location.
0334_0335_ESGEU_S_C12_LAB_658713.indd 3340334_0335_ESGEU_S_C12_LAB_658713.indd 334 2/24/11 12:15 PM2/24/11 12:15 PM
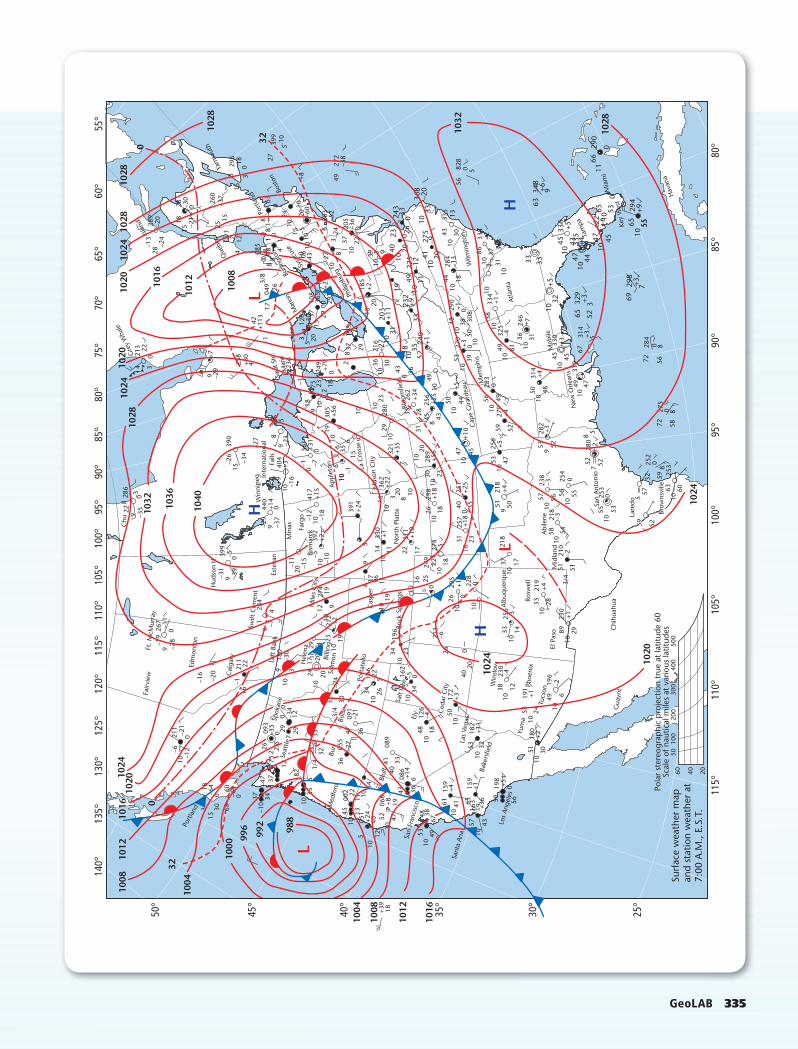
yarruMc
M .tF
anavaH
weivriaF
dnaltroP
notnomdE
yraglaC
knaB tfeL
rruBdrofde
M
ffulB
ekal tlaS
ocsicnarF naS
anA atnaS
selegnA soL
dleifsrekaB
amuY
noscuT
xineohP
wolsniW
osaP lE
tnyauG
Chi
huah
ua
Lare
do
Brow
nsvi
lle
esioB
olletatroP
Rock
Sp
rings
Nor
th P
latt
e
uaedr ariG epa
C
dl eifmool B
si hpme
M
at naltA
not gnimli
W
ytiC nosa
M
nomlaS
ytiC rade
CylE sageV saL
aneleH
enakopS
ytiC seli
M
gnilliB
–19
–16
–6
315
30
18–6
4
–6460
–10
3437–4
7 37
82
4500
2
089
086
48 3867
5310
6110
10
41
159
159
103253
18210
50+3
40
172
–6213
26 020
+11
198
59 56
52
106063
5957
5
252
5880
7227
5
284
6929
8
557
5510
10
6529
400
1166
290
+9+3
72 5680
32 59 25380
5118
010
53+119
1
101238
230
–4
4910
6–219
6
8910
29
+224
1030
0+5
6516
3+910+3
6+1
4357
+4
1048 18
–4126
1034
162
23
196
2231
1
11
174
+1330
14
391
362
321
+35
1029
28010
23
3526
2+3
4
256
+25
1049
7
16+2
2103
610
19
–910
305
+5618
035
6
+24
59 10
+10
17
1022
274
1018
10
10
10
8203
23
289
1020
31
+56
2629
8+1
830
518
2629
5+1 22
831
257
4010
4710
50+5
4410
438
4528
45
519 50
+4218
104753
251
+18
035
1023
+25
10 10
3310
14
3310
219
28
230
+13/
45151
210
1054
–358
105355
0253
7 5252
52
52+427
91049
056
283
39100+3
50
38
4932
51033
410+1
10
5031
4+4
1053
270
1048
290
0+110
18–1
343
1030
1333533
368
–20
56
63
4533
6+5
+4 47 45
22 –665
1053
1047
348
+6 9
828
0 5
0 10
38 308
256
759
+5
953
282
10
1045
1033
+5
10
1086
338
348
37+2
313 33
32
3110
3624
6
–4
7
81
45
6731
4+3
6532
910
44
43 335
+3 352
5
330 3
47
4810
4931
9
+3
280
82
5
21810
57 56
238
–3 254
5610
550
–2
+4
256
3710
17
218
3
0
0
10
1016 25
1024
9 3+
19
96 11
1034
–5 0
49
+14
366
33
2210
510
1311 10
1240
1047
43
068
+8
051
52
19
+24
34
4140
1035
61/
432
3605
5–2
7–2
1
1034 26
–22
166
5
091
3/4
32 3047 3633
12
5
600 0
211
–21
–12
100
–1–20
267
1024
9 –28
–11
–31
–26
15–3
4
838
69–2
7
–23
5
390
–29
258
+80
4
1
42+1
1317
3/8
4 085
18
81
10
4
12151
2515
157
88
88
804
9 26
+79
399
284
1
211
1622
093
–35
292900
0–3
412
7
26
525
752
910
2910
24 20
101923
21210
–12
91227
4
–11
20–1
5 –510 –1
0
392
–12
41710
+940
4
–136
1
6
–110
1510
–1
+75 23
249
+79
236
312
0
15+30 37 29
0036
5
29+2
18–4
3
10
108
83
–24
37
185
+2
2706
10
10
15 –520
10–6
0
203
–52
4927
2–3
820
5
022
1039 9
10
–12
102041
275
–9
284
44
2022
5
2324
333
–36
40
260
1010
110
85 20
218
3621
6+2
7
31
1020
203
+11
1030
430
3610
3524
0+1
52118
232
101149
+9
19
33
10
0
0
28
29
115
37
9
+31
–70
0+3–1
6
+15
–18
10+2
19–2
017
104
–24
3
180
–30
9–7
4
–5
–29
–37
0440
+14
9
09
39
0
Chu
rchi
ll22
286
el ahW yer
Gdnal sI
cebeuQ
ht uomraY
nots oBes ucar yS
9 –35
–34
213 22
–13
–20
1518
28 260
296
18 2763
240
+8
399
–10
5
033
–37
–30
0–2
1
–24
2828
90
3
0
Hud
son
H
Inte
rnat
iona
lFa
lls
ess orC aL
not el ppA
gepi nniW
. et S tl uaSeira
Mnoira
M
gr ubs pili hP
Este
van Bi
smar
ck
tnerruC tfi
wS
Min
as Farg
o
Cas
per
Alb
uque
rque
Rosw
ell
Mid
land
oi not nA naS
eli boM
apmaT
tseW yeK
imai
M
s nael rO
weN
Abi
lene
+39
18
1028
1032
1024
1020
0
1016
1012
1008
1024
1016
1012
1008
1004
1004
32
1000
996
992
988
1020
1036
1040
1008
1032
1028
1024
1020
1020 10
16
1028
32
1012
1024
1028
1028
0
elttaeS
dnaltr oP
not gnilr uB
5060 40 20
100
Scal
e of
nau
tical
mile
s at
var
ious
latit
udes
Pola
r st
ereo
grap
hic
pro
ject
ion
true
at
latit
ude
60
Surf
ace
wea
ther
map
and
stat
ion
wea
ther
at
7:00
A.M
., E.
S.T.
200
300
400
500
H
H
HL
L
L
140°
135°
130°
125°
120°
115°
110°
105°
100°
95°
90°
85°
80°
75°
70°
65°
60°
55°
50°
45°
40°
35°
30°
25°
115°
110°
105°
100°
95°
90°
85°
80°
GeoLAB 335
0334_0335_ESGEU_S_C12_LAB_658713.indd 3350334_0335_ESGEU_S_C12_LAB_658713.indd 335 2/24/11 12:15 PM2/24/11 12:15 PM
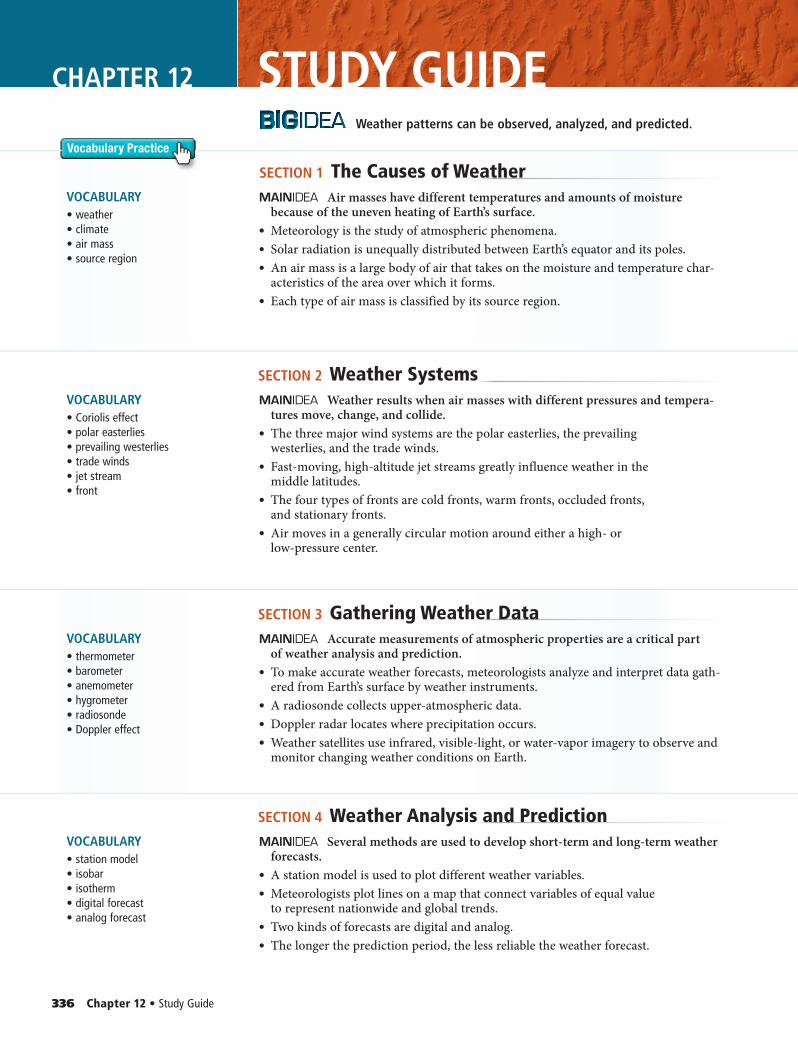
Download quizzes, key terms, and flash cards from glencoe.com.
336 Chapter 12 • Study Guide
SECTION 1 The Causes of WeatherVOCABULARY• weather• climate• air mass• source region
Air masses have different temperatures and amounts of moisture because of the uneven heating of Earth’s surface.
• Meteorology is the study of atmospheric phenomena.• Solar radiation is unequally distributed between Earth’s equator and its poles.• An air mass is a large body of air that takes on the moisture and temperature char-
acteristics of the area over which it forms.• Each type of air mass is classified by its source region.
SECTION 2 Weather SystemsVOCABULARY• Coriolis effect• polar easterlies• prevailing westerlies• trade winds• jet stream• front
Weather results when air masses with different pressures and tempera-tures move, change, and collide.
• The three major wind systems are the polar easterlies, the prevailing westerlies, and the trade winds.
• Fast-moving, high-altitude jet streams greatly influence weather in the middle latitudes.
• The four types of fronts are cold fronts, warm fronts, occluded fronts, and stationary fronts.
• Air moves in a generally circular motion around either a high- or low-pressure center.
SECTION 3 Gathering Weather DataVOCABULARY• thermometer• barometer• anemometer• hygrometer• radiosonde• Doppler effect
Accurate measurements of atmospheric properties are a critical part of weather analysis and prediction.
• To make accurate weather forecasts, meteorologists analyze and interpret data gath-ered from Earth’s surface by weather instruments.
• A radiosonde collects upper-atmospheric data.• Doppler radar locates where precipitation occurs.• Weather satellites use infrared, visible-light, or water-vapor imagery to observe and
monitor changing weather conditions on Earth.
SECTION 4 Weather Analysis and PredictionVOCABULARY• station model• isobar• isotherm• digital forecast• analog forecast
Several methods are used to develop short-term and long-term weather forecasts.
• A station model is used to plot different weather variables.• Meteorologists plot lines on a map that connect variables of equal value
to represent nationwide and global trends.• Two kinds of forecasts are digital and analog.• The longer the prediction period, the less reliable the weather forecast.
Vocabulary Practice
STUDY GUIDECHAPTER 12 Weather patterns can be observed, analyzed, and predicted.
0336_0339_ESGEU_S_C12_CA_658713.indd 3360336_0339_ESGEU_S_C12_CA_658713.indd 336 2/24/11 12:15 PM2/24/11 12:15 PM
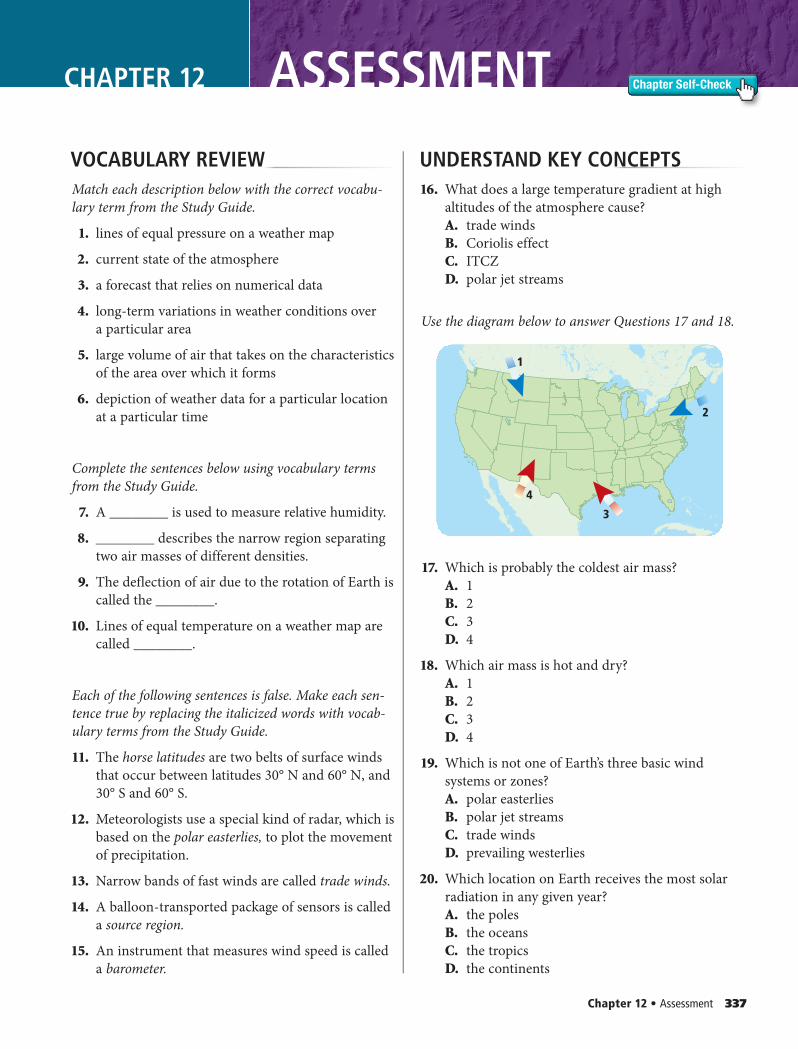
Chapter 12 • Assessment 337
Chapter Self-Check
1
2
3
4
CHAPTER 12 ASSESSMENT
VOCABULARY REVIEWMatch each description below with the correct vocabu-lary term from the Study Guide.
1. lines of equal pressure on a weather map
2. current state of the atmosphere
3. a forecast that relies on numerical data
4. long-term variations in weather conditions over a particular area
5. large volume of air that takes on the characteristics of the area over which it forms
6. depiction of weather data for a particular location at a particular time
Complete the sentences below using vocabulary terms from the Study Guide.
7. A ________ is used to measure relative humidity.
8. ________ describes the narrow region separating two air masses of different densities.
9. The deflection of air due to the rotation of Earth is called the ________.
10. Lines of equal temperature on a weather map are called ________.
Each of the following sentences is false. Make each sen-tence true by replacing the italicized words with vocab-ulary terms from the Study Guide .
11. The horse latitudes are two belts of surface winds that occur between latitudes 30° N and 60° N, and 30° S and 60° S.
12. Meteorologists use a special kind of radar, which is based on the polar easterlies, to plot the movement of precipitation.
13. Narrow bands of fast winds are called trade winds.
14. A balloon-transported package of sensors is called a source region.
15. An instrument that measures wind speed is called a barometer.
UNDERSTAND KEY CONCEPTS 16. What does a large temperature gradient at high
altitudes of the atmosphere cause?A. trade windsB. Coriolis effectC. ITCZD. polar jet streams
Use the diagram below to answer Questions 17 and 18.
17. Which is probably the coldest air mass?A. 1B. 2C. 3D. 4
18. Which air mass is hot and dry?A. 1B. 2C. 3D. 4
19. Which is not one of Earth’s three basic wind systems or zones?A. polar easterliesB. polar jet streamsC. trade windsD. prevailing westerlies
20. Which location on Earth receives the most solar radiation in any given year?A. the polesB. the oceansC. the tropicsD. the continents
0336_0339_ESGEU_S_C12_CA_658713.indd 3370336_0339_ESGEU_S_C12_CA_658713.indd 337 2/24/11 12:15 PM2/24/11 12:15 PM
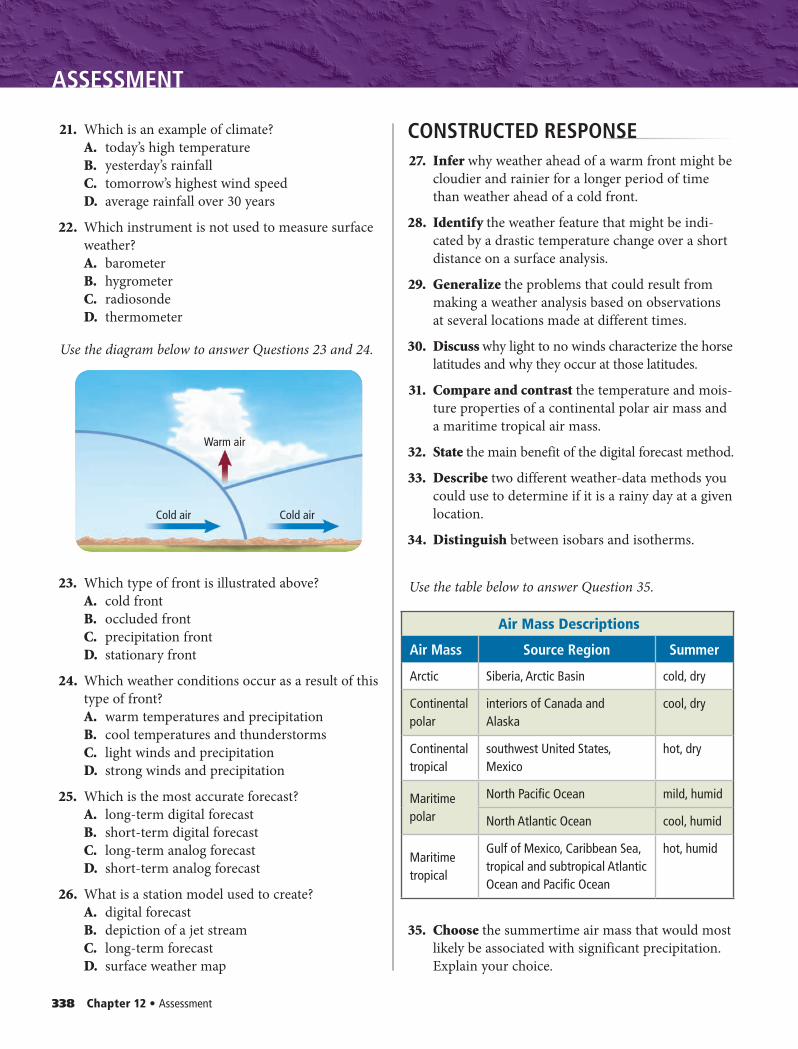
338 Chapter 12 • Assessment
ASSESSMENT
21. Which is an example of climate?A. today’s high temperatureB. yesterday’s rainfallC. tomorrow’s highest wind speedD. average rainfall over 30 years
22. Which instrument is not used to measure surface weather?A. barometerB. hygrometerC. radiosondeD. thermometer
Use the diagram below to answer Questions 23 and 24.
23. Which type of front is illustrated above?A. cold frontB. occluded frontC. precipitation frontD. stationary front
24. Which weather conditions occur as a result of this type of front?A. warm temperatures and precipitationB. cool temperatures and thunderstormsC. light winds and precipitationD. strong winds and precipitation
25. Which is the most accurate forecast?A. long-term digital forecastB. short-term digital forecastC. long-term analog forecastD. short-term analog forecast
26. What is a station model used to create?A. digital forecastB. depiction of a jet streamC. long-term forecastD. surface weather map
CONSTRUCTED RESPONSE 27. Infer why weather ahead of a warm front might be
cloudier and rainier for a longer period of time than weather ahead of a cold front.
28. Identify the weather feature that might be indi-cated by a drastic temperature change over a short distance on a surface analysis.
29. Generalize the problems that could result from making a weather analysis based on observations at several locations made at different times.
30. Discuss why light to no winds characterize the horse latitudes and why they occur at those latitudes.
31. Compare and contrast the temperature and mois-ture properties of a continental polar air mass and a maritime tropical air mass.
32. State the main benefit of the digital forecast method.
33. Describe two different weather-data methods you could use to determine if it is a rainy day at a given location.
34. Distinguish between isobars and isotherms.
Use the table below to answer Question 35.
35. Choose the summertime air mass that would most likely be associated with significant precipitation. Explain your choice.
Cold air Cold air
Warm air
Air Mass Descriptions
Air Mass Source Region Summer
Arctic Siberia, Arctic Basin cold, dry
Continental polar
interiors of Canada and Alaska
cool, dry
Continental tropical
southwest United States, Mexico
hot, dry
Maritime polar
North Pacific Ocean mild, humid
North Atlantic Ocean cool, humid
Maritime tropical
Gulf of Mexico, Caribbean Sea, tropical and subtropical Atlantic Ocean and Pacific Ocean
hot, humid
0336_0339_ESGEU_S_C12_CA_658713.indd 3380336_0339_ESGEU_S_C12_CA_658713.indd 338 2/24/11 12:15 PM2/24/11 12:15 PM
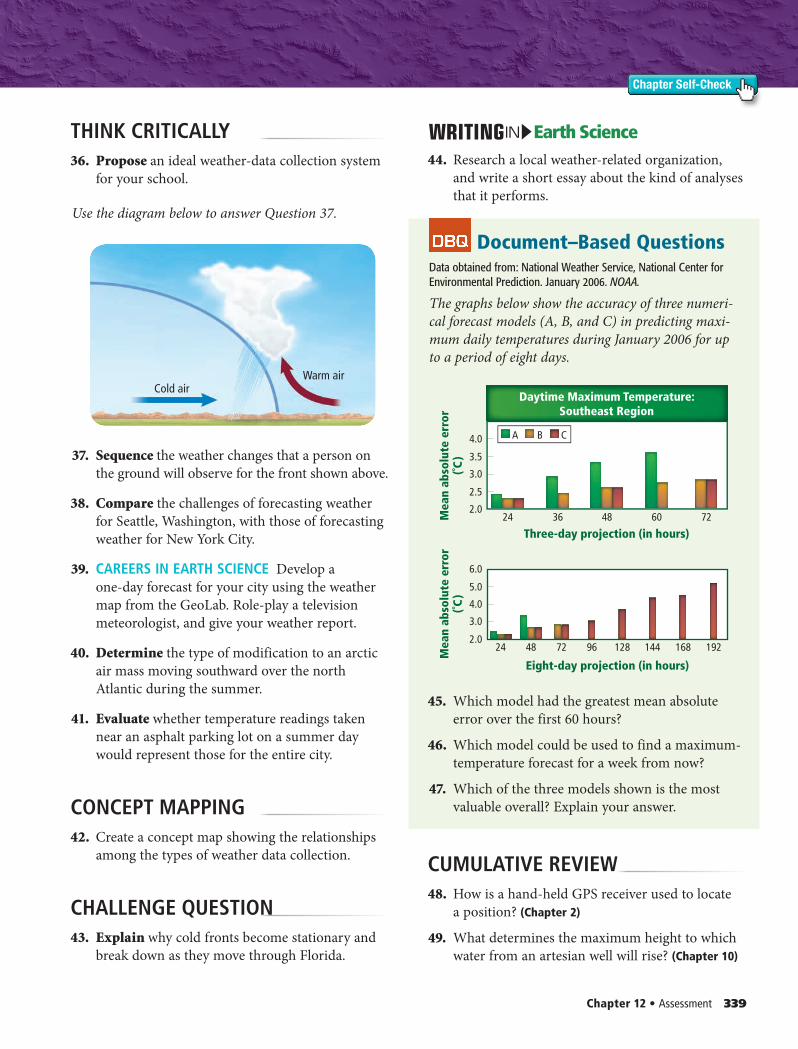
Chapter 12 • Assessment 339
Chapter Self-Check
THINK CRITICALLY 36. Propose an ideal weather-data collection system
for your school.
Use the diagram below to answer Question 37.
37. Sequence the weather changes that a person on the ground will observe for the front shown above.
38. Compare the challenges of forecasting weather for Seattle, Washington, with those of forecasting weather for New York City.
39. CAREERS IN EARTH SCIENCE Develop a one-day forecast for your city using the weather map from the GeoLab. Role-play a television meteorologist, and give your weather report.
40. Determine the type of modification to an arctic air mass moving southward over the north Atlantic during the summer.
41. Evaluate whether temperature readings taken near an asphalt parking lot on a summer day would represent those for the entire city.
CONCEPT MAPPING 42. Create a concept map showing the relationships
among the types of weather data collection.
CHALLENGE QUESTION 43. Explain why cold fronts become stationary and
break down as they move through Florida.
Cold airWarm air
A B C
Daytime Maximum Temperature:Southeast Region
2.5
3.0
3.5
4.0M
ean
abso
lute
err
or(˚C
)
2.024 48 60 7236
3.0
4.0
5.0
6.0
Mea
n ab
solu
te e
rror
(˚C)
2.024 72 96 128 144 168 19248
Eight-day projection (in hours)
Three-day projection (in hours)
Earth ScienceIN
44. Research a local weather-related organization, and write a short essay about the kind of analyses that it performs.
Document–Based QuestionsData obtained from: National Weather Service, National Center for Environmental Prediction. January 2006. NOAA.
The graphs below show the accuracy of three numeri-cal forecast models (A, B, and C) in predicting maxi-mum daily temperatures during January 2006 for up to a period of eight days.
45. Which model had the greatest mean absolute error over the first 60 hours?
46. Which model could be used to find a maximum-temperature forecast for a week from now?
47. Which of the three models shown is the most valuable overall? Explain your answer.
CUMULATIVE REVIEW 48. How is a hand-held GPS receiver used to locate
a position? (Chapter 2)
49. What determines the maximum height to which water from an artesian well will rise? (Chapter 10)
0336_0339_ESGEU_S_C12_CA_658713.indd 3390336_0339_ESGEU_S_C12_CA_658713.indd 339 2/24/11 12:15 PM2/24/11 12:15 PM
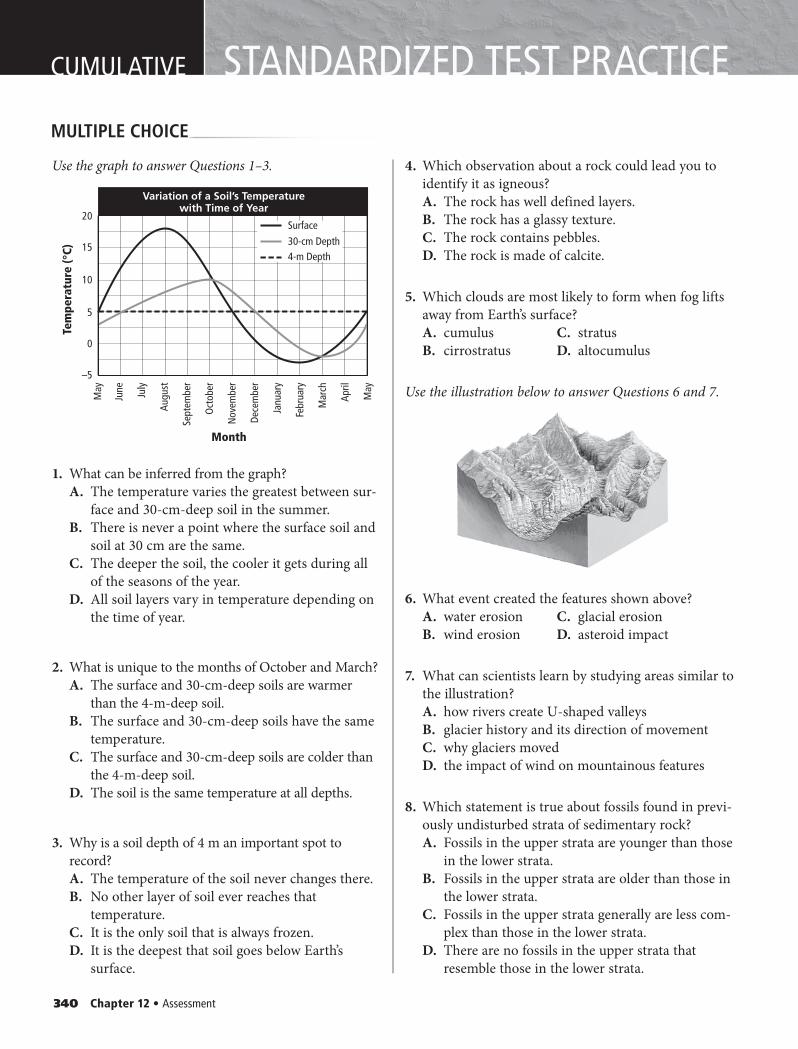
340 Chapter 12 • Assessment
MULTIPLE CHOICE
CUMULATIVE STANDARDIZED TEST PRACTICE
Use the graph to answer Questions 1–3.
1. What can be inferred from the graph?A. The temperature varies the greatest between sur-
face and 30-cm-deep soil in the summer.B. There is never a point where the surface soil and
soil at 30 cm are the same.C. The deeper the soil, the cooler it gets during all
of the seasons of the year.D. All soil layers vary in temperature depending on
the time of year.
2. What is unique to the months of October and March?A. The surface and 30-cm-deep soils are warmer
than the 4-m-deep soil.B. The surface and 30-cm-deep soils have the same
temperature.C. The surface and 30-cm-deep soils are colder than
the 4-m-deep soil.D. The soil is the same temperature at all depths.
3. Why is a soil depth of 4 m an important spot to record?A. The temperature of the soil never changes there.B. No other layer of soil ever reaches that
temperature.C. It is the only soil that is always frozen.D. It is the deepest that soil goes below Earth’s
surface.
4. Which observation about a rock could lead you to identify it as igneous? A. The rock has well defined layers.B. The rock has a glassy texture.C. The rock contains pebbles.D. The rock is made of calcite.
5. Which clouds are most likely to form when fog lifts away from Earth’s surface?A. cumulus C. stratusB. cirrostratus D. altocumulus
Use the illustration below to answer Questions 6 and 7.
6. What event created the features shown above?A. water erosion C. glacial erosionB. wind erosion D. asteroid impact
7. What can scientists learn by studying areas similar to the illustration?A. how rivers create U-shaped valleysB. glacier history and its direction of movementC. why glaciers movedD. the impact of wind on mountainous features
8. Which statement is true about fossils found in previ-ously undisturbed strata of sedimentary rock?A. Fossils in the upper strata are younger than those
in the lower strata.B. Fossils in the upper strata are older than those in
the lower strata.C. Fossils in the upper strata generally are less com-
plex than those in the lower strata.D. There are no fossils in the upper strata that
resemble those in the lower strata.
Variation of a Soil’s Temperaturewith Time of Year
20
15
10
5
0
–5
4-m Depth
Surface
Tem
pera
ture
(°C)
Month
30-cm Depth
May
June July
Augu
st
Sept
embe
r
Oct
ober
Nov
embe
r
Dece
mbe
r
Janu
ary
Febr
uary
Mar
ch
April
May
0340_0341_ESGEU_S_C12_STP_658713.indd 3400340_0341_ESGEU_S_C12_STP_658713.indd 340 2/24/11 12:15 PM2/24/11 12:15 PM
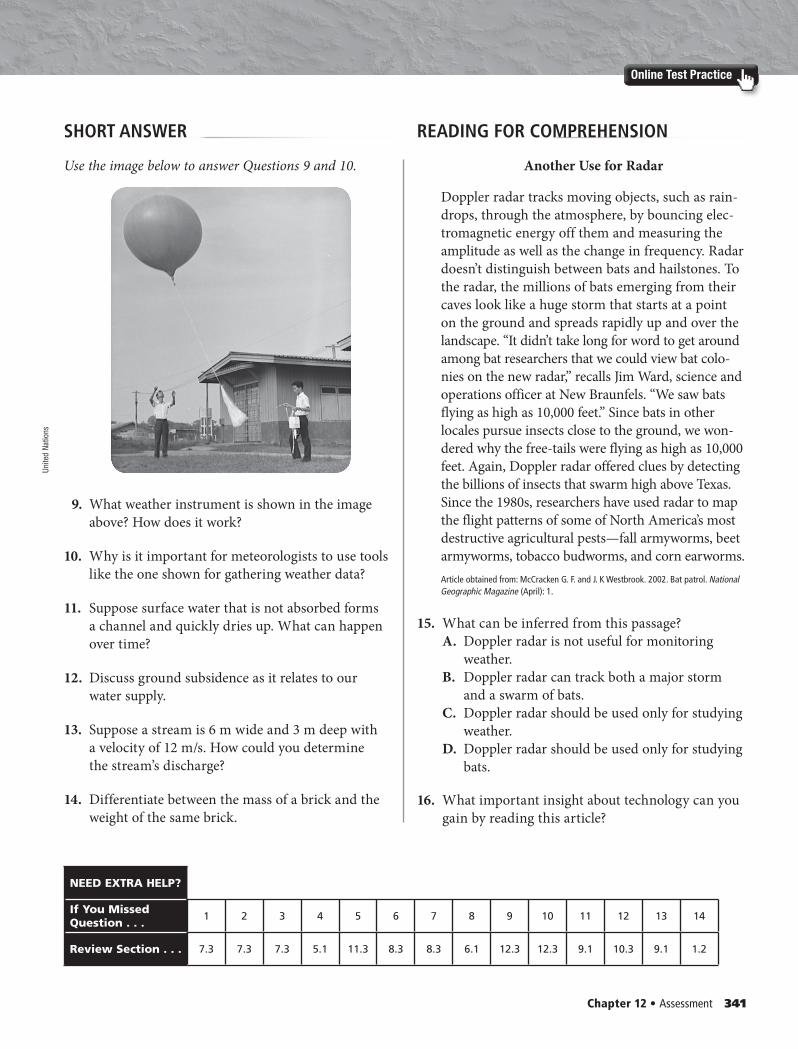
Chapter 12 • Assessment 341
Online Test Practice
SHORT ANSWER READING FOR COMPREHENSION
NEED EXTRA HELP?
If You Missed Question . . .
1 2 3 4 5 6 7 8 9 10 11 12 13 14
Review Section . . . 7.3 7.3 7.3 5.1 11.3 8.3 8.3 6.1 12.3 12.3 9.1 10.3 9.1 1.2
Use the image below to answer Questions 9 and 10.
9. What weather instrument is shown in the image above? How does it work?
10. Why is it important for meteorologists to use tools like the one shown for gathering weather data?
11. Suppose surface water that is not absorbed forms a channel and quickly dries up. What can happen over time?
12. Discuss ground subsidence as it relates to our water supply.
13. Suppose a stream is 6 m wide and 3 m deep with a velocity of 12 m/s. How could you determine the stream’s discharge?
14. Differentiate between the mass of a brick and the weight of the same brick.
Another Use for Radar
Doppler radar tracks moving objects, such as rain-drops, through the atmosphere, by bouncing elec-tromagnetic energy off them and measuring the amplitude as well as the change in frequency. Radar doesn’t distinguish between bats and hailstones. To the radar, the millions of bats emerging from their caves look like a huge storm that starts at a point on the ground and spreads rapidly up and over the landscape. “It didn’t take long for word to get around among bat researchers that we could view bat colo-nies on the new radar,” recalls Jim Ward, science and operations officer at New Braunfels. “We saw bats flying as high as 10,000 feet.” Since bats in other locales pursue insects close to the ground, we won-dered why the free-tails were flying as high as 10,000 feet. Again, Doppler radar offered clues by detecting the billions of insects that swarm high above Texas. Since the 1980s, researchers have used radar to map the flight patterns of some of North America’s most destructive agricultural pests—fall armyworms, beet armyworms, tobacco budworms, and corn earworms.Article obtained from: McCracken G. F. and J. K Westbrook. 2002. Bat patrol. National Geographic Magazine (April): 1.
15. What can be inferred from this passage?A. Doppler radar is not useful for monitoring
weather.B. Doppler radar can track both a major storm
and a swarm of bats.C. Doppler radar should be used only for studying
weather.D. Doppler radar should be used only for studying
bats.
16. What important insight about technology can you gain by reading this article?
Unite
d Na
tions
0340_0341_ESGEU_S_C12_STP_658713.indd 3410340_0341_ESGEU_S_C12_STP_658713.indd 341 2/24/11 12:16 PM2/24/11 12:16 PM
Hurricanes are given names to provide ease in communication between forecasters and the general public. Names for hurricanes, such as Hurricane Katrina, are selected from a list maintained by the World Meteorological Organization.
SECTIONSSECTIONS1 Thunderstorms
2 Severe Weather
3 Tropical Storms
4 Recurrent Weather
The Nature of StormsThe Nature of StormsThe exchange of thermal energy in the atmosphere sometimes occurs with great violence that varies in form, size, and duration.
CHAPTER 13
CumulusStage
MatureStage
DissipationStage
Thunderstorm DevelopmentMake a trifold book using the labels shown. Use it to summarize the stages of thunderstorm development.
Why does lightning form?You have probably felt the shock of static electricity when you scuff your feet on a rug and then touch a doorknob. Your feet pick up additional electrons, which are negatively charged. These electrons are attracted to the positively charged protons of the doorknob metal, causing a small electrical current to form. The current causes you to feel a small shock . In this lab, explore why lightning forms.
LaunchLAB iLab Station
342
0342_0343_ESGEU_S_C13_CO_658713.indd 3420342_0343_ESGEU_S_C13_CO_658713.indd 342 2/18/11 11:16 AM2/18/11 11:16 AM
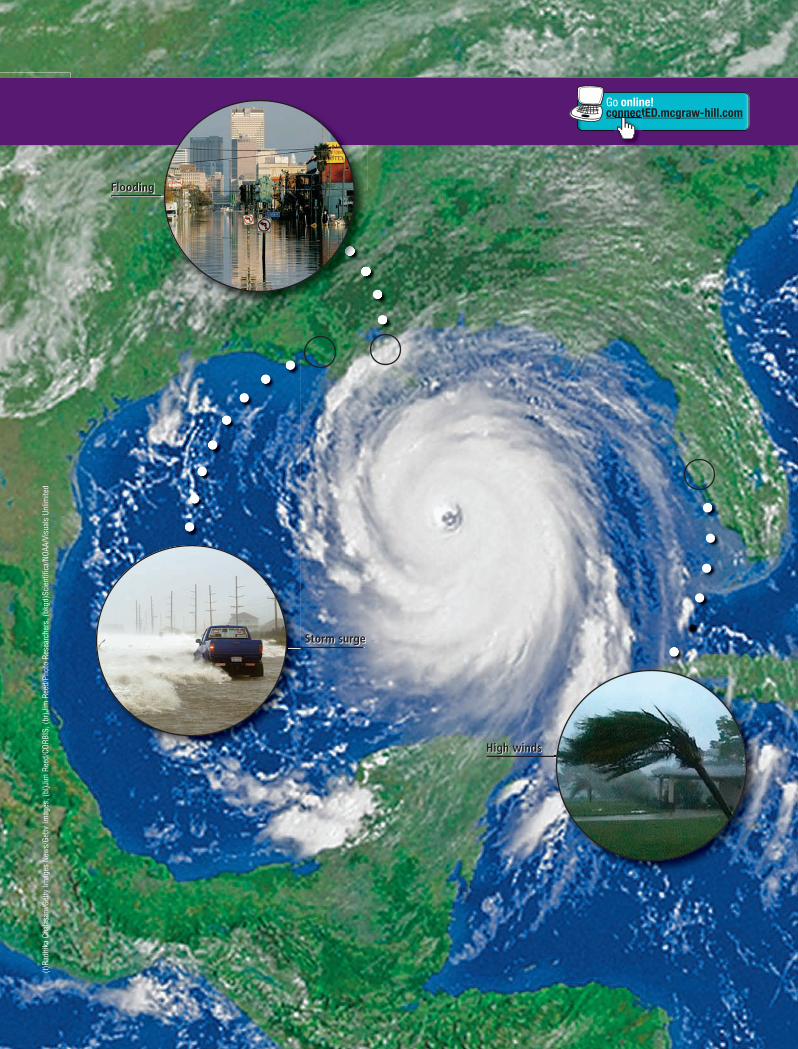
High winds
Flooding
Storm surg e
Go online!connectED.mcgraw-hill.comonnect
(t)Ra
dhik
a Ch
alas
ani/G
etty
Imag
es N
ews/
Getty
Imag
es, (
bl)J
im R
eed/
CORB
IS, (
br)J
im R
eed/
Phot
o Re
sear
cher
s, (b
kgd)
Scie
ntifi
ca/N
OAA/
Visu
als
Unlim
ited
0342_0343_ESGEU_S_C13_CO_658713.indd 3430342_0343_ESGEU_S_C13_CO_658713.indd 343 2/18/11 11:16 AM2/18/11 11:16 AM
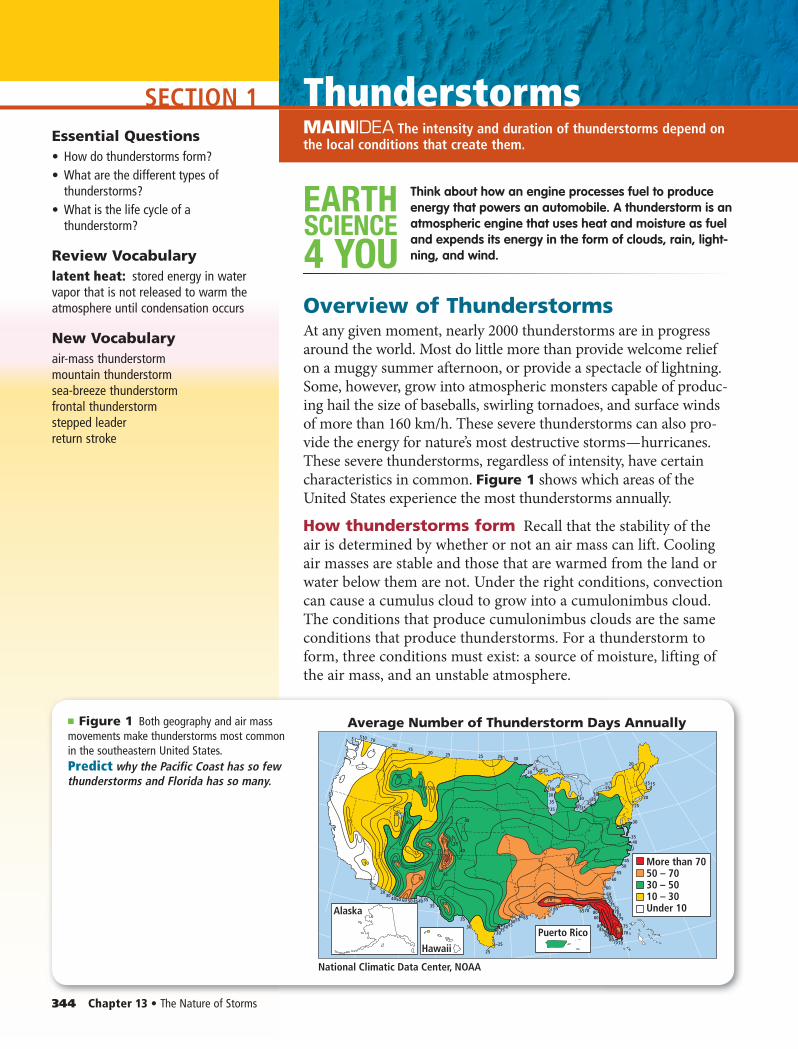
SECTION 1
Alaska
Hawaii
Puerto Rico
National Climatic Data Center, NOAA
10
10
20
40
2535
30
2520
40
25
50
5065
6560
60
45
35
40
50
60 50 45403535
35
30
25
25
40455055
6065
65 657075
8080
808590
7085807570
75
7570
7075
757065
5550
45
6060
60
50 703035
40
4550
5070
50
15
1015
20 25 25 25 30
25 25
30
3030
30
35
35 353535
3530
30
25
25
20
20
1515
3540
55
5
5
5
5
5
10 10
5
2030
4050
More than 7050 – 7030 – 5010 – 30Under 10
Average Number of Thunderstorm Days Annually
344 Chapter 13 • The Nature of Storms
MAINIDEA The intensity and duration of thunderstorms depend on the local conditions that create them.
SCIENCE
4 YOU
EARTH Think about how an engine processes fuel to produce energy that powers an automobile. A thunderstorm is an atmospheric engine that uses heat and moisture as fuel and expends its energy in the form of clouds, rain, light-ning, and wind.
Overview of ThunderstormsAt any given moment, nearly 2000 thunderstorms are in progress around the world. Most do little more than provide welcome relief on a muggy summer afternoon, or provide a spectacle of lightning. Some, however, grow into atmospheric monsters capable of produc-ing hail the size of baseballs, swirling tornadoes, and surface winds of more than 160 km/h. These severe thunderstorms can also pro-vide the energy for nature’s most destructive storms — hurricanes. These severe thunderstorms, regardless of intensity, have certain characteristics in common. Figure 1 shows which areas of the United States experience the most thunderstorms annually.
How thunderstorms form Recall that the stability of the air is determined by whether or not an air mass can lift. Cooling air masses are stable and those that are warmed from the land or water below them are not. Under the right conditions, convection can cause a cumulus cloud to grow into a cumulonimbus cloud. The conditions that produce cumulonimbus clouds are the same conditions that produce thunderstorms. For a thunderstorm to form, three conditions must exist: a source of moisture, lifting of the air mass, and an unstable atmosphere.
Essential Questions• How do thunderstorms form?• What are the different types of
thunderstorms?• What is the life cycle of a
thunderstorm?
Review Vocabularylatent heat: stored energy in water vapor that is not released to warm the atmosphere until condensation occurs
New Vocabularyair-mass thunderstormmountain thunderstormsea-breeze thunderstormfrontal thunderstormstepped leaderreturn stroke
■ Figure 1 Both geography and air mass movements make thunderstorms most common in the southeastern United States.Predict why the Pacific Coast has so few thunderstorms and Florida has so many.
Thunderstorms
0344_0349_ESGEU_S_C13_S1_658713.indd 3440344_0349_ESGEU_S_C13_S1_658713.indd 344 2/12/11 11:36 AM2/12/11 11:36 AM
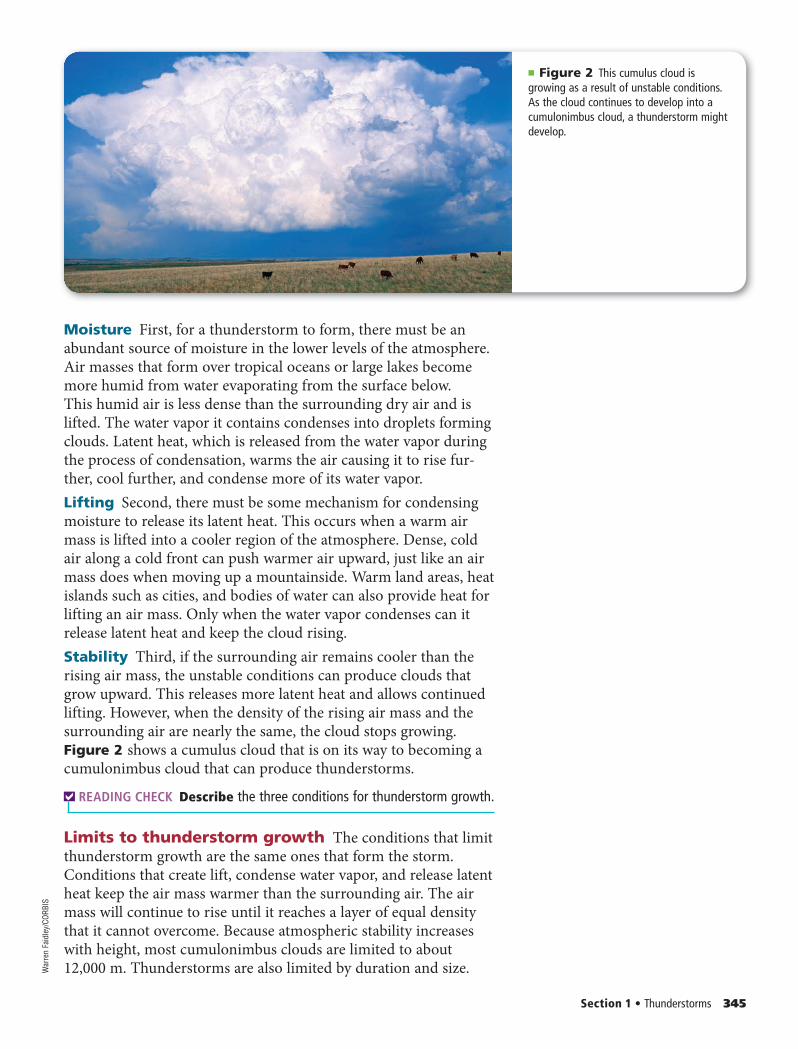
Section 1 • Thunderstorms 345
Moisture First, for a thunderstorm to form, there must be an abundant source of moisture in the lower levels of the atmosphere. Air masses that form over tropical oceans or large lakes become more humid from water evaporating from the surface below. This humid air is less dense than the surrounding dry air and is lifted. The water vapor it contains condenses into droplets forming clouds. Latent heat, which is released from the water vapor during the process of condensation, warms the air causing it to rise fur-ther, cool further, and condense more of its water vapor.Lifting Second, there must be some mechanism for condensing moisture to release its latent heat. This occurs when a warm air mass is lifted into a cooler region of the atmosphere. Dense, cold air along a cold front can push warmer air upward, just like an air mass does when moving up a mountainside. Warm land areas, heat islands such as cities, and bodies of water can also provide heat for lifting an air mass. Only when the water vapor condenses can it release latent heat and keep the cloud rising.Stability Third, if the surrounding air remains cooler than the rising air mass, the unstable conditions can produce clouds that grow upward. This releases more latent heat and allows continued lifting. However, when the density of the rising air mass and the surrounding air are nearly the same, the cloud stops growing. Figure 2 shows a cumulus cloud that is on its way to becoming a cumulonimbus cloud that can produce thunderstorms.
READING CHECK Describe the three conditions for thunderstorm growth.
Limits to thunderstorm growth The conditions that limit thunderstorm growth are the same ones that form the storm. Conditions that create lift, condense water vapor, and release latent heat keep the air mass warmer than the surrounding air. The air mass will continue to rise until it reaches a layer of equal density that it cannot overcome. Because atmospheric stability increases with height, most cumulonimbus clouds are limited to about 12,000 m. Thunderstorms are also limited by duration and size.
■ Figure 2 This cumulus cloud is growing as a result of unstable conditions. As the cloud continues to develop into a cumulonimbus cloud, a thunderstorm might develop.
War
ren
Faid
ley/
CORB
IS
0344_0349_ESGEU_S_C13_S1_658713.indd 3450344_0349_ESGEU_S_C13_S1_658713.indd 345 2/12/11 11:36 AM2/12/11 11:36 AM
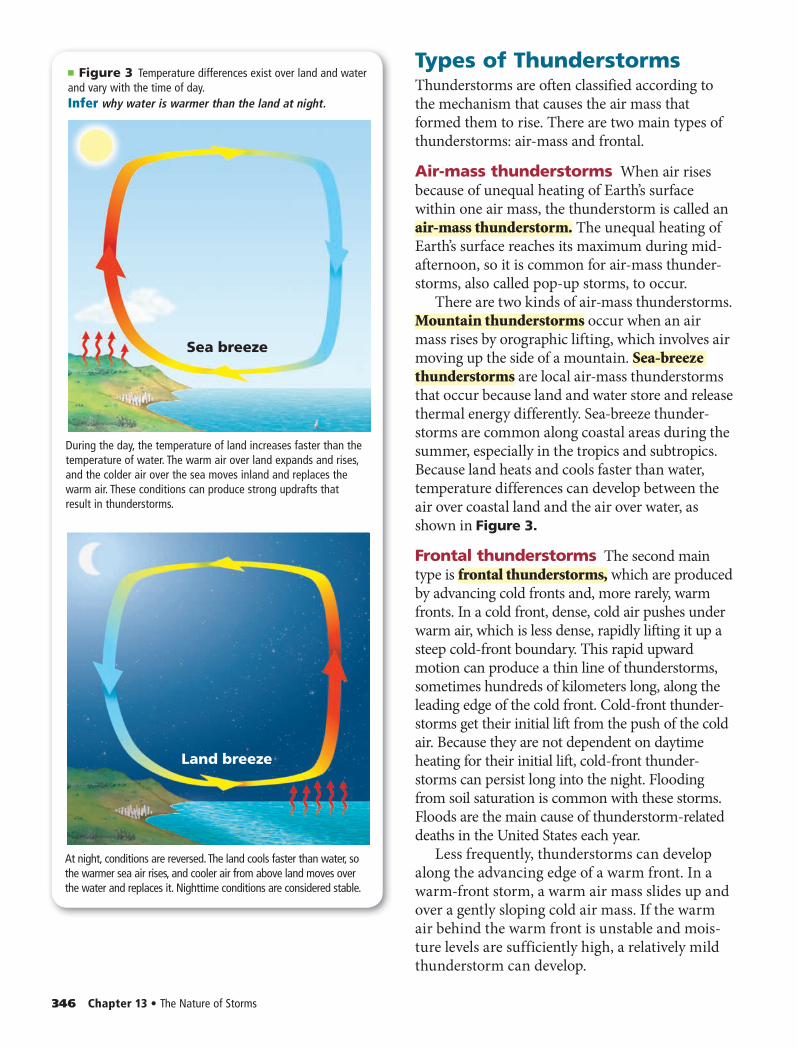
Sea breeze
During the day, the temperature of land increases faster than the temperature of water. The warm air over land expands and rises, and the colder air over the sea moves inland and replaces the warm air. These conditions can produce strong updrafts that result in thunderstorms.
Land breeze
At night, conditions are reversed. The land cools faster than water, so the warmer sea air rises, and cooler air from above land moves over the water and replaces it. Nighttime conditions are considered stable.
346 Chapter 13 • The Nature of Storms
Types of ThunderstormsThunderstorms are often classified according to the mechanism that causes the air mass that formed them to rise. There are two main types of thunderstorms: air-mass and frontal.
Air-mass thunderstorms When air rises because of unequal heating of Earth’s surface within one air mass, the thunderstorm is called an air-mass thunderstorm. The unequal heating of Earth’s surface reaches its maximum during mid-afternoon, so it is common for air-mass thunder-storms, also called pop-up storms, to occur.
There are two kinds of air-mass thunderstorms. Moun tain thunderstorms occur when an air mass rises by orographic lifting, which involves air moving up the side of a mountain. Sea-breeze thunderstorms are local air-mass thunderstorms that occur because land and water store and release thermal energy differently. Sea-breeze thunder-storms are common along coastal areas during the summer, especially in the tropics and subtropics. Because land heats and cools faster than water, temperature differences can develop between the air over coastal land and the air over water, as shown in Figure 3.
Frontal thunderstorms The second main type is frontal thunderstorms, which are produced by advancing cold fronts and, more rarely, warm fronts. In a cold front, dense, cold air pushes under warm air, which is less dense, rapidly lifting it up a steep cold-front boundary. This rapid upward motion can produce a thin line of thunderstorms, sometimes hundreds of kilometers long, along the leading edge of the cold front. Cold-front thunder-storms get their initial lift from the push of the cold air. Because they are not dependent on daytime heating for their initial lift, cold-front thunder-storms can persist long into the night. Flooding from soil saturation is common with these storms. Floods are the main cause of thunderstorm-related deaths in the United States each year.
Less frequently, thunderstorms can develop along the advancing edge of a warm front. In a warm-front storm, a warm air mass slides up and over a gently sloping cold air mass. If the warm air behind the warm front is unstable and mois-ture levels are sufficiently high, a relatively mild thunderstorm can develop.
■ Figure 3 Temperature differences exist over land and water and vary with the time of day. Infer why water is warmer than the land at night.
0344_0349_ESGEU_S_C13_S1_658713.indd 3460344_0349_ESGEU_S_C13_S1_658713.indd 346 2/12/11 11:36 AM2/12/11 11:36 AM
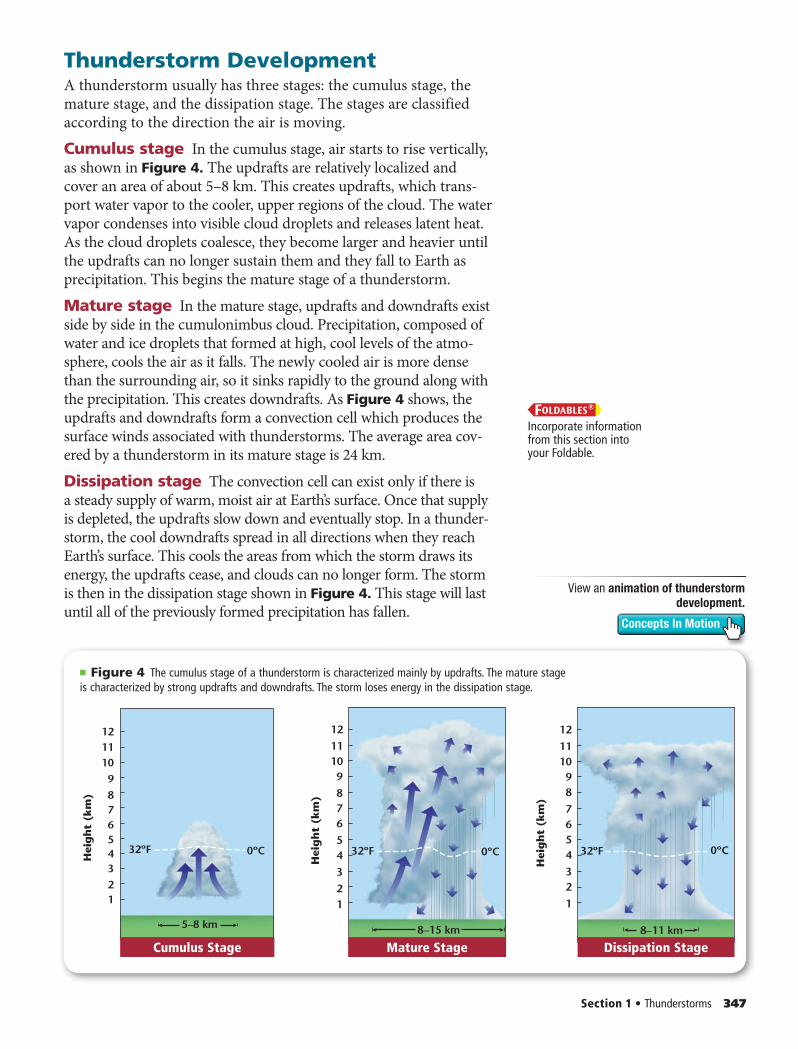
12
3456
Hei
gh
t (k
m)
78
9
101112
32ºF 0ºC
5–8 km
12
3
45
6
Hei
gh
t (k
m)
78
91011
12
32ºF
8–15 km
0ºC
1
23
456
Hei
gh
t (k
m)
7
89
1011
12
32ºF
8–11 km
0ºC
Section 1 • Thunderstorms 347
Thunderstorm DevelopmentA thunderstorm usually has three stages: the cumulus stage, the mature stage, and the dissipation stage. The stages are classified according to the direction the air is moving.Cumulus stage In the cumulus stage, air starts to rise vertically, as shown in Figure 4. The updrafts are relatively localized and cover an area of about 5–8 km. This creates updrafts, which trans-port water vapor to the cooler, upper regions of the cloud. The water vapor condenses into visible cloud droplets and releases latent heat. As the cloud droplets coalesce, they become larger and heavier until the updrafts can no longer sustain them and they fall to Earth as precipitation. This begins the mature stage of a thunderstorm.Mature stage In the mature stage, updrafts and downdrafts exist side by side in the cumulonimbus cloud. Precipitation, composed of water and ice droplets that formed at high, cool levels of the atmo-sphere, cools the air as it falls. The newly cooled air is more dense than the surrounding air, so it sinks rapidly to the ground along with the precipitation. This creates downdrafts. As Figure 4 shows, the updrafts and downdrafts form a convection cell which produces the surface winds associated with thunderstorms. The average area cov-ered by a thunderstorm in its mature stage is 24 km. Dissipation stage The convection cell can exist only if there is a steady supply of warm, moist air at Earth’s surface. Once that supply is depleted, the updrafts slow down and eventually stop. In a thunder-storm, the cool downdrafts spread in all directions when they reach Earth’s surface. This cools the areas from which the storm draws its energy, the updrafts cease, and clouds can no longer form. The storm is then in the dissipation stage shown in Figure 4. This stage will last until all of the previously formed precipitation has fallen.
■ Figure 4 The cumulus stage of a thunderstorm is characterized mainly by updrafts. The mature stage is characterized by strong updrafts and downdrafts. The storm loses energy in the dissipation stage.
Cumulus Stage Mature Stage Dissipation Stage
FOLDABLESIncorporate information from this section into your Foldable.
View an animation of thunderstorm
development.
Concepts In Motion
0344_0349_ESGEU_S_C13_S1_658713.indd 3470344_0349_ESGEU_S_C13_S1_658713.indd 347 2/12/11 11:36 AM2/12/11 11:36 AM
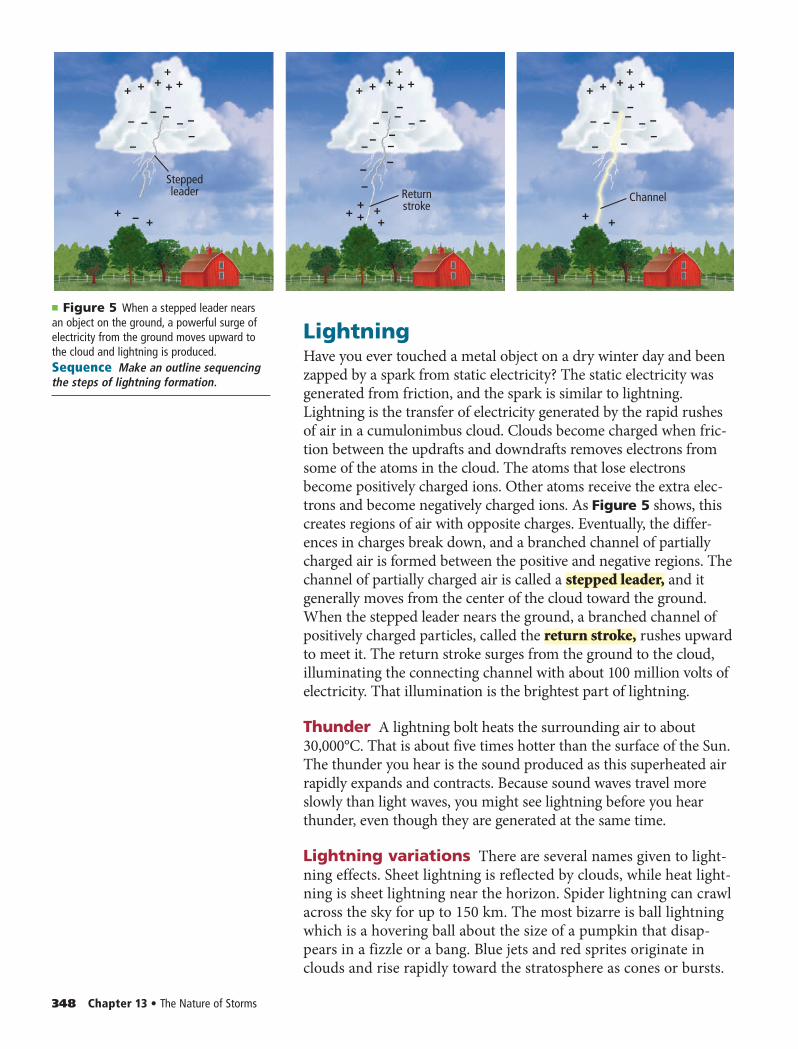
++++ + +
++ –
–
–– –
–– – –
–
Steppedleader Return
strokeChannel
++++ + +
+++ ++
–
––
––
–– –
–
–– –
–
++++ + +
++
––
–– –
–– – –
–
348 Chapter 13 • The Nature of Storms
LightningHave you ever touched a metal object on a dry winter day and been zapped by a spark from static electricity? The static electricity was generated from friction, and the spark is similar to lightning. Lightning is the transfer of electricity generated by the rapid rushes of air in a cumulonimbus cloud. Clouds become charged when fric-tion between the updrafts and downdrafts removes electrons from some of the atoms in the cloud. The atoms that lose electrons become positively charged ions. Other atoms receive the extra elec-trons and become negatively charged ions. As Figure 5 shows, this creates regions of air with opposite charges. Eventually, the differ-ences in charges break down, and a branched channel of partially charged air is formed between the positive and negative regions. The channel of partially charged air is called a stepped leader, and it generally moves from the center of the cloud toward the ground. When the stepped leader nears the ground, a branched channel of positively charged particles, called the return stroke, rushes upward to meet it. The return stroke surges from the ground to the cloud, illuminating the connecting channel with about 100 million volts of electricity. That illumination is the brightest part of lightning.
Thunder A lightning bolt heats the surrounding air to about 30,000°C. That is about five times hotter than the surface of the Sun. The thunder you hear is the sound produced as this superheated air rapidly expands and contracts. Because sound waves travel more slowly than light waves, you might see lightning before you hear thunder, even though they are generated at the same time.
Lightning variations There are several names given to light-ning effects. Sheet lightning is reflected by clouds, while heat light-ning is sheet lightning near the horizon. Spider lightning can crawl across the sky for up to 150 km. The most bizarre is ball lightning which is a hovering ball about the size of a pumpkin that disap-pears in a fizzle or a bang. Blue jets and red sprites originate in clouds and rise rapidly toward the stratosphere as cones or bursts.
■ Figure 5 When a stepped leader nears an object on the ground, a powerful surge of electricity from the ground moves upward to the cloud and lightning is produced. Sequence Make an outline sequencing the steps of lightning formation.
0344_0349_ESGEU_S_C13_S1_658713.indd 3480344_0349_ESGEU_S_C13_S1_658713.indd 348 2/12/11 11:36 AM2/12/11 11:36 AM
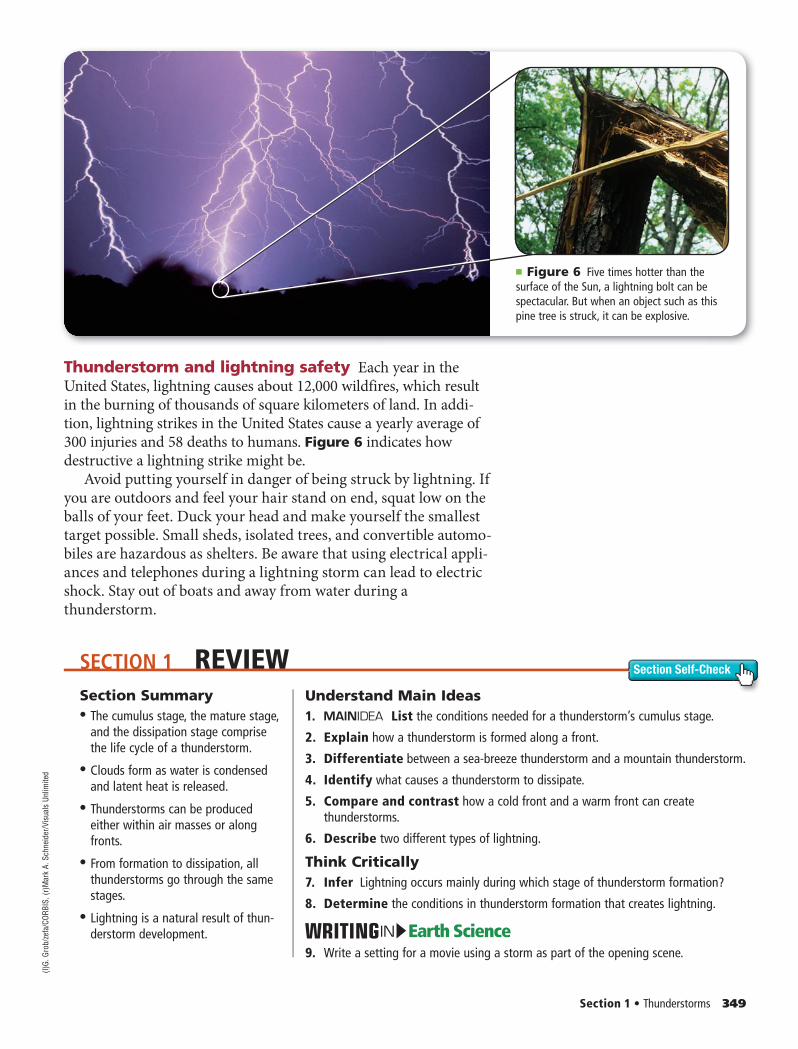
SECTION 1 REVIEW Section Self-Check
Section 1 • Thunderstorms 349
Thunderstorm and lightning safety Each year in the United States, lightning causes about 12,000 wildfires, which result in the burning of thousands of square kilometers of land. In addi-tion, lightning strikes in the United States cause a yearly average of 300 injuries and 58 deaths to humans. Figure 6 indicates how destructive a lightning strike might be.
Avoid putting yourself in danger of being struck by lightning. If you are outdoors and feel your hair stand on end, squat low on the balls of your feet. Duck your head and make yourself the smallest target possible. Small sheds, isolated trees, and convertible automo-biles are hazardous as shelters. Be aware that using electrical appli-ances and telephones during a lightning storm can lead to electric shock. Stay out of boats and away from water during a thunderstorm.
■ Figure 6 Five times hotter than the surface of the Sun, a lightning bolt can be spectacular. But when an object such as this pine tree is struck, it can be explosive.
Section Summary• • The cumulus stage, the mature stage,
and the dissipation stage comprise the life cycle of a thunderstorm.
• • Clouds form as water is condensed and latent heat is released.
• • Thunderstorms can be produced either within air masses or along fronts.
• • From formation to dissipation, all thunderstorms go through the same stages.
• • Lightning is a natural result of thun-derstorm development.
Understand Main Ideas1. List the conditions needed for a thunderstorm’s cumulus stage.
2. Explain how a thunderstorm is formed along a front.
3. Differentiate between a sea-breeze thunderstorm and a mountain thunderstorm.
4. Identify what causes a thunderstorm to dissipate.
5. Compare and contrast how a cold front and a warm front can create thunderstorms.
6. Describe two different types of lightning.
Think Critically7. Infer Lightning occurs mainly during which stage of thunderstorm formation?
8. Determine the conditions in thunderstorm formation that creates lightning.
Earth ScienceIN9. Write a setting for a movie using a storm as part of the opening scene.
(l)G.
Gro
b/ze
fa/C
ORBI
S, (r
)Mar
k A.
Sch
neid
er/V
isua
ls U
nlim
ited
0344_0349_ESGEU_S_C13_S1_658713.indd 3490344_0349_ESGEU_S_C13_S1_658713.indd 349 2/12/11 11:36 AM2/12/11 11:36 AM
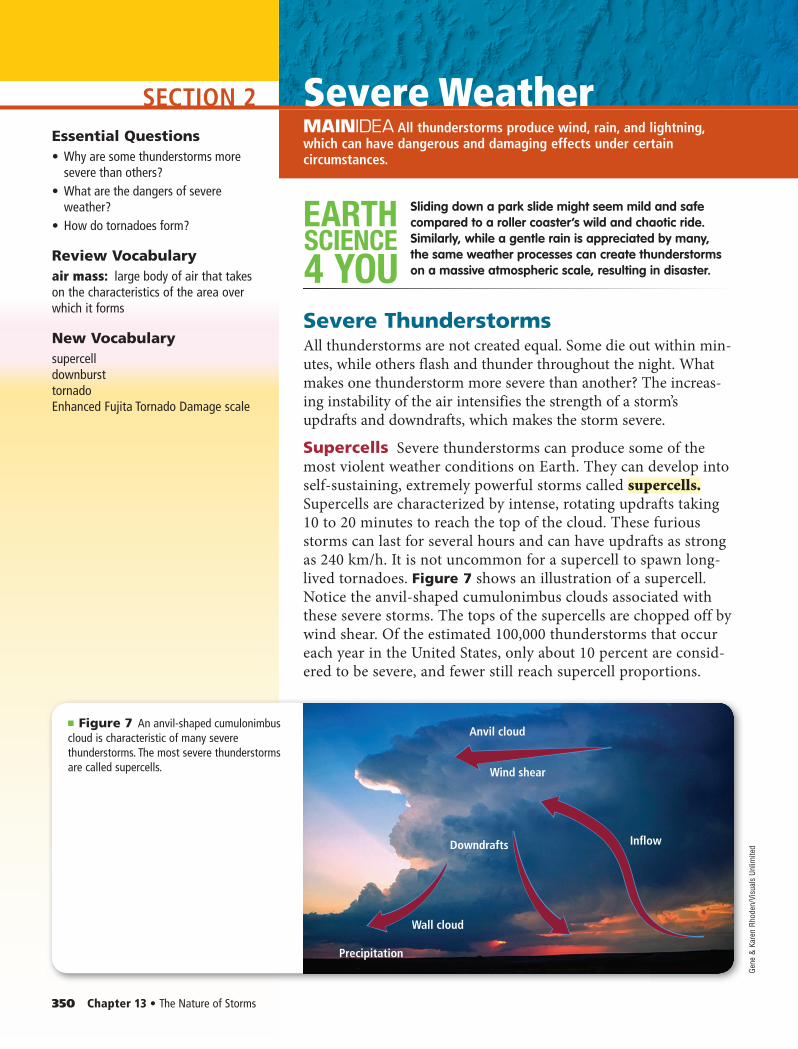
SECTION 2
Precipitation
Wall cloud
Downdrafts Inflow
Wind shear
Anvil cloud
350 Chapter 13 • The Nature of Storms
MAINIDEA All thunderstorms produce wind, rain, and lightning, which can have dangerous and damaging effects under certain circumstances.
SCIENCE
4 YOU
EARTH Sliding down a park slide might seem mild and safe compared to a roller coaster’s wild and chaotic ride. Similarly, while a gentle rain is appreciated by many, the same weather processes can create thunderstorms on a massive atmospheric scale, resulting in disaster.
Severe ThunderstormsAll thunderstorms are not created equal. Some die out within min-utes, while others flash and thunder throughout the night. What makes one thunderstorm more severe than another? The increas-ing instability of the air intensifies the strength of a storm’s updrafts and downdrafts, which makes the storm severe.
Supercells Severe thunderstorms can produce some of the most violent weather conditions on Earth. They can develop into self-sustaining, extremely powerful storms called supercells. Supercells are characterized by intense, rotating updrafts taking 10 to 20 minutes to reach the top of the cloud. These furious storms can last for several hours and can have updrafts as strong as 240 km/h. It is not uncommon for a supercell to spawn long-lived tornadoes. Figure 7 shows an illustration of a supercell. Notice the anvil-shaped cumulonimbus clouds associated with these severe storms. The tops of the supercells are chopped off by wind shear. Of the estimated 100,000 thunderstorms that occur each year in the United States, only about 10 percent are consid-ered to be severe, and fewer still reach supercell proportions.
Essential Questions• Why are some thunderstorms more
severe than others?• What are the dangers of severe
weather?• How do tornadoes form?
Review Vocabularyair mass: large body of air that takes on the characteristics of the area over which it forms
New VocabularysupercelldownbursttornadoEnhanced Fujita Tornado Damage scale
■ Figure 7 An anvil-shaped cumulonimbus cloud is characteristic of many severe thunderstorms. The most severe thunderstorms are called supercells.
Severe Weather
Gene
& K
aren
Rho
den/
Visu
als
Unlim
ited
0350_0354_ESGEU_S_C13_S2_658713.indd 3500350_0354_ESGEU_S_C13_S2_658713.indd 350 2/12/11 11:36 AM2/12/11 11:36 AM
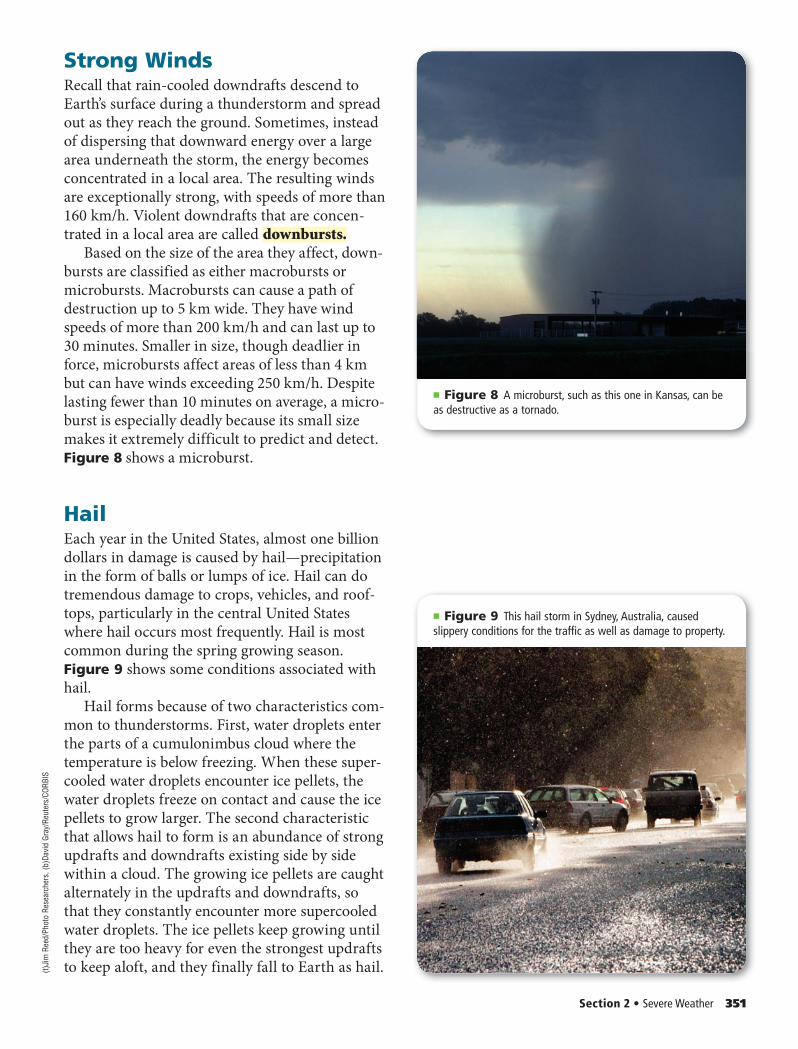
Section 2 • Severe Weather 351
Strong WindsRecall that rain-cooled downdrafts descend to Earth’s surface during a thunderstorm and spread out as they reach the ground. Sometimes, instead of dispersing that downward energy over a large area underneath the storm, the energy becomes concentrated in a local area. The resulting winds are exceptionally strong, with speeds of more than 160 km/h. Violent downdrafts that are concen-trated in a local area are called downbursts.
Based on the size of the area they affect, down-bursts are classified as either macrobursts or microbursts. Macrobursts can cause a path of destruction up to 5 km wide. They have wind speeds of more than 200 km/h and can last up to 30 minutes. Smaller in size, though deadlier in force, microbursts affect areas of less than 4 km but can have winds exceeding 250 km/h. Despite lasting fewer than 10 minutes on average, a micro-burst is especially deadly because its small size makes it extremely difficult to predict and detect. Figure 8 shows a microburst.
HailEach year in the United States, almost one billion dollars in damage is caused by hail—precipitation in the form of balls or lumps of ice. Hail can do tremendous damage to crops, vehicles, and roof-tops, particularly in the central United States where hail occurs most frequently. Hail is most common during the spring growing season. Figure 9 shows some conditions associated with hail.
Hail forms because of two characteristics com-mon to thunderstorms. First, water droplets enter the parts of a cumulonimbus cloud where the temperature is below freezing. When these super-cooled water droplets encounter ice pellets, the water droplets freeze on contact and cause the ice pellets to grow larger. The second characteristic that allows hail to form is an abundance of strong updrafts and downdrafts existing side by side within a cloud. The growing ice pellets are caught alternately in the updrafts and downdrafts, so that they constantly encounter more supercooled water droplets. The ice pellets keep growing until they are too heavy for even the strongest updrafts to keep aloft, and they finally fall to Earth as hail.
■ Figure 9 This hail storm in Sydney, Australia, caused slippery conditions for the traffic as well as damage to property.
■ Figure 8 A microburst, such as this one in Kansas, can be as destructive as a tornado.
(t)Ji
m R
eed/
Phot
o Re
sear
cher
s, (b
)Dav
id G
ray/
Reut
ers/
CORB
IS
0350_0354_ESGEU_S_C13_S2_658713.indd 3510350_0354_ESGEU_S_C13_S2_658713.indd 351 2/12/11 11:36 AM2/12/11 11:36 AM
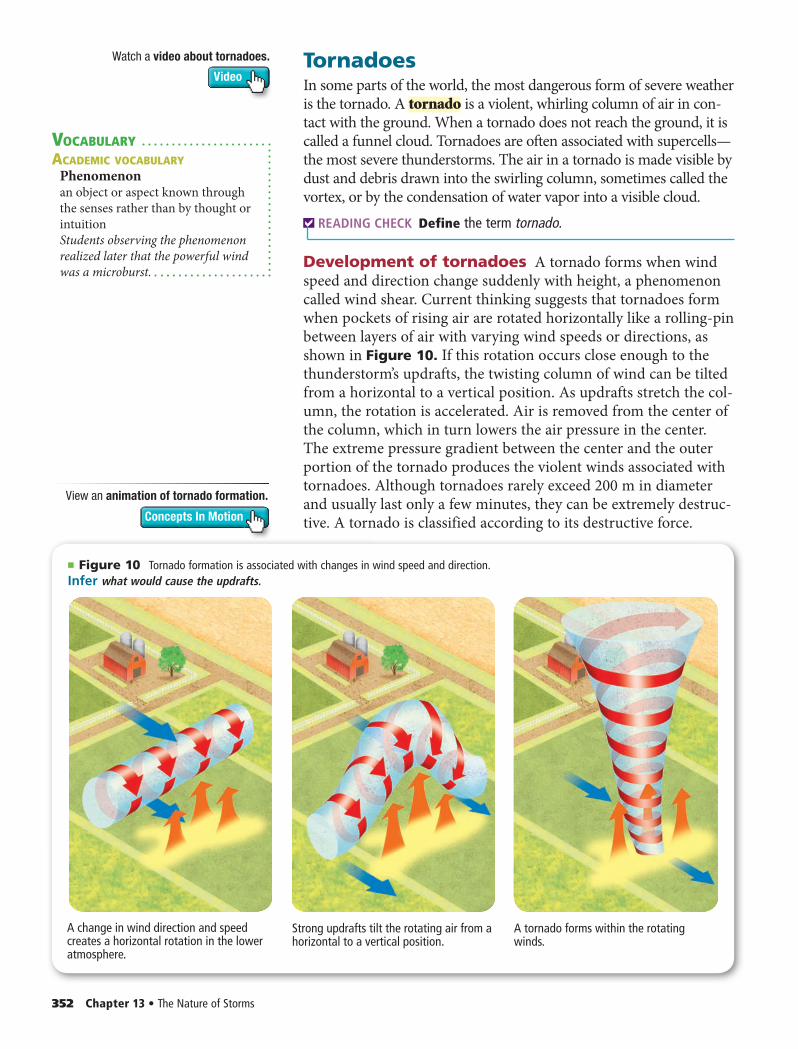
352 Chapter 13 • The Nature of Storms
VOCABULARYACADEMIC VOCABULARY
Phenomenonan object or aspect known through the senses rather than by thought or intuitionStudents observing the phenomenon realized later that the powerful wind was a microburst.
TornadoesIn some parts of the world, the most dangerous form of severe weather is the tornado. A tornado is a violent, whirling column of air in con-tact with the ground. When a tornado does not reach the ground, it is called a funnel cloud. Tornadoes are often associated with supercells—the most severe thunderstorms. The air in a tornado is made visible by dust and debris drawn into the swirling column, sometimes called the vortex, or by the condensation of water vapor into a visible cloud.
READING CHECK Define the term tornado.
Development of tornadoes A tornado forms when wind speed and direction change suddenly with height, a phenomenon called wind shear. Current thinking suggests that tornadoes form when pockets of rising air are rotated horizontally like a rolling-pin between layers of air with varying wind speeds or directions, as shown in Figure 10. If this rotation occurs close enough to the thunderstorm’s updrafts, the twisting column of wind can be tilted from a horizontal to a vertical position. As updrafts stretch the col-umn, the rotation is accelerated. Air is removed from the center of the column, which in turn lowers the air pressure in the center. The extreme pressure gradient between the center and the outer portion of the tornado produces the violent winds associated with tornadoes. Although tornadoes rarely exceed 200 m in diameter and usually last only a few minutes, they can be extremely destruc-tive. A tornado is classified according to its destructive force.
■ Figure 10 Tornado formation is associated with changes in wind speed and direction. Infer what would cause the updrafts.
A change in wind direction and speed creates a horizontal rotation in the lower atmosphere.
Strong updrafts tilt the rotating air from a horizontal to a vertical position.
A tornado forms within the rotating winds.
View an animation of tornado formation.
Concepts In Motion
Video
Watch a video about tornadoes.
0350_0354_ESGEU_S_C13_S2_658713.indd 3520350_0354_ESGEU_S_C13_S2_658713.indd 352 2/12/11 11:36 AM2/12/11 11:36 AM
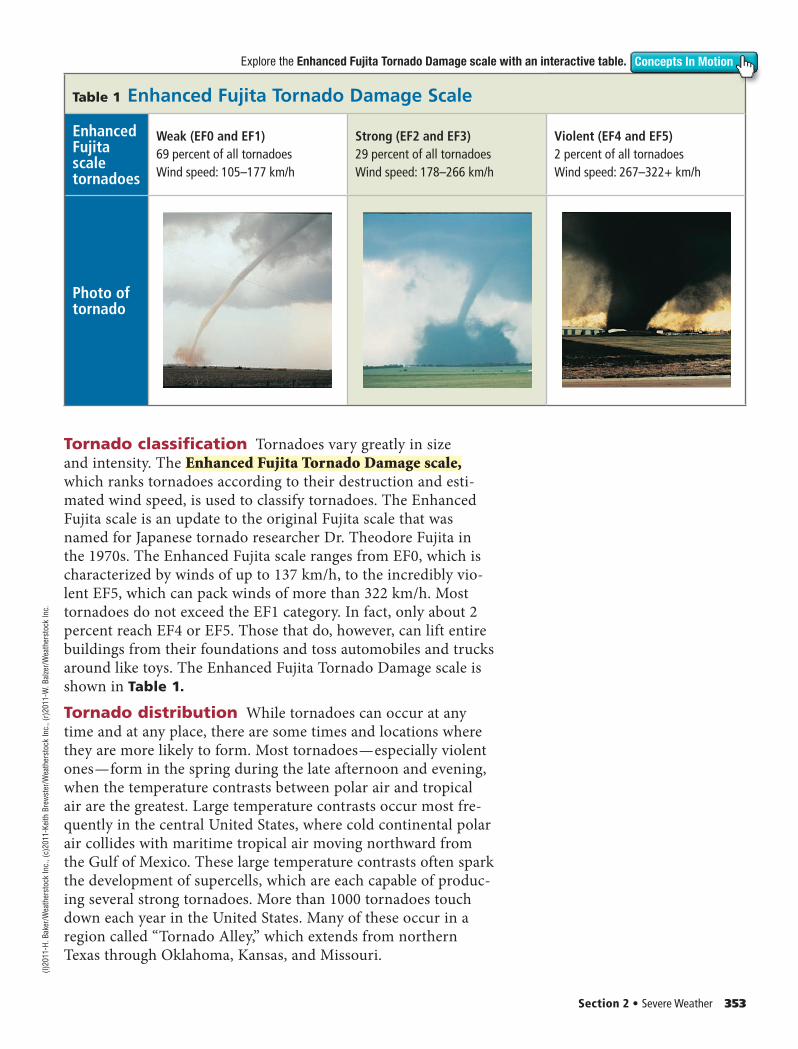
Section 2 • Severe Weather 353
Tornado classification Tornadoes vary greatly in size and intensity. The Enhanced Fujita Tornado Damage scale,which ranks tornadoes according to their destruction and esti-mated wind speed, is used to classify tornadoes. The Enhanced Fujita scale is an update to the original Fujita scale that was named for Japanese tornado researcher Dr. Theodore Fujita in the 1970s. The Enhanced Fujita scale ranges from EF0, which is characterized by winds of up to 137 km/h, to the incredibly vio-lent EF5, which can pack winds of more than 322 km/h. Most tornadoes do not exceed the EF1 category. In fact, only about 2 percent reach EF4 or EF5. Those that do, however, can lift entire buildings from their foundations and toss automobiles and trucks around like toys. The Enhanced Fujita Tornado Damage scale is shown in Table 1.
Tornado distribution While tornadoes can occur at any time and at any place, there are some times and locations where they are more likely to form. Most tornadoes — especially violent ones — form in the spring during the late afternoon and evening, when the temperature contrasts between polar air and tropical air are the greatest. Large temperature contrasts occur most fre-quently in the central United States, where cold con tinental polar air collides with maritime tropical air moving northward from the Gulf of Mexico. These large temperature contrasts often spark the development of supercells, which are each capable of produc-ing several strong tornadoes. More than 1000 tornadoes touch down each year in the United States. Many of these occur in a region called “Tornado Alley,” which extends from northern Texas through Oklahoma, Kansas, and Missouri.
Table 1 Enhanced Fujita Tornado Damage Scale
Enhanced Fujita scale tornadoes
Weak (EF0 and EF1)69 percent of all tornadoesWind speed: 105–177 km/h
Strong (EF2 and EF3)29 percent of all tornadoesWind speed: 178–266 km/h
Violent (EF4 and EF5)2 percent of all tornadoesWind speed: 267–322+ km/h
Photo of tornado
Concepts In MotionExplore the Enhanced Fujita Tornado Damage scale with an interactive table.
(l)20
11-H
. Bak
er/W
eath
erst
ock
Inc.
, (c)
2011
-Kei
th B
rew
ster
/Wea
ther
stoc
k In
c., (
r)20
11-W
. Bal
zer/W
eath
erst
ock
Inc.
0350_0354_ESGEU_S_C13_S2_658713.indd 3530350_0354_ESGEU_S_C13_S2_658713.indd 353 6/13/11 1:46 PM6/13/11 1:46 PM
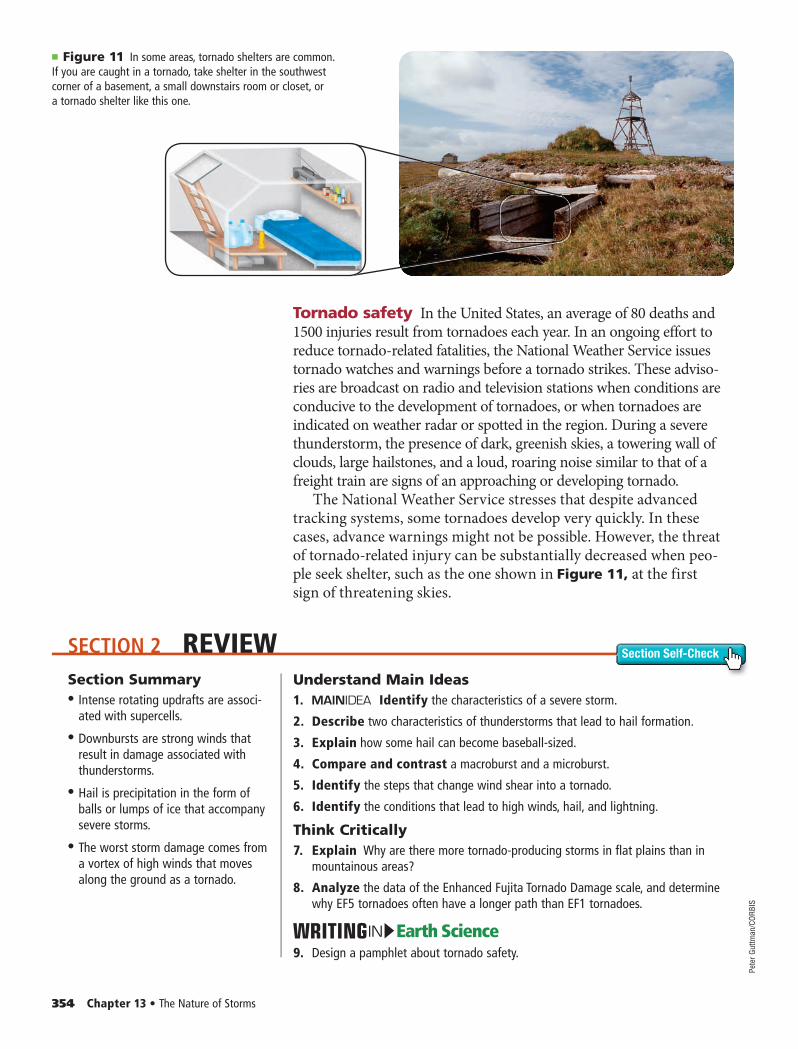
SECTION 2 REVIEW Section Self-Check
354 Chapter 13 • The Nature of Storms
Tornado safety In the United States, an average of 80 deaths and 1500 injuries result from tornadoes each year. In an ongoing effort to reduce tornado-related fatalities, the National Weather Service issues tor nado watches and warnings before a tornado strikes. These adviso-ries are broadcast on radio and television stations when conditions are conducive to the development of tornadoes, or when tornadoes are indicated on weather radar or spotted in the region. During a severe thunderstorm, the presence of dark, greenish skies, a towering wall of clouds, large hailstones, and a loud, roaring noise similar to that of a freight train are signs of an approaching or developing tornado.
The National Weather Service stresses that despite advanced tracking systems, some tornadoes develop very quickly. In these cases, advance warnings might not be possible. However, the threat of tornado-related injury can be substantially decreased when peo-ple seek shelter, such as the one shown in Figure 11, at the first sign of threatening skies.
■ Figure 11 In some areas, tornado shelters are common. If you are caught in a tornado, take shelter in the southwest corner of a basement, a small downstairs room or closet, or a tornado shelter like this one.
Section Summary• • Intense rotating updrafts are associ-
ated with supercells.
• • Downbursts are strong winds that result in damage associated with thunderstorms.
• • Hail is precipitation in the form of balls or lumps of ice that accompany severe storms.
• • The worst storm damage comes from a vortex of high winds that moves along the ground as a tornado.
Understand Main Ideas1. Identify the characteristics of a severe storm.
2. Describe two characteristics of thunderstorms that lead to hail formation.
3. Explain how some hail can become baseball-sized.
4. Compare and contrast a macroburst and a microburst.
5. Identify the steps that change wind shear into a tornado.
6. Identify the conditions that lead to high winds, hail, and lightning.
Think Critically7. Explain Why are there more tornado-producing storms in flat plains than in
mountainous areas?
8. Analyze the data of the Enhanced Fujita Tornado Damage scale, and determine why EF5 tornadoes often have a longer path than EF1 tornadoes.
Earth ScienceIN9. Design a pamphlet about tornado safety.
Pete
r Gut
tman
/COR
BIS
0350_0354_ESGEU_S_C13_S2_658713.indd 3540350_0354_ESGEU_S_C13_S2_658713.indd 354 6/13/11 1:46 PM6/13/11 1:46 PM
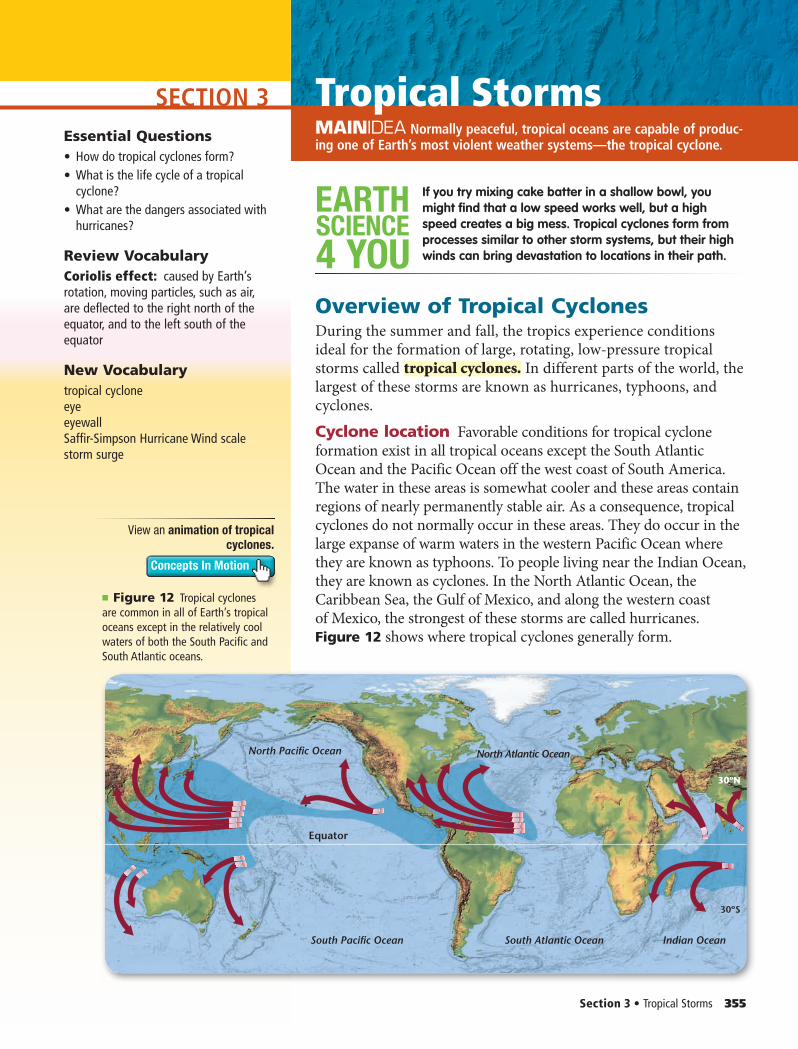
SECTION 3
Section 3 • Tropical Storms 355
MAINIDEA Energy is transferred throughout Earth’s atmosphere. MAINIDEA Normally peaceful, tropical oceans are capable of produc-ing one of Earth’s most violent weather systems—the tropical cyclone.
SCIENCE
4 YOU
EARTH If you try mixing cake batter in a shallow bowl, you might find that a low speed works well, but a high speed creates a big mess. Tropical cyclones form from processes similar to other storm systems, but their high winds can bring devastation to locations in their path.
Overview of Tropical CyclonesDuring the summer and fall, the tropics experience conditions ideal for the formation of large, rotating, low-pressure tropical storms called tropical cyclones. In different parts of the world, the largest of these storms are known as hurricanes, typhoons, and cyclones.Cyclone location Favorable conditions for tropical cyclone formation exist in all tropical oceans except the South Atlantic Ocean and the Pacific Ocean off the west coast of South America. The water in these areas is somewhat cooler and these areas contain regions of nearly permanently stable air. As a consequence, tropical cyclones do not normally occur in these areas. They do occur in the large expanse of warm waters in the western Pacific Ocean where they are known as typhoons. To people living near the Indian Ocean, they are known as cyclones. In the North Atlantic Ocean, the Caribbean Sea, the Gulf of Mexico, and along the western coast of Mexico, the strongest of these storms are called hurricanes. Figure 12 shows where tropical cyclones generally form.
Essential Questions• How do tropical cyclones form?• What is the life cycle of a tropical
cyclone?• What are the dangers associated with
hurricanes?
Review VocabularyCoriolis effect: caused by Earth’s rotation, moving particles, such as air, are deflected to the right north of the equator, and to the left south of the equator
New Vocabularytropical cycloneeyeeyewallSaffir-Simpson Hurricane Wind scalestorm surge
30ºN
30ºS
Equator
North Pacific Ocean North Atlantic Ocean
South Pacific Ocean South Atlantic Ocean Indian Ocean
■ Figure 12 Tropical cyclones are common in all of Earth’s tropical oceans except in the relatively cool waters of both the South Pacific and South Atlantic oceans.
View an animation of tropical
cyclones.
Concepts In Motion
Tropical Storms
0355_0360_ESGEU_S_C13_S3_658713.indd 3550355_0360_ESGEU_S_C13_S3_658713.indd 355 2/12/11 11:36 AM2/12/11 11:36 AM
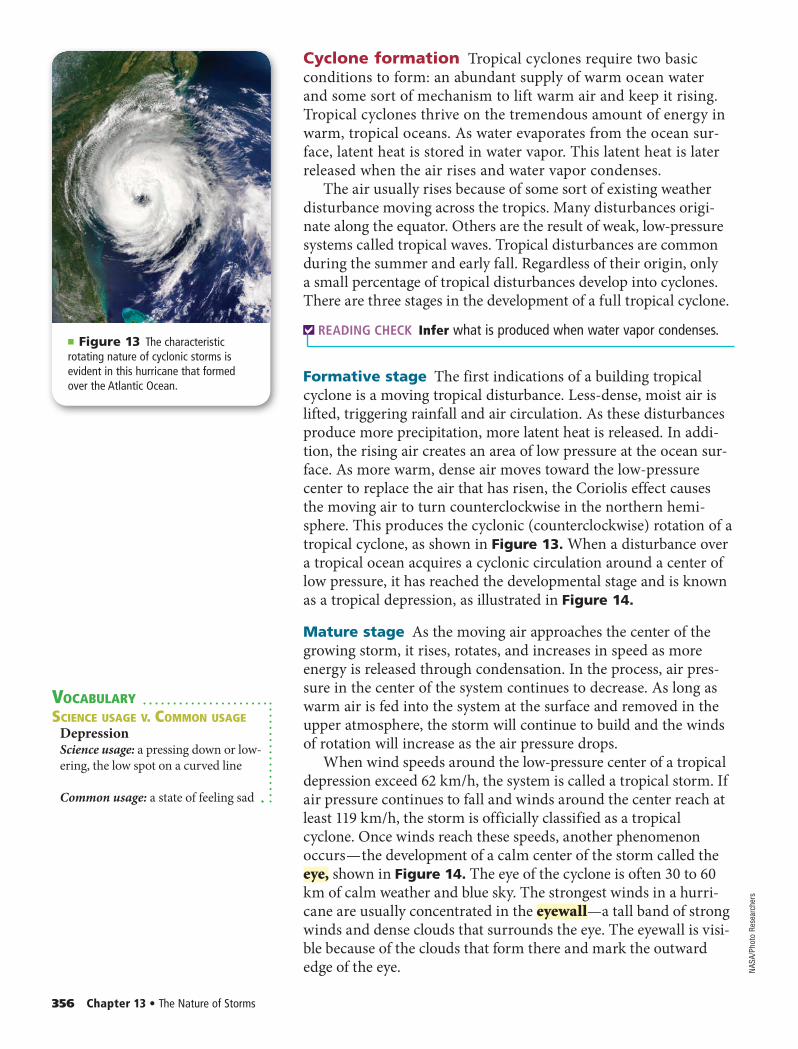
356 Chapter 13 • The Nature of Storms
Cyclone formation Tropical cyclones require two basic conditions to form: an abundant supply of warm ocean water and some sort of mechanism to lift warm air and keep it rising. Tropical cyclones thrive on the tremendous amount of energy in warm, tropical oceans. As water evaporates from the ocean sur-face, latent heat is stored in water vapor. This latent heat is later released when the air rises and water vapor condenses.
The air usually rises because of some sort of existing weather disturbance moving across the tropics. Many disturbances origi-nate along the equator. Others are the result of weak, low-pressure systems called tropical waves. Tropical disturbances are common during the summer and early fall. Regardless of their origin, only a small percentage of tropical disturbances develop into cyclones. There are three stages in the development of a full tropical cyclone.
READING CHECK Infer what is produced when water vapor condenses.
Formative stage The first indications of a building tropical cyclone is a moving tropical disturbance. Less-dense, moist air is lifted, triggering rainfall and air circulation. As these disturbances produce more precipitation, more latent heat is released. In addi-tion, the rising air creates an area of low pressure at the ocean sur-face. As more warm, dense air moves toward the low-pressure center to replace the air that has risen, the Coriolis effect causes the moving air to turn counterclockwise in the northern hemi-sphere. This produces the cyclonic (counterclockwise) rotation of a tropical cyclone, as shown in Figure 13. When a disturbance over a tropical ocean acquires a cyclonic circulation around a center of low pressure, it has reached the developmental stage and is known as a tropical depression, as illustrated in Figure 14.
Mature stage As the moving air approaches the center of the growing storm, it rises, rotates, and increases in speed as more energy is released through condensation. In the process, air pres-sure in the center of the system continues to decrease. As long as warm air is fed into the system at the surface and removed in the upper atmosphere, the storm will continue to build and the winds of rotation will increase as the air pressure drops.
When wind speeds around the low-pressure center of a tropical depression exceed 62 km/h, the system is called a tropical storm. If air pressure continues to fall and winds around the center reach at least 119 km/h, the storm is officially classified as a tropical cyclone. Once winds reach these speeds, another phenomenon occurs — the development of a calm center of the storm called the eye, shown in Figure 14. The eye of the cyclone is often 30 to 60 km of calm weather and blue sky. The strongest winds in a hurri-cane are usually concentrated in the eyewall—a tall band of strong winds and dense clouds that surrounds the eye. The eyewall is visi-ble because of the clouds that form there and mark the outward edge of the eye.
■ Figure 13 The characteristic rotating nature of cyclonic storms is evident in this hurricane that formed over the Atlantic Ocean.
VOCABULARYSCIENCE USAGE V. COMMON USAGE
DepressionScience usage: a pressing down or low-ering, the low spot on a curved line
Common usage: a state of feeling sad
NASA
/Pho
to R
esea
rche
rs
0355_0360_ESGEU_S_C13_S3_658713.indd 3560355_0360_ESGEU_S_C13_S3_658713.indd 356 2/12/11 11:37 AM2/12/11 11:37 AM
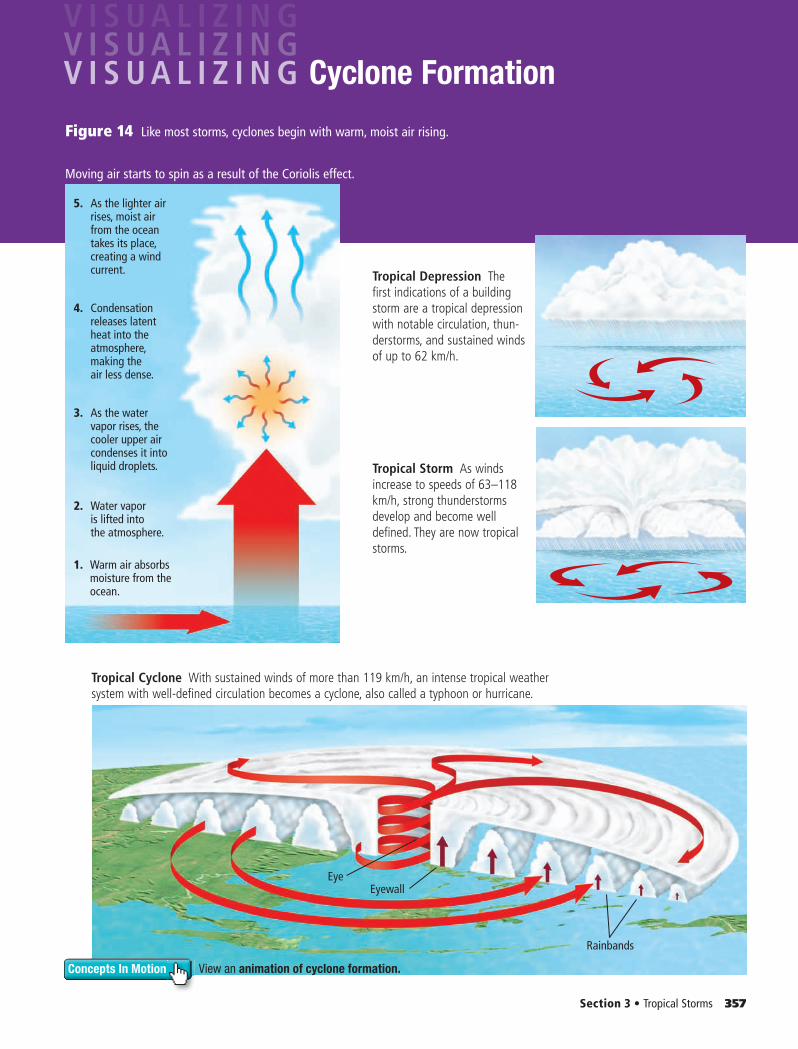
EyeEyewall
Rainbands
1. Warm air absorbs moisture from the ocean.
2. Water vapor is lifted into the atmosphere.
3. As the water vapor rises, the cooler upper air condenses it into liquid droplets.
4. Condensation releases latent heat into the atmosphere, making the air less dense.
5. As the lighter air rises, moist air from the ocean takes its place, creating a wind current.
Section 3 • Tropical Storms 357
Concepts In Motion View an animation of cyclone formation.
Cyclone Formation
Figure 14 Like most storms, cyclones begin with warm, moist air rising.
Moving air starts to spin as a result of the Coriolis effect.
Tropical Depression The first indications of a building storm are a tropical depression with notable circulation, thun-derstorms, and sustained winds of up to 62 km/h.
Tropical Storm As winds increase to speeds of 63–118 km/h, strong thunderstorms develop and become well defined. They are now tropical storms.
Tropical Cyclone With sustained winds of more than 119 km/h, an intense tropical weather system with well-defined circulation becomes a cyclone, also called a typhoon or hurricane.
0355_0360_ESGEU_S_C13_S3_658713.indd 3570355_0360_ESGEU_S_C13_S3_658713.indd 357 2/12/11 11:37 AM2/12/11 11:37 AM
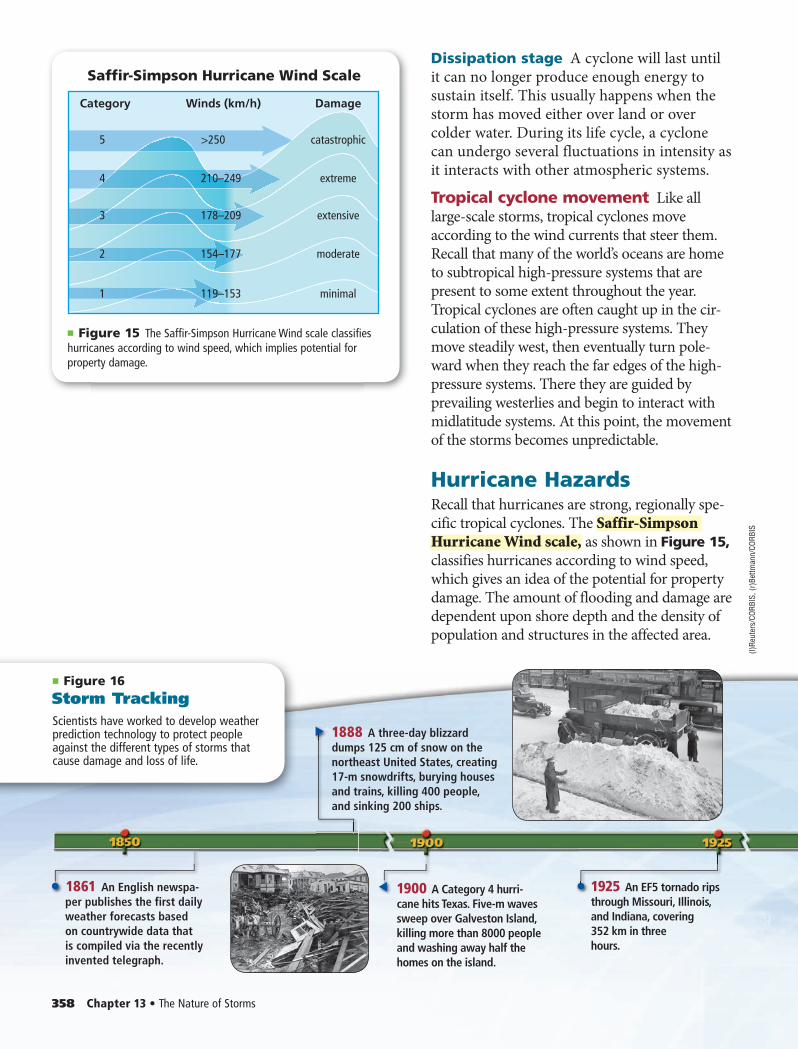
Dissipation stage A cyclone will last until it can no longer produce enough energy to sustain itself. This usually happens when the storm has moved either over land or over colder water. During its life cycle, a cyclone can undergo several fluctuations in intensity as it interacts with other atmospheric systems.
Tropical cyclone movement Like all large-scale storms, tropical cyclones move according to the wind currents that steer them. Recall that many of the world’s oceans are home to subtropical high-pressure systems that are present to some extent throughout the year. Tropical cyclones are often caught up in the cir-culation of these high-pressure systems. They move steadily west, then eventually turn pole-ward when they reach the far edges of the high-pressure systems. There they are guided by prevailing westerlies and begin to interact with midlatitude systems. At this point, the movement of the storms becomes unpredictable.
Hurricane HazardsRecall that hurricanes are strong, regionally spe-cific tropical cyclones. The Saffir-Simpson Hurricane Wind scale, as shown in Figure 15, classifies hurricanes according to wind speed, which gives an idea of the potential for property damage. The amount of flooding and damage are dependent upon shore depth and the density of population and structures in the affected area.
■ Figure 15 The Saffir-Simpson Hurricane Wind scale classifies hurricanes according to wind speed, which implies potential for property damage.
■ Figure 16Storm TrackingScientists have worked to develop weather prediction technology to protect people against the different types of storms that cause damage and loss of life.
1900 A Category 4 hurri-cane hits Texas. Five-m waves sweep over Galveston Island, killing more than 8000 people and washing away half the homes on the island.
1861 An English newspa-per publishes the first daily weather forecasts based on countrywide data that is compiled via the recently invented telegraph.
1925 An EF5 tornado rips through Missouri, Illinois, and Indiana, covering 352 km in three hours.
358 Chapter 13 • The Nature of Storms
Category Damage
5
2
4
3
1
Winds (km/h)
>250
210–249
178–209
154–177
119–153
catastrophic
extreme
extensive
moderate
minimal
Saffir-Simpson Hurricane Wind Scale
1888 A three-day blizzard dumps 125 cm of snow on the northeast United States, creating 17-m snowdrifts, burying houses and trains, killing 400 people, and sinking 200 ships.
(l)
Reut
ers/
CORB
IS, (
r)Be
ttman
n/CO
RBIS
0355_0360_ESGEU_S_C13_S3_658713.indd 3580355_0360_ESGEU_S_C13_S3_658713.indd 358 2/12/11 11:37 AM2/12/11 11:37 AM
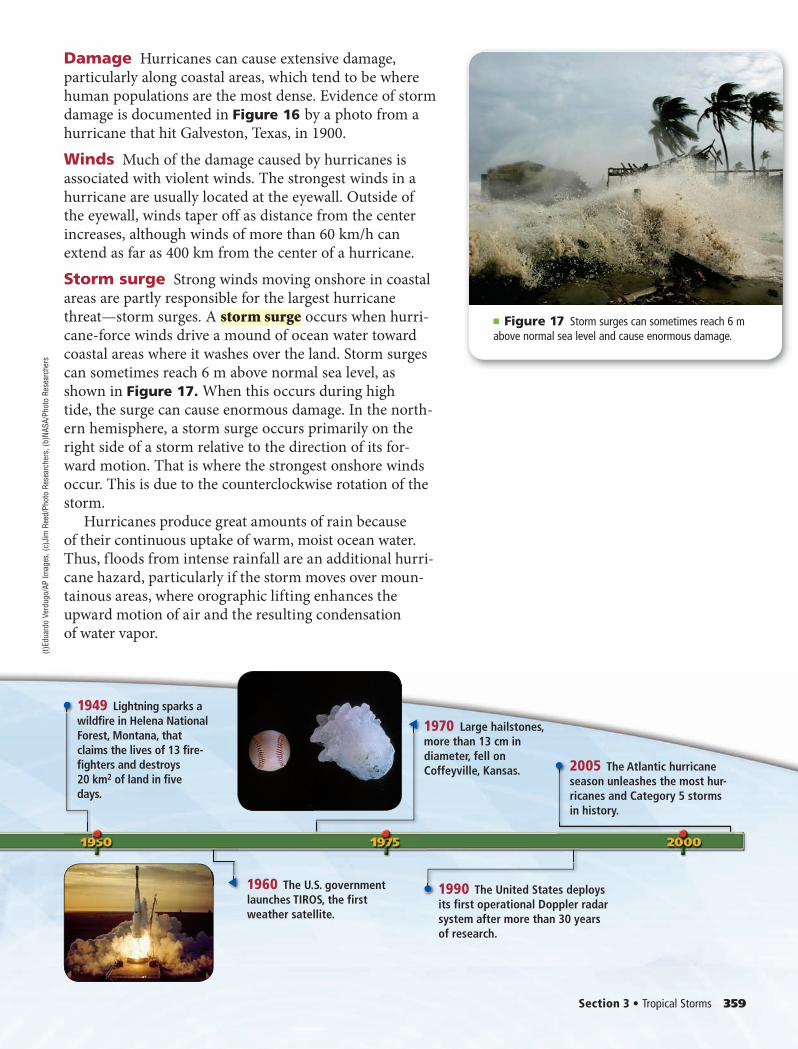
Damage Hurricanes can cause extensive damage, particularly along coastal areas, which tend to be where human populations are the most dense. Evidence of storm damage is documented in Figure 16 by a photo from a hurricane that hit Galveston, Texas, in 1900.Winds Much of the damage caused by hurricanes is associated with violent winds. The strongest winds in a hurricane are usually located at the eyewall. Outside of the eyewall, winds taper off as distance from the center increases, although winds of more than 60 km/h can extend as far as 400 km from the center of a hurricane.Storm surge Strong winds moving onshore in coastal areas are partly responsible for the largest hurricane threat —storm surges. A storm surge occurs when hurri-cane-force winds drive a mound of ocean water toward coastal areas where it washes over the land. Storm surges can sometimes reach 6 m above normal sea level, as shown in Figure 17. When this occurs during high tide, the surge can cause enormous damage. In the north-ern hemisphere, a storm surge occurs primarily on the right side of a storm relative to the direction of its for-ward motion. That is where the strongest onshore winds occur. This is due to the counterclockwise rotation of the storm.
Hurricanes produce great amounts of rain because of their continuous uptake of warm, moist ocean water. Thus, floods from intense rainfall are an additional hurri-cane hazard, particularly if the storm moves over moun-tainous areas, where orographic lifting enhances the upward motion of air and the resulting condensation of water vapor.
■ Figure 17 Storm surges can sometimes reach 6 m above normal sea level and cause enormous damage.
1949 Lightning sparks a wildfire in Helena National Forest, Montana, that claims the lives of 13 fire-fighters and destroys 20 km2 of land in five days.
1970 Large hailstones, more than 13 cm in diameter, fell on Coffeyville, Kansas.
2005 The Atlantic hurricane season unleashes the most hur-ricanes and Category 5 storms in history.
1960 The U.S. government launches TIROS, the first weather satellite.
1990 The United States deploys its first operational Doppler radar system after more than 30 years of research.
Section 3 • Tropical Storms 359
(t)Ed
uard
o Ve
rdug
o/AP
Imag
es, (
c)Ji
m R
eed/
Phot
o Re
sear
cher
s, (b
)NAS
A/Ph
oto
Rese
arch
ers
0355_0360_ESGEU_S_C13_S3_658713.indd 3590355_0360_ESGEU_S_C13_S3_658713.indd 359 2/12/11 11:37 AM2/12/11 11:37 AM
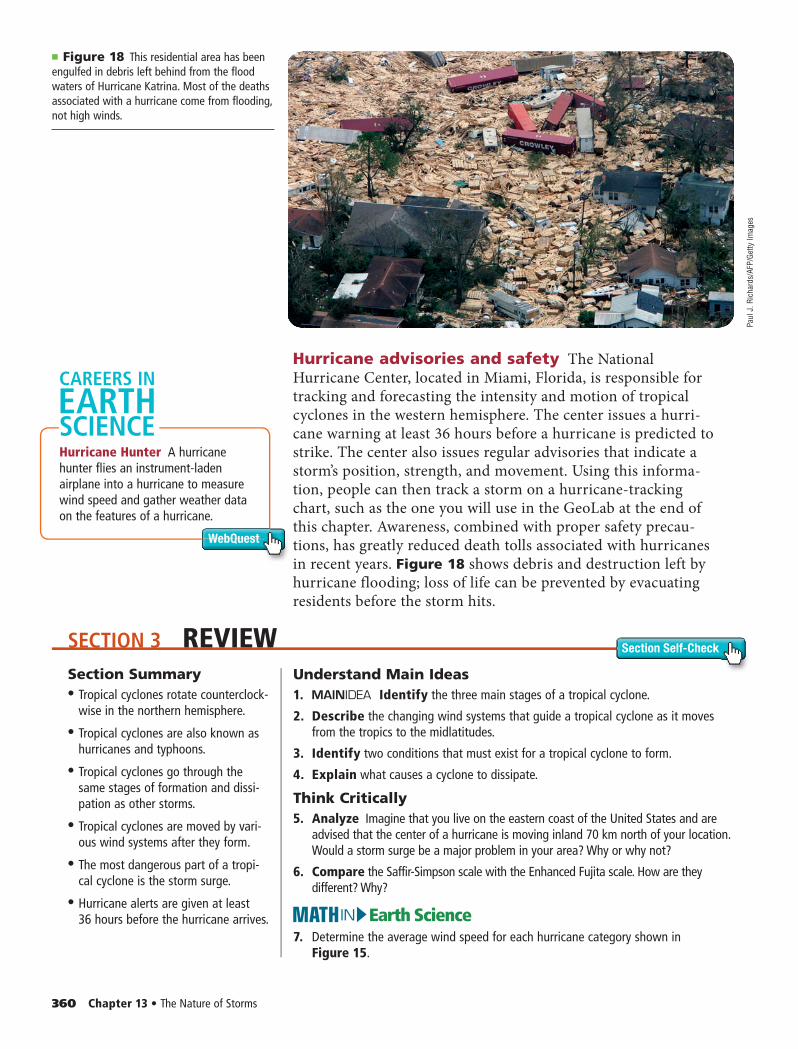
SECTION 3 REVIEW Section Self-Check
360 Chapter 13 • The Nature of Storms
Hurricane advisories and safety The National Hurricane Center, located in Miami, Florida, is responsible for tracking and forecasting the intensity and motion of tropical cyclones in the western hemisphere. The center issues a hurri-cane warning at least 36 hours before a hurricane is predicted to strike. The center also issues regular advisories that indicate a storm’s position, strength, and movement. Using this informa-tion, people can then track a storm on a hurricane-tracking chart, such as the one you will use in the GeoLab at the end of this chapter. Awareness, combined with proper safety precau-tions, has greatly reduced death tolls associated with hurricanes in recent years. Figure 18 shows debris and destruction left by hurricane flooding; loss of life can be prevented by evacuating residents before the storm hits.
■ Figure 18 This residential area has been engulfed in debris left behind from the flood waters of Hurricane Katrina. Most of the deaths associated with a hurricane come from flooding, not high winds.
Hurricane Hunter A hurricane hunter flies an instrument-laden airplane into a hurricane to measure wind speed and gather weather data on the features of a hurricane.
WebQuest
CAREERS IN
SCIENCEEARTH
Section Summary• • Tropical cyclones rotate counterclock-
wise in the northern hemisphere.
• • Tropical cyclones are also known as hurricanes and typhoons.
• • Tropical cyclones go through the same stages of formation and dissi-pation as other storms.
• • Tropical cyclones are moved by vari-ous wind systems after they form.
• • The most dangerous part of a tropi-cal cyclone is the storm surge.
• • Hurricane alerts are given at least 36 hours before the hurricane arrives.
Understand Main Ideas1. Identify the three main stages of a tropical cyclone.
2. Describe the changing wind systems that guide a tropical cyclone as it moves from the tropics to the midlatitudes.
3. Identify two conditions that must exist for a tropical cyclone to form.
4. Explain what causes a cyclone to dissipate.
Think Critically5. Analyze Imagine that you live on the eastern coast of the United States and are
advised that the center of a hurricane is moving inland 70 km north of your location. Would a storm surge be a major problem in your area? Why or why not?
6. Compare the Saffir-Simpson scale with the Enhanced Fujita scale. How are they different? Why?
Earth ScienceIN7. Determine the average wind speed for each hurricane category shown in
Figure 15.
Paul
J. R
icha
rds/
AFP/
Getty
Imag
es
0355_0360_ESGEU_S_C13_S3_658713.indd 3600355_0360_ESGEU_S_C13_S3_658713.indd 360 2/12/11 11:37 AM2/12/11 11:37 AM
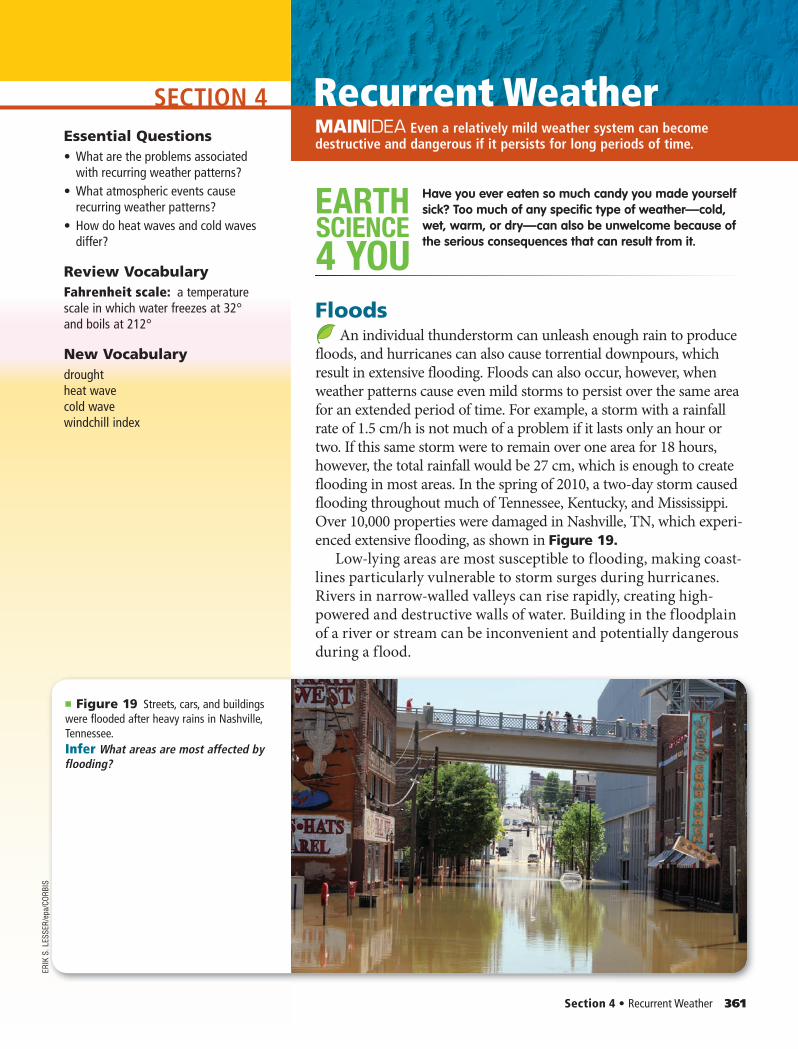
SECTION 4
Section 4 • Recurrent Weather 361
MAINIDEA Energy is transferred throughout Earth’s atmosphere.Essential Questions• What are the problems associated
with recurring weather patterns?• What atmospheric events cause
recurring weather patterns?• How do heat waves and cold waves
differ?
Review VocabularyFahrenheit scale: a temperature scale in which water freezes at 32° and boils at 212°
New Vocabularydroughtheat wavecold wavewindchill index
MAINIDEA Even a relatively mild weather system can become destructive and dangerous if it persists for long periods of time.
SCIENCE
4 YOU
EARTH Have you ever eaten so much candy you made yourself sick? Too much of any specific type of weather—cold, wet, warm, or dry—can also be unwelcome because of the serious consequences that can result from it.
Floods An individual thunderstorm can unleash enough rain to produce
floods, and hurricanes can also cause torrential downpours, which result in extensive flooding. Floods can also occur, however, when weather patterns cause even mild storms to persist over the same area for an extended period of time. For example, a storm with a rainfall rate of 1.5 cm/h is not much of a problem if it lasts only an hour or two. If this same storm were to remain over one area for 18 hours, however, the total rainfall would be 27 cm, which is enough to create flooding in most areas. In the spring of 2010, a two-day storm caused flooding throughout much of Tennessee, Kentucky, and Mississippi. Over 10,000 properties were damaged in Nashville, TN, which experi-enced extensive flooding, as shown in Figure 19.
Low-lying areas are most susceptible to flooding, making coast-lines particularly vulnerable to storm surges during hurricanes. Rivers in narrow-walled valleys can rise rapidly, creating high-powered and destructive walls of water. Building in the floodplain of a river or stream can be inconvenient and potentially dangerous during a flood.
■ Figure 19 Streets, cars, and buildings were flooded after heavy rains in Nashville, Tennessee.Infer What areas are most affected by flooding?
Recurrent WeatherER
IK S
. LES
SER/
epa/
CORB
IS
0361_0365_ESGEU_S_C13_S4_658713.indd 3610361_0365_ESGEU_S_C13_S4_658713.indd 361 2/12/11 11:37 AM2/12/11 11:37 AM
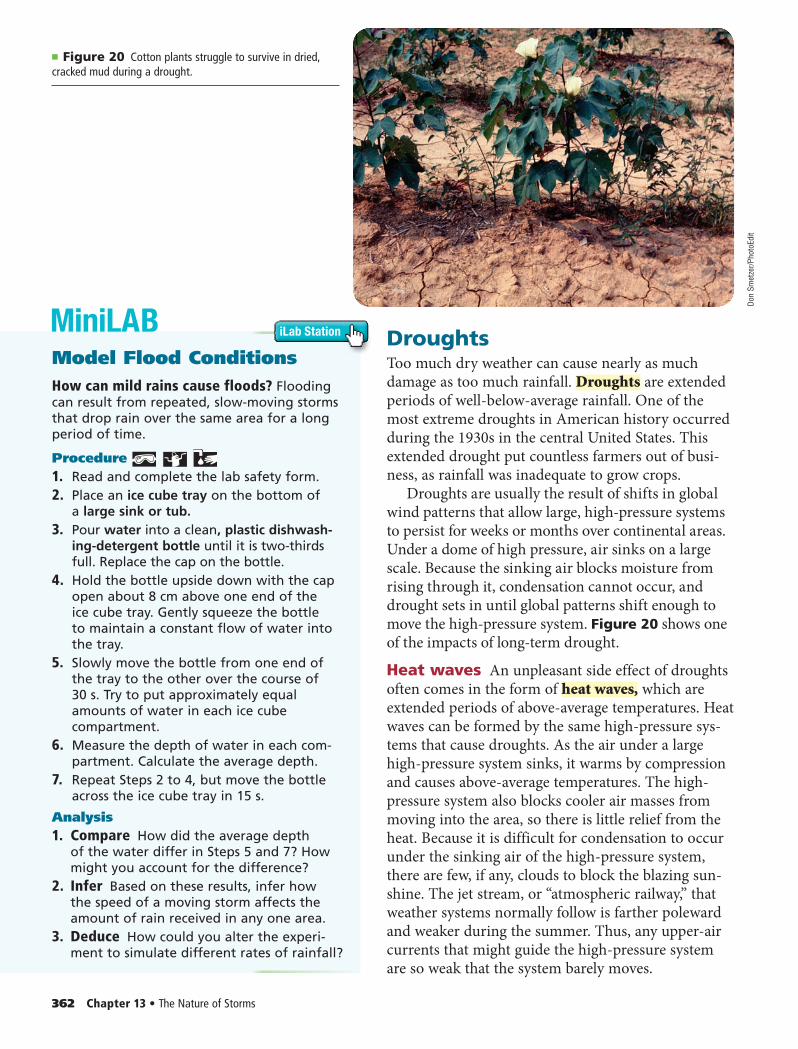
MiniLAB
362 Chapter 13 • The Nature of Storms
DroughtsToo much dry weather can cause nearly as much damage as too much rainfall. Droughts are extended periods of well-below-average rainfall. One of the most extreme droughts in American history occurred during the 1930s in the central United States. This extended drought put countless farmers out of busi-ness, as rainfall was inadequate to grow crops.
Droughts are usually the result of shifts in global wind patterns that allow large, high-pressure systems to persist for weeks or months over continental areas. Under a dome of high pressure, air sinks on a large scale. Because the sinking air blocks moisture from rising through it, condensation cannot occur, and drought sets in until global patterns shift enough to move the high-pressure system. Figure 20 shows one of the impacts of long-term drought.
Heat waves An unpleasant side effect of droughts often comes in the form of heat waves, which are extended periods of above-average temperatures. Heat waves can be formed by the same high-pressure sys-tems that cause droughts. As the air under a large high-pressure system sinks, it warms by compression and causes above-average temperatures. The high-pressure system also blocks cooler air masses from moving into the area, so there is little relief from the heat. Because it is difficult for condensation to occur under the sinking air of the high-pressure system, there are few, if any, clouds to block the blazing sun-shine. The jet stream, or “atmospheric railway,” that weather systems normally follow is farther poleward and weaker during the summer. Thus, any upper-air currents that might guide the high-pressure system are so weak that the system barely moves.
■ Figure 20 Cotton plants struggle to survive in dried, cracked mud during a drought.
Model Flood ConditionsHow can mild rains cause floods? Flooding can result from repeated, slow-moving storms that drop rain over the same area for a long period of time.
Procedure 1. Read and complete the lab safety form.2. Place an ice cube tray on the bottom of
a large sink or tub.3. Pour water into a clean, plastic dishwash-
ing-detergent bottle until it is two-thirds full. Replace the cap on the bottle.
4. Hold the bottle upside down with the cap open about 8 cm above one end of the ice cube tray. Gently squeeze the bottle to maintain a constant flow of water into the tray.
5. Slowly move the bottle from one end of the tray to the other over the course of 30 s. Try to put approximately equal amounts of water in each ice cube compartment.
6. Measure the depth of water in each com-partment. Calculate the average depth.
7. Repeat Steps 2 to 4, but move the bottle across the ice cube tray in 15 s.
Analysis1. Compare How did the average depth
of the water differ in Steps 5 and 7? How might you account for the difference?
2. Infer Based on these results, infer how the speed of a moving storm affects the amount of rain received in any one area.
3. Deduce How could you alter the experi-ment to simulate different rates of rainfall?
iLab Station
Don
Smet
zer/P
hoto
Edit
0361_0365_ESGEU_S_C13_S4_658713.indd 3620361_0365_ESGEU_S_C13_S4_658713.indd 362 2/12/11 11:37 AM2/12/11 11:37 AM
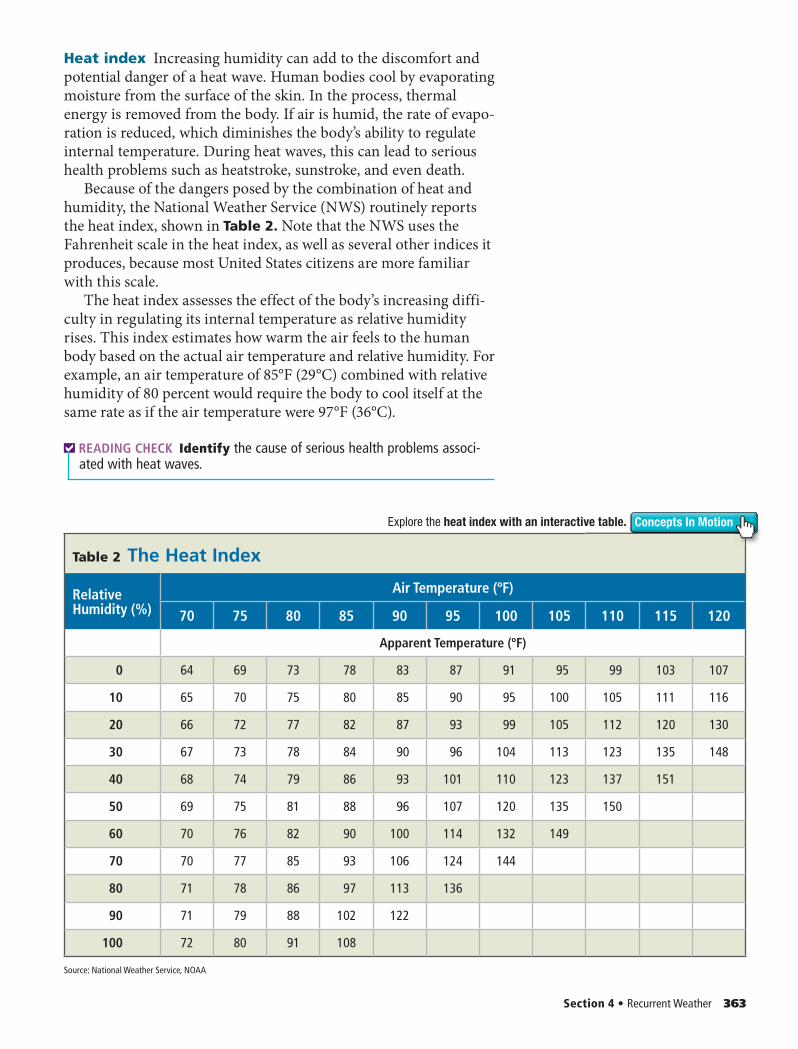
Section 4 • Recurrent Weather 363
Heat index Increasing humidity can add to the discomfort and potential danger of a heat wave. Human bodies cool by evaporating moisture from the surface of the skin. In the process, thermal energy is removed from the body. If air is humid, the rate of evapo-ration is reduced, which diminishes the body’s ability to regulate internal temperature. During heat waves, this can lead to serious health problems such as heatstroke, sunstroke, and even death.
Because of the dangers posed by the combination of heat and humidity, the National Weather Service (NWS) routinely reports the heat index, shown in Table 2. Note that the NWS uses the Fahrenheit scale in the heat index, as well as several other indices it produces, because most United States citizens are more familiar with this scale.
The heat index assesses the effect of the body’s increasing diffi-culty in regulating its internal temperature as relative humidity rises. This index estimates how warm the air feels to the human body based on the actual air temperature and relative humidity. For example, an air temperature of 85°F (29°C) combined with relative humidity of 80 percent would require the body to cool itself at the same rate as if the air temperature were 97°F (36°C).
READING CHECK Identify the cause of serious health problems associ-ated with heat waves.
Source: National Weather Service, NOAA
Table 2 The Heat Index
Relative Humidity (%)
Air Temperature (ºF)
70 75 80 85 90 95 100 105 110 115 120
Apparent Temperature (ºF)
0 64 69 73 78 83 87 91 95 99 103 107
10 65 70 75 80 85 90 95 100 105 111 116
20 66 72 77 82 87 93 99 105 112 120 130
30 67 73 78 84 90 96 104 113 123 135 148
40 68 74 79 86 93 101 110 123 137 151
50 69 75 81 88 96 107 120 135 150
60 70 76 82 90 100 114 132 149
70 70 77 85 93 106 124 144
80 71 78 86 97 113 136
90 71 79 88 102 122
100 72 80 91 108
Concepts In MotionExplore the heat index with an interactive table.
0361_0365_ESGEU_S_C13_S4_658713.indd 3630361_0365_ESGEU_S_C13_S4_658713.indd 363 2/12/11 11:37 AM2/12/11 11:37 AM
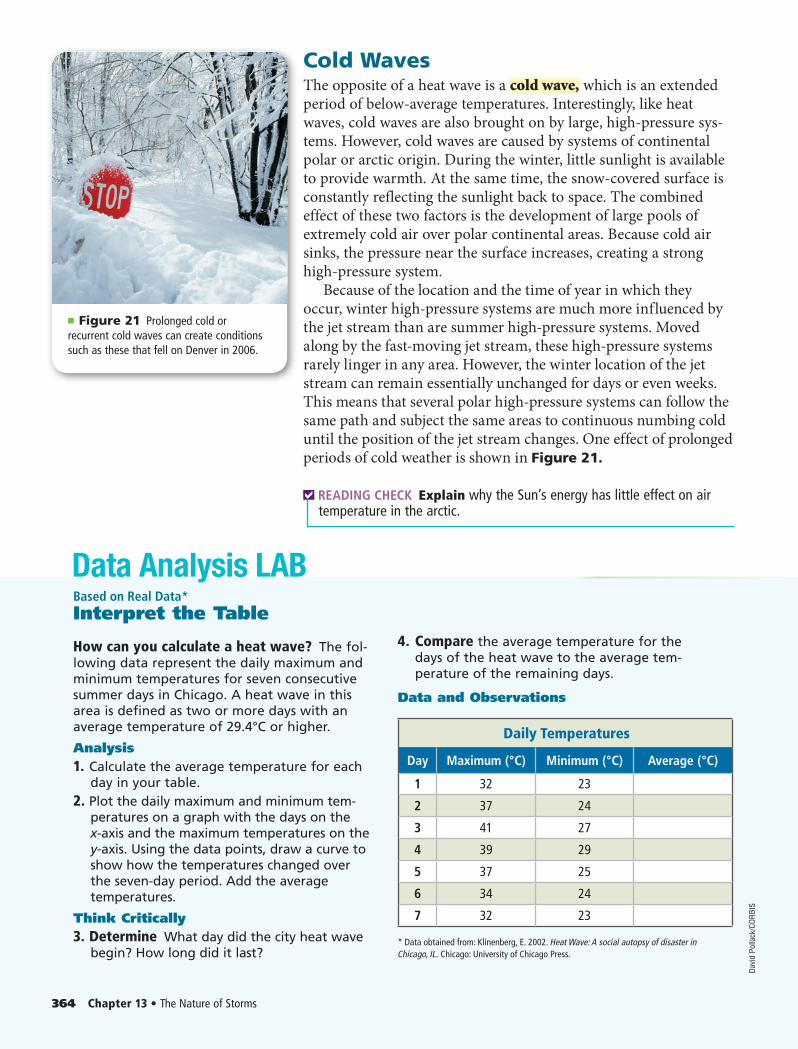
Data Analysis LAB
364 Chapter 13 • The Nature of Storms
Cold WavesThe opposite of a heat wave is a cold wave, which is an extended period of below-average temperatures. Interestingly, like heat waves, cold waves are also brought on by large, high-pressure sys-tems. However, cold waves are caused by systems of continental polar or arctic origin. During the winter, little sunlight is available to provide warmth. At the same time, the snow-covered surface is constantly reflecting the sunlight back to space. The combined effect of these two factors is the development of large pools of extremely cold air over polar continental areas. Because cold air sinks, the pressure near the surface increases, creating a strong high-pressure system.
Because of the location and the time of year in which they occur, winter high-pressure systems are much more influenced by the jet stream than are summer high-pressure systems. Moved along by the fast-moving jet stream, these high-pressure systems rarely linger in any area. However, the winter location of the jet stream can remain essentially unchanged for days or even weeks. This means that several polar high-pressure systems can follow the same path and subject the same areas to continuous numbing cold until the position of the jet stream changes. One effect of prolonged periods of cold weather is shown in Figure 21.
READING CHECK Explain why the Sun’s energy has little effect on air temperature in the arctic.
* Data obtained from: Klinenberg, E. 2002. Heat Wave: A social autopsy of disaster in Chicago, IL. Chicago: University of Chicago Press.
■ Figure 21 Prolonged cold or recurrent cold waves can create conditions such as these that fell on Denver in 2006.
Based on Real Data*Interpret the Table
How can you calculate a heat wave? The fol-lowing data represent the daily maximum and minimum temperatures for seven consecutive summer days in Chicago. A heat wave in this area is defined as two or more days with an average temperature of 29.4°C or higher.
Analysis1. Calculate the average temperature for each
day in your table.2. Plot the daily maximum and minimum tem-
peratures on a graph with the days on the x-axis and the maximum temperatures on the y-axis. Using the data points, draw a curve to show how the temperatures changed over the seven-day period. Add the average temperatures.
Think Critically3. Determine What day did the city heat wave
begin? How long did it last?
4. Compare the average temperature for the days of the heat wave to the average tem-perature of the remaining days.
Data and Observations
Daily Temperatures
Day Maximum (°C) Minimum (°C) Average (°C)
1 32 23
2 37 24
3 41 27
4 39 29
5 37 25
6 34 24
7 32 23
Davi
d Po
llack
/COR
BIS
0361_0365_ESGEU_S_C13_S4_658713.indd 3640361_0365_ESGEU_S_C13_S4_658713.indd 364 2/12/11 11:38 AM2/12/11 11:38 AM
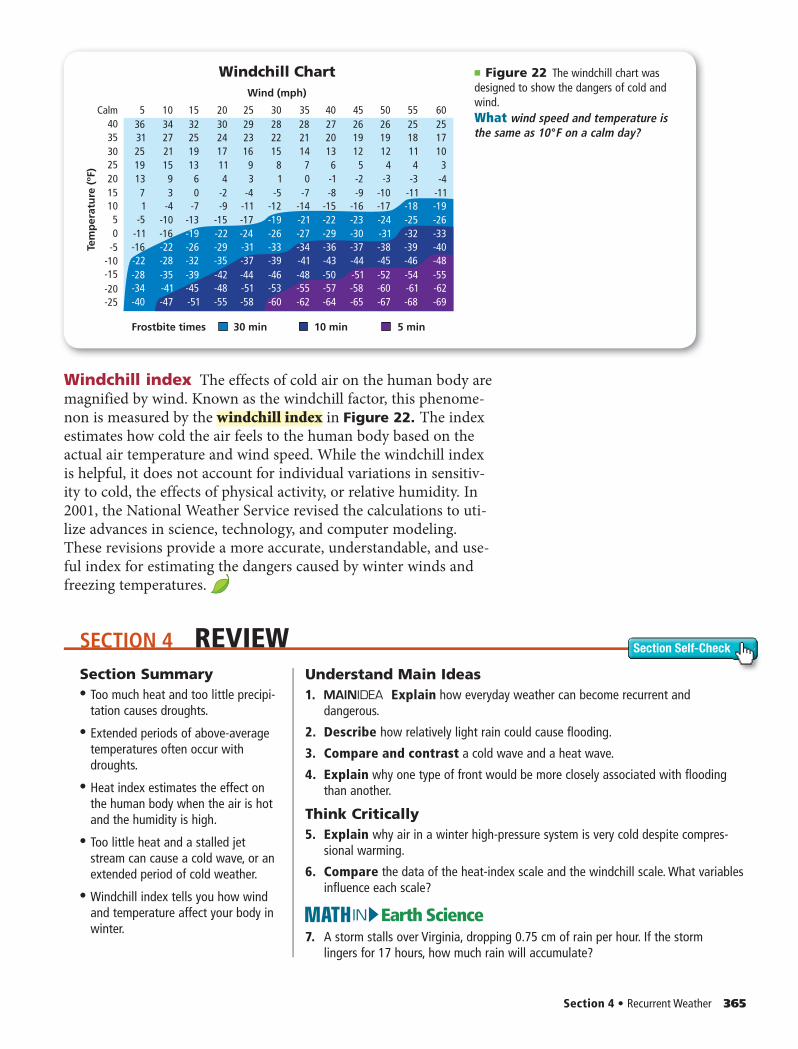
405 10 15 20 25 30 35 40 45 50 55 60
36 34 32 30 29 28 28 27 26 26 25 2531 27 25 24 23 22 21 20 19 19 18 1725 21 19 17 16 15 14 13 12 12 11 1019 15 13 11 9 8 7 6 5 4 4 313 9 6 4 3 1 0 -1 -2 -3 -3 -47 3 0 -2 -4 -5 -7 -8 -9 -10 -11 -111 -4 -7 -9 -11 -12 -14 -15 -16 -17 -18 -19
-5 -10 -13 -15 -17 -19 -21 -22 -23 -24 -25 -26-11 -16 -19 -22 -24 -26 -27 -29 -30 -31 -32 -33-16 -22 -26 -29 -31 -33 -34 -36 -37 -38 -39 -40-22 -28 -32 -35 -37 -39 -41 -43 -44 -45 -46 -48-28 -35 -39 -42 -44 -46 -48 -50 -51 -52 -54 -55-34 -41 -45 -48 -51 -53 -55 -57 -58 -60 -61 -62-40 -47 -51 -55 -58 -60 -62 -64 -65 -67 -68 -69
Calm
353025201510
05
-5-10-15-20-25
Windchill ChartTe
mp
erat
ure
(ºF
)Wind (mph)
Frostbite times 30 min 10 min 5 min
SECTION 4 REVIEW Section Self-Check
Section 4 • Recurrent Weather 365
Windchill index The effects of cold air on the human body are magnified by wind. Known as the windchill factor, this phenome-non is measured by the windchill index in Figure 22. The index estimates how cold the air feels to the human body based on the actual air temperature and wind speed. While the windchill index is helpful, it does not account for individual variations in sensitiv-ity to cold, the effects of physical activity, or relative humidity. In 2001, the National Weather Service revised the calculations to uti-lize advances in science, technology, and computer modeling. These revisions provide a more accurate, understandable, and use-ful index for estimating the dangers caused by winter winds and freezing temperatures.
■ Figure 22 The windchill chart was designed to show the dangers of cold and wind.What wind speed and temperature is the same as 10°F on a calm day?
Section Summary• • Too much heat and too little precipi-
tation causes droughts.
• • Extended periods of above-average temperatures often occur with droughts.
• • Heat index estimates the effect on the human body when the air is hot and the humidity is high.
• • Too little heat and a stalled jet stream can cause a cold wave, or an extended period of cold weather.
• • Windchill index tells you how wind and temperature affect your body in winter.
Understand Main Ideas1. Explain how everyday weather can become recurrent and
dangerous.
2. Describe how relatively light rain could cause flooding.
3. Compare and contrast a cold wave and a heat wave.
4. Explain why one type of front would be more closely associated with flooding than another.
Think Critically5. Explain why air in a winter high-pressure system is very cold despite compres-
sional warming.
6. Compare the data of the heat-index scale and the windchill scale. What variables influence each scale?
Earth ScienceIN7. A storm stalls over Virginia, dropping 0.75 cm of rain per hour. If the storm
lingers for 17 hours, how much rain will accumulate?
0361_0365_ESGEU_S_C13_S4_658713.indd 3650361_0365_ESGEU_S_C13_S4_658713.indd 365 2/12/11 11:38 AM2/12/11 11:38 AM
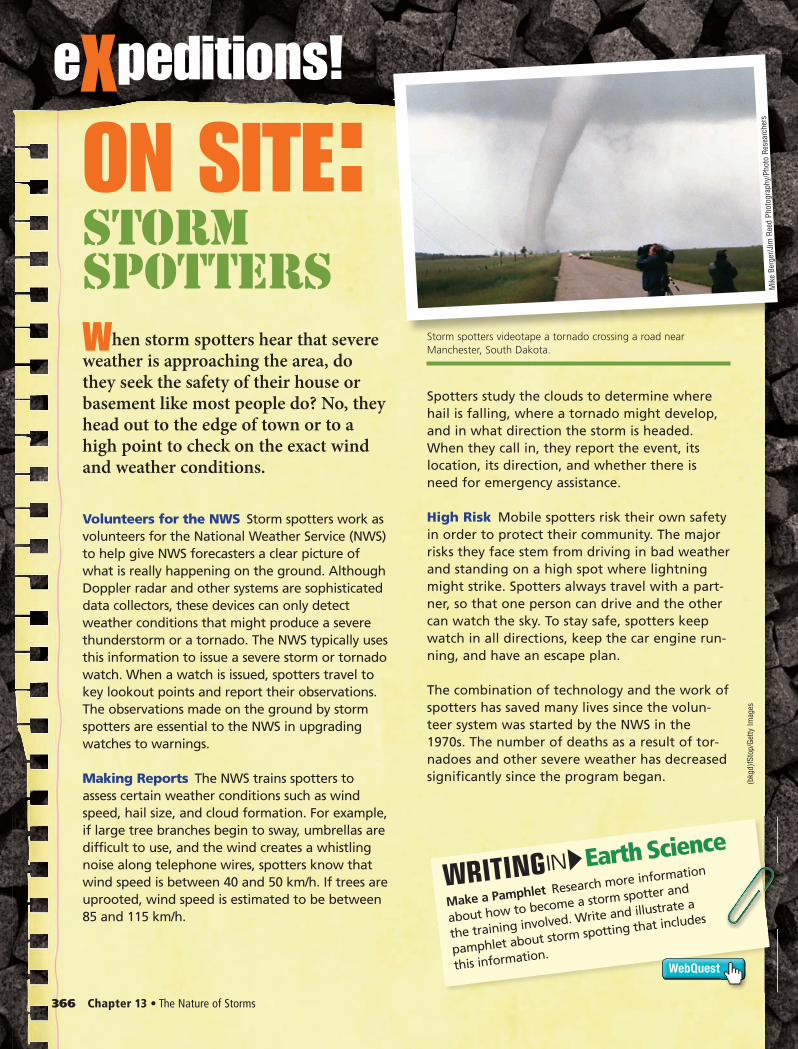
ON SITE:eXpeditions!
Storm spotters videotape a tornado crossing a road near Manchester, South Dakota. When storm spotters hear that severe
weather is approaching the area, do they seek the safety of their house or basement like most people do? No, they head out to the edge of town or to a high point to check on the exact wind and weather conditions.
Volunteers for the NWS Storm spotters work as volunteers for the National Weather Service (NWS) to help give NWS forecasters a clear picture of what is really happening on the ground. Although Doppler radar and other systems are sophisticated data collectors, these devices can only detect weather conditions that might produce a severe thunderstorm or a tornado. The NWS typically uses this information to issue a severe storm or tornado watch. When a watch is issued, spotters travel to key lookout points and report their observations. The observations made on the ground by storm spotters are essential to the NWS in upgrading watches to warnings.
Making Reports The NWS trains spotters to assess certain weather conditions such as wind speed, hail size, and cloud formation. For example, if large tree branches begin to sway, umbrellas are difficult to use, and the wind creates a whistling noise along telephone wires, spotters know that wind speed is between 40 and 50 km/h. If trees are uprooted, wind speed is estimated to be between 85 and 115 km/h.
Spotters study the clouds to determine where hail is falling, where a tornado might develop, and in what direction the storm is headed. When they call in, they report the event, its location, its direction, and whether there is need for emergency assistance.
High Risk Mobile spotters risk their own safety in order to protect their community. The major risks they face stem from driving in bad weather and standing on a high spot where lightning might strike. Spotters always travel with a part-ner, so that one person can drive and the other can watch the sky. To stay safe, spotters keep watch in all directions, keep the car engine run-ning, and have an escape plan.
The combination of technology and the work of spotters has saved many lives since the volun-teer system was started by the NWS in the 1970s. The number of deaths as a result of tor-nadoes and other severe weather has decreased significantly since the program began.
Storm Spotters
Make a Pamphlet Research more information
about how to become a storm spotter and
the training involved. Write and illustrate a
pamphlet about storm spotting that includes
this information.
Earth ScienceIN
WebQuest
366 Chapter 13 • The Nature of Storms
Mik
e Be
rger
/Jim
Ree
d Ph
otog
raph
y/Ph
oto
Rese
arch
ers
(bkg
d) fS
top/
Getty
Imag
es
0366_ESGEU_S_C13_F_EX_658713.indd 3660366_ESGEU_S_C13_F_EX_658713.indd 366 2/12/11 11:38 AM2/12/11 11:38 AM
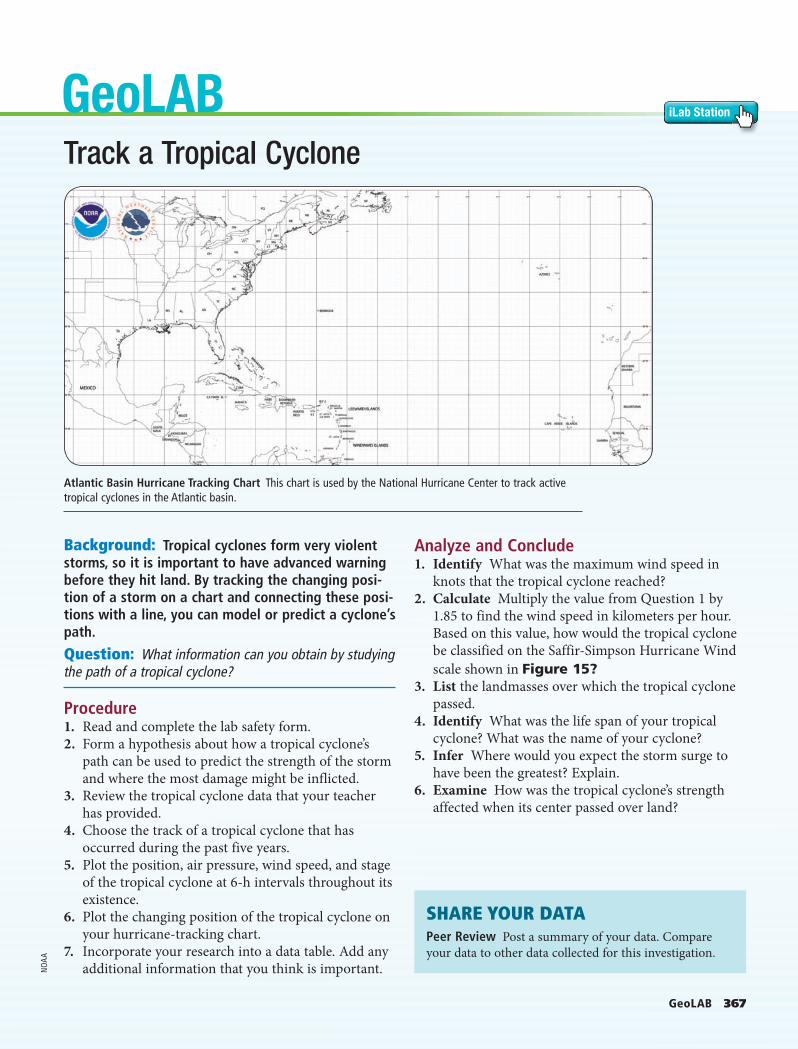
GeoLAB 367
GeoLAB iLab Station
Background: Tropical cyclones form very violent storms, so it is important to have advanced warning before they hit land. By tracking the changing posi-tion of a storm on a chart and connecting these posi-tions with a line, you can model or predict a cyclone’s path.
Question: What information can you obtain by studying the path of a tropical cyclone?
Procedure1. Read and complete the lab safety form.2. Form a hypothesis about how a tropical cyclone’s
path can be used to predict the strength of the storm and where the most damage might be inflicted.
3. Review the tropical cyclone data that your teacher has provided.
4. Choose the track of a tropical cyclone that has occurred during the past five years.
5. Plot the position, air pressure, wind speed, and stage of the tropical cyclone at 6-h intervals throughout its existence.
6. Plot the changing position of the tropical cyclone on your hurricane-tracking chart.
7. Incorporate your research into a data table. Add any additional information that you think is important.
Analyze and Conclude1. Identify What was the maximum wind speed in
knots that the tropical cyclone reached?2. Calculate Multiply the value from Question 1 by
1.85 to find the wind speed in kilometers per hour. Based on this value, how would the tropical cyclone be classified on the Saffir-Simpson Hurricane Wind scale shown in Figure 15?
3. List the landmasses over which the tropical cyclone passed.
4. Identify What was the life span of your tropical cyclone? What was the name of your cyclone?
5. Infer Where would you expect the storm surge to have been the greatest? Explain.
6. Examine How was the tropical cyclone’s strength affected when its center passed over land?
SHARE YOUR DATAPeer Review Post a summary of your data. Compare your data to other data collected for this investigation.
Track a Tropical Cyclone
Atlantic Basin Hurricane Tracking Chart This chart is used by the National Hurricane Center to track active tropical cyclones in the Atlantic basin.
NO
AA
0367_ESGEU_S_C13_LAB_658713.indd 3670367_ESGEU_S_C13_LAB_658713.indd 367 2/12/11 11:38 AM2/12/11 11:38 AM
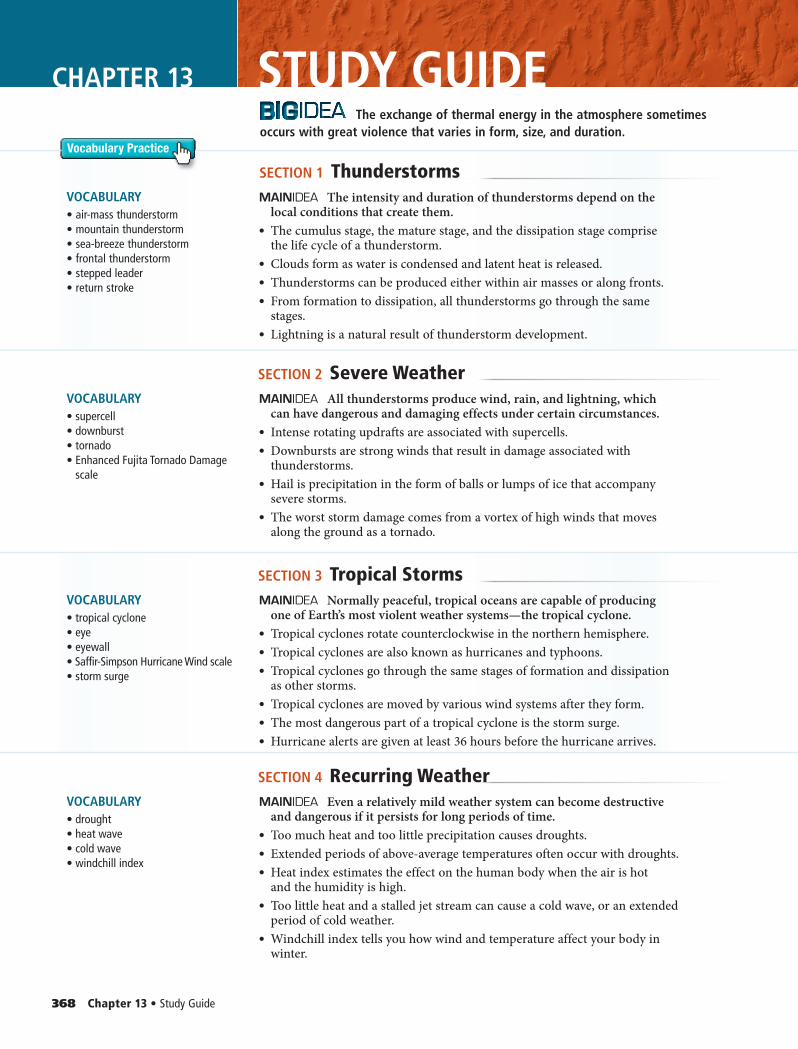
Download quizzes, key terms, and flash cards from glencoe.com.
368 Chapter 13 • Study Guide
SECTION 1 ThunderstormsVOCABULARY• air-mass thunderstorm• mountain thunderstorm• sea-breeze thunderstorm• frontal thunderstorm• stepped leader• return stroke
The intensity and duration of thunderstorms depend on the local conditions that create them.
• The cumulus stage, the mature stage, and the dissipation stage comprise the life cycle of a thunderstorm.
• Clouds form as water is condensed and latent heat is released.• Thunderstorms can be produced either within air masses or along fronts.• From formation to dissipation, all thunderstorms go through the same
stages.• Lightning is a natural result of thunderstorm development.
SECTION 2 Severe WeatherVOCABULARY• supercell• downburst• tornado• Enhanced Fujita Tornado Damage
scale
All thunderstorms produce wind, rain, and lightning, which can have dangerous and damaging effects under certain circumstances.
• Intense rotating updrafts are associated with supercells.• Downbursts are strong winds that result in damage associated with
thunderstorms.• Hail is precipitation in the form of balls or lumps of ice that accompany
severe storms.• The worst storm damage comes from a vortex of high winds that moves
along the ground as a tornado.
SECTION 3 Tropical StormsVOCABULARY• tropical cyclone• eye• eyewall• Saffir-Simpson Hurricane Wind scale• storm surge
Normally peaceful, tropical oceans are capable of producing one of Earth’s most violent weather systems—the tropical cyclone.
• Tropical cyclones rotate counterclockwise in the northern hemisphere.• Tropical cyclones are also known as hurricanes and typhoons.• Tropical cyclones go through the same stages of formation and dissipation
as other storms.• Tropical cyclones are moved by various wind systems after they form.• The most dangerous part of a tropical cyclone is the storm surge.• Hurricane alerts are given at least 36 hours before the hurricane arrives.
SECTION 4 Recurring WeatherVOCABULARY• drought• heat wave• cold wave• windchill index
Even a relatively mild weather system can become destructive and dangerous if it persists for long periods of time.
• Too much heat and too little precipitation causes droughts.• Extended periods of above-average temperatures often occur with droughts.• Heat index estimates the effect on the human body when the air is hot
and the humidity is high.• Too little heat and a stalled jet stream can cause a cold wave, or an extended
period of cold weather.• Windchill index tells you how wind and temperature affect your body in
winter.
Vocabulary Practice
STUDY GUIDECHAPTER 13 The exchange of thermal energy in the atmosphere sometimes
occurs with great violence that varies in form, size, and duration.
0368_0371_ESGEU_S_C13_CA_658713.indd 3680368_0371_ESGEU_S_C13_CA_658713.indd 368 2/12/11 11:38 AM2/12/11 11:38 AM
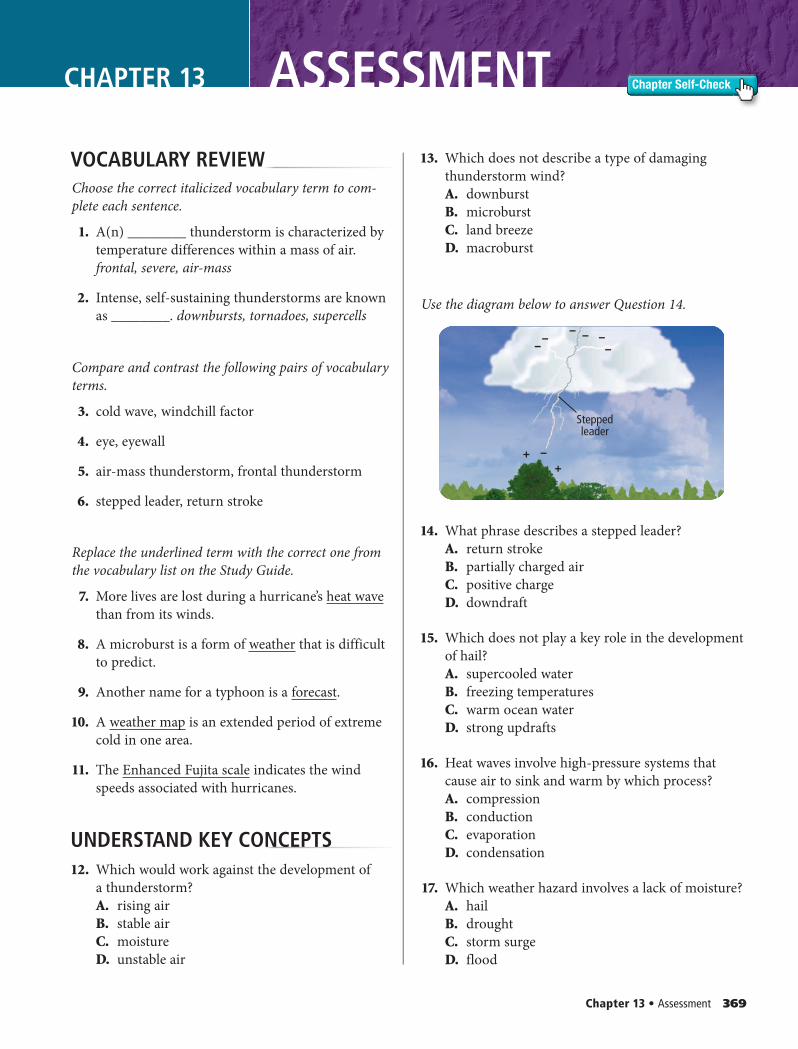
Chapter 13 • Assessment 369
Chapter Self-Check
++ –
–––
––
–
Steppedleader
CHAPTER 13 ASSESSMENT
VOCABULARY REVIEWChoose the correct italicized vocabulary term to com-plete each sentence.
1. A(n) ________ thunderstorm is characterized by temperature differences within a mass of air. frontal, severe, air-mass
2. Intense, self-sustaining thunderstorms are known as ________. downbursts, tornadoes, supercells
Compare and contrast the following pairs of vocabulary terms.
3. cold wave, windchill factor
4. eye, eyewall
5. air-mass thunderstorm, frontal thunderstorm
6. stepped leader, return stroke
Replace the underlined term with the correct one from the vocabulary list on the Study Guide.
7. More lives are lost during a hurricane’s heat wavethan from its winds.
8. A microburst is a form of weather that is difficult to predict.
9. Another name for a typhoon is a forecast.
10. A weather map is an extended period of extreme cold in one area.
11. The Enhanced Fujita scale indicates the wind speeds associated with hurricanes.
UNDERSTAND KEY CONCEPTS 12. Which would work against the development of
a thunderstorm?A. rising airB. stable airC. moistureD. unstable air
13. Which does not describe a type of damaging thunderstorm wind?A. downburstB. microburstC. land breezeD. macroburst
Use the diagram below to answer Question 14.
14. What phrase describes a stepped leader?A. return strokeB. partially charged airC. positive chargeD. downdraft
15. Which does not play a key role in the development of hail?A. supercooled waterB. freezing temperaturesC. warm ocean waterD. strong updrafts
16. Heat waves involve high-pressure systems that cause air to sink and warm by which process?A. compressionB. conductionC. evaporationD. condensation
17. Which weather hazard involves a lack of moisture?A. hailB. droughtC. storm surgeD. flood
0368_0371_ESGEU_S_C13_CA_658713.indd 3690368_0371_ESGEU_S_C13_CA_658713.indd 369 2/12/11 11:38 AM2/12/11 11:38 AM
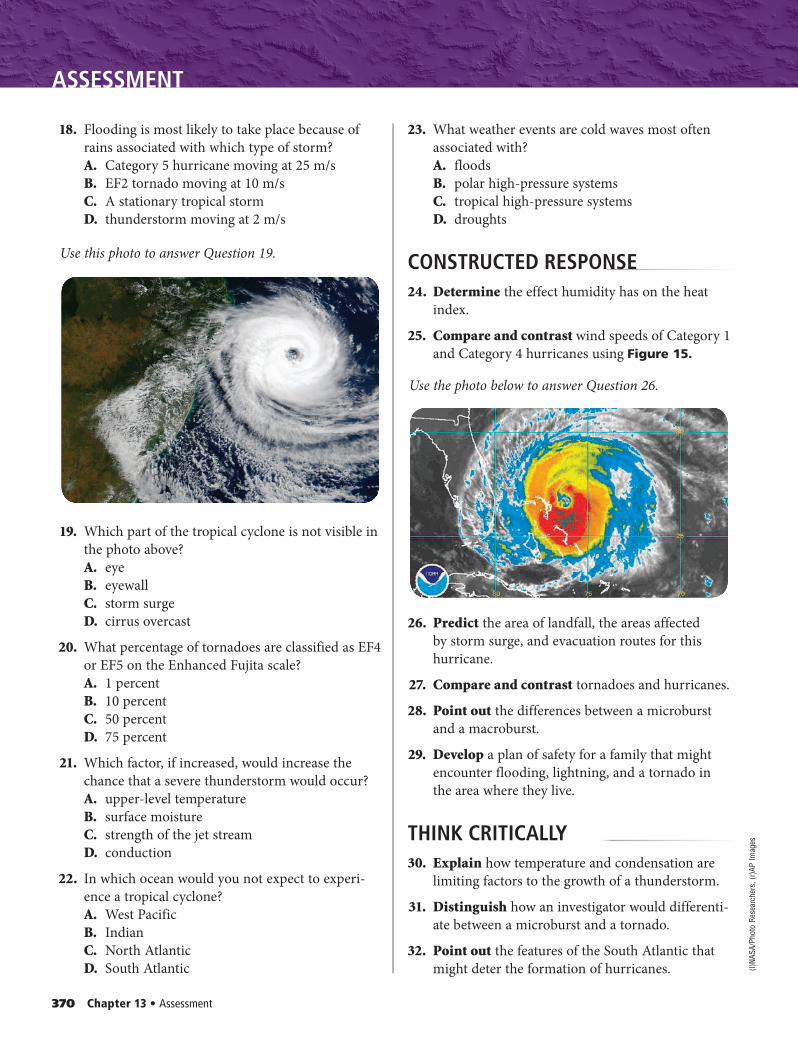
(l)N
ASA/
Phot
o Re
sear
cher
s, (r
)AP
Imag
es
370 Chapter 13 • Assessment
ASSESSMENT
18. Flooding is most likely to take place because of rains associated with which type of storm?A. Category 5 hurricane moving at 25 m/sB. EF2 tornado moving at 10 m/sC. A stationary tropical stormD. thunderstorm moving at 2 m/s
Use this photo to answer Question 19.
19. Which part of the tropical cyclone is not visible in the photo above?A. eyeB. eyewallC. storm surgeD. cirrus overcast
20. What percentage of tornadoes are classified as EF4 or EF5 on the Enhanced Fujita scale?A. 1 percentB. 10 percentC. 50 percentD. 75 percent
21. Which factor, if increased, would increase the chance that a severe thunderstorm would occur?A. upper-level temperatureB. surface moistureC. strength of the jet streamD. conduction
22. In which ocean would you not expect to experi-ence a tropical cyclone?A. West PacificB. IndianC. North AtlanticD. South Atlantic
23. What weather events are cold waves most often associated with?A. floodsB. polar high-pressure systemsC. tropical high-pressure systemsD. droughts
CONSTRUCTED RESPONSE 24. Determine the effect humidity has on the heat
index.
25. Compare and contrast wind speeds of Category 1 and Category 4 hurricanes using Figure 15.
Use the photo below to answer Question 26.
26. Predict the area of landfall, the areas affected by storm surge, and evacuation routes for this hurricane.
27. Compare and contrast tornadoes and hurricanes.
28. Point out the differences between a microburst and a macroburst.
29. Develop a plan of safety for a family that might encounter flooding, lightning, and a tornado in the area where they live.
THINK CRITICALLY 30. Explain how temperature and condensation are
limiting factors to the growth of a thunderstorm.
31. Distinguish how an investigator would differenti-ate between a microburst and a tornado.
32. Point out the features of the South Atlantic that might deter the formation of hurricanes.
0368_0371_ESGEU_S_C13_CA_658713.indd 3700368_0371_ESGEU_S_C13_CA_658713.indd 370 2/12/11 11:38 AM2/12/11 11:38 AM
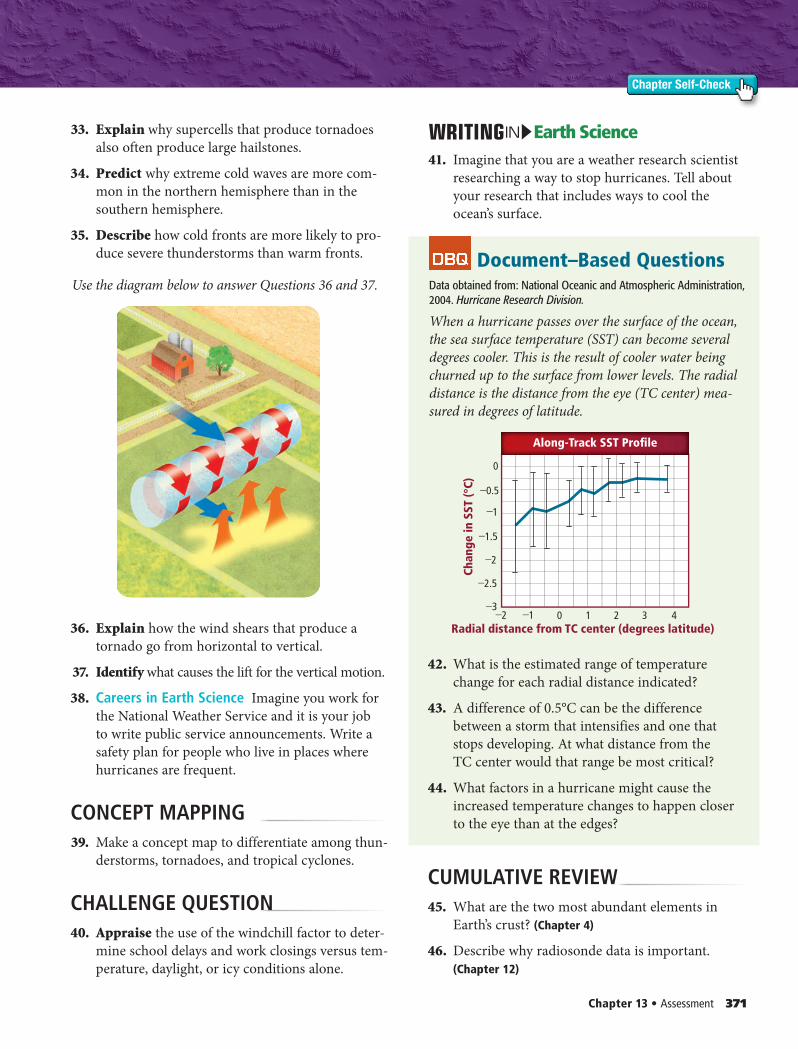
Chapter 13 • Assessment 371
Chapter Self-Check
33. Explain why supercells that produce tornadoes also often produce large hailstones.
34. Predict why extreme cold waves are more com-mon in the northern hemisphere than in the southern hemisphere.
35. Describe how cold fronts are more likely to pro-duce severe thunderstorms than warm fronts.
Use the diagram below to answer Questions 36 and 37.
36. Explain how the wind shears that produce a tornado go from horizontal to vertical.
37. Identify what causes the lift for the vertical motion.
38. Careers in Earth Science Imagine you work for the National Weather Service and it is your job to write public service announcements. Write a safety plan for people who live in places where hurricanes are frequent.
CONCEPT MAPPING 39. Make a concept map to differentiate among thun-
derstorms, tornadoes, and tropical cyclones.
CHALLENGE QUESTION 40. Appraise the use of the windchill factor to deter-
mine school delays and work closings versus tem-perature, daylight, or icy conditions alone.
Radial distance from TC center (degrees latitude)2 1 0 1 2 3 4
Chan
ge in
SST
(°C)
3
2.5
2
1.5
1
0.5
0
Along-Track SST Profile
Earth ScienceIN
41. Imagine that you are a weather research scientist researching a way to stop hurricanes. Tell about your research that includes ways to cool the ocean’s surface.
Document–Based QuestionsData obtained from: National Oceanic and Atmospheric Administration, 2004. Hurricane Research Division.
When a hurricane passes over the surface of the ocean, the sea surface temperature (SST) can become several degrees cooler. This is the result of cooler water being churned up to the surface from lower levels. The radial distance is the distance from the eye (TC center) mea-sured in degrees of latitude.
42. What is the estimated range of temperature change for each radial distance indicated?
43. A difference of 0.5°C can be the difference between a storm that intensifies and one that stops developing. At what distance from the TC center would that range be most critical?
44. What factors in a hurricane might cause the increased temperature changes to happen closer to the eye than at the edges?
CUMULATIVE REVIEW 45. What are the two most abundant elements in
Earth’s crust? (Chapter 4)
46. Describe why radiosonde data is important. (Chapter 12)
0368_0371_ESGEU_S_C13_CA_658713.indd 3710368_0371_ESGEU_S_C13_CA_658713.indd 371 2/12/11 11:39 AM2/12/11 11:39 AM
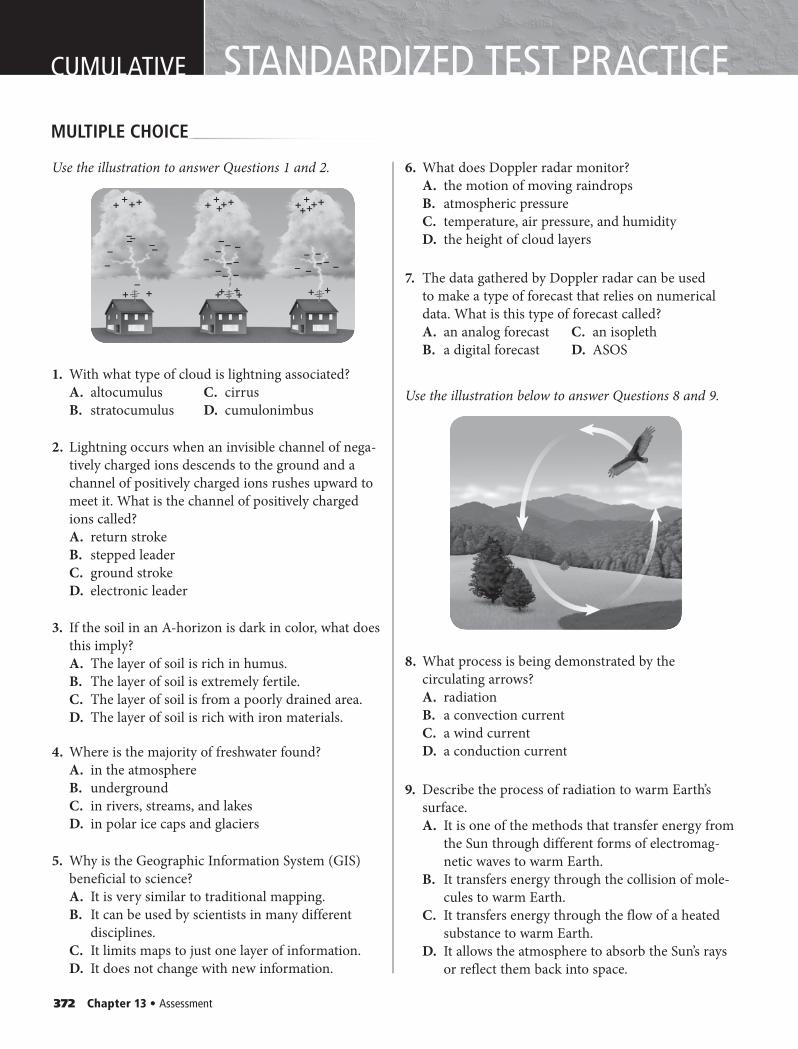
372 Chapter 13 • Assessment
CUMULATIVE STANDARDIZED TEST PRACTICEMULTIPLE CHOICE
Use the illustration to answer Questions 1 and 2.
1. With what type of cloud is lightning associated?A. altocumulus C. cirrusB. stratocumulus D. cumulonimbus
2. Lightning occurs when an invisible channel of nega-tively charged ions descends to the ground and a channel of positively charged ions rushes upward to meet it. What is the channel of positively charged ions called?A. return strokeB. stepped leaderC. ground strokeD. electronic leader
3. If the soil in an A-horizon is dark in color, what does this imply?A. The layer of soil is rich in humus.B. The layer of soil is extremely fertile.C. The layer of soil is from a poorly drained area.D. The layer of soil is rich with iron materials.
4. Where is the majority of freshwater found?A. in the atmosphereB. undergroundC. in rivers, streams, and lakesD. in polar ice caps and glaciers
5. Why is the Geographic Information System (GIS) beneficial to science?A. It is very similar to traditional mapping.B. It can be used by scientists in many different
disciplines.C. It limits maps to just one layer of information.D. It does not change with new information.
6. What does Doppler radar monitor?A. the motion of moving raindropsB. atmospheric pressureC. temperature, air pressure, and humidityD. the height of cloud layers
7. The data gathered by Doppler radar can be used to make a type of forecast that relies on numerical data. What is this type of forecast called?A. an analog forecast C. an isoplethB. a digital forecast D. ASOS
Use the illustration below to answer Questions 8 and 9.
8. What process is being demonstrated by the circulating arrows?A. radiationB. a convection currentC. a wind currentD. a conduction current
9. Describe the process of radiation to warm Earth’s surface.A. It is one of the methods that transfer energy from
the Sun through different forms of electromag-netic waves to warm Earth.
B. It transfers energy through the collision of mole-cules to warm Earth.
C. It transfers energy through the flow of a heated substance to warm Earth.
D. It allows the atmosphere to absorb the Sun’s rays or reflect them back into space.
0372_0373_ESGEU_S_C13_STP_658713.indd 3720372_0373_ESGEU_S_C13_STP_658713.indd 372 2/12/11 11:39 AM2/12/11 11:39 AM
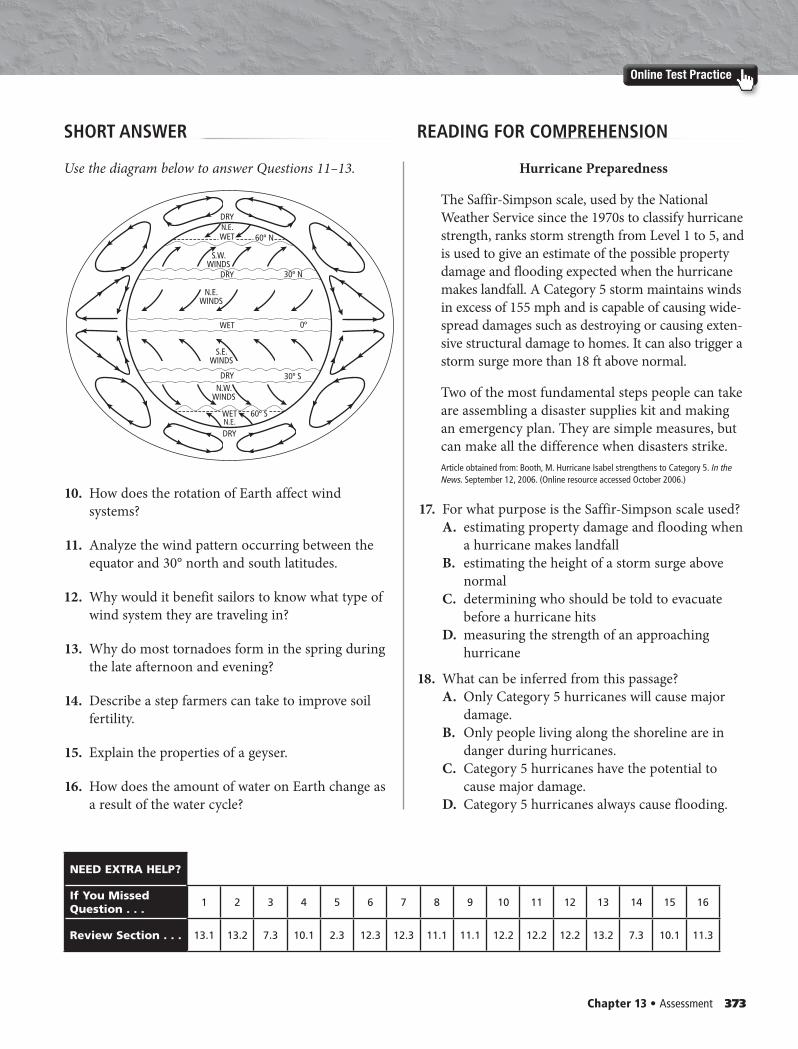
Chapter 13 • Assessment 373
Online Test Practice
SHORT ANSWER READING FOR COMPREHENSION
NEED EXTRA HELP?
If You Missed Question . . .
1 2 3 4 5 6 7 8 9 10 11 12 13 14 15 16
Review Section . . . 13.1 13.2 7.3 10.1 2.3 12.3 12.3 11.1 11.1 12.2 12.2 12.2 13.2 7.3 10.1 11.3
Use the diagram below to answer Questions 11–13.
10. How does the rotation of Earth affect wind systems?
11. Analyze the wind pattern occurring between the equator and 30° north and south latitudes.
12. Why would it benefit sailors to know what type of wind system they are traveling in?
13. Why do most tornadoes form in the spring during the late afternoon and evening?
14. Describe a step farmers can take to improve soil fertility.
15. Explain the properties of a geyser.
16. How does the amount of water on Earth change as a result of the water cycle?
Hurricane Preparedness
The Saffir-Simpson scale, used by the National Weather Service since the 1970s to classify hurricane strength, ranks storm strength from Level 1 to 5, and is used to give an estimate of the possible property damage and flooding expected when the hurricane makes landfall. A Category 5 storm maintains winds in excess of 155 mph and is capable of causing wide-spread damages such as destroying or causing exten-sive structural damage to homes. It can also trigger a storm surge more than 18 ft above normal.
Two of the most fundamental steps people can take are assembling a disaster supplies kit and making an emergency plan. They are simple measures, but can make all the difference when disasters strike.Article obtained from: Booth, M. Hurricane Isabel strengthens to Category 5. In the News. September 12, 2006. (Online resource accessed October 2006.)
17. For what purpose is the Saffir-Simpson scale used?A. estimating property damage and flooding when
a hurricane makes landfallB. estimating the height of a storm surge above
normalC. determining who should be told to evacuate
before a hurricane hitsD. measuring the strength of an approaching
hurricane
18. What can be inferred from this passage?A. Only Category 5 hurricanes will cause major
damage.B. Only people living along the shoreline are in
danger during hurricanes.C. Category 5 hurricanes have the potential to
cause major damage.D. Category 5 hurricanes always cause flooding.
N.E.WET
WET
WET
DRY
DRY
DRY
DRY
S.W.WINDS
S.E.WINDS
N.E.WINDS
N.W.WINDS
60º N
30º N
30º S
60º S
0º
N.E.
0372_0373_ESGEU_S_C13_STP_658713.indd 3730372_0373_ESGEU_S_C13_STP_658713.indd 373 2/12/11 11:39 AM2/12/11 11:39 AM
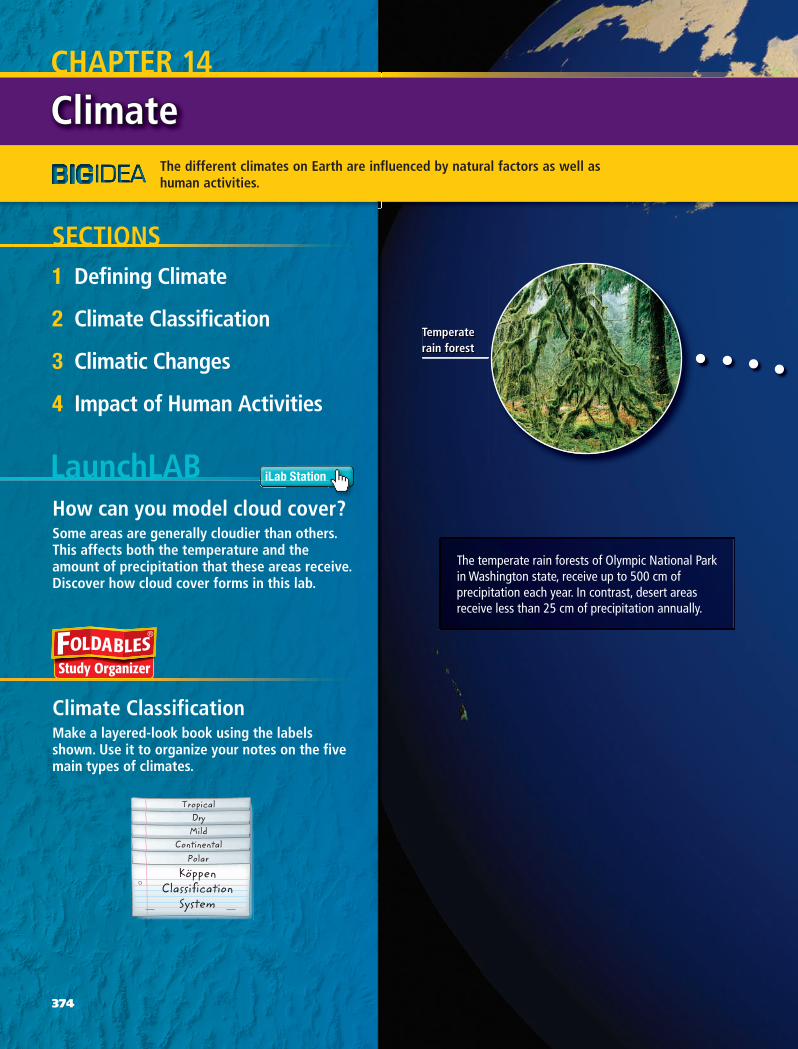
Temperate rain forest
The temperate rain forests of Olympic National Park in Washington state, receive up to 500 cm of precipitation each year. In contrast, desert areas receive less than 25 cm of precipitation annually.
ClimateClimateCHAPTER 14
TropicalDryMild
ContinentalPolar
KoppenClassification
System
..
Climate ClassificationMake a layered-look book using the labels shown. Use it to organize your notes on the five main types of climates.
How can you model cloud cover?Some areas are generally cloudier than others. This affects both the temperature and the amount of precipitation that these areas receive.Discover how cloud cover forms in this lab.
LaunchLAB
1 Defining Climate
2 Climate Classification
3 Climatic Changes
4 Impact of Human Activities
SECTIONS
The different climates on Earth are influenced by natural factors as well as human activities.
iLab Station
374
0374_0375_ESGEU_S_C14_CO_658713.indd 3740374_0375_ESGEU_S_C14_CO_658713.indd 374 2/16/11 12:21 PM2/16/11 12:21 PM
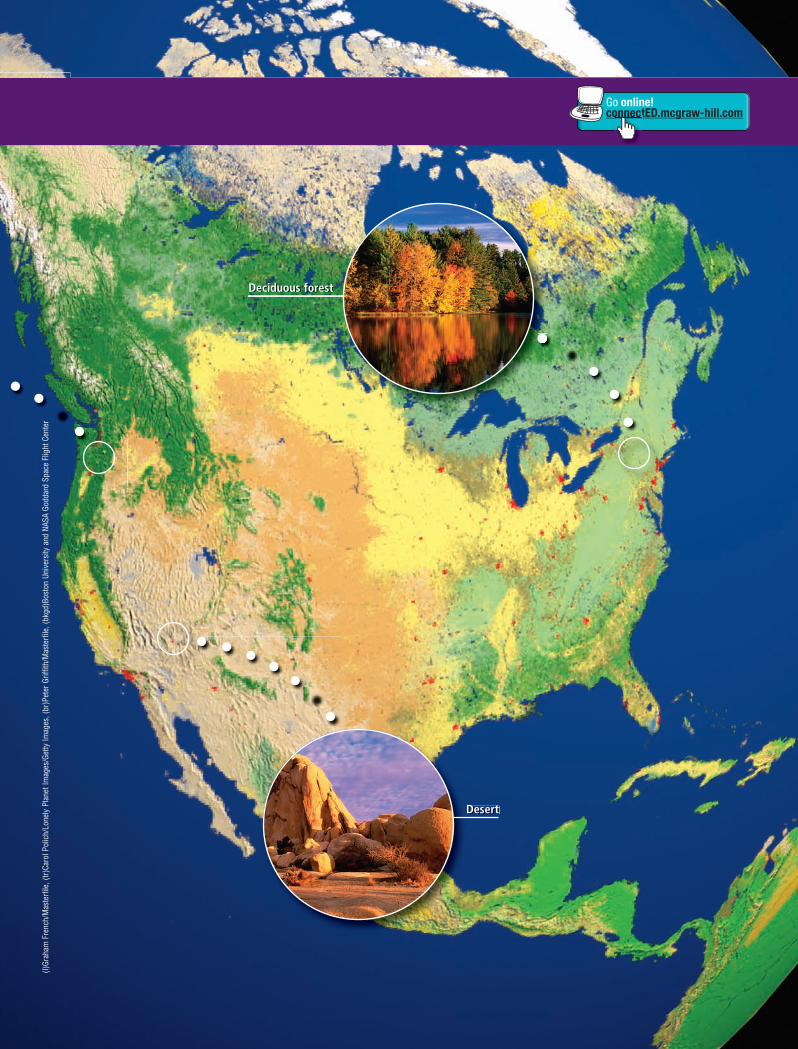
Desert
Deciduous forest
Go online!connectED.mcgraw-hill.comonnect
(l)Gr
aham
Fre
nch/
Mas
terf
ile, (
tr)Ca
rol P
olic
h/Lo
nely
Pla
net I
mag
es/G
etty
Imag
es, (
br)P
eter
Grif
fith/
Mas
terf
ile, (
bkgd
)Bos
ton
Univ
ersi
ty a
nd N
ASA
Godd
ard
Spac
e Fl
ight
Cen
ter
0374_0375_ESGEU_S_C14_CO_658713.indd 3750374_0375_ESGEU_S_C14_CO_658713.indd 375 2/16/11 12:21 PM2/16/11 12:21 PM
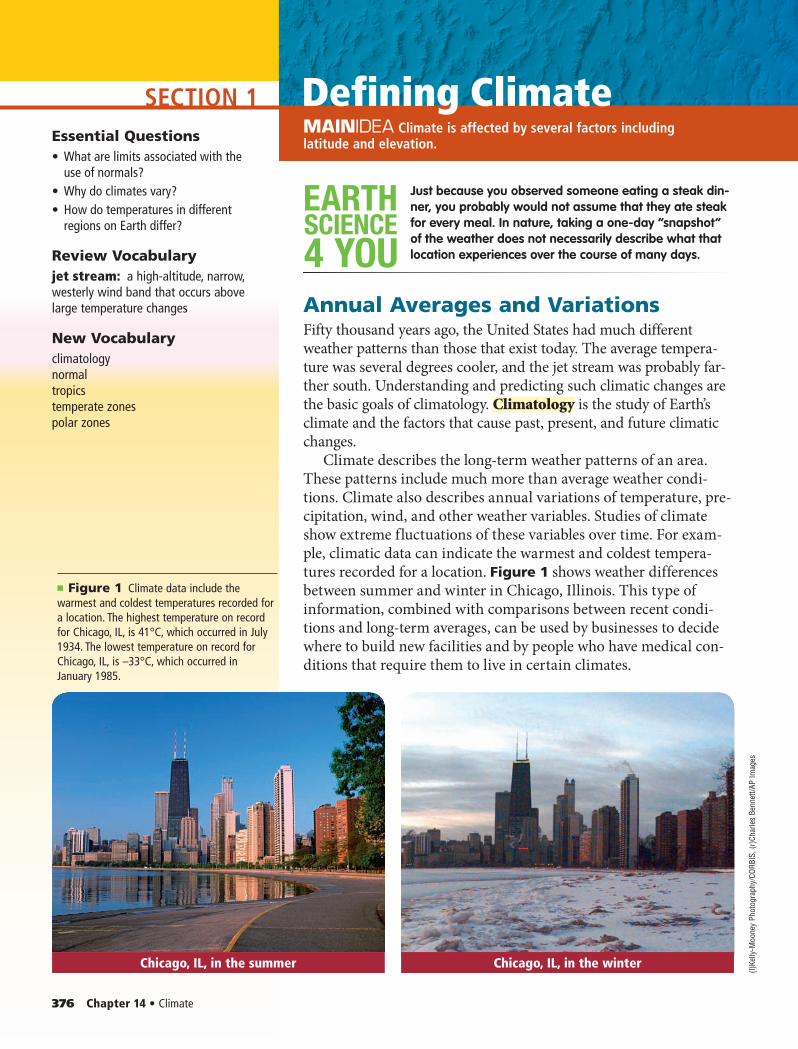
SECTION 1
376 Chapter 14 • Climate
Defining ClimateMAINIDEA Climate is affected by several factors including latitude and elevation.
SCIENCE
4 YOU
EARTH Just because you observed someone eating a steak din-ner, you probably would not assume that they ate steak for every meal. In nature, taking a one-day “snapshot” of the weather does not necessarily describe what that location experiences over the course of many days.
Annual Averages and VariationsFifty thousand years ago, the United States had much different weather patterns than those that exist today. The average tempera-ture was several degrees cooler, and the jet stream was probably far-ther south. Understanding and predicting such climatic changes are the basic goals of climatology. Climatology is the study of Earth’s climate and the factors that cause past, present, and future climatic changes.
Climate describes the long-term weather patterns of an area. These patterns include much more than average weather condi-tions. Climate also describes annual variations of temperature, pre-cipitation, wind, and other weather variables. Studies of climate show extreme fluctuations of these variables over time. For exam-ple, climatic data can indicate the warmest and coldest tempera-tures recorded for a location. Figure 1 shows weather differences between summer and winter in Chicago, Illinois. This type of information, combined with comparisons between recent condi-tions and long-term averages, can be used by businesses to decide where to build new facilities and by people who have medical con-ditions that require them to live in certain climates.
Essential Questions• What are limits associated with the
use of normals?• Why do climates vary?• How do temperatures in different
regions on Earth differ?
Review Vocabularyjet stream: a high-altitude, narrow, westerly wind band that occurs above large temperature changes
New Vocabularyclimatologynormaltropicstemperate zonespolar zones
■ Figure 1 Climate data include the warmest and coldest temperatures recorded for a location. The highest temperature on record for Chicago, IL, is 41°C, which occurred in July 1934. The lowest temperature on record for Chicago, IL, is –33°C, which occurred in January 1985.
Chicago, IL, in the summer Chicago, IL, in the winter
(l)Ke
lly-M
oone
y Ph
otog
raph
y/CO
RBIS
, (r)
Char
les
Benn
ett/A
P Im
ages
0376_0380_ESGEU_S_C14_S1_658713.indd 3760376_0380_ESGEU_S_C14_S1_658713.indd 376 2/16/11 12:22 PM2/16/11 12:22 PM
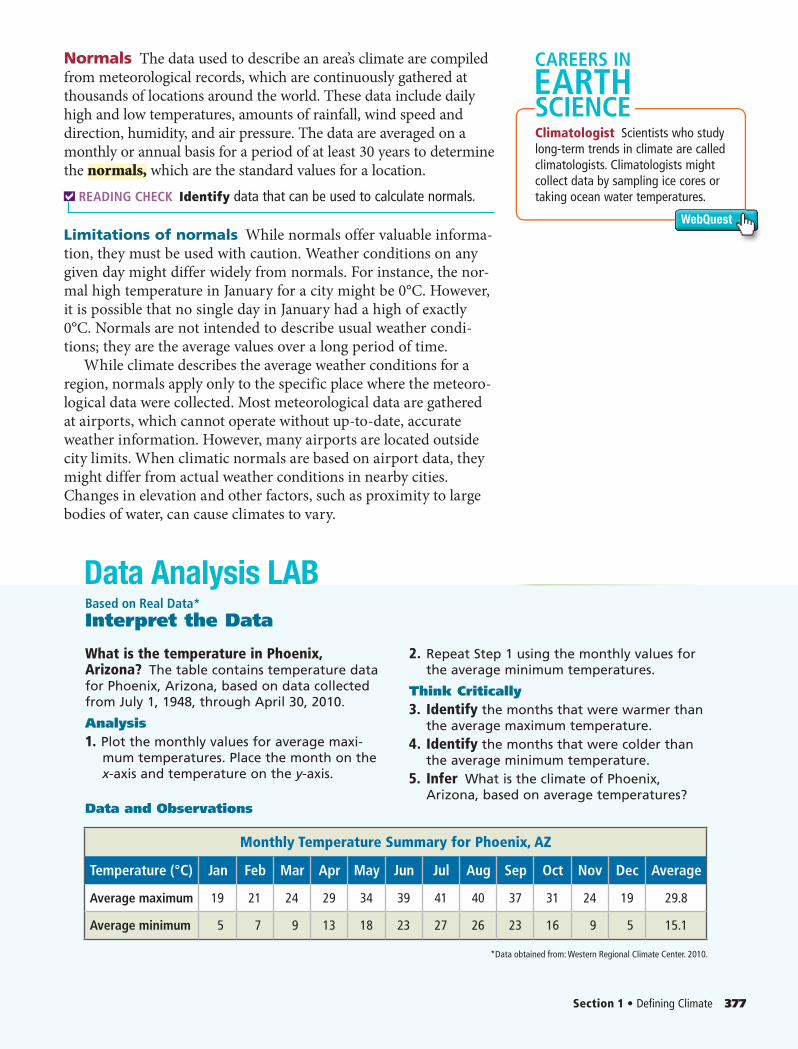
Data Analysis LAB
Section 1 • Defining Climate 377
Normals The data used to describe an area’s climate are compiled from meteorological records, which are continuously gathered at thousands of locations around the world. These data include daily high and low temperatures, amounts of rainfall, wind speed and direction, humidity, and air pressure. The data are averaged on a monthly or annual basis for a period of at least 30 years to determine the normals, which are the standard values for a location.
READING CHECK Identify data that can be used to calculate normals.
Limitations of normals While normals offer valuable informa-tion, they must be used with caution. Weather conditions on any given day might differ widely from normals. For instance, the nor-mal high temperature in January for a city might be 0°C. However, it is possible that no single day in January had a high of exactly 0°C. Normals are not intended to describe usual weather condi-tions; they are the average values over a long period of time.
While climate describes the average weather conditions for a region, normals apply only to the specific place where the meteoro-logical data were collected. Most meteorological data are gathered at airports, which cannot operate without up-to-date, accurate weather information. However, many airports are located outside city limits. When climatic normals are based on airport data, they might differ from actual weather conditions in nearby cities. Changes in elevation and other factors, such as proximity to large bodies of water, can cause climates to vary.
Climatologist Scientists who study long-term trends in climate are called climatologists. Climatologists might collect data by sampling ice cores or taking ocean water temperatures.
WebQuest
CAREERS IN
SCIENCEEARTH
Based on Real Data*Interpret the Data
What is the temperature in Phoenix, Arizona? The table contains temperature data for Phoenix, Arizona, based on data collected from July 1, 1948, through April 30, 2010.
Analysis1. Plot the monthly values for average maxi-
mum temperatures. Place the month on the x-axis and temperature on the y-axis.
2. Repeat Step 1 using the monthly values for the average minimum temperatures.
Think Critically3. Identify the months that were warmer than
the average maximum temperature.4. Identify the months that were colder than
the average minimum temperature.5. Infer What is the climate of Phoenix,
Arizona, based on average temperatures?
*Data obtained from: Western Regional Climate Center. 2010.
Data and Observations
Monthly Temperature Summary for Phoenix, AZ
Temperature (°C) Jan Feb Mar Apr May Jun Jul Aug Sep Oct Nov Dec Average
Average maximum 19 21 24 29 34 39 41 40 37 31 24 19 29.8
Average minimum 5 7 9 13 18 23 27 26 23 16 9 5 15.1
0376_0380_ESGEU_S_C14_S1_658713.indd 3770376_0380_ESGEU_S_C14_S1_658713.indd 377 2/16/11 12:22 PM2/16/11 12:22 PM
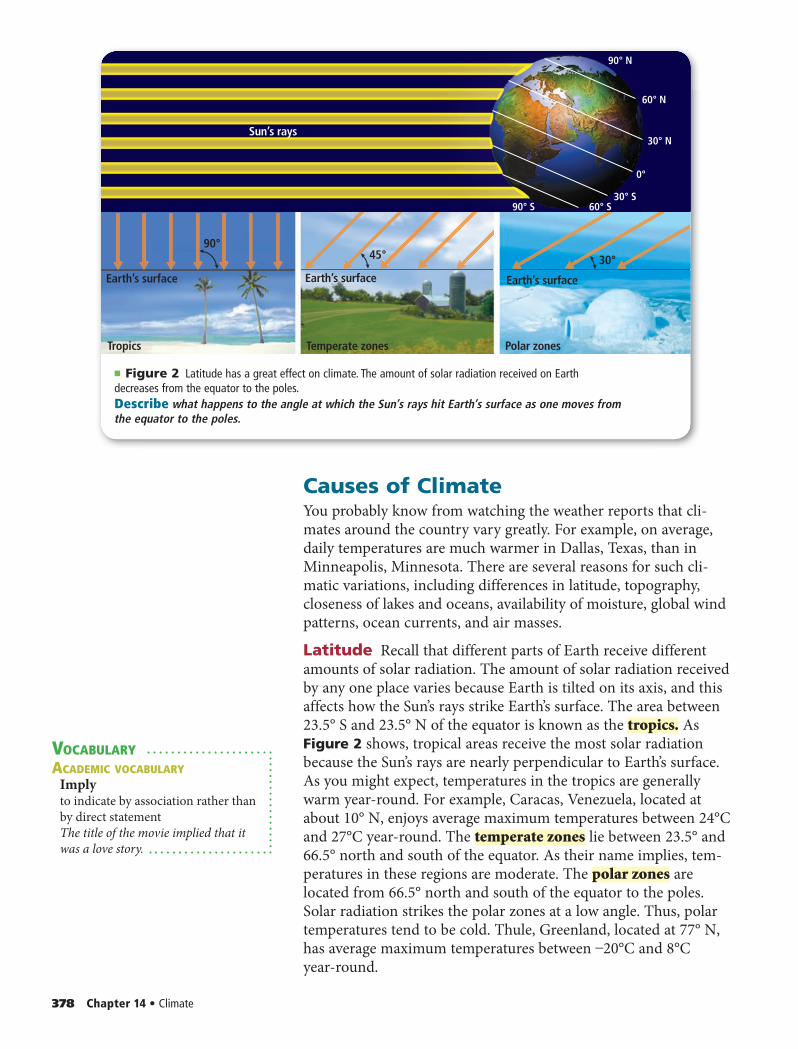
Sun’s rays
Earth’s surface
Tropics
90°
90° N
90° S
30° N
60° N
60° S30° S
0°
45° 30°
Temperate zones Polar zones
Earth’s surface Earth’s surface
378 Chapter 14 • Climate
Causes of ClimateYou probably know from watching the weather reports that cli-mates around the country vary greatly. For example, on average, daily temperatures are much warmer in Dallas, Texas, than in Minneapolis, Minnesota. There are several reasons for such cli-matic variations, including differences in latitude, topography, closeness of lakes and oceans, availability of moisture, global wind patterns, ocean currents, and air masses.
Latitude Recall that different parts of Earth receive different amounts of solar radiation. The amount of solar radiation received by any one place varies because Earth is tilted on its axis, and this affects how the Sun’s rays strike Earth’s surface. The area between 23.5° S and 23.5° N of the equator is known as the tropics. As Figure 2 shows, tropical areas receive the most solar radiation because the Sun’s rays are nearly perpendicular to Earth’s surface. As you might expect, temperatures in the tropics are generally warm year-round. For example, Caracas, Venezuela, located at about 10° N, enjoys average maximum temperatures between 24°C and 27°C year-round. The temperate zones lie between 23.5° and 66.5° north and south of the equator. As their name implies, tem-peratures in these regions are moderate. The polar zones are located from 66.5° north and south of the equator to the poles. Solar radiation strikes the polar zones at a low angle. Thus, polar temperatures tend to be cold. Thule, Greenland, located at 77° N, has average maximum temperatures between –20°C and 8°C year-round.
■ Figure 2 Latitude has a great effect on climate. The amount of solar radiation received on Earth decreases from the equator to the poles.Describe what happens to the angle at which the Sun’s rays hit Earth’s surface as one moves from the equator to the poles.
VOCABULARYACADEMIC VOCABULARY
Implyto indicate by association rather than by direct statementThe title of the movie implied that it was a love story.
0376_0380_ESGEU_S_C14_S1_658713.indd 3780376_0380_ESGEU_S_C14_S1_658713.indd 378 2/16/11 12:22 PM2/16/11 12:22 PM
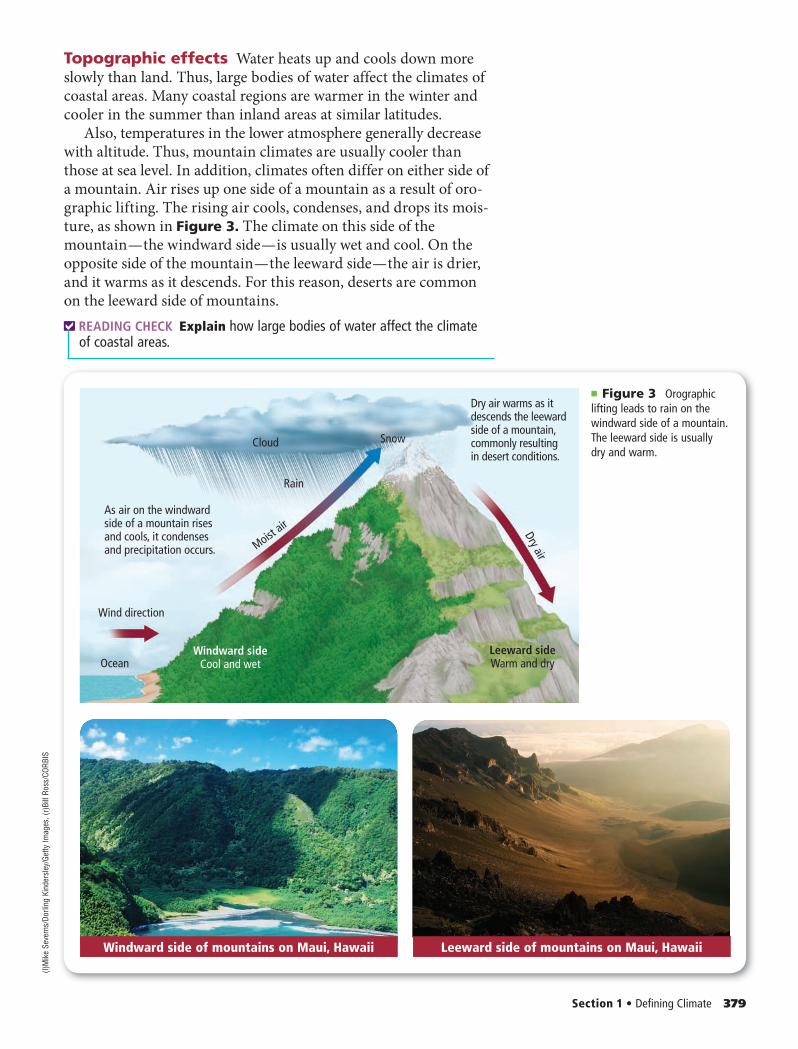
As air on the windward side of a mountain risesand cools, it condensesand precipitation occurs.
Dry air warms as itdescends the leewardside of a mountain,commonly resultingin desert conditions.
Cloud
Windward sideCool and wet
Leeward sideWarm and dry
Rain
Ocean
Moist air Dry air
Wind direction
Snow
Section 1 • Defining Climate 379
Topographic effects Water heats up and cools down more slowly than land. Thus, large bodies of water affect the climates of coastal areas. Many coastal regions are warmer in the winter and cooler in the summer than inland areas at similar latitudes.
Also, temperatures in the lower atmosphere generally decrease with altitude. Thus, mountain climates are usually cooler than those at sea level. In addition, climates often differ on either side of a mountain. Air rises up one side of a mountain as a result of oro-graphic lifting. The rising air cools, condenses, and drops its mois-ture, as shown in Figure 3. The climate on this side of the mountain — the windward side — is usually wet and cool. On the opposite side of the mountain — the leeward side — the air is drier, and it warms as it descends. For this reason, deserts are common on the leeward side of mountains.
READING CHECK Explain how large bodies of water affect the climate of coastal areas.
■ Figure 3 Orographic lifting leads to rain on the windward side of a mountain. The leeward side is usually dry and warm.
Windward side of mountains on Maui, Hawaii Leeward side of mountains on Maui, Hawaii
(l)M
ike
Seve
rns/
Dorli
ng K
inde
rsle
y/Ge
tty Im
ages
, (r)
Bill
Ross
/COR
BIS
0376_0380_ESGEU_S_C14_S1_658713.indd 3790376_0380_ESGEU_S_C14_S1_658713.indd 379 2/16/11 12:22 PM2/16/11 12:22 PM
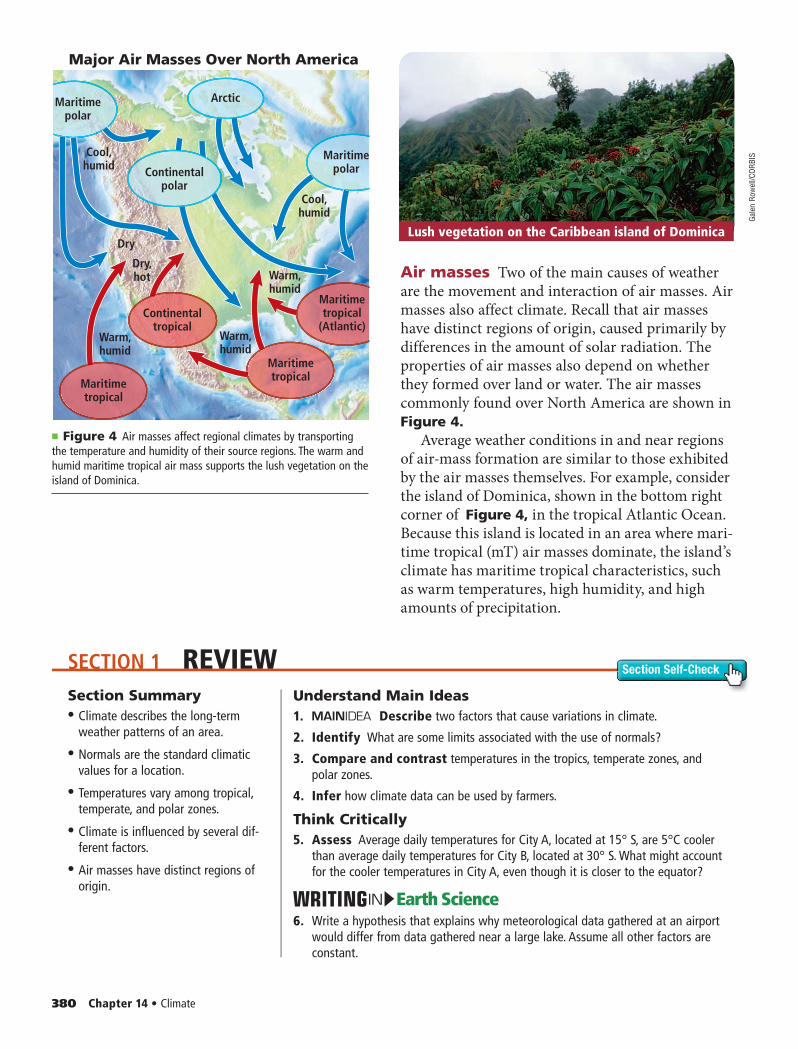
Major Air Masses Over North America
Maritimepolar
Continentalpolar
Continentaltropical
Maritimetropical
Maritimetropical
Maritimetropical
(Atlantic)
Maritimepolar
Arctic
Cool,humid
Cool,humid
Warm,humid
Warm,humid
Warm,humid
Dry,hot
Dry
SECTION 1 REVIEW Section Self-Check
380 Chapter 14 • Climate
Air masses Two of the main causes of weather are the movement and interaction of air masses. Air masses also affect climate. Recall that air masses have distinct regions of origin, caused primarily by differences in the amount of solar radiation. The properties of air masses also depend on whether they formed over land or water. The air masses commonly found over North America are shown in Figure 4.
Average weather conditions in and near regions of air-mass formation are similar to those exhibited by the air masses themselves. For example, consider the island of Dominica, shown in the bottom right corner of Figure 4, in the tropical Atlantic Ocean. Because this island is located in an area where mari-time tropical (mT) air masses dominate, the island’s climate has maritime tropical characteristics, such as warm temperatures, high humidity, and high amounts of precipitation.
■ Figure 4 Air masses affect regional climates by transporting the temperature and humidity of their source regions. The warm and humid maritime tropical air mass supports the lush vegetation on the island of Dominica.
Lush vegetation on the Caribbean island of Dominica
Section Summary• • Climate describes the long-term
weather patterns of an area.
• • Normals are the standard climatic values for a location.
• • Temperatures vary among tropical, temperate, and polar zones.
• • Climate is influenced by several dif-ferent factors.
• • Air masses have distinct regions of origin.
Understand Main Ideas1. Describe two factors that cause variations in climate.
2. Identify What are some limits associated with the use of normals?
3. Compare and contrast temperatures in the tropics, temperate zones, and polar zones.
4. Infer how climate data can be used by farmers.
Think Critically5. Assess Average daily temperatures for City A, located at 15° S, are 5°C cooler
than average daily temperatures for City B, located at 30° S. What might account for the cooler temperatures in City A, even though it is closer to the equator?
Earth ScienceIN6. Write a hypothesis that explains why meteorological data gathered at an airport
would differ from data gathered near a large lake. Assume all other factors are constant.
Gale
n Ro
wel
l/COR
BIS
0376_0380_ESGEU_S_C14_S1_658713.indd 3800376_0380_ESGEU_S_C14_S1_658713.indd 380 2/16/11 12:22 PM2/16/11 12:22 PM
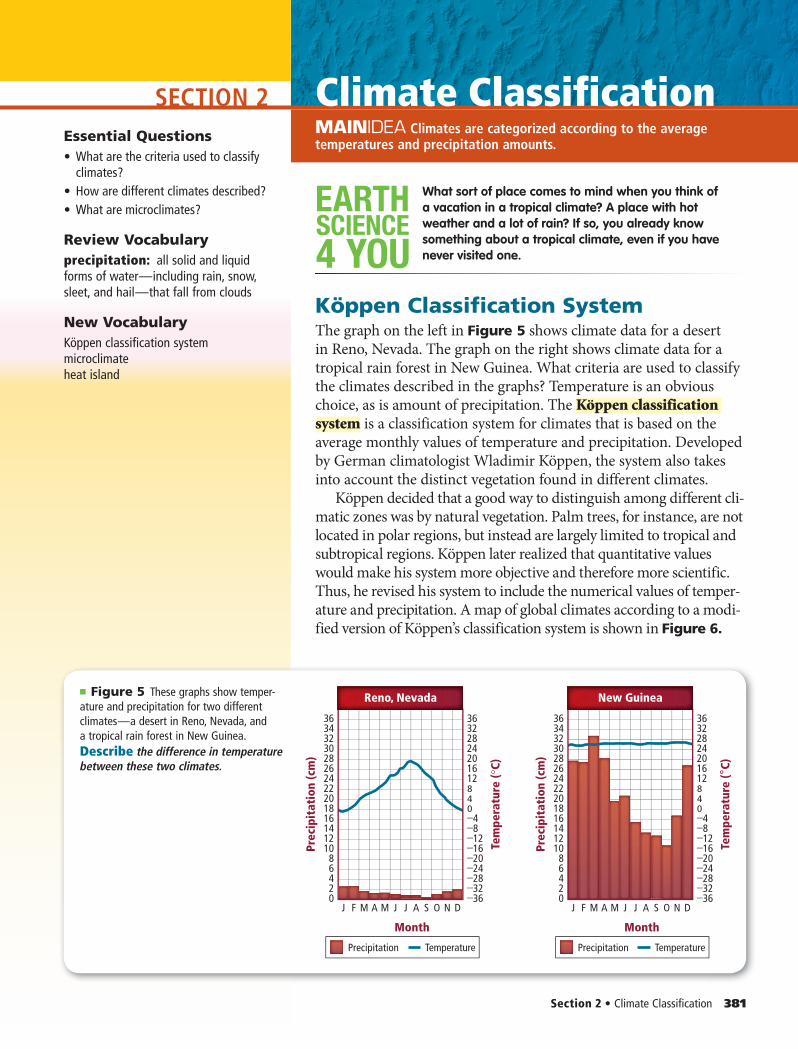
SECTION 2
Section 2 • Climate Classification 381
MAINIDEA Energy is transferred throughout Earth’s atmosphere.
Climate ClassificationMAINIDEA Climates are categorized according to the average temperatures and precipitation amounts.
SCIENCE
4 YOU
EARTH What sort of place comes to mind when you think of a vacation in a tropical climate? A place with hot weather and a lot of rain? If so, you already know something about a tropical climate, even if you have never visited one.
Köppen Classification SystemThe graph on the left in Figure 5 shows climate data for a desert in Reno, Nevada. The graph on the right shows climate data for a tropical rain forest in New Guinea. What criteria are used to classify the climates described in the graphs? Temperature is an obvious choice, as is amount of precipitation. The Köppen classification system is a classification system for climates that is based on the average monthly values of temperature and precipitation. Developed by German climatologist Wladimir Köppen, the system also takes into account the distinct vegetation found in different climates.
Köppen decided that a good way to distinguish among different cli-matic zones was by natural vegetation. Palm trees, for instance, are not located in polar regions, but instead are largely limited to tropical and subtropical regions. Köppen later realized that quantitative values would make his system more objective and therefore more scientific. Thus, he revised his system to include the numerical values of temper-ature and precipitation. A map of global climates according to a modi-fied version of Köppen’s classification system is shown in Figure 6.
Essential Questions• What are the criteria used to classify
climates?• How are different climates described?• What are microclimates?
Review Vocabularyprecipitation: all solid and liquid forms of water — including rain, snow, sleet, and hail — that fall from clouds
New VocabularyKöppen classification systemmicroclimateheat island
Precipitation Temperature
Reno, Nevada
Prec
ipit
atio
n (c
m)
Tem
pera
ture
(C)
Month
3632282420161284
04812162024283236
02468
1012141618202224262830323436
DNOSAJJMAMFJ
Precipitation Temperature
New Guinea
Prec
ipit
atio
n (c
m)
Tem
pera
ture
(°C)
Month
3632282420161284
04812162024283236
02468
1012141618202224262830323436
DNOSAJJMAMFJ
■ Figure 5 These graphs show temper-ature and precipitation for two different climates — a desert in Reno, Nevada, and a tropical rain forest in New Guinea.Describe the difference in temperature between these two climates.
0381_0386_ESGEU_S_C14_S2_658713.indd 3810381_0386_ESGEU_S_C14_S2_658713.indd 381 2/16/11 12:23 PM2/16/11 12:23 PM
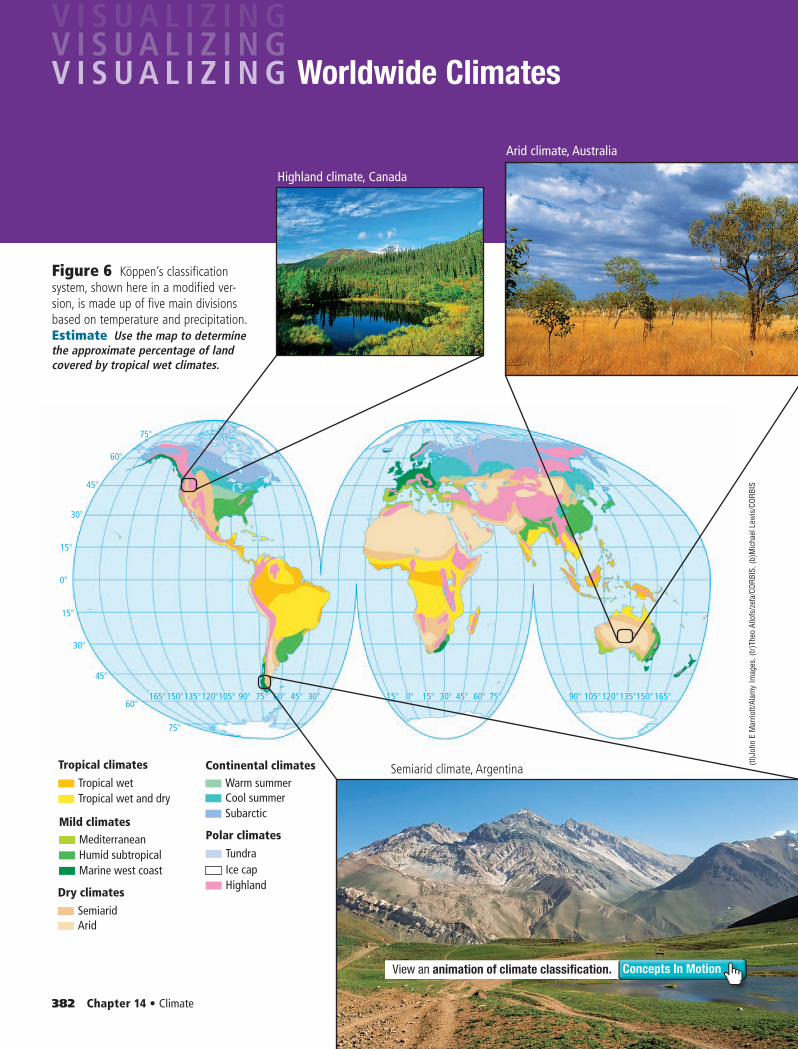
Tropical climates
Tropical wetTropical wet and dry
Dry climates
SemiaridArid
Mild climatesMediterraneanHumid subtropicalMarine west coast
Continental climatesWarm summerCool summerSubarctic
Polar climates
TundraIce capHighland
0°
15°
15°
30°
30°
45°
45°
60°
60°
75°
75°
75° 75°60° 60°45° 45°30° 30°15° 15°0°90° 90°105° 105°120° 120°135° 135°150° 150°165° 165°
Concepts In MotionView an animation of climate classification.
382 Chapter 14 • Climate
Worldwide Climates
Figure 6 Köppen’s classification system, shown here in a modified ver-sion, is made up of five main divisions based on temperature and precipitation.Estimate Use the map to determine the approximate percentage of land covered by tropical wet climates.
Highland climate, Canada
Arid climate, Australia
Semiarid climate, Argentina(tl
)Joh
n E
Mar
riott/
Alam
y Im
ages
, (tr)
Theo
Allo
fs/z
efa/
CORB
IS, (
b)M
icha
el L
ewis
/COR
BIS
0381_0386_ESGEU_S_C14_S2_658713.indd 3820381_0386_ESGEU_S_C14_S2_658713.indd 382 2/16/11 12:23 PM2/16/11 12:23 PM
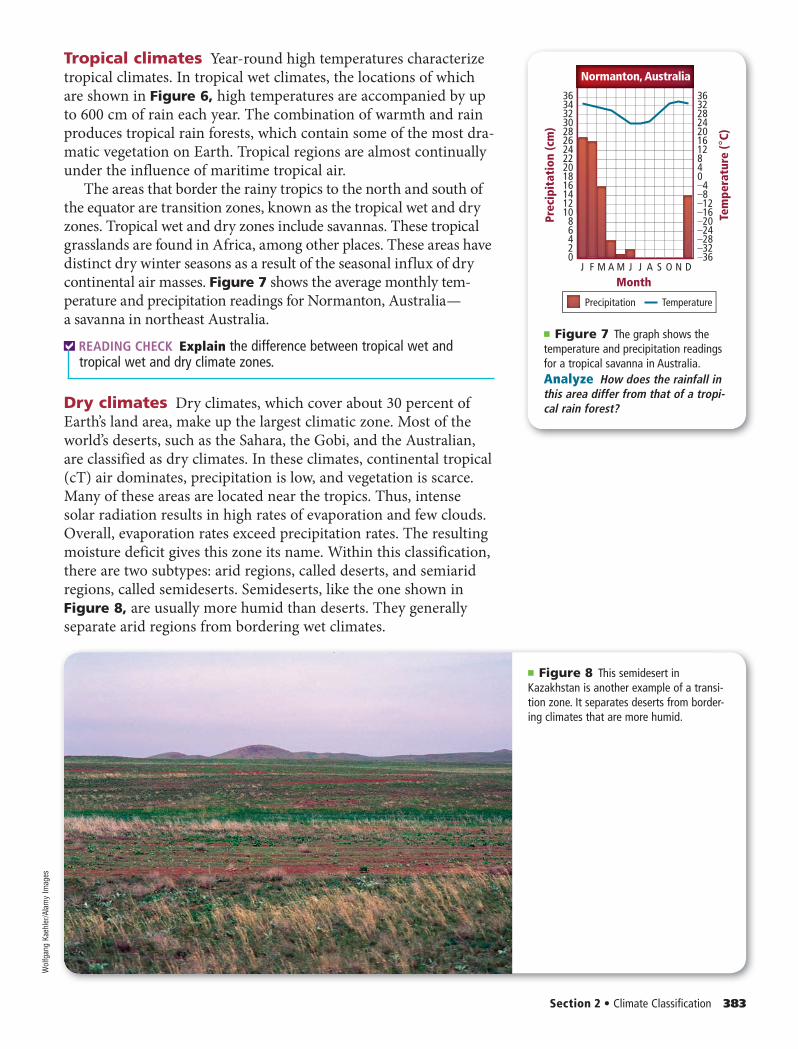
Precipitation Temperature
Prec
ipit
atio
n (c
m)
Tem
pera
ture
(°C)
Month
Normanton, Australia
3632282420161284
04812162024283236
02468
1012141618202224262830323436
DNOSAJJMAMFJ
Section 2 • Climate Classification 383
Tropical climates Year-round high temperatures characterize tropical climates. In tropical wet climates, the locations of which are shown in Figure 6, high temperatures are accompanied by up to 600 cm of rain each year. The combination of warmth and rain produces tropical rain forests, which contain some of the most dra-matic vegetation on Earth. Tropical regions are almost continually under the influence of maritime tropical air.
The areas that border the rainy tropics to the north and south of the equator are transition zones, known as the tropical wet and dry zones. Tropical wet and dry zones include savannas. These tropical grasslands are found in Africa, among other places. These areas have distinct dry winter seasons as a result of the seasonal influx of dry continental air masses. Figure 7 shows the average monthly tem-perature and precipitation readings for Normanton, Australia — a savanna in northeast Australia.
READING CHECK Explain the difference between tropical wet and tropical wet and dry climate zones.
Dry climates Dry climates, which cover about 30 percent of Earth’s land area, make up the largest climatic zone. Most of the world’s deserts, such as the Sahara, the Gobi, and the Australian, are classified as dry climates. In these climates, continental tropical (cT) air dominates, precipitation is low, and vegetation is scarce. Many of these areas are located near the tropics. Thus, intense solar radiation results in high rates of evaporation and few clouds. Overall, evaporation rates exceed precipitation rates. The resulting moisture deficit gives this zone its name. Within this classification, there are two subtypes: arid regions, called deserts, and semiarid regions, called semideserts. Semideserts, like the one shown in Figure 8, are usually more humid than deserts. They generally separate arid regions from bordering wet climates.
■ Figure 7 The graph shows the temperature and precipitation readings for a tropical savanna in Australia.Analyze How does the rainfall in this area differ from that of a tropi-cal rain forest?
■ Figure 8 This semidesert in Kazakhstan is another example of a transi-tion zone. It separates deserts from border-ing climates that are more humid.
Wol
fgan
g Ka
ehle
r/Ala
my
Imag
es
0381_0386_ESGEU_S_C14_S2_658713.indd 3830381_0386_ESGEU_S_C14_S2_658713.indd 383 2/16/11 12:23 PM2/16/11 12:23 PM
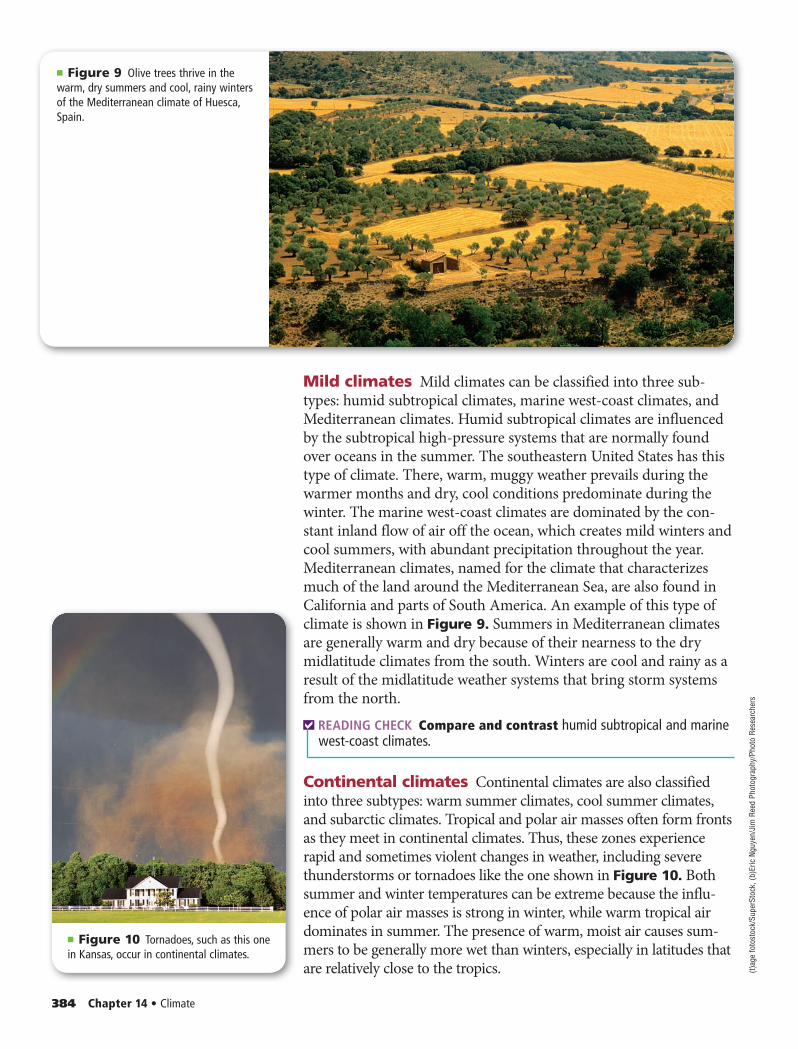
384 Chapter 14 • Climate
Mild climates Mild climates can be classified into three sub-types: humid subtropical climates, marine west-coast climates, and Mediterranean climates. Humid subtropical climates are influenced by the subtropical high-pressure systems that are normally found over oceans in the summer. The southeastern United States has this type of climate. There, warm, muggy weather prevails during the warmer months and dry, cool conditions predominate during the winter. The marine west-coast climates are dominated by the con-stant inland flow of air off the ocean, which creates mild winters and cool summers, with abundant precipitation throughout the year. Mediterranean climates, named for the climate that characterizes much of the land around the Mediterranean Sea, are also found in California and parts of South America. An example of this type of climate is shown in Figure 9. Summers in Mediterranean climates are generally warm and dry because of their nearness to the dry midlatitude climates from the south. Winters are cool and rainy as a result of the midlatitude weather systems that bring storm systems from the north.
READING CHECK Compare and contrast humid subtropical and marine west-coast climates.
Continental climates Continental climates are also classified into three subtypes: warm summer climates, cool summer climates, and subarctic climates. Tropical and polar air masses often form fronts as they meet in continental climates. Thus, these zones experience rapid and sometimes violent changes in weather, including severe thunderstorms or tornadoes like the one shown in Figure 10. Both summer and winter temperatures can be extreme because the influ-ence of polar air masses is strong in winter, while warm tropical air dominates in summer. The presence of warm, moist air causes sum-mers to be generally more wet than winters, especially in latitudes that are relatively close to the tropics.
■ Figure 9 Olive trees thrive in the warm, dry summers and cool, rainy winters of the Mediterranean climate of Huesca, Spain.
■ Figure 10 Tornadoes, such as this one in Kansas, occur in continental climates.
(t)ag
e fo
tost
ock/
Supe
rSto
ck, (
b)Er
ic N
guye
n/Ji
m R
eed
Phot
ogra
phy/
Phot
o Re
sear
cher
s
0381_0386_ESGEU_S_C14_S2_658713.indd 3840381_0386_ESGEU_S_C14_S2_658713.indd 384 2/16/11 12:23 PM2/16/11 12:23 PM
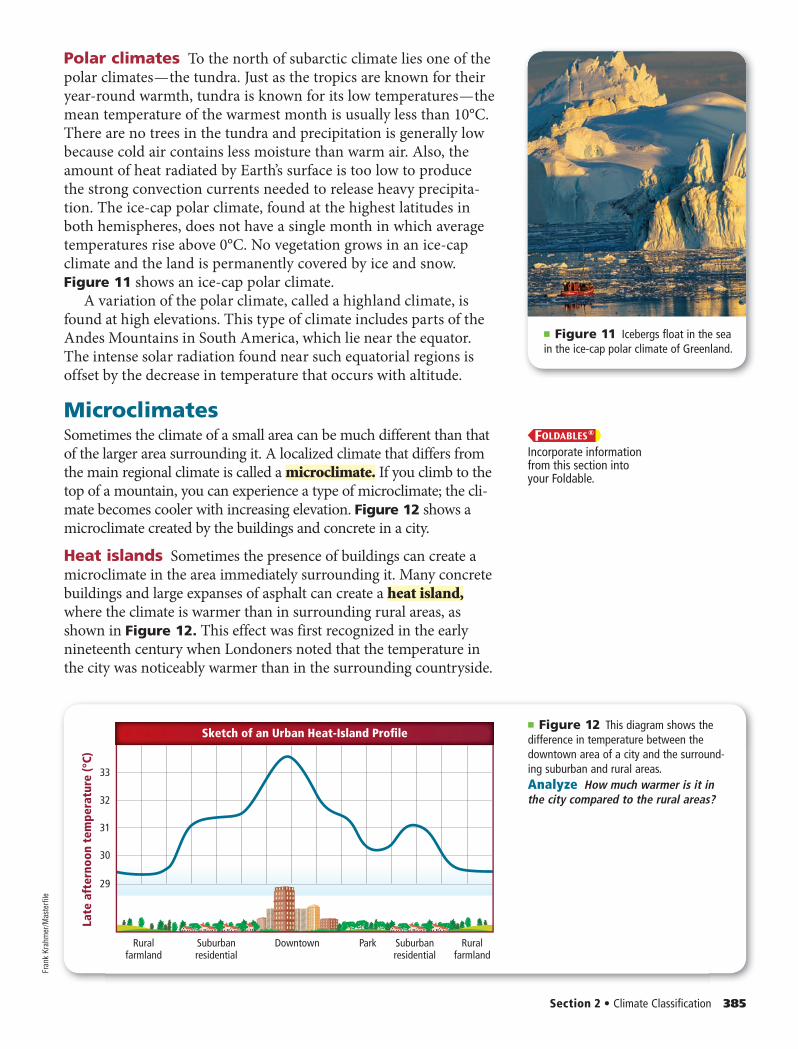
Ruralfarmland
Suburbanresidential
Downtown Park Suburbanresidential
Ruralfarmland
Late
aft
erno
on t
empe
ratu
re (°
C)
Sketch of an Urban Heat-Island Profile
33
32
31
30
29
Section 2 • Climate Classification 385
Polar climates To the north of subarctic climate lies one of the polar climates — the tundra. Just as the tropics are known for their year-round warmth, tundra is known for its low temperatures — the mean temperature of the warmest month is usually less than 10°C. There are no trees in the tundra and precipitation is generally low because cold air contains less moisture than warm air. Also, the amount of heat radiated by Earth’s surface is too low to produce the strong convection currents needed to release heavy precipita-tion. The ice-cap polar climate, found at the highest latitudes in both hemispheres, does not have a single month in which average temperatures rise above 0°C. No vegetation grows in an ice-cap climate and the land is permanently covered by ice and snow. Figure 11 shows an ice-cap polar climate.
A variation of the polar climate, called a highland climate, is found at high elevations. This type of climate includes parts of the Andes Mountains in South America, which lie near the equator. The intense solar radiation found near such equatorial regions is offset by the decrease in temperature that occurs with altitude.
MicroclimatesSometimes the climate of a small area can be much different than that of the larger area surrounding it. A localized climate that differs from the main regional climate is called a microclimate. If you climb to the top of a mountain, you can experience a type of microclimate; the cli-mate becomes cooler with increasing elevation. Figure 12 shows a microclimate created by the buildings and concrete in a city.
Heat islands Sometimes the presence of buildings can create a microclimate in the area immediately surrounding it. Many concrete buildings and large expanses of asphalt can create a heat island,where the climate is warmer than in surrounding rural areas, as shown in Figure 12. This effect was first recognized in the early nineteenth century when Londoners noted that the temperature in the city was noticeably warmer than in the surrounding countryside.
■ Figure 12 This diagram shows the difference in temperature between the downtown area of a city and the surround-ing suburban and rural areas.Analyze How much warmer is it in the city compared to the rural areas?
■ Figure 11 Icebergs float in the sea in the ice-cap polar climate of Greenland.
FOLDABLESIncorporate information from this section into your Foldable.
Fran
k Kr
ahm
er/M
aste
rfile
0381_0386_ESGEU_S_C14_S2_658713.indd 3850381_0386_ESGEU_S_C14_S2_658713.indd 385 2/16/11 12:23 PM2/16/11 12:23 PM
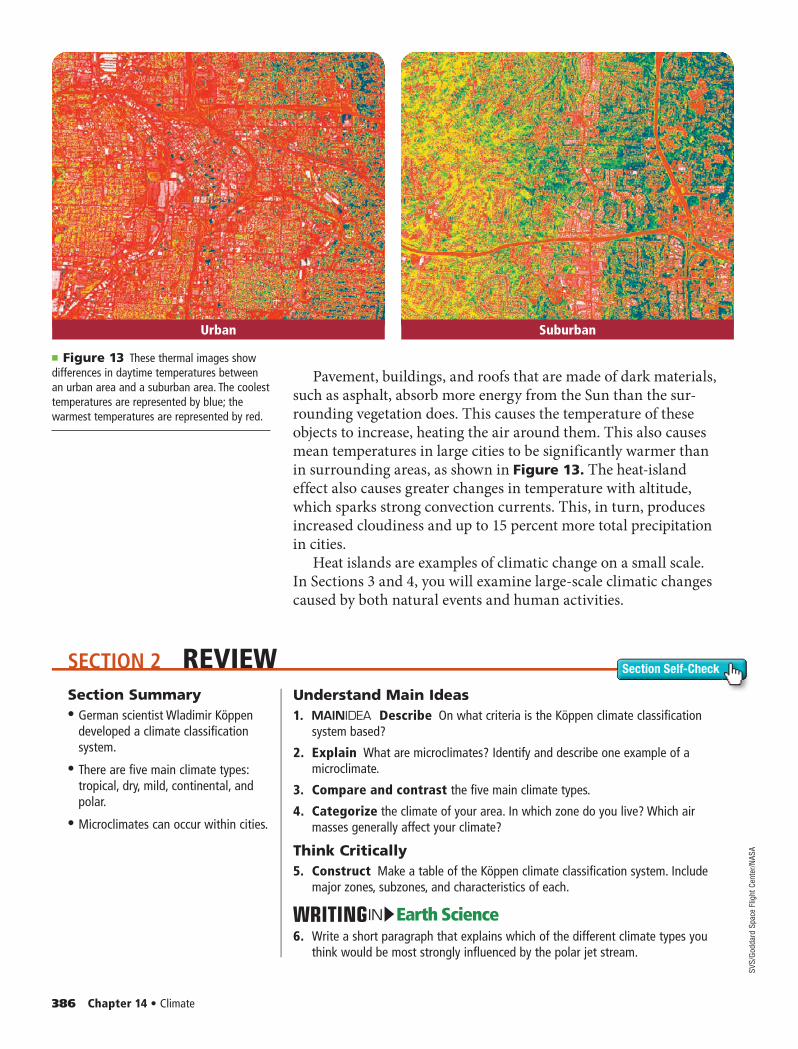
Urban Suburban
SECTION 2 REVIEW Section Self-Check
386 Chapter 14 • Climate
Pavement, buildings, and roofs that are made of dark materials, such as asphalt, absorb more energy from the Sun than the sur-rounding vegetation does. This causes the temperature of these objects to increase, heating the air around them. This also causes mean temperatures in large cities to be significantly warmer than in surrounding areas, as shown in Figure 13. The heat-island effect also causes greater changes in temperature with altitude, which sparks strong convection currents. This, in turn, produces increased cloudiness and up to 15 percent more total precipitation in cities.
Heat islands are examples of climatic change on a small scale. In Sections 3 and 4, you will examine large-scale climatic changes caused by both natural events and human activities.
■ Figure 13 These thermal images show differences in daytime temperatures between an urban area and a suburban area. The coolest temperatures are represented by blue; the warmest temperatures are represented by red.
Section Summary• • German scientist Wladimir Köppen
developed a climate classification system.
• • There are five main climate types: tropical, dry, mild, continental, and polar.
• • Microclimates can occur within cities.
Understand Main Ideas1. Describe On what criteria is the Köppen climate classification
system based?
2. Explain What are microclimates? Identify and describe one example of a microclimate.
3. Compare and contrast the five main climate types.
4. Categorize the climate of your area. In which zone do you live? Which air masses generally affect your climate?
Think Critically5. Construct Make a table of the Köppen climate classification system. Include
major zones, subzones, and characteristics of each.
Earth ScienceIN6. Write a short paragraph that explains which of the different climate types you
think would be most strongly influenced by the polar jet stream.
SVS/
Godd
ard
Spac
e Fl
ight
Cen
ter/N
ASA
0381_0386_ESGEU_S_C14_S2_658713.indd 3860381_0386_ESGEU_S_C14_S2_658713.indd 386 2/16/11 12:23 PM2/16/11 12:23 PM
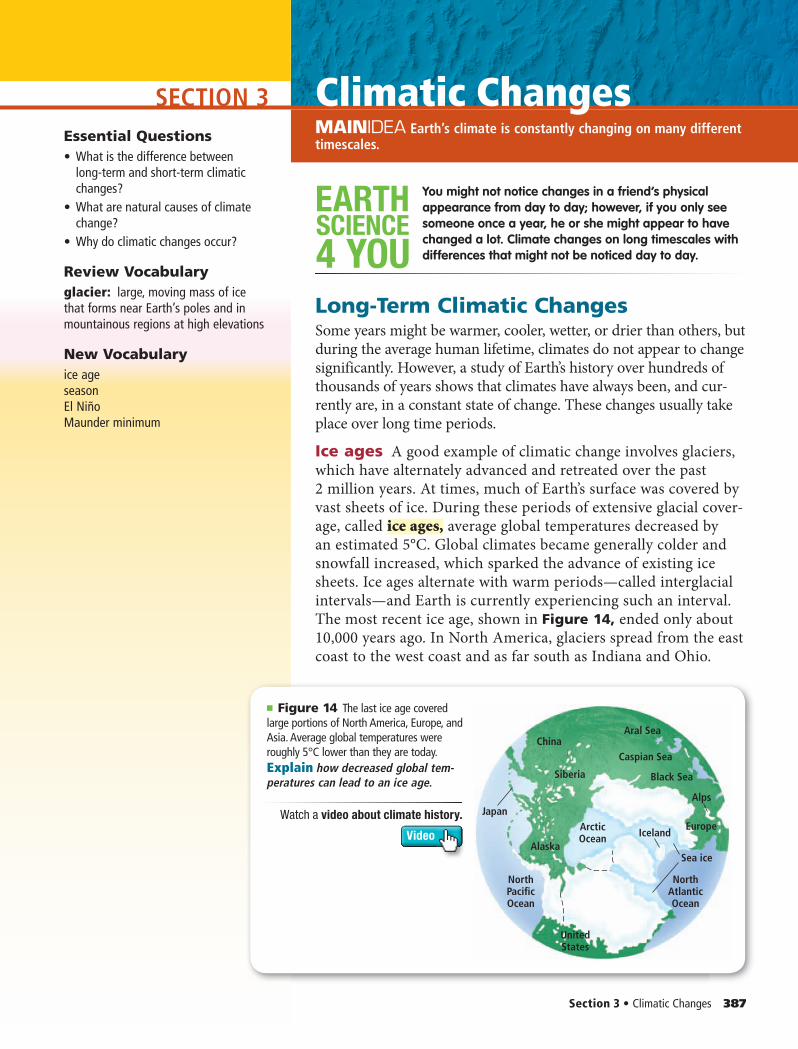
SECTION 3
Section 3 • Climatic Changes 387
MAINIDEA Energy is transferred throughout Earth’s atmosphere.
Climatic ChangesMAINIDEA Earth’s climate is constantly changing on many different timescales.
SCIENCE
4 YOU
EARTH You might not notice changes in a friend’s physical appearance from day to day; however, if you only see someone once a year, he or she might appear to have changed a lot. Climate changes on long timescales with differences that might not be noticed day to day.
Long-Term Climatic ChangesSome years might be warmer, cooler, wetter, or drier than others, but during the average human lifetime, climates do not appear to change significantly. However, a study of Earth’s history over hundreds of thousands of years shows that climates have always been, and cur-rently are, in a constant state of change. These changes usually take place over long time periods.
Ice ages A good example of climatic change involves glaciers, which have alternately advanced and retreated over the past 2 million years. At times, much of Earth’s surface was covered by vast sheets of ice. During these periods of extensive glacial cover-age, called ice ages, average global temperatures decreased by an estimated 5°C. Global climates became generally colder and snowfall increased, which sparked the advance of existing ice sheets. Ice ages alternate with warm periods—called interglacial intervals—and Earth is currently experiencing such an interval. The most recent ice age, shown in Figure 14, ended only about 10,000 years ago. In North America, glaciers spread from the east coast to the west coast and as far south as Indiana and Ohio.
Essential Questions• What is the difference between
long-term and short-term climatic changes?
• What are natural causes of climate change?
• Why do climatic changes occur?
Review Vocabularyglacier: large, moving mass of ice that forms near Earth’s poles and in mountainous regions at high elevations
New Vocabularyice ageseasonEl NiñoMaunder minimum
Black Sea
Alps
Caspian Sea
Sea ice
Aral Sea
Europe
China
Siberia
JapanArcticOcean
NorthAtlanticOcean
NorthPacificOcean
Iceland
UnitedStates
Alaska
■ Figure 14 The last ice age covered large portions of North America, Europe, and Asia. Average global temperatures were roughly 5°C lower than they are today. Explain how decreased global tem-peratures can lead to an ice age.
Video
Watch a video about climate history.
0387_0392_ESGEU_S_C14_S3_658713.indd 3870387_0392_ESGEU_S_C14_S3_658713.indd 387 2/16/11 12:24 PM2/16/11 12:24 PM
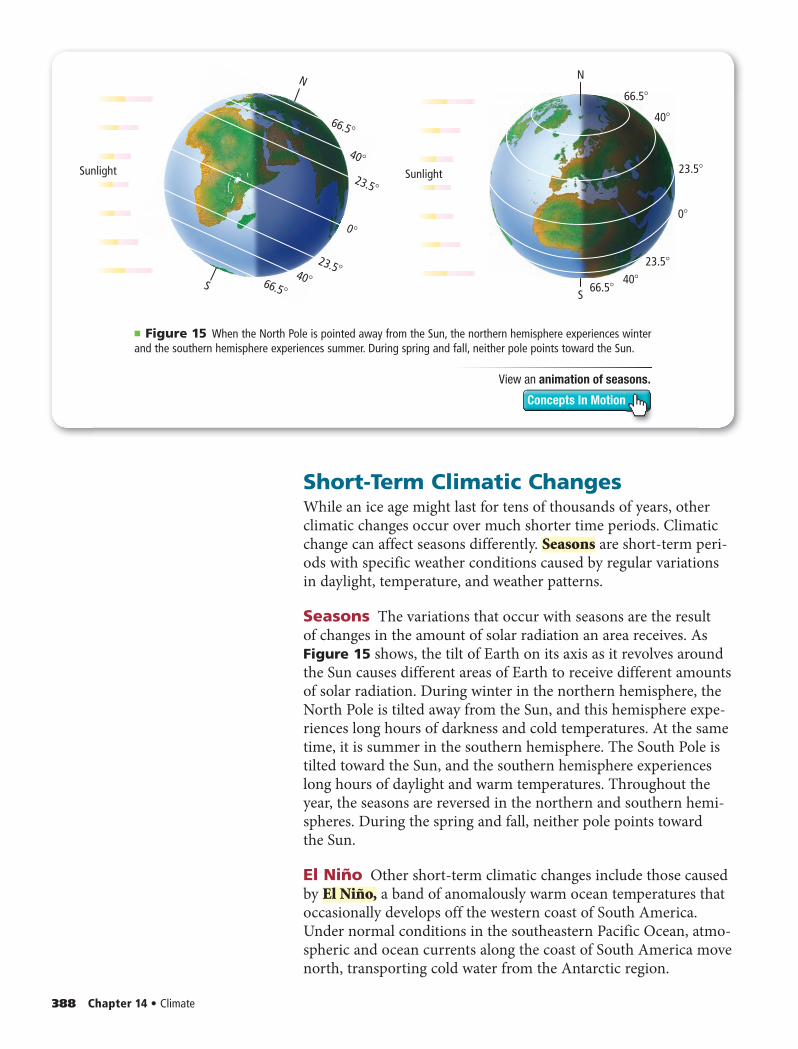
388 Chapter 14 • Climate
Short-Term Climatic ChangesWhile an ice age might last for tens of thousands of years, other climatic changes occur over much shorter time periods. Climatic change can affect seasons differently. Seasons are short-term peri-ods with specific weather conditions caused by regular variations in daylight, temperature, and weather patterns.
Seasons The variations that occur with seasons are the result of changes in the amount of solar radiation an area receives. As Figure 15 shows, the tilt of Earth on its axis as it revolves around the Sun causes different areas of Earth to receive different amounts of solar radiation. During winter in the northern hemisphere, the North Pole is tilted away from the Sun, and this hemisphere expe-riences long hours of darkness and cold temperatures. At the same time, it is summer in the southern hemisphere. The South Pole is tilted toward the Sun, and the southern hemisphere experiences long hours of daylight and warm temperatures. Throughout the year, the seasons are reversed in the northern and southern hemi-spheres. During the spring and fall, neither pole points toward the Sun.
El Niño Other short-term climatic changes include those caused by El Niño, a band of anomalously warm ocean temperatures that occasionally develops off the western coast of South America. Under normal conditions in the southeastern Pacific Ocean, atmo-spheric and ocean currents along the coast of South America move north, transporting cold water from the Antarctic region.
■ Figure 15 When the North Pole is pointed away from the Sun, the northern hemisphere experiences winter and the southern hemisphere experiences summer. During spring and fall, neither pole points toward the Sun.
N
S
0
Sunlight23.5
23.5
40
40
66.5
66.5
N
S
0
23.5
23.5
40
40
66.5
66.5
Sunlight
View an animation of seasons.
Concepts In Motion
0387_0392_ESGEU_S_C14_S3_658713.indd 3880387_0392_ESGEU_S_C14_S3_658713.indd 388 2/16/11 12:24 PM2/16/11 12:24 PM
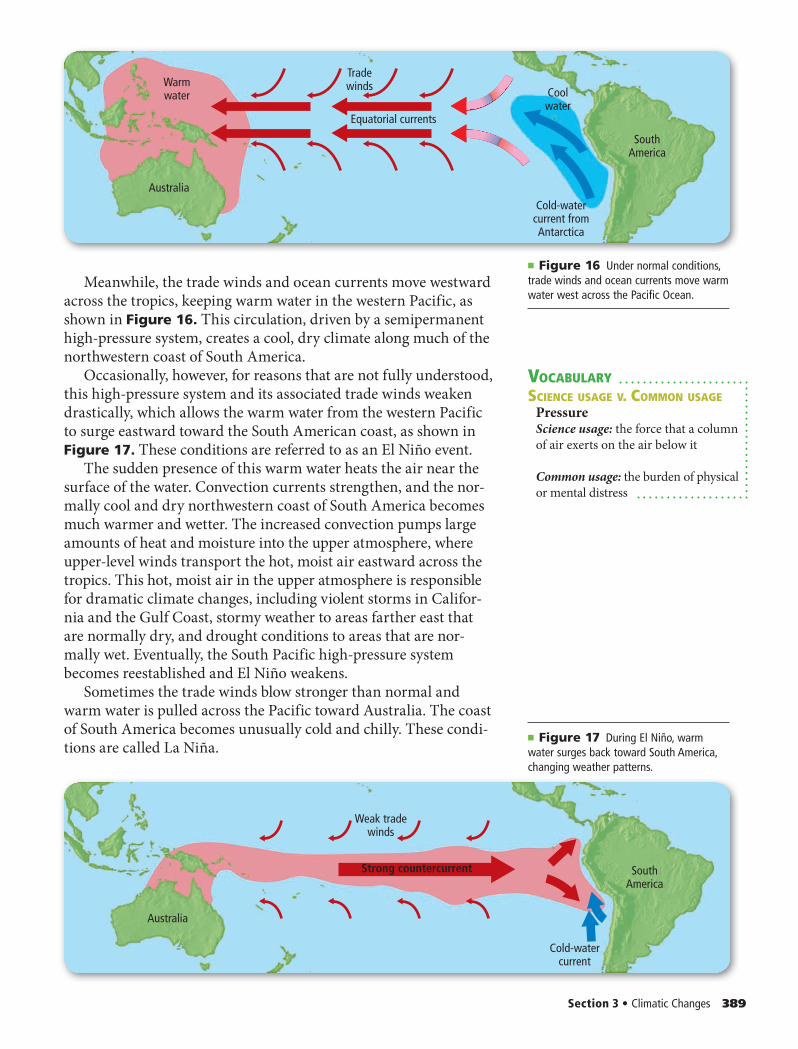
Warmwater Cool
water
Cold-watercurrent fromAntarctica
Australia
SouthAmerica
Tradewinds
Equatorial currents
Cold-watercurrent
Australia
SouthAmerica
Weak tradewinds
Strong countercurrent
Section 3 • Climatic Changes 389
Meanwhile, the trade winds and ocean currents move westward across the tropics, keeping warm water in the western Pacific, as shown in Figure 16. This circulation, driven by a semipermanent high-pressure system, creates a cool, dry climate along much of the northwestern coast of South America.
Occasionally, however, for reasons that are not fully understood, this high-pressure system and its associated trade winds weaken drastically, which allows the warm water from the western Pacific to surge eastward toward the South American coast, as shown in Figure 17. These conditions are referred to as an El Niño event.
The sudden presence of this warm water heats the air near the surface of the water. Convection currents strengthen, and the nor-mally cool and dry northwestern coast of South America becomes much warmer and wetter. The increased convection pumps large amounts of heat and moisture into the upper atmosphere, where upper-level winds transport the hot, moist air eastward across the tropics. This hot, moist air in the upper atmosphere is responsible for dramatic climate changes, including violent storms in Califor-nia and the Gulf Coast, stormy weather to areas farther east that are normally dry, and drought conditions to areas that are nor-mally wet. Eventually, the South Pacific high-pressure system becomes reestablished and El Niño weakens.
Sometimes the trade winds blow stronger than normal and warm water is pulled across the Pacific toward Australia. The coast of South America becomes unusually cold and chilly. These condi-tions are called La Niña.
■ Figure 17 During El Niño, warm water surges back toward South America, changing weather patterns.
■ Figure 16 Under normal conditions, trade winds and ocean currents move warm water west across the Pacific Ocean.
VOCABULARYSCIENCE USAGE V. COMMON USAGE
PressureScience usage: the force that a column of air exerts on the air below it
Common usage: the burden of physical or mental distress
0387_0392_ESGEU_S_C14_S3_658713.indd 3890387_0392_ESGEU_S_C14_S3_658713.indd 389 2/16/11 12:24 PM2/16/11 12:24 PM
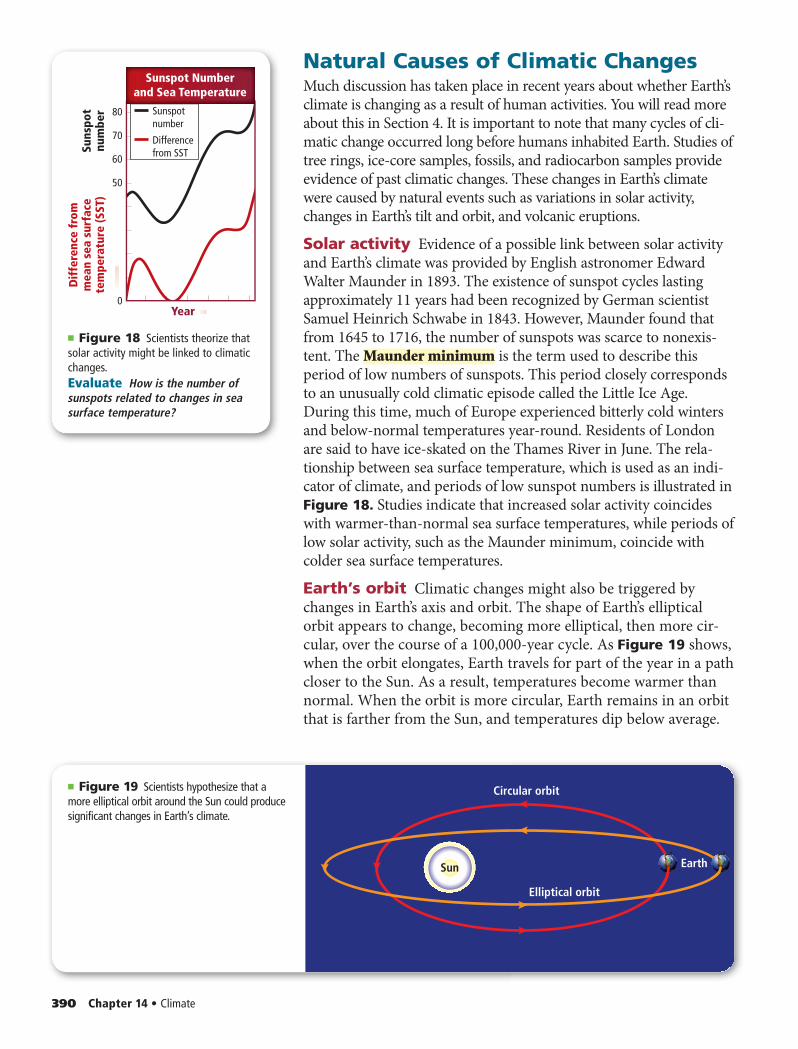
Earth
Circular orbit
Elliptical orbit
Sun
390 Chapter 14 • Climate
Natural Causes of Climatic ChangesMuch discussion has taken place in recent years about whether Earth’s climate is changing as a result of human activities. You will read more about this in Section 4. It is important to note that many cycles of cli-matic change occurred long before humans inhabited Earth. Studies of tree rings, ice-core samples, fossils, and radiocarbon samples provide evidence of past climatic changes. These changes in Earth’s climate were caused by natural events such as variations in solar activity, changes in Earth’s tilt and orbit, and volcanic eruptions.
Solar activity Evidence of a possible link between solar activity and Earth’s climate was provided by English astronomer Edward Walter Maunder in 1893. The existence of sunspot cycles lasting approximately 11 years had been recognized by German scientist Samuel Heinrich Schwabe in 1843. However, Maunder found that from 1645 to 1716, the number of sunspots was scarce to nonexis-tent. The Maunder minimum is the term used to describe this period of low numbers of sunspots. This period closely corresponds to an unusually cold climatic episode called the Little Ice Age. During this time, much of Europe experienced bitterly cold winters and below-normal temperatures year-round. Residents of London are said to have ice-skated on the Thames River in June. The rela-tionship between sea surface temperature, which is used as an indi-cator of climate, and periods of low sunspot numbers is illustrated in Figure 18. Studies indicate that increased solar activity coincides with warmer-than-normal sea surface temperatures, while periods of low solar activity, such as the Maunder minimum, coincide with colder sea surface temperatures.
Earth’s orbit Climatic changes might also be triggered by changes in Earth’s axis and orbit. The shape of Earth’s elliptical orbit appears to change, becoming more elliptical, then more cir-cular, over the course of a 100,000-year cycle. As Figure 19 shows, when the orbit elongates, Earth travels for part of the year in a path closer to the Sun. As a result, temperatures become warmer than normal. When the orbit is more circular, Earth remains in an orbit that is farther from the Sun, and temperatures dip below average.
■ Figure 19 Scientists hypothesize that a more elliptical orbit around the Sun could produce significant changes in Earth’s climate.
■ Figure 18 Scientists theorize that solar activity might be linked to climatic changes.Evaluate How is the number of sunspots related to changes in sea surface temperature?
Sunspotnumber
Differencefrom SSTSu
nspo
tnu
mbe
r
Dif
fere
nce
from
mea
n se
a su
rfac
ete
mpe
ratu
re (S
ST)
Year
80
70
60
50
0
Sunspot Numberand Sea Temperature
0387_0392_ESGEU_S_C14_S3_658713.indd 3900387_0392_ESGEU_S_C14_S3_658713.indd 390 2/21/11 9:54 AM2/21/11 9:54 AM
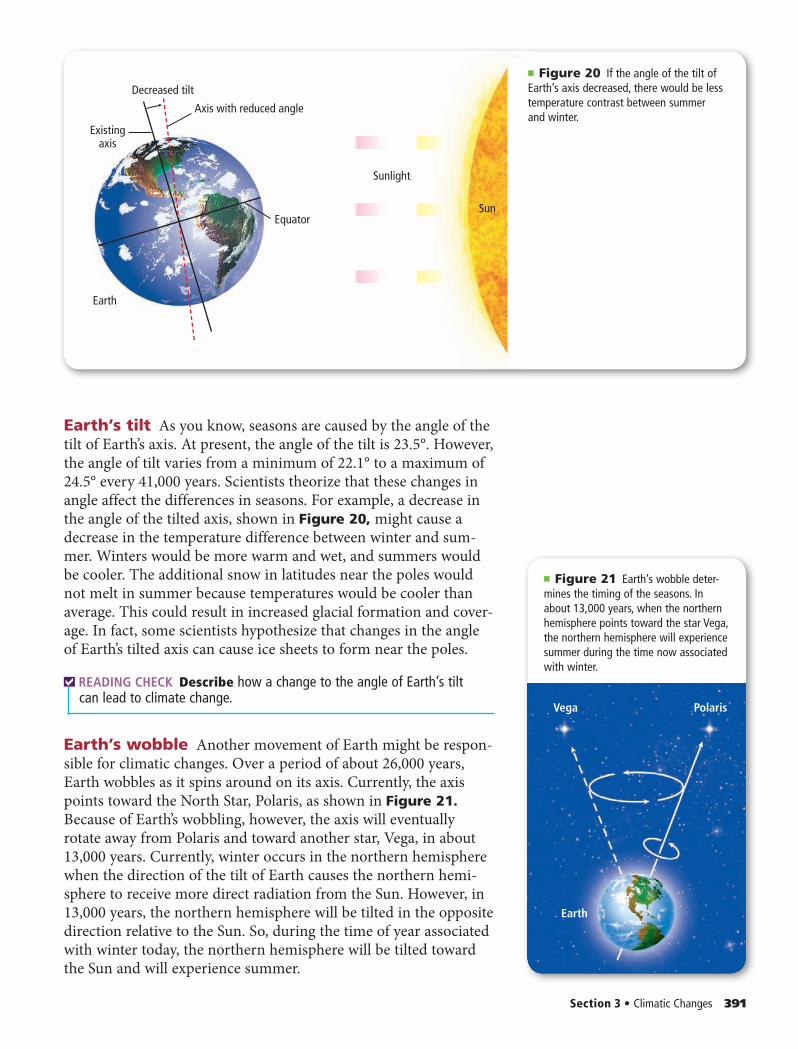
Decreased tilt
Axis with reduced angle
Equator
Sunlight
Sun
Earth
Existingaxis
PolarisVega
Earth
Section 3 • Climatic Changes 391
Earth’s tilt As you know, seasons are caused by the angle of the tilt of Earth’s axis. At present, the angle of the tilt is 23.5°. However, the angle of tilt varies from a minimum of 22.1° to a maximum of 24.5° every 41,000 years. Scientists theorize that these changes in angle affect the differences in seasons. For example, a decrease in the angle of the tilted axis, shown in Figure 20, might cause a decrease in the temperature difference between winter and sum-mer. Winters would be more warm and wet, and summers would be cooler. The additional snow in latitudes near the poles would not melt in summer because temperatures would be cooler than average. This could result in increased glacial formation and cover-age. In fact, some scientists hypothesize that changes in the angle of Earth’s tilted axis can cause ice sheets to form near the poles.
READING CHECK Describe how a change to the angle of Earth’s tilt can lead to climate change.
Earth’s wobble Another movement of Earth might be respon-sible for climatic changes. Over a period of about 26,000 years, Earth wobbles as it spins around on its axis. Currently, the axis points toward the North Star, Polaris, as shown in Figure 21.Because of Earth’s wobbling, however, the axis will eventually rotate away from Polaris and toward another star, Vega, in about 13,000 years. Currently, winter occurs in the northern hemisphere when the direction of the tilt of Earth causes the northern hemi-sphere to receive more direct radiation from the Sun. However, in 13,000 years, the northern hemisphere will be tilted in the opposite direction relative to the Sun. So, during the time of year associated with winter today, the northern hemisphere will be tilted toward the Sun and will experience summer.
■ Figure 20 If the angle of the tilt of Earth’s axis decreased, there would be less temperature contrast between summer and winter.
■ Figure 21 Earth’s wobble deter-mines the timing of the seasons. In about 13,000 years, when the northern hemisphere points toward the star Vega, the northern hemisphere will experience summer during the time now associated with winter.
0387_0392_ESGEU_S_C14_S3_658713.indd 3910387_0392_ESGEU_S_C14_S3_658713.indd 391 2/16/11 12:24 PM2/16/11 12:24 PM
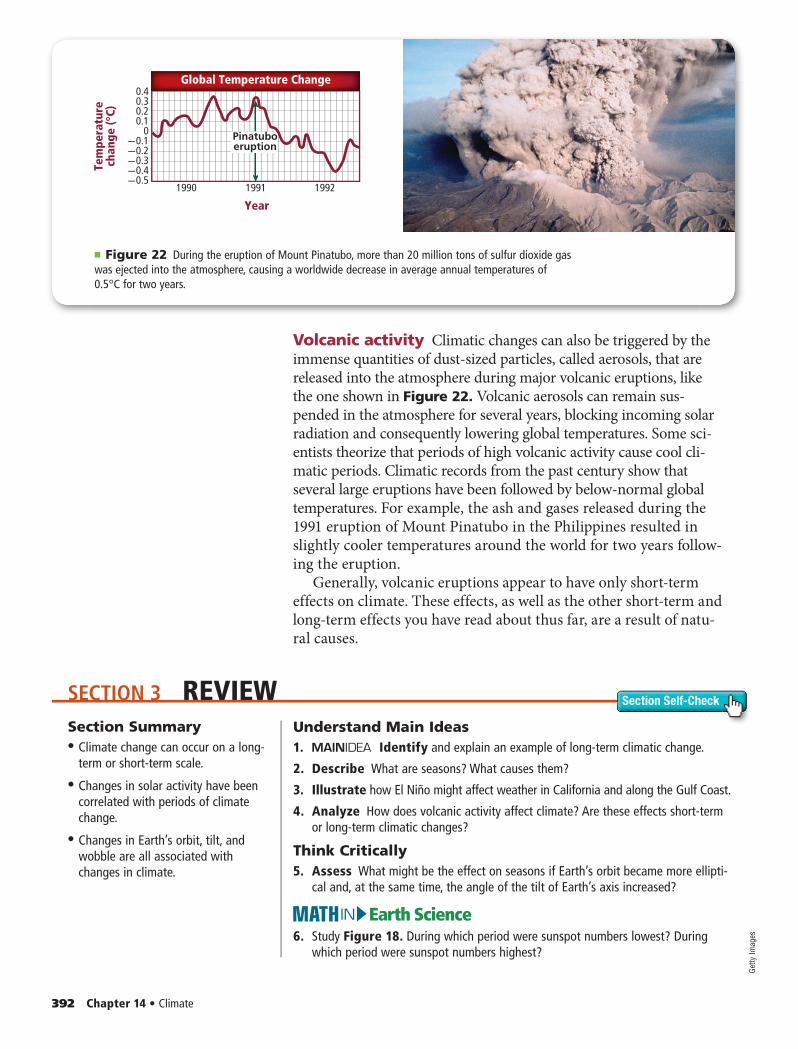
SECTION 3 REVIEW Section Self-Check
1990 1991 1992
Tem
pera
ture
chan
ge (°
C)
Year
-0.4
0.4
-0.5
-0.3-0.2-0.1
00.10.20.3
Global Temperature Change
Pinatuboeruption
392 Chapter 14 • Climate
Volcanic activity Climatic changes can also be triggered by the immense quantities of dust-sized particles, called aerosols, that are released into the atmosphere during major volcanic eruptions, like the one shown in Figure 22. Volcanic aerosols can remain sus-pended in the atmosphere for several years, blocking incoming solar radiation and consequently lowering global temperatures. Some sci-entists theorize that periods of high volcanic activity cause cool cli-matic periods. Climatic records from the past century show that several large eruptions have been followed by below-normal global temperatures. For example, the ash and gases released during the 1991 eruption of Mount Pinatubo in the Philippines resulted in slightly cooler temperatures around the world for two years follow-ing the eruption.
Generally, volcanic eruptions appear to have only short-term effects on climate. These effects, as well as the other short-term and long-term effects you have read about thus far, are a result of natu-ral causes.
■ Figure 22 During the eruption of Mount Pinatubo, more than 20 million tons of sulfur dioxide gas was ejected into the atmosphere, causing a worldwide decrease in average annual temperatures of 0.5°C for two years.
Section Summary• • Climate change can occur on a long-
term or short-term scale.
• • Changes in solar activity have been correlated with periods of climate change.
• • Changes in Earth’s orbit, tilt, and wobble are all associated with changes in climate.
Understand Main Ideas1. Identify and explain an example of long-term climatic change.
2. Describe What are seasons? What causes them?
3. Illustrate how El Niño might affect weather in California and along the Gulf Coast.
4. Analyze How does volcanic activity affect climate? Are these effects short-term or long-term climatic changes?
Think Critically5. Assess What might be the effect on seasons if Earth’s orbit became more ellipti-
cal and, at the same time, the angle of the tilt of Earth’s axis increased?
Earth ScienceIN6. Study Figure 18. During which period were sunspot numbers lowest? During
which period were sunspot numbers highest?
Getty
Imag
es
0387_0392_ESGEU_S_C14_S3_658713.indd 3920387_0392_ESGEU_S_C14_S3_658713.indd 392 2/16/11 12:24 PM2/16/11 12:24 PM
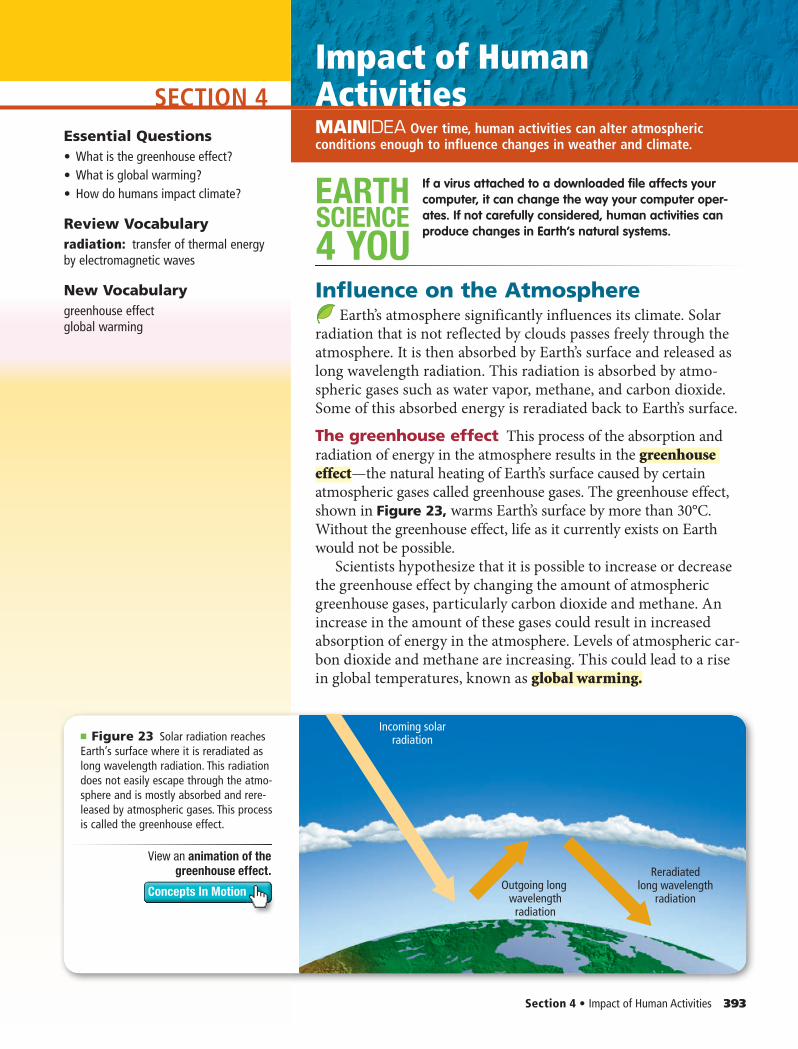
SECTION 4
Outgoing long wavelength
radiation
Reradiatedlong wavelength
radiation
Incoming solarradiation
Section 4 • Impact of Human Activities 393
MAINIDEA Energy is transferred throughout Earth’s atmosphere.Essential Questions• What is the greenhouse effect?• What is global warming?• How do humans impact climate?
Review Vocabularyradiation: transfer of thermal energy by electromagnetic waves
New Vocabularygreenhouse effectglobal warming
Impact of Human ActivitiesMAINIDEA Over time, human activities can alter atmospheric conditions enough to influence changes in weather and climate.
SCIENCE
4 YOU
EARTH If a virus attached to a downloaded file affects your computer, it can change the way your computer oper-ates. If not carefully considered, human activities can produce changes in Earth’s natural systems.
Influence on the Atmosphere Earth’s atmosphere significantly influences its climate. Solar
radiation that is not reflected by clouds passes freely through the atmosphere. It is then absorbed by Earth’s surface and released as long wavelength radiation. This radiation is absorbed by atmo-spheric gases such as water vapor, methane, and carbon dioxide. Some of this absorbed energy is reradiated back to Earth’s surface.
The greenhouse effect This process of the absorption and radiation of energy in the atmosphere results in the greenhouse effect—the natural heating of Earth’s surface caused by certain atmospheric gases called greenhouse gases. The greenhouse effect, shown in Figure 23, warms Earth’s surface by more than 30°C. Without the greenhouse effect, life as it currently exists on Earth would not be possible.
Scientists hypothesize that it is possible to increase or decrease the greenhouse effect by changing the amount of atmospheric greenhouse gases, particularly carbon dioxide and methane. An increase in the amount of these gases could result in increased absorption of energy in the atmosphere. Levels of atmospheric car-bon dioxide and methane are increasing. This could lead to a rise in global temperatures, known as global warming.
■ Figure 23 Solar radiation reaches Earth’s surface where it is reradiated as long wavelength radiation. This radiation does not easily escape through the atmo-sphere and is mostly absorbed and rere-leased by atmospheric gases. This process is called the greenhouse effect.
View an animation of the
greenhouse effect.
Concepts In Motion
0393_0395_ESGEU_S_C14_S4_658713.indd 3930393_0395_ESGEU_S_C14_S4_658713.indd 393 2/16/11 12:24 PM2/16/11 12:24 PM
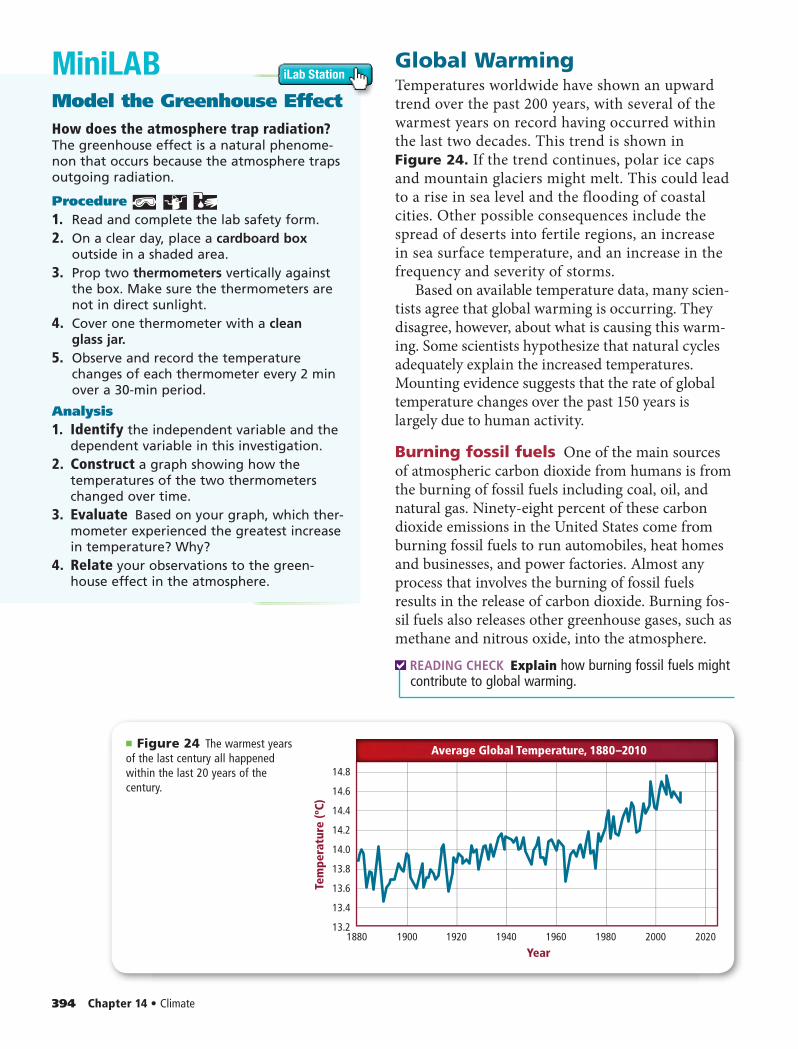
19001880 1920 1940 1980 2000 20201960
Tem
pera
ture
(ºC)
Year
Average Global Temperature, 1880–2010
14.8
14.6
14.4
14.2
14.0
13.8
13.6
13.4
13.2
MiniLAB
394 Chapter 14 • Climate
Global WarmingTemperatures worldwide have shown an upward trend over the past 200 years, with several of the warmest years on record having occurred within the last two decades. This trend is shown in Figure 24. If the trend continues, polar ice caps and mountain glaciers might melt. This could lead to a rise in sea level and the flooding of coastal cities. Other possible consequences include the spread of deserts into fertile regions, an increase in sea surface temperature, and an increase in the frequency and severity of storms.
Based on available temperature data, many scien-tists agree that global warming is occurring. They disagree, however, about what is causing this warm-ing. Some scientists hypothesize that natural cycles adequately explain the increased temperatures. Mounting evidence suggests that the rate of global temperature changes over the past 150 years is largely due to human activity.
Burning fossil fuels One of the main sources of atmospheric carbon dioxide from humans is from the burning of fossil fuels including coal, oil, and natural gas. Ninety-eight percent of these carbon dioxide emissions in the United States come from burning fossil fuels to run automobiles, heat homes and businesses, and power factories. Almost any process that involves the burning of fossil fuels results in the release of carbon dioxide. Burning fos-sil fuels also releases other greenhouse gases, such as methane and nitrous oxide, into the atmosphere.
READING CHECK Explain how burning fossil fuels might contribute to global warming.
■ Figure 24 The warmest years of the last century all happened within the last 20 years of the century.
Model the Greenhouse EffectHow does the atmosphere trap radiation? The greenhouse effect is a natural phenome-non that occurs because the atmosphere traps outgoing radiation.
Procedure 1. Read and complete the lab safety form.2. On a clear day, place a cardboard box
outside in a shaded area.3. Prop two thermometers vertically against
the box. Make sure the thermometers are not in direct sunlight.
4. Cover one thermometer with a clean glass jar.
5. Observe and record the temperature changes of each thermometer every 2 min over a 30-min period.
Analysis1. Identify the independent variable and the
dependent variable in this investigation.2. Construct a graph showing how the
temperatures of the two thermometers changed over time.
3. Evaluate Based on your graph, which ther-mometer experienced the greatest increase in temperature? Why?
4. Relate your observations to the green-house effect in the atmosphere.
iLab Station
0393_0395_ESGEU_S_C14_S4_658713.indd 3940393_0395_ESGEU_S_C14_S4_658713.indd 394 2/16/11 12:25 PM2/16/11 12:25 PM
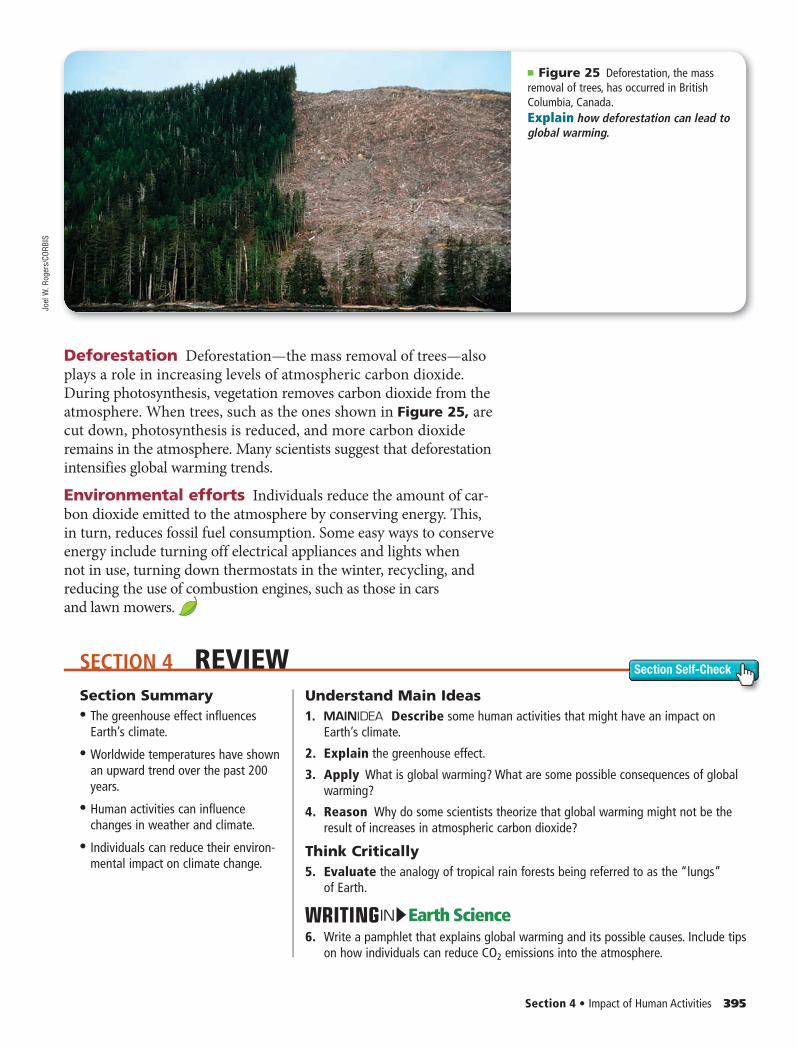
SECTION 4 REVIEW Section Self-Check
Section 4 • Impact of Human Activities 395
Deforestation Deforestation—the mass removal of trees—also plays a role in increasing levels of atmospheric carbon dioxide. During photosynthesis, vegetation removes carbon dioxide from the atmosphere. When trees, such as the ones shown in Figure 25, are cut down, photosynthesis is reduced, and more carbon dioxide remains in the atmosphere. Many scientists suggest that deforestation intensifies global warming trends.
Environmental efforts Individuals reduce the amount of car-bon dioxide emitted to the atmosphere by conserving energy. This, in turn, reduces fossil fuel consumption. Some easy ways to conserve energy include turning off electrical appliances and lights when not in use, turning down thermostats in the winter, recycling, and reducing the use of combustion engines, such as those in cars and lawn mowers.
■ Figure 25 Deforest ation, the mass removal of trees, has occurred in British Columbia, Canada.Explain how deforestation can lead to global warming.
Section Summary• • The greenhouse effect influences
Earth’s climate.
• • Worldwide temperatures have shown an upward trend over the past 200 years.
• • Human activities can influence changes in weather and climate.
• • Individuals can reduce their environ-mental impact on climate change.
Understand Main Ideas1. Describe some human activities that might have an impact on
Earth’s climate.
2. Explain the greenhouse effect.
3. Apply What is global warming? What are some possible consequences of global warming?
4. Reason Why do some scientists theorize that global warming might not be the result of increases in atmospheric carbon dioxide?
Think Critically5. Evaluate the analogy of tropical rain forests being referred to as the “lungs”
of Earth.
Earth ScienceIN6. Write a pamphlet that explains global warming and its possible causes. Include tips
on how individuals can reduce CO2 emissions into the atmosphere.
Joel
W. R
oger
s/CO
RBIS
0393_0395_ESGEU_S_C14_S4_658713.indd 3950393_0395_ESGEU_S_C14_S4_658713.indd 395 2/16/11 12:25 PM2/16/11 12:25 PM
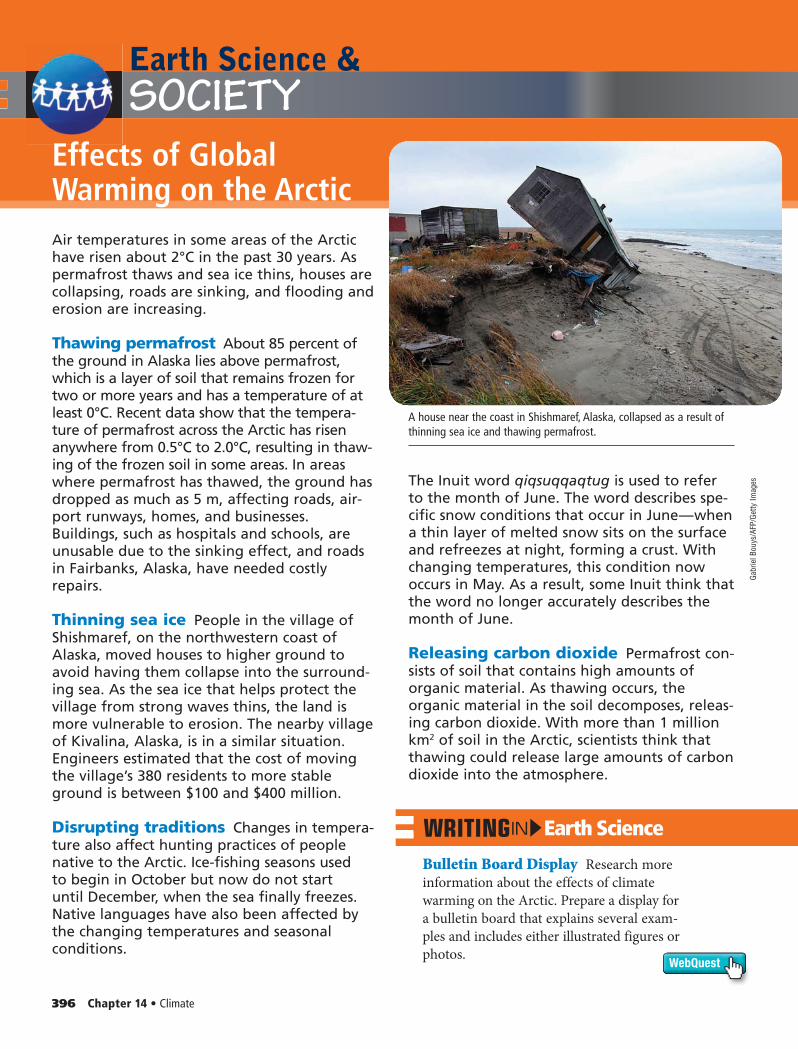
Earth Science &
WebQuest
SOCIETY
Earth ScienceIN
Bulletin Board Display Research more information about the effects of climate warming on the Arctic. Prepare a display for a bulletin board that explains several exam-ples and includes either illustrated figures or photos.
Effects of Global Warming on the ArcticAir temperatures in some areas of the Arctic have risen about 2°C in the past 30 years. As permafrost thaws and sea ice thins, houses are collapsing, roads are sinking, and flooding and erosion are increasing.
Thawing permafrost About 85 percent of the ground in Alaska lies above permafrost, which is a layer of soil that remains frozen for two or more years and has a temperature of at least 0°C. Recent data show that the tempera-ture of permafrost across the Arctic has risen anywhere from 0.5°C to 2.0°C, resulting in thaw-ing of the frozen soil in some areas. In areas where permafrost has thawed, the ground has dropped as much as 5 m, affecting roads, air-port runways, homes, and businesses. Buildings, such as hospitals and schools, are unusable due to the sinking effect, and roads in Fairbanks, Alaska, have needed costly repairs.
Thinning sea ice People in the village of Shishmaref, on the northwestern coast of Alaska, moved houses to higher ground to avoid having them collapse into the surround-ing sea. As the sea ice that helps protect the village from strong waves thins, the land is more vulnerable to erosion. The nearby village of Kivalina, Alaska, is in a similar situation. Engineers estimated that the cost of moving the village’s 380 residents to more stable ground is between $100 and $400 million.
Disrupting traditions Changes in tempera-ture also affect hunting practices of people native to the Arctic. Ice-fishing seasons used to begin in October but now do not start until December, when the sea finally freezes. Native languages have also been affected by the changing temperatures and seasonal conditions.
The Inuit word qiqsuqqaqtug is used to refer to the month of June. The word describes spe-cific snow conditions that occur in June — when a thin layer of melted snow sits on the surface and refreezes at night, forming a crust. With changing temperatures, this condition now occurs in May. As a result, some Inuit think that the word no longer accurately describes the month of June.
Releasing carbon dioxide Permafrost con-sists of soil that contains high amounts of organic material. As thawing occurs, the organic material in the soil decomposes, releas-ing carbon dioxide. With more than 1 million km2 of soil in the Arctic, scientists think that thawing could release large amounts of carbon dioxide into the atmosphere.
A house near the coast in Shishmaref, Alaska, collapsed as a result of thinning sea ice and thawing permafrost.
396 Chapter 14 • Climate
Gabr
iel B
ouys
/AFP
/Get
ty Im
ages
0396_ESGEU_S_C14_F_658713.indd 3960396_ESGEU_S_C14_F_658713.indd 396 2/16/11 12:25 PM2/16/11 12:25 PM
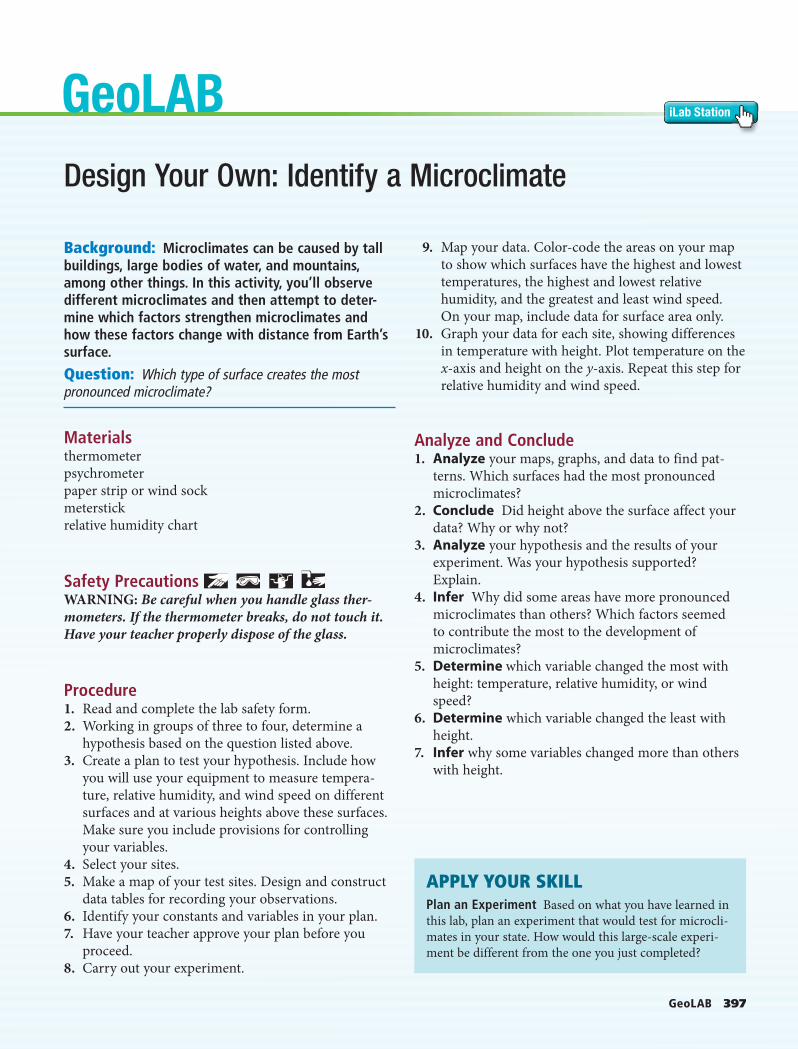
GeoLAB 397
GeoLAB iLab Station
Background: Microclimates can be caused by tall buildings, large bodies of water, and mountains, among other things. In this activity, you’ll observe different microclimates and then attempt to deter-mine which factors strengthen microclimates and how these factors change with distance from Earth’s surface.
Question: Which type of surface creates the most pronounced microclimate?
Materialsthermometerpsychrometerpaper strip or wind sockmeterstickrelative humidity chart
Safety Precautions WARNING: Be careful when you handle glass ther-mometers. If the thermometer breaks, do not touch it. Have your teacher properly dispose of the glass.
Procedure1. Read and complete the lab safety form.2. Working in groups of three to four, determine a
hypothesis based on the question listed above.3. Create a plan to test your hypothesis. Include how
you will use your equipment to measure tempera-ture, relative humidity, and wind speed on different surfaces and at various heights above these surfaces. Make sure you include provisions for controlling your variables.
4. Select your sites.5. Make a map of your test sites. Design and construct
data tables for recording your observations.6. Identify your constants and variables in your plan.7. Have your teacher approve your plan before you
proceed.8. Carry out your experiment.
9. Map your data. Color-code the areas on your map to show which surfaces have the highest and lowest temperatures, the highest and lowest relative humidity, and the greatest and least wind speed. On your map, include data for surface area only.
10. Graph your data for each site, showing differences in temperature with height. Plot temperature on the x-axis and height on the y-axis. Repeat this step for relative humidity and wind speed.
Analyze and Conclude1. Analyze your maps, graphs, and data to find pat-
terns. Which surfaces had the most pronounced microclimates?
2. Conclude Did height above the surface affect your data? Why or why not?
3. Analyze your hypothesis and the results of your experiment. Was your hypothesis supported? Explain.
4. Infer Why did some areas have more pronounced microclimates than others? Which factors seemed to contribute the most to the development of microclimates?
5. Determine which variable changed the most with height: temperature, relative humidity, or wind speed?
6. Determine which variable changed the least with height.
7. Infer why some variables changed more than others with height.
APPLY YOUR SKILLPlan an Experiment Based on what you have learned in this lab, plan an experiment that would test for microcli-mates in your state. How would this large-scale experi-ment be different from the one you just completed?
Design Your Own: Identify a Microclimate
0397_ESGEU_S_C14_LAB_658713.indd 3970397_ESGEU_S_C14_LAB_658713.indd 397 2/16/11 12:25 PM2/16/11 12:25 PM
Download quizzes, key terms, and flash cards from glencoe.com.
398 Chapter 14 • Study Guide
SECTION 1 Defining ClimateVOCABULARY• climatology• normal• tropics• temperate zones• polar zones
Climate is affected by several factors including latitude and elevation.
• Climate describes the long-term weather patterns of an area.• Normals are the standard climatic values for a location. • Temperatures vary among tropical, temperate, and polar zones.• Climate is influenced by several different factors. • Air masses have distinct regions of origin.
SECTION 2 Climate ClassificationVOCABULARY• Köppen classification system• microclimate• heat island
Climates are categorized according to the average temperatures and precipitation amounts.
• German scientist Wladimir Köppen developed a climate classification system.
• There are five main climate types: tropical, dry, mild, continental, and polar.
• Microclimates can occur within cities.
SECTION 3 Climatic ChangesVOCABULARY• ice age• season• El Niño• Maunder minimum
Earth’s climate is constantly changing on many different timescales.
• Climate change can occur on a long-term or short-term scale.• Changes in solar activity have been correlated with periods of climate
change.• Changes in Earth’s orbit, tilt, and wobble are all associated with changes
in climate.
SECTION 4 Impact of Human ActivitiesVOCABULARY• greenhouse effect• global warming
Over time, human activities can alter atmospheric conditions enough to influence changes in weather and climate.
• The greenhouse effect influences Earth’s climate. • Worldwide temperatures have shown an upward trend over the past
200 years.• Human activities can influence changes in weather and climate.• Individuals can reduce their environmental impact on climate change.
Vocabulary Practice
STUDY GUIDECHAPTER 14 The different climates on Earth are influenced by natural factors
as well as human activities.
0398_0401_ESGEU_S_C14_CA_658713.indd 3980398_0401_ESGEU_S_C14_CA_658713.indd 398 2/16/11 1:14 PM2/16/11 1:14 PM
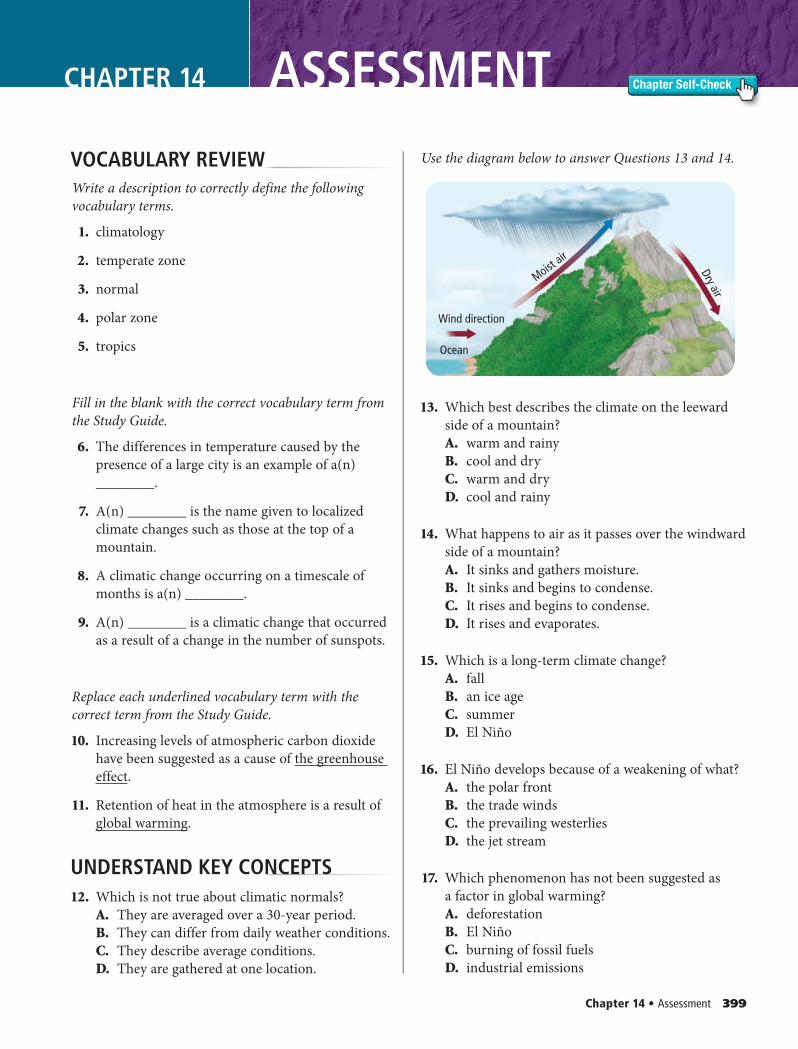
Chapter 14 • Assessment 399
Chapter Self-Check
Ocean
Moist air
Dry air
Wind direction
CHAPTER 14 ASSESSMENT
VOCABULARY REVIEWWrite a description to correctly define the following vocabulary terms.
1. climatology
2. temperate zone
3. normal
4. polar zone
5. tropics
Fill in the blank with the correct vocabulary term from the Study Guide.
6. The differences in temperature caused by the presence of a large city is an example of a(n) ________.
7. A(n) ________ is the name given to localized climate changes such as those at the top of a mountain.
8. A climatic change occurring on a timescale of months is a(n) ________.
9. A(n) ________ is a climatic change that occurred as a result of a change in the number of sunspots.
Replace each underlined vocabulary term with the correct term from the Study Guide.
10. Increasing levels of atmospheric carbon dioxide have been suggested as a cause of the greenhouse effect.
11. Retention of heat in the atmosphere is a result of global warming.
UNDERSTAND KEY CONCEPTS 12. Which is not true about climatic normals?
A. They are averaged over a 30-year period.B. They can differ from daily weather conditions.C. They describe average conditions.D. They are gathered at one location.
Use the diagram below to answer Questions 13 and 14.
13. Which best describes the climate on the leeward side of a mountain?A. warm and rainyB. cool and dryC. warm and dryD. cool and rainy
14. What happens to air as it passes over the windward side of a mountain?A. It sinks and gathers moisture.B. It sinks and begins to condense.C. It rises and begins to condense.D. It rises and evaporates.
15. Which is a long-term climate change?A. fallB. an ice ageC. summerD. El Niño
16. El Niño develops because of a weakening of what?A. the polar frontB. the trade windsC. the prevailing westerliesD. the jet stream
17. Which phenomenon has not been suggested as a factor in global warming?A. deforestationB. El NiñoC. burning of fossil fuelsD. industrial emissions
0398_0401_ESGEU_S_C14_CA_658713.indd 3990398_0401_ESGEU_S_C14_CA_658713.indd 399 2/16/11 1:14 PM2/16/11 1:14 PM
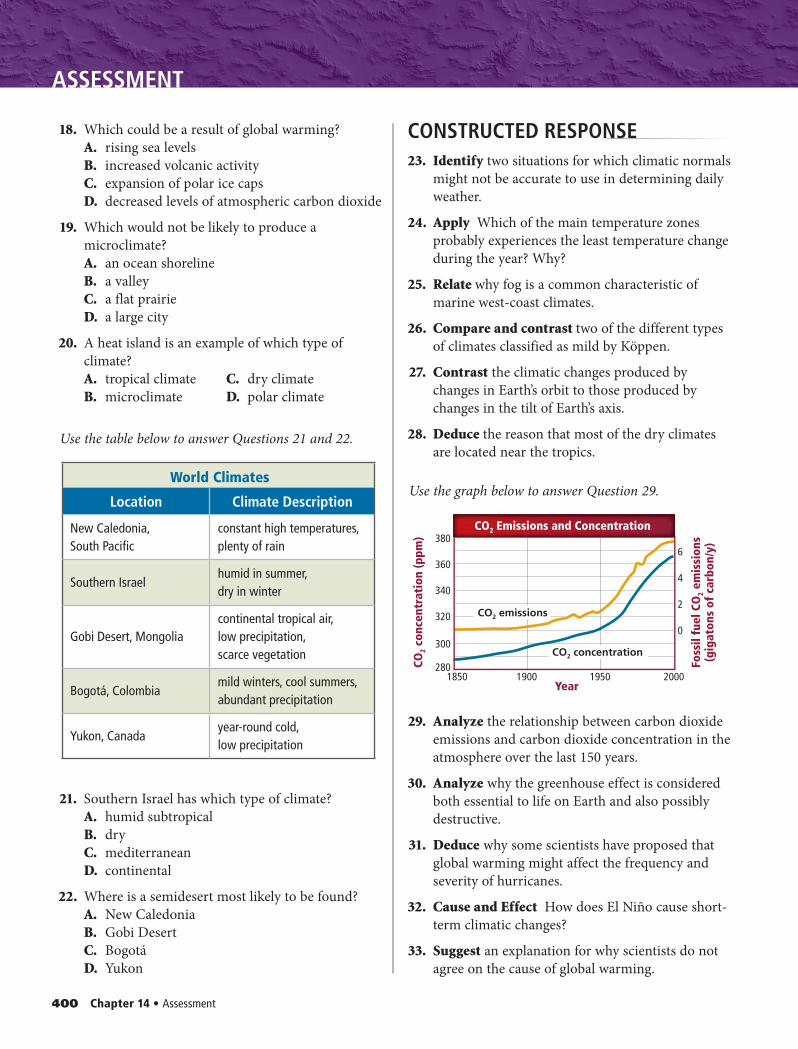
400 Chapter 14 • Assessment
ASSESSMENT
18. Which could be a result of global warming?A. rising sea levelsB. increased volcanic activityC. expansion of polar ice capsD. decreased levels of atmospheric carbon dioxide
19. Which would not be likely to produce a microclimate?A. an ocean shorelineB. a valleyC. a flat prairieD. a large city
20. A heat island is an example of which type of climate?A. tropical climate C. dry climateB. microclimate D. polar climate
Use the table below to answer Questions 21 and 22.
World Climates
Location Climate Description
New Caledonia, South Pacific
constant high temperatures, plenty of rain
Southern Israelhumid in summer, dry in winter
Gobi Desert, Mongoliacontinental tropical air, low precipitation, scarce vegetation
Bogotá, Colombiamild winters, cool summers, abundant precipitation
Yukon, Canadayear-round cold, low precipitation
21. Southern Israel has which type of climate?A. humid subtropicalB. dryC. mediterraneanD. continental
22. Where is a semidesert most likely to be found?A. New CaledoniaB. Gobi DesertC. BogotáD. Yukon
CONSTRUCTED RESPONSE 23. Identify two situations for which climatic normals
might not be accurate to use in determining daily weather.
24. Apply Which of the main temperature zones probably experiences the least temperature change during the year? Why?
25. Relate why fog is a common characteristic of marine west-coast climates.
26. Compare and contrast two of the different types of climates classified as mild by Köppen.
27. Contrast the climatic changes produced by changes in Earth’s orbit to those produced by changes in the tilt of Earth’s axis.
28. Deduce the reason that most of the dry climates are located near the tropics.
Use the graph below to answer Question 29.
29. Analyze the relationship between carbon dioxide emissions and carbon dioxide concentration in the atmosphere over the last 150 years.
30. Analyze why the greenhouse effect is considered both essential to life on Earth and also possibly destructive.
31. Deduce why some scientists have proposed that global warming might affect the frequency and severity of hurricanes.
32. Cause and Effect How does El Niño cause short-term climatic changes?
33. Suggest an explanation for why scientists do not agree on the cause of global warming.
1850 1900 1950 2000
Foss
il fu
el C
O2 e
mis
sion
s(g
igat
ons
of c
arbo
n/y)
Year
CO2 Emissions and Concentration380
360
340
320
3000
2
4
6
280CO2 c
once
ntra
tion
(ppm
)
CO2 emissions
CO2 concentration
0398_0401_ESGEU_S_C14_CA_658713.indd 4000398_0401_ESGEU_S_C14_CA_658713.indd 400 2/16/11 1:14 PM2/16/11 1:14 PM
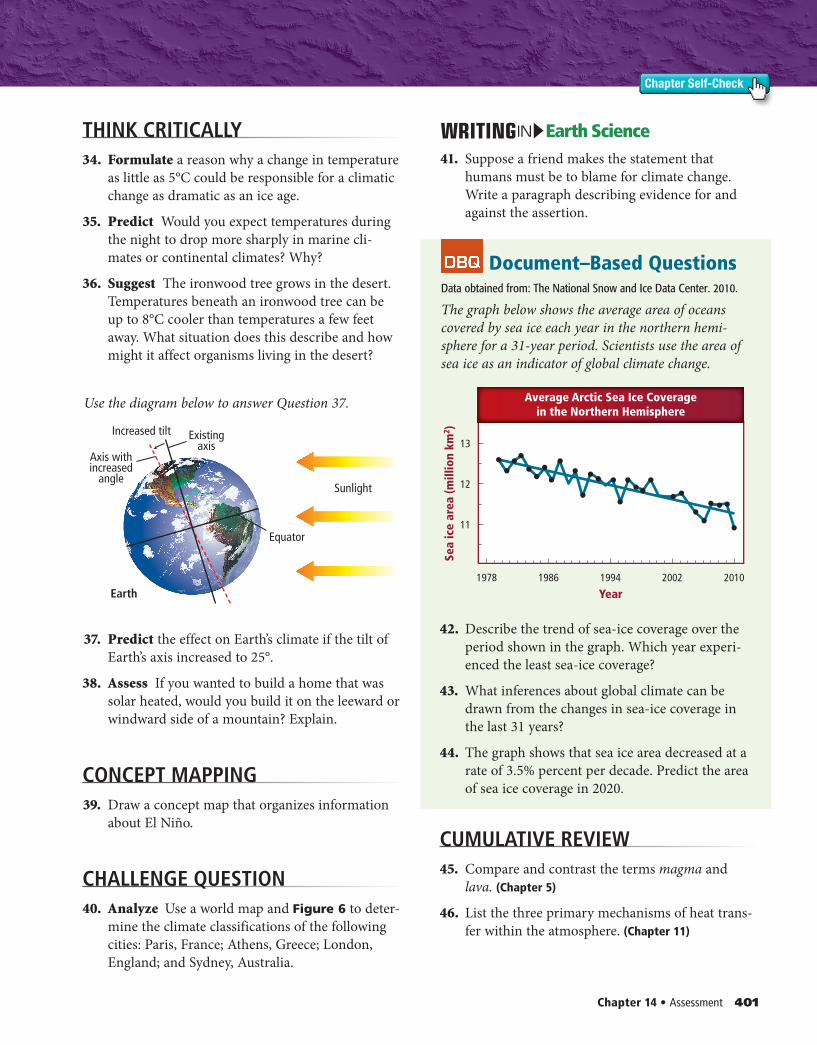
Chapter 14 • Assessment 401
Chapter Self-Check
THINK CRITICALLY 34. Formulate a reason why a change in temperature
as little as 5°C could be responsible for a climatic change as dramatic as an ice age.
35. Predict Would you expect temperatures during the night to drop more sharply in marine cli-mates or continental climates? Why?
36. Suggest The ironwood tree grows in the desert. Temperatures beneath an ironwood tree can be up to 8°C cooler than temperatures a few feet away. What situation does this describe and how might it affect organisms living in the desert?
Use the diagram below to answer Question 37.
Increased tilt
Equator
Sunlight
Earth
Existingaxis
Axis withincreased
angle
37. Predict the effect on Earth’s climate if the tilt of Earth’s axis increased to 25°.
38. Assess If you wanted to build a home that was solar heated, would you build it on the leeward or windward side of a mountain? Explain.
CONCEPT MAPPING 39. Draw a concept map that organizes information
about El Niño.
CHALLENGE QUESTION 40. Analyze Use a world map and Figure 6 to deter-
mine the climate classifications of the following cities: Paris, France; Athens, Greece; London, England; and Sydney, Australia.
Earth ScienceIN
41. Suppose a friend makes the statement that humans must be to blame for climate change. Write a paragraph describing evidence for and against the assertion.
Document–Based Questions Data obtained from: The National Snow and Ice Data Center. 2010.
The graph below shows the average area of oceans covered by sea ice each year in the northern hemi-sphere for a 31-year period. Scientists use the area of sea ice as an indicator of global climate change.
42. Describe the trend of sea-ice coverage over the period shown in the graph. Which year experi-enced the least sea-ice coverage?
43. What inferences about global climate can be drawn from the changes in sea-ice coverage in the last 31 years?
44. The graph shows that sea ice area decreased at a rate of 3.5% percent per decade. Predict the area of sea ice coverage in 2020.
CUMULATIVE REVIEW 45. Compare and contrast the terms magma and
lava. (Chapter 5)
46. List the three primary mechanisms of heat trans-fer within the atmosphere. (Chapter 11)
1978 1986 1994 20102002
Sea
ice
area
(mill
ion
km2 )
11
12
13
Year
Average Arctic Sea Ice Coveragein the Northern Hemisphere
0398_0401_ESGEU_S_C14_CA_658713.indd 4010398_0401_ESGEU_S_C14_CA_658713.indd 401 4/6/12 9:48 AM4/6/12 9:48 AM
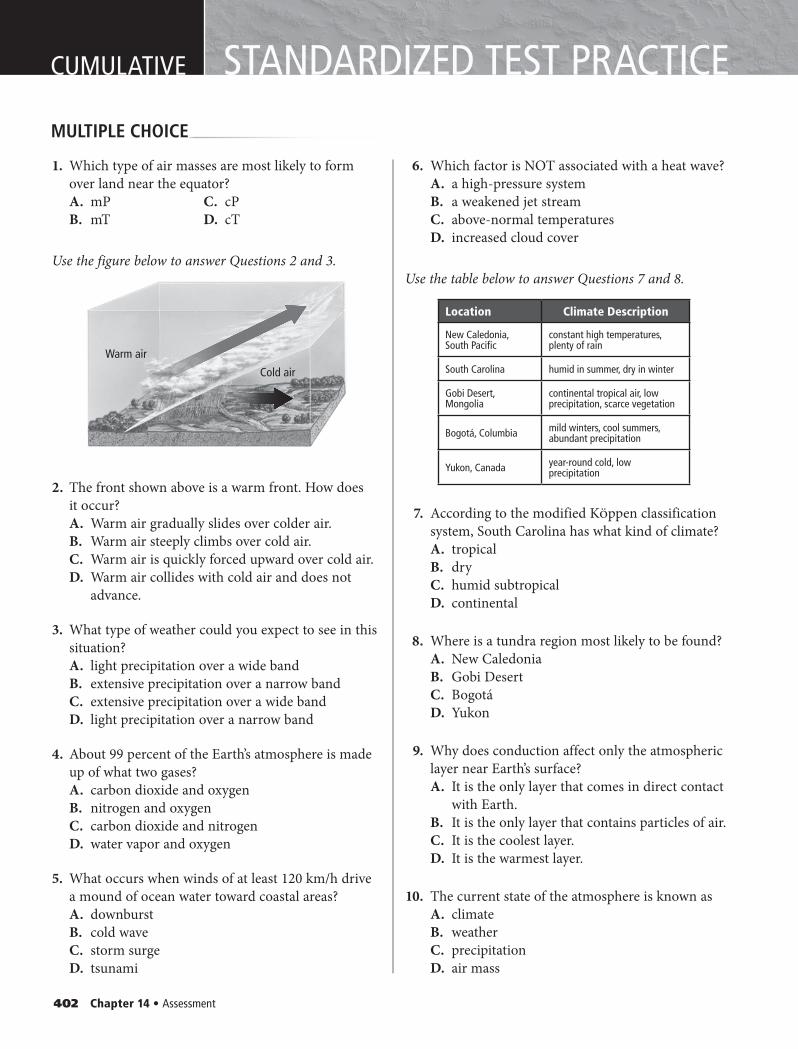
402 Chapter 14 • Assessment
CUMULATIVE STANDARDIZED TEST PRACTICEMULTIPLE CHOICE
1. Which type of air masses are most likely to form over land near the equator?A. mP C. cPB. mT D. cT
Use the figure below to answer Questions 2 and 3.
2. The front shown above is a warm front. How does it occur?A. Warm air gradually slides over colder air.B. Warm air steeply climbs over cold air.C. Warm air is quickly forced upward over cold air.D. Warm air collides with cold air and does not
advance.
3. What type of weather could you expect to see in this situation?A. light precipitation over a wide bandB. extensive precipitation over a narrow bandC. extensive precipitation over a wide bandD. light precipitation over a narrow band
4. About 99 percent of the Earth’s atmosphere is made up of what two gases?A. carbon dioxide and oxygenB. nitrogen and oxygenC. carbon dioxide and nitrogenD. water vapor and oxygen
5. What occurs when winds of at least 120 km/h drive a mound of ocean water toward coastal areas?A. downburstB. cold waveC. storm surgeD. tsunami
6. Which factor is NOT associated with a heat wave?A. a high-pressure systemB. a weakened jet streamC. above-normal temperaturesD. increased cloud cover
Use the table below to answer Questions 7 and 8.
7. According to the modified Köppen classification system, South Carolina has what kind of climate?A. tropicalB. dryC. humid subtropicalD. continental
8. Where is a tundra region most likely to be found?A. New CaledoniaB. Gobi DesertC. BogotáD. Yukon
9. Why does conduction affect only the atmospheric layer near Earth’s surface?A. It is the only layer that comes in direct contact
with Earth.B. It is the only layer that contains particles of air.C. It is the coolest layer.D. It is the warmest layer.
10. The current state of the atmosphere is known as A. climateB. weatherC. precipitationD. air mass
Location Climate Description
New Caledonia, South Pacifi c
constant high temperatures, plenty of rain
South Carolina humid in summer, dry in winter
Gobi Desert, Mongolia
continental tropical air, low precipitation, scarce vegetation
Bogotá, Columbia mild winters, cool summers, abundant precipitation
Yukon, Canada year-round cold, low precipitation
Warm air
Cold air
0402_0403_ESGEU_S_C14_STP_658713.indd 4020402_0403_ESGEU_S_C14_STP_658713.indd 402 2/16/11 1:14 PM2/16/11 1:14 PM
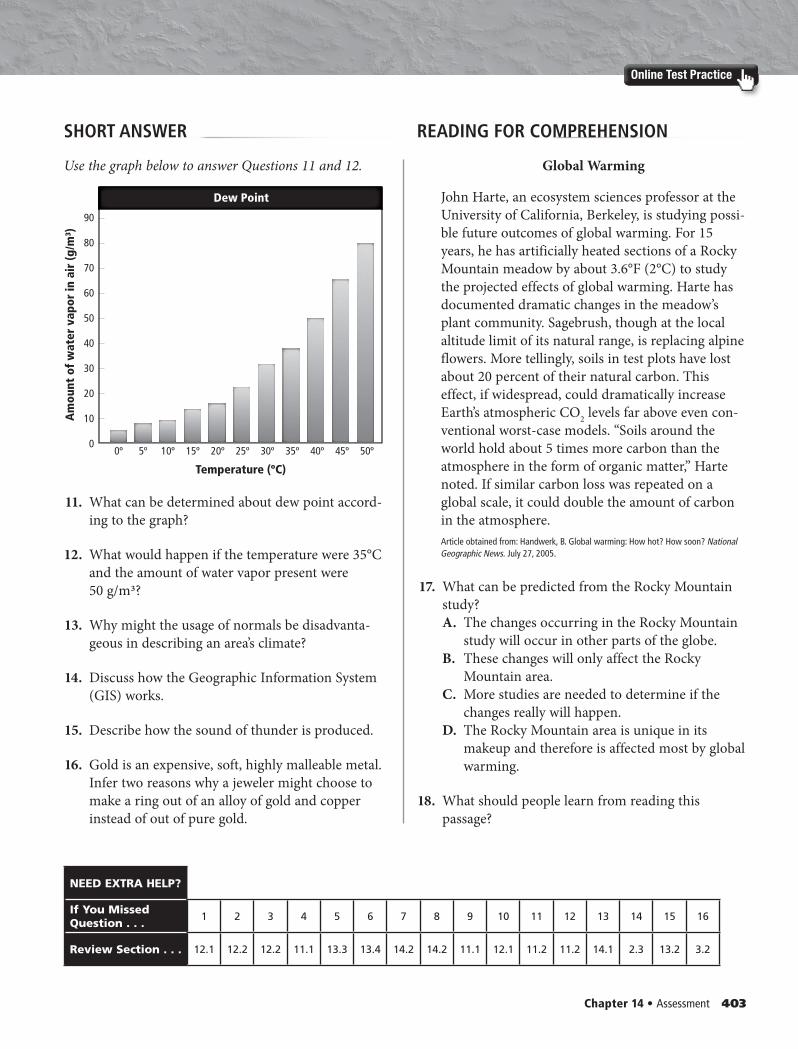
Chapter 14 • Assessment 403
Online Test Practice
SHORT ANSWER READING FOR COMPREHENSION
NEED EXTRA HELP?
If You Missed Question . . .
1 2 3 4 5 6 7 8 9 10 11 12 13 14 15 16
Review Section . . . 12.1 12.2 12.2 11.1 13.3 13.4 14.2 14.2 11.1 12.1 11.2 11.2 14.1 2.3 13.2 3.2
Use the graph below to answer Questions 11 and 12.
11. What can be determined about dew point accord-ing to the graph?
12. What would happen if the temperature were 35°C and the amount of water vapor present were 50 g/m3?
13. Why might the usage of normals be disadvanta-geous in describing an area’s climate?
14. Discuss how the Geographic Information System (GIS) works.
15. Describe how the sound of thunder is produced.
16. Gold is an expensive, soft, highly malleable metal. Infer two reasons why a jeweler might choose to make a ring out of an alloy of gold and copper instead of out of pure gold.
Global Warming
John Harte, an ecosystem sciences professor at the University of California, Berkeley, is studying possi-ble future outcomes of global warming. For 15 years, he has artificially heated sections of a Rocky Mountain meadow by about 3.6°F (2°C) to study the projected effects of global warming. Harte has documented dramatic changes in the meadow’s plant community. Sagebrush, though at the local altitude limit of its natural range, is replacing alpine flowers. More tellingly, soils in test plots have lost about 20 percent of their natural carbon. This effect, if widespread, could dramatically increase Earth’s atmospheric CO2 levels far above even con-ventional worst-case models. “Soils around the world hold about 5 times more carbon than the atmosphere in the form of organic matter,” Harte noted. If similar carbon loss was repeated on a global scale, it could double the amount of carbon in the atmosphere.Article obtained from: Handwerk, B. Global warming: How hot? How soon? National Geographic News. July 27, 2005.
17. What can be predicted from the Rocky Mountain study? A. The changes occurring in the Rocky Mountain
study will occur in other parts of the globe.B. These changes will only affect the Rocky
Mountain area.C. More studies are needed to determine if the
changes really will happen.D. The Rocky Mountain area is unique in its
makeup and therefore is affected most by global warming.
18. What should people learn from reading this passage?
Dew Point
10
20
30
40
50
60
70
80
90
Am
ount
of
wat
er v
apor
in a
ir (g
/m³)
0 0º 5º 10º 15º 20º 25º 30º 35º 40º 45º 50º
Temperature (ºC)
Dew Point Dew Point
0402_0403_ESGEU_S_C14_STP_658713.indd 4030402_0403_ESGEU_S_C14_STP_658713.indd 403 2/16/11 1:14 PM2/16/11 1:14 PM
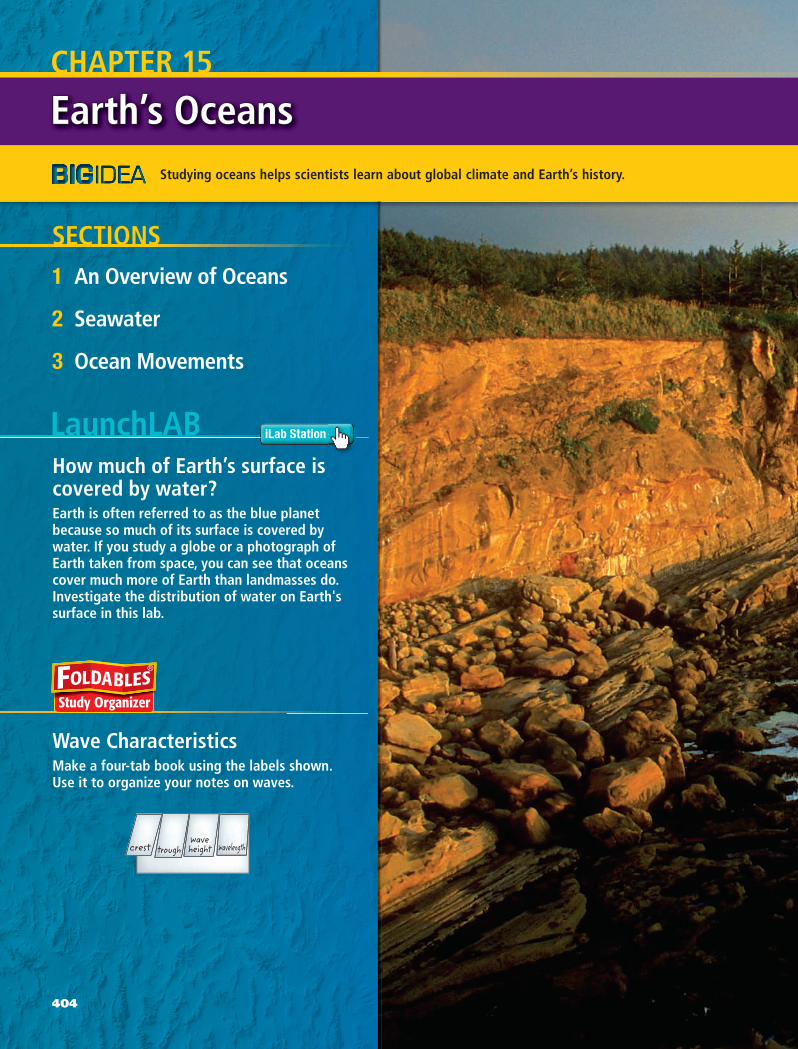
crest troughwaveheight wavelength
Wave Characteristics Make a four-tab book using the labels shown. Use it to organize your notes on waves.
How much of Earth’s surface is covered by water?Earth is often referred to as the blue planet because so much of its surface is covered by water. If you study a globe or a photograph of Earth taken from space, you can see that oceans cover much more of Earth than landmasses do. Investigate the distribution of water on Earth's surface in this lab.
LaunchLAB
1 An Overview of Oceans
2 Seawater
3 Ocean Movements
SECTIONS
Studying oceans helps scientists learn about global climate and Earth’s history.
Earth’s Oceans Earth’s OceansCHAPTER 15
iLab Station
404
0404_0405_ESGEU_S_C15_CO_658713.indd 4040404_0405_ESGEU_S_C15_CO_658713.indd 404 2/18/11 11:16 AM2/18/11 11:16 AM
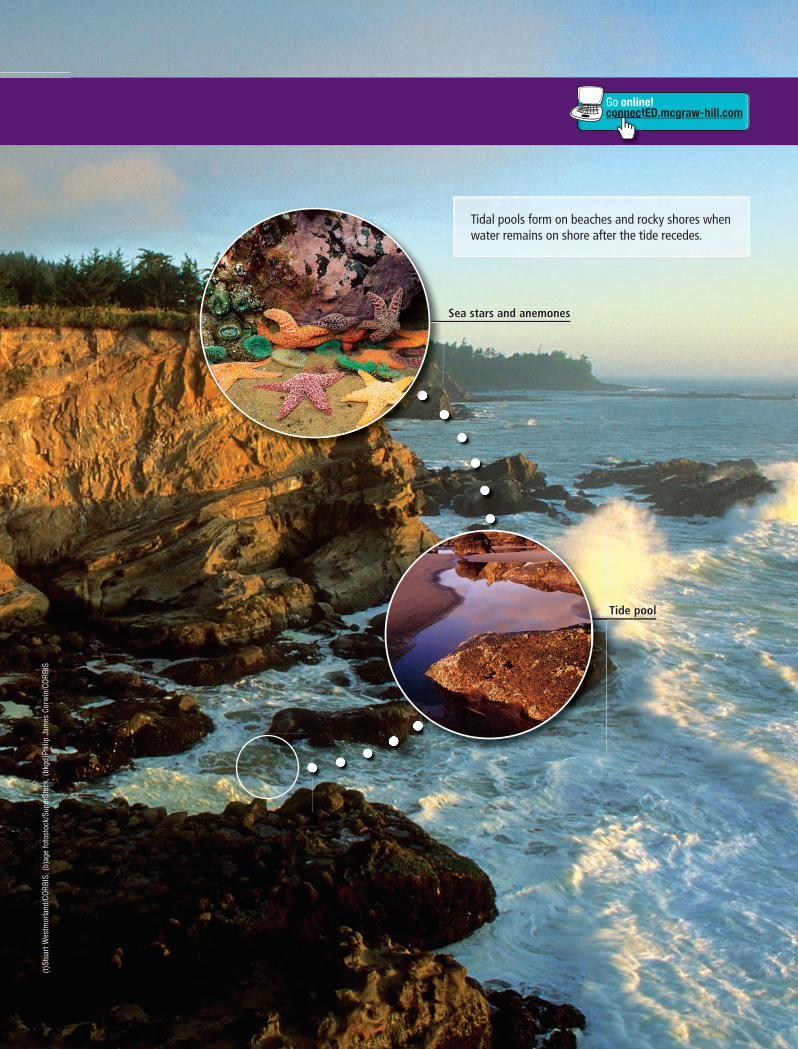
Go online!connectED.mcgraw-hill.comonnect
Tidal pools form on beaches and rocky shores when water remains on shore after the tide recedes.
Sea stars and anemones
Tide pool
(t)St
uart
Wes
tmor
land
/COR
BIS,
(b)a
ge fo
tost
ock/
Supe
rSto
ck, (
bkgd
)Phi
lip J
ames
Cor
win
/COR
BIS
0404_0405_ESGEU_S_C15_CO_658713.indd 4050404_0405_ESGEU_S_C15_CO_658713.indd 405 2/18/11 11:17 AM2/18/11 11:17 AM
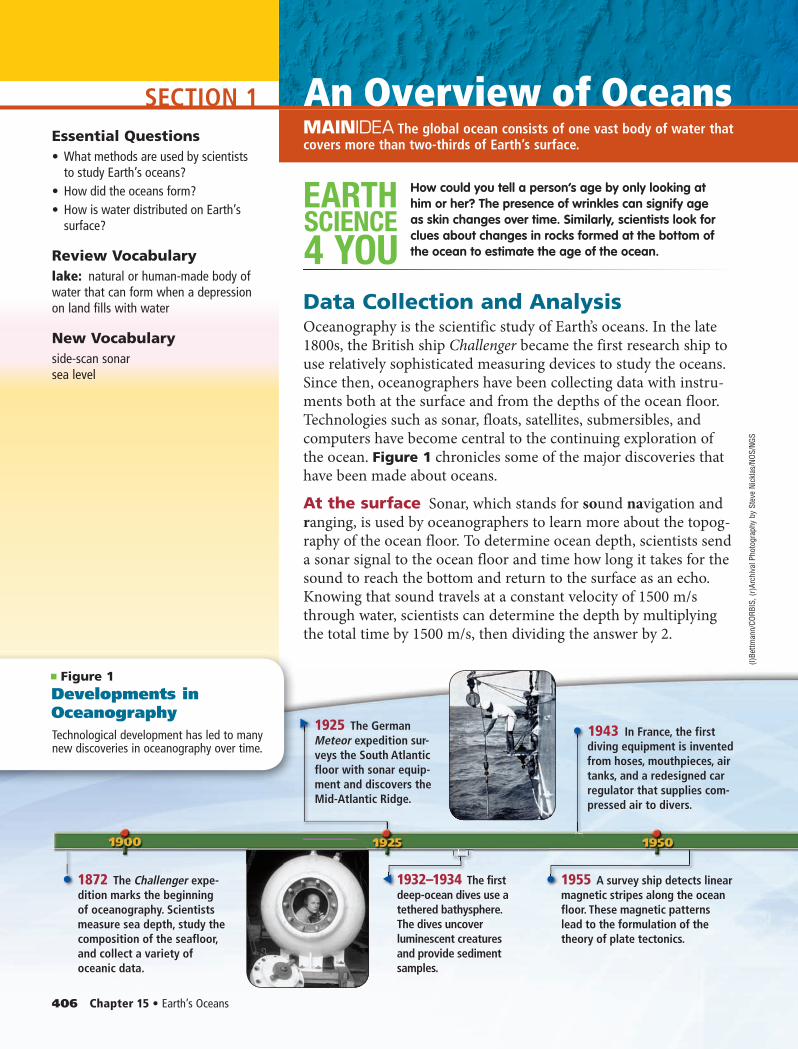
SECTION 1
■ Figure 1 Developments in OceanographyTechnological development has led to many new discoveries in oceanography over time.
1925 The German Meteor expedition sur-veys the South Atlantic floor with sonar equip-ment and discovers the Mid-Atlantic Ridge.
1955 A survey ship detects linear magnetic stripes along the ocean floor. These magnetic patterns lead to the formulation of the theory of plate tectonics.
1943 In France, the first diving equipment is invented from hoses, mouthpieces, air tanks, and a redesigned car regulator that supplies com-pressed air to divers.
1872 The Challenger expe-dition marks the beginning of oceanography. Scientists measure sea depth, study the composition of the seafloor, and collect a variety of oceanic data.
1932–1934 The first deep-ocean dives use a tethered bathysphere. The dives uncover luminescent creatures and provide sediment samples.
406 Chapter 15 • Earth’s Oceans
Essential Questions• What methods are used by scientists
to study Earth’s oceans?• How did the oceans form?• How is water distributed on Earth’s
surface?
Review Vocabularylake: natural or human-made body of water that can form when a depression on land fills with water
New Vocabularyside-scan sonarsea level
MAINIDEA The global ocean consists of one vast body of water that covers more than two-thirds of Earth’s surface.
SCIENCE
4 YOU
EARTH How could you tell a person’s age by only looking at him or her? The presence of wrinkles can signify age as skin changes over time. Similarly, scientists look for clues about changes in rocks formed at the bottom of the ocean to estimate the age of the ocean.
Data Collection and AnalysisOceanography is the scientific study of Earth’s oceans. In the late 1800s, the British ship Challenger became the first research ship to use relatively sophisticated measuring devices to study the oceans. Since then, oceanographers have been collecting data with instru-ments both at the surface and from the depths of the ocean floor. Technologies such as sonar, floats, satellites, submersibles, and computers have become central to the continuing exploration of the ocean. Figure 1 chronicles some of the major discoveries that have been made about oceans.
At the surface Sonar, which stands for sound navigation and ranging, is used by oceanographers to learn more about the topog-raphy of the ocean floor. To determine ocean depth, scientists send a sonar signal to the ocean floor and time how long it takes for the sound to reach the bottom and return to the surface as an echo. Knowing that sound travels at a constant velocity of 1500 m/s through water, scientists can determine the depth by multiplying the total time by 1500 m/s, then dividing the answer by 2.
An Overview of Oceans
(l)Be
ttman
n/CO
RBIS
, (r)
Arch
ival
Pho
togr
aphy
by
Stev
e Ni
ckla
s/NO
S/NG
S
0406_0412_ESGEU_S_C15_S1_658713.indd 4060406_0412_ESGEU_S_C15_S1_658713.indd 406 2/12/11 11:40 AM2/12/11 11:40 AM
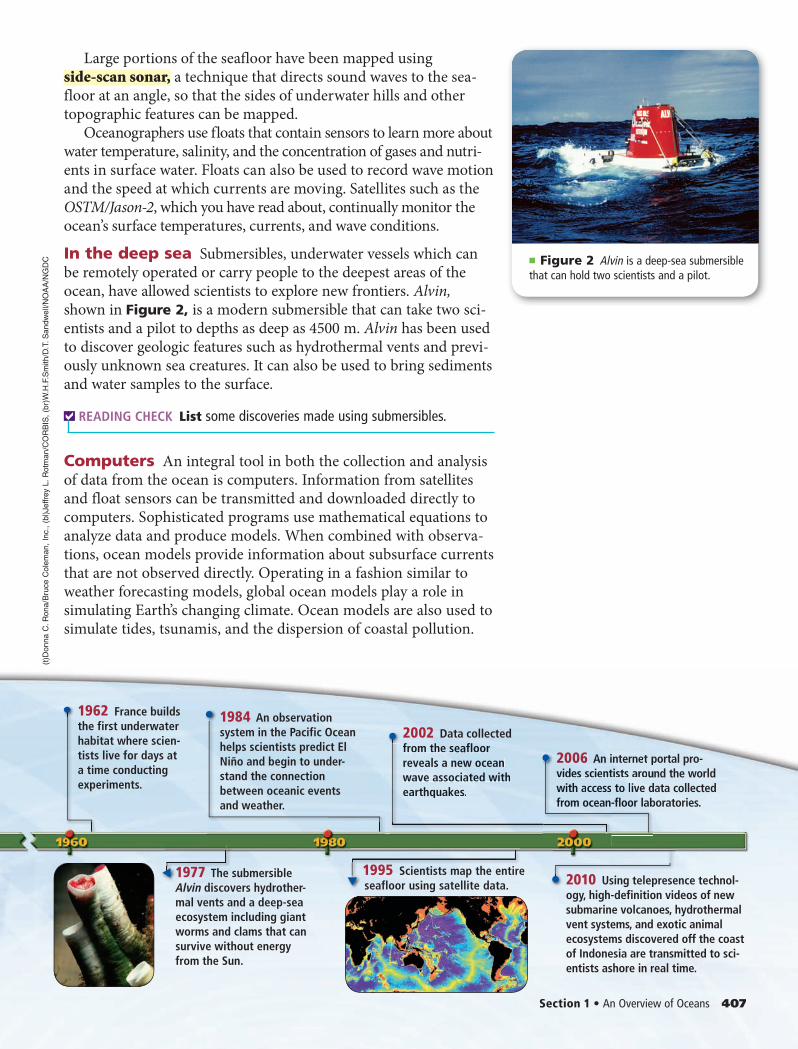
2002 Data collected from the seafloor reveals a new ocean wave associated with earthquakes.
1977 The submersible Alvin discovers hydrother-mal vents and a deep-sea ecosystem including giant worms and clams that can survive without energy from the Sun.
frfromom t thehehehe s s eaflflf ooorr reveals a nenenenew w oceaan nwawaveve a assssocociaaaiatetetet d d d wiwiw thth eaeartrthqhquauakekes.s.
1984 An observation system in the Pacific Ocean helps scientists predict El Niño and begin to under-stand the connection between oceanic events and weather.
2010 Using telepresence technol-ogy, high-definition videos of new submarine volcanoes, hydrothermal vent systems, and exotic animal ecosystems discovered off the coast of Indonesia are transmitted to sci-entists ashore in real time.
1995 Scientists map the entire seafloor using satellite data.
2006 An internet portal pro-vides scientists around the world with access to live data collected from ocean-floor laboratories.
1962 France builds the first underwater habitat where scien-tists live for days at a time conducting experiments.
202 060 iintnterernen t pp AnAn i iittisissststst a aror uvivividededess scscieieieentntn toto l llivivive e ddwiwithth aaccccesesss-ffloor lalabfrfrfromomom o oceceanan-
Large portions of the seafloor have been mapped using side-scan sonar, a technique that directs sound waves to the sea-floor at an angle, so that the sides of underwater hills and other topographic features can be mapped.
Oceanographers use floats that contain sensors to learn more about water temperature, salinity, and the concentration of gases and nutri-ents in surface water. Floats can also be used to record wave motion and the speed at which currents are moving. Satellites such as the OSTM/Jason-2, which you have read about, continually monitor the ocean’s surface temperatures, currents, and wave conditions.
In the deep sea Submersibles, underwater vessels which can be remotely operated or carry people to the deepest areas of the ocean, have allowed scientists to explore new frontiers. Alvin, shown in Figure 2, is a modern submersible that can take two sci-entists and a pilot to depths as deep as 4500 m. Alvin has been used to discover geologic features such as hydrothermal vents and previ-ously unknown sea creatures. It can also be used to bring sediments and water samples to the surface.
READING CHECK List some discoveries made using submersibles.
Computers An integral tool in both the collection and analysis of data from the ocean is computers. Information from satellites and float sensors can be transmitted and downloaded directly to computers. Sophisticated programs use mathematical equations to analyze data and produce models. When combined with observa-tions, ocean models provide information about subsurface currents that are not observed directly. Operating in a fashion similar to weather forecasting models, global ocean models play a role in simulating Earth’s changing climate. Ocean models are also used to simulate tides, tsunamis, and the dispersion of coastal pollution.
Section 1 • An Overview of Oceans 407
■ Figure 2 Alvin is a deep-sea submersible that can hold two scientists and a pilot.
(t)D
onna C
. R
ona/B
ruce C
ole
man,
Inc., (
bl)Jeffre
y L
. R
otm
an/C
OR
BIS
, (b
r)W
.H.F
.Sm
ith/D
.T. S
andw
ell/
NO
AA
/NG
DC
0406_0412_ESGEU_S_C15_S1_658713.indd 4070406_0412_ESGEU_S_C15_S1_658713.indd 407 6/13/11 1:44 PM6/13/11 1:44 PM
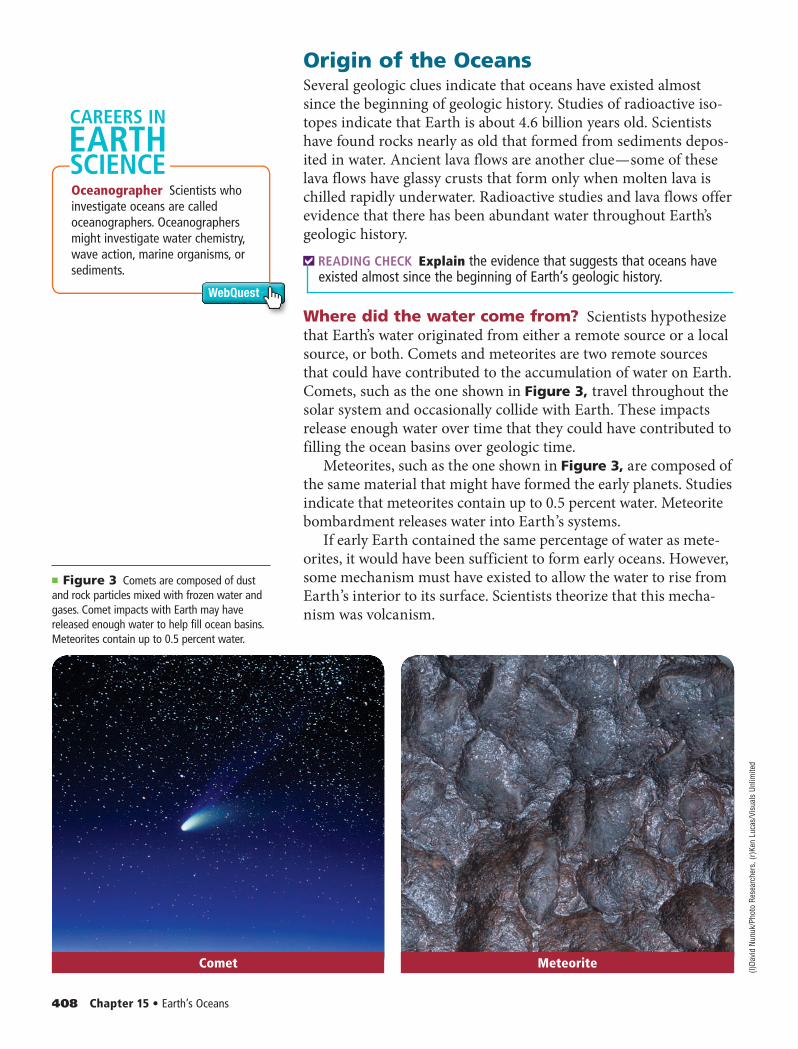
Origin of the OceansSeveral geologic clues indicate that oceans have existed almost since the beginning of geologic history. Studies of radioactive iso-topes indicate that Earth is about 4.6 billion years old. Scientists have found rocks nearly as old that formed from sediments depos-ited in water. Ancient lava flows are another clue — some of these lava flows have glassy crusts that form only when molten lava is chilled rapidly underwater. Radioactive studies and lava flows offer evidence that there has been abundant water throughout Earth’s geologic history.
READING CHECK Explain the evidence that suggests that oceans have existed almost since the beginning of Earth’s geologic history.
Where did the water come from? Scientists hypothesize that Earth’s water originated from either a remote source or a local source, or both. Comets and meteorites are two remote sources that could have contributed to the accumulation of water on Earth. Comets, such as the one shown in Figure 3, travel throughout the solar system and occasionally collide with Earth. These impacts release enough water over time that they could have contributed to filling the ocean basins over geologic time.
Meteorites, such as the one shown in Figure 3, are composed of the same material that might have formed the early planets. Studies indicate that meteorites contain up to 0.5 percent water. Meteorite bombardment releases water into Earth’s systems.
If early Earth contained the same percentage of water as mete-orites, it would have been sufficient to form early oceans. However, some mechanism must have existed to allow the water to rise from Earth’s interior to its surface. Scientists theorize that this mecha-nism was volcanism.
408 Chapter 15 • Earth’s Oceans
■ Figure 3 Comets are composed of dust and rock particles mixed with frozen water and gases. Comet impacts with Earth may have released enough water to help fill ocean basins. Meteorites contain up to 0.5 percent water.
Comet Meteorite
Oceanographer Scientists who investigate oceans are called oceanographers. Oceanographers might investigate water chemistry, wave action, marine organisms, or sediments.
WebQuest
CAREERS IN
SCIENCEEARTH
(l)Da
vid
Nunu
k/Ph
oto
Rese
arch
ers,
(r)K
en L
ucas
/Vis
uals
Unl
imite
d
0406_0412_ESGEU_S_C15_S1_658713.indd 4080406_0412_ESGEU_S_C15_S1_658713.indd 408 2/12/11 11:40 AM2/12/11 11:40 AM
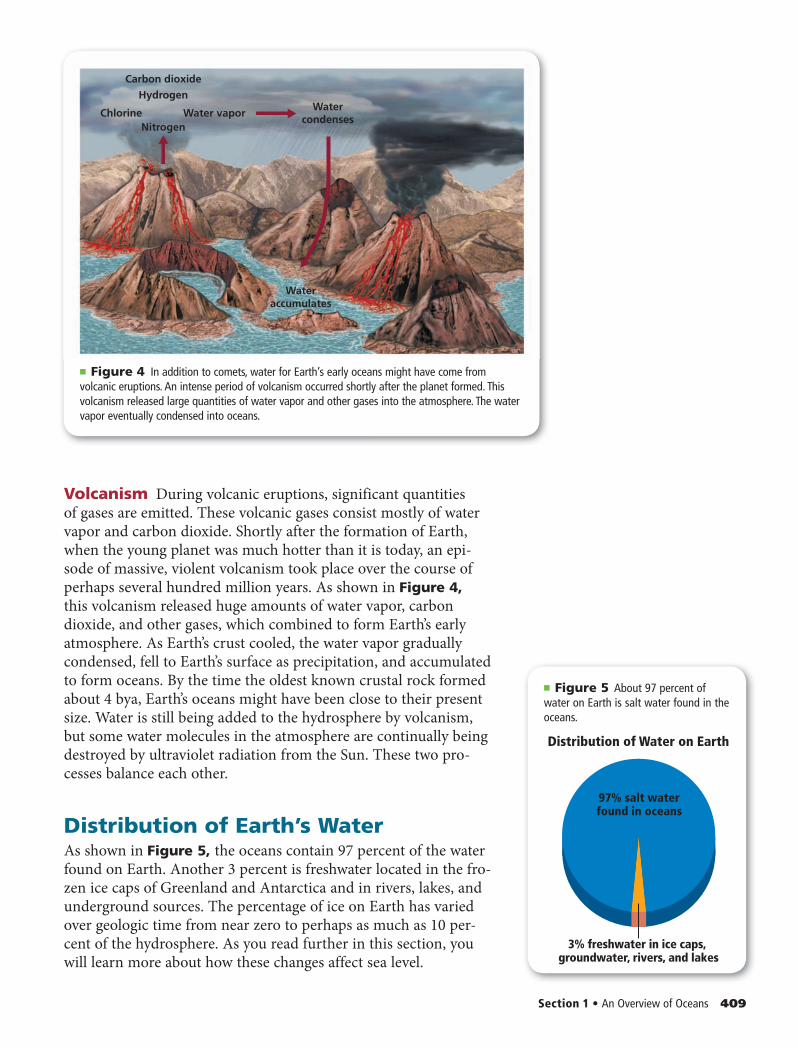
Carbon dioxide
Hydrogen
Chlorine Water vaporWater
condenses
Wateraccumulates
Nitrogen
Distribution of Water on Earth
97% salt waterfound in oceans
3% freshwater in ice caps, groundwater, rivers, and lakes
Volcanism During volcanic eruptions, significant quantities of gases are emitted. These volcanic gases consist mostly of water vapor and carbon dioxide. Shortly after the formation of Earth, when the young planet was much hotter than it is today, an epi-sode of massive, violent volcanism took place over the course of perhaps several hundred million years. As shown in Figure 4, this volcanism released huge amounts of water vapor, carbon dioxide, and other gases, which combined to form Earth’s early atmosphere. As Earth’s crust cooled, the water vapor gradually condensed, fell to Earth’s surface as precipitation, and accumulated to form oceans. By the time the oldest known crustal rock formed about 4 bya, Earth’s oceans might have been close to their present size. Water is still being added to the hydrosphere by volcanism, but some water molecules in the atmosphere are continually being destroyed by ultraviolet radiation from the Sun. These two pro-cesses balance each other.
Distribution of Earth’s WaterAs shown in Figure 5, the oceans contain 97 percent of the water found on Earth. Another 3 percent is freshwater located in the fro-zen ice caps of Greenland and Antarctica and in rivers, lakes, and underground sources. The percentage of ice on Earth has varied over geologic time from near zero to perhaps as much as 10 per-cent of the hydrosphere. As you read further in this section, you will learn more about how these changes affect sea level.
Section 1 • An Overview of Oceans 409
■ Figure 4 In addition to comets, water for Earth’s early oceans might have come from volcanic eruptions. An intense period of volcanism occurred shortly after the planet formed. This volcanism released large quantities of water vapor and other gases into the atmosphere. The water vapor eventually condensed into oceans.
■ Figure 5 About 97 percent of water on Earth is salt water found in the oceans.
0406_0412_ESGEU_S_C15_S1_658713.indd 4090406_0412_ESGEU_S_C15_S1_658713.indd 409 2/12/11 11:40 AM2/12/11 11:40 AM
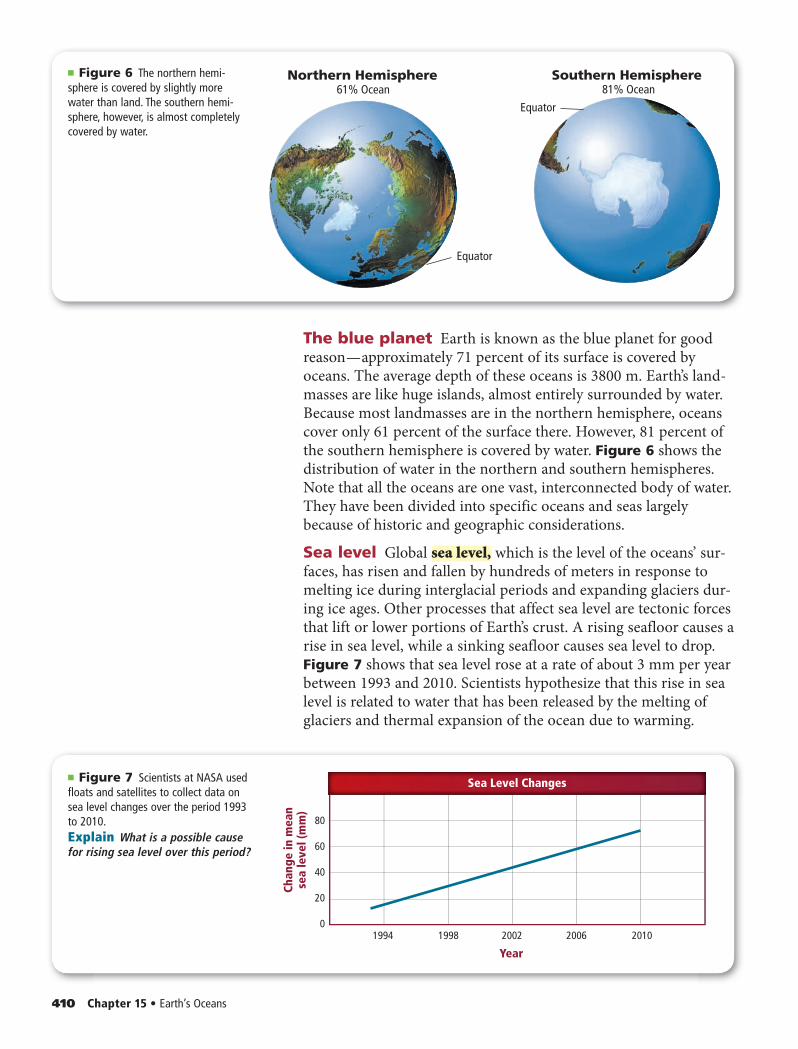
Equator
Northern Hemisphere61% Ocean
1994 1998 2002 20102006
Chan
ge in
mea
nse
a le
vel (
mm
)
80
60
40
20
0
Year
Sea Level Changes
Equator
Southern Hemisphere81% Ocean
The blue planet Earth is known as the blue planet for good reason — approximately 71 percent of its surface is covered by oceans. The average depth of these oceans is 3800 m. Earth’s land-masses are like huge islands, almost entirely surrounded by water. Because most landmasses are in the northern hemisphere, oceans cover only 61 percent of the surface there. However, 81 percent of the southern hemisphere is covered by water. Figure 6 shows the distribution of water in the northern and southern hemispheres. Note that all the oceans are one vast, interconnected body of water. They have been divided into specific oceans and seas largely because of historic and geographic considerations.
Sea level Global sea level, which is the level of the oceans’ sur-faces, has risen and fallen by hundreds of meters in response to melting ice during interglacial periods and expanding glaciers dur-ing ice ages. Other processes that affect sea level are tectonic forces that lift or lower portions of Earth’s crust. A rising seafloor causes a rise in sea level, while a sinking seafloor causes sea level to drop. Figure 7 shows that sea level rose at a rate of about 3 mm per year between 1993 and 2010. Scientists hypothesize that this rise in sea level is related to water that has been released by the melting of glaciers and thermal expansion of the ocean due to warming.
410 Chapter 15 • Earth’s Oceans
■ Figure 6 The northern hemi-sphere is covered by slightly more water than land. The southern hemi-sphere, however, is almost completely covered by water.
■ Figure 7 Scientists at NASA used floats and satellites to collect data on sea level changes over the period 1993 to 2010. Explain What is a possible cause for rising sea level over this period?
0406_0412_ESGEU_S_C15_S1_658713.indd 4100406_0412_ESGEU_S_C15_S1_658713.indd 410 2/12/11 11:40 AM2/12/11 11:40 AM
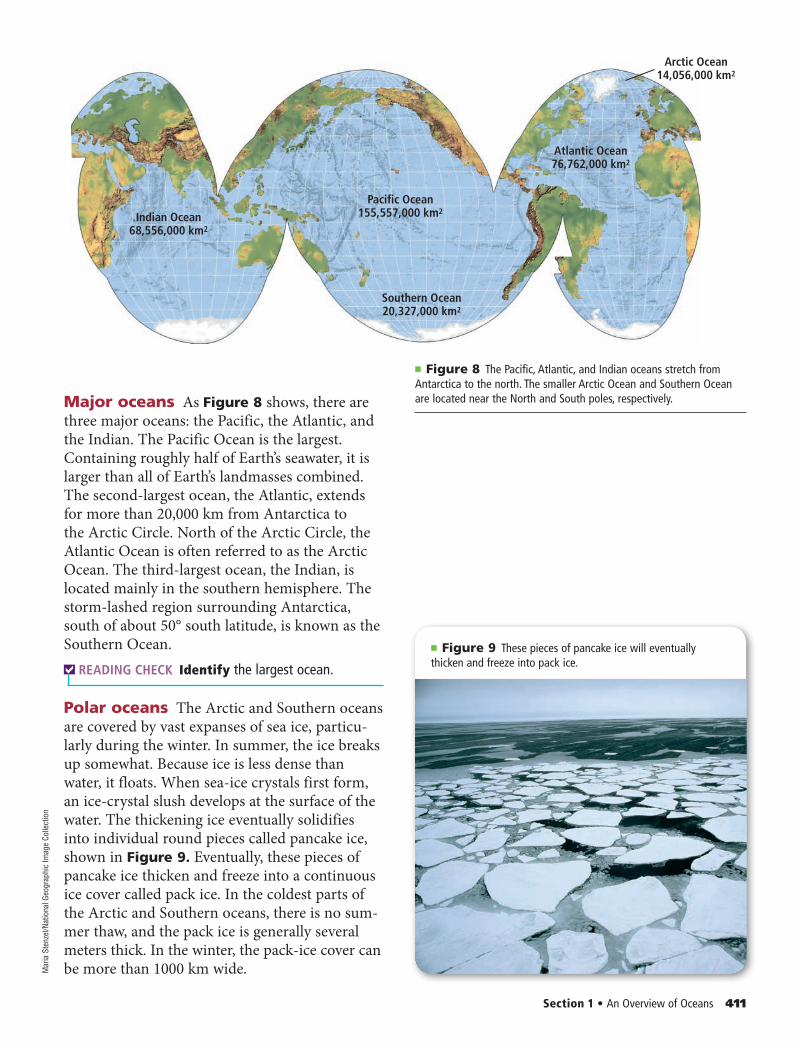
Indian Ocean68,556,000 km2
Pacific Ocean155,557,000 km2
Southern Ocean20,327,000 km2
Atlantic Ocean76,762,000 km2
Arctic Ocean14,056,000 km2
Major oceans As Figure 8 shows, there are three major oceans: the Pacific, the Atlantic, and the Indian. The Pacific Ocean is the largest. Containing roughly half of Earth’s seawater, it is larger than all of Earth’s landmasses combined. The second-largest ocean, the Atlantic, extends for more than 20,000 km from Antarctica to the Arctic Circle. North of the Arctic Circle, the Atlantic Ocean is often referred to as the Arctic Ocean. The third-largest ocean, the Indian, is located mainly in the southern hemisphere. The storm-lashed region surrounding Antarctica, south of about 50° south latitude, is known as the Southern Ocean.
READING CHECK Identify the largest ocean.
Polar oceans The Arctic and Southern oceans are covered by vast expanses of sea ice, particu-larly during the winter. In summer, the ice breaks up somewhat. Because ice is less dense than water, it floats. When sea-ice crystals first form, an ice-crystal slush develops at the surface of the water. The thickening ice eventually solidifies into individual round pieces called pancake ice, shown in Figure 9. Eventually, these pieces of pancake ice thicken and freeze into a continuous ice cover called pack ice. In the coldest parts of the Arctic and Southern oceans, there is no sum-mer thaw, and the pack ice is generally several meters thick. In the winter, the pack-ice cover can be more than 1000 km wide.
Section 1 • An Overview of Oceans 411
■ Figure 8 The Pacific, Atlantic, and Indian oceans stretch from Antarctica to the north. The smaller Arctic Ocean and Southern Ocean are located near the North and South poles, respectively.
■ Figure 9 These pieces of pancake ice will eventually thicken and freeze into pack ice.
Mar
ia S
tenz
el/N
atio
nal G
eogr
aphi
c Im
age
Colle
ctio
n
0406_0412_ESGEU_S_C15_S1_658713.indd 4110406_0412_ESGEU_S_C15_S1_658713.indd 411 2/12/11 11:40 AM2/12/11 11:40 AM
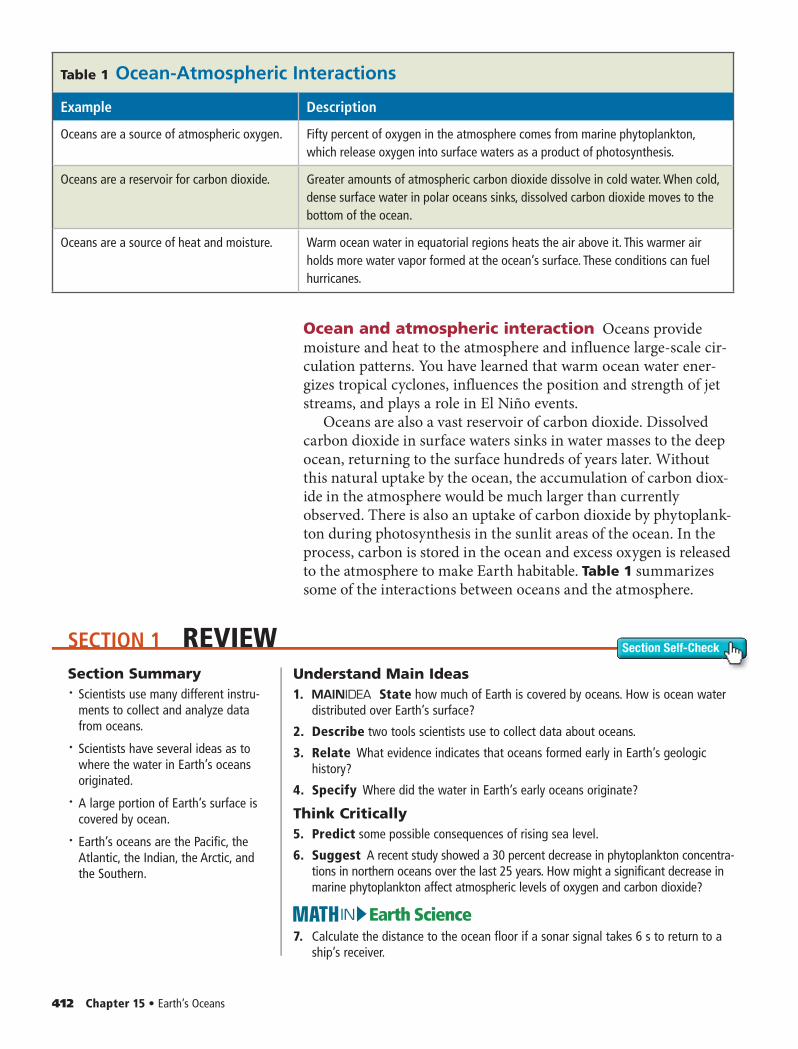
SECTION 1 REVIEW Section Self-Check
412 Chapter 15 • Earth’s Oceans
Ocean and atmospheric interaction Oceans provide moisture and heat to the atmosphere and influence large-scale cir-culation patterns. You have learned that warm ocean water ener-gizes tropical cyclones, influences the position and strength of jet streams, and plays a role in El Niño events.
Oceans are also a vast reservoir of carbon dioxide. Dissolved carbon dioxide in surface waters sinks in water masses to the deep ocean, returning to the surface hundreds of years later. Without this natural uptake by the ocean, the accumulation of carbon diox-ide in the atmosphere would be much larger than currently observed. There is also an uptake of carbon dioxide by phytoplank-ton during photosynthesis in the sunlit areas of the ocean. In the process, carbon is stored in the ocean and excess oxygen is released to the atmosphere to make Earth habitable. Table 1 summarizes some of the interactions between oceans and the atmosphere.
Section Summary• Scientists use many different instru-
ments to collect and analyze data from oceans.
• Scientists have several ideas as to where the water in Earth’s oceans originated.
• A large portion of Earth’s surface is covered by ocean.
• Earth’s oceans are the Pacific, the Atlantic, the Indian, the Arctic, and the Southern.
Understand Main Ideas1. State how much of Earth is covered by oceans. How is ocean water
distributed over Earth’s surface?
2. Describe two tools scientists use to collect data about oceans.
3. Relate What evidence indicates that oceans formed early in Earth’s geologic history?
4. Specify Where did the water in Earth’s early oceans originate?
Think Critically5. Predict some possible consequences of rising sea level.
6. Suggest A recent study showed a 30 percent decrease in phytoplankton concentra-tions in northern oceans over the last 25 years. How might a significant decrease in marine phytoplankton affect atmospheric levels of oxygen and carbon dioxide?
Earth ScienceIN7. Calculate the distance to the ocean floor if a sonar signal takes 6 s to return to a
ship’s receiver.
Table 1 Ocean-Atmospheric Interactions
Example Description
Oceans are a source of atmospheric oxygen. Fifty percent of oxygen in the atmosphere comes from marine phytoplankton, which release oxygen into surface waters as a product of photosynthesis.
Oceans are a reservoir for carbon dioxide. Greater amounts of atmospheric carbon dioxide dissolve in cold water. When cold, dense surface water in polar oceans sinks, dissolved carbon dioxide moves to the bottom of the ocean.
Oceans are a source of heat and moisture. Warm ocean water in equatorial regions heats the air above it. This warmer air holds more water vapor formed at the ocean’s surface. These conditions can fuel hurricanes.
0406_0412_ESGEU_S_C15_S1_658713.indd 4120406_0412_ESGEU_S_C15_S1_658713.indd 412 2/12/11 11:40 AM2/12/11 11:40 AM
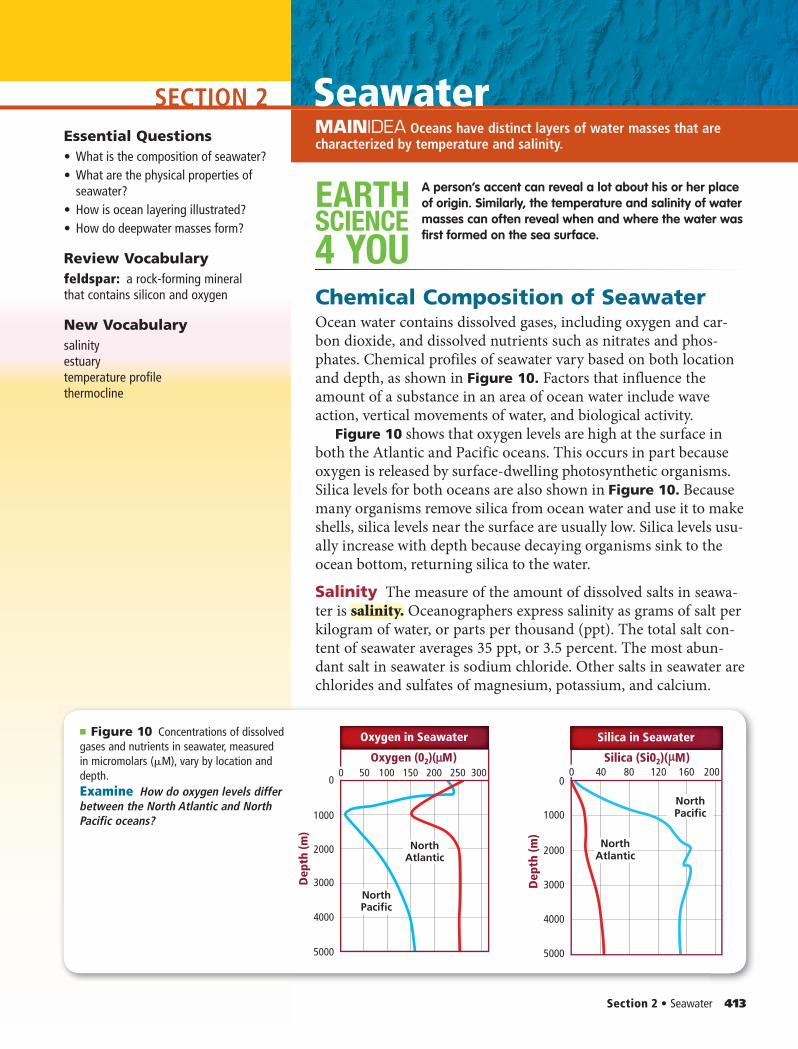
SECTION 2MAINIDEA Energy is transferred throughout Earth’s atmosphere.
Section 2 • Seawater 413
Essential Questions• What is the composition of seawater? • What are the physical properties of
seawater?• How is ocean layering illustrated?• How do deepwater masses form?
Review Vocabularyfeldspar: a rock-forming mineral that contains silicon and oxygen
New Vocabularysalinityestuarytemperature profilethermocline
MAINIDEA Oceans have distinct layers of water masses that are characterized by temperature and salinity.
SCIENCE
4 YOU
EARTH A person’s accent can reveal a lot about his or her place of origin. Similarly, the temperature and salinity of water masses can often reveal when and where the water was first formed on the sea surface.
Chemical Composition of SeawaterOcean water contains dissolved gases, including oxygen and car-bon dioxide, and dissolved nutrients such as nitrates and phos-phates. Chemical profiles of seawater vary based on both location and depth, as shown in Figure 10. Factors that influence the amount of a substance in an area of ocean water include wave action, vertical movements of water, and biological activity.
Figure 10 shows that oxygen levels are high at the surface in both the Atlantic and Pacific oceans. This occurs in part because oxygen is released by surface-dwelling photosynthetic organisms. Silica levels for both oceans are also shown in Figure 10. Because many organisms remove silica from ocean water and use it to make shells, silica levels near the surface are usually low. Silica levels usu-ally increase with depth because decaying organisms sink to the ocean bottom, returning silica to the water.
Salinity The measure of the amount of dissolved salts in seawa-ter is salinity. Oceanographers express salinity as grams of salt per kilogram of water, or parts per thousand (ppt). The total salt con-tent of seawater averages 35 ppt, or 3.5 percent. The most abun-dant salt in seawater is sodium chloride. Other salts in seawater are chlorides and sulfates of magnesium, potassium, and calcium.
■ Figure 10 Concentrations of dissolved gases and nutrients in seawater, measured in micromolars (μM), vary by location and depth.Examine How do oxygen levels differ between the North Atlantic and North Pacific oceans?
40
5000
4000
3000
2000
1000
00 80 120 200160
Dep
th (m
)
NorthAtlantic
NorthPacific
Silica (Si02)( M)
Silica in Seawater
50
5000
4000
3000
2000
1000
00 100 150 250 300200
Dep
th (m
)
NorthPacific
NorthAtlantic
Oxygen (02)( M)
Oxygen in Seawater
Seawater
0413_0420_ESGEU_S_C15_S2_658713.indd 4130413_0420_ESGEU_S_C15_S2_658713.indd 413 2/12/11 11:40 AM2/12/11 11:40 AM
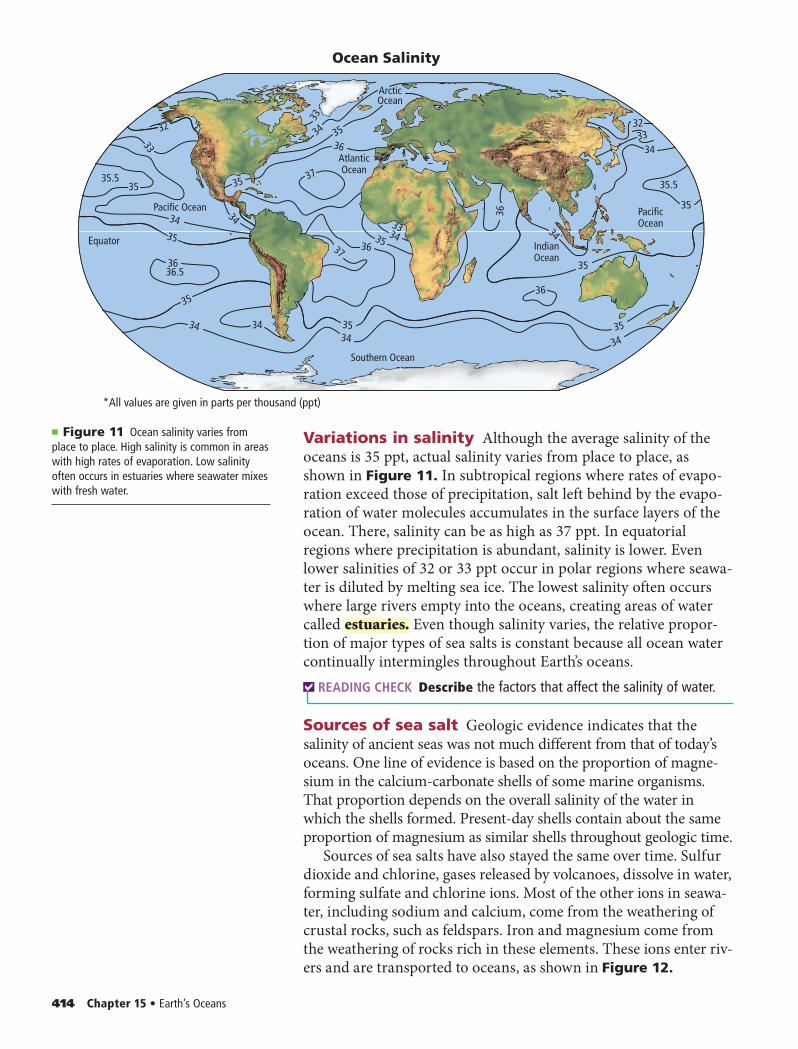
Variations in salinity Although the average salinity of the oceans is 35 ppt, actual salinity varies from place to place, as shown in Figure 11. In subtropical regions where rates of evapo-ration exceed those of precipitation, salt left behind by the evapo-ration of water molecules accumulates in the surface layers of the ocean. There, salinity can be as high as 37 ppt. In equatorial regions where precipitation is abundant, salinity is lower. Even lower salinities of 32 or 33 ppt occur in polar regions where seawa-ter is diluted by melting sea ice. The lowest salinity often occurs where large rivers empty into the oceans, creating areas of water called estuaries. Even though salinity varies, the relative propor-tion of major types of sea salts is constant because all ocean water continually intermingles throughout Earth’s oceans.
READING CHECK Describe the factors that affect the salinity of water.
Sources of sea salt Geologic evidence indicates that the salinity of ancient seas was not much different from that of today’s oceans. One line of evidence is based on the proportion of magne-sium in the calcium-carbonate shells of some marine organisms. That proportion depends on the overall salinity of the water in which the shells formed. Present-day shells contain about the same proportion of magnesium as similar shells throughout geologic time.
Sources of sea salts have also stayed the same over time. Sulfur dioxide and chlorine, gases released by volcanoes, dissolve in water, forming sulfate and chlorine ions. Most of the other ions in seawa-ter, including sodium and calcium, come from the weathering of crustal rocks, such as feldspars. Iron and magnesium come from the weathering of rocks rich in these elements. These ions enter riv-ers and are transported to oceans, as shown in Figure 12.
414 Chapter 15 • Earth’s Oceans
■ Figure 11 Ocean salinity varies from place to place. High salinity is common in areas with high rates of evaporation. Low salinity often occurs in estuaries where seawater mixes with fresh water.
35
36.536
Southern Ocean
*All values are given in parts per thousand (ppt)
35.535.5
35
35
35
34
34
35
34
3534
353637
36
36
3233
34
34
3534
3433
36
37
35
35
32
33
33
Equator
Pacific Ocean
ArcticOcean
AtlanticOcean
PacificOcean
IndianOcean
3434
Ocean Salinity
0413_0420_ESGEU_S_C15_S2_658713.indd 4140413_0420_ESGEU_S_C15_S2_658713.indd 414 2/12/11 11:41 AM2/12/11 11:41 AM
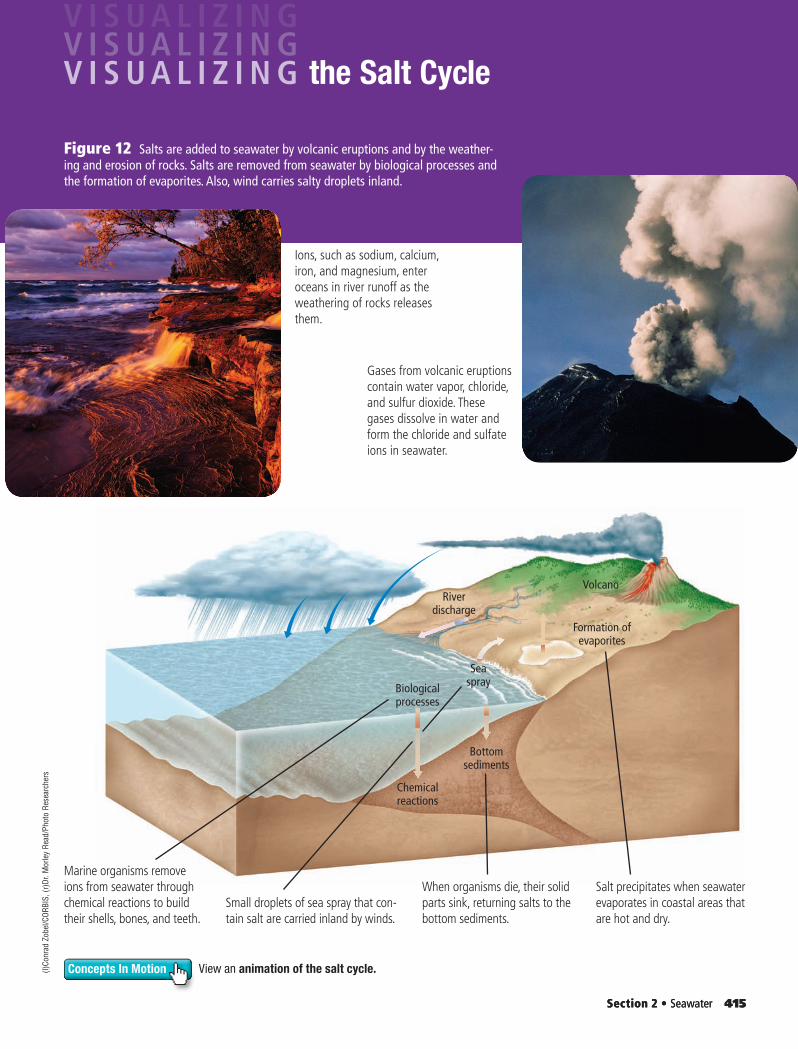
Section 2 • Seawater 415Section 2 • Seawater 415
View an animation of the salt cycle.Concepts In Motion
the Salt Cycle
Volcano
Seaspray
Chemicalreactions
Biologicalprocesses
Formation ofevaporites
Riverdischarge
Bottomsediments
Figure 12 Salts are added to seawater by volcanic eruptions and by the weather-ing and erosion of rocks. Salts are removed from seawater by biological processes and the formation of evaporites. Also, wind carries salty droplets inland.
Salt precipitates when seawater evaporates in coastal areas that are hot and dry.
When organisms die, their solid parts sink, returning salts to the bottom sediments.
Marine organisms remove ions from seawater through chemical reactions to build their shells, bones, and teeth.
Small droplets of sea spray that con-tain salt are carried inland by winds.
Ions, such as sodium, calcium, iron, and magnesium, enter oceans in river runoff as the weathering of rocks releases them.
Gases from volcanic eruptions contain water vapor, chloride, and sulfur dioxide. These gases dissolve in water and form the chloride and sulfate ions in seawater.
(l)Co
nrad
Zob
el/C
ORBI
S, (r
)Dr.
Mor
ley
Read
/Pho
to R
esea
rche
rs
0413_0420_ESGEU_S_C15_S2_658713.indd 4150413_0420_ESGEU_S_C15_S2_658713.indd 415 2/12/11 11:41 AM2/12/11 11:41 AM
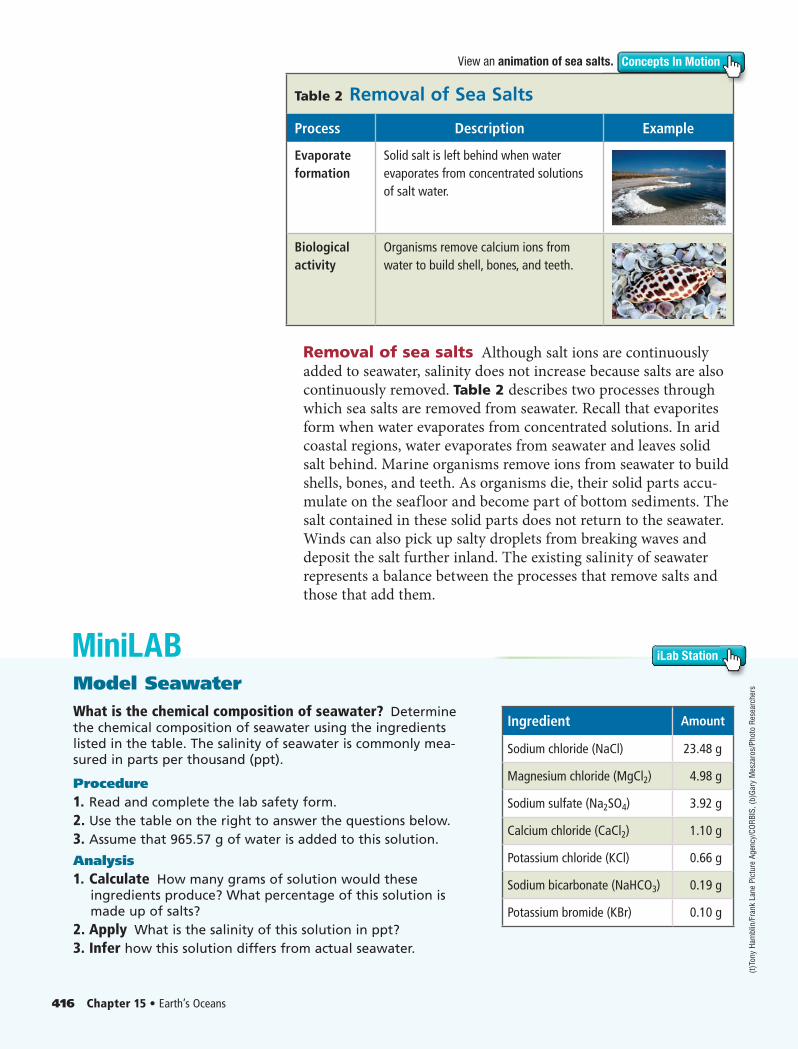
iLab Station
Removal of sea salts Although salt ions are continuously added to seawater, salinity does not increase because salts are also continuously removed. Table 2 describes two processes through which sea salts are removed from seawater. Recall that evaporites form when water evaporates from concentrated solutions. In arid coastal regions, water evaporates from seawater and leaves solid salt behind. Marine organisms remove ions from seawater to build shells, bones, and teeth. As organisms die, their solid parts accu-mulate on the seafloor and become part of bottom sediments. The salt contained in these solid parts does not return to the seawater. Winds can also pick up salty droplets from breaking waves and deposit the salt further inland. The existing salinity of seawater represents a balance between the processes that remove salts and those that add them.
416 Chapter 15 • Earth’s Oceans
Table 2 Removal of Sea Salts
Process Description Example
Evaporate formation
Solid salt is left behind when water evaporates from concentrated solutions of salt water.
Biological activity
Organisms remove calcium ions from water to build shell, bones, and teeth.
Concepts In MotionView an animation of sea salts.
Model SeawaterWhat is the chemical composition of seawater? Determine the chemical composition of seawater using the ingredients listed in the table. The salinity of seawater is commonly mea-sured in parts per thousand (ppt).
Procedure 1. Read and complete the lab safety form. 2. Use the table on the right to answer the questions below.3. Assume that 965.57 g of water is added to this solution.
Analysis1. Calculate How many grams of solution would these
ingredients produce? What percentage of this solution is made up of salts?
2. Apply What is the salinity of this solution in pp t?3. Infer how this solution differs from actual seawater.
Ingredient Amount
Sodium chloride (NaCl) 23.48 g
Magnesium chloride (MgCl2) 4.98 g
Sodium sulfate (Na2SO4) 3.92 g
Calcium chloride (CaCl2) 1.10 g
Potassium chloride (KCl) 0.66 g
Sodium bicarbonate (NaHCO3) 0.19 g
Potassium bromide (KBr) 0.10 g
MiniLAB
(t)To
ny H
ambl
in/F
rank
Lan
e Pi
ctur
e Ag
ency
/COR
BIS,
(b)G
ary
Mes
zaro
s/Ph
oto
Rese
arch
ers
0413_0420_ESGEU_S_C15_S2_658713.indd 4160413_0420_ESGEU_S_C15_S2_658713.indd 416 2/12/11 11:41 AM2/12/11 11:41 AM
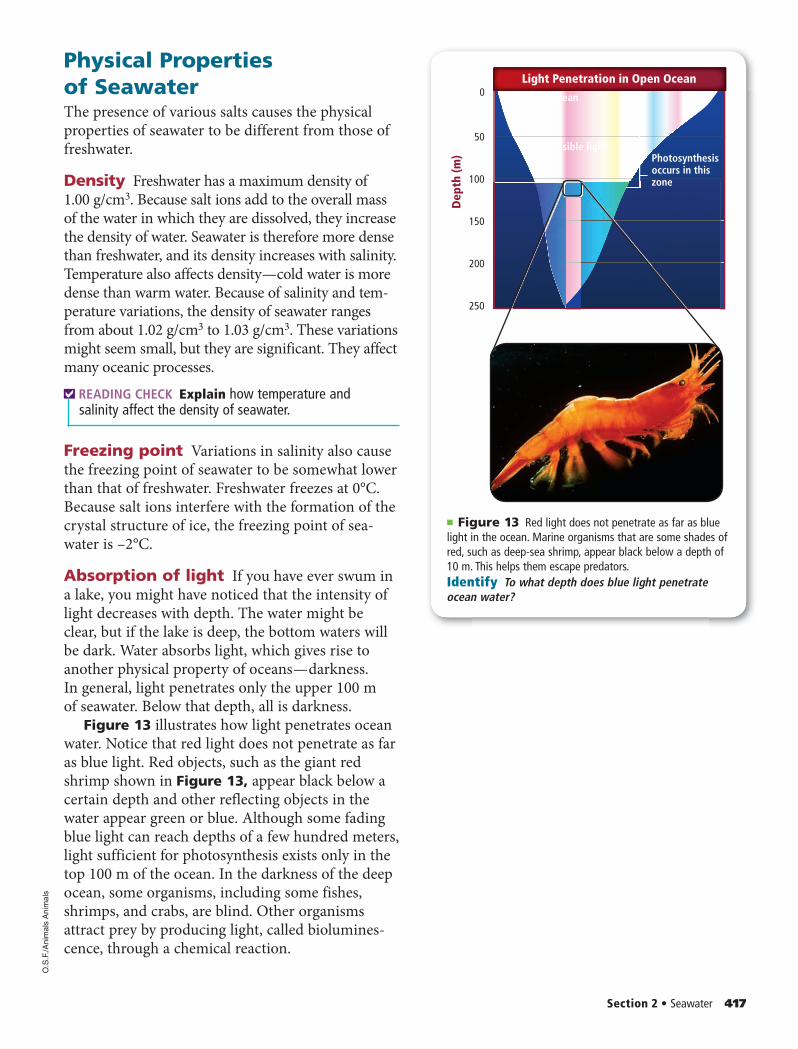
50
0
100
150
250
200
Dep
th (m
)
Light Penetration in Open Ocean
Photosynthesis occurs in this zone
Visible light
Surface of ocean
Physical Properties of SeawaterThe presence of various salts causes the physical properties of seawater to be different from those of freshwater.
Density Freshwater has a maximum density of 1.00 g/cm3. Because salt ions add to the overall mass of the water in which they are dissolved, they increase the density of water. Seawater is therefore more dense than freshwater, and its density increases with salinity. Temperature also affects density — cold water is more dense than warm water. Because of salinity and tem-perature variations, the density of seawater ranges from about 1.02 g/cm3 to 1.03 g/cm3. These variations might seem small, but they are significant. They affect many oceanic processes.
READING CHECK Explain how temperature and salinity affect the density of seawater.
Freezing point Variations in salinity also cause the freezing point of seawater to be somewhat lower than that of freshwater. Freshwater freezes at 0°C. Because salt ions interfere with the formation of the crystal structure of ice, the freezing point of sea-water is –2°C.
Absorption of light If you have ever swum in a lake, you might have noticed that the intensity of light decreases with depth. The water might be clear, but if the lake is deep, the bottom waters will be dark. Water absorbs light, which gives rise to another physical property of oceans — darkness. In general, light penetrates only the upper 100 m of seawater. Below that depth, all is darkness.
Figure 13 illustrates how light penetrates ocean water. Notice that red light does not penetrate as far as blue light. Red objects, such as the giant red shrimp shown in Figure 13, appear black below a certain depth and other reflecting objects in the water appear green or blue. Although some fading blue light can reach depths of a few hundred meters, light sufficient for photosynthesis exists only in the top 100 m of the ocean. In the darkness of the deep ocean, some organisms, including some fishes, shrimps, and crabs, are blind. Other organisms attract prey by producing light, called biolumines-cence, through a chemical reaction.
Section 2 • Seawater 417
■ Figure 13 Red light does not penetrate as far as blue light in the ocean. Marine organisms that are some shades of red, such as deep-sea shrimp, appear black below a depth of 10 m. This helps them escape predators.Identify To what depth does blue light penetrate ocean water?
zone
O.S
.F./A
nim
als
Anim
als
0413_0420_ESGEU_S_C15_S2_658713.indd 4170413_0420_ESGEU_S_C15_S2_658713.indd 417 2/12/11 11:41 AM2/12/11 11:41 AM
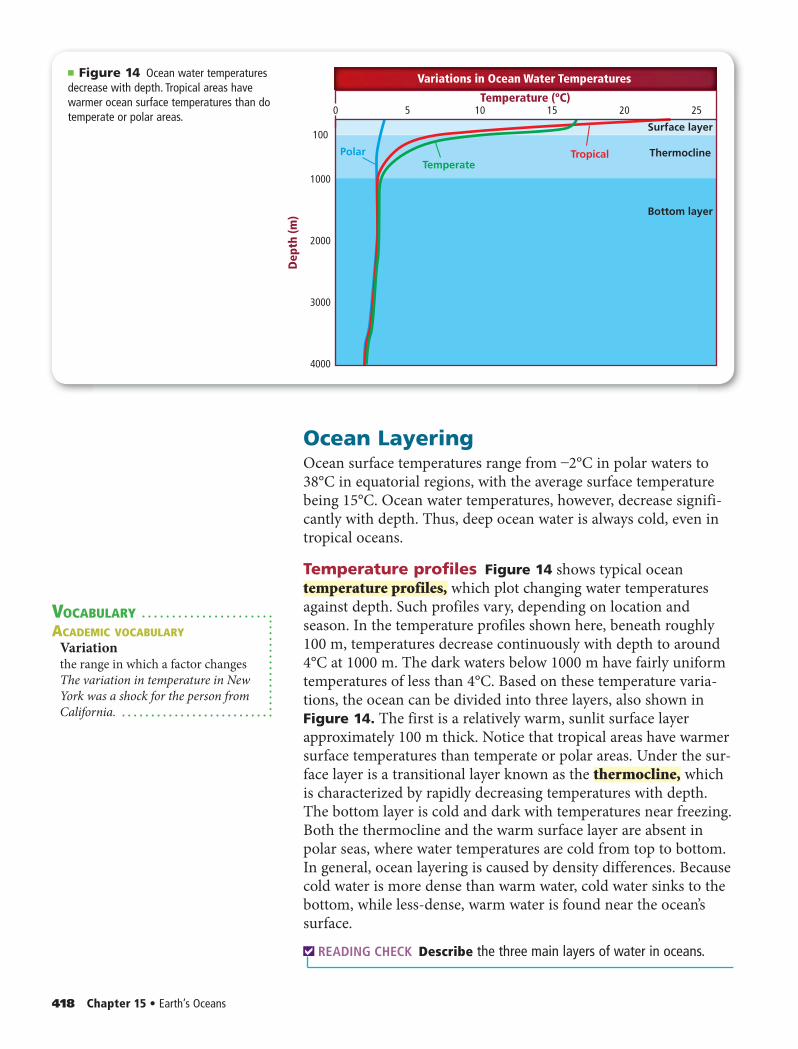
VOCABULARYACADEMIC VOCABULARY
Variationthe range in which a factor changesThe variation in temperature in New York was a shock for the person from California.
Ocean LayeringOcean surface temperatures range from –2°C in polar waters to 38°C in equatorial regions, with the average surface temperature being 15°C. Ocean water temperatures, however, decrease signifi-cantly with depth. Thus, deep ocean water is always cold, even in tropical oceans.
Temperature profiles Figure 14 shows typical ocean temperature profiles, which plot changing water temperatures against depth. Such profiles vary, depending on location and season. In the temperature profiles shown here, beneath roughly 100 m, temperatures decrease continuously with depth to around 4°C at 1000 m. The dark waters below 1000 m have fairly uniform temperatures of less than 4°C. Based on these temperature varia-tions, the ocean can be divided into three layers, also shown in Figure 14. The first is a relatively warm, sunlit surface layer approximately 100 m thick. Notice that tropical areas have warmer surface temperatures than temperate or polar areas. Under the sur-face layer is a transitional layer known as the thermocline, which is characterized by rapidly decreasing temperatures with depth. The bottom layer is cold and dark with temperatures near freezing. Both the thermocline and the warm surface layer are absent in polar seas, where water temperatures are cold from top to bottom. In general, ocean layering is caused by density differences. Because cold water is more dense than warm water, cold water sinks to the bottom, while less-dense, warm water is found near the ocean’s surface.
READING CHECK Describe the three main layers of water in oceans.
418 Chapter 15 • Earth’s Oceans
■ Figure 14 Ocean water temperatures decrease with depth. Tropical areas have warmer ocean surface temperatures than do temperate or polar areas. 50 10
100
1000
2000
3000
4000
15 2520
Dep
th (m
)
Temperature (ºC)
Polar
Variations in Ocean Water Temperatures
Temperate
Surface layer
Thermocline
Bottom layer
Tropical
0413_0420_ESGEU_S_C15_S2_658713.indd 4180413_0420_ESGEU_S_C15_S2_658713.indd 418 2/12/11 11:41 AM2/12/11 11:41 AM
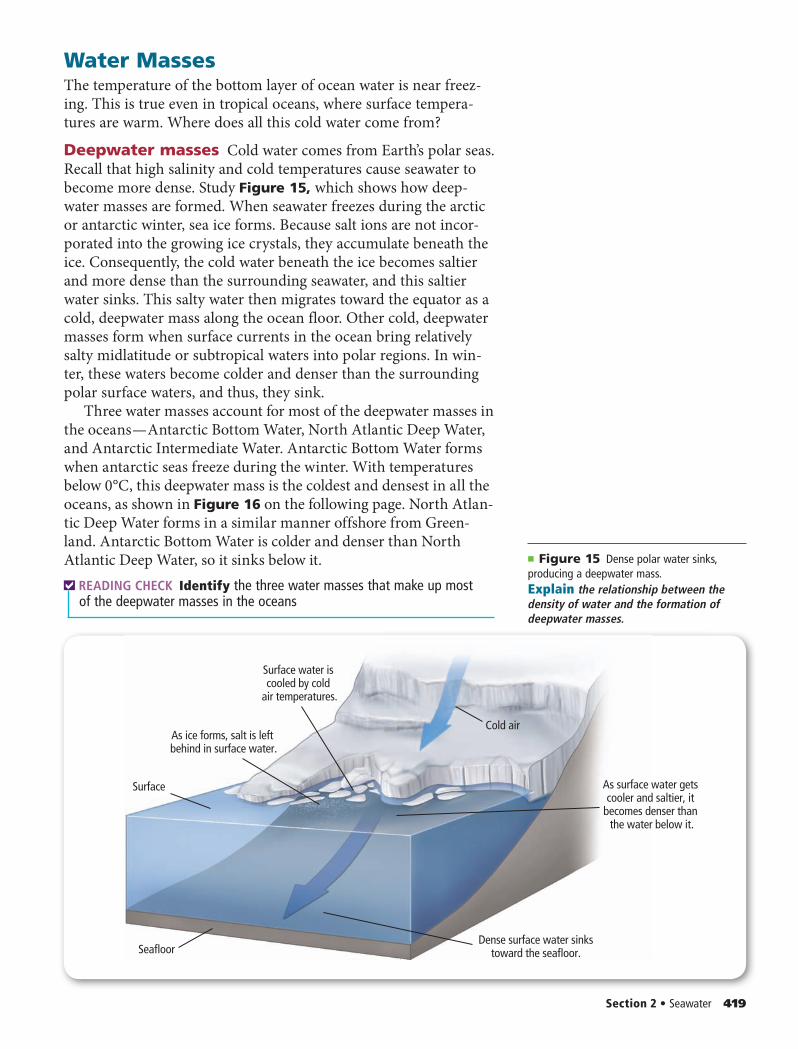
Water MassesThe temperature of the bottom layer of ocean water is near freez-ing. This is true even in tropical oceans, where surface tempera-tures are warm. Where does all this cold water come from?
Deepwater masses Cold water comes from Earth’s polar seas. Recall that high salinity and cold temperatures cause seawater to become more dense. Study Figure 15, which shows how deep-water masses are formed. When seawater freezes during the arctic or antarctic winter, sea ice forms. Because salt ions are not incor-porated into the growing ice crystals, they accumulate beneath the ice. Consequently, the cold water beneath the ice becomes saltier and more dense than the surrounding seawater, and this saltier water sinks. This salty water then migrates toward the equator as a cold, deepwater mass along the ocean floor. Other cold, deepwater masses form when surface currents in the ocean bring relatively salty midlatitude or subtropical waters into polar regions. In win-ter, these waters become colder and denser than the surrounding polar surface waters, and thus, they sink.
Three water masses account for most of the deepwater masses in the oceans — Antarctic Bottom Water, North Atlantic Deep Water, and Antarctic Intermediate Water. Antarctic Bottom Water forms when antarctic seas freeze during the winter. With temperatures below 0°C, this deepwater mass is the coldest and densest in all the oceans, as shown in Figure 16 on the following page. North Atlan-tic Deep Water forms in a similar manner offshore from Green-land. Antarctic Bottom Water is colder and denser than North Atlantic Deep Water, so it sinks below it.
READING CHECK Identify the three water masses that make up most of the deepwater masses in the oceans
Section 2 • Seawater 419
As ice forms, salt is left behind in surface water.
Surface water is cooled by cold
air temperatures.
As surface water gets cooler and saltier, it
becomes denser than the water below it.
Dense surface water sinkstoward the seafloor.Seafloor
Surface
Cold air
■ Figure 15 Dense polar water sinks, producing a deepwater mass.Explain the relationship between the density of water and the formation of deepwater masses.
0413_0420_ESGEU_S_C15_S2_658713.indd 4190413_0420_ESGEU_S_C15_S2_658713.indd 419 2/12/11 11:41 AM2/12/11 11:41 AM
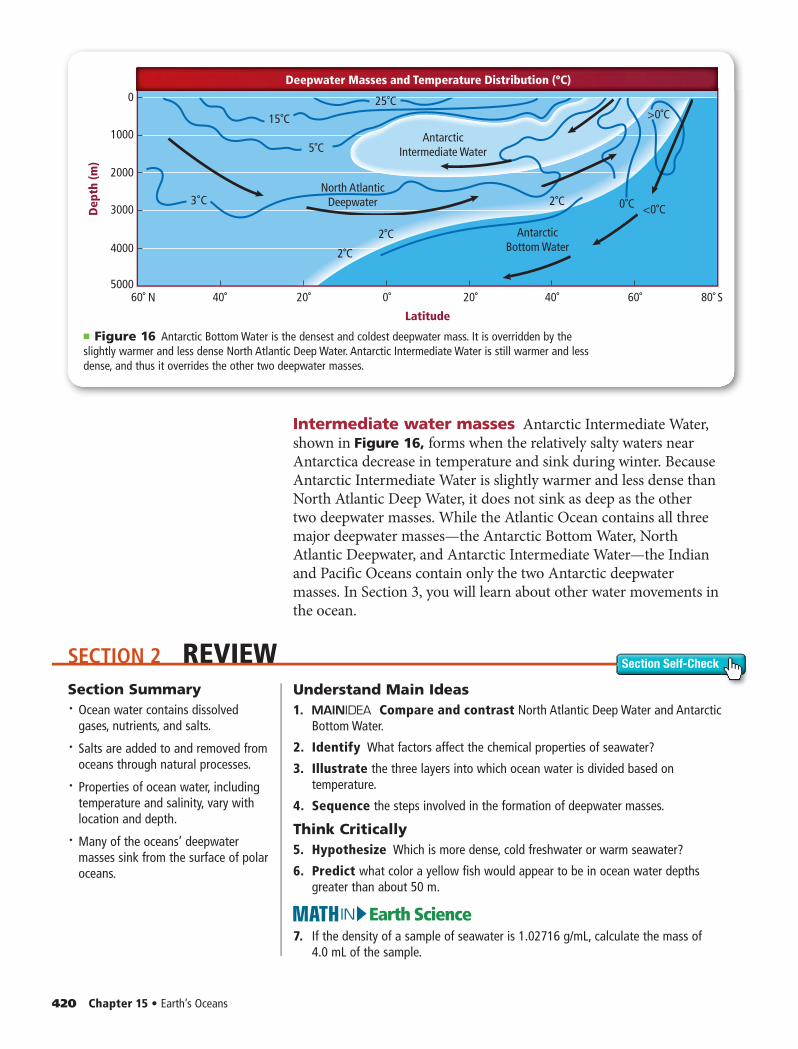
SECTION 2 REVIEW Section Self-Check
Intermediate water masses Antarctic Intermediate Water, shown in Figure 16, forms when the relatively salty waters near Antarctica decrease in temperature and sink during winter. Because Antarctic Intermediate Water is slightly warmer and less dense than North Atlantic Deep Water, it does not sink as deep as the other two deepwater masses. While the Atlantic Ocean contains all three major deepwater masses—the Antarctic Bottom Water, North Atlantic Deepwater, and Antarctic Intermediate Water—the Indian and Pacific Oceans contain only the two Antarctic deepwater masses. In Section 3, you will learn about other water movements in the ocean.
420 Chapter 15 • Earth’s Oceans
60˚ 40˚ 20˚
North AtlanticDeepwater
AntarcticIntermediate Water
AntarcticBottom Water
0˚
<0˚C
>0˚C
0˚C3˚C
5˚C
15˚C25˚C
2˚C
2˚C2˚C
20˚ 40˚ 60˚ 80˚N S
0
1000
2000
3000
4000
5000
Dep
th (m
)
Latitude
Deepwater Masses and Temperature Distribution (ºC)
■ Figure 16 Antarctic Bottom Water is the densest and coldest deepwater mass. It is overridden by the slightly warmer and less dense North Atlantic Deep Water. Antarctic Intermediate Water is still warmer and less dense, and thus it overrides the other two deepwater masses.
Section Summary• Ocean water contains dissolved
gases, nutrients, and salts.
• Salts are added to and removed from oceans through natural processes.
• Properties of ocean water, including temperature and salinity, vary with location and depth.
• Many of the oceans’ deepwater masses sink from the surface of polar oceans.
Understand Main Ideas1. Compare and contrast North Atlantic Deep Water and Antarctic
Bottom Water.
2. Identify What factors affect the chemical properties of seawater?
3. Illustrate the three layers into which ocean water is divided based on temperature.
4. Sequence the steps involved in the formation of deepwater masses.
Think Critically5. Hypothesize Which is more dense, cold freshwater or warm seawater?
6. Predict what color a yellow fish would appear to be in ocean water depths greater than about 50 m.
Earth ScienceIN7. If the density of a sample of seawater is 1.02716 g/mL, calculate the mass of
4.0 mL of the sample.
0413_0420_ESGEU_S_C15_S2_658713.indd 4200413_0420_ESGEU_S_C15_S2_658713.indd 420 2/12/11 11:41 AM2/12/11 11:41 AM
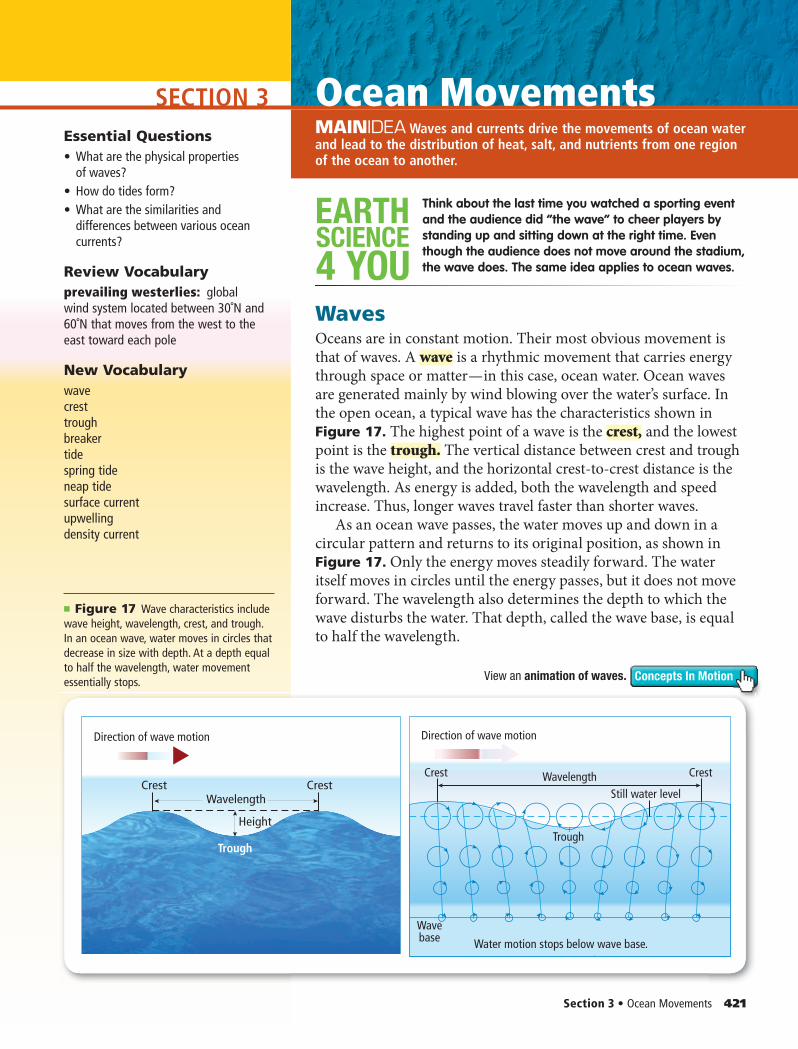
SECTION 3MAINIDEA Energy is transferred throughout Earth’s atmosphere.
Section 3 • Ocean Movements 421
Essential Questions• What are the physical properties
of waves?• How do tides form?• What are the similarities and
differences between various ocean currents?
Review Vocabularyprevailing westerlies: global wind system located between 30˚N and 60˚N that moves from the west to the east toward each pole
New Vocabularywavecresttroughbreakertidespring tideneap tidesurface currentupwellingdensity current
Ocean MovementsMAINIDEA Waves and currents drive the movements of ocean water and lead to the distribution of heat, salt, and nutrients from one region of the ocean to another.
SCIENCE
4 YOU
EARTH Think about the last time you watched a sporting event and the audience did “the wave” to cheer players by standing up and sitting down at the right time. Even though the audience does not move around the stadium, the wave does. The same idea applies to ocean waves.
WavesOceans are in constant motion. Their most obvious movement is that of waves. A wave is a rhythmic movement that carries energy through space or matter — in this case, ocean water. Ocean waves are generated mainly by wind blowing over the water’s surface. In the open ocean, a typical wave has the characteristics shown in Figure 17. The highest point of a wave is the crest, and the lowest point is the trough. The vertical distance between crest and trough is the wave height, and the horizontal crest-to-crest distance is the wavelength. As energy is added, both the wavelength and speed increase. Thus, longer waves travel faster than shorter waves.
As an ocean wave passes, the water moves up and down in a circular pattern and returns to its original position, as shown in Figure 17. Only the energy moves steadily forward. The water itself moves in circles until the energy passes, but it does not move forward. The wavelength also determines the depth to which the wave disturbs the water. That depth, called the wave base, is equal to half the wavelength.
■ Figure 17 Wave characteristics include wave height, wavelength, crest, and trough. In an ocean wave, water moves in circles that decrease in size with depth. At a depth equal to half the wavelength, water movement essentially stops.
Direction of wave motion
CrestCrestWavelength
Height
Trough
Crest Wavelength
Trough
Direction of wave motion
Still water level
Water motion stops below wave base.
Wavebase
Crest
Concepts In Mo tionView an animation of waves.
0421_0427_ESGEU_S_C15_S3_658713.indd 4210421_0427_ESGEU_S_C15_S3_658713.indd 421 2/12/11 11:41 AM2/12/11 11:41 AM
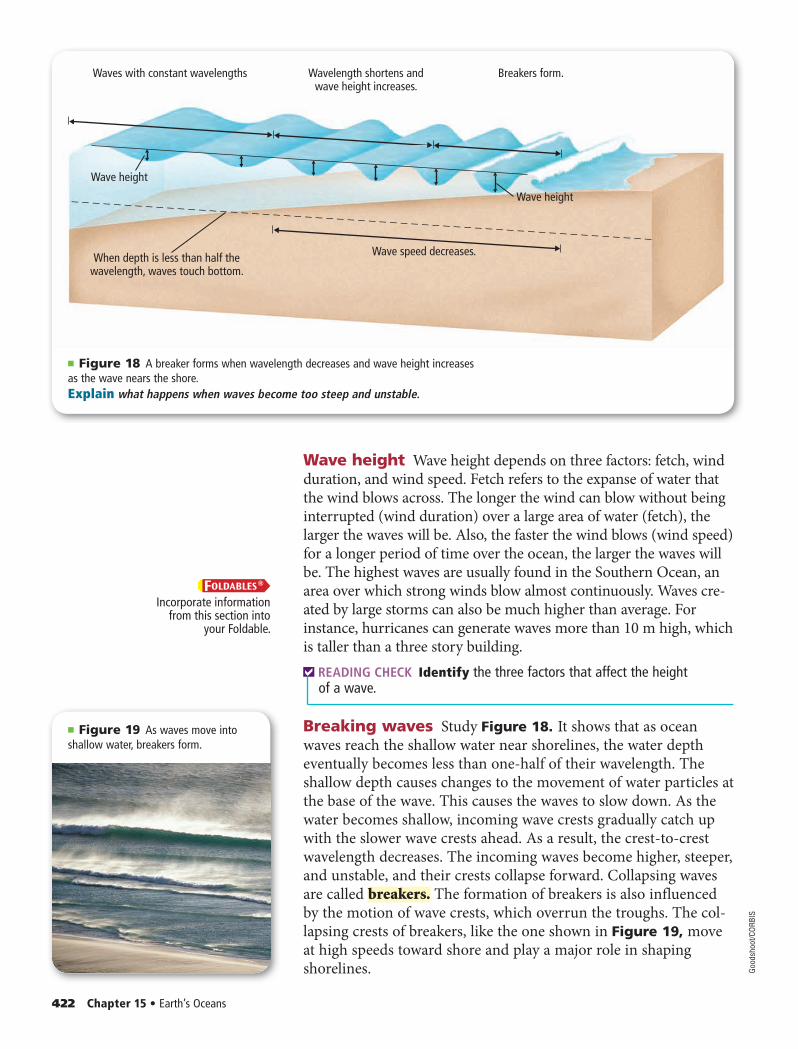
Wave height Wave height depends on three factors: fetch, wind duration, and wind speed. Fetch refers to the expanse of water that the wind blows across. The longer the wind can blow without being interrupted (wind duration) over a large area of water (fetch), the larger the waves will be. Also, the faster the wind blows (wind speed) for a longer period of time over the ocean, the larger the waves will be. The highest waves are usually found in the Southern Ocean, an area over which strong winds blow almost continuously. Waves cre-ated by large storms can also be much higher than average. For instance, hurricanes can generate waves more than 10 m high, which is taller than a three story building.
READING CHECK Identify the three factors that affect the height of a wave.
Breaking waves Study Figure 18. It shows that as ocean waves reach the shallow water near shorelines, the water depth eventually becomes less than one-half of their wavelength. The shallow depth causes changes to the movement of water particles at the base of the wave. This causes the waves to slow down. As the water becomes shallow, incoming wave crests gradually catch up with the slower wave crests ahead. As a result, the crest-to-crest wavelength decreases. The incoming waves become higher, steeper, and unstable, and their crests collapse forward. Collapsing waves are called breakers. The formation of breakers is also influenced by the motion of wave crests, which overrun the troughs. The col-lapsing crests of breakers, like the one shown in Figure 19, move at high speeds toward shore and play a major role in shaping shorelines.
422 Chapter 15 • Earth’s Oceans
Waves with constant wavelengths Wavelength shortens andwave height increases.
When depth is less than half thewavelength, waves touch bottom.
Wave speed decreases.
Wave height
Wave height
Breakers form.
■ Figure 18 A breaker forms when wavelength decreases and wave height increases as the wave nears the shore.Explain what happens when waves become too steep and unstable.
■ Figure 19 As waves move into shallow water, breakers form.
FOLDABLESIncorporate information
from this section into your Foldable.
Good
shoo
t/COR
BIS
0421_0427_ESGEU_S_C15_S3_658713.indd 4220421_0427_ESGEU_S_C15_S3_658713.indd 422 2/12/11 11:41 AM2/12/11 11:41 AM
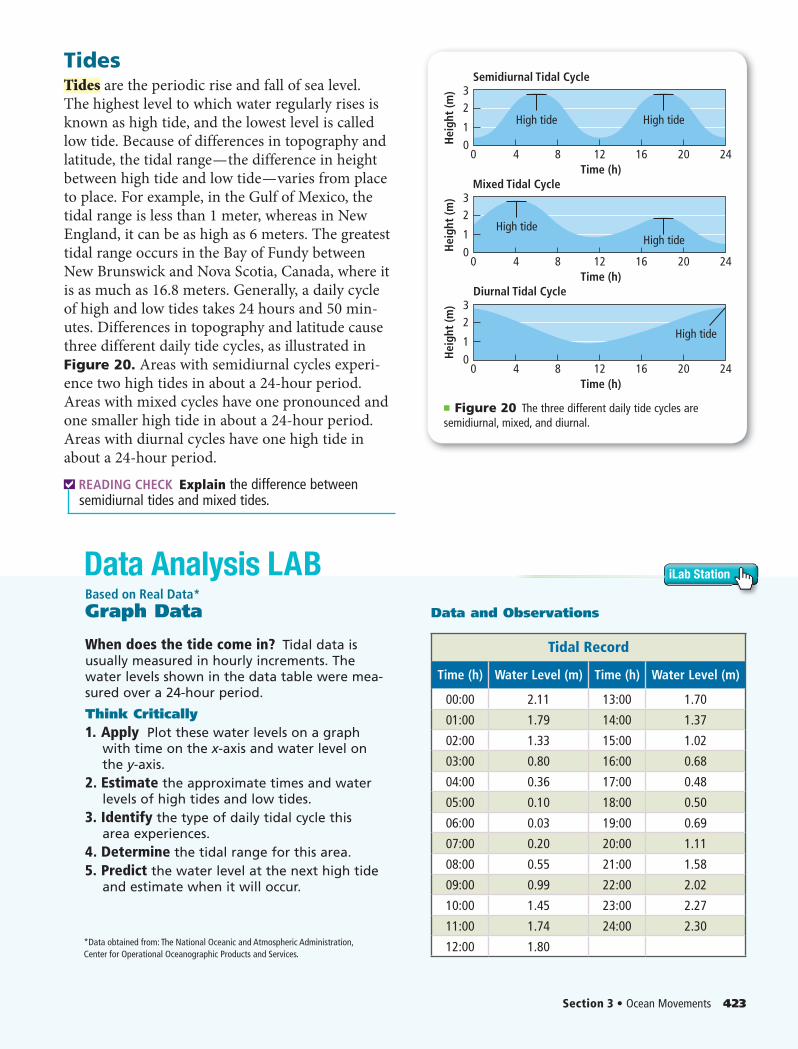
iLab Station
Section 3 • Ocean Movements 423
TidesTides are the periodic rise and fall of sea level. The highest level to which water regularly rises is known as high tide, and the lowest level is called low tide. Because of differences in topography and latitude, the tidal range — the difference in height between high tide and low tide — varies from place to place. For example, in the Gulf of Mexico, the tidal range is less than 1 meter, whereas in New England, it can be as high as 6 meters. The greatest tidal range occurs in the Bay of Fundy between New Bruns wick and Nova Scotia, Canada, where it is as much as 16.8 meters. Generally, a daily cycle of high and low tides takes 24 hours and 50 min-utes. Differences in topography and latitude cause three different daily tide cycles, as illustrated in Figure 20. Areas with semidiurnal cycles experi-ence two high tides in about a 24-hour period. Areas with mixed cycles have one pronounced and one smaller high tide in about a 24-hour period. Areas with diurnal cycles have one high tide in about a 24-hour period.
READING CHECK Explain the difference between semidiurnal tides and mixed tides.
■ Figure 20 The three different daily tide cycles are semidiurnal, mixed, and diurnal.
High tide High tide
Semidiurnal Tidal Cycle
Mixed Tidal Cycle
Diurnal Tidal Cycle
Time (h)
Hei
ght
(m)
0 24
1
2
4 0 8 12 16 20
3
High tide
Time (h)
Hei
ght
(m)
0 24
1
2
4 0 8 12 16 20
3
High tide
High tide
Time (h)
Hei
ght
(m)
0 24
1
2
4 0 8 12 16 20
3
Based on Real Data*Graph Data
When does the tide come in? Tidal data is usually measured in hourly increments. The water levels shown in the data table were mea-sured over a 24-hour period.
Think Critically1. Apply Plot these water levels on a graph
with time on the x-axis and water level on the y-axis.
2. Estimate the approximate times and water levels of high tides and low tides.
3. Identify the type of daily tidal cycle this area experiences.
4. Determine the tidal range for this area.5. Predict the water level at the next high tide
and estimate when it will occur.
*Data obtained from: The National Oceanic and Atmospheric Administration, Center for Operational Oceanographic Products and Services.
Tidal Record
Time (h) Water Level (m) Time (h) Water Level (m)
00:00 2.11 13:00 1.70
01:00 1.79 14:00 1.37
02:00 1.33 15:00 1.02
03:00 0.80 16:00 0.68
04:00 0.36 17:00 0.48
05:00 0.10 18:00 0.50
06:00 0.03 19:00 0.69
07:00 0.20 20:00 1.11
08:00 0.55 21:00 1.58
09:00 0.99 22:00 2.02
10:00 1.45 23:00 2.27
11:00 1.74 24:00 2.30
12:00 1.80
Data and Observations
Data Analysis LAB
0421_0427_ESGEU_S_C15_S3_658713.indd 4230421_0427_ESGEU_S_C15_S3_658713.indd 423 2/12/11 11:41 AM2/12/11 11:41 AM
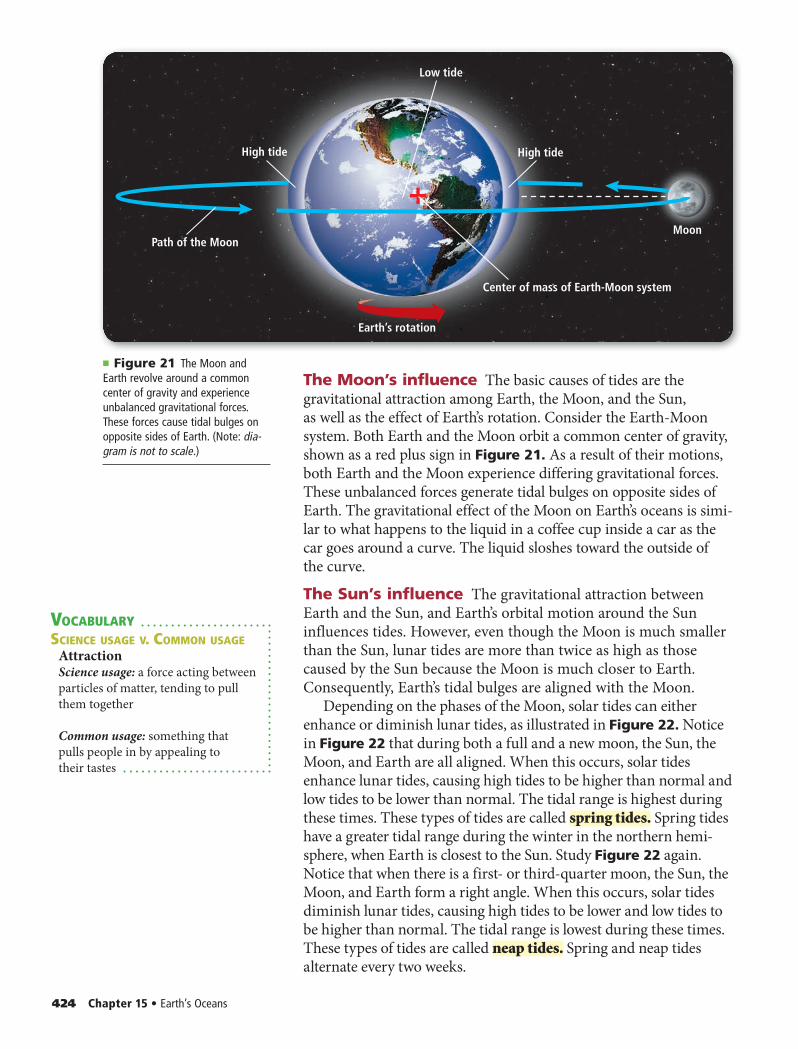
VOCABULARYSCIENCE USAGE V. COMMON USAGE
AttractionScience usage: a force acting between particles of matter, tending to pull them together
Common usage: something that pulls people in by appealing to their tastes
The Moon’s influence The basic causes of tides are the gravitational attraction among Earth, the Moon, and the Sun, as well as the effect of Earth’s rotation. Consider the Earth-Moon system. Both Earth and the Moon orbit a common center of gravity, shown as a red plus sign in Figure 21. As a result of their motions, both Earth and the Moon experience differing gravitational forces. These unbalanced forces generate tidal bulges on opposite sides of Earth. The gravitational effect of the Moon on Earth’s oceans is simi-lar to what happens to the liquid in a coffee cup inside a car as the car goes around a curve. The liquid sloshes toward the outside of the curve.
The Sun’s influence The gravitational attraction between Earth and the Sun, and Earth’s orbital motion around the Sun influences tides. However, even though the Moon is much smaller than the Sun, lunar tides are more than twice as high as those caused by the Sun because the Moon is much closer to Earth. Consequently, Earth’s tidal bulges are aligned with the Moon.
Depending on the phases of the Moon, solar tides can either enhance or diminish lunar tides, as illustrated in Figure 22. Notice in Figure 22 that during both a full and a new moon, the Sun, the Moon, and Earth are all aligned. When this occurs, solar tides enhance lunar tides, causing high tides to be higher than normal and low tides to be lower than normal. The tidal range is highest during these times. These types of tides are called spring tides. Spring tides have a greater tidal range during the winter in the northern hemi-sphere, when Earth is closest to the Sun. Study Figure 22 again. Notice that when there is a first- or third-quarter moon, the Sun, the Moon, and Earth form a right angle. When this occurs, solar tides diminish lunar tides, causing high tides to be lower and low tides to be higher than normal. The tidal range is lowest during these times. These types of tides are called neap tides. Spring and neap tides alternate every two weeks.
424 Chapter 15 • Earth’s Oceans
High tide High tide
Path of the Moon
Low tide
Moon
Center of mass of Earth-Moon system
Earth’s rotation
■ Figure 21 The Moon and Earth revolve around a common center of gravity and experience unbalanced gravitational forces. These forces cause tidal bulges on opposite sides of Earth. (Note: dia-gram is not to scale.)
0421_0427_ESGEU_S_C15_S3_658713.indd 4240421_0427_ESGEU_S_C15_S3_658713.indd 424 2/12/11 11:41 AM2/12/11 11:41 AM
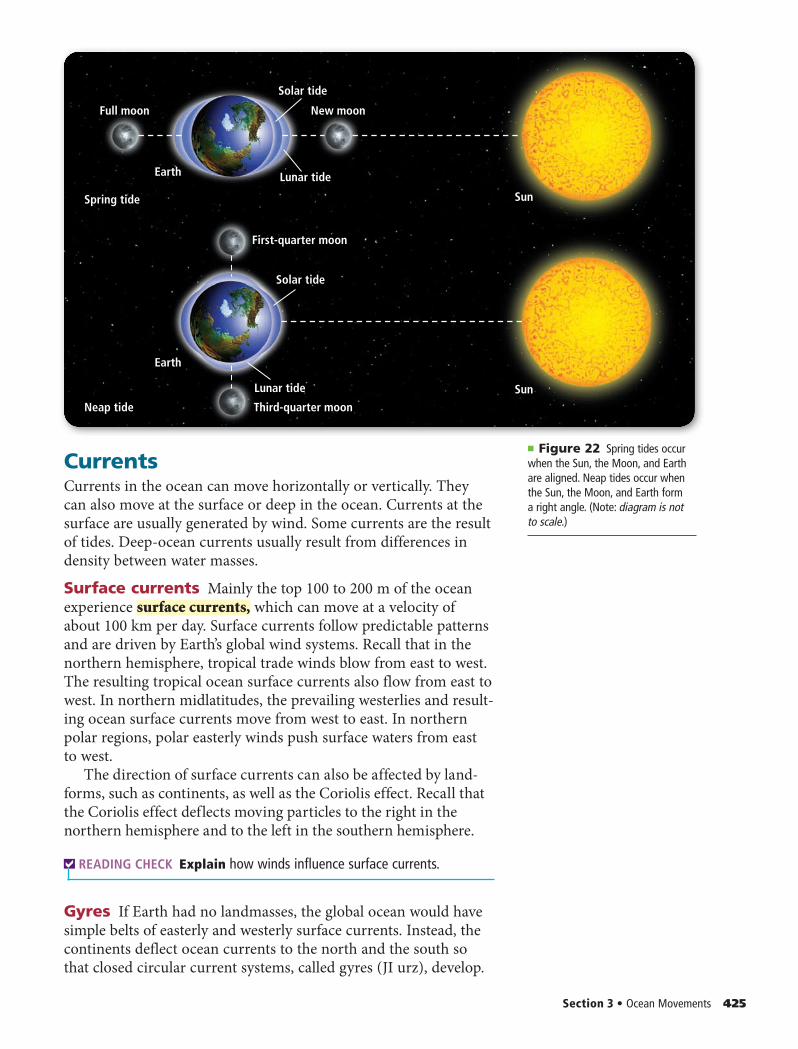
CurrentsCurrents in the ocean can move horizontally or vertically. They can also move at the surface or deep in the ocean. Currents at the surface are usually generated by wind. Some currents are the result of tides. Deep-ocean currents usually result from differences in density between water masses.
Surface currents Mainly the top 100 to 200 m of the ocean experience surface currents, which can move at a velocity of about 100 km per day. Surface currents follow predictable patterns and are driven by Earth’s global wind systems. Recall that in the northern hemisphere, tropical trade winds blow from east to west. The resulting tropical ocean surface currents also flow from east to west. In northern midlatitudes, the prevailing westerlies and result-ing ocean surface currents move from west to east. In northern polar regions, polar easterly winds push surface waters from east to west.
The direction of surface currents can also be affected by land-forms, such as continents, as well as the Coriolis effect. Recall that the Coriolis effect deflects moving particles to the right in the northern hemisphere and to the left in the southern hemisphere.
READING CHECK Explain how winds influence surface currents.
Gyres If Earth had no landmasses, the global ocean would have simple belts of easterly and westerly surface currents. Instead, the continents deflect ocean currents to the north and the south so that closed circular current systems, called gyres (JI urz), develop.
Section 3 • Ocean Movements 425
Earth
Earth
Sun
Sun
Full moon
Spring tide
Neap tide
First-quarter moon
Third-quarter moon
New moon
Lunar tide
Solar tide
Lunar tide
Solar tide
■ Figure 22 Spring tides occur when the Sun, the Moon, and Earth are aligned. Neap tides occur when the Sun, the Moon, and Earth form a right angle. (Note: diagram is not to scale.)
0421_0427_ESGEU_S_C15_S3_658713.indd 4250421_0427_ESGEU_S_C15_S3_658713.indd 425 2/12/11 11:42 AM2/12/11 11:42 AM
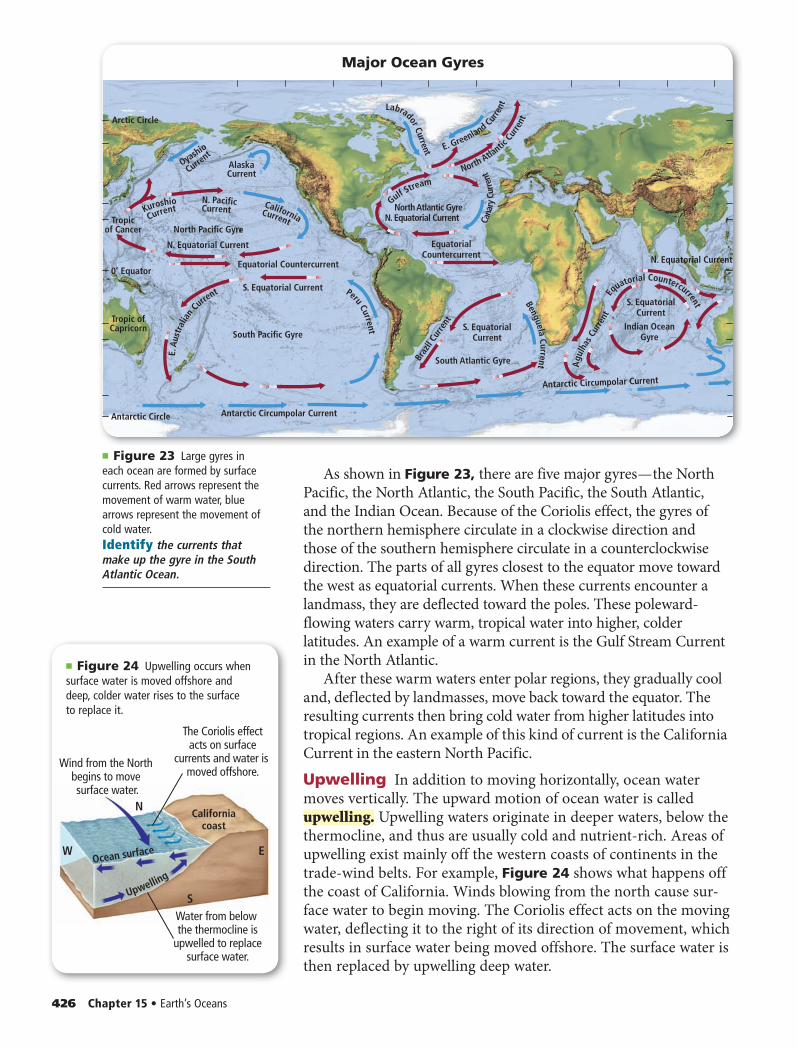
As shown in Figure 23, there are five major gyres — the North Pacific, the North Atlantic, the South Pacific, the South Atlantic, and the Indian Ocean. Because of the Coriolis effect, the gyres of the northern hemisphere circulate in a clockwise direction and those of the southern hemisphere circulate in a counterclockwise direction. The parts of all gyres closest to the equator move toward the west as equatorial currents. When these currents encounter a landmass, they are deflected toward the poles. These poleward-flowing waters carry warm, tropical water into higher, colder latitudes. An example of a warm current is the Gulf Stream Current in the North Atlantic.
After these warm waters enter polar regions, they gradually cool and, deflected by landmasses, move back toward the equator. The resulting currents then bring cold water from higher latitudes into tropical regions. An example of this kind of current is the California Current in the eastern North Pacific.Upwelling In addition to moving horizontally, ocean water moves vertically. The upward motion of ocean water is called upwelling. Upwelling waters originate in deeper waters, below the thermocline, and thus are usually cold and nutrient-rich. Areas of upwelling exist mainly off the western coasts of continents in the trade-wind belts. For example, Figure 24 shows what happens off the coast of California. Winds blowing from the north cause sur-face water to begin moving. The Coriolis effect acts on the moving water, deflecting it to the right of its direction of movement, which results in surface water being moved offshore. The surface water is then replaced by upwelling deep water.
426 Chapter 15 • Earth’s Oceans
■ Figure 23 Large gyres in each ocean are formed by surface currents. Red arrows represent the movement of warm water, blue arrows represent the movement of cold water.Identify the currents that make up the gyre in the South Atlantic Ocean.
Upwelling
Californiacoast
Ocean surface
Wind from the North begins to move surface water.
The Coriolis effectacts on surface
currents and water is moved offshore.
Water from below the thermocline is
upwelled to replacesurface water.
N
S
W E
■ Figure 24 Upwelling occurs when surface water is moved offshore and deep, colder water rises to the surface to replace it.
Arctic Circle
Tropicof Cancer
Tropic ofCapricorn
0˚ EquatorEquatorial Countercurrent
S. Equatorial Current
S. EquatorialCurrent
S. EquatorialCurrent
N. Equatorial Current
South Pacific Gyre
South Atlantic Gyre
Indian OceanGyre
N. Equatorial Current
AlaskaCurrent
N. Equatorial CurrentNorth Pacific Gyre
EquatorialCountercurrent
North Atlantic Gyre
Braz
il Cu
rrent
Antarctic Circle Antarctic Circumpolar Current
Antarctic Circumpolar Current
Benguela Current
Equatorial Countercurrent
Agu
lhas
Cur
rent
Gulf Stream
North Atlantic
Cur
rent
E. Greenland Curre
nt
Cana
ry C
urre
nt
Kuroshio
Peru Current
E. A
ustr
alia
n Curre
nt
Current
Oyashio
Current
Labrador Current
N. Pacific Current Current
California
Major Ocean Gyres
0421_0427_ESGEU_S_C15_S3_658713.indd 4260421_0427_ESGEU_S_C15_S3_658713.indd 426 2/12/11 11:42 AM2/12/11 11:42 AM
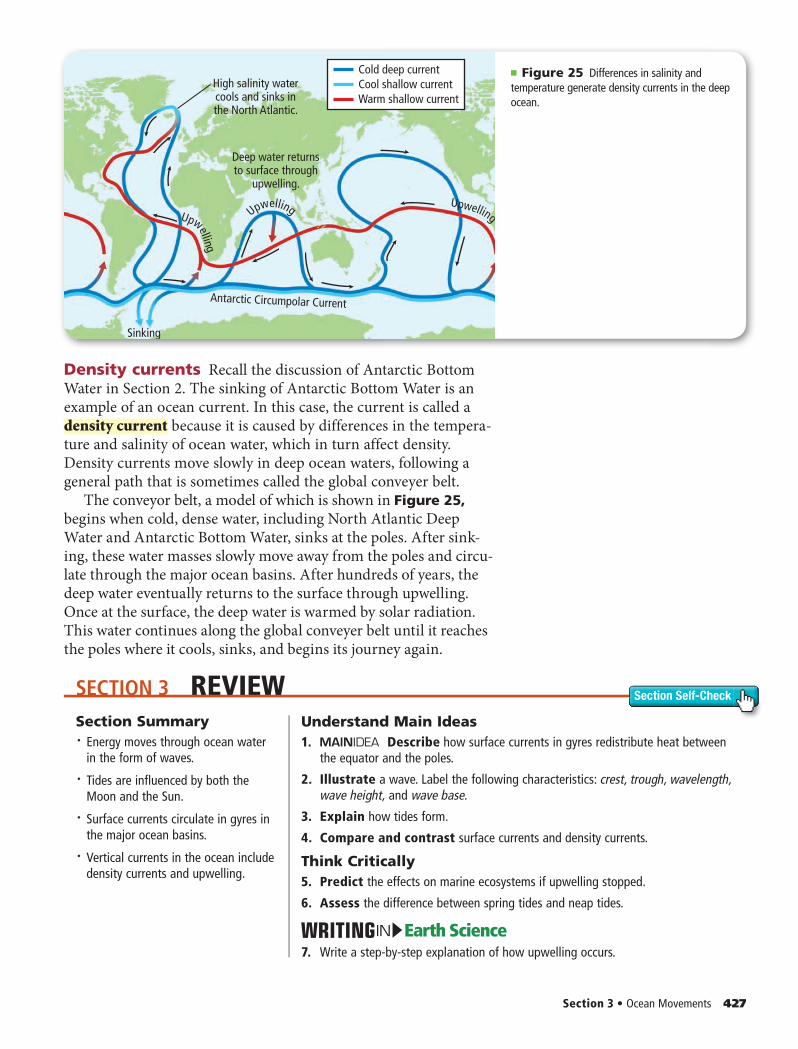
SECTION 3 REVIEW Section Self-Check
Section 3 • Ocean Movements 427
Cold deep currentCool shallow currentWarm shallow current
High salinity watercools and sinks inthe North Atlantic.
Deep water returnsto surface through
upwelling.
Sinking
UpwellingUpwelling
Antarctic Circumpolar Current
Upwelling
■ Figure 25 Differences in salinity and temperature generate density currents in the deep ocean.
Density currents Recall the discussion of Antarctic Bottom Water in Section 2. The sinking of Antarctic Bottom Water is an example of an ocean current. In this case, the current is called a density current because it is caused by differences in the tempera-ture and salinity of ocean water, which in turn affect density. Density currents move slowly in deep ocean waters, following a general path that is sometimes called the global conveyer belt.
The conveyor belt, a model of which is shown in Figure 25,begins when cold, dense water, including North Atlantic Deep Water and Antarctic Bottom Water, sinks at the poles. After sink-ing, these water masses slowly move away from the poles and circu-late through the major ocean basins. After hundreds of years, the deep water eventually returns to the surface through upwelling. Once at the surface, the deep water is warmed by solar radiation. This water continues along the global conveyer belt until it reaches the poles where it cools, sinks, and begins its journey again.
Section Summary• Energy moves through ocean water
in the form of waves.
• Tides are influenced by both the Moon and the Sun.
• Surface currents circulate in gyres in the major ocean basins.
• Vertical currents in the ocean include density currents and upwelling.
Understand Main Ideas1. Describe how surface currents in gyres redistribute heat between
the equator and the poles.
2. Illustrate a wave. Label the following characteristics: crest, trough, wavelength, wave height, and wave base.
3. Explain how tides form.
4. Compare and contrast surface currents and density currents.
Think Critically5. Predict the effects on marine ecosystems if upwelling stopped.
6. Assess the difference between spring tides and neap tides.
Earth ScienceIN7. Write a step-by-step explanation of how upwelling occurs.
0421_0427_ESGEU_S_C15_S3_658713.indd 4270421_0427_ESGEU_S_C15_S3_658713.indd 427 2/12/11 11:42 AM2/12/11 11:42 AM
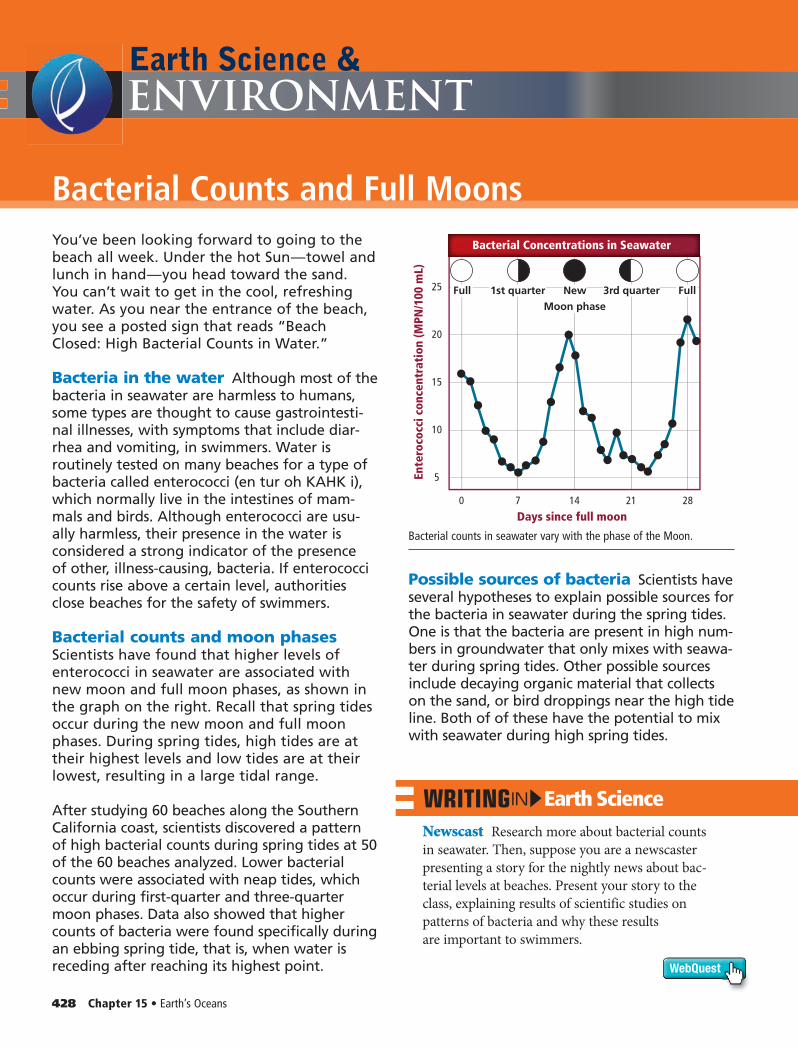
Bacterial Counts and Full Moons
Earth Science &
WebQuest
Earth ScienceIN
Newscast Research more about bacterial counts in seawater. Then, suppose you are a newscaster presenting a story for the nightly news about bac-terial levels at beaches. Present your story to the class, explaining results of scientific studies on patterns of bacteria and why these results are important to swimmers.
You’ve been looking forward to going to the beach all week. Under the hot Sun — towel and lunch in hand — you head toward the sand. You can’t wait to get in the cool, refreshing water. As you near the entrance of the beach, you see a posted sign that reads “Beach Closed: High Bacterial Counts in Water.”
Bacteria in the water Although most of the bacteria in seawater are harmless to humans, some types are thought to cause gastrointesti-nal illnesses, with symptoms that include diar-rhea and vomiting, in swimmers. Water is routinely tested on many beaches for a type of bacteria called enterococci (en tur oh KAHK i), which normally live in the intestines of mam-mals and birds. Although enterococci are usu-ally harmless, their presence in the water is considered a strong indicator of the presence of other, illness-causing, bacteria. If enterococci counts rise above a certain level, authorities close beaches for the safety of swimmers.
Bacterial counts and moon phases Scientists have found that higher levels of enterococci in seawater are associated with new moon and full moon phases, as shown in the graph on the right. Recall that spring tides occur during the new moon and full moon phases. During spring tides, high tides are at their highest levels and low tides are at their lowest, resulting in a large tidal range.
After studying 60 bea ches along the Southern California coast, scientists discovered a pattern of high bacterial counts during spring tides at 50 of the 60 beaches analyzed. Lower bacterial counts were associated with neap tides, which occur during first-quarter and three-quarter moon phases. Data also showed that higher counts of bacteria were found specifically during an ebbing spring tide, that is, when water is receding after reaching its highest point.
Possible sources of bacteria Scientists have several hypotheses to explain possible sources for the bacteria in seawater during the spring tides. One is that the bacteria are present in high num-bers in groundwater that only mixes with seawa-ter during spring tides. Other possible sources include decaying organic material that collects on the sand, or bird droppings near the high tide line. Both of of these have the potential to mix with seawater during high spring tides.
ENVIRONMENT
Bacterial counts in seawater vary with the phase of the Moon.
70
5
10
15
20
25
14 21 28
Ente
roco
cci c
once
ntra
tion
(MPN
/100
mL)
Days since full moon
Bacterial Concentrations in Seawater
Moon phase
Full New1st quarter 3rd quarter Full
428 Chapter 15 • Earth’s Oceans
0428_ESGEU_S_C15_F_658713.indd 4280428_ESGEU_S_C15_F_658713.indd 428 2/12/11 11:42 AM2/12/11 11:42 AM
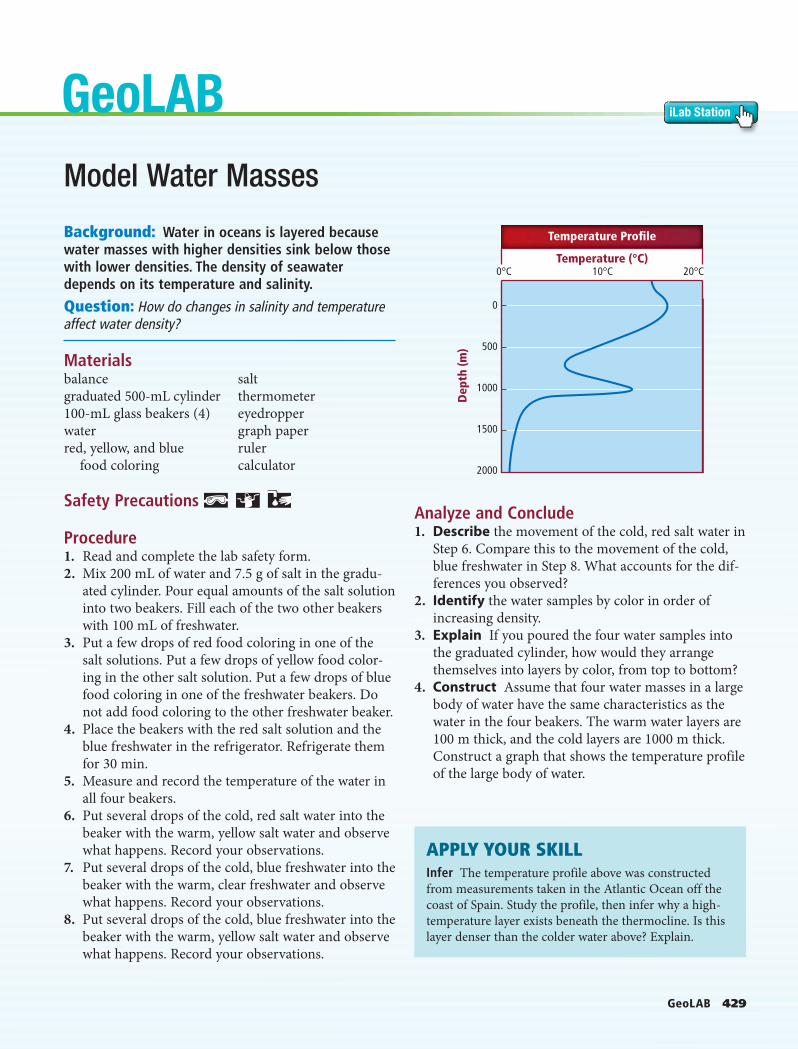
GeoLAB 429
1000
2000
1500
500
Dep
th (m
)
Temperature (°C)
0
0°C 10°C 20°C
Temperature Profile
GeoLAB iLab Station
Background: Water in oceans is layered because water masses with higher densities sink below those with lower densities. The density of seawater depends on its temperature and salinity.
Question: How do changes in salinity and temperature affect water density?
Materialsbalancegraduated 500-mL cylinder100-mL glass beakers (4)waterred, yellow, and blue
food coloring
saltthermometereyedroppergraph paperrulercalculator
Safety Precautions
Procedure1. Read and complete the lab safety form.2. Mix 200 mL of water and 7.5 g of salt in the gradu-
ated cylinder. Pour equal amounts of the salt solution into two beakers. Fill each of the two other beakers with 100 mL of freshwater.
3. Put a few drops of red food coloring in one of the salt solutions. Put a few drops of yellow food color-ing in the other salt solution. Put a few drops of blue food coloring in one of the freshwater beakers. Do not add food coloring to the other freshwater beaker.
4. Place the beakers with the red salt solution and the blue freshwater in the refrigerator. Refrigerate them for 30 min.
5. Measure and record the temperature of the water in all four beakers.
6. Put several drops of the cold, red salt water into the beaker with the warm, yellow salt water and observe what happens. Record your observations.
7. Put several drops of the cold, blue freshwater into the beaker with the warm, clear freshwater and observe what happens. Record your observations.
8. Put several drops of the cold, blue freshwater into the beaker with the warm, yellow salt water and observe what happens. Record your observations.
Analyze and Conclude1. Describe the movement of the cold, red salt water in
Step 6. Compare this to the movement of the cold, blue freshwater in Step 8. What accounts for the dif-ferences you observed?
2. Identify the water samples by color in order of increasing density.
3. Explain If you poured the four water samples into the graduated cylinder, how would they arrange themselves into layers by color, from top to bottom?
4. Construct Assume that four water masses in a large body of water have the same characteristics as the water in the four beakers. The warm water layers are 100 m thick, and the cold layers are 1000 m thick. Construct a graph that shows the temperature profile of the large body of water.
Model Water Masses
APPLY YOUR SKILLInfer The temperature profile above was constructed from measurements taken in the Atlantic Ocean off the coast of Spain. Study the profile, then infer why a high-temperature layer exists beneath the thermocline. Is this layer denser than the colder water above? Explain.
0429_ESGEU_S_C15_LAB_658713.indd 4290429_ESGEU_S_C15_LAB_658713.indd 429 2/12/11 11:42 AM2/12/11 11:42 AM
430 Chapter 15 • Assessment 430 Chapter 11 • Study Guide Vocabulary Practice
Download quizzes, key terms, and flash cards from glencoe.com.
430 Chapter 15 • Study Guide
Vocabulary Practice
SECTION 1 An Overview of Oceans VOCABULARY• side-scan sonar• sea level
The global ocean consists of one vast body of water that covers more than two-thirds of Earth’s surface.
• Scientists use many different instruments to collect and analyze data from oceans.
• Scientists have several ideas as to where the water in Earth’s oceans originated.
• A large portion of Earth’s surface is covered by ocean.• Earth’s oceans are the Pacific, the Atlantic, the Indian, the Arctic, and the
Southern.
SECTION 2 SeawaterVOCABULARY• salinity• estuary• temperature profile• thermocline
Oceans have distinct layers of water masses that are character-ized by temperature and salinity.
• Ocean water contains dissolved gases, nutrients, and salts.• Salts are added to and removed from oceans through natural processes.• Properties of ocean water, including temperature and salinity, vary with
location and depth.• Many of the oceans’ deepwater masses sink from the surface of polar
oceans.
SECTION 3 Ocean MovementsVOCABULARY• wave• crest• trough• breaker• tide• spring tide• neap tide• surface current• upwelling• density current
Waves and currents drive the movements of ocean water and lead to the distribution of heat, salt, and nutrients from one region of the ocean to another.
• Energy moves through ocean water in the form of waves.• Tides are influenced by both the Moon and the Sun.• Surface currents circulate in gyres in the major ocean basins.• Vertical currents in the ocean include density currents and upwelli ng.
Studying oceans helps scientists learn about global climate and Earth’s history.
STUDY GUIDECHAPTER 15
0430_0433_ESGEU_S_C15_CA_658713.indd 4300430_0433_ESGEU_S_C15_CA_658713.indd 430 2/12/11 11:42 AM2/12/11 11:42 AM
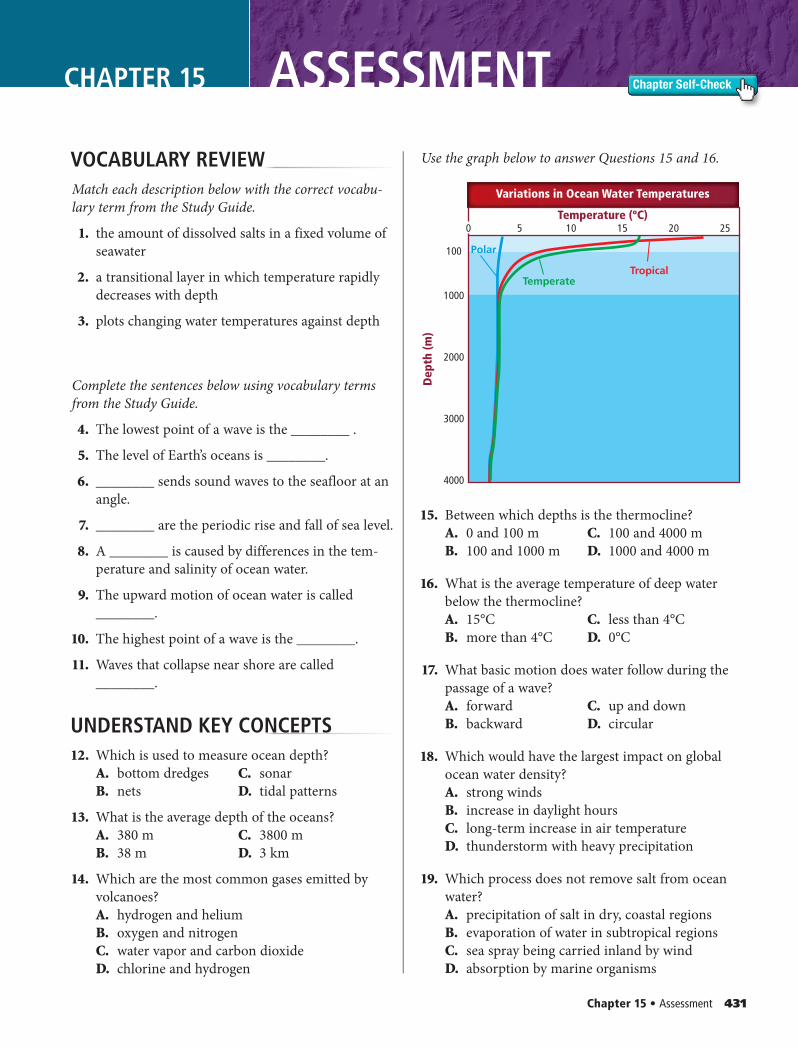
Chapter 15 • Assessment 431
Chapter Self-Check
50 10
100
1000
2000
3000
4000
15 2520
Dep
th (m
)
Temperature (ºC)
Polar
Variations in Ocean Water Temperatures
TemperateTropical
CHAPTER 15 ASSESSMENT
VOC ABULARY REVIEWMatch each description below with the correct vocabu-lary term from the Study Guide.
1. the amount of dissolved salts in a fixed volume of seawater
2. a transitional layer in which temperature rapidly decreases with depth
3. plots changing water temperatures against depth
Complete the sentences below using vocabulary terms from the Study Guide.
4. The lowest point of a wave is the ________ .
5. The level of Earth’s oceans is ________.
6. ________ sends sound waves to the seafloor at an angle.
7. ________ are the periodic rise and fall of sea level.
8. A ________ is caused by differences in the tem-perature and salinity of ocean water.
9. The upward motion of ocean water is called ________.
10. The highest point of a wave is the ________.
11. Waves that collapse near shore are called ________.
UNDERSTAND KEY CONCEPTS 12. Which is used to measure ocean depth?
A. bottom dredges C. sonarB. nets D. tidal patterns
13. What is the average depth of the oceans?A. 380 m C. 3800 mB. 38 m D. 3 km
14. Which are the most common gases emitted by volcanoes?A. hydrogen and heliumB. oxygen and nitrogenC. water vapor and carbon dioxideD. chlorine and hydrogen
Use the graph below to answer Questions 15 and 16.
15. Between which depths is the thermocline?A. 0 and 100 m C. 100 and 4000 mB. 100 and 1000 m D. 1000 and 4000 m
16. What is the average temperature of deep water below the thermocline?A. 15°C C. less than 4°CB. more than 4°C D. 0°C
17. What basic motion does water follow during the passage of a wave?A. forward C. up and downB. backward D. circular
18. Which would have the largest impact on global ocean water density?A. strong windsB. increase in daylight hoursC. long-term increase in air temperatureD. thunderstorm with heavy precipitation
19. Which process does not remove salt from ocean water?A. precipitation of salt in dry, coastal regionsB. evaporation of water in subtropical regionsC. sea spray being carried inland by windD. absorption by marine organisms
0430_0433_ESGEU_S_C15_CA_658713.indd 4310430_0433_ESGEU_S_C15_CA_658713.indd 431 2/12/11 11:42 AM2/12/11 11:42 AM
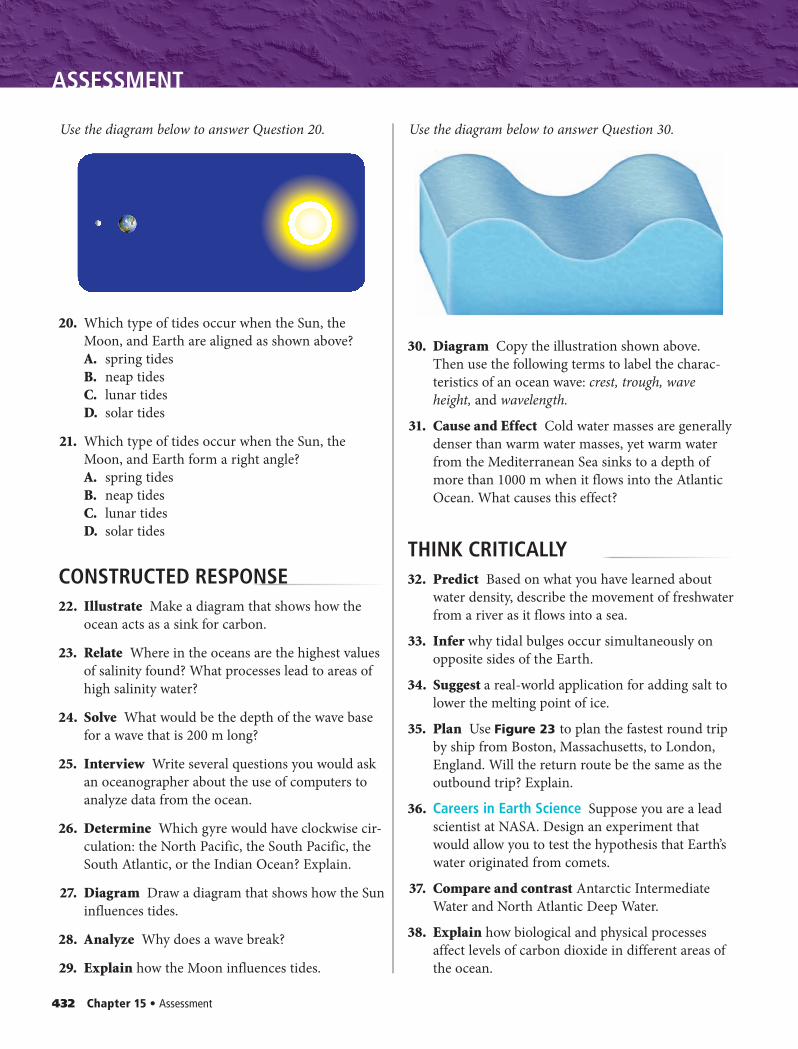
432 Chapter 15 • Assessment
ASSESSMENT
Use the diagram below to answer Question 20.
20. Which type of tides occur when the Sun, the Moon, and Earth are aligned as shown above?A. spring tidesB. neap tidesC. lunar tidesD. solar tides
21. Which type of tides occur when the Sun, the Moon, and Earth form a right angle?A. spring tidesB. neap tidesC. lunar tidesD. solar tides
CONSTRUCTED RESPONSE 22. Illustrate Make a diagram that shows how the
ocean acts as a sink for carbon.
23. Relate Where in the oceans are the highest values of salinity found? What processes lead to areas of high salinity water?
24. Solve What would be the depth of the wave base for a wave that is 200 m long?
25. Interview Write several questions you would ask an oceanographer about the use of computers to analyze data from the ocean.
26. Determine Which gyre would have clockwise cir-culation: the North Pacific, the South Pacific, the South Atlantic, or the Indian Ocean? Explain.
27. Diagram Draw a diagram that shows how the Sun influences tides.
28. Analyze Why does a wave break?
29. Explain how the Moon influences tides.
Use the diagram below to answer Question 30.
30. Diagram Copy the illustration shown above. Then use the following terms to label the charac-teristics of an ocean wave: crest, trough, wave height, and wavelength.
31. Cause and Effect Cold water masses are generally denser than warm water masses, yet warm water from the Mediterranean Sea sinks to a depth of more than 1000 m when it flows into the Atlantic Ocean. What causes this effect?
THINK CRITICALLY 32. Predict Based on what you have learned about
water density, describe the movement of freshwater from a river as it flows into a sea.
33. Infer why tidal bulges occur simultaneously on opposite sides of the Earth.
34. Suggest a real-world application for adding salt to lower the melting point of ice.
35. Plan Use Figure 23 to plan the fastest round trip by ship from Boston, Massachusetts, to London, England. Will the return route be the same as the outbound trip? Explain.
36. Careers in Earth Science Suppose you are a lead scientist at NASA. Design an experiment that would allow you to test the hypothesis that Earth’s water originated from comets.
37. Compare and contrast Antarctic Intermediate Water and North Atlantic Deep Water.
38. Explain how biological and physical processes affect levels of carbon dioxide in different areas of the ocean.
0430_0433_ESGEU_S_C15_CA_658713.indd 4320430_0433_ESGEU_S_C15_CA_658713.indd 432 2/12/11 11:42 AM2/12/11 11:42 AM
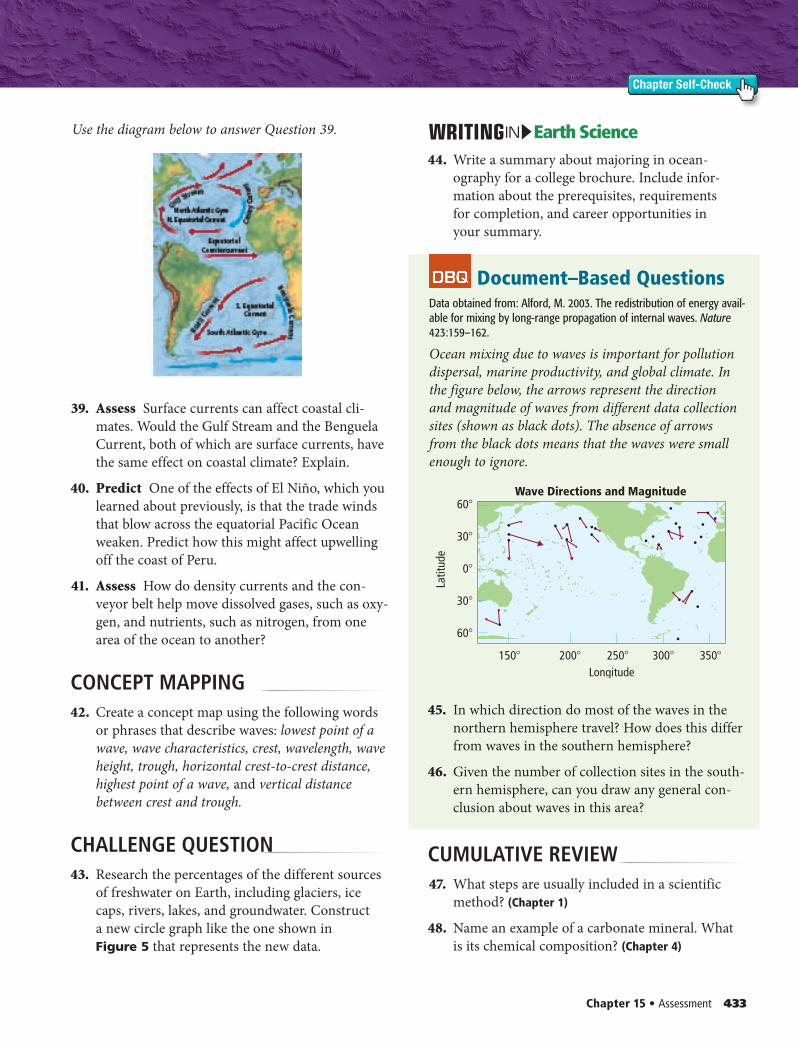
Chapter 15 • Assessment 433
Chapter Self-Check
Use the diagram below to answer Question 39.
39. Assess Surface currents can affect coastal cli-mates. Would the Gulf Stream and the Benguela Current, both of which are surface currents, have the same effect on coastal climate? Explain.
40. Predict One of the effects of El Niño, which you learned about previously, is that the trade winds that blow across the equatorial Pacific Ocean weaken. Predict how this might affect upwelling off the coast of Peru.
41. Assess How do density currents and the con-veyor belt help move dissolved gases, such as oxy-gen, and nutrients, such as nitrogen, from one area of the ocean to another?
CONCEPT MAPPING 42. Create a concept map using the following words
or phrases that describe waves: lowest point of a wave, wave characteristics, crest, wavelength, wave height, trough, horizontal crest-to-crest distance, highest point of a wave, and vertical distance between crest and trough.
CHALLENGE QUESTION 43. Research the percentages of the different sources
of freshwater on Earth, including glaciers, ice caps, rivers, lakes, and groundwater. Construct a new circle graph like the one shown in Figure 5 that represents the new data.
0
30
30
60Wave Directions and Magnitude
60
200 250Longitude
Latit
ude
300 350150
Earth ScienceIN
44. Write a summary about majoring in ocean-ography for a college brochure. Include infor-mation about the prerequisites, requirements for completion, and career opportunities in your summary.
Document–Based QuestionsData obtained from: Alford, M. 2003. The redistribution of energy avail-able for mixing by long-range propagation of internal waves. Nature 423:159–162.
Ocean mixing due to waves is important for pollution dispersal, marine productivity, and global climate. In the figure below, the arrows represent the direction and magnitude of waves from different data collection sites (shown as black dots). The absence of arrows from the black dots means that the waves were small enough to ignore.
45. In which direction do most of the waves in the northern hemisphere travel? How does this differ from waves in the southern hemisphere?
46. Given the number of collection sites in the south-ern hemisphere, can you draw any general con-clusion about waves in this area?
CUMULATIVE REVIEW 47. What steps are usually included in a scientific
method? (Chapter 1)
48. Name an example of a carbonate mineral. What is its chemical composition? (Chapter 4)
0430_0433_ESGEU_S_C15_CA_658713.indd 4330430_0433_ESGEU_S_C15_CA_658713.indd 433 2/12/11 11:42 AM2/12/11 11:42 AM
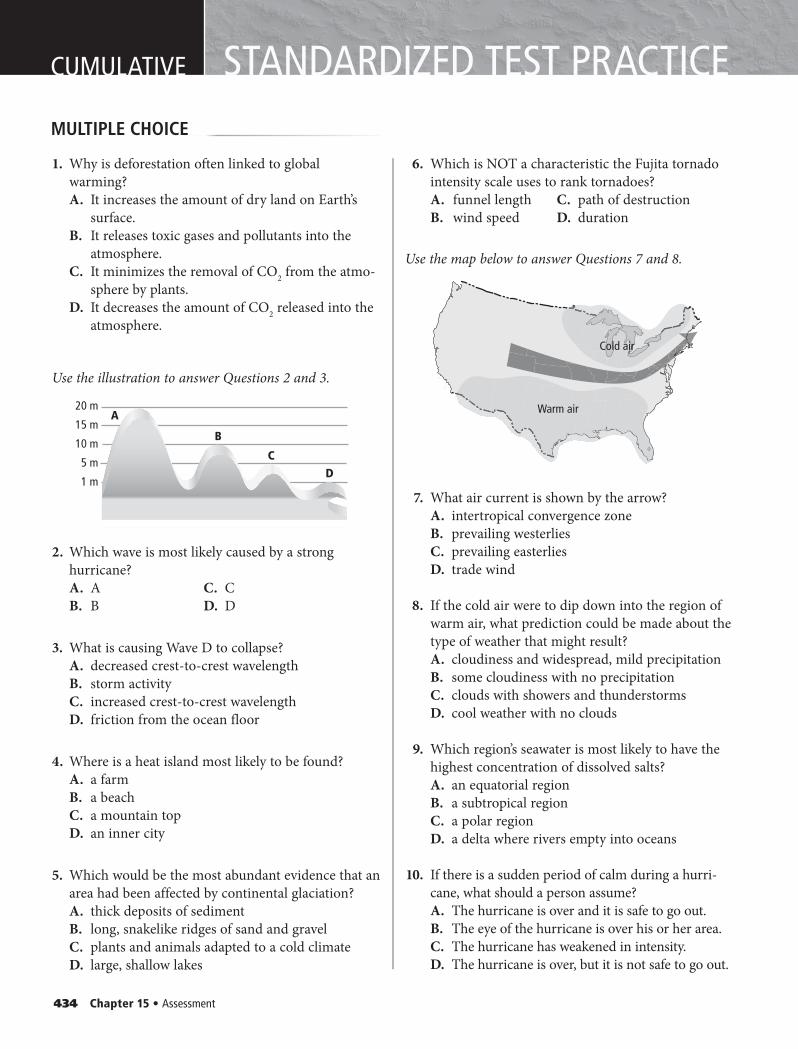
434 Chapter 15 • Assessment
CUMULATIVE STANDARDIZED TEST PRACTICEMULTIPLE CHOICE
1. Why is deforestation often linked to global warming?A. It increases the amount of dry land on Earth’s
surface.B. It releases toxic gases and pollutants into the
atmosphere.C. It minimizes the removal of CO2 from the atmo-
sphere by plants.D. It decreases the amount of CO2 released into the
atmosphere.
Use the illustration to answer Questions 2 and 3.
2. Which wave is most likely caused by a strong hurricane?A. A C. CB. B D. D
3. What is causing Wave D to collapse?A. decreased crest-to-crest wavelengthB. storm activityC. increased crest-to-crest wavelengthD. friction from the ocean floor
4. Where is a heat island most likely to be found?A. a farmB. a beachC. a mountain topD. an inner city
5. Which would be the most abundant evidence that an area had been affected by continental glaciation?A. thick deposits of sedimentB. long, snakelike ridges of sand and gravelC. plants and animals adapted to a cold climateD. large, shallow lakes
6. Which is NOT a characteristic the Fujita tornado intensity scale uses to rank tornadoes?A. funnel length C. path of destructionB. wind speed D. duration
Use the map below to answer Questions 7 and 8.
7. What air current is shown by the arrow?A. intertropical convergence zoneB. prevailing westerliesC. prevailing easterliesD. trade wind
8. If the cold air were to dip down into the region of warm air, what prediction could be made about the type of weather that might result?A. cloudiness and widespread, mild precipitationB. some cloudiness with no precipitationC. clouds with showers and thunderstormsD. cool weather with no clouds
9. Which region’s seawater is most likely to have the highest concentration of dissolved salts?A. an equatorial regionB. a subtropical regionC. a polar regionD. a delta where rivers empty into oceans
10. If there is a sudden period of calm during a hurri-cane, what should a person assume?A. The hurricane is over and it is safe to go out.B. The eye of the hurricane is over his or her area.C. The hurricane has weakened in intensity.D. The hurricane is over, but it is not safe to go out.
A
B
CD
20 m
15 m
10 m
5 m
1 m
Cold air
Warm air
0434_0435_ESGEU_S_C15_STP_658713.indd 4340434_0435_ESGEU_S_C15_STP_658713.indd 434 2/12/11 11:42 AM2/12/11 11:42 AM
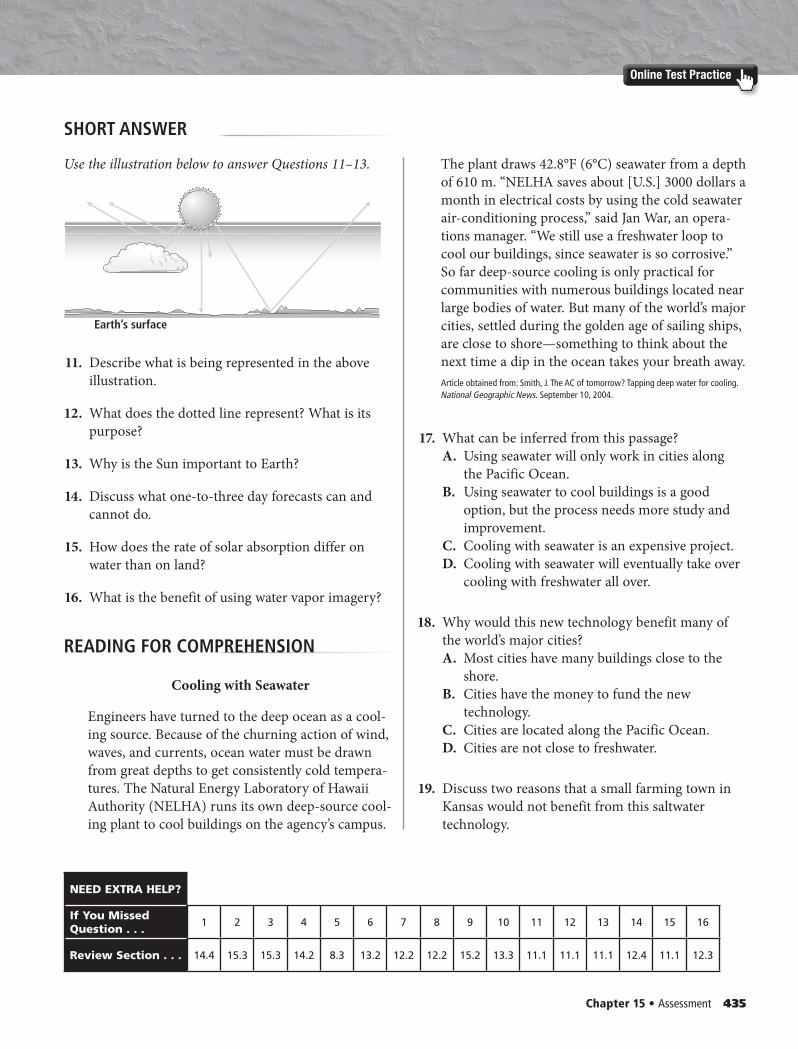
Chapter 15 • Assessment 435
Online Test Practice
SHORT ANSWER
READING FOR COMPREHENSION
NEED EXTRA HELP?
If You Missed Question . . .
1 2 3 4 5 6 7 8 9 10 11 12 13 14 15 16
Review Section . . . 14.4 15.3 15.3 14.2 8.3 13.2 12.2 12.2 15.2 13.3 11.1 11.1 11.1 12.4 11.1 12.3
Use the illustration below to answer Questions 11–13.
11. Describe what is being represented in the above illustration.
12. What does the dotted line represent? What is its purpose?
13. Why is the Sun important to Earth?
14. Discuss what one-to-three day forecasts can and cannot do.
15. How does the rate of solar absorption differ on water than on land?
16. What is the benefit of using water vapor imagery?
Cooling with Seawater
Engineers have turned to the deep ocean as a cool-ing source. Because of the churning action of wind, waves, and currents, ocean water must be drawn from great depths to get consistently cold tempera-tures. The Natural Energy Laboratory of Hawaii Authority (NELHA) runs its own deep-source cool-ing plant to cool buildings on the agency’s campus.
The plant draws 42.8°F (6°C) seawater from a depth of 610 m. “NELHA saves about [U.S.] 3000 dollars a month in electrical costs by using the cold seawater air-conditioning process,” said Jan War, an opera-tions manager. “We still use a freshwater loop to cool our buildings, since seawater is so corrosive.” So far deep-source cooling is only practical for communities with numerous buildings located near large bodies of water. But many of the world’s major cities, settled during the golden age of sailing ships, are close to shore—something to think about the next time a dip in the ocean takes your breath away. Article obtained from: Smith, J. The AC of tomorrow? Tapping deep water for cooling. National Geographic News. September 10, 2004.
17. What can be inferred from this passage?A. Using seawater will only work in cities along
the Pacific Ocean.B. Using seawater to cool buildings is a good
option, but the process needs more study and improvement.
C. Cooling with seawater is an expensive project.D. Cooling with seawater will eventually take over
cooling with freshwater all over.
18. Why would this new technology benefit many of the world’s major cities?A. Most cities have many buildings close to the
shore.B. Cities have the money to fund the new
technology.C. Cities are located along the Pacific Ocean.D. Cities are not close to freshwater.
19. Discuss two reasons that a small farming town in Kansas would not benefit from this saltwater technology.
Earth’s surface
0434_0435_ESGEU_S_C15_STP_658713.indd 4350434_0435_ESGEU_S_C15_STP_658713.indd 435 2/12/11 11:42 AM2/12/11 11:42 AM
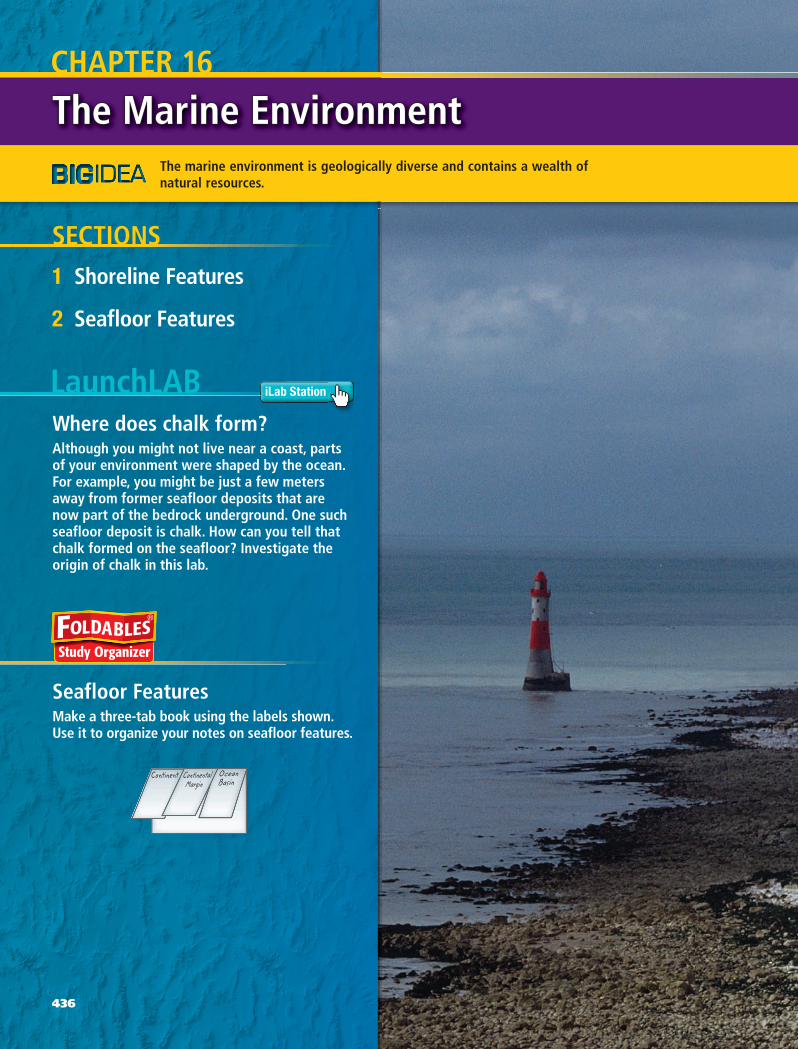
Continent OceanBasin
ContinentalMargin
The Marine EnvironmentThe Marine EnvironmentCHAPTER 16
Seafloor FeaturesMake a three-tab book using the labels shown. Use it to organize your notes on seafloor features.
Where does chalk form?Although you might not live near a coast, parts of your environment were shaped by the ocean. For example, you might be just a few meters away from former seafloor deposits that are now part of the bedrock underground. One such seafloor deposit is chalk. How can you tell that chalk formed on the seafloor? Investigate the origin of chalk in this lab.
LaunchLAB
1 Shoreline Features
2 Seafloor Features
SECTIONS
The marine environment is geologically diverse and contains a wealth of natural resources.
iLab Station
436
0436_0437_ESGEU_S_C16_CO_658713.indd 4360436_0437_ESGEU_S_C16_CO_658713.indd 436 2/18/11 11:17 AM2/18/11 11:17 AM
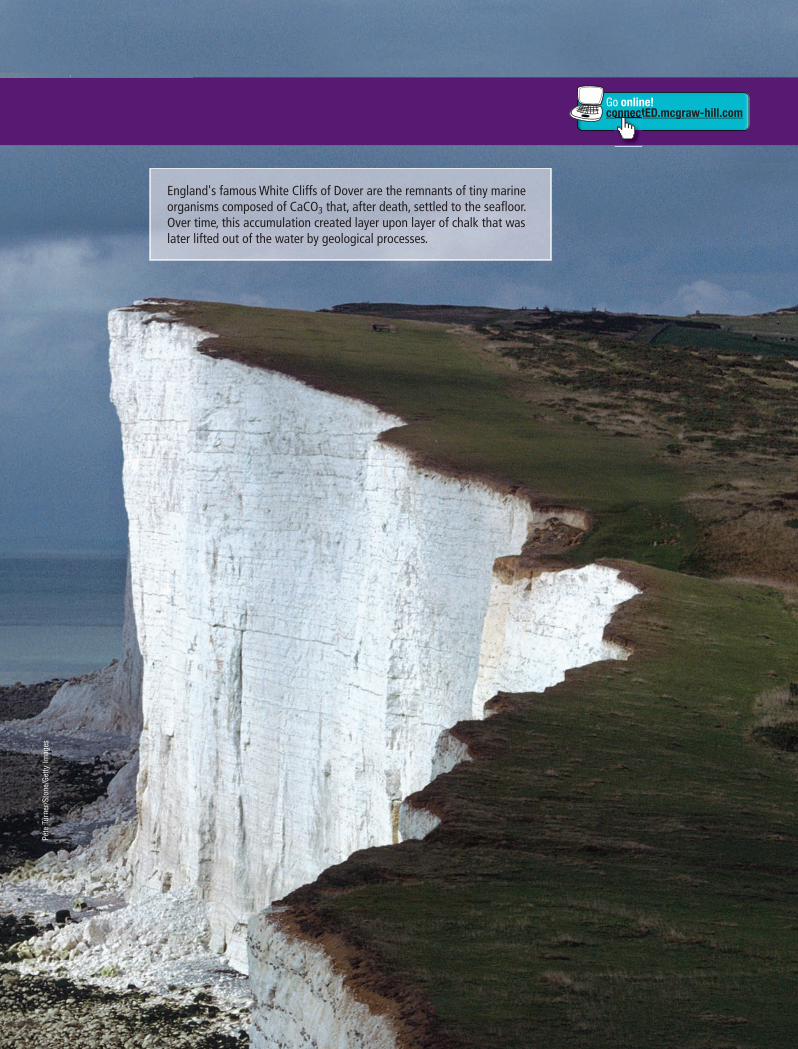
England's famous White Cliffs of Dover are the remnants of tiny marine organisms composed of CaCO3 that, after death, settled to the seafl oor. Over time, this accumulation created layer upon layer of chalk that was later lifted out of the water by geological processes.
Go online!connectED.mcgraw-hill.comonnect
Pete
Tur
ner/S
tone
/Get
ty Im
ages
0436_0437_ESGEU_S_C16_CO_658713.indd 4370436_0437_ESGEU_S_C16_CO_658713.indd 437 2/18/11 11:18 AM2/18/11 11:18 AM
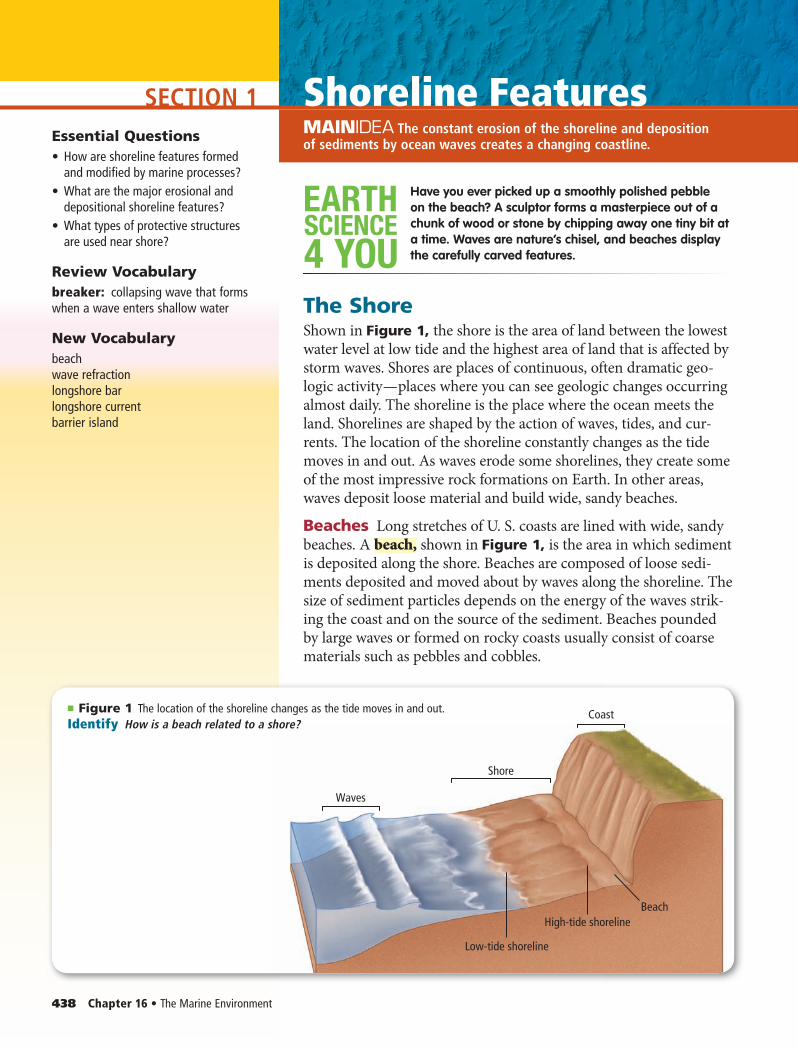
SECTION 1 Shoreline FeaturesMAINIDEA The constant erosion of the shoreline and deposition of sediments by ocean waves creates a changing coastline.
SCIENCE
4 YOU
EARTH Have you ever picked up a smoothly polished pebble on the beach? A sculptor forms a masterpiece out of a chunk of wood or stone by chipping away one tiny bit at a time. Waves are nature’s chisel, and beaches display the carefully carved features.
The ShoreShown in Figure 1, the shore is the area of land between the lowest water level at low tide and the highest area of land that is affected by storm waves. Shores are places of continuous, often dramatic geo-logic activity — places where you can see geologic changes occurring almost daily. The shoreline is the place where the ocean meets the land. Shorelines are shaped by the action of waves, tides, and cur-rents. The location of the shoreline constantly changes as the tide moves in and out. As waves erode some shorelines, they create some of the most impressive rock formations on Earth. In other areas, waves deposit loose material and build wide, sandy beaches.
Beaches Long stretches of U. S. coasts are lined with wide, sandy beaches. A beach, shown in Figure 1, is the area in which sediment is deposited along the shore. Beaches are composed of loose sedi-ments deposited and moved about by waves along the shoreline. The size of sediment particles depends on the energy of the waves strik-ing the coast and on the source of the sediment. Beaches pounded by large waves or formed on rocky coasts usually consist of coarse materials such as pebbles and cobbles.
Essential Questions• How are shoreline features formed
and modified by marine processes?• What are the major erosional and
depositional shoreline features?• What types of protective structures
are used near shore?
Review Vocabularybreaker: collapsing wave that forms when a wave enters shallow water
New Vocabularybeachwave refractionlongshore barlongshore currentbarrier island
Coast
Shore
Low-tide shoreline
High-tide shorelineBeach
Waves
■ Figure 1 The location of the shoreline changes as the tide moves in and out.Identify How is a beach related to a shore?
438 Chapter 16 • The Marine Environment
0438_0446_ESGEU_S_C16_S1_658713.indd 4380438_0446_ESGEU_S_C16_S1_658713.indd 438 2/16/11 12:08 PM2/16/11 12:08 PM
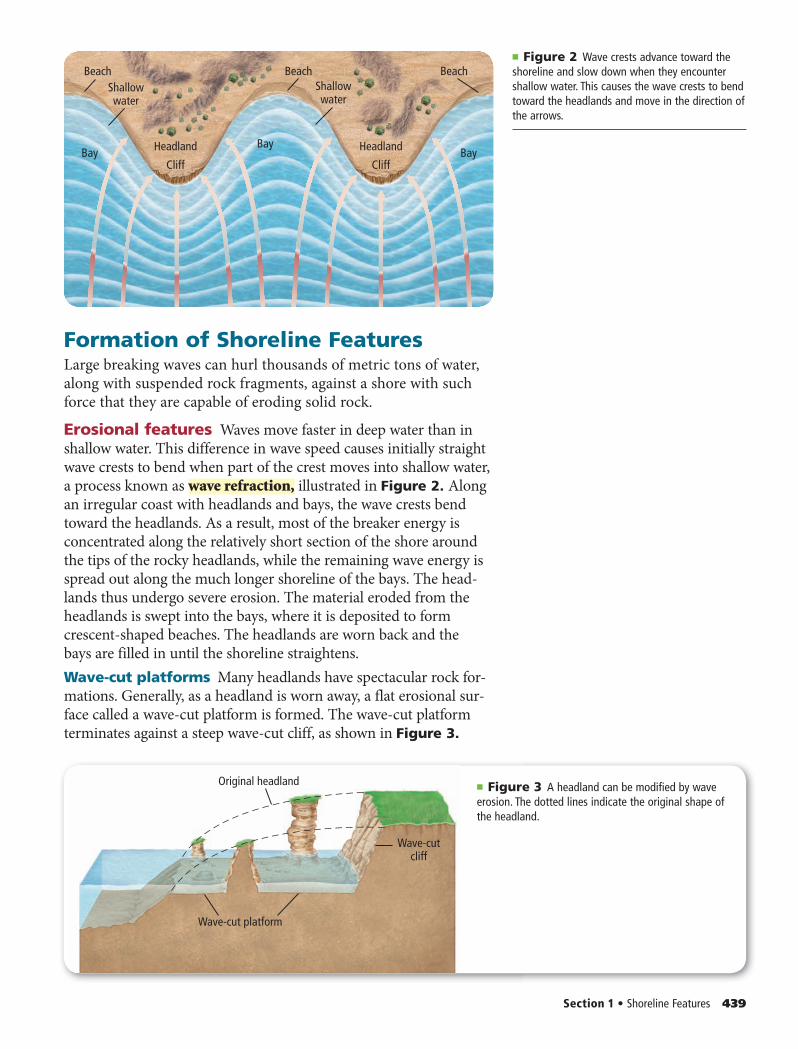
Beach BeachBeach
Cliff Cliff
Shallowwater
Headland Headland
Shallowwater
BayBay
Bay
■ Figure 2 Wave crests advance toward the shoreline and slow down when they encounter shallow water. This causes the wave crests to bend toward the headlands and move in the direction of the arrows.
Original headland
Wave-cut platform
Wave-cutcliff
■ Figure 3 A headland can be modified by wave erosion. The dotted lines indicate the original shape of the headland.
Formation of Shoreline FeaturesLarge breaking waves can hurl thousands of metric tons of water, along with suspended rock fragments, against a shore with such force that they are capable of eroding solid rock.
Erosional features Waves move faster in deep water than in shallow water. This difference in wave speed causes initially straight wave crests to bend when part of the crest moves into shallow water, a process known as wave refraction, illustrated in Figure 2. Along an irregular coast with headlands and bays, the wave crests bend toward the headlands. As a result, most of the breaker energy is concentrated along the relatively short section of the shore around the tips of the rocky headlands, while the remaining wave energy is spread out along the much longer shoreline of the bays. The head-lands thus undergo severe erosion. The material eroded from the headlands is swept into the bays, where it is deposited to form crescent-shaped beaches. The headlands are worn back and the bays are filled in until the shoreline straightens. Wave-cut platforms Many headlands have spectacular rock for-mations. Generally, as a headland is worn away, a flat erosional sur-face called a wave-cut platform is formed. The wave-cut platform terminates against a steep wave-cut cliff, as shown in Figure 3.
Section 1 • Shoreline Features 439
0438_0446_ESGEU_S_C16_S1_658713.indd 4390438_0446_ESGEU_S_C16_S1_658713.indd 439 2/16/11 12:08 PM2/16/11 12:08 PM
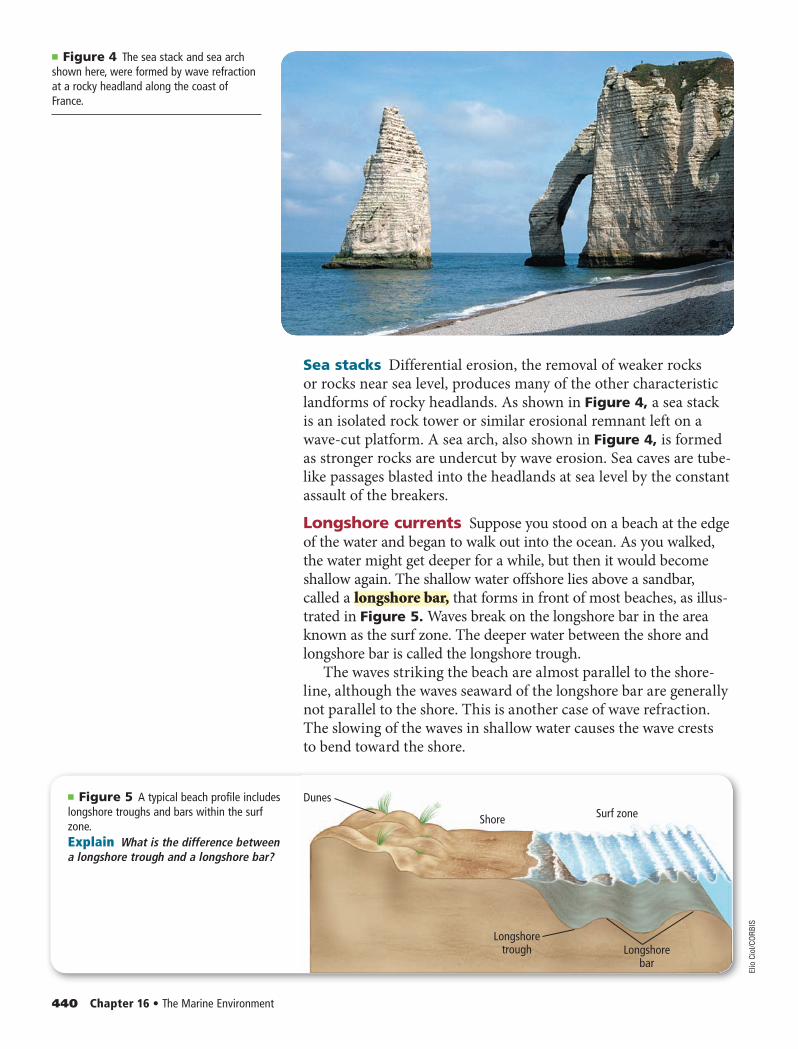
■ Figure 4 The sea stack and sea arch shown here, were formed by wave refraction at a rocky headland along the coast of France.
Longshoretrough Longshore
bar
Surf zoneShore
Dunes■ Figure 5 A typical beach profile includes longshore troughs and bars within the surf zone.Explain What is the difference between a longshore trough and a longshore bar?
440 Chapter 16 • The Marine Environment
Sea stacks Differential erosion, the removal of weaker rocks or rocks near sea level, produces many of the other characteristic landforms of rocky headlands. As shown in Figure 4, a sea stack is an isolated rock tower or similar erosional remnant left on a wave-cut platform. A sea arch, also shown in Figure 4, is formed as stronger rocks are undercut by wave erosion. Sea caves are tube-like passages blasted into the headlands at sea level by the constant assault of the breakers.
Longshore currents Suppose you stood on a beach at the edge of the water and began to walk out into the ocean. As you walked, the water might get deeper for a while, but then it would become shallow again. The shallow water offshore lies above a sandbar, called a longshore bar, that forms in front of most beaches, as illus-trated in Figure 5. Waves break on the longshore bar in the area known as the surf zone. The deeper water between the shore and longshore bar is called the longshore trough.
The waves striking the beach are almost parallel to the shore-line, although the waves seaward of the longshore bar are generally not parallel to the shore. This is another case of wave refraction. The slowing of the waves in shallow water causes the wave crests to bend toward the shore.
Elio
Cio
l/COR
BIS
0438_0446_ESGEU_S_C16_S1_658713.indd 4400438_0446_ESGEU_S_C16_S1_658713.indd 440 2/16/11 12:08 PM2/16/11 12:08 PM
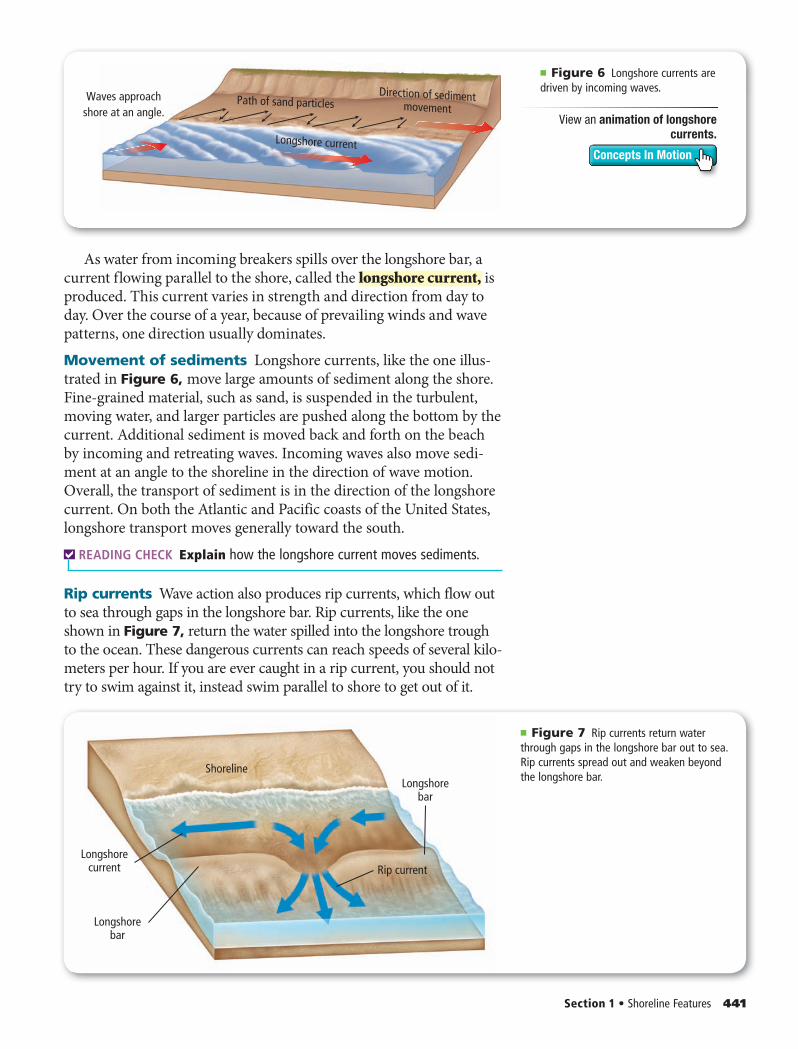
Waves approachshore at an angle.
Path of sand particlesDirection of sediment
movement
Longshore current
Section 1 • Shoreline Features 441
As water from incoming breakers spills over the longshore bar, a current flowing parallel to the shore, called the longshore current, is produced. This current varies in strength and direction from day to day. Over the course of a year, because of prevailing winds and wave patterns, one direction usually dominates.Movement of sediments Longshore currents, like the one illus-trated in Figure 6, move large amounts of sediment along the shore. Fine-grained material, such as sand, is suspended in the turbulent, moving water, and larger particles are pushed along the bottom by the current. Additional sediment is moved back and forth on the beach by incoming and retreating waves. Incoming waves also move sedi-ment at an angle to the shoreline in the direction of wave motion. Overall, the transport of sediment is in the direction of the longshore current. On both the Atlantic and Pacific coasts of the United States, longshore transport moves generally toward the south.
READING CHECK Explain how the longshore current moves sediments.
Rip currents Wave action also produces rip currents, which flow out to sea through gaps in the longshore bar. Rip currents, like the one shown in Figure 7, return the water spilled into the longshore trough to the ocean. These dangerous currents can reach speeds of several kilo-meters per hour. If you are ever caught in a rip current, you should not try to swim against it, instead swim parallel to shore to get out of it.
■ Figure 6 Longshore currents are driven by incoming waves.
ShorelineLongshore
bar
Longshorebar
Longshorecurrent Rip current
■ Figure 7 Rip currents return water through gaps in the longshore bar out to sea. Rip currents spread out and weaken beyond the longshore bar.
View an animation of longshore
currents.
Concepts In Motion
0438_0446_ESGEU_S_C16_S1_658713.indd 4410438_0446_ESGEU_S_C16_S1_658713.indd 441 2/16/11 12:08 PM2/16/11 12:08 PM
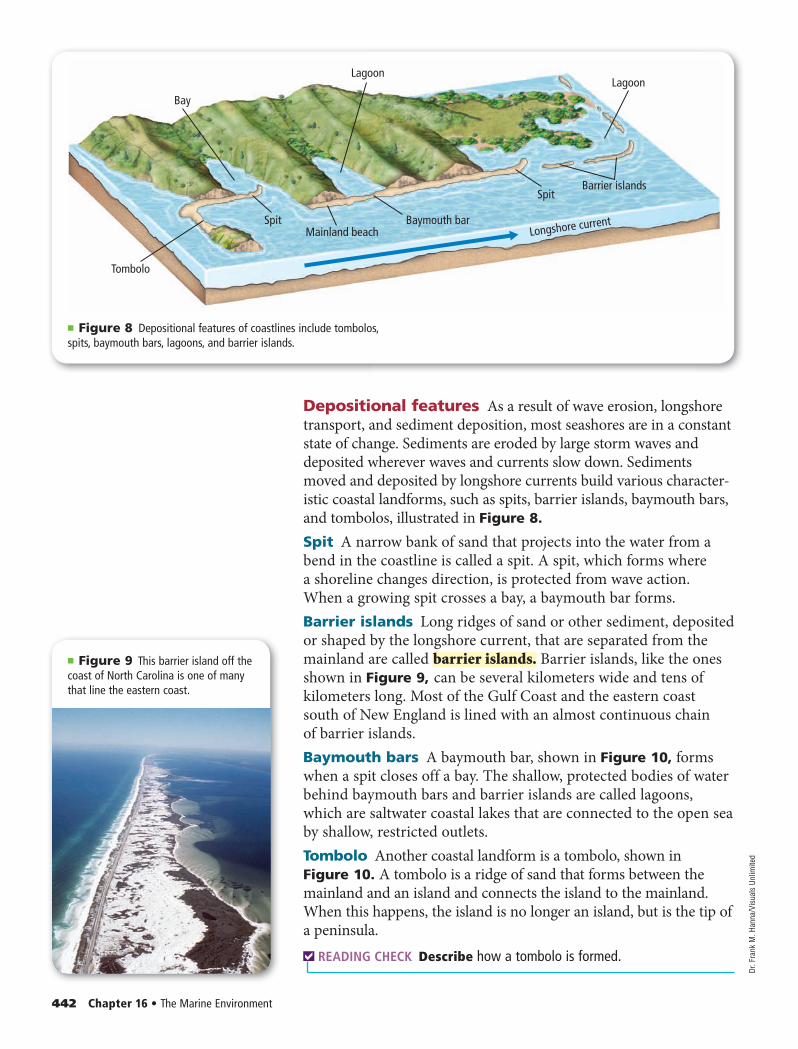
Bay
LagoonLagoon
Barrier islands
Mainland beachSpit
Tombolo
Spit
Longshore currentBaymouth bar
■ Figure 8 Depositional features of coastlines include tombolos,spits, baymouth bars, lagoons, and barrier islands.
■ Figure 9 This barrier island off the coast of North Carolina is one of many that line the eastern coast.
442 Chapter 16 • The Marine Environment
Depositional features As a result of wave erosion, longshore transport, and sediment deposition, most seashores are in a constant state of change. Sediments are eroded by large storm waves and deposited wherever waves and currents slow down. Sediments moved and deposited by longshore currents build various character-istic coastal landforms, such as spits, barrier islands, baymouth bars, and tombolos, illustrated in Figure 8.
Spit A narrow bank of sand that projects into the water from a bend in the coastline is called a spit. A spit, which forms where a shoreline changes direction, is protected from wave action. When a growing spit crosses a bay, a baymouth bar forms.Barrier islands Long ridges of sand or other sediment, deposited or shaped by the longshore current, that are separated from the mainland are called barrier islands. Barrier islands, like the ones shown in Figure 9, can be several kilometers wide and tens of kilometers long. Most of the Gulf Coast and the eastern coast south of New England is lined with an almost continuous chain of barrier islands.Baymouth bars A baymouth bar, shown in Figure 10, forms when a spit closes off a bay. The shallow, protected bodies of water behind baymouth bars and barrier islands are called lagoons, which are saltwater coastal lakes that are connected to the open sea by shallow, restricted outlets.Tombolo Another coastal landform is a tombolo, shown in Figure 10. A tombolo is a ridge of sand that forms between the mainland and an island and connects the island to the mainland. When this happens, the island is no longer an island, but is the tip of a peninsula.
READING CHECK Describe how a tombolo is formed.
Dr. F
rank
M. H
anna
/Vis
uals
Unl
imite
d
0438_0446_ESGEU_S_C16_S1_658713.indd 4420438_0446_ESGEU_S_C16_S1_658713.indd 442 2/16/11 12:08 PM2/16/11 12:08 PM
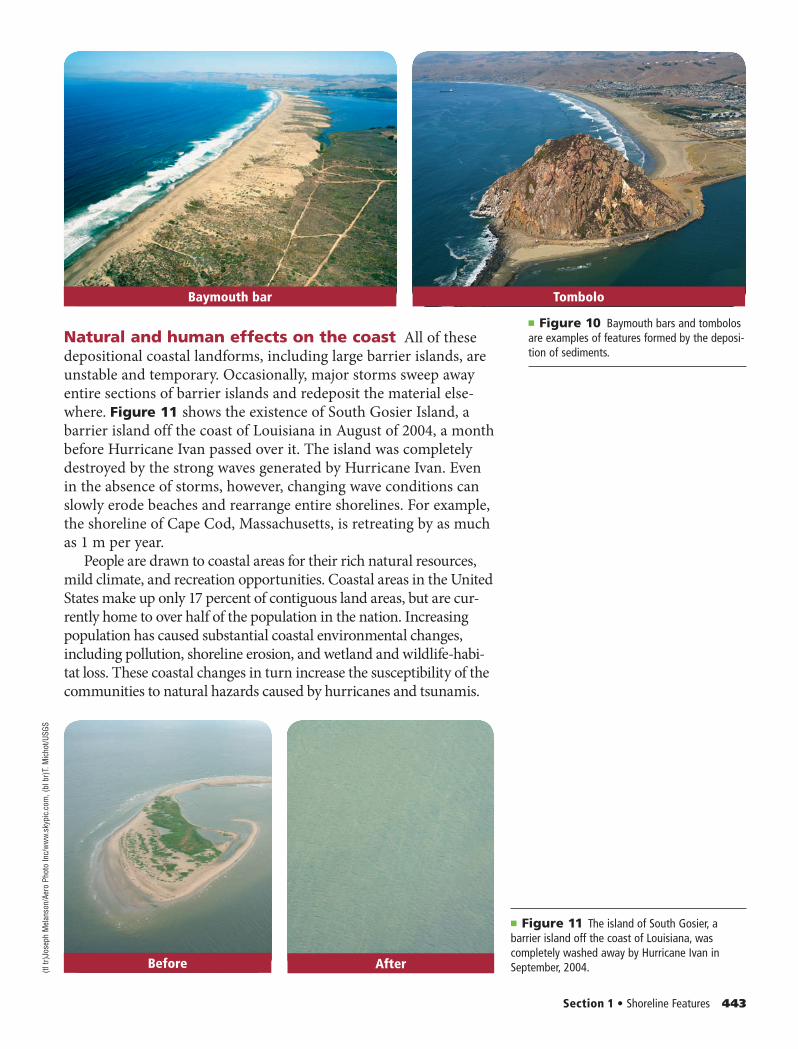
■ Figure 10 Baymouth bars and tombolos are examples of features formed by the deposi-tion of sediments.
■ Figure 11 The island of South Gosier, a barrier island off the coast of Louisiana, was completely washed away by Hurricane Ivan in September, 2004.
Section 1 • Shoreline Features 443
Natural and human effects on the coast All of these depositional coastal landforms, including large barrier islands, are unstable and temporary. Occasionally, major storms sweep away entire sections of barrier islands and redeposit the material else-where. Figure 11 shows the existence of South Gosier Island, a barrier island off the coast of Louisiana in August of 2004, a month before Hurricane Ivan passed over it. The island was completely destroyed by the strong waves generated by Hurricane Ivan. Even in the absence of storms, however, changing wave conditions can slowly erode beaches and rearrange entire shorelines. For example, the shoreline of Cape Cod, Massachusetts, is retreating by as much as 1 m per year.
People are drawn to coastal areas for their rich natural resources, mild climate, and recreation opportunities. Coastal areas in the United States make up only 17 percent of contiguous land areas, but are cur-rently home to over half of the population in the nation. Increasing population has caused substantial coastal environmental changes, including pollution, shoreline erosion, and wetland and wildlife-habi-tat loss. These coastal changes in turn increase the susceptibility of the communities to natural hazards caused by hurricanes and tsunamis.
Before After
Baymouth bar Tombolo
(tl tr
)Jos
eph
Mel
anso
n/Ae
ro P
hoto
Inc/
ww
w.s
kypi
c.co
m , (
bl b
r)T.
Mic
hot/U
SGS
0438_0446_ESGEU_S_C16_S1_658713.indd 4430438_0446_ESGEU_S_C16_S1_658713.indd 443 2/16/11 12:08 PM2/16/11 12:08 PM
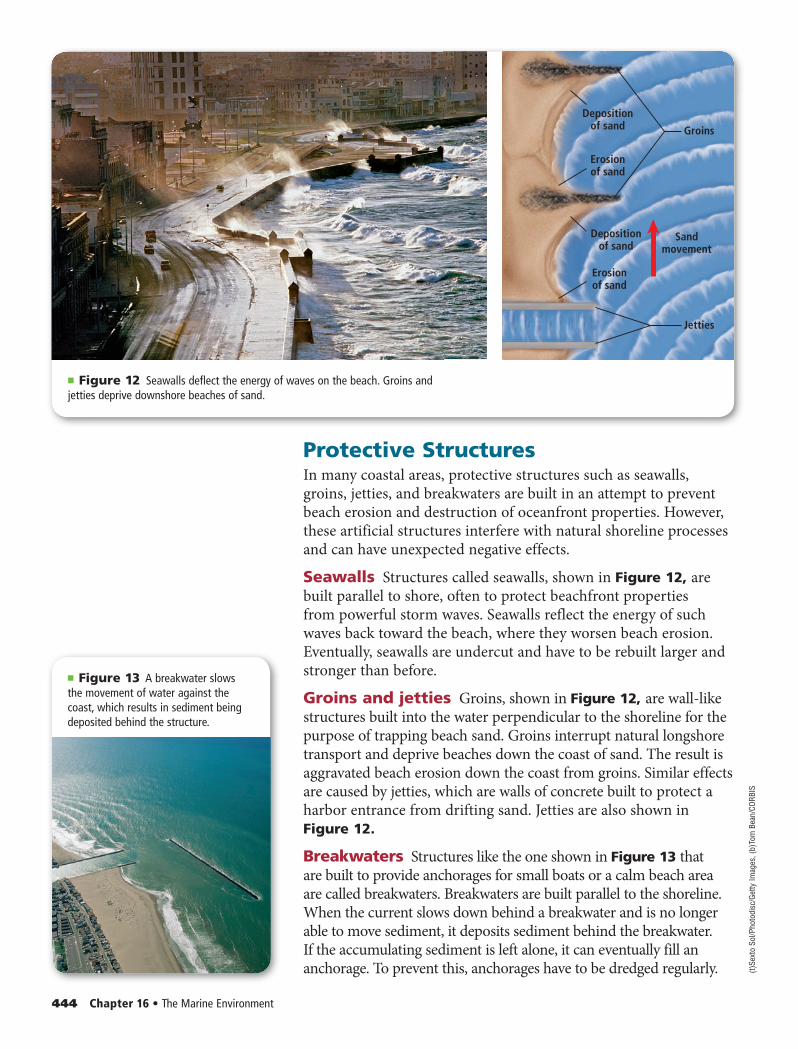
■ Figure 12 Seawalls deflect the energy of waves on the beach. Groins and jetties deprive downshore beaches of sand.
■ Figure 13 A breakwater slows the movement of water against the coast, which results in sediment being deposited behind the structure.
Groins
Depositionof sand
Erosionof sand
Jetties
Sandmovement
Depositionof sand
Erosionof sand
444 Chapter 16 • The Marine Environment
Protective StructuresIn many coastal areas, protective structures such as seawalls, groins, jetties, and breakwaters are built in an attempt to prevent beach erosion and destruction of oceanfront properties. However, these artificial structures interfere with natural shoreline processes and can have unexpected negative effects.
Seawalls Structures called seawalls, shown in Figure 12, are built parallel to shore, often to protect beachfront properties from powerful storm waves. Seawalls reflect the energy of such waves back toward the beach, where they worsen beach erosion. Eventually, seawalls are undercut and have to be rebuilt larger and stronger than before.
Groins and jetties Groins, shown in Figure 12, are wall-like structures built into the water perpendicular to the shoreline for the purpose of trapping beach sand. Groins interrupt natural longshore transport and deprive beaches down the coast of sand. The result is aggravated beach erosion down the coast from groins. Similar effects are caused by jetties, which are walls of concrete built to protect a harbor entrance from drifting sand. Jetties are also shown in Figure 12.
Breakwaters Structures like the one shown in Figure 13 that are built to provide anchorages for small boats or a calm beach area are called breakwaters. Breakwaters are built parallel to the shoreline. When the current slows down behind a breakwater and is no longer able to move sediment, it deposits sediment behind the breakwater. If the accumulating sediment is left alone, it can eventually fill an anchorage. To prevent this, anchorages have to be dredged regularly. (t)
Sext
o So
l/Pho
todi
sc/G
etty
Imag
es , (
b)To
m B
ean/
CORB
IS
0438_0446_ESGEU_S_C16_S1_658713.indd 4440438_0446_ESGEU_S_C16_S1_658713.indd 444 2/16/11 12:09 PM2/16/11 12:09 PM
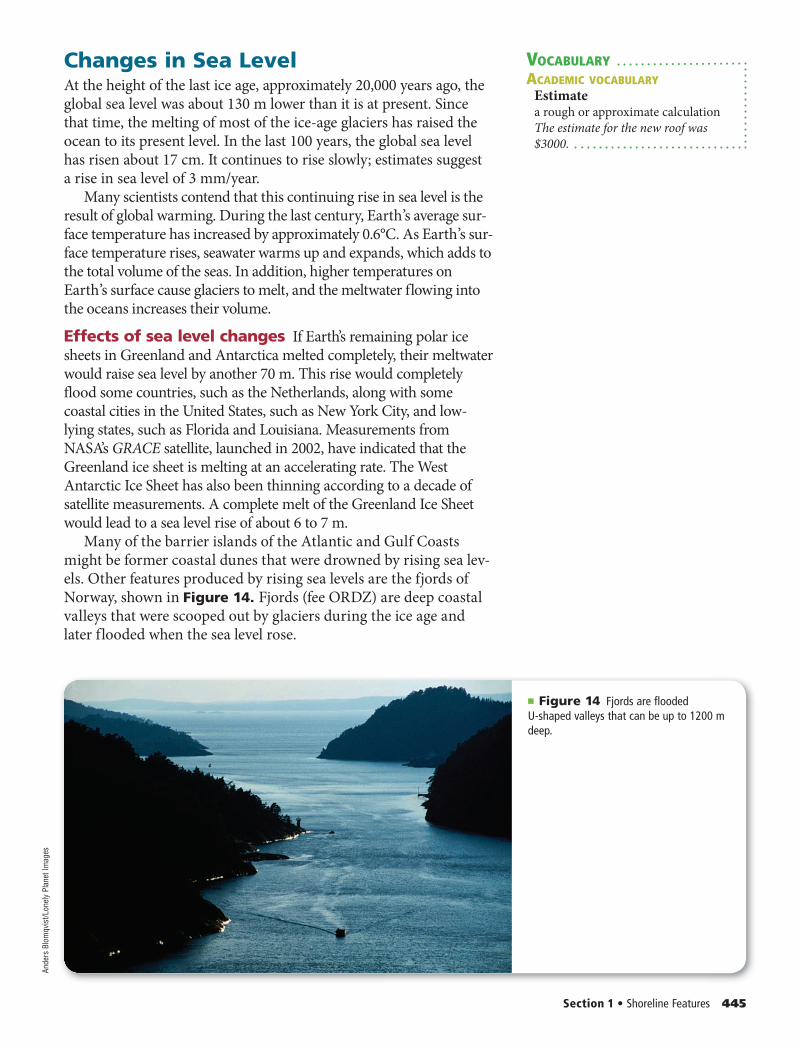
■ Figure 14 Fjords are flooded U-shaped valleys that can be up to 1200 m deep.
VOCABULARYACADEMIC VOCABULARY
Estimatea rough or approximate calculationThe estimate for the new roof was $3000.
Changes in Sea LevelAt the height of the last ice age, approximately 20,000 years ago, the global sea level was about 130 m lower than it is at present. Since that time, the melting of most of the ice-age glaciers has raised the ocean to its present level. In the last 100 years, the global sea level has risen about 17 cm. It continues to rise slowly; estimates suggest a rise in sea level of 3 mm/year.
Many scientists contend that this continuing rise in sea level is the result of global warming. During the last century, Earth’s average sur-face temperature has increased by approximately 0.6°C. As Earth’s sur-face temperature rises, seawater warms up and expands, which adds to the total volume of the seas. In addition, higher temperatures on Earth’s surface cause glaciers to melt, and the meltwater flowing into the oceans increases their volume.
Effects of sea level changes If Earth’s remaining polar ice sheets in Greenland and Antarctica melted completely, their meltwater would raise sea level by another 70 m. This rise would completely flood some countries, such as the Netherlands, along with some coastal cities in the United States, such as New York City, and low-lying states, such as Florida and Louisiana. Measurements from NASA’s GRACE satellite, launched in 2002, have indicated that the Greenland ice sheet is melting at an accelerating rate. The West Antarctic Ice Sheet has also been thinning according to a decade of satellite measurements. A complete melt of the Greenland Ice Sheet would lead to a sea level rise of about 6 to 7 m.
Many of the barrier islands of the Atlantic and Gulf Coasts might be former coastal dunes that were drowned by rising sea lev-els. Other features produced by rising sea levels are the fjords of Norway, shown in Figure 14. Fjords (fee ORDZ) are deep coastal valleys that were scooped out by glaciers during the ice age and later flooded when the sea level rose.
Section 1 • Shoreline Features 445
Ande
rs B
lom
qvis
t/Lon
ely
Plan
et Im
ages
0438_0446_ESGEU_S_C16_S1_658713.indd 4450438_0446_ESGEU_S_C16_S1_658713.indd 445 2/16/11 12:09 PM2/16/11 12:09 PM
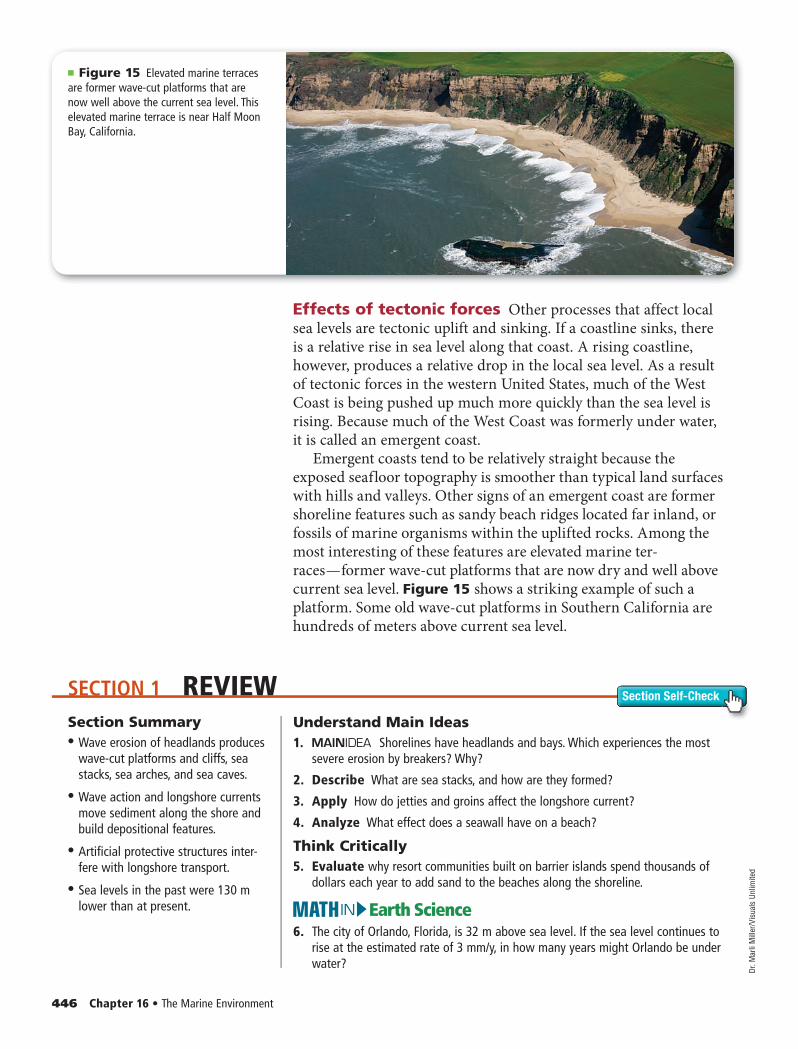
SECTION 1 REVIEW Section Self-Check
446 Chapter 16 • The Marine Environment
Effects of tectonic forces Other processes that affect local sea levels are tectonic uplift and sinking. If a coastline sinks, there is a relative rise in sea level along that coast. A rising coastline, however, produces a relative drop in the local sea level. As a result of tectonic forces in the western United States, much of the West Coast is being pushed up much more quickly than the sea level is rising. Because much of the West Coast was formerly under water, it is called an emergent coast.
Emergent coasts tend to be relatively straight because the exposed seafloor topography is smoother than typical land surfaces with hills and valleys. Other signs of an emergent coast are former shoreline features such as sandy beach ridges located far inland, or fossils of marine organisms within the uplifted rocks. Among the most interesting of these features are elevated marine ter-races — former wave-cut platforms that are now dry and well above current sea level. Figure 15 shows a striking example of such a platform. Some old wave-cut platforms in Southern California are hundreds of meters above current sea level.
■ Figure 15 Elevated marine terraces are former wave-cut platforms that are now well above the current sea level. This elevated marine terrace is near Half Moon Bay, California.
Section Summary• • Wave erosion of headlands produces
wave-cut platforms and cliffs, sea stacks, sea arches, and sea caves.
• • Wave action and longshore currents move sediment along the shore and build depositional features.
• • Artificial protective structures inter-fere with longshore transport.
• • Sea levels in the past were 130 m lower than at present.
Understand Main Ideas1. Shorelines have headlands and bays. Which experiences the most
severe erosion by breakers? Why?
2. Describe What are sea stacks, and how are they formed?
3. Apply How do jetties and groins affect the longshore current?
4. Analyze What effect does a seawall have on a beach?
Think Critically5. Evaluate why resort communities built on barrier islands spend thousands of
dollars each year to add sand to the beaches along the shoreline.
Earth ScienceIN6. The city of Orlando, Florida, is 32 m above sea level. If the sea level continues to
rise at the estimated rate of 3 mm/y, in how many years might Orlando be under water?
Dr. M
arli
Mill
er/V
isua
ls U
nlim
ited
0438_0446_ESGEU_S_C16_S1_658713.indd 4460438_0446_ESGEU_S_C16_S1_658713.indd 446 2/16/11 12:09 PM2/16/11 12:09 PM
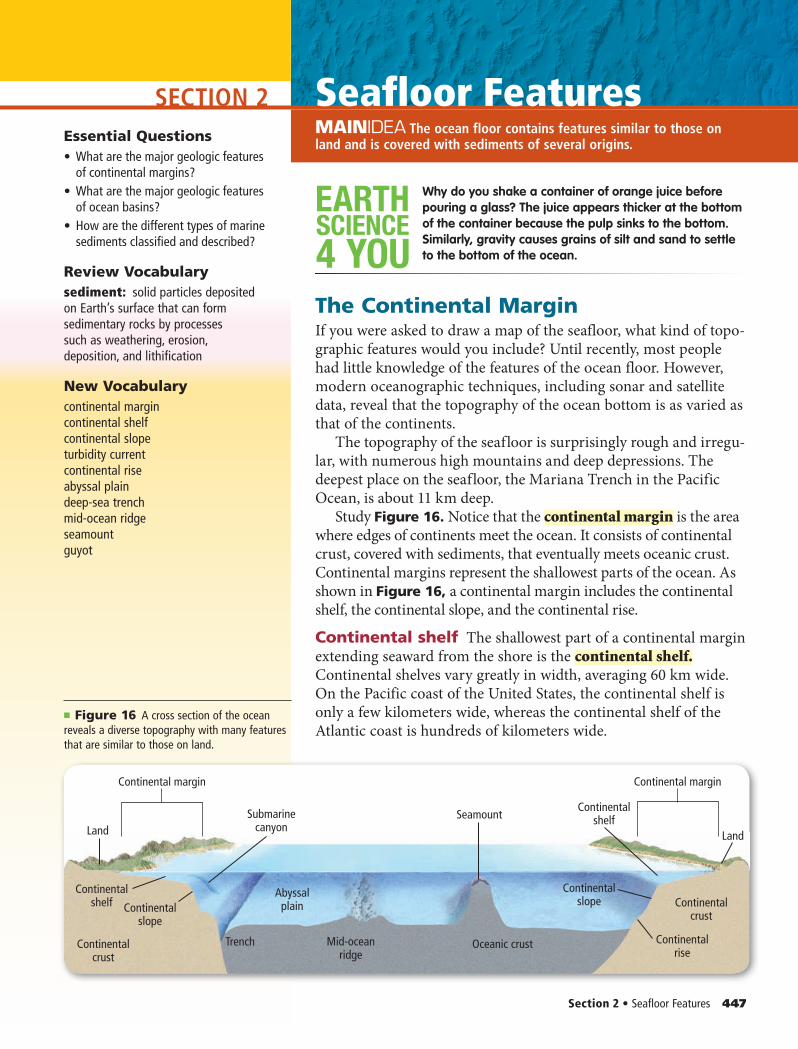
SECTION 2MAINIDEA Energy is transferred throughout Earth’s atmosphere.
Seafloor FeaturesMAINIDEA The ocean floor contains features similar to those on land and is covered with sediments of several origins.
SCIENCE
4 YOU
EARTH Why do you shake a container of orange juice before pouring a glass? The juice appears thicker at the bottom of the container because the pulp sinks to the bottom. Similarly, gravity causes grains of silt and sand to settle to the bottom of the ocean.
The Continental MarginIf you were asked to draw a map of the seafloor, what kind of topo-graphic features would you include? Until recently, most people had little knowledge of the features of the ocean floor. However, modern oceanographic techniques, including sonar and satellite data, reveal that the topography of the ocean bottom is as varied as that of the continents.
The topography of the seafloor is surprisingly rough and irregu-lar, with numerous high mountains and deep depressions. The deepest place on the seafloor, the Mariana Trench in the Pacific Ocean, is about 11 km deep.
Study Figure 16. Notice that the continental margin is the area where edges of continents meet the ocean. It consists of continental crust, covered with sediments, that eventually meets oceanic crust. Continental margins represent the shallowest parts of the ocean. As shown in Figure 16, a continental margin includes the continental shelf, the continental slope, and the continental rise.
Continental shelf The shallowest part of a continental margin extending seaward from the shore is the continental shelf. Continental shelves vary greatly in width, averaging 60 km wide. On the Pacific coast of the United States, the continental shelf is only a few kilometers wide, whereas the continental shelf of the Atlantic coast is hundreds of kilometers wide.
Essential Questions• What are the major geologic features
of continental margins?• What are the major geologic features
of ocean basins?• How are the different types of marine
sediments classified and described?
Review Vocabularysediment: solid particles deposited on Earth’s surface that can form sedimentary rocks by processes such as weathering, erosion, deposition, and lithification
New Vocabularycontinental margincontinental shelfcontinental slopeturbidity currentcontinental riseabyssal plaindeep-sea trenchmid-ocean ridgeseamountguyot
■ Figure 16 A cross section of the ocean reveals a diverse topography with many featur es that are similar to those on land.
Section 2 • Seafloor Features 447
LandSubmarine
canyon
Abyssalplain
Seamount
Trench Mid-oceanridge
Continentalshelf Continental
slope
Oceanic crust
Continentalcrust
Continentalcrust
Continentalshelf
Continentalrise
Continentalslope
Continental marginContinental margin
Land
0447_0454_ESGEU_S_C16_S2_658713.indd 4470447_0454_ESGEU_S_C16_S2_658713.indd 447 2/16/11 12:09 PM2/16/11 12:09 PM
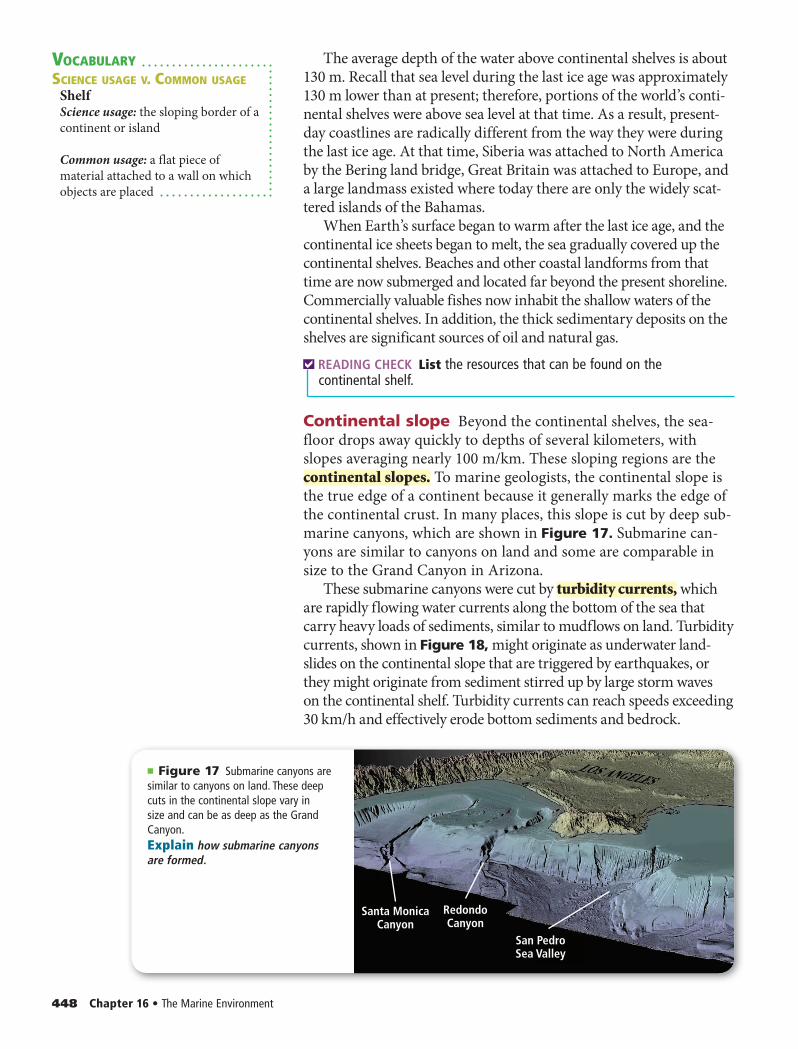
■ Figure 17 Submarine canyons are similar to canyons on land. These deep cuts in the continental slope vary in size and can be as deep as the Grand Canyon.Explain how sub marine canyons are formed.
VOCABULARYSCIENCE USAGE V. COMMON USAGE
ShelfScience usage: the sloping border of a continent or island
Common usage: a flat piece of material attached to a wall on which objects are placed
The average depth of the water above continental shelves is about 130 m. Recall that sea level during the last ice age was approximately 130 m lower than at present; therefore, portions of the world’s conti-nental shelves were above sea level at that time. As a result, present-day coastlines are radically different from the way they were during the last ice age. At that time, Siberia was attached to North America by the Bering land bridge, Great Britain was attached to Europe, and a large landmass existed where today there are only the widely scat-tered islands of the Bahamas.
When Earth’s surface began to warm after the last ice age, and the continental ice sheets began to melt, the sea gradually covered up the continental shelves. Beaches and other coastal landforms from that time are now submerged and located far beyond the present shoreline. Commercially valuable fishes now inhabit the shallow waters of the continental shelves. In addition, the thick sedimentary deposits on the shelves are significant sources of oil and natural gas.
READING CHECK List the resources that can be found on thecontinental shelf.
Continental slope Beyond the continental shelves, the sea-floor drops away quickly to depths of several kilometers, with slopes averaging nearly 100 m/km. These sloping regions are the continental slopes. To marine geologists, the continental slope is the true edge of a continent because it generally marks the edge of the continental crust. In many places, this slope is cut by deep sub-marine canyons, which are shown in Figure 17. Submarine can-yons are similar to canyons on land and some are comparable in size to the Grand Canyon in Arizona.
These submarine canyons were cut by turbidity currents, which are rapidly flowing water currents along the bottom of the sea that carry heavy loads of sediments, similar to mudflows on land. Turbidity currents, shown in Figure 18, might originate as underwater land-slides on the continental slope that are triggered by earthquakes, or they might originate from sediment stirred up by large storm waves on the continental shelf. Turbidity currents can reach speeds exceeding 30 km/h and effectively erode bottom sediments and bedrock.
448 Chapter 16 • The Marine Environment
0447_0454_ESGEU_S_C16_S2_658713.indd 4480447_0454_ESGEU_S_C16_S2_658713.indd 448 2/16/11 12:09 PM2/16/11 12:09 PM
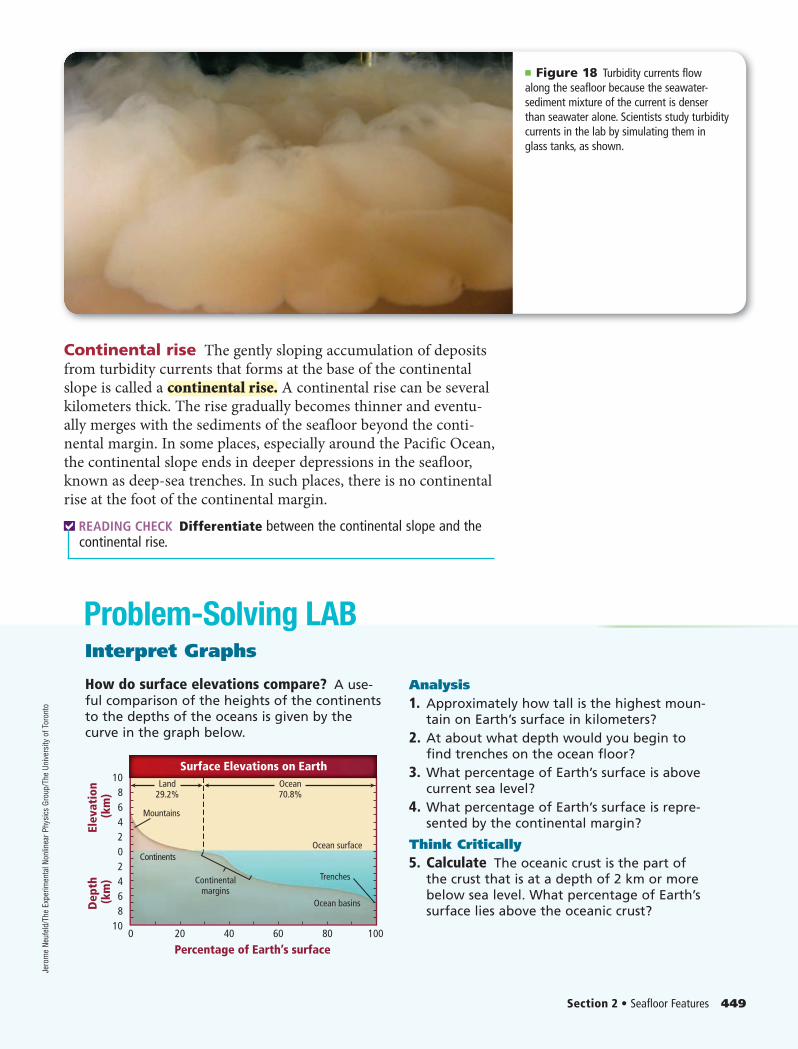
■ Figure 18 Turbidity currents flow along the seafloor because the seawater-sediment mixture of the current is denser than seawater alone. Scientists study turbidity currents in the lab by simulating them in glass tanks, as shown.
Problem-Solving LAB
Continental rise The gently sloping accumulation of deposits from turbidity currents that forms at the base of the continental slope is called a continental rise. A continental rise can be several kilometers thick. The rise gradually becomes thinner and eventu-ally merges with the sediments of the seafloor beyond the conti-nental margin. In some places, especially around the Pacific Ocean, the continental slope ends in deeper depressions in the seafloor, known as deep-sea trenches. In such places, there is no continental rise at the foot of the continental margin.
READING CHECK Differentiate between the continental slope and the continental rise.
Section 2 • Seafloor Features 449
Mountains
Continents
Continentalmargins
Ocean surface
Trenches
Ocean basins
Land29.2%
Ocean70.8%
20
10
108
8
6
6
4
4
2
20
0 40 60 10080
Elev
atio
n (k
m)
Dep
th
(km
)
Percentage of Earth’s surface
Surface Elevations on Earth
Interpret Graphs
How do surface elevations compare? A use-ful comparison of the heights of the continents to the depths of the oceans is given by the curve in the graph below.
Analysis1. Approximately how tall is the highest moun-
tain on Earth’s surface in kilometers?2. At about what depth would you begin to
find trenches on the ocean floor?3. What percentage of Earth’s surface is above
current sea level?4. What percentage of Earth’s surface is repre-
sented by the continental margin?
Think Critically5. Calculate The oceanic crust is the part of
the crust that is at a depth of 2 km or more below sea level. What percentage of Earth’s surface lies above the oceanic crust?
Jero
me
Neuf
eld/
The
Expe
rimen
tal N
onlin
ear P
hysi
cs G
roup
/The
Uni
vers
ity o
f Tor
onto
0447_0454_ESGEU_S_C16_S2_658713.indd 4490447_0454_ESGEU_S_C16_S2_658713.indd 449 2/16/11 12:09 PM2/16/11 12:09 PM
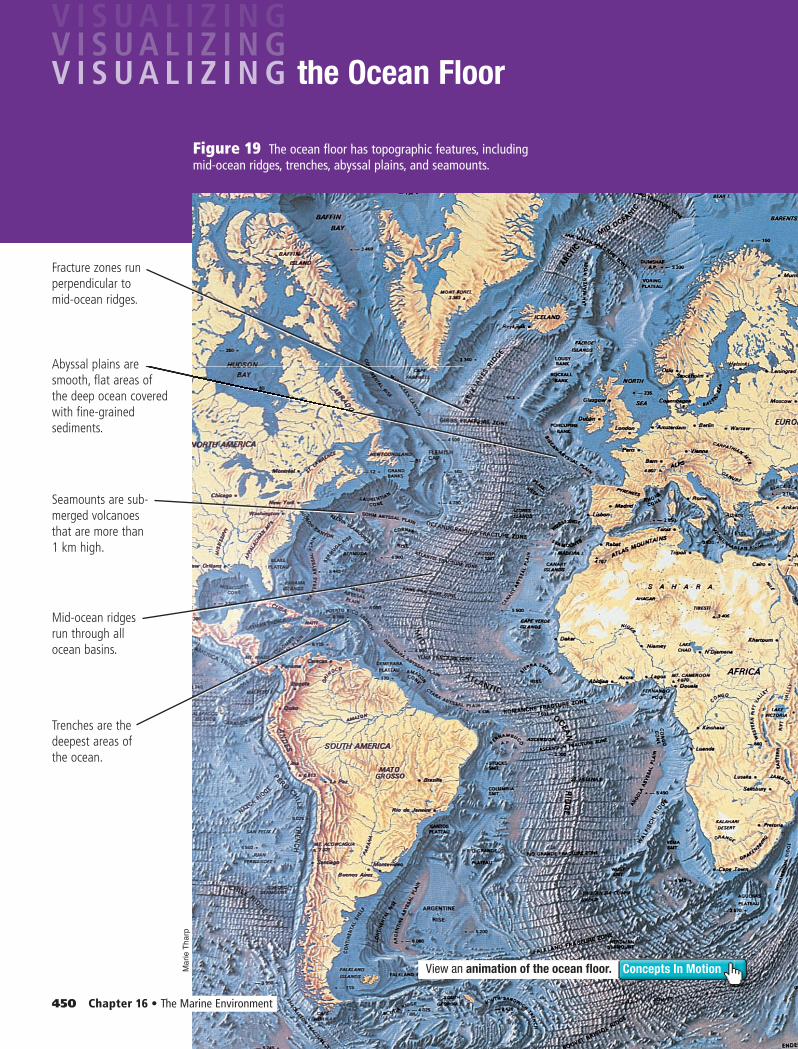
Concepts In MotionView an animation of the ocean floor.
the Ocean Floor
450 Chapter 16 • The Marine Environment
Figure 19 The ocean floor has topographic features, including mid-ocean ridges, trenches, abyssal plains, and seamounts.
Trenches are the deepest areas of the ocean.
Abyssal plains are smooth, flat areas of the deep ocean covered with fine-grained sediments.
Mid-ocean ridges run through all ocean basins.
Fracture zones runperpendicular tomid-ocean ridges.
Seamounts are sub-merged volcanoes that are more than 1 km high.
Mari
e T
harp
0447_0454_ESGEU_S_C16_S2_658713.indd 4500447_0454_ESGEU_S_C16_S2_658713.indd 450 2/16/11 12:09 PM2/16/11 12:09 PM
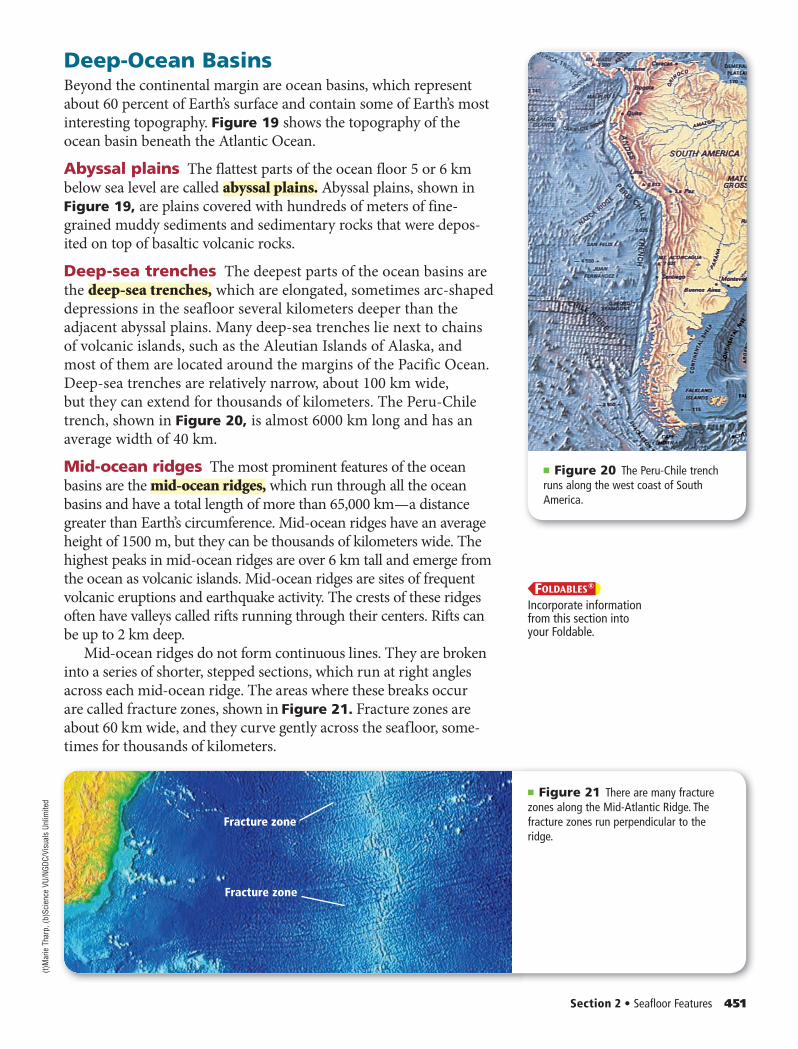
■ Figure 21 There are many fracture zones along the Mid-Atlantic Ridge. The fracture zones run perpendicular to the ridge.
■ Figure 20 The Peru-Chile trench runs along the west coast of South America.
Deep-Ocean BasinsBeyond the continental margin are ocean basins, which represent about 60 percent of Earth’s surface and contain some of Earth’s most interesting topography. Figure 19 shows the topography of the ocean basin beneath the Atlantic Ocean.
Abyssal plains The flattest parts of the ocean floor 5 or 6 km below sea level are called abyssal plains. Abyssal plains, shown in Figure 19, are plains covered with hundreds of meters of fine-grained muddy sediments and sedimentary rocks that were depos-ited on top of basaltic volcanic rocks.
Deep-sea trenches The deepest parts of the ocean basins are the deep-sea trenches, which are elongated, sometimes arc-shaped depressions in the seafloor several kilometers deeper than the adjacent abyssal plains. Many deep-sea trenches lie next to chains of volcanic islands, such as the Aleutian Islands of Alaska, and most of them are located around the margins of the Pacific Ocean. Deep-sea trenches are relatively narrow, about 100 km wide, but they can extend for thousands of kilometers. The Peru-Chile trench, shown in Figure 20, is almost 6000 km long and has an average width of 40 km.
Mid-ocean ridges The most prominent features of the ocean basins are the mid-ocean ridges, which run through all the ocean basins and have a total length of more than 65,000 km — a distance greater than Earth’s circumference. Mid-ocean ridges have an average height of 1500 m, but they can be thousands of kilometers wide. The highest peaks in mid-ocean ridges are over 6 km tall and emerge from the ocean as volcanic islands. Mid-ocean ridges are sites of frequent volcanic eruptions and earthquake activity. The crests of these ridges often have valleys called rifts running through their centers. Rifts can be up to 2 km deep.
Mid-ocean ridges do not form continuous lines. They are broken into a series of shorter, stepped sections, which run at right angles across each mid-ocean ridge. The areas where these breaks occur are called fracture zones, shown in Figure 21. Fracture zones are about 60 km wide, and they curve gently across the seafloor, some-times for thousands of kilometers.
Section 2 • Seafloor Features 451
Fracture zone
Fracture zone
FOLDABLESIncorporate information from this section into your Foldable.
(t)M
arie
Tha
rp , (
b)Sc
ienc
e VU
/NGD
C/Vi
sual
s Un
limite
d
0447_0454_ESGEU_S_C16_S2_658713.indd 4510447_0454_ESGEU_S_C16_S2_658713.indd 451 2/16/11 12:10 PM2/16/11 12:10 PM
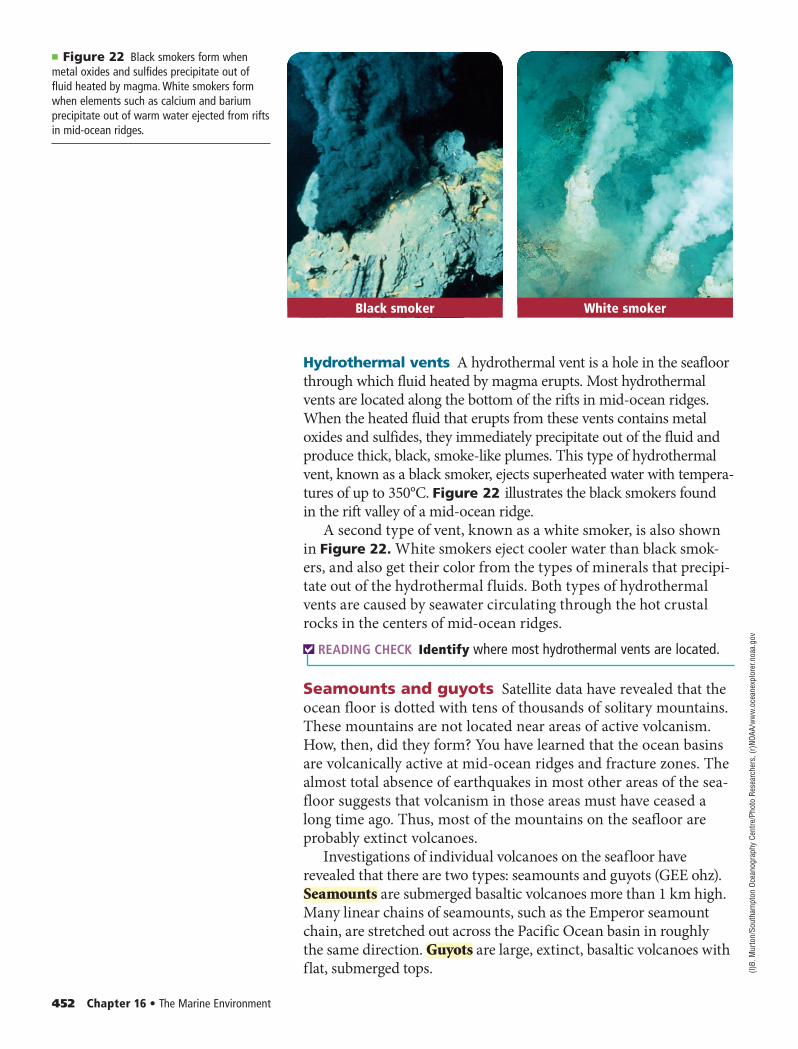
Hydrothermal vents A hydrothermal vent is a hole in the seafloor through which fluid heated by magma erupts. Most hydrothermal vents are located along the bottom of the rifts in mid-ocean ridges. When the heated fluid that erupts from these vents contains metal oxides and sulfides, they immediately precipitate out of the fluid and produce thick, black, smoke-like plumes. This type of hydrothermal vent, known as a black smoker, ejects superheated water with tempera-tures of up to 350°C. Figure 22 illustrates the black smokers found in the rift valley of a mid-ocean ridge.
A second type of vent, known as a white smoker, is also shown in Figure 22. White smokers eject cooler water than black smok-ers, and also get their color from the types of minerals that precipi-tate out of the hydrothermal fluids. Both types of hydrothermal vents are caused by sea water circulating through the hot crustal rocks in the centers of mid-ocean ridges.
READING CHECK Identify where most hydrothermal vents are located.
Seamounts and guyots Satellite data have revealed that the ocean floor is dotted with tens of thousands of solitary mountains. These mountains are not located near areas of active volcanism. How, then, did they form? You have learned that the ocean basins are volcanically active at mid-ocean ridges and fracture zones. The almost total absence of earthquakes in most other areas of the sea-floor suggests that volcanism in those areas must have ceased a long time ago. Thus, most of the mountains on the seafloor are probably extinct volcanoes.
Investigations of individual volcanoes on the seafloor have revealed that there are two types: seamounts and guyots (GEE ohz). Seamounts are submerged basaltic volcanoes more than 1 km high. Many linear chains of seamounts, such as the Emperor seamount chain, are stretched out across the Pacific Ocean basin in roughly the same direction. Guyots are large, extinct, basaltic volcanoes with flat, submerged tops.
■ Figure 22 Black smokers form when metal oxides and sulfides precipitate out of fluid heated by magma. White smokers form when elements such as calcium and barium precipitate out of warm water ejected from rifts in mid-ocean ridges.
452 Chapter 16 • The Marine Environment
White smokerBlack smoker
(l)B.
Mur
ton/
Sout
ham
pton
Oce
anog
raph
y Ce
ntre
/Pho
to R
esea
rche
rs , (
r)NO
AA/w
ww
.oce
anex
plor
er.n
oaa.
gov
0447_0454_ESGEU_S_C16_S2_658713.indd 4520447_0454_ESGEU_S_C16_S2_658713.indd 452 2/16/11 12:10 PM2/16/11 12:10 PM
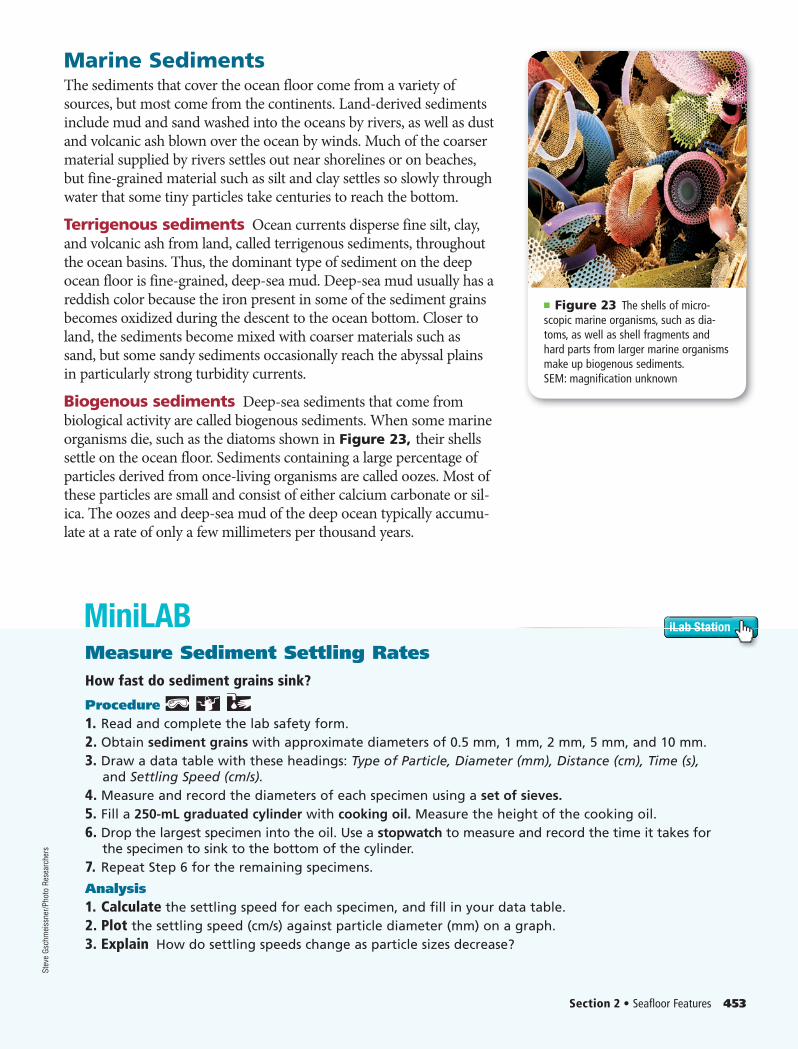
MiniLAB
■ Figure 23 The shells of micro-scopic marine organisms, such as dia-toms, as well as shell fragments and hard parts from larger marine organisms make up biogenous sediments.SEM: magnification unknown
Marine SedimentsThe sediments that cover the ocean floor come from a variety of sources, but most come from the continents. Land-derived sediments include mud and sand washed into the oceans by rivers, as well as dust and volcanic ash blown over the ocean by winds. Much of the coarser material supplied by rivers settles out near shorelines or on beaches, but fine-grained material such as silt and clay settles so slowly through water that some tiny particles take centuries to reach the bottom.
Terrigenous sediments Ocean currents disperse fine silt, clay, and volcanic ash from land, called terrigenous sediments, throughout the ocean basins. Thus, the dominant type of sediment on the deep ocean floor is fine-grained, deep-sea mud. Deep-sea mud usually has a reddish color because the iron present in some of the sediment grains becomes oxidized during the descent to the ocean bottom. Closer to land, the sediments become mixed with coarser materials such as sand, but some sandy sediments occasionally reach the abyssal plains in particularly strong turbidity currents.
Biogenous sediments Deep-sea sediments that come from biological activity are called biogenous sediments. When some marine organisms die, such as the diatoms shown in Figure 23, their shells settle on the ocean floor. Sediments containing a large percentage of particles derived from once-living organisms are called oozes. Most of these particles are small and consist of either calcium carbonate or sil-ica. The oozes and deep-sea mud of the deep ocean typically accumu-late at a rate of only a few millimeters per thousand years.
Section 2 • Seafloor Features 453
Measure Sediment Settling RatesHow fast do sediment grains sink?
Procedure 1. Read and complete the lab safety form.2. Obtain sediment grains with approximate diameters of 0.5 mm, 1 mm, 2 mm, 5 mm, and 10 mm.3. Draw a data table with these headings: Type of Particle, Diameter (mm), Distance (cm), Time (s),
and Settling Speed (cm/s).4. Measure and record the diameters of each specimen using a set of sieves. 5. Fill a 250-mL graduated cylinder with cooking oil. Measure the height of the cooking oil.6. Drop the largest specimen into the oil. Use a stopwatch to measure and record the time it takes for
the specimen to sink to the bottom of the cylinder. 7. Repeat Step 6 for the remaining specimens.
Analysis1. Calculate the settling speed for each specimen, and fill in your data table.2. Plot the settling speed (cm/s) against particle diameter (mm) on a graph.3. Explain How do settling speeds change as particle sizes decrease?
iLab Station
Stev
e Gs
chm
eiss
ner/P
hoto
Res
earc
hers
0447_0454_ESGEU_S_C16_S2_658713.indd 4530447_0454_ESGEU_S_C16_S2_658713.indd 453 2/16/11 12:10 PM2/16/11 12:10 PM
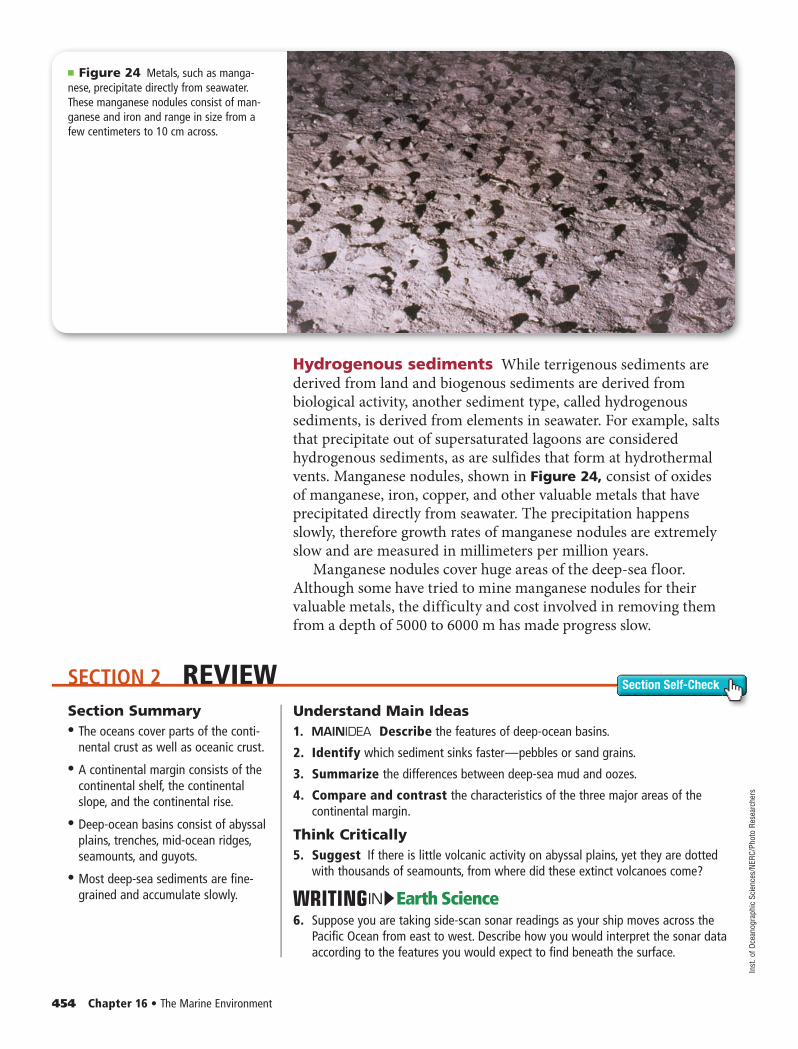
■ Figure 24 Metals, such as manga-nese, precipitate directly from seawater. These manganese nodules consist of man-ganese and iron and range in size from a few centimeters to 10 cm across.
SECTION 2 REVIEW Section Self-Check
Hydrogenous sediments While terrigenous sediments are derived from land and biogenous sediments are derived from biological activity, another sediment type, called hydrogenous sediments, is derived from elements in seawater. For example, salts that precipitate out of supersaturated lagoons are considered hydrogenous sediments, as are sulfides that form at hydrothermal vents. Manganese nodules, shown in Figure 24, consist of oxides of manganese, iron, copper, and other valuable metals that have precipitated directly from seawater. The precipitation happens slowly, therefore growth rates of manganese nodules are extremely slow and are measured in millimeters per million years.
Manganese nodules cover huge areas of the deep-sea floor. Although some have tried to mine manganese nodules for their valuable metals, the difficulty and cost involved in removing them from a depth of 5000 to 6000 m has made progress slow.
454 Chapter 16 • The Marine Environment
Section Summary• • The oceans cover parts of the conti-
nental crust as well as oceanic crust.
• • A continental margin consists of the continental shelf, the continental slope, and the continental rise.
• • Deep-ocean basins consist of abyssal plains, trenches, mid-ocean ridges, seamounts, and guyots.
• • Most deep-sea sediments are fine-grained and accumulate slowly.
Understand Main Ideas1. Describe the features of deep-ocean basins.
2. Identify which sediment sinks faster — pebbles or sand grains.
3. Summarize the differences between deep-sea mud and oozes.
4. Compare and contrast the characteristics of the three major areas of the continental margin.
Think Critically5. Suggest If there is little volcanic activity on abyssal plains, yet they are dotted
with thousands of seamounts, from where did these extinct volcanoes come?
Earth ScienceIN6. Suppose you are taking side-scan sonar readings as your ship moves across the
Pacific Ocean from east to west. Describe how you would interpret the sonar data according to the features you would expect to find beneath the surface.
Inst
. of O
cean
ogra
phic
Sci
ence
s/NE
RC/P
hoto
Res
earc
hers
0447_0454_ESGEU_S_C16_S2_658713.indd 4540447_0454_ESGEU_S_C16_S2_658713.indd 454 2/16/11 12:10 PM2/16/11 12:10 PM
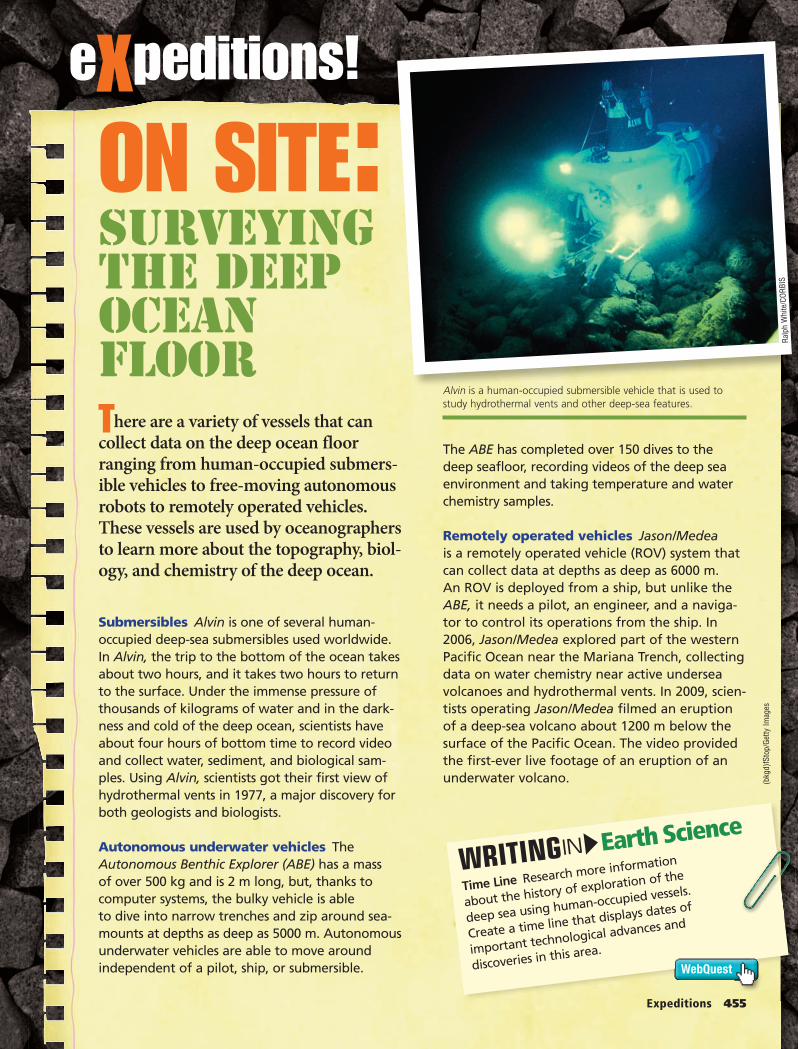
ON SITE:eXpeditions!
Time Line Research more information
about the history of exploration of the
deep sea using human-occupied vessels.
Create a time line that displays dates of
important technological advances and
discoveries in this area.
Earth ScienceIN
Alvin is a human-occupied submersible vehicle that is used to study hydrothermal vents and other deep-sea features.
There are a variety of vessels that can collect data on the deep ocean floor ranging from human-occupied submers-ible vehicles to free-moving autonomous robots to remotely operated vehicles. These vessels are used by oceanographers to learn more about the topography, biol-ogy, and chemistry of the deep ocean.
Submersibles Alvin is one of several human-occupied deep-sea submersibles used worldwide. In Alvin, the trip to the bottom of the ocean takes about two hours, and it takes two hours to return to the surface. Under the immense pressure of thousands of kilograms of water and in the dark-ness and cold of the deep ocean, scientists have about four hours of bottom time to record video and collect water, sediment, and biological sam-ples. Using Alvin, scientists got their first view of hydrothermal vents in 1977, a major discovery for both geologists and biologists.
Autonomous underwater vehicles The Autonomous Benthic Explorer (ABE) has a mass of over 500 kg and is 2 m long, but, thanks to computer systems, the bulky vehicle is able to dive into narrow trenches and zip around sea-mounts at depths as deep as 5000 m. Autonomous underwater vehicles are able to move around independent of a pilot, ship, or submersible.
The ABE has completed over 150 dives to the deep seafloor, recording videos of the deep sea environment and taking temperature and water chemistry samples.
Remotely operated vehicles Jason/Medea is a remotely operated vehicle (ROV) system that can collect data at depths as deep as 6000 m. An ROV is deployed from a ship, but unlike the ABE, it needs a pilot, an engineer, and a naviga-tor to control its operations from the ship. In 2006, Jason/Medea explored part of the western Pacific Ocean near the Mariana Trench, collecting data on water chemistry near active undersea volcanoes and hydrothermal vents. In 2009, scien-tists operating Jason/Medea filmed an eruption of a deep-sea volcano about 1200 m below the surface of the Pacific Ocean. The video provided the first-ever live footage of an eruption of an underwater volcano.
Surveying the Deep Ocean Floor
WebQuest
AlAl ii ii hh i dd b ibi l hi l th th ii dd tt
Expeditions 455
Ralp
h W
hite
/COR
BIS
(bkg
d)fS
top/
Getty
Imag
es
0455_ESGEU_S_C16_F_EX_658713.indd 4550455_ESGEU_S_C16_F_EX_658713.indd 455 2/16/11 12:10 PM2/16/11 12:10 PM
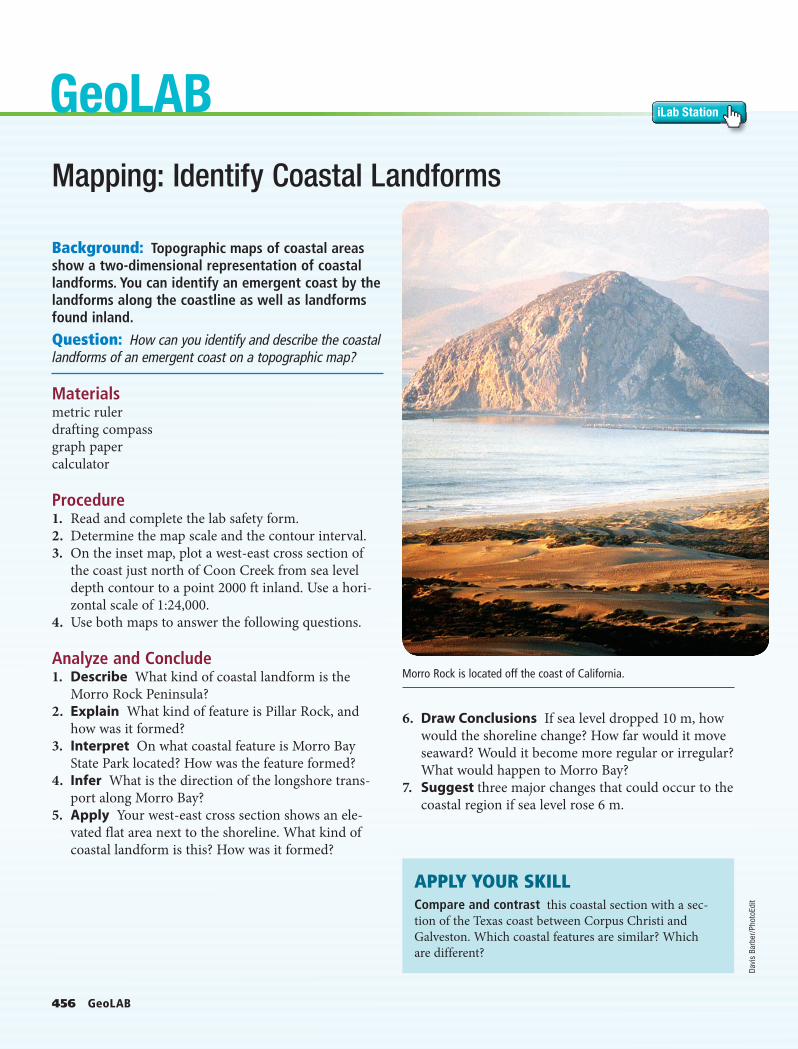
456 GeoLAB
GeoLAB iLab Station
APPLY YOUR SKILLCompare and contrast this coastal section with a sec-tion of the Texas coast between Corpus Christi and Galveston. Which coastal features are similar? Which are different?
6. Draw Conclusions If sea level dropped 10 m, how would the shoreline change? How far would it move seaward? Would it become more regular or irregular? What would happen to Morro Bay?
7. Suggest three major changes that could occur to the coastal region if sea level rose 6 m.
Background: Topographic maps of coastal areas show a two-dimensional representation of coastal landforms. You can identify an emergent coast by the landforms along the coastline as well as landforms found inland.
Question: How can you identify and describe the coastal landforms of an emergent coast on a topographic map?
Materialsmetric rulerdrafting compassgraph papercalculator
Procedure 1. Read and complete the lab safety form.2. Determine the map scale and the contour interval.3. On the inset map, plot a west-east cross section of
the coast just north of Coon Creek from sea level depth contour to a point 2000 ft inland. Use a hori-zontal scale of 1:24,000.
4. Use both maps to answer the following questions.
Analyze and Conclude1. Describe What kind of coastal landform is the
Morro Rock Peninsula?2. Explain What kind of feature is Pillar Rock, and
how was it formed?3. Interpret On what coastal feature is Morro Bay
State Park located? How was the feature formed?4. Infer What is the direction of the longshore trans-
port along Morro Bay?5. Apply Your west-east cross section shows an ele-
vated flat area next to the shoreline. What kind of coastal landform is this? How was it formed?
Mapping: Identify Coastal Landforms
Morro Rock is located off the coast of California.
Davi
s Ba
rber
/Pho
toEd
it
0456_0457_ESGEU_S_C16_LAB_658713.indd 4560456_0457_ESGEU_S_C16_LAB_658713.indd 456 2/16/11 12:11 PM2/16/11 12:11 PM
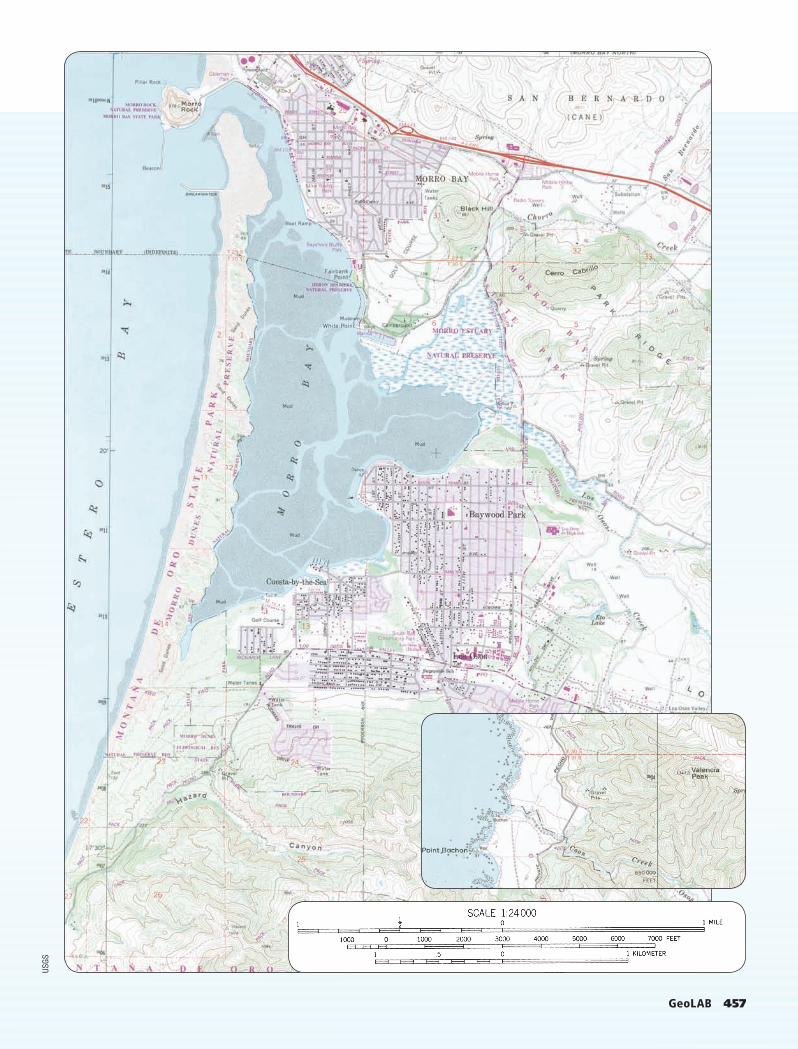
GeoLAB 457
USGS
0456_0457_ESGEU_S_C16_LAB_658713.indd 4570456_0457_ESGEU_S_C16_LAB_658713.indd 457 2/16/11 12:11 PM2/16/11 12:11 PM
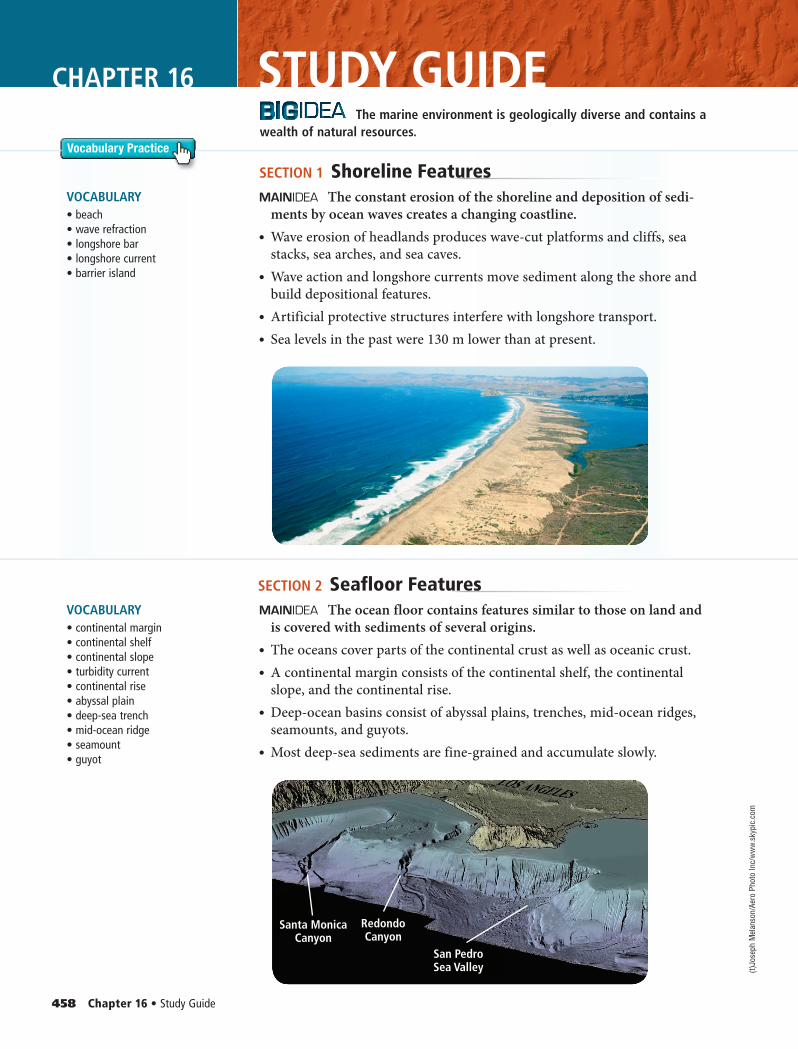
(t)Jo
seph
Mel
anso
n/Ae
ro P
hoto
Inc/
ww
w.s
kypi
c.co
m
Download quizzes, key terms, and flash cards from glencoe.com.
458 Chapter 16 • Study Guide
SECTION 1 Shoreline FeaturesVOCABULARY• beach• wave refraction• longshore bar• longshore current• barrier island
The constant erosion of the shoreline and deposition of sedi-ments by ocean waves creates a changing coastline.
• Wave erosion of headlands produces wave-cut platforms and cliffs, sea stacks, sea arches, and sea caves.
• Wave action and longshore currents move sediment along the shore and build depositional features.
• Artificial protective structures interfere with longshore transport.• Sea levels in the past were 130 m lower than at present.
SECTION 2 Seafloor FeaturesVOCABULARY• continental margin• continental shelf• continental slope• turbidity current• continental rise• abyssal plain• deep-sea trench• mid-ocean ridge• seamount• guyot
The ocean floor contains features similar to those on land and is covered with sediments of several origins.
• The oceans cover parts of the continental crust as well as oceanic crust.• A continental margin consists of the continental shelf, the continental
slope, and the continental rise.• Deep-ocean basins consist of abyssal plains, trenches, mid-ocean ridges,
seamounts, and guyots.• Most deep-sea sediments are fine-grained and accumulate slowly.
Vocabulary Practice
STUDY GUIDECHAPTER 16 The marine environment is geologically diverse and contains a
wealth of natural resources.
0458_0461_ESGEU_S_C16_CA_658713.indd 4580458_0461_ESGEU_S_C16_CA_658713.indd 458 2/16/11 12:11 PM2/16/11 12:11 PM
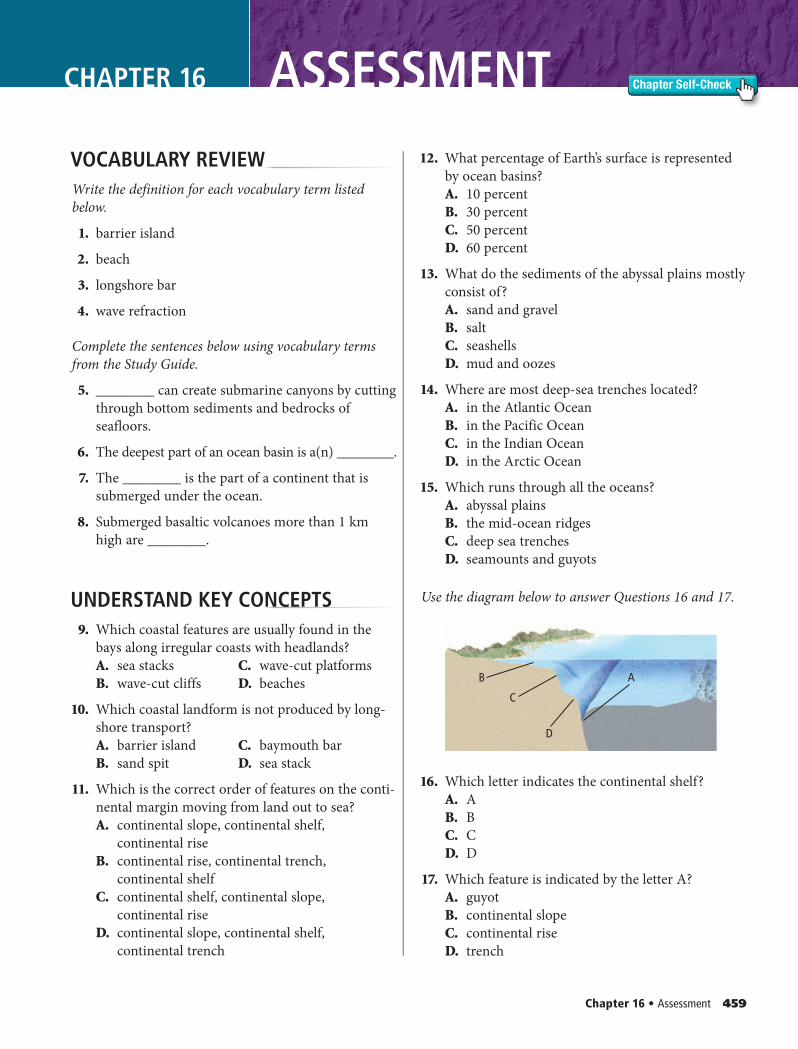
Chapter 16 • Assessment 459
Chapter Self-CheckCHAPTER 16 ASSESSMENT
VOCABULARY REVIEWWrite the definition for each vocabulary term listed below.
1. barrier island
2. beach
3. longshore bar
4. wave refraction
Complete the sentences below using vocabulary terms from the Study Guide.
5. ________ can create submarine canyons by cutting through bottom sediments and bedrocks of seafloors.
6. The deepest part of an ocean basin is a(n) ________.
7. The ________ is the part of a continent that is submerged under the ocean.
8. Submerged basaltic volcanoes more than 1 km high are ________.
UNDERSTAND KEY CONCEPTS 9. Which coastal features are usually found in the
bays along irregular coasts with headlands?A. sea stacks C. wave-cut platformsB. wave-cut cliffs D. beaches
10. Which coastal landform is not produced by long-shore transport?A. barrier island C. baymouth barB. sand spit D. sea stack
11. Which is the correct order of features on the conti-nental margin moving from land out to sea?A. continental slope, continental shelf,
continental riseB. continental rise, continental trench,
continental shelfC. continental shelf, continental slope,
continental riseD. continental slope, continental shelf,
continental trench
12. What percentage of Earth’s surface is represented by ocean basins?A. 10 percentB. 30 percentC. 50 percentD. 60 percent
13. What do the sediments of the abyssal plains mostly consist of?A. sand and gravelB. saltC. seashellsD. mud and oozes
14. Where are most deep-sea trenches located?A. in the Atlantic OceanB. in the Pacific OceanC. in the Indian OceanD. in the Arctic Ocean
15. Which runs through all the oceans?A. abyssal plainsB. the mid-ocean ridgesC. deep sea trenchesD. seamounts and guyots
Use the diagram below to answer Questions 16 and 17.
16. Which letter indicates the continental shelf?A. AB. BC. CD. D
17. Which feature is indicated by the letter A?A. guyotB. continental slopeC. continental riseD. trench
AB
C
D
0458_0461_ESGEU_S_C16_CA_658713.indd 4590458_0461_ESGEU_S_C16_CA_658713.indd 459 2/16/11 12:11 PM2/16/11 12:11 PM
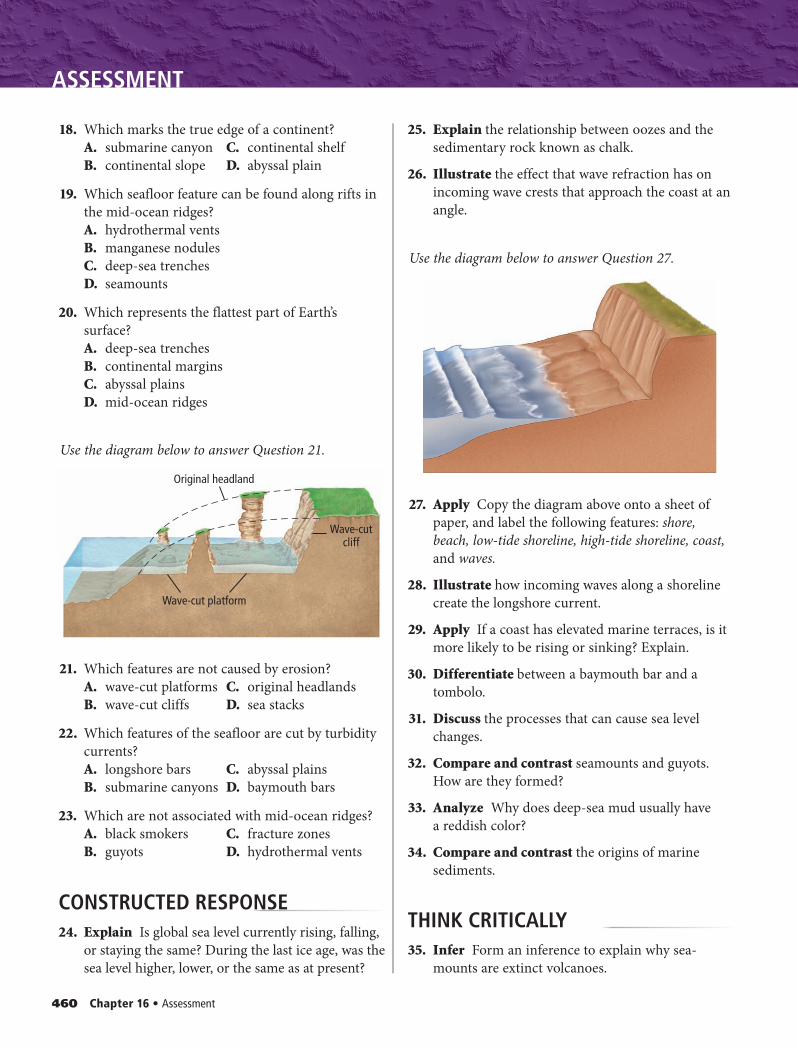
460 Chapter 16 • Assessment
ASSESSMENT
18. Which marks the true edge of a continent?A. submarine canyon C. continental shelfB. continental slope D. abyssal plain
19. Which seafloor feature can be found along rifts in the mid-ocean ridges?A. hydrothermal ventsB. manganese nodulesC. deep-sea trenchesD. seamounts
20. Which represents the flattest part of Earth’s surface?A. deep-sea trenchesB. continental marginsC. abyssal plainsD. mid-ocean ridges
Use the diagram below to answer Question 21.
21. Which features are not caused by erosion?A. wave-cut platforms C. original headlandsB. wave-cut cliffs D. sea stacks
22. Which features of the seafloor are cut by turbidity currents?A. longshore bars C. abyssal plainsB. submarine canyons D. baymouth bars
23. Which are not associated with mid-ocean ridges?A. black smokers C. fracture zonesB. guyots D. hydrothermal vents
CONSTRUCTED RESPONSE 24. Explain Is global sea level currently rising, falling,
or staying the same? During the last ice age, was the sea level higher, lower, or the same as at present?
25. Explain the relationship between oozes and the sedimentary rock known as chalk.
26. Illustrate the effect that wave refraction has on incoming wave crests that approach the coast at an angle.
Use the diagram below to answer Question 27.
27. Apply Copy the diagram above onto a sheet of paper, and label the following features: shore, beach, low-tide shoreline, high-tide shoreline, coast, and waves.
28. Illustrate how incoming waves along a shoreline create the longshore current.
29. Apply If a coast has elevated marine terraces, is it more likely to be rising or sinking? Explain.
30. Differentiate between a baymouth bar and a tombolo.
31. Discuss the processes that can cause sea level changes.
32. Compare and contrast seamounts and guyots. How are they formed?
33. Analyze Why does deep-sea mud usually have a reddish color?
34. Compare and contrast the origins of marine sediments.
THINK CRITICALLY 35. Infer Form an inference to explain why sea-
mounts are extinct volcanoes.
Original headland
Wave-cut platform
Wave-cutcliff
0458_0461_ESGEU_S_C16_CA_658713.indd 4600458_0461_ESGEU_S_C16_CA_658713.indd 460 2/16/11 12:12 PM2/16/11 12:12 PM
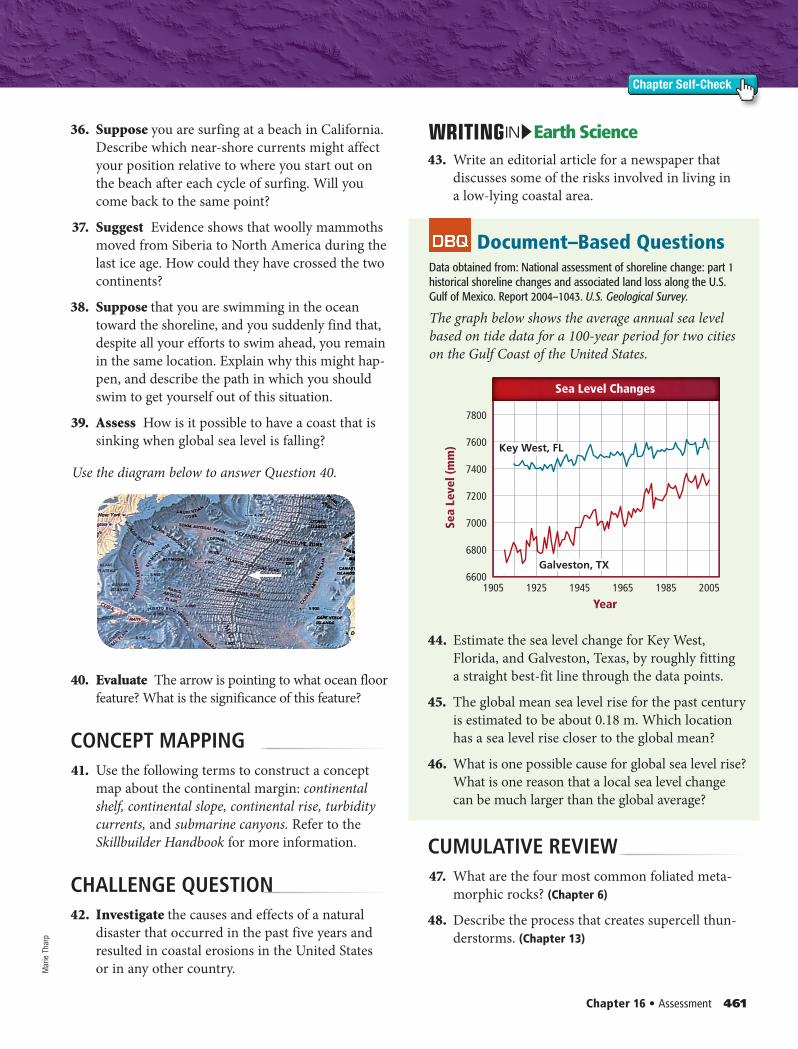
Mar
ie T
harp
Chapter 16 • Assessment 461
Chapter Self-Check
36. Suppose you are surfing at a beach in California. Describe which near-shore currents might affect your position relative to where you start out on the beach after each cycle of surfing. Will you come back to the same point?
37. Suggest Evidence shows that woolly mammoths moved from Siberia to North America during the last ice age. How could they have crossed the two continents?
38. Suppose that you are swimming in the ocean toward the shoreline, and you suddenly find that, despite all your efforts to swim ahead, you remain in the same location. Explain why this might hap-pen, and describe the path in which you should swim to get yourself out of this situation.
39. Assess How is it possible to have a coast that is sinking when global sea level is falling?
Use the diagram below to answer Question 40.
40. Evaluate The arrow is pointing to what ocean floor feature? What is the significance of this feature?
CONCEPT MAPPING 41. Use the following terms to construct a concept
map about the continental margin: continental shelf, continental slope, continental rise, turbidity currents, and submarine canyons. Refer to the Skillbuilder Handbook for more information.
CHALLENGE QUESTION 42. Investigate the causes and effects of a natural
disaster that occurred in the past five years and resulted in coastal erosions in the United States or in any other country.
192519056600
6800
7000
7200
7400
7600
7800
1945 1965 20051985
Sea
Leve
l (m
m)
Year
Sea Level Changes
Key West, FL
Galveston, TX
Earth ScienceIN
43. Write an editorial article for a newspaper that discusses some of the risks involved in living in a low-lying coastal area.
Document–Based QuestionsData obtained from: National assessment of shoreline change: part 1 historical shoreline changes and associated land loss along the U.S. Gulf of Mexico. Report 2004–1043. U.S. Geological Survey.
The graph below shows the average annual sea level based on tide data for a 100-year period for two cities on the Gulf Coast of the United States.
44. Estimate the sea level change for Key West, Florida, and Galveston, Texas, by roughly fitting a straight best-fit line through the data points.
45. The global mean sea level rise for the past century is estimated to be about 0.18 m. Which location has a sea level rise closer to the global mean?
46. What is one possible cause for global sea level rise? What is one reason that a local sea level change can be much larger than the global average?
CUMULATIVE REVIEW 47. What are the four most common foliated meta-
morphic rocks? (Chapter 6)
48. Describe the process that creates supercell thun-derstorms. (Chapter 13)
0458_0461_ESGEU_S_C16_CA_658713.indd 4610458_0461_ESGEU_S_C16_CA_658713.indd 461 2/21/11 9:52 AM2/21/11 9:52 AM
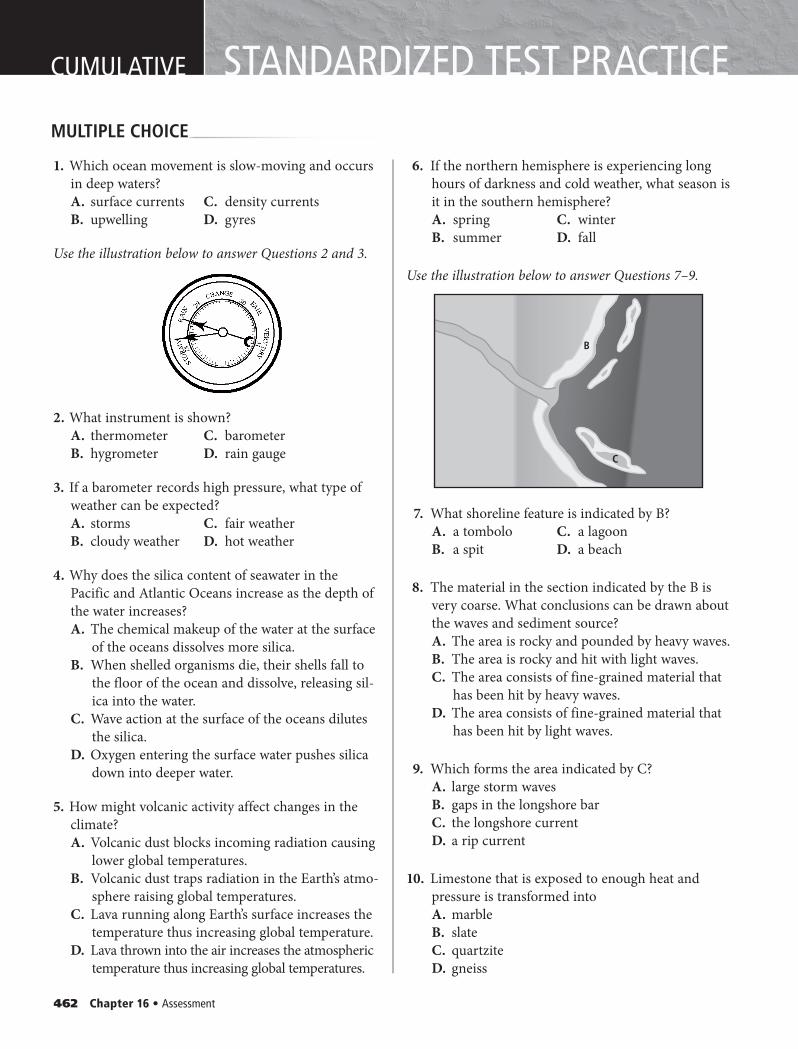
462 Chapter 16 • Assessment
MULTIPLE CHOICE
CUMULATIVE STANDARDIZED TEST PRACTICE
1. Which ocean movement is slow-moving and occurs in deep waters? A. surface currents C. density currentsB. upwelling D. gyres
Use the illustration below to answer Questions 2 and 3.
2. What instrument is shown? A. thermometer C. barometerB. hygrometer D. rain gauge
3. If a barometer records high pressure, what type of weather can be expected? A. storms C. fair weatherB. cloudy weather D. hot weather
4. Why does the silica content of seawater in the Pacific and Atlantic Oceans increase as the depth of the water increases? A. The chemical makeup of the water at the surface
of the oceans dissolves more silica.B. When shelled organisms die, their shells fall to
the floor of the ocean and dissolve, releasing sil-ica into the water.
C. Wave action at the surface of the oceans dilutes the silica.
D. Oxygen entering the surface water pushes silica down into deeper water.
5. How might volcanic activity affect changes in the climate? A. Volcanic dust blocks incoming radiation causing
lower global temperatures.B. Volcanic dust traps radiation in the Earth’s atmo-
sphere raising global temperatures.C. Lava running along Earth’s surface increases the
temperature thus increasing global temperature.D. Lava thrown into the air increases the atmospheric
temperature thus increasing global temperatures.
6. If the northern hemisphere is experiencing long hours of darkness and cold weather, what season is it in the southern hemisphere? A. spring C. winterB. summer D. fall
Use the illustration below to answer Questions 7–9.
7. What shoreline feature is indicated by B? A. a tombolo C. a lagoonB. a spit D. a beach
8. The material in the section indicated by the B is very coarse. What conclusions can be drawn about the waves and sediment source? A. The area is rocky and pounded by heavy waves.B. The area is rocky and hit with light waves.C. The area consists of fine-grained material that
has been hit by heavy waves.D. The area consists of fine-grained material that
has been hit by light waves.
9. Which forms the area indicated by C? A. large storm wavesB. gaps in the longshore barC. the longshore currentD. a rip current
10. Limestone that is exposed to enough heat and pressure is transformed into A. marbleB. slateC. quartziteD. gneiss
B
C
0462_0463_ESGEU_S_C16_STP_658713.indd 4620462_0463_ESGEU_S_C16_STP_658713.indd 462 2/16/11 12:12 PM2/16/11 12:12 PM
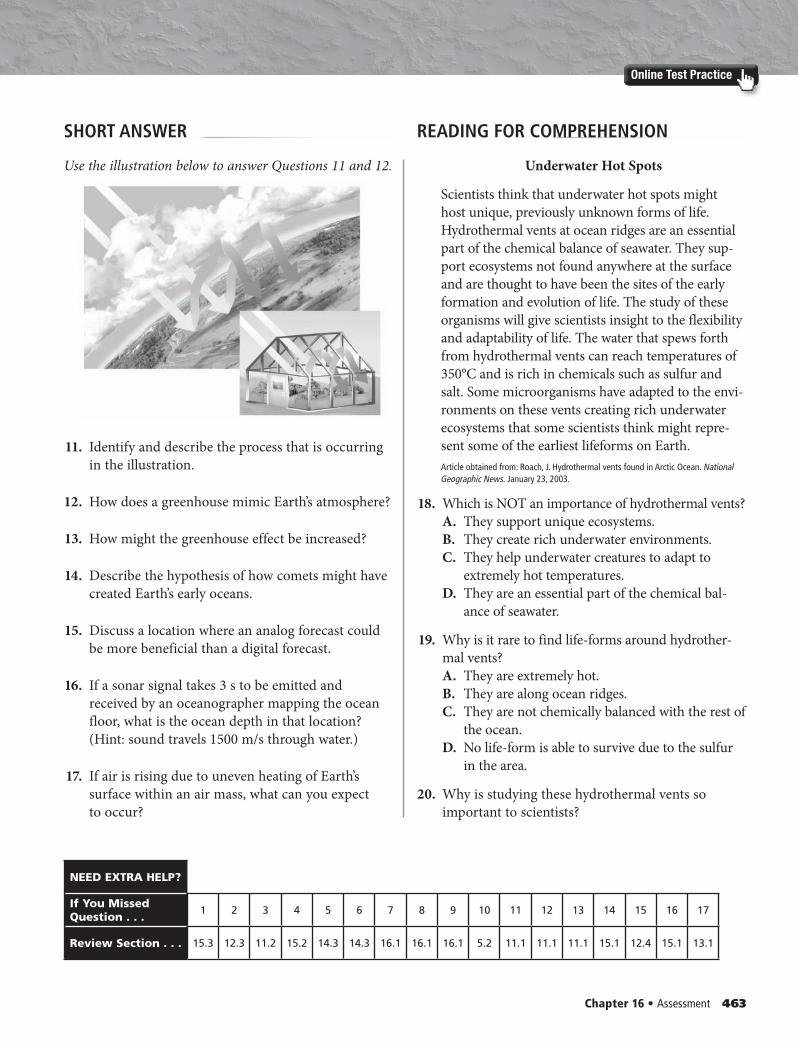
Chapter 16 • Assessment 463
Online Test Practice
SHORT ANSWER READING FOR COMPREHENSION
NEED EXTRA HELP?
If You Missed Question . . .
1 2 3 4 5 6 7 8 9 10 11 12 13 14 15 16 17
Review Section . . . 15.3 12.3 11.2 15.2 14.3 14.3 16.1 16.1 16.1 5.2 11.1 11.1 11.1 15.1 12.4 15.1 13.1
Use the illustration below to answer Questions 11 and 12.
11. Identify and describe the process that is occurring in the illustration.
12. How does a greenhouse mimic Earth’s atmosphere?
13. How might the greenhouse effect be increased?
14. Describe the hypothesis of how comets might have created Earth’s early oceans.
15. Discuss a location where an analog forecast could be more beneficial than a digital forecast.
16. If a sonar signal takes 3 s to be emitted and received by an oceanographer mapping the ocean floor, what is the ocean depth in that location? (Hint: sound travels 1500 m/s through water.)
17. If air is rising due to uneven heating of Earth’s surface within an air mass, what can you expect to occur?
Underwater Hot Spots
Scientists think that underwater hot spots might host unique, previously unknown forms of life. Hydrothermal vents at ocean ridges are an essential part of the chemical balance of seawater. They sup-port ecosystems not found anywhere at the surface and are thought to have been the sites of the early formation and evolution of life. The study of these organisms will give scientists insight to the flexibility and adaptability of life. The water that spews forth from hydrothermal vents can reach temperatures of 350°C and is rich in chemicals such as sulfur and salt. Some microorganisms have adapted to the envi-ronments on these vents creating rich underwater ecosystems that some scientists think might repre-sent some of the earliest lifeforms on Earth. Article obtained from: Roach, J. Hydrothermal vents found in Arctic Ocean. National Geographic News. January 23, 2003.
18. Which is NOT an importance of hydrothermal vents? A. They support unique ecosystems.B. They create rich underwater environments.C. They help underwater creatures to adapt to
extremely hot temperatures.D. They are an essential part of the chemical bal-
ance of seawater.
19. Why is it rare to find life-forms around hydrother-mal vents? A. They are extremely hot.B. They are along ocean ridges.C. They are not chemically balanced with the rest of
the ocean.D. No life-form is able to survive due to the sulfur
in the area.
20. Why is studying these hydrothermal vents so important to scientists?
0462_0463_ESGEU_S_C16_STP_658713.indd 4630462_0463_ESGEU_S_C16_STP_658713.indd 463 2/16/11 12:12 PM2/16/11 12:12 PM