Embed Size (px)
Citation preview
Molecular and Cellular Neuroscience 48 (2011) 9–19
Contents lists available at ScienceDirect
Molecular and Cellular Neuroscience
j ourna l homepage: www.e lsev ie r.com/ locate /ymcne
The carbohydrate CT1 is expressed in topographically fixed glomeruli in the mouseolfactory bulb
Katie E. Lineburg a, Daniel Amaya a, Jenny A. Ekberg a, Fatemeh Chehrehasa a, Alan Mackay-Sim a,Paul T. Martin c, Brian Key b, James A. St John a,⁎a National Centre for Adult Stem Cell Research, Eskitis Institute for Cell and Molecular Therapies, Griffith University, Nathan 4111, Brisbane, Australiab Brain Growth and Regeneration Laboratory, School of Biomedical Sciences, The University of Queensland, Brisbane 4072, Australiac Center for Gene Therapy, The Research Institute at Nationwide Children's Hospital, Ohio State University, Columbus, OH 43205, USA
⁎ Corresponding author. Fax: +61 7 3735 4255.E-mail address: [email protected] (J.A. St John)
1044-7431/$ – see front matter © 2011 Elsevier Inc. Aldoi:10.1016/j.mcn.2011.05.011
a b s t r a c t
a r t i c l e i n f oArticle history:Received 20 January 2011Revised 26 May 2011Accepted 31 May 2011Available online 12 June 2011
Keywords:GlycoproteinNeuronOlfactionTargetingGuidanceAxon
Cell surface carbohydrates define subpopulations of primary olfactory neurons whose axons terminate inselect glomeruli in the olfactory bulb. The combination of carbohydrates present on axon subpopulations hasbeen proposed to confer a unique identity that contributes to the establishment of the olfactory topographicmap. We have identified a novel subpopulation of primary olfactory neurons in mice that express bloodgroup carbohydrates with GalNAc-ß1,4[NeuAcα 2,3]Galß1 residues recognised by the CT1 antibody. The CT1carbohydrate has been shown tomodulate adhesionof nerve terminals to the extracellularmatrix and to synapticproteins. The axons of the CT1-positive primary olfactory neurons terminate in a subpopulation of glomeruli inthe olfactory bulb. Four lines of evidence support the view that CT1 glomeruli are topographically fixed. First, CT1glomeruliwere restrictedpredominantly to the dorsomedial olfactory bulb andwere absent from large patches ofthe ventrolateral bulb. Second, similar distributions were observed for CT1 glomeruli on both the left and rightolfactory bulbs of each animal, and between animals. Third, CT1 glomeruliwere typically present as small clustersof 2–4 glomeruli. Fourth, a single CT1 glomerulus was always apposed to the glomeruli innervated by axonsexpressing the M72 odorant receptor. We also show that the CT1 carbohydrate is lost in gain-of-functiontransgenic mice over-expressing the blood group A glycosyltransferase in which there is aberrant targeting ofM72 axons. Taken together, these results suggest that the CT1 carbohydrate, together with other carbohydrates,contributes to axon guidance during the establishment of the olfactory topographic map.
.
l rights reserved.
© 2011 Elsevier Inc. All rights reserved.
Introduction
In the mammalian olfactory system, primary olfactory neuronseach express one of ~1000 odorant receptors and are distributedmosaically throughout the olfactory epithelium (Buck andAxel, 1991).The axons that extend from the primary olfactory neurons fasciculatetogether in bundles of mixed axons, and project to the olfactory bulb.At this point they defasciculate and sort so that axons expressing thesame odorant receptor target specific glomeruli located in roughlytopographically fixed positions on the olfactory bulb surface. We havepreviously proposed a hierarchical model of axon guidance to explainhow axons from widely dispersed neurons expressing the sameodorant receptor are able to converge and form glomeruli (Key andSt John, 2002). Most of the predictions of this model including thepresence of zonal cues (Bozza et al., 2009), the complementarygradients of axon guidance ligands and their receptors (Cho et al.,2007; Takeuchi et al., 2010) and mosaically expressed sorting cues
(Cutforth et al., 2003; Kaneko-Goto et al., 2008; Serizawa et al., 2006)have been confirmed. While we and others have revealed that themosaic expression of cell surface carbohydrates plays a role in axonnavigation in the olfactory system (Lipscomb et al., 2002, 2003;Schwarting andHenion, 2007; St John et al., 2006),most likely throughselective fasciculation of axons involving lectin-like molecules (Pucheand Key, 1996; St John and Key, 1999; Storan et al., 2004), there is verylittle evidence suggesting that the expression of these molecules issufficiently fine-tuned to account for the observed topography in theprimary olfactory pathway.
Carbohydrates are expressed by primary olfactory axons and theirdifferential distribution provides a potential mechanism for confer-ring a unique identity to each subset of primary olfactory neurons, or a“glycocode” (St John and Key, 2005). Some carbohydrates areuniversally expressed by primary olfactory neurons whereas othersare expressed by large subpopulations of neurons. For example,blood group H carbohydrate is expressed on all axons (St John et al.,2006) while the NOC-7 carbohydrate with an α-extended lactoseries(NOC-7), recognised by the LA4 antibody, is widely expressed (Storanet al., 2004). In contrast, the N-acetyl-D-lactosamine carbohydraterecognised by Dolichos biflorus agglutinin (DBA) (Key and Akeson,
10 K.E. Lineburg et al. / Molecular and Cellular Neuroscience 48 (2011) 9–19
1993; Lipscomb et al., 2003), the lactosamine glycan LCG (Crandallet al., 2000), the NOC-8 carbohydrate recognised by KH10 (Storanet al., 2004), the NOC-3 carbohydrate (St John and Key, 2001) andthe N-acetyl-galactosamine linked alpha or beta to the 3 or 6 positionof galactose recognised by the lectin Wisteria floribunda agglutinin(WFA) (St John and Key, 2002) are expressed by large subsets ofneurons. We postulate that the differential expression of carbohy-drates by smaller subpopulations of primary olfactory neurons mayprovide a mechanism for axons to be uniquely coded and to assist insorting en route to their target glomeruli. One of the predictions ofthis hypothesis is that axons expressing these carbohydrates willterminate in topographically fixed locations in the olfactory bulb.
To test this ideawe examined the expression of Cad/Sda blood groupcarbohydrate antigens (GalNAc-ß1,4[NeuAcα 2,3]Galß1 residues),which are recognised by CT1 (cytotoxic T cells) antibodies (Lefrancoisand Bevan, 1985), in the mouse primary olfactory system. Inneuromuscular junctions, the CT1 carbohydrate is expressed in nerveterminals on glycoproteins that modulate adhesion to the extracellularmatrix (Xia and Martin, 2002; Xia et al., 2002) and, as such, is a strong
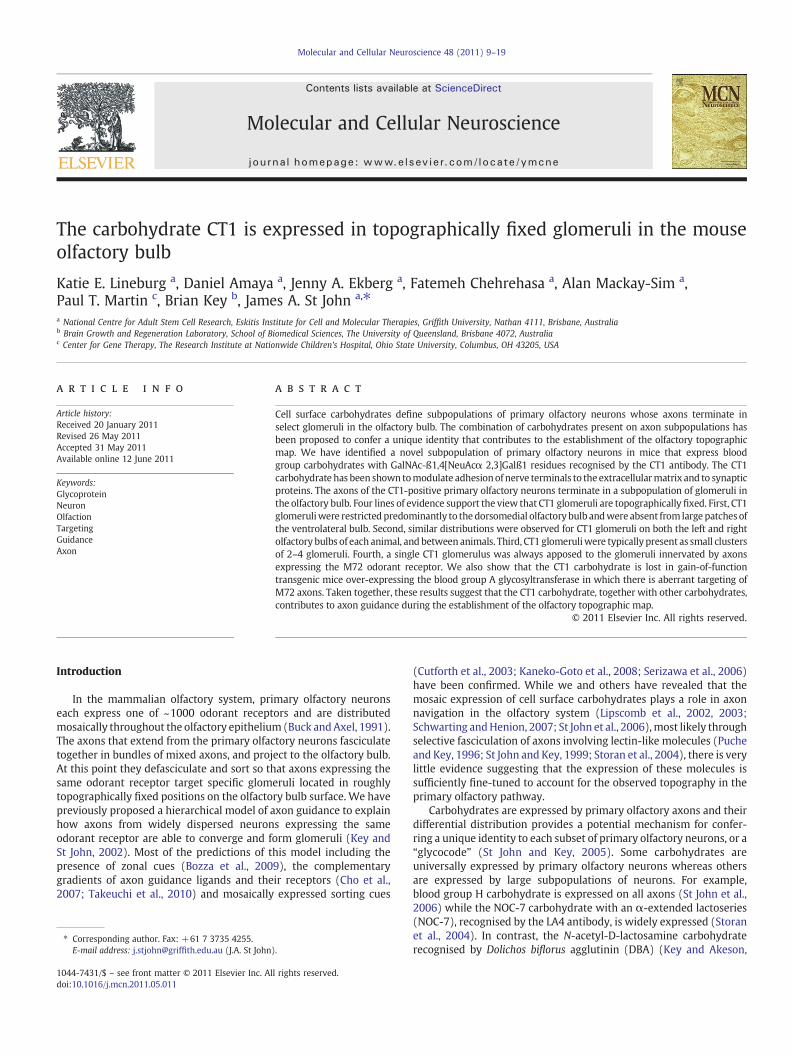
Fig. 1. CT1 is expressed by primary olfactory neurons. Panels show coronal cryostat sectionsOMP-ZsGreen transgenic mice that expressed ZsGreen in primary olfactory neurons (grimmunolabelled with anti-CT1 antibodies (red, arrow). (B) Higher power view of panel sho(C–E) In P7 animals, CT1-positive neurons (red) and their axons (double-headed arrow)image of C and D is shown in panel E. (F) In the adult, a proportion of neurons were labelledCT1-positive neurons were present in all regions of the olfactory epithelium in the rostral (Gthroughout the olfactory bulb. CT1 neurons in the medial epithelium (arrows) were presentNC: nasal cavity: lp: lamina propria; ob: olfactory bulb; oe: olfactory epithelium, s: septum
candidate for modulating axon guidance in the olfactory system. Wefound here that the CT1 carbohydrate is expressed by a novelsubpopulation of primary sensory olfactory neurons including theiraxons and their glomerular terminations in the olfactory bulb. Theglomeruli innervated by the CT1 expressing axons were presentpredominantly in the mediodorsal surface of the olfactory bulb inwhat appeared to be topographically fixed positions. These resultssupport theview that differential expressionof carbohydrates generatesa glycocode that confers a unique identity for primary olfactory axons.
Results
CT1 carbohydrate is expressed by a unique subpopulation of primaryolfactory neurons
The expression of CT1 carbohydrate was examined using immu-nohistochemistry on cryostat sections of the primary olfactory systemfrom both wild-type mice and OMP-ZsGreen transgenic mice whichexpress ZsGreen, a variant of green fluorescent protein, under the
through the olfactory epithelium and olfactory bulbs, with dorsal to the top. (A) In E18een), a few immature neurons that expressed low levels of ZsGreen were stronglywn in A. The axon of the CT1-positive neuron is indicated by the double-headed arrow.were more numerous. OMP-ZsGreen neurons are shown in D and the double-labelby CT1 antibodies using DAB immunohistochemistry. (G–H) In postnatal day 4 animals,) and caudal (H) portions of the epithelium. CT1 axons projected to glomeruli in regionsat a higher density compared to CT1 neurons in the lateral epithelium (arrowwith tail).. Scale bar is 50 μm in A, F, 25 μm in B–E, 300 μm in G–H.
11K.E. Lineburg et al. / Molecular and Cellular Neuroscience 48 (2011) 9–19
control of the OMP promoter (Ekberg et al., 2011; Windus et al.,2010). The robust fluorescence of primary olfactory neurons in theOMP-ZsGreen mice provides a simple means for characterising thelineal expression of the CT1 epitope in the olfactory system. OMP is amarker of more mature differentiated neurons in the olfactoryepithelium (Baker et al., 1989). CT1 expression was first detected onthe dendrites, perikarya and axons of a subset of OMP negativeprimary olfactory neurons at E18.5 (Fig. 1A–B). By postnatal day 7(P7), the expression of CT1 had increased and there were now manyOMP positive neurons co-expressing this carbohydrate antigen(Fig. 1C–E). A small subset of these CT1-positive neurons was stillnot expressing OMP (Fig. 1E, arrows). In adults, the CT1 positiveneurons were stochastically dispersed throughout all regions of theolfactory epithelium in the nasal cavity (Fig. 1F–H), but the density ofstained cells was clearly not uniformwith some regions having higherdensity of CT1 neurons (arrows in Fig. 1G) while other regions hadlower density (arrow with tail, Fig. 1G). We estimated the proportionof neurons that expressed CT1 by counting cells throughout the nasalcavity in coronal sections that covered the medial–lateral and rostral–caudal range of the nasal cavity. We found that around 15–20% ofolfactory neurons (identified by expression of ZsGreen) expressed theCT1 epitope in the adult.
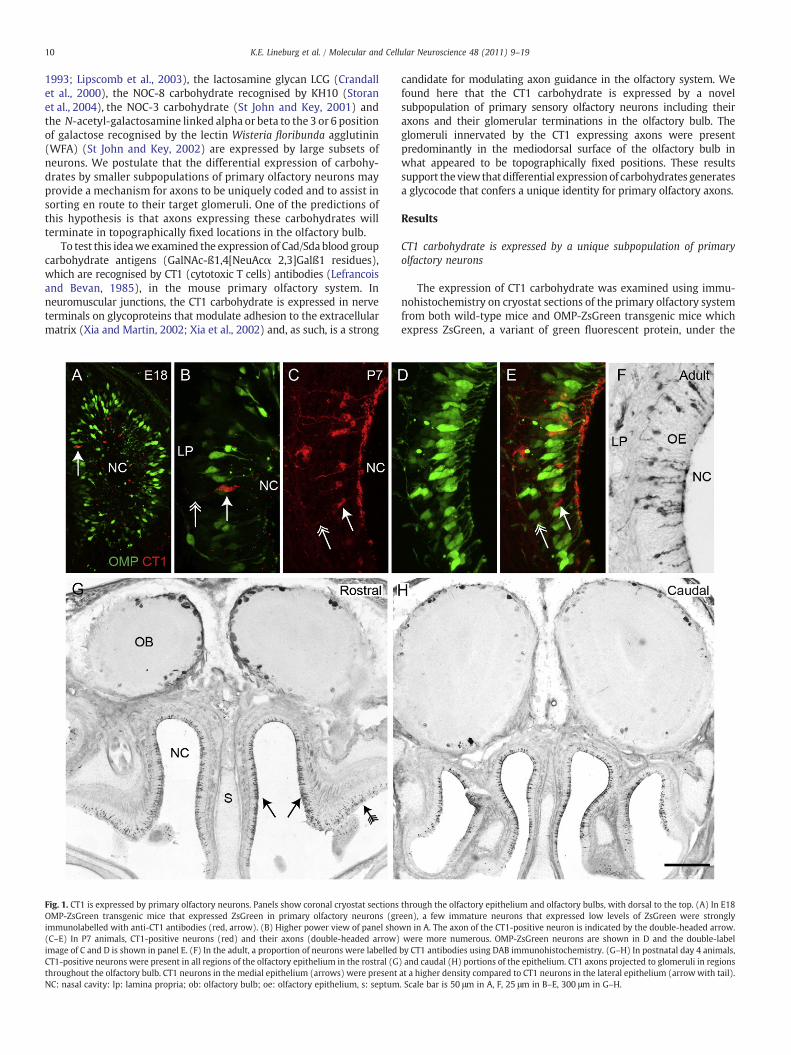
Within the olfactory bulb, the CT1 positive axons projected toclusters of glomeruli positioned predominantly at the medial anddorsal margins along the rostral–caudal length of the bulb (Fig. 2A–C).
Fig. 2. Expression of CT1 in the olfactory bulb. Panels show coronal cryostat sectimmunohistochemistry, with dorsal to the top and medial to the left. (A–C) In sections fglomeruli (arrowheads) along the medial surface (A) as well as scattered glomeruli in thearrowhead in C). (D–F) Higher power images of glomeruli in the dorsal (D) and ventral (E) reGlomeruli expressing high levels of CT1 (arrow in E, F) were adjacent to glomeruli that exprenegative for CT1 expression (dashed circles in F) were in close proximity. (G–H) Other examwhile others expressed lower levels (arrowhead) and adjacent glomeruli were completely neepithelium. Scale bar is 600 μm in A–C; 50 μm in D–F; 75 μm in G–H.
In these regions, the CT1 glomeruli typically appeared discretelyclustered as pairs or quadruples which were often separated byunstained glomeruli. These clusters contained glomeruli which werestrongly (arrows, Fig. 2D–H) or weakly (arrowheads, Fig. 2D–H)stained. Only in regions containing few stained glomeruli wereisolated single-stained glomeruli evident (unfilled arrowhead, Fig. 2C;arrow with tail in Fig. 3A, B).
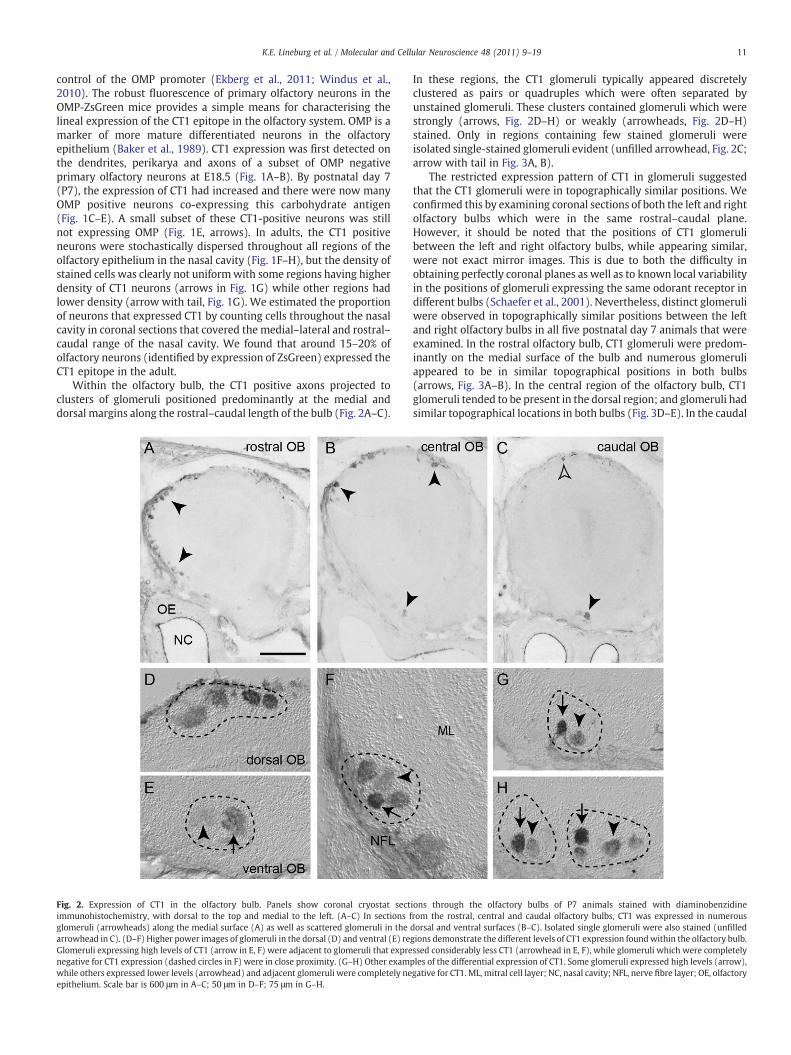
The restricted expression pattern of CT1 in glomeruli suggestedthat the CT1 glomeruli were in topographically similar positions. Weconfirmed this by examining coronal sections of both the left and rightolfactory bulbs which were in the same rostral–caudal plane.However, it should be noted that the positions of CT1 glomerulibetween the left and right olfactory bulbs, while appearing similar,were not exact mirror images. This is due to both the difficulty inobtaining perfectly coronal planes as well as to known local variabilityin the positions of glomeruli expressing the same odorant receptor indifferent bulbs (Schaefer et al., 2001). Nevertheless, distinct glomeruliwere observed in topographically similar positions between the leftand right olfactory bulbs in all five postnatal day 7 animals that wereexamined. In the rostral olfactory bulb, CT1 glomeruli were predom-inantly on the medial surface of the bulb and numerous glomeruliappeared to be in similar topographical positions in both bulbs(arrows, Fig. 3A–B). In the central region of the olfactory bulb, CT1glomeruli tended to be present in the dorsal region; and glomeruli hadsimilar topographical locations in both bulbs (Fig. 3D–E). In the caudal
ions through the olfactory bulbs of P7 animals stained with diaminobenzidinerom the rostral, central and caudal olfactory bulbs, CT1 was expressed in numerousdorsal and ventral surfaces (B–C). Isolated single glomeruli were also stained (unfilledgions demonstrate the different levels of CT1 expression foundwithin the olfactory bulb.ssed considerably less CT1 (arrowhead in E, F), while glomeruli which were completelyples of the differential expression of CT1. Some glomeruli expressed high levels (arrow),gative for CT1. ML, mitral cell layer; NC, nasal cavity; NFL, nerve fibre layer; OE, olfactory
Fig. 3. Axons that express CT1 project to glomeruli in topographically fixed positions. Panels show coronal sections of the olfactory bulb of P7 animals with dorsal to the top. CT1immunostaining of the left olfactory bulb is shown in A, D, and G; the right olfactory bulb is shown in B, E, and H; DBA lectin staining is shown in C, F, and I. Immunostaining for CT1 insections from the left and right olfactory bulbs in the equivalent rostro-caudal plane revealed that axons that express CT1 project to glomeruli (arrows) in clusters that were intopographically fixed positions; compare A–B, D–E, and G–H. Isolated single glomeruli were also stained (e.g. arrows with tail in A, and B). The DBA stained glomeruli were morenumerous but were in topographically similar positions (C, F, and I); sections were stained with haemotoxylin. (J–L) CT1 was expressed by glomeruli that also expressed DBA(arrow)whereas other glomeruli that expressed DBA (dashed oval) did not express CT1. Arrowheads show blood vessels that were immunostained by CT1. GL, glomerular layer; ML,mitral cell layer; NFL, nerve fibre layer. Scale bar is 500 μm in A–I; 50 μm in J–L.
12 K.E. Lineburg et al. / Molecular and Cellular Neuroscience 48 (2011) 9–19
13K.E. Lineburg et al. / Molecular and Cellular Neuroscience 48 (2011) 9–19
region of the olfactory bulb, CT1 glomeruli were scattered throughoutall surfaces, again with glomeruli having similar topographicalpositions in both bulbs (Fig. 3G–H).
The distribution of the CT1 glomeruli was reminiscent of thedistribution of the glomeruli stained by the lectin D. biflorus agglutinin(DBA) (Key and Akeson, 1993). We next compared the distribution ofCT1 glomeruli to that of DBA glomeruli (Fig. 3). The DBA glomeruliwere scattered around the olfactory bulb and were intermingled withglomeruli that did not express DBA ligands (Fig. 3C, F and I). Althoughthe CT1 glomeruli were located in positions similar to those of the DBAglomeruli (arrows, Fig. 3C, F and I), it was clear that there were manymore DBA stained glomeruli in the olfactory bulb. We next useddouble staining to show that the CT1 glomeruli were a subset of theDBA reactive glomeruli (Fig. 3J–L). Thus the CT1 and DBA boundcarbohydrates are clearly molecularly distinct and CT1 is expressed bya subset of the neurons that expresses the carbohydrate recognised byDBA.
CT1 is expressed in the accessory olfactory system during development
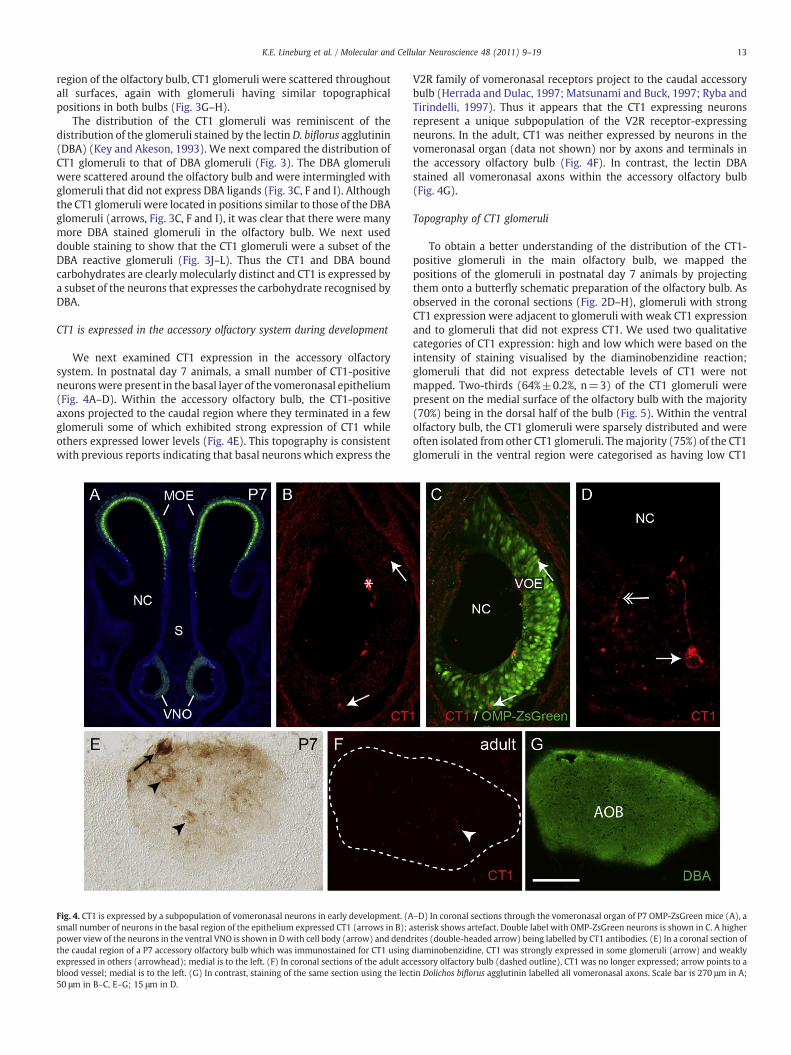
We next examined CT1 expression in the accessory olfactorysystem. In postnatal day 7 animals, a small number of CT1-positiveneuronswere present in the basal layer of the vomeronasal epithelium(Fig. 4A–D). Within the accessory olfactory bulb, the CT1-positiveaxons projected to the caudal region where they terminated in a fewglomeruli some of which exhibited strong expression of CT1 whileothers expressed lower levels (Fig. 4E). This topography is consistentwith previous reports indicating that basal neurons which express the
Fig. 4. CT1 is expressed by a subpopulation of vomeronasal neurons in early development. (Asmall number of neurons in the basal region of the epithelium expressed CT1 (arrows in B); apower view of the neurons in the ventral VNO is shown in Dwith cell body (arrow) and dendthe caudal region of a P7 accessory olfactory bulb which was immunostained for CT1 usingexpressed in others (arrowhead); medial is to the left. (F) In coronal sections of the adult accblood vessel; medial is to the left. (G) In contrast, staining of the same section using the lec50 μm in B–C, E–G; 15 μm in D.
V2R family of vomeronasal receptors project to the caudal accessorybulb (Herrada and Dulac, 1997; Matsunami and Buck, 1997; Ryba andTirindelli, 1997). Thus it appears that the CT1 expressing neuronsrepresent a unique subpopulation of the V2R receptor-expressingneurons. In the adult, CT1 was neither expressed by neurons in thevomeronasal organ (data not shown) nor by axons and terminals inthe accessory olfactory bulb (Fig. 4F). In contrast, the lectin DBAstained all vomeronasal axons within the accessory olfactory bulb(Fig. 4G).
Topography of CT1 glomeruli
To obtain a better understanding of the distribution of the CT1-positive glomeruli in the main olfactory bulb, we mapped thepositions of the glomeruli in postnatal day 7 animals by projectingthem onto a butterfly schematic preparation of the olfactory bulb. Asobserved in the coronal sections (Fig. 2D–H), glomeruli with strongCT1 expression were adjacent to glomeruli with weak CT1 expressionand to glomeruli that did not express CT1. We used two qualitativecategories of CT1 expression: high and low which were based on theintensity of staining visualised by the diaminobenzidine reaction;glomeruli that did not express detectable levels of CT1 were notmapped. Two-thirds (64%±0.2%, n=3) of the CT1 glomeruli werepresent on the medial surface of the olfactory bulb with the majority(70%) being in the dorsal half of the bulb (Fig. 5). Within the ventralolfactory bulb, the CT1 glomeruli were sparsely distributed and wereoften isolated from other CT1 glomeruli. Themajority (75%) of the CT1glomeruli in the ventral region were categorised as having low CT1
–D) In coronal sections through the vomeronasal organ of P7 OMP-ZsGreen mice (A), asterisk shows artefact. Double label with OMP-ZsGreen neurons is shown in C. A higherrites (double-headed arrow) being labelled by CT1 antibodies. (E) In a coronal section ofdiaminobenzidine, CT1 was strongly expressed in some glomeruli (arrow) and weaklyessory olfactory bulb (dashed outline), CT1 was no longer expressed; arrow points to atin Dolichos biflorus agglutinin labelled all vomeronasal axons. Scale bar is 270 μm in A;
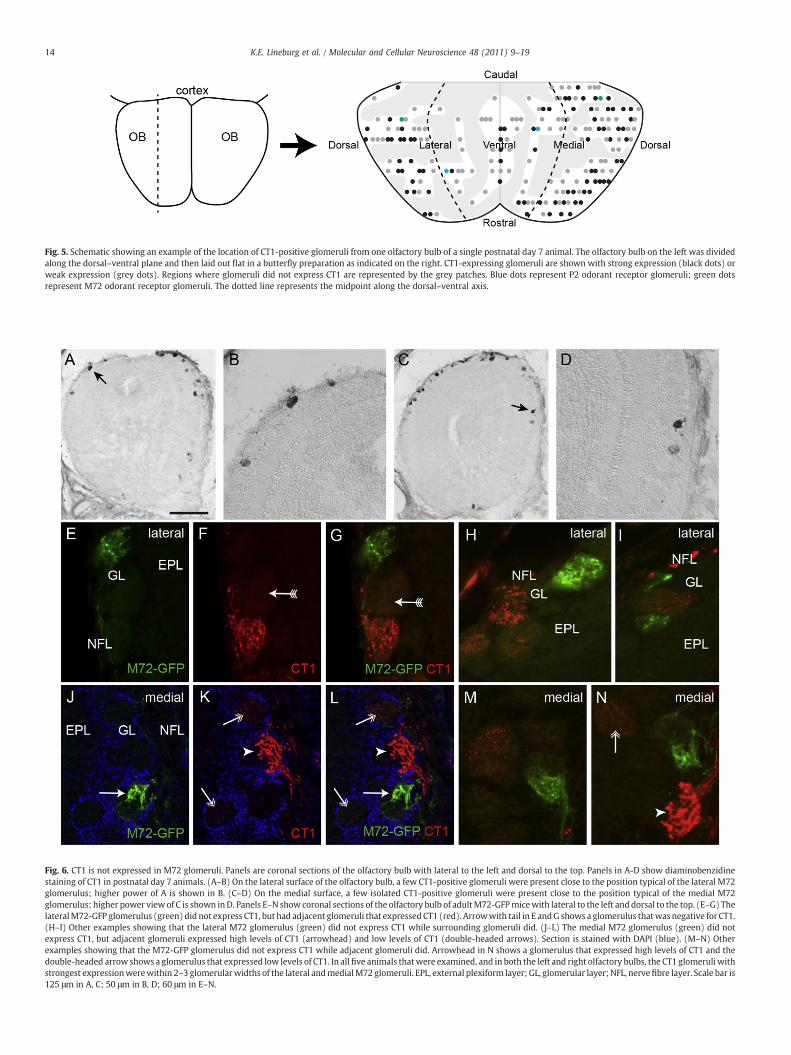
Fig. 6. CT1 is not expressed in M72 glomeruli. Panels are coronal sections of the olfactory bulb with lateral to the left and dorsal to the top. Panels in A-D show diaminobenzidinestaining of CT1 in postnatal day 7 animals. (A–B) On the lateral surface of the olfactory bulb, a few CT1-positive glomeruli were present close to the position typical of the lateral M72glomerulus; higher power of A is shown in B. (C–D) On the medial surface, a few isolated CT1-positive glomeruli were present close to the position typical of the medial M72glomerulus; higher power view of C is shown inD. Panels E–N show coronal sections of the olfactory bulb of adultM72-GFPmicewith lateral to the left and dorsal to the top. (E–G) ThelateralM72-GFP glomerulus (green) did not express CT1, but had adjacent glomeruli that expressed CT1 (red). Arrowwith tail in E andG shows a glomerulus thatwas negative for CT1.(H–I) Other examples showing that the lateral M72 glomerulus (green) did not express CT1 while surrounding glomeruli did. (J–L) The medial M72 glomerulus (green) did notexpress CT1, but adjacent glomeruli expressed high levels of CT1 (arrowhead) and low levels of CT1 (double-headed arrows). Section is stained with DAPI (blue). (M–N) Otherexamples showing that the M72-GFP glomerulus did not express CT1 while adjacent glomeruli did. Arrowhead in N shows a glomerulus that expressed high levels of CT1 and thedouble-headed arrow shows a glomerulus that expressed low levels of CT1. In allfive animals thatwere examined, and in both the left and right olfactory bulbs, the CT1 glomeruli withstrongest expressionwerewithin 2–3 glomerularwidths of the lateral andmedialM72 glomeruli. EPL, external plexiform layer; GL, glomerular layer; NFL, nervefibre layer. Scale bar is125 μm in A, C; 50 μm in B, D; 60 μm in E–N.
Fig. 5. Schematic showing an example of the location of CT1-positive glomeruli from one olfactory bulb of a single postnatal day 7 animal. The olfactory bulb on the left was dividedalong the dorsal–ventral plane and then laid out flat in a butterfly preparation as indicated on the right. CT1-expressing glomeruli are shown with strong expression (black dots) orweak expression (grey dots). Regions where glomeruli did not express CT1 are represented by the grey patches. Blue dots represent P2 odorant receptor glomeruli; green dotsrepresent M72 odorant receptor glomeruli. The dotted line represents the midpoint along the dorsal–ventral axis.
14 K.E. Lineburg et al. / Molecular and Cellular Neuroscience 48 (2011) 9–19
15K.E. Lineburg et al. / Molecular and Cellular Neuroscience 48 (2011) 9–19
staining. In the dorsal olfactory bulb, there was an equal proportion ofhigh and low expressing CT1 glomeruli. Schematic maps from threedifferent animals were generated and showed overall similarities, yetexhibited minor positional differences for individual glomeruli asexpected (Schaefer et al., 2001). The map shown in Fig. 5 is from asingle animal.
Relationship of CT1 glomeruli to defined glomeruli
The highly restricted targeting of CT1-expressing axons in theolfactory bulb raised the possibility that there was a spatial
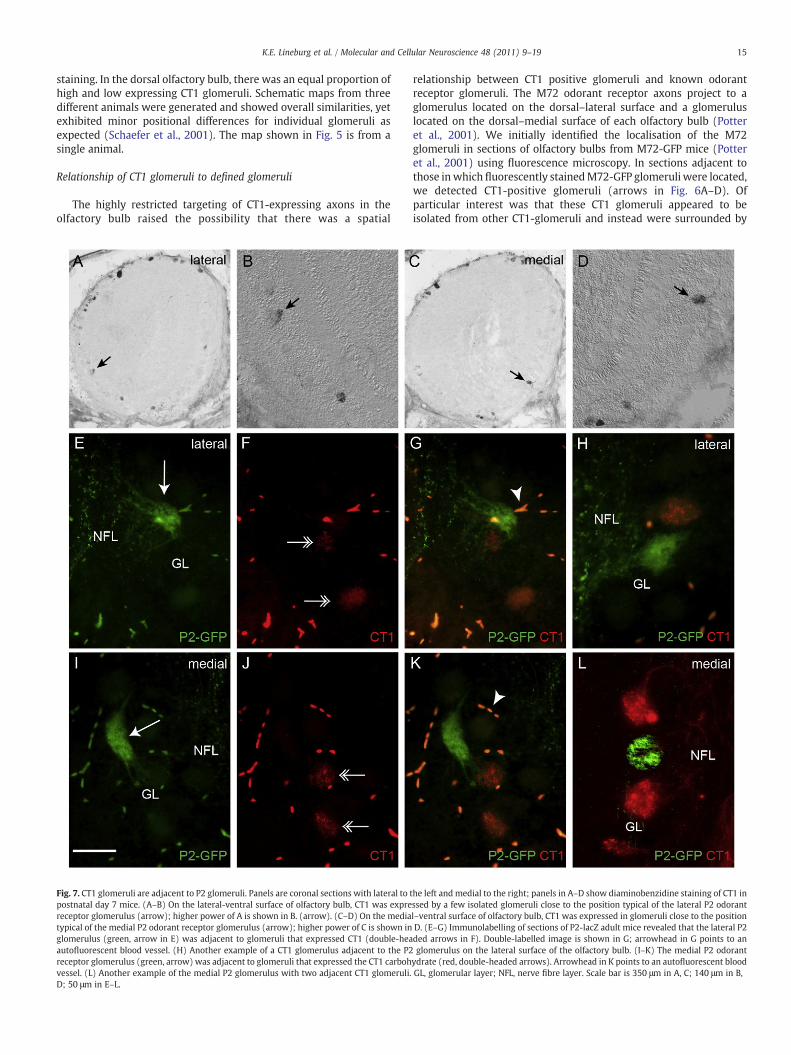
Fig. 7. CT1 glomeruli are adjacent to P2 glomeruli. Panels are coronal sections with lateral to tpostnatal day 7 mice. (A–B) On the lateral-ventral surface of olfactory bulb, CT1 was exprereceptor glomerulus (arrow); higher power of A is shown in B. (arrow). (C–D) On the mediatypical of the medial P2 odorant receptor glomerulus (arrow); higher power of C is shown inglomerulus (green, arrow in E) was adjacent to glomeruli that expressed CT1 (double-heaautofluorescent blood vessel. (H) Another example of a CT1 glomerulus adjacent to the P2receptor glomerulus (green, arrow) was adjacent to glomeruli that expressed the CT1 carbohvessel. (L) Another example of the medial P2 glomerulus with two adjacent CT1 glomeruli.D; 50 μm in E–L.
relationship between CT1 positive glomeruli and known odorantreceptor glomeruli. The M72 odorant receptor axons project to aglomerulus located on the dorsal–lateral surface and a glomeruluslocated on the dorsal–medial surface of each olfactory bulb (Potteret al., 2001). We initially identified the localisation of the M72glomeruli in sections of olfactory bulbs from M72-GFP mice (Potteret al., 2001) using fluorescence microscopy. In sections adjacent tothose in which fluorescently stainedM72-GFP glomeruli were located,we detected CT1-positive glomeruli (arrows in Fig. 6A–D). Ofparticular interest was that these CT1 glomeruli appeared to beisolated from other CT1-glomeruli and instead were surrounded by
he left and medial to the right; panels in A–D show diaminobenzidine staining of CT1 inssed by a few isolated glomeruli close to the position typical of the lateral P2 odorantl–ventral surface of olfactory bulb, CT1 was expressed in glomeruli close to the positionD. (E–G) Immunolabelling of sections of P2-lacZ adult mice revealed that the lateral P2ded arrows in F). Double-labelled image is shown in G; arrowhead in G points to anglomerulus on the lateral surface of the olfactory bulb. (I–K) The medial P2 odorant
ydrate (red, double-headed arrows). Arrowhead in K points to an autofluorescent bloodGL, glomerular layer; NFL, nerve fibre layer. Scale bar is 350 μm in A, C; 140 μm in B,
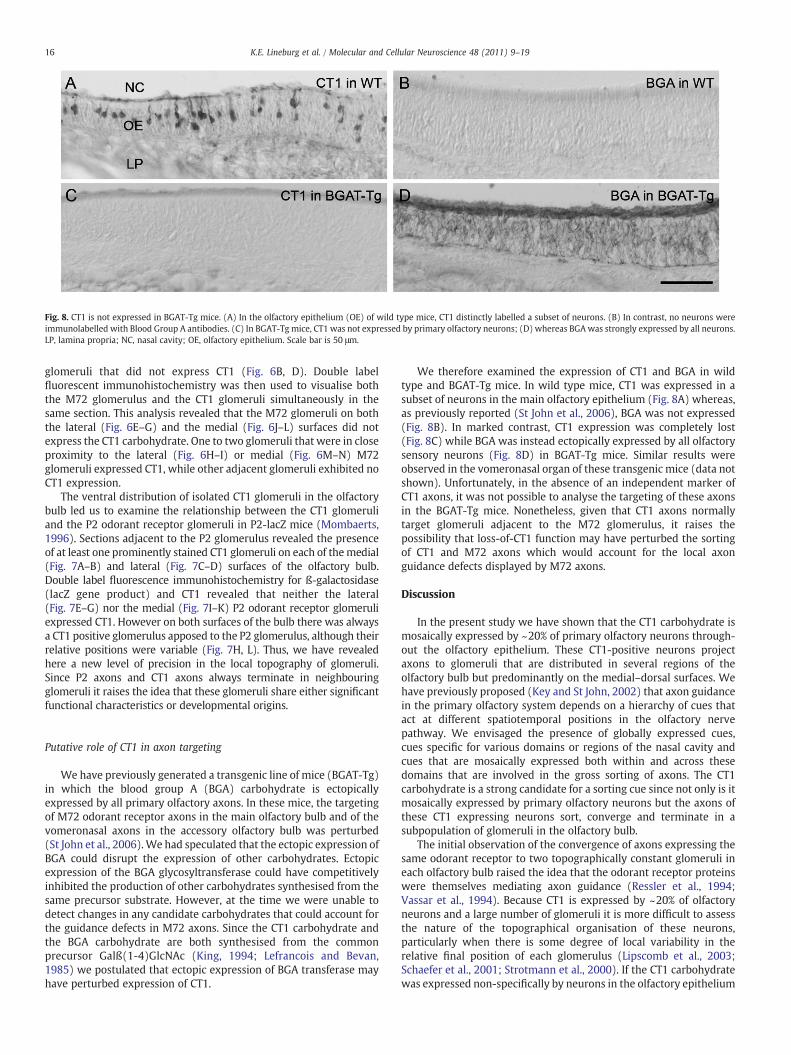
Fig. 8. CT1 is not expressed in BGAT-Tg mice. (A) In the olfactory epithelium (OE) of wild type mice, CT1 distinctly labelled a subset of neurons. (B) In contrast, no neurons wereimmunolabelled with Blood Group A antibodies. (C) In BGAT-Tg mice, CT1 was not expressed by primary olfactory neurons; (D) whereas BGA was strongly expressed by all neurons.LP, lamina propria; NC, nasal cavity; OE, olfactory epithelium. Scale bar is 50 μm.
16 K.E. Lineburg et al. / Molecular and Cellular Neuroscience 48 (2011) 9–19
glomeruli that did not express CT1 (Fig. 6B, D). Double labelfluorescent immunohistochemistry was then used to visualise boththe M72 glomerulus and the CT1 glomeruli simultaneously in thesame section. This analysis revealed that the M72 glomeruli on boththe lateral (Fig. 6E–G) and the medial (Fig. 6J–L) surfaces did notexpress the CT1 carbohydrate. One to two glomeruli that were in closeproximity to the lateral (Fig. 6H–I) or medial (Fig. 6M–N) M72glomeruli expressed CT1, while other adjacent glomeruli exhibited noCT1 expression.
The ventral distribution of isolated CT1 glomeruli in the olfactorybulb led us to examine the relationship between the CT1 glomeruliand the P2 odorant receptor glomeruli in P2-lacZ mice (Mombaerts,1996). Sections adjacent to the P2 glomerulus revealed the presenceof at least one prominently stained CT1 glomeruli on each of themedial(Fig. 7A–B) and lateral (Fig. 7C–D) surfaces of the olfactory bulb.Double label fluorescence immunohistochemistry for ß-galactosidase(lacZ gene product) and CT1 revealed that neither the lateral(Fig. 7E–G) nor the medial (Fig. 7I–K) P2 odorant receptor glomeruliexpressed CT1. However on both surfaces of the bulb there was alwaysa CT1 positive glomerulus apposed to the P2 glomerulus, although theirrelative positions were variable (Fig. 7H, L). Thus, we have revealedhere a new level of precision in the local topography of glomeruli.Since P2 axons and CT1 axons always terminate in neighbouringglomeruli it raises the idea that these glomeruli share either significantfunctional characteristics or developmental origins.
Putative role of CT1 in axon targeting
We have previously generated a transgenic line of mice (BGAT-Tg)in which the blood group A (BGA) carbohydrate is ectopicallyexpressed by all primary olfactory axons. In these mice, the targetingof M72 odorant receptor axons in the main olfactory bulb and of thevomeronasal axons in the accessory olfactory bulb was perturbed(St John et al., 2006).We had speculated that the ectopic expression ofBGA could disrupt the expression of other carbohydrates. Ectopicexpression of the BGA glycosyltransferase could have competitivelyinhibited the production of other carbohydrates synthesised from thesame precursor substrate. However, at the time we were unable todetect changes in any candidate carbohydrates that could account forthe guidance defects in M72 axons. Since the CT1 carbohydrate andthe BGA carbohydrate are both synthesised from the commonprecursor Galß(1-4)GlcNAc (King, 1994; Lefrancois and Bevan,1985) we postulated that ectopic expression of BGA transferase mayhave perturbed expression of CT1.
We therefore examined the expression of CT1 and BGA in wildtype and BGAT-Tg mice. In wild type mice, CT1 was expressed in asubset of neurons in the main olfactory epithelium (Fig. 8A) whereas,as previously reported (St John et al., 2006), BGA was not expressed(Fig. 8B). In marked contrast, CT1 expression was completely lost(Fig. 8C) while BGA was instead ectopically expressed by all olfactorysensory neurons (Fig. 8D) in BGAT-Tg mice. Similar results wereobserved in the vomeronasal organ of these transgenic mice (data notshown). Unfortunately, in the absence of an independent marker ofCT1 axons, it was not possible to analyse the targeting of these axonsin the BGAT-Tg mice. Nonetheless, given that CT1 axons normallytarget glomeruli adjacent to the M72 glomerulus, it raises thepossibility that loss-of-CT1 function may have perturbed the sortingof CT1 and M72 axons which would account for the local axonguidance defects displayed by M72 axons.
Discussion
In the present study we have shown that the CT1 carbohydrate ismosaically expressed by ~20% of primary olfactory neurons through-out the olfactory epithelium. These CT1-positive neurons projectaxons to glomeruli that are distributed in several regions of theolfactory bulb but predominantly on the medial–dorsal surfaces. Wehave previously proposed (Key and St John, 2002) that axon guidancein the primary olfactory system depends on a hierarchy of cues thatact at different spatiotemporal positions in the olfactory nervepathway. We envisaged the presence of globally expressed cues,cues specific for various domains or regions of the nasal cavity andcues that are mosaically expressed both within and across thesedomains that are involved in the gross sorting of axons. The CT1carbohydrate is a strong candidate for a sorting cue since not only is itmosaically expressed by primary olfactory neurons but the axons ofthese CT1 expressing neurons sort, converge and terminate in asubpopulation of glomeruli in the olfactory bulb.
The initial observation of the convergence of axons expressing thesame odorant receptor to two topographically constant glomeruli ineach olfactory bulb raised the idea that the odorant receptor proteinswere themselves mediating axon guidance (Ressler et al., 1994;Vassar et al., 1994). Because CT1 is expressed by ~20% of olfactoryneurons and a large number of glomeruli it is more difficult to assessthe nature of the topographical organisation of these neurons,particularly when there is some degree of local variability in therelative final position of each glomerulus (Lipscomb et al., 2003;Schaefer et al., 2001; Strotmann et al., 2000). If the CT1 carbohydratewas expressed non-specifically by neurons in the olfactory epithelium
17K.E. Lineburg et al. / Molecular and Cellular Neuroscience 48 (2011) 9–19
then it would be expected that the axons of these CT1-expressingneurons would terminate in glomeruli which were not topographi-cally fixed, either in the left and right olfactory bulbs of the sameanimal or in bulbs from different animals. Several observations hereindicate that this is not the case, and that CT1 expression must betightly controlled and probably linked somehow to the expression ofcertain odorant receptor genes. CT1 axons clearly terminate in asubpopulation of glomeruli. These glomeruli are restricted to specificregions on the surface of the olfactory bulb. While they are moreconcentrated on the dorsomedial surface of the bulb, there arepatches located in spatially defined regions of the ventromedial andventrolateral olfactory bulb which are totally devoid of CT1 glomeruli.Within the dorsomedial olfactory bulb, the CT1 glomeruli are typicallygrouped as discrete clusters of 2–4 apposing glomeruli. Despitetechnical limitations associated with obtaining sections in the samecoronal plane it was possible to identify certain glomeruli whichappeared to be in relatively constant positions in separate olfactorybulbs. These glomeruli could be identified both on the medial andlateral surfaces of the olfactory bulb. Thus, CT1 glomeruli are notstochastically distributed across the surface of the olfactory bulb. Theaxons of CT1 expressing primary olfactory neurons are clearlyconverging and form specific glomeruli within topographicallydefined regions. Moreover, within these regions the CT1 glomeruliare spatially restricted.
Notwithstanding the above results, the strongest evidence thatrefutes the idea that CT1 is expressed non-specifically by neurons inthe olfactory epithelium is the observation that CT1 was neverexpressed by olfactory neurons expressing either the P2 or the M72odorant receptors. More importantly was the observation that a CT1glomerulus was always apposed directly to the M72 glomerulus onboth the lateral and medial surfaces of the olfactory bulb. Very little isunderstood about the spatial arrangements of glomeruli at the level ofresolution of individual glomeruli. Using gene targeting approaches ithas been shown that two genetically distinct populations of axonsexpressing different members of the OR37 odorant receptor genefamily typically terminated in glomeruli that were directly apposed toeach other in 80% of cases (Strotmann et al., 2000). However it is notthe case that all families of related receptor genes target apposingglomeruli. The axons expressing the P2, P3 and P4 receptor genesterminate closely together but not in adjacent glomeruli (Feinsteinet al., 2004). The closely apposed localisation of the CT1 and P2glomeruli appears similar to the spatial relationship of the OR37 geneswhile the separated CT1 and M72 glomeruli are similar to thatobserved for the P2 subfamily. Taken together, the results indicatethat the CT1 carbohydrate is most likely expressed by primaryolfactory neurons which also consistently and specifically express anumber of different odorant receptor genes. While these genes
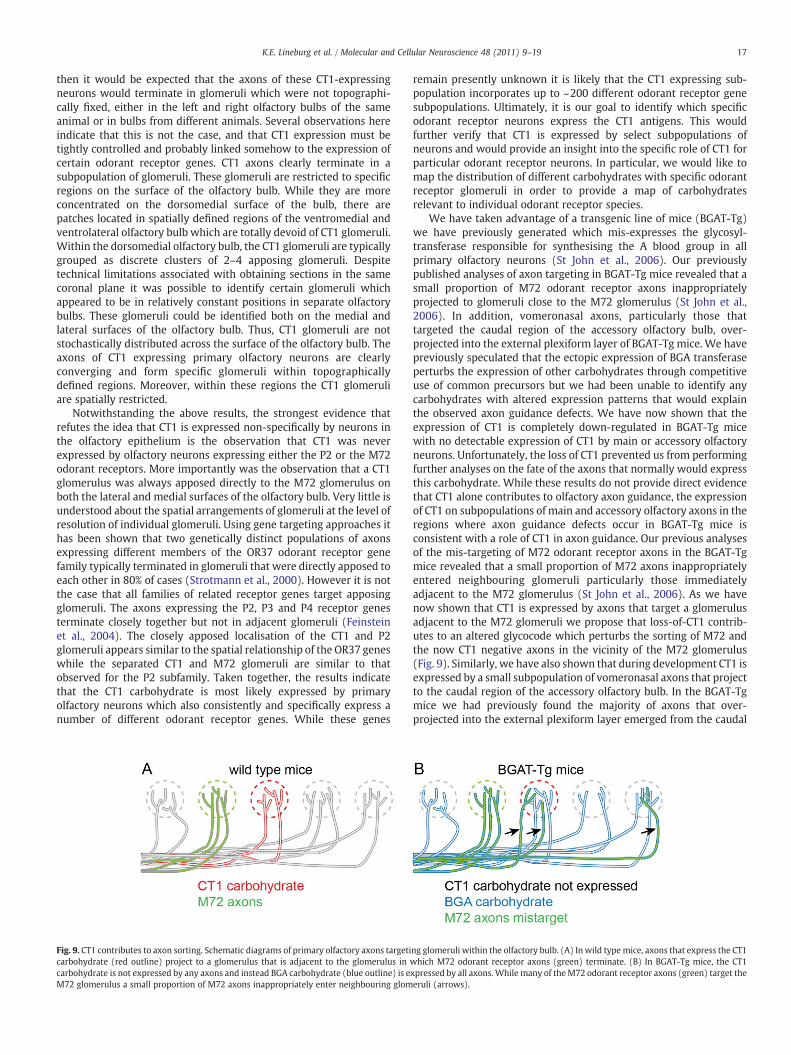
Fig. 9. CT1 contributes to axon sorting. Schematic diagrams of primary olfactory axons targeticarbohydrate (red outline) project to a glomerulus that is adjacent to the glomerulus incarbohydrate is not expressed by any axons and instead BGA carbohydrate (blue outline) is eM72 glomerulus a small proportion of M72 axons inappropriately enter neighbouring glom
remain presently unknown it is likely that the CT1 expressing sub-population incorporates up to ~200 different odorant receptor genesubpopulations. Ultimately, it is our goal to identify which specificodorant receptor neurons express the CT1 antigens. This wouldfurther verify that CT1 is expressed by select subpopulations ofneurons and would provide an insight into the specific role of CT1 forparticular odorant receptor neurons. In particular, we would like tomap the distribution of different carbohydrates with specific odorantreceptor glomeruli in order to provide a map of carbohydratesrelevant to individual odorant receptor species.
We have taken advantage of a transgenic line of mice (BGAT-Tg)we have previously generated which mis-expresses the glycosyl-transferase responsible for synthesising the A blood group in allprimary olfactory neurons (St John et al., 2006). Our previouslypublished analyses of axon targeting in BGAT-Tg mice revealed that asmall proportion of M72 odorant receptor axons inappropriatelyprojected to glomeruli close to the M72 glomerulus (St John et al.,2006). In addition, vomeronasal axons, particularly those thattargeted the caudal region of the accessory olfactory bulb, over-projected into the external plexiform layer of BGAT-Tg mice. We havepreviously speculated that the ectopic expression of BGA transferaseperturbs the expression of other carbohydrates through competitiveuse of common precursors but we had been unable to identify anycarbohydrates with altered expression patterns that would explainthe observed axon guidance defects. We have now shown that theexpression of CT1 is completely down-regulated in BGAT-Tg micewith no detectable expression of CT1 by main or accessory olfactoryneurons. Unfortunately, the loss of CT1 prevented us from performingfurther analyses on the fate of the axons that normally would expressthis carbohydrate. While these results do not provide direct evidencethat CT1 alone contributes to olfactory axon guidance, the expressionof CT1 on subpopulations of main and accessory olfactory axons in theregions where axon guidance defects occur in BGAT-Tg mice isconsistent with a role of CT1 in axon guidance. Our previous analysesof the mis-targeting of M72 odorant receptor axons in the BGAT-Tgmice revealed that a small proportion of M72 axons inappropriatelyentered neighbouring glomeruli particularly those immediatelyadjacent to the M72 glomerulus (St John et al., 2006). As we havenow shown that CT1 is expressed by axons that target a glomerulusadjacent to the M72 glomeruli we propose that loss-of-CT1 contrib-utes to an altered glycocode which perturbs the sorting of M72 andthe now CT1 negative axons in the vicinity of the M72 glomerulus(Fig. 9). Similarly, we have also shown that during development CT1 isexpressed by a small subpopulation of vomeronasal axons that projectto the caudal region of the accessory olfactory bulb. In the BGAT-Tgmice we had previously found the majority of axons that over-projected into the external plexiform layer emerged from the caudal
ng glomeruli within the olfactory bulb. (A) In wild typemice, axons that express the CT1which M72 odorant receptor axons (green) terminate. (B) In BGAT-Tg mice, the CT1xpressed by all axons. While many of theM72 odorant receptor axons (green) target theeruli (arrows).
18 K.E. Lineburg et al. / Molecular and Cellular Neuroscience 48 (2011) 9–19
region of the accessory olfactory bulb (St John et al., 2006). Thus, theseresults are consistent with a role for CT1 in olfactory axon guidance.It remains to be determined whether cell surface carbohydrates suchas CT1 play a role in axon guidance during regeneration and whetherthe expression of carbohydrates is dependent on neural activity. Itwould be informative to determine if carbohydrates continue to beselectively expressed during widespread regeneration such as thatstimulated by chemical destruction of the olfactory epithelium bydichlobenil (St John and Key, 2003), methimazole (Chehrehasa et al.,2010) or ZnSO4 (Harding et al., 1978). Moreover such analyses wouldalso determine if these carbohydrates contribute to the successfultopographic reinnervation of glomeruli. In addition, by occluding thenaris (Brunjes, 1994) it would be possible to begin to understand therole of neuronal activity on the expression of carbohydrates in theolfactory epithelium. Future experimentswill examine these potentialroles of CT1 and other cell surface carbohydrates.
Conclusion
Our results support the hypothesis that a glycocode (St Johnand Key, 2005) contributes to the establishment of the olfactorytopographic map. We envisage that broadly expressed carbohydratesdefine the regional fasciculation of large subpopulations of axons.More restricted expression of carbohydrates, such as the DBA ligandswhich are present on ~30% of axons (Key and Akeson, 1993, Lipscombet al., 2002, 2003), might subdivide the large bundles into smallerdiscrete fascicles. Further refinement and subdivision is thenmediated by carbohydrates such as the CT1 carbohydrate which areexpressed on ~20% of axons. Together, the differential combination ofcarbohydrates enables individual odorant receptor axons to beuniquely identified. Overall these observations support the postulatethat olfactory axon guidance is achieved through a combination ofaxon guidance signals, and that cell surface carbohydrates contributeby providing identity to subpopulations of axons.
Experimental methods
Animal preparation
Wild type Quackenbush mice, M72-IRES-tau-GFP (Potter et al.,2001), P2-lacZ mice (Mombaerts, 1996), and BGAT-Tg mice (St Johnet al., 2006) were examined. Three to six animals were examined foreach age and for eachmouse line. Embryonic and postnatal mice weredecapitated, adult mice were asphyxiated by CO2 and heads wereimmersion fixed overnight at 4 °C in 4% paraformaldehyde. Followingfixation, postnatal heads were cryoprotected in 30% sucrose and adultheads were decalcified in 20% disodium ethylene diaminetetraaceticacid in PBS (pH 7.4). Heads were placed in embedding matrix (O.C.T.compound, Miles Scientific, Naperville, IL), snap frozen by immersionin iso-pentane that had been cooled by liquid nitrogen and sectioned(30 μm) on a cryostat microtome.
Histochemistry
Immunohistochemistry and lectin histochemistry was performedas previously described (St John et al., 2006). Monoclonal antibodiesagainst CT1 (Conzelmann and Lefrancois, 1988; Lefrancois and Bevan,1985) were prepared in the laboratory of Prof Paul Martin fromhybridoma cells provided by Leo Lefrancois. The CT1 antibodies havebeen previously demonstrated to react with GalNAc and sialic acidcontaining antigens defined as GalNAcß1,4-[SAα2,3]Gal carbohydratedeterminants. This was demonstrated by showing specific binding tothe murine CTL-clone B6.1, the human blood group Cad antigen, andthe Tamm–Horsfall urinary glycoprotein from Sda+ individuals;when the three different sources lacked the GalNAc or sialic acidresidues there was no immunoreactivity by the CT1 antibodies
(Conzelmann and Lefrancois, 1988). Sections were incubated withanti-CT1 followed by horse anti-mouse Alexa Fluor488 (1:400; Molec-ular Probes, Carlsbad, CA) or anti-mouse μ-chain specific conjugated toTexas Red (1:200, Abcam ab5927); or were incubated with anti-GFP oranti-beta galactosidase followed by goat anti-rabbit secondary anti-bodies conjugated to biotin (1:200; Vector Labs, Burlingame, CA) andthen with Streptavidin-conjugated Alexa Fluor488 (1:400; MolecularProbes). Alternatively, immunostaining staining was visualised usingavidin-biotin-horseradish peroxidase (Vector Laboratories Inc) fol-lowed by reaction with 3,3′-diaminobenzidine (DAB) and hydrogenperoxide (H2O2) in TBS. For lectin staining, sectionswere incubatedwithbiotinylated D. biflorus agglutinin in BSA/TBS/Triton X-100 with1.25 mM CaCl2, 1.25 mM MgCl2 and 1.25 mM MnCl2. The sectionswere then washed in TBS/Triton X-100 and incubated with either(i) avidin-biotin-horseradish peroxidise for 1 h at RT with stainingvisualised by reaction with diaminobenzidine as described above, or(ii) Streptavidin-conjugated Alexa Fluor488 as described above.
Imaging
Images of the sections were captured using Olympus BX51compound fluorescence microscope fitted with differential inferencecontrast. Images were colour balanced in Adobe Photoshop CS5 withuniform colour and gamma adjustment and figures were compiledusing Adobe Illustrator CS5 (Adobe Systems Incorporated).
Quantification of CT1 neurons
The percentage of mature neurons that expressed CT1 in adultanimals was determined using coronal sections from OMP-ZsGreentransgenic mice that were immunostained using anti-CT1 antibodies.Five sections from each animal (n=3 animals) were selected witheach section separated by 300 μm so that the sections covered therostral–caudal range of the olfactory epithelium. For each section, allregions of the epithelium were included in the quantification. Thenumber of ZsGreen neurons that co-expressed CT1 and the totalnumber of ZsGreen neurons were counted to determine theproportion of mature neurons that expressed CT1.
Mapping of glomeruli
CT1 immunostaining was performed on sections from postnatalday 7 animals to prepare threemaps from different animals. Every 4thcoronal section from the rostral tip of the olfactory bulb to the caudalregion of the accessory olfactory bulb was used. Sections were stainedusing diaminobenzidine with the reaction time being the same foreach section. For each section a vertical line was drawn from the mostventral portion of the bulb to the midpoint of the dorsal surface, withthe dorsal point serving as the position from which the butterflyschematic preparation was opened. The circumference of the outersurface of the olfactory bulb was measured for each section togenerate the shape of the butterfly schematic of the olfactory bulb.The positions of each CT1-positive glomerulus were measured fromthe dorsal point and then mapped onto the schematic butterflypreparation of the olfactory bulb. Glomeruli were categorised ashaving strong expression or weak expression or no expression of CT1using a binarised threshold level in ImageJ. Glomeruli with strong orweak expression were mapped onto the schematic. A consensus mapwas not appropriate due to the low number of olfactory bulbs thatwere mapped (n=3), the sampling of every 4th section and the localvariability in the position of individual glomeruli. Maps appearedsimilar and the map from a single animal is presented in Fig. 5. Thestrong andweak expressing CT1 glomeruli were counted to determinethe proportion of glomeruli within each region.
19K.E. Lineburg et al. / Molecular and Cellular Neuroscience 48 (2011) 9–19
Acknowledgments
This work was supported by grant from the National Health andMedical Research Council to J.S. and B.K. (grant number 511006), byfunding to the National Centre for Adult Stem Cell Research from theAustralian Government Department of Health and Aging (A.M.S.), by aPostdoctoral Fellowship from the Australian Research Council to J.E.(DP0986294) and an Australian Postgraduate Award to D.A.
References
Baker, H., Grillo, M., Margolis, F.L., 1989. Biochemical and immunocytochemicalcharacterization of olfactory marker protein in the rodent central nervous system.J. Comp. Neurol. 285, 246–261.
Bozza, T., Vassalli, A., Fuss, S., Zhang, J.J., Weiland, B., Pacifico, R., Feinstein, P.,Mombaerts, P., 2009. Mapping of class I and class II odorant receptors to glomerulardomains by two distinct types of olfactory sensory neurons in the mouse. Neuron61, 220–233.
Brunjes, P.C., 1994. Unilateral naris closure and olfactory system development. BrainRes. Brain Res. Rev. 19, 146–160.
Buck, L., Axel, R., 1991. A novel multigene family may encode odorant receptors: amolecular basis for odor recognition. Cell 65, 175–187.
Chehrehasa, F., Windus, L.C., Ekberg, J.A., Scott, S.E., Amaya, D., Mackay-Sim, A., St John,J.A., 2010. Olfactory glia enhance neonatal axon regeneration. Mol. Cell. Neurosci.45, 277–288.
Cho, J.H., Lepine, M., Andrews, W., Parnavelas, J., Cloutier, J.F., 2007. Requirement forSlit-1 and Robo-2 in zonal segregation of olfactory sensory neuron axons in themain olfactory bulb. J. Neurosci. 27, 9094–9104.
Conzelmann, A., Lefrancois, L., 1988. Monoclonal antibodies specific for T cell-associated carbohydrate determinants react with human blood group antigensCAD and SDA. J. Exp. Med. 167, 119–131.
Crandall, J.E., Dibble, C., Butler, D., Pays, L., Ahmad, N., Kostek, C., Puschel, A.W.,Schwarting, G.A., 2000. Patterning of olfactory sensory connections is mediated byextracellular matrix proteins in the nerve layer of the olfactory bulb. J. Neurobiol.45, 195–206.
Cutforth, T., Moring, L., Mendelsohn, M., Nemes, A., Shah, N.M., Kim, M.M., Frisen, J.,Axel, R., 2003. Axonal ephrin-As and odorant receptors: coordinate determinationof the olfactory sensory map. Cell 114, 311–322.
Ekberg, J.A., Amaya, D., Chehrehasa, F., Lineburg, K., Claxton, C., Windus, L.C., Key, B.,Mackay-Sim, A., St John, J.A., 2011. OMP-ZsGreen fluorescent protein transgenicmice for visualisation of olfactory sensory neurons in vivo and in vitro. J. Neurosci.Methods 196, 88–98.
Feinstein, P., Bozza, T., Rodriguez, I., Vassalli, A., Mombaerts, P., 2004. Axon guidance ofmouse olfactory sensory neurons by odorant receptors and the beta2 adrenergicreceptor. Cell 117, 833–846.
Harding, J.W., Getchell, T.V., Margolis, F.L., 1978. Denervation of the primary olfactorypathway in mice. V. Long-term effect of intranasal ZnSO4 irrigation on behavior,biochemistry and morphology. Brain Res. 140, 271–285.
Herrada, G., Dulac, C., 1997. A novel family of putative pheromone receptors inmammals with a topographically organized and sexually dimorphic distribution.Cell 90, 763–773.
Kaneko-Goto, T., Yoshihara, S., Miyazaki, H., Yoshihara, Y., 2008. BIG-2 mediatesolfactory axon convergence to target glomeruli. Neuron 57, 834–846.
Key, B., Akeson, R.A., 1993. Distinct subsets of sensory olfactory neurons in mouse:possible role in the formation of the mosaic olfactory projection. J. Comp. Neurol.335, 355–368.
Key, B., St John, J., 2002. Axon navigation in the Mammalian primary olfactory pathway:where to next? Chem. Senses 27, 245–260.
King, M.J., 1994. Blood group antigens on human erythrocytes—distribution, structureand possible functions. Biochim. Biophys. Acta 1197, 15–44.
Lefrancois, L., Bevan, M.J., 1985. Novel antigenic determinants of the T200 glycoproteinexpressed preferentially by activated cytotoxic T lymphocytes. J. Immunol. 135,374–383.
Lipscomb, B.W., Treloar, H.B., Greer, C.A., 2002. Cell surface carbohydrates revealheterogeneity in olfactory receptor cell axons in the mouse. Cell Tissue Res. 308,7–17.
Lipscomb, B.W., Treloar, H.B., Klenoff, J., Greer, C.A., 2003. Cell surface carbohydratesand glomerular targeting of olfactory sensory neuron axons in the mouse. J. Comp.Neurol. 467, 22–31.
Matsunami, H., Buck, L.B., 1997. Amultigene family encoding a diverse array of putativepheromone receptors in mammals. Cell 90, 775–784.
Mombaerts, P., 1996. Targeting olfaction. Curr. Opin. Neurobiol. 6, 481–486.Potter, S.M., Zheng, C., Koos, D.S., Feinstein, P., Fraser, S.E., Mombaerts, P., 2001.
Structure and emergence of specific olfactory glomeruli in the mouse. J. Neurosci.21, 9713–9723.
Puche, A.C., Key, B., 1996. N-acetyl-lactosamine in the rat olfactory system: expressionand potential role in neurite growth. J. Comp. Neurol. 364, 267–278.
Ressler, K.J., Sullivan, S.L., Buck, L.B., 1994. Information coding in the olfactory system:evidence for a stereotyped and highly organized epitope map in the olfactory bulb.Cell 79, 1245–1255.
Ryba, N.J., Tirindelli, R., 1997. A newmultigene family of putative pheromone receptors.Neuron 19, 371–379.
Schaefer, M.L., Finger, T.E., Restrepo, D., 2001. Variability of position of the P2glomerulus within a map of the mouse olfactory bulb. J. Comp. Neurol. 436,351–362.
Schwarting, G.A., Henion, T.R., 2007. Lactosamine differentially affects olfactory sensoryneuron projections to the olfactory bulb. Dev. Neurobiol. 67, 1627–1640.
Serizawa, S., Miyamichi, K., Takeuchi, H., Yamagishi, Y., Suzuki, M., Sakano, H., 2006. Aneuronal identity code for the odorant receptor-specific and activity-dependentaxon sorting. Cell 127, 1057–1069.
St John, J.A., Key, B., 1999. Expression of galectin-1 in the olfactory nerve pathway of rat.Brain Res. Dev. Brain Res. 117, 171–178.
St John, J.A., Key, B., 2001. Chemically and morphologically identifiable glomeruli in therat olfactory bulb. J. Comp. Neurol. 436, 497–507.
St John, J.A., Key, B., 2002. Heterogeneity in olfactory neurons in mouse revealed bydifferential expression of glycoconjugates. Histochem. J. 34, 281–289.
St John, J.A., Key, B., 2003. Axon mis-targeting in the olfactory bulb during regenerationof olfactory neuroepithelium. Chem. Senses 28, 773–779.
St John, J.A., Key, B., 2005. A model for axon navigation based on glycocodes in theprimary olfactory system. Chem. Senses 30 (Suppl. 1), i123–i124.
St John, J.A., Claxton, C., Robinson, M.W., Yamamoto, F., Domino, S.E., Key, B., 2006.Genetic manipulation of blood group carbohydrates alters development andpathfinding of primary sensory axons of the olfactory systems. Dev. Biol. 298,470–484.
Storan, M.J., Magnaldo, T., Biol-N'Garagba, M.C., Zick, Y., Key, B., 2004. Expression andputative role of lactoseries carbohydrates present on NCAM in the rat primaryolfactory pathway. J. Comp. Neurol. 475, 289–302.
Strotmann, J., Conzelmann, S., Beck, A., Feinstein, P., Breer, H., Mombaerts, P., 2000.Local permutations in the glomerular array of the mouse olfactory bulb. J. Neurosci.20, 6927–6938.
Takeuchi, H., Inokuchi, K., Aoki, M., Suto, F., Tsuboi, A., Matsuda, I., Suzuki, M., Aiba, A.,Serizawa, S., Yoshihara, Y., Fujisawa, H., Sakano, H., 2010. Sequential arrival andgraded secretion of Sema3F by olfactory neuron axons specify map topography atthe bulb. Cell 141, 1056–1067.
Vassar, R., Chao, S.K., Sitcheran, R., Nunez, J.M., Vosshall, L.B., Axel, R., 1994. Topographicorganization of sensory projections to the olfactory bulb. Cell 79, 981–991.
Windus, L.C., Lineburg, K.E., Scott, S.E., Claxton, C., Mackay-Sim, A., Key, B., St John, J.A.,2010. Lamellipodia mediate the heterogeneity of central olfactory ensheathing cellinteractions. Cell. Mol. Life Sci. 67, 1735–1750.
Xia, B., Martin, P.T., 2002. Modulation of agrin binding and activity by the CT and relatedcarbohydrate antigens. Mol. Cell. Neurosci. 19, 539–551.
Xia, B., Hoyte, K., Kammesheidt, A., Deerinck, T., Ellisman, M., Martin, P.T., 2002.Overexpression of the CT GalNAc transferase in skeletal muscle alters myofibergrowth, neuromuscular structure, and laminin expression. Dev. Biol. 242, 58–73.


