Embed Size (px)
Citation preview
The Determination of Stem Cell Fate by 3D Scaffold Structuresthrough the Control of Cell Shape
Girish Kumar§,1,2, Christopher K. Tison§,1, Kaushik Chatterjee§,1,2, P. Scott Pine3, JenniferH. McDaniel3, Marc L. Salit3, Marian F. Young2, and Carl G. Simon Jr.*,11Polymers Division, National Institute of Standards & Technology, 100 Bureau Drive,Gaithersburg, MD, 20899, USA2National Institute of Dental and Craniofacial Research, National Institutes of Health, 30 ConventDrive, Bethesda, MD, 20892, USA3Biochemical Sciences Division, National Institute of Standards & Technology, 100 Bureau Drive,Gaithersburg, MD, 20899, USA
AbstractStem cell response to a library of scaffolds with varied 3D structures was investigated. Microarrayscreening revealed that each type of scaffold structure induced a unique gene expression signaturein primary human bone marrow stromal cells (hBMSCs). Hierarchical cluster analysis showed thattreatments sorted by scaffold structure and not by polymer chemistry suggesting that scaffoldstructure was more influential than scaffold composition. Further, the effects of scaffold structureon hBMSC function were mediated by cell shape. Of all the scaffolds tested, only scaffolds with ananofibrous morphology were able to drive the hBMSCs down an osteogenic lineage in theabsence of osteogenic supplements. Nanofiber scaffolds forced the hBMSCs to assume anelongated, highly branched morphology. This same morphology was seen in osteogenic controlswhere hBMSCs were cultured on flat polymer films in the presence of osteogenic supplements(OS). In contrast, hBMSCs cultured on flat polymer films in the absence of OS assumed a morerounded and less-branched morphology. These results indicate that cells are more sensitive toscaffold structure than previously appreciated and suggest that scaffold efficacy can be optimizedby tailoring the scaffold structure to force cells into morphologies that direct them to differentiatedown the desired lineage.
Keywordsbone tissue engineering; cell morphology; nanotopography; osteogenesis; scaffolds; stem cell
1. IntroductionUse of tissue scaffold properties to direct cell function constitutes a basic tenet in the field oftissue engineering [1]. It is known that surface topography from the micro- to the nanoscalecan influence cell behavior [2–4]. For instance, 2D topographical cues can induceosteoprogenitor cell [4,5] and mesenchymal stem cell [6] osteogenesis. Since topographyhas been reported to direct cell function, the hypothesis that 3D scaffold structure can directcell differentiation has been tested herein. Many protocols for fabricating polymer scaffoldshave been developed that yield a wide variety of structures including salt-leaching (SL) [7],
*Corresponding Author: Tel. 301-975-8574, Fax: 301-975-4977, [email protected].§These authors contributed equally
NIH Public AccessAuthor ManuscriptBiomaterials. Author manuscript; available in PMC 2012 August 27.
Published in final edited form as:Biomaterials. 2011 December ; 32(35): 9188–9196. doi:10.1016/j.biomaterials.2011.08.054.
NIH
-PA Author Manuscript
NIH
-PA Author Manuscript
NIH
-PA Author Manuscript
gas foaming (GF) [8], phase-separation (GFPS) [9], electrospinning nanofibers (NF) [10,11]and freeform fabrication (FFF) [12,13]. Scaffolds fabricated by these methods have differentphysical architectures ranging from porous to fibrous, nanofibrous to microfibrous, andirregular to uniform. However, a systematic study to determine how these different scaffoldstructures influence cell function has not been performed.
Herein, gene expression signatures and osteogenic differentiation of primary human bonemarrow stromal cells (hBMSCs) were assessed during culture on a library of scaffolds withvaried structure and chemistry. hBMSCs are adult stem cells that can be isolated from bonemarrow and can differentiate into bone, fat and cartilage [14,15]. Scaffolds with variedstructure were fabricated from the same material poly(ε-caprolactone) (PCL) so that effectsof scaffold chemistry could be decoupled from effects of scaffold structure. A number ofcontrols were also tested including 2D flat samples (spun-coat films) and scaffolds madefrom a different polymer [PDLLA, poly(D,L-lactic acid)] to control for 3D structure andchemistry, respectively. hBMSC sensitivity to differences in scaffold structure wereassessed and a mechanism for their response based on cell shape is proposed.
2. Materials and methods2.1. PCL Salt-Leached Scaffolds (PCL_SL)
PCL (relative molecular mass 80 000 g/mol, Sigma) solution (30% mass fraction inchloroform) was mixed with sieved NaCl (250 μm to 425 μm) at a (NaCl):(PCL solution)mass ratio of 4:1 to yield a homogenous paste [16]. The paste was pressed into a disk shapedTeflon mold (12 mm diameter, 4 mm thickness). Scaffolds in molds were air dried for 2 h atroom temperature, salt-leached 5 d in deionized water, air-dried for 1 d and stored in adesiccator.
2.2. PCL Gas-Foamed Scaffolds (PCL_GF)PCL solution (30% by mass in chloroform) was mixed with sieved NH4HCO3 (250 μm to425 μm) at a (NH4HCO3):(PCL solution) mass ratio of 2:1 to yield a homogenous paste [8].The paste was pressed into a disk shaped Teflon mold (12 mm diameter, 4 mm thickness).Scaffolds in molds were air dried for 2 h at room temperature, removed from molds,incubated in warm d-water (40°C) until no gas bubbles were generated (2 h), further leachedin d-water at room temperature for 3 d, air-dried for 1 d and stored in a desiccator.
2.3. PCL Gas-Foamed Phase-Separated Scaffolds (PCL_GFPS)Gas foamed phase separated scaffolds of PCL were fabricated by combining thermallyinduced phase-separation technique (TIPS) and a gas-foaming technique [9]. PCL solution(30 % by mass in 7:3 volume ratio chloroform:n-butanol) was mixed with sieved NH4HCO3(250 μm to 425 μm) at a (NH4HCO3):(PCL solution) mass ratio of 2:1 to yield ahomogenous paste. The paste was pressed into a disk-shaped Teflon mold (12 mm diameter,4 mm thickness) and phase separated at −80 °C for 4 h. Next, the scaffolds were immersedin methanol at −20 °C for 24 h for solvent exchange. Scaffolds were gas-foamed byimmersion in warm d-water (40 °C) for 2 h (until no bubbles were released), immersed in d-water at room temperature for 3 d, air-dried for 1 d and stored in a desiccator.
2.4. PCL “Big” Nanofiber Scaffolds (PCL_BNF)This protocol yields large diameter PCL nanofibers (≈900 nm). PCL solution (30 % by massin 9:1 volume ratio chloroform: methanol) was loaded into a syringe and a syringe pumpwas used to dispense PCL solution (0.5 mL/h) into a home built electrospinning apparatus[11]. Aluminum foil was used as the target, the distance between needle and target was 15cm, and voltage was 15 kV. The positive lead from the power supply was fixed to the
Kumar et al. Page 2
Biomaterials. Author manuscript; available in PMC 2012 August 27.
NIH
-PA Author Manuscript
NIH
-PA Author Manuscript
NIH
-PA Author Manuscript
spinneret which was an 18 gauge needle and the ground lead was fixed to the target(aluminum foil). Non-woven PCL nanofiber mats were collected for 1 h onto tissue culturepolystyrene (TCPS) disks (12 mm dia., punched from the bottom of 48-well TCPS plates)placed on the aluminum foil target. TCPS disks were lightly sprayed with 70 % by massethanol before electrospinning to help fibers adhere to the disks. TCPS disks were made byusing a hot 12 mm punch to punch disks from the bottom of TCPS 48-well plates.
2.5. PCL “Small” Nanofiber Scaffolds (PCL_SNF)This protocol yields small diameter PCL nanofibers (≈300 nm) and is the same as for PCL-BNF except for the following changes: PCL solution 10 % by mass in 3:1 volume ratiochloroform: methanol, pump rate 2 mL/h and voltage 16.5 kV.
2.6. PCL Freeform Fabricated Scaffolds (PCL_FFF)Disc-shaped freeform fabricated scaffolds (5 mm dia., 2 mm height, in 96-well plates) madeby precision extrusion deposition [12] were purchased from 3D Biotek and used as received.
2.7. 2D Spin-Coated PCL Films (PCL_SC)Thin films of PCL were then prepared by spin-coating PCL solution (0.8 mL, 10% by massin glacial acetic acid) at 1000 rpm for 30 s over TCPS disks (100 mm dia.). Films were air-dried at room temperature for 2 h and annealed at 60° C for 30 s to adhere the PCL to theTCPS. Films were punched into 12 mm disks using a hot punch and exposed to sterile PBSto remove residual acetic acid.
2.8. PDLLA “Big” Nanofiber Scaffolds (PDLLA_BNF)This protocol yields large diameter PDLLA nanofibers (≈900 nm) and is the same as forPCL-BNF except for the following changes: PDLLA (relative molecular mass 100,000 g/mol, Surmodics) solution 15 % by mass in hexafluoroisopropanol (1,1,1,3,3,3-hexafluoro-2-propanol), pump rate 1.5 mL/h and voltage 15 kV.
2.9. 2D Spin-Coated PDLLA Films (PDLLA_SC)Thin films of PDLLA were then prepared by spin-coating PDLLA solution (0.8 mL, 10% bymass in glacial acetic acid) at 1500 rpm for 30 s over TCPS disks (100 mm dia.). Films wereair-dried at room temperature for 2 h and annealed at 60° C for 30 s to adhere the PDLLA tothe TCPS. Films were punched into 12 mm disks using a hot punch and exposed to sterilePBS to remove residual acetic acid.
2.10. Scaffold CharacterizationPCL_SL, PCL_GF, PCL_GFPS, PCL_BNF, PCL_SNF, PCL_FFF and PDLLA_BNFscaffolds were examined by scanning electron microscopy (SEM). PCL_SL, PCL_GF andPCL_GFPS scaffolds were frozen in liquid nitrogen and fractured with a scalpel to exposeinterior. PCL_BNF, PCL_SNF, PCL_FFF and PDLLA_BNF scaffolds were examined fromthe top. Scaffolds were sputter-coated with gold for 90 s and imaged (SEM, 15kV, Hitachis-4700-II FE-SEM). NF diameter, FFF strut diameter and FFF strut spacing were measuredin SEM images using ImageJ software (NIH) (100 measurements of each). Morphology of2D PCL_SC and TCPS samples were viewed by transmitted white light phase contrastmicroscopy. Gravimetry was used to measure total porosity of PCL_SL, PCL_GF,PCL_GFPS and PCL_FFF scaffolds using an equation, “Total Porosity = 1 − [(m/d)/v]”,where “m” is mass of the scaffold (g), “d” is PCL density (1.1 g/mL) and “v” is volume ofscaffold (mL) (caliper measurements).
Kumar et al. Page 3
Biomaterials. Author manuscript; available in PMC 2012 August 27.
NIH
-PA Author Manuscript
NIH
-PA Author Manuscript
NIH
-PA Author Manuscript
2.11. Cell CulturePCL_SL, PCL_GF, PCL_GFPS, PCL_BNF, PCL_SNF, PCL_SC, PDLLA_BNF andPDLLA_SC specimens were placed in 48-well tissue-culture polystyrene plates for cellculture experiments. Wells without specimens were used as TCPS controls. PCL_FFF wereput into polystyrene 96-well plates (non-tissue culture treated) for cell culture experiments.Specimens were sterilized by ethylene oxide (Anderson Products) and degassed for 2 dunder house vacuum.
Primary human bone marrow stromal cells (hBMSCs, also known as mesenchymal stemcells, Tulane Center for Gene Therapy) were cultured at 37 °C with 5 % by volume CO2 inα-minimum essential medium (Invitrogen) supplemented with 16.5 % by volume fetalbovine serum (Atlanta Biologicals) and 4 mmole/L L-glutamine [14]. To wet scaffolds fullywith culture medium, medium was added to specimens in wells and plates were placedunder vacuum for 1 min. The vacuum was released and reapplied two more times. Forseeding scaffolds, hBMSCs (80 % confluent) were dissociated with 0.25 % mass fractiontrypsin [containing 1 mmole/L ethylenediaminetetraactate (EDTA)] and re-suspended inmedium. Passage 4 or 5 cells were used for all experiments. Medium was removed fromscaffolds and 10,000 hBMSCs in 0.5 mL of medium was added to each well for 48-wellplates (PCL_SL, PCL_GF, PCL_GFPS, PCL_BNF, PCL_SNF, PCL_SC, PDLLA_BNF,PDLLA_SC, TCPS) or 5,000 hBMSCs in 0.2 mL of medium for 96-well plates (PCL_FFF).Medium was changed twice per week and cells cultured for 4 time points (1 d, 7 d, 21 d, 50d) as indicated in the figures. In some experiments, cells were cultured in mediumcontaining osteogenic supplements (OS): dexamethasone (10 nmole/L), β-glycerophosphate(20 mmol/L) and ascorbic acid (0.05 mmol/L).
2.12. Alizarin Red StainingFor Alizarin red staining, scaffolds were fixed with 3.7 % formaldehyde for 24 h at 37°Cand then stained with Alizarin Red S (10 mg/mL) for 1 h. Scaffolds were washed 5 timeswith d-water to remove excess stain and air dried. Digital images of stained scaffolds wereacquired using a stereomicroscope. All Alizarin red experiments were performed with threespecimens (n = 3). Two fields of view at both low and high magnification were randomlyselected and captured for each specimen and representative images are shown in the figures.
2.13. Picogreen DNA AssayThe Picogreen DNA assay was used to quantify cell numbers in the scaffolds. Scaffoldswere washed with PBS (phosphate-buffered saline) and then incubated with lysis buffer (0.2mg/mL Proteinase K and 0.02 % by mass sodium dodecyl sulfate) for 24 h at 37°C. Afterincubation, 100 μL of lysate was transferred to a clean 96-well plate and diluted with 100μL of Picogreen reagent (Invitrogen, diluted to working concentration as per manufacturer’sprotocol). Fluorescence (excitation 485 nm, emission 538 nm) was measured using a platereader. A DNA standard curve was generated using known DNA concentrations to calibratereadings.
2.14. Fluorescence Staining of CellsCells on scaffolds were fixed with 3.7 % formaldehyde (mass/volume in PBS buffer) for 15min, washed in PBS and permeabilized with 0.2 % by mass Triton X-100 for 5 min.Samples were rinsed with PBS and stained (1 h) with Alexa Fluor 546-phalloidin (20 nmol/L in PBS) and Sytox green (100 nmol/L in PBS buffer) to stain for F-actin and nuclei,respectively (Invitrogen). Cells were washed with PBS.
Kumar et al. Page 4
Biomaterials. Author manuscript; available in PMC 2012 August 27.
NIH
-PA Author Manuscript
NIH
-PA Author Manuscript
NIH
-PA Author Manuscript
2.15. Epifluorescence MicroscopyFor regular epifluorescence microscopy (non-confocal, Fig. 2 and Fig. S2-S4) to assess cellproliferation, specimens were washed with PBS, then water and air-dried before imaging.Two specimens were prepared for each treatment. Two fields of view at both low and highmagnification were randomly selected and captured for green (nuclei) and red channels(actin) for each specimen and representative images are shown in the figures.
2.16. Confocal MicroscopyConfocal microscopy (Zeiss LSM-510) was used to measure cell morphology using sampleswet with PBS (not air-dried). High resolution z-stack images were captured with a 40×/0.80water immersion objective (1 μm z-step size) for nuclei (Sytox green) and actin (AlexaFluor 546 phalloidin). Two specimens were prepared for each treatment and ten cells wereimaged and analyzed for each specimen (n = 20 cells).
Sytox green staining of nuclei was used to make sure that cell morphology was assessed forsingle cells only (only one nucleus per object). Alexa Fluor 546 phalloidin stained actinimages were used to assess cell morphology. Confocal Z-stack projections were constructed(to project entire cell surface into two dimensions) and thresholding was performed to resultin binary images. ImageJ was used to measure cell area, aspect ratio and roundness. Celloutlines were created and analyzed for branching. Branching was determined by countingthe number of projections from the cell body and the number of branch points originatingwithin that projection with a length greater than 5 μm.
2.17. Human Genome MicroarrayTotal RNA from hBMSCs in 3D scaffolds and on 2D surfaces at 1 d and 14 d was collectedby homogenization of the cell lysate using the QIAshredder followed by purification usingthe RNeasy Minikit (Qiagen). Four replicates were performed for all treatments wherein areplicate was prepared by pooling cell lysates from 4 samples (expect for PCL_FFFscaffolds where 8 samples were pooled). Genome-wide transcriptions of hBMSCs weremeasured by high-throughput screening using the Illumina Human HT-12 v4 ExpressionBeadChips with 47231 probes for 25130 RefSeq annotated genes (NCBI/NIH) through acontract with Gene Logic (Gaithersburg, MD).
Data analysis was performed using the BRB-Array Tools version 4.1.0 (Biometric ResearchBranch, National Cancer Institute). The average of the four replicates of TCPS_1d was usedas an in silico reference array for median normalization of all of the individual array data.The “significance analysis of microarrays” (SAM) approach [17], with a false discovery rateof 0.05, was chosen to test for significantly changed genes within the osteogenic controls (4replicates each of TCPS_1d, TCPS_14d, TCPS_OS_1d and TCPS_OS_14d). A total of9494 genes were identified that were changed significantly between all possible pair-wisecomparisons of these treatments. From those 9494 SAM-significant genes, a subset of 831genes was found to exhibit at least a two-fold change ‘between TCPS_1d andTCPS_OS_1d’ or ‘between TCPS_14d and TCPS_OS_14d’ (this creates “black” regions onthe sorted 14d arrays indicating “no change”). Hierarchical cluster analysis (HCA), withcentered correlation and average linkage, was performed using all arrays and the 831 two-fold significant genes. A dendrogram of the relationships is shown in Fig. 3a. The log2 ratioof the each gene intensity compared to the reference array (see above) was used to show therelative change in gene expression across the dataset. A heat map for the 831 SAM-significant genes is shown in Fig. 3b. Finally, 29 of those genes were found (January 2011)to be in a Gene Ontology [18] cluster for skeletal development (Fig. 3c).
Kumar et al. Page 5
Biomaterials. Author manuscript; available in PMC 2012 August 27.
NIH
-PA Author Manuscript
NIH
-PA Author Manuscript
NIH
-PA Author Manuscript
2.18. Imaging Fluorescent PDLLA_BNFIn some cases (Fig. 4i-k), PDLLA_BNF were doped with Rhodamine-123 (5 μg/mL inelectrospinning solution, Molecular Probes) so that they could be imaged by fluorescencemicroscopy. For 3D renderings in Fig. 4i-j, confocal microscopy images (Leica TCS SP5broadband) were collected with a 63x/0.9 water immersion objective (290 nm Z-step size)for nanofibers (Rhodamine-123) and hBMSC actin (Alexa Fluor 633 phalloidin). For thesingle Z-slice in Fig. 4k, a confocal microscopy image (Zeiss LSM-510) was collected witha 40×/0.80 water immersion objective for nanofibers (Rhodamine-123) and hBMSC actin(Alexa Fluor 546 phalloidin).
3. ResultsIn order to test if 3D scaffold architecture affects hBMSC behavior, poly(ε-caprolactone)(PCL) scaffolds with different architectures were fabricated by five different techniques(Table 1): salt-leaching (PCL_SL), gas-foaming (PCL_GF), gas-foaming phase-separation(PCL_GFPS), electrospinning nanofibers (PCL_BNF) and freeform fabrication (PCL_FFF).Spun-coat films of PCL (PCL_SC) were used as a flat 2D control for 3Dness. Tissue culturepolystyrene (TCPS) was also used as a control flat surface. Using PCL to fabricate thesedifferent scaffold architectures enables contributions from material chemistry to be isolatedfrom topographical effects. The specimens presented a wide variety of morphologies asshown by the range of structural parameters including porosities and fiber diameters (Fig. 1;Table 2).
When hBMSCs were cultured on the scaffolds in the absence of osteogenic supplements(OS), the nanofiber scaffolds (PCL_BNF) induced deposition of a bone-like matrixcontaining calcium (Fig. 1, Fig. S1). hBMSCs did not produce a calcified matrix on theother scaffold types (PCL_SL, PCL_GF, PCL_GFPS, PCL_FFF) or the flat controls(PCL_SC, TCPS) unless OS were added to the culture medium. These results suggest thatonly the nanofibrous scaffolds can induce hBMSC osteogenesis.
Next, the nanofiber effect was investigated more closely and the effect of nanofiber diameterand chemistry were tested. “Small” diameter 300 nm nanofibers (PCL_SNF) were fabricatedand induced hBMSC osteogenesis in the absence of OS. “Big” 900 nm nanofibers madefrom another polymer, poly(D,L-lactic acid) (PDLLA_BNF), induced osteogenesis butcontrol flat PDLLA films (PDLLA_SC) did not. When control PCL_BNF were incubated incomplete medium without hBMSCs, they did not induce non-specific calcium depositionfrom medium (Fig. S1). A summary of all experiments is given in Fig. S8. These resultsindicate that nanofiber scaffolds of different sizes (300 nm and 900 nm) and differentchemistries (PCL and PDLLA) induced hBMSC osteogenesis without OS, while flat filmsof the same polymers required OS to support osteogenic differentiation of hBMSCs.
The effect of scaffold architecture on hBMSC proliferation was tested using Picogreen DNAassay, fluorescence microscopy and stereomicroscopy (Fig. 2; Fig. S2-S5). hBMSCsadhered and proliferated on all specimens tested (PCL_SL, PCL_GF, PCL_GFPS,PCL_BNF, PCL_FFF, PCL_SC, TCPS) both in the presence and absence of osteogenicsupplements. For the DNA assay, hBMSC numbers increased the fastest on PCL_FFFscaffolds (both without and with OS) and the highest amount of DNA extracted from anyspecimen was for PCL_FFF in the presence of OS after 21 d culture (Fig. 2). This wasobserved despite the fact that that PCL_SL, PCL_GF, PCL_GFPS, PCL_BNF, PCL_FFF,PCL_SC and TCPS were seeded with more hBMSCs (10,000) and were cultured in largerwells (48-well) than the PCL_FFF (PCL_FFF were seeded with 5000 cells in 96-wellplates). The hBMSCs formed a tissue-like matrix at the strut joints on the PCL_FFFscaffolds by 21 d as observed in fluorescence micrographs and stereomicrographs (both
Kumar et al. Page 6
Biomaterials. Author manuscript; available in PMC 2012 August 27.
NIH
-PA Author Manuscript
NIH
-PA Author Manuscript
NIH
-PA Author Manuscript
without and with OS) (Fig. 2; Fig. S1, S2, S4). By 50 d without OS, a tissue-like matrixformed a continuous sheet between some struts on the PCL_FFF scaffolds (Fig. S1c, S2).These data indicate that hBMSCs adhered and proliferated on all substrates tested (PCL_SL,PCL_GF, PCL_GFPS, PCL_BNF, PCL_FFF, PCL_SC, TCPS) but that PCL_FFF scaffoldssupported the most hBMSC proliferation.
The effect of scaffold architecture on hBMSC gene expression was assessed usingmicroarrays (mRNA). A dendrogram resulting from cluster analysis (Fig. 3a) plus heat mapsof the expression level for significantly regulated genes (Fig. 3b) are shown. Heat maps ofthe significantly regulated genes involved in skeletal development are also given (Fig. 3c,Table S1). Cluster analysis indicated that hBMSC gene expression at 14 d on the nanofiberspecimens correlated most closely with the osteogenic control treatments. Thus, Node A(TCPS+OS 14d: hBMSCs cultured 14 d in OS on TCPS) and Node B (14d nanofiberspecimens: PCL_BNF, PCL_SNF, PDLLA_BNF) grouped together under Node C. Thesedata indicate that nanofiber scaffolds induced a gene expression signature that was similar tothat induced by OS, further supporting the observation that culture of hBMSCs onnanofibrous scaffolds induces hBMSC osteogenesis.
It is also astonishing that for the different treatments, the 4 replicates group together almostexclusively (Fig. 3a). Indeed, only three treatments (marked with an asterisk in Fig. 3)would need to be relocated to give perfect segregation by treatment in the dendrogram. Also,all 14 d flat specimens (TCPS, PCL_SC, PDLLA_SC) group together under node D,indicating that the hBMSCs can sense the 2-dimensionality of these substrates. For theseexperiments, specimen architecture was more important than surface chemistry, sincePCL_SC grouped with the other 2D specimens (PDLLA_SC, TCPS) instead of with otherPCL specimens. Likewise, PDLLA_SC grouped with the other 2D specimens (PCL_SC,TCPS) instead of with the other PDLLA specimen (PDLLA_BNF). These results indicatethat hBMSCS are exquisitely sensitive to scaffold structure resulting in a unique geneexpression profile for each type of scaffold tested. The results also suggest that scaffoldstructure has a bigger influence on stem cell behavior than does polymer chemistry.
The ability of nanofibers to drive osteogenic differentiation of hBMSCs was investigatedfurther to understand the mechanism. Fluorescence micrographs suggested that cell shapecould be driving osteogenesis on nanofiber scaffolds. hBMSCs assumed a spindly, highlybranched morphology on PCL_BNF which was very different than the well spreadmorphology observed for flat films (PCL_SC) (Fig. S2–S4). Since cell morphology istightly linked to cell function [19,20], this possibility was investigated further using highresolution confocal microscopy to quantify and compare cell morphology on PCLnanofibers (PCL_BNF) and films (PCL_SC) after 1 d culture (Fig. 4, Fig. S7). hBMSCscultured on PCL_BNF had smaller cell area, higher aspect ratio, lower roundness and morebranching than did hBMSCs on PCL_SC. Strikingly, hBMSCs cultured on PCL_SC in thepresence of OS also took on a spindly, branched morphology that was similar to hBMSCson PCL_BNF (Fig. 4). Thus, elongated, highly branched hBMSC morphologies inducedosteogenesis regardless of whether morphological changes were driven by scaffoldarchitecture (nanofiber scaffolds) or by biochemical supplements (OS).
Confocal 3D renderings of hBMSCs on fluorescent nanofiber scaffolds show that thehBMSCs penetrate into the nanofiber scaffolds (Fig. 4i–j). In addition, the hBMSCsextended projections that follow along the individual nanofibers resulting in the elongated,branched hBMSC morphology (Fig. 4k). The hBMSCs cannot attach to the aqueous mediumin the voids between the nanofibers and have no choice but to adhere to the nanofibers,which forces them into and elongated and highly branched morphology. Taken together,
Kumar et al. Page 7
Biomaterials. Author manuscript; available in PMC 2012 August 27.
NIH
-PA Author Manuscript
NIH
-PA Author Manuscript
NIH
-PA Author Manuscript
these results suggest that the intrinsic structure of the nanofiber scaffolds forces thehBMSCs into an osteogenic morphology that drives their osteogenic differentiation.
4. DiscussionThe cluster analysis dendrogram (Fig. 3) is powerful because it provides an unbiasedapproach of sorting scaffold treatments according to gene expression patterns. The analysisconsiders all genes and does not focus on pre-selected markers. In addition, this approachprovides a unique way to analyze cell-material interactions where the sorting of thetreatments provides insight into which material properties are influencing cell fate. In Fig.3a, the different scaffold treatments sort by scaffold structure over scaffold composition,suggesting that scaffold structure has a greater ability to control cell fate than doescomposition. Combining the microarray cluster analysis with the scaffold library approach,where many types of scaffold architectures are systematically compared side-by-side,robustly demonstrates that cells are more sensitive to scaffold structure than previouslyappreciated.
Although the advantages of nanofiber scaffolds for tissue engineering are well-documentedand their ability to promote osteogenesis has been demonstrated [21–23], the mechanism forthese effects has not been defined. The current scaffold library results further emphasize theability of nanofibers to induce osteogenesis by systematically comparing multiple scaffoldarchitectures side by side. A nanofibrous topography was key since only the nanofiberscaffolds, of all the scaffold morphologies that were tested (SL, GF, GFPS, NF, FFF),induced osteogenic differentiation. In addition, the current results provide a mechanisticbasis for the effects of nanofibers. Nanofibers provided fibrous adhesion sites for thehBMSCs that caused the hBMSCs to take on an elongated, highly branched morphologywhich drove them down and osteogenic lineage (Fig. 4). The current experiments suggestthat the osteoinductive effects of nanofibers come from their ability to force cells into anosteogenic morphology.
Decellularized extracellular matrices (dECM) have been very successful as tissueengineering scaffolds and collagen nanofibers are the dominant structure of dECM [24–27].Synthetic polymer nanofiber scaffolds such as PCL_BNF mimic the structure of thecollagen nanofibers present in dECM [11]. The current results suggest that the dECMscaffolds may be effective because their nanofibrous structure drives cells into morphologiesthat enhance their differentiation. It will be interesting to see if this holds true in futurework.
It is well-established that cell morphology and cell function are strongly linked [19,20] andthat this principle applies to hBMSC osteogenesis [28–30]. McBeath et al. demonstrated thatmodulation of hBMSC shape with surface patterning could be used to switch hBMSCdifferentiation between osteogenic or adipogenic [28]. In addition, Rodriguez et al. observedthat osteogenic supplements caused changes in hBMSC morphology [29]. In vivo, hBMSCsprogress to osteoblasts and then to mature osteocytes. While osteoblasts are cuboidal,osteocytes are highly branched, residing in lacunae and radiating multiple extensions downcanaliculi [31]. Thus, nanofiber scaffolds may force the hBMSCs into a highly branched“osteocyte-like” morphology, which pushes the hBMSCs towards an osteogenic lineage.
The data suggest that scaffolds should be designed to drive cells into morphologies that willinduce the desired cell function (proliferation, migration, differentiation, etc.). Models forcell spreading could be adapted to predict cell shape on different 3D structures.Alternatively, more extensive libraries of 3D structures could be probed for their effect oncell shape and function to create a catalog of scaffold structures versus cell shape/behavior.
Kumar et al. Page 8
Biomaterials. Author manuscript; available in PMC 2012 August 27.
NIH
-PA Author Manuscript
NIH
-PA Author Manuscript
NIH
-PA Author Manuscript
Coupling scaffold structure to cell shape could yield new targets for scaffold design thatcould enhance the inherent regenerative capabilities of scaffolds.
5. ConclusionsA systematic comparison of multiple scaffold types highlights the unexpected sensitivitythat cells have for scaffold structure. hBMSCs took on a unique gene expression profile oneach type of scaffold structure tested demonstrating that hBMSCs are highly responsive toscaffold architecture. In addition, the effect of scaffold structure on stem cell behavior wasmediated by cell shape. Nanofibers scaffolds induced osteogenic differentiation of hBMSCsby forcing the cells into an elongated, highly-branched, osteogenic morphology. Theseresults advance our understanding of how scaffold architecture can control cell fates. Thedata suggest a new paradigm for improving 3D tissue scaffold efficacy where the structureof the scaffold can be designed to drive cells into morphologies that direct theirdifferentiation down a desired lineage.
Supplementary MaterialRefer to Web version on PubMed Central for supplementary material.
AcknowledgmentsG.K. and K.C. were supported by an NIH-NIBIB/NIST NRC Research Associateship. C.K.T. was supported by aNIST NRC Research Associateship. This work was supported by NIST and the Intramural Program of the NIH/NIDCR (National Institute of Dental and Craniofacial Research). Some of the materials employed in this work wereprovided by the Tulane Center for Gene Therapy through a grant from NCRR of the NIH P40RR017447. The“standard deviation” (S.D.) is the same as the “combined standard uncertainty of the mean” for the purposes of thiswork. The content is solely the responsibility of the authors and does not necessarily represent the official views ofNIH, NIBIB, NIDCR or NIST. This article, a contribution of NIST, is not subject to US copyright. Certainequipment and instruments or materials are identified in the paper to adequately specify the experimental details.Such identification does not imply recommendation by NIST, nor does it imply the materials are necessarily thebest available for the purpose.
References1. Stevens MM, George JH. Exploring and engineering the cell surface interface. Science. 2005;
310(5751):1135–8. [PubMed: 16293749]
2. Dalby MJ, Riehle MO, Johnstone HJ, Affrossman S, Curtis AS. Polymer-demixed nanotopography:control of fibroblast spreading and proliferation. Tissue Eng. 2002; 8(6):1099–108. [PubMed:12542955]
3. Thapa A, Miller DC, Webster TJ, Haberstroh KM. Nano-structured polymers enhance bladdersmooth muscle cell function. Biomaterials. 2003; 24(17):2915–26. [PubMed: 12742731]
4. Lovmand J, Justesen E, Foss M, Lauridsen RH, Lovmand M, Modin C, et al. The use ofcombinatorial topographical libraries for the screening of enhanced osteogenic expression andmineralization. Biomaterials. 2009; 30(11):2015–22. [PubMed: 19178942]
5. Zhao G, Zinger O, Schwartz Z, Wieland M, Landolt D, Boyan BD. Osteoblast-like cells aresensitive to submicron-scale surface structure. Clin Oral Implants Res. 2006; 17(3):258–64.[PubMed: 16672020]
6. Dalby MJ, Gadegaard N, Tare R, Andar A, Riehle MO, Herzyk P, et al. The control of humanmesenchymal cell differentiation using nanoscale symmetry and disorder. Nat Mater. 2007; 6(12):997–1003. [PubMed: 17891143]
7. Shea LD, Wang D, Franceschi RT, Mooney DJ. Engineered bone development from a pre-osteoblast cell line on three-dimensional scaffolds. Tissue Engineering. 2000; 6(6):605–17.[PubMed: 11103082]
Kumar et al. Page 9
Biomaterials. Author manuscript; available in PMC 2012 August 27.
NIH
-PA Author Manuscript
NIH
-PA Author Manuscript
NIH
-PA Author Manuscript
8. Nam YS, Yoon JJ, Park TG. A novel fabrication method of macroporous biodegradable polymerscaffolds using gas foaming salt as a porogen additive. J Biomed Mater Res. 2000; 53(1):1–7.[PubMed: 10634946]
9. Whang K, Thomas CH, Healy KE, Nuber G. A Novel Method to Fabricate Bioabsorbable Scaffolds.Polymer. 1995; 36(4):837–42.
10. Ma PX, Zhang R. Synthetic nano-scale fibrous extracellular matrix. J Biomed Mater Res. 1999;46(1):60–72. [PubMed: 10357136]
11. Li WJ, Laurencin CT, Caterson EJ, Tuan RS, Ko FK. Electrospun nanofibrous structure: a novelscaffold for tissue engineering. J Biomed Mater Res. 2002; 60(4):613–21. [PubMed: 11948520]
12. Darling AL, Sun W. 3D microtomographic characterization of precision extruded poly-epsilon-caprolactone scaffolds. J Biomed Mater Res B Appl Biomater. 2004; 70(2):311–7. [PubMed:15264314]
13. Kim K, Lee CH, Kim BK, Mao JJ. Anatomically shaped tooth and periodontal regeneration by cellhoming. J Dent Res. 2010; 89(8):842–7. [PubMed: 20448245]
14. Dominici M, Le BK, Mueller I, Slaper-Cortenbach I, Marini F, Krause D, et al. Minimal criteriafor defining multipotent mesenchymal stromal cells. The International Society for CellularTherapy position statement. Cytotherapy. 2006; 8(4):315–7. [PubMed: 16923606]
15. Bianco P, Robey PG, Simmons PJ. Mesenchymal stem cells: revisiting history, concepts, andassays. Cell Stem Cell. 2008; 2(4):313–9. [PubMed: 18397751]
16. Dorsey SM, Lin-Gibson S, Simon CG Jr. X-ray microcomputed tomography for the measurementof cell adhesionand proliferation in polymer scaffolds. Biomaterials. 2009; 30(16):2967–74.[PubMed: 19286251]
17. Tusher VG, Tibshirani R, Chu G. Significance analysis of microarrays applied to the ionizingradiation response. Proc Natl Acad Sci U S A. 2001; 98(9):5116–21. [PubMed: 11309499]
18. Ashburner M, Ball CA, Blake JA, Botstein D, Butler H, Cherry JM, et al. Gene ontology: tool forthe unification of biology. The Gene Ontology Consortium. Nat Genet. 2000; 25(1):25–9.[PubMed: 10802651]
19. Folkman J, Moscona A. Role of cell shape in growth control. Nature. 1978; 273(5661):345–9.[PubMed: 661946]
20. Chen CS, Mrksich M, Huang S, Whitesides GM, Ingber DE. Geometric control of cell life anddeath. Science. 1997; 276(5317):1425–8. [PubMed: 9162012]
21. Smith LA, Liu X, Hu J, Ma PX. The influence of three-dimensional nanofibrous scaffolds on theosteogenic differentiation of embryonic stem cells. Biomaterials. 2009; 30(13):2516–22. [PubMed:19176243]
22. Smith LA, Liu X, Hu J, Wang P, Ma PX. Enhancing osteogenic differentiation of mouseembryonic stem cells by nanofibers. Tissue Eng Part A. 2009; 15(7):1855–64. [PubMed:19196152]
23. Ruckh TT, Kumar K, Kipper MJ, Popat KC. Osteogenic differentiation of bone marrow stromalcells on poly(epsilon-caprolactone) nanofiber scaffolds. Acta Biomater. 2010; 6(8):2949–59.[PubMed: 20144747]
24. Abrams GA, Goodman SL, Nealey PF, Franco M, Murphy CJ. Nanoscale topography of thebasement membrane underlying the corneal epithelium of the rhesus macaque. Cell Tissue Res.2000; 299(1):39–46. [PubMed: 10654068]
25. Atala A, Bauer SB, Soker S, Yoo JJ, Retik AB. Tissue-engineered autologous bladders for patientsneeding cystoplasty. Lancet. 2006; 367(9518):1241–6. [PubMed: 16631879]
26. Ott HC, Matthiesen TS, Goh SK, Black LD, Kren SM, Netoff TI, et al. Perfusion-decellularizedmatrix: using nature’s platform to engineer a bioartificial heart. Nat Med. 2008 Feb; 14(2):213–21.[PubMed: 18193059]
27. Petersen TH, Calle EA, Zhao L, Lee EJ, Gui L, Raredon MB, et al. Tissue-engineered lungs for invivo implantation. Science. 2010; 329(5991):538–41. [PubMed: 20576850]
28. McBeath R, Pirone DM, Nelson CM, Bhadriraju K, Chen CS. Cell shape, cytoskeletal tension, andRhoA regulate stem cell lineage commitment. Dev Cell. 2004; 6(4):483–95. [PubMed: 15068789]
Kumar et al. Page 10
Biomaterials. Author manuscript; available in PMC 2012 August 27.
NIH
-PA Author Manuscript
NIH
-PA Author Manuscript
NIH
-PA Author Manuscript

29. Rodriguez JP, Gonzalez M, Rios S, Cambiazo V. Cytoskeletal organization of humanmesenchymal stem cells (MSC) changes during their osteogenic differentiation. J Cell Biochem.2004; 93(4):721–31. [PubMed: 15660416]
30. Treiser MD, Yang EH, Gordonov S, Cohen DM, Androulakis IP, Kohn J, et al. Cytoskeleton-basedforecasting of stem cell lineage fates. Proc Natl Acad Sci U S A. 2010; 107(2):610–5. [PubMed:20080726]
31. Marks, SC., Jr; Hermey, DC. The structure and development of bone. In: Bilezikian, JP.; Raisz,LG.; Rodan, GA., editors. Principles of Bone Biology. 1. New York: Academic Press; 1996. p.3-14.
Kumar et al. Page 11
Biomaterials. Author manuscript; available in PMC 2012 August 27.
NIH
-PA Author Manuscript
NIH
-PA Author Manuscript
NIH
-PA Author Manuscript
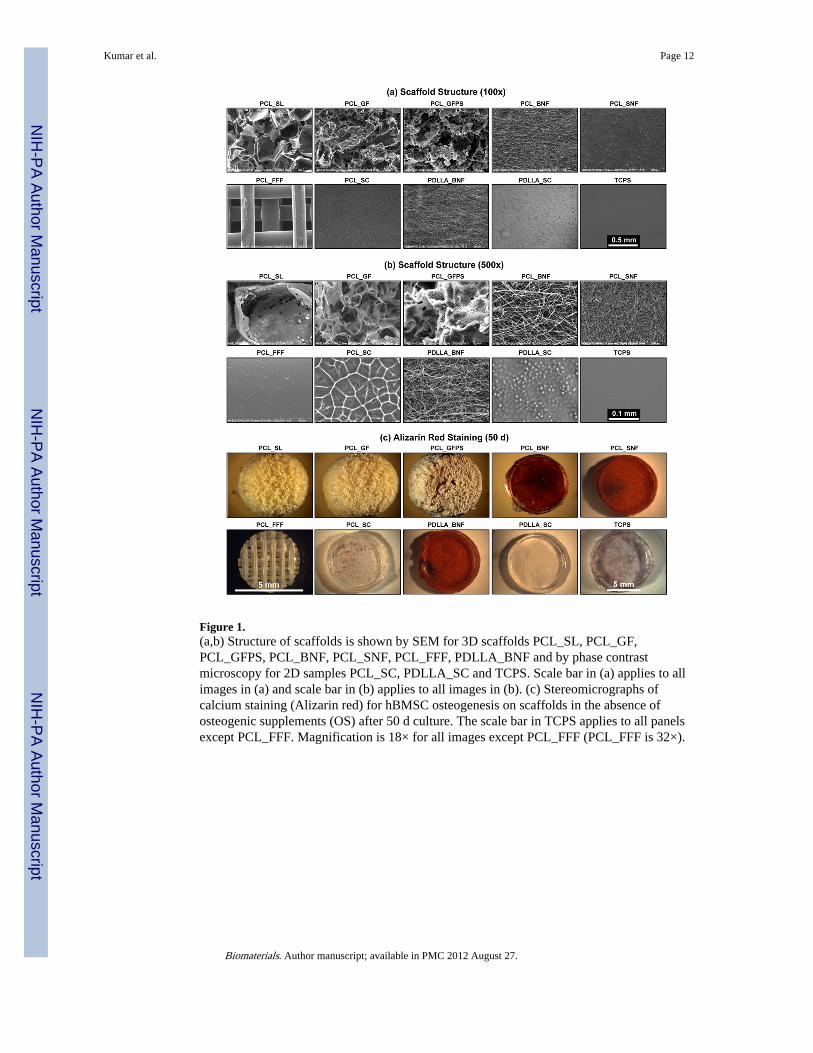
Figure 1.(a,b) Structure of scaffolds is shown by SEM for 3D scaffolds PCL_SL, PCL_GF,PCL_GFPS, PCL_BNF, PCL_SNF, PCL_FFF, PDLLA_BNF and by phase contrastmicroscopy for 2D samples PCL_SC, PDLLA_SC and TCPS. Scale bar in (a) applies to allimages in (a) and scale bar in (b) applies to all images in (b). (c) Stereomicrographs ofcalcium staining (Alizarin red) for hBMSC osteogenesis on scaffolds in the absence ofosteogenic supplements (OS) after 50 d culture. The scale bar in TCPS applies to all panelsexcept PCL_FFF. Magnification is 18× for all images except PCL_FFF (PCL_FFF is 32×).
Kumar et al. Page 12
Biomaterials. Author manuscript; available in PMC 2012 August 27.
NIH
-PA Author Manuscript
NIH
-PA Author Manuscript
NIH
-PA Author Manuscript
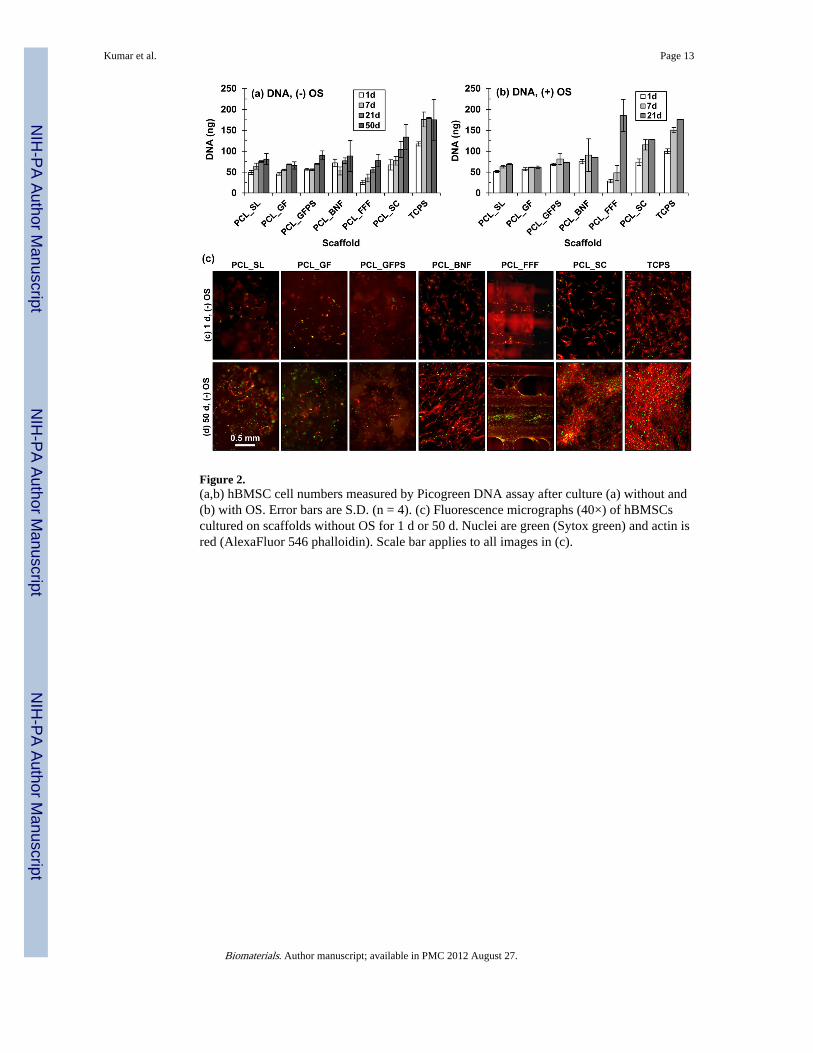
Figure 2.(a,b) hBMSC cell numbers measured by Picogreen DNA assay after culture (a) without and(b) with OS. Error bars are S.D. (n = 4). (c) Fluorescence micrographs (40×) of hBMSCscultured on scaffolds without OS for 1 d or 50 d. Nuclei are green (Sytox green) and actin isred (AlexaFluor 546 phalloidin). Scale bar applies to all images in (c).
Kumar et al. Page 13
Biomaterials. Author manuscript; available in PMC 2012 August 27.
NIH
-PA Author Manuscript
NIH
-PA Author Manuscript
NIH
-PA Author Manuscript
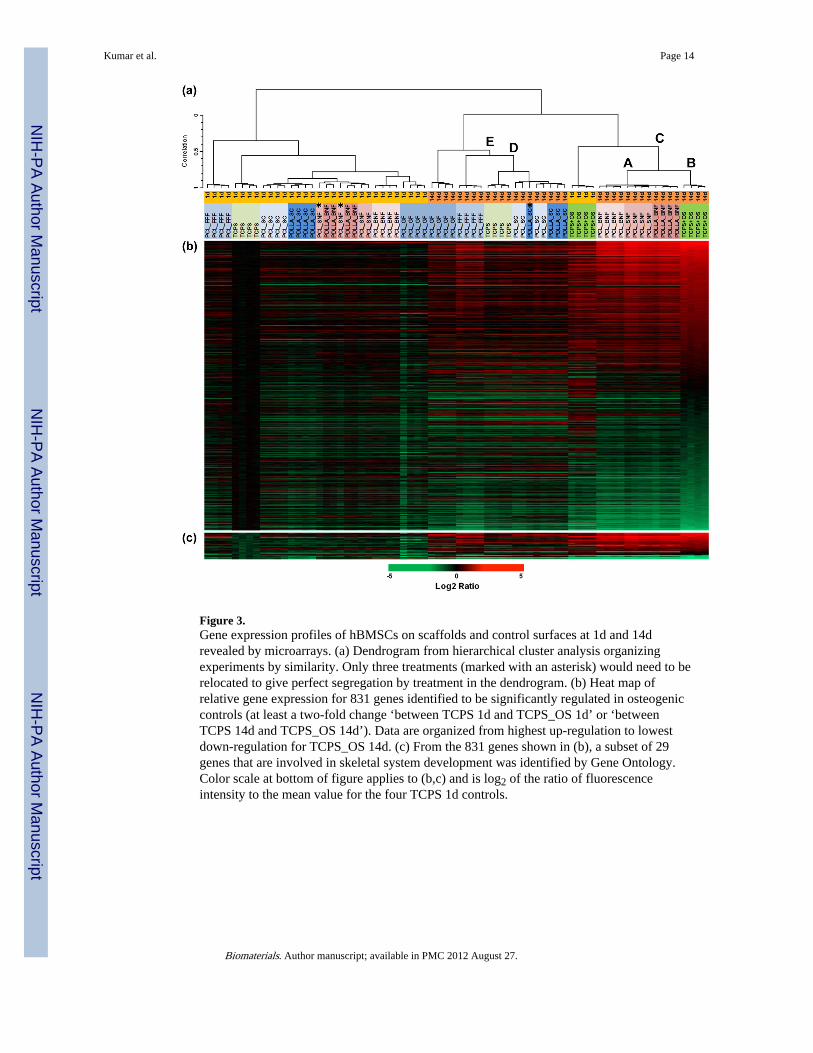
Figure 3.Gene expression profiles of hBMSCs on scaffolds and control surfaces at 1d and 14drevealed by microarrays. (a) Dendrogram from hierarchical cluster analysis organizingexperiments by similarity. Only three treatments (marked with an asterisk) would need to berelocated to give perfect segregation by treatment in the dendrogram. (b) Heat map ofrelative gene expression for 831 genes identified to be significantly regulated in osteogeniccontrols (at least a two-fold change ‘between TCPS 1d and TCPS_OS 1d’ or ‘betweenTCPS 14d and TCPS_OS 14d’). Data are organized from highest up-regulation to lowestdown-regulation for TCPS_OS 14d. (c) From the 831 genes shown in (b), a subset of 29genes that are involved in skeletal system development was identified by Gene Ontology.Color scale at bottom of figure applies to (b,c) and is log2 of the ratio of fluorescenceintensity to the mean value for the four TCPS 1d controls.
Kumar et al. Page 14
Biomaterials. Author manuscript; available in PMC 2012 August 27.
NIH
-PA Author Manuscript
NIH
-PA Author Manuscript
NIH
-PA Author Manuscript
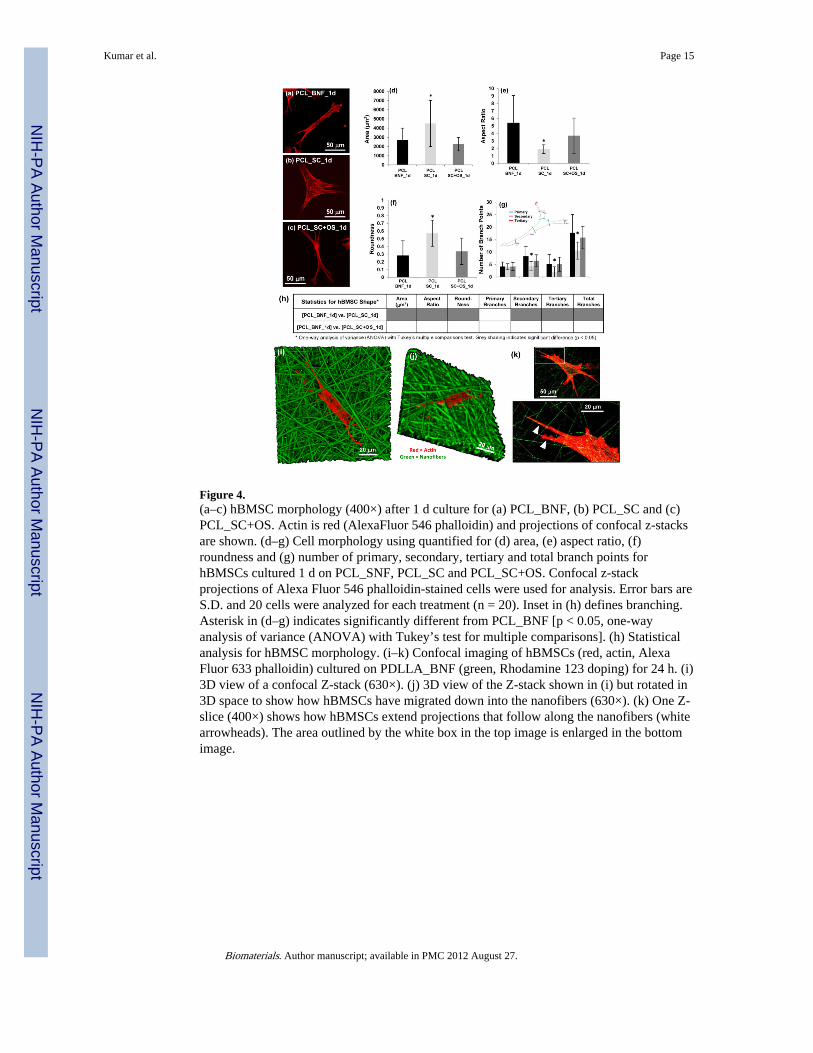
Figure 4.(a–c) hBMSC morphology (400×) after 1 d culture for (a) PCL_BNF, (b) PCL_SC and (c)PCL_SC+OS. Actin is red (AlexaFluor 546 phalloidin) and projections of confocal z-stacksare shown. (d–g) Cell morphology using quantified for (d) area, (e) aspect ratio, (f)roundness and (g) number of primary, secondary, tertiary and total branch points forhBMSCs cultured 1 d on PCL_SNF, PCL_SC and PCL_SC+OS. Confocal z-stackprojections of Alexa Fluor 546 phalloidin-stained cells were used for analysis. Error bars areS.D. and 20 cells were analyzed for each treatment (n = 20). Inset in (h) defines branching.Asterisk in (d–g) indicates significantly different from PCL_BNF [p < 0.05, one-wayanalysis of variance (ANOVA) with Tukey’s test for multiple comparisons]. (h) Statisticalanalysis for hBMSC morphology. (i–k) Confocal imaging of hBMSCs (red, actin, AlexaFluor 633 phalloidin) cultured on PDLLA_BNF (green, Rhodamine 123 doping) for 24 h. (i)3D view of a confocal Z-stack (630×). (j) 3D view of the Z-stack shown in (i) but rotated in3D space to show how hBMSCs have migrated down into the nanofibers (630×). (k) One Z-slice (400×) shows how hBMSCs extend projections that follow along the nanofibers (whitearrowheads). The area outlined by the white box in the top image is enlarged in the bottomimage.
Kumar et al. Page 15
Biomaterials. Author manuscript; available in PMC 2012 August 27.
NIH
-PA Author Manuscript
NIH
-PA Author Manuscript
NIH
-PA Author Manuscript

NIH
-PA Author Manuscript
NIH
-PA Author Manuscript
NIH
-PA Author Manuscript
Kumar et al. Page 16
Table 1
Scaffold Abbreviations
Abbreviation Definition
PCL_SL Poly(ε-Caprolactone) Salt-Leached Scaffold
PCL_GF Poly(ε-Caprolactone) Gas-Foamed Scaffold
PCL_GFPS Poly(ε-Caprolactone) Gas-Foamed Phase-Separated Scaffolds
PCL_BNF Poly(ε-Caprolactone) “Big” Nanofiber Scaffolds
PCL_SNF Poly(ε-Caprolactone) “Small” Nanofiber Scaffolds
PCL_FFF Poly(ε-Caprolactone) Freeform Fabricated Scaffolds
PCL_SC Poly(ε-Caprolactone) Spun-Coat Films
PDLLA_BNF Poly(D,L-Lactic Acid) “Big” Nanofiber Scaffolds
PDLLA_SC Poly(D,L-Lactic Acid) Spun-Coat Films
TCPS Tissue Culture Polystyrene
+OS (+) Osteogenic Supplements
Biomaterials. Author manuscript; available in PMC 2012 August 27.

NIH
-PA Author Manuscript
NIH
-PA Author Manuscript
NIH
-PA Author Manuscript
Kumar et al. Page 17
Table 2
Scaffold Structural Measurements [mean ± S.D. (n)]
PCL_SL Porositya (%) 94.3 ± 0.7 (10)
PCL_GF Porositya (%) 92.6 ± 0.8 (10)
PCL_GFPS Porositya (%) 90.3 ± 0.7 (10)
PCL_BNF Fiber Diameterb (nm) 910 ± 526 (100)
PCL_SNF Fiber Diameterb (nm) 326 ± 128 (70)
PCL FFF Porositya (%) 65.6 ± 0.9 (10)
PCL_FFF Strut Diameterb (μm) 288 ± 29 (100)
PCL_FFF Strut Spacingb (μm) 491 ± 39 (100)
PDLLA_BNF Fiber Diameterb (nm) 942 ± 234 (70)
aPorosity measured by gravimetry.
bFiber diameter, strut diameter and strut spacing measured in electron micrographs.
Biomaterials. Author manuscript; available in PMC 2012 August 27.


