Embed Size (px)
Citation preview
THE EFFECT OF CAPITAL STRUCTURE ON PROFITABILITY
OF FIRMS LISTED AT THE NAIROBI SECURITIES
EXCHANGE
LILIAN NJERI GICHUHI
A RESEARCH PROJECT SUBMITTED IN PARTIAL
FULFILLMENT OF THE REQUIREMENTS FOR THE AWARD
OF THE DEGREE OF MASTER OF BUSINESS
ADMINISTRATION (MBA), SCHOOL OF BUSINESS,
UNIVERSITY OF NAIROBI
OCTOBER 2016
ii
DECLARATION
The project is my own work and it has not been submitted for examination in any
other university or institution of higher learning for any academic award or credit.
Signed …………………………….. Date………………………
Lilian Njeri Gichuhi
D61/68853/2013
This research proposal has been submitted for examination with my approval as the
University Supervisor
Signed …………………………….. Date………………………
Mr. Mwachiti Ngome Mohamed
Lecturer
Department of Finance and Accounting
School of Business, University of Nairobi

iii
DEDICATION
This is devoted to my loving husband and child for their love and understading when I
was out to pursue my studies.

iv
ACK NOWLEDGEMENT
I intend to recognize a few peole and groups that made this research project a success.
To my supervisor, Mr. Mwachiti Ngome Mohamed and moderator, Dr. Cyrus Iraya
for their consructuve criticism and guidance when I was writing the project. To the
School of Business, University of Nairobi staffs for their efforts and support in many
ways. To my immediate family, for their encouragements during my low moments.
Last but not least, I thank God for the gift of life and good health.

v
TABLE OF CONTENTS
DECLARATION ........................................................................................................... ii
DEDICATION ............................................................................................................. iii
ACK NOWLEDGEMENT ........................................................................................... iv
ABSTRACT ............................................................................................................... viii
LIST OF TABLES ........................................................................................................ ix
LIST OF FIGURES ....................................................................................................... x
LIST OF ABBREVIATIONS AND ACRONYMS ..................................................... xi
CHAPTER ONE .......................................................................................................... 1
INTRODUCTION........................................................................................................ 1
1.1 Background of the Study ......................................................................................... 1
1.1.1 Capital Structure ............................................................................................ 2
1.1.2 Firm Profitability ........................................................................................... 3
1.1.3 The relationship between Capital Structure and Firm Profitability ............... 4
1.1.4 Nairobi Securities Exchange ......................................................................... 5
1.2 Research Problem .................................................................................................... 6
1.3 Research Objective .................................................................................................. 8
1.4 Value of the Study ................................................................................................... 8
CHAPTER TWO ....................................................................................................... 10
LITERATURE REVIEW ......................................................................................... 10
2.1 Introduction ............................................................................................................ 10
2.2 Theoretical Foundation .......................................................................................... 10
2.2.1 Modigliani and Miller Model ...................................................................... 10
2.2.2 Pecking Order Theory ................................................................................. 11
2.2.3 Agency Theory ............................................................................................ 12
2.3 Determinants of Profitability ................................................................................. 14
2.3.1 Liquidity ...................................................................................................... 14
2.3.2 Firm Size...................................................................................................... 15
2.3.3 Leverage ...................................................................................................... 15
2.3.4 Efficiency .................................................................................................... 16
2.4 Empirical Review................................................................................................... 17
vi
2.4.1 International Studies .................................................................................... 17
2.4.2 Local Studies ............................................................................................... 19
2.5 Summary of the Literature Review ........................................................................ 21
CHAPTER THREE ................................................................................................... 23
RESEARCH METHODOLOGY ............................................................................. 23
3.1 Introduction ............................................................................................................ 23
3.2 Research Design..................................................................................................... 23
3.3 Population .............................................................................................................. 23
3.4 Data Collection ...................................................................................................... 24
3.5 Data Analysis ......................................................................................................... 24
3.5.1 Analytical Model ......................................................................................... 24
3.5.2 Tests of Significance ................................................................................... 25
CHAPTER FOUR ...................................................................................................... 26
DATA ANALYSIS, RESULTS AND DISCUSSION .............................................. 26
4.1 Introduction ............................................................................................................ 26
4.2 Descriptive Statistics .............................................................................................. 26
4.3 Inferential Statistics ............................................................................................... 27
4.3.1 Pearson Correlation .................................................................................... 27
4.4 Regression Analysis .............................................................................................. 28
4.5 Discussion and Findings ........................................................................................ 29
CHAPTER FIVE ....................................................................................................... 31
SUMMARY OF FINDINGS, CONCLUSION, RECOMMENDATIONS ........... 31
5.1 Introduction ............................................................................................................ 31
5.2 Summary of Findings ............................................................................................. 31
5.3 Conclusion ............................................................................................................. 32
5.4 Policy Recommendations....................................................................................... 33
5.5 Limitations For the Study ...................................................................................... 33
5.6 Suggestions for Further study ............................................................................... 34

vii
REFERENCES ............................................................................................................ 35
APPENDIX I: LETTER OF INTRODUCTION ......................................................... 41
APPENDIX II: COMPUTED MEASUREMENTS FOR THE STUDY VARIABLES
...................................................................................................................................... 42
APPENDIX III: LIST OF LISTED FIRMS IN THE NSE AS AT DECEMBER 2015
...................................................................................................................................... 47
viii
ABSTRACT
Firms require capital to finance their business operations and invest. Most firms are
faced with a dilemma on whether to utilize debt or equity to finance their firms. But, it
important for firms to find the best option and effectively manage their risks. The
objective for this study was to determine the outcome of capital structure on
profitability of firms listed at the NSE. A descriptive research design was considered
effective for this study because it was useful in collecting data that depict the
relationship between variables. The study targeted 67 firms that had been actively
trading for the last 5 years (2011-2015) nonetheless; data was collected from 36 firms
that were considered satisfactory to make generalization. The study used secondary
data which was obtained from annual reports published by Capital Markets Authority.
Analysis of data was done using descriptive and inferential statistics. The study found
that listed firms were profitable in the study period. Firms utilized debt which
minimized their cost of financing and operational costs. There lacked a relationship
between capital structure, firm size, leverage and profitability of listed firms. The
independent variables explained eighteen percent variance in profitability of listed
firms. The regression model implemented was found to be significant. It was
concluded that there existed an insignificant link relating capital structure and
profitability of listed firms. It is recommended that a fair mix of debt and equity
should be established to ensure that the firm maintains capital adequacy. Firms can
thus be able to meet their financial compulsions and investments that can promise
attractive returns. Time and resources was a hindrance that forced me to use 36 listed
firms. A replica of this research study should be conducted in another sector such as
the manufacturing sector to find out if similar results will hold. Financial leverage
varies significantly by industry. Researchers can compare results and make a logical
conclusion.

ix
LIST OF TABLES
Table 4.1 Descriptive Statistics ............................................................................ 26
Table 4.2 Pearson Correlation Coefficient ........................................................... 27
Table 4.3 Model Coefficient................................................................................ 28
Table 4.4 Analysis of Variance ............................................................................ 28
Table 4.5 Model Coefficients ............................................................................... 29

x
LIST OF FIGURES
Figure 2.1: Conceptual Framework ...................................................................... 21

xi
LIST OF ABBREVIATIONS AND ACRONYMS
ASEA African Securities Exchanges Association
CMA Capital Markets Authority
EASEA East African Securities Exchanges Association
ETFs Exchange Traded Funds
NSE Nairobi Securities Exchange
ROA Return on Assets
ROE Return on Equity
1
CHAPTER ONE
INTRODUCTION
1.1 Background of the Study
Capital structure choice is imperative for the firm, this is for the reason that it
determines how well a firm can identify and invest in projects that can promise better
returns. An investment decision made by the firm has an influence on its competitive
abilities to cope with a aggressive environment (Wald, 1999). The capital structure of
a company essentially is a blend of various securities. In broad, a company can go for
amongst numerous options of capital structures. A firm can issue a huge quantity of
debt or meager debt. A firm can also organize to lease financing, use warrants, issue
convertible bonds, sign forward contracts or trade bond swaps. Also it can issue
dozens of different securities in limitless blends; nevertheless, it tries to get the
exacting blend that make best use of its general market worth (Hadlock and James,
2002).
Champion (2000) argues that the capital structure choice is vital for any business.
The choice is vital since there is need to capitalize on proceeds to different
organizational areas, and also since of the influence such a choice has on a company’s
capability to cope with its aggressive environs. The business surroundings is
characterized by risks and reservations in such a circumstances; decision making is
one of the majority demanding responsibilities in deciding the future of a firm.
The managers must consider the motive and consequence connection as they make a
meticulous choice. It is therefore important for managers to make accurate decisions
that impact positively on firm performance (Williamson, 2001). The managers of
2
present business world must go after systems approach in their choice since a choice
in use in segregation can get a firm to the edge of a adversity. Titman and Wessels
(2001) contends that of all the features of investment speculation choice, capital
structure choice is necessary, as the profitability of a venture is frankly affected by
such choice. Therefore, appropriate concern and concentration require to be specified
whereas making the capital structure choice (Graham, 2000).
1.1.1 Capital Structure
The capital structure of a business is a blend of debt and equity utilized by the firm in
its processes. Brealey and Myers (2003) note a company can issue many of different
securities in limitless combinations while attempting toward establishing a blend so as
to enhances market worth. Wald (1999) contends that the greatest capital structure is
lone to make best use of the market worth of the company’s exceptional stocks.
Companies can use either debt or equity capital to finance their possessions. Greatest
choice is a combination of debt and equity. In circumstance where interest was not
duty deductible, companies’ proprietors would be uninterested as to whether they
used debt or equity, and where interest was tax deductible, they would make best use
of the worth of their organizations by spending 100% debt bankrolling (Champion,
2000). Use of debt in capital structure of the company leads to agency charges.
Agency charges rise as a consequence of the associations amongst stakeholders as
well as directors, and those among debt-holders and stakeholders (Jensen and
Meckling, 1976).
3
1.1.2 Firm Profitability
Maheshwari (2001) indicate that a firm’s profitability is its capability to make profit
from all its business lines. This is an indication of how efficient the administration can
generate incomes using the capitals accessible in the market. Income growth is said to
be the key aim of every firm. In a aggressive marketplace, a firm possessor need to
learn to attain a acceptable level of productivity. Cumulative productivity comprises
defining which parts of a monetary policy are functioning and which ones require
upgrading. The management of any firm is charged with a responsibility of making
the right decisions that would maximize the returns of an organization. In
genuineness, organizations ensure they have returns goals, in addition occasionally
they compensate executives for accomplishing them, nonetheless the objectives of
organizations remain bigger than proceeds only (Petersen and Kumar, 2010).
Conferring to the pecking order philosophy in occurrence of uneven facts, a company
would select internal funding instead of other sources of capitals, but desire to issue
debt if internal funds was drained. The slightest striking substitute for the organization
would be to issue new equity. Commercial companies are expected to have additional
reserved incomes. It is anticipated that recognized stockholders will choose to
capitalize in gainful companies. This is since the more gainful the company is, the
lesser the probability of evasion and of obligating to face monetary hitches and
insolvency (Williamson, 2001).
Each company is most concerned with its productivity. One of the greatest regularly
used gears of monetary proportion examination is productivity proportions used to
govern firm's end result and its yield to that one of stockholders. Productivity
processes are significant towards executives as well as proprietors of a company
4
subsequently they display general competence in addition to presentation of the
company. Profitability proportions can be separated into twofolds that is margin and
returns (Petersen and Kumar.2010). Proportions that display margins signify the
capability of a company to convert transactions into incomes at numerous phases of
dimension. Proportions remain vital gears intended for gauging productivity of the
company since they exemplify capability a company towards quantifying the general
efficacy of the firm in producing earnings to its stockholders. This study will measure
profitability using Return on Assets (ROA) which is calculated as net income divided
by total assets (Khan and Jain, 2003).
1.1.3 The relationship between Capital Structure and Firm Profitability
Capital structure make best use of the market worth of a company that is if a company
requiring a appropriately intended capital structures the collective worth of the rights
and proprietorship benefits of the stockholders are exploited. Effective and efficient
utilization of the capital structure bring about cost reduction.
Appropriate blend of debt and equity enables the company to invest in profitable
ventures. This is because capital structure upsurges the capability of the business to
find new affluence by generating venture chances. With appropriate wealth gearing it
also rises the self-confidence of dealers of debt. This enables firm to utilize leverage
and enjoy the benefits of tax deduction, this leads to an increase in profitability. This
is in line with a study conducted by Friend and Lang (1995) who established that
there was a affirmative connection among capital structure and profitability. The
findings revealed that firms that maintained an optimal capital structure obtained
cheap funds to finance their operations which in turn generate returns and enhanced
their financial performance.
5
Capital structure rises the nation’s amount of venture and development by growing
the company’s chance to involve in forthcoming affluence-generating monies. This is
because firms that make maximum use of leverage face attractive growth due
increasing costs savings as a result of tax deduction. This is consistent with Sarkar
and Zapatero (2003) who observed there was affirmative connection among leverage
and productivity of businesses.
1.1.4 Nairobi Securities Exchange
Nairobi Securities Exchange (NSE) provides an programmed podium for citation and
transacting securities. Over the previous 6 eras, the NSE has been providing a fine
controlled, vigorous and world class podium to trade equities and bonds. Current NSE
is organizing to produce new produces comprising; Exchange Traded Funds (ETFs),
Financial and Commodity Derivatives and Carbon Credits. NSE is the market of
choice meant for global as well as local stockholders who aspire to advance exposure
to East Africa capital markets. NSE is licensed as well as regulated by Capital
Markets Authority (CMA). It is authorized to offer a dais for trading registered
securities and oversight of its member companies. CMA is a government regulator
which is responsible for certifying and regulating the capital markets in Kenya. It
gives approval to public bids and schedules of securities merchandised at the Nairobi
Stock Exchange.
NSE plays a significant part in the development of Kenya’s economy by encouraging
savings and investing and aiding local and international firms to gain access to cost-
effective capital. NSE functions under the authority of the Capital Markets Authority
of Kenya. It is an associate of the World Federation of Exchange, a initiator associate
of the African Securities Exchanges Association (ASEA) and the East African
6
Securities Exchanges Association (EASEA). Current there 67 listed firms under the
Nairobi securities Exchange (NSE, 2016).
In most firms capital structure is typically intended to help the interest of the equity
stockholders (Champion, 2000). Thus as an alternative of accruing full reserve from
shareholders a share of longterm reserve may be raised up as early payment in the
form of debenture or pledge through disbursing a secure yearly duty. Although these
expenditures are measured as outlays to an unit, such technique of funding is accepted
to aid the interest of the normal stakeholders in a healthier way. Choices connecting
to funding the possessions of most registered firms are very critical in every corporate
and the business executive is often fixed in the quandary of whatever the finest
amount of debt and equity should be. As an overall rule there should be a appropriate
blend of debt and equity capital in funding the organization’s possessions (Kuria,
2014).
1.2 Research Problem
The capital structure choice of financial company and that of non-financial company
is equal though there are substantial inter business variances in the capital structure of
companies due to the distinct nature of each business’s commercial and intra-firm
disparities which is attributable to commercial and monetary peril of discrete
companies (Brealey and Myers, 2003). Firms that need finances are faced with
dilemma on whether to use debt or equity. However, it is imperative for firms to
assess and manage risks. Firms fail to agree on an optimal capital structure that can
effectively accommodate risks and sustain the firms’ profitability (Azhagaiah &
Candasamy, 2011).
7
Firms need monetary wealth in so as to function their industry, listed firms in Kenya
raise financial capital by issuing debt securities or by vending common stock. The
quantity of debt and equity that makes up a company’s capital structure has numerous
peril and yield inferences. Consequently, company administration has an
responsibility to use a exhaustive and judicious procedure for founding a business’s
objective capital structure that enable firm to make efficient use of available sources
of finances to boost profitability (Tale, 2014).
Chiang and Chuang (2009) directed a study on the influence of capital structure on
profitability of registered companies in Hong Kong. Consequences depicted
significant association amongst capital structure in addition to productivity of non-
financial registered firms on Islamabad Stock Exchange. Abor (2005) examines
connection among capital structure and productivity of registered companies on the
Ghana Stock Exchange. Results concluded there was a affirmative link between the
proportions of short-term debt to entire assets. Mendell and Mishra (2011)
investigated financing practices crosswise companies in the woodland produces
industry by studying the association amid debt and levies conjectured in business
philosophy. Study found a undesirable association amid productivity and debt.
Ondiek (2010) examined the relationship amid of capital structure as well as financial
presentation of registered firms by Nairobi Securities Exchange. It remained exposed
that capital structure was influenced by asset tangibility, size of the firm and
profitability. Kuria (2013) conducted a research on the consequence of capital
structure on the monetary performance of commercial Banks in Kenya. The findings
8
publicized no noteworthy relationship amid of the capital structure and the financial
presentation of commercial banks in Kenya. Tale (2014) studied the connection
among capital structure and financial presentation of non-financial registered
companies at the NSE in Kenya. Research found financial presentation was definitely
connected to debt-to-equity ratio. In spite of these studies: Ondiek (2010), Kuria
(2013) and Tale (2014) failing to agree on the connection that exists amid capital
structure and productivity of registered companies, they are not conclusive. Ondiek
(2010) used a sample of 20 listed firms, Tale (2014) focused on non-financial firms
while Kuria (2013) focused on commercial banks in Kenya. These studies were not
exhaustive, hence the current study found the worth to undertake an extensive study to
bring forth a better understanding on the connection among capital structure and
productivity of registered firms at Nairobi Securities Exchange through finding an
answer to the question: what was the effect of capital structure on profitability of
registered firms at Nairobi Securities Exchange?
1.3 Research Objective
To determine the effect of capital structure on profitability of firms listed at the
Nairobi Securities Exchange.
1.4 Value of the Study
Findings of the study might be useful towards policy makers; like Capital Markets
Authority (CMA), in setting policies that ensure that listed firms maintain and
implement an optimal structure that is less susceptible to financial risks. This will
enable firms to exploit cheaper and reliable sources of finances to enhance
profitability.

9
Other firms other than listed one will also benefit from the findings of the study. They
will learn how to balance capital structure and how this influence on the productivity
in the company, this is for the reason that the development in the productivity is
essential for the long-lasting survival of the firm. The study will contribute to the
available literature. It will provide more insights on the relationship between capital
structure and profitability of listed firms, ways of achieving an optimal capital
structure. Researchers interested in this field of research might use the findings of this
study as a point of reference for further research.
10
CHAPTER TWO
LITERATURE REVIEW
2.1 Introduction
This chapter describes theoretical basis for the study to bring out the link between
profitability and capital structure. Profitability determinants have also been discussed
including the empirical review and the a chapter summary.
2.2 Theoretical Foundation
Under this section, the study discusses the theories that are in line with the study
variables; capital structure and profitability. These theories include: Modigliani and
Miller Model, Pecking Order Theory and Agency Theory.
2.2.1 Modigliani and Miller Model
Modigliani and Miller (1958) contended that the capital structure of a company is
immaterial to the company's worth, supposing faultless markets and zero business
deal charges. Modigliani and Miller (1963) presented the influence of business
revenue levies on the capital structure of a company and established that companies
will upsurge their use of debt to exploit the duty deductibility of interest. Though,
greater debt funding upsurges the likelihood of insolvency. Market symmetry must be
real in which the value of using debt‐financing equals increased peril of insolvency
owing to the great leverage of companies. This was supported by Staking and Babbel
(1995) who argued that they concurred with the hypothesis made by Modigliani and
Miller.
11
Modigliani and Miller (1963) revised their previous opinion through integrating duty
welfares as causes of the capital structure of companies. Important feature of tax
policy is that interest is a tax‐deductible outlay. Company which remits duties obtains
partly counterweighing interest duty‐shield in the form of smaller levies remited.
Consequently, as Modigliani and Miller (1963) propose, companies ought to
expenditure equally considerable debt capital as possible acceptable to exploit their
worth. Alongside with company tax policy, scholars were also concerned in
investigating the situation of individual duties levied on persons.
2.2.2 Pecking Order Theory
Pecking order theory observe that companies are enthusiastic to trade their equity
when the market is overvalued (Myers, 1984, Chittenden, 1996). This is built on the
proposition that executives act in favour of their stockholders, as a result, they decline
use of underrated stocks except the worth allocation to new stockholders is greater
than counterbalance by the remaining current worth of the development chance. It can
therefore be settled that new stocks can only be ussued at a greater value rather than
the one levied by the actual market. Based on the investors the issuance of equity by
the company signifies overvaluing. If the firm ignores exterior funding, it might resort
to secured debt rather than perilous debt and thus companies can only issue common
stocks as a latter option.
Myers and Majluf (1984), observe that companies choose internal finances sources as
opposed to costly sources of finance. Pecking order theory holds that moneymaking
firms make a high rate of earning whereby they are likely to spend less debt capital
unlike those that fail to make higher incomes. Scholars confirmed the linkage between
12
company profitability and leverage as follows: Friend and Lang (1995) and Kester
(1986) found that profitability was negatively related to debt-to-asset ratios. Rajan and
Zingales (1995) and Wald (1999) establish an contrary correlation amid leverage and
profitability. Fama and French (1998) posited that there was a positive link amid
profitability and leverage. It was observed a high amount of leverage led to agency
problems amongst stakeholders and creditors which resulted into a negative
connection amid leverage and profitability. These results are agreement with Booth &
Aivazian (2001) who investigated capital structure and profitability in a number of
countries having diverse financial markets. It was found that the variables that
affected the choice of the capital structure of firms were alike inspite of the variances
of the fiscal markets. The results concluded that productivity was inversely related to
debt and firm size.
2.2.3 Agency Theory
Agency costs emante from various conflicts from the stakeholders and self-seeking
behavior. The assumptions underlying in this theory for public firms is that the
management and emoloyees must have shared objectives and to expand the company
even if it worth investing in investments that do not cover their rate of capital. This is
so for the reason that, executive and employees’ pays service chances, perks and job
safety are linked to company scope (Kumar, Rajan & Zingales, 2001).
Top management can increase scale of the firm’s operations through diversification.
Growth strategies might affect the wealth of the shareholders, evidence shows that
firms embrace diversificantion since it minimize risks while enhancing the value of
shareholders. Lamont & Polk (2002) observe that bank growth entails increasing
management layers and employing more employees. This kind of growth reduces the
13
bank’s ability to effectively cope with evolving changes in the environment and
prevent the bank from responding to customer needs hence affect the bank’s
profitability.
Maksimovic & Phillips (2002), the superior the duration of control (number of
administrative layers) in the organization, the more complex the transaction and
agency costs will be. The main measure for administrative layers is the number of
employees hence agency costs and spand of control costs highly depends on the
vastness of these layers. These costs determine whether the average costs per unit
would be increased and off set thrifts of scale and establish an ideal scope of the
company.
Lamont & Polk (2002) argue that the top management of the bank has control over
the bank resources which they can make maximum use to increase the bank’s
profitability. These resources include: assets, technology and intellectual property.
Jensen and Meckling (1976) posit that consequence of leverage on entire agency
charges is probable to be non-monotonic. At low levels of leverage (high capital
ratio), debt increase will point out, the effect of leverage (high capital ratio), upsurges
of debt motivates executives to minimize the agency debt costs and thus enhance
profitability. Further, bankruptcy and financial distress result into unequal difficulties
and agency charges of debt surpass the agency charges of equity, and lead to further
upsurges in leverage (lower capital ratio) that will effect in advanced entire agency
charges as well as impact negatively on profitability.
14
2.3 Determinants of Profitability
There are various determinants of a firm’s profitability; these determinants might
have a positive or undesirable result on the company’s profitability. In view of this,
the study will discuss the following determinants of profitability; liquidity, firm size,
Leverage and efficiency.
2.3.1 Liquidity
Padachi (2006) notes that liquidity affects the firm profitability, liquidity risk can be
evaluated using two approaches, these include: liquidity ratios and liquidity gap.
Liquidity gap is the difference between liabilities and asssets at present and future
data. Liquidity is described as the amount of capital that is available for spending and
investing. Capital includes cash, credit and equity. Most institutions prefer using debt
because it is a chaper source of financing because of tax deductions. Stable firms are
more liquidity because they invest in short-term investments that generate free
cahsflows, their long-term investments are examined to ensure that they earn a return
on investment. It is argued that a positive gap between assets and liabilities is equal to
a deficit. Liquidity ratios can also be decribed as balance ratios that establish liquidity
trends of a firm. The firm should aim at achieving a proper balance between assets
and liabilities to minimize the cost of fundings while ensuring that funds for
investment can be accessed in a short period of time. Firm can achieve this through
holding a portfolio of assets which can easily be converted into liquid assets. Exmples
include treasury bills that are short-term in nature and risk free (Padachi et al., 2008).
15
2.3.2 Firm Size
For a firm to be profitable, it means that its assets have to generate income which is
important for investments and meeting short-term financial responsibilities. There
exists substantial evidence that firm size is instrumental in contributing towards firm
profitability. Stable firms opt to diversify their products lines and investment and thus
minimize their risk of bankcruptcy. So, a optimistic link is anticipated between
company scope and leverage (Graham, 2000). Institutional stockholders opt to
capitalize hugely in stable companies in the trust that they possess lower peril of
insolvency since big companies have access to resources needed and ability to
minimize risks of their stock investment. Therefore, they are fewer susceptibe to
monetary suffering and insolvency peril (Wald, 1999).
Large firms get discounts from suppliers because they deal with bulky products, this
minimizes their operational costs and impact positively on their profitability. This is
also supported by Jonsson (2007) who maintains that large banks are profitable as
compared to smaller banks. They have a large portfolio of customers that attracts
more customers while retaining present customers. Such banks possess a huge
turnover of customers and a huge assest base and can easily access credit because of
its credibility from stakeholders and financial stability (Williamson, 2001).
2.3.3 Leverage
Abor (2005) define leverage as the amount of debt used to finance company assets. A
firm that utilizes more debt compared to leverage is perceived to be highly levered.
Empirical review depicts a mixture of reaction on the link between these two
variables (leverage and profitability) as follows: Robb and Robinson (2009), Ruland
16
and Zhou (2011) depict a positive linkage between leverage and profitability. In view
of this, Jensen (1976) indicat the presence of a optimistic linkage amid leverage and
firm profitability.
Robb and Robinson (2009) note that use of debt increases firm market value.
Financial leverage was found to contribute positively towards company’s yield on
equity considering the influence of earnings of the firm’s possessions which is more
as compared to the aggregate cost of interest of firm’s debt. Financial leverage
impacts positively on return on equity taking into account the earnings power of a
firm’s assets that are more compare to the average cost of debt. Abor (2005) posits the
being of a positive linkage amid total debt and profitability (profitability was
measured using return on equity). Equally, Chandrakumarmangalam & Govindasamy
(2010) found that leverage was positively linked to profitability and wealth of
shareholders that was maximized when firms utilized excessive debt.
2.3.4 Efficiency
Berger and De Young (2011) define efficiency as level of performance which defines
a procedure that utilizes the lowermost sum of contributions to generate outputs.
Efficiency is the use of all contributions to produce a agreed yield which include
individual period and vigor. Competence is a notion that can be measured by decisive
the proportion of valuable production to entire contribution. It mitigates the surplus of
incomes for example physical resources, vigor and period while seeking to achieve
the expected yield. Drake and Hall (2013) note that efficiency of firm suggests better
profitability, huge amounts of resources directed in, better charges and service value
17
for customers and better security in terms of enhanced wealth buffer in engrossing
peril.
The information got from evaluation of the firm’s performance can be utilized in
improving the general competence of processes and in turn, this might contribute
towards realizing a viable verge (Hasan and Marton, 2009). Charge efficiency looks at
the charge expenses of firm (interest plus noninterest expenditures) as a purpose of
designated variables supposed to effect the cost arrangement of firms and a price
remaining, which replicates the prices that cannot be clarified by the firm. These
unsolved prices are presumed to be a quantity of a firm’s additional expenses or rate
incompetence. Study will measure efficiency using cost efficiency which will be
computed by dividing total operating expenses divided by total income.
2.4 Empirical Review
This section consists of both the local and global empirical studies that support the
connection amid capital structure and profitability of companies in different
subdivisions. Below is the discussion:
2.4.1 International Studies
Abor (2005) examines connection amid of capital structure and profitability of
registered companies on the Ghana Stock Exchange. The research used a descriptive
research. Panel data for a period of ten years was used, this covered between (1995-
2004). The regression results concluded that there was a affirmative connection amid
the proportion of short-term debt to total assets and ROE and negative connection
amid proportion of long-term debt to total assets and ROE.
18
Chiang et al. (2009) piloted a research on the effect of capital structure on profitability
of registered companies in Hong Kong. The research adopted a descriptive research
design. The study used as sample of 35 firms and panel data was used for
investigation. The consequences of the investigation found there was a significant
connection amid capital structure and profitability of non-financial registered
companies on Islamabad Stock Exchange.
Gleason (2009) investigated relationship amid capital structure besides financial
performance of 14 European nations which are congregated into 4 ethnic groups.
Descriptive study was used to explain the connection between the variables. The
research used panel data of financial and non-financial firms. Using together
monetary and functioning events of presentation, it is revealed that capital structure
effects monetary performance, though not wholly. An undesirable connection amid
capital structure and presentation proposes that agency matters possibly will lead to
consumption of sophisticated than suitable ranks of debt in the capital structure, thus
creating lesser presentation.
Mendell et al. (2011) examined financing practices across firms in the forest products
industry by reviewing the connection among debt and duties theorized in finance
model. In testing the theoretical connection among taxes and capital structure for 20
openly operated forest industry companies for the ages 1994-2003, the study find a
undesirable connection among profitability and debt, a constructive connection among
non-debt levy armors and debt, and a undesirable connection among company scope
and obligation.
19
Gill and Nahum (2013) examined the influence of capital structure on profitability of
the American service and manufacturing firms. A sample of 272 American listed
companies on New York Stock Exchange for a period of 3 years from 2005 – 2007
was selected. The correlations and regression analyses were used to approximate the
purposes connecting to profitability (measured by return on equity) with measures of
capital structure. The consequences display a affirmative connection among short-
term debt to total assets and profitability and between total debt to total assets and
profitability in the service industry. The results of this paper illustrate also a optimistic
relationship between short-term debt to total assets and profitability, long-term debt to
total assets and profitability, and among entire debt to total assets and profitability in
the manufacturing industry.
2.4.2 Local Studies
Munene (2006) evaluated the influence of profitability on capital structure of
businesses listed at NSE. The study used a descriptive research design. Secondary
informations was used for a retro of six centuries from 1999 to 2004. Statistics
examination was done using a regression model and the outcomes found that
profitability alone cannot account for variations in the capital structure of listed
companies at the Nairobi Securities Exchange.
Ondiek (2010) evaluated the link between capital structure in addition to monetary
presentation of listed firms at the Nairobi Securities Exchange. A descriptive research
design was used to find out the relationship between capital structure and financial
performance of listed firms. Secondary informations was used for a retro of five
20
centuries . Study revealed that capital structure was influenced by asset tangibility,
size of the firm and profitability.
Kuria (2013) studied on the effect of capital structure on the financial performance of
commercial Banks in Kenya. The study was piloted on 35 commercial banks in Kenya
which were in operation in Kenya for five years of study from 2008 to 2012. The
various ratios of these commercial banks were computed from the various data
collected from the data extracted from their financial statement for the period. The
data was analyzed using a linear regression model using to establish if there is any
significant relationship of capital structure and the financial performance of these
commercial banks. The finding of the analysis concluded that there was no significant
relationship between the capital structure and the financial performance of
commercial banks in Kenya.
Gichangi (2014) assessed the connection among capital structure and profitability of
registered non monetary companies in Kenya. Target inhabitants of the study was 40
listed non monetary firms. A census of non-financial firms was used. The study used
secondary data extracted from annual financial reports. Descriptive data analysis
techniques and regression were used to analyze the data. The long-term liability to
equity indicated an inverse relationship to profitability at -5.70%, with an adjusted
coefficient of determination of 97.80%. A negative relationship between capital
structure and profitability was found to exists.
Tale (2014) investigated the link among capital structure and financial performance of
non-financial registered firms at the Nairobi securities exchange in Kenya between
the period January 2008 to December 2013. The study population consisted of all the
21
40 non- financial listed firms and duly registered with capital market authority.
Secondary information used was got from financial statements of listed firms. Data
was analyzed using a regression model. Financial performance was established to be
absolutely connected to debt-to-equity proportion.
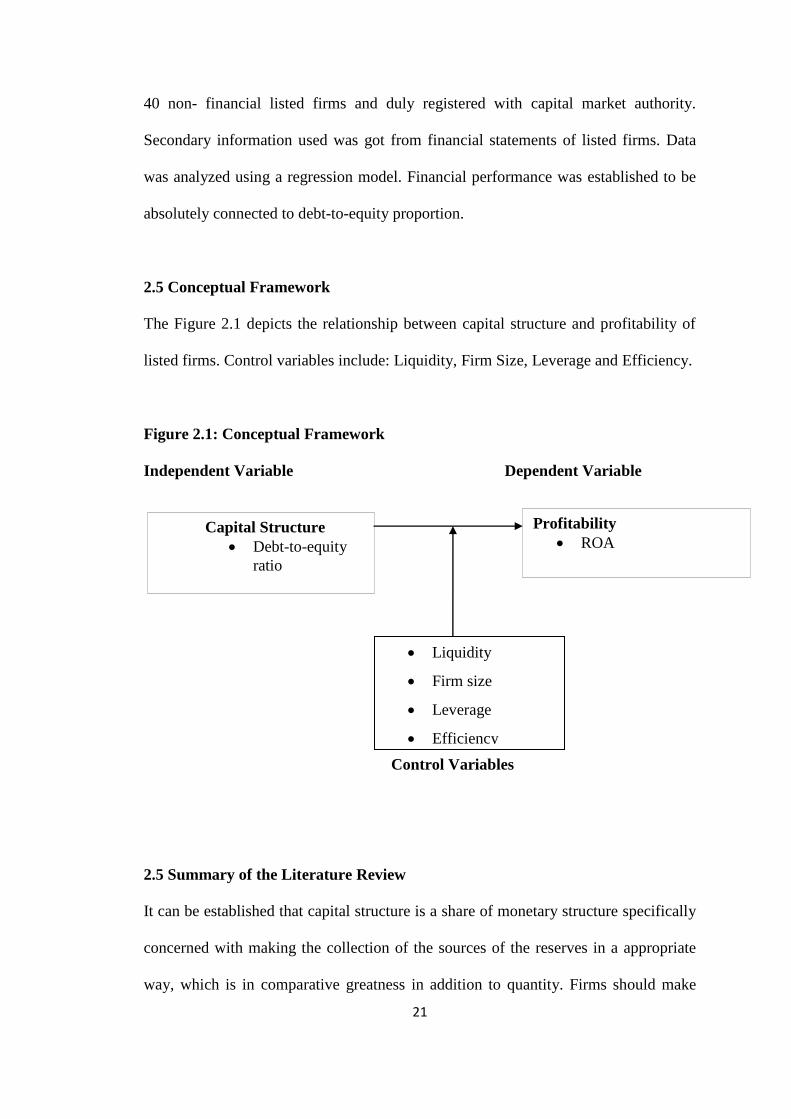
2.5 Conceptual Framework
The Figure 2.1 depicts the relationship between capital structure and profitability of
listed firms. Control variables include: Liquidity, Firm Size, Leverage and Efficiency.
Figure 2.1: Conceptual Framework
Independent Variable Dependent Variable
Control Variables
2.5 Summary of the Literature Review
It can be established that capital structure is a share of monetary structure specifically
concerned with making the collection of the sources of the reserves in a appropriate
way, which is in comparative greatness in addition to quantity. Firms should make
Capital Structure
Debt-to-equity
ratio
Profitability
ROA
Liquidity
Firm size
Leverage
Efficiency
22
accurate decisions when financing various projects in the firm in a manner that
ensures an optimal capital structure to boost profitability. Theories of that support this
studies supports the argument that companies must attempt towards achieving an
optimal capital structure through obtaining a suitable share amongst retained and debt
capital. This rest on the monetary strategy of specific companies.
Studies on relationship between capital structure and profitability of registered
companies show mix-up of their relationships. Examples include: Kuria (2014),
Gichangi (2014), Tale (2014), Gleason (2000) and Gill et al. (2013). These studies are
inconclusive and fail to agree on the connection amongst capital structure in addition
to profitability of listed financial companies in the Nairobi Securities Exchange. The
study finds a need to address this gap by attempting to establish the relationship
between capital structure and profitability of registered companies at Nairobi
securities Exchange.
23
CHAPTER THREE
RESEARCH METHODOLOGY
3.1 Introduction
This chapter provides methodology that was applied to achive the study objective.
Consists of research design, population,data collection,data analysis,analytical model
and tests of significance.
3.2 Research Design
Kothari (2004) notes that a research design involves preparation of the circumstances
for gathering and examination of statistics in a way that strives to achieve significance
to the study drive. A plan involves a preparation of what is to be done from writing
the hypothesis all through to analysis of data. Kothari (2004) notes that a sresaerch
design is a blue print for gathering, measuring and analyzing data. This design
allowed the researcher to find an answer to a research question (Kerlinger, 1973). The
study utilized a descriptive research design. The choice of this design was because it
was useful in depicting the relationships between varialbles. This form of design also
allowed to describe the behaviour of the variables without influencing them.
3.3 Population
Population refers to an whole collection of persons, proceedings or objects obligating
shared features that can be observed and measured (Singh and Nath, 2010). At present
there are 67 listed firms in the Nairobi Securities Exchange. The firms were
categorized in elevent sectors as presented in Appendix I.

24
3.4 Data Collection
The study used secondary data which was gotten from yearly informations published
by Capital Markets Authority. The collected data was reviewed for completeness and
consistency in order to carry out statistical analysis. The study covered a period of
five years (2011-2015) which was considered adequate in establishing the association
amid capital structure and profitability of registered companies. Firms that have been
actively involved in trading for the last five years were considered for data collection.
3.5 Data Analysis
The data collected was sorted and organized before capturing the same in Statistical
Packages for Social Sciences for analysis. Inferential statistics was used for analysis
of data. Inferential statistics which includes Pearson’s Coefficient and Regression
Analysis required to establish the level of reliability and consistency of findings.
Mean stardard deviation,minimum value and maximum value were decriptive
statistics which were utilized to establish the trend and patterns of the study variables.
3.5.1 Analytical Model
To attain the objective of this study, a multivariate regression model was used to
establish the connection amongst capital structure plus profitability of listed firms at
Nairobi Securities Exchange. A multiple regression model was applied consisting of
six independent variables. The independent variable was capital structure, the control
variables included: firm size, leverage and efficiency. The dependent variable was
profitability. This sought to extend the model advanced by Rajan & Zingales (1995)
and Tale (2014).
Y = a + b1X1 + b2X2+ b3X3+ b4X4+ b5X5+ ε
25
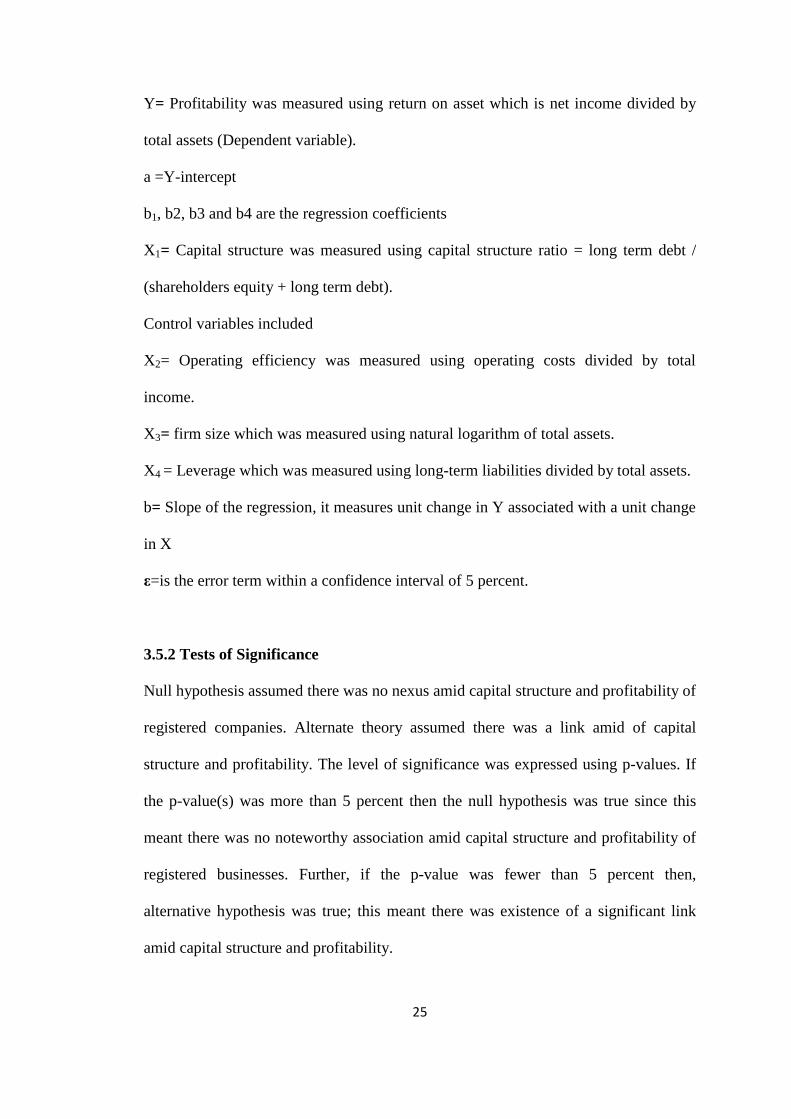
Y= Profitability was measured using return on asset which is net income divided by
total assets (Dependent variable).
a =Y-intercept
b1, b2, b3 and b4 are the regression coefficients
X1= Capital structure was measured using capital structure ratio = long term debt /
(shareholders equity + long term debt).
Control variables included
X2= Operating efficiency was measured using operating costs divided by total
income.
X3= firm size which was measured using natural logarithm of total assets.
X4 = Leverage which was measured using long-term liabilities divided by total assets.
b= Slope of the regression, it measures unit change in Y associated with a unit change
in X
ε=is the error term within a confidence interval of 5 percent.
3.5.2 Tests of Significance
Null hypothesis assumed there was no nexus amid capital structure and profitability of
registered companies. Alternate theory assumed there was a link amid of capital
structure and profitability. The level of significance was expressed using p-values. If
the p-value(s) was more than 5 percent then the null hypothesis was true since this
meant there was no noteworthy association amid capital structure and profitability of
registered businesses. Further, if the p-value was fewer than 5 percent then,
alternative hypothesis was true; this meant there was existence of a significant link
amid capital structure and profitability.
26
CHAPTER FOUR
DATA ANALYSIS, RESULTS AND DISCUSSION
4.1 Introduction
This chapter outlines analyzed statistics that have been carried out using descriptive
statistics and regression analysis. The analysis was excuted objectively to establish an
exact link that existed between capital structure and profitability of listed firms at
NSE.
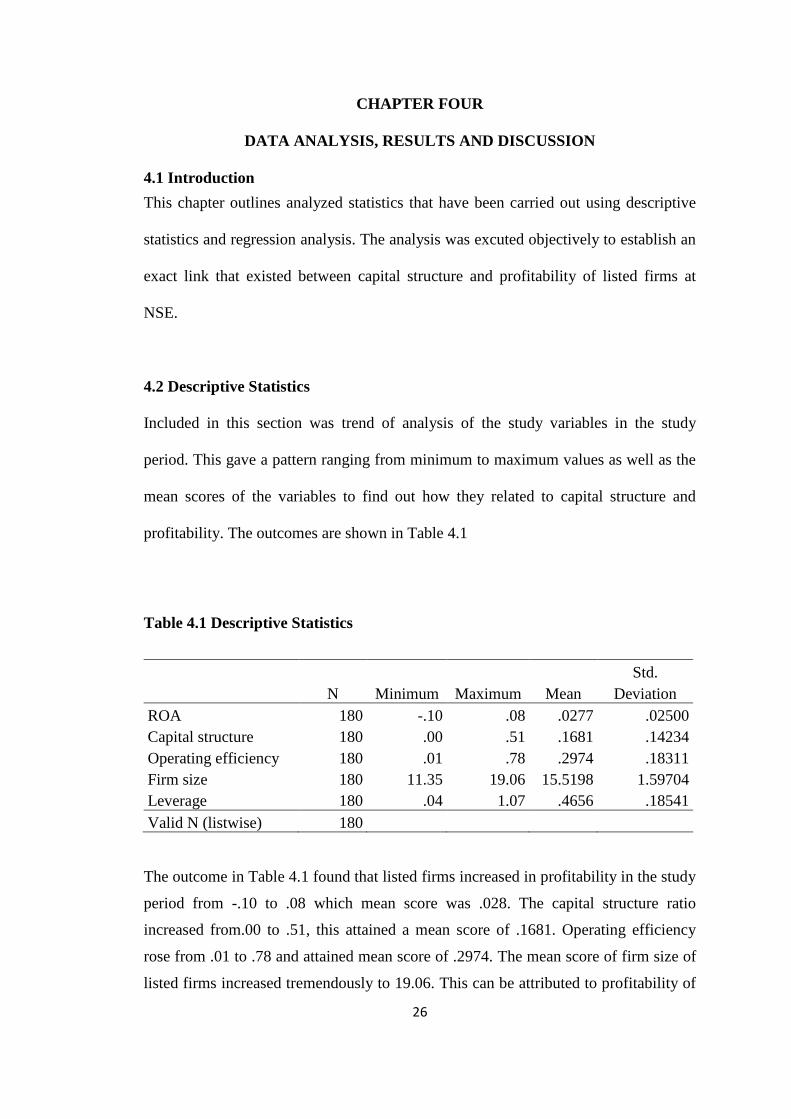
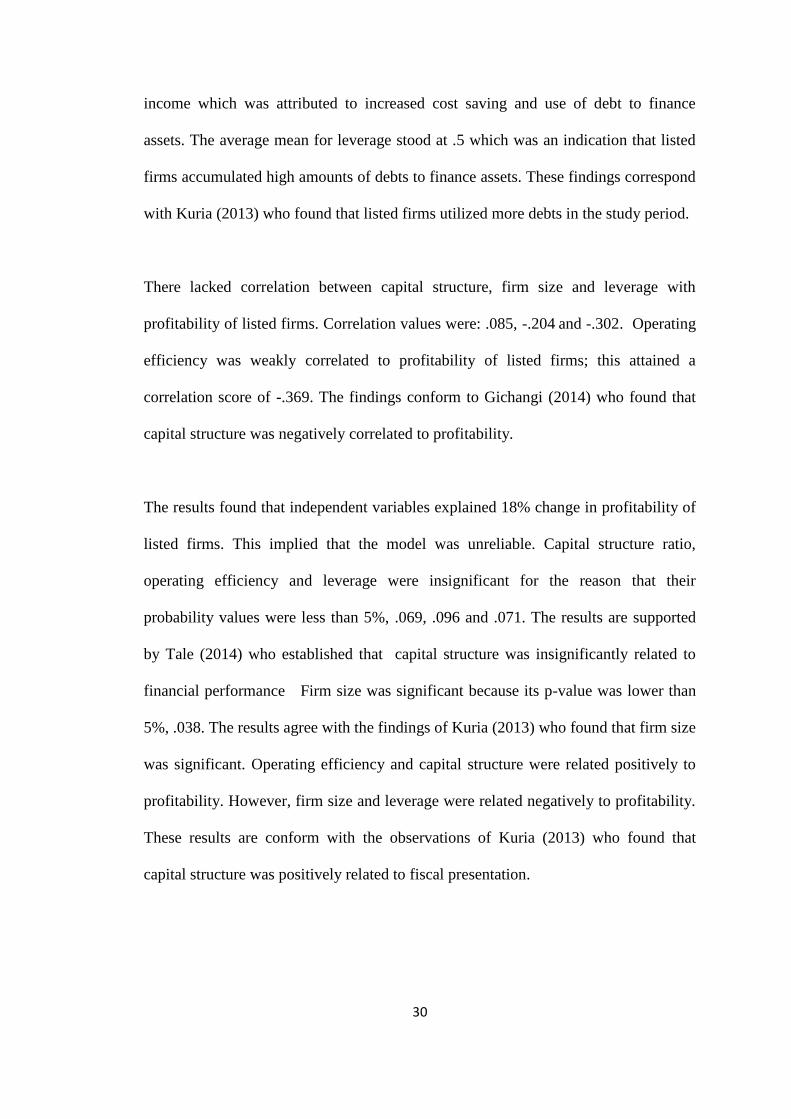
4.2 Descriptive Statistics
Included in this section was trend of analysis of the study variables in the study
period. This gave a pattern ranging from minimum to maximum values as well as the
mean scores of the variables to find out how they related to capital structure and
profitability. The outcomes are shown in Table 4.1
Table 4.1 Descriptive Statistics
N Minimum Maximum Mean
Std.
Deviation
ROA 180 -.10 .08 .0277 .02500
Capital structure 180 .00 .51 .1681 .14234
Operating efficiency 180 .01 .78 .2974 .18311
Firm size 180 11.35 19.06 15.5198 1.59704
Leverage 180 .04 1.07 .4656 .18541
Valid N (listwise) 180
The outcome in Table 4.1 found that listed firms increased in profitability in the study
period from -.10 to .08 which mean score was .028. The capital structure ratio
increased from.00 to .51, this attained a mean score of .1681. Operating efficiency
rose from .01 to .78 and attained mean score of .2974. The mean score of firm size of
listed firms increased tremendously to 19.06. This can be attributed to profitability of
27
listed firms that enabled them to generate income from their base of assets. Leverage
increased in the study period from .04 to 1.07 with mean of .4, meant that listed listed
accumulated high amounts of debts to finance their assets.
4.3 Inferential Statistics
The study utilized inferential statistics to examine the strength of the relationship that
existed amid capital structure and profitability of registered companies.
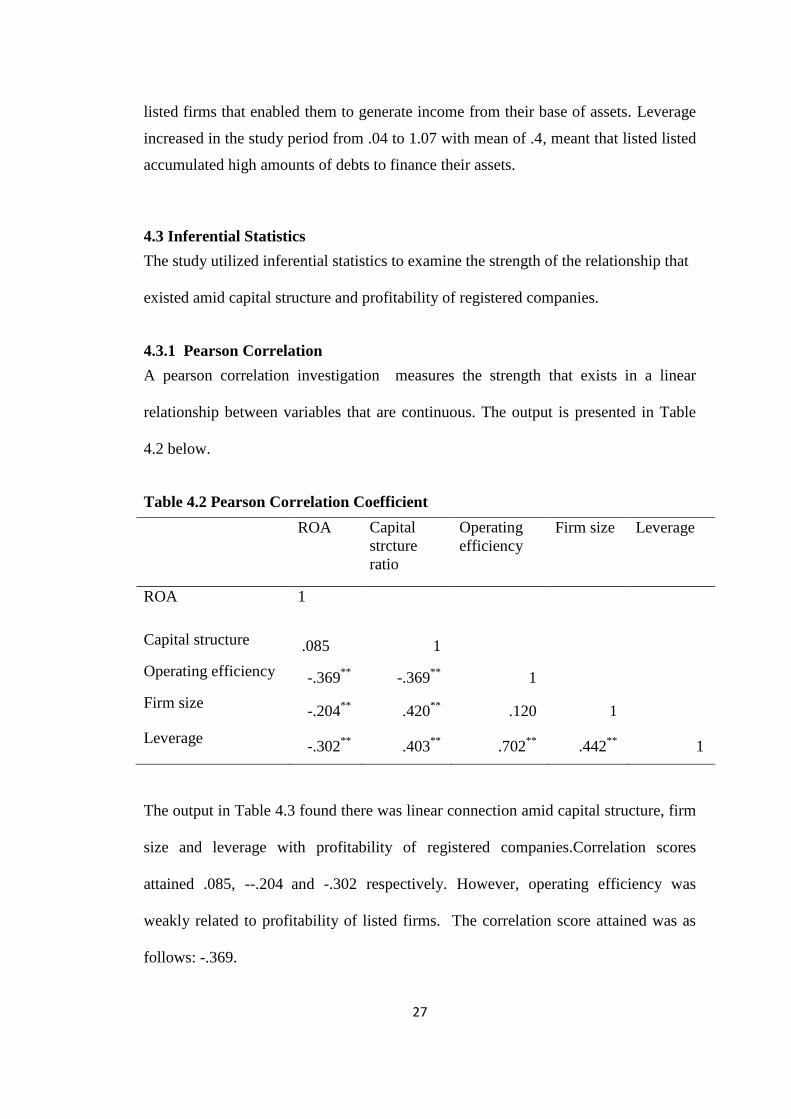
4.3.1 Pearson Correlation
A pearson correlation investigation measures the strength that exists in a linear
relationship between variables that are continuous. The output is presented in Table
4.2 below.
Table 4.2 Pearson Correlation Coefficient
ROA Capital
strcture
ratio
Operating
efficiency
Firm size Leverage
ROA 1
Capital structure .085 1
Operating efficiency -.369**
-.369**
1
Firm size -.204
** .420
** .120 1
Leverage -.302
** .403
** .702
** .442
** 1
The output in Table 4.3 found there was linear connection amid capital structure, firm
size and leverage with profitability of registered companies.Correlation scores
attained .085, --.204
and -.302 respectively. However, operating efficiency was
weakly related to profitability of listed firms. The correlation score attained was as
follows: -.369.
28
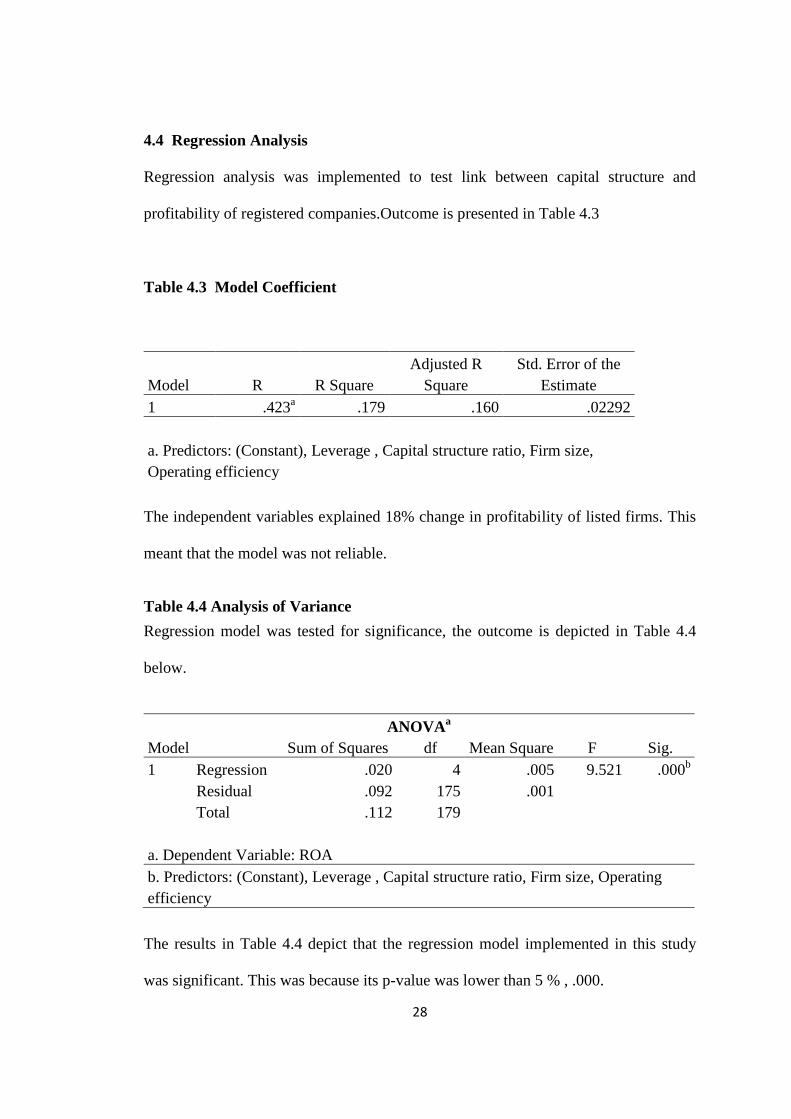
4.4 Regression Analysis
Regression analysis was implemented to test link between capital structure and
profitability of registered companies.Outcome is presented in Table 4.3
Table 4.3 Model Coefficient
Model R R Square
Adjusted R
Square
Std. Error of the
Estimate
1 .423a .179 .160 .02292
a. Predictors: (Constant), Leverage , Capital structure ratio, Firm size,
Operating efficiency
The independent variables explained 18% change in profitability of listed firms. This
meant that the model was not reliable.
Table 4.4 Analysis of Variance
Regression model was tested for significance, the outcome is depicted in Table 4.4
below.
ANOVAa
Model Sum of Squares df Mean Square F Sig.
1 Regression .020 4 .005 9.521 .000b
Residual .092 175 .001
Total .112 179
a. Dependent Variable: ROA
b. Predictors: (Constant), Leverage , Capital structure ratio, Firm size, Operating
efficiency
The results in Table 4.4 depict that the regression model implemented in this study
was significant. This was because its p-value was lower than 5 % , .000.
29
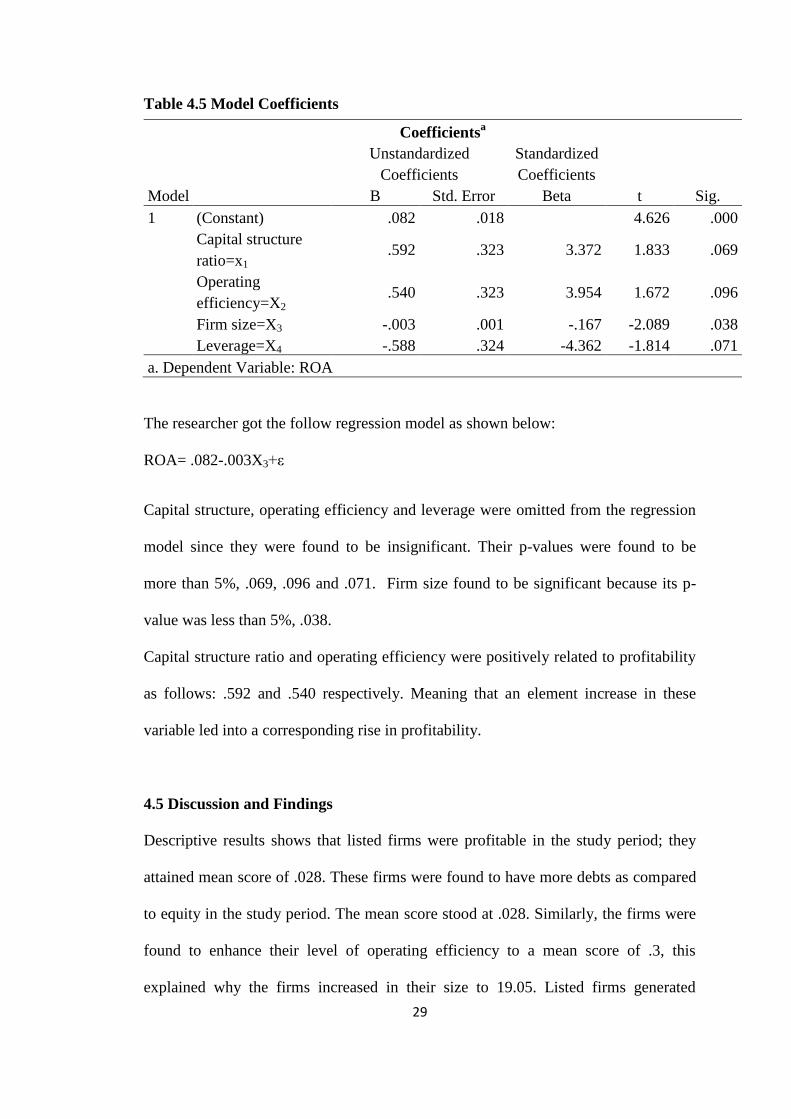
Table 4.5 Model Coefficients
Coefficientsa
Model
Unstandardized
Coefficients
Standardized
Coefficients
t Sig. B Std. Error Beta
1 (Constant) .082 .018 4.626 .000
Capital structure
ratio=x1 .592 .323 3.372 1.833 .069
Operating
efficiency=X2 .540 .323 3.954 1.672 .096
Firm size=X3 -.003 .001 -.167 -2.089 .038
Leverage=X4 -.588 .324 -4.362 -1.814 .071
a. Dependent Variable: ROA
The researcher got the follow regression model as shown below:
ROA= .082-.003X3+ε
Capital structure, operating efficiency and leverage were omitted from the regression
model since they were found to be insignificant. Their p-values were found to be
more than 5%, .069, .096 and .071. Firm size found to be significant because its p-
value was less than 5%, .038.
Capital structure ratio and operating efficiency were positively related to profitability
as follows: .592 and .540 respectively. Meaning that an element increase in these
variable led into a corresponding rise in profitability.
4.5 Discussion and Findings
Descriptive results shows that listed firms were profitable in the study period; they
attained mean score of .028. These firms were found to have more debts as compared
to equity in the study period. The mean score stood at .028. Similarly, the firms were
found to enhance their level of operating efficiency to a mean score of .3, this
explained why the firms increased in their size to 19.05. Listed firms generated
30
income which was attributed to increased cost saving and use of debt to finance
assets. The average mean for leverage stood at .5 which was an indication that listed
firms accumulated high amounts of debts to finance assets. These findings correspond
with Kuria (2013) who found that listed firms utilized more debts in the study period.
There lacked correlation between capital structure, firm size and leverage with
profitability of listed firms. Correlation values were: .085, -.204 and -.302. Operating
efficiency was weakly correlated to profitability of listed firms; this attained a
correlation score of -.369. The findings conform to Gichangi (2014) who found that
capital structure was negatively correlated to profitability.
The results found that independent variables explained 18% change in profitability of
listed firms. This implied that the model was unreliable. Capital structure ratio,
operating efficiency and leverage were insignificant for the reason that their
probability values were less than 5%, .069, .096 and .071. The results are supported
by Tale (2014) who established that capital structure was insignificantly related to
financial performance Firm size was significant because its p-value was lower than
5%, .038. The results agree with the findings of Kuria (2013) who found that firm size
was significant. Operating efficiency and capital structure were related positively to
profitability. However, firm size and leverage were related negatively to profitability.
These results are conform with the observations of Kuria (2013) who found that
capital structure was positively related to fiscal presentation.
31
CHAPTER FIVE
SUMMARY OF FINDINGS, CONCLUSION, RECOMMENDATIONS
5.1 Introduction
The chapter covers summarized results, conclusion and suggestions for further
research that have been done going by the objective of this study.
5.2 Summary of Findings
Going by objective of the study, descriptive results found that majority of the listed
firms made profits. This was because most of them attained profitability score of .028.
This was attributed to reduction of financing costs since firms were able to retain
more profits as compared to use of equity. This explains why the operating efficiency
increased with a huge margin from .01 to .78. Firm size increased rapidly with a
margin of 7.71, this was attributable to increase in profitability and use of leverage
that rose with a margin of 1.03, from 0.4 to 1.07. These findings comply with a study
by Gill and Nahum (2013) who found that that use of leverage minimized financing
costs while it contributed to profitability.
The findings confirmed that there was correlation between capital structure, firm size
and leverage with profitability of listed firms (.085, -.204 and -.302). The outcomes
are supported by the study of Gill and Nahum (2013) they observed that there lacked
correlation between capital structure and profitability. Operating efficiency was
weakly correlated to profitability (-.369). These findings are agreement with Gichangi
(2014) who observed that operating efficiency was significant.
32
Coefficient of determination attained 18%. The implication of this was that the
independent variables explained only eighteen percent variance in profitability. These
findings contradict a study by Kuria (2013) who found that the independent variables
explained .68% of the changes in financial performance. Analysis of variance showed
that regression model was important since the p-value was less than 5%, .000. The
findings conform to Mendell and Mishra (2011) who found that the regression model
utilized was statistically significant. Findings concluded that capital structure and
profitability were insignificant. These findings were supported by Tale (2014) and
Kuria (2013) and Ondiek (2010) who concluded that capital structure and financial
performance were insignificant
5.3 Conclusion
The study concluded that listed firms were profitable and efficiency in the study
period. Based on the findings, the firms utilized debt which minimized their cost of
financing and operational costs. There lacked a correlation amid capital structure, firm
size, leverage and profitability of listed companies. Operating efficiency was found to
be weakly correlated to profitability.
It was also concluded that the independent variables explained only eighteen percent
variance in profitability of listed firms.. The regression model implemented was found
to be significant. It was concluded that there existed an insignificant link amid capital
structure and profitability of registered companies. Capital structure and operating
efficiency were found to be positively related to profitability of listed firms.
33
5.4 Policy Recommendations
The study recommends that a well-adjusted combination of debt and equity should be
established so as to ensure that the firm maintains capital adequacy. Firms can thus be
able to meet their financial compulsions and grasp investments that can promise
attractive returns.
Listed firms should exhaust their retained earnings before they can decide to utilize
other forms of investment such as debt and leverage. This will ensure maximize
utilization of available funds and accurate choice of investment while minimizing
wasteful spending.
Top management should explore investment decisions before deciding on the best
investment to make. This will ensure that firms investment in priority areas based on
the funds available and enhance maximum utilization of available funds.
5.5 Limitations For the Study
Time and resources were hindrances that lead to use 36 listed firms. The findings
might have been more accurate if the study had investigated firms that have been
listed and actively been trading at the Nairobi Securities Exchange.
Because of time contraints it could have been approapriate for the researcher to excute
an exploratory study to discover the ‘cause and effect’ on the link amid capital
structure and profitability. This might have given more insights on the long-term
sustainability of capital structure and how its contribution towards profitability.
There are other factors that affect profitability of listed firms other than those decribed
in the study (liquidity, firm size, leverage and efficiency). They include diversification
and management efficiency index that have not been discussed in this study. This are
34
important factors that might have been considered in this study to enhance its level of
accuracy.
This research was limited to a duration of five years only. This duration was
insufficient in establishing an accurate and reliable connection amid capital structure
and profitability. A duration of say fifteen or twenty years could have been more
accurate in finding out the link between the variables.
5.6 Suggestions for Further study
A replica of this research study should be conducted in another sector such as the
manufacturing sector to find out if similar results will hold. Financial leverage varies
significantly by industry. Resaerchers can compare findings and make a logical
conclusion.
A related study can be done using return on equity as the dependent variable being an
important profitability measure that compares a firm’s profitability annually in
relation to the money raised by the shareholders. The aim of any company is to make
best use of the wealth of shareholders and return on equity is a measure of return
realize from the investment made by the shareholders.
As a result of technological changes and regulatory framework it is advisable that
future researchers should conduct a comparable study after a long duration of time
like 20 years. Hence, do a contrast and draw conclusive results that are built on facts.
35
REFERENCES
Abor, J. (2005). The effect of capital structure on profitability: an empirical analysis
of listed firms in Ghana, Journal of Risk Finance, 6(5), 16-30
Azhagaiah, R. & Candasamy, G. (2011). The impact of capital structure on
profitability with special reference to it industry in India, Managing Global
Transitions 9 (4), 371–392.
Berger, A.N. & De Young, R. (2010). Problem loans and cost efficiency in
commercial banks, Journal of Banking and Finance, 21, 849-870.
Booth, L., V. & Aivazian, A. (2001). Capital Structures in Developing Countries,
Journal of Finance 56, 87-130.
Brealey, R.A. & Myers, S.C. (2003). Principles of corporate finance, international
ed., McGraw‐Hill, Boston, MA.
Champion, D. (2000). Finance: the joy of leverage, Harvard Business Review, 77. 4,
19‐22.
Chandrakumarmangalam, S. & Govindasamy P. (2010), Leverage- An analysis and its
impact on profitability with reference to selected cement companies in India,
European Journal of Economics, Finance and Administrative Sciences, 27,
1450-2275
Chiang, Y. & Chuang, Li., M. (2009). Capital structure on profitability of listed firms
in Hong Kong, Journal of Finance, 2, 1, 34-45
Chittenden, F., Hall, G. & Hutchinson, P. (1996). Small firm growth, access to capital
markets and financial structure: review of issues and an empirical
investigation, Small Business Economics, 8 1, 59‐67.
36
Drake, L. & Hall, M.J.B (2013). Efficiency in Japanese banking: An empirical
analysis, Journal of Banking and Finance, 27: 891–917
Fama, E.F. & French, K. R. (1998). Taxes, financing decisions, and firm value,
Journal of Finance, 53, 819‐43.
Friend, I. & Lang, H.P. (1995). An empirical test of the impact of managerial
self‐interest on corporate capital structure, Journal of Finance, 43,271‐81.
Gichangi, A. (2014) studied the relationship between capital structure and profitability
of listed non-financial firms in Kenya, Unpublished MBA Projects, School of
Business, University of Nairobi
Gill, A. & Nahum, B. (2013). The effect of capital structure on profitability. Evidence
from the United States, International Journal of Management, 28, 4, 1, 3-15.
Gleason, A. (2009). The relationship between capital structure and financial
performance, Journal of Finance, 12(3), 19-29
Graham, J.R. (2000). How big are the tax benefits of debt, Journal of Finance,
1901‐41.
Hadlock, C.J. & James, C.M. (2002). Do banks provide financial slack, Journal of
Finance, 57, 1383‐420.
Hasan, I., & Marton, K. (2009). Development and efficiency of the banking sector in
a transitional economy: Hungarian experience, Journal of Banking and
Finance, 27, 2249-2271.
Jensen, M. & Meckling, W. (1976). Theory of the firm: managerial behavior, agency
costs and ownership structure, Journal of Financial Economics, 3, 305‐60.
37
Jonsson, B. (2007). Does the size matter? The Relationship between size and
profitability Of Icelandic Firms, Bifrost Journal of Social Sciences, 1, 43-55.
Kerlinger, F.N. (1973). Foundations of behavioral research, New Delhi: Surjeet,
Publications
Khan, Y. & Jain, K. (2003).Financial Management Text and Problems, Tata McGraw
Hill Publishing Company Limited, New Delhi
Kothari, C. K. (2004). Research methodology, methods and technique, New Delhi:
New Age International Limited Publishers
Kumar, K.B. Rajan, R.G. & Zingales, L. (2001). What determines firm size, working
paper, University of Chicago.
Kuria, T, (2013) did a study on the effect of capital structure on the financial
performance of commercial Banks in Kenya, Unpublished MBA Projects,
School of Business, University of Nairobi
Lamont, O.A. & Polk, C. (2002). Does diversification destroy value, evidence from
the industry shocks, Journal of Financial Economics 63, 51-77
Maheshwari, N. (2001).Principles of Management Accounting, Sultan hand 7 Sons,
New Delhi
Maksimovic, V. & Phillips, G. (2002).Do conglomerate firms allocate resources
inefficiently across Indus- tries, Theory and Evidence, the Journal of Finance,
57, 721-767.
Mendell, B.C. & Mishra, N., (2011). Capital structure in the United States forest
products industry, the influence of debt and taxes, Forest Science, 52(5), 540-
548.
38
Miller, M.H. & Modigliani, F. (1966). Some estimates of the cost of capital to the
electric utility industry, 1954‐57, American Economic Review, 56 3, 333‐91.
Miller, M.H. (1977). Debt and taxes, Journal of Finance, 32, 261‐76.
Modigliani, F. & Miller, M. (1958). The cost of capital, corporate finance and the
theory of investment, American Economic Review, 48, 261‐97.
Mugenda, O. & Mugenda, A. (2005). Research methods: quantitative and qualitative
approaches.2nd
, Nairobi: Act press
Munene, K. (2006). Impact of capital structure on the performance of listed firms at
the Nairobi Securities Exchange, Unpublished MBA project, School of
Business, University of Nairobi
Myers, S.C. & Majluf, N. (1984). Corporate financing and investment decisions when
firm have information that investors do not have, Journal of Financial
Economics, 13, 187‐221.
Myers, S.C. (1977). Determinants of capital borrowing, Journal of Finance
Economics, 5, 5147‐75.
Myers, S.C. (1984).The capital structure puzzle, Journal of Finance, 39, 575‐92.
Ondiek, B. (2010). The relationship between capital structure and financial
performance of listed firms at NSE, Unpublished MBA project, School of
Business, University of Nairobi
Padachi, K. (2006). Trends in working capital management and its impact on firms’
performance: an analysis of Mauritian small manufacturing firms,
International Review of Business Research Papers, 2(2), 45-58.
39
Petersen, A. & Kumar, V. (2010). Can product returns make you money, MIT Sloan
Management Review, spring, 51(3): 8
Rajan, R.G. & Zingales, L. (1995). What do we know about capital structure, some
evidence from international data, Journal of Finance, 50, 1421‐60.
Robb A. & Robinson, D.T. (2009). The capital structure decision of new
firms[Online].Available:http://papers.ssrn.com/so13/papers.cfm?abstract-
id=1345895 [Accessed: 9 setptember2016]
Ruland, W. & Zhou, P. (2011), Debt, diversification and valuation, Review of
Quantitative, Financial. Accounting, 25(3); 277-291
Sarkar, S., & Zapatero, F. (2003). The trade-off model with mean reverting earnings:
Theory and Empirical Test, The Economic Journal, 113, 490, 834–60.
Singh, Y. K., & Nath, R. (2010). Research methodology, New Delhi: A. P. H.
Publishing Corporation
Srivastava, K. & Srivastava, K. (2006). Managing Product Returns for Reverse
Logistics, International Journal of Physical Distribution and Logistics
Management, 36(7):524-546.
Staking, K.B., & Babbel, D. F. (1995). The relation between capital structure, interest
rate sensitivity and market value in the property-liability insurance industry,
Journal of Risk and Insurance, 62(4), 690-718.
Tale, N. (2014). Relationship between capital structure and performance of non-
financial listed firms at the Nairobi securities exchange, Unpublished MBA
project, School of Business, University of Nairobi
Titman, S. & Wessels, R. (2001). The determinants of capital structure choice,
Journal of Finance, 43, 1, 1-19.

40
Titman, S. & Wessels, R. (2001). The determinants of capital structure choice,
Journal of Finance, 43, 1, 1‐19.
Wald, J.K. (1999). How firm characteristics affect capital structure: an international
comparison, Journal of Financial Research, 22, 2,161‐87.
Williamson, O. (2001). Corporate finance and corporate governance, Journal of
Finance, 43, 567‐91

41
APPENDIX I: LETTER OF INTRODUCTION
42
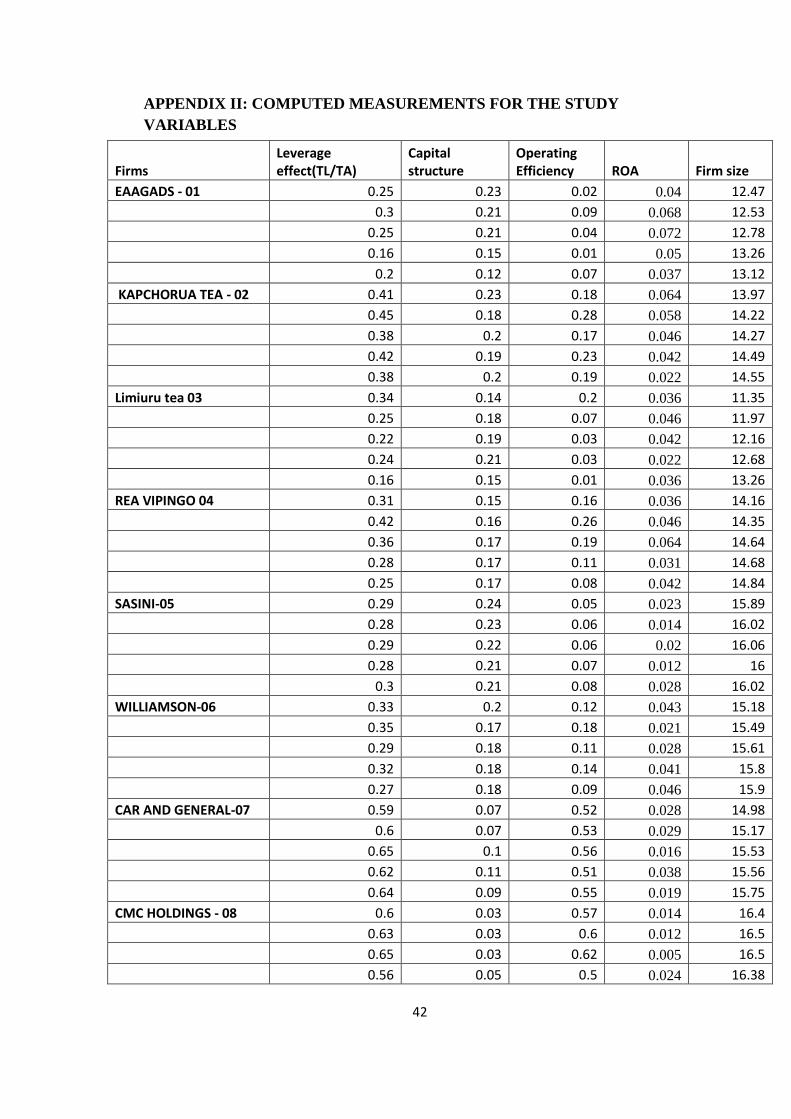
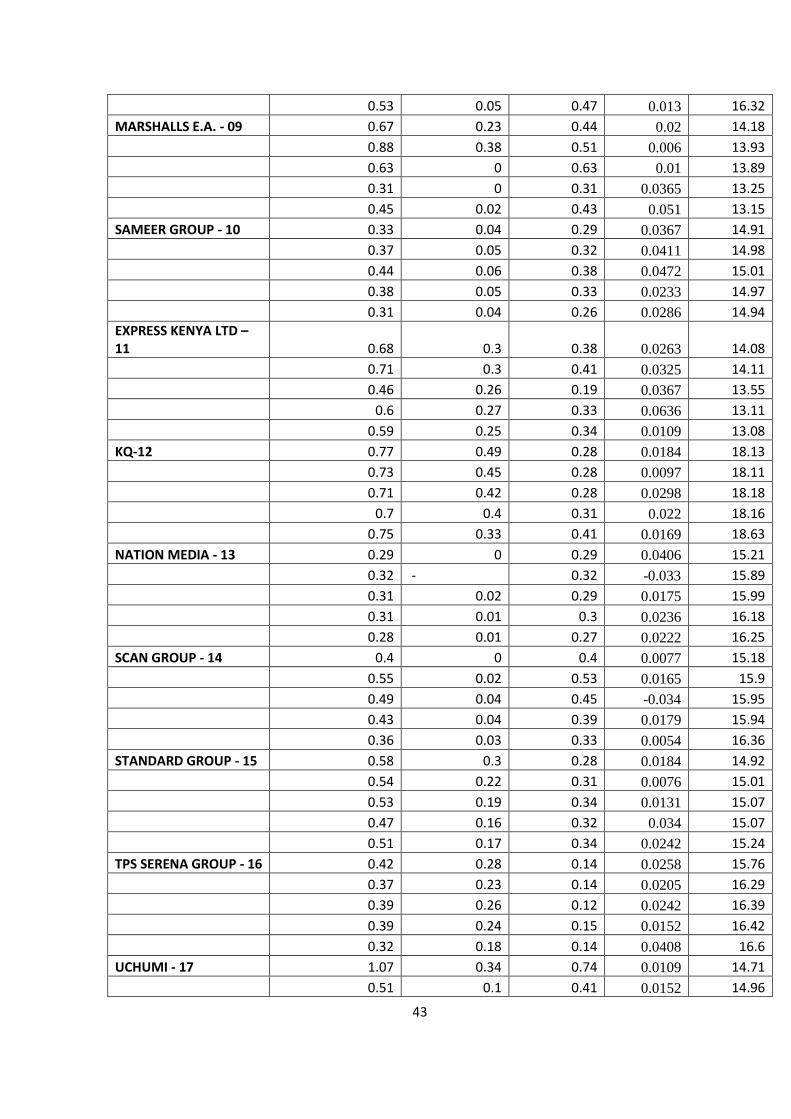
APPENDIX II: COMPUTED MEASUREMENTS FOR THE STUDY
VARIABLES
Firms Leverage effect(TL/TA)
Capital structure
Operating Efficiency ROA Firm size
EAAGADS - 01 0.25 0.23 0.02 0.04 12.47
0.3 0.21 0.09 0.068 12.53
0.25 0.21 0.04 0.072 12.78
0.16 0.15 0.01 0.05 13.26
0.2 0.12 0.07 0.037 13.12
KAPCHORUA TEA - 02 0.41 0.23 0.18 0.064 13.97
0.45 0.18 0.28 0.058 14.22
0.38 0.2 0.17 0.046 14.27
0.42 0.19 0.23 0.042 14.49
0.38 0.2 0.19 0.022 14.55
Limiuru tea 03 0.34 0.14 0.2 0.036 11.35
0.25 0.18 0.07 0.046 11.97
0.22 0.19 0.03 0.042 12.16
0.24 0.21 0.03 0.022 12.68
0.16 0.15 0.01 0.036 13.26
REA VIPINGO 04 0.31 0.15 0.16 0.036 14.16
0.42 0.16 0.26 0.046 14.35
0.36 0.17 0.19 0.064 14.64
0.28 0.17 0.11 0.031 14.68
0.25 0.17 0.08 0.042 14.84
SASINI-05 0.29 0.24 0.05 0.023 15.89
0.28 0.23 0.06 0.014 16.02
0.29 0.22 0.06 0.02 16.06
0.28 0.21 0.07 0.012 16
0.3 0.21 0.08 0.028 16.02
WILLIAMSON-06 0.33 0.2 0.12 0.043 15.18
0.35 0.17 0.18 0.021 15.49
0.29 0.18 0.11 0.028 15.61
0.32 0.18 0.14 0.041 15.8
0.27 0.18 0.09 0.046 15.9
CAR AND GENERAL-07 0.59 0.07 0.52 0.028 14.98
0.6 0.07 0.53 0.029 15.17
0.65 0.1 0.56 0.016 15.53
0.62 0.11 0.51 0.038 15.56
0.64 0.09 0.55 0.019 15.75
CMC HOLDINGS - 08 0.6 0.03 0.57 0.014 16.4
0.63 0.03 0.6 0.012 16.5
0.65 0.03 0.62 0.005 16.5
0.56 0.05 0.5 0.024 16.38
43
0.53 0.05 0.47 0.013 16.32
MARSHALLS E.A. - 09 0.67 0.23 0.44 0.02 14.18
0.88 0.38 0.51 0.006 13.93
0.63 0 0.63 0.01 13.89
0.31 0 0.31 0.0365 13.25
0.45 0.02 0.43 0.051 13.15
SAMEER GROUP - 10 0.33 0.04 0.29 0.0367 14.91
0.37 0.05 0.32 0.0411 14.98
0.44 0.06 0.38 0.0472 15.01
0.38 0.05 0.33 0.0233 14.97
0.31 0.04 0.26 0.0286 14.94
EXPRESS KENYA LTD – 11 0.68 0.3 0.38 0.0263 14.08
0.71 0.3 0.41 0.0325 14.11
0.46 0.26 0.19 0.0367 13.55
0.6 0.27 0.33 0.0636 13.11
0.59 0.25 0.34 0.0109 13.08
KQ-12 0.77 0.49 0.28 0.0184 18.13
0.73 0.45 0.28 0.0097 18.11
0.71 0.42 0.28 0.0298 18.18
0.7 0.4 0.31 0.022 18.16
0.75 0.33 0.41 0.0169 18.63
NATION MEDIA - 13 0.29 0 0.29 0.0406 15.21
0.32 - 0.32 -0.033 15.89
0.31 0.02 0.29 0.0175 15.99
0.31 0.01 0.3 0.0236 16.18
0.28 0.01 0.27 0.0222 16.25
SCAN GROUP - 14 0.4 0 0.4 0.0077 15.18
0.55 0.02 0.53 0.0165 15.9
0.49 0.04 0.45 -0.034 15.95
0.43 0.04 0.39 0.0179 15.94
0.36 0.03 0.33 0.0054 16.36
STANDARD GROUP - 15 0.58 0.3 0.28 0.0184 14.92
0.54 0.22 0.31 0.0076 15.01
0.53 0.19 0.34 0.0131 15.07
0.47 0.16 0.32 0.034 15.07
0.51 0.17 0.34 0.0242 15.24
TPS SERENA GROUP - 16 0.42 0.28 0.14 0.0258 15.76
0.37 0.23 0.14 0.0205 16.29
0.39 0.26 0.12 0.0242 16.39
0.39 0.24 0.15 0.0152 16.42
0.32 0.18 0.14 0.0408 16.6
UCHUMI - 17 1.07 0.34 0.74 0.0109 14.71
0.51 0.1 0.41 0.0152 14.96
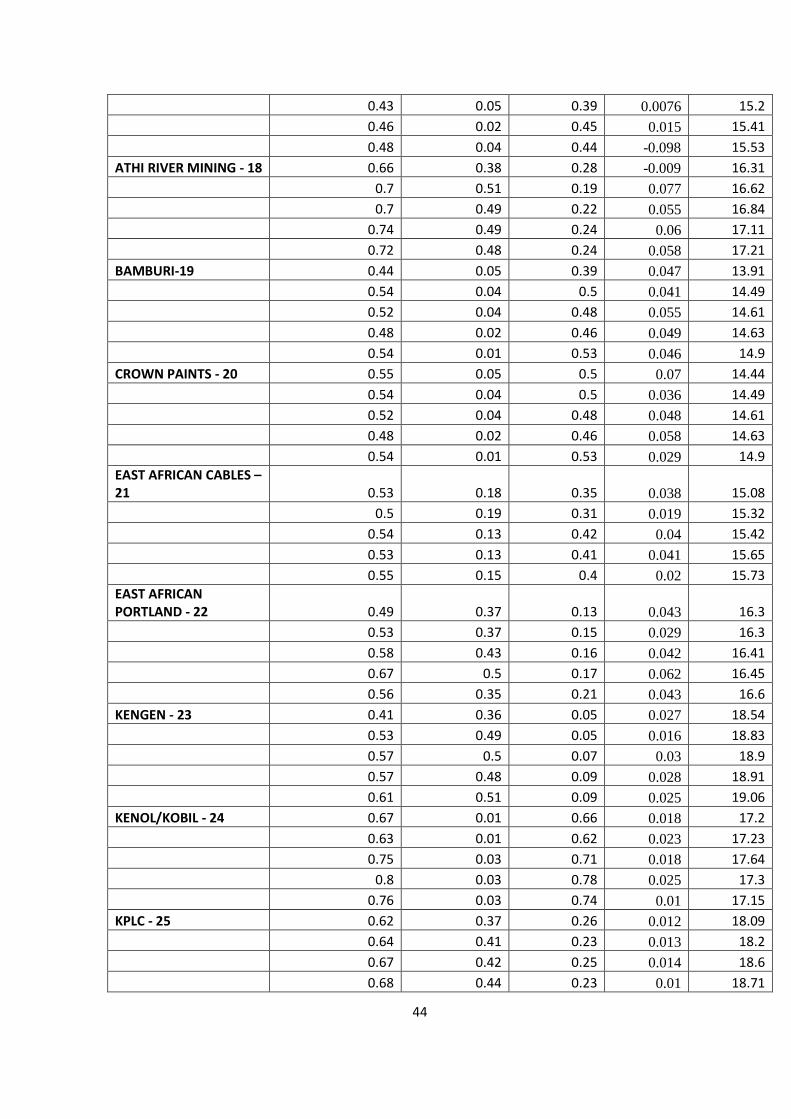
44
0.43 0.05 0.39 0.0076 15.2
0.46 0.02 0.45 0.015 15.41
0.48 0.04 0.44 -0.098 15.53
ATHI RIVER MINING - 18 0.66 0.38 0.28 -0.009 16.31
0.7 0.51 0.19 0.077 16.62
0.7 0.49 0.22 0.055 16.84
0.74 0.49 0.24 0.06 17.11
0.72 0.48 0.24 0.058 17.21
BAMBURI-19 0.44 0.05 0.39 0.047 13.91
0.54 0.04 0.5 0.041 14.49
0.52 0.04 0.48 0.055 14.61
0.48 0.02 0.46 0.049 14.63
0.54 0.01 0.53 0.046 14.9
CROWN PAINTS - 20 0.55 0.05 0.5 0.07 14.44
0.54 0.04 0.5 0.036 14.49
0.52 0.04 0.48 0.048 14.61
0.48 0.02 0.46 0.058 14.63
0.54 0.01 0.53 0.029 14.9
EAST AFRICAN CABLES – 21 0.53 0.18 0.35 0.038 15.08
0.5 0.19 0.31 0.019 15.32
0.54 0.13 0.42 0.04 15.42
0.53 0.13 0.41 0.041 15.65
0.55 0.15 0.4 0.02 15.73
EAST AFRICAN PORTLAND - 22 0.49 0.37 0.13 0.043 16.3
0.53 0.37 0.15 0.029 16.3
0.58 0.43 0.16 0.042 16.41
0.67 0.5 0.17 0.062 16.45
0.56 0.35 0.21 0.043 16.6
KENGEN - 23 0.41 0.36 0.05 0.027 18.54
0.53 0.49 0.05 0.016 18.83
0.57 0.5 0.07 0.03 18.9
0.57 0.48 0.09 0.028 18.91
0.61 0.51 0.09 0.025 19.06
KENOL/KOBIL - 24 0.67 0.01 0.66 0.018 17.2
0.63 0.01 0.62 0.023 17.23
0.75 0.03 0.71 0.018 17.64
0.8 0.03 0.78 0.025 17.3
0.76 0.03 0.74 0.01 17.15
KPLC - 25 0.62 0.37 0.26 0.012 18.09
0.64 0.41 0.23 0.013 18.2
0.67 0.42 0.25 0.014 18.6
0.68 0.44 0.23 0.01 18.71
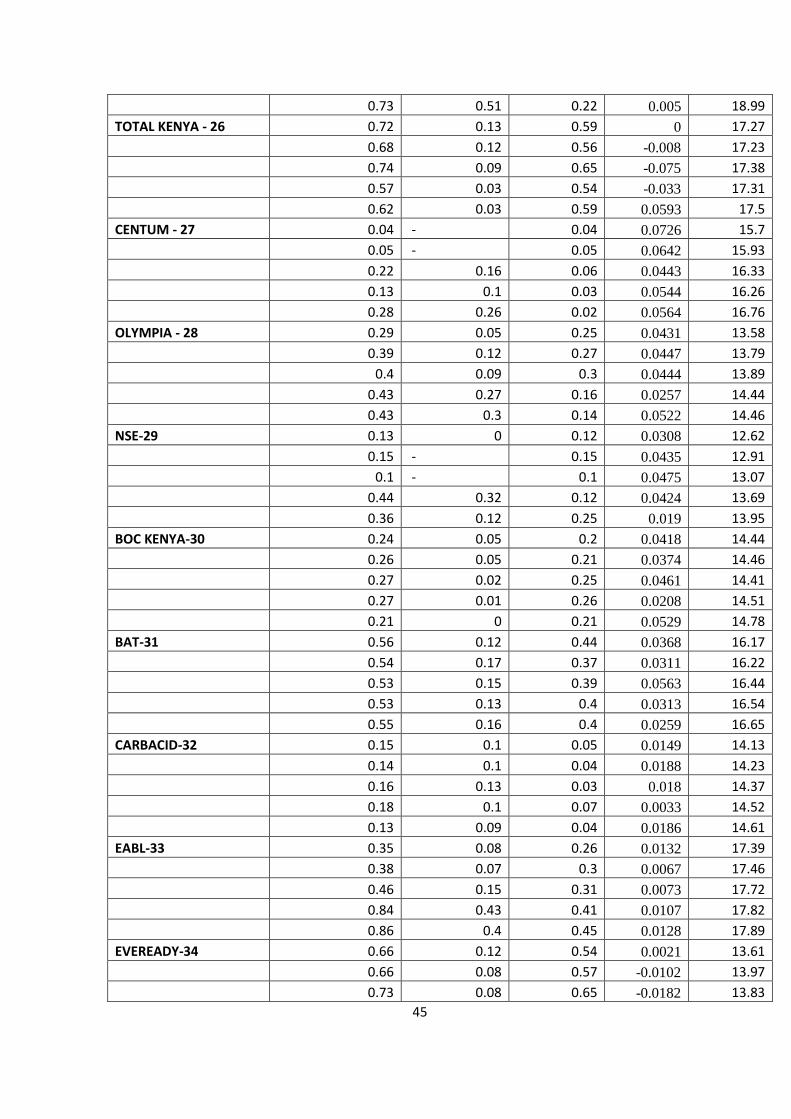
45
0.73 0.51 0.22 0.005 18.99
TOTAL KENYA - 26 0.72 0.13 0.59 0 17.27
0.68 0.12 0.56 -0.008 17.23
0.74 0.09 0.65 -0.075 17.38
0.57 0.03 0.54 -0.033 17.31
0.62 0.03 0.59 0.0593 17.5
CENTUM - 27 0.04 - 0.04 0.0726 15.7
0.05 - 0.05 0.0642 15.93
0.22 0.16 0.06 0.0443 16.33
0.13 0.1 0.03 0.0544 16.26
0.28 0.26 0.02 0.0564 16.76
OLYMPIA - 28 0.29 0.05 0.25 0.0431 13.58
0.39 0.12 0.27 0.0447 13.79
0.4 0.09 0.3 0.0444 13.89
0.43 0.27 0.16 0.0257 14.44
0.43 0.3 0.14 0.0522 14.46
NSE-29 0.13 0 0.12 0.0308 12.62
0.15 - 0.15 0.0435 12.91
0.1 - 0.1 0.0475 13.07
0.44 0.32 0.12 0.0424 13.69
0.36 0.12 0.25 0.019 13.95
BOC KENYA-30 0.24 0.05 0.2 0.0418 14.44
0.26 0.05 0.21 0.0374 14.46
0.27 0.02 0.25 0.0461 14.41
0.27 0.01 0.26 0.0208 14.51
0.21 0 0.21 0.0529 14.78
BAT-31 0.56 0.12 0.44 0.0368 16.17
0.54 0.17 0.37 0.0311 16.22
0.53 0.15 0.39 0.0563 16.44
0.53 0.13 0.4 0.0313 16.54
0.55 0.16 0.4 0.0259 16.65
CARBACID-32 0.15 0.1 0.05 0.0149 14.13
0.14 0.1 0.04 0.0188 14.23
0.16 0.13 0.03 0.018 14.37
0.18 0.1 0.07 0.0033 14.52
0.13 0.09 0.04 0.0186 14.61
EABL-33 0.35 0.08 0.26 0.0132 17.39
0.38 0.07 0.3 0.0067 17.46
0.46 0.15 0.31 0.0073 17.72
0.84 0.43 0.41 0.0107 17.82
0.86 0.4 0.45 0.0128 17.89
EVEREADY-34 0.66 0.12 0.54 0.0021 13.61
0.66 0.08 0.57 -0.0102 13.97
0.73 0.08 0.65 -0.0182 13.83
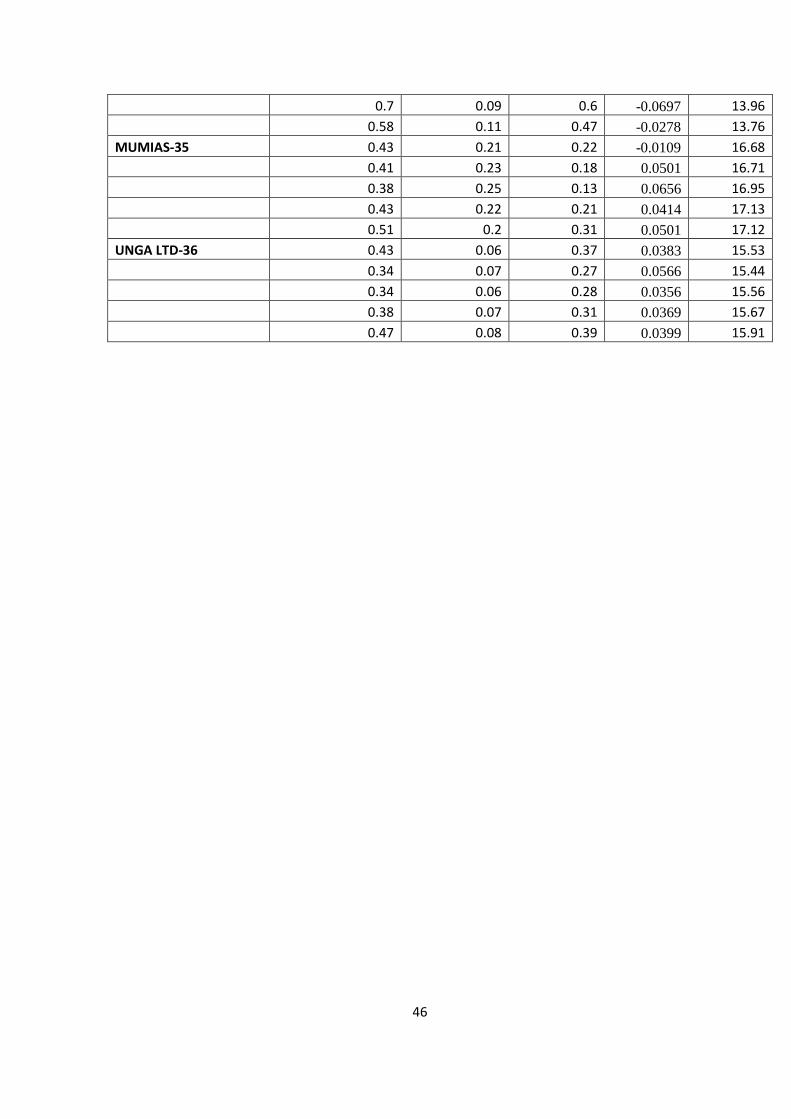
46
0.7 0.09 0.6 -0.0697 13.96
0.58 0.11 0.47 -0.0278 13.76
MUMIAS-35 0.43 0.21 0.22 -0.0109 16.68
0.41 0.23 0.18 0.0501 16.71
0.38 0.25 0.13 0.0656 16.95
0.43 0.22 0.21 0.0414 17.13
0.51 0.2 0.31 0.0501 17.12
UNGA LTD-36 0.43 0.06 0.37 0.0383 15.53
0.34 0.07 0.27 0.0566 15.44
0.34 0.06 0.28 0.0356 15.56
0.38 0.07 0.31 0.0369 15.67
0.47 0.08 0.39 0.0399 15.91
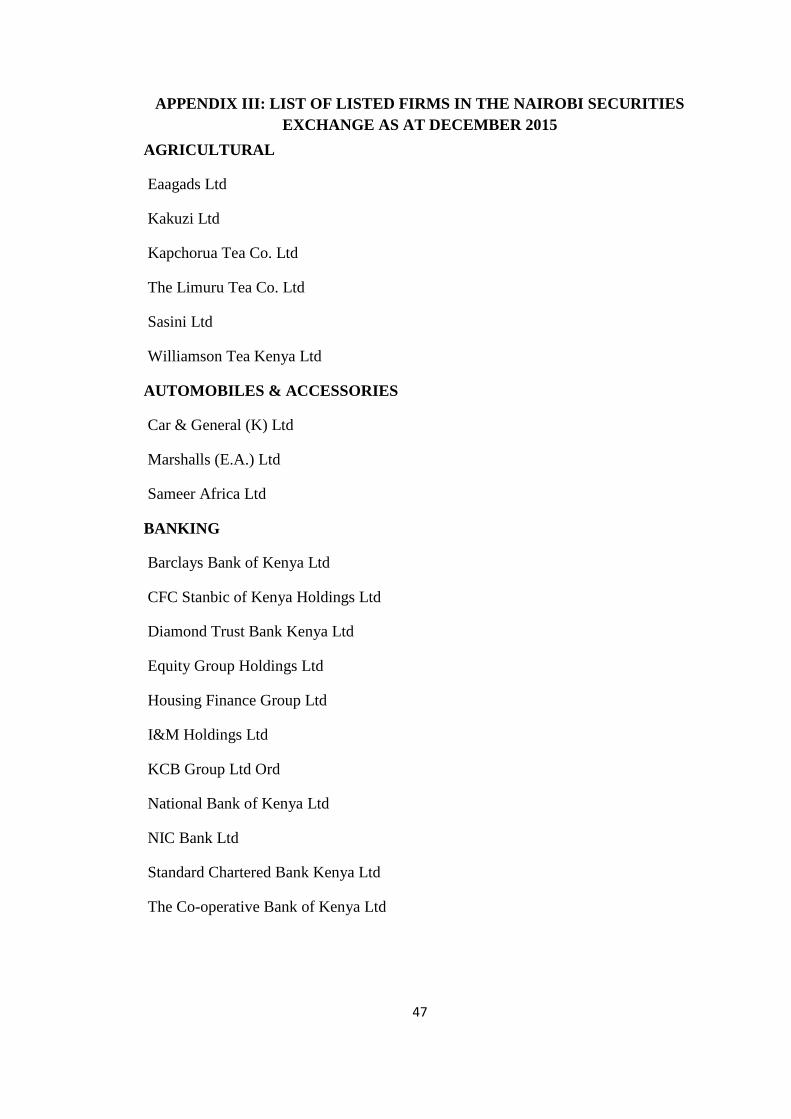
47
APPENDIX III: LIST OF LISTED FIRMS IN THE NAIROBI SECURITIES
EXCHANGE AS AT DECEMBER 2015
AGRICULTURAL
Eaagads Ltd
Kakuzi Ltd
Kapchorua Tea Co. Ltd
The Limuru Tea Co. Ltd
Sasini Ltd
Williamson Tea Kenya Ltd
AUTOMOBILES & ACCESSORIES
Car & General (K) Ltd
Marshalls (E.A.) Ltd
Sameer Africa Ltd
BANKING
Barclays Bank of Kenya Ltd
CFC Stanbic of Kenya Holdings Ltd
Diamond Trust Bank Kenya Ltd
Equity Group Holdings Ltd
Housing Finance Group Ltd
I&M Holdings Ltd
KCB Group Ltd Ord
National Bank of Kenya Ltd
NIC Bank Ltd
Standard Chartered Bank Kenya Ltd
The Co-operative Bank of Kenya Ltd

48
COMMERCIAL AND SERVICES
Atlas African Industries Ltd
Express Kenya Ltd
Hutchings Biemer Ltd
Kenya Airways Ltd
Longhorn Publishers Ltd
Nairobi Business Ventures Ltd
Nation Media Group Ltd
Standard Group Ltd
TPS Eastern Africa Ltd
Uchumi Supermarket Ltd
WPP Scan group Ltd
CONSTRUCTION & ALLIED
ARM Cement Ltd
Bamburi Cement Ltd
Crown Paints Kenya Ltd
E.A.Cables Ltd
E.A.Portland Cement Co. Ltd
ENERGY & PETROLEUM
KenGen Co. Ltd
KenolKobil Ltd
Kenya Power & Lighting Co Ltd
Kenya Power & Lighting Ltd 4% Pref 20.00
Kenya Power & Lighting Ltd 7% Pref 20.00
Total Kenya Ltd
Umeme Ltd
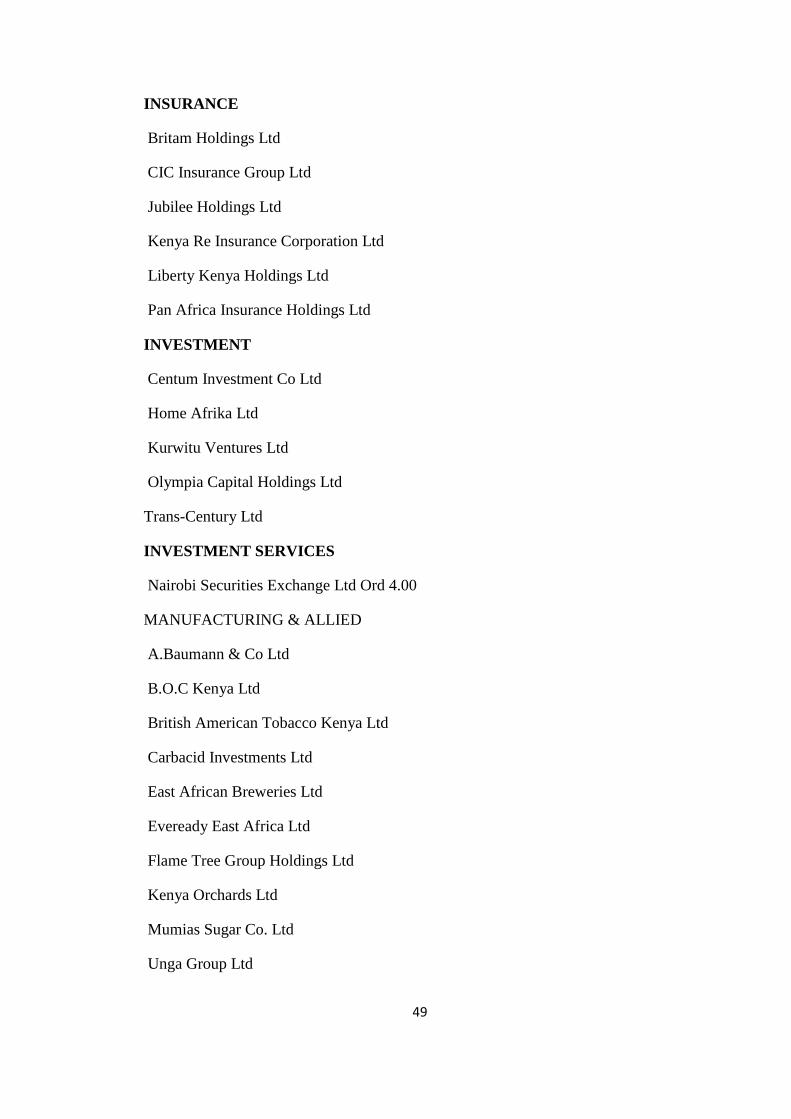
49
INSURANCE
Britam Holdings Ltd
CIC Insurance Group Ltd
Jubilee Holdings Ltd
Kenya Re Insurance Corporation Ltd
Liberty Kenya Holdings Ltd
Pan Africa Insurance Holdings Ltd
INVESTMENT
Centum Investment Co Ltd
Home Afrika Ltd
Kurwitu Ventures Ltd
Olympia Capital Holdings Ltd
Trans-Century Ltd
INVESTMENT SERVICES
Nairobi Securities Exchange Ltd Ord 4.00
MANUFACTURING & ALLIED
A.Baumann & Co Ltd
B.O.C Kenya Ltd
British American Tobacco Kenya Ltd
Carbacid Investments Ltd
East African Breweries Ltd
Eveready East Africa Ltd
Flame Tree Group Holdings Ltd
Kenya Orchards Ltd
Mumias Sugar Co. Ltd
Unga Group Ltd

50
TELECOMMUNICATION & TECHNOLOGY
Safaricom Ltd
REAL ESTATE INVESTMENT TRUST
STANLIB FAHARI I-REIT. Ord.20.00
Source: NSE, 2015


