Embed Size (px)
Citation preview

Perry & Wilson: The Accord and Strikes 397
The HILDA Survey:What’s in it for Economists?
Nicole Watson and Mark Wooden*
Melbourne Institute of Applied Economic and Social Research,The University of Melbourne
AbstractIn 2001 the first wave of the HILDA Survey, Australia’s first ever large-scalehousehold panel survey, was conducted. This article presents an introduction tothis survey. It provides a summary of the design and the process by which thesample was selected, the type of information being collected, and the proceduresemployed for data collection during wave 1. The article concludes with a discussionof some of the issues of interest to economists, and especially labour economists,that could be examined with these data.
1. IntroductionArguably the main force motivating research in the social sciences (includingeconomics) is change, with researchers concerned with the forces behindchange, its consequences, and how individuals, organisations and societiesreact and adapt to it. A major weakness of much of this research, especiallyin Australia, however, has been the reliance on cross-section data. Asdiscussed in Rose (2000, p. 8), most surveys provide point-in-time snapshotsand thus can tell us very little about change. Cross-section surveys that arerepeated are more useful, but nevertheless still only permit analyses of netchange. Moreover, that analysis can only be conducted at the level of groupaggregates. Ultimately, the analysis of change at the level of individuals,families and households requires longitudinal designs where the same unitsare followed over time.
Recognition of this, together with the vast improvement in the technologyfor handling complex data sets, has seen the emergence in many countriesof large household-based panel surveys. Indeed, the first major survey ofthis type – the Panel Study of Income Dynamics (PSID) in the USA –commenced back in 1968, and the interviewing of original sample membersstill continues today. Further, it has spawned literally hundreds of researcharticles, especially by economists, covering a diverse range of topics (seeBrown, Duncan and Stafford 1996 for a review). Similar studies wereeventually established in the mid-1980s in Germany and The Netherlandsand in the early 1990s in the UK and Canada (see Haisken-DeNew, 2001).Address for correspondence: Mark Wooden, Melbourne Institute of AppliedEconomic and Social Research, 6th Floor, Economics and Commerce Building, TheUniversity of Melbourne, Vic 3010, Australia. Tel: +61 3 8344 8882; Fax: +61 3 83445630; email: [email protected].* The HILDA Project was initiated, and is funded, by the Commonwealth Departmentof Family and Community Services (FaCS). The views expressed in this article,however, are those of the authors and should not be attributed to either FaCS or theMelbourne Institute.© The Centre for Labour Market Research, 2002.
Australian Journal of Labour Economics, Vol. 5, No. 3, September 2002, pp 397 - 417

Australian Journal of Labour Economics, September 2002398
Australia, however, did not have a large-scale survey of this type until 2001when the first wave of the Household, Income and Labour Dynamics inAustralia (HILDA) Survey was conducted. Funded by the CommonwealthGovernment, but designed and managed by a team based at the MelbourneInstitute of Applied Economic and Social Research, the University ofMelbourne, the HILDA Survey is modelled on other international panelstudies, and especially the British Household Panel Survey (BHPS) and theGerman Socio-Economic Panel (GSOEP).1 The funding initially covers thefirst three years of data collection, but with a strong expectation that fundingfor data collection will continue well beyond this initial window.
It is important to note that while other longitudinal data collections do existin Australia, their scope has been limited in a number of ways. First, mostfocus on relatively small sub-groups of the population (such as youth orimmigrants). Second, they typically provide limited information abouthousehold structure. Third, they generally have not been designed to followtheir samples for very long. Finally, where these weaknesses are not present,the samples involved are often very small. Australian policy-makers andresearchers have thus not had access to data that are both representative ofthe Australian population and provide information on the dynamic natureof events and how they interact in influencing the changing behaviour andfortunes of Australian households, families and individuals. This has beenconsistently identified as a major problem in reviews of policy-relevantresearch literature in areas such as the labour market and social policy (e.g.,Richardson 1978, p. 39; Creedy 1994; Norris and Wooden 1996, p. 107; Barr1999, pp. 22-23). The HILDA Survey is thus intended to rectify this deficiency.
This article provides an introduction to this survey. It provides a summaryof the design and the process by which the sample was selected, the type ofinformation being collected, and the procedures employed for datacollection procedures during wave 1. A brief discussion of some of the issuesof interest to economists, and especially labour economists, that could beexamined with these data then follows.
2. Who is Surveyed?The broad objective of the HILDA Survey is to select a nation-wide sampleof private households and then attempt to trace all of the individualmembers of these households, including children, over time. Individualswould only drop out of the sample in the event of death, emigration fromAustralia, the acquisition of some disability that prevented furtherparticipation (such as the onset of dementia), and incarceration.
Furthermore, and in line with the designs used in most of the householdpanel studies conducted overseas, the sample is automatically extended overtime by ‘following rules’. That is, any new children of members of the selected
1 Extensive documentation on the GSOEP and the BHPS can be found on the WorldWide Web. Their respective web addresses are: http://www.diw.de/English/sop/http://www.irc.essex.ac.uk/bhps/

Watson & Wooden: The HILDA Survey 399
households (including both biological and adopted children) as well as anynew household members resulting from changes in the composition of theoriginal households are added to the sample. Compared with other possibledesigns, such as a classic single cohort panel (e.g., the National LongitudinalSurvey of Youth — NLSY — in the USA) or a rotating medium-life panel(e.g., the Survey of Labour and Income Dynamics — SLID — in Canada),this design is generally thought to be superior in terms of delivering highquality information about family, income and labour dynamics. The lengthsof medium-life panels, for example, are often too short to provide anunderstanding of some of the issues and questions that are of highest priorityin the HILDA. Very differently, by adding new household members into thesample, the power of research into questions concerning the influences on,and impact of, changing household structure is much enhanced. Finally,with time, the indefinite life panel approach is clearly superior in terms ofaddressing questions concerning the socio-economic links betweensuccessive generations.
Wave 1 Reference PopulationThe reference population for the first wave of the HILDA Survey is allAustralian residents who live in private households. That is, and consistentwith previous longitudinal surveys of this type, the scope of the populationexcludes most persons living in institutions (such as hospitals and otherhealth-care institutions, military and police installations, correctional andpenal institutions, convents and monasteries, and boarding schools) andother non-private dwellings (such as hotels and motels). The only exceptionhere is persons listed as household members who spent part of the year atboarding schools, halls of residence and university colleges. In line withthe practice adopted in the BHPS, these individuals were included in thereference population for wave 1.
Further, to ensure that all members of the in-scope population have thesame probability of selection, dwellings that are not primary places ofresidence (e.g., holiday homes) were also excluded.
The other major exclusion was persons living in remote and sparselypopulated areas. This exclusion was dictated by cost considerations but isconsistent with the practice adopted by the Australian Bureau of Statistics(ABS) in its supplements to the monthly Labour Force Survey. It results inabout 80,000 persons being omitted from the scope of HILDA.
Finally, an Australian resident was defined to include overseas residentsliving in Australia provided they had stayed, or intended to stay, in Australiafor at least one year.
Data Collection UnitThe data collection unit is the household. Following the ABS, this is broadlydefined as ‘a group of people who usually reside and eat together’ (ABS,Statistical Concepts Library, ABS Cat. No. 1361.30.001), with emphasis givento the making of common provision for food.

Australian Journal of Labour Economics, September 2002400
The ABS makes the further observations about households.• A household resides wholly within one physical dwelling. A group of
people who make common provision for food but are living in twoseparate dwellings are two separate households.
• Lodgers, who receive accommodation only (not meals), are treated as aseparate household.
• Boarders, who receive accommodation and meals (board), are treatedas part of the household.
In general, persons who live in more than one household will only be treatedas members of the household where they spend most of their time.
We do, however, vary from the ABS practice in how children attendingboarding schools and halls of residence while studying are treated. As notedearlier, while these dwellings are out of scope, such individuals are treatedas members of sampled households provided they spend at least part ofthe year in the sampled dwelling.
Note that while all members of the household are defined as members ofthe sample, interviews are only conducted with those persons who are atleast 15 years of age (on June 30 in the year each survey wave commences).
Sample SelectionHouseholds were selected using a multi-stage approach. First, a randomsample of 488 Census Collection Districts (CDs), based on 1996 Censusboundaries, was selected from across Australia (each of which consists ofapproximately 200 to 250 households). To ensure the sample provided goodcoverage of all parts of Australia, the frame of CDs was stratified by State,and within the five most populous States, by metropolitan and non-metropolitan regions. The CDs were sampled with a probabilityproportional to their size, as measured by the number of dwellings recordedin the 1996 Census.
Second, within each of these CDs, a sample of 22 to 34 dwellings wereselected, depending on the expected response and occupancy rates withineach area. This resulted in a total of 12,252 dwellings being selected andgiven an assumed 70 per cent response rate and an expected dwellingoccupancy rate of 91 per cent, would produce a responding samplecomprising just over 7800 households.
The selections were made after all dwellings within each of the CDs werefully listed by a trained team of interviewers, thus permitting calculationof accurate probabilities of selection (that is, probabilities that take intoaccount changes in population between 1996 and 2001). Within each CD aninitial dwelling was selected at random from the list of all dwellings. Aninterviewing route was than determined and every fifth dwelling in urbanareas, and every second dwelling in rural areas, along this route was thenselected until the total number of selections was achieved.
Finally, given dwellings can contain multiple households, rules weredevised for the selection of households. These rules stipulated that where adwelling contained three or fewer households, all such households should

Watson & Wooden: The HILDA Survey 401
be sampled. Where there were four or more households occupying onedwelling, all households had to be enumerated and a random sample ofthree households obtained (based on a predetermined pattern). The selectionof households within dwellings was undertaken by the interviewer at thetime of first contact.
Following RulesSince this is a panel survey, interviews in wave 2 are sought with all membersof responding households in wave 1 (including those members whodeclined to be interviewed in wave 1). The sample, however, is designed tohave an indefinite life. This is achieved through the use of following rulesthat are intended to ensure that the sample replaces itself in the same manneras the population (see Duncan and Hill 1989). In the BHPS, for example,persons not included in the first wave but who subsequently becamemembers of households containing an original sample member (e.g., as aresult of birth or marriage, or because of other changes in householdcomposition and formation) become eligible for sample inclusion. Similarfollowing rules have been implemented in the HILDA Survey.
Essentially, eligibility for sample inclusion after wave 1 can occur in thefollowing ways.(i) A child is born to, or is adopted by, an ‘original’ or ‘continuing sample
member’. This child automatically counts as an original samplemember and information about that child will be collected from parentsuntil age 15 (after which they too will become eligible for interview).
(ii) An original sample member moves into a different household withone or more new people. These new people will now become eligiblefor interview, but are only treated as ‘temporary sample members’.
(iii) One or more new people move in with an original sample member.Again, these new people will now become eligible for interview, andare counted as temporary sample members.
All temporary sample members remain in the sample for as long as theyremain resident in a household that includes an original sample member.Temporary sample members, however, are converted to continuing samplemembers if they become the parents of a new sample member birth.
3. What Type of Information is Collected?As defined by the principal client, the Commonwealth Department ofFamily and Community Services, the primary objective of the HILDASurvey is to support research questions falling within three broad and inter-related areas. These are: (i) income dynamics; (ii) labour market dynamics;and (iii) family dynamics. Thus we would expect to include in each waveof the survey a set of like (if not identical) questions covering each of thesethree broad areas.
The income module in wave 1 is designed to measure both current andprevious financial year income of all individual household members.Household income, therefore, has to be calculated by summing acrossindividual household members. Further, our approach, which is basedclosely on that used in the ABS Survey of Income and Housing Costs,

Australian Journal of Labour Economics, September 2002402
Questionnaire
Household Form
HouseholdQuestionnaire
PersonQuestionnaire
Section
Householdcomposition
Dwellingcharacteristics
Childcare
Housing/Householdfinances
Country of birthand language
Family background
Education
Employmenthistory and status
Persons in paidemployment
Persons not in paidemployment
Examples of Data Items
Date of birthSexEnglish language speaking abilityDisabilityMarital statusEmployment statusRelationship between household members
Type of dwellingCondition of dwelling
Amount of childcare used by type of careWeekly cost of childcare used by typeChildcare difficulties
Number of bedroomsOwnership statusValue of homeRent/mortgage paymentsValue of outstanding home loanNumber of motor vehiclesWeekly expenditure on groceries / mealsPerceived adequacy of household income
Country of birthYear of arrival in Australia (if born o/s)English language backgroundIndigenous origin
Parental presence at age 14Age when first left homeParents’ birthplaceParents’ occupation
Age left schoolHighest year of school attendedPost-school qualifications obtainedCurrent educational activities
Years since leaving full-time educationSummary measures of labour force historyCurrent labour force statusCurrent employment statusTime since last worked (if not employed)Characteristics of last job (if not employed)
Characteristics of main job (occupation, hours,tenure, etc.)Employer characteristics (industry, size, sector)Perceived employment prospectsJob satisfactionRetirement intentions
Job search activityTypes of difficulties experienced in finding a jobDesire to work (if not looking)Reasons for not looking for work (if not looking)Reservation wagePerceived employment prospects
Table 1 HILDA Survey Instrument Content, Wave 1
Watson & Wooden: The HILDA Survey 403
Examples of Data Items
History of employment, job search and educationhistory since July 1 of preceding yearMutual obligation activities
Current income from:wages and salariesgovernment pensions and benefitsFinancial year income from:wages and salariesgovernment pensions and benefitsbusinessessavings and investmentsother sourcesCredit card use
Characteristics of childrenchild support paymentspatterns of contact parents and children (wherethey live apart)likelihood of having children
Marital historyDe facto relationshipsMarriage intentions
Health statusLife satisfactionAttitudes to life in AustraliaReasons for moving (if moved in last year)
Respondent cooperation and understandingProblems affecting interview
SF-36 Health Survey
SmokingFrequency of alcohol consumptionTime stressNeighbourhood characteristicsHousing adequacySatisfaction with family lifeFrequency of social interactionSocial support
Time useFinancial well-being (self assessed prosperity)Stressful financial eventsSavings habitsSavings time horizonRisk preference
Job characteristics (stress, pay fairness, security,skills utilisation and development, autonomy)Workplace support for family roleFamily-friendly work practices
Parental stressWork-family gains and strains
Section
Calendar
Income
Family formation
Partnering
Life situation
Interview situation
General health andwell-being
Lifestyle and livingsituation
Personal andhousehold finances
Attitudes andvalues about workand gender roles
Job / Workplace
Parenting
Questionnaire
Self-completionQuestionnaire

Australian Journal of Labour Economics, September 2002404
involves deducing total individual income from the sum of differentcomponents. The HILDA data will thus provide measures of each of thedifferent components of income – wages and salaries, pensions and benefits,business income, and so on.
Questions about employment and job search activity are primarilyconcerned with job characteristics for those employed at the time ofinterview, and with work intentions and job search activity for those not inemployment. In addition, one of the novel features of the HILDA Survey isthe inclusion of a calendar covering the period between July 1 in thepreceding year and the time of interview. This calendar will be used tocollect data on the length and timing of different spells of employment andunemployment and periods spent in study.
The family oriented components of the survey include a section on childcarearrangements, asked of one member in the household, a section on familyformation, with a particular emphasis on child-parent contact in familiesthat are no longer intact, and a section on partnering. In addition, additionalquestions about parenting and other aspects of family life are included in aself-completion questionnaire.
However, and as can be seen from table 1, which provides a summary ofthe content of the HILDA Survey instruments used in wave 1, the range oftopics covered extends well beyond these three broad areas, and includessuch diverse issues as housing, health, and lifestyle. In addition, duringwave 1 an extensive array of personal characteristics was also collected.This array extends well beyond the standard demographic variables toinclude, for example, parental and family background, marital history andlabour market history variables.
A particularly novel feature of the HILDA Survey, at least relative to itsinternational counterparts, is the amount of subjective data that is beingcollected. While a very limited range of attitudinal questions are includedin both the BHPS and GSOEP, the addition of a leave-behind self-completioninstrument as part of the suite of HILDA Survey instruments has facilitatedthe collection of far more information of this kind.2
In future waves, while much of the content will remain stable, it is expectedthat there will be scope for up to 10 minutes of interview time to be devotedto special topics. The topic for wave 2 is household assets and debts, withthe broad objective being to generate sufficient data to measure nethousehold wealth.
In summary, while the full power of the HILDA Survey will take manyyears to materialise, even the first wave of data is likely to prove attractiveto many users given the diverse nature of topics covered.
4. Wave 1 OutcomesThe first wave of the HILDA Survey was conducted during the latter half2 A self-completion instrument is administered as part of the BHPS. That instrument,however, is very short (taking just five minutes to complete) and is completed whilethe interviewer is still in the household.

Watson & Wooden: The HILDA Survey 405
of 2001 with a public release data file becoming available in October 2002.In what follows we describe the fieldwork process for wave 1, report onachieved response rates and provide an assessment of the representativenessof the achieved sample.
How Were the Data Collected?The data collection task, at least for the first three waves, has been sub-contracted to ACNielsen, a private market research company with a strongbackground in undertaking survey research in the area of social policy. Themajority of the wave 1 data were collected though face-to-face interviews3,which mostly took place between 24 August 2001 and 21 December 2001.4
The workload was spread across a total of 139 interviewers, all of who wereexpected to have a minimum of 100 hours of interviewing experience priorto commencing work on the HILDA project.
After establishing contact with a member of the household, an interviewlasting, on average, around 10 minutes was conducted with at least onemember of the household. This interview involved the administration ofboth the Household Form and the Household Questionnaire (see table 1).While any adult member of the household could complete these twoinstruments, interviewers requested to speak with the household memberknowing most about the finances. The option was also provided for thedeferment of the childcare section of the Household Questionnaire shouldthat person not be in the best position to respond to questions about thehousehold’s child care arrangements.
Interviews, using the Person Questionnaire, were then pursued with eachhousehold member aged 15 years and over, and averaged 34 minutes inlength. Once an individual completed this interview they were thenprovided with the Self-Completion Questionnaire (SCQ) to complete inprivate. The interviewer returned to the household at a later date to pickup the SCQ. If the SCQ was still not complete or could not be collected inperson, instructions were left with the respondent to return it by mail.
In most cases, selected households were sent a primary approach letterand a brochure approximately one week prior to when the interviewer wasscheduled to make contact with the household.5 This pre-interview materialmarketed the survey to respondents as a study about ‘Living in Australia’and, among other things, emphasised that participation was voluntary andprovided a means for sample members to opt out of the survey prior to aninterviewer calling.
To encourage response, a $50 cash incentive was offered to households whereall eligible household members completed the Person Questionnaire. If thisdid not occur, a $20 payment was offered to households if at least one3 A very small proportion (0.3 per cent) of personal interviews were conducted bytelephone.4 Some additional calls were made to a very small proportion of households between10 January and 23 January 2002. This additional fieldwork period was mainly dueto the difficulties completing two areas in rural NSW involving an ill interviewer.5 In 18 of the selected CDs, the listing of dwellings was undertaken immediatelyprior to interviewing commencing. In these cases the primary approach letter andbrochure were hand delivered on the first call attempt.

Australian Journal of Labour Economics, September 2002406
interview was obtained. The availability of this incentive was made clear inboth the primary approach letter and the brochure.
The fieldwork was conducted in two stages. The first stage involved theinterviewer working in an area over a three-week period. They called eachselected household according to a specified call-back pattern. This requiredthat, if needed, at least six calls would be made to all selected householdsuntil a final household outcome was achieved. These calls were made overa minimum of five different days, with typically three calls made onweekdays and at least three calls made on weekends.
This achieved approximately 65 per cent of the interviews from each area.The remainder of each workload was then consolidated into intensivefollow-up workloads and reassigned to the most experienced interviewers.They again called at each of these households according to the specifiedcall-back pattern. These interviewers obtained the remaining 35 per cent ofthe interviews from each area.
Response RatesA summary of the outcomes of the wave 1 fieldwork is provided in tables 2and 3. Table 2 reveals that from the 11,693 households identified as in scope,interviews were completed with all eligible members of 6872 householdsand with at least one eligible member of a further 810 households. Thehousehold response rate was, therefore, 66 per cent.
Table 2 Wave 1 Household Outcomes
Sample Outcome Number Per Cent
Addresses issued 12252less out-of-scope (vacant, non-residential, foreign) -804plus multi-households additional to sample +245
Total in-scope households =11693 100.0
Refusals to interviewer 2670 22.8Refusals to fieldwork company (via 1800 number or email) 431 3.7Non-response with contact 469 4.0Non-contact 441 3.8Fully responding households 6872 58.8Partially responding households 810 6.9
How does this compare with international best practice? At first glanceHILDA might appear to have been a relatively poor performer. The initial(that is, wave 1) response rate usually reported for the PSID is 76 per centwhile the BHPS obtained interviews at 74 per cent of selected households.The first point to note, however, is that the calculation of response rates isoften subject to sleight of hand. As noted in Wooden (2001a), part of theinitial sample used in the PSID was pre-screened, which was not taken intoaccount when calculating response rates. Doing so would have resulted ina response rate of 69 per cent. Second, there is growing evidence that thewillingness of populations to cooperate with surveys fell during the 1990s.For example, both the GSOEP and the BHPS added new samples in recent

Watson & Wooden: The HILDA Survey 407
years. In both cases the rates of response were well down on the initialresponse rates reported for their original samples. In wave 9 of the BHPS,conducted in 1999, two additional household samples were recruited inWales and Scotland. Partial coverage was only achieved at 63 per cent ofthe selected sample, which represents an 11-percentage point declinecompared with the rates achieved in 1991. Similarly, in 2000 the GSOEPadded a major new refresher sample. As with the BHPS, achieved responserates were much lower than those reported for the original sample surveyedin 1984. Interviews were obtained at only 51 per cent of their new householdssampled in 2000, compared with 63 per cent in 1984.6
The person-level outcomes are provided in table 3. Within the 7682households interviewed, there were 19,917 people, resulting in an averageof 2.6 persons per household.7 Of this group, 4790 were under 15 years ofage on the preceding 30 June and hence were ineligible for an interview inwave 1. This left 15,127 persons eligible for a personal interview, 13,969 ofwho completed the Person Questionnaire. Additionally, of this group, 13,159(94%) completed and returned the Self-Completion Questionnaire (though103 of these could not be successfully matched to a Person Questionnaire).
Table 3 Wave 1 Person Outcomes
Sample Outcome Number Per Cent
Enumerated persons 19917less ineligible children (under 15) -4790
Eligible adults =15127 100.0
Refusals to interviewer 597 3.9Refusals to fieldwork company (via 1800 number or email) 31 0.2Non-response with contact 218 1.4Non-contact 312 2.1Responding individuals 13969 92.3
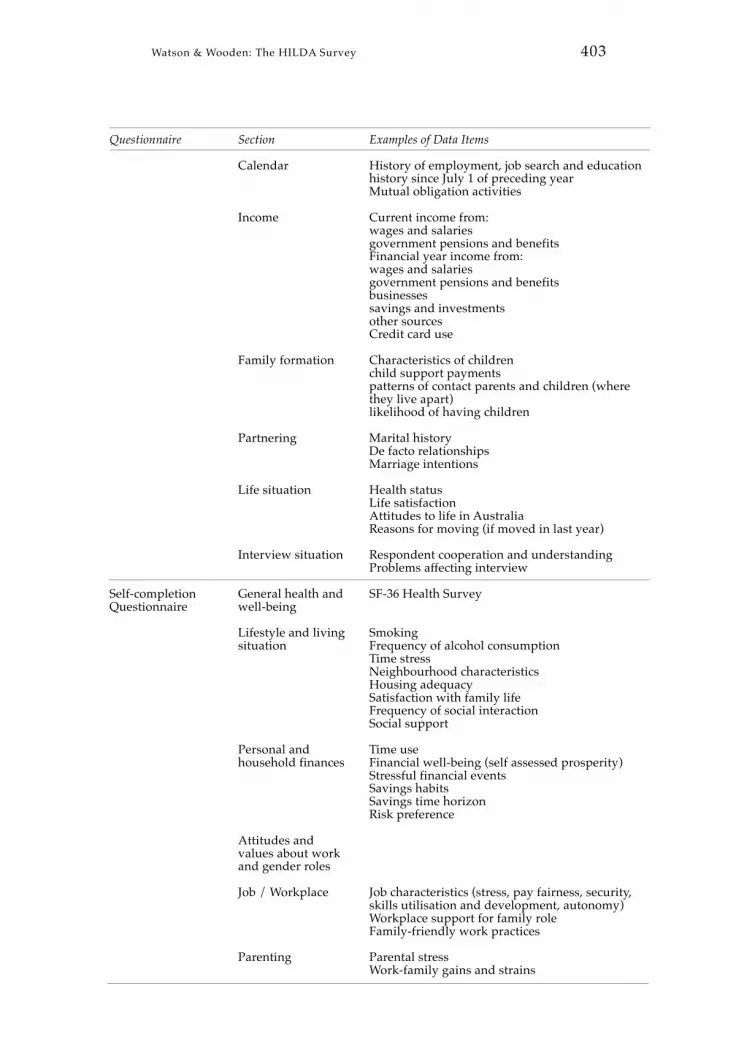
Sample CharacteristicsNon-response is only a problem if the respondents differ systematicallyfrom the non-respondents. It is thus important to establish in what waysthe responding sample differs from the population. We can assess this byfirst comparing the responding sample with the selected sample. This ispossible since all selected dwellings were fully enumerated prior tointerviews commencing. The range of information we have about the fullsample, however, is extremely small, limited to just location, type ofdwelling structure, security features possessed by the dwelling, aninterviewer assessment of the external condition of the dwelling, and thevisibility of high-rise buildings in the immediate vicinity. A comparisonbetween the selected and responding samples on each of these five criteriais thus provided in table 4. Furthermore, as a guide to the quality of thesample selection and listing process we also provide, for two of these criteria,some comparative data from the 2001 Census, which was conducted justprior to commencement of wave 1 of the HILDA Survey. Note that6 Incomplete households were discarded in the GSOEP and so these response ratesrefer to the incidence of fully responding households.7 This is identical to the figure reported in the 1996 Census (ABS 1999).
Australian Journal of Labour Economics, September 2002408
Tab
le 4
Ch
arac
teri
stic
s of
Wav
e 1
HIL
DA
Su
rvey
Sam
ple
sa
Pro
b. o
f zer
oP
rob.
of z
ero
HIL
DA
HIL
DA
diffe
renc
e b/
wdi
ffere
nce
sele
cted
sesp
ondi
ngse
lect
ed &
2001
b/w
Cen
sus
sam
ple
sam
ple
resp
ondi
ngC
ensu
s&
sel
ecte
d(d
wel
lings
)(h
ouse
hold
s)sa
mpl
es(d
wel
lings
)sa
mpl
e
Are
a of
usu
al r
esid
ence
Syd
ney
21.0
16.9
<0.
0120
.3ns
Res
t of N
SW13
.414
.6<
0.05
12.8
nsM
elbo
urn
e17
.616
.7ns
17.6
nsR
est o
f Vic
tori
a6.
77.
5<
0.05
6.9
nsB
risb
ane
8.8
8.8
ns8.
5ns
Res
t of Q
uee
nsla
nd10
.411
.8ns
10.6
nsA
del
aid
e6.
16.
1ns
6.1
nsR
est o
f Sou
th A
ust
ralia
1.9
2.3
<0.
052.
2<
0.05
Per
th7.
37.
7ns
7.2
nsR
est o
f Wes
tern
Au
stra
lia2.
42.
8ns
2.6
nsTa
sman
ia2.
62.
8ns
2.6
nsN
orth
ern
Terr
itor
y0.
60.
5N
s0.
9ns
AC
T1.
41.
5ns
1.6
<0.
01D
wel
ling
stru
ctu
reb
Sep
arat
e ho
use
75.9
77.3
ns75
.3ns
Sem
i-d
etac
hed
9.7
10.0
ns8.
9ns
Flat
13.3
11.7
ns13
.1ns
Oth
er0.
90.
9ns
1.9
<0.
01C
ond
itio
n of
dw
ellin
gV
ery
good
/ex
celle
nt33
.733
.8ns
Goo
d35
.636
.2ns
Ave
rage
25.2
25.0
nsP
oor
4.9
4.6
nsV
ery
poo
r/al
mos
t der
elic
t0.
50.
4ns

Watson & Wooden: The HILDA Survey 409
Pro
b. o
f zer
oP
rob.
of z
ero
HIL
DA
HIL
DA
diffe
renc
e b/
wdi
ffere
nce
sele
cted
sesp
ondi
ngse
lect
ed &
2001
b/w
Cen
sus
sam
ple
sam
ple
resp
ondi
ngC
ensu
s&
sel
ecte
d(d
wel
lings
)(h
ouse
hold
s)sa
mpl
es(d
wel
lings
)sa
mpl
e
Secu
rity
feat
ure
s of
dw
ellin
gL
ocke
d g
ate
(w/
o in
terc
om)
3.3
2.8
nsL
ocke
d d
oor/
gate
(w i/
c)5.
64.
1<
0.05
Secu
rity
gu
ard
, doo
rman
, etc
.1.
31.
1ns
Bar
s on
win
dow
s4.
94.
9ns
Secu
rity
doo
r37
.037
.4ns
No
tres
pas
sing
sig
n0.
50.
5ns
Bew
are
of d
og s
ign
2.2
2.2
nsE
vid
ence
of a
dan
gero
us
dog
2.5
2.3
nsN
o ju
nk m
ail s
ign
3.5
3.3
nsN
eigh
bou
rhoo
d w
atch
sig
n3.
73.
6ns
Hig
h-ri
se b
uild
ings
in a
rea
A lo
t – m
ore
than
50%
1.7
1.0
nsA
fair
bit
– 2
0-50
%1.
00.
8ns
One
or
two
2.4
2.1
nsN
one
at a
ll94
.996
.1ns
Not
es:
aT
he r
aw d
ata
from
the
HIL
DA
Su
rvey
hav
e be
en a
dju
sted
to a
ccou
nt fo
r th
e va
riab
ility
in th
e p
roba
bilit
y of
sel
ecti
on a
cros
s C
ensu
s C
olle
ctio
n D
istr
icts
.b
Exc
lud
es a
sm
all p
rop
orti
on o
f cas
es w
here
dw
ellin
g st
ruct
ure
typ
e no
t abl
e to
be
clas
sifi
ed.
nsD
enot
es d
iffe
renc
e no
t sig
nifi
cant
ly d
iffe
rent
at t
he 9
5 p
er c
ent c
onfi
den
ce le
vel.

Australian Journal of Labour Economics, September 2002410
comparisons between the selected and responding samples are not strictlyvalid given the former relates to dwellings whereas the latter relates tohouseholds. For most purposes, however, this distinction can be safelyignored, with dwellings with more than one household representing lessthan three per cent of our sample of in-scope dwellings with respondents.
Table 4 indicates that non-response is not random. Most obviously, there isa marked difference in the geographic distribution of the responding samplecompared with the selected sample, with residents in Sydney under-responding compared with residents elsewhere in Australia. This is notparticularly surprising, and is a common feature of other voluntary surveysin Australia (Bednall, Cavenett and Shaw 2000). The usual explanationprovided is that people in Sydney are under more time pressures and henceare far more reluctant to spend part of their time participating in surveys.In addition, we also suspect that part of the explanation lies in greaterdifficulties making contact with the occupants of selected dwellings inSydney because of a relatively high incidence of dwellings with locked gates,gatekeepers and other devices intended to screen access. Table 4 providessome support for this hypothesis, with response rates significantly lowerin dwellings with locked gates, especially those with intercom access.
With respect to the other dwelling characteristics considered – dwellingstructure, condition of dwelling and the visibility of high-rise buildings –differences are small and statistically insignificant. The main conclusionwe draw from table 4 is that analyses using the HILDA Survey data willneed to take into account the under-representation of households in Sydney.
As a check on the quality of the selection process we also report in table 4figures from the 2001 Census on the distribution of private dwellings by bothlocation and structure type. As can be seen, the selected sample for the HILDASurvey appears to conform closely to the Census data and thus suggests that,as was intended, the initial sample was not biased in any significant way.
What about the characteristics of the individual members of our respondingsample? Obviously we cannot know what the characteristics of the membersof non-responding households are. Any assessment of therepresentativeness of the sample of individual household members willthus have to be based on a comparison with some benchmark sample. Themost obvious choice here is the Monthly Population Survey (MPS),conducted by the ABS. The sample for the MPS is large (with the sampleddwellings covering about 0.5 per cent of the Australian population), thescope of coverage is broad, and response rates are acknowledged to be high.
In table 5, therefore, we compare the distribution of selected characteristicsof the sample of individual respondents to wave 1 of the HILDA Surveywith those from a comparable month of the MPS – typically October 2001.8
Before proceeding, it should be noted that the comparisons are notcompletely straightforward. Most importantly, the coverage of the MPS isbroader than that of the HILDA Survey and includes persons living in bothinstitutions and in remote areas.8 Fifty per cent of all of the personal (PQ) interviews in wave 1 were completed byearly October 2001.

Watson & Wooden: The HILDA Survey 411
Table 5 Selected Wave 1 Individual Sample Characteristics andPopulation Estimates from the ABS Monthly Population SurveyCompared (persons aged 15 years or over)
HILDA: AllHILDA PQ Household
MPSa Respondentsb Membersb
Area of usual residenceSydney 21.5 16.9 ** 18.0 **Rest of NSW 12.2 14.5 ** 14.1 **Melbourne 18.4 17.3 * 17.5Rest of Victoria 6.7 7.5 7.3Brisbane 8.6 8.8 8.8Rest of Queensland 10.0 11.5 * 11.4Adelaide 5.8 6.1 5.8Rest of South Australia 2.0 2.4 * 2.3Perth 7.3 7.5 7.4Rest of Western Australia 2.5 2.8 2.7Tasmania 2.4 2.8 2.7Northern Territory 0.9 0.5 ** 0.5 **ACT 1.6 1.6 1.6
SexMale 49.3 47.4 ** 48.6 *Female 50.7 52.6 ** 51.4 *
Age (years) at 30 June 200115-19 8.8 8.7 9.4 *20-24 8.9 7.4 ** 7.8 **25-34 18.7 18.7 18.735-44 19.0 21.7 ** 21.4 **45-54 17.1 17.1 17.155-64 11.8 12.0 1.765 or over 15.6 14.4 * 13.9 **
Marital statusMarried (including de facto) 58.7 63.4 ** 62.7 **Not married 41.3 36.6 ** 37.3 **
Indigenous statusIndigenous 1.7 1.8Non-indigenous 98.3 98.2
BirthplaceBorn in Australia 72.4 74.4 **Born outside Australia
Main English-speaking country 10.2 10.9Other country 17.5 14.7 **Labour force statusc
EmployedFull-time 42.1 41.7Part-time 17.4 19.5 **Unemployed 4.3 4.4Not in the labour force 36.3 34.5 **
Employment status in main job(employed persons only)
Employee 86.0 87.0Employer 3.6 43.9Own account worker 10.0 8.4 **Contributing family worker 0.4 0.8 **
Notes: ** and * denotes significantly different from the MPS estimate at the 99 percent and 95 per cent confidence levels respectively. Standard errors have beenadjusted to take account of both the stratified and clustered nature of the designemployed in the HILDA Survey.

Australian Journal of Labour Economics, September 2002412
Table 5 Selected Wave 1 Individual Sample Characteristics andPopulation Estimates from the ABS Monthly Population SurveyCompared (persons aged 15 years or over) - Continued
a With the exception of indigenous status and employment status, the MPSestimates come from the October 2001 survey. In the case of the two exceptions,data for August 2001 are used. With the exception of country of birth, thepopulation that these estimates apply to is all civilians aged 15 years and over.The figures for country of birth exclude persons living in an institution.
b The HILDA estimates are also for people aged 15 years and over, but includedefence force personnel and exclude people living in remote areas of Australiaand those living in special dwellings. The HILDA estimates have also beenadjusted to account for variability in the probability of selection across CDs.
c We vary from the usual ABS definition in defining full-time work solely on thebasis of usual hours worked (rather than on a combination of usual hours andactual hours worked).
Source: ABS data are from The Labour Force, Australia (cat. no. 6203.0), August 2001and October 2001 issues.
Table 5 indicates that the HILDA sample is noticeably different from thebroader population in a number of ways. First, and as expected given thedistribution of responding households, Sydney residents are under-represented in the HILDA individual sample. The first column in table 5indicates that according to the MPS for October 2001, persons living inSydney comprised 21.5 per cent of the Australian population aged 15 yearsand over. In contrast, Sydney residents make up only 17 per cent of thesample of persons completing a Person Questionnaire (PQ). Note that almost24 per cent of the lower response rate in Sydney is due to a relatively highincidence of non-response within households. This can be seen bycomparing column 2 with column 3. Sydney residents actually comprise18 per cent of all HILDA sample members (as determined from theHousehold Form), which is more than a full percentage point higher thanthe proportion that completed a PQ.
Second, the HILDA sample has an under-representation of men and an over-representation of women, which is not uncommon in voluntary surveys. Alarge proportion of this differential (just over half), however, is explainedby male household members not participating in the PQ interview.
Third, married persons are over-represented (and unmarried persons under-represented). In part, this was to be expected given the population forHILDA excludes persons living in institutions. It was also expected that itwould be more difficult to make contact with persons living alone.Nevertheless, the size of the differential is much larger than expected(though possibly might reflect differences in the way de facto partnershipsare defined and treated in the HILDA Survey compared with the MPS).
Fourth, immigrants from a non-English-speaking background compriseonly 14.5 per cent of the HILDA sample, which compares with a populationestimate of 17.5 per cent. We suspect this difference reflects both the greaterdifficulties communicating with persons for whom English was not theirfirst language and the greater suspicion of government-backed surveysamong this sub-population.

Watson & Wooden: The HILDA Survey 413
Of the other characteristics considered, the differences are small and ofteninsignificant. The age composition of the HILDA individual sample, forexample, is quite close to the MPS, even though the HILDA sample excludespersons living in institutions which will tend to mean a lesser representationof older people. The breakdown by labour force status is also similar, thoughpersons working part-time are slightly over-represented while personsoutside the labour force status are under-represented. We suggest that thesedifferences might be explained by both the over-representation of marriedwomen and by the exclusion of persons living in institutions. Finally, whencomparing our sample of employed persons with that reported in theAugust 2001 MPS, we again find only small differences. Specifically, theredoes appear to be a slight under-representation of own account workers(that is, the self-employed) in the HILDA sample.
Overall, while there are clear sources of bias in the HILDA data, we do notbelieve that the size of these discrepancies is so large as to seriously discreditthe data. Further, the sources of bias which appear to of greatest importance– differences in rates of response across both sex and location – are relativelyeasily corrected through the application of population weights.
5. Possible Research UsesTo illustrate the many and varied research uses that could be made of theHILDA data, we only have to look to the overseas experience. For example,according to the PSID website, at the time of writing more than 2000 articleshad been published in academic journals and books using PSID data, withthe number rising exponentially over time. Similarly, the literature databaseavailable from the GSOEP website currently contains 2250 different entries.Moreover, and despite the diverse range of topics covered by these surveys,economic research overwhelmingly dominates this literature.
A guide to the range of topics that economists have examined using thePSID data is summarised in a review by Brown et al. (1996). In particular,they highlight how significant the PSID data have been in improvingunderstanding of:
(i) intertemporal models of labour supply;(ii) whether real wages are pro- or countercyclical;(iii) labour mobility;(iv) consumption dynamics;(v) extended-family behaviour;(vi) poverty, welfare and income dynamics;(vii) the intergenerational transmission of economic status; and(viii) the longer-run antecedents of events like marital breakdown,
unemployment and retirement.
Ultimately, it is impossible to do justice to the research potential of thesedata in the brief space allocated to it here – there are just too many issuesand topics that are being covered by the various HILDA Survey instruments.Nevertheless, we highlight below six topics that demonstrate the potentialpower of the HILDA data.

Australian Journal of Labour Economics, September 2002414
Income Support and Welfare DependencyGiven the marked growth in the number of Australian families in receipt ofincome support, it should not be surprising to learn that one of the majorpurposes of the HILDA Survey is to help understand the impact of variationsin income support arrangements on Australians and their families. TheHILDA Survey is thus seeking detailed information about income receivedfrom government sources, including the type of benefit, the amount receivedand the length of time spent in receipt of those benefits. It will with time,therefore, become possible to use the HILDA data to analyse a range ofimportant policy-relevant questions and topics. Included here are:
(i) the risks and factors promoting welfare dependence;(ii) the long-run redistributive impact of the tax and transfer system;(iii) the impact of variations in income support arrangements on work
incentives; and(iv) the long-run consequences of welfare dependence for a range of
socio-economic outcomes.
The Changing Nature of WorkIt is widely accepted that labour markets in Australia have been undergoingenormous change in recent years, with key aspects of this change includingan increased diversity in both the nature of employment contracts and inreported working hours (Wooden 2002). There is, however, far less agreementabout what these changes mean for workers and their families. There is, forexample, considerable debate over the question of whether or not casualand part-time work experiences when young assist or hinder long-runemployment prospects. Unfortunately, most longitudinal data available inAustralia that might assist researchers analyse this question simply do nottrack people over sufficiently long periods of time. Gaston and Timcke (1999),for example, have attempted to analyse this question using data from theAustralian Youth Survey, but were only able to consider transitions over afour-year period. Relatedly, there is currently debate about the impact ofnew working arrangements on working hours and job security, and in turn,how changes in these factors affect job satisfaction, productivity and qualityof life (c.f., Allan et al. 1999 with Borland 2001 or Wooden 2001b). These areall issues that the HILDA data should be well placed to help us analyse.
Family and Household DynamicsAnother area of research where the HILDA Survey will provide a largeamount of information is family and household dynamics. Ermisch (2000),for example, has illustrated how panel data from the BHPS can be used tomodel the processes of family and household change, such as maritalseparation and divorce, cohabitation, and parental home leaving. Moreimportantly, with each successive wave of data, the potential to analysethe consequences of such change (especially in terms of the impact onincome) grows. Relatedly, the HILDA Survey stands apart from otherhousehold panels in the amount of information it is collecting aboutchildren, and especially the decision to have children, care arrangements

Watson & Wooden: The HILDA Survey 415
and contact with children. Such data, therefore, should facilitate analysesof topics such as the interrelationship between the timing of children andlabour force participation, and the impact of child care availability and costson labour supply decisions.
Quality of LifeWhile the concept of utility maximisation is central to most economic modelsof human behaviour, economists have traditionally been reluctant to useself-reported measures of utility. This, however, appears to have changedin recent years, partly as a consequence of the inclusion of quality of lifemeasures in household panels. Gerlach and Stephan (1996), Winkelmanand Winkelman (1998) and Clark, Georgellis and Sanfey (2001), for example,have all used the GSOEP data (which has included a self-reported lifesatisfaction measure in each of its waves) to confirm that unemployment isassociated with significantly lower levels of satisfaction with life in thefuture. Clark et al. (2001) go further and show that the effect persists, evenafter return to work. Further, they report evidence of habituation, with theeffect of unemployment attenuated for those who have experienced moreunemployment in the past.
Of course, with long-running panels there is considerable scope to examinethe long-term impacts on life satisfaction and other quality of life measuresof many other life events. Included here, for example, would be changes inhousehold composition (e.g., as a result of child birth, divorce and deathsin the family), moving house, changing jobs, retirement and major changesin health status. These are all issues that could potentially be examinedwith the life satisfaction measure that is provided in the HILDA data.Further, the HILDA data will allow researchers to examine relationshipsbetween economic variables and measures of other aspects of quality life,such as physical and mental health, and social participation.
Neighbourhood EffectsThere is growing interest, both in Australia and overseas, in the linksbetween communities and socio-economic outcomes. Empirical research,especially in Australia, however, is very limited, and is almost exclusivelyfocused on the spatial distribution of incomes and job opportunities (e.g.,Gregory and Hunter, 1995). The HILDA Survey will lend itself to furtherresearch in this area, especially given the clustered nature of the sample.While geographic identifiers at the CD and postcode level are not includedas part of the public data release, a number of derived variables providingsummary measures of CD characteristics, based on Census data, will bemade available.
WealthPoverty measurement in this country is almost entirely based on incomemeasures. This is potentially problematic and ideally assessments of povertyand living standards should incorporate information about a household’swealth holdings. Australia, however, does not even have a good cross-

Australian Journal of Labour Economics, September 2002416
section database that provides measures of wealth, let alone a panel. Wave2 of the HILDA Survey, with its detailed modules on assets and debts, shouldtherefore fill this data gap. Moreover, it is anticipated that wealth will berevisited some years later thus permitting analyses of wealth mobility.9
6. Want to Know More?Persons who are interested in knowing more about the HILDA Surveyshould log on to the HILDA web site at:
http://www.melbourneinstitute.com/hilda/
At this web site you can download copies of all survey instruments,download copies of discussion and technical papers, monitor thedevelopment and progress of the survey, and find out how you can obtainthe data collected during wave 1.
ReferencesAllan , C., O’Donnell, M. and Peetz, D. (1999), ‘More Tasks, Less Secure,
Working Harder: Three Dimensions of Labour Utilisation’, Journalof Industrial Relations, 41, 519-535.
Australian Bureau of Statistics [ABS] (1999), Household and Family Projections,Australia, 1996 to 2021 (ABS cat. no. 3236.0), ABS, Canberra.
Barr, N. (1999), ‘Fundamentals of Social Security Analysis’, Australian SocialPolicy, 1, 7-29.
Bednall, D., Cavenett, P. and Shaw, M. (2000), ‘Response Rates in AustralianMarket Research’, Paper presented at the Market Research Societyof Society Annual Conference, Sydney, October.
Borland, J. (2001), ‘Job Stability and Job Security’, in J. Borland, R. Gregoryand P. Sheehan (eds), Work Rich, Work Poor: Inequality and EconomicChange in Australia, Centre for Strategic Economic Studies, VictoriaUniversity, Melbourne.
Brown, C., Duncan, G.J. and Stafford, F.P. (1996), ‘Data Watch: The PanelStudy of Income Dynamics’, Journal of Economic Perspectives, 10, 155-168.
Clark, A., Georgellis, Y. and Sanfey, P. (2001), ‘Scarring: The PsychologicalImpact of Past Unemployment’, Economica, 68, 221-241.
Creedy, J. (1994), ‘The Statics and Dynamics of Income Distribution: AnIntroductory Survey’, Australian Economic Review, 108, 51-71.
Duncan, G.J. and Hill, D.H. (1989), ‘Assessing the Quality of HouseholdPanel Data: The case of the Panel Study of Income Dynamics’, Journalof Business and Economic Statistics, 7, 441-452.
Ermisch, J. (2000), ‘Using Panel Data to Analyse Household and FamilyDynamics’, in D. Rose (ed.), Researching Social and Economic Change:The Uses of Household Panel Studies, Routledge, London.
Gaston, N. and Timcke, D. (1999), ‘Do Casual Workers Find Permanent Fulltime Employment?’, Economic Record, 75, 333-347.
9 For an example of such an analysis using the PSID data, see Hurst, Luoh and Stafford(1998).

Perry & Wilson: The Accord and Strikes 417
Gerlach, K. and Stephan, G. (1996), ‘A Paper on Unhappiness andUnemployment in Germany’, Economics Letters, 52, 325-330.
Gregory, R.G. and Hunter, B. (1995), ‘The Macro Economy and the Growthof Ghettos and Urban Poverty in Australia’, Centre for Economic PolicyResearch Discussion Paper No. 325, Australian National University,Canberra.
Haisken-DeNew, J. (2001), ‘A Hitchhiker’s Guide to the World’s HouseholdPanel Data Sets’, Australian Economic Review, 34, 356-366.
Hurst, E., Luoh, M.C. and Stafford, F.P. (1998), ‘Wealth Dynamics ofAmerican Families, 1984 94’, Brookings Papers on Economic Activity,267-329.
Norris, K. and Wooden, M. [eds] (1996), The Changing Australian LabourMarket (EPAC Commission Paper No. 11), AGPS, Canberra.
Richardson, S. (1978), ‘Income Distribution, Poverty and RedistributionPolicies’, in F.H. Gruen (ed.), Surveys of Australian Economics, Vol. II,George Allen and Unwin, Sydney.
Rose, D. (2000), ‘Household Panel Studies: An Overview’, in D. Rose (ed.),Researching Social and Economic Change: The Use of Household PanelStudies, Routledge, London.
Winkelman, L. and Winkelman, R. (1998), ‘Why are the Unemployed soUnhappy? Evidence from Panel Data’, Economica, 65, 1-15.
Wooden, M. (2001a), ‘Design and Management of a Household PanelSurvey: Lessons from the International Experience’, HILDADiscussion Paper No. 2/01, Melbourne Institute of Applied Economicand Social Research, University of Melbourne.
Wooden, M. (2001b), ‘Are Non-standard Jobs Sub-standard Jobs’, AustralianSocial Monitor, 3, 65-70.
Wooden, M. (2002), ‘The Changing Labour Market and its Impact on Workand Employment Relations’, in R. Callus and R.D. Lansbury (eds),The Changing Nature of Work and Employment Relations in Australia,Federation Press, Sydney.