Embed Size (px)
Citation preview

The Identification of Novel Potential InjuryMechanisms and Candidate Biomarkers inRenal Allograft Rejection by QuantitativeProteomics*□S
Tara K. Sigdel‡, Nathan Salomonis‡, Carrie D. Nicora§, Soyoung Ryu¶, Jintang He§,Van Dinh‡, Daniel J. Orton§, Ronald J. Moore§, Szu-Chuan Hsieh‡, Hong Dai‡,Minh Thien-Vu‡, Wenzhong Xiao¶, Richard D. Smith§, Wei-Jun Qian§,David G. Camp 2nd§, and Minnie M. Sarwal‡�
Early transplant dysfunction and failure because of immu-nological and nonimmunological factors still presents asignificant clinical problem for transplant recipients. Acritical unmet need is the noninvasive detection and pre-diction of immune injury such that acute injury can bereversed by proactive immunosuppression titration. Inthis study, we used iTRAQ -based proteomic discoveryand targeted ELISA validation to discover and validatecandidate urine protein biomarkers from 262 renal al-lograft recipients with biopsy-confirmed allograft injury.Urine samples were randomly split into a training set of108 patients and an independent validation set of 154patients, which comprised the clinical biopsy-confirmedphenotypes of acute rejection (AR) (n � 74), stable graft(STA) (n � 74), chronic allograft injury (CAI) (n � 58), BKvirus nephritis (BKVN) (n � 38), nephrotic syndrome (NS)(n � 8), and healthy, normal control (HC) (n � 10). A totalof 389 proteins were measured that displayed differentialabundances across urine specimens of the injury types(p < 0.05) with a significant finding that SUMO2 (smallubiquitin-related modifier 2) was identified as a “hub”protein for graft injury irrespective of causation. Sixty-nine urine proteins had differences in abundance (p <0.01) in AR compared with stable graft, of which 12 pro-teins were up-regulated in AR with a mean fold increase of
2.8. Nine urine proteins were highly specific for AR be-cause of their significant differences (p < 0.01; fold in-crease >1.5) from all other transplant categories (HLAclass II protein HLA-DRB1, KRT14, HIST1H4B, FGG,ACTB, FGB, FGA, KRT7, DPP4). Increased levels of threeof these proteins, fibrinogen beta (FGB; p � 0.04), fibrin-ogen gamma (FGG; p � 0.03), and HLA DRB1 (p � 0.003)were validated by ELISA in AR using an independent sam-ple set. The fibrinogen proteins further segregated ARfrom BK virus nephritis (FGB p � 0.03, FGG p � 0.02), afinding that supports the utility of monitoring these urinaryproteins for the specific and sensitive noninvasive diag-nosis of acute renal allograft rejection. Molecular & Cel-lular Proteomics 13: 10.1074/mcp.M113.030577, 621–631,2014.
Although improvements in immunosuppressive drugs, or-gan procurement, and surgical methods have advanced,there remains the inability to noninvasively diagnose and pre-dict acute allograft rejection in solid organ transplantation inthe clinical setting (1, 2). Currently available strategies formonitoring transplanted organs are both inefficient and lack-ing in accuracy to assess the risks of drug toxicity, and acuteor chronic rejection (3, 4). Rapid advances in genomics andtranscriptomics technologies have facilitated their applicationtoward the understanding of graft injury mechanisms andmore recently, the evaluation of gene polymorphisms and thevalidation of blood-based gene-panels that can diagnose andpredict allograft rejection (5–12). Proteomic measurements ofurine, a noninvasive biofluid suitable for monitoring renaltransplant recipients, have revealed promising candidateurine protein biomarkers that are highly correlative of the graftmilieu with the added benefit that the identified proteins maydirectly reflect the underlying biology (13–17).
In this report, we have analyzed a highly annotated cohortof clinical samples from a large database of pediatric andyoung adult renal transplant recipients. Applying an unbiased
From the ‡California Pacific Medical Center Research Institute, 475Brannan St., Ste 220, San Francisco, California 9410; §BiologicalSciences Division, Pacific Northwest National Laboratory, Richland,Washington 99352; ¶Department of Biochemistry, 251 Campus Dr,Stanford University, Stanford, California 94305
Received May16, 2013, and in revised form, November 14, 2013Published, MCP Papers in Press, December 12, 2013, DOI
10.1074/mcp.M113.030577Author contributions: T.K.S., C.D.N., V.D., W.X., R.D.S., W.Q.,
D.G.C., and M.M.S. designed research; T.K.S., N.S., C.D.N., S.R.,J.H., V.D., D.J.O., R.J.M., S.H., H.D., W.X., W.Q., D.G.C., and M.M.S.performed research; T.K.S., N.S., C.D.N., S.R., J.H., D.J.O., R.J.M.,S.H., H.D., M.T., W.X., W.Q., D.G.C., and M.M.S. analyzed data;T.K.S., N.S., S.R., J.H., M.T., W.X., W.Q., D.G.C., and M.M.S. wrotethe paper; R.D.S. provided overall supervision to the research.
Research© 2014 by The American Society for Biochemistry and Molecular Biology, Inc.This paper is available on line at http://www.mcponline.org
Molecular & Cellular Proteomics 13.2 621
high-throughput proteomic approach, we identified candidateurine protein biomarkers for biopsy-confirmed acute rejectionand then performed orthogonal, targeted validation by ELISAto select the most informative urinary proteins that wouldclearly define acute allograft rejection from all other confound-ing transplant phenotypes. Customized bioinformatics analy-sis of these datasets provided the additional benefit of reveal-ing a common molecular network responsible for drivingkidney transplant injury. The overall study is summarized inFig 1.
MATERIALS AND METHODS
Study Population and Samples—A total of 262 urine samples wereanalyzed in this study: acute rejection (AR) (n � 74), stable graft (STA)(n � 74), chronic allograft injury (CAI) (n � 58 total samples; 48samples had chronic allograft nephropathy based on the Banff criteria(18); 10 had evidence of chronic allograft injury because of calcineurininhibitor drug nephrotoxicity based on the CNIT score (19)); BK (n �38), patients with nonspecific proteinuria from native renal diseasebecause of nephrotic syndrome (NS; to control for nonspecific renal
injury) (n � 8), and healthy normal control (HC) (n � 10). All sampleswere selected from a large and highly annotated urine sample bio-bank collected from pediatric and young adult recipients of kidneytransplants in years 2000 to 2009 at Lucile Packard Children’s Hos-pital at Stanford University. The biorepository consisted of �2000banked urine samples of which 770 were biopsy matched and col-lected before any treatment intensification for clinical graft dysfunc-tion. From this subset of 770 patients, demographically matchedclinical categories of different categories of stable graft function andallograft injury were selected for a total of 244 urine samples. Thecause of ESRD is shown in Table I. Only first transplants from low riskpatients with peak PRA �20% were included. Eight patients were onperitoneal or hemodialysis with little or no residual renal function beforetransplant and the majority of patients (n � 236) had received pre-emptive transplantation and had residual renal function with an eGFR(Schwartz) of �15–20 ml/min/1.73 m2. Eighteen additional sampleswere included for analysis from age-matched healthy controls (n � 10)and patients with nephrotic syndrome (n � 8). A summary of the patientdemography selected for this study is presented in Table I. Urine sam-ples were randomly split into (1) a training set of 108 patients, and (2) anindependent validation set of 154 patients.
We balanced the study subjects in terms of their being either onsteroid-based treatment or steroid-free treatment following transplan-tation. “Allograft injury” in this study was defined as a � 20% increasein serum creatinine from its previous steady-state baseline value andan associated biopsy that was pathological. The histological diagno-ses spectra for the “allograft injury” cases (n � 170) were either acuterejection (n � 74), chronic injury (n � 58), or BK nephritis (n � 38).There were 74 samples collected at the time of stable graft functionand normal histology on the paired biopsy and were called “stable.”All biopsies were blindly, semiquantitatively scored by a single pa-
1 The abbreviations used are: AR, acute rejection; CAI, chronicallograft injury; BKVN, BK virus nephritis; NS, nephrotic syndrome;HC, healthy normal control; SUMO2, small ubiquitin-related modifier2; FGB, fibrinogen beta; FGG, fibrinogen gamma; eGFR, estimatedglomerular filtration rate; ESRD, end-stage renal disease; ESI, elec-trospray ionization; HCD, high-energy collisional dissociation; ROC,Receiver Operating Characteristic.
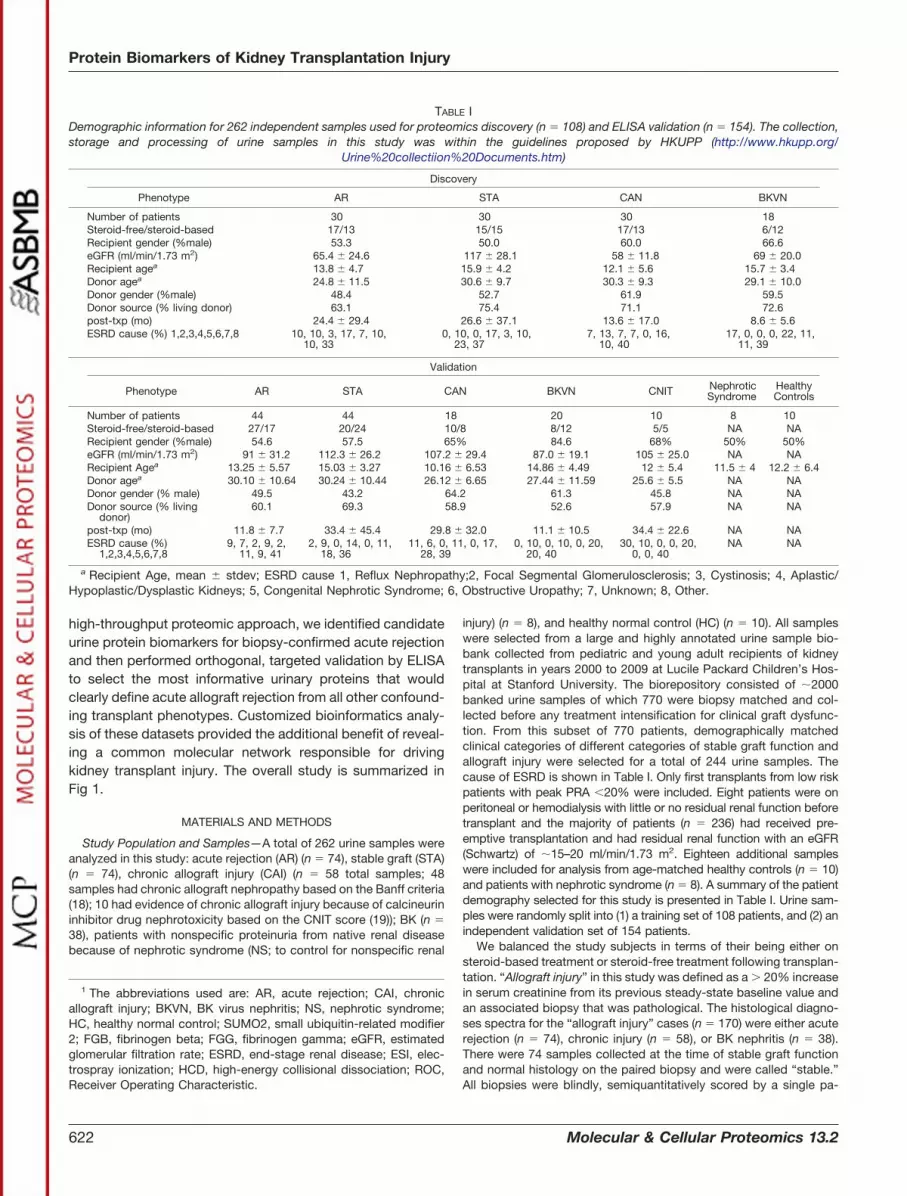
TABLE IDemographic information for 262 independent samples used for proteomics discovery (n � 108) and ELISA validation (n � 154). The collection,storage and processing of urine samples in this study was within the guidelines proposed by HKUPP (http://www.hkupp.org/
Urine%20collectiion%20Documents.htm)
Discovery
Phenotype AR STA CAN BKVN
Number of patients 30 30 30 18Steroid-free/steroid-based 17/13 15/15 17/13 6/12Recipient gender (%male) 53.3 50.0 60.0 66.6eGFR (ml/min/1.73 m2) 65.4 � 24.6 117 � 28.1 58 � 11.8 69 � 20.0Recipient agea 13.8 � 4.7 15.9 � 4.2 12.1 � 5.6 15.7 � 3.4Donor agea 24.8 � 11.5 30.6 � 9.7 30.3 � 9.3 29.1 � 10.0Donor gender (%male) 48.4 52.7 61.9 59.5Donor source (% living donor) 63.1 75.4 71.1 72.6post-txp (mo) 24.4 � 29.4 26.6 � 37.1 13.6 � 17.0 8.6 � 5.6ESRD cause (%) 1,2,3,4,5,6,7,8 10, 10, 3, 17, 7, 10,
10, 330, 10, 0, 17, 3, 10,
23, 377, 13, 7, 7, 0, 16,
10, 4017, 0, 0, 0, 22, 11,
11, 39
Validation
Phenotype AR STA CAN BKVN CNIT NephroticSyndrome
HealthyControls
Number of patients 44 44 18 20 10 8 10Steroid-free/steroid-based 27/17 20/24 10/8 8/12 5/5 NA NARecipient gender (%male) 54.6 57.5 65% 84.6 68% 50% 50%eGFR (ml/min/1.73 m2) 91 � 31.2 112.3 � 26.2 107.2 � 29.4 87.0 � 19.1 105 � 25.0 NA NARecipient Agea 13.25 � 5.57 15.03 � 3.27 10.16 � 6.53 14.86 � 4.49 12 � 5.4 11.5 � 4 12.2 � 6.4Donor agea 30.10 � 10.64 30.24 � 10.44 26.12 � 6.65 27.44 � 11.59 25.6 � 5.5 NA NADonor gender (% male) 49.5 43.2 64.2 61.3 45.8 NA NADonor source (% living
donor)60.1 69.3 58.9 52.6 57.9 NA NA
post-txp (mo) 11.8 � 7.7 33.4 � 45.4 29.8 � 32.0 11.1 � 10.5 34.4 � 22.6 NA NAESRD cause (%)
1,2,3,4,5,6,7,89, 7, 2, 9, 2,
11, 9, 412, 9, 0, 14, 0, 11,
18, 3611, 6, 0, 11, 0, 17,
28, 390, 10, 0, 10, 0, 20,
20, 4030, 10, 0, 0, 20,
0, 0, 40NA NA
a Recipient Age, mean � stdev; ESRD cause 1, Reflux Nephropathy;2, Focal Segmental Glomerulosclerosis; 3, Cystinosis; 4, Aplastic/Hypoplastic/Dysplastic Kidneys; 5, Congenital Nephrotic Syndrome; 6, Obstructive Uropathy; 7, Unknown; 8, Other.
Protein Biomarkers of Kidney Transplantation Injury
622 Molecular & Cellular Proteomics 13.2
thologist using the most recent Banff criteria for both acute andchronic injury (18, 20–22). AR was defined at minimum, as per BanffSchema, a tubulitis score �1 accompanied with an interstitial inflam-mation score �1. Patients had varying grades of AR: Banff 1A, Banff1B, Banff 2A, and Banff 2B; 2 patients had humoral AR as evidencedby C4d positivity in the allograft. Chronic allograft injury (CAI) wasdefined as patients with poor allograft function (see eGFR in Table I)(23) and on biopsy with a tubular atrophy score �1 accompanied byan interstitial fibrosis score �1 (18). BK nephritis (BKVN) was definedas acute (�20% increase in serum creatinine) or chronic graft dys-function with demonstration of a positive blood BK viral load, graftinflammation and a positive immunohistochemical stain for the poly-oma virus. Normal (STA) allografts were defined as patients withstable serum creatinine and on absence of significant injury on pro-tocol biopsy. Given the very low incidence of acute tubular necrosis inour transplant program because of a bias toward living donation anda selection of deceased donors with low cold ischemia times, thecategory of acute tubular necrosis as a transplant injury subtype wasnot included for analysis because of low sample numbers. The pa-tients included in this study were all on maintenance immunosuppres-sion with tacrolimus, mycophenolate mofetil, and either on mainte-nance steroids or on a steroid avoidance protocol (24). The study wasapproved by the Ethics Committee of Stanford University MedicalSchool and California Pacific Medical Center Research Institute(CPMCRI), and all patients/guardians provided informed consent toparticipate in the research, in full adherence to the Declaration ofHelsinki. This study was approved by the Institutional Review Boardfor Human Subjects Research at Pacific Northwest National Labora-tory in accordance with federal regulations.
Urine Collection, Initial Processing and Storage—We followed thestandards recommended by the Human Kidney and Urine ProteomeProject (HKUPP) when collecting and processing samples from thekidney transplant clinic. Briefly, second morning, void mid-streamurine samples (50–100 ml) were collected in sterile containers, cen-trifuged at 2000 � g for 20 min at room temperature within 1 h ofcollection, and the supernatant was separated from any pelletedparticulate matter that included cells and cell debris. The pH of thesupernatant was adjusted to 7.0 and stored at �80 °C until furtheranalysis. In our previous report we established protocols allowing forstable urine collection from multicenter clinical studies (25), in whichdelays in storage and processing may occur. In our protocols, wedetermined that urine samples can be safely stored up to 1 h at roomtemperature and up to 12 h at 4 °C without significant protein deg-radation. Samples do not require the addition of protease inhibitors tomaintain sample integrity, if stored at 4 °C or �80 °C within 72 h ofcollection. Centrifugal filtration is our optimal processing method ofchoice. Urine protein was quantified using the Bradford assay. Mea-sured total protein concentrations in the urine of acute rejection,stable graft, chronic allograft injury, BK virus nephropathy, nephroticsyndrome, and healthy normal control were 1.8 � 2.3, 2.4 � 1.9,2.6 � 2.7, 1.2 � 0.6, 15.9 � 18.7, and 1.8 � 1.7 mg/ml, respectively.To minimize impact of freeze thaw cycles, we aliquoted urine samplesinto 10 ml aliquots (5–10 tubes per sample) before freezing at �80 °C,to facilitate multiple assays without any freeze thaw cycles of theprocessed urine. Our assay uses a starting volume of 10 ml of urine soeach aliquot only needs to be thawed once for each experiment.
Recovery, Quantification and Trypsin Digestion of Urinary Protein—Using a urine sample processing method that we developed, urinaryproteins were isolated by filtering the supernatant through AmiconUltra centrifugal filtration tubes (10K molecular weight cutoff, Milli-pore, Bedford, MA) to separate small MW peptides and other pig-ments (�10 kDa) from the larger proteins. The device was initiallywashed with 10 ml of 50 mM NH4HCO3 (pH 8.0) and discarded. Thena 10 ml aliquot of urine was loaded into the device and centrifuged for
20 min at 3000 � g at 10 °C, the filtrate was recovered, and saved fora peptidomics analysis, and the retentate was used for proteomicsstudies. The final volume of the retentate was adjusted to 400 �l with50 mM NH4HCO3 (pH 8.0). For iTRAQ-based quantitative analysis, thesamples consisted of six unique pools for each phenotype with eachpooled sample generated from: (1) 5 patients with acute rejection(AR); (2) 5 patients with chronic allograft nephropathy (CAN); (3) 3patients with the BK virus (BK); or (4) 5 patients who are stable graftfunction (STA). All the samples were assayed with bicinchoninic acid(BCA) (Thermo Scientific, Rockford, IL) to determine the protein con-centration. An equal mass of protein (200 �g) was collected from eachsample and brought to a total volume of 100 �l using 0.5 M triethyl-ammonium bicarbonate (TEAB) (all chemicals purchased from Sigma-Aldrich, St. Louis, MO, unless otherwise stated). Powdered urea wasadded to each tube to a final concentration of 8 M for protein dena-turation and 500 mM dithiothreitol (DTT) was added to a concentrationof 10 mM for reduction. The samples were briefly sonicated, andincubated at 37 °C for 1 h with constant shaking in a thermomixer(Eppendorf North America, Hauppauge, NY). Iodoacetamide wasadded to each sample to reach a concentration of 40 mM for alkylationand then incubated in the dark at 37 °C for 1 h with constant shaking.Samples were then diluted 10-fold using 0.5 M TEAB and digestedwith trypsin (50:1 protein/trypsin (w/w)) (Promega, Madison, WI) at37 °C for 3 h. To clean the peptide preparations for analysis, C-18solid phase extraction was performed using Supelco Discoverycolumns on a Gilson GX-274 ASPEC™ system (Gilson Inc., Middle-ton, WI). All samples were then concentrated in a speed-vac to 30�l and measured with the BCA assay to determine the peptideconcentration.
8-plex iTRAQ Labeling—The pH of each sample was measured andbrought to � pH 8 using 1 M TEAB. The sample concentrations weremeasured with the BCA assay and then vialed to contain 25 �g ofpeptides for each sample. Sample volumes were adjusted to 15 �ltotal volume either by adding 0.5 M TEAB or concentrated to 15 �l ina low-protein-binding 1.5 ml centrifuge tube. Each vial of 8-plexiTRAQ reagent (AB Sciex, Framingham, MA) was thawed and broughtto room temperature. The reagents were pulse spun to ensure thecontents were collected at the bottom of each tube and 60 of iso-proponal was added to each reagent vial. The reagent vials werethoroughly vortexed, briefly centrifuged, and added to the appropriatesample. Each reagent vial was rinsed with an additional 10 �l ofisopropanol and added to their respective samples.
The iTRAQ reagents with eight channels, ranging from 114 to 121,were used to label two AR, two BKV, two CAI, and two STA samples,respectively, for each eight-plex iTRAQ experiment. Three eight-plexexperiments were performed for the 24 pools from the four pheno-types. For each labeling reaction, the pH was above 7.8 and theorganic concentration was at least 60% (v/v). To mix the reagents,each sample was vortexed,d briefly centrifuged and incubated atroom temperature for 2 h. The labeling reactions were stopped by theaddition of 100 �l of nanopure water to hydrolyze any remainingiTRAQ reagent in each sample, and incubated for an additional 30min. The labeled samples were partially concentrated in a speed vacto remove the organic solvent and then pooled together to obtainthree samples with each containing all eight of the iTRAQ labels (twofrom the AR group (113, 114), two from the BK group (115, 116), twofrom the CAI group (117, 118) and two from the STA group (119, 121).The three mixed samples were concentrated to a volume of �100 �lin a speed vac.
High pH Reversed-phase C-18 Fractionation—Each of the threeeight-plex iTRAQ-labeled peptide samples were fractionated into 24-fractions by high pH reversed-phase chromatography (26). Followingdilution to a volume of 900 �l with 10 mM ammonium formate buffer(pH 10.0), each sample was resolved on a XBridge C18, 250 � 4.6
Protein Biomarkers of Kidney Transplantation Injury
Molecular & Cellular Proteomics 13.2 623

mm, 5-�m particle size, with 4.6 � 20 mm guard column (Waters,Milford, MA). Separations were performed at 0.5 ml/min using anAgilent 1100 series HPLC system (Agilent Technologies, Santa Clara,CA) with mobile phases (A) 10 mM Ammonium Formate, pH 10.0, and(B) 10 mM Ammonium Formate, pH 10.0/acetonitrile (10:90). Thegradient was changed from at 100% A to 95% A over the first 10 min,95% A to 65% A from 10 min to 70 min, 65% A to 30% A from 70 minto 85 min, maintained at 30% A from 85 min to 95 min, re-equilibratedwith 100% A from 95 min to 105 min, and held at 100% A until 120min had elapsed. Fractions were collected every 1.25 min (96 frac-tions over the entire gradient). The plate fractions were concentratedin a speed vac and then the 96 fractions in each plate were combinedinto a total of 24 final fractions samples (each with n � 4 fractionspooled) (i.e. each fraction combined with every 24th fraction). Thepooled fractions were then completely dried down, 25 �l of 25 mM
ammonium bicarbonate was added to each fraction, and plates withpooled fractions were stored at �20 °C until time for LC-MS/MSanalysis.
LC-MS/MS Analysis—Peptide mixtures were analyzed on a highresolution, reversed-phase capillary LC system coupled with aThermo Fisher Scientific LTQ-Orbitrap Velos MS (San Jose, CA). Theautomated LC system was custom built using two Agilent 1200nanoflow pumps and one Agilent 1200 capillary pump (Agilent Tech-nologies, Santa Clara, CA), and a PAL autosampler (Leap Technolo-gies, Carrboro, NC). Full automation was made possible by customsoftware that allowed for parallel event coordination and therefore,�100% of the MS duty cycle was used through the use of twotrapping and two analytical capillary columns. Capillary reversed-phase columns were prepared in-house by slurry packing 3-�m Ju-piter C18 (Phenomenex, Torrence, CA) into 35-cm x 360 �m o.d. x 75�m i.d fused silica (Polymicro Technologies Inc., Phoenix, AZ). Trap-ping columns were prepared similarly, but using 3.6-�m Aeris Wide-pore XB-C18 packed into a 4-cm length of 150 �m i.d. fused silica.Mobile phases consisted of 0.1% formic acid in water (A) and 0.1%formic acid acetonitrile (B) operated at 300 nL/min constant flow witha gradient profile over the course of 100 min as follows (min:%B); 0:5,2:8, 20:12, 75:35, 97:60, 100:85. Sample injections (5-�l) weretrapped and washed on the trapping columns at 1.5-�l/min for 20 minbefore alignment with analytical columns. Two column operation alsoallowed for columns to be “washed” (shortened gradients) and re-generated off-line without any cost to duty cycle.
MS analysis was performed on a LTQ-Orbitrap Velos mass spec-trometer outfitted with a custom electrospray ionization (ESI) inter-face. Electrospray emitters were custom made by chemically etching150 �m o.d. � 20 �m i.d. fused silica (27). The heated capillarytemperature and spray voltage were 350 °C and 2.2 kV, respectively.Full MS spectra were recorded at a resolution of 100K (for ions at m/z400) over the range of m/z 400–2000 with an automated gain control(AGC) value of 1e6. MS/MS was performed in the data-dependentmode with an AGC target value of 3e4. The ten most abundant parentions, excluding single charge states, were selected for MS/MS usinghigh-energy collisional dissociation (HCD) with a normalized collisionenergy setting of 40%. A dynamic exclusion time of 45 s was used.
ELISA assays of FGB, FGG, and HLA DRB1—Commercially avail-able ELISA assays for fibrinogen beta (FGB) (Cat#ABIN418172), fi-brinogen gamma (FGG) (Cat#ABIN416913), HLA class II DRB11(Cat#ABIN1137134), and SUMO2 (Cat# ABIN591073) were pur-chased from Antibodies-online (Atlanta, GA). After optimization forurine dilution, the manufacturer’s protocol was followed.
Data Analysis—iTRAQ-labeled peptides were identified based ontandem MS/MS spectra. MS/MS spectra were converted to peak listsusing DeconMSn (version 2.2.2.2, http://omics.pnl.gov/software/DeconMSn.php) (v1) using default parameters. The database usedwas SEQUEST v27. The protein database from Uniprot was down-
loaded (released May 5, 2010) with 20,776 total entries. Both fully andpartially tryptic peptides were considered with two missed cleavagesallowed. The mass tolerance for precursor ions was 50 ppm andfragmentation tolerance for HCD were 0.05 Da. All peptides wereidentified with �0.1% False Discovery Rate by using a MS-Generat-ing Function Score (MS-GF) �1E-10 and a decoy database searchingstrategy (28). The reporter ion intensities for each peptide weresummed for all identified spectra for each channel in each biologicalcondition. Relative abundances at the peptide level were rolled-up tothe protein level using the software tool DAnTE (29) with the abun-dances being log2 transformed and normalized by the central tend-ency approach. For each eight-plex iTRAQ experiment, a global mean(i.e. average abundance) was calculated for each protein across theeight channels in to serve as a baseline for normalization across thethree iTRAQ experiments. All protein abundances (log2 transformed)in the three iTRAQ experiments were normalized against the globalmean (i.e. subtracting by the global mean) obtained from their respec-tive iTRAQ experiment to identify increased or decreased proteinabundances in each phenotype. Differential expression analysis wasconducted in AltAnalyze (30) version 2.0.8 with the Ensembl version65 human database. Proteins were considered to have differentialabundances with an empirical Bayes t test p value � 0.05 and foldchange � 1.5. Pathway and gene set enrichment analysis and visu-alization were performed using the GO-Elite module of AltAnalyze.Protein-protein and protein-DNA interaction networks in AltAnalyzewere built using annotated interactions from Wikipathways, KEGG,PAZAR and Amadeus using direct interactions only. For ELISA data,the urine protein levels were normalized to urine creatinine levels.GraphPad PRISM (GraphPad Software, Inc., La Jolla, CA) was usedfor statistical analysis, p values were calculated using an unpaired ttest, and fold changes were used for significant increases or de-creases of proteins in the urine. Nominal logistic regression modelwas performed on the ELISA data collected from the three proteinsFGB, FGG, and HLA-DRB1. Receiver operating characteristic (ROC)analysis was conducted on a combined panel of 3 proteins to predictAR with fitted logistic regression models using log-transformed urineprotein quantities. Given that different injury phenotypes can co-existin the graft, we developed a multinomial regression model with anelastic-net penalty to estimate the risk score for each injury subtype.The computation was done in R using the package glmnet.
RESULTS
Peptide and protein identifications for kidney transplanturine—Application of the 2D-LC-MS/MS strategy for iTRAQ-labeled pooled samples led to the identification of a total of6379 unique peptides with FDR �0.1% at the peptide level(supplemental Table S1), covering 958 human proteins (sup-plemental Table S2). The numbers of proteins quantifiedacross the three eight-plex iTRAQ experiments were 824, 780,and 805, respectively. The normalized abundance profiles inlog2 transformation format against a global mean are listed insupplemental Table S2.
Among this set, parametric analysis of all possible groupsof pair-wise comparisons yielded a set of 389 proteins dem-onstrating a 50% difference in protein abundances amonggroups (moderated t test p � 0.05) (supplemental Table S3).Principal component analysis for the first three componentsindicated overall similarity among the distinct injury samplesets for these 389 proteins across the 24 pooled injury profiles(supplemental Fig. S1A). Unsupervised clustering of these
Protein Biomarkers of Kidney Transplantation Injury
624 Molecular & Cellular Proteomics 13.2

proteins using the HOPACH algorithm indicates largely dis-tinct profile expression of AR, BKV, and CAI from STA (sup-plemental Fig. S1B and supplemental Table S3). SUMO2(small ubiquitin-related modifier 2) was identified as a “hub”protein for graft injury irrespective of causation (see below).
AR Enriched Proteins—With criteria of �1.5 fold changeand p value �0.05, there were 28 urine proteins increased and125 urine proteins decreased in AR urine when compared withSTA urine. The top 10 most significantly increased urine pro-teins in AR included ACTB, HIST1H4B, FGG, KRT18, FGB,HLA-DRB1, FGA, KRT14, KRT7, and DPP4 of which 9 werespecific to AR (p � 0.01; fold increase �1.5) (Table II). The top10 most significantly decreased proteins included COL1A1,BCAN, SHISA5, PGA4, HTRA1, RTN4RL2, VGF, SUSD2,HAVCR2, and GGT6.
BK Infection Enriched Proteins—Analysis of urine proteinscollected from patients with BKV nephritis revealed 94 urineproteins increased and 26 urine proteins were decreased inBKV urine when compared with STA urine with the criteria of�1.5-fold change and p value �0.05. The top 10 mostsignificant increased urine proteins in BKV are shown inTable II.
CAI Enriched Proteins (CAN and CNIT Samples)—Analysisof urine proteins collected from patients with CAI resulted in48 urine proteins significantly increased with the criteria �1.5-fold change and p value �0.05. The top 10 most significantincreased urine proteins in CAI are shown in Table II.
Comparison and Functional Analysis of Distinct Forms ofRenal Transplant Injury—We compared urine proteins that areincreased in different graft injury phenotypes (AR, BKV, andCAI) relative to STA. As illustrated by the Venn diagram in Fig.2A, a set of eight proteins (CALR, CTSZ, DPP4, FABP4,FBXL19, FKBP1A, KITLG, and SUMO2) are increased in allthe transplant injury phenotypes studied. Likewise, multipleoverlapping sets were found when each individual group wascompared. This core common set, was associated with T-cellactivation (DPP4, FKBP1A) and ubiquitin protein ligase bind-ing (CALR, SUMO2), with both direct and indirect predictedinteractions among these proteins. Additionally, a group ofproteins associated in a network that includes proteins thatare known as extracellular matrix proteins and proteins in-volved in fibrosis (CD40, VIM, ACTB, CALR, CTSZ, KITLG,COL11A1, DPP4, and TGFBR1) (30–33)(Fig. 3B).
To properly evaluate those proteins with highly restrictedinjury profiles, we performed a marker discovery analysis in Alt-Analyze with the function MarkerFinder (supplemental Table S4).
Proteins most correlated with either AR, BKV, or CAI associ-ated with a diverse and distinct set of biological processes(Fig. 2B). Proteins uniquely expressed in AR were character-ized as belonging to pathways of blood clotting (FGA, FGB,and FGG) and keratin filaments (KRT1, KRT10, KRT14, KRT2,KRT5, KRT7, and KRT9). BKVN selective proteins were char-acterized as associating with contractile fiber (ACTA2,ALDOA, DES, ENO1, KRT19, MMP2, TPM1, TPM3, andTPM4), gene expression regulation (EEF1A1, HSPA8, RPL14,RPL18, SET, and SRP14), glycolysis (ALDOA, ENO1, PKM2,and TPI1), and response to virus (ACTA2, CFL1, ENO1, andSTMN1). Proteins expressed specifically in CAI were predom-inantly annotated as sugar binding (ACAN, CLEC14A, GLB1,LGALS9B, LMAN2, MRC2, and SELL), regulation of caspaseactivity (CD27, DPEP1, and F2), and generally associated withimmune system phenotypes (phenotype ontology). Althoughsome of these “marker” proteins were up-regulated in morethan one type of injury, they were still found to be moreselective for the indicated injury group, such as KRT19 withBKV.
To better explore the functional relationships among differ-entially expressed proteins, we examined putative protein-protein and protein-DNA interactions using the analysis toolkitAltAnalyze. When viewed in the context of just direct interac-tions, proteins in both AR and BK formed a highly connectednetwork of proteins (supplemental Fig. S2). In both sets, thecommon regulated protein SUMO2 formed a strong interac-tion hub to many up-regulated proteins.
ELISA Validation of AR Specific Proteins—We chose fourproteins to validate, fibrinogen beta (FGB), fibrinogen gamma(FGG), small ubiquitin-related modifier 2 (SUMO2), andMHC-II protein (HLA-DRB1), based on their statistical signif-icance and biological relevance in AR. When measured bycommercially available ELISA assays, the significance of threeproteins, fibrinogen beta, fibrinogen gamma, and HLA-DRB1,were validated on an independent set of urine samples. Theincreased protein level of fibrinogen beta (FBB) in AR urine(27.8 � 64.4 ng/mg urine creatinine) was significant whencompared with STA urine (7.1 � 8.7 ng/mg urine creatinine)(p � 0.04), CAI urine (8.1 � 6.8 ng/mg urine creatinine) (p �
0.05), BKV urine (4.9 � 3.9 ng/mg urine creatinine) (p � 0.03),NS urine (4.2 � 2.2 ng/mg urine creatinine) (p � 0.02), HCurine (2.0 � 1.1 ng/mg urine creatinine) (p � 0.01), and CNITurine (6.6 � 6.3 ng/mg urine creatinine)(p � 0.04) (Fig. 3A).Similarly, the increased protein level of fibrinogen gamma(FBG) in AR urine (27.4 � 60.1 ng/mg urine creatinine) was
TABLE IIAnalysis of pooled urine proteins collected from patients with AR, BKVN and CAI when compared to STA urine with the criteria of �1.5-fold
change of each transplant injury phenotype (AR, BKVN, and CAN), compared to STA pooled urine and with a p value of �0.05
Increased in AR Increased in BKVN Increased in CAI (CAN and CNIT)
HLA-DRB1, FGB, FGA, FGG, KRT14,HIST1H4B, ACTB, KRT7, DPP4
KRT18, SUMO2, STMN1, CFHR2, KRT8, KRT19,RPL18, KRT75, FAM3C, HIST1H2BA
CALR, FAM151A, SERPINA2P, FAM3C, DAG1,KITLG, LUM, FABP4, AGT, LRG1
Protein Biomarkers of Kidney Transplantation Injury
Molecular & Cellular Proteomics 13.2 625

significant when compared with urine of STA urine (7.5 � 8.5ng/mg urine creatinine) (p � 0.04), CAI urine (8.5 � 7.0 ng/mgurine creatinine) (p � 0.05), BKV urine (5.4 � 4.3 ng/mg urinecreatinine) (p � 0.02), NS urine (5.0 � 2.4 ng/mg urine creat-inine) (p � 0.02), HC urine (2.5 � 1.5 ng/mg urine creatinine)(p � 0.01), and CNIT urine (6.6 � 6.3 ng/mg urine crea-tinine)(p � 0.04) (Fig. 3B). The protein level of HLA-DRB1 wassignificantly higher in AR urine (2.8 � 4.6 ng/mg urine creat-inine) when compared with its level in STA urine (0.4 � 0.4ng/mg urine creatinine) (p � 0.001), CAI urine (0.6 � 0.8ng/mg urine creatinine) (p � 0.003), BKV urine (1.2 �
1.6 ng/mg urine creatinine) (p � 0.04) , NS urine (0.1 � 0.1ng/mg urine creatinine) (p � 0.0003), HC urine (0.1 � 0.1ng/mg urine creatinine) (p � 0.0003), and CNIT urine (0.2 �
0.1 ng/mg urine creatinine)(p � 0.0005) (Fig. 3C). The proteinlevel of SUMO2 was significantly higher in AR urine (n � 24)and CAI urine (n � 16) combined (13.6 � 18.1 ng/mg urinecreatinine), when compared with STA urine (4.2 � 5.8 ng/mgurine creatinine) (p � 0.0005) (Fig. 3D). SUMO2 level wassignificantly higher in AR urine (10.1 � 5.6 ng/mg urine cre-atinine) when compared with STA urine (4.2 � 5.9 ng/mg urinecreatinine) (p � 0.005), BKVN urine (4.0 � 5.1 ng/mg urinecreatinine) (p � 0.04), NS urine (0.3 � 0.2 ng/mg urine creat-inine) (p � 0.0003), and HC urine (0.2 � 0.4 ng/mg urinecreatinine) (p � 0.0003). The SUMO2 protein level was also
significantly higher in CAI (18.9 � 24.5 ng/mg urine creatinine)urine than in STA urine (4.2 � 5.9 ng/mg urine creatinine) (p �
0.009), BKVN urine (4.0 � 5.1 ng/mg urine creatinine) (p �
0.03), NS urine (0.3 � 0.2 ng/mg urine creatinine) (p � 0.008),HC urine (0.2 � 0.4 ng/mg urine creatinine) (p � 0.008), andCNIT urine (6.6 � 6.3 ng/mg urine creatinine)(p � 0.03) (Fig.3E). ROC curve analysis performed to identify AR from therest of the phenotypes (CAI, BK, and STA) on the data fromthree urine proteins yielded an AUC of 0.8.
Controls for Clinical and Pathology Confounders—Wechecked the association between patients’ phenotypes andtheir demographic information to ensure no demography re-lated confounders were driving the data. Because height andweight of the recipients were highly correlative to their age, welooked into the age association with different phenotypes.Recipient age was significantly associated with patients’ phe-notypes with p value � 0.001. When examined for the asso-ciation between the three potential biomarker (log-trans-formed) and recipients’ age, there was no significantassociation found among them (p � 0.187 for FGB; p � 0.260for FGG; p � 0.633 for HLA-DRB1). Based on this, we did notcontrol for recipient age for the three potential biomarkers.There were significant associations between three potentialbiomarker proteins and initial infiltration amount at 95% con-fidence level. The correlations between three candidate bio-
FIG. 1. The study design used in this study for effective urine protein biomarker discovery for kidney transplantation.
Protein Biomarkers of Kidney Transplantation Injury
626 Molecular & Cellular Proteomics 13.2

markers and mononuclear cell interstitial inflammation (i-score) were positive (0.35 for FGB, 0.33 for GG, and 0.46 forHLA-DRB1). Urine HLA-DRB1 positively correlated with tubu-litis score (t-score) with p value 0.003 and correlation coeffi-cient 0.34.
DISCUSSION
Serial and noninvasive monitoring of transplanted kidneyremains a critical unmet need to predict transplant injury andto distinguish among the different causes of transplant injury,such as AR, BKVN, and CAI. Noninvasive monitoring providespatient risk stratification for different immunosuppressionloads and choices based on the nature of the injury. Specialemphasis for the development of a noninvasive monitoring
assay needs to focus on distinguishing acute transplant injurybecause of AR (based on increased alloimmune reactivity)and BKVN (because of altered viral and innate immunity) asthese conditions require diametrically opposite treatment ap-proaches, with intensification of immunosuppression for ARand reduction or even discontinuation of immunosuppressionfor BKVN (1). When monitoring blood serum creatinine levels,a very redundant, minimally invasive, biomarker of nonspecifictransplant injury, injury to the transplanted kidney gets diag-nosed only when there is already established and often irre-versible tissue damage. Kidney biopsy is invasive and cannotbe used as a serial monitoring tool, though it is consideredthe gold standard for transplant injury detection, when im-plemented following an observed increase in blood serum
FIG. 2. Distinct and common proteomic targets of allograft injury. A, 133 unique up-regulated proteins overlapping among AR, BKV andCAI relative to STA. Protein names for overlapping up-regulated proteins are shown to the right of the Venn diagram. Predicted interactions(shortest path analysis) among core common injury proteins are shown on the right using predicted interactions from WikiPathways, KEGG,and BioGRID (undirected edges) (red � common injury proteins, gray � interaction partners not present among the 133 up-regulated proteins),with extracellular matrix fibrosis associated proteins indicated by blue text. B, Distinct marker profiles for the 133 uniquely increased injuryproteins along with associated enriched Gene Ontology (GO), KEGG, Disease Ontology (CTD), Phenotype Ontology (MP), and WikiPathways(WP) terms from GO-Elite. Terms with a Fisher’s Exact nonadjusted p value are reported. The top ranked marker proteins are shown in bluenext to the heatmap.
Protein Biomarkers of Kidney Transplantation Injury
Molecular & Cellular Proteomics 13.2 627

creatinine levels. For these reasons, identification and vali-dation of clinically applicable noninvasive biomarkers re-mains an important and unmet need in the field of kidneytransplantation.
Urine-based biomarkers provide a noninvasive monitoringand management alternative to assess renal diseases includ-ing kidney transplantation (34–36). With the publication ofhuman genome data and ever improving molecular profilingassays our ability to accurately identify and quantify potentialurine biomarker molecules has increased tremendously. Sev-eral reports on assessing mRNA level in urine sediments (12,37, 38), urine protein (13, 35) and peptides (16) have high-lighted the feasibility of identifying potential biomarker mole-cules in urine. Measurement of urine mRNA levels presents anattractive biomarker option, but susceptibility of mRNA in theurine in combination with low mRNA abundances requiresmore validation in the clinical setting (39). Unlike peak clus-tering for SELDI-TOF or a label-free shotgun MS/MS ap-proach, the quantitative iTRAQ method provides an accurateassessment of protein levels in the urine samples analyzedin this study. In this report we applied a unique quantitativeapproach of identifying and profiling potential candidate
urine biomarker proteins that could provide surrogate non-invasive biomarkers to screen for transplant injury, providea risk output of the type of transplant injury, and addition-ally, reveal underlying key molecules driving kidney trans-plant injury.
To accurately characterize urine protein profiles that aredistinct to different injury phenotypes following kidney trans-plantation, we applied a quantitative proteomics approachthat identified a unique set of proteins for each sub-type oftransplant injury. Through this study we were able to furthervalidate proteins that were observed as AR specific in ourpreviously published report from a pilot study which wasbased on label-free shotgun proteomics (17). The associatedmolecular networks identified by AltAnalyze, an innovativebioinformatics suite, has helped to better characterize andunderstand the events that cause different injuries of kidneytransplantation. Similar to our previously published observa-tions of altered levels of PEDF and CD44 proteins in urine, inthis study we observed a 1.7-fold increase in PEDF level in ARurine compared with STA urine and a 2.2-fold decrease inCD44 level in AR urine compared with STA urine; however,the candidate biomarker panel reported in this study had
FIG. 3. Validation of transplant injury specific proteins by ELISA on independent set of individual urine samples. A–C, Potential ARspecific protein biomarkers were validated on an independent set of urine samples on (A) Fibrinogen beta (FGB), (B) Fibrinogen gamma (FGG),and (C) HLA class II histocompatibility antigen (HLA-DRB1). [D-E] Small ubiquitin-related modifier 2 [SUMO2] was validated to be significantlyincreased in AR and CAI urine combined compared with no-injury phenotype including nontransplant control [D]. Urine level of SUMO2 wasalso found to be significantly increased in AR and CAI independently when compared with its level BKVN and STA urine and urine fromnontransplant control. The error bars represent standard error of means (S.E.).
Protein Biomarkers of Kidney Transplantation Injury
628 Molecular & Cellular Proteomics 13.2

greater statistical significance as biomarkers for renal al-lograft rejection.
Fibrin-fibrinogen and keratin degradation products havebeen previously shown to be present (decades ago) in urine atthe time of renal allograft rejection using Western blotting (40).Fibrin deposition itself can be a key player in the evolution ofchronic transplant glomerulopathy, a prime risk factor foracute rejection (41). Likewise, increases in excreted HLA pep-tides have been correlated with an increase in donor-directedHLA antibodies, which are important in humoral or antibody-mediated rejection (42). A number of other proteins identifiedin this study are markers of tubular epithelial injury, and manyhave been demonstrated to be deregulated in experimentalmodels of ischemia reperfusion injury (43).
The antigenic protein DPP4, also known as CD26, wasfound to be increased in all injury models. This interestingmolecule is a cell surface glycoprotein receptor involved in thecostimulatory signal essential for T-cell receptor (TCR)-medi-ated T-cell activation. DPP4 acts as a positive regulator ofT-cell coactivation and it is reported to be found in renaltubules (44).There are reports that DPP4 may play an unex-pected role in modulating Na/H exchange mediated byNHE3 in proximal tubule cells (45). DPP4 is also a target for aclass of drugs that are used to treat diabetes mellitus. Giventhe high incidence of glucose intolerance following chronicimmunosuppression after organ transplantation, it would betantalizing to hypothesize that DPP4 may be dysregulatedduring alloimmunity and help to drive an increased risk forglucose intolerance.
Among the eight core regulated injury set, a consistenttwofold increase was observed with both CALR and FBXL19proteins observed in all three injury types. The calreticulin(CALR) protein binds to misfolded proteins and has beenpreviously reported to be associated with systemic lupus andother autoimmune disorders through its binding to autoanti-bodies (46, 47) and DNA (48). The F-box and leucine-richrepeat protein FBXL19 is associated with cellular inflamma-tion (pulmonary) through its action as a ubiquitin ligase totarget proteins for proteasomal degradation (49). Hence,these common injury-associated proteins may represent anautoimmune inflammatory end-point common to all forms ofrenal allograft injury. Among the common set of injury-asso-ciated proteins, SUMO2 was found to be the most tightlyinterconnected protein at the central hub of regulation in bothacute injury settings (AR and BKV) and CAI (Fig. 2A). SUMO2is a factor that regulates the functional activity of a broadrange of proteins through a reversible covalent modification tothose proteins known as SUMOylation. Although there is noclear identified functional role for SUMOylation in allograftinjury, SUMO2’s common regulation and predicted interac-tions with a large number of AR, CAI, and BKV proteins maysuggest that its regulation is a central axis of allograft injury.
In conclusion, an unbiased, quantitative, high-throughputproteome characterization approach has been tested and
optimized for biomarker discovery. Subsequent validation ofproteomic discoveries with highly annotated clinical samplesdemonstrated that this method provides an effective strategyfor biomarker discovery with the goal of monitoring transplantinjury in kidney transplant patients. Because the study popu-lation consists of children and young adults with minimalincidence of acute tubular necrosis, these findings may not begeneralizable to transplant populations that are not similarlyhighly selected for living donors and low cold ischemia times.Further application of these well-credentialed candidate pro-tein biomarkers in clinical trials that utilize larger sample co-horts for prospective validation will forge the path towardclinical utility of these protein panels for predictive risk strat-ification of renal transplant patients.
Acknowledgments—The authors acknowledge the funding supportfrom NIDDK R01DK083447 (to M.M.S. and D.G.C.), DP2OD006668(to W.J.Q.), and P41GM103493 (to R.D.S.). The experimental workdescribed herein was performed in the Environmental Molecular Sci-ences Laboratory (EMSL), a U.S. Department of Energy (DOE) na-tional scientific user facility located at PNNL in Richland, Washingtonand in the Sarwal Lab at Stanford University and California PacificMedical Center Research Institute. PNNL is a multi-program nationallaboratory operated by Battelle Memorial Institute for the DOE underContract DE-AC05-76RL01830.
* This work was supported by NIDDK R01DK083447 (to M.M.S.and D.G.C.), DP2OD006668 (to W.J.Q.), and P41GM103493 (toR.D.S.). The experimental work described herein was performed inthe Environmental Molecular Sciences Laboratory (EMSL), a U.S.Department of Energy (DOE) national scientific user facility located atPNNL in Richland, Washington and in the Sarwal Lab at StanfordUniversity and California Pacific Medical Center Research Institute.PNNL is a multi-program national laboratory operated by BattelleMemorial Institute for the DOE under Contract DE-AC05–76RL01830.
□S This article contains supplemental Tables S1 to S4 and Figs. S1and S2.
� To whom correspondence should be addressed: Pediatrics andTransplant Nephrology, Sutter Health Care, Director, The BIOMARCProgram, California Pacific Medical Center Research Institute,475 Brannan St., Ste 220, San Francisco, CA 94107. E-mail:[email protected].
REFERENCES
1. Nankivell, B. J., and Alexander, S. I. (2010) Rejection of the kidney allograft.N. Engl. J. Med. 363, 1451–1462
2. de Fijter, J. W. (2010) Rejection and function and chronic allograft dysfunc-tion. Kidney Int 119, S38–S41
3. Sigdel, T. K., Gao, X., and Sarwal, M. M. (2012) Protein and peptidebiomarkers in organ transplantation. Biomark Med. 6, 259–271
4. Turka, L. A., and Lechler, R. I. (2009) Towards the identification of biomark-ers of transplantation tolerance. Nat. Rev. Immunol. 9, 521–526
5. Green, E. D., and Guyer, M. S. (2011) Charting a course for genomicmedicine from base pairs to bedside. Nature 470, 204–213
6. Ozsolak, F., Platt, A. R., Jones, D. R., Reifenberger, J. G., Sass, L. E.,McInerney, P., Thompson, J. F., Bowers, J., Jarosz, M., and Milos, P. M.(2009) Direct RNA sequencing. Nature 461, 814–818
7. Li, L., Khatri, P., Sigdel, T. K., Tran, T., Ying, L., Vitalone, M. J., Chen, A.,Hsieh, S., Dai, H., Zhang, M., Naesens, M., Zarkhin, V., Sansanwal, P.,Chen, R., Mindrinos, M., Xiao, W., Benfield, M., Ettenger, R. B., Dharnid-harka, V., Mathias, R., Portale, A., McDonald, R., Harmon, W., Kershaw,D., Vehaskari, V. M., Kamil, E., Baluarte, H. J., Warady, B., Davis, R.,Butte, A. J., Salvatierra, O., and Sarwal, M. M. (2012) A peripheral blooddiagnostic test for acute rejection in renal transplantation. Am. J. Trans-
Protein Biomarkers of Kidney Transplantation Injury
Molecular & Cellular Proteomics 13.2 629
plant. 12, 2710–27188. Sarwal, M., Chua, M. S., Kambham, N., Hsieh, S. C., Satterwhite, T.,
Masek, M., and Salvatierra, O., Jr. (2003) Molecular heterogeneity inacute renal allograft rejection identified by DNA microarray profiling.N. Engl. J. Med. 349, 125–138
9. Einecke, G., Melk, A., Ramassar, V., Zhu, L. F., Bleackley, R. C., Famulski,K. S., and Halloran, P. F. (2005) Expression of CTL associated transcriptsprecedes the development of tubulitis in T-cell mediated kidney graftrejection. Am. J. Transplant. 5, 1827–1836
10. Mas, V., Maluf, D., Archer, K., Yanek, K., Mas, L., King, A., Gibney, E.,Massey, D., Cotterell, A., Fisher, R., and Posner, M. (2007) Establishingthe molecular pathways involved in chronic allograft nephropathy fortesting new noninvasive diagnostic markers. Transplantation 83,448–457
11. Anglicheau, D., Sharma, V. K., Ding, R., Hummel, A., Snopkowski, C.,Dadhania, D., Seshan, S. V., and Suthanthiran, M. (2009) MicroRNAexpression profiles predictive of human renal allograft status. Proc. Natl.Acad. Sci. U.S.A. 106, 5330–5335
12. Muthukumar, T., Dadhania, D., Ding, R., Snopkowski, C., Naqvi, R., Lee,J. B., Hartono, C., Li, B., Sharma, V. K., Seshan, S. V., Kapur, S.,Hancock, W. W., Schwartz, J. E., and Suthanthiran, M. (2005) MessengerRNA for FOXP3 in the urine of renal-allograft recipients. N. Engl. J. Med.353, 2342–2351
13. Schaub, S., Rush, D., Wilkins, J., Gibson, I. W., Weiler, T., Sangster, K.,Nicolle, L., Karpinski, M., Jeffery, J., and Nickerson, P. (2004) Proteomic-based detection of urine proteins associated with acute renal allograftrejection. J. Am. Soc. Nephrol. 15, 219–227
14. Schaub, S., Wilkins, J. A., Rush, D., and Nickerson, P. (2006) Developing atool for noninvasive monitoring of renal allografts. Expert Rev. Proteo-mics 3, 497–509
15. Chen, R., Sigdel, T. K., Li, L., Kambham, N., Dudley, J. T., Hsieh, S. C.,Klassen, R. B., Chen, A., Caohuu, T., Morgan, A. A., Valantine, H. A.,Khush, K. K., Sarwal, M. M., and Butte, A. J. (2010) Differentially ex-pressed RNA from public microarray data identifies serum protein bio-markers for cross-organ transplant rejection and other conditions. PLoSComput Biol. 6, 1–12
16. Ling, X. B., Sigdel, T. K., Lau, K., Ying, L., Lau, I., Schilling, J., and Sarwal,M. M. (2010) Integrative urinary peptidomics in renal transplantation iden-tifies biomarkers for acute rejection. J. Am. Soc. Nephrol. 21, 646–653
17. Sigdel, T. K., Kaushal, A., Gritsenko, M., Norbeck, A. D., Qian, W. J., Xiao,W., Camp, D. G., 2nd, Smith, R. D., and Sarwal, M. M. (2010) Shotgunproteomics identifies proteins specific for acute renal transplant rejec-tion. Proteomics Clin. Appl. 4, 32–47
18. Solez, K., Colvin, R. B., Racusen, L. C., Haas, M., Sis, B., Mengel, M.,Halloran, P. F., Baldwin, W., Banfi, G., Collins, A. B., Cosio, F., David,D. S., Drachenberg, C., Einecke, G., Fogo, A. B., Gibson, I. W., Glotz, D.,Iskandar, S. S., Kraus, E., Lerut, E., Mannon, R. B., Mihatsch, M.,Nankivell, B. J., Nickeleit, V., Papadimitriou, J. C., Randhawa, P., Regele,H., Renaudin, K., Roberts, I., Seron, D., Smith, R. N., and Valente, M.(2008) Banff 07 classification of renal allograft pathology: updates andfuture directions. Am. J. Transplant 8, 753–760
19. Isoniemi, H., Taskinen, E., and Hayry, P. (1994) Histological chronic al-lograft damage index accurately predicts chronic renal allograft rejection.Transplantation 58, 1195–1198
20. Racusen, L. C., Halloran, P. F., and Solez, K. (2004) Banff 2003 meetingreport: new diagnostic insights and standards. Am. J. Transplant 4,1562–1566
21. Racusen, L. C., Solez, K., Colvin, R. B., Bonsib, S. M., Castro, M. C.,Cavallo, T., Croker, B. P., Demetris, A. J., Drachenberg, C. B., Fogo,A. B., Furness, P., Gaber, L. W., Gibson, I. W., Glotz, D., Goldberg, J. C.,Grande, J., Halloran, P. F., Hansen, H. E., Hartley, B., Hayry, P. J., Hill,C. M., Hoffman, E. O., Hunsicker, L. G., Lindblad, A. S., Yamaguchi, Y.,and et al. (1999) The Banff 97 working classification of renal allograftpathology. Kidney Int. 55, 713–723
22. Solez, K., Colvin, R. B., Racusen, L. C., Sis, B., Halloran, P. F., Birk, P. E.,Campbell, P. M., Cascalho, M., Collins, A. B., Demetris, A. J., Drachen-berg, C. B., Gibson, I. W., Grimm, P. C., Haas, M., Lerut, E., Liapis, H.,Mannon, R. B., Marcus, P. B., Mengel, M., Mihatsch, M. J., Nankivell,B. J., Nickeleit, V., Papadimitriou, J. C., Platt, J. L., Randhawa, P.,Roberts, I., Salinas-Madriga, L., Salomon, D. R., Seron, D., Sheaff, M.,and Weening, J. J. (2007) Banff ’05 Meeting Report: differential diagnosis
of chronic allograft injury and elimination of chronic allograft nephropathy(‘CAN). Am. J. Transplant. 7, 518–526
23. Schwartz, G. J., and Work, D. F. (2009) Measurement and estimation ofGFR in children and adolescents. Clin. J. Am. Soc. Nephrol. 4,1832–1843
24. Li, L., Chaudhuri, A., Chen, A., Zhao, X., Bezchinsky, M., Concepcion, W.,Salvatierra, O., Jr., and Sarwal, M. M. (2010) Efficacy and safety ofthymoglobulin induction as an alternative approach for steroid-free main-tenance immunosuppression in pediatric renal transplantation. Trans-plantation 90, 1516–1520
25. Sigdel, T. K., Lau, K., Schilling, J., and Sarwal, M. (2008) Optimizing proteinrecovery for urinary proteomics, a tool to monitor renal transplantation.Clin. Transplant. 22, 617–623
26. Wang, Y., Yang, F., Gritsenko, M. A., Clauss, T., Liu, T., Shen, Y., Monroe,M. E., Lopez-Ferrer, D., Reno, T., Moore, R. J., Klemke, R. L., Camp,D. G., 2nd, and Smith, R. D. (2011) Reversed-phase chromatographywith multiple fraction concatenation strategy for proteome profiling ofhuman MCF10A cells. Proteomics 11, 2019–2026
27. Kelly, R. T., Page, J. S., Luo, Q., Moore, R. J., Orton, D. J., Tang, K., andSmith, R. D. (2006) Chemically etched open tubular and monolithicemitters for nanoelectrospray ionization mass spectrometry. Anal. Chem.78, 7796–7801
28. Qian, W. J., Liu, T., Monroe, M. E., Strittmatter, E. F., Jacobs, J. M., Kangas,L. J., Petritis, K., Camp, D. G., 2nd, and Smith, R. D. (2005) Probability-based evaluation of peptide and protein identifications from tandemmass spectrometry and SEQUEST analysis: the human proteome. J.Proteome Res. 4, 53–62
29. Polpitiya, A. D., Qian, W. J., Jaitly, N., Petyuk, V. A., Adkins, J. N., Camp,D. G., 2nd, Anderson, G. A., and Smith, R. D. (2008) DAnTE: a statisticaltool for quantitative analysis of -omics data. Bioinformatics 24,1556–1558
30. Kawai, M., Masuda, A., and Kuwana, M. (2008) A CD40-CD154 interactionin tissue fibrosis. Arthritis Rheum. 58, 3562–3573
31. Challa, A. A., and Stefanovic, B. (2011) A novel role of vimentin filaments:binding and stabilization of collagen mRNAs. Mol. Cell. Biol. 31,3773–3789
32. Martin, M., Lefaix, J. L., Pinton, P., Crechet, F., and Daburon, F. (1993)Temporal modulation of TGF-beta 1 and beta-actin gene expression inpig skin and muscular fibrosis after ionizing radiation. Radiat. Res. 134,63–70
33. Nakerakanti, S., and Trojanowska, M. (2012) The Role of TGF-beta Recep-tors in Fibrosis. Open Rheumatol. J. 6, 156–162
34. Quintana, L. F., Banon-Maneus, E., Sole-Gonzalez, A., and Campistol, J. M.(2009) Urine proteomics biomarkers in renal transplantation: an overview.Transplantation 88, S45–S49
35. Sigdel, T. K., Klassen, R. B., and Sarwal, M. M. (2009) Interpreting theproteome and peptidome in transplantation. Adv. Clin. Chem. 47,139–169
36. Sigdel, T. K., Lee, S., and Sarwal, M. M. (2011) Profiling the proteome inrenal transplantation. Proteomics Clin. Appl. 5, 269–280
37. Dadhania, D., Muthukumar, T., Ding, R., Li, B., Hartono, C., Serur, D.,Seshan, S. V., Sharma, V. K., Kapur, S., and Suthanthiran, M. (2003)Molecular signatures of urinary cells distinguish acute rejection of renalallografts from urinary tract infection. Transplantation 75, 1752–1754
38. Ding, R., Li, B., Muthukumar, T., Dadhania, D., Medeiros, M., Hartono, C.,Serur, D., Seshan, S. V., Sharma, V. K., Kapur, S., and Suthanthiran, M.(2003) CD103 mRNA levels in urinary cells predict acute rejection of renalallografts. Transplantation 75, 1307–1312
39. Keslar, K. S., Lin, M., Zmijewska, A. A., Sigdel, T. K., Tran, T. Q., Ma, L.,Bhasin, M., Rao, P., Ding, R., Ikle, D. N., Mannon, R. B., Sarwal, M. M.,Strom, T. B., Reed, E. F., Heeger, P. S., Suthanthiran, M., and Fairchild,R. L. Multicenter evaluation of a standardized protocol for noninvasivegene expression profiling. Am. J. Transplant. 13, 1891–1897
40. Exaire, E., Flores-Izquierdo, G., Ortiz, F., Pizzuto, J., Cruz, M., and Gutier-rez, M. L. (1978) Detection of urinary fibrin-fibrinogen degradation prod-ucts in kidney transplantation. Arch. Invest. Med. 9, 503–510
41. Maryniak, R. K., First, M. R., and Weiss, M. A. (1985) Transplant glomeru-lopathy: evolution of morphologically distinct changes. Kidney Int. 27,799–806
42. Bray, R. A., Harris, S. B., Josephson, C. D., Hillyer, C. D., and Gebel, H. M.(2004) Unappreciated risk factors for transplant patients: HLA antibodies
Protein Biomarkers of Kidney Transplantation Injury
630 Molecular & Cellular Proteomics 13.2

in blood components. Hum. Immunol. 65, 240–24443. Jayle, C., Favreau, F., Zhang, K., Doucet, C., Goujon, J. M., Hebrard, W.,
Carretier, M., Eugene, M., Mauco, G., Tillement, J. P., and Hauet, T.(2007) Comparison of protective effects of trimetazidine against experi-mental warm ischemia of different durations: early and long-term effectsin a pig kidney model. Am. J. Physiol. Renal Physiol. 292, F1082–F1093
44. Tiruppathi, C., Miyamoto, Y., Ganapathy, V., Roesel, R. A., Whitford, G. M.,and Leibach, F. H. (1990) Hydrolysis and transport of proline-containingpeptides in renal brush-border membrane vesicles from dipeptidyl pep-tidase IV-positive and dipeptidyl peptidase IV-negative rat strains. J. Biol.Chem. 265, 1476–1483
45. Girardi, A. C., Knauf, F., Demuth, H. U., and Aronson, P. S. (2004) Role ofdipeptidyl peptidase IV in regulating activity of Na/H exchanger iso-form NHE3 in proximal tubule cells. Am. J. Physiol. Cell Physiol. 287,C1238–C1245
46. Sanchez, D., Tuckova, L., Sebo, P., Michalak, M., Whelan, A., Sterzl, I.,Jelinkova, L., Havrdova, E., Imramovska, M., Benes, Z., Krupickova, S.,and Tlaskalova-Hogenova, H. (2000) Occurrence of IgA and IgG autoan-tibodies to calreticulin in coeliac disease and various autoimmune dis-eases. J. Autoimmun. 15, 441–449
47. Watanabe, K., Ohira, H., Orikasa, H., Saito, K., Kanno, K., Shioya, Y.,Obara, K., and Sato, Y. (2006) Anti-calreticulin antibodies in patients withinflammatory bowel disease. Fukushima J. Med. Sci. 52, 1–11
48. Seddiki, N., Nato, F., Lafaye, P., Amoura, Z., Piette, J. C., and Mazie, J. C.(2001) Calreticulin, a potential cell surface receptor involved in cell pen-etration of anti-DNA antibodies. J. Immunol. 166, 6423–6429
49. Zhao, J., Wei, J., Mialki, R. K., Mallampalli, D. F., Chen, B. B., Coon, T., Zou,C., Mallampalli, R. K., and Zhao, Y. (2012) F-box protein FBXL19-medi-ated ubiquitination and degradation of the receptor for IL-33 limits pul-monary inflammation. Nat. Immunol. 13, 651–658
Protein Biomarkers of Kidney Transplantation Injury
Molecular & Cellular Proteomics 13.2 631


