Embed Size (px)
Citation preview
The middle Pleistocene Merced-2 and -3 sequences from
Ocean Beach, San Francisco
R.M. Carter a,*, S.T. Abbott b, I.J. Graham c, T.R. Naish c, P.R. Gammon d
aMarine Geophysical Laboratory, James Cook University, 4811 Townsville, Qld, AustraliabSchool of Resource Science, Southern Cross University, Lismore, AustraliacInstitute of Geological and Nuclear Sciences, Lower Hutt, New Zealand
dDepartment of Geology and Geophysics, University of Adelaide, Adelaide, Australia
Accepted 23 January 2002
Abstract
The Merced Formation comprises a 2-km-thick shallow marine and non-marine succession that was deposited in a small
transtensional basin along the San Andreas Fault during the late Pliocene to middle Pleistocene. The sediments dip between 10jand 80j to the northeast, and are locally disrupted by small faults. During tilting, the beds have been rotated into subparallelism
with the San Andreas Fault zone, splays of which bound the outcrop belt of Merced sediments to both the southwest and
northeast. The Merced Formation contains more than 20 transgressive–regressive sedimentary rhythms (cyclothems, or
sequences) that are generally between 40 and 120 m thick, and which were deposited mostly during interglacial time, under the
influence of rising, highstand and early falling sea levels. Sequences Merced-2 [units M1–N of Soc. Econ. Paleontol. Mineral.,
Field Guidebook 3 (1984) 1] and Merced-3 (units O–P), though in fault contact, comprise typical Plio-Pleistocene shallow
water cyclothems. The Merced-2 Sequence is 22+ m thick, and comprises a sandy and shelly transgressive systems tract,
including a basal Type A shellbed, an in situ Type B mid-cycle shellbed, and a highstand systems tract of massive siltstone. The
Merced-3 Sequence is 47 m thick, and comprises a basal compound shellbed, a thin highstand systems tract siltstone, and a
sand-rich regressive systems tract. The RST comprises distal shoreface sands with an abundant in situ molluscan fauna, and
upper shoreface and back-beach trough cross-bedded sands and pebbly sands. The top of the Merced-3 cycle comprises a beach
sand capped by a palaeosol and lignite (the ‘‘Beetle Bed’’), which together mark the subaerial exposure of the site during the
ensuing glacial sea-level lowstand. Analysis of 10Be across the Merced-3 Sequence shows major peaks, indicative of
sedimentation starvation, in the basal transgressive systems tract shellbed and in the capping lignite of the Beetle Bed. Smaller10Be peaks are associated with a shellbed that is inferred to represent winnowing at the foot of the shoreface, and with a minor
exposure surface that delimits a small paracycle in the top of the sequence. Otherwise, 10Be abundances decline regularly across
the Merced-3 Sequence, consistent with an increasing sedimentation rate as shoreface progradation, and regression, progressed.
The character of cycles Merced-2 and Merced-3 respectively resembles the Seafield and Rangitikei sequence motifs described
from similar Plio-Pleistocene sediments in New Zealand. The cycles are of mid-Pleistocene age, and were probably deposited
during interglacial oxygen isotope stages 21 and 19, respectively.
D 2002 Elsevier Science B.V. All rights reserved.
Keywords: Middle Pleistocene; Merced Formation; Cyclothems
0037-0738/02/$ - see front matter D 2002 Elsevier Science B.V. All rights reserved.
PII: S0037 -0738 (02 )00099 -4
* Corresponding author. Tel.: +61-77-81-4536; fax: +61-77-251-501.
E-mail address: [email protected] (R.M. Carter).
www.elsevier.com/locate/sedgeo
Sedimentary Geology 153 (2002) 23–41
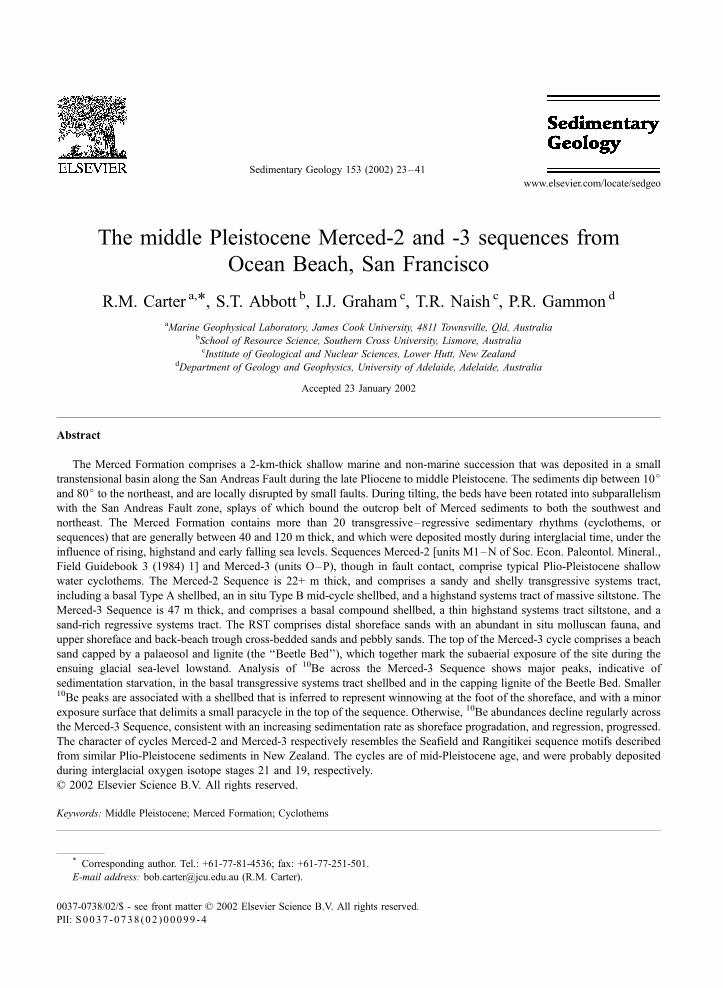
1. Introduction
The Merced Formation outcrops as a coastal strip
between Fort Funston and Mussel Rock, on the Pacific
coast 15–20 km south of the tip of San Francisco
peninsula (Fig. 1). The outcrop comprises a homocli-
nal sequence that is bounded to the southwest by the
San Andreas Fault (Clifton et al., 1988). Dips are
between 60j and 80j in the lower part of the section,
lessening to 10j–20j near Fort Funston at the north
end. The sediments are dominantly unconsolidated
sands and muds with intervals of consolidated silt-
stone, an unstable mix that results in severe landsliding
along the coastal cliffs. Rapid tectonic uplift and tilting
has caused significant deformation of the sediments,
which exhibit many minor faults, shear zones and
incipient cleavages. This combination of tectonic de-
formation and pervasive landsliding poses a significant
challenge to reconstructing a detailed stratigraphic
record.
Fig. 1. Locality map for the outcrop occurrence of the Merced-2 and Merced-3 sequences, Ocean Beach, San Francisco (after Hunter et al., 1984).
R.M. Carter et al. / Sedimentary Geology 153 (2002) 23–4124
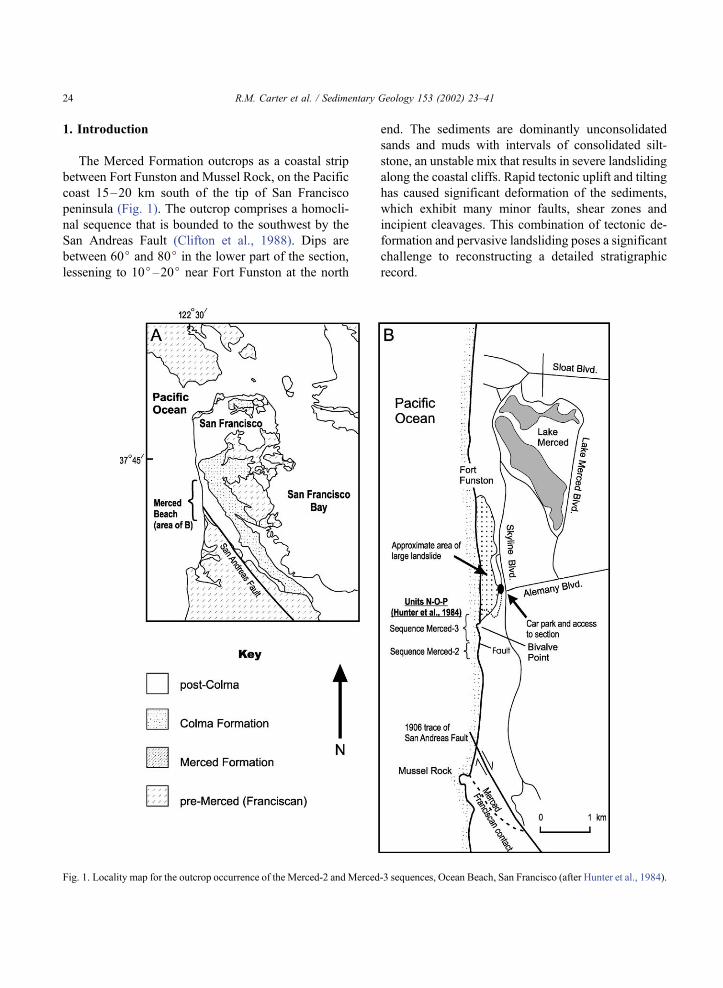
Fig. 2. Measured section of the Merced-2 and Merced-3 sequences at Ocean Beach. Stratigraphic and shellbed terminology after Abbott and
Carter (1994) and Naish and Kamp (1997).
R.M. Carter et al. / Sedimentary Geology 153 (2002) 23–41 25
Clifton et al. (1988) and Clifton (1989) have shown
that the outcropping section of the Merced Formation
is 1.75 km thick, and comprises a succession of se-
dimentary cycles. A typical cycle is 40–120 m thick,
and comprises a sharp, erosional contact at the base, a
basal pebbly shellbed, a lower interval of shallow
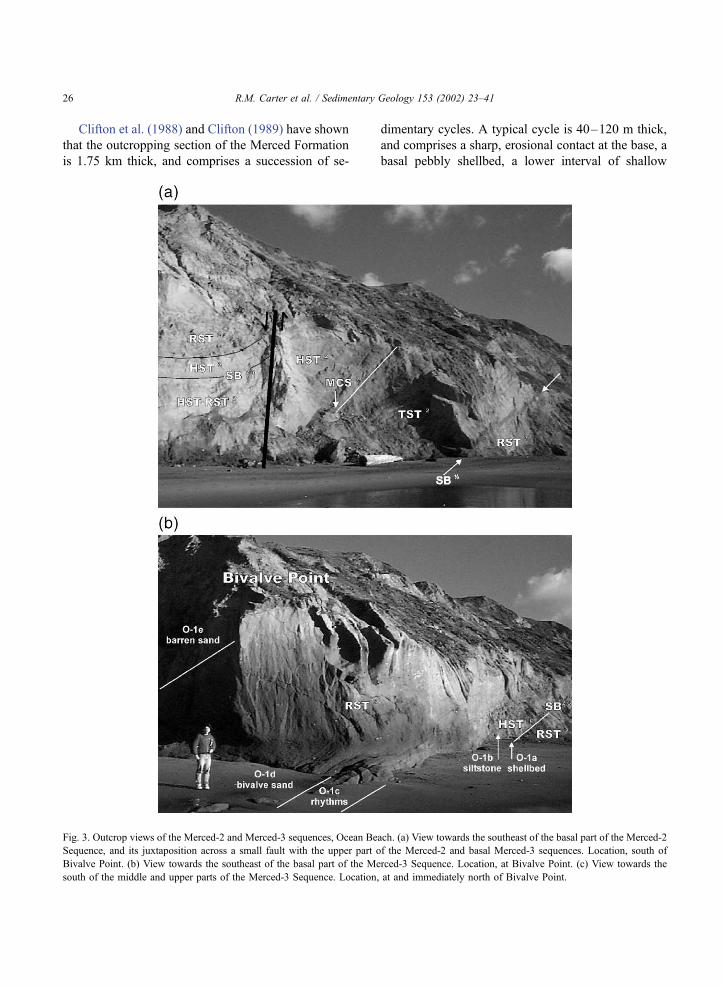
Fig. 3. Outcrop views of the Merced-2 and Merced-3 sequences, Ocean Beach. (a) View towards the southeast of the basal part of the Merced-2
Sequence, and its juxtaposition across a small fault with the upper part of the Merced-2 and basal Merced-3 sequences. Location, south of
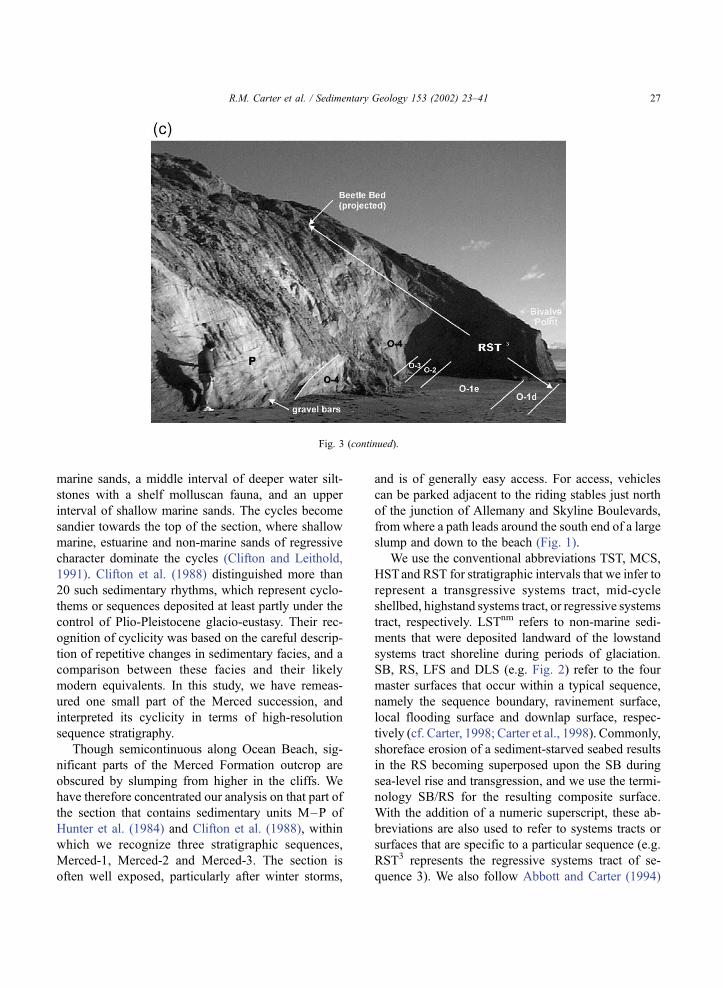
Bivalve Point. (b) View towards the southeast of the basal part of the Merced-3 Sequence. Location, at Bivalve Point. (c) View towards the
south of the middle and upper parts of the Merced-3 Sequence. Location, at and immediately north of Bivalve Point.
R.M. Carter et al. / Sedimentary Geology 153 (2002) 23–4126
marine sands, a middle interval of deeper water silt-
stones with a shelf molluscan fauna, and an upper
interval of shallow marine sands. The cycles become
sandier towards the top of the section, where shallow
marine, estuarine and non-marine sands of regressive
character dominate the cycles (Clifton and Leithold,
1991). Clifton et al. (1988) distinguished more than
20 such sedimentary rhythms, which represent cyclo-
thems or sequences deposited at least partly under the
control of Plio-Pleistocene glacio-eustasy. Their rec-
ognition of cyclicity was based on the careful descrip-
tion of repetitive changes in sedimentary facies, and a
comparison between these facies and their likely
modern equivalents. In this study, we have remeas-
ured one small part of the Merced succession, and
interpreted its cyclicity in terms of high-resolution
sequence stratigraphy.
Though semicontinuous along Ocean Beach, sig-
nificant parts of the Merced Formation outcrop are
obscured by slumping from higher in the cliffs. We
have therefore concentrated our analysis on that part of
the section that contains sedimentary units M–P of
Hunter et al. (1984) and Clifton et al. (1988), within
which we recognize three stratigraphic sequences,
Merced-1, Merced-2 and Merced-3. The section is
often well exposed, particularly after winter storms,
and is of generally easy access. For access, vehicles
can be parked adjacent to the riding stables just north
of the junction of Allemany and Skyline Boulevards,
from where a path leads around the south end of a large
slump and down to the beach (Fig. 1).
We use the conventional abbreviations TST, MCS,
HSTand RST for stratigraphic intervals that we infer to
represent a transgressive systems tract, mid-cycle
shellbed, highstand systems tract, or regressive systems
tract, respectively. LSTnm refers to non-marine sedi-
ments that were deposited landward of the lowstand
systems tract shoreline during periods of glaciation.
SB, RS, LFS and DLS (e.g. Fig. 2) refer to the four
master surfaces that occur within a typical sequence,
namely the sequence boundary, ravinement surface,
local flooding surface and downlap surface, respec-
tively (cf. Carter, 1998; Carter et al., 1998). Commonly,
shoreface erosion of a sediment-starved seabed results
in the RS becoming superposed upon the SB during
sea-level rise and transgression, and we use the termi-
nology SB/RS for the resulting composite surface.
With the addition of a numeric superscript, these ab-
breviations are also used to refer to systems tracts or
surfaces that are specific to a particular sequence (e.g.
RST3 represents the regressive systems tract of se-
quence 3). We also follow Abbott and Carter (1994)
Fig. 3 (continued).
R.M. Carter et al. / Sedimentary Geology 153 (2002) 23–41 27
in recognizing two important types of shellbed within
the Merced succession. Type A shellbeds, which most
often occur immediately above sequence-bounding
ravinement surfaces, are characterised by broken and
eroded shells of shallow water mollusca intermixed
with sandy, well-rounded pebble conglomerate (cf.
Chiocci and Clifton, 1991) of inferred TST origin. In
contrast, Type B shellbeds contain generally deeper
water shelf molluscan species (including some in situ
double-valved bivalves) set in a muddy sand matrix,
and correspond toMCS. Other autocyclic shellbeds can
of course occur within shallow marine sequences. A
critical part of the recognition of sequence-determining
basal TST and MCS shellbeds, therefore, is the correct
identification of their respective lower bounding sur-
faces as significant RS or LFS diastems, together with
the overall nature of the facies packages that the
shellbeds punctuate.
Hunter et al. (1984, Fig. 2) depicted the sedimentary
section across their units M–P as continuous. Though
our remeasured section (Fig. 2) matches their earlier
observations in most features, storms during the
autumn and early winter of 1998 caused fresh erosion
of the cliff face and exposed, perhaps for the first time, a
fault that truncates the top of unit N (Fig. 3a). The
inaccessibility of parts of the cliff, and pervasive
slumping, prevented us from measuring the throw of
this fault directly. However, comparison with the many
other small faults that occur across the section (e.g.
Clifton et al., 1988, Fig. 6.4) suggests that the throw is
unlikely to be more than 5–15 m. Our remeasurement
of this part of the section (Fig. 2) therefore recognizes
two main sequence cycles, Merced-2 (units M1–N of
Hunter et al., 1984, occurring south of the fault; Fig.
3a), and Merced-3 (units O–P of Hunter et al., 1984,
occurring north of the fault; Fig. 3c). The fault appa-
rently does not alter the basic stratigraphy, and acts only
to offset a small (and so far immeasurable) portion of
unit N, that is, the fault is probably located entirely
within the upper HST–RST part of theMerced-2 cycle.
Marine macrofossils are common in the Merced
Formation, particularly in shelf siltstone and lower
shoreface sand facies. They comprise principally mol-
luscan and echinoderm species that are still living, and
are thus of use for palaeoecological determinations but
have little value for age determination. Many of the
molluscan macrofossils are also fragile, and therefore
difficult to extract and identify at species level. Other
means of age determination are also sparse. Clifton et
al. (1988) report that palaeomagnetic determinations
are not possible because of the occurrence of sedi-
ment remagnetization. The major age control on the
sequence, therefore, is provided by the Rockland
tephra that occurs within the top of unit S (Hunter et
al., 1984, Fig. 3), two cycles above the Merced-3 Se-
quence. The established fission track age of 400 ka for
this tephra (Sarna-Wojcicki et al., 1985; Meyer et al.,
1991) has recently been revised, and 40Ar/39Ar dating
now indicates a best age of 614 ka (Lanphere et al.,
1999, 2000). Using the redated Rockland tephra for
guidance, the Merced-3 Sequence was deposited about
800 ka, that is, probably corresponds to interglacial
oxygen isotope stage 19 or 21.
2. Sequence Merced-2
Those parts of units M–N of Hunter et al. (1984,
Fig. 2) that we include in the Merced-2 Sequence, and
that occur to the south of the fault, are 22+ m thick.
Hunter et al. (1984, p. 20) reported that ‘‘a distinctive
gravel 30 cm thick lies in the upper part of unit M1’’.
Large bio-erosional structures at the base of this gravel
appear to be produced by large bivalves, some of which
(Tresus?) are preserved in living position. We take this
pebbly shellbed to mark the base of the Merced-2
Sequence, and its base as a marine ravinement surface
which has been superposed upon, and has eroded, a
former subaerial unconformity.
The superposition of similar facies below (inner
shelf, RST) and above (inner shelf, TST) a sequence
boundary, as in this case (Fig. 2), is not an uncommon
occurrence in successions that represent basinal near-
shore (at highstand) conditions. Indeed, such occur-
rences are a primary cause of ambiguity as to the
correct late-TST, HST or early-RST interpretation of
many Holocene shoreface successions (cf. Larcombe
and Carter, 1998). In older examples, however, iden-
tification is normally aided by the fact that the RST
caps a shoaling–sanding upward succession, and the
TST starts a deepening–fining upward succession.
2.1. Transgressive systems tract
TheMerced-2 cycle commences with a 45-cm-thick
pebbly shellbed (intra-M1) resting on a sharp, un-
R.M. Carter et al. / Sedimentary Geology 153 (2002) 23–4128
dulating surface of erosion with up to 30 cm of pebble
and shell-filled incision (Figs. 2 and 3a). Similar
shellbed bases have been illustrated in Chiocci and
Clifton (1991). The underlying bioturbated, bedded
and cross-bedded concretionary sandstone was inter-
preted as an inner shelf deposit by Hunter et al. (1984,
p. 20), and we treat it as part of the RSTof theMerced-1
Sequence. The basal Merced-2 shellbed contains worn
and broken molluscan shells in a matrix of poorly
sorted, pebbly, medium sand, with occasional pebbles
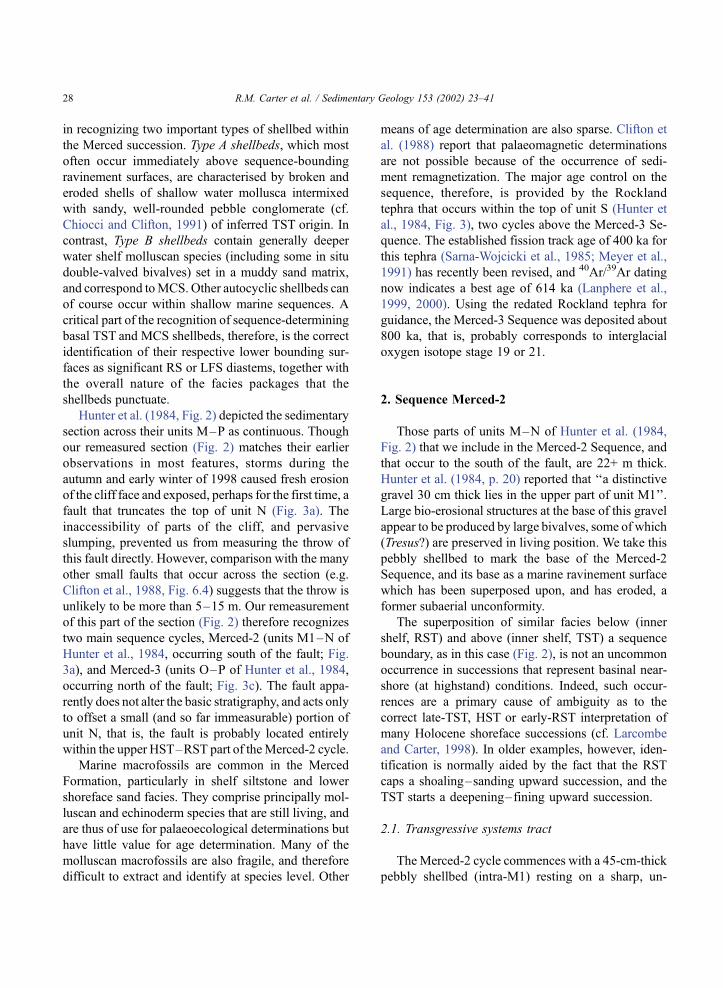
up to 15 cm in diameter (Fig. 4a). Bivalve shells occur
as single valves that are aligned with the bedding and
dominantly preserved convex-side-up. The shellbed is
clearly current deposited, and has a similar appearance
to the Type A shellbeds that characterise the TST of
mid-Pleistocene shellbeds in New Zealand (Abbott and
Carter, 1994). The basal shellbed is overlain by several
rhythms of well-sorted, massive, sandstone, in which
the sharp base of each rhythm is followed by a thin bed
of coarser grained granular or pebbly sand.
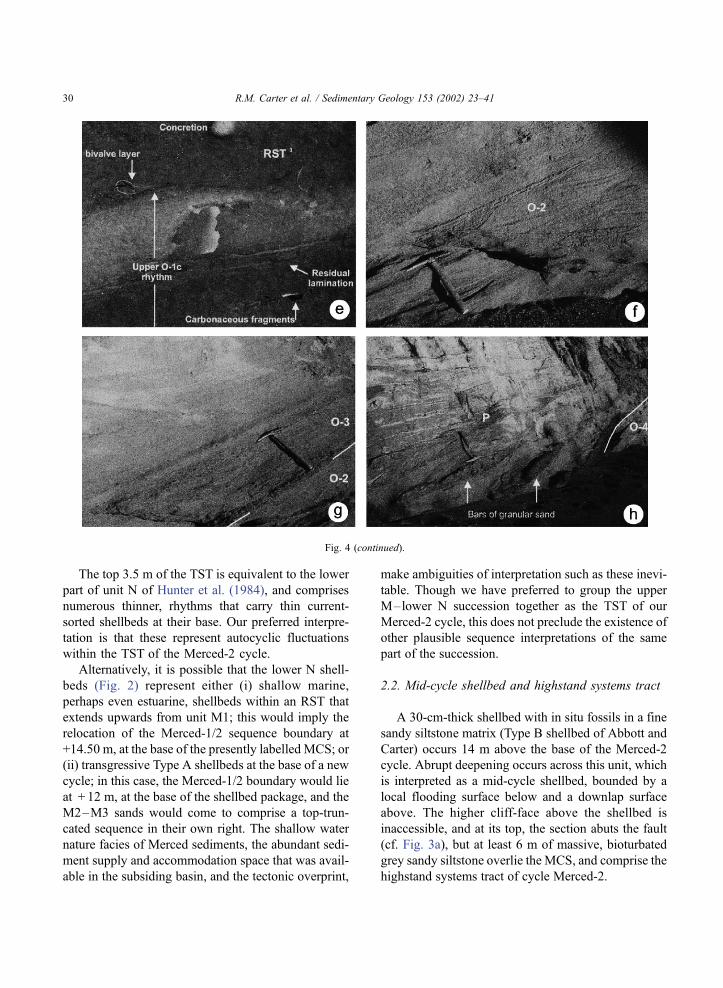
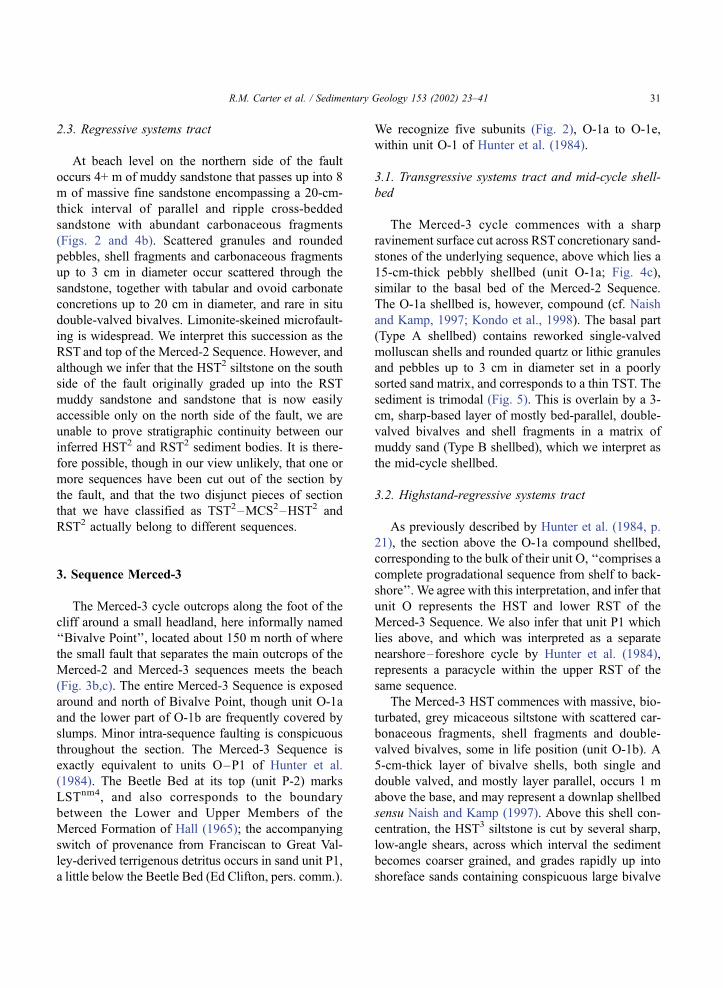
Fig. 4. Outcrop detail of sedimentary units within the Merced-2 and Merced-3 sequences. Hammer, where present, is 30 cm long. (a) Basal Type
A shellbed and pebble layer of the Merced-2 Sequence, resting on an erosive surface on concretionary RST sands of the preceding cycle. (The
apparent angular discrepancy across the sequence boundary is illusory, caused by foreshortening and changing angles of the main surface of
outcrop.) (b) Concretionary bioturbated and bedded sands of the RST of the Merced-2 Sequence. Inset: cluster of Scutellaster from probable
RST3 shoreface sands (fallen block). (c) Basal compound shellbed, including a thin MCS, and overlying HST of the Merced-3 Sequence. Pencil
gives scale. (d) Outcrop view of the HST3–RST3 transition, on the south side of Bivalve Point. Note the discontinuous, current-sorted shell-lens
about 1 m above the O-1c/O-1d unit boundary. (e) Detail of the O-1c/O-1d unit boundary. Note the presence of carbonaceous fragments and
residual lamination in the lower part of the O-1c rhythm, the ‘‘hummocky’’ top of the overlying and better cemented massive sand (light
coloured), and the presence of in situ bivalved molluscs at the base of Unit O-1d. (f) Trough cross-bedded sands of Unit O-2, middle RST3.
(g) Unit O-2/O-3 boundary, with hammer resting on the coarser grained, laminated sand at the base of O-3. (h) Unit O-4/P-1 boundary, with
hammerhead resting on a lens-shaped bar of cross-bedded granular sand.
R.M. Carter et al. / Sedimentary Geology 153 (2002) 23–41 29
The top 3.5 m of the TST is equivalent to the lower
part of unit N of Hunter et al. (1984), and comprises
numerous thinner, rhythms that carry thin current-
sorted shellbeds at their base. Our preferred interpre-
tation is that these represent autocyclic fluctuations
within the TST of the Merced-2 cycle.
Alternatively, it is possible that the lower N shell-
beds (Fig. 2) represent either (i) shallow marine,
perhaps even estuarine, shellbeds within an RST that
extends upwards from unit M1; this would imply the
relocation of the Merced-1/2 sequence boundary at
+14.50 m, at the base of the presently labelled MCS; or
(ii) transgressive Type A shellbeds at the base of a new
cycle; in this case, the Merced-1/2 boundary would lie
at + 12 m, at the base of the shellbed package, and the
M2–M3 sands would come to comprise a top-trun-
cated sequence in their own right. The shallow water
nature facies of Merced sediments, the abundant sedi-
ment supply and accommodation space that was avail-
able in the subsiding basin, and the tectonic overprint,
make ambiguities of interpretation such as these inevi-
table. Though we have preferred to group the upper
M–lower N succession together as the TST of our
Merced-2 cycle, this does not preclude the existence of
other plausible sequence interpretations of the same
part of the succession.
2.2. Mid-cycle shellbed and highstand systems tract
A 30-cm-thick shellbed with in situ fossils in a fine
sandy siltstone matrix (Type B shellbed of Abbott and
Carter) occurs 14 m above the base of the Merced-2
cycle. Abrupt deepening occurs across this unit, which
is interpreted as a mid-cycle shellbed, bounded by a
local flooding surface below and a downlap surface
above. The higher cliff-face above the shellbed is
inaccessible, and at its top, the section abuts the fault
(cf. Fig. 3a), but at least 6 m of massive, bioturbated
grey sandy siltstone overlie the MCS, and comprise the
highstand systems tract of cycle Merced-2.
Fig. 4 (continued).
R.M. Carter et al. / Sedimentary Geology 153 (2002) 23–4130
2.3. Regressive systems tract
At beach level on the northern side of the fault
occurs 4+ m of muddy sandstone that passes up into 8
m of massive fine sandstone encompassing a 20-cm-
thick interval of parallel and ripple cross-bedded
sandstone with abundant carbonaceous fragments
(Figs. 2 and 4b). Scattered granules and rounded
pebbles, shell fragments and carbonaceous fragments
up to 3 cm in diameter occur scattered through the
sandstone, together with tabular and ovoid carbonate
concretions up to 20 cm in diameter, and rare in situ
double-valved bivalves. Limonite-skeined microfault-
ing is widespread. We interpret this succession as the
RST and top of the Merced-2 Sequence. However, and
although we infer that the HST2 siltstone on the south
side of the fault originally graded up into the RST
muddy sandstone and sandstone that is now easily
accessible only on the north side of the fault, we are
unable to prove stratigraphic continuity between our
inferred HST2 and RST2 sediment bodies. It is there-
fore possible, though in our view unlikely, that one or
more sequences have been cut out of the section by
the fault, and that the two disjunct pieces of section
that we have classified as TST2–MCS2–HST2 and
RST2 actually belong to different sequences.
3. Sequence Merced-3
The Merced-3 cycle outcrops along the foot of the
cliff around a small headland, here informally named
‘‘Bivalve Point’’, located about 150 m north of where
the small fault that separates the main outcrops of the
Merced-2 and Merced-3 sequences meets the beach
(Fig. 3b,c). The entire Merced-3 Sequence is exposed
around and north of Bivalve Point, though unit O-1a
and the lower part of O-1b are frequently covered by
slumps. Minor intra-sequence faulting is conspicuous
throughout the section. The Merced-3 Sequence is
exactly equivalent to units O–P1 of Hunter et al.
(1984). The Beetle Bed at its top (unit P-2) marks
LSTnm4, and also corresponds to the boundary
between the Lower and Upper Members of the
Merced Formation of Hall (1965); the accompanying
switch of provenance from Franciscan to Great Val-
ley-derived terrigenous detritus occurs in sand unit P1,
a little below the Beetle Bed (Ed Clifton, pers. comm.).
We recognize five subunits (Fig. 2), O-1a to O-1e,
within unit O-1 of Hunter et al. (1984).
3.1. Transgressive systems tract and mid-cycle shell-
bed
The Merced-3 cycle commences with a sharp
ravinement surface cut across RST concretionary sand-
stones of the underlying sequence, above which lies a
15-cm-thick pebbly shellbed (unit O-1a; Fig. 4c),
similar to the basal bed of the Merced-2 Sequence.
The O-1a shellbed is, however, compound (cf. Naish
and Kamp, 1997; Kondo et al., 1998). The basal part
(Type A shellbed) contains reworked single-valved
molluscan shells and rounded quartz or lithic granules
and pebbles up to 3 cm in diameter set in a poorly
sorted sand matrix, and corresponds to a thin TST. The
sediment is trimodal (Fig. 5). This is overlain by a 3-
cm, sharp-based layer of mostly bed-parallel, double-
valved bivalves and shell fragments in a matrix of
muddy sand (Type B shellbed), which we interpret as
the mid-cycle shellbed.
3.2. Highstand-regressive systems tract
As previously described by Hunter et al. (1984, p.
21), the section above the O-1a compound shellbed,
corresponding to the bulk of their unit O, ‘‘comprises a
complete progradational sequence from shelf to back-
shore’’. We agree with this interpretation, and infer that
unit O represents the HST and lower RST of the
Merced-3 Sequence. We also infer that unit P1 which
lies above, and which was interpreted as a separate
nearshore–foreshore cycle by Hunter et al. (1984),
represents a paracycle within the upper RST of the
same sequence.
The Merced-3 HST commences with massive, bio-
turbated, grey micaceous siltstone with scattered car-
bonaceous fragments, shell fragments and double-
valved bivalves, some in life position (unit O-1b). A
5-cm-thick layer of bivalve shells, both single and
double valved, and mostly layer parallel, occurs 1 m
above the base, and may represent a downlap shellbed
sensu Naish and Kamp (1997). Above this shell con-
centration, the HST3 siltstone is cut by several sharp,
low-angle shears, across which interval the sediment
becomes coarser grained, and grades rapidly up into
shoreface sands containing conspicuous large bivalve
R.M. Carter et al. / Sedimentary Geology 153 (2002) 23–41 31
R.M. Carter et al. / Sedimentary Geology 153 (2002) 23–4132
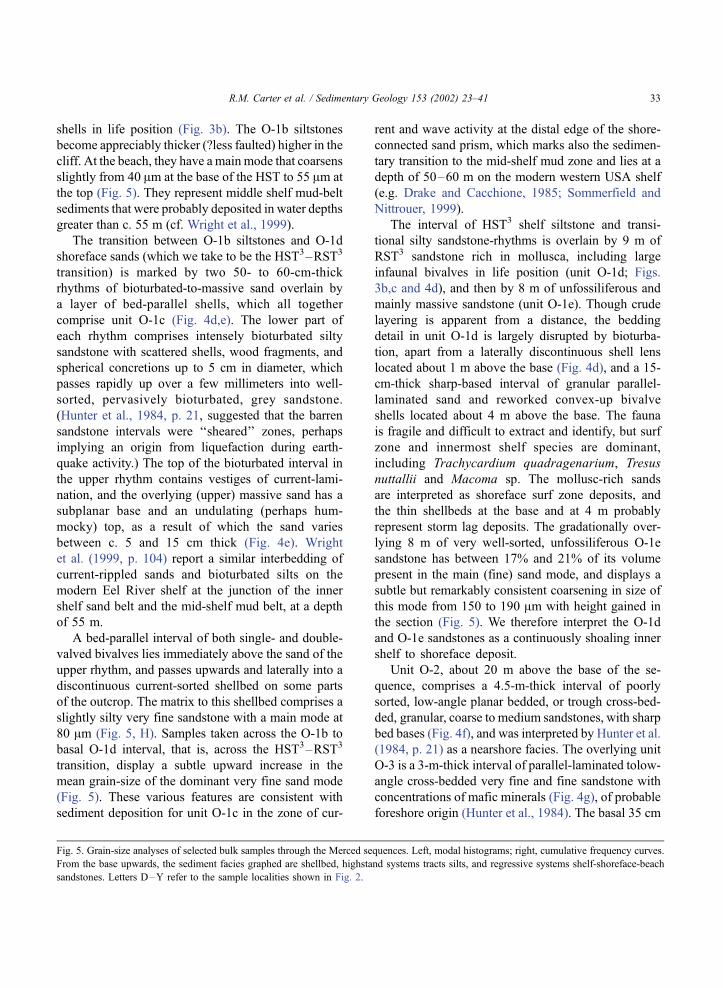
shells in life position (Fig. 3b). The O-1b siltstones
become appreciably thicker (?less faulted) higher in the
cliff. At the beach, they have a main mode that coarsens
slightly from 40 Am at the base of the HST to 55 Am at
the top (Fig. 5). They represent middle shelf mud-belt
sediments that were probably deposited in water depths
greater than c. 55 m (cf. Wright et al., 1999).
The transition between O-1b siltstones and O-1d
shoreface sands (which we take to be the HST3–RST3
transition) is marked by two 50- to 60-cm-thick
rhythms of bioturbated-to-massive sand overlain by
a layer of bed-parallel shells, which all together
comprise unit O-1c (Fig. 4d,e). The lower part of
each rhythm comprises intensely bioturbated silty
sandstone with scattered shells, wood fragments, and
spherical concretions up to 5 cm in diameter, which
passes rapidly up over a few millimeters into well-
sorted, pervasively bioturbated, grey sandstone.
(Hunter et al., 1984, p. 21, suggested that the barren
sandstone intervals were ‘‘sheared’’ zones, perhaps
implying an origin from liquefaction during earth-
quake activity.) The top of the bioturbated interval in
the upper rhythm contains vestiges of current-lami-
nation, and the overlying (upper) massive sand has a
subplanar base and an undulating (perhaps hum-
mocky) top, as a result of which the sand varies
between c. 5 and 15 cm thick (Fig. 4e). Wright
et al. (1999, p. 104) report a similar interbedding of
current-rippled sands and bioturbated silts on the
modern Eel River shelf at the junction of the inner
shelf sand belt and the mid-shelf mud belt, at a depth
of 55 m.
A bed-parallel interval of both single- and double-
valved bivalves lies immediately above the sand of the
upper rhythm, and passes upwards and laterally into a
discontinuous current-sorted shellbed on some parts
of the outcrop. The matrix to this shellbed comprises a
slightly silty very fine sandstone with a main mode at
80 Am (Fig. 5, H). Samples taken across the O-1b to
basal O-1d interval, that is, across the HST3–RST3
transition, display a subtle upward increase in the
mean grain-size of the dominant very fine sand mode
(Fig. 5). These various features are consistent with
sediment deposition for unit O-1c in the zone of cur-
rent and wave activity at the distal edge of the shore-
connected sand prism, which marks also the sedimen-
tary transition to the mid-shelf mud zone and lies at a
depth of 50–60 m on the modern western USA shelf
(e.g. Drake and Cacchione, 1985; Sommerfield and
Nittrouer, 1999).
The interval of HST3 shelf siltstone and transi-
tional silty sandstone-rhythms is overlain by 9 m of
RST3 sandstone rich in mollusca, including large
infaunal bivalves in life position (unit O-1d; Figs.
3b,c and 4d), and then by 8 m of unfossiliferous and
mainly massive sandstone (unit O-1e). Though crude
layering is apparent from a distance, the bedding
detail in unit O-1d is largely disrupted by bioturba-
tion, apart from a laterally discontinuous shell lens
located about 1 m above the base (Fig. 4d), and a 15-
cm-thick sharp-based interval of granular parallel-
laminated sand and reworked convex-up bivalve
shells located about 4 m above the base. The fauna
is fragile and difficult to extract and identify, but surf
zone and innermost shelf species are dominant,
including Trachycardium quadragenarium, Tresus
nuttallii and Macoma sp. The mollusc-rich sands
are interpreted as shoreface surf zone deposits, and
the thin shellbeds at the base and at 4 m probably
represent storm lag deposits. The gradationally over-
lying 8 m of very well-sorted, unfossiliferous O-1e
sandstone has between 17% and 21% of its volume
present in the main (fine) sand mode, and displays a
subtle but remarkably consistent coarsening in size of
this mode from 150 to 190 Am with height gained in
the section (Fig. 5). We therefore interpret the O-1d
and O-1e sandstones as a continuously shoaling inner
shelf to shoreface deposit.
Unit O-2, about 20 m above the base of the se-
quence, comprises a 4.5-m-thick interval of poorly
sorted, low-angle planar bedded, or trough cross-bed-
ded, granular, coarse to medium sandstones, with sharp
bed bases (Fig. 4f), and was interpreted by Hunter et al.
(1984, p. 21) as a nearshore facies. The overlying unit
O-3 is a 3-m-thick interval of parallel-laminated tolow-
angle cross-bedded very fine and fine sandstone with
concentrations of mafic minerals (Fig. 4g), of probable
foreshore origin (Hunter et al., 1984). The basal 35 cm
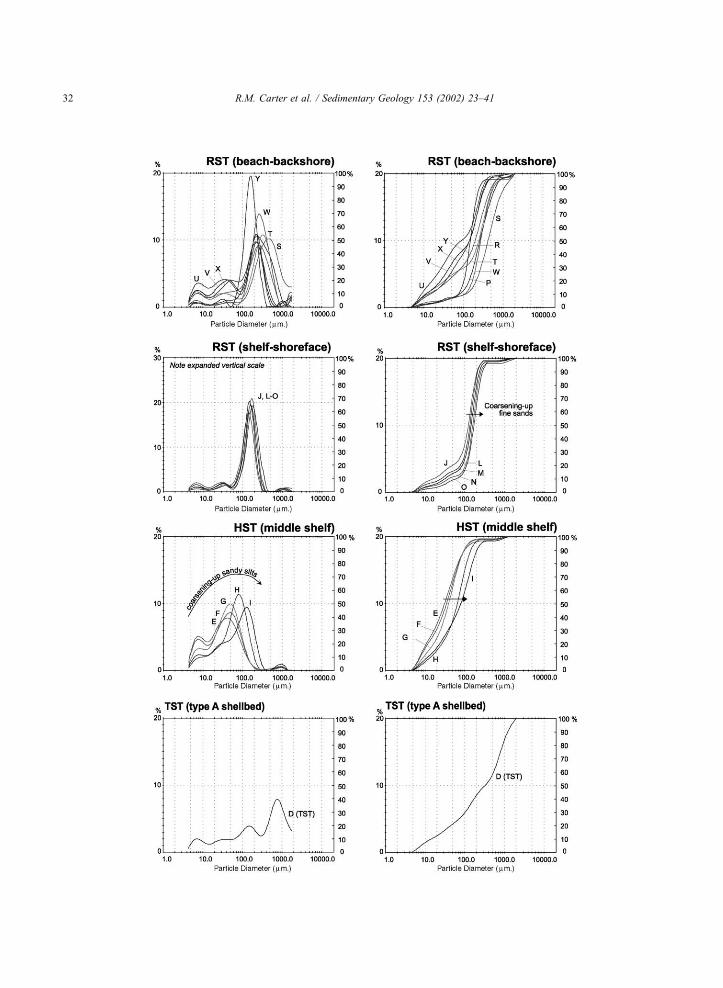
Fig. 5. Grain-size analyses of selected bulk samples through the Merced sequences. Left, modal histograms; right, cumulative frequency curves.
From the base upwards, the sediment facies graphed are shellbed, highstand systems tracts silts, and regressive systems shelf-shoreface-beach
sandstones. Letters D–Y refer to the sample localities shown in Fig. 2.
R.M. Carter et al. / Sedimentary Geology 153 (2002) 23–41 33
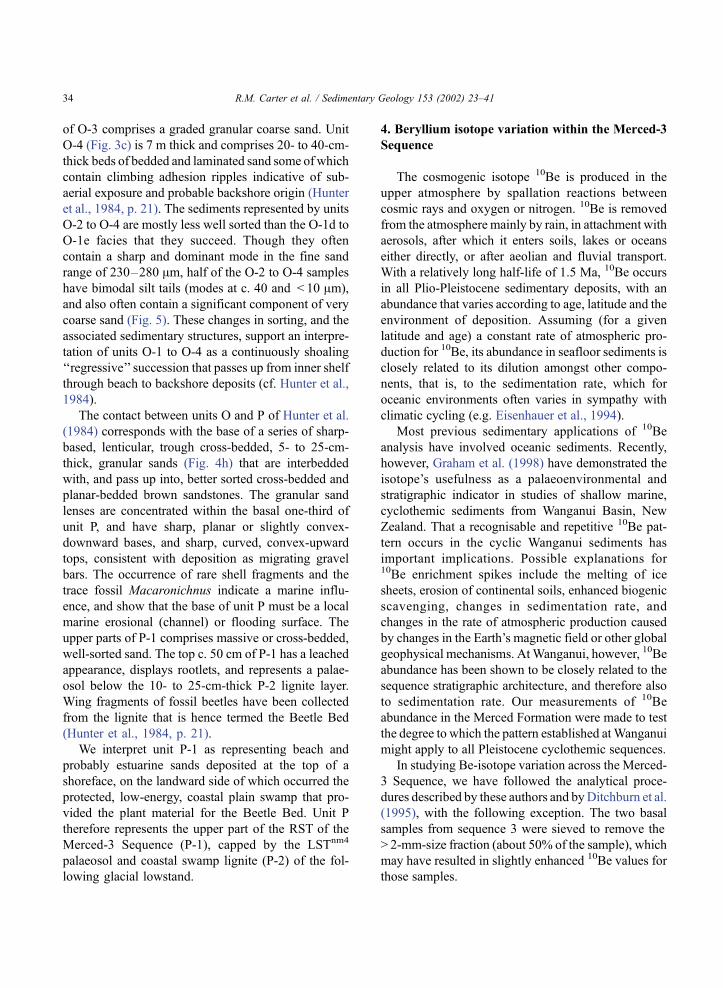
of O-3 comprises a graded granular coarse sand. Unit
O-4 (Fig. 3c) is 7 m thick and comprises 20- to 40-cm-
thick beds of bedded and laminated sand some of which
contain climbing adhesion ripples indicative of sub-
aerial exposure and probable backshore origin (Hunter
et al., 1984, p. 21). The sediments represented by units
O-2 to O-4 are mostly less well sorted than the O-1d to
O-1e facies that they succeed. Though they often
contain a sharp and dominant mode in the fine sand
range of 230–280 Am, half of the O-2 to O-4 samples
have bimodal silt tails (modes at c. 40 and < 10 Am),
and also often contain a significant component of very
coarse sand (Fig. 5). These changes in sorting, and the
associated sedimentary structures, support an interpre-
tation of units O-1 to O-4 as a continuously shoaling
‘‘regressive’’ succession that passes up from inner shelf
through beach to backshore deposits (cf. Hunter et al.,
1984).
The contact between units O and P of Hunter et al.
(1984) corresponds with the base of a series of sharp-
based, lenticular, trough cross-bedded, 5- to 25-cm-
thick, granular sands (Fig. 4h) that are interbedded
with, and pass up into, better sorted cross-bedded and
planar-bedded brown sandstones. The granular sand
lenses are concentrated within the basal one-third of
unit P, and have sharp, planar or slightly convex-
downward bases, and sharp, curved, convex-upward
tops, consistent with deposition as migrating gravel
bars. The occurrence of rare shell fragments and the
trace fossil Macaronichnus indicate a marine influ-
ence, and show that the base of unit P must be a local
marine erosional (channel) or flooding surface. The
upper parts of P-1 comprises massive or cross-bedded,
well-sorted sand. The top c. 50 cm of P-1 has a leached
appearance, displays rootlets, and represents a palae-
osol below the 10- to 25-cm-thick P-2 lignite layer.
Wing fragments of fossil beetles have been collected
from the lignite that is hence termed the Beetle Bed
(Hunter et al., 1984, p. 21).
We interpret unit P-1 as representing beach and
probably estuarine sands deposited at the top of a
shoreface, on the landward side of which occurred the
protected, low-energy, coastal plain swamp that pro-
vided the plant material for the Beetle Bed. Unit P
therefore represents the upper part of the RST of the
Merced-3 Sequence (P-1), capped by the LSTnm4
palaeosol and coastal swamp lignite (P-2) of the fol-
lowing glacial lowstand.
4. Beryllium isotope variation within the Merced-3
Sequence
The cosmogenic isotope 10Be is produced in the
upper atmosphere by spallation reactions between
cosmic rays and oxygen or nitrogen. 10Be is removed
from the atmosphere mainly by rain, in attachment with
aerosols, after which it enters soils, lakes or oceans
either directly, or after aeolian and fluvial transport.
With a relatively long half-life of 1.5 Ma, 10Be occurs
in all Plio-Pleistocene sedimentary deposits, with an
abundance that varies according to age, latitude and the
environment of deposition. Assuming (for a given
latitude and age) a constant rate of atmospheric pro-
duction for 10Be, its abundance in seafloor sediments is
closely related to its dilution amongst other compo-
nents, that is, to the sedimentation rate, which for
oceanic environments often varies in sympathy with
climatic cycling (e.g. Eisenhauer et al., 1994).
Most previous sedimentary applications of 10Be
analysis have involved oceanic sediments. Recently,
however, Graham et al. (1998) have demonstrated the
isotope’s usefulness as a palaeoenvironmental and
stratigraphic indicator in studies of shallow marine,
cyclothemic sediments from Wanganui Basin, New
Zealand. That a recognisable and repetitive 10Be pat-
tern occurs in the cyclic Wanganui sediments has
important implications. Possible explanations for10Be enrichment spikes include the melting of ice
sheets, erosion of continental soils, enhanced biogenic
scavenging, changes in sedimentation rate, and
changes in the rate of atmospheric production caused
by changes in the Earth’s magnetic field or other global
geophysical mechanisms. AtWanganui, however, 10Be
abundance has been shown to be closely related to the
sequence stratigraphic architecture, and therefore also
to sedimentation rate. Our measurements of 10Be
abundance in the Merced Formation were made to test
the degree to which the pattern established atWanganui
might apply to all Pleistocene cyclothemic sequences.
In studying Be-isotope variation across the Merced-
3 Sequence, we have followed the analytical proce-
dures described by these authors and byDitchburn et al.
(1995), with the following exception. The two basal
samples from sequence 3 were sieved to remove the
> 2-mm-size fraction (about 50% of the sample), which
may have resulted in slightly enhanced 10Be values for
those samples.
R.M. Carter et al. / Sedimentary Geology 153 (2002) 23–4134
In their study of mid-latitude, shallow-water, cyclo-
themic Pleistocene sediments from Wanganui, Gra-
ham et al. (1998) established that:
. transgressive shoreface sands (TST) and progra-
dational shelf silts (HST) exhibit low values of 10Be
abundance, of the order of 0.5–1.0� 108 atoms g� 1;
these values represent the local background 10Be
level, and indicate a remarkably uniform rate of
sedimentation, especially for the HST siltstones;
. within each cyclothem, significant 10Be peaks of
2–6� 108 atoms g� 1 occur at the base of mid-cycle
shellbeds (MCS), coincident with the local flooding
surface (LFS), that is, a 10Be peak corresponds pre-
cisely with the surface of inferred maximum sediment
starvation within each cyclothem, and is estimated to
represent a 2- to 4-ka hiatus in sedimentation; a steady
decay of the LFS peaks occurs upwards through each
MCS, with 10Be values reaching the background level
just above the contact with the overlying HST silt-
stone; and
. the ravinement surfaces that separate cylothems
at Wanganui are in general not associated with 10Be
peaks; this is consistent with the inference, already
established from sedimentological study, that marine
erosion at the ravinement surfaces has removed any
soil or non-marine sediment that formerly marked the
underlying sequence boundary.
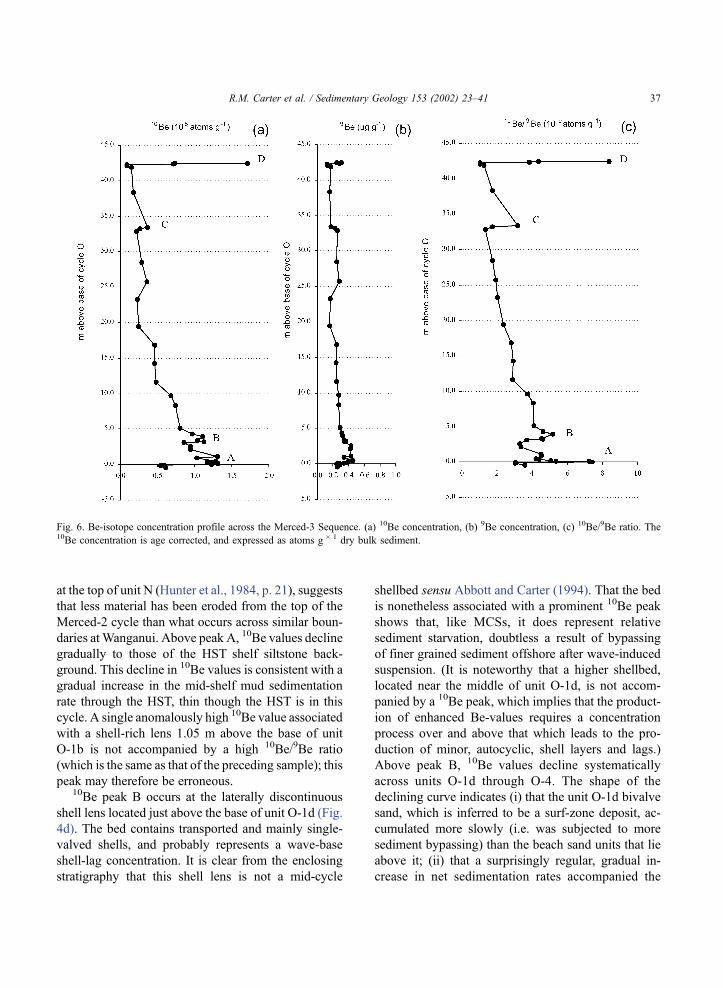
We have analysed for Be-isotopes through the
Merced-3 Sequence (Figs. 2 and 6; Table 1). A
systematic pattern of variation in 10Be abundance
occurs, but with peaks located at different levels to
those established for the Wanganui cyclothems. We
note the following characteristics of the 10Be pattern
across the Merced-3 Sequence:
. a level of 0.94� 108 atoms g� 1 of 10Be char-
acterizes the HST mid-shelf silts (unit O-1b), com-
pared with the low background level of 0.22� 108
atoms g� 1 of 10Be that characterizes upper shoreface
sands in the same cycle (top of unit O-4);
. major 10Be peaks occur near both the upper and
lower sequence boundaries; peak A of 1.3� 108
atoms g� 1 of 10Be is associated with the unit O-1a
shellbed that rests on the basal ravinement surface/
sequence boundary, and values up to 1.7� 108 atoms
g� 1 of 10Be characterize peak D that lies in the Beetle
Bed lignite (unit P-2), at the upper sequence boundary;
. a slightly lower peak (B) of 1.1�108 atoms
g� 1 of 10Be occurs near the HST/RST boundary, in
the lagged shell lens that occurs just above the base of
bivalve sand unit O-1d;
. the major (RST) part of the cycle is characterized
by a gradual diminution of 10Be values from those of
the basal O-1d high to those at background level in
upper unit O-4; minor steps occur in this diminution
(i) at the top of the unit O-1d bivalve sand, and (ii) at
the base of the P1 beach sand paracycle at the top of
the Merced-3 Sequence.
. these major characteristics of 10Be variation
across the succession are mirrored by the 10Be/9Be
curve, which is, however, smoother and has better
defined peaks (Fig. 6). This is because the effects on10Be abundance of variations in grain size and carbo-
nate content are largely eliminated by use of the10Be/9Be ratio.
. significant variations also occur in the 9Be plot, in
particular the increase in 9Be that occurs in the three
samples from the Beetle Bed, and which may relate to
an enhanced availability of 9Be after the advanced
chemical weathering caused by soil and lignite for-
mation. Other increases in 9Be appear unsystematic,
for instance in unit O1b, an increase in 9Be is asso-
ciated with a decrease in 10Be, whereas the converse is
true for the sample from the base of unit P1.
It is evident from this pattern that, as already
established for Wanganui cyclothems, the 10Be sig-
nature of the Merced-3 Sequence reflects well the
sequence stratigraphic architecture, and the absolute10Be values follow closely the cycle trends in sedi-
mentary facies and grain size. Thus, 10Be content may
be used as a proxy for sediment accumulation rate
(Graham et al., 1998). Consistent with this, 10Be
peaks are associated with shellbeds and lignites, both
of which have slow sedimentation rates, whereas
background 10Be values characterize terrigenous shelf
siltstones and shoreface sands.10Be peak A occurs within the Type A transgres-
sive shellbed that marks the base of the Merced-3
Sequence (Fig. 4c). Similar transgressive shellbeds at
Wanganui (the Kaikokopu and Kupe Formation shell-
beds, Graham et al., 1998, Fig. 3) do not display 10Be
enrichment. We interpret this as indicating that the10Be enrichment in Merced unit O-1a results from the
concentration within the shellbed of material eroded
from the 10Be-rich former top of underlying cycle N.
This, together with (i) the very thin, reworked nature
of unit O-1a, and (ii) the presence of inner shelf sand
R.M. Carter et al. / Sedimentary Geology 153 (2002) 23–41 35
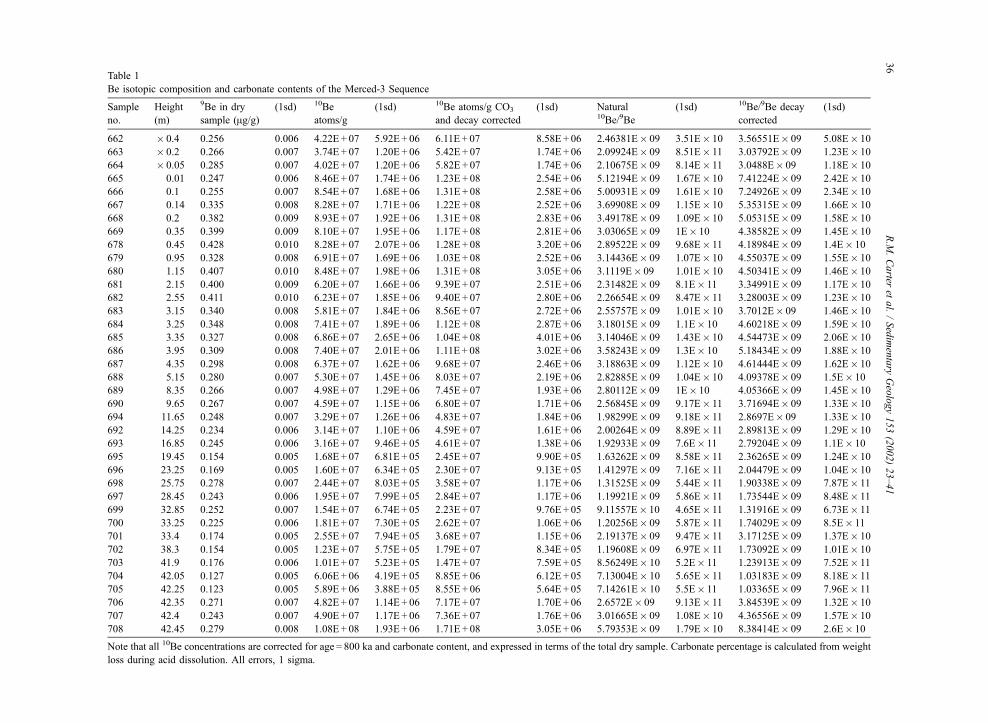
Table 1
Be isotopic composition and carbonate contents of the Merced-3 Sequence
Sample
no.
Height
(m)
9Be in dry
sample (Ag/g)(1sd) 10Be
atoms/g
(1sd) 10Be atoms/g CO3
and decay corrected
(1sd) Natural10Be/9Be
(1sd) 10Be/9Be decay
corrected
(1sd)
662 � 0.4 0.256 0.006 4.22E + 07 5.92E+ 06 6.11E+ 07 8.58E + 06 2.46381E� 09 3.51E� 10 3.56551E� 09 5.08E� 10
663 � 0.2 0.266 0.007 3.74E + 07 1.20E+ 06 5.42E + 07 1.74E + 06 2.09924E� 09 8.51E� 11 3.03792E� 09 1.23E� 10
664 � 0.05 0.285 0.007 4.02E + 07 1.20E+ 06 5.82E + 07 1.74E + 06 2.10675E� 09 8.14E� 11 3.0488E� 09 1.18E� 10
665 0.01 0.247 0.006 8.46E + 07 1.74E+ 06 1.23E + 08 2.54E + 06 5.12194E� 09 1.67E� 10 7.41224E� 09 2.42E� 10
666 0.1 0.255 0.007 8.54E + 07 1.68E+ 06 1.31E + 08 2.58E + 06 5.00931E� 09 1.61E� 10 7.24926E� 09 2.34E� 10
667 0.14 0.335 0.008 8.28E + 07 1.71E+ 06 1.22E + 08 2.52E + 06 3.69908E� 09 1.15E� 10 5.35315E� 09 1.66E� 10
668 0.2 0.382 0.009 8.93E + 07 1.92E+ 06 1.31E + 08 2.83E + 06 3.49178E� 09 1.09E� 10 5.05315E� 09 1.58E� 10
669 0.35 0.399 0.009 8.10E + 07 1.95E+ 06 1.17E + 08 2.81E + 06 3.03065E� 09 1E� 10 4.38582E� 09 1.45E� 10
678 0.45 0.428 0.010 8.28E + 07 2.07E+ 06 1.28E + 08 3.20E + 06 2.89522E� 09 9.68E� 11 4.18984E� 09 1.4E� 10
679 0.95 0.328 0.008 6.91E + 07 1.69E+ 06 1.03E + 08 2.52E + 06 3.14436E� 09 1.07E� 10 4.55037E� 09 1.55E� 10
680 1.15 0.407 0.010 8.48E + 07 1.98E+ 06 1.31E + 08 3.05E + 06 3.1119E� 09 1.01E� 10 4.50341E� 09 1.46E� 10
681 2.15 0.400 0.009 6.20E + 07 1.66E+ 06 9.39E + 07 2.51E + 06 2.31482E� 09 8.1E� 11 3.34991E� 09 1.17E� 10
682 2.55 0.411 0.010 6.23E + 07 1.85E+ 06 9.40E + 07 2.80E + 06 2.26654E� 09 8.47E� 11 3.28003E� 09 1.23E� 10
683 3.15 0.340 0.008 5.81E + 07 1.84E+ 06 8.56E + 07 2.72E + 06 2.55757E� 09 1.01E� 10 3.7012E� 09 1.46E� 10
684 3.25 0.348 0.008 7.41E + 07 1.89E+ 06 1.12E + 08 2.87E + 06 3.18015E� 09 1.1E� 10 4.60218E� 09 1.59E� 10
685 3.35 0.327 0.008 6.86E + 07 2.65E+ 06 1.04E + 08 4.01E + 06 3.14046E� 09 1.43E� 10 4.54473E� 09 2.06E� 10
686 3.95 0.309 0.008 7.40E + 07 2.01E+ 06 1.11E+ 08 3.02E + 06 3.58243E� 09 1.3E� 10 5.18434E� 09 1.88E� 10
687 4.35 0.298 0.008 6.37E + 07 1.62E+ 06 9.68E + 07 2.46E + 06 3.18863E� 09 1.12E� 10 4.61444E� 09 1.62E� 10
688 5.15 0.280 0.007 5.30E + 07 1.45E+ 06 8.03E + 07 2.19E + 06 2.82885E� 09 1.04E� 10 4.09378E� 09 1.5E� 10
689 8.35 0.266 0.007 4.98E + 07 1.29E+ 06 7.45E + 07 1.93E + 06 2.80112E� 09 1E� 10 4.05366E� 09 1.45E� 10
690 9.65 0.267 0.007 4.59E + 07 1.15E+ 06 6.80E + 07 1.71E + 06 2.56845E� 09 9.17E� 11 3.71694E� 09 1.33E� 10
694 11.65 0.248 0.007 3.29E + 07 1.26E+ 06 4.83E + 07 1.84E + 06 1.98299E� 09 9.18E� 11 2.8697E� 09 1.33E� 10
692 14.25 0.234 0.006 3.14E + 07 1.10E+ 06 4.59E + 07 1.61E + 06 2.00264E� 09 8.89E� 11 2.89813E� 09 1.29E� 10
693 16.85 0.245 0.006 3.16E + 07 9.46E+ 05 4.61E + 07 1.38E + 06 1.92933E� 09 7.6E� 11 2.79204E� 09 1.1E� 10
695 19.45 0.154 0.005 1.68E + 07 6.81E+ 05 2.45E + 07 9.90E + 05 1.63262E� 09 8.58E� 11 2.36265E� 09 1.24E� 10
696 23.25 0.169 0.005 1.60E + 07 6.34E+ 05 2.30E + 07 9.13E + 05 1.41297E� 09 7.16E� 11 2.04479E� 09 1.04E� 10
698 25.75 0.278 0.007 2.44E + 07 8.03E+ 05 3.58E + 07 1.17E + 06 1.31525E� 09 5.44E� 11 1.90338E� 09 7.87E� 11
697 28.45 0.243 0.006 1.95E + 07 7.99E+ 05 2.84E + 07 1.17E + 06 1.19921E� 09 5.86E� 11 1.73544E� 09 8.48E� 11
699 32.85 0.252 0.007 1.54E + 07 6.74E+ 05 2.23E + 07 9.76E + 05 9.11557E� 10 4.65E� 11 1.31916E� 09 6.73E� 11
700 33.25 0.225 0.006 1.81E + 07 7.30E+ 05 2.62E + 07 1.06E + 06 1.20256E� 09 5.87E� 11 1.74029E� 09 8.5E� 11
701 33.4 0.174 0.005 2.55E + 07 7.94E+ 05 3.68E + 07 1.15E + 06 2.19137E� 09 9.47E� 11 3.17125E� 09 1.37E� 10
702 38.3 0.154 0.005 1.23E + 07 5.75E+ 05 1.79E + 07 8.34E + 05 1.19608E� 09 6.97E� 11 1.73092E� 09 1.01E� 10
703 41.9 0.176 0.006 1.01E + 07 5.23E+ 05 1.47E + 07 7.59E + 05 8.56249E� 10 5.2E� 11 1.23913E� 09 7.52E� 11
704 42.05 0.127 0.005 6.06E + 06 4.19E+ 05 8.85E + 06 6.12E + 05 7.13004E� 10 5.65E� 11 1.03183E� 09 8.18E� 11
705 42.25 0.123 0.005 5.89E + 06 3.88E+ 05 8.55E + 06 5.64E + 05 7.14261E� 10 5.5E� 11 1.03365E� 09 7.96E� 11
706 42.35 0.271 0.007 4.82E + 07 1.14E+ 06 7.17E + 07 1.70E + 06 2.6572E� 09 9.13E� 11 3.84539E� 09 1.32E� 10
707 42.4 0.243 0.007 4.90E + 07 1.17E+ 06 7.36E + 07 1.76E + 06 3.01665E� 09 1.08E� 10 4.36556E� 09 1.57E� 10
708 42.45 0.279 0.008 1.08E + 08 1.93E+ 06 1.71E + 08 3.05E + 06 5.79353E� 09 1.79E� 10 8.38414E� 09 2.6E� 10
Note that all 10Be concentrations are corrected for age = 800 ka and carbonate content, and expressed in terms of the total dry sample. Carbonate percentage is calculated from weight
loss during acid dissolution. All errors, 1 sigma.
R.M
.Carter
etal./Sedimentary
Geology153(2002)23–41
36
at the top of unit N (Hunter et al., 1984, p. 21), suggests
that less material has been eroded from the top of the
Merced-2 cycle than what occurs across similar boun-
daries at Wanganui. Above peak A, 10Be values decline
gradually to those of the HST shelf siltstone back-
ground. This decline in 10Be values is consistent with a
gradual increase in the mid-shelf mud sedimentation
rate through the HST, thin though the HST is in this
cycle. A single anomalously high 10Be value associated
with a shell-rich lens 1.05 m above the base of unit
O-1b is not accompanied by a high 10Be/9Be ratio
(which is the same as that of the preceding sample); this
peak may therefore be erroneous.10Be peak B occurs at the laterally discontinuous
shell lens located just above the base of unit O-1d (Fig.
4d). The bed contains transported and mainly single-
valved shells, and probably represents a wave-base
shell-lag concentration. It is clear from the enclosing
stratigraphy that this shell lens is not a mid-cycle
shellbed sensu Abbott and Carter (1994). That the bed
is nonetheless associated with a prominent 10Be peak
shows that, like MCSs, it does represent relative
sediment starvation, doubtless a result of bypassing
of finer grained sediment offshore after wave-induced
suspension. (It is noteworthy that a higher shellbed,
located near the middle of unit O-1d, is not accom-
panied by a 10Be peak, which implies that the product-
ion of enhanced Be-values requires a concentration
process over and above that which leads to the pro-
duction of minor, autocyclic, shell layers and lags.)
Above peak B, 10Be values decline systematically
across units O-1d through O-4. The shape of the
declining curve indicates (i) that the unit O-1d bivalve
sand, which is inferred to be a surf-zone deposit, ac-
cumulated more slowly (i.e. was subjected to more
sediment bypassing) than the beach sand units that lie
above it; (ii) that a surprisingly regular, gradual in-
crease in net sedimentation rates accompanied the
Fig. 6. Be-isotope concentration profile across the Merced-3 Sequence. (a) 10Be concentration, (b) 9Be concentration, (c) 10Be/9Be ratio. The10Be concentration is age corrected, and expressed as atoms g� 1 dry bulk sediment.
R.M. Carter et al. / Sedimentary Geology 153 (2002) 23–41 37
deposition of the prograding RST shoreface repre-
sented by units O-1e to O-4; and (iii) that a sharp basal
increase of 10Be (peak C) followed by a decline to
background values marks the unit P-1 beach sand,
which therefore corresponds to a minor depositional
paracycle within the top part of theMerced-3 Sequence.10Be peak D is defined by three samples with
sharply increasing values that are located at the very
top of the Merced-3 Sequence, within the Beetle Bed
lignite. The Merced-3/Merced-4 sequence boundary is
here marked by unconsolidated beach sand of cycle Q
that rests directly on the Beetle Bed. Thus, and
unusually for most of the Plio-Pleistocene sequences
described to date (cf. Abbott, 1992), the Beetle Bed
represents the preservation at the sequence boundary
of sediments that accumulated during a glacial LSTnm
environment. Not surprisingly, given that 10Be is
known to concentrate at the land surface and in soils
(e.g. Barg et al., 1997), a high concentration of 10Be
occurs, with a peak just below the sequence boundary
that reaches about 20 times the background level that
characterizes the underlying, near-contemporaneous
shoreface sand.
In summary, the 10Be profile across the Merced-3
Sequence (Fig. 6) demonstrates the presence of sig-
nificant 10Be peaks associated with both the lower and
upper sequence boundaries. The lower peak (A) is
assumed to be reworked, because it corresponds to
high values within the transgressive Type A shellbed
that marks the base of the cycle. The upper peak (D)
marks lignite accumulation, and 10Be concentration,
within a glacial coastal plain swamp. Between these
peaks, a further 10Be concentration (peak B) occurs
within a shellbed near the base of the RST, and is in-
ferred to have been caused by wave-suspension bypas-
sing. 10Be values throughout the rest of the Merced-3
Sequence exhibit three trends of gradual decline, one
within HST shelf silts and two within RST shoreface
sands, each of which is inferred to represent a subcycle
of increasing sedimentation rate.
5. Discussion of sequence stratigraphic significance
The shallow water sedimentary cycles preserved
within the Merced Formation are typical of deposits
laid down under the influence of the high-frequency
glacio-eustatic sea-level changes of the Plio-Pleisto-
cene (Clifton, 1988; Clifton et al., 1988). Each cycle
represents a stratigraphic sequence if it can be shown
to be bounded below and above by unconformities
that correspond to sea-level withdrawal during the
preceding and ensuing glacial periods. Though Clifton
(1989) noted the rarity of unequivocal sequence
boundaries of this type within the Merced Formation,
we suggest that such boundaries can be inferred
within the Merced-1 to Merced-3 part of the succes-
sion. Within the sequences thus defined, characteristic
sedimentary lithofacies succeed one another in a
predictable order, and can be grouped into genetic
systems tracts (Payton, 1977). In general, Plio-Pleis-
tocene shallow marine sequences comprise, in ascend-
ing order, a transgressive systems tract, a mid-cycle
shellbed, a highstand systems tract, and sometimes a
regressive systems tract (Abbott and Carter, 1994;
Naish and Kamp, 1997).
We interpret the basal surfaces of the Merced-2 and
Merced-3 sequences as marine ravinement surfaces
that have been superposed upon the original sequence
boundaries during post-glacial shoreline transgression.
In contrast, an in situ sequence boundary is represented
by the LSTnm4 Beetle Bed and its subjacent palaeosol,
which is preserved at the top of the Merced-3 cycle.
The basal shellbed of Merced-2, and the lower part
of the basal shellbed from Merced-3, are similar to the
Type A shellbeds described by Abbott and Carter
(1994) from the TSTs of New Zealand Pleistocene
cyclothems. Similar shellbeds from late Pliocene
sequences in the Rangitikei Valley were termed onlap
shellbeds by Naish and Kamp (1997), and represent
transgressive lag deposits formed by shoreface ero-
sion and cannibalisation during rapid marine trans-
gression (Abbott, 1998). The overlying well-sorted
sands of the lower part of the Merced-2 cycle are of
shoreface origin, and comprise the TST.
The Type B shellbeds that mark the middle of both
the Merced-2 and Merced-3 cycles are bounded by
inferred local flooding surfaces below and downlap
surfaces above, and correspond to the mid-cycle shell-
beds (MCS) described from New Zealand (Abbott and
Carter, 1994; Abbott, 1997). AMCS is the sedimentary
pivot around which a typical inner shelf glacio-eustatic
cyclothem is organised; transgressive sediments depos-
ited during a rising sea level lie below, and highstand
and regressive sediments, deposited mostly during a
static or falling sea level, lie above. After the landward
R.M. Carter et al. / Sedimentary Geology 153 (2002) 23–4138
movement of the shore-connected sedimentary prism
that is manifested by the local flooding surface, sedi-
ment starvation occurs on the middle shelf and beyond.
In such a setting, in situ or near situ shellbeds develop,
which are dominated by shellground taxa but which
also have an accompanying infauna living in patches of
soft-bottom between areas of shell accumulation
(Abbott and Carter, 1997). Such shellbeds have been
interpreted as backlap shellbeds by Naish and Kamp
(1997).
In keeping with this interpretation, in the Merced-3
Sequence, the deepest water siltstones (O-1b) occur
immediately above the MCS, and are followed by an
almost 40-m-thick, continuously shoaling, regressive
sedimentary sequence (RST). As described earlier by
Hunter et al. (1984), all the major environments that
characterize the modern Californian inner shelf and
shoreface are superposed in the Merced-3 cycle in
vertical Waltherian order (Fig. 2): coarsening upward,
middle shelf siltstones (O-1b to O-1c); a thin zone of
wave-base winnowed sediment (basal O-1d shell lens);
a zone of sandstone with in situ bivalved clams (O-1d;
surf zone shoreface); a unit of coarsening upward, very
well-sorted massive sandstones (O-1e; lower beach);
low-angle planar cross-bedded or trough cross-bedded,
coarse to medium sandstone (O-2; middle–upper
beach); laminated fine sand with mafic mineral con-
centrations along low-angle, tabular cross-sets (O-3;
upper beach); rhythmic, slightly silty sandstones with
climbing adhesion ripple marks (O-4; upper beach to
backshore); cross-bedded beach sand with bars of
granular sand (P1; estuarine flats and beach); and a
palaeosol capped by thin lignite (Beetle Bed; coastal
swamp).
The development of such a thick, continuously
regressive, sedimentary cycle requires the presence of
a substantial terrigenous sediment supply, and a static
or falling sea level. Naish and Kamp (1997) have
shown that the upper sandy parts of similar thick,
continuously regressive sequences from New Zealand
late Pliocene cyclothems were probably deposited
during post-highstand sea-level fall, and comprise
regressive systems tracts (RST). By analogy, we infer
that the upper part of the Merced-2 and Merced-3
cycles, and of the other similar Merced cycles de-
scribed by Hunter et al. (1984), represent RSTs. In any
particular cycle, the boundary between the HST and
RST is arbitrary and generally gradational. For the
Merced-3 Sequence, we judge that it is best corre-
sponds to unit O-1c, which marks the transition
between mainly aggradational shelf siltstones below
(O-1b) and the progradational, sandy, shoreface sands
above (O-1d and higher units). As reported also by
Naish and Kamp (1997) for many New Zealand RSTs,
and given the high sediment supply that characterises
the Merced cycles, there is no necessary ‘‘regressive
surface of erosion’’ at the base of individual RSTs.
The emplacement at the top of the Merced-3 Se-
quence of the unit P-1 beach sand with an erosive base
and basal gravel bars, followed by development on top
of the beach of a palaeosol and lignite, marks a final
marine influence that was followed by subaerial ero-
sion and the development of non-marine coastal plain
sedimentation. Unit P was interpreted as a thin but full
cycle in its own right by Hunter et al. (1984). Though
such an interpretation may be correct, given that the
typical thickness of a Merced cyclothem is several tens
of metres, we prefer to treat unit P as a final sedimen-
tary pulse, or paracycle, within the Merced-3 cycle.
Sequence motifs similar to those we have de-
scribed from the Merced Formation are also known
from the Plio-Pleistocene of New Zealand. In partic-
ular, the Merced-2 Sequence, with its well-sorted TST
sands, and probably continuous HST–RST, is similar
to the Seafield Motif cyclothem of Saul et al. (1999;
note, however, that any RST sands have been eroded
from the top of the type example of the Seafield
Motif). The Merced-3 Sequence, with a basal com-
pound shellbed in which the TST is represented only
by a thin, reworked shell and pebble layer, and with a
thick and continuous HST–RST, is similar to the
Rangitikei Motif cyclothem described by Naish and
Kamp (1997).
Continental shelf sequences similar to those of the
Merced Formation are now known from New Zealand
(Fleming, 1953; Vella, 1963; Abbott et al., 1989; Ab-
bott and Carter, 1994), Japan (Tokuhashi and Kondo,
1989; Kitamura andKondo, 1990; Ito, 1992), Italy (Rio
et al., 1996), and most recently Taiwan (Chen et al.,
2001). Many of these authors have also shown that
sequences deposited landward of the lowstand shore-
line each correspond to an interglacial (odd-numbered)
oxygen isotope stage. Studies of such Plio-Pleistocene
glacio-eustatic sequences have the potential to contrib-
ute greatly to our understanding of how sedimentary se-
quencesaredeposited ingeneral (e.g.Carteretal.,1998).
R.M. Carter et al. / Sedimentary Geology 153 (2002) 23–41 39
6. Conclusions
The exposure above sea level of a thick sequence of
middle Pleistocene marine sediments is unusual, in that
it requires a tectonic subsidence–uplift cycle on a scale
of hundreds of metres within a time scale of only a few
hundred thousand years (Saul et al., 1999). Such
conditions are generally restricted to plate boundary
areas, which is why the best known examples of Plio-
Pleistocene sequence stratigraphy come from Japan
and New Zealand. The sedimentary and tectonic cycles
in each case are those of a consuming plate margin, in
both forearc and backarc settings. The Merced For-
mation is located in a different tectonic setting, that of a
conservative, transform-fault margin. The Merced For-
mation is important both for that reason, and also
because it provides a rare onland example in North
America of thick, cyclic, marine Pleistocene sediment.
Studies of 10Be concentration within the Merced-3
Sequence, and in similar cyclothems from New Zea-
land, show that the abundance of 10Be is an accurate
indicator of sequence stratigraphic architecture, and
that it varies closely in sympathy with changes in in-
ferred sedimentation rate.
Acknowledgements
Financial support for this research was provided by
the Australian Research Council. We thank Alan Beu
for his help with fossil identification, Bob Ditchburn
and Albert Zondervan for performing the 10Be
analyses, Ed Clifton and Al Hine for their critical
comments on the draft manuscript, and Helen and Bill
Lindqvist for their warm hospitality. We particularly
appreciate the kindness shown to us by Ralph Hunter,
who introduced RMC to the Merced section in the field
in 1994, and Ed Clifton, who generously provided a
copy of his unpublished detailed measured section of
the units M–P part of the succession, and showed great
patience in suggesting many improvements to succes-
sive manuscript drafts.
References
Abbott, S.T., 1992. The mid-Pleistocene Waiomio Shellbed (c. 500–
600 ky), Wanganui Basin, New Zealand. Alcheringa 16, 171–
180.
Abbott, S.T., 1997. Mid-cycle condensed shellbeds from mid-Pleis-
tocene cyclothems, New Zealand: implications for sequence
architecture. Sedimentology 44, 805–824.
Abbott, S.T., 1998. Transgressive systems tracts and onlap shellbeds
from mid-Pleistocene sequences, Wanganui Basin, New Zea-
land. J. Sediment. Res. 68, 253–268.
Abbott, S.T., Carter, R.M., 1994. The sequence architecture of mid-
Pleistocene (0.35–0.95 Ma) cyclothems from New Zealand:
facies development during a period of known orbital control
on sea-level cyclicity. In: de Boer, P.L., Smith, D.G. (Eds.),
Orbital Forcing and Cyclic Sequences, Int. Assoc. Sedimentol.,
Spec. Publ., vol. 19. Blackwell Scientific, Oxford, pp. 367–394.
Abbott, S.T., Carter, R.M., 1997. Macrofossil associations from
mid-Pleistocene cyclothems, Castlecliff section, New Zealand:
implications for sequence stratigraphy. Palaios 12, 182–210.
Abbott, S.T., Haywick, D.W., Carter, R.M., Henderson, R.A., 1989.
Facies signature of late Neogene eustatic sea-level fluctuations
exemplified in Plio-Pleistocene cyclothems, North Island, New
Zealand. 28th Int. Geol. Cong., Washington (D.C.), Abstr., pp.
1–2.
Barg, E., Lal, D., Pavick, M.J., Caffee, M.W., Southon, J.R., 1997.
Beryllium geochemistry in soils: evaluation of 10Be/9Be ratios
in authigenic minerals as a basis for age models. Chem. Geol.
140, 237–258.
Carter, R.M., 1998. Two models: global sea-level change and se-
quence stratigraphic architecture. Sediment. Geol. 122, 23–36.
Carter, R.M., Naish, T.R., Ito, M., Pillans, B.J. (Eds.), 1998.
Sequence stratigraphy in the Plio-Pleistocene: an evaluation.
Sediment. Geol., Spec. Issue, vol. 122. Elsevier, Amsterdam,
pp. 1–284.
Chen, W.-S., Ridgway, K.D., Horng, C.-S., Chen, Y.-G., Shea, K.-S.,
Yeh, M.-G., 2001. Stratigraphic architecture, magnetostratigra-
phy, and incised-valley systems of Pliocene–Pleistocene colli-
sional marine foreland basin of Taiwan. Geol. Soc. Am. Bull.
113, 1249–1271.
Chiocci, F.L., Clifton, H.E., 1991. Gravel-filled gutter casts in near-
shore facies—indicators of ancient shoreline trend. Soc. Econ.
Paleontol. Mineral., Spec. Publ. 46, 76.
Clifton, H.E., 1988. Sedimentologic approaches to paleobathymetry,
with applications to the Merced Formation of central California.
Palaios 3, 507–522.
Clifton, H.E., 1989. Stratigraphic sequence response to glacioeu-
static fluctuations in a rapidly subsiding Cenozoic basin, San
Francisco, California. In: Morton, R.A., Nummedal, D. (Eds.),
Gulf Coast Section, SEPM Foundation Seventh Annual Re-
search Proceedings, pp. 203–211.
Clifton, H.E., Leithold, E.L., 1991. Quaternary coastal and shallow
marine facies sequences, northern California and the Pacific
Northwest. In: Morrison, R.B. (Ed.), Quaternary Nonglacial
Geology, Conterminous United States, Geological Society of
America, DNAG v. K-2, pp. 1156–1453.
Clifton, H.E., Hunter, R.E., Gardner, J.V., 1988. Analysis of eu-
static, tectonic and sedimentologic influences on transgressive
and regressive cycles in the Upper Cenozoic Merced Formation,
San Francisco, California. In: Kleinspehn, K.L., Paola, C.
(Eds.), New Perspectives in Basin Analysis. Springer-Verlag,
New York, pp. 109–128.
R.M. Carter et al. / Sedimentary Geology 153 (2002) 23–4140
Ditchburn, G.D., Graham, I.J., Sparks, R.J, Whitehead, N.E., 1995.
Analytical methods for measuring 10Be in marine sediments.
Institute of Geological and Nuclear Sciences (Lower Hutt,
New Zealand), Sci. Rep. 95/31, pp. 1–11.
Drake, D.E., Cacchione, D.A., 1985. Seasonal variation in sediment
transport on the Russian River shelf. Cont. Shelf Res. 4, 495–
514.
Eisenhauer, A., Spielhagen, R.F., Frank, M., Hentzschel, G., Man-
gini, A., Kubik, P.W., Dittrich-Hannen, B., Billen, T., 1994.10Be records of sediment cores from high northern latitudes:
implications for environmental and climatic changes. Earth
Planet. Sci. Lett. 124, 171–184.
Fleming, C.A., 1953. The geology of the Wanganui Subdivision,
Waverley and Wanganui sheet districts (N137 and N138). N. Z.
Geol. Surv. Bull. 52, 1–362.
Graham, I.J., Ditchburn, R.G., Whitehead, N.E., 1998. 10Be spikes
in Plio-Pleistocene cyclothems, Wanganui Basin, New Zealand:
identification of the local flooding surface (LFS). Sediment.
Geol. 22, 193–215.
Hall, N.T., 1965. Petrology of the type Merced Group, San Fran-
cisco Peninsula, California. Unpublished MA thesis, University
of California, Berkeley, pp. 1–126.
Hunter, R.E., Clifton, H.E., Hall, N.T., Csaszar, G., Richmond, B.M.,
Chin, J.L., 1984. Pliocene and Pleistocene coastal and shelf
deposits of the Merced Formation and associated beds,
northwestern San Francisco Peninsula, California. Soc. Econ.
Paleontol. Mineral., Field Guidebook 3, 1–29 (Mid-year
meeting, San Jose).
Ito, M., 1992. High-frequency depositional sequences of the upper
part of the Kazusa Group, a middle Pleistocene forearc basin fill
in Boso Peninsula, Japan. Sediment. Geol. 76, 155–175.
Kitamura, M., Kondo, Y., 1990. Cyclic change of sediments and
molluscan fossil associations caused by glacio-eustatic sea-level
changes during the early Pleistocene—a case study of the mid-
dle part of the Omma Formation at the type locality. J. Geol.
Soc. Jpn. 96, 19–36 (English abstract).
Kondo, Y., Abbott, S.T., Kitamura, A., Kamp, P.J.J., Naish, T.R.,
Kamataki, T., Saul, G.S., 1998. The relationship between
shellbed type and sequence architecture: examples from Japan
and New Zealand. Sediment. Geol. 122, 109–127.
Lanphere, M.A., Champion, D.E., Clynne, M.A., Muffler, L.J.P.,
1999. Revised age of the Rockland tephra, northern California:
implications for climate and stratigraphic reconstructions in the
western United States. Geology 27, 135–138.
Lanphere, M.A., Champion, D.E., Clynne, M.A., Muffler, L.J.P.,
2000. Revised age of the Rockland tephra, northern California:
implications for climate and stratigraphic reconstructions in the
western United States: reply. Geology 28, 287.
Larcombe, P., Carter, R.M., 1998. Sequence architecture during the
Holocene transgression: an example from the Great Barrier Reef
shelf, Australia. Sediment. Geol. 117, 97–121.
Meyer, C.E., Sarna-Wojcicki, A.M., Hillhouse, J.W., Woodward,
M.J., Slate, J.L., Sorg, D.H., 1991. Fission-track age (400,000
yr) of the Rockland tephra, based on inclusion of zircon grains
lacking fossil fission tracks. Quat. Res. 35, 367–382.
Naish, T.R., Kamp, P.J.J., 1997. Pliocene–Pleistocene shelf cyclo-
thems from Wanganui Basin, New Zealand: high resolution
facies and sequence stratigraphic analysis. Geol. Soc. Am. Bull.
109, 978–999.
Payton, C.E. (Ed.), 1977. Seismic stratigraphy—applications to
hydrocarbon exploration. Am. Assoc. Pet. Geol. Mem., vol.
26, pp. 1–516.
Rio, D., Channell, J.E.T., Massarei, F., Poli, M.S., Sgavetti, M.,
D’Alessandro, A., Prosser, G., 1996. Reading Pleistocene eu-
stasy in a tectonically active shelf setting (Crotone Peninsula,
southern Italy). Geology 24, 743–746.
Sarna-Wojcicki, A.M., Meyer, C.E., Bowman, H.R., Hall, N.T.,
Russell, P.C., Woodward, M.J., Slate, J.L., 1985. Correlation
of the Rockland ash bed, a 40,000-year-old stratigraphic marker
in northern California and western Nevada, and implications for
middle Pleistocene paleogeography of central California. Quat.
Geol. 23, 236–257.
Saul, G., Naish, T.R., Abbott, S.T., Carter, R.M., 1999. Sedimentary
cyclicity in the marine Plio-Pleistocene: sequence stratigraphic
motifs characteristic of the last 2.5 Ma. Geol. Soc. Am. Bull.
111, 524–537.
Sommerfield, C.K., Nittrouer, C.A., 1999. Modern accumulation
rates and a sediment budget for the Eel shelf: a flood-dominated
depositional environment. Mar. Geol. 154, 227–241.
Tokuhashi, S., Kondo, Y., 1989. Sedimentary cycles and environ-
ments in the middle– late Pleistocene Shimosa Group, Boso
Peninsula, central Japan. J. Geol. Soc. Jpn. 95, 933–951.
Vella, P., 1963. Pliocene–Pleistocene cyclothems, Wairarapa, New
Zealand. Trans. R. N. Z., Geol. 2, 15–50.
Wright, L.D., Kim, S.-C., Friedrichs, C.T., 1999. Across-shelf var-
iations in bed roughness, bed stress and sediment suspension on
the northern California shelf. Mar. Geol. 154, 99–115.
R.M. Carter et al. / Sedimentary Geology 153 (2002) 23–41 41