Embed Size (px)
Citation preview

Neuron
Article
The Precise Temporal Pattern of PrehearingSpontaneous Activity Is Necessaryfor Tonotopic Map RefinementAmanda Clause,1,2,3,6,7 Gunsoo Kim,2,3,6,8,* Mandy Sonntag,4 Catherine J.C. Weisz,1 Douglas E. Vetter,5
Rudolf R}ubsamen,4 and Karl Kandler1,2,3,*1Department of Otolaryngology, University of Pittsburgh School of Medicine, Pittsburgh, PA 15261, USA2Department of Neurobiology, University of Pittsburgh School of Medicine, Pittsburgh, PA 15261, USA3Center for the Neural Basis of Cognition, University of Pittsburgh School of Medicine, Pittsburgh, PA 15261, USA4Faculty of Biosciences, Pharmacy and Psychology, University of Leipzig, 04103 Leipzig, Germany5Department of Neurobiology and Anatomical Sciences, University of Mississippi Medical Center, Jackson, MS 39216, USA6Co-first author7Present address: Eaton-Peabody Laboratory, Massachusetts Eye and Ear Infirmary, Department of Otology and Laryngology, Harvard
Medical School, Boston, MA 02114, USA8Present address: Department of Physiology, Center for Integrative Neuroscience, University of California San Francisco, San Francisco,
CA 94143-0444, USA*Correspondence: [email protected] (G.K.), [email protected] (K.K.)
http://dx.doi.org/10.1016/j.neuron.2014.04.001
SUMMARY
Patterned spontaneous activity is a hallmark ofdeveloping sensory systems. In the auditory system,rhythmic bursts of spontaneous activity are gener-ated in cochlear hair cells and propagated alongcentral auditory pathways. The role of these activitypatterns in the development of central auditorycircuits has remained speculative. Here we demon-strate that blocking efferent cholinergic neurotrans-mission to developing hair cells in mice that lackthe a9 subunit of nicotinic acetylcholine receptors(a9 KO mice) altered the temporal fine structureof spontaneous activity without changing activitylevels. KO mice showed a severe impairment in thefunctional and structural sharpening of an inhibitorytonotopic map, as evidenced by deficits in synapticstrengthening and silencing of connections and anabsence in axonal pruning. These results provideevidence that the precise temporal pattern of spon-taneous activity before hearing onset is crucial forthe establishment of precise tonotopy, the majororganizing principle of central auditory pathways.
INTRODUCTION
Before the developing brain responds to external stimuli, the
dominant activity in neuronal pathways consists of spontane-
ously generated action potentials. This spontaneous activity
is typically characterized by rhythmic bursts of high levels of
activity separated by periods of quiescence (Hanson and Land-
messer, 2003; Kirkby et al., 2013; Meister et al., 1991). Similar
burst-like activity is also present in the developing auditory sys-
822 Neuron 82, 822–835, May 21, 2014 ª2014 Elsevier Inc.
tem before the onset of hearing (i.e., sensitivity to airborne
sound; Jones et al., 2007; Kotak and Sanes, 1995; Lippe,
1994; Sonntag et al., 2009; Tritsch et al., 2010). Prehearing activ-
ity bursts originate in cochlear inner hair cells (IHCs), which
fire trains of calcium action potentials (Glowatzki and Fuchs,
2000; Johnson et al., 2011; Kros et al., 1998; Tritsch et al.,
2007) that are transmitted to spiral ganglion cells and are
faithfully propagated along ascending central auditory pathways
(Tritsch et al., 2010).
Before hearing onset, IHCs are transiently innervated by the
efferent axons of medial olivocochlear neurons, a cholinergic
cell group located in the ventral brainstem (Simmons et al.,
1996; Warr and Guinan, 1979). At hair cells, acetylcholine
activates nicotinic acetylcholine receptors (AChRs) that contain
calcium-permeable a9 and a10 subunits (Elgoyhen et al., 1994;
Vetter et al., 1999). Calcium influx through these a9-containing
AChRs rapidly activates small-conductance potassium chan-
nels, resulting in the hyperpolarization of IHCs and an inhibition
of calcium spike generation (Glowatzki and Fuchs, 2000; Katz
et al., 2004). The transient cholinergic modulation of immature
IHCs may be a mechanism that modulates the level or temporal
pattern of cochlea-generated prehearing activity (Glowatzki and
Fuchs, 2000; Johnson et al., 2011).
In analogy to other neuronal systems (Hanson and Land-
messer, 2004; Kirkby et al., 2013), it has been widely assumed
that cochlea-generated patterns of spontaneous activity play
an important role in the development of the auditory system.
Whereas the rate of IHC spikes is important for the maturation
of vesicle fusion at IHC synapses (Johnson et al., 2013), a causal
link between patterned activity and the developmental organi-
zation of central auditory circuits has remained speculative due
to difficulties in experimentally altering the temporal patterns of
spontaneous activity without also severely changing the overall
levels of cochlea-generated activity. For instance, blocking
cochlea-generated activity before hearing onset leads to the
degeneration of spiral ganglion neurons and their postsynaptic

Neuron
Spontaneous Activity and Tonotopic Refinement
targets in the ventral cochlear nucleus (Hashisaki and Rubel,
1989; Hirtz et al., 2011; Seal et al., 2008), and it interferes with
the maturation of neuronal and synaptic properties in higher or-
der auditory neurons (Cao et al., 2008; Couchman et al., 2011;
Kotak and Sanes, 1996; Leao et al., 2006; Youssoufian et al.,
2005). Conflicting results have been obtained as to whether pre-
hearing activity plays a role in the formation of precise tonotopic
maps, themajor organizational principle of auditory pathways. In
congenitally deaf mice, the tonotopic organization of central
auditory pathways appears normal before hearing onset (Cao
et al., 2008; Noh et al., 2010; Rubel and Fritzsch, 2002; Youssou-
fian et al., 2008), whereas in neonatally deafened cats (Leake
et al., 2006) or gerbils (Sanes and Takacs, 1993), tonotopic orga-
nization of brainstem pathways is less precise.
In this study, we investigated whether changes in the temporal
pattern of spontaneous activity affect the development of a cen-
tral tonotopic map. We hypothesized that spontaneous activity
patterns would be altered in mice in which the a9 AChR subunit
has been genetically deleted (a9 knockout [KO] mice) (Vetter
et al., 1999). Because a9-containing AChRs are not expressed
in the brain (Allen Institute for Brain Science, 2012; Vetter et al.,
1999; Zuo et al., 1999), cholinergic transmission in a9 KO mice
is abolished in cochlear hair cells while remaining normal in cen-
tral auditory pathways. Single unit recordings from inhibitory
neurons in the medial nucleus of the trapezoid body (MNTB) re-
vealed that a9 KO mice exhibit altered temporal spike patterns
while having normal levels of spontaneous activity. To determine
whether this affects the development of tonotopic maps, we
characterized the synaptic and anatomical refinement of the
inhibitory pathway from the MNTB to the lateral superior olive
(LSO), an inhibitory pathway in the mammalian sound localiza-
tion system whose development has been well characterized
both physiologically and anatomically (Friauf, 2004; Kandler
and Gillespie, 2005). Our results demonstrate that, compared
to wild-type (WT) mice, in a9 KO mice, the strengthening and
silencing of inhibitory MNTB-LSO connections before hearing
onset was impaired, leading to a reduced sharpening of func-
tional topography. In addition, a9 KO mice have severe deficits
in the axonal pruning that occurs in normal mice during the first
week after hearing onset. These results provide evidence that
the precise temporal pattern of spontaneous activity before
hearing onset is crucial for the development of a precise tono-
topic map.
RESULTS
Altered Temporal Structure of Spontaneous Activity ina9 KO MiceTo test whether a loss of cholinergic innervation of IHCs alters
the level or the temporal patterns of spontaneous activity in cen-
tral auditory pathways, we recorded single units from the MNTB
in WT and a9 KO mice before hearing onset (Figure 1A). We
chose the MNTB because the spontaneous firing of MNTB neu-
rons faithfully follows the spike patterns of spiral ganglion neu-
rons (Tritsch et al., 2010) and because these recordings directly
reveal the presynaptic activity in the MNTB-LSO pathway. In WT
mice, spontaneous action potentials (APs) occurred in bursts
that were separated by periods of low, sporadic activity (Fig-
ure 1B; Figure S1 available online). Single events exhibited the
characteristic complex waveform composed of a pre- and post-
synaptic component typical for MNTB neurons (Sonntag et al.,
2009). Bursts occurred five to six times per minute (5.6 ± 0.3
bursts/min, n = 21 cells), with a mean burst duration of 5.5 ±
0.8 s and a mean firing rate during bursts of 8.4 ± 0.7 Hz (Figures
1G–1J). During bursts, spikes did not occur randomly, as indi-
cated by a coefficient of variation of interspike intervals (ISIs)
significantly greater than one (1.9 ± 0.1, n = 21 cells). Instead,
most spikes in a burst were clustered into ‘‘mini-bursts,’’ which
occurred at approximately 2 Hz (Figure 1K) and consisted of
two to nine APs (2.3 ± 0.1 APs/mini-burst) occurring at high rates
(383 ± 13 Hz; range, 275–481 Hz). The clustering of spikes into
bursts and mini-bursts resulted in ISI histograms with distinct
peaks (Figures 1D and 1F) very similar to those previously
described for spiral ganglion neurons and MNTB neurons in
rats (Tritsch et al., 2010) and spiral ganglion neurons in neonatal
cats (Jones et al., 2007).
In a9 KO mice, the mean firing rate of MNTB neurons was
indistinguishable from the rate in WT mice (Figure 1G; p = 0.58,
Student’s t test). In addition, bursts occurred with a similar fre-
quency as inWTmice (Figure 1H; p = 0.31). However, burst dura-
tion was 49% shorter in a9 KO mice than in WT mice (Figure 1I;
p = 0.0036), and during bursts themean firing rate was increased
by 83% (Figure 1J; p = 0.00002). Accordingly, the mean fre-
quency of mini-bursts and single spikes was 71% and 82%
higher, respectively, in KO mice (Figures 1K and 1L; p = 0.0018
and p = 0.00034), whereas the fraction of spikes that belonged
to mini-bursts remained the same (58% both in WT and KO,
p = 0.98). These changes resulted in marked differences in
the population ISI histograms (Figures 1E and 1F). Whereas the
first peak of the ISI histogram was similar in KO and WT mice
(peaks at �4 ms), the second peak, which reflects the intervals
between mini-bursts, was significantly shifted toward shorter
values (from �120 ms in WT to �40 ms in a9 KO mice). Interest-
ingly, the higher firing rates during bursts in a9 KO mice had
no effect on the lengthening-shorting pattern of ‘‘spike cluster’’
intervals (mini-bursts and single APs) that occurs during bursts
(Tritsch et al., 2010), indicating that the temporal dynamics of
spike clusters were unaffected in a9 KOmice (Figure 1M). Taken
together, loss of functional cholinergic transmission to hair cells
was associated with relatively subtle changes in spontaneous
activity as overall spike rate or the burst-like nature of the activity
of MNTB neurons remained unchanged, while the duration of
bursts was reduced and intraburst firing was increased.
Refinement of Functional Connectivity of theMNTB-LSOPathway before HearingOnset Is Impaired in a9KOMiceWe next investigated whether the topographic sharpening of
MNTB-LSO maps and the synaptic refinement of MNTB-LSO
connections before hearing onset is affected by the altered activ-
ity pattern in a9 KOmice. We first used focal glutamate uncaging
to characterize the development of functional MNTB-LSOmaps.
In WT mice, there was a developmental decrease in the area of
theMNTB that provides synaptic input to individual LSO neurons
(MNTB input area), indicating a sharpening of the functional
MNTB-LSO map. Between postnatal days (P) 1 and 12, the
average MNTB input area decreased by 63% (Figures 2A and
Neuron 82, 822–835, May 21, 2014 ª2014 Elsevier Inc. 823

Figure 1. Temporal Patterns of Spontaneous
Prehearing Activity Differ between MNTB
Neurons of WT and a9 KO Mice
(A) Scheme of ascending neuronal pathways to
the LSO. Excitatory pathways, releasing glutamate,
are in green; inhibitory pathways, coreleasing gly-
cine, GABA, and glutamate are in red. VCN, ventral
cochlear nucleus. The tonotopic organization is
reflected by shading (low-frequency areas are dark,
high-frequency areas are white).
(B and C) Example in vivo recordings of the
spontaneous spiking activity of MNTB neurons in
an 8-day-old WT (B) and a9 KO mouse (C). Neural
traces are shown on increasingly finer time scales
from left to right, as indicated by the scale bars.
Blue bars indicate activity bursts. Red brackets
mark the portion of the traces shown at higher
resolution on the right. Individual events exhibited
complex waveforms composed of pre- (Pr) and
postsynaptic components (Po) typical for MNTB
neurons.
(D and E) Interspike interval (ISI) histograms plotted
on a log scale for the neurons shown in (B) and (C),
respectively.
(F) Normalized population ISI histograms of WT
(black, n = 21 cells) and a9 KO mice (red, n = 21
cells). In a9 KO mice, the second peak is shifted to
shorter intervals.
(G–L) Quantification of spiking activity in WT (n =
21 cells) and a9 KO mice (n = 21 cells). The mean
overall firing rate (G) and the frequency of bursts
(H) did not differ between the two genotypes. The
duration of bursts (I) was reduced in a9 KO mice
(WT, 5.5 ± 0.8 s; KO, 2.9 ± 0.3 s; p = 0.0036,
Student’s t test). The mean firing rate during bursts
(J) was increased in a9 KO mice (WT, 8.4 ± 0.7 Hz;
KO, 15.4 ± 1.3 Hz; p = 0.000026, Student’s t test),
as was the mean frequency of mini-bursts (K;
WT, 2.1 ± 0.2 Hz; KO, 3.6 ± 0.4 Hz; p = 0.0018,
Student’s t test) and single spikes that did not
form mini-bursts (L; WT, 3.3 ± 0.3 Hz; KO, 6.0 ±
0.4; p = 0.00034).
(M) Mean intervals between spike clusters (mini-
bursts and single spikes together) plotted as a
function of position within a burst (black: WT, 214
bursts; red: KO, 216 bursts). Positions 1 through 5
denote the first five intervals at the beginning of a
burst, whereas positions �5 through �1 denote the
last five intervals at the end of a burst. All error bars
represent SEM.
See also Figure S1.
Neuron
Spontaneous Activity and Tonotopic Refinement
2B). Along the tonotopic (mediolateral) axis of the MNTB, the
width of input areas decreased by 45% (Figure 2C), indicating
an approximate 2-fold increase in the topographic precision of
connectivity along the tonotopic axis. These results are in line
with previous results from other mouse strains and from rats
(Kim and Kandler, 2003; Noh et al., 2010).
In newborn a9 KO mice, the size of MNTB input areas was
similar to those of WT mice (32% ± 3%, P1–P3, n = 6, p =
0.46, Student’s t test; Figures 2A and 2B), indicating that the
initial formation of MNTB-LSO topography occurs normally in
824 Neuron 82, 822–835, May 21, 2014 ª2014 Elsevier Inc.
a9 KO mice. Over the next 7–10 days, the size of MNTB input
areas in a9 KO mice decreased by 44% (to 18% ± 2% at P10–
P12, n = 16), but this decrease was significantly smaller than
that in WT mice (p < 0.01, Student’s t test). Therefore, at hearing
onset, MNTB input areas were on average 80% larger in a9 KO
mice than in WT mice (18% ± 2% in a9 KO versus 10% ± 2%
in WT at P10–P12; p = 0.01, Student’s t test, Figure 2B). These
larger input areas spread over 27% of the mediolateral axis of
the MNTB, a 50% increase compared to WT mice (Figure 2C).
The larger input maps in a9 KO mice were not due to a smaller

Figure 2. Topographic Refinement of Functional MNTB-LSO Con-
nectivity Is Impaired in a9 KO Mice
(A) Examples of MNTB input maps in brain slices obtained from WT mice
(upper row) and a9 KO mice (lower row). Example traces show postsynaptic
currents (PSCs) in LSO neurons elicited by uncaging glutamate at corre-
sponding MNTB sites. The amplitudes and transferred charge of the PSCs are
quantified in Figure S3 and Table S2. The MNTB is outlined in black. Stimu-
lation locations are depicted as squares and locations in theMNTB fromwhich
responses could be elicited are shown filled in red (see Experimental Pro-
cedures for details).
(B) Mean input areas normalized to the corresponding MNTB area in WT and
a9 KO mice aged P1–P3 and P10–P12. In WT mice, normalized MNTB input
areas decreased by 63% (from 27% ± 5% at P1–P3 [n = 7] to 10% ± 2% at
P10–P12 [n = 14]; p < 0.01, Student’s t test), whereas in KO mice, input areas
decreased by 44% (from 32% ± 3% at P1–P3 [n = 6] to 18 ± 2% at P10–P12
[n = 16]; p < 0.01). At P10–P12, input maps in KOmice were 80% larger than in
WT mice (p = 0.01).
(C) Developmental changes in the normalized mediolateral width of MNTB
input maps in WT and a9 KO mice. In WT mice, the width decreased by 45%
(from 33% ± 5% at P1–P3 [n = 7], to 18% ± 2% at P10–P12 [n = 14]; p < 0.01),
whereas in a9 KOmice the width decreased by 34% (from 41%± 3%at P1–P3
to 27% ± 3% at P10–P12; p < 0.01). At P10–P12, the tonotopic width of input
maps was 50% larger in a9 KO mice than in WT mice (p = 0.01). All error bars
represent SEM.
See also Figure S2 and Table S1.
Neuron
Spontaneous Activity and Tonotopic Refinement
cross-sectional MNTB area (WT: 69 3 103 ± 3.2 3 103 mm; a9
KO: 63.5 3 103 ± 1.8 3 103 mm; p = 0.15, Student’s t test) or
to differences in the spatial resolution of glutamate uncaging
(Figure S2) that may be caused by altered neuronal excitability
or glutamate sensitivity of MNTB neurons in a9 KO mice.
We next examined whether the decrease in MNTB-LSO
convergence that occurs during the first 2 postnatal weeks
was altered in a9 KO mice. We used minimal and maximal stim-
ulation techniques, which provide a measure of the strength
of single MNTB-LSO fiber connections and of all converging
MNTB fibers (Gil et al., 1999; Hirtz et al., 2012; Kim and Kandler,
2003, 2010). In P1–P3 mice, the maximal response amplitudes
did not differ between WT and a9 KO mice (Figures 3A, 3B,
and 3E). The developmental increase of maximal response
amplitude between P1 and P12 was also similar in both geno-
types with an approximate 6-fold increase in WT mice and an
approximate 5-fold increase in a9 KO mice (Figure 3E), resulting
in maximum responses at P10–P12 that did not differ signifi-
cantly between genotypes (p = 0.21, Student’s t test). Thus,
despite receiving inputs from a significantly larger MNTB area,
in a9 KOmice the total amount of inhibition received by individual
LSO neurons at hearing onset was unchanged.
In contrast to a normal increase in the maximal responses, in
a9 KO mice the increase in single-fiber responses was sig-
nificantly impaired (Figures 3A–3D). In WT mice, we observed a
16-fold increase in single-fiber response amplitude between
P1–P3 and P10–P12, whereas in a9 KO mice, this increase
was only 7-fold. Consequently, at P10-12 single-fiber response
amplitudes were significantly smaller in a9 KO mice than in WT
mice (p < 0.01, Figure 3E). The amplitude distributions and cu-
mulative histograms of single-fiber postsynaptic currents
(PSCs) indicate that the smaller average PSC amplitude in a9
KO mice is due to a higher prevalence of weak inputs
(<100 pA; Figure 3G; p = 0.001, Kolmogorov-Smirnov test).
This conclusion is supported by the smaller peak amplitudes eli-
cited from individual uncaging sites in P10–P12 a9 KO mice in
the mapping experiments (Figure S3 and Table S1). In contrast
to the reduced amplitudes of single-fiber responses, the kinetics
of single-fiber responses, such as the decay and rise times, did
not differ between WT and a9 KO mice (Figure S4), suggesting
that other basic properties of synaptic transmission at the
MNTB-LSO synapse, such as release synchronicity, the type
of neurotransmitters released, and postsynaptic receptor
composition, develop normally in a9 KO mice.
The observed decrease in single-fiber response amplitudes in
a9 KO mice may reflect more distal dendritic locations of inputs
rather than a reduction of their actual strength. This possibility,
however, seems unlikely because the rise times (which correlate
with the electrotonic distance between recording site and syn-
apse site) not differ between the genotypes (Figure S4) and
the rise times were also not correlated with the amplitude of
the synaptic currents (WT: r = �0.15, p = 0.33; KO: r = �0.09,
p = 0.51). Therefore, smaller single-fiber responses combined
with unchanged maximal responses suggest that LSO neurons
in a9 KO mice are contacted by a larger number of MNTB neu-
rons, each of which forms weaker connections.
To estimate the convergence of MNTB inputs to LSO neu-
rons, we used bootstrap resampling of the mean single-fiber
and maximal PSC amplitudes (see Supplemental Experimental
Procedures). Between P1 and P12, the MNTB-LSO conver-
gence decreased by 57% in WT mice (from 23 ± 6 inputs to
10 ± 2 inputs per LSO neuron), whereas in a9 KO mice this
decrease was only 22% (27 ± 7 inputs to 21 ± 6 inputs; Fig-
ure 3F). Thus, in a9 KO mice, individual LSO neurons receive
inputs from twice as many MNTB neurons compared to LSO
neurons in WT mice (p = 0.03, permutation test). Taken
together, both functional mapping and minimal/maximal stimu-
lation experiments demonstrate that the strengthening and
elimination (silencing) of individual MNTB inputs are impaired
Neuron 82, 822–835, May 21, 2014 ª2014 Elsevier Inc. 825

Figure 3. Developmental Strengthening and Elimination of MNTB-LSO Connections Are Impaired in a9 KO Mice
(A and B) Examples of synaptic responses in LSO neurons elicited by minimal (min) and maximal (max) stimulation of MNTB fibers in neonatal (P1–P3) WT (A) and
a9 KO mice (B). Insets represent 5–30 superimposed individual current traces.
(C and D) Examples of minimal and maximal synaptic responses in LSO neurons of P10–P11 WT (C) and a9 KO mice (D).
(E) Average amplitudes of synaptic responses elicited by minimal and maximal stimulation. In WT animals, maximal responses increased from 0.75 ± 0.12 nA
at P1–P3 (n = 26) to 4.23 ± 0.54 nA at P10–P12 (n = 42), and minimal responses increased from 30 ± 4 pA at P1–P3 (n = 22) to 470 ± 93 pA at P10–P12 (n = 43).
In a9 KO mice, maximal responses increased from 0.82 ± 0.16 nA at P1–P3 (n = 18) to 3.93 ± 0.36 nA at P10–P12 (n = 57) and minimal responses from 29 ± 9 pA
at P1–P3 (n = 18) to 200 ± 52 pA at P10–P12 (n = 57). The amplitude of minimal responses at P10–P12 was significantly smaller in a9 KO mice compared to WT
mice (*p < 0.01, Student’s t test).
(F) Bootstrap analysis of MNTB-LSO convergence. In WT mice, the mean convergence decreased from 23 ± 6 MNTB fibers per LSO neuron at P1–P3 to 10 ± 2
MNTB fibers per LSO neuron at P10–P12. In KO mice, the mean convergence was 27 ± 7 MNTB fibers per LSO neuron at P1–P3 (not significantly different from
WT mice, p = 0.66, permutation test) and 21 ± 6 MNTB fibers/ LSO neuron at P10–P12, significantly higher than WT mice (p = 0.03, permutation test).
(G) Amplitude and cumulative histograms of minimal stimulation responses in WT and a9 KO mice (*p = 0.001, Kolmogorov-Smirnov test). All error bars
represent SEM.
See also Figure S4.
Neuron
Spontaneous Activity and Tonotopic Refinement
in a9 KO mice, resulting in a deficit in the sharpening of func-
tional MNTB-LSO maps.
Functional Refinement Is Accompanied by AxonalGrowth in Both WT and a9 KO MiceTopographic refinement of the MNTB-LSO pathway also
involves the pruning of MNTB axons and LSO dendrites
(Rietzel and Friauf, 1998; Sanes and Siverls, 1991). We therefore
826 Neuron 82, 822–835, May 21, 2014 ª2014 Elsevier Inc.
analyzed the axonal termination patterns of individual MNTB
axons in the developing LSO to investigate whether axonal prun-
ing is affected in a9 KO mice. To this end, individual MNTB
neurons in brain slices were filled with biocytin and their axonal
projections to the LSO reconstructed (Figure S5). Because
the axonal termination field and the magnitude of pruning of
MNTB-LSO axons depend on the tonotopic (mediolateral)
location (Sanes and Siverls, 1991), we restricted our analysis to

Figure 4. Growth of MNTB Axon Terminals
and Formation of New Boutons before
Hearing Onset
(A and B) Example of reconstructed MNTB axon
terminals in the medial LSO (outlined in blue) in
WT mice (A) and a9 KO mice (B). Lower portions
illustrate bouton locations of corresponding axons.
Bouton clouds are fit with an ellipse that maximizes
enclosed bouton density (see Experimental Pro-
cedures). D, dorsal; L, lateral. Scale bar represents
100 mm.
(C) Increase in the average number of boutons per
MNTB axon in the LSO before hearing onset is
similar in WT and a9 KO mice (P2–P4: 127 ± 13 in
WT versus 112 ± 12 in KO, p = 0.39, Student’s t test;
P12–P14: 301 ± 29 in WT versus 324 ± 26 in KO,
p = 0.55, Student’s t test).
(D) The average bouton area, normalized to LSO
cross-sectional area, does not change before
hearing onset and does not differ between WT and
a9 KOmice at either age (P2–P4: 19.7 ± 1.7% in WT
versus 15.5 ± 2.2% in KO, p = 0.14, Student’s t test;
P12–P14: 19.6 ± 1.1% in WT versus 21.3 ± 2.6% in
KO, p = 0.54, Student’s t test).
(E) The average width of boutons along the LSO
tonotopic axis, normalized to LSO length, does not
change before hearing onset and does not differ
between WT and a9 KO mice at either age (P2–P4:
23.3 ± 2.3% in WT versus 20.6 ± 1.5% in KO, p = 0.33, Student’s t test; P12–P14: 20.7 ± 1.1% in WT versus 23.1 ± 2.1% in KO, p = 0.28, Student’s t test).
Errors bars represent SEM. P2–P4: n = 9 axons from six WT animals and nine axons from eight a9 KO animals. P12–P14: n = 10 axons from eight WT animals and
eight axons from six a9 KO animals. See Figure S6 for absolute values.
Neuron
Spontaneous Activity and Tonotopic Refinement
MNTB neurons that were located in the medial, high-frequency
part of the MNTB (Table S2).
During the first 2 postnatal weeks, there was a substantial
growth of MNTB-LSO axons in WT mice, and the average num-
ber of boutons per MNTB-LSO axon increased approximately
2.5-fold (Figure 4). To quantitatively and objectively estimate
the topographic specificity of axon terminals, an ellipse that
maximized the density of enclosed boutons was fit to the two-
dimensional projection of the boutons. The ellipse area repre-
sents the area innervated by a single MNTB axon (bouton
area), whereas the length of the short axis of the ellipse provides
a measure of the spread of boutons along the tonotopic axis
(bouton spread).
In WT mice, the bouton area increased almost 2-fold before
hearing onset (p < 0.01, Student’s t test; Figure S6A), and bouton
spread along the tonotopic axis increased approximately 1.4-
fold (p < 0.01, Student’s t test; Figure S6B). This expansion of
the bouton area, however, was matched by an almost 2-fold
expansion of the cross-sectional area of the LSO (Figure S6C)
and as a result, bouton area and bouton spread, when normal-
ized to the LSO cross-sectional area and length, respectively,
remained unchanged before hearing onset (Figures 4D and 4E;
p = 0.99 for normalized area; p = 0.29 for normalized spread,
Student’s t test). Thus, despite the considerable refinement of
functional MNTB-LSO maps, on an anatomical level, the degree
of topographic accuracy remains constant before hearing onset.
In a9 KOmice, the average number of boutons perMNTB-LSO
axon increased 2.9-fold before hearing onset, similar to the
increase in WT mice, resulting in bouton numbers at P12–P14
that did not differ significantly between genotypes (p = 0.55; Fig-
ures 4A–4C). In addition, the cross-sectional area of the LSO,
normalized bouton area, and normalized bouton spread at either
P2–P4 or P12–P14 did not differ between genotypes (Figures 4
and S6; p > 0.1). This indicates that the growth of MNTB axons
and the expansion of the LSO before hearing onset were normal
in a9 KO mice despite their deficits in functional refinement.
To investigate whether the addition of new boutons occurred
in a random or in a spatially guided manner, we determined the
density of boutons across the termination field during prehearing
development. In P2–P4 mice, the average bouton density was
relatively flat across the termination area, with only a slight in-
crease toward the center (bouton centroid; Figures 5A and 5B).
Over the next 2 weeks, new boutons were added preferentially
to the center of the termination field (Figure 5B), resulting in a
prominent bouton-dense peak at hearing onset. A similar pattern
of bouton formation was also present in a9 KO mice, yielding
a spatial distribution of boutons that closely resembles that of
WT mice at hearing onset (Figures 5C and 5D). These results
indicate that boutons are primarily added to the tonotopic center
of the termination area and that the spatial pattern of bouton
addition is not altered in a9 KO mice.
Axonal Pruning Occurs after Hearing Onset in WT Miceand Is Absent in a9 KO MiceDuring the first week after hearing onset, the number of boutons
per MNTB axon decreased by �50% in WT mice (p < 0.001;
Figure 6). This pruning was associated with a 50% decrease in
bouton area (p < 0.001; Figures 6 and 7A) and a 35% decrease
Neuron 82, 822–835, May 21, 2014 ª2014 Elsevier Inc. 827

Figure 5. Changes in the Spatial Distribution
of Boutons Formed by Single Axons before
Hearing Onset
(A) Heat maps of the average density of boutons
of individual MNTB axons in the LSO. Color bar
represents average number of boutons per axon
per bin (0.08% LSO area). Scale bars represent
20% LSO length and 40% dorsoventral LSO
height.
(B) Histograms of the average distribution of
boutons per MNTB axon along the LSO frequency
axis in WT mice at P2–P4 (gray) and P12–P14
(black). The x-axis represents bouton positions
with respect to the centroid of the bouton fields,
and the bin size was 2% of the LSO length.
Asterisks (*) mark the bins where the mean number
of boutons significantly differed (p < 0.05, Stu-
dent’s t test) between the P2–P4 (n = 9 axons) and
P12–P14 (n = 10 axons) WT groups. Error bars
represent SEM.
(C) Heat maps for a9 KO mice.
(D) Histograms for a9 KO mice. Asterisks (*) mark
the bins that are significantly different between
the P2–P4 (magenta, n = 9 axons) and P12–P14 (red, n = 8 axons) KO groups. The histogram for WT P12–P14 from (B) is also plotted for comparison (black). The
mean bouton numbers did not significantly differ between genotypes at P12–P14 (black versus red) at any bins (p > 0.1, Student’s t test).
See Figure S6 for absolute values.
Neuron
Spontaneous Activity and Tonotopic Refinement
in bouton spread along the tonotopic axis (p = 0.002). The bouton
elimination occurred not only at the periphery, but also at the
very center of the distribution (Figure 7B, gray versus black). In
fact, shifting the distribution curve at P12–P14 by subtracting
a constant number of boutons yielded a close match for the dis-
tribution at P19–P21 (Figure 7B, thick gray line versus black;
correlation coefficient = 0.84). These results indicate that bouton
elimination is not biased toward ‘‘inappropriate’’ boutons at
the periphery of the termination area, but rather occurs homo-
geneously across the entire termination field, a process best
described by a ‘‘sinking iceberg’’ scenario.
Surprisingly, in a9 KO mice, which have no obvious hearing
deficits (May et al., 2002; Vetter et al., 1999), the pruning of
MNTB-LSO boutons after hearing onset was absent (Figures
6B–6E). Bouton areas in a9 KO mice were over twice as large
as in WT mice and boutons were distributed over twice the
distance along the LSO frequency axis (Figures 6 and 7; area:
p < 0.0001, width: p = 0.002, Student’s t test). The spatial distri-
bution of boutons along the tonotopic axis further demonstrates
the difference between genotypes at P19–P21 (Figure 7D, black
versus red). The cross-sectional area and length of the LSO in a9
KO mice was not different from that in WT mice (Figure S6C;
area, p = 0.16; length, p = 0.69; Student’s t test). Thus, in a9
KO mice, sharpening of the structural MNTB-LSO map was
virtually absent, resulting in the maintenance of an immature,
less precise tonotopic map.
Although a9 KO mice have seemingly normal hearing as
defined by threshold and gain of compound action potentials
(Vetter et al., 1999), auditory brainstem responses, tone detec-
tion, and intensity discrimination (May et al., 2002), neurons in
the cochlear nucleus, MNTB or LSO of a9 KO mice may still
have subtle changes in their spontaneous or sound-evoked
activity, which may interfere with the pruning process. We thus
reasoned that if pruning of the MNTB-LSO pathway is indeed
828 Neuron 82, 822–835, May 21, 2014 ª2014 Elsevier Inc.
sensitive to slight changes in activity patterns, then pruning
should be altered in mice in which sound-evoked activity is sub-
stantially altered. To test this possibility, we raised mouse pups
from P8 until P19–P21 in pulsed white noise, an acoustic envi-
ronment that severely disrupts the maturation of tonotopic
maps in the primary auditory cortex (Zhang et al., 2002) and
the frequency tuning of neurons in the inferior colliculus (Sanes
and Constantine-Paton, 1983). As shown in Figure 8, pulsed
noise-reared mice displayed normal pruning of MNTB-LSO
that was indistinguishable from that in WT mice. The distance
of filled MNTB neurons to the medial edge of the MNTB did
not differ between WT and noise-reared mice (p = 0.31,
Student’s t test), indicating that we sampled MNTB neurons
from a similar frequency region. These results further support
the notion that pruning of MNTB-LSO axons does not depend
on normal spatiotemporal patterns of sound-evoked activity
and argues against the possibility that subtle changes in post-
hearing activity in a9 KO mice underlie the absence of pruning
in these mice.
No Obvious Deficits in Cochlear Nucleus Projectionsto the MNTB in a9 KO MiceFinally, we addressed the possibility that in a9 KO mice the
projection from the cochlear nucleus (CN) to the MNTB is
disturbed, which then may ‘‘propagate’’ to the MNTB-LSO
pathway.MNTB neurons receive their excitatory input from glob-
ular bushy cells that are located exclusively in the contralateral
cochlear nucleus (Kuwabara et al., 1991; Tolbert et al., 1982).
Globular bushy cell axons give rise to a single, large glutamater-
gic synapse, the calyx of Held, which contacts a single MNTB
neuron. This typical connection pattern persists in congenitally
deaf mice (Youssoufian et al., 2008), but cochlear ablation in
neonatal animals disrupts the strict contralateral innervation of
the MNTB (Kitzes et al., 1995). Using in vitro biocytin tracing

Figure 6. Pruning of MNTB Axon Terminals
and Elimination of Boutons after Hearing
Onset
(A) Example of reconstructed MNTB axon terminals
in the LSO (outlined in blue) in WT mice and (B) a9
KO mice. Lower portions illustrate bouton locations
of corresponding axons. D, dorsal; L, lateral. Scale
bar represents 100 mm.
(C) Average number of boutons per MNTB axon
in the LSO decreases in WT mice, but not in a9
KO mice (WT: 302 ± 29 boutons/MNTB axon at
P12–P14 to 137 ± 21 boutons at P19–P21, p <
0.001, Student’s t test; KO: 325 ± 26 boutons/MNTB
axon at P12–P14 to 278 ± 28 at P19–P21, p = 0.25,
Student’s t test; WT versus KO at P19–P21: p =
0.001, Student’s t test).
(D) Average bouton area normalized to LSO cross-
sectional area decreases in WT mice, but not in a9
KO mice (WT: 20% ± 1% LSO cross-sectional area
at P12–P14 to 10% ± 2% at P19–P21, p < 0.001,
Student’s t test; KO: 21% ± 3% LSO cross-
sectional area at P12–P14 to 22%±1%at P19–P21,
p = 0.75, Student’s t test; WT versus KO at P19–
P21: p < 0.0001).
(E) Average width of bouton area along LSO tono-
topic axis decreases in WT mice, but not in a9 KO
mice (WT: 21% ± 1% LSO length at P12–P14 to
14% ± 2% at P19–P21, p = 0.002, Student’s t test;
KO: 23% ± 2% LSO length at P12–P14 to 27% ± 3% at P19–P21, p = 0.34, Student’s t test; WT versus KO at P19–P21: p = 0.002).
Errors bars represent SEM. At P12–P14, n = 10 axons from eight animals in WT mice and n = 10 axons from six animals in a9 KO mice. At P19–P21, n = 9 axons
from eight animals in WT mice and n = 9 axons from eight animals in a9 KO mice. See Figure S6 for absolute values.
Neuron
Spontaneous Activity and Tonotopic Refinement
(P10–P14; 17 KO and 9 WT mice), we found no evidence for
abnormal CN projections or altered calyx morphology in a9 KO
mice (Figure 9). In both WT and a9 KO mice, CN axons inner-
vated the ipsilateral but not contralateral LSO, and calyces
were present exclusively in the contralateral MNTB. In both
genotypes, we observed the occasional retrogradely labeled
MNTB neuron as reported previously in other species (Schofield,
1995; Winter et al., 1989). Calyx morphology in a9 KO mice ap-
peared normal, showing the typical engulfment of postsynaptic
neurons with several typical finger-like processes (Figure 9B;
Morest, 1968; Kandler and Friauf, 1993; Hoffpauir et al., 2006).
DISCUSSION
Before hearing onset, neuronal activity in the auditory system is
characterized by stereotypical patterns of spiking activity, yet
the role of these patterns in the formation of precise auditory
circuits has remained speculative. In this study, we addressed
this question by characterizing the functional and anatomical
emergence of precise tonotopy in the inhibitory MNTB-LSO
pathway of a9 KO mice, which lack the expression of a9 AChR
subunits in cochlear hair cells, and thus lack classic olivoco-
chlear feedback activity (Vetter et al., 1999). In vivo recordings
from MNTB neurons in a9 KO mice demonstrated that the
functional denervation of efferent cholinergic transmission had
no effect on average spontaneous spike rates or overall burst-
activity but that it distinctively changed the temporal pattern of
spontaneous spikes. Compared to WT mice, LSO neurons in
a9 KO mice exhibited reduced strengthening of single-axon
MNTB-LSO connections, retained more MNTB inputs, and had
an impaired refinement of functional MNTB-LSO maps before
hearing onset. Although axonal growth and the formation of
boutons were normal in a9 KO mice before hearing onset, the
pruning of MNTB axon branches, which in WT mice occurred
after hearing onset, was virtually absent in a9 KOmice. These re-
sults provide strong evidence that the precise temporal pattern
of spontaneous prehearing activity is crucial for the formation
of precise tonotopy in a central auditory pathway.
Cholinergic Modulation of Spontaneous ActivityImmature IHCs are able to generate calcium action potentials
(Kros et al., 1998; Marcotti, 2012), which are elicited or modu-
lated by ATP release from Kolliker’s organ, a transient structure
in the immature cochlea (Johnson et al., 2011, 2012; Tritsch
et al., 2007). The firing of IHCs is also modulated by acetylcho-
line, which is released from the terminals of medial olivocochlear
neurons, a cholinergic cell group located in the brainstem that
transiently innervates IHCs (Simmons et al., 1996; Warr and
Guinan, 1979). Acetylcholine hyperpolarizes IHC by activating
a9 and a10 subunit-containing nicotinic AChRs (Elgoyhen
et al., 1994; Katz et al., 2004; Vetter et al., 1999), leading to
calcium influx and rapid activation of calcium-dependent small
conductance potassium (SK2) channels (Fuchs and Murrow,
1992; Glowatzki and Fuchs, 2000; Johnson et al., 2011; Kros
et al., 1998). The role of the transient cholinergic innervation
of immature IHCs has remained poorly understood, although
it has been suggested that it modulates spontaneous activity
levels or patterns (Glowatzki and Fuchs, 2000; Johnson et al.,
Neuron 82, 822–835, May 21, 2014 ª2014 Elsevier Inc. 829

Figure 7. Changes in the Spatial Distribution
of Boutons after Hearing Onset
(A) Heat maps of average density of the boutons
of individual MNTB axons in the LSO of WT mice.
Color bar represents the average number of bou-
tons per axon per bin (0.08% LSO area). Scale bars
represent 20% LSO length and 40% dorsoventral
LSO height.
(B) Histograms of the average distribution of
boutons per MNTB axon along the LSO frequency
axis at P12–P14 (gray circles) and P19–P21 (black
squares). The x-axis represents bouton positions
with respect to the centroid of the bouton fields, and
the bin size was 2% of the LSO length. Asterisks (*)
mark the bins where the mean number of boutons
significantly differed (p < 0.05, Student’s t test)
between the P12–P14 (n = 10 axons) and P19–P21
(n = 9 axons) WT groups. Also shown is the down-
shifted P12–P14 histogram (thick gray line) to match
the peak of the P19–P21 distribution. Error bars
represent SEM.
(C) Heat maps for a9 KO mice.
(D) Histograms for a9 KOmice showing the P12–P14 (magenta, n = 8 axons) and P19–P21 (red, n = 9 axons) groups, which did not differ significantly at any bins.
The histogram for the WT P19–P21 group from (B) is also plotted for comparison (black). The asterisks on the black curve mark the bins where the mean bouton
numbers significantly differed between genotypes at P19–P21 (black versus red; Student’s t test, p < 0.05).
Neuron
Spontaneous Activity and Tonotopic Refinement
2011). Results from cochlear explants have provided evidence
both for and against this hypothesis (Johnson et al., 2011; Tritsch
and Bergles, 2010; Tritsch et al., 2007). Our in vivo recordings
from MNTB neurons in a9 KO mice revealed normal average
spike rates, typical bursting patterns, and normal acceleration-
deceleration spike train dynamics (Figure 1), indicating these
properties emerge independent of cholinergic transmission
(Tritsch and Bergles, 2010; Tritsch et al., 2007). Our results,
however, reveal that acetylcholine modulates burst duration
(50% decrease in a9 KO mice) and intraburst firing rates
(70%–80% increase in in a9 KOmice). The mechanisms respon-
sible for these changes remain to be determined but may include
the loss of a tonic acetylcholine-mediated hyperpolarization of
IHCs, resulting in an increased spiking during bursts (Johnson
et al., 2011) or a deficit in the maturation of vesicle fusion in
IHCs (Johnson et al., 2013).
One could argue that the altered spike patterns of MNTB
neurons in a9 KO mice result from changes in the CN or the
MNTB itself, rather than from changes in the cochlea. However,
this possibility seems rather unlikely due to the following argu-
ments: First, the pattern of spontaneous activity in the MNTB
of WT mice (Figure 1) is strikingly similar to the activity of
MNTB neurons in rats, where it closely resembles the spike
pattern of spiral ganglion cells (Tritsch et al., 2010), indicating a
faithful transmission of spikes from the auditory nerve to the
MNTB even at the young ages examined. Second, nicotinic a9
AChR subunits are not expressed in the brain and, within the
auditory system, are expressed only in the cochlea (Allen Insti-
tute for Brain Science, 2012; Elgoyhen et al., 1994; Zuo et al.,
1999), arguing against altered cholinergic transmission at CN
neurons (Brown et al., 1988; Brown and Vetter, 2009; Fujino
and Oertel, 2001) in a9 KO mice. Third, glutamate sensitivity
and glutamate-elicited spike patterns of MNTB neurons in a9
KO mice were normal (Figure S2), as were the afferent pathways
(Figure 9). Taken together, these results make it highly likely that
830 Neuron 82, 822–835, May 21, 2014 ª2014 Elsevier Inc.
the specific changes in the temporal firing pattern of MNTB neu-
rons in a9 KOmice reflect changes in the activity pattern of spiral
ganglion neurons.
Impaired Sharpening of Functional MNTB-LSO Maps ina9 KO MiceThe present study provides strong evidence that even subtle
changes in the temporal pattern of spontaneous activity before
hearing onset lead to profound deficits in the tonotopic precision
of an inhibitory auditory map. Although changes beyond altered
activity patterns within the cochlea cannot be excluded at this
point, the most likely way that a genetic manipulation specific
to cochlea hair cells could influence connections in the LSO
(four synapses downstream from IHCs) is through activity prop-
agated along the auditory pathway.
It remains to be shown why shorter bursts with higher spike
frequencies interfere with the developmental strengthening of
MNTB-LSO connections. Because the rise and decay times of
postsynaptic currents were normal in a9 KO mice, it is unlikely
that the smaller single-fiber responses are caused bymore distal
locations of dendritic inputs, reduced synchronicity of neuro-
transmitter release, or changes in GABA and glycine response
components (Hirtz et al., 2012; Kapfer et al., 2002; Leao et al.,
2004). In contrast to single-fiber responses, maximal MNTB-
LSO responses increased normally in a9 KO mice, suggesting
that the developmental increase in the amount of inhibition in
the LSO is resilient to abnormal temporal activity patterns. In
line with this, the amount of inhibition in deaf otoferlin mice
(Longo-Guess et al., 2007; Noh et al., 2010; Roux et al., 2006)
or dn/dn mice (Couchman et al., 2011; Leao et al., 2006) is
unchanged. However, in these genetically deaf mice, both
cochleae are affected equally, leaving the excitation-inhibition
balance in the LSO unchanged. In contrast, disturbing the exci-
tation-inhibition balance, as is the case after unilateral cochlear
ablation (Kotak and Sanes, 1996) or by blocking glutamate
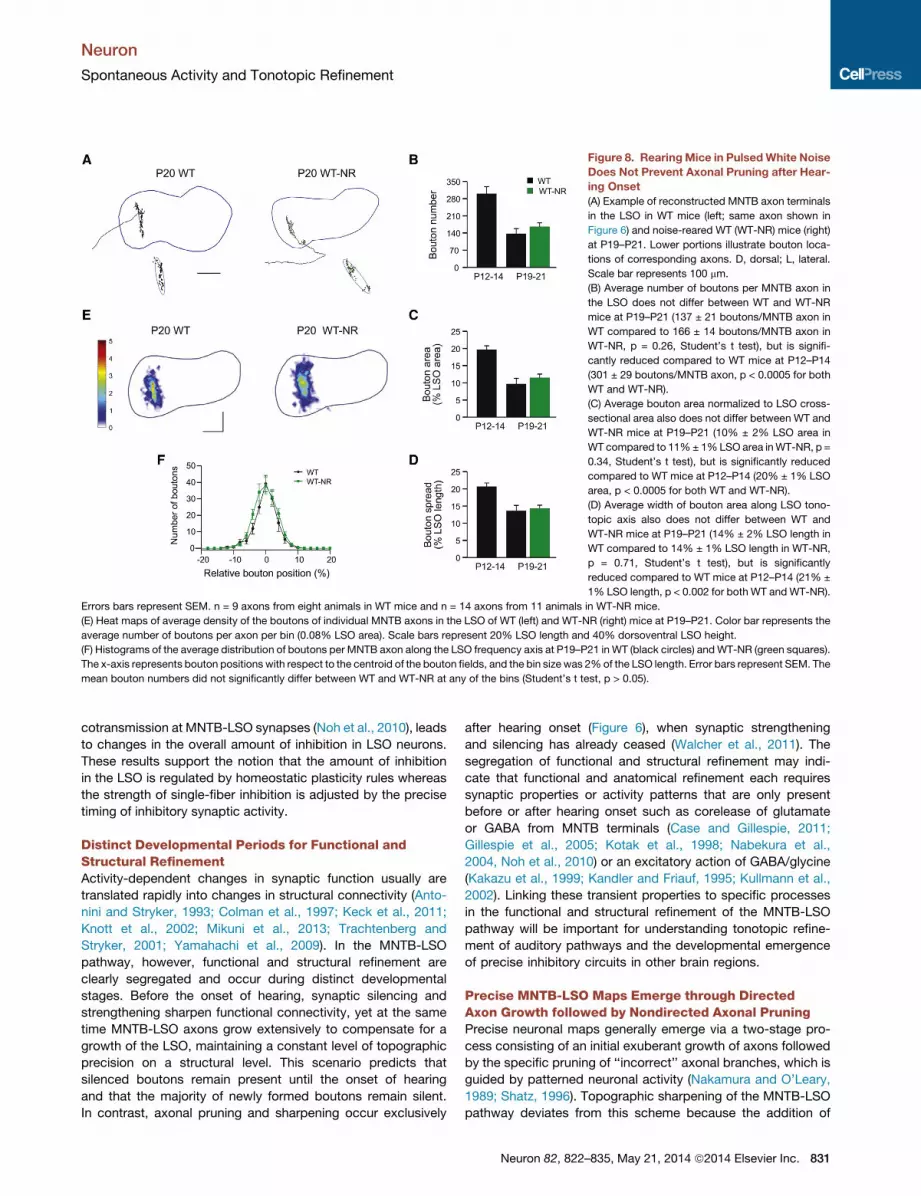
Figure 8. RearingMice in PulsedWhite Noise
Does Not Prevent Axonal Pruning after Hear-
ing Onset
(A) Example of reconstructed MNTB axon terminals
in the LSO in WT mice (left; same axon shown in
Figure 6) and noise-reared WT (WT-NR) mice (right)
at P19–P21. Lower portions illustrate bouton loca-
tions of corresponding axons. D, dorsal; L, lateral.
Scale bar represents 100 mm.
(B) Average number of boutons per MNTB axon in
the LSO does not differ between WT and WT-NR
mice at P19–P21 (137 ± 21 boutons/MNTB axon in
WT compared to 166 ± 14 boutons/MNTB axon in
WT-NR, p = 0.26, Student’s t test), but is signifi-
cantly reduced compared to WT mice at P12–P14
(301 ± 29 boutons/MNTB axon, p < 0.0005 for both
WT and WT-NR).
(C) Average bouton area normalized to LSO cross-
sectional area also does not differ between WT and
WT-NR mice at P19–P21 (10% ± 2% LSO area in
WT compared to 11%± 1%LSO area inWT-NR, p =
0.34, Student’s t test), but is significantly reduced
compared to WT mice at P12–P14 (20% ± 1% LSO
area, p < 0.0005 for both WT and WT-NR).
(D) Average width of bouton area along LSO tono-
topic axis also does not differ between WT and
WT-NR mice at P19–P21 (14% ± 2% LSO length in
WT compared to 14% ± 1% LSO length in WT-NR,
p = 0.71, Student’s t test), but is significantly
reduced compared to WT mice at P12–P14 (21% ±
1% LSO length, p < 0.002 for both WT andWT-NR).
Errors bars represent SEM. n = 9 axons from eight animals in WT mice and n = 14 axons from 11 animals in WT-NR mice.
(E) Heat maps of average density of the boutons of individual MNTB axons in the LSO of WT (left) and WT-NR (right) mice at P19–P21. Color bar represents the
average number of boutons per axon per bin (0.08% LSO area). Scale bars represent 20% LSO length and 40% dorsoventral LSO height.
(F) Histograms of the average distribution of boutons per MNTB axon along the LSO frequency axis at P19–P21 in WT (black circles) andWT-NR (green squares).
The x-axis represents bouton positions with respect to the centroid of the bouton fields, and the bin size was 2%of the LSO length. Error bars represent SEM. The
mean bouton numbers did not significantly differ between WT and WT-NR at any of the bins (Student’s t test, p > 0.05).
Neuron
Spontaneous Activity and Tonotopic Refinement
cotransmission at MNTB-LSO synapses (Noh et al., 2010), leads
to changes in the overall amount of inhibition in LSO neurons.
These results support the notion that the amount of inhibition
in the LSO is regulated by homeostatic plasticity rules whereas
the strength of single-fiber inhibition is adjusted by the precise
timing of inhibitory synaptic activity.
Distinct Developmental Periods for Functional andStructural RefinementActivity-dependent changes in synaptic function usually are
translated rapidly into changes in structural connectivity (Anto-
nini and Stryker, 1993; Colman et al., 1997; Keck et al., 2011;
Knott et al., 2002; Mikuni et al., 2013; Trachtenberg and
Stryker, 2001; Yamahachi et al., 2009). In the MNTB-LSO
pathway, however, functional and structural refinement are
clearly segregated and occur during distinct developmental
stages. Before the onset of hearing, synaptic silencing and
strengthening sharpen functional connectivity, yet at the same
time MNTB-LSO axons grow extensively to compensate for a
growth of the LSO, maintaining a constant level of topographic
precision on a structural level. This scenario predicts that
silenced boutons remain present until the onset of hearing
and that the majority of newly formed boutons remain silent.
In contrast, axonal pruning and sharpening occur exclusively
after hearing onset (Figure 6), when synaptic strengthening
and silencing has already ceased (Walcher et al., 2011). The
segregation of functional and structural refinement may indi-
cate that functional and anatomical refinement each requires
synaptic properties or activity patterns that are only present
before or after hearing onset such as corelease of glutamate
or GABA from MNTB terminals (Case and Gillespie, 2011;
Gillespie et al., 2005; Kotak et al., 1998; Nabekura et al.,
2004, Noh et al., 2010) or an excitatory action of GABA/glycine
(Kakazu et al., 1999; Kandler and Friauf, 1995; Kullmann et al.,
2002). Linking these transient properties to specific processes
in the functional and structural refinement of the MNTB-LSO
pathway will be important for understanding tonotopic refine-
ment of auditory pathways and the developmental emergence
of precise inhibitory circuits in other brain regions.
Precise MNTB-LSO Maps Emerge through DirectedAxon Growth followed by Nondirected Axonal PruningPrecise neuronal maps generally emerge via a two-stage pro-
cess consisting of an initial exuberant growth of axons followed
by the specific pruning of ‘‘incorrect’’ axonal branches, which is
guided by patterned neuronal activity (Nakamura and O’Leary,
1989; Shatz, 1996). Topographic sharpening of the MNTB-LSO
pathway deviates from this scheme because the addition of
Neuron 82, 822–835, May 21, 2014 ª2014 Elsevier Inc. 831

Figure 9. Projections from the Cochlear Nu-
cleus to the Superior Olivary Complex Appear
Normal in a9 KO Mice
(A) Pattern of cochlear nucleus projections to the
ipsilateral and contralateral superior olivary com-
plex in a P13 WT mouse and P12 a9 KO mouse
following insertion of a biocytin crystal into the left
cochlear nucleus. In both genotypes, labeled axon
terminals were predominantly found in the ipsilateral
LSO and contralateral MNTB. A fewMNTB neurons,
but never calyces, were observed in the ipsilateral
MNTB in both genotypes.
(B) Normal morphology of calyx of Held in a9 KO
mice. An example of rhodamine dextran-labeled
calyces of Held in P14WT and a9 KOmice is shown.
Each image is a maximum intensity projection of a
stack of two-photon optical sections. Scale bars
represent 5 mm.
Neuron
Spontaneous Activity and Tonotopic Refinement
new boutons before hearing onset is directed to the ‘‘correct’’
area (center of the termination field; Figure 5) whereas subse-
quent bouton elimination is nonspecific, following a ‘‘sinking
iceberg’’ mechanism (Figure 7). Because nondiscriminatory
pruning does not necessitate guidance by instructive signals
derived from sound-evoked activity, pruning should be resilient
to abnormal patterns of hearing-evoked activity. In support of
this, noise-reared animals show normal pruning (Figure 8). It
remains to be shown whether directed growth and unguided
pruning are features unique to the LSO or related to the inhibitory
nature of the MNTB-LSO pathway.
Structural Refinement in a9 KO MiceAxonal growth and bouton addition were normal a9 KO mice,
indicating that the amount and spatial specificity of axon
growth is insensitive to the altered temporal pattern of sponta-
neous activity in a9 KO mice. Because functional map refine-
ment was impaired in a9 KO mice, it appears that functional
and structural refinement are differentially regulated by sponta-
neous activity before hearing onset. Axonal pruning after hear-
ing onset, however, was severely impaired in a9 KO mice
(Figures 6 and 7). While it remains to be shown whether
these deficits persist throughout adulthood, the lack of pruning
was unexpected because a9 KO mice lack any obvious hearing
832 Neuron 82, 822–835, May 21, 2014 ª2014 Elsevier Inc.
deficits (Vetter et al., 1999, May et al.,
2002). It is possible that neurons in the
MNTB-LSO pathway or in upstream areas
have subtle changes in sound-evoked or
spontaneous activity, which may prevent
pruning. However, because pruning was
normal in noise-reared animals, possible
changes in sound-evoked or spontaneous
activity a9 KO mice after hearing onset
would need to be dramatic to disrupt
pruning and thus would have disrupted
normal hearing (Vetter et al., 1999, May
et al., 2002). Our results rather support
the interpretation that structural refine-
ment after hearing onset depends on the
refinement of synaptic strength and functional maps beforehearing onset.
EXPERIMENTAL PROCEDURES
Animals and Preparation
Experiments were performed on a9 KO mice (on background 129S6/SvEv)
or WT mice (129S6/SvEv) (Vetter et al., 1999). Experimental procedures
were in accordance with National Institutes of Health guidelines and were
approved by the Institutional Animal Care and Use Committee at the
University of Pittsburgh and by the Saxonian District Government Leipzig
(TVV 06/09).
In Vivo Recording and Burst Analysis
Single units were recorded from the MNTB in P8 mice under xylazine hydro-
chloride anesthesia (Sonntag et al., 2009). MNTB principal neurons were
identified by the complex waveform and recording sites were also verified
histologically. Mini-bursts and bursts were defined based on the population
ISI histogram (Figure S1). Within a burst, spikes that did not form mini-bursts
were analyzed separately as single spikes (Figures 1K and 1L). In Figure 1M,
we refer to mini-bursts and single spikes together as ‘‘spike clusters’’ to
analyze them together in a single temporal sequence.
In Vitro Electrophysiological Recordings and Functional Mapping
Whole cell recordings were obtained from neurons in the medial LSO in
300 mm thick slices with recording electrodes (2–3 MOhm) containing (in
mM) 76 Cs-methanesulfonate, 56 CsCl, 10 EGTA, 1 MgCl2, 1 CaCl2, 2

Neuron
Spontaneous Activity and Tonotopic Refinement
ATP-Mg, 0.3 GTP-Na, 5 Na2-phosphocreatine, and 10 HEPES (Kim and Kan-
dler, 2003). For current clamp recordings (Figure S2), Cs-methanesulfonate
was replaced with K-gluconate. MNTB-LSO connections were mapped by
photolysis of p-hydroxyphenacyl-glutamate (Givens et al., 1997) or CNB-
glu (150–200 mM; Invitrogen) using a fiber optic-based system (Kandler
et al., 2013) and 20 ms (P1–P3) or 100 ms (P10–P12) light pulses. For minimal
and maximal stimulation, MNTB axons were stimulated with constant current
pulses (0.2 ms) at a rate of 0.2 Hz. The experimenter was blind to the geno-
type of the animals until data analysis was completed. Convergence ratios
were determined using bootstrap resampling of maximal and minimal PSC
amplitudes and statistical significance was determined with a permutation
test (Figure 3F).
Noise-Rearing Protocol
Mice were reared from P8 until P19–P21 in pulsed white noise (70 dB SPL) in a
sound-attenuating chamber (Coulbourn Instruments).White noise pulse length
was pseudorandomly set to 700–1400 ms, and pulses were pseudorandomly
presented at a rate of �36 per minute.
Axon and Bouton Analysis
MNTB neurons were filled with patch pipettes containing 0.1 mM Alexa Fluor
568 hydrazide (Invitrogen) and 0.5% biocytin, followed by standard biocytin
histochemistry. Axons and boutons within the LSO were reconstructed using
a Neurolucida system (MBF Bioscience). Cells with cut axon branches within
the LSO were discarded from analysis. Bouton area was determined by fitting
an ellipse that maximized the density of enclosed boutons. Analysis using
bouton areas determined by conventional approaches (connecting peripheral
boutons) yielded qualitatively and statistically similar results. Density heat
maps were created by overlaying boutons with a two-dimensional grid
comprised of 56.8 mm2 (at P2–P4) or 100 mm2 (at P12–P14 and P19–P21)
bins. The chosen bin size encompassed a constant proportion of LSO area
(�0.08%) across ages. Bouton numbers per bin were calculated for each
axon and then averaged across axons. Throughout the paper, results are
presented as mean ± SEM, and a Student’s t test was used unless stated
otherwise.
In Vitro Tracing
Following decapitation and removal of the brain, a small crystal of biocytin
(Sigma-Aldrich) was inserted into the cochlear nucleus (Kandler and Friauf,
1993). Brains were incubated in artificial cerebrospinal fluid for 3–4 hr, fixed
for 2–5 days (4% parafomaldehyde), and processed for biocytin (Vectastain
ABC kit). Calyceal axons were labeled in 300 mm thick living slices by in-
serting a crystal of rhodamin dextrane (Sigma-Aldrich) into the acoustic
decussation between both MNTBs. After 30–60 min, slices of the calyces
were imaged with a two-photon microscope (VIVO 2-photon, Intelligent
Imaging Innovations) with excitation at 810 nm and z axis spacing of
0.5 mm.
SUPPLEMENTAL INFORMATION
Supplemental Information includes Supplemental Experimental Procedures,
six figures, and two tables and can be found with this article online at http://
dx.doi.org/10.1016/j.neuron.2014.04.001.
AUTHOR CONTRIBUTIONS
A.C. conducted and analyzed anatomical experiments shown in Figures 4, 5,
6, 7, 8, S5, and S6. G.K. performed and analyzed all in vitro recordings shown
in Figures 2, 3, and S1–S4. M.S. and R.R. performed all in vivo single unit
recordings. G.K, M.S., and R.R analyzed the in vivo data shown in Figures 1
and S1. D.E.V. provided a9 KO founder mice and consulted on breeding and
genotyping. C.J.C.W. performed and analyzed anatomical experiments shown
in Figure 9. All authors contributed to corresponding sections of the manu-
script. G.K., A.C, and K.K. conceptualized and planned the study and wrote
the paper.
ACKNOWLEDGMENTS
We thank Dr. Richard Givens (Department of Chemistry, University of Kansas)
for his generous gift of p-hydroxyphenacyl-glutamate, Jessica Garver and
Xinyan Gu for technical support, and Dr. Tuan Nguyen for help with the
noise-rearing experiments. The work was supported by US National Institute
on Deafness and Other Communication Disorders grant 04199 (to K.K.) and
06258 (to D.E.V.), NIH Basic Neuroscience Predoctoral Training grant T32
NS007433 (to A.C.), National Science Foundation IGERT Training grant DGE
0549352 (to A.C.), National Institute on Deafness and Other Communication
Disorders Institutional Training grant T32 DC011499 (to C.J.C.W.), a Pennsyl-
vania Lions Hearing Research Foundation grant (to K.K.), Deutsche For-
schungsgemeinschaft Ru 390/19-1 (to R.R.), and GK 1097 (to M.S.).
Accepted: March 24, 2014
Published: May 21, 2014
REFERENCES
Allen Institute for Brain Science. (2012). Allen developing mouse brain atlas.
http://www.brain-map.org.
Antonini, A., and Stryker, M.P. (1993). Rapid remodeling of axonal arbors in the
visual cortex. Science 260, 1819–1821.
Brown, M.C., and Vetter, D.E. (2009). Olivocochlear neuron central anatomy is
normal in alpha 9 knockout mice. J. Assoc. Res. Otolaryngol. 10, 64–75.
Brown, M.C., Liberman, M.C., Benson, T.E., and Ryugo, D.K. (1988).
Brainstem branches from olivocochlear axons in cats and rodents. J. Comp.
Neurol. 278, 591–603.
Cao, X.J., McGinley, M.J., and Oertel, D. (2008). Connections and synaptic
function in the posteroventral cochlear nucleus of deaf jerker mice. J. Comp.
Neurol. 510, 297–308.
Case, D.T., and Gillespie, D.C. (2011). Pre- and postsynaptic properties of glu-
tamatergic transmission in the immature inhibitory MNTB-LSO pathway.
J. Neurophysiol. 106, 2570–2579.
Colman, H., Nabekura, J., and Lichtman, J.W. (1997). Alterations in synaptic
strength preceding axon withdrawal. Science 275, 356–361.
Couchman, K., Garrett, A., Deardorff, A.S., Rattay, F., Resatz, S., Fyffe, R.,
Walmsley, B., and Leao, R.N. (2011). Lateral superior olive function in congen-
ital deafness. Hear. Res. 277, 163–175.
Elgoyhen, A.B., Johnson, D.S., Boulter, J., Vetter, D.E., and Heinemann, S.
(1994). Alpha 9: an acetylcholine receptor with novel pharmacological proper-
ties expressed in rat cochlear hair cells. Cell 79, 705–715.
Friauf, E. (2004). Developmental changes and cellular plasticity in the superior
olivary complex. In Plasticity of the Auditory System, T.N. Parks, E.W. Rubel,
R.R. Fay, and A.N. Popper, eds. (New York: Springer), pp. 49–95.
Fuchs, P.A., and Murrow, B.W. (1992). Cholinergic inhibition of short (outer)
hair cells of the chick’s cochlea. J. Neurosci. 12, 800–809.
Fujino, K., and Oertel, D. (2001). Cholinergic modulation of stellate cells in the
mammalian ventral cochlear nucleus. J. Neurosci. 21, 7372–7383.
Gil, Z., Connors, B.W., and Amitai, Y. (1999). Efficacy of thalamocortical
and intracortical synaptic connections: quanta, innervation, and reliability.
Neuron 23, 385–397.
Gillespie, D.C., Kim, G., and Kandler, K. (2005). Inhibitory synapses in the
developing auditory system are glutamatergic. Nat. Neurosci. 8, 332–338.
Givens, R.S., Jung, A., Park, C.H., Weber, J., and Bartlett, W. (1997). New
photoactivated protecting groups. 7. p-hydroxyphenacyl - a phototrigger for
excitatory amino acids and peptides. J. Am. Chem. Soc. 119, 8369–8370.
Glowatzki, E., and Fuchs, P.A. (2000). Cholinergic synaptic inhibition of inner
hair cells in the neonatal mammalian cochlea. Science 288, 2366–2368.
Hanson, M.G., and Landmesser, L.T. (2003). Characterization of the circuits
that generate spontaneous episodes of activity in the early embryonic mouse
spinal cord. J. Neurosci. 23, 587–600.
Neuron 82, 822–835, May 21, 2014 ª2014 Elsevier Inc. 833

Neuron
Spontaneous Activity and Tonotopic Refinement
Hanson, M.G., and Landmesser, L.T. (2004). Normal patterns of spontaneous
activity are required for correct motor axon guidance and the expression of
specific guidance molecules. Neuron 43, 687–701.
Hashisaki, G.T., and Rubel, E.W. (1989). Effects of unilateral cochlea removal
on anteroventral cochlear nucleus neurons in developing gerbils. J. Comp.
Neurol. 283, 5–73.
Hirtz, J.J., Boesen, M., Braun, N., Deitmer, J.W., Kramer, F., Lohr, C., Muller,
B., Nothwang, H.G., Striessnig, J., Lohrke, S., and Friauf, E. (2011). Cav1.3 cal-
cium channels are required for normal development of the auditory brainstem.
J. Neurosci. 31, 8280–8294.
Hirtz, J.J., Braun, N., Griesemer, D., Hannes, C., Janz, K., Lohrke, S., Muller,
B., and Friauf, E. (2012). Synaptic refinement of an inhibitory topographic
map in the auditory brainstem requires functional Cav1.3 calcium channels.
J. Neurosci. 32, 14602–14616.
Hoffpauir, B.K., Grimes, J.L., Mathers, P.H., and Spirou, G.A. (2006).
Synaptogenesis of the calyx of Held: rapid onset of function and one-to-one
morphological innervation. J. Neurosci. 26, 5511–5523.
Johnson, S.L., Eckrich, T., Kuhn, S., Zampini, V., Franz, C., Ranatunga, K.M.,
Roberts, T.P., Masetto, S., Knipper, M., Kros, C.J., and Marcotti, W. (2011).
Position-dependent patterning of spontaneous action potentials in immature
cochlear inner hair cells. Nat. Neurosci. 14, 711–717.
Johnson, S.L., Kennedy, H.J., Holley, M.C., Fettiplace, R., and Marcotti, W.
(2012). The resting transducer current drives spontaneous activity in prehear-
ing mammalian cochlear inner hair cells. J. Neurosci. 32, 10479–10483.
Johnson, S.L., Kuhn, S., Franz, C., Ingham, N., Furness, D.N., Knipper, M.,
Steel, K.P., Adelman, J.P., Holley, M.C., and Marcotti, W. (2013).
Presynaptic maturation in auditory hair cells requires a critical period of sen-
sory-independent spiking activity. Proc. Natl. Acad. Sci. USA 110, 8720–8725.
Jones, T.A., Leake, P.A., Snyder, R.L., Stakhovskaya, O., and Bonham, B.
(2007). Spontaneous discharge patterns in cochlear spiral ganglion cells
before the onset of hearing in cats. J. Neurophysiol. 98, 1898–1908.
Kakazu, Y., Akaike, N., Komiyama, S., and Nabekura, J. (1999). Regulation
of intracellular chloride by cotransporters in developing lateral superior olive
neurons. J. Neurosci. 19, 2843–2851.
Kandler, K., and Friauf, E. (1993). Pre- and postnatal development of efferent
connections of the cochlear nucleus in the rat. J. Comp. Neurol. 328, 161–184.
Kandler, K., and Friauf, E. (1995). Development of glycinergic and glutama-
tergic synaptic transmission in the auditory brainstem of perinatal rats.
J. Neurosci. 15, 6890–6904.
Kandler, K., and Gillespie, D.C. (2005). Developmental refinement of inhibitory
sound-localization circuits. Trends Neurosci. 28, 290–296.
Kandler, K., Nguyen, T., Noh, J., and Givens, R.S. (2013). An optical fiber-
based uncaging system. Cold Spring Harbor Protoc. 2013, 118–121.
Kapfer, C., Seidl, A.H., Schweizer, H., and Grothe, B. (2002). Experience-
dependent refinement of inhibitory inputs to auditory coincidence-detector
neurons. Nat. Neurosci. 5, 247–253.
Katz, E., Elgoyhen, A.B., Gomez-Casati, M.E., Knipper, M., Vetter, D.E., Fuchs,
P.A., and Glowatzki, E. (2004). Developmental regulation of nicotinic synapses
on cochlear inner hair cells. J. Neurosci. 24, 7814–7820.
Keck, T., Scheuss, V., Jacobsen, R.I., Wierenga, C.J., Eysel, U.T., Bonhoeffer,
T., and Hubener, M. (2011). Loss of sensory input causes rapid structural
changesof inhibitory neurons in adultmousevisual cortex.Neuron71, 869–882.
Kim, G., and Kandler, K. (2003). Elimination and strengthening of glycinergic/
GABAergic connections during tonotopic map formation. Nat. Neurosci. 6,
282–290.
Kim, G., and Kandler, K. (2010). Synaptic changes underlying the strength-
ening of GABA/glycinergic connections in the developing lateral superior olive.
Neuroscience 171, 924–933.
Kirkby, L.A., Sack, G.S., Firl, A., and Feller, M.B. (2013). A role for correlated
spontaneous activity in the assembly of neural circuits. Neuron 80, 1129–1144.
Kitzes, L.M., Kageyama, G.H., Semple, M.N., and Kil, J. (1995). Development
of ectopic projections from the ventral cochlear nucleus to the superior olivary
834 Neuron 82, 822–835, May 21, 2014 ª2014 Elsevier Inc.
complex induced by neonatal ablation of the contralateral cochlea. J. Comp.
Neurol. 353, 341–363.
Knott, G.W., Quairiaux, C., Genoud, C., and Welker, E. (2002). Formation of
dendritic spines with GABAergic synapses induced by whisker stimulation in
adult mice. Neuron 34, 265–273.
Kotak, V.C., and Sanes, D.H. (1995). Synaptically evoked prolonged depolar-
izations in the developing auditory system. J. Neurophysiol. 74, 1611–1620.
Kotak, V.C., and Sanes, D.H. (1996). Developmental influence of glycinergic
transmission: regulation of NMDA receptor-mediated EPSPs. J. Neurosci.
16, 1836–1843.
Kotak, V.C., Korada, S., Schwartz, I.R., and Sanes, D.H. (1998). A develop-
mental shift from GABAergic to glycinergic transmission in the central auditory
system. J. Neurosci. 18, 4646–4655.
Kros, C.J., Ruppersberg, J.P., and Rusch, A. (1998). Expression of a potas-
sium current in inner hair cells during development of hearing in mice.
Nature 394, 281–284.
Kullmann, P.H., Ene, F.A., and Kandler, K. (2002). Glycinergic and GABAergic
calcium responses in the developing lateral superior olive. Eur. J. Neurosci. 15,
1093–1104.
Kuwabara, N., DiCaprio, R.A., and Zook, J.M. (1991). Afferents to the medial
nucleus of the trapezoid body and their collateral projections. J. Comp.
Neurol. 314, 684–706.
Leake, P.A., Hradek, G.T., Chair, L., and Snyder, R.L. (2006). Neonatal deaf-
ness results in degraded topographic specificity of auditory nerve projections
to the cochlear nucleus in cats. J. Comp. Neurol. 497, 13–31.
Leao, R.N., Oleskevich, S., Sun, H., Bautista, M., Fyffe, R.E., andWalmsley, B.
(2004). Differences in glycinergic mIPSCs in the auditory brain stem of normal
and congenitally deaf neonatal mice. J. Neurophysiol. 91, 1006–1012.
Leao, R.N., Sun, H., Svahn, K., Berntson, A., Youssoufian, M., Paolini, A.G.,
Fyffe, R.E., and Walmsley, B. (2006). Topographic organization in the auditory
brainstem of juvenile mice is disrupted in congenital deafness. J. Physiol. 571,
563–578.
Lippe, W.R. (1994). Rhythmic spontaneous activity in the developing avian
auditory system. J. Neurosci. 14, 1486–1495.
Longo-Guess, C., Gagnon, L.H., Bergstrom, D.E., and Johnson, K.R. (2007). A
missense mutation in the conserved C2B domain of otoferlin causes deafness
in a new mouse model of DFNB9. Hear. Res. 234, 21–28.
Marcotti, W. (2012). Functional assembly of mammalian cochlear hair cells.
Exp. Physiol. 97, 438–451.
May, B.J., Prosen, C.A., Weiss, D., and Vetter, D. (2002). Behavioral investiga-
tion of some possible effects of the central olivocochlear pathways in trans-
genic mice. Hear. Res. 171, 142–157.
Meister, M., Wong, R.O., Baylor, D.A., and Shatz, C.J. (1991). Synchronous
bursts of action potentials in ganglion cells of the developing mammalian
retina. Science 252, 939–943.
Mikuni, T., Uesaka, N., Okuno, H., Hirai, H., Deisseroth, K., Bito, H., and Kano,
M. (2013). Arc/Arg3.1 is a postsynaptic mediator of activity-dependent syn-
apse elimination in the developing cerebellum. Neuron 78, 1024–1035.
Morest, D.K. (1968). The growth of synaptic endings in the mammalian brain: a
study of the calyces of the trapezoid body. Z. Anat. Entwicklungsgesch. 127,
201–220.
Nabekura, J., Katsurabayashi, S., Kakazu, Y., Shibata, S., Matsubara, A.,
Jinno, S., Mizoguchi, Y., Sasaki, A., and Ishibashi, H. (2004). Developmental
switch from GABA to glycine release in single central synaptic terminals.
Nat. Neurosci. 7, 17–23.
Nakamura, H., and O’Leary, D.D. (1989). Inaccuracies in initial growth and
arborization of chick retinotectal axons followed by course corrections and
axon remodeling to develop topographic order. J. Neurosci. 9, 3776–3795.
Noh, J., Seal, R.P., Garver, J.A., Edwards, R.H., and Kandler, K. (2010).
Glutamate co-release at GABA/glycinergic synapses is crucial for the refine-
ment of an inhibitory map. Nat. Neurosci. 13, 232–238.

Neuron
Spontaneous Activity and Tonotopic Refinement
Rietzel, H.J., and Friauf, E. (1998). Neuron types in the rat lateral superior olive
and developmental changes in the complexity of their dendritic arbors.
J. Comp. Neurol. 390, 20–40.
Roux, I., Safieddine, S., Nouvian, R., Grati, M., Simmler, M.C., Bahloul, A.,
Perfettini, I., Le Gall, M., Rostaing, P., Hamard, G., et al. (2006). Otoferlin,
defective in a human deafness form, is essential for exocytosis at the auditory
ribbon synapse. Cell 127, 277–289.
Rubel, E.W., and Fritzsch, B. (2002). Auditory system development: primary
auditory neurons and their targets. Annu. Rev. Neurosci. 25, 51–101.
Sanes, D.H., and Constantine-Paton, M. (1983). Altered activity patterns
during development reduce neural tuning. Science 221, 1183–1185.
Sanes, D.H., and Siverls, V. (1991). Development and specificity of inhibitory
terminal arborizations in the central nervous system. J. Neurobiol. 22,
837–854.
Sanes, D.H., and Takacs, C. (1993). Activity-dependent refinement of inhibi-
tory connections. Eur. J. Neurosci. 5, 570–574.
Schofield, B.R. (1995). Projections from the cochlear nucleus to the superior
paraolivary nucleus in guinea pigs. J. Comp. Neurol. 360, 135–149.
Seal, R.P., Akil, O., Yi, E., Weber, C.M., Grant, L., Yoo, J., Clause, A., Kandler,
K., Noebels, J.L., Glowatzki, E., et al. (2008). Sensorineural deafness and sei-
zures in mice lacking vesicular glutamate transporter 3. Neuron 57, 263–275.
Shatz, C.J. (1996). Emergence of order in visual system development. Proc.
Natl. Acad. Sci. USA 93, 602–608.
Simmons, D.D., Mansdorf, N.B., and Kim, J.H. (1996). Olivocochlear innerva-
tion of inner and outer hair cells during postnatal maturation: evidence for a
waiting period. J. Comp. Neurol. 370, 551–562.
Sonntag, M., Englitz, B., Kopp-Scheinpflug, C., and Rubsamen, R. (2009).
Early postnatal development of spontaneous and acoustically evoked
discharge activity of principal cells of the medial nucleus of the trapezoid
body: an in vivo study in mice. J. Neurosci. 29, 9510–9520.
Tolbert, L.P., Morest, D.K., and Yurgelun-Todd, D.A. (1982). The neuronal ar-
chitecture of the anteroventral cochlear nucleus of the cat in the region of the
cochlear nerve root: horseradish peroxidase labelling of identified cell types.
Neuroscience 7, 3031–3052.
Trachtenberg, J.T., and Stryker, M.P. (2001). Rapid anatomical plasticity of
horizontal connections in the developing visual cortex. J. Neurosci. 21,
3476–3482.
Tritsch, N.X., and Bergles, D.E. (2010). Developmental regulation of sponta-
neous activity in the Mammalian cochlea. J. Neurosci. 30, 1539–1550.
Tritsch, N.X., Yi, E., Gale, J.E., Glowatzki, E., and Bergles, D.E. (2007). The
origin of spontaneous activity in the developing auditory system. Nature 450,
50–55.
Tritsch, N.X., Rodrıguez-Contreras, A., Crins, T.T., Wang, H.C., Borst, J.G.,
and Bergles, D.E. (2010). Calcium action potentials in hair cells pattern audi-
tory neuron activity before hearing onset. Nat. Neurosci. 13, 1050–1052.
Vetter, D.E., Liberman, M.C., Mann, J., Barhanin, J., Boulter, J., Brown, M.C.,
Saffiote-Kolman, J., Heinemann, S.F., and Elgoyhen, A.B. (1999). Role of
alpha9 nicotinic ACh receptor subunits in the development and function of
cochlear efferent innervation. Neuron 23, 93–103.
Walcher, J., Hassfurth, B., Grothe, B., and Koch, U. (2011). Comparative post-
hearing development of inhibitory inputs to the lateral superior olive in gerbils
and mice. J. Neurophysiol. 106, 1443–1453.
Warr, W.B., and Guinan, J.J., Jr. (1979). Efferent innervation of the organ of
corti: two separate systems. Brain Res. 173, 152–155.
Winter, I.M., Robertson, D., and Cole, K.S. (1989). Descending projections
from auditory brainstem nuclei to the cochlea and cochlear nucleus of the
guinea pig. J. Comp. Neurol. 280, 143–157.
Yamahachi, H., Marik, S.A., McManus, J.N., Denk, W., and Gilbert, C.D.
(2009). Rapid axonal sprouting and pruning accompany functional reorganiza-
tion in primary visual cortex. Neuron 64, 719–729.
Youssoufian, M., Oleskevich, S., and Walmsley, B. (2005). Development of a
robust central auditory synapse in congenital deafness. J. Neurophysiol. 94,
3168–3180.
Youssoufian, M., Couchman, K., Shivdasani, M.N., Paolini, A.G., and
Walmsley, B. (2008). Maturation of auditory brainstem projections and calyces
in the congenitally deaf (dn/dn) mouse. J. Comp. Neurol. 506, 442–451.
Zhang, L.I., Bao, S., and Merzenich, M.M. (2002). Disruption of primary audi-
tory cortex by synchronous auditory inputs during a critical period. Proc.
Natl. Acad. Sci. USA 99, 2309–2314.
Zuo, J., Treadaway, J., Buckner, T.W., and Fritzsch, B. (1999). Visualization of
alpha9 acetylcholine receptor expression in hair cells of transgenic mice con-
taining a modified bacterial artificial chromosome. Proc. Natl. Acad. Sci. USA
96, 14100–14105.
Neuron 82, 822–835, May 21, 2014 ª2014 Elsevier Inc. 835
Neuron, Volume 82
Supplemental Information
The Precise Temporal Pattern of Prehearing
Spontaneous Activity Is Necessary
for Tonotopic Map Refinement
Amanda Clause, Gunsoo Kim, Mandy Sonntag, Catherine J.C. Weisz, Douglas E. Vetter,
Rudolf Rűbsamen, and Karl Kandler

1
Supplemental Items Figure S1, related to Figure 1 Boundary ISI values used to define mini-bursts and bursts (the 2 vertical red lines). A population ISI histogram in WT mice was fit with a sum of 3 gaussians using a maximum likelihood estimation algorithm (MATLAB). Blue curves show the 3 gaussians, while the green curve is the sum of the 3 blue curves. The ISI value at the minimum between the first and the second gaussians defined the boundary for minibursts (red dashed line on the left; ISI=12 msec). The ISI value at the intersection between the second and the third gaussians defined the boundary for bursts (red dashed line on the right; ISI=1888 msec).
Rel
ativ
e fre
quen
cy
ISI (msec)100
0
0.5
1.0
101 102 103 104 105

2
Figure S2, related to Figure 2 and Experimental Procedures. Spatial resolution of uncaging is independent of age and genotype. (A) Examples of direct stimulation of MNTB neurons by uncaging glutamate. Open squares indicate uncaging sites with no responses, red squares indicate locations where spikes were evoked, and blue squares indicate subthrehold stimulus locations. Spikes could only be elicited by uncaging glutamate directly over the cell bodies of recorded MNTB neurons despite using longer light-pulse durations at older ages (Kim and Kandler, 2003). (B) Summary plot of spatial resolution of uncaging expressed as spike-eliciting distance from soma. Distance was measured in steps of 50 µm, and in all cases one step away from the location of the cell body failed to elicit spikes; therefore no error bars are shown. The numbers within the bars indicate the number of MNTB neurons recorded for each group. The same numbers apply to (C). (C) Average number of spikes elicited did not differ between the genotypes at both age groups (P1-3: 2.4 ± 0.2 (WT) vs 2.4 ± 0.5 (KO), p = 0.96; P10-12: 10.7 ± 1.9 (WT) vs 8.8 ± 2.6 (KO), p = 0.53).
100 m
WT
9 KO
MNTBA
B
Spik
e-e
licitin
g d
ista
nce (
µm)
P1-3 P10-12
WT
9 KO
C
Num
ber
of spik
es
P1-3 P10-12
WT
9 KO
5 7 6 12

3
Figure S3, related to Figures 2 and 3. Quantification of synaptic responses evoked by glutamate uncaging shown in Figure 2. (A-B) Comparison of peak amplitudes and charge transfer of the synaptic responses between WT and KO mice at P1-3 (A) and P10-12 (B). “Per map” measurements show amplitudes and charge transfer summed over all stimulation sites of an input map. “Per stimulation location” measurements show the values at individual stimulation sites.
C
A
B
First
pe
ak a
mp
litu
de
(p
A)
WT KO
Pe
ak a
mp
litu
de
(p
A)
Ch
arg
e t
ran
sfe
r (p
C)
Pe
ak a
mp
litu
de
(p
A)
Ch
arg
e t
ran
sfe
r (p
C)
per map per stim location
Pe
ak a
mp
litu
de
(p
A)
Ch
arg
e t
ran
sfe
r (p
C)
WT KO
P1-3
WT KO WT KO WT KO
P10-12
WT KO WT KO WT KO WT KO
P10-12
Pe
ak a
mp
litu
de
(p
A)
Ch
arg
e t
ran
sfe
r (p
C)
per map per stim location
First
pe
ak a
mp
litu
de
(p
A)
per map per stim location
*
WT KO

(C) For the P10-12 group, amplitudes of the first peak of the synaptic responses are also quantified. Values for all the bar graphs are presented in Table S2 along with p-values (Student’s t test). Results: At P1-3, peak amplitudes and charge transfer did not differ between the genotypes, either when summed over stimulation sites of each map (“per map”), or not (“per stimulation location”). This is consistent with the results from electrical stimulation that amplitudes of synaptic responses to both maximal and minimal stimulations were similar between the genotypes (Figure 3E). At P10-12, peak amplitudes and charge transfer per map did not differ between the genotypes (Figure S3B), consistent with the maximal stimulation results (Figure 3E). Peak amplitudes per stimulation site did not significantly differ (Figure S3B), unlike the minimal stimulation results. In contrast to minimal stimulation, however, our glutamate uncaging likely drives multiple connected neurons to fire even at a single site, whose inputs can add up. Indeed, amplitudes of the first peak of the compound synaptic responses, which is more likely to represent an input from a single MNTB neuron, were significantly reduced in KOs, consistent with the minimal stimulation results (Figure S3C; p = 0.47). Transferred charge per stimulation site did not differ between the genotypes (Figure S3B). Even though inputs from individual MNTB neurons are smaller in KOs (Figure 3E), if uncaging tends to activate more neurons owing to a higher convergence in KOs, the summation of synaptic currents over time can increase the amount of transferred charge. Because we did not observe differences in the mean number spikes in single MNTB neurons evoked by uncaging (Figure S2C) or in the decay time of single-fiber inputs (Figure S4), it seems likely that enhanced temporal summation of MNTB inputs make up for reduced single-fiber inputs in KOs (Figure 3E and Figure S3C). In summary, our analysis of synaptic responses to uncaging generally agrees with the results from electrical stimulation. Methods: To quantify the amplitude and transferred charge of uncaging responses, synaptic currents during a 400 (P1-3) or 200 msec (P10-12) window from the onset of the UV flash were analyzed. Longer window size was necessary for the P1-3 groups because response latency and duration were often longer presumably due to a combination of factors including longer latencies of the evoked spikes, slower decay of synaptic currents, and less effective glutamate clearance mechanisms. Peak amplitudes and charge transfer (measured as the area under the synaptic traces) were measured for each response (averaged over 1-3 trials per stimulation site). The amplitude of the first peaks was measured only for the P10-12 groups because it was often not possible to unambiguously identify the first peak of the compound synaptic currents at P1-3.
4

5
Figure S4, related to Figure 3. No differences in the kinetics of single-fiber PSCs in WT and α9 KO mice. (A-B) Example traces of single-fiber PSCs in LSO neurons (averaged over 5-15 PSCs) at P2 (A) and P10 (B). The traces on the left are from WT mice, and those on the right are from KO mice. Single exponential fits for the decay phase are also shown (red). (C) 20-80% rise times of single-fiber PSCs (P1-3: WT 0.83 ± 0.07 msec, KO 0.92 ± 0.04 msec, p = 0.28, Student’s t test; P10-12: WT 0.37 ± 0.02 msec, KO 0.40 ± 0.02 msec, p = 0.29, Student’s t test). (D) Decay time constants obtained by single exponential fits did not differ between WT and KO mice (P1-3: WT 14.7 ± 1.3 msec, KO 14.6± 1.4 msec; p = 0.99, Student’s t test; P10-12: WT 3.3± 0.4 msec, KO 3.8± 0.4 msec; p = 0.36, Student’s t test).
P1-3 P10-12
De
ca
y t
ime
(m
se
c) WT
9 KO WT
9 KO
C D
0
0.2
0.4
0.6
0.8
1
22 18 43 56
P1-3 P10-12
20
-80
% r
ise
tim
e (
mse
c)
0
5
10
15
20
22 18 42 56
100 pA
10 msec
200 pA
τ = 3.6 msec τ = 3.5 msec
20 pA
10 msec
τ = 15.8 msec
20 pA
10 msec
τ = 14.7 msec
WT KOA
B
P2 P2
P10 P10

6
Figure S5, related to Figure 4 and Experimental Procedures. Reconstruction of single MNTB-LSO axons (A) Photomicrographs (top) and reconstruction (bottom) of MNTB-LSO axons in a P19 WT mouse. Reconstructions also include axons contained in neighboring sections (not shown). Blue arrows point to putative axonal boutons, marked in red in the high-magnification reconstruction. (B) same as (A) but from a P21 α9 KO mouse. Scale bars are 250 µm (left) and 10 µm (right)
A
B

7
Figure S6, related to Figures 4,6, and 8. Non-normalized data of MNTB axon morphology. (A) Average area covered by boutons in the LSO. At P1-21 bouton area is significantly greater in α9 KO mice (11.1 ± 1.8 x 103µm in WTvs.26.6 ± 1.0 x 103 µm in KO, p < 0.001, Student’s t-test). At P2-4, the smaller bouton area in α9 KO mice is due to a reduction in the dorsoventral spread of boutons, rather than a reduction in the spread along the tonotopic axis (13.3 ± 1.6 x 103 µm in WT vs. 8.0 ± 0.9 x 103 µm in KO, p = 0.01, Student’s t--‐test). (B) Average spread of boutons along the LSO tonotopic axis. At P19-21 the spread of boutons is significantly greater in α9 KO mice (72 ± 8 µm in WT vs. 147 ± 21 µm in KO, p < 0.005, Student’s t--‐test). (C) Average crosssectional area of the LSO does not differ between WT and α9 KO mice at any of the ages studied (p > 0.1 at all ages, Student’s t--‐test). Data originate from the same axons as the data presented in Figs. 4-7. N = 9 axons from 6 WT animals and 9 axons from 8 α9 KO animals. Error bars, SEM. *p < 0.05, Student’s t-test against age-matched.

8
Table S1. Quantification of synaptic responses to glutamate uncaging (related to Figure S3)
Peak amplitude (pA)
Charge transfer (pC)
First peak amplitude (pA)
P1-3
map WT (n = 6) 1655 ± 1240 129.1 ± 105.0 - KO (n = 6) 1799 ± 500 122.6 ± 41.5 -
p-value 0.92 0.95 -
stimulation site
WT (n = 31) 320 ± 82 25.0 ± 7.0 - KO (n = 42) 257 ± 38 17.5 ± 3.0 -
p-value 0.45 0.29 -
P10-12
map WT (n = 14) 1147 ± 336 24.1 ± 8.4 700 ± 186 KO (n = 16) 1343 ± 281 41.3 ± 8.2 707 ± 128
p-value 0.66 0.16 0.97
stimulation site
WT (n = 38) 423 ± 62 8.9 ± 1.7 258 ± 46 KO (n = 74) 290 ± 52 8.9 ± 1.5 153 ± 29
p-value 0.13 0.99 0.47

9
Table S2. Related to Figure 4 and 6 and Experimental procedures. Location of somas within the MNTB and bouton centroids within the LSO.

Supplemental Experimental Procedures In vivo recording and spike sorting In vivo single unit recordings from MNTB neurons (P8) were performed at the Neurobiology Laboratories of the Institute of Biology at the University of Leipzig. Experimental procedures are described in detail elsewhere (Sonntag et al., 2009). Mice were anesthetized by an initial intraperitoneal injection of a mixture of ketamine hydrochloride (0.1 mg/g body weight; Pfizer) and xylazine hydrochloride (0.005 mg/g body weight; Bayer) and by successive injections of one-‐third of the initial dose every 120–230 min. Previously it was shown that the spontaneous firing rates of MNTB neurons does not correlate with the length of anesthesia (Sonntag et al., 2009). Recordings were performed in a sound-‐attenuation chamber (A400, Industrial Acoustics). Body temperature was maintained at 38°C. The head was secured via a metal post on the skull. The MNTB was approached dorsally through a hole (diameter ~ 0.5 mm) at the midline placed 1.8–2 mm caudal to the lambda suture. High impedance glass micropipettes (5-‐12 MΩ; Harvard Apparatus, GC150F-‐10) filled with 3 M KCl were advanced into the MNTB, approximately 4-‐5 mm deep from the skull surface. Voltage signals were bandpass filtered (0.3–7 kHz), amplified (PC1, TDT), and digitized (RP2.1, TDT) at 97.7 kHz. MNTB principal neurons were identified by the characteristic complex waveform that consists of the calyceal potential (“prepotential”) preceding the postsynaptic action potential (Guinan and Li, 1990)(Figure 1B). Recording sites were also verified histologically by iontophoretic injection (4 μA, 10 min) of fluorogold. Only stable and well-‐isolated MNTB units were included in the analysis. Generally, the spikes of a single neuron could be identified by simple thresholding, but we performed further spike sorting offline using custom routines written in MATLAB7.5 (MathWorks). Thresholded spike waveforms were separated from noise by clustering based on principal components analysis. Although the amplitude of MNTB spikes can decrease during high-‐frequency bursting, they still formed a cluster that was clearly separable from noise. We also checked the amplitude of the prepotentials, which remains constant even when postsynaptic spike waveforms vary (Sonntag et al., 2009). A lack of refractory period violations (ISI < 1 msec) further ensured the single unit nature of the activity. Burst analysis To quantitatively compare the patterns of spontaneous activity between the two genotypes, we defined mini-‐bursts and bursts based on the population ISI histogram (Figure S1). The population ISI histogram of WT mice was fit with a sum of 3 Gaussians using maximum likelihood estimation ("mle" function in MATLAB). Based on the intersections of the Gaussian fits, mini-‐bursts were defined as successive spikes with ISIs less than 12 msec, whereas bursts were defined as ISIs less than 1888 msec. Within a burst, spikes that did not form mini-‐bursts (i.e., spikes that were preceded and followed by intervals greater than 12 msec) were analyzed separately as single spikes (Figure 1K and L). The same boundary values were used for both WT and KO mice to make the comparison of activity patterns possible. The difference between the genotypes shown in Figure 1 is not a result of the
10

particular choices of boundaries because we obtained qualitatively similar results with a range of boundary values (10, 12, or 14 msec for mini-‐bursts; 1600, 1888, or 2200 msec for bursts). For the interval analysis shown in Figure 1M, we refer to mini-‐bursts and single spikes together as “spike clusters” to analyze them together in a single temporal sequence. Only bursts that contain at least 11 spike clusters (or 10 intervals) were analyzed. The interval between a neighboring pair of spike clusters was defined as the time from the last spike of the first cluster to the first spike of the second. In vitro electrophysiological recordings and functional mapping Brainstem slices (300 µm) were prepared as previously described (Kim and Kandler, 2003). Whole cell recordings were obtained from visually identified, putative principal cells of the medial LSO. Recording electrodes (2-‐3 MΟhm) contained (in mM) 76 Cs-‐methanesulfonate, 56 CsCl, 10 EGTA, 1 MgCl2, 1 CaCl2, 2 ATP-‐Mg, 0.3 GTP-‐Na, 5 Na2-‐phosphocreatine, and 10 HEPES. Synaptic currents were recorded with an Axopatch 1D amplifier (Axon Instruments). With the internal and external solution and a holding potential of -‐70 mV (corrected for -‐5 mV liquid junction potential), ECl was -‐20 mV. For the current clamp recordings shown in Figure S2, Cs-‐methanesulfonate was replaced with K-‐gluconate. The series resistance (5-‐20 MΩ) was compensated by 60-‐80% (Axopatch 1D, Axon Instruments) and was continuously monitored throughout the recordings. Data were filtered at 2 kHz (Axopatch 1D) and acquired at 10 kHz using custom-‐written Labview data acquisition software.
The spatial distribution of presynaptic MNTB neurons was determined using focal photolysis of p-‐hydroxyphenacyl-‐glutamate (Givens et al., 1997) or CNB-‐glu (“caged glutamate”, 150-‐200 µM; Invitrogen) using a fiber optic-‐based system as described previously (Kandler et al., 2013; Kim and Kandler, 2003). The optical fiber for delivering UV light had a 20-‐µm-‐diameter light-‐conducting core (Polymicro Technologies Inc, Phoenix, AZ) that produced small diameter UV spots (~25 µm) on the surface of the slice. The duration of UV-‐light pulses was 20 ms for the P1-‐3 group and 100 ms for the P10-‐12 group. Pulse durations were chosen such that the spike-‐eliciting distance from an MNTB neuron was less than 50 µm in both age groups (see below and Figure S2).
In each slice, 50 to 80 locations (spaced ~50 µm apart) in and around the MNTB were stimulated. Uncaging sites were marked as the position of the light spot on the slice on digitized video frames overlaid with a 50 µm x 50 µm grid (Figure 2). Squares containing successful stimulation sites were used to calculate input areas (Noh et al., 2010). To normalize input areas to MNTB cross-‐sectional areas, MNTB boundaries were determined by three investigators (two of them were blind to the data and animal group) using images taken from the slices during the experiments and the mean boundary constructed (Adobe Illustrator). On rare occasions in neonatal animals of both genotypes, responses could be elicited from sites slightly dorsal to the MNTB boundaries and these locations were excluded from our analysis. The spatial resolution of uncaging was measured by recording the direct responses of MNTB neurons to uncaging glutamate in current clamp (Kim and
11
Kandler, 2003). With the same uncaging parameters as for mapping, only uncaging directly at the cell body (indicated by electrode tip) elicited spikes (Figure S2).
For minimal and maximal stimulation, MNTB axons were stimulated at the lateral boundary of the MNTB with patch pipettes (1 MΩ) filled with external bath solution. Constant current pulses (0.2 ms) were delivered using a stimulation isolation unit (IsoFlex, AMPI) at a rate of 0.2 Hz. In minimal stimulation, stimulus intensity was gradually varied around the threshold, such that we could record the smallest responses that emerge from failures. The first plateau of successful responses in the input-‐output relationship was taken as the single-‐fiber response amplitude. Using minimal stimulation allowed us to detect small amplitude single-‐fiber responses that would not be resolved in input-‐output relations over a wide range of stimulus intensity. For maximal responses, stimulus intensity was increased up to 1,000 µA. PSC amplitudes typically saturated around 400 µA, indicating our range of stimulus intensity was adequate for activating most available inputs. Only 1 or 2 LSO neurons were recorded per MNTB-‐LSO pathway to minimize potential bias introduced by slicing. The experimenter was blind to the genotype of the animals until the analysis was finished.
The amplitudes of individual MNTB inputs varied widely within each LSO neuron. Therefore, unlike in the case where converging inputs have similar amplitude, simply dividing the maximal amplitude by the minimal within each neuron may not yield accurate estimates of the number of converging inputs. To better estimate the convergence and its uncertainty, we used bootstrap resampling of maximal and minimal PSC amplitudes. PSC amplitude values were randomly drawn from the experimental data set (with replacement) to form a resample of the same sample size. A convergence ratio was computed by dividing the mean maximal amplitude by the mean minimal amplitude. Resampling was repeated 1000 times, yielding 1000 convergence values. The mean and standard deviation of these 1000 values represent bootstrap estimates (Figure 3F). Statistical significance between WT and α9 KO mice was determined using a permutation test. The amplitude values from the two groups were first combined and then randomly re-‐assigned to either group to form permuted samples. This permutation was repeated 1000 times, yielding a distribution of the difference values in convergence between the two permuted samples. The difference values from our experimental data were then compared against this distribution to calculate the p values (Figure 3F). Noise-‐rearing protocol
Noise-‐reared (NR) mice were reared from P8 until P19-‐21 in pulsed white noise. Litters were culled to six pups and home cages containing the pups and their mother were placed in a sound-‐attenuating chamber (Coulbourn Instruments, PA) lined with anechoic foam on a 12-‐hour light/dark cycle with food and water ad libidum. White noise pulses at 70 decibels sound pressure level (dB SPL) were generated (Coulbourn tone/noise generator A69-‐20, Coulbourn Instruments, PA) and delivered to the chamber by an isodynamic tweeter (RT2H-‐A, HiVi Research, CA) mounted 30 cm above the cage floor. The loudspeaker had a relatively flat frequency response over much of the normal hearing range of the mouse (~2-‐50
12

kHz). In order to minimize adaptation effects, white noise pulse length was pseudorandomly set to 700-‐1400 ms and pulses were pseudorandomly presented at a rate of ~36 per minute. Acoustic stimuli were calibrated with a ¼” diameter microphone (4939, Brüel & Kjær, Denmark) placed at the level of the animals within the housing. Microphone output was amplified (Nexus 2690-‐A-‐OS1, Brüel & Kjær, Denmark) and analyzed using SoundCheck (Listen, MA). NR pups showed no behavioral signs of distress and at time of sacrifice were similar in weight to WT pups, indicating normal maternal care. Of the 17 total axons reconstructed from 13 NR mice, 3 axons exhibited two distinctly separate areas of boutons in the LSO, a termination pattern that was not observed in WT mice. Including these 3 axons in the NR population did not change the results of statistical comparisons between NR and WT mice at P19-‐21 (all p-‐values > 0.05), but because they were unique to the NR and never observed in the WT case, they were excluded from the population data presented here. Single axon and bouton analysis Individual MNTB neurons were filled with patch pipettes containing 0.1 mM Alexa Fluor 568 hydrazide (Invitrogen, Carlsbad, CA) and 0.5 % biocytin. After filling, slices were incubated for at least 60 min in an interface-‐type chamber before being fixed in 4 % paraformaldehyde (1-‐7 days) and processed for biocytin visualization. Axonal arbors and boutons within the LSO were reconstructed with 60X and 100X oil objectives using a Neurolucida system (MBF Bioscience, Williston, VT) interfaced with a Zeiss Imager M1. Putative synaptic boutons were identified based on their characteristic round shape and their diameter greater than 2x the width of the parent axon. Cells with cut axon branches within the LSO (identified by a bulbous ending at the slice surface) were discarded from analysis. For analysis (Neurolucida Explorer), 3-‐dimensional reconstructions were flattened rostro-‐caudally into a 2-‐dimensional, medio-‐laterally-‐ and dorso-‐ventrally-‐defined Cartesian coordinate system. To determine bouton area in an objective manner, an ellipse was fit to the coordinates of LSO boutons that maximized the density of boutons within the confines of the ellipse. This approach is less likely to be influenced by the presence of single or small numbers of boutons located far outside the main region of termination. Analysis using bouton areas determined by conventional approaches (connecting peripheral boutons) yielded qualitatively and statistically similar results. For ellipse fitting, custom-‐written LabView programs were used to extract the Cartesian coordinates of boutons located within the LSO from Neurolucida ASC files and a minimum-‐volume enclosing ellipse was then fit to these coordinates using custom-‐written MATLAB (Mathworks, Natick, MA) scripts based on the Khachiyan Algorithm. Due to the S-‐shaped curvature of the LSO we used the length of the short axis of the ellipse as a measure of tonotopic spread. The angle of the ellipse short axis to the horizontal medio-‐lateral axis was used as an estimate of the orientation of the LSO frequency axis at the location of the axonal boutons and when measuring LSO length. There was no difference of the ellipse-‐horizontal angles between genotypes at any age (P > 0.05, Students t-‐test). To create density heat maps (e.g., Figure 5A), the boutons of each reconstructed axon were overlaid with a 2-‐dimensional grid comprised of 56.8 μm2
13

(at P2-‐4) or 100 μm2 (at P12-‐14 and P19-‐21) bins within Neurolucida. The chosen bin size encompassed a constant proportion of LSO area (~0.08 %) across all ages. The origin of the grid was positioned at the bouton centroid (the center of mass) of each axon, aligning each axon independent of the location of its terminations within the LSO. Bouton numbers per bin were calculated for each axon and then averaged across axons. This average bouton density for each age group was plotted as a heat map using the ‘contourf’ function in MATLAB.
To generate histograms of bouton density along the LSO frequency axis (e.g., Figure 5B), each axon’s bouton field was rotated around the centroid so that the horizontal axis of the coordinate system now corresponded to the putative LSO frequency axis. The frequency axis was divided into bins of 2 % of the length of the LSO. For each axon, counts of the number of boutons per bin were computed. Data for all of the axons in each age group were then averaged.
In Figure 7B, to demonstrate the “sinking iceberg” effect, a constant (21.4 boutons) was subtracted from the P12-‐14 histogram to match the peak of the P19-‐21 histogram. The correlation coefficient between the downshifted and the P19-‐21 distribution was calculated using only the bins with non-‐zero bouton counts, and using a finer binning (1% LSO length) to have enough bins.
Throughout the paper, results are presented as mean ± s.e.m, and Student’s t-‐test was used unless stated otherwise.
In vitro tracing Following decapitation and removal of the brain a small crystal of biocytin (Sigma-‐Aldrich) was inserted into the cochlear nucleus under visual control (Kandler and Friauf, 1993). Brains were submerged in oxygenated ACSF for 3-‐4 hours and immersion fixed for 2-‐5 days in 4% PFA. Brains were cryoprotected in 30% sucrose, cut into 50 µm thick coronal sections on a freezing microtome, and processed for biocytin visualization following standard protocols (Vectastain ABC kit). Calyceal axons were labeled in 300 µm thick living brainstem slices by inserting a small crystal of rhodamin dextrane (Sigma-‐Aldrich) into the acoustic decussation between both MNTBs. Following 30-‐60 minutes of incubation, slices were transferred into a submerged type chamber mounted to an upright microscope (Examiner Z1, Zeiss) and individual calyces were imaged with a 2 photon microscope (VIVO 2-‐photon, Intelligent Imaging Innovations) with excitation at 810 nm and z-‐axis spacing of 0.5 µm.
14

References Guinan, J.J., and Li, R.Y. (1990). Signal processing in brainstem auditory neurons which receive giant endings (calyces of Held) in the medial nucleus of the trapezoid body of the cat. Hear Res 49, 321-‐334.
Sonntag, M., Englitz, B., Kopp-‐Scheinpflug, C., and Rubsamen, R. (2009). Early postnatal development of spontaneous and acoustically evoked discharge activity of principal cells of the medial nucleus of the trapezoid body: an in vivo study in mice. J Neurosci 29, 9510-‐9520.
Kim, G., and Kandler, K. (2003). Elimination and strengthening of glycinergic/GABAergic connections during tonotopic map formation. Nat Neurosci 6, 282-‐290. Givens, R.S., Jung, A., Park, C.H., Weber, J., and Bartlett, W. (1997). New photoactivated protecting groups. 7. p-‐hydroxyphenacyl -‐ a phototrigger for excitatory amino acids and peptides. J Am Chem Soc 119, 8369-‐8370. Kandler, K., Nguyen, T., Noh, J., and Givens, R.S. (2013). An optical fiber-‐based uncaging system. Cold Spring Harbor protocols 2013, 118-‐121.
Noh, J., Seal, R.P., Garver, J.A., Edwards, R.H., and Kandler, K. (2010). Glutamate co-‐release at GABA/glycinergic synapses is crucial for the refinement of an inhibitory map. Nat Neurosci 13, 232-‐238. Kandler, K., and Friauf, E. (1993). Pre-‐ and postnatal development of efferent connections of the cochlear nucleus in the rat. J Comp Neurol. 328, 161-‐84.
15


