Embed Size (px)
Citation preview
Communicated by Wyeth Bair
How Precise is Neuronal Synchronization?
Peter Konig* Andreas K. Engel Pieter R. Roelfsema Wolf Singer Max-Planck-lnstitut fur Hirnforschung, Deutschordenstr. 46, 60528 Frankfurt, Germany
Recent work suggests that synchronization of neuronal activity could serve to define functionally relevant relationships between spatially distributed cortical neurons. At present, it is not known to what ex- tent this hypothesis is compatible with the widely supported notion of coarse coding, which assumes that features of a stimulus are rep- resented by the graded responses of a population of optimally and suboptimally activated cells. To resolve this issue we investigated the temporal relationship between responses of optimally and sub- optimally stimulated neurons in area 17 of cat visual cortex. We find that optimally and suboptimally activated cells can synchronize their responses with a precision of a few milliseconds. However, there are consistent and systematic deviations of the phase relations from zero phase lag. Systematic variation of the orientation of visual stimuli shows that optimally driven neurons tend to lead over suboptimally activated cells. The observed phase lag depends linearly on the stim- ulus orientation and is, in addition, proportional to the difference be- tween the preferred orientations of the recorded cells. Similar effects occur when testing the influence of the movement direction and the spatial frequency of visual stimuli. These results suggest that binding by synchrony can be used to define assemblies of neurons representing a coarse-coded stimulus. Furthermore, they allow a quantitative test of neuronal network models designed to reproduce physiological results on stimulus-specific synchronization.
1 Introduction
Theoretical considerations and an increasing body of experimental find- ings suggest that information about sensory patterns is encoded not only in the amplitude distributions and spatial positions of activated nerve
*Present address: The Neurosciences Institute, 10640 John J. Hopkins Drive, San Diego, CA 92121 USA.
Neural Computation 7, 469-485 (1995) @ 1995 Massachusetts Institute of Technology
470 P. Konig et al.
cells but also in the temporal relations between their discharges. Re- garding cortical processing it has been suggested that synchronization of neuronal responses on a time scale of milliseconds could serve to bind spatially distributed cells into coherently active assemblies representing particular components of a visual scene (Milner 1974; von der Malsburg 1981; Abeles 1982; Shimizu et al. 1986). Cross-correlation studies in the neocortex that have been designed to test predictions of this hypothesis have provided data that are compatible with a functional role of syn- chronization of neuronal activity (for review see Engel et al. 1992; Singer 1993).
One of the questions unresolved so far is whether this notion of tem- poral binding is compatible with the concept of coarse coding of sensory stimuli. It is commonly assumed that exact information about the at- tributes of a stimulus such as its precise location or orientation is not contained solely in the responses of cells that are optimally activated by the stimulus but in the graded responses of the whole group of cells that respond to the stimulus (Hinton et al. 1986; Geogopoulos et al. 1986; Vo- gels 1990). Thus, if assemblies of functionally related neurons are defined by synchronous discharges, not only optimally activated neurons but all cells whose responses contribute to the coarse code should be able to syn- chronize. If, on the other hand, only optimally activated neurons were able to synchronize their responses, either the concept of coarse coding or the hypothesis of binding by synchrony would have to be abandoned.
In previous studies of response synchronization in the visual cortex, this issue has not explicitly been addressed (Ts’o et al. 1986; Gray et al. 1989; Engel et al. 1990, 1991; Nelson et al. 1992). For the most part, these studies have been performed with visual stimuli that were optimal for the analyzed neurons. Only if these showed major differences in their re- sponse properties suboptimal stimuli had been used representing a com- promise between the respective feature preferences of the recorded cells. However, the influence of suboptimal stimulation on neural synchrony has so far not been studied on its on right.
The goal of the present study was to examine, in a systematic way, the temporal relationship between responses of optimally and subop- timally stimulated neurons. In particular, we sought to determine the phase relationship and the temporal precision with which suboptimally driven neurons synchronize their responses. Simulation studies of the integrative properties of pyramidal neurons suggest that for conditions encountered in the cerebral cortex, the window for temporal integration may be as narrow as a few milliseconds (Abeles 1982; Bernander et al. 1991; Softky and Koch 1993). Thus, response synchronization among neurons contributing to a coarse-coded representation should exhibit a precision in the millisecond range. To investigate the temporal relation- ship between optimally and suboptimally driven neurons, we performed simultaneous recordings with multiple electrodes from the primary vi- sual cortex of anesthetized cats.
Neuronal Synchronization 471
2 Methods
The data were collected from five adult cats. In one of the cats a con- vergent strabismus had been induced at the age of 3 weeks by cutting the medial rectus muscle of one eye. Subsequently, the visual acuity of this cat had been tested behaviorally using a modification of the so-called jumping stand method (Mitchell e f al. 1976; Roelfsema et al. 1994). For recording, all animals were prepared and maintained as described in de- tail elsewhere (Engel et al. 1990). Briefly, anesthesia was induced with ketamine and xylazine (10 and 2.5 mg/kg, respectively) and maintained with 70% N 2 0 and 30% O2 supplemented by 0.4 to 2% halothane. After completion of the surgical procedures, the cats were paralyzed with hex- acarbacholine bromide (1-2.5 mg/hr). During the subsequent recording sessions, the parameters of anesthesia remained unchanged. We recorded multiunit activity with arrays of closely spaced teflon-coated platinum- iridium wires from the representation of the central visual field in area 17. The multiunit activity, which usually comprised spikes of one to five neurons, was extracted from the amplified and filtered electrode signals using a Schmitt trigger whose threshold was set to at least three times the noise level. The trigger pulses were sampled at 1 kHz and stored on disk.
For visual stimulation the optical axes of the two eyes were aligned with a prism to permit binocular stimulus presentation. Prior to quanti- tative measurements the size and the position of the receptive fields of the recorded neurons were determined by manual mapping on a tangent screen. Since the interelectrode distances were below 2 mm the receptive fields of the recorded cells were in all cases overlapping. For a quantita- tive assessment of the cells' preferred stimulus parameters, visual stimuli were generated with a computer-controlled optical bench. For the com- pilation of orientation tuning curves eight different orientations were presented at steps of 22.5'. The optimal orientation was assessed quan- titatively by fitting a gaussian to the resulting tuning curve. Using this method, the neurons' preferred orientation could be determined with a precision of approximately 5". In the strabismic cat we compared, in ad- dition, the neuronal responses to two square-wave gratings that differed in spatial frequency by one octave (0.6 and 1.2 cycles/degree, respec- tively; Roelfsema et al. 1994). Prior psychophysical measurements had established that the cat was able to discriminate both gratings with its nonamblyopic eye. All recordings from this cat included in the present study were dominated by this eye.
For correlation analysis, neurons were activated with single light bars or gratings of different orientation that moved orthogonal to their axis of orientation forward and backward across the receptive fields. Each trial lasted for 10 sec and was repeated at intervals of 15 sec. At least 10 responses to the same stimulus were recorded. During all measure- ments, bar stimuli with different orientations were interleaved to control
472 I? Konig et al.
for potential slow changes in recording conditions. The orientation of these stimuli did not always fall into the interval defined by the cells’ preferred orientations but could also range beyond this interval. For a quantitative description of the influence of stimulus orientation on the temporal relationships observed, we computed the average deviation of the stimulus orientation (SO) from the preferred orientations (Pol, P02) of the recorded neurons: (]PO1 - SO] + JP02 - S0))/2. The pairs of recording sites used for correlation analysis were selected according to two criteria. First, their orientation preference had to differ significantly to allow for their optimal and suboptimal activation by a single stim- ulus. Second, their tuning had to be broad enough to allow for their coactivation by single stimuli of at least two different orientations.
For quantitative evaluation of the temporal correlation we used a stan- dard procedure described elsewhere (Konig 1994). Briefly, peristimulus- time histograms and cross-correlation functions were calculated for the spike trains in the first and second half of each 10 sec trial, correspond- ing to forward and backward movements of the stimulus, respectively. The correlograms were computed for time shifts of up to 80 msec and then summed up to obtain a single correlation function. In the same way, we computed shift predictors for the temporal correlation (Perkel et al. 1967). As described in previous studies (Gray et al. 1989; Engel et al. 19901, these shift predictors were flat in all cases, which indicates that the correlograms did not contain stimulus-locked temporal structures on the timescale investigated. To quantify the strength of neural synchroniza- tion, a damped generalized sinusoid (Gabor function) was fitted to each of the correlograms. For this, we employed the Marquardt-Levenberg algorithm that supplies values and error estimates for amplitude and fre- quency of the correlogram modulation, as well as for its decay constant, phase shift, and offset (Press et al. 1986). As described in detail elsewhere (Konig 19941, this procedure allowed testing the significance of eventu- ally occurring center peaks. A center peak was accepted as indicating a synchronization of the respective neuronal responses if the amplitude of the central maximum of the sinusoid was significantly different from zero at the 5% level and if, in addition, the fit led to a reduction of the x2 value of at least 15%, i.e., if the fitted function explained at least 15% of the variance of the data. The error estimates for the phase shift of the fitted function were used for regression analysis.
3 Results
In the four normally raised cats 61 pairs of recording sites met the se- lection criteria stated in the Methods section. In 57% of these pairs a synchronization was observed for some of the stimuli tested, i.e., a sig- nificant center peak occurred in the correlogram showed and, in addition, the fit yielded an appropriate x2 reduction (cf. Methods). In 11% of the
Neuronal Synchronization 473
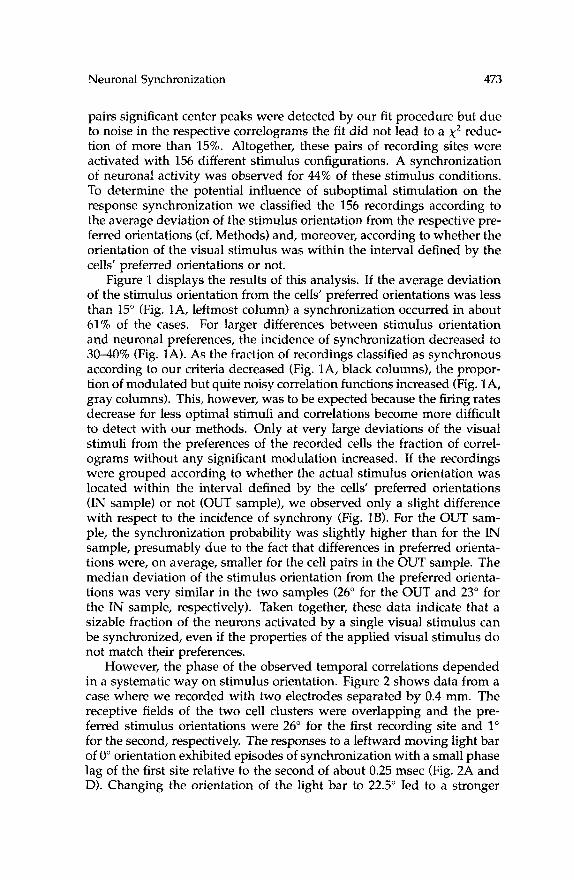
pairs significant center peaks were detected by our fit procedure but due to noise in the respective correlograms the fit did not lead to a x2 reduc- tion of more than 15%. Altogether, these pairs of recording sites were activated with 156 different stimulus configurations. A synchronization of neuronal activity was observed for 44% of these stimulus conditions. To determine the potential influence of suboptimal stimulation on the response synchronization we classified the 156 recordings according to the average deviation of the stimulus orientation from the respective pre- ferred orientations (cf. Methods) and, moreover, according to whether the orientation of the visual stimulus was within the interval defined by the cells' preferred orientations or not.
Figure 1 displays the results of this analysis. If the average deviation of the stimulus orientation from the cells' preferred orientations was less than 15" (Fig. lA, leftmost column) a synchronization occurred in about 61 % of the cases. For larger differences between stimulus orientation and neuronal preferences, the incidence of synchronization decreased to 3040% (Fig. 1A). As the fraction of recordings classified as synchronous according to our criteria decreased (Fig. lA, black columns), the propor- tion of modulated but quite noisy correlation functions increased (Fig. lA, gray columns). This, however, was to be expected because the firing rates decrease for less optimal stimuli and correlations become more difficult to detect with our methods. Only at very large deviations of the visual stimuli from the preferences of the recorded cells the fraction of correl- ograms without any significant modulation increased. If the recordings were grouped according to whether the actual stimulus orientation was located within the interval defined by the cells' preferred orientations (IN sample) or not (OUT sample), we observed only a slight difference with respect to the incidence of synchrony (Fig. 1B). For the OUT sam- ple, the synchronization probability was slightly higher than for the IN sample, presumably due to the fact that differences in preferred orienta- tions were, on average, smaller for the cell pairs in the OUT sample. The median deviation of the stimulus orientation from the preferred orienta- tions was very similar in the two samples (26" for the OUT and 23" for the IN sample, respectively). Taken together, these data indicate that a sizable fraction of the neurons activated by a single visual stimulus can be synchronized, even if the properties of the applied visual stimulus do not match their preferences.
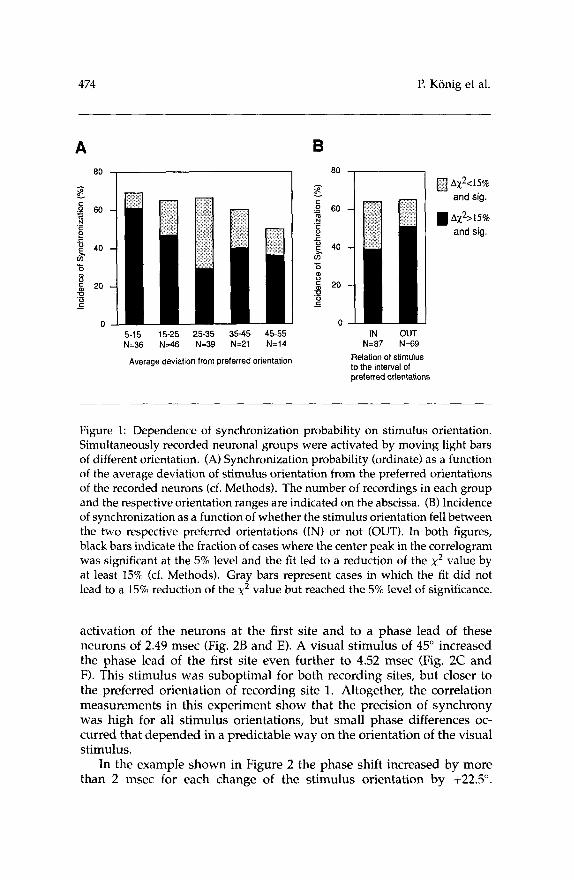
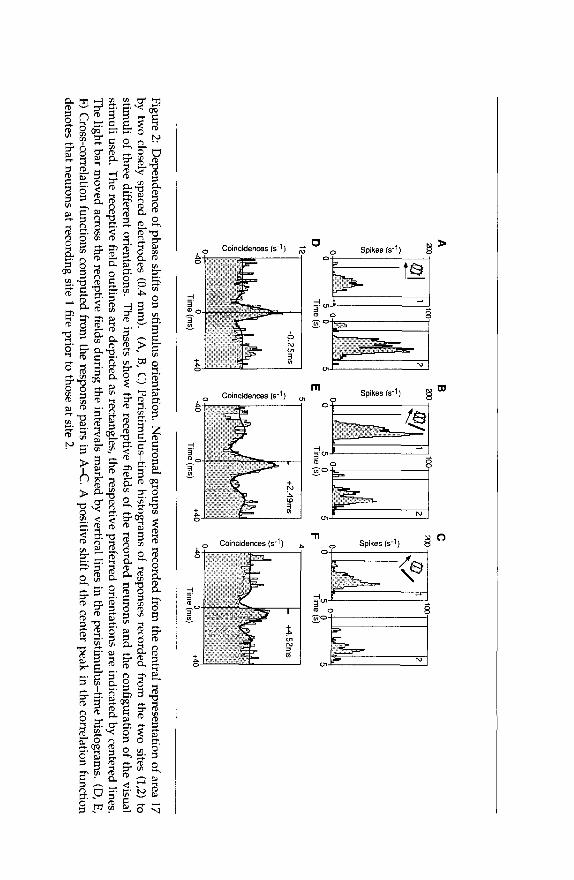
However, the phase of the observed temporal correlations depended in a systematic way on stimulus orientation. Figure 2 shows data from a case where we recorded with two electrodes separated by 0.4 mm. The receptive fields of the two cell clusters were overlapping and the pre- ferred stimulus orientations were 26" for the first recording site and 1" for the second, respectively. The responses to a leftward moving light bar of 0" orientation exhibited episodes of synchronization with a small phase lag of the first site relative to the second of about 0.25 msec (Fig. 2A and D). Changing the orientation of the light bar to 22.5" led to a stronger
474 I? Konig et al.
5-15 15-25 25-35 35-45 45-55 N=36 N=46 N=39 N=21 N=14
B
IN OUT N=87 N=69
a Ax2<15% and sig.
Ax2>15% and sig.
Average deviation from preferred orientation Relation of stimulus to the interval of preferred orientations
Figure 1: Dependence of synchronization probability on stimulus orientation. Simultaneously recorded neuronal groups were activated by moving light bars of different orientation. (A) Synchronization probability (ordinate) as a function of the average deviation of stimulus orientation from the preferred orientations of the recorded neurons (cf. Methods). The number of recordings in each group and the respective orientation ranges are indicated on the abscissa. (B) Incidence of synchronization as a function of whether the stimulus orientation fell between the two respective preferred orientations (IN) or not (OUT). In both figures, black bars indicate the fraction of cases where the center peak in the correlogram was significant at the 5% level and the fit led to a reduction of the x2 value by at least 15% (cf. Methods). Gray bars represent cases in which the fit did not lead to a 15% reduction of the x2 value but reached the 5% level of significance.
activation of the neurons at the first site and to a phase lead of these neurons of 2.49 msec (Fig. 2B and E). A visual stimulus of 45” increased the phase lead of the first site even further to 4.52 msec (Fig. 2C and F). This stimulus was suboptimal for both recording sites, but closer to the preferred orientation of recording site 1. Altogether, the correlation measurements in this experiment show that the precision of synchrony was high for all stimulus orientations, but small phase differences oc- curred that depended in a predictable way on the orientation of the visual stimulus.
In the example shown in Figure 2 the phase shift increased by more than 2 msec for each change of the stimulus orientation by +22.5”.
A - ... 0 - 8 :: r 0
0
D
Time (5)
0 5
0
B
C
12 5
4
... -
- -
- - u)
(0
u)
II) u)
0 -
... -
8 0
0
P
P
P
s
m
m
m
5 i
c
0 0 -40
0 +40
0
Time (m
s) Tim
e (ms)
Time (m
s)
Figure 2: Dependence of phase shifts on stim
ulus orientation. Neuronal groups w
ere recorded from the central representation of area 17
by two closely spaced electrodes (0.4 mm
). (A, B, C
) Peristimulus-tim
e histograms of
responses recorded from the tw
o sites (1,2) to stim
uli of three different orientations. The insets show
the receptive fields of the recorded neurons and the configuration of the visual stim
uli used. The receptive field outlines are depicted as rectangles, the respective preferred orientations are indicated by centered lines.
The light bar m
oved across the receptive fields during the intervals marked by vertical lines in the peristim
ulus-time histogram
s. (D, E,
F) Cross-correlation functions com
puted from the response pairs in A
X. A
positive shift of the center peak in the correlation function denotes that neurons at recording site 1 fire prior to those at site 2.
476 P. Konig et al.
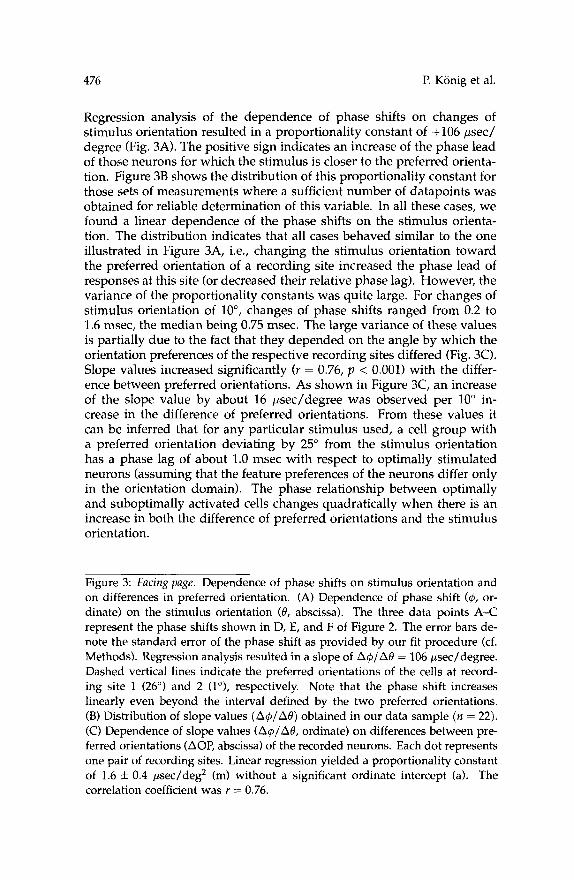
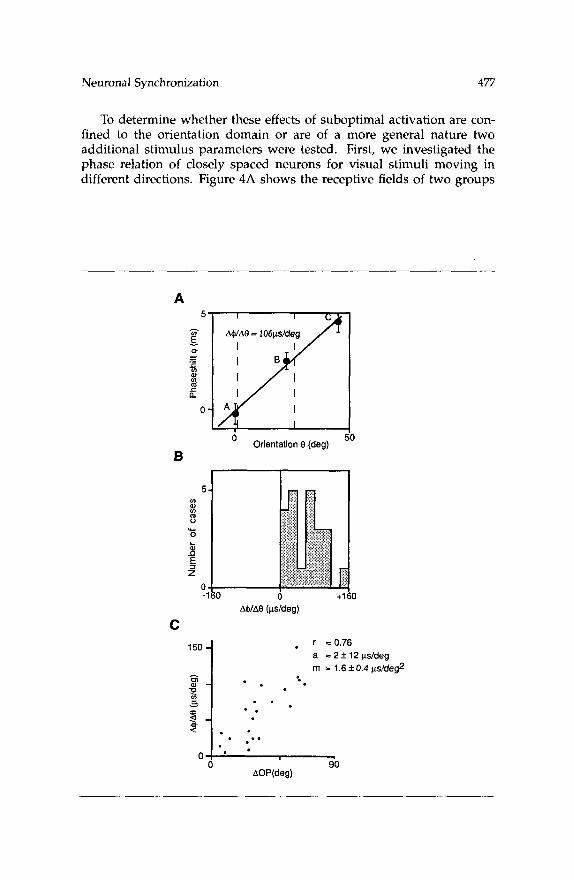
Regression analysis of the dependence of phase shifts on changes of stimulus orientation resulted in a proportionality constant of +lo6 psec/ degree (Fig. 3A). The positive sign indicates an increase of the phase lead of those neurons for which the stimulus is closer to the preferred orienta- tion. Figure 3B shows the distribution of this proportionality constant for those sets of measurements where a sufficient number of datapoints was obtained for reliable determination of this variable. In all these cases, we found a linear dependence of the phase shifts on the stimulus orienta- tion. The distribution indicates that all cases behaved similar to the one illustrated in Figure 3A, i.e., changing the stimulus orientation toward the preferred orientation of a recording site increased the phase lead of responses at this site (or decreased their relative phase lag). However, the variance of the proportionality constants was quite large. For changes of stimulus orientation of lo", changes of phase shifts ranged from 0.2 to 1.6 msec, the median being 0.75 msec. The large variance of these values is partially due to the fact that they depended on the angle by which the orientation preferences of the respective recording sites differed (Fig. 3C). Slope values increased significantly ( r = 0.76, p < 0.001) with the differ- ence between preferred orientations. As shown in Figure 3C, an increase of the slope value by about 16 pec/degree was observed per 10" in- crease in the difference of preferred orientations. From these values it can be inferred that for any particular stimulus used, a cell group with a preferred orientation deviating by 25" from the stimulus orientation has a phase lag of about 1.0 msec with respect to optimally stimulated neurons (assuming that the feature preferences of the neurons differ only in the orientation domain). The phase relationship between optimally and suboptimally activated cells changes quadratically when there is an increase in both the difference of preferred orientations and the stimulus orientation.
Figure 3: Facing page. Dependence of phase shifts on stimulus orientation and on differences in preferred orientation. (A) Dependence of phase shift (4, or- dinate) on the stimulus orientation (@, abscissa). The three data points A-C represent the phase shifts shown in D, E, and F of Figure 2. The error bars de- note the standard error of the phase shift as provided by our fit procedure (cf. Methods). Regression analysis resulted in a slope of A+/AO = 106 psec/degree. Dashed vertical lines indicate the preferred orientations of the cells at record- ing site 1 (26") and 2 (lo), respectively. Note that the phase shift increases linearly even beyond the interval defined by the two preferred orientations. (8) Distribution of slope values (A4/A@) obtained in our data sample ( n = 22). (C) Dependence of slope values (A4/A@, ordinate) on differences between pre- ferred orientations (AOP, abscissa) of the recorded neurons. Each dot represents one pair of recording sites. Linear regression yielded a proportionality constant of 1.6 f 0.4 psec/deg2 (m) without a significant ordinate intercept (a). The correlation coefficient was r = 0.76.
Neuronal Synchronization 477
To determine whether these effects of suboptimal activation are con- fined to the orientation domain or are of a more general nature two additional stimulus parameters were tested. First, we investigated the phase relation of closely spaced neurons for visual stimuli moving in different directions. Figure 4A shows the receptive fields of two groups
A 5
2 v
8
c al
E
I E 0
I I
A$/At3 = 106p/deg
' Orientation 8 (deg) B
I I 5
v)
I u Y-
L aJ n
Z 5 0 -160 0 +1
A$/Ae (ps/deg)
C
0
. r = 0.76 a = 2 f 12 ps/deg rn = 1.6 _+ 0.4 ps/deg2
. .. o ! *
0 90 AOP(deg)
478 I? Konig et al.
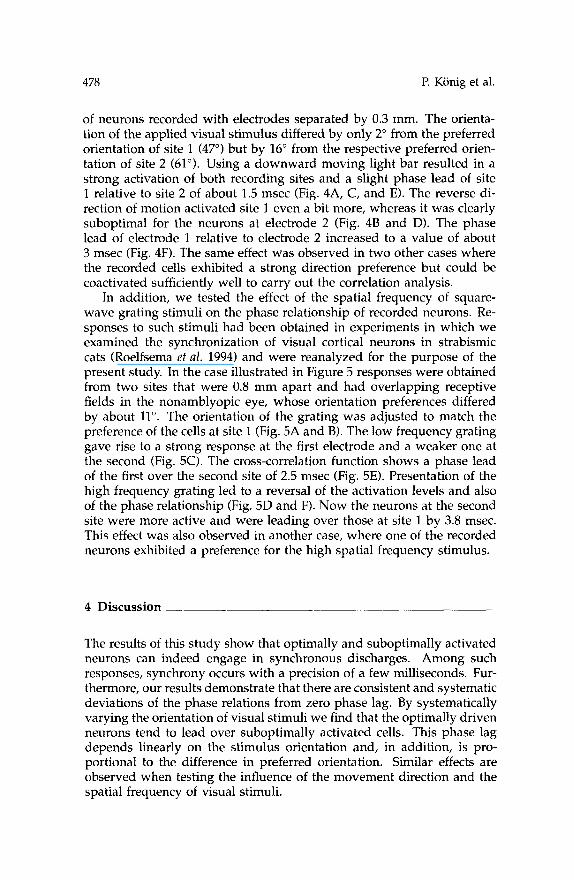
of neurons recorded with electrodes separated by 0.3 mm. The orienta- tion of the applied visual stimulus differed by only 2" from the preferred orientation of site 1 (47") but by 16" from the respective preferred orien- tation of site 2 (61"). Using a downward moving light bar resulted in a strong activation of both recording sites and a slight phase lead of site 1 relative to site 2 of about 1.5 msec (Fig. 4A, C, and E). The reverse di- rection of motion activated site 1 even a bit more, whereas it was clearly suboptimal for the neurons at electrode 2 (Fig. 4B and D). The phase lead of electrode 1 relative to electrode 2 increased to a value of about 3 msec (Fig. 4F). The same effect was observed in two other cases where the recorded cells exhibited a strong direction preference but could be coactivated sufficiently well to carry out the correlation analysis.
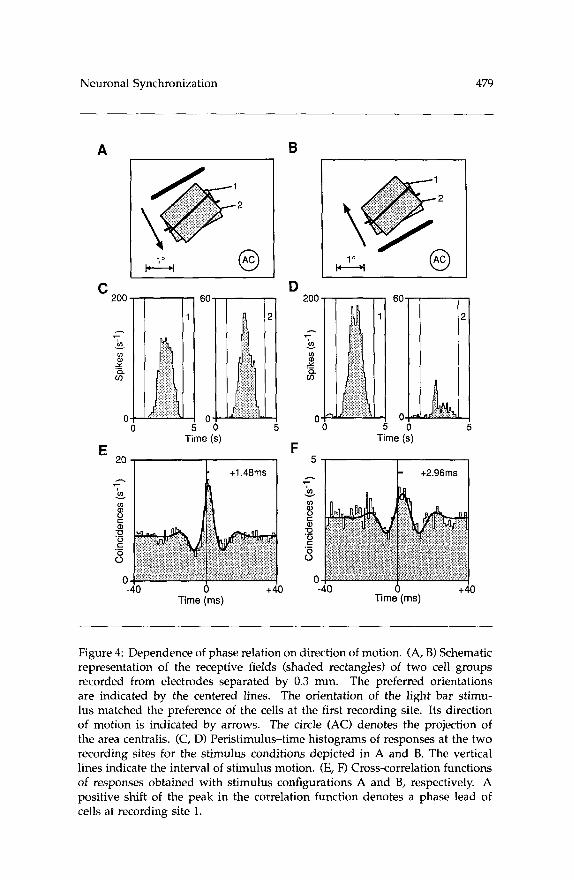
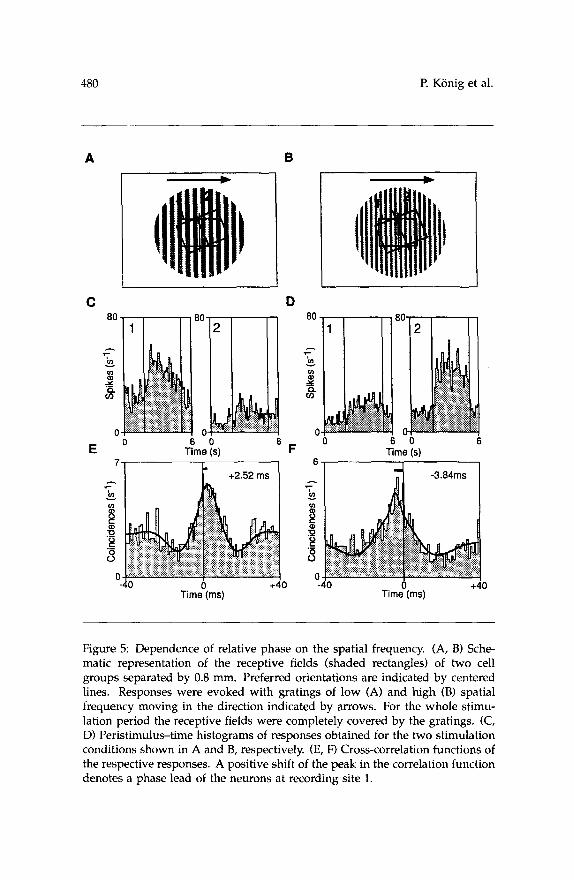
In addition, we tested the effect of the spatial frequency of square- wave grating stimuli on the phase relationship of recorded neurons. Re- sponses to such stimuli had been obtained in experiments in which we examined the synchronization of visual cortical neurons in strabismic cats (Roelfsema et al. 1994) and were reanalyzed for the purpose of the present study. In the case illustrated in Figure 5 responses were obtained from two sites that were 0.8 mm apart and had overlapping receptive fields in the nonamblyopic eye, whose orientation preferences differed by about 11". The orientation of the grating was adjusted to match the preference of the cells at site 1 (Fig. 5A and B). The low frequency grating gave rise to a strong response at the first electrode and a weaker one at the second (Fig. 5C). The cross-correlation function shows a phase lead of the first over the second site of 2.5 msec (Fig. 5E). Presentation of the high frequency grating led to a reversal of the activation levels and also of the phase relationship (Fig. 5D and F). Now the neurons at the second site were more active and were leading over those at site 1 by 3.8 msec. This effect was also observed in another case, where one of the recorded neurons exhibited a preference for the high spatial frequency stimulus.
4 Discussion
The results of this study show that optimally and suboptimally activated neurons can indeed engage in synchronous discharges. Among such responses, synchrony occurs with a precision of a few milliseconds. Fur- thermore, our results demonstrate that there are consistent and systematic deviations of the phase relations from zero phase lag. By systematically varying the orientation of visual stimuli we find that the optimally driven neurons tend to lead over suboptimally activated cells. This phase lag depends linearly on the stimulus orientation and, in addition, is pro- portional to the difference in preferred orientation. Similar effects are observed when testing the influence of the movement direction and the spatial frequency of visual stimuli.
Neuronal Synchronization 479
A B
200 60 200 60
r - 7
ln ln
ln 0 - Y
g u v) w 0 0 0 0 0 5
Time (s) Time (s)
5 F
20 - 7 h
?
m m v - I b c
a,
S
0
a,
0 c 0 0
2 n 0
s .- .-
0 0
0 0
Time (ms) Time (ms)
Figure 4: Dependence of phase relation on direction of motion. (A, B) Schematic representation of the receptive fields (shaded rectangles) of two cell groups recorded from electrodes separated by 0.3 mm. The preferred orientations are indicated by the centered lines. The orientation of the light bar stimu- lus matched the preference of the cells at the first recording site. Its direction of motion is indicated by arrows. The circle (AC) denotes the projection of the area centralis. (C, D) Peristimulus-time histograms of responses at the two recording sites for the stimulus conditions depicted in A and B. The vertical lines indicate the interval of stimulus motion. (E, F) Cross-correlation functions of responses obtained with stimulus configurations A and 8, respectively. A positive shift of the peak in the correlation function denotes a phase lead of cells at recording site 1.
480 I? Konig et al.
A B
C D
O E 6 Time
0 F
6 9
7 +2.52 ms
6 , I
I -3.84ms 1
-40 0 t40 Time (ms)
--40 +40 Time (ms)
Figure 5: Dependence of relative phase on the spatial frequency. (A, B) Sche- matic representation of the receptive fields (shaded rectangles) of two cell groups separated by 0.8 mm. Preferred orientations are indicated by centered lines. Responses were evoked with gratings of low (A) and high (B) spatial frequency moving in the direction indicated by arrows. For the whole stimu- lation period the receptive fields were completely covered by the gratings. (C, D) Peristimulus-time histograms of responses obtained for the two stimulation conditions shown in A and B, respectively. (E, F) Cross-correlation functions of the respective responses. A positive shift of the peak in the correlation function denotes a phase lead of the neurons at recording site 1.
Neuronal Synchronization 481
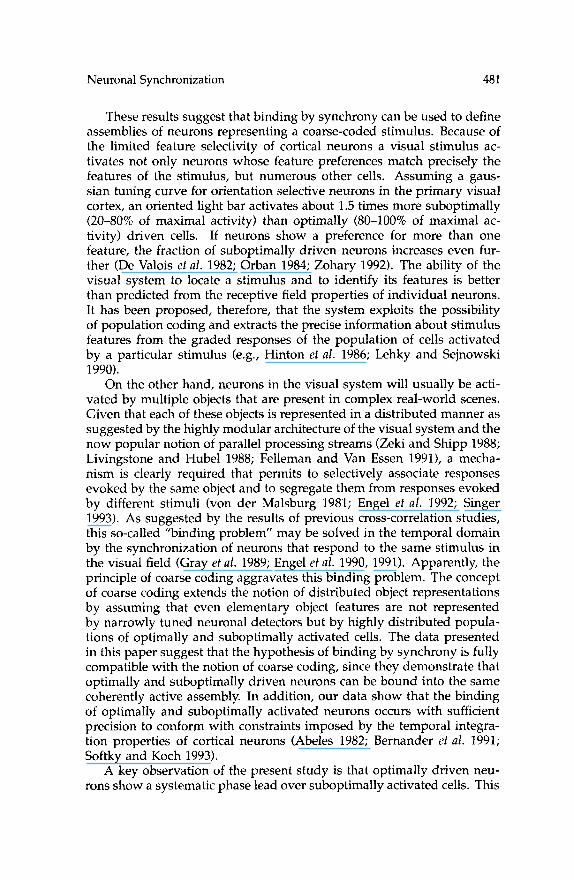
These results suggest that binding by synchrony can be used to define assemblies of neurons representing a coarse-coded stimulus. Because of the limited feature selectivity of cortical neurons a visual stimulus ac- tivates not only neurons whose feature preferences match precisely the features of the stimulus, but numerous other cells. Assuming a gaus- sian tuning curve for orientation selective neurons in the primary visual cortex, an oriented light bar activates about 1.5 times more suboptimally (20-80% of maximal activity) than optimally (80-100% of maximal ac- tivity) driven cells. If neurons show a preference for more than one feature, the fraction of suboptimally driven neurons increases even fur- ther (De Valois et al. 1982; Orban 1984; Zohary 1992). The ability of the visual system to locate a stimulus and to identify its features is better than predicted from the receptive field properties of individual neurons. It has been proposed, therefore, that the system exploits the possibility of population coding and extracts the precise information about stimulus features from the graded responses of the population of cells activated by a particular stimulus (e.g., Hinton et al. 1986; Lehky and Sejnowski 1990).
On the other hand, neurons in the visual system will usually be acti- vated by multiple objects that are present in complex real-world scenes. Given that each of these objects is represented in a distributed manner as suggested by the highly modular architecture of the visual system and the now popular notion of parallel processing streams (Zeki and Shipp 1988; Livingstone and Hubel 1988; Felleman and Van Essen 19911, a mecha- nism is clearly required that permits to selectively associate responses evoked by the same object and to segregate them from responses evoked by different stimuli (von der Malsburg 1981; Engel et al. 1992; Singer 1993). As suggested by the results of previous cross-correlation studies, this so-called “binding problem” may be solved in the temporal domain by the synchronization of neurons that respond to the same stimulus in the visual field (Gray et al. 1989; Engel et a/. 1990, 1991). Apparently, the principle of coarse coding aggravates this binding problem. The concept of coarse coding extends the notion of distributed object representations by assuming that even elementary object features are not represented by narrowly tuned neuronal detectors but by highly distributed popula- tions of optimally and suboptimally activated cells. The data presented in this paper suggest that the hypothesis of binding by synchrony is fully compatible with the notion of coarse coding, since they demonstrate that optimally and suboptimally driven neurons can be bound into the same coherently active assembly. In addition, our data show that the binding of optimally and suboptimally activated neurons occurs with sufficient precision to conform with constraints imposed by the temporal integra- tion properties of cortical neurons (Abeles 1982; Bernander et at. 1991; Softky and Koch 1993).
A key observation of the present study is that optimally driven neu- rons show a systematic phase lead over suboptimally activated cells. This
482 P. Konig et al.
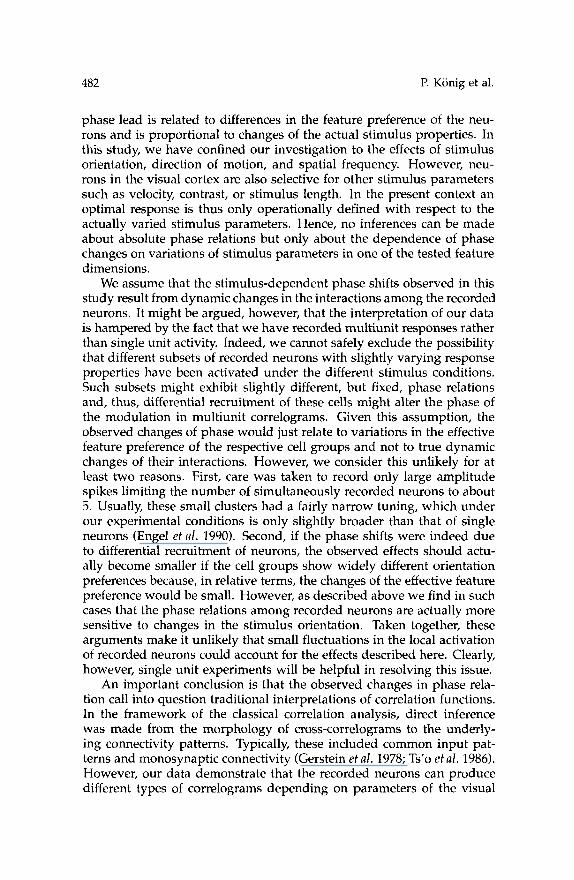
phase lead is related to differences in the feature preference of the neu- rons and is proportional to changes of the actual stimulus properties. In this study, we have confined our investigation to the effects of stimulus orientation, direction of motion, and spatial frequency. However, neu- rons in the visual cortex are also selective for other stimulus parameters such as velocity, contrast, or stimulus length. In the present context an optimal response is thus only operationally defined with respect to the actually varied stimulus parameters. Hence, no inferences can be made about absolute phase relations but only about the dependence of phase changes on variations of stimulus parameters in one of the tested feature dimensions.
We assume that the stimulus-dependent phase shifts observed in this study result from dynamic changes in the interactions among the recorded neurons. It might be argued, however, that the interpretation of our data is hampered by the fact that we have recorded multiunit responses rather than single unit activity. Indeed, we cannot safely exclude the possibility that different subsets of recorded neurons with slightly varying response properties have been activated under the different stimulus conditions. Such subsets might exhibit slightly different, but fixed, phase relations and, thus, differential recruitment of these cells might alter the phase of the modulation in multiunit correlograms. Given this assumption, the observed changes of phase would just relate to variations in the effective feature preference of the respective cell groups and not to true dynamic changes of their interactions. However, we consider this unlikely for at least two reasons. First, care was taken to record only large amplitude spikes limiting the number of simultaneously recorded neurons to about 5. Usually, these small clusters had a fairly narrow tuning, which under our experimental conditions is only slightly broader than that of single neurons (Engel et al. 1990). Second, if the phase shifts were indeed due to differential recruitment of neurons, the observed effects should actu- ally become smaller if the cell groups show widely different orientation preferences because, in relative terms, the changes of the effective feature preference would be small. However, as described above we find in such cases that the phase relations among recorded neurons are actually more sensitive to changes in the stimulus orientation. Taken together, these arguments make it unlikely that small fluctuations in the local activation of recorded neurons could account for the effects described here. Clearly, however, single unit experiments will be helpful in resolving this issue.
An important conclusion is that the observed changes in phase rela- tion call into question traditional interpretations of correlation functions. In the framework of the classical correlation analysis, direct inference was made from the morphology of cross-correlograms to the underly- ing connectivity patterns. Typically, these included common input pat- terns and monosynaptic connectivity (Gerstein et al. 1978; Ts’o et al. 1986). However, our data demonstrate that the recorded neurons can produce different types of correlograms depending on parameters of the visual
Neuronal Synchronization 483
stimulus. Thus, for instance, the correlogram in Figure 2D shows a cen- tral peak nearly symmetric about zero that, in classical terms, suggests a common driving input. Yet, the same pair of recordings can display a correlogram with a peak offset from zero, usually taken as indicative of a monosynaptic connection, when stimulated with a light bar of dif- ferent orientation (Fig. 2F). Obviously, then, correlograms cannot directly be interpreted in anatomical terms. Rather, models of neuronal circuitry designed to explain the functional connectivity in correlograms should envisage dynamically varying interactions among interconnected sets of neurons. In this respect, the quantitative data reported here could serve as an additional source of constraints for the evaluation of possible mod- els of stimulus-specific synchronization (Sporns et al. 1989; Sompolinsky et al. 1990; Konig and Schillen 1991) and coarse coding (Lehky and Sej- nowsky 1990).
Acknowledgments
We are pleased to thank Renate Ruhl-Volsing and Susanne Herzog for excellent technical assistance and we are obliged to the referees for helpful comments on the manuscript.
References
Abeles, M. 1982. Local Cortical Circuits. A n Elecfrophysiological Study. Springer, Berlin.
Bernander, 0. E., Douglas, R. J., Martin, K. A. C., and Koch, C. 1991. Synaptic background activity influences spatiotemporal integration in single pyrami- dal cells. Proc. Natl. Acad. Sci. U.S.A. 88, 11569-11573.
De Valois, R. L., Albrecht, D. G., and Thorell, L. G. 1982. Spatial frequency selectivity of cells in macaque visual cortex. Vision Res. 22, 545-559.
Engel, A. K., Konig, I?, Gray, C. M., and Singer, W. 1990. Stimulus-dependent neuronal oscillations in cat visual cortex: Inter-columnar interaction as de- termined by cross-correlation analysis. Eur. J. Neurosci. 2, 588-606.
Engel, A. K., Konig, P., and Singer, W. 1991. Direct physiological evidence for scene segmentation by temporal coding. Proc. Natl. Acad. Sci. U.S.A. 88, 9136-9140.
Engel, A. K., Konig, P., Kreiter, A. K., Schillen, T. B., and Singer, W. 1992. Temporal coding in the visual cortex: New vistas on integration in the nervous system. Trends Neurosci. 15, 218-226.
Felleman, D. J., and Van Essen, D. C. 1991. Distributed hierarchical processing in the primate cerebral cortex. Cerebral Cortex 1, 1-47.
Geogopoulos, A. P., Schwartz, A. B., and Kettner, R. E. 1986. Neural population coding of movement direction. Science 233, 1416-1419.
Gerstein, G. L., Perkel, D. H., and Subramanian, K. N. 1978. Identification of functionally related neural assemblies. Brain Res. 140, 43-62.
484 P. Konig et al.
Gray, C. M., Konig, P., Engel, A. K., and Singer, W. 1989. Oscillatory responses in cat visual cortex exhibit inter-columnar synchronization which reflects global stimulus properties. Nature (London) 338, 334-337.
Hinton, G. E., McClelland, J. L., and Rumelhart, D. E. 1986. Distributed repre- sentations. In Parallel Distributed Processing, D. E. Rumelhart and J. L. Mc- Clelland, eds., pp. 77-109. MIT Press, Cambridge.
Konig, P. 1994. A method for the quantification of synchrony and oscillatory properties of neuronal activity. J. Neurosci. Meth. 54, 31-37.
Konig, P., and Schillen, T. B. 1991. Stimulus-dependent assembly formation of oscillatory responses. I. Synchronization. Neural Cornp. 3, 155-166.
Lehky, S. R., and Sejnowsky, T. J. 1990. Neural model of stereoacuity and depth interpolation based on distributed representation of stereo disparity. J. Neurosci. 10, 2281-2299.
Livingstone, M., and Hubel, D. 1988. Segregation of form, colour, movement, and depth: Anatomy, physiology, and perception. Science 240, 740-749.
Milner, P. M. 1974. A model for visual shape recognition. Psychol. Rev. 81,
Mitchell, D. E., Giffin, F., Wilkinson, F., Anderson, P., and Smith, M. L. 1976. Visual resolution in young kittens. Vision Res. 16, 363-366.
Nelson, J. I., Salin, P. A., Munk, M., Arzi, M., and Bullier, J. 1992. Spatial and temporal coherence in cortico cortical connections: A cross-correlation study in area 17 and 18 in the cat. Visual Neurosci. 9, 21-38.
521-535.
Orban, G. A. 1984. Neural Operations in the Visual Cortex. Springer, Berlin. Perkel, D. H., Gerstein, G. L., and Moore, G. P. 1967. Neuronal spike trains
and stochastic point processes. 11. Simultaneous spike trains. Biophys. J. 7, 419-440.
Press, D. H., Flannery, B. P., Teukolsky, S. A., and Vetterling, W. T. 1986. Nu- merical Recipes. Cambridge University Press, Cambridge.
Roelfsema, P. R., Konig, P., Engel, A. K., Sireteanu, R., and Singer, W. 1994. Reduced synchronization in the visual cortex of cats with strabismic ambly- opia. E m J. Neurosci. 6, 1645-1655.
Shimizu, H., Yamaguchi, Y., Tsuda, I., and Yano, M. 1986. Pattern recogni- tion based on holonic information dynamics: Towards synergetic comput- ers. In Complex systems-Operational Approaches, H. Haken, ed., pp. 225-240. Springer, Berlin.
Singer, W. 1993. Synchronization of cortical activity and its putative role in information processing and learning. Annu. Rev. Physiol. 55, 349-374.
Softky, W. R., and Koch, C. 1993. The highly irregular firing of cortical cells is inconsistent with temporal integration of random EPSPs. J. Neurosci. 13, 334-350.
Sompolinsky, H., Golomb, D., and Kleinfeld, D. 1990. Global processing of visual stimuli in a neural network of coupled oscillators. Proc. Natl. Acad. Sci. U.S.A. 87, 7200-7204.
Sporns, O., Gally, J. A., Reeke, Jr., G. N., and Edelman, G. M. 1989. Reentrant signaling among simulated neuronal groups leads to coherency in their os- cillatory activity. Proc. Natl. Acad. Sci. U.S.A. 86, 7265-7269.
Ts’o, D. Y., Gilbert, C. D., and Wiesel, T. N. 1986. Relationships between horizon-
Neuronal Synchronization 485
tal interactions and functional architecture in cat striate cortex as revealed by cross-correlation analysis. J. Neurosci. 6, 1160-1170.
Vogels, R. 1990. Population coding of stimulus orientation by striate cortical cells. Biol. Cybern. 64, 25-31.
von der Malsburg, C. 1981. The correlation theory of brain function. Internal Report 81-2. Max-Planck-Institute for Biophysical Chemistry, Gottingen.
Zeki, S., and Shipp, S. 1988. The functional logic of cortical connections. Nature (London) 335, 311-317.
Zohary, E. 1992. Population coding of visual stimuli by cortical neurons tuned to more than one dimension. Biol. Cybern. 66, 265-272.
Received April 29, 1994; accepted September 27, 1994.
This article has been cited by:
1. Timothée Masquelier, Gustavo DecoLearning and Coding in Neural Networks513-526. [CrossRef]
2. Martin Vinck, Thilo Womelsdorf, Pascal FriesGamma-Band Synchronization andInformation Transmission 449-470. [CrossRef]
3. Martin Vinck, Francesco Paolo Battaglia, Thilo Womelsdorf, Cyriel Pennartz. 2012.Improved measures of phase-coupling between spikes and the Local Field Potential.Journal of Computational Neuroscience 33:1, 53-75. [CrossRef]
4. Ozgur Yilmaz. 2012. Oscillatory synchronization model of attention to movingobjects. Neural Networks 29-30, 20-36. [CrossRef]
5. Danko Nikolić, Raul C. Mureşan, Weijia Feng, Wolf Singer. 2012. Scaledcorrelation analysis: a better way to compute a cross-correlogram. European Journalof Neuroscience no-no. [CrossRef]
6. Cyriel M.A. Pennartz, Marijn van Wingerden, Martin Vinck. 2011. Populationcoding and neural rhythmicity in the orbitofrontal cortex. Annals of the New YorkAcademy of Sciences 1239:1, 149-161. [CrossRef]
7. J. Ito, P. Maldonado, W. Singer, S. Grun. 2011. Saccade-Related Modulationsof Neuronal Excitability Support Synchrony of Visually Elicited Spikes. CerebralCortex 21:11, 2482-2497. [CrossRef]
8. Hadas Okon-Singer, Ilana Podlipsky, Tali Siman-Tov, Eti Ben-Simon, AndreyZhdanov, Miri Y. Neufeld, Talma Hendler. 2011. Spatio-temporal indications ofsub-cortical involvement in leftward bias of spatial attention. NeuroImage 54:4,3010-3020. [CrossRef]
9. David M. Alexander, Chris Trengove, Phillip E. Sheridan, Cees Leeuwen. 2010.Generalization of learning by synchronous waves: from perceptual organization toinvariant organization. Cognitive Neurodynamics . [CrossRef]
10. Han-Yan Gong, Ying-Ying Zhang, Pei-Ji Liang, Pu-Ming Zhang. 2010. Neuralcoding properties based on spike timing and pattern correlation of retinal ganglioncells. Cognitive Neurodynamics 4:4, 337-346. [CrossRef]
11. Benjamin Staude, Stefan Rotter, Sonja Grün. 2010. CuBIC: cumulant basedinference of higher-order correlations in massively parallel spike trains. Journal ofComputational Neuroscience 29:1-2, 327-350. [CrossRef]
12. Peng Wang, Martha N. Havenith, Micha Best, Christine Gruetzner, Wolf Singer,Peter Uhlhaas, Danko Nikolić. 2010. Time delays in the β/γ cycle operate on thelevel of individual neurons. NeuroReport 21:11, 746-750. [CrossRef]
13. B. Lima, W. Singer, N.-H. Chen, S. Neuenschwander. 2010. SynchronizationDynamics in Response to Plaid Stimuli in Monkey V1. Cerebral Cortex 20:7,1556-1573. [CrossRef]
14. M. Siegel, M. R. Warden, E. K. Miller. 2009. Phase-dependent neuronal codingof objects in short-term memory. Proceedings of the National Academy of Sciences106:50, 21341-21346. [CrossRef]
15. M HAVENITH, A ZEMMAR, S YU, S BAUDREXEL, W SINGER, DNIKOLIC. 2009. Measuring sub-millisecond delays in spiking activity withmillisecond time-bins. Neuroscience Letters 450:3, 296-300. [CrossRef]
16. P. J. Uhlhaas, C. Haenschel, D. Nikolic, W. Singer. 2008. The Role ofOscillations and Synchrony in Cortical Networks and Their Putative Relevancefor the Pathophysiology of Schizophrenia. Schizophrenia Bulletin 34:5, 927-943.[CrossRef]
17. Il Park, António R.C. Paiva, Thomas B. DeMarse, José C. Príncipe. 2008. Anefficient algorithm for continuous time cross correlogram of spike trains. Journalof Neuroscience Methods 168:2, 514-523. [CrossRef]
18. M. Santhanam, Siddharth Arora. 2007. Zero delay synchronization of chaos incoupled map lattices. Physical Review E 76:2. . [CrossRef]
19. Pascal Fries, Danko Nikolić, Wolf Singer. 2007. The gamma cycle. Trends inNeurosciences 30:7, 309-316. [CrossRef]
20. T. Womelsdorf, J.-M. Schoffelen, R. Oostenveld, W. Singer, R. Desimone, A. K.Engel, P. Fries. 2007. Modulation of Neuronal Interactions Through NeuronalSynchronization. Science 316:5831, 1609-1612. [CrossRef]
21. C. M. Sweeney-Reed, S. J. Nasuto. 2007. A novel approach to the detectionof synchronisation in EEG based on empirical mode decomposition. Journal ofComputational Neuroscience 23:1, 79-111. [CrossRef]
22. Danko Nikolić. 2007. Non-parametric detection of temporal order across pairwisemeasurements of time delays. Journal of Computational Neuroscience 22:1, 5-19.[CrossRef]
23. K SCHINDLER, P GOODMAN, H WIESER, R DOUGLAS. 2006. Fastoscillations trigger bursts of action potentials in neocortical neurons in vitro: Aquasi-white-noise analysis study. Brain Research 1110:1, 201-210. [CrossRef]
24. David Rudrauf, Abdel Douiri, Christopher Kovach, Jean-Philippe Lachaux, DiegoCosmelli, Mario Chavez, Claude Adam, Bernard Renault, Jacques Martinerie,Michel Le Van Quyen. 2006. Frequency flows and the time-frequency dynamicsof multivariate phase synchronization in brain signals. NeuroImage 31:1, 209-227.[CrossRef]
25. G. Schneider, D. Nikolić. 2006. Detection and assessment of near-zero delaysin neuronal spiking activity. Journal of Neuroscience Methods 152:1-2, 97-106.[CrossRef]
26. S SEVUSH. 2006. Single-neuron theory of consciousness. Journal of TheoreticalBiology 238:3, 704-725. [CrossRef]
27. D Kernick. 2005. Migraine - new perspectives from chaos theory. Cephalalgia 25:8,561-566. [CrossRef]
28. R VANRULLEN, R GUYONNEAU, S THORPE. 2005. Spike times make sense.Trends in Neurosciences 28:1, 1-4. [CrossRef]
29. Sang-Gui Lee, Shigeru Tanaka, Seunghwan Kim. 2004. Orientation tuning andsynchronization in the hypercolumn model. Physical Review E 69:1. . [CrossRef]
30. Andrea Benucci, Paul Verschure, Peter König. 2003. Existence of high-ordercorrelations in cortical activity. Physical Review E 68:4. . [CrossRef]
31. Maxim Volgushev, Joachim Pernberg, Ulf T. Eysel. 2003. gamma-Frequencyfluctuations of the membrane potential and response selectivity in visual corticalneurons. European Journal of Neuroscience 17:9, 1768-1776. [CrossRef]
32. R. Wyss, P. Konig, P. F. M. J. Verschure. 2003. Invariant representations of visualpatterns in a temporal population code. Proceedings of the National Academy ofSciences 100:1, 324-329. [CrossRef]
33. R VanRullen. 2002. Surfing a spike wave down the ventral stream. Vision Research42:23, 2593-2615. [CrossRef]
34. M. R. Mehta, A. K. Lee, M. A. Wilson. 2002. Role of experience and oscillationsin transforming a rate code into a temporal code. Nature 417:6890, 741-746.[CrossRef]
35. M.A. Sanchez-Montanes, P. Konig, P.F.M.J. Verschure. 2002. Learning sensorymaps with real-world stimuli in real time using a biophysically realistic learningrule. IEEE Transactions on Neural Networks 13:3, 619-632. [CrossRef]
36. Wolf SingerChapter 1 Cognition, gamma oscillations and neuronal synchrony 54,3-22. [CrossRef]
37. Wolf SingerResponse Synchronization, Gamma Oscillations, and PerceptualBinding in Cat Primary Visual Cortex 521-559. [CrossRef]
38. Stefano Panzeri, Huw Golledge, Fashan Zheng, Martin Tovee, Malcolm Young.2001. Objective assessment of the functional role of spike train correlations usinginformation measures. Visual Cognition 8:3, 531-547. [CrossRef]
39. D. Golomb, D. Hansel, G. MatoChapter 21 Mechanisms of synchrony of neuralactivity in large networks 4, 887-968. [CrossRef]
40. G.Bard Ermentrout, David Kleinfeld. 2001. Traveling Electrical Waves inCortexInsights from Phase Dynamics and Speculation on a Computational Role.Neuron 29:1, 33-44. [CrossRef]
41. Winrich A. Freiwald, Andreas K. Kreiter, Wolf SingerChapter 8 Synchronizationand assembly formation in the visual cortex 130, 111-140. [CrossRef]
42. K Körding. 2000. A spike based learning rule for generation of invariantrepresentations. Journal of Physiology-Paris 94:5-6, 539-548. [CrossRef]
43. Axel Frien, Reinhard Eckhorn. 2000. Functional coupling shows stronger stimulusdependency for fast oscillations than for low-frequency components in striate cortexof awake monkey. European Journal of Neuroscience 12:4, 1466-1478. [CrossRef]
44. K Körding. 2000. A learning rule for dynamic recruitment and decorrelation.Neural Networks 13:1, 1-9. [CrossRef]
45. S Helekar. 1999. On the Possibility of Universal Neural Coding of SubjectiveExperience. Consciousness and Cognition 8:4, 423-446. [CrossRef]
46. Reinhard Eckhorn. 1999. Neural Mechanisms of Visual Feature BindingInvestigated with Microelectrodes and Models. Visual Cognition 6:3, 231-265.[CrossRef]
47. R. Eckhorn. 1999. Neural mechanisms of scene segmentation: recordings from thevisual cortex suggest basic circuits for linking field models. IEEE Transactions onNeural Networks 10:3, 464-479. [CrossRef]
48. V Towle. 1998. Identification of the sensory/motor area and pathologic regionsusing ECoG coherence. Electroencephalography and Clinical Neurophysiology 106:1,30-39. [CrossRef]
49. M VOLGUSHEV, M CHISTIAKOVA, W SINGER. 1998. Modification ofdischarge patterns of neocortical neurons by induced oscillations of the membranepotential. Neuroscience 83:1, 15-25. [CrossRef]
50. Hiroshi Fujii, Hiroyuki Ito, Kazuyuki Aihara, Natsuhiro Ichinose, MinoruTsukada. 1996. Dynamical Cell Assembly Hypothesis — Theoretical Possibilityof Spatio-temporal Coding in the Cortex. Neural Networks 9:8, 1303-1350.[CrossRef]
51. Herman P. Snippe. 1996. Parameter Extraction from Population Codes: A CriticalAssessment. Neural Computation 8:3, 511-529. [Abstract] [PDF] [PDF Plus]
52. A Treisman. 1996. The binding problem. Current Opinion in Neurobiology 6:2,171-178. [CrossRef]
53. D. Hansel, H. Sompolinsky. 1996. Chaos and synchrony in a model of ahypercolumn in visual cortex. Journal of Computational Neuroscience 3:1, 7-34.[CrossRef]
54. H.D. Abarbanel, M.I. Rabinovich, A. Selverston, M.V. Bazhenov, R. Huerta, M.M.Sushchik, L.L. Rubchinskii. 1996. Synchronisation in neural networks. UspekhiFizicheskih Nauk 166:4, 363. [CrossRef]
55. P König. 1995. Correlated firing in sensory-motor systems. Current Opinion inNeurobiology 5:4, 511-519. [CrossRef]


