Embed Size (px)
Citation preview

lable at ScienceDirect
Journal of Archaeological Science 37 (2010) 2705e2720
Contents lists avai
Journal of Archaeological Science
journal homepage: http : / /www.elsevier .com/locate/ jas
The use of SEM-EDS, PIXE and EDXRF for obsidian provenance studiesin the Near East: a case study from Neolithic Çatalhöyük (central Anatolia)q
Gérard Poupeau a,b,*, François-Xavier Le Bourdonnec a, Tristan Carter c, Sarah Delerue a,M. Steven Shackley d, Jean-Alix Barrat e, Stéphan Dubernet a, Philippe Moretto f, Thomas Calligaro g,Marina Mili�c h, Katsuji Kobayashi i
aCentre de Recherche de Physique Appliquée à l’Archéologie et Institut de Recherche sur les Archéomatériaux, UMR 5060, CNRS-UniversitéMichel de Montaigne-Bordeaux 3, Esplanade des Antilles, 33607 Pessac, FrancebUMR 5194 et Département de Préhistoire, CNRS-Muséum National d’Histoire Naturelle, Paris, FrancecDepartment of Anthropology, McMaster University, Chester New Hall, 524, 1280 Main Street West, Hamilton, ON L8S 4L9, CanadadDepartment of Anthropology/Archaeological XRF Laboratory, University of California, Berkeley, CA 94720-3710, USAeCNRS/UBO, UMR 6538, Institut Universitaire Européen de la Mer, Place Copernic, 29280 Plouzané, FrancefUniversité Bordeaux 1, CNRS/IN2P3, Centre d’Etudes Nucléaires de Bordeaux Gradignan, CENBG, Chemin du Solarium, BP120, 33175 Gradignan, FrancegCentre de Recherche et de Restauration des Musées de France, UMR CNRS 171, 14 Quai François Mitterrand, 75001 Paris, Franceh Institute of Archaeology, University College London, 31-34 Gordon Square, WC1H 0PY, United Kingdomi School of Earth Sciences, The University of Melbourne, Melbourne, VIC 3010 Australia
a r t i c l e i n f o
Article history:Received 10 February 2010Received in revised form30 May 2010Accepted 8 June 2010
Keywords:Obsidian sourcingPIXESEM-EDSNon-destructive analysisÇatalhöyükAnatolian NeolithicEast Göllü Da�gNenezi Da�gNear East
q This article is dedicated to the late Joseph Salomonthe AGLAE research group of the Centre de RecheMusées de France (Paris), with whom some of us initiaprogram fifteen years ago, Joseph, who passed away acollaborator and friend of several of the authors, and whumanly indebted to him.* Corresponding author. Centre de Recherche de P
éologie et Institut de Recherche sur les Archéomatéversité Michel de Montaigne-Bordeaux 3, EsplanadeFrance.
E-mail addresses: [email protected], [email protected] (F.-X.mcmaster.ca (T. Carter), [email protected] (M. Stbrest.fr (J.-A. Barrat), [email protected] (P. Moretto), [email protected]@ucl.ac.uk (M. Mili�c), [email protected] (K. Kobay
0305-4403/$ e see front matter � 2010 Published bydoi:10.1016/j.jas.2010.06.007
a b s t r a c t
In this paper we evaluate the relative analytical capabilities of SEM-EDS, PIXE and EDXRF for charac-terizing archaeologically significant Anatolian obsidians on the basis of their elemental compositions.The study involves 54 geological samples from various sources, together with an archaeological casestudy involving 100 artifacts from Neolithic Çatalhöyük (central Anatolia). With each technique theartifacts formed two compositional groups that correlated with the East Göllü Da�g and Nenezi Da�gsources. The non-destructive capabilities of these methods are emphasized (albeit with certain analyticallimitations in the case of SEM-EDS), suggesting important new techniques for Near Eastern obsidianprovenance studies.
� 2010 Published by Elsevier Ltd.
, a former leading member ofrche et de Restauration dested this obsidian provenancefew months ago, was a closee feel both scientifically and
hysique Appliquée à l’Arch-riaux, UMR 5060, CNRS-Uni-des Antilles, 33607 Pessac,
[email protected] (G. Poupeau),Le Bourdonnec), stringy@
even Shackley), [email protected] (S. Dubernet), moretto@fr (T. Calligaro), marina.milic.ashi).
Elsevier Ltd.
1. Introduction
Obsidian was the primary raw material used by the inhabitantsof Çatalhöyük (Konya Plain, central Anatolia) for themanufacture oftheir chipped stone tools throughout its Aceramic Neolithic e EarlyChalcolithic occupation (c.7400e5500 cal BC, Cessford et al., 2005),despite the fact that the nearest sources are located�190 km to thenortheast in the volcanic region of Cappadocia (Fig. 1). In 1999, aspart of the renewed work at the site, a major program of obsidiancharacterization was initiated to investigate the long-term use ofobsidian at Çatalhöyük. From the outset this work involved morethan one laboratory and employed a range of analytical techniques(Table 1), i.e. our project is interested not only in the archaeologicalramifications of our analyses, but also the collaborative develop-ment of innovative archaeometric approaches.

Fig. 1. Map of Anatolia showing the location of Çatalhöyük and the obsidian sources cited in the text.
G. Poupeau et al. / Journal of Archaeological Science 37 (2010) 2705e27202706
Recent work at CRP2A (Bordeaux) has involved the investiga-tion of two non-destructive analytical techniques that havereceived little, or no previous application in Near Eastern obsidiansourcing studies, namely scanning electron microscopy-energydispersive spectroscopy (SEM-EDS) (Keller and Seifried, 1990;Delerue, 2007; Delerue and Poupeau, 2007) and particle inducedx-ray emission (PIXE) (Abbès et al., 2003; Le Bourdonnec et al.,2005; Delerue, 2007; Carter et al., 2008). This paper focusesinitially on the ability of these two methods to chemicallydiscriminate some of the major Anatolian obsidian sources and toreport new sourcing data using these approaches on 100 obsidianartifacts from Aceramic e Early Pottery Neolithic Çatalhöyük.Issues raised with some of the SEM-EDS data further led us toemploy EDXRF, both as a means of analytical ‘check and balance’and to integrate further another of the labs involved in our long-term international multi-technique/-researcher approach. Thefocus of this paper is therefore largely methodological, wherebythe integrated chaîne opératoire analytical framework advocated byour team (Carter et al., 2006, 893e895), is detailed fully ina companion paper.
2. Provenance studies at Çatalhöyük
Çatalhöyük has long enjoyed a relationship with characteriza-tion studies, with four blades from the site included in the veryfirst analysis of Near Eastern obsidians using OES in the 1960s(Renfrew et al., 1966), followed by the analysis of a further 11
Table 1Total number of Çatalhöyük obsidian artifacts sourced by our group and techniques used
Laboratory Artifactsa
Grenoble (LGCA-CNRS) 100 (101)Aberystwyth 35Berkeley (2003) 42Bordeaux (CENBG-CNRS) 62 (62)Paris (C2RMF-CNRS) (2005) 10 (10)Bordeaux (IRAMAT-CNRS) 51Berkeley (2008a) 34b
Berkeley (2007) 48 (53)Berkeley (2008b) 100Paris (C2RMF-CNRS) (2007a) 42 (46)Paris (C2RMF-CNRS) (2007b) 15Stanford 45
Total artifacts analyzed 557 (584)
a The number in parentheses refer to the total number of analyses. Some artifacts havb These artifacts and 17 others traited by PIXE were initially analyzed by SEM-EDS at
artifacts over the next 35 years by OES, XRF and strontium isotopeanalyses (Gale, 1981; Keller and Seifried, 1990; Wright, 1969).Our new program of analyses has since characterized a further 527samples, 100 of which form the archaeological basis of this paper(Table 1). While allowing for certain changes in source nomen-clature over the past 40 years (Chataigner, 1998; Poidevin, 1998),the following general statements can be made concerning thehistory of obsidian use at Çatalhöyük (see Table 1 for all refer-ences): (1) throughout its history the two main sources exploitedwere East Göllü Da�g and Nenezi Da�g in southern Cappadocia(Fig. 1); (2) these obsidians were often consumed differently withregard to how they were worked and what was made fromthem, distinctions that cannot be explained through reference tomechanical properties alone; (3) the relative importance of theserawmaterials changed through time in terms of their proportion ofthe total obsidian assemblage; (4) during the later Early PotteryNeolithic (East Mound, Levels VI and upward) and Early Chalco-lithic (West Mound) tiny quantities of obsidian were also procuredfrom northern Cappadocian sources such as West Acıgöl and EastAcıgöl ante caldera; (5) later Early Pottery Neolithic and EarlyChalcolithic contexts have produced a handful of ready-madepressure-flaked blades made from eastern Anatolian obsidians,mainly the distinctive green peralkaline raw materials associatedwith the mountains of Bingöl and/or Nemrut Da�g, plus one madeof a calc-alkaline product of Bingöl, sources located some650e825 km distant, extending the western distribution of theseobsidians by 300 km.
.
Techniques Publication
ICP-AES; ICP-MS Carter et al. (2005a, 2006)LA-ICP-MS Carter et al. (2005a, 2006)EDXRF Carter and Shackley (2007)PIXE This paperPIXE This paperSEM-EDS This paperEDXRF This paperEDXRF in prep.EDXRF in prep.PIXE Carter et al. (2008); in prep.PIXE in prep.ICP-AES in prep.
e been measured more than once (by different labs).IRAMAT-CNRS, they are not counted as new artifacts.

G. Poupeau et al. / Journal of Archaeological Science 37 (2010) 2705e2720 2707
3. Sampling
3.1. Geological samples
In provenance studies, in order to ascertain source attributions,it is of great importance that the data from artifacts and geologicalsamples are obtained under the same conditions. For this reason,geological samples were selected from sources of potential interestto be run alongside the archaeological artifacts using the sametechniques. The obsidians under consideration come principallyfrom Cappadocia, as these are the closest to Çatalhöyük and includeraw materials already attested at the site by previous character-ization studies (Appendix 1).
We deal first with the Göllü Da�g massif (Fig. 2) whose variousobsidian outcrops have been geo-chemically grouped into twomain compositional groups by Poidevin (1998, 115e121). The ‘EastGöllü Da�g’ [hereafter EGD] type amalgamates the products of theEast Kayırlı, Kömürcü and Sirça Deresi flows while the ‘West GöllüDa�g’ [hereafter WGD] type unites the obsidians of the Kayırlı-Village, North-Bozköy and Gösterli outcrops. The EGD ‘source’ wasone of the major suppliers of obsidian throughout the prehistoricNear East (Carter et al., 2005a, 298e304; Chataigner, 1998,285e292, Fig. 7b), with knapping workshops recognized atopvarious outcrops, not least that of the Aceramic Neolithic atelier ofKaletepe-Kömürcü (Balkan-Atli and Der Aprahamian, 1998;Binder and Balkan-Atli, 2001; Cauvin and Balkan-Atli, 1996 interalia). Eleven source samples from Kömürcü and East-Kayırlı (EGDtype) were selected for analysis, together with one sample from
Fig. 2. Schematic map of the Göllü Da�g obsidia
North-Bozköy (WGD type), even though the obsidian from latterflow is known to often have fissures and crystallization spheru-lites, i.e. of lesser quality for prehistoric knappers.
Three samples were also included from Nenezi Da�g, a volcanowhose obsidians are often more compact and grainy than those ofKömürcüandEast-Kayırlı (EastGöllüDa�g), butarenonetheless knownto have been used extensively by the inhabitants of Çatalhöyük andprehistoric communities throughout theNearEast (Carteretal., 2005a,298e304; Chataigner, 1998, 285, Fig. 5b). While knapping floors havebeenmapped on its western flanks, the actual geological outcrops aretoday obscured (Balkan-Atli et al., 1999, 135e136, Figs. 2 and 3).
In turn, eleven samples relating to the various outcrops of theAcıgöl region in northern Cappadocia were also analyzed (Fig. 3).Four samples come from the Bogazköy, Kartaltepe, Kocada�g andTulucetepe flows that form part of the ‘East Acıgöl ante-caldera’(EAAC) geo-chemical compositional group (Poidevin, 1998, 113). Afurther two samples came from Kocada�g, of the ‘East Acıgöl post-caldera’ type (EAPC), while the last five came from Körüda�g, Acıgölcrater and Güneyda�g, flows that form part of the ‘West Acıgöl’ (WA)source (Poidevin, 1998, 113e114, Fig. 6).
In keeping with our desire to discriminate as many of the centralAnatolian sources as possible, we also analyzed three geologicalsamples from Hasan Da�g in western Cappadocia. While this isÇatalhöyük’s closest source, there is no evidence to suggest thatHasan Da�g was ever exploited by this or any other community(contra the expectations of Mellaart (1967, 177)), its raw materialsnow appreciated to be poor-quality and difficult to access (Cauvinand Balkan-Atli, 1996, 252; Chataigner, 1998, 292e293). These
n sources (modified from Poidevin, 1998).

Fig. 3. Schematic map of the Acıgöl area obsidian sources (modified from Bigazzi et al., 1993 and Poidevin, 1998).
G. Poupeau et al. / Journal of Archaeological Science 37 (2010) 2705e27202708
three samples came specifically from the ‘Hasan Da�g’ and ‘HasanDa�g-Kayırlı’ locales as defined by Ercan et al. (1989).
Giventhatwenowknowthatobsidians fromsoutheasternAnatoliareached Çatalhöyük during the Early Ceramic Neolithic (Carter et al.,2008), we also felt it necessary to select obsidians from the majorsources of the Bingöl area and Nemrut Da�g, together with samplesfrom the nearby sources ofMus, Meydan Da�g and Süphan Da�g (Fig.1).
Finally, we included one sample each from the Orta and Sakaelisources in the Galatia region of northwest Anatolia, some 330 kmfrom Çatalhöyük (Fig. 1), despite the fact that these obsidians haveyet to be attested at the site, having seemingly only been used bylocal populations in the Neolithic (Chataigner, 1998, 275).
3.2. Archaeological samples
The 100 artifacts selected for analysis from Çatalhöyük camefrom various contexts on the East mound and the nearby/off-siteKonya Basin Palaeoenvironments Project (KOPAL) trench, excavatedduring 1997e2004 (Hodder, 2007). Chronologically the materialcan be roughly subdivided into two data-sets: Aceramic Neolithic(OB200-OB239, OB245-OB249) and Early Pottery Neolithic (OB240-OB244, OB250-OB299); the assemblages fromwhich these sampleswere selected are discussed fully elsewhere (Carter et al., 2005b).As a means of interrogating the relationship through time betweenraw material source and specific modes of exploitation (chaînesopératoires), the artifacts were chosen on the basis of a range ofattributes: visual characteristics of raw material, technology,typology, date and context.
4. Analytical procedures
Methodologically this project’s point of departure was to try andemploy SEM-EDS and PIXE as analytical means of obsidian
characterization and source discrimination in an Anatolian/NearEastern context.
4.1. SEM-EDS
The SEM-EDS data were obtained at CRP2A with the OxfordIndustries INCAx-sight energy dispersive spectrometer of a JEOLscanning electron microscope operating at 20 kV with an electronbeam scanning a sample surface of 200e500 mm2, with four to tenmeasurements per sample taken in different locations. In eachanalysis six elements, Na, Al, Si, K, Ca, and Fe were quantitativelydetermined; elements Ti, Mn and Mg were often below detectionlimits. Element contents were computed as 100% oxides. Thegeological samples were prepared as polished sections while thearchaeological artifacts were analyzed non-destructively, i.e. withno surface preparation. The data were accumulated over a period ofthree years, with one source sample repeatedly analyzed in order tocontrol the stability of the analytical system (P35-18B1 of the East-Kayirli source [EGD area]). The fifteen determinations taken overthese 36 months do not reveal any drift with time (see also LeBourdonnec et al., 2010). The smallest variations were found tobe for Al, Si (less than one per cent), Na and K (less than six percent). The largest dispersions were observed for Ca and Fe (albeitless than 9%). In the former case this is a reflection of the element’s‘low’ content with regard to our analytical system, while the lattercan be explained with reference to intrinsic sample variations, asfrequently found between multiple measurements of singlesamples and/or between aliquots of many obsidians.
4.2. PIXE
The PIXE analyses were performed in two laboratories (cf. LeBourdonnec et al., 2005). At the Centre d’Etudes Nucléaires de

Table 2Elemental compositions of Anatolian source samples as determined by SEM-EDS.
Area Source Sample Surface n Na2O Al2O3 SiO2 K2O CaO Fe2O3 Type
Northwest Anatolia (Galatia)Orta Or 4 PS 1* 3.54 12.60 77.01 5.23 0.77 0.78 OrtaSakaeli Sa 1 PS 1* 3.67 12.78 76.79 5.02 0.82 0.86 Orta
FS 1 3.78 12.78 76.65 4.98 0.80 0.95
CappadociaAcıgöl Acıgöl Crater N8 PS 2** 3.74 11.62 78.97 4.46 0.40 0.80 WA
FS 1 3.46 11.60 79.09 4.55 0.49 0.81N9 PS 2** 3.81 11.63 78.95 4.43 0.41 0.78 WA
Güneyda�g N10 PS 2** 3.75 11.76 78.81 4.44 0.41 0.80 WAN11 PS 2** 3.85 11.75 78.77 4.40 0.42 0.82 WA
Körüda�g N6 PS 2** 3.68 11.68 78.88 4.49 0.44 0.82 WAFS 1 3.89 11.89 78.60 4.43 0.40 0.78
Bogazköy N7 PS 2** 3.60 12.25 77.86 4.68 0.72 0.87 EAACFS 1 3.49 12.27 77.95 4.64 0.81 0.84
Kartaltepe N2 PS 2** 3.59 12.19 77.80 4.68 0.79 0.95 EAACFS 1 3.25 12.19 77.93 4.89 0.79 0.90
Tulucetepe N3 PS 2** 3.62 12.17 77.99 4.65 0.72 0.85 EAACFS 1 3.85 12.15 77.77 4.60 0.86 0.77
WTHD N1 PS 2** 3.56 12.16 77.91 4.82 0.78 0.78 EAACFS 1 3.65 12.29 77.86 4.76 0.77 0.68
Kocada�g N4 PS 1* 3.97 12.83 76.41 4.39 0.96 1.42 EAPCFS 1 3.93 12.81 76.94 4.34 0.84 1.12
N5 PS 2** 3.89 12.76 76.54 4.39 0.97 1.40 EAPCFS 1 4.31 12.96 76.31 4.16 0.89 1.28
Göllü Da�g East Kayırlı P35-18B1 PS 1 3.56 11.65 78.97 4.70 0.44 0.68 EGDFS 1 3.97 11.79 78.66 4.47 0.38 0.67
Kay E1 PS 1 3.51 11.64 79.05 4.68 0.42 0.69 EGDFS 2 3.47 12.02 78.75 4.58 0.45 0.75
Kömürçü Kom 1 PS 1 3.53 11.68 78.98 4.64 0.42 0.72 EGDFS 1 3.80 11.80 78.70 4.65 0.41 0.64
Kom C1 PS 1 3.50 11.61 79.08 4.64 0.43 0.74 EGDFS 1 3.25 11.49 79.11 4.94 0.52 0.70
Kom C1b FS 1 3.73 11.66 78.91 4.52 0.43 0.75 EGDPS 1 3.48 11.58 79.10 4.65 0.42 0.78FS 1 3.59 11.53 79.16 4.57 0.49 0.66
Kom C4 FS 1 3.48 11.66 78.91 4.82 0.46 0.67 EGDKom C5 PS 1 3.45 11.67 79.01 4.65 0.45 0.74 EGDKomC6 PS 1 3.47 11.64 79.22 4.53 0.45 0.70 EGD
FS 1 3.59 11.57 78.91 4.78 0.41 0.69Kom C11 PS 1 3.53 11.66 78.96 4.64 0.44 0.73 EGD
FS 1 3.58 11.60 78.94 4.73 0.45 0.64Kom C14 PS 1 3.43 11.62 79.02 4.79 0.46 0.69 EGD
FS 1 3.63 11.70 78.98 4.62 0.45 0.62North-Bozköy N12 PS 5** 3.61 11.84 78.64 4.61 0.59 0.69 WGD
Hasan Da�g Hasan Da�g Hasan PS 3** 3.71 12.12 78.72 4.25 0.60 0.55 HasanFS 1 3.47 12.17 78.91 4.30 0.57 0.53
H. Da�g-Kayırlı Has-Kay PS 3** 3.73 12.49 77.29 4.62 0.86 0.95 Hasan
Nenezi Dag P34.8 PS 2** 3.81 12.68 76.77 4.50 1.07 0.98 NNZDFS 3 3.56 12.53 76.93 4.75 1.12 1.02
NeW2 PS 2** 3.73 12.63 76.79 4.68 1.04 1.05 NNZDFS 1 3.73 12.70 76.83 4.73 1.00 0.97
NE 5 PS 2** 3.54 12.69 76.47 4.90 1.05 1.06 NNZDFS 1 4.02 12.89 76.63 4.49 1.01 0.90
Southeastern AnatoliaBingöl Ala Tepe Ala Tepe 1 PS 3*** 4.29 13.34 74.69 5.19 0.68 1.62 BB
FS 1 3.85 13.25 74.50 5.81 0.78 1.73Orta Duz Orta D1 PS 1 4.61 9.66 76.35 4.85 0.17 4.22 BA/NMRD
FS 1 4.83 9.87 76.67 4.59 <0.30 3.71Orta D2 PS 2**** 5.11 9.71 76.59 4.19 <0.20 4.12 BA/NMRD
FS 3 4.59 9.53 76.30 4.96 0.19 4.28Çavuslar Çavuslar 1 PS 1 4.38 9.53 77.90 4.49 <0.20 3.56 BA/NMRD
FS 1 4.22 9.68 78.21 4.46 <0.27 3.26Çavuslar 2 PS 1 4.42 9.52 77.74 4.52 <0.20 3.56 BA/NMRD
FS 1 3.88 9.60 78.27 4.58 <0.26 3.41Çavuslar 4 PS 1 4.86 9.71 76.44 4.49 <0.20 4.16 BA/NMRD
FS 1 5.07 9.64 76.12 4.70 0.21 4.06Çavuslar 6 PS 1 4.73 9.15 77.25 4.36 <0.20 4.33 BA/NMRD
FS 1 4.58 9.26 77.32 4.46 <0.41 4.08Unspecified Bingöl 1 PS 1 4.91 9.90 75.68 4.58 0.23 4.43 BA/NMRD
FS 1 5.04 10.27 76.10 4.37 <0.22 3.89Bingöl 2 PS 1 4.80 9.65 76.59 4.52 <0.20 4.23 BA/NMRD
FS 1 4.57 9.72 76.94 4.52 <0.33 3.92
(continued on next page)
G. Poupeau et al. / Journal of Archaeological Science 37 (2010) 2705e2720 2709

Table 2 (continued )
Area Source Sample Surface n Na2O Al2O3 SiO2 K2O CaO Fe2O3 Type
Lake Van Meydan Da�g Mey 1 PS 1* 4.37 12.09 77.36 4.49 0.38 1.29 MDDFS 2 4.61 12.09 77.24 4.35 0.42 1.27
Mey 4 PS 1* 4.35 12.16 77.36 4.44 0.48 1.20 MDDFS 2 4.55 12.38 77.04 4.32 0.43 1.27
D13 PS 1 4.19 12.03 77.30 4.74 0.38 1.29 MDDFS 1 4.10 12.02 77.84 4.42 0.36 1.22
D25 PS 1 4.34 12.06 77.30 4.50 0.45 1.34 MDDFS 1 4.21 12.15 77.48 4.42 0.43 1.31
D26 PS 1 4.41 12.13 77.25 4.43 0.39 1.35 MDDFS 1 4.41 12.25 77.45 4.38 0.37 1.15
Nemrut Da�g Nem N1 PS 3** 4.55 10.32 77.35 4.58 <0.30 2.90 BA/NMRDFS 2 4.27 10.36 77.63 4.79 0.00 2.94
Nem N2 PS 1* 5.60 8.74 73.58 4.51 0.32 6.70 BA/NMRDFS 2 5.36 8.70 73.85 4.60 0.38 6.68
D2 PS 1 5.50 8.86 73.39 4.59 0.30 6.97 BA/NMRDFS 1 6.10 8.80 73.21 4.55 0.56 6.27
D4 PS 1 5.29 8.75 73.78 4.61 0.32 6.90 BA/NMRDFS 1 5.48 8.94 74.11 4.57 0.26 6.24
D21 PS 1* 5.64 8.88 74.06 3.46 0.32 7.14 BA/NMRDFS 1 5.55 8.92 73.70 4.84 0.35 6.28
D24 PS 1 5.50 8.76 73.56 4.63 0.22 6.88 BA/NMRDFS 1 4.29 8.19 73.18 3.83 2.07 7.92
D27 PS 1 5.62 8.59 73.44 4.58 0.27 7.04 BA/NMRDFS 1 5.21 8.45 73.32 4.63 0.35 7.47
Süphan Da�g SUP 1 PS 1* 3.59 12.25 77.74 4.88 0.51 1.02 SPDFS 2 3.63 12.26 77.57 4.92 0.51 1.09
SUP 5 PS 1* 3.45 12.19 77.72 5.13 0.50 0.98 SPDFS 1 3.43 12.20 77.58 5.15 0.47 1.14
PS, polished section, FS, fresh fracture surface; n, number of polished sections analyzed.*Polished section measured twice; n polished sections, of which one was measured twice (**), five times (***) or six times (****). Polished section P35-18B1 was measured 15times over a period of three years (see text).
G. Poupeau et al. / Journal of Archaeological Science 37 (2010) 2705e27202710
Bordeaux-Gradignan (CENBG) the samples were analyzed on the‘Microbeam Line’ of a 4 MV Van de Graaff accelerator (Llabadoret al., 1990). In the vacuum sample chamber of this nuclearmicroprobe up to 15 samples could be introduced together, fixed ona rotating stage allowing us to make measurements on severalpoints of their surface. A 3 MeV and 0.5 nA proton beam of 8 mmdiameter was used on a scanning mode so that element contentswere determined over a w700 � 700 mm2. At the Centre deRecherche et de Restauration des Musées de France (C2RMF, Paris), weused the extracted beam line of the AGLAE facility. The sampleswere fixed on an XYZmoving stage situated outside the accelerator,in front of the beam which exits through a 100 nm Si3N4 window.Up to 30 samples at once can be fixed on this stage. The distancebetween the accelerator exit and the sample under analysis is2 mm. A proton beam of 3 MeV and 1 nA before accelerator exit,produced by a 2 MV Tandem Van de Graaff, reaches a diameter atsample surface of about 700 mm2. During data acquisition the meanatomic number of the room ambient atmosphere is lowered in thevolume of air between the accelerator exit, the sample and the XRFdetector entries in order to limit absorption effects and X-rayspectra alterations (Calligaro et al., 1996, 2002). With regard to thenon-destructive capabilities of these facilities, it should be notedthat at CENBG only artifacts smaller than 3 cm long and 5 mm thickcan be accepted, whereas at C2RMF with the external beamconfiguration of AGLAE there are no such size restrictions (cf.Calligaro et al., 2005). The source samples analyzed were the sameas those previously analyzed by SEM-EDS; as before we focused onthe polished sections with the exception of the Nenezi Da�g samplesthat were treated from fresh fractures on aliquots. Three NemrutDa�g samples, NEM 3-1, 3-2 and 3-3 were only analyzed by PIXE(from polished sections).
In both systems, two Si(Li) detectors were used to simulta-neously determine the contents of fifteen elements. The lightelements Na, Al, Si, K, Ca, Ti, Mn and Fe signals were recorded by
a ‘low-energy’ X-ray detector and the heavy elements Mn, Fe, Zn,Ga, Rb, Sr, Y, Zr and Nb by a ‘high-energy’ detector. Threemeasurements per sample were taken in different areas to accountfor possible local heterogeneities (phenocrysts, etc.). To insure datahomogeneity, a reference sample was analyzed at least twice witheach sample batch (obsidian ARC-URS [Le Bourdonnec, 2007]). Datawas treated with the 2000 version of the GUPIX software (Maxwellet al., 1989; Campbell et al., 2000). Light (major) element contentsfor NaeFe were calculated as 100%weight oxides. As the Fe signal isrecorded in both detectors the content determined from the lowenergy detector spectrumwas then used as an internal standard forthe determination of trace elements contents. We have shownelsewhere that any bias in element content determinationsbetween the CENBG and the C2RMF PIXE facilities, if present, werebelow counting statistics uncertainties (Le Bourdonnec et al., 2005).The only elements for which a content (oxide per cent or ppm)were computed are those that had a peak intensity in XRF spectrahigher than 3s above the detector mean background levels.
In order to critically appraise the quality of our PIXE data, and byextent its utility in Near Eastern obsidian characterization studies,we compared the results from 12 source samples with thosegenerated from the exact same samples by Inductively CoupledPlasma e Mass Spectroscopy (ICP-MS) (see x6 below). The ICP-MSanalyses were made at Brest University following the Tm-spikingprocedure used by the CNRS group for over 10 years, a protocol thatinsures the internal consistency of all data obtained so far onAnatolian obsidians (Bellot-Gurlet, 1998; Abbès et al., 2003; Bellot-Gurlet et al., 2003; Bressy et al., 2005; Carter et al., 2006).
Finally, as a means of further interrogating our SEM-EDSdata (see below) we turned to another of the project’s long-termmembers, the UC Berkeley XRF laboratory (cf. Carter andShackley, 2007). These analyses also provided us with meansto critically review our inter-lab/multi-technique analyticalapproach.

Table 3Elemental compositions of Çatalhöyük obsidian artifacts as determined non-destructively by SEM-EDS. The samples are ordered by increasing Na2O content.
Sample Na2Oa Al2O3 SiO2 K2O CaO Fe2O3
CaeFe poor artifactsOB220 2.38 11.28 79.08 6.06 0.43 0.77OB229 2.48 11.35 79.07 5.76 0.53 0.77OB230 2.51 11.69 78.46 6.23 0.45 0.66OB241 2.56 11.53 79.07 5.59 0.52 0.72OB224 2.68 11.39 79.27 5.41 0.61 0.64OB225 2.74 11.67 78.99 5.43 0.45 0.72OB200 2.85 11.44 79.03 5.37 0.55 0.71OB210 2.89 11.65 79.17 5.20 0.45 0.60OB266 2.89 11.74 78.96 5.37 0.42 0.61OB207 2.93 11.76 78.85 5.33 0.52 0.61OB273 2.94 11.51 78.80 5.38 0.50 0.82OB240 2.97 11.69 78.79 5.32 0.52 0.70OB270 2.97 11.77 78.88 5.22 0.46 0.69OB232 3.01 11.78 78.90 5.25 0.45 0.61OB208 3.02 11.57 78.85 5.27 0.49 0.79OB234 3.03 12.17 78.56 5.27 0.46 0.51OB264 3.03 11.72 78.85 5.30 0.44 0.62OB299 3.03 11.76 78.78 5.30 0.48 0.65OB227 3.06 11.67 78.77 5.33 0.45 0.73OB252 3.06 11.59 78.77 5.47 0.46 0.64OB218 3.07 11.52 78.89 5.35 0.52 0.65OB216 3.18 11.58 78.96 5.05 0.54 0.71OB221 3.22 11.55 78.99 4.96 0.47 0.76OB219 3.25 11.93 78.84 5.02 0.37 0.60OB261 3.26 11.64 78.76 5.16 0.45 0.73OB233 3.27 11.80 78.85 5.09 0.54 0.44OB296 3.27 12.13 79.03 4.83 0.32 0.42OB236 3.35 11.71 79.18 4.80 0.42 0.55OB247 3.39 11.54 79.04 4.81 0.49 0.73OB244 3.45 11.95 78.87 4.78 0.38 0.57OB267 3.47 11.66 78.43 5.08 0.53 0.75OB246 3.48 11.74 79.04 4.71 0.37 0.66OB202 3.49 11.67 79.06 4.63 0.46 0.65OB265 3.55 11.92 79.22 4.48 0.37 0.46OB214 3.73 12.17 78.69 4.41 0.44 0.56OB231 3.73 12.10 78.94 4.29 0.36 0.53OB203 3.76 12.04 78.25 5.07 0.37 0.51OB204 3.77 11.78 78.87 4.52 0.51 0.55OB211 3.79 12.01 78.92 4.35 0.45 0.47OB260 3.86 12.10 78.81 4.44 0.32 0.47OB262 4.05 12.04 78.81 4.13 0.39 0.58OB245 4.06 12.19 78.64 4.38 0.33 0.40OB248 4.14 12.03 78.59 4.27 0.50 0.46
CaeFe rich artifactsOB278 2.89 12.71 76.78 5.33 1.20 1.09OB256 2.96 12.61 76.76 5.28 1.14 1.14OB213 3.61 12.84 76.71 4.79 1.04 0.94OB272 3.68 12.68 77.04 4.67 0.99 0.90OB212 3.82 12.77 76.72 4.62 0.98 0.99OB215 3.87 13.00 76.58 4.37 1.21 0.93OB277 3.94 12.96 76.61 4.52 1.06 0.86OB228 4.03 12.94 76.51 4.59 0.97 0.95
a Element contents in weight per cent oxides.
G. Poupeau et al. / Journal of Archaeological Science 37 (2010) 2705e2720 2711
4.3. EDXRF
Whole rock trace element analyses were performed in theGeoarchaeological XRF Laboratory, Department of Anthropology,University of California, Berkeley, using a ThermoScientific Quant’Xenergy dispersive x-ray fluorescence spectrometer. Thespectrometer is equipped with a ultra-high flux peltier air cooledRh x-ray target with a 125 micron beryllium (Be) window, an x-raygenerator that operates from 4 to 50 kV/0.02 to 1.0 mA at 0.02increments, using an IBM PC based microprocessor andWinTrace�4.1 reduction software. The spectrometer is equipped witha 2001 min�1 Edwards vacuum pump for the analysis of elementsbelow titanium (Ti). Data is acquired with a pulse processor andanalog to digital converter. This is a significant improvement inanalytical speed and efficiency beyond the former Spectrace 5000and QuanX analog systems (see Davis et al., 1998; Shackley, 2005).
For TieNb, Pb, Th elements the mid-Zb condition is used oper-ating the x-ray tube at 30 kV, using a 0.05 mm (medium) Pd pri-mary beam filter in an air path at 200 s livetime to generate x-rayintensity Ka1-line data for elements titanium (Ti), manganese (Mn),iron (as FeT), cobalt (Co), nickel (Ni), copper, (Cu), zinc, (Zn), gallium(Ga), rubidium (Rb), strontium (Sr), yttrium (Y), zirconium (Zr),niobium (Nb), lead (Pb), and thorium (Th). Not all these elements arereported since their values in many volcanic rocks is very low.Trace element intensities were converted to concentration esti-mates by employing a least-squares calibration line ratioed to theCompton scatter established for each element from the analysis ofinternational rock standards certified by the National Institute ofStandards and Technology (NIST), the US. Geological Survey (USGS),Canadian Centre forMineral and Energy Technology, and the Centrede Recherches Pétrographiques et Géochimiques in France(Govindaraju, 1994). Line fitting is linear (XML) for all elements butFe where a derivative fitting is used to improve the fit for iron andthus for all the other elements.When barium (Ba) is acquired, the Rhtube is operated at 50 kV and 1.0 mA in an air path at 200 s livetimeto generate X-ray intensity Ka1-line data, through a 0.630 mm Cu(thick) filter ratioed to the bremsstrahlung region (see Daviset al., 1998). A suite of 17 specific standards used for the best fitregression calibration for elements TieNb, Pb, and Th, include G-2(basalt), AGV-2 (andesite), GSP-2 (granodiorite), SY-2 (syenite),BHVO-2 (hawaiite), STM-1 (syenite), QLO-1 (quartz latite), RGM-1(obsidian), W-2 (diabase), BIR-1 (basalt), SDC-1 (mica schist),BCR-2 (basalt), TLM-1 (tonalite), SCO-1 (shale), all US GeologicalSurvey standards, BR-1 (basalt) from the Centre de RecherchesPétrographiques et Géochimiques in France, and JR-1 and JR-2(obsidian) from the Geological Survey of Japan (Govindaraju, 1994).
The data from the WinTrace software were translated directlyinto Excel for Windows software for manipulation and on into SPSSfor Windows for statistical analyses when necessary. In order toevaluate these quantitative determinations, machine data werecompared to measurements of known standards during each run.RGM-1 is analyzed during each sample run for obsidian artifacts tocheck machine calibration.
5. Sourcing by SEM-EDS
The results of SEM-EDS analyses for 52 geological samples from23 obsidian source-areas are presented in Table 2. The analyseswere conducted either upon polished sections or freshly exposedsurfaces. In most samples only one polished section was analyzedbut in some cases up to five were prepared for a single sample.Several of these sections were analyzed twice or more, atintervals of several months. All repeats from single samples were ingood agreement. Where a sample’s elemental composition wasdetermined more than once from the same polished section, we
report only the average elemental contents (Table 2). When severalpolished sections were analyzed from the same sample, the dataare averaged over these sections. Most elemental compositionswere obtained by measurements on freshly exposed surfaces; inthese cases measurements were made only once. In general theagreement between the element contents measured on polishedsections and freshly exposed surfaces is excellent (Table 2). Rareexceptions are found only for Na, where they exceed only 11%(sample N5 of Koçadag, Göllü Da�g area) to 21% (N4, Koçada�g)respectively. The main differences between source chemistry relateto their Al, Si, Ca and Fe contents.
The 51 Çatalhöyük artifacts tentatively sourced using SEM-EDSwere easily separated into two groups, CaeFe ‘poor’ and ‘rich’,comprising 43 and eight artifacts respectively (Table 3). While

Fig. 4. Comparison for five Çatalhöyük artifacts between the normalized SEM-EDSelemental compositions determined non-destructively on ‘archaeological’ and onpolished surfaces respectively. The norm is taken as the average composition of EastGöllü Da�g obsidians calculated from the 10 samples of Table 2.
G. Poupeau et al. / Journal of Archaeological Science 37 (2010) 2705e27202712
previous reports of the sodium contents of Anatolian obsidianse asexpressed in oxides e have varied from 3.4% to more than 4%(Poidevin, 1998), our SEM-EDS analyses produced anomalously lowvalues down to 2.89% and 2.38% in the high and low CaeFe groupsrespectively (Table 3). Moreover, as Na contents decrease, oneobserves a linear anti-correlation with K contents, a slightprogressive decrease in Al, a subtle increase in Si, more importantand irregular values for Fe and small erratic variations in Ca. This isattributed to the alteration of the obsidian’s chemical compositionthat results from the hydration of a superficial layer that accumu-lates during the artifacts’ post-use burial in soil. Element contentprofiling by secondary ionmass spectrometry has shown that in thefirst micron or so below the surface of an hydrated obsidian, theNa and K contents are considerably enhanced and loweredrespectively, while those of Ca and Fe are variably affected (cf.Adams, 1984; Patel et al., 1998, p. 1049; Anowitz et al., 1999, Fig. 3).In order to test this hypothesis we determined the SEM-EDScomposition on a polished (internal) surface of five artifacts withvarious Na contents, followed by a series of measurements on thesame artifacts’ external surfaces (Table 4). While on the externalsurfaces the analyses were made on only three to five differentlocations against 10 for the internal surface the standard deviationabout the mean values are in general quite similar. However, oneobserves that the compositions determined from the (modern)internal surfaces are significantly different from those determinedfrom the (archaeological) external surfaces. In particular their Nacontents are now in the usual obsidian range, which supports thesurface alteration hypothesis for the data obtained in non-destructive analyses. The ‘internal surface’ compositions of thesefive artifacts are in fact very similar to each other and appear nowto be in the range to be expected for East Göllü Da�g obsidians(Fig. 4). Thus the data obtained on these artifacts raises the questionof the utility of non-destructive SEM-EDS artifact analysis inprovenance studies.
In the high CaeFe artifacts groups, only two artifacts (OB 256and 278) present a visibly affected Na content accompanied byminor effects on K and Fe (Table 3). When plotted in a Fe vs. Cadiagram these artifacts are located in the vicinity of the Nenezi Da�g
Table 4Comparison between the SEM-EDS compositions of five artifacts as determined on‘archaeological’ and polished surfaces respectively.
Sample Surface* n Na2O Al2O3 SiO2 K2O CaO Fe2O3
OB200 AS 5 average 2.85 11.44 79.03 5.37 0.55 0.71st. dev. 0.10 0.14 0.24 0.08 0.05 0.05
PS 10 average 3.54 11.71 79.01 4.58 0.43 0.73st. dev. 0.10 0.17 0.21 0.15 0.07 0.17
OB208 AS 5 average 3.02 11.57 78.85 5.27 0.49 0.79st. dev. 0.14 0.14 0.25 0.12 0.05 0.14
PS 10 average 3.56 11.58 79.09 4.63 0.45 0.68st. dev. 0.08 0.19 0.21 0.09 0.06 0.08
0B220 AS 3 average 2.38 11.28 79.08 6.06 0.43 0.77st. dev. 0.24 0.14 0.58 0.12 0.12 0.33
PS 9 average 3.50 11.61 79.01 4.69 0.43 0.75st. dev. 0.11 0.17 0.19 0.09 0.05 0.16
OB233 AS 5 average 3.27 11.80 78.85 5.09 0.54 0.44st. dev. 0.17 0.14 0.14 0.12 0.07 0.04
PS 10 average 3.54 11.74 78.94 4.61 0.45 0.73st. dev. 0.11 0.14 0.25 0.09 0.06 0.11
OB296 AS 5 average 3.27 12.13 79.03 4.83 0.32 0.42st. dev. 0.10 0.08 0.18 0.11 0.06 0.04
PS 10 average 3.55 11.68 78.86 4.69 0.45 0.77st. dev. 0.08 0.14 0.13 0.07 0.07 0.08
n, number of spot measurements per sample; element contents in weight per centoxides.
* AS, archaeological surface; PS, polished section.
obsidians and not very far from those of the Galatia, Hasan Da�g andthe ante- and post-Acıgöl sources (Fig. 5). However, the Galatia(Orta and Sakaeli) obsidians, which are claimed to have a veryhomogeneous composition (Poidevin,1998), systematically presentCa and Fe contents lower than in Nenezi Da�g obsidians (Keller andSeifried,1990), as also observed in Table 2 and PIXE analyses (belowTable 5). With regard to the East Acıgöl post-caldera obsidians(Kocada�g), their Fe contents are known to be higher than in NeneziDa�g obsidians (Keller and Seifried, 1990), as also seen here by SEM-EDS (Table 2) and PIXE analyses (Table 5). Similarly, the Ca contentsof the East Acıgöl ante-caldera obsidians are lower than in those ofthe Nenezi Da�g (Keller and Seifried, 1990 and here, Tables 3 and 5).Thus on purely analytical grounds a Galatia or Acıgöl origin areunlikely for the raw material of the high CaeFe artifacts group. Itmay also be noted that the Galatian sources of Orta and Sakaeliwere apparently exploited only locally (Chabot et al., 2001;Chataigner, 1998, 275), while these Acıgöl sources were only rarelyused (Chataigner, 1998). With Hasan Da�g obsidians not seeming tohave been used by ancient people (Chataigner, 1998), one couldrather safely assume that like the other CaeFe rich Çatalhöyükobsidians previously sourced by ICP-AES and ICP-MS (Carter et al.,2006), those analyzed here by SEM-EDS also come from NeneziDa�g (see also below).
The situation is not so clear-cut with the low CaeFe group ofartifacts. In a CaeFe binary plot of the Fig. 5 type they would be
Fig. 5. Comparison between the Ca and Fe contents in the Çatalhöyük high CaeFegroup of artifacts and in obsidians from potential sources as determined by SEM-EDS.Source abbreviations as in Table 2.
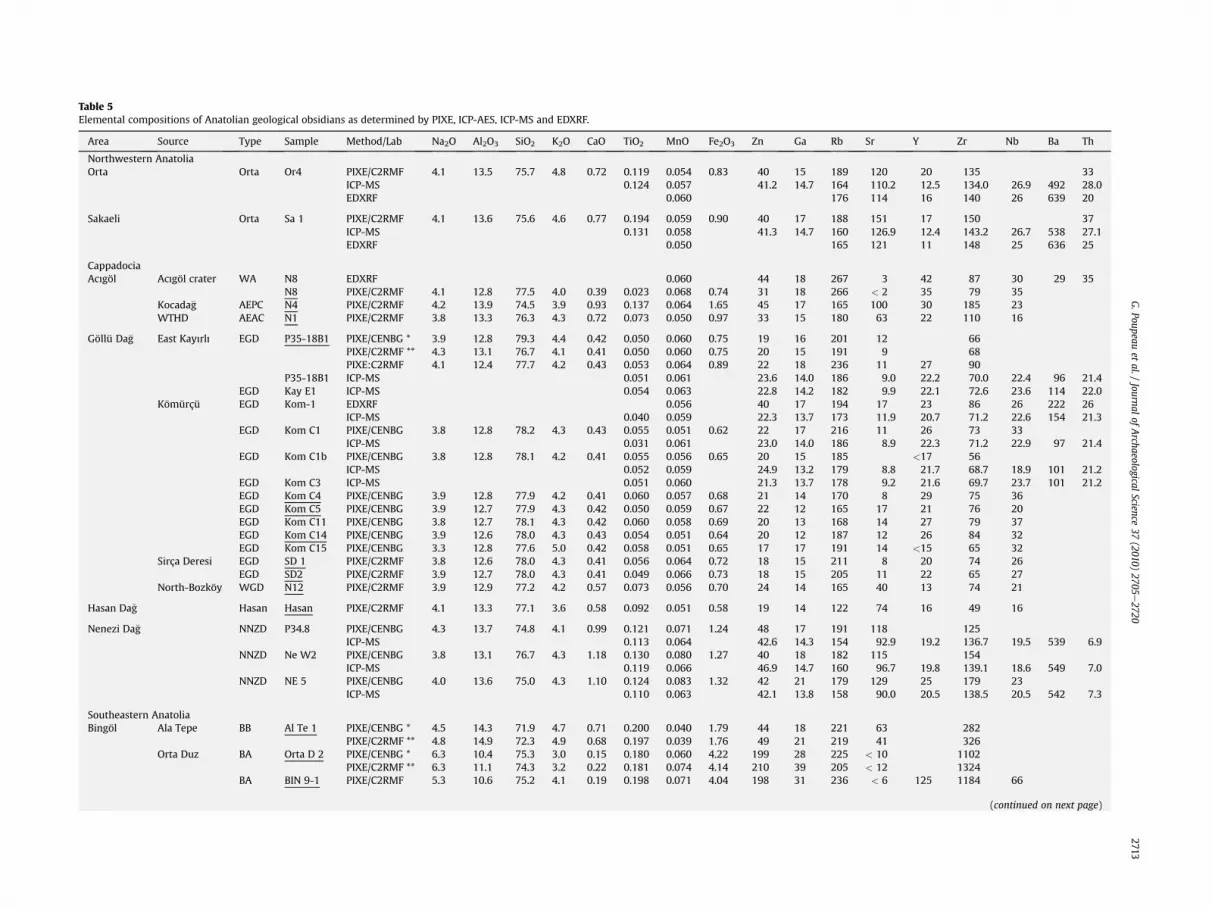
Table 5Elemental compositions of Anatolian geological obsidians as determined by PIXE, ICP-AES, ICP-MS and EDXRF.
Area Source Type Sample Method/Lab Na2O Al2O3 SiO2 K2O CaO TiO2 MnO Fe2O3 Zn Ga Rb Sr Y Zr Nb Ba Th
Northwestern AnatoliaOrta Orta Or4 PIXE/C2RMF 4.1 13.5 75.7 4.8 0.72 0.119 0.054 0.83 40 15 189 120 20 135 33
ICP-MS 0.124 0.057 41.2 14.7 164 110.2 12.5 134.0 26.9 492 28.0EDXRF 0.060 176 114 16 140 26 639 20
Sakaeli Orta Sa 1 PIXE/C2RMF 4.1 13.6 75.6 4.6 0.77 0.194 0.059 0.90 40 17 188 151 17 150 37ICP-MS 0.131 0.058 41.3 14.7 160 126.9 12.4 143.2 26.7 538 27.1EDXRF 0.050 165 121 11 148 25 636 25
CappadociaAcıgöl Acıgöl crater WA N8 EDXRF 0.060 44 18 267 3 42 87 30 29 35
N8 PIXE/C2RMF 4.1 12.8 77.5 4.0 0.39 0.023 0.068 0.74 31 18 266 < 2 35 79 35Kocada�g AEPC N4 PIXE/C2RMF 4.2 13.9 74.5 3.9 0.93 0.137 0.064 1.65 45 17 165 100 30 185 23WTHD AEAC N1 PIXE/C2RMF 3.8 13.3 76.3 4.3 0.72 0.073 0.050 0.97 33 15 180 63 22 110 16
Göllü Da�g East Kayırlı EGD P35-18B1 PIXE/CENBG * 3.9 12.8 79.3 4.4 0.42 0.050 0.060 0.75 19 16 201 12 66PIXE/C2RMF ** 4.3 13.1 76.7 4.1 0.41 0.050 0.060 0.75 20 15 191 9 68PIXE:C2RMF 4.1 12.4 77.7 4.2 0.43 0.053 0.064 0.89 22 18 236 11 27 90
P35-18B1 ICP-MS 0.051 0.061 23.6 14.0 186 9.0 22.2 70.0 22.4 96 21.4EGD Kay E1 ICP-MS 0.054 0.063 22.8 14.2 182 9.9 22.1 72.6 23.6 114 22.0
Kömürçü EGD Kom-1 EDXRF 0.056 40 17 194 17 23 86 26 222 26ICP-MS 0.040 0.059 22.3 13.7 173 11.9 20.7 71.2 22.6 154 21.3
EGD Kom C1 PIXE/CENBG 3.8 12.8 78.2 4.3 0.43 0.055 0.051 0.62 22 17 216 11 26 73 33ICP-MS 0.031 0.061 23.0 14.0 186 8.9 22.3 71.2 22.9 97 21.4
EGD Kom C1b PIXE/CENBG 3.8 12.8 78.1 4.2 0.41 0.055 0.056 0.65 20 15 185 <17 56ICP-MS 0.052 0.059 24.9 13.2 179 8.8 21.7 68.7 18.9 101 21.2
EGD Kom C3 ICP-MS 0.051 0.060 21.3 13.7 178 9.2 21.6 69.7 23.7 101 21.2EGD Kom C4 PIXE/CENBG 3.9 12.8 77.9 4.2 0.41 0.060 0.057 0.68 21 14 170 8 29 75 36EGD Kom C5 PIXE/CENBG 3.9 12.7 77.9 4.3 0.42 0.050 0.059 0.67 22 12 165 17 21 76 20EGD Kom C11 PIXE/CENBG 3.8 12.7 78.1 4.3 0.42 0.060 0.058 0.69 20 13 168 14 27 79 37EGD Kom C14 PIXE/CENBG 3.9 12.6 78.0 4.3 0.43 0.054 0.051 0.64 20 12 187 12 26 84 32EGD Kom C15 PIXE/CENBG 3.3 12.8 77.6 5.0 0.42 0.058 0.051 0.65 17 17 191 14 <15 65 32
Sirça Deresi EGD SD 1 PIXE/C2RMF 3.8 12.6 78.0 4.3 0.41 0.056 0.064 0.72 18 15 211 8 20 74 26EGD SD2 PIXE/C2RMF 3.9 12.7 78.0 4.3 0.41 0.049 0.066 0.73 18 15 205 11 22 65 27
North-Bozköy WGD N12 PIXE/C2RMF 3.9 12.9 77.2 4.2 0.57 0.073 0.056 0.70 24 14 165 40 13 74 21
Hasan Da�g Hasan Hasan PIXE/C2RMF 4.1 13.3 77.1 3.6 0.58 0.092 0.051 0.58 19 14 122 74 16 49 16
Nenezi Da�g NNZD P34.8 PIXE/CENBG 4.3 13.7 74.8 4.1 0.99 0.121 0.071 1.24 48 17 191 118 125ICP-MS 0.113 0.064 42.6 14.3 154 92.9 19.2 136.7 19.5 539 6.9
NNZD Ne W2 PIXE/CENBG 3.8 13.1 76.7 4.3 1.18 0.130 0.080 1.27 40 18 182 115 154ICP-MS 0.119 0.066 46.9 14.7 160 96.7 19.8 139.1 18.6 549 7.0
NNZD NE 5 PIXE/CENBG 4.0 13.6 75.0 4.3 1.10 0.124 0.083 1.32 42 21 179 129 25 179 23ICP-MS 0.110 0.063 42.1 13.8 158 90.0 20.5 138.5 20.5 542 7.3
Southeastern AnatoliaBingöl Ala Tepe BB Al Te 1 PIXE/CENBG * 4.5 14.3 71.9 4.7 0.71 0.200 0.040 1.79 44 18 221 63 282
PIXE/C2RMF ** 4.8 14.9 72.3 4.9 0.68 0.197 0.039 1.76 49 21 219 41 326Orta Duz BA Orta D 2 PIXE/CENBG * 6.3 10.4 75.3 3.0 0.15 0.180 0.060 4.22 199 28 225 < 10 1102
PIXE/C2RMF ** 6.3 11.1 74.3 3.2 0.22 0.181 0.074 4.14 210 39 205 < 12 1324BA BIN 9-1 PIXE/C2RMF 5.3 10.6 75.2 4.1 0.19 0.198 0.071 4.04 198 31 236 < 6 125 1184 66
(continued on next page)
G.Poupeau
etal./
Journalof
Archaeological
Science37
(2010)2705
e2720
2713

Table
5(con
tinu
ed)
Area
Source
Type
Sample
Method
/Lab
Na 2O
Al 2O3
SiO2
K2O
CaO
TiO2
MnO
Fe2O3
ZnGa
Rb
SrY
ZrNb
Ba
Th
Lake
Van
Mey
dan
Da� g
MDD
ME6-1
PIXE/C2R
MF
4.7
13.2
76.3
4.1
0.39
0.07
70.06
51.30
6818
206
2150
261
37MDD
ME7-1
PIXE/C2R
MF
4.8
13.1
76.3
4.1
0.38
0.07
30.06
41.28
6919
206
1848
262
37MDD
Mey
1ICP-MS
0.07
00.06
885
.619
.421
115
.262
.730
3.9
26.9
578.7
MDD
Mey
4ICP-MS
0.08
00.06
582
.218
.219
718
.656
.728
0.4
24.6
677.8
Mus
MUS
D20
PIXE/C2R
MF
4.9
13.6
75.2
4.0
0.37
0.04
50.05
11.15
9828
184
460
190
83MUS
MusZiy
PIXE/C2R
MF
5.0
13.5
75.0
3.9
0.38
0.04
60.05
31.24
103
2919
1<
260
200
87Nem
rutDa� g
NMRT
Nem
N1
PIXE/CEN
BG
4.6
11.3
77.5
4.2
0.23
0.15
00.06
02.81
161
2624
5<
613
23ICP-MS
0.14
00.05
318
3.4
28.2
191
0.1
127.4
1234
57.0
124
.7NMRT
Nem
N2
ICP-MS
0.21
20.10
717
0.1
18.4
147
0.2
94.9
982.0
52.8
221
.3NMRT
NEM
3-1
PIXE/C2R
MF
6.0
9.6
72.6
4.1
0.30
0.33
60.16
76.32
242
2825
2<
1016
213
8295
NMRT
NEM
3-2
PIXE/C2R
MF
6.0
9.6
72.4
4.1
0.29
0.34
90.16
76.41
241
2724
5<
1015
113
4610
0NMRT
NEM
3-3
PIXE/C2R
MF
5.6
11.9
73.8
4.2
0.28
0.21
20.08
15.88
171
2922
4<
511
311
3079
Suphan
Da� g
SPD
Sup1
ICP-MS
0.07
0.03
444
.517
.416
215
.535
.610
2.5
9.2
517
18.8
SPD
SUP5
PIXE/CEN
BG
3.7
13.2
76.3
4.6
0.47
0.06
70.03
41.41
3617
156
1626
9010
ICP-MS
0.02
00.03
235
.416
.515
414
.333
.695
.49.3
478
16.9
SPD
SU5-1
PIXE/C2R
MF
3.8
13.3
76.7
4.5
0.47
0.06
20.03
01.12
3118
152
1722
8911
Con
tents
inox
ides
arein
weigh
tper
centan
dco
ntents
intraceelem
ents
inmg/g(ppm);PIXEdatawereob
tained
from
polished
sections(sam
ple
reference
numbe
rsunderlin
ed)or
freshfractures(other
samples);ICP-AES
were
usedforthedeterminationof
major
andminor
elem
ents
Nato
Fean
dICP-MSfortraceelem
ents
Znto
Th.
*Delerue(200
7);**Le
Bou
rdon
nec
etal.(20
05).
Fig. 6. Comparison between the Ca and Fe contents in the Çatalhöyük low CaeFeartifacts group and in obsidians from potential sources as determined by SEM-EDS.Source abbreviations as in Table 2. Samples numbered 1 to 5 are the same as in Fig. 4.
G. Poupeau et al. / Journal of Archaeological Science 37 (2010) 2705e27202714
located in the lower left corner near to several source compositions.In an enlarged plot of this area the Çatalhöyük artifacts appearrather dispersed around the obsidians of East Göllü Da�g and also inthe immediate vicinity of those from Hasan Da�g, West Acıgöl andWest Göllü Da�g (Fig. 6). It has to be remembered however that allthe artifact compositions reported were obtained on externalsurfaces. The artifacts numbered 1e5 in Fig. 6 are those that wereselected for the determination of an internal surface composition(Table 4). They were intentionally chosen for their extremecontents in Ca and/or Fe contents. The fact their ‘internal surface’composition is in close agreement with that of EGD and WAobsidians suggests, but do not prove, that this might also be thecase for the other low CaeFe artifacts. If this was the case, andconsidering thatWGD and Hasan Da�g obsidians are extremely rare/absent fromNeolithic assemblages, wewould thus suggest that lowCaeFe obsidians determined by SEM-EDS from Çatalhöyük have anEast Göllü Da�g or West Acigöl source, while also keeping in mindthat only one artifact made from the latter rawmaterial has thus farbeen attested at Çatalhöyük out of the aforementioned 527 samplesrun (Table 1). Simply stated, while we cannot be absolutely certain
Fig. 7. Comparison between the elemental compositions determined by PIXE and ICPon aliquots from Anatolian obsidians. The contents of Na to Fe were determined by ICP-AES and for the heavier elements by ICP-MS.

Table 6Elemental compositions of Çatalhöyük obsidian artifacts as determined by PIXE. The samples are ordered by increasing Na2O content.
Sample Facility Na2O Al2O3 SiO2 K2O CaO TiO2 MnO Fe2O3 Zn Ga Rb Sr Y Zr Nb
CaeFe and SreZr poor artifactsOB220 C2RMF 1.9 13.1 79.1 4.6 0.46 0.053 0.059 0.76 20 15 197 16 23 74 22
CENBG 3.1 12.6 78.2 4.7 0.44 0.056 0.062 0.73 19 13 185 19 17 66 22OB233 C2RMF 1.9 13.0 79.1 4.6 0.46 0.069 0.063 0.74 20 15 202 14 24 69 24
CENBG 3.1 12.7 78.2 4.6 0.47 0.048 0.064 0.73 21 12 199 12 e 72 e
OB296 C2RMF 1.9 12.9 79.1 4.6 0.45 0.067 0.065 0.85 23 17 205 19 26 78 28CENBG 3.2 12.8 78.2 4.5 0.48 0.064 0.057 0.66 21 12 177 20 e 67 21
OB200 C2RMF 2.0 13.0 79.1 4.6 0.46 0.054 0.064 0.74 20 15 218 17 25 73 29OB229 C2RMF 2.0 13.0 79.2 4.5 0.46 0.057 0.062 0.78 20 16 201 13 19 66 26OB221 C2RMF 2.2 13.0 79.0 4.5 0.47 0.063 0.061 0.81 21 15 192 20 20 73 25OB289 CENBG 2.7 12.5 79.0 4.8 0.51 0.061 0.085 0.96 30 17 264 11 e 98 e
OB268 CENBG 2.8 13.0 78.5 5.1 0.47 0.074 0.062 0.85 24 16 210 20 e 79 e
OB226 CENBG 2.9 12.5 78.7 4.9 0.52 0.090 0.071 0.94 26 15 212 17 e 80 e
OB299 CENBG 2.9 12.7 77.8 4.7 0.49 0.071 0.081 0.89 28 16 231 14 e 76 26OB230 CENBG 3.0 12.7 78.1 4.7 0.46 0.050 0.069 0.69 21 14 184 9 e 84 e
OB242 CENBG 3.0 12.3 79.0 4.9 0.50 0.093 0.064 0.86 26 16 230 15 e 84 e
OB253 CENBG 3.0 12.7 78.8 4.6 0.45 0.077 0.065 0.84 27 17 216 15 e 79 e
OB266 CENBG 3.0 12.8 78.0 4.7 0.44 0.062 0.067 0.75 18 17 212 12 e 80 20OB203 CENBG 3.1 12.8 78.0 4.5 0.47 0.060 0.064 0.72 21 17 205 10 e e 21OB208 C2RMF 3.1 12.7 78.4 4.5 0.44 0.058 0.065 0.80 22 17 229 14 27 82 27OB234 CENBG 3.1 12.8 78.0 4.6 0.47 0.058 0.057 0.73 23 15 189 12 e e 20OB254 CENBG 3.1 12.5 79.1 4.9 0.49 0.075 0.066 0.84 23 16 209 20 e 74 e
OB255 CENBG 3.1 12.7 78.8 4.8 0.48 0.072 0.066 0.87 27 19 236 18 e 92 e
OB205 CENBG 3.2 12.6 77.7 5.0 0.50 0.072 0.082 1.10 28 22 270 17 e 95 e
OB206 CENBG 3.2 12.7 79.0 4.7 0.46 0.070 0.065 0.87 25 15 224 19 e 79 e
OB209 CENBG 3.2 12.8 79.3 4.7 0.46 0.061 0.057 0.78 22 16 204 17 e 84 e
OB257 CENBG 3.2 12.7 79.1 4.7 0.50 0.076 0.065 0.83 24 14 215 24 e 68 e
OB284 CENBG 3.2 12.6 78.1 4.4 0.46 0.065 0.065 0.79 30 16 198 24 e 78 e
OB291 CENBG 3.2 12.7 78.4 4.8 0.46 0.064 0.067 1.00 26 18 250 27 e 84 e
OB219 CENBG 3.3 12.7 77.9 4.5 0.48 0.059 0.063 0.79 23 16 235 14 e 73 21OB259 CENBG 3.2 12.7 79.1 4.7 0.49 0.066 0.064 0.82 21 16 207 17 e 68 e
OB224 C2RMF 3.3 12.6 78.2 4.5 0.43 0.058 0.064 0.80 20 16 207 13 22 74 27OB231 CENBG 3.3 12.8 77.8 4.4 0.49 0.069 0.066 0.78 26 16 259 14 e 70 28OB235 CENBG 3.3 12.7 79.3 4.7 0.45 0.066 0.057 0.83 22 17 203 14 e 75 e
OB236 CENBG 3.3 12.7 77.8 4.6 0.46 0.053 0.070 0.78 25 14 209 8 e 79 e
OB237 CENBG 3.3 12.8 79.4 4.6 0.43 0.053 0.063 0.77 21 18 239 18 e 71 e
OB263 CENBG 3.3 12.5 77.7 5.0 0.53 0.088 0.081 1.05 31 23 282 21 e 93 e
OB267 CENBG 3.3 12.8 78.2 4.4 0.46 0.067 0.052 0.68 23 14 213 24 e e 26OB269 C2RMF 3.3 12.7 78.4 4.8 0.51 0.083 0.072 0.96 29 21 265 23 e 90 e
OB282 CENBG 3.3 12.8 79.2 4.7 0.48 0.064 0.060 0.78 23 16 224 14 e 81 e
OB201 CENBG 3.4 12.9 78.6 4.6 0.48 0.068 0.068 0.84 27 17 213 14 e 73 e
OB249 CENBG 3.4 12.7 78.3 4.8 0.49 0.078 0.071 0.98 26 20 237 21 e 85 e
OB222 CENBG 3.5 12.8 79.0 4.6 0.47 0.063 0.058 0.82 26 18 238 14 e 90 e
OB273 C2RMF 3.5 12.6 77.9 4.5 0.44 0.058 0.060 0.81 20 15 195 16 23 72 24OB211 CENBG 3.6 12.7 78.0 4.4 0.48 0.057 0.057 0.67 23 14 179 15 e 72 28OB239 CENBG 3.7 12.8 79.1 4.4 0.44 0.055 0.064 0.81 21 16 209 9 e 81 e
OB260 CENBG 3.7 12.7 77.9 4.3 0.49 0.061 0.063 0.70 20 14 204 8 e 82 29OB223 CENBG 3.9 12.6 77.6 4.7 0.51 0.068 0.080 1.05 23 22 304 18 e 96 e
OB258 CENBG 4.0 12.6 78.2 4.7 0.50 0.076 0.070 0.91 29 20 274 6 e 95 e
Average 3.1 12.7 78.5 4.6 0.47 0.066 0.065 0.82 24 16 220 16 23 79 25st. dev. 0.5 0.2 0.5 0.2 0.02 0.010 0.007 0.10 3 2 28 5 3 9 3var. coef., % 16 1.2 0.7 3.7 5.00 16 11 12 14 14 13 29 14 11 13
CaeFe and SreZr rich artefactsOB238 CENBG 2.6 13.5 72.4 5.1 1.13 0.213 0.087 1.74 66 21 241 156 e 164 e
OB217 CENBG 3.2 12.8 74.9 5.1 1.27 0.156 0.098 1.72 69 25 258 154 e 171 e
OB243 CENBG 3.2 13.5 73.1 5.1 1.14 0.155 0.084 1.50 52 20 214 139 e 152 e
OB281 CENBG 3.5 13.6 75.4 4.3 1.01 0.133 0.070 1.23 44 16 184 120 e 129 e
OB250 CENBG 3.6 13.6 75.4 4.3 1.05 0.142 0.062 1.19 42 18 193 128 e 136 e
OB251 CENBG 3.6 13.7 75.2 4.3 1.02 0.124 0.068 1.23 42 17 182 128 e 133 e
OB279 CENBG 3.6 13.3 73.6 4.4 1.14 0.158 0.081 1.57 54 20 205 134 e 136 e
OB280 CENBG 3.6 13.7 75.8 4.2 0.96 0.109 0.063 1.14 42 16 178 110 e 129 e
OB287 CENBG 3.6 13.7 75.5 4.2 1.01 0.128 0.063 1.17 41 15 178 113 e 114 e
OB293 CENBG 3.6 13.6 74.3 4.4 1.06 0.136 0.077 1.42 50 18 202 126 e 144 e
OB294 CENBG 3.6 13.7 74.5 4.3 1.06 0.137 0.071 1.36 47 20 203 139 e 134 e
OB276 CENBG 3.7 13.7 75.7 4.3 1.00 0.113 0.062 1.14 42 16 178 120 e 116 e
OB283 CENBG 3.7 13.7 75.1 4.3 1.05 0.133 0.065 1.20 44 14 174 116 e 133 e
OB285 CENBG 3.7 13.7 75.6 4.2 1.01 0.122 0.060 1.15 40 16 161 117 e 143 e
OB286 CENBG 3.7 13.8 75.4 4.2 1.14 0.118 0.062 1.13 42 17 174 120 e 113 e
OB288 CENBG 3.7 13.8 75.6 4.1 0.95 0.124 0.062 1.13 40 16 178 110 e 115 e
OB292 CENBG 3.7 13.8 76.0 4.1 0.99 0.111 0.063 1.10 38 14 169 115 e 117 e
OB295 CENBG 3.7 13.7 75.8 4.1 0.97 0.121 0.064 1.13 41 18 173 118 e 117 e
OB297 CENBG 3.7 13.8 75.6 4.2 1.02 0.126 0.062 1.13 40 17 181 120 e 131 e
(continued on next page)
G. Poupeau et al. / Journal of Archaeological Science 37 (2010) 2705e2720 2715

Table 6 (continued )
Sample Facility Na2O Al2O3 SiO2 K2O CaO TiO2 MnO Fe2O3 Zn Ga Rb Sr Y Zr Nb
OB298 CENBG 3.7 13.7 75.5 4.3 1.02 0.139 0.065 1.15 40 17 175 115 e 123 e
OB271 CENBG 3.8 13.6 74.9 4.3 1.06 0.133 0.072 1.26 50 16 182 122 e 116 e
OB275 CENBG 3.8 13.6 75.4 4.2 1.00 0.121 0.068 1.16 44 17 178 116 e 122 e
OB290 CENBG 3.8 13.7 75.4 4.2 1.02 0.122 0.065 1.17 44 17 178 118 e 125 e
OB274 CENBG 4.0 13.5 74.8 4.3 1.01 0.131 0.070 1.30 46 16 195 126 e 150 e
Average 3.6 13.6 75.0 4.4 1.05 0.134 0.069 1.27 46 17 189 124 132st. dev. 0.3 0.2 0.9 0.3 0.07 0.022 0.010 0.19 8 2 23 12 16var. coef., % 7.5 1.5 1.2 6.7 6.90 16 14 15 17 14 12 10 12
Contents in oxides are in weight per cent and contents in elements in mg/g (ppm).
G. Poupeau et al. / Journal of Archaeological Science 37 (2010) 2705e27202716
on the basis of the SEM-EDS data, the likelihood is that these 43artifacts were all made from East Göllü Da�g obsidians. It was toresolve the SEM-EDS sourcing uncertainties of the low CaeFeobsidians that all these samples were then re-analyzed using othertechniques. Of these 43 artifacts, 26 were re-analyzed by EDXRF atUC Berkeley, while 17 were re-run using PIXE, nine at CENBG, six atC2RMFand two on the two facilities (Table 1).We also here took theopportunity to run some of these problem artifacts more than onceto undertake a small inter-lab comparison, whereby one pieceanalyzed at UCB’s XRF lab was also run at C2RMF (OB200), whilethree of those re-analyzed at CENBG were also then re-run atC2RMF (OB220, OB233, OB296).
6. Sourcing by PIXE
Most of the source sample data generated by PIXE wereobtained from polished sections, some of which had previouslybeen analyzed by SEM-EDS; the other samples were treated onfreshly exposed surfaces (Table 5). In general the contents offifteen elements were determined except for Y and Nb in an earlyphase of this work at CENBG, and for Sr which for the Acıgöl Cratersample is always below detection level. The single polished sectionof samples P35-18B1 (East Göllü Da�g), Al Te 1 (Ala Tepe, Bingölarea) and Orta D2 (Orta Duz, Bingöl area) were analyzed twice, atC2RMF and CENBG respectively. The excellent agreement betweenthe results obtained in these two facilities confirms the equiva-lence between the extracted beam (C2RMF) and vacuum chamber(CENBG) PIXE declinations for obsidian analyses as previouslyclaimed (Le Bourdonnec et al., 2005). It had also been shownpreviously that the element contents determined in obsidians byour group using PIXE and ICP-AES/MS were in good agreement,with mean relative standard deviations per element better than 10per cent to (for Ti) 15 per cent (Bellot-Gurlet et al., 2005, Fig. 4).While this estimation had already been deduced through workingwith Andean obsidians (Bellot-Gurlet et al., 2008) this is the firsttime that we can demonstrate that this agreement holds also forthe major Anatolian sources (Fig. 7). From Na to Zn and for Zr it isalmost always better than 20% and often within 10%. The disper-sion is high for Mn due to the fact that PIXE can only obtain thiselement with limited precision. In Rb and Sr, the PIXE elementcontents are on the average higher by about 15% and 20%respectively as compared to ICP-MS. The overall distinctionbetween the obsidian sources of Table 5 relies essentially on theirCa, Fe, Zn, Sr and Zr contents and to a lesser extent, to their Al, Si,Ti, Y and Nb contents.
The PIXE data on the Çatalhöyük artifacts are reported in Table 6.Only thirteen element contents were systematically determined inthe early phases of this work, to which Y and Nb were then added.In three cases (samples OB 220, 233 and 296) a polished sectionwasanalyzed at C2RMF and at CENBG. The agreement inside each datacouple is excellent, with the exception of Na, possibly because ofa heterogeneously altered surface, as sometimes observed in
hydrated obsidians. The five artifacts for which SEM-EDS data wereobtained on internal surfaces were also analyzed by PIXE. Theagreement between the two methods for the polished surfaces(SEM-EDS) and the archaeological surfaces (PIXE) is excellent for Si,K, Ca and Fe, while Al is always slightly higher in PIXE analyses. ThePIXE Na contents are mostly below the expected value for obsidiansand do not correspond to their SEM-EDS counterparts. This againargues in favor of non-homogeneously altered archaeologicalsurfaces. The good agreement between PIXE/external surfaces andSEM/internal surfaces for elements Si to Fe is to be related to thelarger efficient depth of analysis by PIXE (�6 mm for Na against�18 mm for the Si and heavier elements) than for SEM-EDS (<4 mm),which tends to be affected to a greater extent by chemicallymodified surface layer (first micron or so thick) that results fromartifact hydration.
As with the SEM-EDS analyses, PIXE provided us with tworelatively homogeneous compositional groups of 45 and 24 arti-facts based on their Ca and Fe contents respectively (Table 6). Theycan also be easily distinguished from each other on the basis oftheir Zn, Sr and Zr contents. In each group the elemental compo-sition is fairly constant, with variation coefficients around themeanvalues lower than 7% for the Al, Si, K, and Ca oxide contents andlower than 17% for the other elements except Sr in the low CaeFegroup. The higher dispersion of 29% found for Sr in the low-Cagroup is to be related to its ‘low’ content, being only slightly abovedetection level. The Na oxides’ (see below) large dispersion of 16%and 28% in the low and high CaeFe groups respectively is a conse-quence of surface alteration.
In most cases the contents of Ca, Fe, Zn, Sr and Zr allow us todetermine the likely source of the artifacts’ raw materials. Thus inbinary plots comparing the contents of Sr, Zr and Zn, we view twowell-separated artifacts groups, particularly with reference to theirSr contents (Fig. 8). That said, for these and other PIXE-determinedtrace elements, the high Sr group does not allow us to distinguishbetween Nenezi Da�g and Orta-Sakaeli source compositions.However, as documented in Table 5 the latter can be discriminatedon the basis of their major element Ca and Fe contents. In turn weexclude Kocada�g as a possible source for the Çatalhöyük obsidianon the basis of the artifacts’ Zr, Sr and Fe values as the Zr and Srcontents are always higher and lower respectively for this sourcecompared to Nenezi Da�g obsidians (Table 5; see also Keller andSeifried, 1990). Furthermore, as detailed above, among the majorelements, the Fe contents are always lower than in Nenezi Da�gobsidians.
With the ‘low Sr’ artifact group in Fig. 8, Sr is close to the GöllüDa�g and Süphan Da�g source compositions. The separation of theartifact group from aWGD composition on the basis of their higherSr contents, is also confirmed by the slightly higher Ca content ofthis source compared to EGD obsidians (as previously observed byother archaeometrists [Keller and Seifried, 1990; Poidevin, 1998and Table 2 here]). With regard to the Süphan Da�g sourcecomposition, the Çatalhöyük samples systematically show Zn

Table 7Elemental compositions of Çatalhöyük obsidian artifacts as determined by EDXRF.
Sample MnOa Ga Rb Sr Y Zr Nb Ba Pb Th
SreZr poor artifacts200 0.06 16 196 13 29 82 26 128 28202 0.06 17 211 10 22 85 22 131 29204 0.06 17 199 12 24 77 20 116 23207 0.06 16 207 16 26 80 22 151 27210 0.07 19 211 15 26 82 23 130 32211 0.06 190 21 23 87 22 223 24214 0.06 17 208 13 26 79 24 118 33216 0.07 18 215 13 25 83 26 155 24218 0.06 18 195 13 27 80 21 116 25225 0.07 19 206 18 28 86 26 246 30227 0.07 19 209 13 28 81 27 125 29232 0.06 16 187 10 23 75 19 125 27240 0.06 17 192 17 25 79 22 224 30241 0.05 16 188 11 23 82 23 145 38244 0.08 20 222 18 26 90 27 221 24245 0.06 15 190 13 23 74 23 138 22246 0.05 15 175 11 24 74 26 132 30247 0.07 17 210 10 24 81 21 143 29248 0.06 18 198 11 24 78 22 121 28252 0.06 18 203 13 25 81 23 144 31261 0.06 17 198 11 25 85 27 152 27262 0.06 18 192 14 22 83 22 199 32264 0.05 17 181 15 24 78 24 206 20265 0.06 15 187 11 25 81 20 226 28270 0.060 18 182 17 23 79 23 201 27273 0.056 191 18 26 92 23 169 17
Average 0.061 17 198 14 25 81 23 161 27st. dev. 0.006 1 12 3 2 4 2 42 4var. coef., % 9.446 8 6 22 7 5 10 26 16
SreZr rich artifacts212 0.064 172 98 22 146 22 875 30 34213 0.067 169 101 23 143 19 840 33 31215 0.063 170 100 23 145 17 756 30 31228 0.062 168 95 21 138 17 843 26 30256 0.075 183 103 19 159 19 920 32 31272 0.065 167 96 24 146 17 802 32 34277 0.086 170 96 20 143 18 853 36 39278 0.062 204 115 22 158 20 856 31 44
Average 0.068 175 101 22 147 19 843 31 34st. dev. 0.008 13 6 2 7 2 49 3 5var. coef., % 12 7 6 8 5 9 6 9 14
a Element contents in weight per cent oxide for Mn and in mg/g for the others.
Fig. 8. Comparison between the contents of Sr, Zn and Zr in the Çatalhöyük artifactsand in obsidians from potential sources as determined by PIXE.
G. Poupeau et al. / Journal of Archaeological Science 37 (2010) 2705e2720 2717
contents subtly lower than the two geological samples analyzed,but also significantly different Ca and Fe contents which suggestthat we can exclude this volcanic centre as a potential source of ourartifacts’ raw material. The Ca and Fe contents thus also serve todiscriminate the artifacts’ raw material from those of Süphan Da�gand WGD.
In summary, while SEM-EDS could not differentiate betweenEast Göllü Da�g and West Acıgöl with regard to the source of the 45low-Ca obsidians from Çatalhöyük, PIXE allows us to assign withconfidence the group to East Göllü Da�g, largely on the basis of theirSr contents. With regard to the 25 high-Ca artifacts, the SEM-EDSand PIXE data converge towards indicating a Nenezi Da�g compo-sitional type.
7. Sourcing by EDXRF
At UC Berkeley’s XRF lab we analyzed 34 artifacts and fourgeological samples. The latter comprised Or4 and Sa1 from Galatiaplus N8 from the Acıgöl Crater which had also been analyzed byPIXE, while Kom-1 from the Kömürcü source (East Göllü Da�g) hadpreviously been run by ICP-MS. In all cases the agreement betweenEDXRF and the other two approaches was excellent for all elements.The Ba content, although in the range admitted for an East GöllüDa�g sample is higher by more than 40% than in the aliquot ofsample Kom-1 also analyzed by ICP-MS.
The 34 artifacts can again, as with PIXE, be separated into twolow and high SreZr groups respectively. While these groupspresent similar contents in Mn, Rb, Y, Nb and Th, they differ alsogreatly by their respective low and high Ba contents (Table 7).
In the high SreZr group, as for PIXE, a SreZr diagram cannotseparate a Nenezi Da�g from a Galatian origin (Fig. 9). However thelatter is easily eliminated from its larger Th contents (>20 ppm)than in the former (<8 ppm) (Table 5). With regard to Ba, the highcontents above 800 ppm found by EDXRF in these artifacts areunknown in Cappadocia and Galatia, where they reach at most560 ppm except at Hasan Da�g (Poidevin, 1998). However, if in thissource the Ba contents are in the range 750e1000 ppm, the Srcontents are lower than in the Nenezi Da�g obsidians (Poidevin,1998) and in the Çatalhöyük high SreZr and CaeFe obsidians.This suggests that the barium might also be somewhat over-estimated by EDXRF (see also KOM-1 in Table 5).
In the low SreZr group, while the Çatalhöyük artifactsmatch theEGD type composition, they also lay side-by-side with the WestAcıgöl and Süphan Da�g obsidians. AWA origin for this material caneasily be rejected on the ground of their lower Sr (<4 ppm in Table4) and especially Ba (29 ppm) values as compared to EGD obsidians(Poidevin, 1998; Bellot-Gurlet, 1998 inter alia). The only WA sampleanalyzed by EDXRF also presents slightly higher contents in Rb, Yand marginally in Ga than the EGD obsidians. In turn, the lowcontent of Ba (<210 ppm) in the group of low SreZr artifacts issufficient to eliminate the Süphan Da�g source (<478 in Table 5), asis possibly the Nb content.
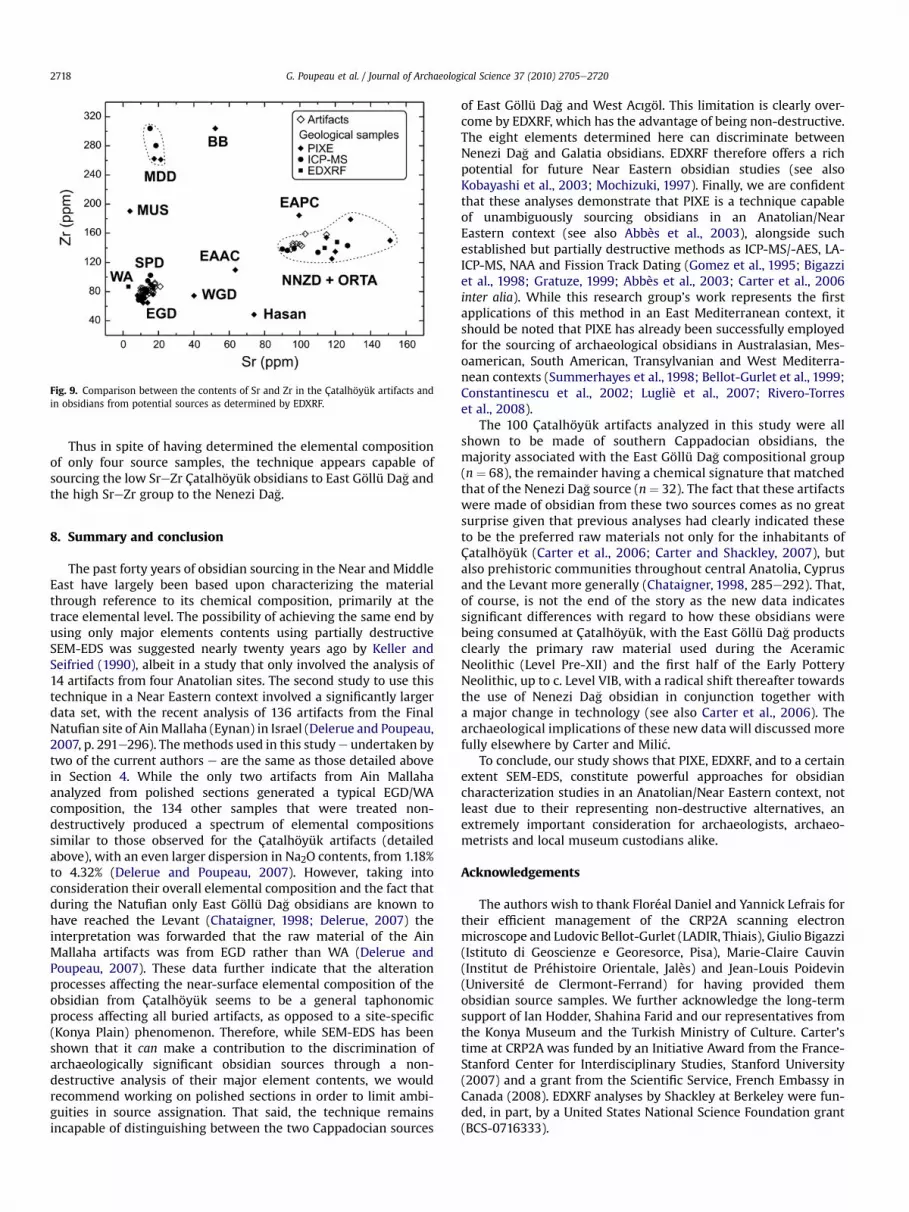
Fig. 9. Comparison between the contents of Sr and Zr in the Çatalhöyük artifacts andin obsidians from potential sources as determined by EDXRF.
G. Poupeau et al. / Journal of Archaeological Science 37 (2010) 2705e27202718
Thus in spite of having determined the elemental compositionof only four source samples, the technique appears capable ofsourcing the low SreZr Çatalhöyük obsidians to East Göllü Da�g andthe high SreZr group to the Nenezi Da�g.
8. Summary and conclusion
The past forty years of obsidian sourcing in the Near and MiddleEast have largely been based upon characterizing the materialthrough reference to its chemical composition, primarily at thetrace elemental level. The possibility of achieving the same end byusing only major elements contents using partially destructiveSEM-EDS was suggested nearly twenty years ago by Keller andSeifried (1990), albeit in a study that only involved the analysis of14 artifacts from four Anatolian sites. The second study to use thistechnique in a Near Eastern context involved a significantly largerdata set, with the recent analysis of 136 artifacts from the FinalNatufian site of AinMallaha (Eynan) in Israel (Delerue and Poupeau,2007, p. 291e296). Themethods used in this studye undertaken bytwo of the current authors e are the same as those detailed abovein Section 4. While the only two artifacts from Ain Mallahaanalyzed from polished sections generated a typical EGD/WAcomposition, the 134 other samples that were treated non-destructively produced a spectrum of elemental compositionssimilar to those observed for the Çatalhöyük artifacts (detailedabove), with an even larger dispersion in Na2O contents, from 1.18%to 4.32% (Delerue and Poupeau, 2007). However, taking intoconsideration their overall elemental composition and the fact thatduring the Natufian only East Göllü Da�g obsidians are known tohave reached the Levant (Chataigner, 1998; Delerue, 2007) theinterpretation was forwarded that the raw material of the AinMallaha artifacts was from EGD rather than WA (Delerue andPoupeau, 2007). These data further indicate that the alterationprocesses affecting the near-surface elemental composition of theobsidian from Çatalhöyük seems to be a general taphonomicprocess affecting all buried artifacts, as opposed to a site-specific(Konya Plain) phenomenon. Therefore, while SEM-EDS has beenshown that it can make a contribution to the discrimination ofarchaeologically significant obsidian sources through a non-destructive analysis of their major element contents, we wouldrecommend working on polished sections in order to limit ambi-guities in source assignation. That said, the technique remainsincapable of distinguishing between the two Cappadocian sources
of East Göllü Da�g and West Acıgöl. This limitation is clearly over-come by EDXRF, which has the advantage of being non-destructive.The eight elements determined here can discriminate betweenNenezi Da�g and Galatia obsidians. EDXRF therefore offers a richpotential for future Near Eastern obsidian studies (see alsoKobayashi et al., 2003; Mochizuki, 1997). Finally, we are confidentthat these analyses demonstrate that PIXE is a technique capableof unambiguously sourcing obsidians in an Anatolian/NearEastern context (see also Abbès et al., 2003), alongside suchestablished but partially destructive methods as ICP-MS/-AES, LA-ICP-MS, NAA and Fission Track Dating (Gomez et al., 1995; Bigazziet al., 1998; Gratuze, 1999; Abbès et al., 2003; Carter et al., 2006inter alia). While this research group’s work represents the firstapplications of this method in an East Mediterranean context, itshould be noted that PIXE has already been successfully employedfor the sourcing of archaeological obsidians in Australasian, Mes-oamerican, South American, Transylvanian and West Mediterra-nean contexts (Summerhayes et al., 1998; Bellot-Gurlet et al., 1999;Constantinescu et al., 2002; Lugliè et al., 2007; Rivero-Torreset al., 2008).
The 100 Çatalhöyük artifacts analyzed in this study were allshown to be made of southern Cappadocian obsidians, themajority associated with the East Göllü Da�g compositional group(n ¼ 68), the remainder having a chemical signature that matchedthat of the Nenezi Da�g source (n ¼ 32). The fact that these artifactswere made of obsidian from these two sources comes as no greatsurprise given that previous analyses had clearly indicated theseto be the preferred raw materials not only for the inhabitants ofÇatalhöyük (Carter et al., 2006; Carter and Shackley, 2007), butalso prehistoric communities throughout central Anatolia, Cyprusand the Levant more generally (Chataigner, 1998, 285e292). That,of course, is not the end of the story as the new data indicatessignificant differences with regard to how these obsidians werebeing consumed at Çatalhöyük, with the East Göllü Da�g productsclearly the primary raw material used during the AceramicNeolithic (Level Pre-XII) and the first half of the Early PotteryNeolithic, up to c. Level VIB, with a radical shift thereafter towardsthe use of Nenezi Da�g obsidian in conjunction together witha major change in technology (see also Carter et al., 2006). Thearchaeological implications of these new data will discussed morefully elsewhere by Carter and Mili�c.
To conclude, our study shows that PIXE, EDXRF, and to a certainextent SEM-EDS, constitute powerful approaches for obsidiancharacterization studies in an Anatolian/Near Eastern context, notleast due to their representing non-destructive alternatives, anextremely important consideration for archaeologists, archaeo-metrists and local museum custodians alike.
Acknowledgements
The authors wish to thank Floréal Daniel and Yannick Lefrais fortheir efficient management of the CRP2A scanning electronmicroscope and Ludovic Bellot-Gurlet (LADIR, Thiais), Giulio Bigazzi(Istituto di Geoscienze e Georesorce, Pisa), Marie-Claire Cauvin(Institut de Préhistoire Orientale, Jalès) and Jean-Louis Poidevin(Université de Clermont-Ferrand) for having provided themobsidian source samples. We further acknowledge the long-termsupport of Ian Hodder, Shahina Farid and our representatives fromthe Konya Museum and the Turkish Ministry of Culture. Carter’stime at CRP2A was funded by an Initiative Award from the France-Stanford Center for Interdisciplinary Studies, Stanford University(2007) and a grant from the Scientific Service, French Embassy inCanada (2008). EDXRF analyses by Shackley at Berkeley were fun-ded, in part, by a United States National Science Foundation grant(BCS-0716333).

Appendix 1. Geological samples localization.
Area Sample Sampling station, when specified Provided by
Orta-dome Or 4 PoidevinSakaeli-dome Sa 1 17 km north of Orta, edge of a dome PoidevinAcigöl crater N8 Acigöl, wall of maar, 2 km E of Aci�göl, S of Acigöl-Nevsehir road Bigazzi*Kocada�g N4 Taskesiktepe, 700 m W of Bogazköy Bigazzi*WTHD N1 Bo�gazköy (wall of caldera 1 km NNW of Bo�gazköy, N of Acigöl-Nevsehir road Bigazzi*East Kayırlı P35-18B1 W flank of Bitlikeler hill Cauvin
Kay E1 PoidevinKömürcü Kom 1 Poidevin
Kom C1 to C6 Gully along the Komürcü ‘C flow’ CauvinSirça Deresi SD1 and SD2 Not specified CarterNorth-Bozköy N12 1 km E of Bozköy or 1 km E of Komürcü Bigazzi*Nenezi Da�g P34.8 Nenezi Da�g west gully Cauvin
Ne W2 and NE 5 PoidevinHasan Dag Hasan and Has-Kay BigazziAla Tepe Al Te 1 CauvinOrta Duz Orta D1 and D2 Cauvin
BIN 9-1 Karan village (Karan Solhan area), between Bingöl and Mus KobayashiMeydan Da�g ME 6-1 Outside caldera Kobayashi
ME 7-1 Inside caldera (Obsidian source No. 6 in Kobayashi et al., 2003) KobayashiMey 1 and Mey 4 Poidevin
Mus D20 Mercimekkale, near to Anzar Bigazzi**MUS-Ziy Mus-Ziyaret Tepe Bigazzi
Nemrut Da�g Nem N1 and N2 Northern part of Nemrut Da�g PoidevinNEM 3-1 Sampling site 3 is a secondary source inside the caldera (Obsidian source No. 8) Kobayashi***NEM 3-2NEM 3-3
Suphan Da�g Sup 1 SW of Suphan Da�g PoidevinSup 5 NE of Suphan Da�g PoidevinSU 5-1 Obsidian source No. 7 in Kobayashi et al. (2003) Kobayashi
*Bigazzi et al. (1993); **Bigazzi et al. (1994); ***Kobayashi et al. (2003). All others, pers. com.
G. Poupeau et al. / Journal of Archaeological Science 37 (2010) 2705e2720 2719
References
Abbès, F., Bellot-Gurlet, L., Cauvin, M.-C., Delerue, S., Dubernet, S., Poupeau, G.,Stordeur, D., 2003. Provenance of the Jerf el Ahmar (Middle Euphrates Valley,Syria) obsidians. Journal of Non-Crystalline Solids 323, 162e166.
Adams, P.B., 1984. Glass corrosion. Journal of Non-Crystalline Solids 67, 193.Anowitz, L.M., Elam, J.M., Riciputi, L.R., Cole, D.R., 1999. The failure of obsidian
hydration dating: sources, implications, and new directions. Journal ofArchaeological Science 26, 735e752.
Balkan-Atli, N., Der Aprahamian, G., 1998. Les nucléus de Kaletepe et deux ateliersde taille en Cappadoce. In: Cauvin, M.-C., Gourgaud, A., Gratuze, B., Arnaud, N.,Poupeau, G., Poidevin, J.-L., Chataigner, C. (Eds.), L’Obsidienne au Proche etMoyen Orient. Du volcan à l’outil. BAR International Series 738. Archaeopress,Oxford, pp. 241e258.
Balkan-Atli, N., Cauvin, M.-C., Binder, D., 1999. Obsidian: sources, workshops andtrade in Central Anatolia. In: Özdo�gan, M., Basgelen, N. (Eds.), Neolithic inTurkey: The Cradle of Civilization. New Discoveries. Arkeoloji ve Sanat Yayınları,Istanbul, pp. 133e145.
Bellot-Gurlet, L., 1998. Caractérisation par analyse élémentaire (PIXE et ICP-MS/-AES) d’un verre naturel:l’obsidienne. Application à l’étude de provenanced’objets archéologiques. Université Joseph Fourier, Grenoble I. http://tel.archives-ouvertes.fr/tel-00315287/fr/.
Bellot-Gurlet, L., Calligaro, Th., Dorighel, O., Dran, J.-C., Poupeau, G., Salomon, J.,1999. PIXE analysis and fission track dating of obsidian from South Americanprehispanic cultures (Colombia, Ecuador). Nuclear Instruments and Methods inPhysics Research Section B 150, 616e621.
Bellot-Gurlet, L., Poupeau, G., Bressy, C., 2003. Element contents determined by ICP-AES and ICP-MS at Grenoble on nine obsidian artefacts from Tell Kosak Shamali:results and inferences on provenance. In: Nishiaki, Y., Matsutani, T (Eds.), TellKosak Shamali, vol. 2. The University of Tokyo, pp. 113e119.
Bellot-Gurlet, L., Poupeau, G., Salomon, J., Calligaro, Th., Moignard, B., Barrat, J.A.,Pichon, L., 2005. Obsidian provenance studies in archaeology: a comparisonbetween PIXE and ICP. Nuclear Instruments and Methods in Physics ResearchSection B 240, 583e588.
Bellot-Gurlet, L., Dorighel, O., Poupeau, G., 2008. Obsidian provenance studies inColombia and Ecuador: obsidian sources revisited. Journal of ArchaeologicalScience 35, 272e289.
Bigazzi, G., Ye�gingil, Z., Ercan, T., Oddone, M., Özdo�gan, M., 1993. Fission track datingin central and northern Anatolia. Bulletin of Volcanology 55, 588e595.
Bigazzi, G., Ye�gingil, Z., Ercan, T., Oddone, M., Özdo�gan, M., 1994. Provenance studiesof prehistoric artifacts in eastern Anatolia: interdisciplinary research results.Mineralogica et Petrographica Acta XXXVII, 17e36.
Bigazzi, G., Poupeau, G., Ye�gingil, Z., Bellot-Gurlet, L., 1998. Provenance studies ofobsidian artefacts in Anatolia using the fission-track dating method: an
overview. In: Cauvin, M.-C., Gourgaud, A., Gratuze, B., Arnaud, N., Poupeau, G.,Poidevin, J.-L., Chataigner, C. (Eds.), L’Obsidienne au Proche et Moyen Orient. Duvolcan à l’outil. BAR International Series 738. Archaeopress, Oxford, pp. 69e89.
Binder, D., Balkan-Atli, N., 2001. Obsidian exploitation and blade technology atKömürcü-Kaletepe (Cappadocia, Turkey). In: Caneva, I., Lemorini, C.,Zampetti, D., Biagi, P. (Eds.), Beyond Tools. Redefining the PPN Lithic Assem-blages of the Levant. Proceedings of the Third Workshop on PPN Chipped LithicIndustries. Studies in Early Near Eastern Production, Subsistence, and Envi-ronment, vol. 9. Ex Oriente, Berlin, pp. 1e16.
Bressy, C., Poupeau, G., Yener, A., 2005. Cultural interactions during the Ubaid andHalaf periods: Tell Kurdu (Amuq Valley, Turkey) obsidian sourcing. Journal ofArchaeological Science 32, 1560e1565.
Calligaro, T., MacArthur, J.D., Salomon, J., 1996. An improved experimental setup forthe simultaneous PIXE analysis of heavy and light elements with a 3 Mevproton external beam. Nuclear Instruments and Methods in Physics ResearchSection B 109/110, 125e128.
Calligaro, T., Dran, J.-C., Moignard, B., Pichon, L., Salomon, J., Walter, P., 2002. Ionbeam analysis with external beams: recent set-up improvements. NuclearInstruments and Methods in Physics Research Section B 188, 135e140.
Calligaro, T., Dran, J.-C., Poupeau, G., Gendron, F., Dubernet, S., Meslay, O.,Gonthier, E., Tenorio, D., 2005. PIXE reveals that two Murillo’s masterpieceswere painted on Mexican obsidian slabs. Nuclear Instruments and Methods inPhysics Research B 240, 576e582.
Campbell, J.L., Hopman, T.L., Maxwell, J.A., Nejedly, Z., 2000. The Guelph PIXEsoftware package III: alternative proton database. Nuclear Instruments andMethods in Physics Research Section B 170, 193e204.
Carter, T., Shackley, M.S., 2007. Sourcing obsidian from Neolithic Çatalhöyük (Turkey)using energy dispersive x-ray fluorescence. Archaeometry 49, 437e454.
Carter, T., Poupeau, G., Bressy, C., Pearce, N.J.G., 2005a. From chemistry toconsumption: towards a history of obsidian use at Çatalhöyük through a pro-gramme of inter-laboratory trace elemental characterization. In: Hodder, I.(Ed.), Changing Materialities at Çatalhöyük: Reports from the 1995e1999Seasons. Mc Donald Institute Monographs and BIAA, Cambridge, pp. 285e305.535e557.
Carter, T., Conolly, J., Spasojevi�c, A., 2005b. The chipped stone. In: Hodder, I. (Ed.),Changing Materialities at Çatalhöyük: Reports from the 1995e1999 Seasons.McDonald Institute Monographs and BIAA, Cambridge, pp. 221e283. 467e533.
Carter, T., Poupeau, G., Bressy, C., Pearce, N.J.G., 2006. A new programme of obsidiancharacterization at Çatalhöyük, Turkey. Journal of Archaeological Science 33,893e909.
Carter, T., Dubernet, S., King, R., Le Bourdonnec, F.-X., Mili�c, M., Poupeau, G.,Shackley, M.S., 2008. Eastern Anatolian obsidians at Çatalhöyük and thereconfiguration of regional interaction in the Early Pottery Neolithic. Antiquity82, 900e909.

G. Poupeau et al. / Journal of Archaeological Science 37 (2010) 2705e27202720
Cauvin, M.-C., Balkan-Atli, N., 1996. Rapport sur les recherches sur l’obsidienne enCappadoce, 1993e1995. Anatolia Antiqua IV, 249e271.
Cessford, C., Blumbach, P., Göze Ako�glu, K., Higham, T., Kuniholm, P.I., Manning, S.W.,Newton, N.W., Özbakan, M., Melek Özer, A., 2005. Absolute dating at Çatalhöyük.In: Hodder, I. (Ed.), Changing Materialities at Çatalhöyük: Reports from the1995e1999 Seasons. McDonald Institute Monographs and BIAA, Cambridge, pp.65e99. 449e450.
Chabot, J., Poidevin, J.-L., Chataigner, C., Fortin, M., 2001. Caractérisation et provenancedes artefacts en obsidienne de Tell ‘Atij et de Tell Gudeda (IIIe millénaire, Syrie). In:Fortin, M. (Ed.), Recherches canadiennes sur la Syrie antique / Canadian Researchon Ancient Syria. Musée de la civilisation. Canadian Society for MesopotamianStudies. Québec, Toronto, pp. 241e256.
Chataigner, C., 1998. Sources des artefacts du Proche Orient d’après leur caractér-isation géochimique. In: Cauvin, M.-C., Gourgaud, A., Gratuze, B., Arnaud, N.,Poupeau, G., Poidevin, J.-L., Chataigner, C. (Eds.), L’Obsidienne au Proche etMoyen Orient. Du volcan à l’outil. BAR International Series 738. Archaeopress,Oxford, pp. 273e324.
Constantinescu, B., Bugoi, R., Sziki, G., 2002. Obsidian provenance studies of Tran-sylvania’s Neolithic tools using PIXE, micro-PIXE and XRF. Nuclear Instrumentsand Methods in Physics Research Section B 189, 373e377.
Davis, M.K., Jackson, T.L., Shackley, M.S., Teague, T., Hampel, J.H., 1998. Factorsaffecting the energy-dispersive x-ray fluorescence (EDXRF) analysis of archae-ological obsidian. In: Shackley, M.S. (Ed.), Archaeological Obsidian Studies:Method and Theory. Advances in Archaeological and Museum Science, vol. 3.Plenum Press, New York, pp. 159e180.
Delerue, S., 2007. L’obsidienne dans le processus de néolithisation du Proche-Orient(12000e6500 BC). Ph.D., Université Michel de Montaigne, Bordeaux 3.
Delerue, S., Poupeau, G.., 2007. La provenance des obsidiennes du Natoufien final deMallaha, in Valla, F.R. et al., Les fouilles de Ain Mallaha (Eynan) de 2003 à 2005:Quatrième rapport préliminaire. Journal of the Israel Prehistoric Society vol. 37,135e379 (291e296).
Ercan, T., Ye�gingil, Z., Bigazzi, G., 1989. Obsidian, definition, characteristics anddistribution in Anatolia; geochemical features of Central Anatolian obsidians.Jeomorfoloji Dergisi 17, 71e83.
Gale, N.H., 1981. Mediterranean obsidian source characterisation by strontiumisotope analysis. Archaeometry 23, 41e51.
Govindaraju, K., 1994. Compilation of working values and sample description for383 geostandards. Geostandards Newsletter 18, 1994. Special Issue.
Gomez, B., Glascock, M.D., Blackman, J., Todd, I.A., 1995. Neutron activationanalysis of obsidian from Kalavasos-Tenta. Journal of Field Archaeology 22,503e508.
Gratuze, B., 1999. Obsidian characterization by Laser Ablation ICP-MS and itsapplication to prehistoric trade in the Mediterranean and the Near East: sourcesand distribution of obsidian with the Aegean and Anatolia. Journal of Archae-ological Science 26, 869e881.
Hodder, I. (Ed.), 2007. Excavating Çatalhöyük: South, North and KOPAL AreaReports from the 1995e1999 Seasons. McDonald Institute Monographs,Cambridge.
Keller, J., Seifried, C., 1990. The present status of obsidian source identification inAnatolia and the Near East. PACT 25, 57e85.
Kobayashi, K., Zahidul, A.M., Mochizuki, A., 2003. Classification of obsidian sourcesin Turkey (II). Classification of obsidian sources in Eastern Anatolia. AnatolianArchaeological Studies XII, 109e112.
Le Bourdonnec, F.-X., 2007. Aspects archéométriques de la circulation de l’obsi-dienne préhistorique. Développements analytiques et applications en Corse,Sardaigne et Ethiopie. Ph. D., Université Michel de Montaigne Bordeaux 3.
Le Bourdonnec, F.-X., Delerue, S., Dubernet, S., Moretto, P., Calligaro, T., Dran, J.C.,Poupeau, G., 2005. PIXE characterization of Western Mediterranean andAnatolian obsidians and Neolithic provenance studies. Nuclear Instruments andMethods in Physics Research Section B240, 595e599.
Le Bourdonnec, F.-X., Bontempi, J.-M., Marini, N., Mazet, S., Neuville, P.F.,Poupeau, G., Sicurani, J., 2010. Western Mediterranean obsidians characteriza-tion by SEM-EDS and the Neolithic site of A Fuata (Corsica). Journal ofArchaeological Science 37, 92e106.
Llabador, Y., Bertault, D., Gouillaud, J.C., Moretto, P., 1990. Advantages of high speedscanning for microprobe analysis of biological samples. Nuclear Instrumentsand Methods in Physics Research Section B 49, 435e440.
Lugliè, C., Le Bourdonnec, F.-X., Poupeau, G., Atzeni, E., Dubernet, S., Moretto, P.,Serani, L., 2007. Early Neolithic obsidians in Sardinia (western Mediterranean):the Su Carroppu case. Journal of Archaeological Science 34, 428e439.
Maxwell, J.A., Campbell, J.L., Teesdale, W.J., 1989. The Guelph PIXE software package.Nuclear Instruments and Methods in Physics Research Section B 43, 218e230.
Mellaart, J., 1967. Çatal Hüyük, a Neolithic Town in Anatolia. Thames and Hudson,London.
Mochizuki, A., 1997. Classification of obsidian sources in Turkey (I). Classification ofobsidian sources in Central Anatolia and source identification of obsidian arti-facts from Kaman-Kalehöyük. Anatolian Archaeological Studies VI, 169e186 (inJapanese).
Patel, S.B., Hedge, R.E., Kilner, J.A., 1998. Surface analysis of archaeological obsidiansby SIMS. Journal of Archaeological Science 25, 1047e1054.
Poidevin, J.-L., 1998. Les gisements d’obsidienne de Turquie et de Transcaucasie:géologie, géochimie et chronométrie. In: Cauvin, M.-C., Gourgaud, A.,Gratuze, B., Arnaud, N., Poupeau, G., Poidevin, J.-L., Chataigner, C. (Eds.), L’Ob-sidienne au Proche et Moyen Orient. Du volcan à l’outil. BAR InternationalSeries 738. Archaeopress, Oxford, pp. 105e203.
Rivero-Torres, S., Calligaro, Th., Tenorio, D., Jiménez-Reyes, M., 2008. Characteriza-tion of archaeological obsidians from Lagartero, Chiapas Mexico by PIXE.Journal of Archaeological Science 35, 3168e3171.
Renfrew, C., Dixon, J.E., Cann, J.R., 1966. Obsidian and early Cultural Contact in thenear East. Proceedings of the Prehistoric Society 22, 30e72.
Shackley, M.S., 2005. Obsidian: Geology and Archaeology in the North AmericanSouthwest. University of Arizona Press, Tucson.
Summerhayes, G.R., Bird, J.R., Fullager, R., Gosden, C., Specht, J., Torrence, R., 1998.Application of PIXE-PIGME to archaeological analysis of changing patterns ofobsidian use in West New Britain, Papua New Guinea. In: Shackley, M.S. (Ed.),Archaeological Obsidian Studies: Method and Theory. Advances in Archaeo-logical and Museum Science 3. Plenum Press, New York, pp. 129e158.
Wright, G.A., 1969. Obsidian analyses and prehistoric near eastern trade: 7500 to3500 BC. In: Anthropological Papers, No 37. Museum of Anthropology,University of Michigan, Ann Arbor, pp. 5e26.


