Embed Size (px)
Citation preview
Daniel Wells
1
The Zombie Virus: A Virtual Byte Too Far
A Mathematical Modelling of Movie & Gaming Zombies By Daniel Wells – Supervised by Dr. Hadi Susanto
Abstract
The Oxford Dictionary defines a zombie as “A corpse said to be revived by witch”23
and that in
popular fiction; “A person or reanimated corpse that has been turned into a creature capable of
movement but not rational thought, which feeds on human flesh”23
. An apocalypse is defined as “An
event involving destruction or damage on a catastrophic scale”23
. The use of zombies in media has
risen over the years, to the point where we have numerous TV shows, movies and games being
released every year. Recent examples include: The Walking Dead, World War Z and The Last of Us.
This report will look over other zombie model papers and try to replicate the results. Followed by
expansion and adapting to different movies and games. It will conclude with the chance of survival if
a zombie apocalypse ever happened.
The report will also show that the addition of a permanently dead group is more realistic then the
removed group that can resurrect dead zombies, as well as the effects a cured group that cannot be
infected again has.
Introduction
The Idea of a Zombie or a reanimated corpse can be traced throughout time to as far back as Circa
2100BC where a poem in ‘Epic of Gilgamesh’1, in which it describes the return of the dead to eat the
living. More commonly zombies can be referenced in Haitian folklore in which voodoo magic is used
to reanimate corpses to be enslaved under the control of the person who raised them, since they have
no free will of their own.
According to Leads Zombie Film Festival2, the first Zombie movie was 1932’s White Zombie
3. Based
on the Haitian zombies with voodoo magic, a plantation owner raises zombies to work for him as
slaves. It wasn’t until 1968 and George Romero’s Night of the Living Dead4, that movies used the
flesh-eating zombies instead of voodoo ones. He also introduced the idea of it being a pandemic with
the zombies attacking not only a small closed area. While zombie games were popularised by Capcom
in 1996 with Resident Evil5, zombie games have been around as early as 1984 and the first zombie
game is attributed to Zombie Zombie6&7
.
Over the past few years we have seen a rise in not only the amount of Films and Games being made
with a Zombie theme, but also the great deal of high grossing zombie films and games, for example:
World War Z8, Zombieland
9, Dying Light
10, The Evil Within
11, 7 Days to Die
12, Last of Us
13, Walking
Dead (Game)14
, any Treyarch Call of Duty console game15
, Day Z16
and the TV series Walking
Dead17
.
Comparing the original and modern zombies, shows there is a wide variety of differences, for
example we notice that the older types of zombies tend to be slower and work as a pack, whilst
modern zombies can have a multitude of strengths and intelligence and can work surprising well alone
as well as in a pack. It’s not that surprising then, that over the past couple of years, zombies with
different strengths, intelligences and zombification causations have been dubbed with different names.
The Haiti zombies being dubbed Voodoo Zombies, other zombies that will be looking at are Classic
Romero Zombies, Brain Eating Zombies, Walkers, Fast Zombies and Rage Zombies.
Daniel Wells
2
Classic Romero Zombies are the ones mainly used in the ‘When Zombies Attack! : Mathematical
Modelling of an Outbreak of Zombie Infection’18
Report. These are the slow moving, low intelligence
and group huddling zombies, most notably used in the film; ‘Night of The Living Dead4’. This report
will be using these zombies as the basis for the other types of zombies. Walkers is the term used in the
Walking Dead Series (Game & TV)14&17
, They are slow moving, group walking zombies like
Romero’s and are easily susceptible to being deceived if you can cover your living scent.
Brain Eating Zombies are the ones that move around asking for brains. They jump you before ripping
your head open and eating your brains, they also can’t be killed by usual zombie killing methods
(Removing the head or destroying the brain), The only way to kill these ones is with fire. These
Zombies appear in movies such as ‘The Return of the Living Dead’19
.
Fast Zombies are zombies that are faster than the original type. They can chase can catch up to even
the fastest of people. They are seen in the ‘Dawn of the Dead’20
Remake in 2004. And Rage Zombies
are famous for being the zombies in the movie ‘28 Days Later’21
, named after the Rage Virus, these
‘zombies’ are not of the dead variety like others, another example is the Last of Us13
‘zombies’ which
are from a fungal Infection.
Some assumptions to take into consideration throughout this report are: there is only one zombie to
start with [unless otherwise stated], the alpha value is the rate at which a zombie is decapitated or
suffers brain damage. The zombie apocalypse happens to a village of 500 and in a short time frame,
so the birth rate can be taken as zero.
Phase 1 – Repeating existing data and expanding.
Munz et al’s18
paper on classic Romero Zombies has take some of these assumptions into
consideration when modelling their zombies, but also some assumptions that do not make sense. The
paper starts off with explaining why they are using Romero Zombies, and what data values to use in
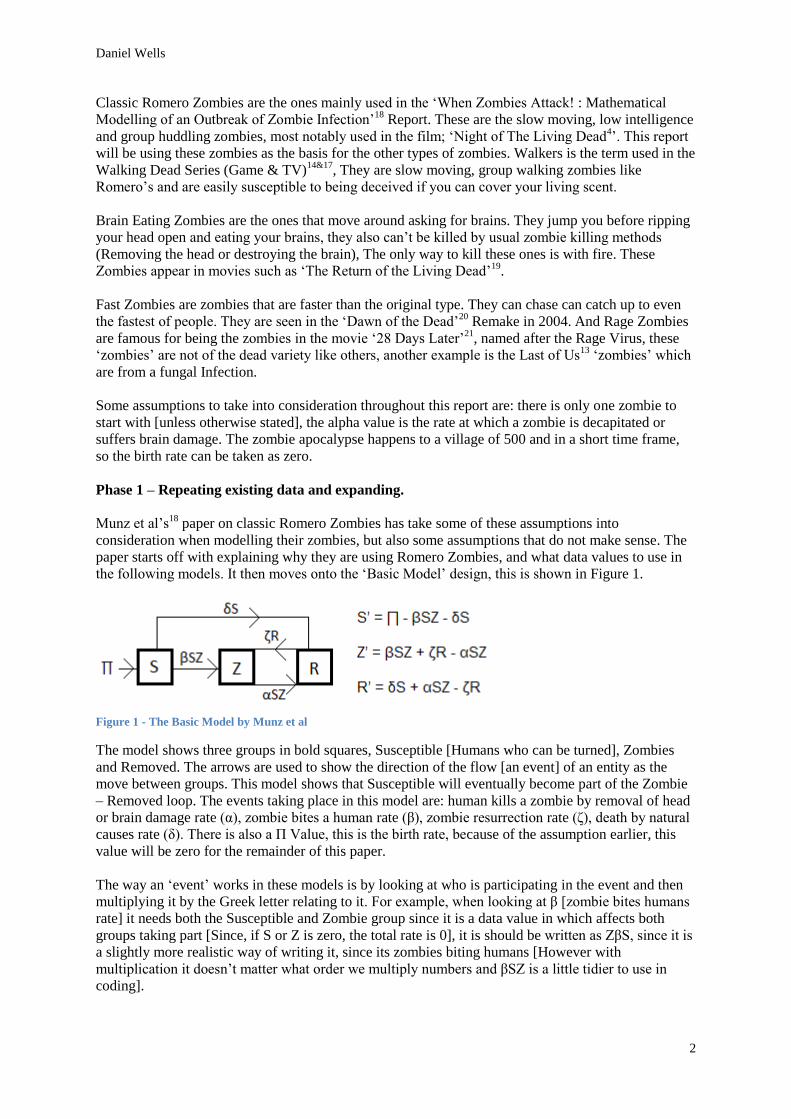
the following models. It then moves onto the ‘Basic Model’ design, this is shown in Figure 1.
Figure 1 - The Basic Model by Munz et al
The model shows three groups in bold squares, Susceptible [Humans who can be turned], Zombies
and Removed. The arrows are used to show the direction of the flow [an event] of an entity as the
move between groups. This model shows that Susceptible will eventually become part of the Zombie
– Removed loop. The events taking place in this model are: human kills a zombie by removal of head
or brain damage rate (α), zombie bites a human rate (β), zombie resurrection rate (ζ), death by natural
causes rate (δ). There is also a Π Value, this is the birth rate, because of the assumption earlier, this
value will be zero for the remainder of this paper.
The way an ‘event’ works in these models is by looking at who is participating in the event and then
multiplying it by the Greek letter relating to it. For example, when looking at β [zombie bites humans
rate] it needs both the Susceptible and Zombie group since it is a data value in which affects both
groups taking part [Since, if S or Z is zero, the total rate is 0], it is should be written as ZβS, since it is
a slightly more realistic way of writing it, since its zombies biting humans [However with
multiplication it doesn’t matter what order we multiply numbers and βSZ is a little tidier to use in
coding].

Daniel Wells
3
When a value is set to the Greek letter, the result is an ODE and when combined with the other groups,
it becomes a system of ODE’s to be solved. The right hand side [RHS] of Figure 1 shows the system
of ODE equations. Figure 2 shows the graph when the values [α = 0.005, β = 0.0095, ζ = 0.0001, δ =
0.0001] are plugged into the ODE coding given at the end of their [and this] paper.
Figure 2 - The graph for the Basic Model
The next section is the infection model; this is an adaptation of the basic model and is shown in Figure
3. It adds a fourth group to the model, the Infected, it affects the model by delaying they rate a
Susceptible becomes a Zombie. Adding the new group increases the total number of ODE’s to four
and it also introduces two new data values, δI [the natural death rate of infected humans] and ρI [the
rate at which infected become full zombies].
Figure 3 - The Infection Model
The data values used on this model is the following, [α = 0.005, β = 0.0095, ζ = 0.0001, δ = 0.0001, ρ
= 0.005], however when you plug these values into the code, you get Figure 4a, this graph however is
not the same one as displayed in the Munz et al18
paper. This is where a paper by Cati et al22
comes in,
this paper has already looked at Munz’s18
and came to the same conclusion, something is wrong.
Cati’s22
paper shows that values that should have been used are [α = 0.001, β = 0.0028, ζ = 5, δ =
0.0001, ρ = 5]. When these data values are used, we get Figure 4b, this graph is more like the one
displayed in Munz’s18
paper.
Figure 4 - The graphs for the Infection Model with different values

Daniel Wells
4
The next two sections of Munz et als18
follow the same path as the infection model, that is, Munz et
al’s18
values not giving the same graphs as their paper shows. However Cati et al22
has figured out the
correct data values and once these are plugged in, the graph looks similar to the on found in the
original paper. Figures 5 & 6, show both the quarantine and cure model respectfully. Figures 7 & 8
are the comparison between Munz et al’18
and Cati et al’s22
data values.
Figure 5 - The Quarantine Model
Figure 6 - The Cure Model
The quarantine model adds the quarantine group, raising the total group number to five. This group
also adds three new data values [σZ (Zombies Moved to Quarantine), κI (Infected moved to
Quarantine), γQ (Quarantine Killed Rate, when zombies try to escape)].
Figure 7a, uses values [α = 0.005, β = 0.0095, ζ = 0.0001, δ = 0.0001, ρ = 0.005, κ = 0.0045, σ =
0.0045, γ = 0.0045] and Figure 7b, uses [α = 0.001, β = 0.0028, ζ = 5, δ = 0.0001, ρ = 5, κ = 0.0045, σ
= 0.0045, γ = 0.0045].
Figure 7 - The graphs for The Quarantine Model with different values

Daniel Wells
5
The cured model, removes the quarantine group and its associated data values, but adds the data value
cZ (Cure Zombification Rate). It does bring up the question: Is the ability to cure zombies back to
human reasonable, or is it more likely that the infected group would be curable instead?]. This will be
looked at later in the paper. Also, is the idea that a cured infected or zombie can then be infected again
plausible?
Figure 8a, uses [α = 0.005, β = 0.0095, ζ = 0.0001, δ = 0.0001, ρ = 0.005, c = 0.005] and finally
Figure 8b uses [α = 0.001, β = 0.0028, ζ = 5, δ = 0.0001, ρ = 5, c = 0.1].
Figure 8 - The graphs for The Cured Model with different values
Munz et al18
wrapped up their paper by talking about Impulsive Eradication, the idea of attacking
zombies with increasing power. The issue with the models above is the use of a zombies – removed
loop with zombies being killed and then [more or less] immediately resurrected again, this end up
being an infinite loop [until the human population reaches zero] with not only the turned susceptible
group but also background death rate feeding this loop, eventually the zombies win because of it.
Cati et al22
brought up the same point in their paper, however they criticised that the idea of zombie
resurrection and reuse was not in any film. This is disagreeable since both papers were using the
assumption that α was the Zombie Destruction Rate by removing the head or destroying the brain18
[page 135 if you’re curious]. There exists a movie, The Return of the Living Dead19
, in which a
zombie could only die by fire, therefore with the assumption in place, these zombies would be
‘removed’ for a little while before becoming reanimated again. Also some movie use the idea that a
human has to die for a short time before becoming a zombie, in these cases, a data value for
resurrection would be needed in order to move the dead bodies with the zombification virus [fungus,
chemical or other] in them from the Removed group to the Zombie group.
The next four models are original Munz et al18
models but with the addition of a permanently dead
group added, this also changes where some data values move entities to and from. The values that will
be used with these models are the ones given by Cati et al22
.
The Basic Model now starts with four groups instead of three, Figure 9. There is also no more loops in
the model allowing entities to move more freely around the model. The model does have a source
(Susceptible) and sink (Dead), which raises a new problem, if time is allowed to continue, and there
exists an infinite income for the Susceptible group, then eventually everyone will move into the dead
group. However we have assumed no one is born in the short time period, also due to alpha being less
then beta, we find that actually, the zombie group ends with more than the dead group, due to the
zombies turning the humans before they can kill the zombies.

Daniel Wells
6
Figure 9 - The Basic Model with Dead group
The data values used for this model are [α = 0.001, β = 0.0028, ζ = 5, δ = 0.0001], this gives the graph
shown in Figure 10. The removed group barely rises throughout the time period, which is what you
would expect to see in zombie films, the person died and then becomes a zombie not to long after.
Figure 10 - The graph for the Basic Model with Dead group
Figure 11 shows the same Infection model as before but with the new dead group. Again, the flow has
a distinct source and sink.
Figure 11 - The Infection Model with Dead group

Daniel Wells
7
Figure 12 - The graph for the Infected Model with Dead group
Looking at Figure 12, there is a slight shift in how long it takes before Humanity is wiped out. This is
due to the infected group; it delays the increase in the zombie group which, in turn, delays the βSZ
term. There is also a distinct curve in the infected line. This is actually realistic [given that zombies
existed] since it shows that zombies would start of by biting a few humans that in turn become more
zombies, causing more infected, causing more zombies and eventually in a closed system there would
be no more humans to infect and hence the distinct curve in the infected line. The other four lines
resemble the same depicted in the Basic Model graph, but with the offset due to the infected group.
Adding the dead group to the quarantine model changes it to become one of the more confusing
models, as shown in Figure 13. The addition of the dead group causes both αSZ and γQ data values to
change from heading to the Removed group and to the dead group.
Figure 13 - The Quarantine Model with Dead group
Figure 14 shows that the addition of the quarantine group compared to the model above has little to no
effect on the overall graph, with the exception of the new quarantine line [purple] which ends on a
very low number of infected/zombies in this group.

Daniel Wells
8
Figure 14 - The graph for The Quarantine Model with Dead group
The Cured Model with the dead group brings back the problem of a loop, although this time it is in
favour of the humans. Figure 15 shows that there are three possible loop paths in this model. This
model has removed the quarantine group and puts the total amount of groups to five.
Figure 15 - The Cured Model with Dead group
The graph in Figure 16, is the first graph with a dead group to not have zombies become the dominate
group once the coding had run its course. The graph also takes nearly ten times as long complete it.
Since the model cures zombies, the graph shows how zombies do take over the humans before
succumbing to both the curing and the attacks from humans. Hence the human race survives but at
less than 10% of the original populations.
Figure 16 - The graph for the Cured Model with Dead group

Daniel Wells
9
Phase 2 – Games and Movies: Take 1
Moving away from the models described in Munz et al18
, it’s time to look at different types of
zombies from both movies and games. The following seven movies and four games will be used as a
premise to design different zombie models based on the type of zombie from these movies/games.
The game, The Last of Us13
was also chosen to be tested to see if the effect of a cure being found
would change the dynamics of the model.
The following graphics show a comparison of the different zombies with respect to intelligence and
speed. This will be used as the main way of determining the different values to use for the models.
The first graphic is from Yahoo! Movies28
while the second one has been designed after researching
the different games.
The following table is a compilation of the different zombie types with respect to different categories.
The graphics from above have been turned into a numeric value from between -10 and 10. Strength is
another value that will affect the values in the models. A zombie with an intelligence, speed and
strength of zeros, is modelled after an average human. Data such as if the game or movie has a cure or
quarantine has also been taken into consideration, however both of them do not turn up at all in any of
the following models, with the exception of the Last of Us13
model that will have a cure. Turn Dead is
a term used to describe if the dead become zombies or if the humans become zombies. The four that
do turn dead [The Walking Dead, Dawn of the Dead (1978), Return of the Living Dead and Grave-
yard Zombies] all show that once humans are bitten by the βSZ event, will die and move to the
Removed group before going to the Zombie groups. The Infectious column, is used to show how
infectious a zombie is, this will give different penalties depending on what type of infectious spread it
uses. Finally, ‘Kill, Turn or Both’ is used to show if the zombies would just turn humans by infecting
them, just turn them or both, if the answer is both, then there is a note saying how many they would
kill and turn for every 5 humans.
Figure 17 - The comparison of different movie zombies from
Yahoo! Movies Figure 18 - The comparison of different game zombies

Daniel Wells
10
Table 1 - Zombie Comparison Table
Zo
mb
ie
Cau
se
Sp
eed
Intellig
ence
Stren
gth
Infectio
usn
ess
(1 - 3
)
Tu
rn D
ead
Re-rise D
ead
(assum
e Brain
dam
age)
Cu
re
Qu
arantin
e
Kill, T
urn
,
Bo
th
No
tes
Beta V
alues
Control
(Munz et al18
)
Undead -7 0 0 Bite (2) Only Yes No No Turn 0.0028
Walking
Dead
(game)14
Undead -3 -8 4 Deep Bite
(3)
Yes No No No Both 1 kill / 4
Turn
0.00364
Resident
Evil5
Disease -3 2 5 Deep Bite
(3)
No No No No Both 1 kill / 4
Turn
0.00465
Last of Us13
Disease 2 3 0,
2,
4,
6,
8
Contact
(1)
No No No No Turn Dies
eventuall
y
0.0034
0.00408
0.00476
0.00544
Last of Us –
Cure13
Disease 2 3 0,
2,
4,
6,
8
Contact
(1)
No No Yes No Turn Dies
eventuall
y – Cures
only
Infected
0.0034
0.00408
0.00476
0.00544
Dead
Rising24
Disease 4 2 2 Deep Bite
(3)
No No No No Turn 0.00414
Dawn of the
dead (1978)26
Undead -7 -7 -5 Bite, but
must die
first (2)
Yes No No No Kill 0.00245
Shaun of the
Dead25
Undead -10 -10 -5 Bite
(2)
No No No No Turn 0.001075
Zombieland9 Disease 9 -2 0 Bite (2) No No No No Turn 0.0035
Dawn of the
Dead
(2004)20
Disease 9 4 5 Bite
(2)
No No No No Turn 0.0037
Quarantine27
Disease 2 4 0 Bite (2) No No No No Turn 0.00345
28 Days
Later21
Disease 9 7 4 Body Fluid
(2)
No No No No Both 1 kill / 4
Turn
0.00553
The return of
the living
dead19
Undead 10 10 5 Chemical
(1)
Yes Yes No No Kill Fire is
needed to
kill these
zombies
0.006225
Grave Yard Undead
/Magic
-10 -10 0 Non
Infectious
(3)
Yes No No No Kill 0.00215
The following table is created by taking the control zombies beta value [That is, Cati et al22
value] of
0.0028, and then increasing up and right by 0.00005 and by decreasing by the same amount going
down and left [Table 2’s Speed/Intelligence cross values are multiplied by 100,000 for space]. The
control zombie value is located at (0,-7). The strength value is used as a modifier to the
speed/intelligence table. The strength modifier ranges between 0 and 2, with a strength of zero,
resulting in a modifier of 1. Multiplying the tables’ value with the strength modifier gives the beta
value for that model.

Daniel Wells
11
Table 2 - Speed, Intelligence & Strength Table
Sp
eed
(0
.00
xxx
) v
10 315 320 325 330 335 340 345 350 355 360 365 370 375 380 385 390 395 400 405 410 415
9 310 315 320 325 330 335 340 345 350 355 360 365 370 375 380 385 390 395 400 405 410
8 305 310 315 320 325 330 335 340 345 350 355 360 365 370 375 380 385 390 395 400 405
7 300 305 310 315 320 325 330 335 340 345 350 355 360 365 370 375 380 385 390 395 400
6 295 300 305 310 315 320 325 330 335 340 345 350 355 360 365 370 375 380 385 390 395
5 290 295 300 305 310 315 320 325 330 335 340 345 350 355 360 365 370 375 380 385 390
4 285 290 295 300 305 310 315 320 325 330 335 340 345 350 355 360 365 370 375 380 385
3 280 285 290 295 300 305 310 315 320 325 330 335 340 345 350 355 360 365 370 375 380
2 275 280 285 290 295 300 305 310 315 320 325 330 335 340 345 350 355 360 365 370 375
1 270 275 280 285 290 295 300 305 310 315 320 325 330 335 340 345 350 355 360 365 370
0 265 270 275 280 285 290 295 300 305 310 315 320 325 330 335 340 345 350 355 360 365
-1 260 265 270 275 280 285 290 295 300 305 310 315 320 325 330 335 340 345 350 355 360
-2 255 260 265 270 275 280 285 290 295 300 305 310 315 320 325 330 335 340 345 350 355
-3 250 255 260 265 270 275 280 285 290 295 300 305 310 315 320 325 330 335 340 345 350
-4 245 250 255 260 265 270 275 280 285 290 295 300 305 310 315 320 325 330 335 340 345
-5 240 245 250 255 260 265 270 275 280 285 290 295 300 305 310 315 320 325 330 335 340
-6 235 240 245 250 255 260 265 270 275 280 285 290 295 300 305 310 315 320 325 330 335
-7 230 235 240 245 250 255 260 265 270 275 280 285 290 295 300 305 310 315 320 325 330
-8 225 230 235 240 245 250 255 260 265 270 275 280 285 290 295 300 305 310 315 320 325
-9 220 225 230 235 240 245 250 255 260 265 270 275 280 285 290 295 300 305 310 315 320
-10 215 220 225 230 235 240 245 250 255 260 265 270 275 280 285 290 295 300 305 310 315
-10 -9 -8 -7 -6 -5 -4 -3 -2 -1 0 1 2 3 4 5 6 7 8 9 10
^ Intelligence (0.00xxx) / Strength v
0 0.1 0.2 0.3 0.4 0.5 0.6 0.7 0.8 0.9 1 1.1 1.2 1.3 1.4 1.5 1.6 1.7 1.8 1.9 2
The Walking Dead14
The Walking Dead14
is a multi-ending game set in a post-apocalyptic world, where the zombies have
already taken over. Your character is an escaped convict who has to survive through countless ‘walker’
attacks as the game progresses.
The zombies from Walking Dead14
infect people with a deep bite. The deep bite [and any other type
of death] then kills off the humans before they reanimate as a zombie. However, once they have been
killed via decapitation or brain damage, they do not come back. In the game, there is no zombie
quarantine or cure to help people. The zombies also turn and kill their targets, resulting in a 1:4
kill/turn ratio, giving a new data value, μ [which is equal to β/4]. Since it infects by deep bite, it has an
infectious penalty (In) of 3, this means that its beta value will be multiplied by 1/3. This results in the
following model and ODE’s in Figure 19.
Figure 19 - The Walking Dead Model
These zombies are slow and clunky, they can easily be deceived if you can hide your scent, and this is
why they have been given a speed of -3 and an intelligence of -8 but has an infectious penalty of 3.
However, they are slightly stronger than normal, giving them a 4. The overall beta value is 0.00364
[Before infectious penalty]. The alpha value will remain as 0.001, Rho is 5, Mu is Beta multiplied by
1/4, Zeta is 5 and delta is 0.0001. This gives us the graph in Figure 20.

Daniel Wells
12
Figure 20 - The Walking Dead graph
The graph shows that the humans will eventually be wiped out and zombies will rise, however there
will only be a short amount of zombies compared to the total number of entities in the system, since
most will end up dead.
Resident Evil5
Resident Evil15
is a multi-ending game set before the discovery of zombies and directly after the
events of Resident Evil Zero29
. You are one of two possible characters who is part of a two team task
force. You are tasked with finding out what happened to Beta Team. After landing at the site of last
contact, you find the helicopter and a severed hand. As the game progresses, you tackle puzzle, traps
and zombies and eventually find out about the T-virus experiments causing the zombies.
The Zombies in this game are slightly slower than a human, but gain a little intelligence as well as
strength. The T-virus is transmitted via a deep bite, the human then becomes infected before turning
into a zombie. The human or infected can die of natural causes and become permanently dead,
however once they become a zombie, the only way to kill them is by the usual brain damage or
decapitation. These zombies do not re-rise after dying either and there is no cure or quarantine. They
turn and kill to feed and again at a 1:4 kill/turn ratio. The model and ODE’s are found in Figure 21
below.
Figure 21 - Resident Evil Model
The values used on this model will be: α = 0.001, β = 0.00465, δ = 0.0001, μ = 0.00465/4, ρ = 5, In =
3. These values give Figure 22. The graph shows that that again, humans will be wiped out, zombies
will remain but only a fifth of the total population.

Daniel Wells
13
Figure 22 - Resident Evil graph
The Last of Us13
The Last of Us13
starts of 12 years before the main game; here you witness the uprising of the zombies,
due to the Cordyceps fungus. After the events of that day, we awake in the present, where humans
have been put into these heavily guarded ‘quarantine’ zones. You are tasked with transporting a
young girl named Ellie out of the quarantine zone. She has been infected and (would normally been
turned into a zombie after two days) is still human after three weeks. It is believed that she could be
the key to a cure since she is both infected and immune.
The zombies are caused by the Cordyceps fungus, a fungus that normally is seen in some ant species30
.
They [fungus] take over the brain and cause the ants to go insane, spreading more air borne spores to
infect more ants. Eventually they die and a fungal spore grows out of their [ants] head. This is similar
to what happens in The Last of Us13
, the fungus takes over once infected and takes them through
different types/stages of zombification. The different zombies [in order] are Runner, Stalker, Clicker
and Bloater13
.
Runners are the first stage of zombie after infection; the fungus causes the zombies to become slightly
insane, making them run after any humans that it sees, trying to spread the fungus as much as possible.
Any time between a week and a year, Runners turn into Stalkers, they become more insane, vision is
slightly decreased by being blinded in one eye, causing them to walk a little slower than an average
human but they have a slightly high intelligence due to the fungus. They still however have the same
strength as a human. They, as their name states, stalk humans by hiding before ambushing and biting.
After around eight years as a stalker, the fungus has removed all vision from the host. The fungus is
smart enough, however, to make the host use echolocation by ‘clicking’. With the addition of
echolocation, the Clickers can now move slightly faster again. The fungus causes a plating to form
around their head making them slightly harder to kill. They are also highly intelligent and stronger
than most humans. These are the worst zombies to come across. These tend to kill more than infect.
The Bloater zombie stage comes after another seven years; the fungus is all over the body of the host,
causing it to have heavy armour and resistant to most low calibre bullets. They are highly aggressive
and due to the fungus bloating them, they are once again, slow moving. The echolocation is worse
than the clickers. These kill and do not infect [However, this will only be looked at later].

Daniel Wells
14
After fifteen years as a Bloater, the fungus has used most of the resources and kills the host. The dead
body, however is still super infective, a giant spore grows from the body sending the fungus into the
air. This also happens to all zombies that die due to head injuries since the fungus is still alive.
Figure 23 shows the basic model for all the ‘living’ [all except dead group] zombies in The Last of
Us13
. This model will focus on one zombie each time, therefore if a zombie converts, it will be
removed from this system.
Figure 23 - The Last of Us Model (No In Term)
The values that will be used in these α = 0.001, δ = 0.0001, ρ = 5, ε [The chance of a zombie
converting] = 0.0001[Runner], 0.0002 [Stalker], 0.0003 [Clicker], 0.0004 [Bloater], β =
0.0034[Runner], 0.00408[Stalker], 0.00476[Clicker], 0.00612[Bloater].
Figure 24 - Graphs for the Last of Us Model with increasing zombie beta values
The graphs shown in Figures, shows that once again, humans die out (and at an increasing rate
depending on the stage of the zombie), the zombies become the dominate group (higher than the dead
group) and again, the higher stage zombies end up being more then the lower end ones.

Daniel Wells
15
The Last of Us – Cure13
This version follows the same as above, except the cure has been found instead. The zombies stay
exactly the same as above and the model stays close with the exception of a cured group. With the
addition of this group, we add two new data values; δC and cI. cI is the rate at which an infected
human becomes cured before the zombification takes place and δC is the rate at which cured people
die of natural causes. The cured group cannot however be infected again by zombies. The model and
ODE’s are shown on Figure 25.
Figure 25 - The Last of Us Model with a Cure
The values used are the same as above, with the addition of the c term. c = 0.1. The graphs are
displayed in Figure 26
Figure 26 - The graphs for The Last of Us Model with a Cure, increasing zombie beta values
The graphs shown show that no matter what zombie you are up against, humanity will survive but at
around 1/50 of the population. The zombies and dead groups are the only ones that seem affected by
the change in beta and epsilon values. As both increase, the amount of zombies at the end increases
and the total amount of dead decreases.

Daniel Wells
16
Dead Rising24
You play as a photojournalist, Frank West24
, and starts off with you in a helicopter flying into
Willamette, Colorado. You have been tasked with finding out why it has been sealed off by the
National Guard. After landing on shopping centre, after telling your pilot to come back in 72 hours,
you discover a group of survivors of a localised zombie outbreak. The game has multiple ending
depending on what you do during the ‘72 hours’ inside the centre.
The zombies in Dead Rising24
are from an unknown disease. They are slightly stronger and more
intelligent than an average human; they have the speed of an athlete running. They infect via a deep
bite to turn humans, they don’t kill the target to eat them. These zombies don’t turn the dead or re-rise
the dead either. Finally there is no cure or quarantine [other than the quarantine around the city].
Figure 27 shows the model and the ODE’S.
Figure 27 - Dead Rising Model
The values used for this model are: α = 0.001, β = 0.00414, δ = 0.0001, ε = 0.0001, ρ = 5, In = 3.
Figure 28 - The graph for the Dead Rising Model
The results are not good for the humans. Out of the 500 humans and 1 zombie, we end with no
humans and around 150 zombies.
Dawn of the Dead (1978)26
In the Movie, the USA is starting to become overrun by zombies. A group of four escapes in a news-
station helicopter, they eventually [after several encounters with zombies] find a shopping centre, here
they land on the roof and find a way into an upper office room. After a while, they make the shopping
centre safe by killing all the zombies inside and blocking up the entrances.

Daniel Wells
17
The zombies in this film are slow, unintelligent and weak. Most scenes show the humans just pushing
or running past the zombies. The zombies work better in groups or by surprising the humans. In this
version of Dawn of the Dead26
any and all they have died of a non head related injury will become a
zombie. However once dead from a decapitation or brain damage, will not re-rise. There is no cure or
quarantine in this world. The zombies will actually try and kill you to turn you but even a small bite is
affective enough to eventually kill you before you come back as a zombie. This is why we get the
following model and ODE in figure 29.
Figure 29 - Dawn of the Dead (1978) Model
The values for this model are: α = 0.001, β = 0.00245, δ = 0.0001, ζ = 5, In = 2.
Figure 30 - The graph for the Dawn of the Dead (1978) Model
The graph [shown in Figure 30] is different to most of the other ones. It shows that, while zombies
survive, they do not actually take over and become a massively dominating ‘race’, unlike other
models. This one shows that with lots of time, the human population actually wipes out with a few
zombies serving but the majority of zombies and humans will end up in the dead pile. This model
isn’t realistic either since with such a great time needed; more babies would be born, changing the
dynamics of the model.
Shaun of the Dead25
This film is the black sheep of the list, while not the only comedy styled movie to have been looked at;
it is the only one that uses zombie stereotypes. The movie starts just as the zombie apocalypse is
beginning, it follows two best friends as they try to survive in a pug as zombies try to gain entry.
The zombies in this film are stereotypical super slow and unintelligent and super weak ones. They can
easily be deceived as at one point the group bypasses them to get into the pub. They can however turn
a human with the tiniest bite, they don’t turn dead or re-rise meaning that if a human dies, it is
permanently dead with the same applying to a zombie that dies from brain damage. The infected don’t

Daniel Wells
18
last long so natural death at this stage can be ignored. The figure below shows the model and the set
of ODE’s.
Figure 31 - The Shaun of the Dead Model
The values used are: α = 0.001, β = 0.001075, δ = 0.0001, ρ = 7, In = 2.
Figure 32 - The graph for the Shaun of the Dead Model
Figure 32 shows that due to the values for alpha and beta being so close [0.000075 in difference], it
causes similar curves as the one in the previous model [Figure 30], however with the time frame
extended by six times. It shows that once again, humans die, one or two zombies survive and
everyone else becomes dead. This model is again unrealistic since in the time frame, births would of
happened, changing the model dynamics.
Zombieland9
The other comedy, this one acts like a regular zombie film but with comedic twists to make it more
enjoyable. The movie starts two months after a mutant strain of mad cow disease mutates into mad
human disease. A college student that goes by “Columbus” is trying to make his way from his college
in Austin, Texas to his parents’ home in Columbus, Ohio to see if they are alive. Throughout the
movie, “Columbus” mentions a list of rules which grow as the movie progresses, a total of thirty three
rules are made by the end of the movie.
While being a comedy, the zombies have a heightened speed with “Columbus” stating “Rule number
1: Cardio”9, people with poor cardio were the first to go. They do however have average strength and
are slightly less intelligent with the group at one point ringing a bell and killing the zombie as it runs
past them. The zombification is caused by a virus and even a small bite is enough to infect someone
and since it is a virus, the zombies only turn humans and never actually die (unless from natural
causes [Humans] and brain damage [zombies]) and once either a human or zombie is killed it is
permanently dead. The model and ODE’s is shown in Figure 33.

Daniel Wells
19
Figure 33 - The Zombieland Model
The values used in this model are: α = 0.001, β = 0.0035, δ = 0.0001, ρ = 5, In = 2.
Figure 34 - The graph for the Zombieland Model
The graph shown above in Figure 34 shows a little infected curve along with the usual humans being
wiped out and the zombies taking over.
Dawn of the Dead (2004)20
This Dawn of the Dead20
is a remake of the 197826
with the same name. This movie has the same
premise as the original, a couple of people find a safe haven in a shopping centre before having to
evacuate later on. The zombies however are completely different to the original movie.
The zombies in this remake are faster, they chase down humans at speed, and they cannot be brushed
past like the original. They have a heightened intelligence as one is seen following a dog [which they
have no use for] go down a hatch and just before it closes it opens it up allowing multiple zombies to
reach a human [which they feed on] hiding behind it. They turn humans by the zombie drawing blood
from the human. For example a woman gets infected by a little scratch but someone is not infected by
a cut from a piece of metal and then being in the same water as a zombie.
Figure 35 - The Dawn of the Dead (2004) Model

Daniel Wells
20
Figure 35 above, shows the model and ODE’s. The values used in this one are similar to the
Zombieland9 values, except for β being increased by 0.0002. Overall the values are: α, 0.001, β =
0.0037, δ = 0.0001, ρ = 5, In = 2.
Figure 36 - The graph for the Dawn of the Dead (2004) Model
The graph, when compared to the Zombieland9 one, has very little in difference. They both use the
same model and almost the same values; this graph however shows that the number of zombies and
the number of dead people are a lot closer.
Quarantine27
This movie is one of a few that shows you or explains to you the origin of the zombie virus. In this
movie, it is a mutated rabid virus that had been stolen by a doomsday cult from a chemical weapons
facility. This movie also has the additional feature that the zombies target any species, even dogs. It
follows a news team following two fire-fighters on their shift. They get called to an apartment
building and everything goes downhill from there.
The zombies, while vicious and bloodthirsty, increasing their speed and intelligence, still have human
strength. They infect people by biting [like most zombies]. The figure below shows the model and
ODE’s.
Figure 37 - The Quarantine [Movie] Model
The values are again similar to the previous two [Dawn of the Dead20
and Zombieland9] but with beta
being slightly less the both of the others. The values used are: α, 0.001, β = 0.00345, δ = 0.0001, ρ = 5,
In = 2.

Daniel Wells
21
Figure 38 - The graph for the Quarantine [Movie] Model
The graph follows a similar trend to the ones above, but with the distance between zombies and dead
being greater. The total amount of zombies is the lowest of the three.
28 Days Later21
28 Days Later21
is a zombie film and not a zombie film at the same time, it [the movie] follows a man
named Jim who wakes up from a coma, 28 days after three activists released the ‘Rage’ virus from a
testing facility. The virus is spread through body fluids such as blood or saliva. The infected become
mindless with extreme hostility and violence; they however do not resort to cannibalism unlike other
zombies, this may be due to the infection taking less than 20 seconds to take effect. This is why the
model has no ‘infected’ group. Also these zombies can die from starvation like humans but this would
only come into affect once all humans had been killed, therefore there would be a downward red
[zombie graph line] curve and an increasing black curve [dead graph line] after the code has finished
running.
The ‘zombies’ in this film, are very fast and intelligent and also physically strong all due to the virus.
Since the ‘zombies’ can accidently kill a human before they turn, the addition of the μ variable has
returned. The ODE’s and model are displayed on Figure 39.
Figure 39 - The 28 Days Later Model
The values used in this model are: α = 0.001, β = 0.00553, δ = 0.0001, μ = 0.00553/4, In = 2
The graph in Figure 40 shows that once again, the zombies will win with just under half the
population becoming a zombie.
Daniel Wells
22
Figure 40 - The graph for the 28 Days Later Model
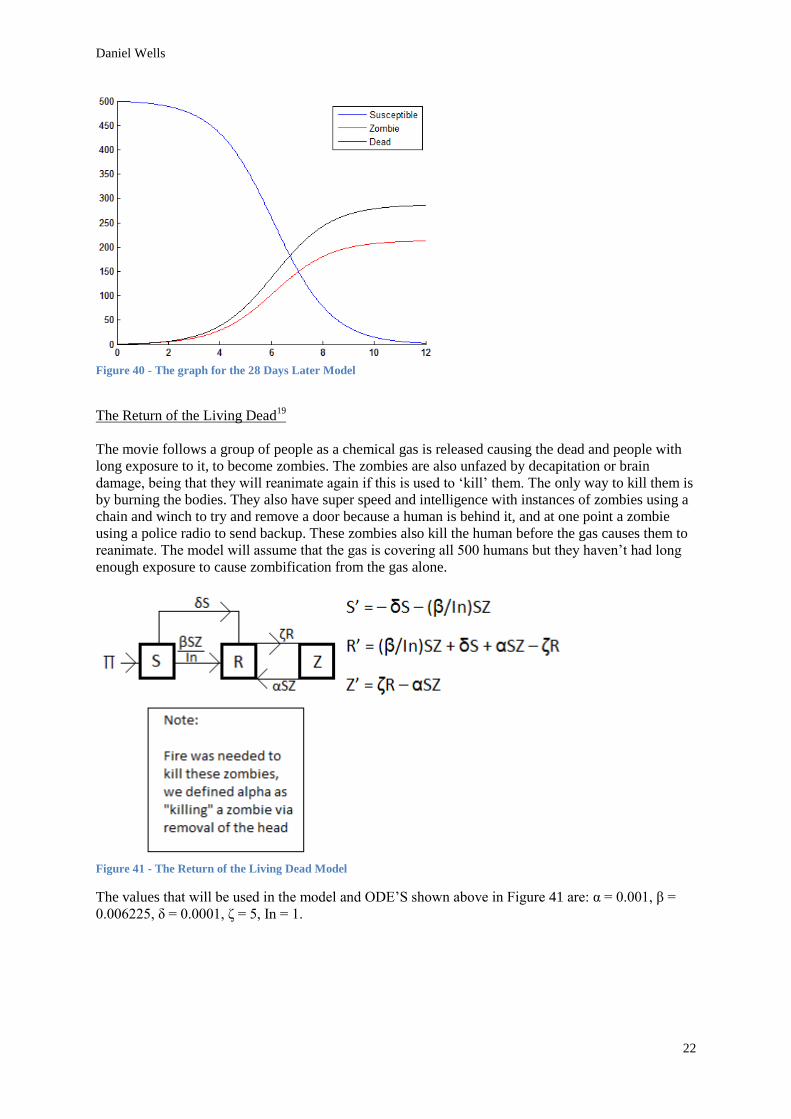
The Return of the Living Dead19
The movie follows a group of people as a chemical gas is released causing the dead and people with
long exposure to it, to become zombies. The zombies are also unfazed by decapitation or brain
damage, being that they will reanimate again if this is used to ‘kill’ them. The only way to kill them is
by burning the bodies. They also have super speed and intelligence with instances of zombies using a
chain and winch to try and remove a door because a human is behind it, and at one point a zombie
using a police radio to send backup. These zombies also kill the human before the gas causes them to
reanimate. The model will assume that the gas is covering all 500 humans but they haven’t had long
enough exposure to cause zombification from the gas alone.
Figure 41 - The Return of the Living Dead Model
The values that will be used in the model and ODE’S shown above in Figure 41 are: α = 0.001, β =
0.006225, δ = 0.0001, ζ = 5, In = 1.

Daniel Wells
23
Figure 42 - The graph for The Return of the Living Dead Model
The graph shows that again, humans will become extinct and zombies will all rise under this gas. A
small amount of dead bodies will form before rising as well.
Grave-Yard Zombies
Graveyard zombies are the most basic and most known [before TV shows, Games and Movies
changed the way we look at them], they are the once dead and they rise from their graves at midnight.
These zombies are the similar to the ones you would find in the game Minecraft31
. They roam around
until sunrise at which time they either go back to their graves or hide from the sun [Since it burns
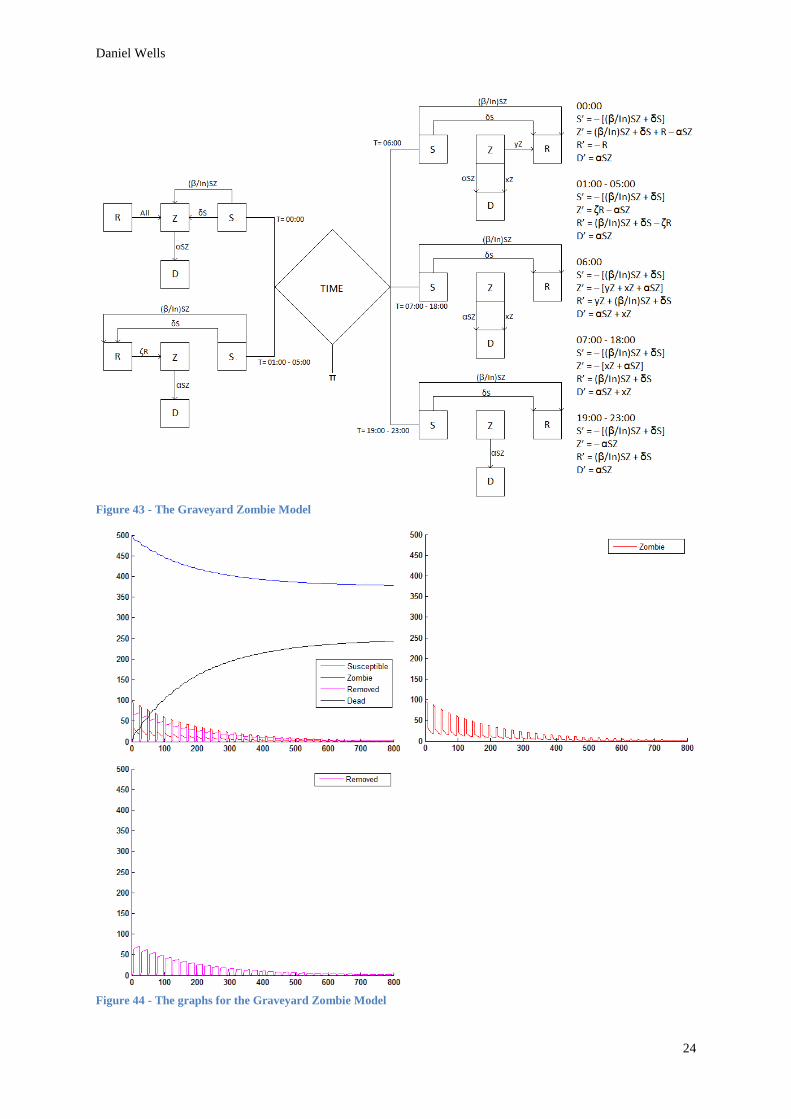
them]. Burning in the sun or brain damage will permanently kill these zombies. This model is a time
dependant one, meaning the ODE’S used depend on the time. The model is spilt into five different
times; 00:00 – 00:59, 01:00 – 05:59, 06:00 – 06:59, 07:00 – 18:59, 19:00 – 23:59. Figure 43 shows
the model and ODE’s used.
The zombies once raised, kill the humans which then rise at midnight. The graveyard in this village
[with population 500] has 100 graveyards which the bodies didn’t die of a brain trauma. These
zombies though are the slow limp walking zombies that are un-intelligent but have the same strength
as a human. At 06:00 in the morning, 60% of the zombies return their graves.
The values in this model are: α = 0.001, β = 0.00215, δ = 0.0001, ζ = 5, x = 0.02, y = 0.6, In = 3.
Figure 44, shows three different graphs; the top left graph displays all the lines showing that humanity
will survive with about 4/5th the original population. The 100 zombies will eventually be killed and all
other deaths will be easily taken care of as they happen. The top right graph shows just the zombie
population, and shows it gradually decreasing over the course of 800 hours [This is the only model to
have a proper time frame for the y-axis]. The bottom left graph shows the removed group, it shows
the affect the rising at midnight has on the model. Overall this model shows that these zombies would
be the easiest to counter.
Daniel Wells
24
Figure 43 - The Graveyard Zombie Model
Figure 44 - The graphs for the Graveyard Zombie Model

Daniel Wells
25
Phase 3 – Games and Movies: Take 2
Phase two is about improving on the results gained in phase one. Instead of making the table of beta
values from arbitrarily increasing or decreasing by a set value, it will be designed around the
regression values of two movies. Also the strength line is not a modifier any more it now gives the
values for alpha, the reasoning for this is because a weaker zombie should be easier to kill then a
stronger one. From here, once the values are placed, intermediate values will be placed and from there,
the table will be constructed. The two movies in question are both Dawn of the Dead (1978)26
and its
remake in 200420
. The models shall be the same as above, unless otherwise stated, so they will not be
displayed below.
Figure 45 - A plot between time (Minutes) & Ln(Total Deaths) for the 1978 Dawn of the Dead
Figure 45 shows the natural log of the total deaths [human or zombie] against time in minutes for
Dawn of the Dead (1978)26
, the blue line showing zombies and red line showing humans. When you
plug the correct values into the regression coefficient equation;
The value for r ends up being 0.0229 for the zombie deaths and 0.011 for human deaths. This sets the
value in the beta table to be 0.011, and the alpha line being 0.0229.
The graph shown in Figure 46 shows the natural log of the total deaths [human or zombie] against
time in minutes for Dawn of the Dead (2004)20
. The regression values end up being 0.044 and 0.022
for zombies and humans respectably. A full table with values showing the regression can be found at
the back of this report.
Figure 46 - A plot between time (Minutes) & Ln(Total Deaths) for the 2004 Dawn of the Dead

Daniel Wells
26
The new values for beta are created by increasing the value by 0.0004 up and right and decreasing by
the same amount going left or down and similarly for alpha by increasing and decreasing by 0.002.
Table 3 shows the beta and alpha values in same style as Table 2, with values being multiplied by
10,000 [for easier display]. Table 4 shows the values that will be used in the models below.
Table 3 - New Alpha & Beta values
Spee
d (
0.0
xxx)
v
10 168 172 176 180 184 188 192 196 200 204 208 212 216 220 224 228 232 236 240 244 248
9 164 168 172 176 180 184 188 192 196 200 204 208 212 216 220 224 228 232 236 240 244
8 160 164 168 172 176 180 184 188 192 196 200 204 208 212 216 220 224 228 232 236 240
7 156 160 164 168 172 176 180 184 188 192 196 200 204 208 212 216 220 224 228 232 236
6 152 156 160 164 168 172 176 180 184 188 192 196 200 204 208 212 216 220 224 228 232
5 148 152 156 160 164 168 172 176 180 184 188 192 196 200 204 208 212 216 220 224 228
4 144 148 152 156 160 164 168 172 176 180 184 188 192 196 200 204 208 212 216 220 224
3 140 144 148 152 156 160 164 168 172 176 180 184 188 192 196 200 204 208 212 216 220
2 136 140 144 148 152 156 160 164 168 172 176 180 184 188 192 196 200 204 208 212 216
1 132 136 140 144 148 152 156 160 164 168 172 176 180 184 188 192 196 200 204 208 212
0 128 132 136 140 144 148 152 156 160 164 168 172 176 180 184 188 192 196 200 204 208
-1 124 128 132 136 140 144 148 152 156 160 164 168 172 176 180 184 188 192 196 200 204
-2 120 124 128 132 136 140 144 148 152 156 160 164 168 172 176 180 184 188 192 196 200
-3 116 120 124 128 132 136 140 144 148 152 156 160 164 168 172 176 180 184 188 192 196
-4 112 116 120 124 128 132 136 140 144 148 152 156 160 164 168 172 176 180 184 188 192
-5 108 112 116 120 124 128 132 136 140 144 148 152 156 160 164 168 172 176 180 184 188
-6 104 108 112 116 120 124 128 132 136 140 144 148 152 156 160 164 168 172 176 180 184
-7 100 104 108 112 116 120 124 128 132 136 140 144 148 152 156 160 164 168 172 176 180
-8 096 100 104 108 112 116 120 124 128 132 136 140 144 148 152 156 160 164 168 172 176
-9 092 096 100 104 108 112 116 120 124 128 132 136 140 144 148 152 156 160 164 168 172
-10 088 092 096 100 104 108 112 116 120 124 128 132 136 140 144 148 152 156 160 164 168
-10 -9 -8 -7 -6 -5 -4 -3 -2 -1 0 1 2 3 4 5 6 7 8 9 10
^ Intelligence (0.0xxx) / Strength (0.0xx) v
54 52 50 48 46 44 42 40 38 36 34 32 30 28 26 24 22 20 18 16 14
Table 4 - All the values to be used in models below
Zo
mb
ie
Alp
ha
Beta
Zeta
Delta
In
Rh
o
Ep
silon
c mu
x
y
Walking Dead (game)14
0.026 0.0124 5 0.0001 3 5 n/a n/a 0.0031 n/a n/a
Resident Evil5 0.024 0.0164 n/a 0.0001 3 5 n/a n/a 0.0041 n/a n/a
Dead Rising24
0.030 0.0192 n/a 0.0001 3 5 0.0001 n/a n/a n/a n/a
Dawn of the dead (1978)26
0.044 0.0112 5 0.0001 2 n/a n/a n/a n/a n/a n/a
Shaun of the Dead25
0.044 0.0088 n/a 0.0001 2 5 n/a n/a n/a n/a n/a
Zombieland9 0.032 0.0196 n/a 0.0001 2 5 n/a n/a n/a n/a n/a
Dawn of the Dead (2004)20
0.024 0.0220 n/a 0.0001 2 5 n/a n/a n/a n/a n/a
Quarantine27
0.034 0.0192 n/a 0.0001 2 5 n/a n/a n/a n/a n/a
28 Days Later21
0.026 0.0232 n/a 0.0001 2 n/a n/a n/a 0.0058 n/a n/a
The return of the living dead19
0.024 0.0248 5 0.0001 1 n/a n/a n/a n/a n/a n/a
Grave Yard 0.034 0.0088 5 0.0001 3 n/a n/a n/a n/a 0.02 0.6

Daniel Wells
27
Walking Dead14
The walking dead graph changes a lot when compared to original, so much so, that the amount of
zombies is increased to 500 because even at 100 zombies, the graph didn’t last long and with 500
zombies we still win before 1 ‘time’ has past, this is due to the Removed group becoming less than
zero, causing the code to stop. Figure 47 shows that still zombies will lose, a much need change from
previous models. Humans will survive around 4/5th the original population.
Figure 47 - The graph for The Walking Dead Model with new values used
Resident Evil5
Once again, the amount of zombies is increased from 1 to 100. Even with this increase, humans win
and zombies lose.
Figure 48 - The graph for the Resident Evil Model with new values used
This is very much anti what is thought of by a zombie apocalypse. However when you look at movies
and games, there is only a select few where the zombies actually win by wiping out the human race.
Most end with the human race on low numbers but surviving in camps.
Even with the next few graphs, all come to the same conclusion, with the values based of movies,
humans win.

Daniel Wells
28
Dead Rising24
Figure 49 - The graph for the Dead Rising Model with new values used
Dawn of the Dead (1978)26
Figure 50 - The graph for the Shaun of the Dead (1978) Model with new values used

Daniel Wells
29
Shaun of the Dead25
Figure 51 - The graph for the Shaun of the Dead Model with new values used
Zombieland9
Figure 52 - The graph for the Zombieland Model with new values used
Dawn of the Dead (2004)20
Figure 53 - The graph for the Dawn of the Dead (2004) Model with new values used

Daniel Wells
30
Quarantine27
Figure 54 - The graph for the Quarantine [Movie] Model with new values used
28 Days Later21
Figure 55 - The graph for the 28 Days Later Model with new values used
The Return of the Living Dead19
Once again, the movie with the zombie that only die by fire, has shown that zombie do in fact win if
this was the case. Even with the alpha and beta values being 0.0008 greater in the beta value, zombies
win. The graph shown in Figure 56, gives a nice green ‘removed’ curve, showing how the humans
would die before the gas resurrected them as zombies.
Grave-Yard Zombies
The coding used for this model, makes the graph [Figure 57] not that pleasing to the eye. It does,
however, show that even if 500 zombies rose at midnight in a village of 500, they would all be dead
by 4 am in the morning.

Daniel Wells
31
Figure 56 - The graph for The Return of the Living Dead Model with new values used
Figure 57 - The graph for the Graveyard Model with new values used
Last of Us13
This model has been revamped compared to the original one. This model includes all the different
types of zombies at once, it has a progressive rho value showing that it takes longer for the zombies to
move to the next stage. The zombies also have different beta and beta* values, this is due to that fact,
the different types of zombies, not only have different speeds and intelligence and strengths but also
kill or infect at different ratios. Table 5 shows that values that will be used in the following two
models.
Last o
f Us
Valu
es
Variab
les
Valu
es
Variab
les
Valu
es
S 500 α0 0.034 β2* 0.00752
I 0 α1 0.03 β3* 0.01248
Z1 1 α2 0.026 β4* 0.0168
Z2 0 α3 0.022 ρ0 5
Z3 0 α4 0.018 ρ1 4
Z4 0 β1 0.01344 ρ2 3
R 0 β2 0.01128 ρ3 2
D 0 β3 0.00832 ρ4 1
C 0 β5 0.0168 δ 0.0001
β1* 0.00336 c 0.1

Daniel Wells
32
Figure 58 - The Last of Us Model redesigned
Figure 58 shows the model and ODE’s used for all the different types of zombies. Since this model is
based on the fungus just appearing, in this small village, S will start at 500, Z1 start at 1 while the
others start at 0. They give the following graphs shown in Figure 59 (Zoomed in) and Figure 60.
Figure 59 - The graph for The Last of Us Model (redesigned) with new values used [zoomed]
Figure 60 - The graph for The Last of Us Model (redesigned) with new values used

Daniel Wells
33
Even with the alpha value being higher than beta, humanity will still be wiped out from a single
zombie. This is due to the way the model is set up. As time progresses, not only is there more zombies,
but they are of different strengths and even more so, that once a zombie dies, the fungus can still
infect people. Eventually all the zombies will ‘die’ and become giant spore in the ground.
Last of Us Cure13
Like the model above, it will use the same starting values with the addition of the c term, c being 0.1.
The following model and ODE’s are shown on Figure 61 and graphs are shown on Figures 62 & 63.
Figure 61 - The Last of Us with Cure Model redesigned
Figure 62 – The graph for The Last of Us with Cure Model (redesigned) with new values used [zoomed]

Daniel Wells
34
Figure 63 - The graph for The Last of Us with Cure Model (redesigned) with new values used
The graph shows that having a cure will keep humanity alive but at around 1/10th of the original
population. The model also does not take into consideration the fact that a zombie could still kill a
cured person. This could be explained by them staying inside the heavily quarantined zones as seen in
The Last of Us13
.
Phase 4 – Combining the data
One thing that seems to be recurring in games and movies is that the zombie apocalypse seems to take
everyone by surprise and the next you know, there are millions of zombies. The original set of data
values shows this all too well, with most showing that humanity will be wiped out sooner or later and
the reign of zombie beginning. This theory however is only shown in a few movies, and even then, the
future is uncertain (that is, no one knows who won). The second set of values that is derived from
both the Dawn of the Dead movies20 & 26
, shows a completely different story. These graphs mostly
show that zombies are not a problem even with 100 or 500 to begin with. There are some exceptions
such as The Return of the Living Dead19
.
Humanity seems to kick in its survival instincts when doomed with the prospect of the human
population dropping below the zombies’. It would seem that a model which uses the original values,
until the number of humans drops below the number of zombies and then uses the derived values after.
Since the models for Zombieland, Dawn of the Dead 200420
and Quarantine are all the same and with
value being very close, they can be used for this as a comparison.
As time goes on, the human population drops from the threat of originally one zombie, however once
the human instinct takes over, it shows how humans can attack back and survive, again on little
numbers. Even with the values used all varying by very little. The amount in the Susceptible group in
the end varies a lot. Figure 64 shows the graph for Dawn of the Dead20
, Figure 65 shows Quarantine
and Figure 66 shows Zombieland.

Daniel Wells
35
Figure 64 – Dawn of the Dead (2004) Model with both values
Figure 65 – Quarantine [Movie] Model with both values
Figure 66 – Zombieland Model with both values

Daniel Wells
36
Results
Step one of this report was about looking at other zombie models that have already been published,
and showing their results. It showed that while the coding worked and was subsequently used in this
report throughout, the values given in Munz et al18
were incorrect, this was quickly corrected by the
paper by Cati et al22
. Now with the correct coding and values, the graphs show us exactly what is
shown in the original Munz et al18
paper. This gave the perfect basis to expand into different types of
zombies in films and games.
Using data already gathered from Cati et al22
, a table of values was designed to give us different beta
values for the different zombies, due to some zombies being stronger than others. With the different
models designed and values in place, the graphs showed that humanity didn’t really stand a chance.
However, the values used felt like it was cheating the system, the alpha value stayed the same while
beta got increasing higher. Also in games, if you die, you respawn until you complete the plot line,
most of the time leaving on a cliff hanger, but with humanity not being wiped out completely. The
same was seen in movies, not everyone died, but it was left on a cliff hanger. The addition of a cure
also shows that humanity will remain but at low levels, this seems the most realistic so far.
After using the regression method on two movies to find the coefficient that represents alpha and beta
better, a new table was designed and these new alpha and beta values were used instead. This time,
the opposite was true; humanity would win most of the time with zombies being killed almost
instantly, even with a zombie to human ratio of 1:5 or even 1:1. There was only four models that
didn’t show humans winning; Dawn of the Dead 197826
, Shaun of the Dead25
, The Return of the
Living Dead19
, and The Last of Us13
(Redesigned model). Both the Dawn of the Dead26
and Shaun of
the Dead25
show that humanity will die out, but only over a long period of time. The Return of the
Living Dead19
once again shows nice curves and even with beta and alpha being marginally different,
humans lose to the zombies because of the need for fire to kill them. Finally, The Last of Us13
shows
that even with one stage 1 zombie, humanity will become extinct; this is because even when a stage 1
zombie dies, it becomes a fungus spore on the ground which can still infect a susceptible. Eventually
all the infected will go through the cycle and earth will become a planet full of animals, plants, giant
spores and dead bodies. Unless, a cure is found, the Last of Us13
model with a cure shows that
humanity will survive but in low numbers.
Phase 4, looked at the fact most humans seem to be oblivious to the zombie infection until they have
killed or turned most of the population. This phase, looks at the survival rate given half of the
population has turned into zombies by the values given in phases 1 & 2. After the human population
reaches the zombie population, survival instincts kick in and change to the values given in phase 3.
These models show that humans can bounce back from this pandemic. However, it seems that values
(even when changing by very little) in the second half, have massive impacts on the number of
survivors in the end.
Improvements to these models could come in the form of a movement constant, having the zombies
move and spread out, would of made these models more realistic, you never see a zombie apocalypse
happen to just a village of 500. With this also comes the idea that in movies and games, a lone zombie
can easily be killed, no matter its speed, strength or intelligence, however when faced against a pack (?
Group? Murder? Horde? [More collective noun suggestions can be found at this website32
]) of
zombies, you find that the difficulty exponentially grows. Two zombies are more difficult than one,
but ten zombies and you’re dead (most of the time). Adding movement and group effects to the
models would definitely make them more applicable to games, films and possibly real life. Looking at
other types of zombies as well to get a broader range would help. There exist other zombies that don’t
follow similarly to above such as vampire zombies such as the ones in I Am Legend33
and zombie
aliens34
.
In conclusion the zombie apocalypse would bring devastation to the human race, many other models
show this; however there is hope, as long as there exists a cure or that the zombie humans come up

Daniel Wells
37
against are weak singular zombies, we can survive. Let’s just hope zombies remain a thing of fiction
and if anything did happen, you have watched and played enough in the zombie genre to know what
to do when they rise.
Coding & Regression data
Regression for the Dawn of the Dead 1978
Time (x)
Time2
(x2) Zombie Deaths
Ln(Zombie Deaths) (y)
Ln(Zombie Deaths)* Time (xy)
Human Deaths Ln(Human Deaths)
(y) Ln(Human Deaths)*
Time (xy)
0 0 0 0 0 0 0 0
5 25 0 0 0 0 0 0
10 100 0 0 0 0 0 0
15 225 3 1.098612289 16.47918433 1 0 0
20 400 16 2.772588722 55.45177444 1 0 0
25 625 16 2.772588722 69.31471806 1 0 0
30 900 31 3.433987204 103.0196161 1 0 0
35 1225 31 3.433987204 120.1895522 1 0 0
40 1600 31 3.433987204 137.3594882 1 0 0
45 2025 34 3.526360525 158.6862236 1 0 0
50 2500 38 3.63758616 181.879308 1 0 0
55 3025 39 3.663561646 201.4958905 1 0 0
60 3600 40 3.688879454 221.3327672 1 0 0
65 4225 40 3.688879454 239.7771645 1 0 0
70 4900 40 3.688879454 258.2215618 1 0 0
75 5625 47 3.850147602 288.7610701 1 0 0
80 6400 48 3.871201011 309.6960809 1 0 0
85 7225 50 3.912023005 332.5219555 1 0 0
90 8100 51 3.931825633 353.8643069 1 0 0
95 9025 51 3.931825633 373.5234351 1 0 0
100 10000 52 3.951243719 395.1243719 2 0.693147181 69.31471806
105 11025 52 3.951243719 414.8805905 2 0.693147181 72.78045396
110 12100 52 3.951243719 434.636809 2 0.693147181 76.24618986
115 13225 54 3.988984047 458.7331654 2 0.693147181 79.71192576
120 14400 59 4.077537444 489.3044933 2 0.693147181 83.17766167
125 15625 59 4.077537444 509.6921805 2 0.693147181 86.64339757
130 16900 60 4.094344562 532.2647931 7 1.945910149 252.9683194
135 18225 61 4.110873864 554.9679717 7 1.945910149 262.6978701
140 19600 62 4.127134385 577.7988139 7 1.945910149 272.4274209
2030 192850 94.6670638 7788.97729 9.99661353 1255.96796
The sums are the values given under the bold black line. N = 29, meaning for the zombie, the top left
of the regression coefficient is 225880.341, top right = 192174.14, bottom left = 5592650 and bottom
right = 4120900, this give a total top of 33706.2017 and total bottom of 1471750, giving a coefficient
of 0.02290212 ≈ 0.0229.
N = 29, meaning for the humans, the top left of the regression coefficient is 225880.341, top right =
192174.14, bottom left = 5592650 and bottom right = 4120900, this give a total top of 33706.2017
and total bottom of 1471750, giving a coefficient of 0.02290212 ≈ 0.0229.

Daniel Wells
38
Regression for the Dawn of the Dead 2004
Time
(x)
Time2
(x2) Zombie Deaths
Ln(Zombie Deaths)
(y)
Ln(Zombie Deaths)*
Time (xy) Human Deaths
Ln(Human Deaths)
(y)
Ln(Human Deaths)*
Time (xy)
0 0 0 0 0 0 0 0
5 25 0 0 0 0 0 0
10 100 0 0 0 2 0.693147181 6.931471806
15 225 0 0 0 2 0.693147181 10.39720771
20 400 0 0 0 2 0.693147181 13.86294361
25 625 2 0.693147181 17.32867951 2 0.693147181 17.32867951
30 900 2 0.693147181 20.79441542 2 0.693147181 20.79441542
35 1225 3 1.098612289 38.4514301 2 0.693147181 24.26015132
40 1600 3 1.098612289 43.94449155 2 0.693147181 27.72588722
45 2025 8 2.079441542 93.57486938 3 1.098612289 49.43755299
50 2500 9 2.197224577 109.8612289 3 1.098612289 54.93061443
55 3025 10 2.302585093 126.6421801 4 1.386294361 76.24618986
60 3600 13 2.564949357 153.8969614 4 1.386294361 83.17766167
65 4225 13 2.564949357 166.7217082 4 1.386294361 90.10913347
70 4900 18 2.890371758 202.3260231 6 1.791759469 125.4231628
75 5625 20 2.995732274 224.6799205 7 1.945910149 145.9432612
80 6400 20 2.995732274 239.6585819 7 1.945910149 155.6728119
85 7225 20 2.995732274 254.6372433 8 2.079441542 176.752531
90 8100 31 3.433987204 309.0588484 8 2.079441542 187.1497388
95 9025 44 3.784189634 359.4980152 9 2.197224577 208.7363348
100 10000 54 3.988984047 398.8984047 10 2.302585093 230.2585093
105 11025 69 4.234106505 444.581183 12 2.48490665 260.9151982
2030 192850 42.61150483 3204.554185 28.0353171 1966.053457
The sums are the values given under the bold black line. N = 22, meaning for the zombie, the top left
of the regression coefficient is 70500.19206, top right = 49216.28808, bottom left = 1821050 and
bottom right = 1334025, this give a total top of 21283.90398 and total bottom of 1334025, giving a
coefficient of 0.043701872 ≈ 0.044.
N = 22, meaning for the humans, the top left of the regression coefficient is 43253.17606, top right =
32380.79125, bottom left = 1821050 and bottom right = 1334025, this give a total top of 10872.38481
and total bottom of 1334025, giving a coefficient of 0.022324079 ≈ 0.022.

Daniel Wells
39

Daniel Wells
40

Daniel Wells
41

Daniel Wells
42

Daniel Wells
43
References
1) Circa 2100BC Ancient Mesopotamia
2) A Brief (and Frankly Half-Arsed) History of Zombie Cinema, (n.d.) Online at:
http://leedszombiefilmfestival.com/a-brief-and-frankly-half-arsed-history-of-zombie-cinema/
3) Edward Halperin, (1932) White Zombie (Film)
4) Karl Hardman & Russell Streiner, (1968) Night of the Living Dead (Film)
5) Capcom (1996), Resident Evil. Capcom (Game)
6) P. Shaw, A History of Zombies in Video Games, (1 October 2010) Online at:
http://www.pcworld.com/article/206769/history_zombies_video_games.html#slide2
7) Spaceman Ltd (1984), Zombie Zombie. Quicksilva (Game)
8) Brad Pitt, Dede Gardner, Jeremy Kleiner & Ian Bryce, (2013) World War Z (Film)
9) Gavin Polone, (2009) Zombieland (Film)
10) Techland (2015), Dying Light. Warner Bros. Interactive Entertainment (Games)
11) Tango Gameworks (2014), The Evil Within. Bethesda Softworks (Games)
12) The Fun Pimps (2013), 7 Days To Die. The Fun Pimps (Games)
13) Naughty Dog (2013), The Last of Us. Sony Computer Entertainment (Games)
14) Telltale Games (2012), The Walking Dead. Telltale Games (Games)
15) Treyarch (2005-Present), Call of Duty. Activision Blizzard (Games)
16) Bohemia Interactive (2012), Day Z. Bohemia Interactive (Games)
17) AMC Studios, (2010) The Walking Dead (TV Series)
18) Philip Munz, Ioan Hudea, Joe Imad & Robert J. Smith (2009), When Zombies Attack!: Mathematical
Modelling of an Outbreak of Zombie Infection. Infectious Diseases Modelling Research Progress. 133
– 150. ISBN: 978-1-60741-347-9.
19) Tom Fox & Graham Henderson (1985), The Return of The Living Dead. Hemdale Film, Fox Films Ltd
& Cinema 84 (Film)
20) Richard P. Rubinstein, Marc Abraham & Eric Newman (2004), Dawn of the Dead. Strike
Entertainment & New Amsterdam Entertainment (Film)
21) Andrew MacDonald (2002), 28 Days Later. DNA Films & British Film Council (Film)
22) Cati Witkowski & Brian Blais (2013), Zombie Apocalypse: An Epidemic Model.
23) Oxford Dictionary
24) Capcom Production Studio 1 (2006), Dead Rising. Capcom (Games)
25) Nira Park (2004), Shaun of the Dead. StudioCanal, Working Title & Big Talk Productions (Film)
26) Richard P. Rubinstein, Claudio Argento & Alfredo Cuomo (1978), Dawn of The Dead. Laurel Group
Inc. (Film)
27) Doug Davison, Roy Lee, Sergio Aguero, Carlos Fernández, Julio Fernández & Clint Culpepper (2008),
Quarantine. Vertigo Entertainment, Andale Pictures & Filmax Entertainment (Film)
28) Online at: http://fullyc.com/a-comparison-of-the-threat-level-of-zombies-from-various-movies/
29) Capcom Production Studio 3 (2002), Resident Evil Zero. Capcom (Game)
30) BBC Worldwide Youtube, (3 November 2008) Online at:
https://www.youtube.com/watch?v=XuKjBIBBAL8
31) Mojang (2011), Minecraft. Mojang, Microsoft Studios & Sony Computer Entertainment (Game)
32) Online at: http://all-sorts.org/nouns/zombies
33) Akiva Goldsman, James Lassiter, David Heyman and Neal H. Moritz (2007), I Am Legend. Village
Roadshow Pictures, Weed Road Pictures, Overbrook Entertainment, Heyday Films & Original Film.
(Film)
34) Team Chaos, LLC (2014), Rooster Teeth vs. Zombiens. Team Chaos, LLC (Game)


