Embed Size (px)
Citation preview

>> Employed by a non-US affiliate of MLPF&S and is not registered/qualified as a research analyst under the FINRA rules. Refer to "Other Important Disclosures" for information on certain BofA Merrill Lynch entities that take responsibility for this report in particular jurisdictions. BofA Merrill Lynch does and seeks to do business with companies covered in its research reports. As a result, investors should be aware that the firm may have a conflict of interest that could affect the objectivity of this report. Investors should consider this report as only a single factor in making their investment decision. Refer to important disclosures on page 195 to 197. Link to Definitions on page 194. 11393616
Thematic Investing Thematic Investing
The Silver Dollar – longevity revolution primer
Equity | Europe | Thematic Investing 06 June 2014
Sarbjit Nahal >> +44 20 7996 8031 Equity Strategist MLI (UK) [email protected] Beijia Ma >> +44 20 7996 9070 Equity Strategist MLI (UK) [email protected]
Click the image above to watch the video.
A Transforming World
A Transforming World: the longevity revolution
As part of our work on A Transforming World, we introduce a new People-focused theme – the longevity revolution – with this Primer and a Primer Picks report setting out the challenges and opportunities presented by global ageing.
Global ageing: the greatest trans formation of our time Ageing populations are becoming a virtually universal phenomenon, and the number of older persons (60+) is expected to more than double from 841mn in 2013 to 2bn+ by 2050E (Source: UN). People aged 65+ will outnumber children under 5 for the first time in human history in 2047E (Source: UN), and falling birth rates mean that some countries are heading towards a potentially catastrophic decline in population. We believe that all aspects of society and the economy need to be viewed through the lens of this demographic transformation.
Longevity risk: hugely underestimated Longevity risk will be one of the most significant challenges facing retirement systems over the next 50Y, with global annuity and pension-related exposure estimated to be as high as US$15-25tn. Many countries could be facing additional costs of up to 50% of 2010 GDP by 2050E (Source: IMF).
Look for the silver lining: US$15tn+ opportunity (2020E) The longevity economy is becoming an increasingly powerful force, and the spending power of 60+ consumers is expected to reach US$15tn by 2020E (Source: Euromonitor). The US longevity sector alone is currently estimated at US$7.1tn, making it the world’s #3 economy. This section of the economy is expected to account for over 50% of US and Japanese GDP by the 2030s (Source: Oxford Economics, NLIRI). However, there are pressing challenges concerning wealth inequality, those on low incomes, women and the EM elderly.
Cradle to grave: three main entry points for investors We have mapped efforts to tackle the global dynamics of longevity to highlight three entry points for investors wishing to play the ”silver dollar” theme: 1) Pharma & Healthcare (incl. tackling age-related diseases and conditions such as cancer, cardiovascular disease, Alzheimer’s, diabetes, osteoporosis, as well as medical devices, hearing aids, dental and vision care, and incontinence); 2) Financials (incl. insurance, asset & wealth management); and 3) Consumer (incl. senior living, care, managed care, healthcare REITs, aging in place, death care, pharmacies & drug stores, anti-ageing, travel & leisure, retail, VMS, and technology).
BofAML Global Longevity stock list & Primer Picks Together with our sector analysts, we have created a list of over 160 global stocks covered by BofAML that have exposure to longevity-related themes and solutions. Our Buy-rated stocks with material exposure to the theme are detailed in an accompanying Primer Picks report, as is our full stock list.
Un
auth
ori
zed
red
istr
ibu
tio
n o
f th
is r
epo
rt is
pro
hib
ited
.T
his
rep
ort
is in
ten
ded
fo
r ke
gan
.love
ly@
bam
l.co
m.
2
Themat ic Inves t ing 06 June 2014
Contents Longevity, the silver dollar 3
BofAML Global Longevity stock list 12
Ageing world – the global demographic transition 16
The longevity economy, US$15tn+ by 2020E 39
Ageing-related diseases, two-thirds of global deaths 57
Other ageing-related conditions 80
The genomics future is here 94
Financial markets, accumulation & decumulation 100
Consumer, the silver dollar 125
Appendix 1 – Global population pyramids: 2010, 2050E, 2100E
173
Appendix 2 – US healthcare 187
Themat ic Inves t ing 06 June 2014
3
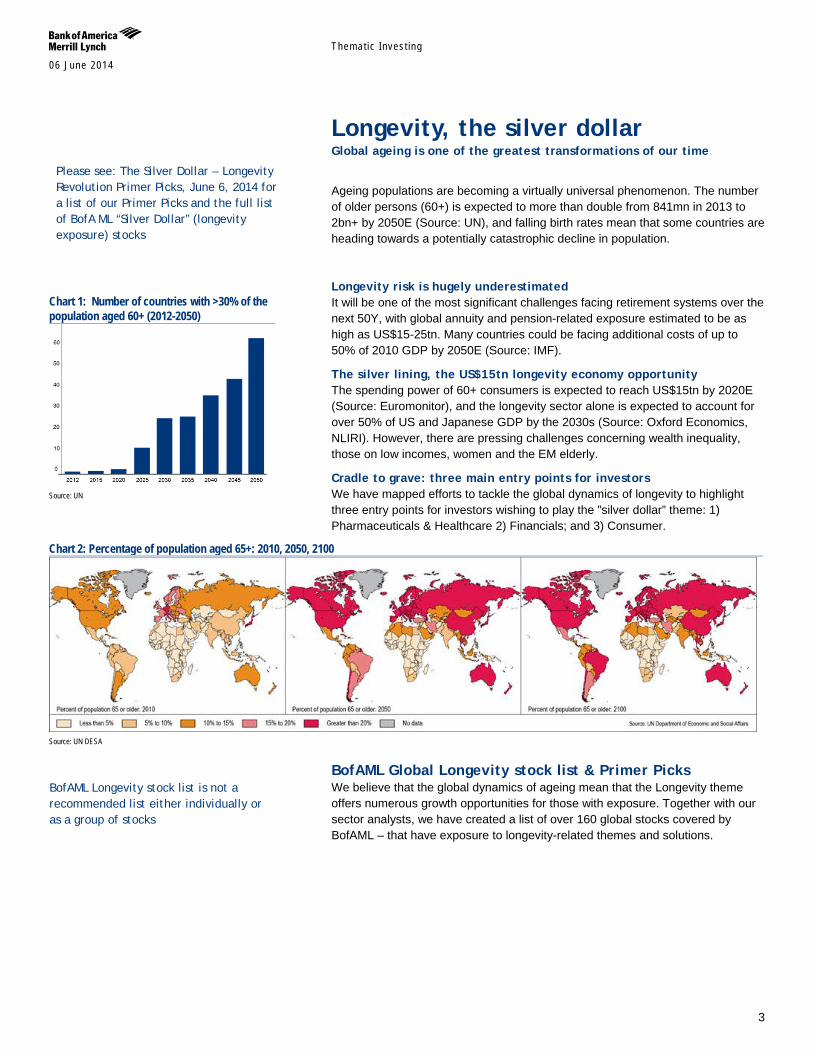
Longevity, the silver dollar Global ageing is one of the greatest transformations of our time
Ageing populations are becoming a virtually universal phenomenon. The number of older persons (60+) is expected to more than double from 841mn in 2013 to 2bn+ by 2050E (Source: UN), and falling birth rates mean that some countries are heading towards a potentially catastrophic decline in population.
Longevity risk is hugely underestimated It will be one of the most significant challenges facing retirement systems over the next 50Y, with global annuity and pension-related exposure estimated to be as high as US$15-25tn. Many countries could be facing additional costs of up to 50% of 2010 GDP by 2050E (Source: IMF).
The silver lining, the US$15tn longevity economy opportunity The spending power of 60+ consumers is expected to reach US$15tn by 2020E (Source: Euromonitor), and the longevity sector alone is expected to account for over 50% of US and Japanese GDP by the 2030s (Source: Oxford Economics, NLIRI). However, there are pressing challenges concerning wealth inequality, those on low incomes, women and the EM elderly.
Cradle to grave: three main entry points for investors We have mapped efforts to tackle the global dynamics of longevity to highlight three entry points for investors wishing to play the ”silver dollar” theme: 1) Pharmaceuticals & Healthcare 2) Financials; and 3) Consumer.
Chart 2: Percentage of population aged 65+: 2010, 2050, 2100
Source: UN DESA
BofAML Global Longevity stock list & Primer Picks We believe that the global dynamics of ageing mean that the Longevity theme offers numerous growth opportunities for those with exposure. Together with our sector analysts, we have created a list of over 160 global stocks covered by BofAML – that have exposure to longevity-related themes and solutions.
Chart 1: Number of countries with >30% of the population aged 60+ (2012-2050)
Source: UN
BofAML Longevity stock list is not a recommended list either individually or as a group of stocks
Please see: The Silver Dollar – Longevity Revolution Primer Picks, June 6, 2014 for a list of our Primer Picks and the full list of BofA ML “Silver Dollar” (longevity exposure) stocks
Themat ic Inves t ing 06 June 2014
4
Ageing world, the global demographic transition Ageing is becoming a virtually universal phenomenon during the 21st century according to the UN’s Population Division. Population ageing is taking place in nearly all countries of the world off the back of decreasing mortality and declining fertility. This process is leading to a relative reduction in the proportion of children and to an increase in the share of older persons in the population. The global share of older people (aged 60+) increased from 9.2% in 1990 to 11.7% in 2013 and will continue to grow as a proportion of the world population, reaching 21.1% by 2050E.
Globally, the number of older persons (60+) is expected to more than double to 2050, from 841mn in 2013 to 2bn+ by 2050. Older persons are projected to exceed the number of children for the first time in 2047E. While developed markets have been ageing for many decades, it is important to note that two-thirds of the world’s older persons currently live in developing countries. Given the significantly higher growth rate of ageing in EMs (vs. developed markets), the projections show that by 2050, nearly eight in 10 of the world’s 60+ population will live in less developed regions (Source: UN). We also note that women make up the majority of the old, the ‘oldest old’ and the ‘most vulnerable old’ (Source: WEF).
Global birth rates have been falling over the last 50Y & 41% of the world’s population is below the replacement rate – Birth rates have fallen from 5.0 children per woman in 1950 to 2.5 today, and are expected to fall to between 1.8 and 2.2 by 2050. The fertility decline over the last half century has been one of the main factors explaining global ageing (Source: UN). Developed markets have seen the most pronounced decline while EMs are also seeing a sharp decline. 70% of the world’s population could eventually fall below replacement level (i.e. reproducing at a rate of 1+ child per adult), which means we could be heading towards a potentially catastrophic decline in population (Source: Ian Goldin, Professor of Globalisation and Development at Oxford University).
Population ageing will pose major social and economic challenges and opportunities as old-age dependency or support ratios (ratio of the population aged 65+ to the population aged 15-64) are already low in developed markets, and are expected to continue to fall in the coming decades with ensuing fiscal pressures on public and private support systems for older persons. This can be compounded by higher levels of poverty, non-communicable diseases, and disability among older persons, especially in developing markets (Source: UN). On the flipside, older persons are becoming an engine for economic growth.
A large number of EMs can benefit from a demographic dividend given projections of high and increasing economic support ratios for years or decades to come, provided that appropriate labour market and other policies allow for productive absorption of the growth (Source: UN).
“The aging of the global population represents the greatest social, economic, and political transformation of our time” – Global Coalition on Aging “No other force is likely to shape the future of national economic health, public finances, and policymaking as the irreversible rate at which the world’s population is aging” – S&P
Investors should consider the fundamentals of the companies and their own individual circumstances / objectives before making any investment decisions. The full rationale and investment thesis for our fundamental analyst’s recommendation on each stock is contained in the most recent report on the company, which we urge you to read.
Themat ic Inves t ing 06 June 2014
5
The longevity economy, US$15tn+ by 2020E The longevity economy is becoming an increasingly powerful economic force – encompassing both the economic activity serving the needs and wants of the 50+ global population, as well as directly purchased products and services and the knock-on economic activity that this generates (jobs, wages, productivity, taxes, charitable giving et. al.),
The size of the U.S. longevity economy alone is estimated at US$7.1tn, making it the world’s #3 economy – and it is expected to grow to account for over 50% of U.S. and Japanese GDP by the 2030s (Source: Oxford Economics, NLI Research Institute). While we must be careful about extrapolating such data globally, we are seeing similar trends in other countries with ageing populations.
The spending power of consumers aged 60+ will reach US$15tn+ globally by 2020E (Source: Euromonitor). This reflects their high net worth with U.S. households headed by someone aged 50+ averaging US$765,000, and in the UK £541,000 (Source: Oxford Economics; PFRC-ILC UK). It also reflects their unprecedented spending power with boomers accounting for c60% of U.S. consumer spending and c50% of UK spending (Source: AARP, Saga). They also drive the healthcare industry, accounting for 73% of U.S. spending (Source: Oxford Economics).
The importance of the silver dollar will grow as the over 50s become the fastest growing demographic globally (Source: UN). For instance, there are more boomers in the U.S. alone than the combined populations of the UK, Switzerland and Israel. Demographic drivers – including increasing life expectancy, raised retirement ages, longer working lives as well as inheritance – will further boost the incomes and spending power of older consumers.
We need to remember that ageing has its costs notably in terms of financial insecurity vis-à-vis older people’s dependence on social benefits and the decline of employer-based pensions (Source: Oxford Economics) as well as healthcare costs which are expected to double by 2020 (Source: AARP). It is also important to note that many older people are conservative consumers or burdened by bills - and the very real issues that they face are not forgotten (Source: PFRC-ILC UK).
The Longevity Economy is refuting the conventional wisdom that consumers over 50 spend less. In fact, they spend more than any other age group, and will increasingly challenge businesses to win their attention (Source: Oxford Economics) “This phenomenon presents a unique opportunity for individuals, corporations, and governments to find new, smarter ways to live, work, and prepare for a future with a significantly greater proportion of the population over the age of 60” – Global Coalition on Aging
Themat ic Inves t ing 06 June 2014
6
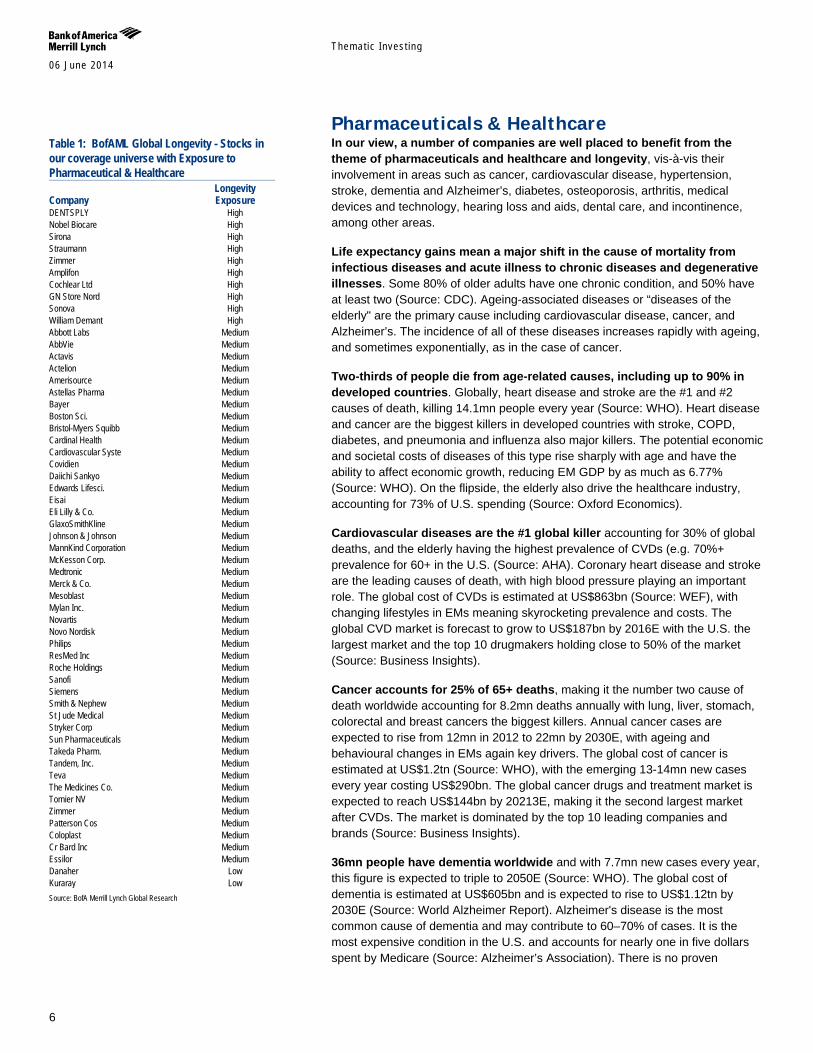
Pharmaceuticals & Healthcare In our view, a number of companies are well placed to benefit from the theme of pharmaceuticals and healthcare and longevity, vis-à-vis their involvement in areas such as cancer, cardiovascular disease, hypertension, stroke, dementia and Alzheimer’s, diabetes, osteoporosis, arthritis, medical devices and technology, hearing loss and aids, dental care, and incontinence, among other areas.
Life expectancy gains mean a major shift in the cause of mortality from infectious diseases and acute illness to chronic diseases and degenerative illnesses. Some 80% of older adults have one chronic condition, and 50% have at least two (Source: CDC). Ageing-associated diseases or “diseases of the elderly" are the primary cause including cardiovascular disease, cancer, and Alzheimer’s. The incidence of all of these diseases increases rapidly with ageing, and sometimes exponentially, as in the case of cancer.
Two-thirds of people die from age-related causes, including up to 90% in developed countries. Globally, heart disease and stroke are the #1 and #2 causes of death, killing 14.1mn people every year (Source: WHO). Heart disease and cancer are the biggest killers in developed countries with stroke, COPD, diabetes, and pneumonia and influenza also major killers. The potential economic and societal costs of diseases of this type rise sharply with age and have the ability to affect economic growth, reducing EM GDP by as much as 6.77% (Source: WHO). On the flipside, the elderly also drive the healthcare industry, accounting for 73% of U.S. spending (Source: Oxford Economics).
Cardiovascular diseases are the #1 global killer accounting for 30% of global deaths, and the elderly having the highest prevalence of CVDs (e.g. 70%+ prevalence for 60+ in the U.S. (Source: AHA). Coronary heart disease and stroke are the leading causes of death, with high blood pressure playing an important role. The global cost of CVDs is estimated at US$863bn (Source: WEF), with changing lifestyles in EMs meaning skyrocketing prevalence and costs. The global CVD market is forecast to grow to US$187bn by 2016E with the U.S. the largest market and the top 10 drugmakers holding close to 50% of the market (Source: Business Insights).
Cancer accounts for 25% of 65+ deaths, making it the number two cause of death worldwide accounting for 8.2mn deaths annually with lung, liver, stomach, colorectal and breast cancers the biggest killers. Annual cancer cases are expected to rise from 12mn in 2012 to 22mn by 2030E, with ageing and behavioural changes in EMs again key drivers. The global cost of cancer is estimated at US$1.2tn (Source: WHO), with the emerging 13-14mn new cases every year costing US$290bn. The global cancer drugs and treatment market is expected to reach US$144bn by 20213E, making it the second largest market after CVDs. The market is dominated by the top 10 leading companies and brands (Source: Business Insights).
36mn people have dementia worldwide and with 7.7mn new cases every year, this figure is expected to triple to 2050E (Source: WHO). The global cost of dementia is estimated at US$605bn and is expected to rise to US$1.12tn by 2030E (Source: World Alzheimer Report). Alzheimer's disease is the most common cause of dementia and may contribute to 60–70% of cases. It is the most expensive condition in the U.S. and accounts for nearly one in five dollars spent by Medicare (Source: Alzheimer’s Association). There is no proven
Table 1: BofAML Global Longevity - Stocks in our coverage universe with Exposure to Pharmaceutical & Healthcare Longevity Company Exposure DENTSPLY High Nobel Biocare High Sirona High Straumann High Zimmer High Amplifon High Cochlear Ltd High GN Store Nord High Sonova High William Demant High Abbott Labs Medium AbbVie Medium Actavis Medium Actelion Medium Amerisource Medium Astellas Pharma Medium Bayer Medium Boston Sci. Medium Bristol-Myers Squibb Medium Cardinal Health Medium Cardiovascular Syste Medium Covidien Medium Daiichi Sankyo Medium Edwards Lifesci. Medium Eisai Medium Eli Lilly & Co. Medium GlaxoSmithKline Medium Johnson & Johnson Medium MannKind Corporation Medium McKesson Corp. Medium Medtronic Medium Merck & Co. Medium Mesoblast Medium Mylan Inc. Medium Novartis Medium Novo Nordisk Medium Philips Medium ResMed Inc Medium Roche Holdings Medium Sanofi Medium Siemens Medium Smith & Nephew Medium St Jude Medical Medium Stryker Corp Medium Sun Pharmaceuticals Medium Takeda Pharm. Medium Tandem, Inc. Medium Teva Medium The Medicines Co. Medium Tornier NV Medium Zimmer Medium Patterson Cos Medium Coloplast Medium Cr Bard Inc Medium Essilor Medium Danaher Low Kuraray Low Source: BofA Merrill Lynch Global Research
Themat ic Inves t ing 06 June 2014
7
effective measure in preventing or treating the underlying causes of Alzheimer’s disease, and a cure is considered to be a “holy grail” for the pharmaceutical industry.
382mn people globally have diabetes as of 2013 and this number is set to rise to 592mn people by 2035E with current trends (Source: IDF). Amongst the elderly population, type 2 diabetes is a growing problem, and 27% of the 65+ in the U.S. have diabetes and another 50% have pre-diabetes (Source: CDC). Diabetes kills 5.1mn annually (Source: IDF), and will emerge as the #7 cause of death by 2030E (Source: WHO). It accounts for US$548bn annually in healthcare spending (Source: IDF) and approximately US$1 of US$5 health care dollars in the U.S. is spent on it (Source: CDC). The global anti-diabetic pharmaceuticals market was estimated at US$29.3bn in 2010 (Source: GBI Research) and is expected to reach US$47-55bn globally by 2017E (Source: Visiongain, GBI Research).
Osteoporosis affects more than 200mn people worldwide, 80% of which are women. Advanced age, fractures and fall risk are biggest dangers, and up to 35% of people aged 65+ fall every year. The loss of function and independence is profound and morbidity following hip fracture is around 20-24% in the first year after the fracture occurs (Source: International Osteoporosis Foundation). The US spends US$30bn a year treating older adults for the effects of falls, and by 2050E, the global cost of osteoporosis is expected to exceed US$130bn (Source: Siemens). The global osteoporosis market is estimated to be worth US$15bn by 2015E (Source: Research and Markets).
Nearly 50% of adults 65 and older are diagnosed with arthritis (Source: CDC) and it is one of most common causes of disability and is more frequent cause of activity limitation than heart disease, cancer or diabetes (Source: American Academy of Orthopaedic Surgeons). 1 in 2 will develop osteoarthritis by age 85 (Source: CDC). While there is no cure for osteoarthritis, it accounts for one third of global orthopaedic revenues with nearly 2.9mn annual joint replacements every year worldwide (Source: OrthoKnow). The joint replacement market is cUS$14bn and is dominated by the largest 8 companies (Source: Orthoworld).
Over 650mn people suffer from hearing impairment globally (Source: WHO), including up to 20% of the population in industrialised countries. 35-40% of the total 65+ population is hearing impaired (Source: Hearing Health Matters), yet only 10-25% take advantage of a hearing aid (Source: Amplifon, Donova). The hearing aid market is estimated at US$5.4bn (Source: Hearing Health Matters) and has high barriers to entry and pricing power from technological innovation. Long-term growth drivers include demographic trends, increasing acceptance and rapid growth in EMs (Source: Amplifon).
25% of all adults aged 60 years and older have lost all of their teeth (Source: CDC). Oral disease is considered to be the fourth most costly ailment to treat, and industrialised countries spend 5–10% of their national public health resources on dental care a year (Source: WHO). The global dental industry is worth an estimated US$21bn - and the market is less volatile than the broader economy, has typically grown at 1-2x GDP, and is less government reimbursement dependent than the medical market (Source: Dentsply). Long-term drivers include the ageing population, greater care needed for ageing populations, and low implant penetration rates.
4.3bn people need vision correction with c50% of those aged 50+ exhibiting hyperopic conditions such as presbyopia, myopia, and hyperopia (Source:

Themat ic Inves t ing 06 June 2014
8
Research and Markets). Yet, visual correction has low penetration, especially in EMs. The global vision care market stood is expected to reach US$46bn by 2017E with much of the growth driven by the ageing population (Source: Research and Markets). We anticipate a two-tier market, with developed world optical markets growing by 1-2% while EMs are experiencing volume growth of 5-6%, as by 2020E - the number of wearers of corrective lenses is set to hit 2.2bn those with myopia 2.0bn and those with presbyopia 2.3bn (Source: Essilor).
Up to 35% of the total population aged 60+ are estimated to be incontinent with women twice as likely as men (Source: NIH). Over 50% of homebound elderly people or those living in long-term care facilities are incontinent; and it is the #2 cause of institutionalisation (Source: National Association For Continence). The global incontinence and ostomy care market is expected to reach US$17.2bn by 2020E (Source: Grand View Research). drivers include high patient awareness, demographics, EMs, and the advent of technologically advanced products.
The genomics future is here as today’s DNA sequencing platforms are dramatically cheaper and faster than those used to sequence the first human genome. These nextgen DNA sequencing (NGS) technologies are enabling scientists to ask questions about the biological and genetic mechanisms of ageing and age-related diseases, especially cancer. Our Life Sciences team estimates that NGS has become a US$1.7-2.0bn market and is on its way to multi-billion US$ levels as they see ~20% growth for the next several years.
Themat ic Inves t ing 06 June 2014
9
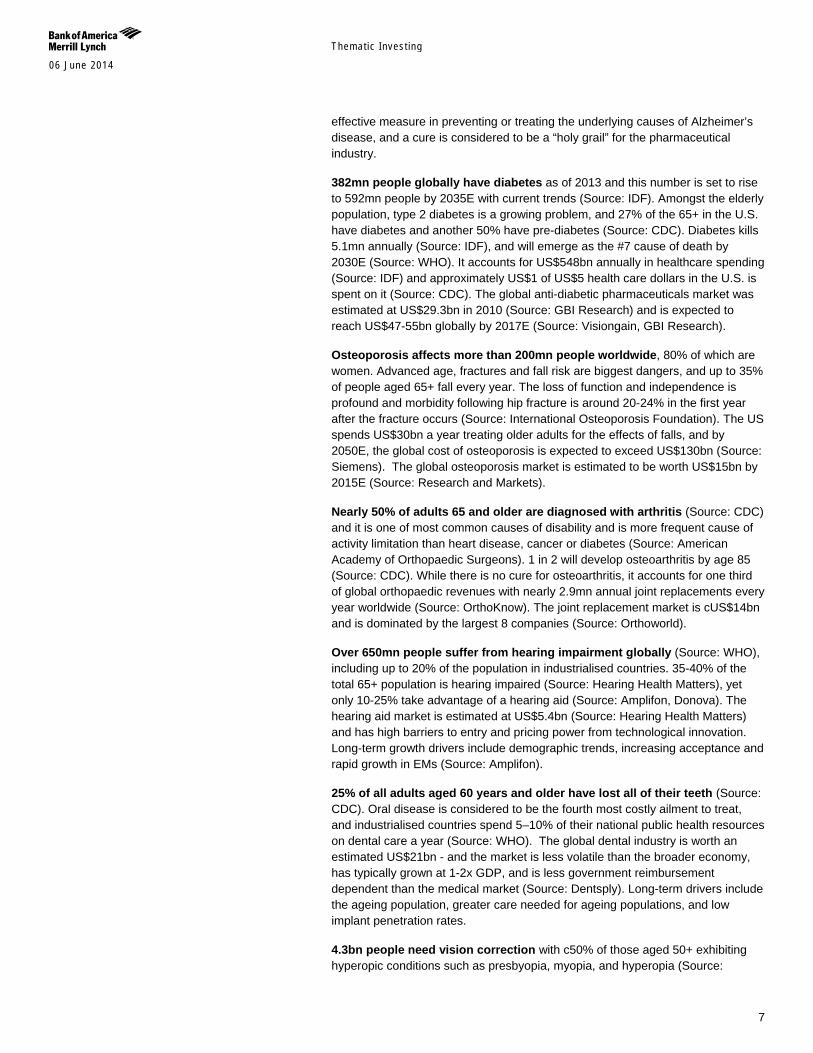
Financials, accumulation & decumulation In our view, a number of stocks are well placed to benefit from the theme of Longevity via financials through their involvement in areas such as insurance, reinsurance, asset management and wealth management, among other areas.
Longevity risk putting survival of retirement systems at risk Longevity risk is the risk that, on average, people live longer than expected, or “too long”. For individuals who have not secured an income for life, the risk is that they outlive their savings. For providers of pensions and annuities, the risk is that payments are made for longer than anticipated. Longevity risk will likely be one of the most significant challenges facing retirement systems over the next 50Y.
US15-25tn in annuity and pension-related longevity risk Estimates of the global amount of annuity and pension-related longevity risk exposure range from US$15tn to US$25tn (Source: CRO Forum, 2010, and Biffis and Blake, 2012). The issue is most acute in North America where over 90% of longevity risk sits with defined benefit pension plans and is estimated at over US$7tn (Swiss Re). A one-year shock to longevity would more than double the amount of aggregate pension underfunding, and many countries could be facing additional costs of up to 50% of 2010 GDP by 2050E (Source: IMF).
Huge retirement opportunity for insurers The shifts from state to private pension provision and from defined benefit to defined contribution pension savings place an increasing onus on the individual, creating vast opportunities for insurers that are able to manage assets during the accumulation phase and risk during the post-retirement decumulation phase. The greatest near-term opportunities are in the UK and US, while Asia represents an attractive accumulation opportunity, in our view. Reinsurers also have a role as buyers of longevity risk, and a nascent longevity risk transfer (LRT) market is developing.
Wealth management to benefit from the “great transfer” Global ageing and longevity trends should create significant opportunities for asset managers, and especially wealth managers off the back of the looming shift of wealth to and from boomers. The “great transfer” will shift US$12tn from those born in the 1920s and 1930s to the boomers and, and an even larger transfer – estimated at US$30tn in financial and non-financial assets – will shift over the next 30-40Y in the US alone (Source: Cerulli Associates). Global wealth is estimated at US$240tn (Source: Schroders), and global HNW investable assets have reached US$46tn (Source: Capgemini-RBC), and there is considerable room for growth given that only four out of 10 US retirees currently use a financial advisor (Source: Actuaries Institute, CoreData). On the flipside, concerns around plutonomies cannot be ignored.
Demographics and changing risk appetite The coming decade will see a significant decline in the number of 40-64 year olds, the group which is viewed typically as the biggest net investors and takers of risk in investment products. We expect risk appetite to wane with core equity mandates likely to come under increasing pressure, while incremental demand for diversification and risk-controlled assets looks set to rise. We see this providing further impetus for wealth management, retirement-focused savings and investment, and the secular move towards more risk-controlled investment.
Table 2: BofAML Global Longevity - Stocks in our coverage universe with Exposure to Financials, accumulation & decumulation Longevity Company Exposure AMP Ltd High Legal & General High Lincoln National High Principal Fincl High Prudential Fincl High Aegon Medium Affiliated Mgrs. Medium Aflac Inc Medium AIA Medium AIG Medium AllianceBernstein Medium BlackRock, Inc. Medium BNY Mellon Medium Credit Suisse Group Medium Eaton Vance Medium Federated Inv. Medium Franklin Re Medium Henderson Group Medium IGMFinancial Medium Invesco Medium Janus Capital Medium JP Morgan Chase Medium Legg Mason Medium Man Group Medium Manulife Medium MetLife Inc. Medium Morgan Stanley Medium Northern Trust Medium Old Mutual Medium Prudential PLC Medium Schroders Medium St James Place Medium State Street Medium Sun Life Medium T. Rowe Price Medium UBS Medium Waddell & Reed Medium Wells Fargo Medium The Hartford Low LifeLock Low Source: BofA Merrill Lynch Global Research
Themat ic Inves t ing 06 June 2014
10
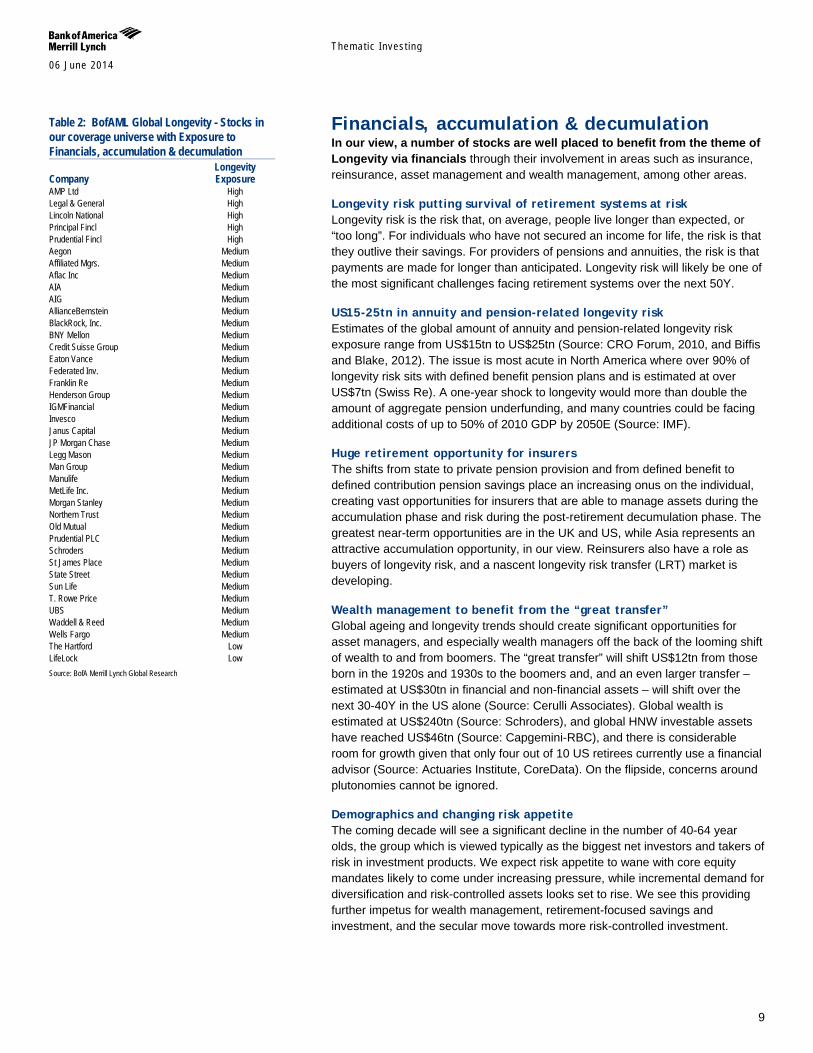
Consumer, the silver dollar In our view, a number of stocks are well placed to benefit from the theme of longevity via older consumers through their involvement in areas such as senior living, care, managed care, healthcare REITs, ageing in place, death care, pharmacies and drug stores, travel and leisure, beauty and cosmetics, fashion, retail, and technology, among other areas.
The spending power of consumers aged 60+ will reach US$15tn+ globally by 2020E (Source: Euromonitor), and their lifestyles and spending patterns differ from older adults of a previous generation. In addition to having unprecedented spending power, they are also extremely open to marketing and media, making them an attractive consumer demographic. They are internet savvy, use cell phones, and have the desire to keep doing the things they have always done. Older adults contributed to US$3.0tn to non-healthcare consumer spending or US$28,200 per capita in expenditure, representing c.51% of U.S. spending by all 25+ consumers (Source: Oxford Economics). This represents a huge opportunity.
Companies need to develop effective strategies to address the longevity economy. The two main strategies used to date are explicitly targeting the 50+ market with products and services specifically designed for segments in that market; and maximising market opportunities by expanding into the 50+ market. Additional strategies include age-, design-, and message-targeted approaches and modifications for products and services for older consumers (Source: AARP).
Up to 40% of US adults aged 65+ need assistance with daily living activities and 40% of the 65+ population are likely to eventually enter a nursing home vs. the OECD average of 12% (Source: Health and Retirement Study, PRB, KPMG, Medicare). Total public spending on long-term care currently accounts for 1.4% of OECD GDP and is expected to double to 2050E (Source: OECD) – with individuals and families bearing an increasing share of the costs.
Revenue for the US senior living industry is expected to reach US$69.8bn by 2018E (5.4% CAGR in 2013-18E) (Source: IbisWorld). A new generation of facilities is increasingly attractive for active boomers and there is significant room for growth in the US, given that there are currently only 1.9mn units serving a population of 12mn seniors (c.15% penetration rate) (Source: Brookdale Senior Living). Moreover, the industry is strongly levered to the housing market recovery and improving economy, and has the least exposure to government reimbursement among all of the healthcare facilities subsectors. Increasing stakeholder concerns over quality will also mean greater federal and state level scrutiny.
83% of boomers want to age in place and the 55+ age group accounts for 50% of home renovation spending (Source: AARP, Joint Center for Housing Studies, of Harvard University). US “renovation nation” expenditures are projected to increase at a 3.5-5.0% CAGR to 2015E with the US home improvement industry set to reach US$191.5bn by 2018E (Source: Joint Center for Housing Studies of Harvard University, IBISWorld).
Healthcare REITs own up to 20% of US senior housing & healthcare real estate. They have invested across a variety of sub-asset classes and been rewarded to date by investors with premium multiples that have allowed them to expand and diversify via acquisitions. Absorption is outpacing inventory growth –
Table 3: BofAML Global Longevity - Stocks in our coverage universe with Exposure to Consumer Longevity Company Exposure Aviv REIT High Brookdale High Capital Senior Livin High Challenger Ltd High HCA High HCP, Inc. High Health Care REIT High HealthSouth High Kindred High Lung Yen High Medical Prop Trust High N Brown High National Health High Primary Health High Ramsay High Select Medical High Senior Housing High Serv Corp Intl High Skilled Healthcare High UnitedHealth Grp High Ventas Inc. High WellCare High Ain Pharmaciez Medium BR Pharma Medium CVS/Caremark Medium DaVita HealthCare Medium Debenhams Medium Humana Inc Medium Jean Coutu Medium M & S Medium Masco Corp Medium Matsumotokiyoshi Medium Raia Drogasil Medium Secom Medium Secom Medium Sugi Holdings Medium Sundrug Medium The Home Depot Medium Walgreen Medium Avon Products Low Beiersdorf Low Boyd Gaming Corp Low Caesars Low Carnival Low Carnival Low Coty Inc. Low Croda Low CVC Low DSM Low Estee Lauder Low Flight Centre Low Henkel Low Int'l Game Tech Low Kao Corp Low Las Vegas Sands Low L'Oreal Low Lowe's Low MGM Resorts Low Nestle (Reg) Low Nu Skin Low Penn Natl Gaming Low Pinnacle Ent. Low Procter & Gamble Low SCA Low Shiseido Low Thomas Cook Low TUI Travel Low Unicharm Low Vitamin Shoppe Low Wynn Resorts Ltd Low
Source: BofA Merrill Lynch Global Research
Themat ic Inves t ing 06 June 2014
11
and the industry remains fragmented, providing ample growth through consolidation opportunities.
The flipside off longevity is mortality and the death care market is estimated at US$17bn for the US and US$18bn for Japan and US$7.6bn for China (Source: International Cemetery, Cremation and Funeral Association, Bloomberg and Euromonitor). The markets are highly fragmented but experiencing increasing consolidation by large-scale, for-profit actors and chains.
Ageing is creating a larger base for the drug store industry and seniors are the largest consumers of healthcare and prescription drugs with the average American aged 65-79 receiving an average of 27 prescriptions per person (Source: IMS). Global pharmacy sales are expected to reach US$1.2tn by 2017E (Source: IMS), with prescription drugs and OTC medication still comprising the lion’s share of sales. Ageing remains the key driver with U.S prescription drug expenditure expected to grow by 6% CAGR to 2022E (Source: CVS et. al.).
Ageing populations want to look and feel their best and are the primary driver of the global anti-aging industry, including anti-wrinkle skincare, aesthetic dermatology, plastic surgery, and hair restoration. European women over 60 account for 34% of the facial skincare market, buying twice as many products as women under 25 (Source: L'Oréal). The global market size was estimated to be at US$122.3bn in 2013. An expanding consumer base is expected to drive this figure upwards by a CAGR of 7.8% from 2013 to 2019E to reach an estimated value of US$191.7bn (Source: Transparency Market Research).
Boomers are the one of the most active demographics in travel and leisure and spend $120bn per year (Source: World Travel Monitor). Americans aged 50+ make up a large share of the overseas travel pie accounting for 38.2% of all overseas travel by US adults, representing 22.7% of the overall US adult outbound travel market. In fact, the average age of a cruise passenger is 50+ with annual household earnings of US$ 109,000. The total economic contribution of travel and tourism industry was US$6.9tn in 2013 or 9.5% of GDP (Source: WTTC Travel & Tourism Economic Impact 2014).
More than half of people aged 65+ reported gambling in the past year, and people aged 50+ comprise 64% of U.S. casino visitors (Source: AGA). Older adults are showing greater participation in gaming and gambling than ever before, and studies show a link with better overall health and improved quality of life (Source: American Journal of Psychiatry). The global casino and gaming market is estimated to have been at US$118bn in 2010, and will grow at a 9.2% CAGR to US$182bn by 2015E, propelled by growth in the Asia Pacific region (Source: PWC, Companies and Markets).
Older adults are making up a greater proportion of retail fashion spend. Already 50% of total womenswear purchases in UK come from over 45 year olds, compared to 37% twenty years ago and this number will increase further due to an ageing population. This is reflective of a greater number of working women and higher spending power. Retailers and service providers will need to adapt to the changing customer base and modify their products to an older demographic.
Smart technologies will play an increasing role in facilitating eldercare with M2M, remote monitoring, automation, and robots all set to benefit going forward.
Themat ic Inves t ing 06 June 2014
12
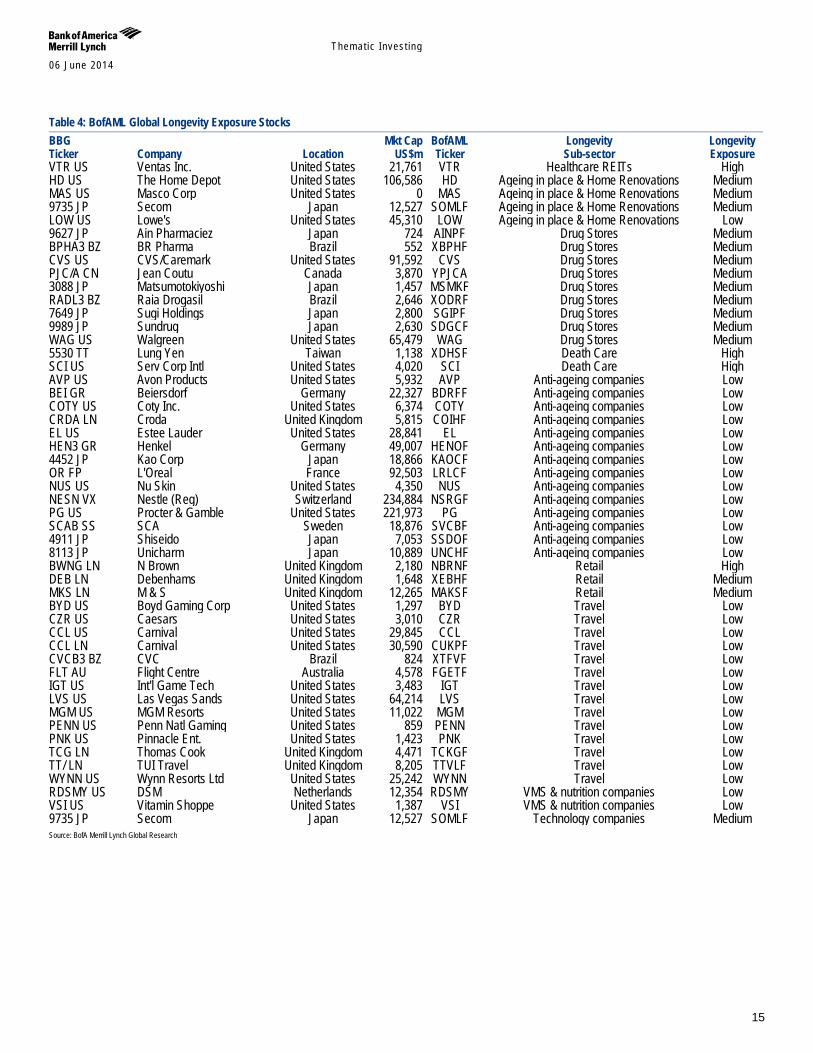
BofAML Global Longevity stock list We have created a BofA Merrill Lynch Global Research list of stocks which have exposure to longevity-related themes and that we consider should benefit long-term from global ageing. The aim of this stock list is to provide investors with information to understand company and sub-sector specific risks and opportunities inherent in the longevity theme.
Our longevity stock list We have mapped efforts to tackle the global dynamics of longevity to highlight three main entry points for investors wishing to play the ”Silver Dollar” theme:
1. Pharmaceuticals & Healthcare (incl. tackling age-related diseases and conditions such as cancer, cardiovascular disease, Alzheimer’s, diabetes, osteoporosis, as well as medical devices, hearing aids, dental care, vision care, and incontinence);
2. Financials (incl. insurance, asset & wealth management); and
3. Consumer (incl. senior living, care, managed care, healthcare REITs, aging in place, death care, pharmacies & drug stores, anti-ageing, travel & leisure, retail, VMS, and technology).
For each entry point, we map opportunities and risks across a number of sector value chains to highlight a diverse range of entry points for investors wishing to play the theme. Together with our fundamental BofAML Global Research analysts, we have estimated the level and materiality of companies’ exposure to the themes, and the role of the themes as long-term drivers. We have characterised each company’s longevity exposure as follows:
Low – Longevity-related products, technologies, services, and solutions are not material to global revenues and/or growth but are one factor, among others, for the business model, strategy and R&D of the company.
Medium – Longevity-related products, technologies, services, and solutions are an important factor for the business model, strategy and R&D of the company; material to sales and/or growth.
High – Longevity-related products, technologies, services, and solutions are core to the business model, strategy and R&D of the company; material sales and/or growth driver; pure play (i.e., 100% of sales).
Although it is difficult to accurately gauge the link between such exposure and share price performance (as many factors outside the scope of this analysis are likely to play a role in short- and long-term price development), we still consider longevity-related exposure an important and positive point to track given that longevity is a thematic megatrend with a 25-50 year lifespan.
The aim of our Global Longevity Exposure stock list and its three underlying themes is to provide investors with information to identify company and sub-sector specific risks and opportunities that are inherent in the longevity theme.
The BofAML Global Longevity stock list of stocks is not a recommended list either individually or as a group of stocks. Investors should consider the fundamentals of the companies and their own individual circumstances / objectives before making any investment decisions
Themat ic Inves t ing 06 June 2014
13
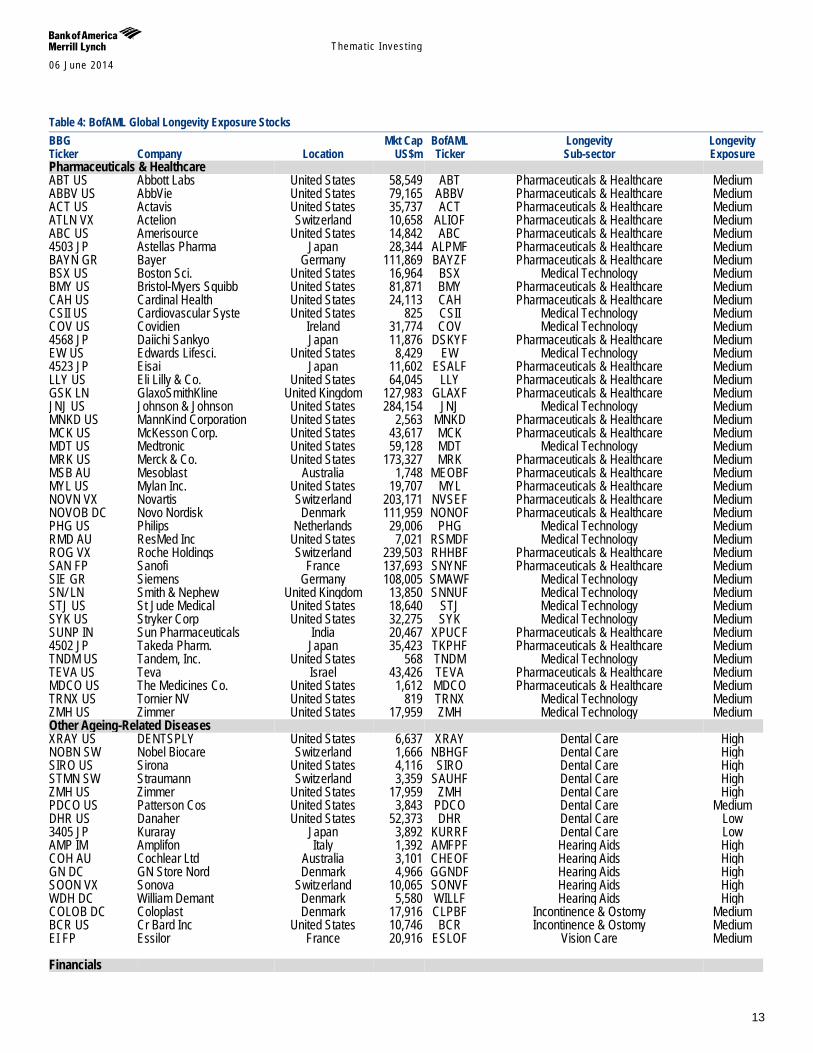
Table 4: BofAML Global Longevity Exposure Stocks BBG Mkt Cap BofAML Longevity Longevity Ticker Company Location US$m Ticker Sub-sector Exposure Pharmaceuticals & Healthcare ABT US Abbott Labs United States 58,549 ABT Pharmaceuticals & Healthcare Medium ABBV US AbbVie United States 79,165 ABBV Pharmaceuticals & Healthcare Medium ACT US Actavis United States 35,737 ACT Pharmaceuticals & Healthcare Medium ATLN VX Actelion Switzerland 10,658 ALIOF Pharmaceuticals & Healthcare Medium ABC US Amerisource United States 14,842 ABC Pharmaceuticals & Healthcare Medium 4503 JP Astellas Pharma Japan 28,344 ALPMF Pharmaceuticals & Healthcare Medium BAYN GR Bayer Germany 111,869 BAYZF Pharmaceuticals & Healthcare Medium BSX US Boston Sci. United States 16,964 BSX Medical Technology Medium BMY US Bristol-Myers Squibb United States 81,871 BMY Pharmaceuticals & Healthcare Medium CAH US Cardinal Health United States 24,113 CAH Pharmaceuticals & Healthcare Medium CSII US Cardiovascular Syste United States 825 CSII Medical Technology Medium COV US Covidien Ireland 31,774 COV Medical Technology Medium 4568 JP Daiichi Sankyo Japan 11,876 DSKYF Pharmaceuticals & Healthcare Medium EW US Edwards Lifesci. United States 8,429 EW Medical Technology Medium 4523 JP Eisai Japan 11,602 ESALF Pharmaceuticals & Healthcare Medium LLY US Eli Lilly & Co. United States 64,045 LLY Pharmaceuticals & Healthcare Medium GSK LN GlaxoSmithKline United Kingdom 127,983 GLAXF Pharmaceuticals & Healthcare Medium JNJ US Johnson & Johnson United States 284,154 JNJ Medical Technology Medium MNKD US MannKind Corporation United States 2,563 MNKD Pharmaceuticals & Healthcare Medium MCK US McKesson Corp. United States 43,617 MCK Pharmaceuticals & Healthcare Medium MDT US Medtronic United States 59,128 MDT Medical Technology Medium MRK US Merck & Co. United States 173,327 MRK Pharmaceuticals & Healthcare Medium MSB AU Mesoblast Australia 1,748 MEOBF Pharmaceuticals & Healthcare Medium MYL US Mylan Inc. United States 19,707 MYL Pharmaceuticals & Healthcare Medium NOVN VX Novartis Switzerland 203,171 NVSEF Pharmaceuticals & Healthcare Medium NOVOB DC Novo Nordisk Denmark 111,959 NONOF Pharmaceuticals & Healthcare Medium PHG US Philips Netherlands 29,006 PHG Medical Technology Medium RMD AU ResMed Inc United States 7,021 RSMDF Medical Technology Medium ROG VX Roche Holdings Switzerland 239,503 RHHBF Pharmaceuticals & Healthcare Medium SAN FP Sanofi France 137,693 SNYNF Pharmaceuticals & Healthcare Medium SIE GR Siemens Germany 108,005 SMAWF Medical Technology Medium SN/ LN Smith & Nephew United Kingdom 13,850 SNNUF Medical Technology Medium STJ US St Jude Medical United States 18,640 STJ Medical Technology Medium SYK US Stryker Corp United States 32,275 SYK Medical Technology Medium SUNP IN Sun Pharmaceuticals India 20,467 XPUCF Pharmaceuticals & Healthcare Medium 4502 JP Takeda Pharm. Japan 35,423 TKPHF Pharmaceuticals & Healthcare Medium TNDM US Tandem, Inc. United States 568 TNDM Medical Technology Medium TEVA US Teva Israel 43,426 TEVA Pharmaceuticals & Healthcare Medium MDCO US The Medicines Co. United States 1,612 MDCO Pharmaceuticals & Healthcare Medium TRNX US Tornier NV United States 819 TRNX Medical Technology Medium ZMH US Zimmer United States 17,959 ZMH Medical Technology Medium Other Ageing-Related Diseases XRAY US DENTSPLY United States 6,637 XRAY Dental Care High NOBN SW Nobel Biocare Switzerland 1,666 NBHGF Dental Care High SIRO US Sirona United States 4,116 SIRO Dental Care High STMN SW Straumann Switzerland 3,359 SAUHF Dental Care High ZMH US Zimmer United States 17,959 ZMH Dental Care High PDCO US Patterson Cos United States 3,843 PDCO Dental Care Medium DHR US Danaher United States 52,373 DHR Dental Care Low 3405 JP Kuraray Japan 3,892 KURRF Dental Care Low AMP IM Amplifon Italy 1,392 AMFPF Hearing Aids High COH AU Cochlear Ltd Australia 3,101 CHEOF Hearing Aids High GN DC GN Store Nord Denmark 4,966 GGNDF Hearing Aids High SOON VX Sonova Switzerland 10,065 SONVF Hearing Aids High WDH DC William Demant Denmark 5,580 WILLF Hearing Aids High COLOB DC Coloplast Denmark 17,916 CLPBF Incontinence & Ostomy Medium BCR US Cr Bard Inc United States 10,746 BCR Incontinence & Ostomy Medium EI FP Essilor France 20,916 ESLOF Vision Care Medium Financials
Themat ic Inves t ing 06 June 2014
14
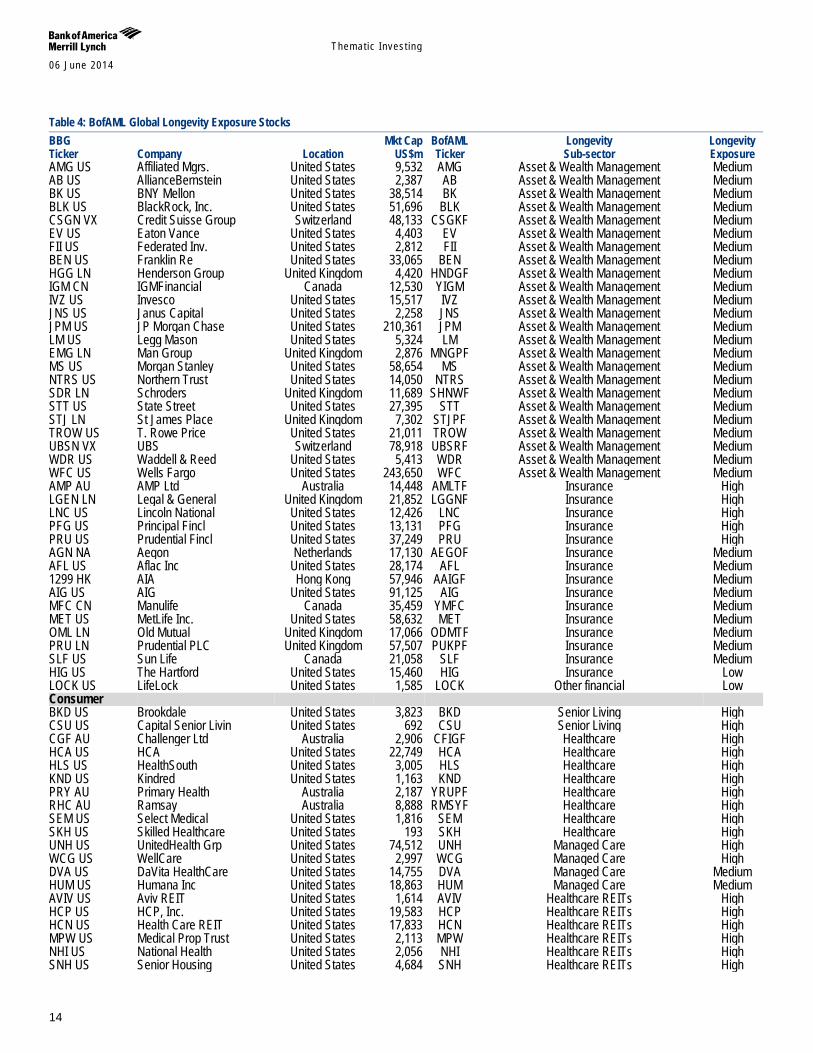
Table 4: BofAML Global Longevity Exposure Stocks BBG Mkt Cap BofAML Longevity Longevity Ticker Company Location US$m Ticker Sub-sector Exposure AMG US Affiliated Mgrs. United States 9,532 AMG Asset & Wealth Management Medium AB US AllianceBernstein United States 2,387 AB Asset & Wealth Management Medium BK US BNY Mellon United States 38,514 BK Asset & Wealth Management Medium BLK US BlackRock, Inc. United States 51,696 BLK Asset & Wealth Management Medium CSGN VX Credit Suisse Group Switzerland 48,133 CSGKF Asset & Wealth Management Medium EV US Eaton Vance United States 4,403 EV Asset & Wealth Management Medium FII US Federated Inv. United States 2,812 FII Asset & Wealth Management Medium BEN US Franklin Re United States 33,065 BEN Asset & Wealth Management Medium HGG LN Henderson Group United Kingdom 4,420 HNDGF Asset & Wealth Management Medium IGM CN IGMFinancial Canada 12,530 YIGM Asset & Wealth Management Medium IVZ US Invesco United States 15,517 IVZ Asset & Wealth Management Medium JNS US Janus Capital United States 2,258 JNS Asset & Wealth Management Medium JPM US JP Morgan Chase United States 210,361 JPM Asset & Wealth Management Medium LM US Legg Mason United States 5,324 LM Asset & Wealth Management Medium EMG LN Man Group United Kingdom 2,876 MNGPF Asset & Wealth Management Medium MS US Morgan Stanley United States 58,654 MS Asset & Wealth Management Medium NTRS US Northern Trust United States 14,050 NTRS Asset & Wealth Management Medium SDR LN Schroders United Kingdom 11,689 SHNWF Asset & Wealth Management Medium STT US State Street United States 27,395 STT Asset & Wealth Management Medium STJ LN St James Place United Kingdom 7,302 STJPF Asset & Wealth Management Medium TROW US T. Rowe Price United States 21,011 TROW Asset & Wealth Management Medium UBSN VX UBS Switzerland 78,918 UBSRF Asset & Wealth Management Medium WDR US Waddell & Reed United States 5,413 WDR Asset & Wealth Management Medium WFC US Wells Fargo United States 243,650 WFC Asset & Wealth Management Medium AMP AU AMP Ltd Australia 14,448 AMLTF Insurance High LGEN LN Legal & General United Kingdom 21,852 LGGNF Insurance High LNC US Lincoln National United States 12,426 LNC Insurance High PFG US Principal Fincl United States 13,131 PFG Insurance High PRU US Prudential Fincl United States 37,249 PRU Insurance High AGN NA Aegon Netherlands 17,130 AEGOF Insurance Medium AFL US Aflac Inc United States 28,174 AFL Insurance Medium 1299 HK AIA Hong Kong 57,946 AAIGF Insurance Medium AIG US AIG United States 91,125 AIG Insurance Medium MFC CN Manulife Canada 35,459 YMFC Insurance Medium MET US MetLife Inc. United States 58,632 MET Insurance Medium OML LN Old Mutual United Kingdom 17,066 ODMTF Insurance Medium PRU LN Prudential PLC United Kingdom 57,507 PUKPF Insurance Medium SLF US Sun Life Canada 21,058 SLF Insurance Medium HIG US The Hartford United States 15,460 HIG Insurance Low LOCK US LifeLock United States 1,585 LOCK Other financial Low Consumer BKD US Brookdale United States 3,823 BKD Senior Living High CSU US Capital Senior Livin United States 692 CSU Senior Living High CGF AU Challenger Ltd Australia 2,906 CFIGF Healthcare High HCA US HCA United States 22,749 HCA Healthcare High HLS US HealthSouth United States 3,005 HLS Healthcare High KND US Kindred United States 1,163 KND Healthcare High PRY AU Primary Health Australia 2,187 YRUPF Healthcare High RHC AU Ramsay Australia 8,888 RMSYF Healthcare High SEM US Select Medical United States 1,816 SEM Healthcare High SKH US Skilled Healthcare United States 193 SKH Healthcare High UNH US UnitedHealth Grp United States 74,512 UNH Managed Care High WCG US WellCare United States 2,997 WCG Managed Care High DVA US DaVita HealthCare United States 14,755 DVA Managed Care Medium HUM US Humana Inc United States 18,863 HUM Managed Care Medium AVIV US Aviv REIT United States 1,614 AVIV Healthcare REITs High HCP US HCP, Inc. United States 19,583 HCP Healthcare REITs High HCN US Health Care REIT United States 17,833 HCN Healthcare REITs High MPW US Medical Prop Trust United States 2,113 MPW Healthcare REITs High NHI US National Health United States 2,056 NHI Healthcare REITs High SNH US Senior Housing United States 4,684 SNH Healthcare REITs High
Themat ic Inves t ing 06 June 2014
15
Table 4: BofAML Global Longevity Exposure Stocks BBG Mkt Cap BofAML Longevity Longevity Ticker Company Location US$m Ticker Sub-sector Exposure VTR US Ventas Inc. United States 21,761 VTR Healthcare REITs High HD US The Home Depot United States 106,586 HD Ageing in place & Home Renovations Medium MAS US Masco Corp United States 0 MAS Ageing in place & Home Renovations Medium 9735 JP Secom Japan 12,527 SOMLF Ageing in place & Home Renovations Medium LOW US Lowe's United States 45,310 LOW Ageing in place & Home Renovations Low 9627 JP Ain Pharmaciez Japan 724 AINPF Drug Stores Medium BPHA3 BZ BR Pharma Brazil 552 XBPHF Drug Stores Medium CVS US CVS/Caremark United States 91,592 CVS Drug Stores Medium PJC/A CN Jean Coutu Canada 3,870 YPJCA Drug Stores Medium 3088 JP Matsumotokiyoshi Japan 1,457 MSMKF Drug Stores Medium RADL3 BZ Raia Drogasil Brazil 2,646 XODRF Drug Stores Medium 7649 JP Sugi Holdings Japan 2,800 SGIPF Drug Stores Medium 9989 JP Sundrug Japan 2,630 SDGCF Drug Stores Medium WAG US Walgreen United States 65,479 WAG Drug Stores Medium 5530 TT Lung Yen Taiwan 1,138 XDHSF Death Care High SCI US Serv Corp Intl United States 4,020 SCI Death Care High AVP US Avon Products United States 5,932 AVP Anti-ageing companies Low BEI GR Beiersdorf Germany 22,327 BDRFF Anti-ageing companies Low COTY US Coty Inc. United States 6,374 COTY Anti-ageing companies Low CRDA LN Croda United Kingdom 5,815 COIHF Anti-ageing companies Low EL US Estee Lauder United States 28,841 EL Anti-ageing companies Low HEN3 GR Henkel Germany 49,007 HENOF Anti-ageing companies Low 4452 JP Kao Corp Japan 18,866 KAOCF Anti-ageing companies Low OR FP L'Oreal France 92,503 LRLCF Anti-ageing companies Low NUS US Nu Skin United States 4,350 NUS Anti-ageing companies Low NESN VX Nestle (Reg) Switzerland 234,884 NSRGF Anti-ageing companies Low PG US Procter & Gamble United States 221,973 PG Anti-ageing companies Low SCAB SS SCA Sweden 18,876 SVCBF Anti-ageing companies Low 4911 JP Shiseido Japan 7,053 SSDOF Anti-ageing companies Low 8113 JP Unicharm Japan 10,889 UNCHF Anti-ageing companies Low BWNG LN N Brown United Kingdom 2,180 NBRNF Retail High DEB LN Debenhams United Kingdom 1,648 XEBHF Retail Medium MKS LN M & S United Kingdom 12,265 MAKSF Retail Medium BYD US Boyd Gaming Corp United States 1,297 BYD Travel Low CZR US Caesars United States 3,010 CZR Travel Low CCL US Carnival United States 29,845 CCL Travel Low CCL LN Carnival United States 30,590 CUKPF Travel Low CVCB3 BZ CVC Brazil 824 XTFVF Travel Low FLT AU Flight Centre Australia 4,578 FGETF Travel Low IGT US Int'l Game Tech United States 3,483 IGT Travel Low LVS US Las Vegas Sands United States 64,214 LVS Travel Low MGM US MGM Resorts United States 11,022 MGM Travel Low PENN US Penn Natl Gaming United States 859 PENN Travel Low PNK US Pinnacle Ent. United States 1,423 PNK Travel Low TCG LN Thomas Cook United Kingdom 4,471 TCKGF Travel Low TT/ LN TUI Travel United Kingdom 8,205 TTVLF Travel Low WYNN US Wynn Resorts Ltd United States 25,242 WYNN Travel Low RDSMY US DSM Netherlands 12,354 RDSMY VMS & nutrition companies Low VSI US Vitamin Shoppe United States 1,387 VSI VMS & nutrition companies Low 9735 JP Secom Japan 12,527 SOMLF Technology companies Medium Source: BofA Merrill Lynch Global Research
Themat ic Inves t ing 06 June 2014
16
Ageing world – the global demographic transition Ageing is becoming a virtually universal phenomenon during the 21st century according to the UN’s Population Division. Population ageing is taking place in nearly all countries of the world off the back of decreasing mortality and declining fertility. This process is leading to a relative reduction in the proportion of children and to an increase in the share of older persons in the population. The global share of older people (aged 60+) increased from 9.2% in 1990 to 11.7% in 2013 and will continue to grow as a proportion of the world population, reaching 21.1% by 2050E.
Globally, the number of older persons (60+) is expected to more than double to 2050, from 841mn in 2013 to 2bn+ by 2050. Older persons are projected to exceed the number of children for the first time in 2047E. While developed markets have been ageing for many decades, it is important to note that two-thirds of the world’s older persons currently live in developing countries. Given the significantly higher growth rate of ageing in EMs (vs. developed markets), the projections show that by 2050, nearly eight in 10 of the world’s 60+ population will live in less developed regions (Source: UN). We also note that women make up the majority of the old, the ‘oldest old’ and the ‘most vulnerable old’ (Source: WEF).
Global birth rates have been falling over the last 50Y & 41% of the world’s population is below the replacement rate – Birth rates have fallen from 5.0 children per woman in 1950 to 2.5 today, and are expected to fall to between 1.8 and 2.2 by 2050. The fertility decline over the last half century has been one of the main factors explaining global ageing (Source: UN). Developed markets have seen the most pronounced decline while EMs are also seeing a sharp decline. 70% of the world’s population could fall below replacement level (i.e. reproducing at a rate of 1+ child per adult), which means we could be heading towards a potentially catastrophic decline in population (Source: Ian Goldin, Professor of Globalisation and Development at Oxford University).
Population ageing will pose major social and economic challenges and opportunities as old-age dependency or support ratios (ratio of the population aged 65+ to the population aged 15-64) are already low in developed markets, and are expected to continue to fall in the coming decades with ensuing fiscal pressures on public and private support systems for older persons. This can be compounded by higher levels of poverty, non-communicable diseases, and disability among older persons, especially in developing markets (Source: UN). On the flipside, older persons are increasingly becoming an engine for economic growth.
A large number of EMs can benefit from a demographic dividend given projections of high and increasing economic support ratios for years or decades to come, provided that appropriate labour market and other policies allow for productive absorption of the growth (Source: UN).
The demographic transition – In this section, we explore three intersecting demographic forces: the longevity miracle, the birth dearth, and the boomer bulge (Source: The Global Coalition on Aging). In addition, we examine the knock-on impact of these trends on old-age dependency ratios, women, retirement age, economic support systems, and poverty.
“The aging of the global population represents the greatest social, economic, and political transformation of our time” – Global Coalition on Aging “No other force is likely to shape the future of national economic health, public finances, and policymaking as the irreversible rate at which the world’s population is aging” – S&P
Themat ic Inves t ing 06 June 2014
17
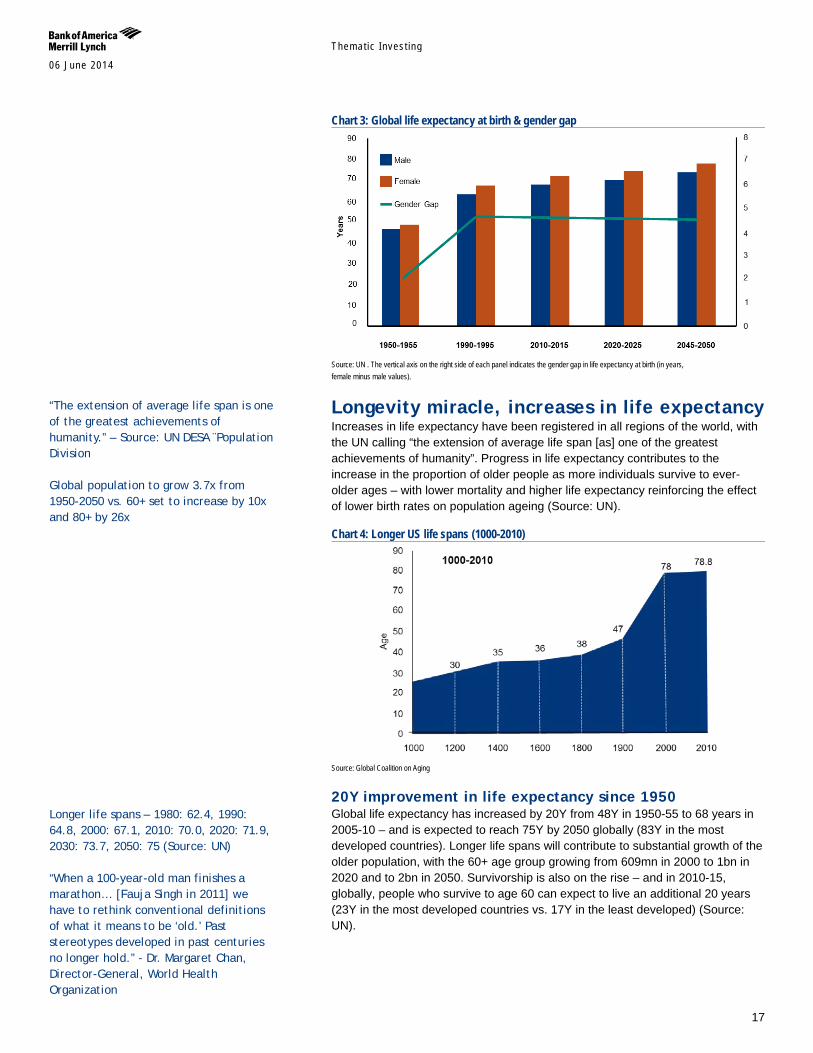
Chart 3: Global life expectancy at birth & gender gap
Source: UN . The vertical axis on the right side of each panel indicates the gender gap in life expectancy at birth (in years, female minus male values).
Longevity miracle, increases in life expectancy Increases in life expectancy have been registered in all regions of the world, with the UN calling “the extension of average life span [as] one of the greatest achievements of humanity”. Progress in life expectancy contributes to the increase in the proportion of older people as more individuals survive to ever-older ages – with lower mortality and higher life expectancy reinforcing the effect of lower birth rates on population ageing (Source: UN).
Chart 4: Longer US life spans (1000-2010)
Source: Global Coalition on Aging
20Y improvement in life expectancy since 1950 Global life expectancy has increased by 20Y from 48Y in 1950-55 to 68 years in 2005-10 – and is expected to reach 75Y by 2050 globally (83Y in the most developed countries). Longer life spans will contribute to substantial growth of the older population, with the 60+ age group growing from 609mn in 2000 to 1bn in 2020 and to 2bn in 2050. Survivorship is also on the rise – and in 2010-15, globally, people who survive to age 60 can expect to live an additional 20 years (23Y in the most developed countries vs. 17Y in the least developed) (Source: UN).
“The extension of average life span is one of the greatest achievements of humanity.” – Source: UN DESA ¨Population Division Global population to grow 3.7x from 1950-2050 vs. 60+ set to increase by 10x and 80+ by 26x
Longer life spans – 1980: 62.4, 1990: 64.8, 2000: 67.1, 2010: 70.0, 2020: 71.9, 2030: 73.7, 2050: 75 (Source: UN) “When a 100-year-old man finishes a marathon… [Fauja Singh in 2011] we have to rethink conventional definitions of what it means to be ‘old.’ Past stereotypes developed in past centuries no longer hold.” - Dr. Margaret Chan, Director-General, World Health Organization
Themat ic Inves t ing 06 June 2014
18
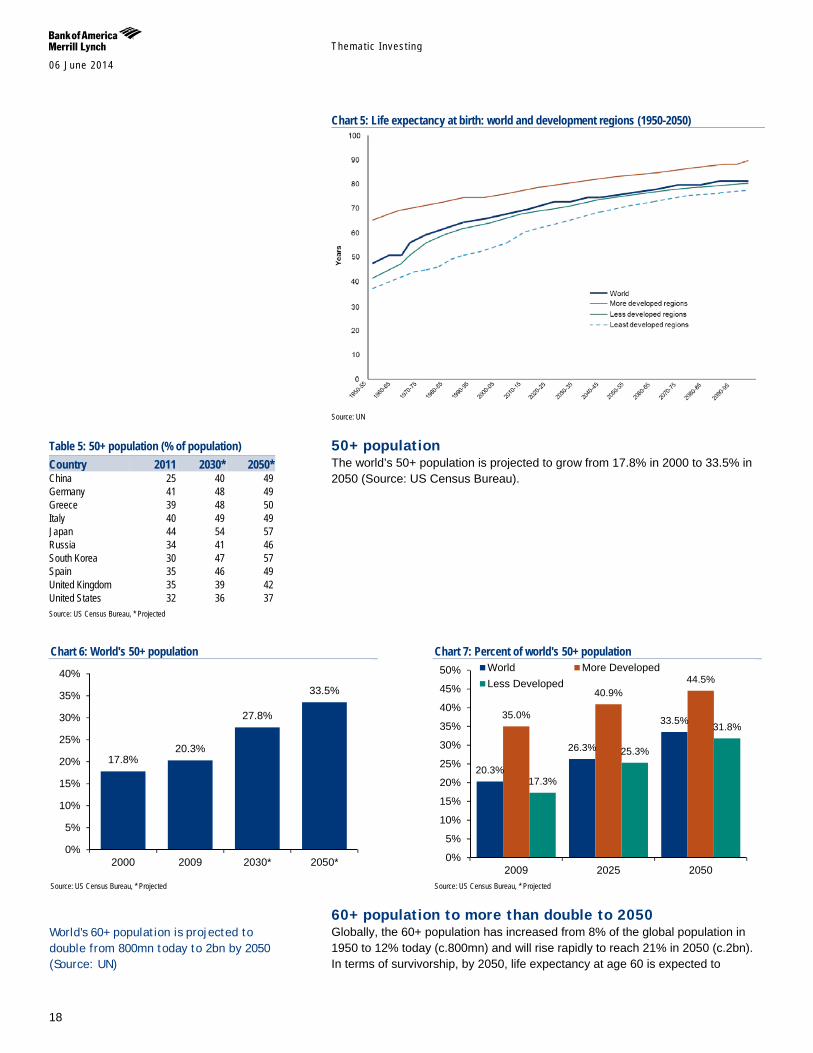
Chart 5: Life expectancy at birth: world and development regions (1950-2050)
Source: UN
50+ population The world’s 50+ population is projected to grow from 17.8% in 2000 to 33.5% in 2050 (Source: US Census Bureau).
Chart 6: World's 50+ population
Source: US Census Bureau, * Projected
Chart 7: Percent of world's 50+ population
Source: US Census Bureau, * Projected
60+ population to more than double to 2050 Globally, the 60+ population has increased from 8% of the global population in 1950 to 12% today (c.800mn) and will rise rapidly to reach 21% in 2050 (c.2bn). In terms of survivorship, by 2050, life expectancy at age 60 is expected to
17.8% 20.3%
27.8%
33.5%
0%
5%
10%
15%
20%
25%
30%
35%
40%
2000 2009 2030* 2050*
20.3%
26.3%
33.5% 35.0%
40.9% 44.5%
17.3%
25.3%
31.8%
0%
5%
10%
15%
20%
25%
30%
35%
40%
45%
50%
2009 2025 2050
World More DevelopedLess Developed
Table 5: 50+ population (% of population) Country 2011 2030* 2050* China 25 40 49 Germany 41 48 49 Greece 39 48 50 Italy 40 49 49 Japan 44 54 57 Russia 34 41 46 South Korea 30 47 57 Spain 35 46 49 United Kingdom 35 39 42 United States 32 36 37 Source: US Census Bureau, * Projected
World's 60+ population is projected to double from 800mn today to 2bn by 2050 (Source: UN)
Themat ic Inves t ing 06 June 2014
19
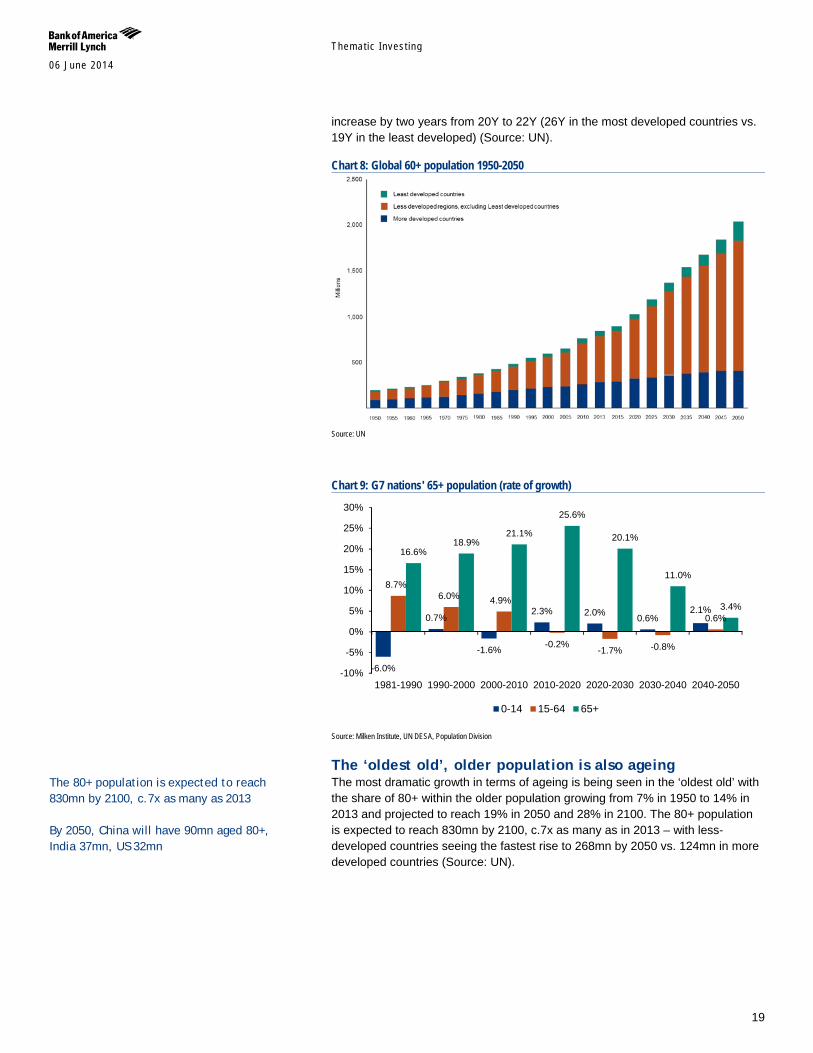
increase by two years from 20Y to 22Y (26Y in the most developed countries vs. 19Y in the least developed) (Source: UN).
Chart 8: Global 60+ population 1950-2050
Source: UN
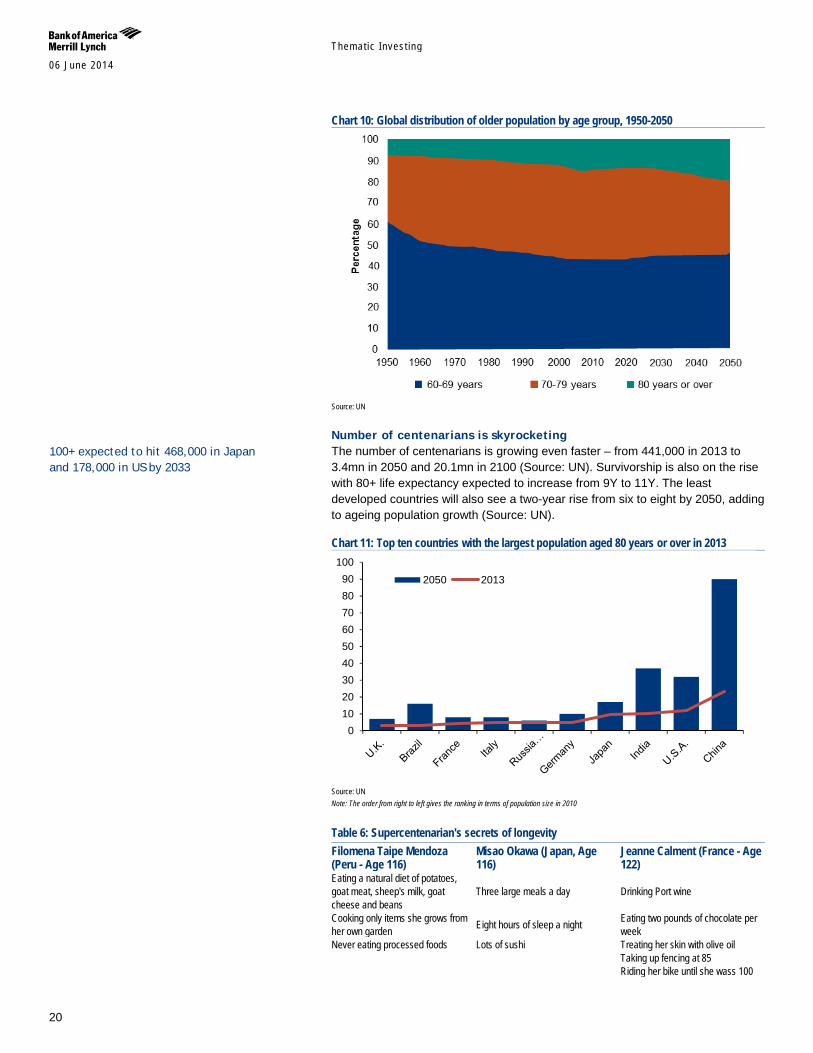
Chart 9: G7 nations' 65+ population (rate of growth)
Source: Milken Institute, UN DESA, Population Division
The ‘oldest old’, older population is also ageing The most dramatic growth in terms of ageing is being seen in the ‘oldest old’ with the share of 80+ within the older population growing from 7% in 1950 to 14% in 2013 and projected to reach 19% in 2050 and 28% in 2100. The 80+ population is expected to reach 830mn by 2100, c.7x as many as in 2013 – with less-developed countries seeing the fastest rise to 268mn by 2050 vs. 124mn in more developed countries (Source: UN).
-6.0%
0.7%
-1.6%
2.3% 2.0% 0.6% 2.1%
8.7% 6.0% 4.9%
-0.2% -1.7% -0.8%
0.6%
16.6% 18.9%
21.1%
25.6%
20.1%
11.0%
3.4%
-10%
-5%
0%
5%
10%
15%
20%
25%
30%
1981-1990 1990-2000 2000-2010 2010-2020 2020-2030 2030-2040 2040-2050
0-14 15-64 65+
The 80+ population is expected to reach 830mn by 2100, c.7x as many as 2013 By 2050, China will have 90mn aged 80+, India 37mn, US 32mn
Themat ic Inves t ing 06 June 2014
20
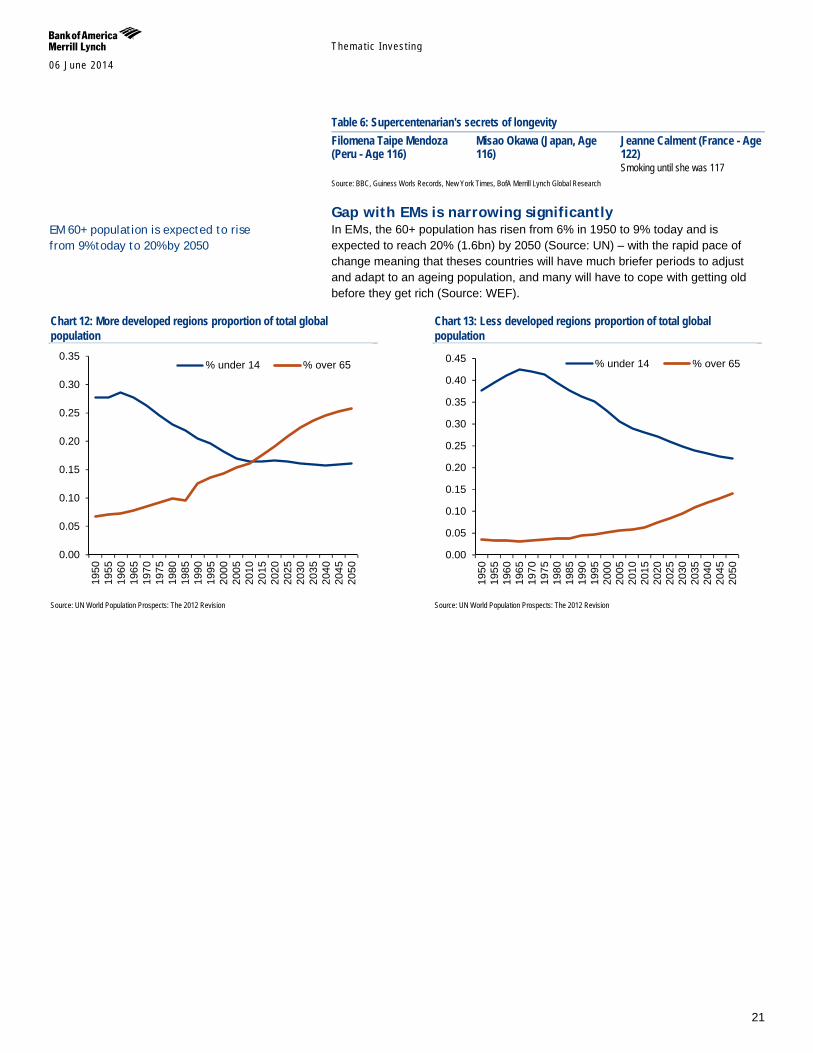
Chart 10: Global distribution of older population by age group, 1950-2050
Source: UN
Number of centenarians is skyrocketing The number of centenarians is growing even faster – from 441,000 in 2013 to 3.4mn in 2050 and 20.1mn in 2100 (Source: UN). Survivorship is also on the rise with 80+ life expectancy expected to increase from 9Y to 11Y. The least developed countries will also see a two-year rise from six to eight by 2050, adding to ageing population growth (Source: UN).
Chart 11: Top ten countries with the largest population aged 80 years or over in 2013
Source: UN Note: The order from right to left gives the ranking in terms of population size in 2010
Table 6: Supercentenarian's secrets of longevity Filomena Taipe Mendoza (Peru - Age 116)
Misao Okawa (Japan, Age 116)
Jeanne Calment (France - Age 122)
Eating a natural diet of potatoes, goat meat, sheep's milk, goat cheese and beans
Three large meals a day Drinking Port wine
Cooking only items she grows from her own garden Eight hours of sleep a night Eating two pounds of chocolate per
week Never eating processed foods Lots of sushi Treating her skin with olive oil Taking up fencing at 85 Riding her bike until she wass 100
0102030405060708090
100
2050 2013
100+ expected to hit 468,000 in Japan and 178,000 in US by 2033
Themat ic Inves t ing 06 June 2014
21
Table 6: Supercentenarian's secrets of longevity Filomena Taipe Mendoza (Peru - Age 116)
Misao Okawa (Japan, Age 116)
Jeanne Calment (France - Age 122)
Smoking until she was 117 Source: BBC, Guiness Worls Records, New York Times, BofA Merrill Lynch Global Research
Gap with EMs is narrowing significantly In EMs, the 60+ population has risen from 6% in 1950 to 9% today and is expected to reach 20% (1.6bn) by 2050 (Source: UN) – with the rapid pace of change meaning that theses countries will have much briefer periods to adjust and adapt to an ageing population, and many will have to cope with getting old before they get rich (Source: WEF).
Chart 12: More developed regions proportion of total global population
Source: UN World Population Prospects: The 2012 Revision
Chart 13: Less developed regions proportion of total global population
Source: UN World Population Prospects: The 2012 Revision
0.00
0.05
0.10
0.15
0.20
0.25
0.30
0.35
1950
1955
1960
1965
1970
1975
1980
1985
1990
1995
2000
2005
2010
2015
2020
2025
2030
2035
2040
2045
2050
% under 14 % over 65
0.00
0.05
0.10
0.15
0.20
0.25
0.30
0.35
0.40
0.45
1950
1955
1960
1965
1970
1975
1980
1985
1990
1995
2000
2005
2010
2015
2020
2025
2030
2035
2040
2045
2050
% under 14 % over 65
EM 60+ population is expected to rise from 9% today to 20% by 2050
Themat ic Inves t ing 06 June 2014
22
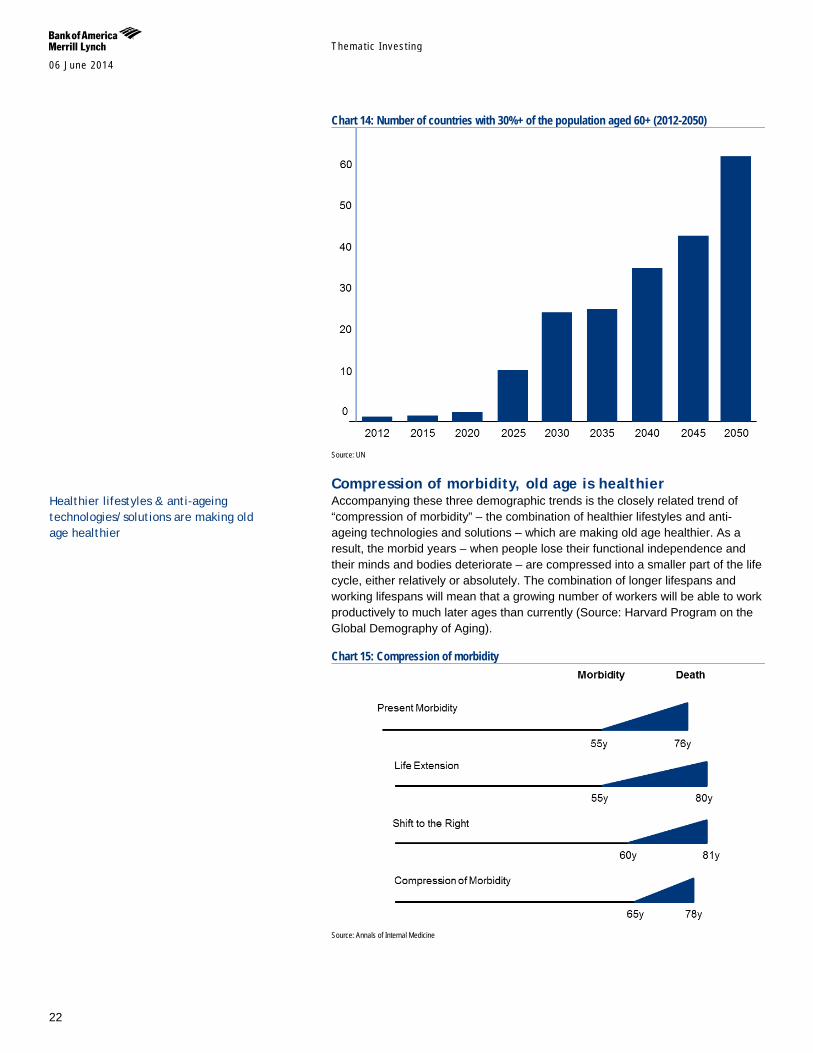
Chart 14: Number of countries with 30%+ of the population aged 60+ (2012-2050)
Source: UN
Compression of morbidity, old age is healthier Accompanying these three demographic trends is the closely related trend of “compression of morbidity” – the combination of healthier lifestyles and anti-ageing technologies and solutions – which are making old age healthier. As a result, the morbid years – when people lose their functional independence and their minds and bodies deteriorate – are compressed into a smaller part of the life cycle, either relatively or absolutely. The combination of longer lifespans and working lifespans will mean that a growing number of workers will be able to work productively to much later ages than currently (Source: Harvard Program on the Global Demography of Aging).
Chart 15: Compression of morbidity
Source: Annals of Internal Medicine
Healthier lifestyles & anti-ageing technologies/solutions are making old age healthier
Themat ic Inves t ing 06 June 2014
23
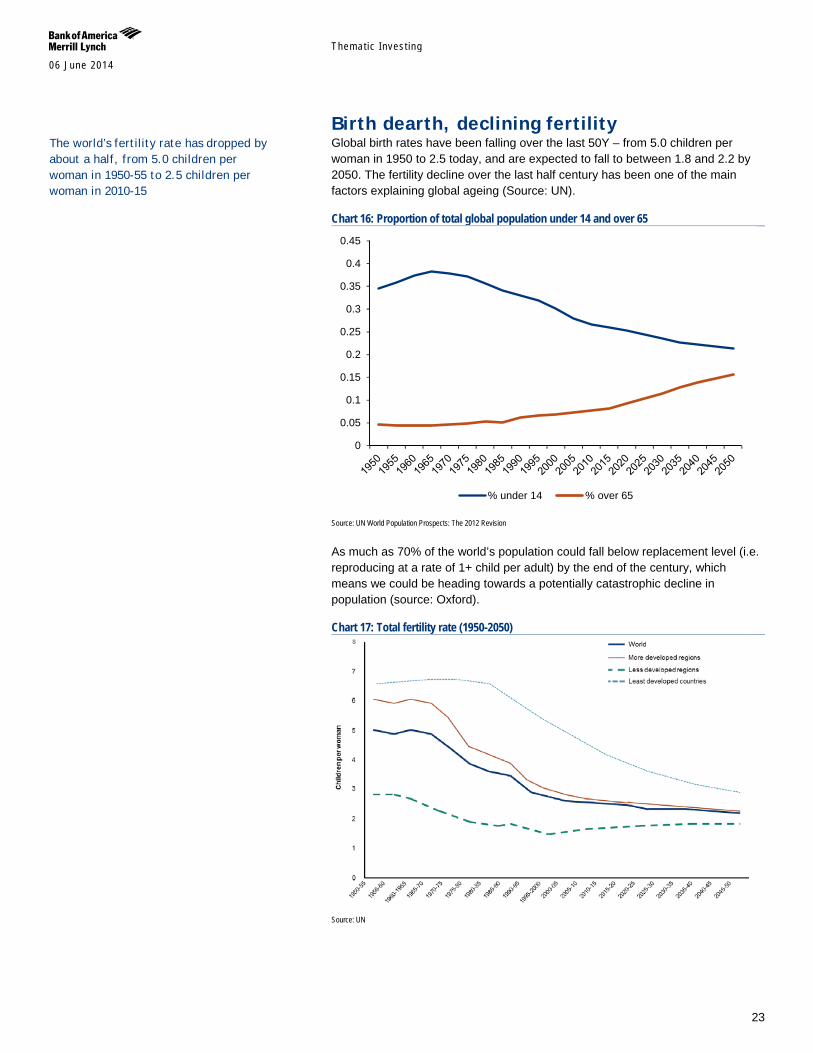
Birth dearth, declining fertility Global birth rates have been falling over the last 50Y – from 5.0 children per woman in 1950 to 2.5 today, and are expected to fall to between 1.8 and 2.2 by 2050. The fertility decline over the last half century has been one of the main factors explaining global ageing (Source: UN).
Chart 16: Proportion of total global population under 14 and over 65
Source: UN World Population Prospects: The 2012 Revision
As much as 70% of the world’s population could fall below replacement level (i.e. reproducing at a rate of 1+ child per adult) by the end of the century, which means we could be heading towards a potentially catastrophic decline in population (source: Oxford).
Chart 17: Total fertility rate (1950-2050)
Source: UN
0
0.05
0.1
0.15
0.2
0.25
0.3
0.35
0.4
0.45
% under 14 % over 65
The world’s fertility rate has dropped by about a half, from 5.0 children per woman in 1950-55 to 2.5 children per woman in 2010-15
Themat ic Inves t ing 06 June 2014
24
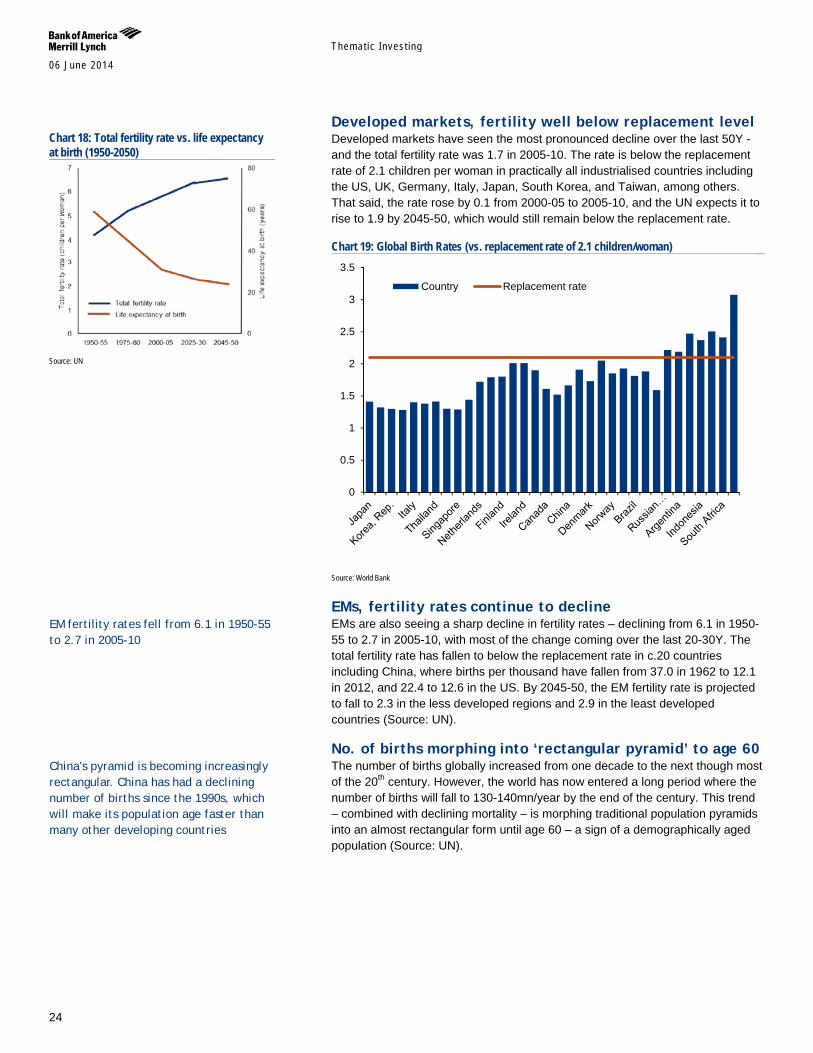
Developed markets, fertility well below replacement level Developed markets have seen the most pronounced decline over the last 50Y - and the total fertility rate was 1.7 in 2005-10. The rate is below the replacement rate of 2.1 children per woman in practically all industrialised countries including the US, UK, Germany, Italy, Japan, South Korea, and Taiwan, among others. That said, the rate rose by 0.1 from 2000-05 to 2005-10, and the UN expects it to rise to 1.9 by 2045-50, which would still remain below the replacement rate.
Chart 19: Global Birth Rates (vs. replacement rate of 2.1 children/woman)
Source: World Bank
EMs, fertility rates continue to decline EMs are also seeing a sharp decline in fertility rates – declining from 6.1 in 1950-55 to 2.7 in 2005-10, with most of the change coming over the last 20-30Y. The total fertility rate has fallen to below the replacement rate in c.20 countries including China, where births per thousand have fallen from 37.0 in 1962 to 12.1 in 2012, and 22.4 to 12.6 in the US. By 2045-50, the EM fertility rate is projected to fall to 2.3 in the less developed regions and 2.9 in the least developed countries (Source: UN).
No. of births morphing into ‘rectangular pyramid’ to age 60 The number of births globally increased from one decade to the next though most of the 20th century. However, the world has now entered a long period where the number of births will fall to 130-140mn/year by the end of the century. This trend – combined with declining mortality – is morphing traditional population pyramids into an almost rectangular form until age 60 – a sign of a demographically aged population (Source: UN).
0
0.5
1
1.5
2
2.5
3
3.5
Country Replacement rate
Chart 18: Total fertility rate vs. life expectancy at birth (1950-2050)
Source: UN
China’s pyramid is becoming increasingly rectangular. China has had a declining number of births since the 1990s, which will make its population age faster than many other developing countries
EM fertility rates fell from 6.1 in 1950-55 to 2.7 in 2005-10
Themat ic Inves t ing 06 June 2014
25
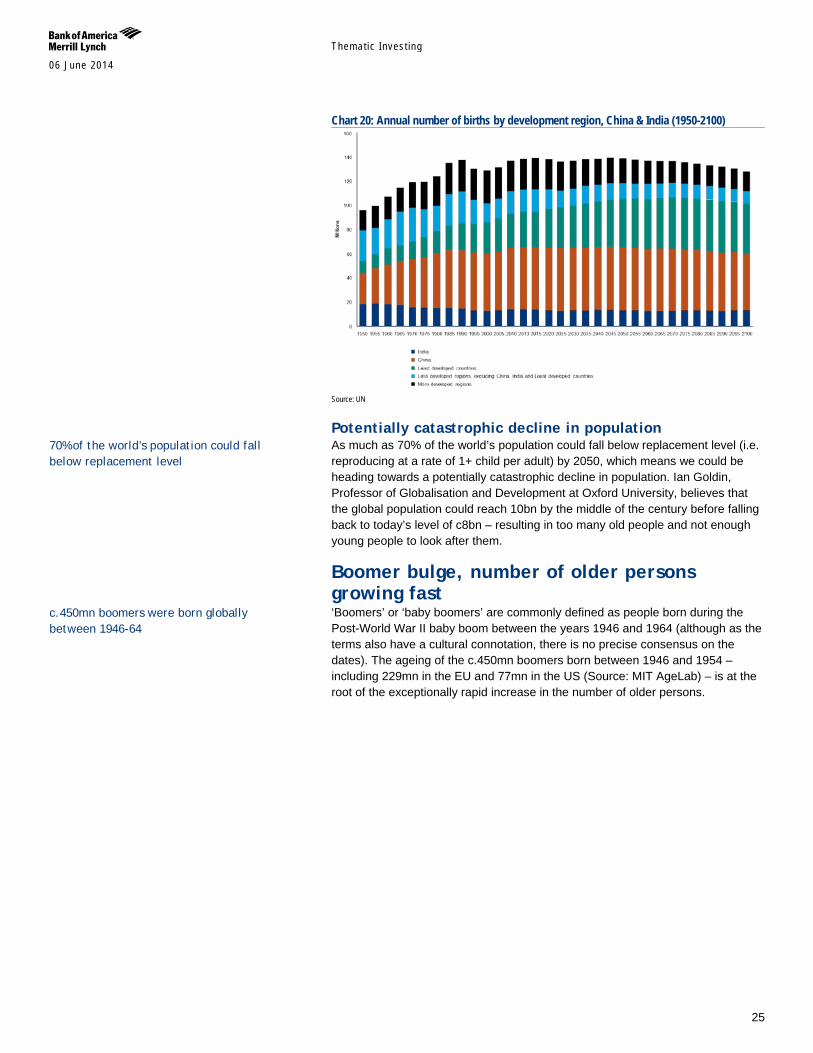
Chart 20: Annual number of births by development region, China & India (1950-2100)
Source: UN
Potentially catastrophic decline in population As much as 70% of the world’s population could fall below replacement level (i.e. reproducing at a rate of 1+ child per adult) by 2050, which means we could be heading towards a potentially catastrophic decline in population. Ian Goldin, Professor of Globalisation and Development at Oxford University, believes that the global population could reach 10bn by the middle of the century before falling back to today’s level of c8bn – resulting in too many old people and not enough young people to look after them.
Boomer bulge, number of older persons growing fast ‘Boomers’ or ‘baby boomers’ are commonly defined as people born during the Post-World War II baby boom between the years 1946 and 1964 (although as the terms also have a cultural connotation, there is no precise consensus on the dates). The ageing of the c.450mn boomers born between 1946 and 1954 – including 229mn in the EU and 77mn in the US (Source: MIT AgeLab) – is at the root of the exceptionally rapid increase in the number of older persons.
c.450mn boomers were born globally between 1946-64
70% of the world’s population could fall below replacement level
Themat ic Inves t ing 06 June 2014
26
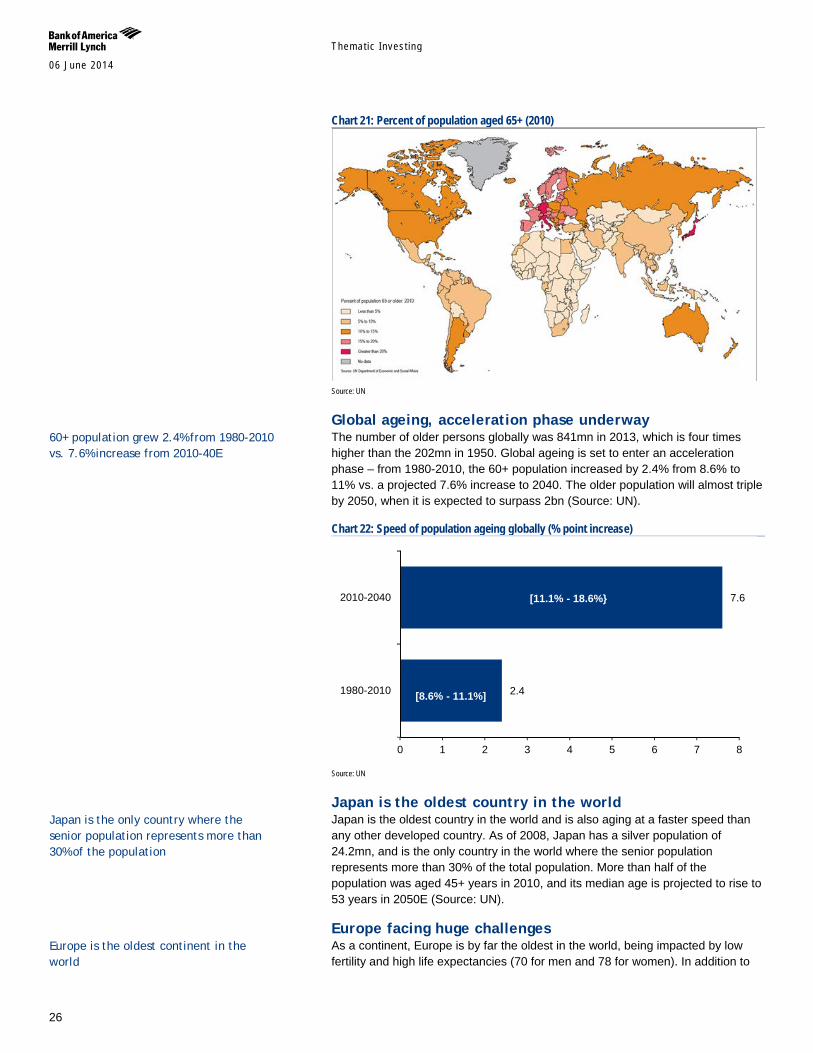
Chart 21: Percent of population aged 65+ (2010)
Source: UN
Global ageing, acceleration phase underway The number of older persons globally was 841mn in 2013, which is four times higher than the 202mn in 1950. Global ageing is set to enter an acceleration phase – from 1980-2010, the 60+ population increased by 2.4% from 8.6% to 11% vs. a projected 7.6% increase to 2040. The older population will almost triple by 2050, when it is expected to surpass 2bn (Source: UN).
Chart 22: Speed of population ageing globally (% point increase)
Source: UN
Japan is the oldest country in the world Japan is the oldest country in the world and is also aging at a faster speed than any other developed country. As of 2008, Japan has a silver population of 24.2mn, and is the only country in the world where the senior population represents more than 30% of the total population. More than half of the population was aged 45+ years in 2010, and its median age is projected to rise to 53 years in 2050E (Source: UN).
Europe facing huge challenges As a continent, Europe is by far the oldest in the world, being impacted by low fertility and high life expectancies (70 for men and 78 for women). In addition to
2.4
7.6
0 1 2 3 4 5 6 7 8
1980-2010
2010-2040
[8.6% - 11.1%]
[11.1% - 18.6%}
60+ population grew 2.4% from 1980-2010 vs. 7.6% increase from 2010-40E
Japan is the only country where the senior population represents more than 30% of the population
Europe is the oldest continent in the world
Themat ic Inves t ing 06 June 2014
27
Japan, Germany and Italy have the highest median ages in the world. By 2050E, Bosnia and Herzegovina, Germany, Malta, Portugal, Serbia and Spain are all projected to have median ages of 50+ (Source: UN).
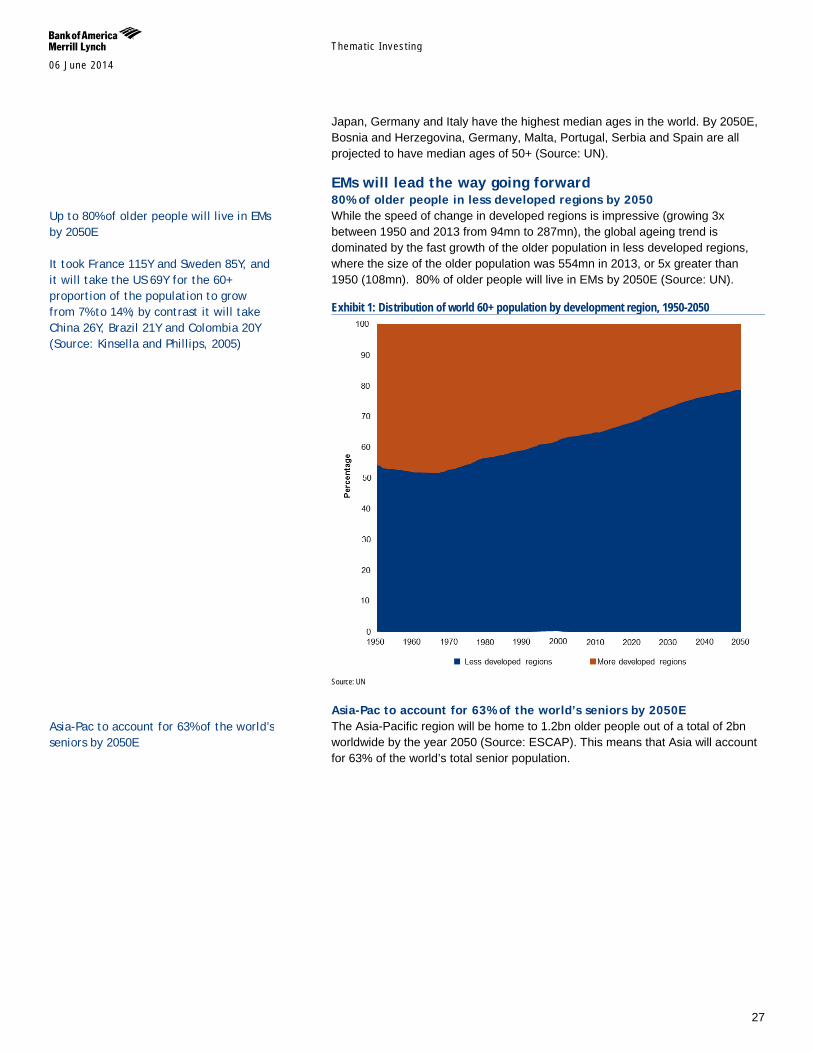
EMs will lead the way going forward 80% of older people in less developed regions by 2050 While the speed of change in developed regions is impressive (growing 3x between 1950 and 2013 from 94mn to 287mn), the global ageing trend is dominated by the fast growth of the older population in less developed regions, where the size of the older population was 554mn in 2013, or 5x greater than 1950 (108mn). 80% of older people will live in EMs by 2050E (Source: UN).
Exhibit 1: Distribution of world 60+ population by development region, 1950-2050
Source: UN
Asia-Pac to account for 63% of the world’s seniors by 2050E The Asia-Pacific region will be home to 1.2bn older people out of a total of 2bn worldwide by the year 2050 (Source: ESCAP). This means that Asia will account for 63% of the world’s total senior population.
Up to 80% of older people will live in EMs by 2050E It took France 115Y and Sweden 85Y, and it will take the US 69Y for the 60+ proportion of the population to grow from 7% to 14%; by contrast it will take China 26Y, Brazil 21Y and Colombia 20Y (Source: Kinsella and Phillips, 2005)
Asia-Pac to account for 63% of the world’s seniors by 2050E
Themat ic Inves t ing 06 June 2014
28
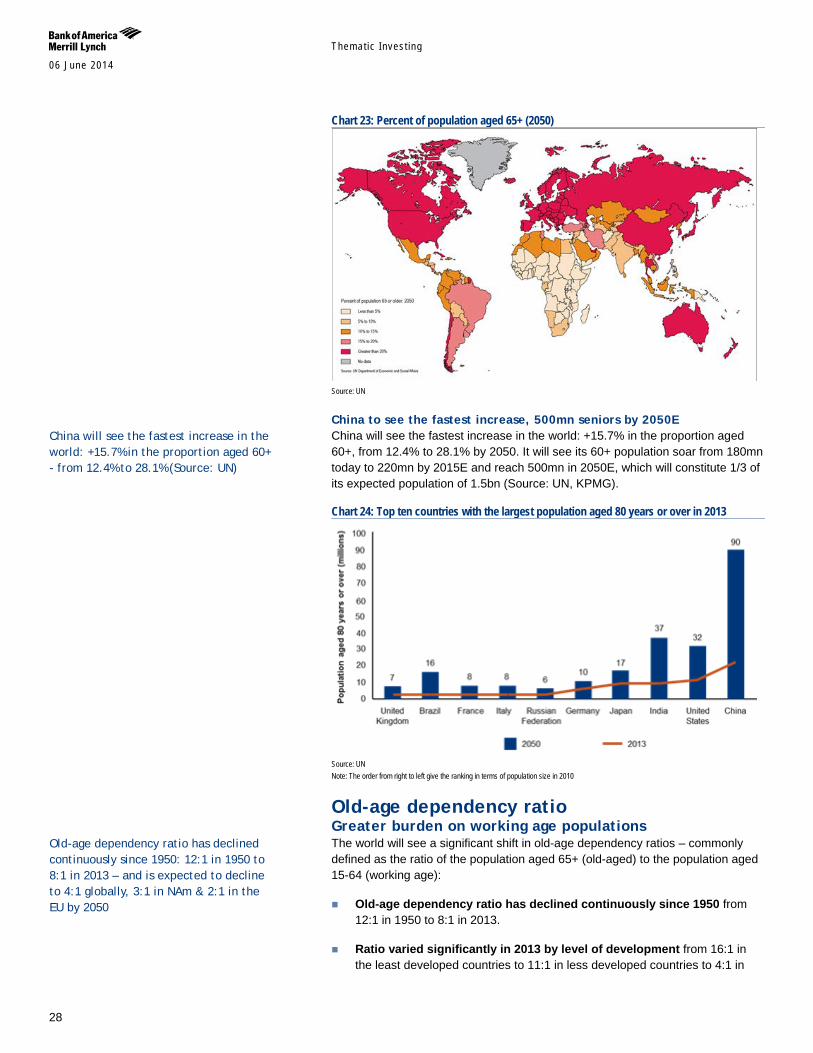
Chart 23: Percent of population aged 65+ (2050)
Source: UN
China to see the fastest increase, 500mn seniors by 2050E China will see the fastest increase in the world: +15.7% in the proportion aged 60+, from 12.4% to 28.1% by 2050. It will see its 60+ population soar from 180mn today to 220mn by 2015E and reach 500mn in 2050E, which will constitute 1/3 of its expected population of 1.5bn (Source: UN, KPMG).
Chart 24: Top ten countries with the largest population aged 80 years or over in 2013
Source: UN Note: The order from right to left give the ranking in terms of population size in 2010
Old-age dependency ratio Greater burden on working age populations The world will see a significant shift in old-age dependency ratios – commonly defined as the ratio of the population aged 65+ (old-aged) to the population aged 15-64 (working age):
Old-age dependency ratio has declined continuously since 1950 from 12:1 in 1950 to 8:1 in 2013.
Ratio varied significantly in 2013 by level of development from 16:1 in the least developed countries to 11:1 in less developed countries to 4:1 in
China will see the fastest increase in the world: +15.7% in the proportion aged 60+ - from 12.4% to 28.1% (Source: UN)
Old-age dependency ratio has declined continuously since 1950: 12:1 in 1950 to 8:1 in 2013 – and is expected to decline to 4:1 globally, 3:1 in NAm & 2:1 in the EU by 2050
Themat ic Inves t ing 06 June 2014
29
more developed countries.
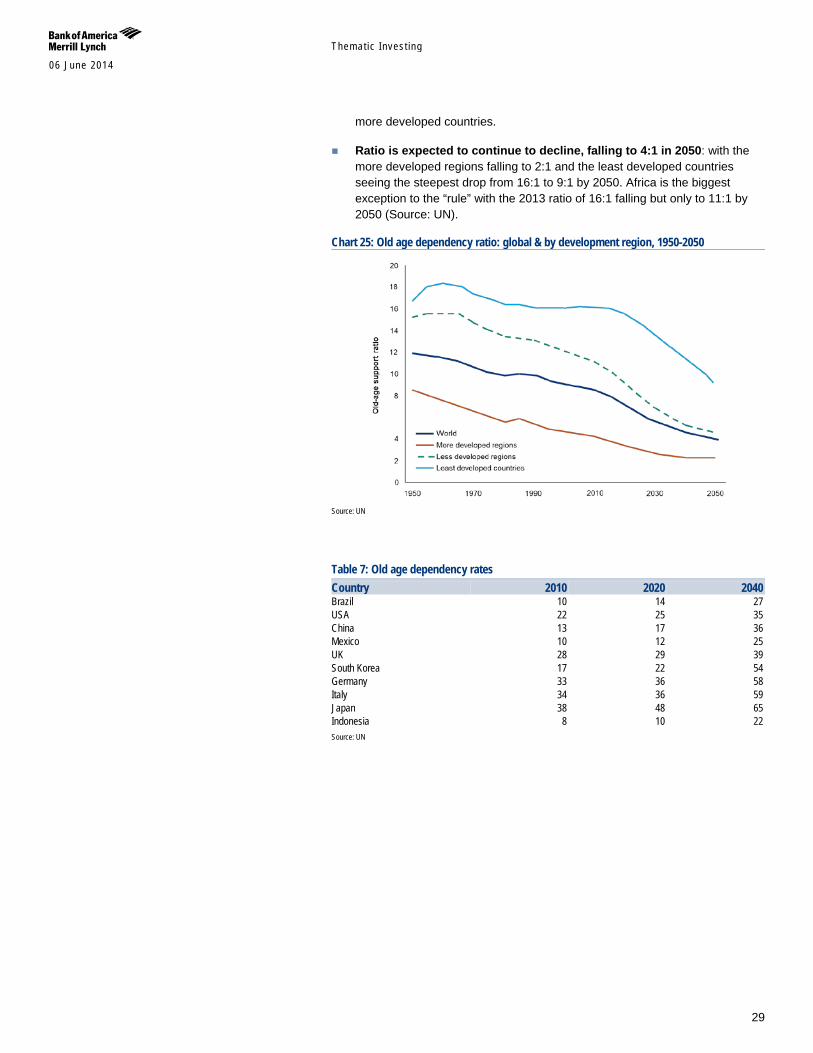
Ratio is expected to continue to decline, falling to 4:1 in 2050: with the more developed regions falling to 2:1 and the least developed countries seeing the steepest drop from 16:1 to 9:1 by 2050. Africa is the biggest exception to the “rule” with the 2013 ratio of 16:1 falling but only to 11:1 by 2050 (Source: UN).
Chart 25: Old age dependency ratio: global & by development region, 1950-2050
Source: UN
Table 7: Old age dependency rates Country 2010 2020 2040 Brazil 10 14 27 USA 22 25 35 China 13 17 36 Mexico 10 12 25 UK 28 29 39 South Korea 17 22 54 Germany 33 36 58 Italy 34 36 59 Japan 38 48 65 Indonesia 8 10 22 Source: UN
Themat ic Inves t ing 06 June 2014
30
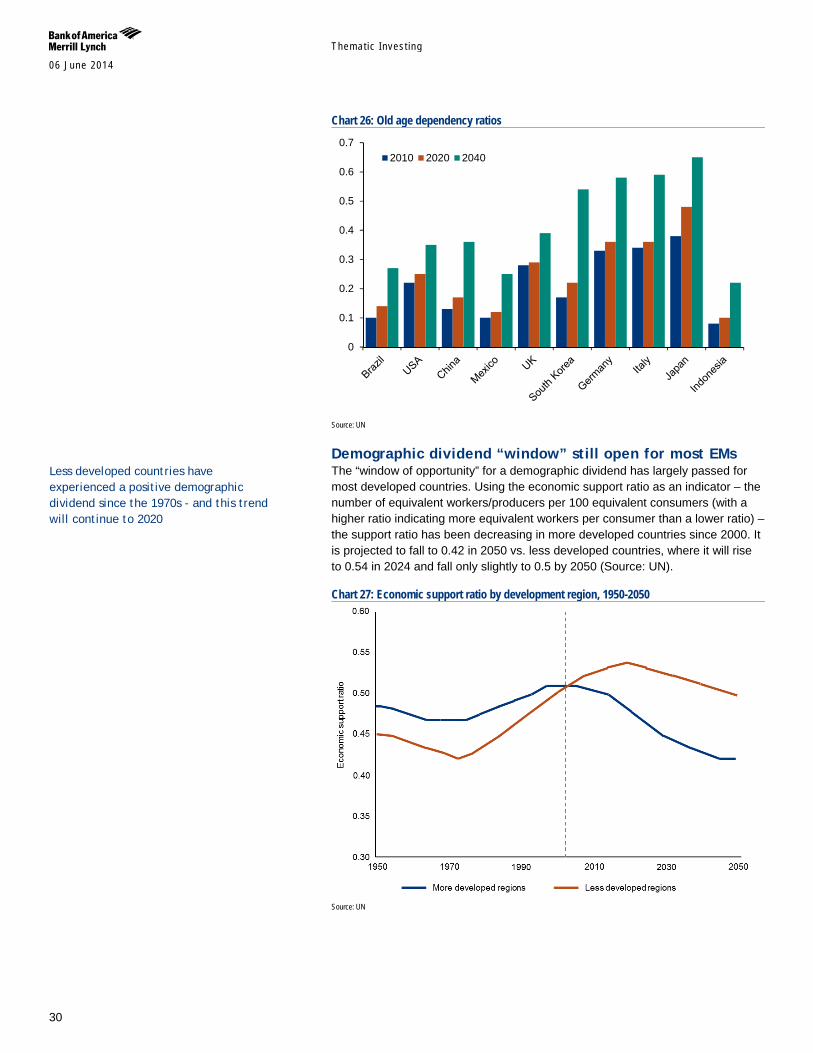
Chart 26: Old age dependency ratios
Source: UN
Demographic dividend “window” still open for most EMs The “window of opportunity” for a demographic dividend has largely passed for most developed countries. Using the economic support ratio as an indicator – the number of equivalent workers/producers per 100 equivalent consumers (with a higher ratio indicating more equivalent workers per consumer than a lower ratio) – the support ratio has been decreasing in more developed countries since 2000. It is projected to fall to 0.42 in 2050 vs. less developed countries, where it will rise to 0.54 in 2024 and fall only slightly to 0.5 by 2050 (Source: UN).
Chart 27: Economic support ratio by development region, 1950-2050
Source: UN
0
0.1
0.2
0.3
0.4
0.5
0.6
0.72010 2020 2040
Less developed countries have experienced a positive demographic dividend since the 1970s - and this trend will continue to 2020
Themat ic Inves t ing 06 June 2014
31
Even countries with younger populations need to prepare That said, even countries with a relatively lower old-age dependency ratio, such as India, Indonesia, and Nigeria, need to prepare for 60+ population growth of up to 200% between 2010 and 2040 (Source: UN).
Table 8: “Young” EMs facing ageing challenge
Country Number of Millions
over 60, 2010 Number of millions
over 60, 2040 Growth in total 60+ population
India 92,663,000 250,213,000 170% Indonesia 19,585,000 60,624,000 210% Nigeria 8,358,000 20,101,000 141% Philippines 5,350,000 17,475,000 227% Vietnam 7,350,000 25,017,000 240% Ethiopia 4,345,000 11,862,000 173% Egypt 6,509,000 17,819,000 174% Source: UN, BofA Merrill Lynch Global Research
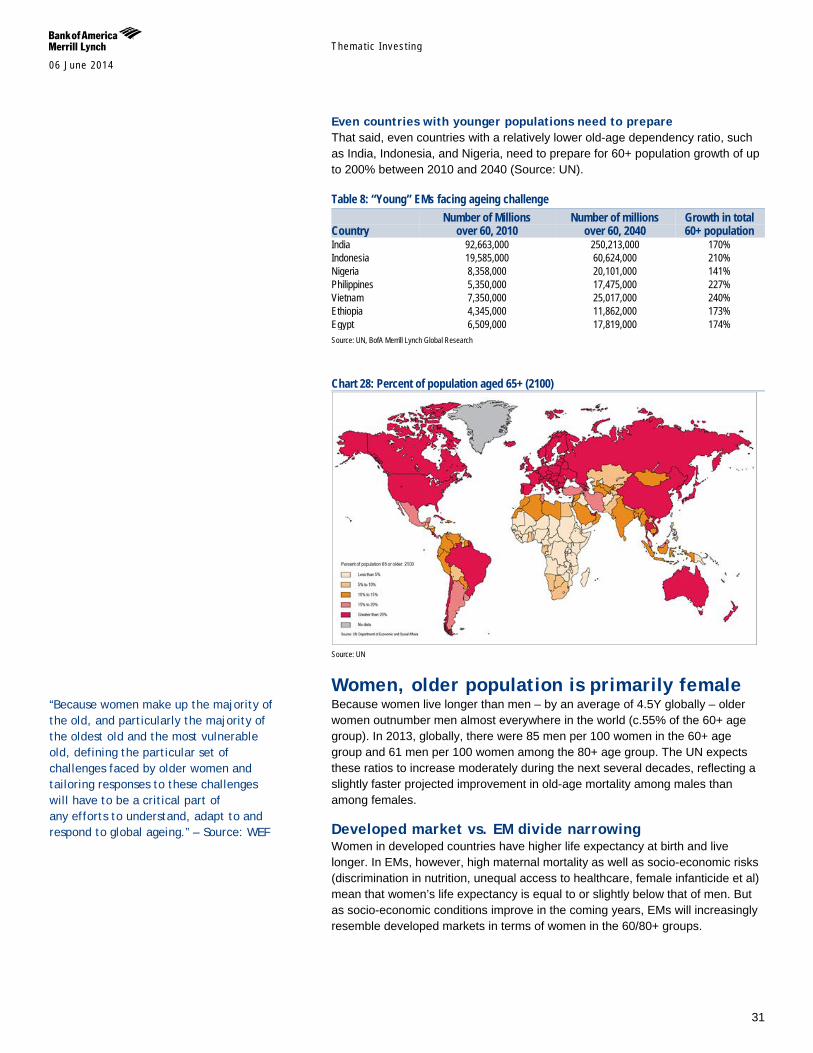
Chart 28: Percent of population aged 65+ (2100)
Source: UN
Women, older population is primarily female Because women live longer than men – by an average of 4.5Y globally – older women outnumber men almost everywhere in the world (c.55% of the 60+ age group). In 2013, globally, there were 85 men per 100 women in the 60+ age group and 61 men per 100 women among the 80+ age group. The UN expects these ratios to increase moderately during the next several decades, reflecting a slightly faster projected improvement in old-age mortality among males than among females.
Developed market vs. EM divide narrowing Women in developed countries have higher life expectancy at birth and live longer. In EMs, however, high maternal mortality as well as socio-economic risks (discrimination in nutrition, unequal access to healthcare, female infanticide et al) mean that women’s life expectancy is equal to or slightly below that of men. But as socio-economic conditions improve in the coming years, EMs will increasingly resemble developed markets in terms of women in the 60/80+ groups.
“Because women make up the majority of the old, and particularly the majority of the oldest old and the most vulnerable old, defining the particular set of challenges faced by older women and tailoring responses to these challenges will have to be a critical part of any efforts to understand, adapt to and respond to global ageing.” – Source: WEF
Themat ic Inves t ing 06 June 2014
32
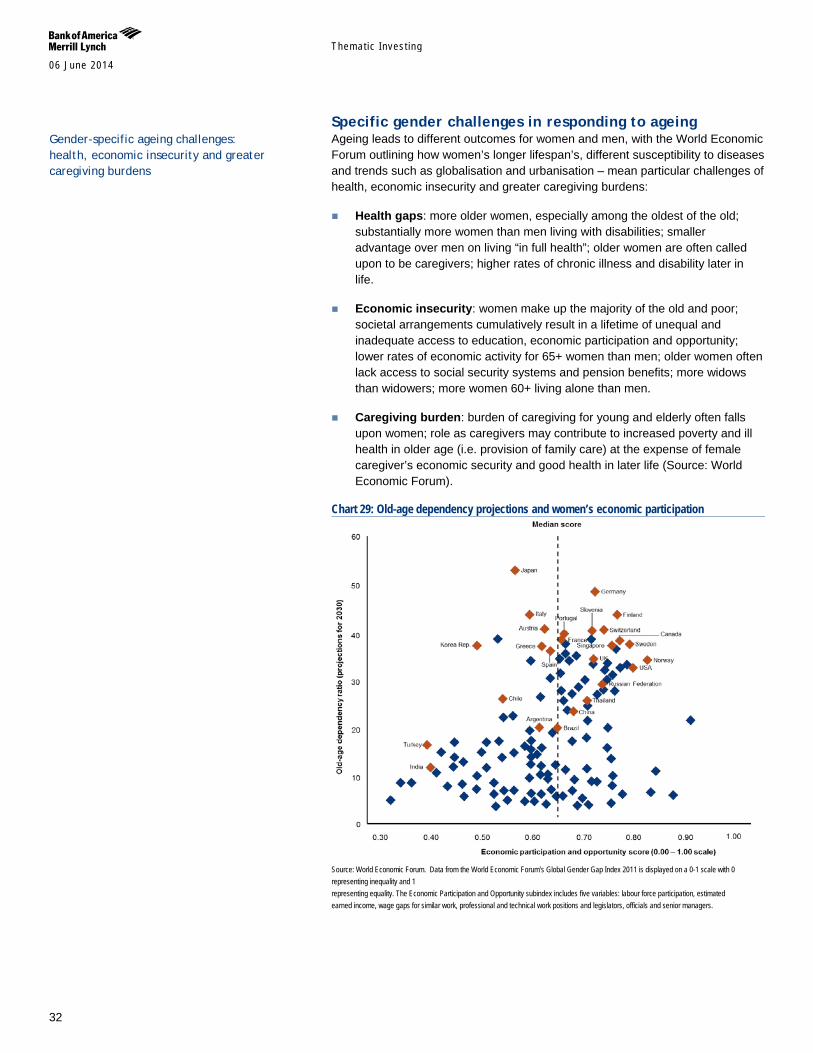
Specific gender challenges in responding to ageing Ageing leads to different outcomes for women and men, with the World Economic Forum outlining how women’s longer lifespan’s, different susceptibility to diseases and trends such as globalisation and urbanisation – mean particular challenges of health, economic insecurity and greater caregiving burdens:
Health gaps: more older women, especially among the oldest of the old; substantially more women than men living with disabilities; smaller advantage over men on living “in full health”; older women are often called upon to be caregivers; higher rates of chronic illness and disability later in life.
Economic insecurity: women make up the majority of the old and poor; societal arrangements cumulatively result in a lifetime of unequal and inadequate access to education, economic participation and opportunity; lower rates of economic activity for 65+ women than men; older women often lack access to social security systems and pension benefits; more widows than widowers; more women 60+ living alone than men.
Caregiving burden: burden of caregiving for young and elderly often falls upon women; role as caregivers may contribute to increased poverty and ill health in older age (i.e. provision of family care) at the expense of female caregiver’s economic security and good health in later life (Source: World Economic Forum).
Chart 29: Old-age dependency projections and women’s economic participation
Source: World Economic Forum. Data from the World Economic Forum’s Global Gender Gap Index 2011 is displayed on a 0-1 scale with 0 representing inequality and 1 representing equality. The Economic Participation and Opportunity subindex includes five variables: labour force participation, estimated earned income, wage gaps for similar work, professional and technical work positions and legislators, officials and senior managers.
Gender-specific ageing challenges: health, economic insecurity and greater caregiving burdens
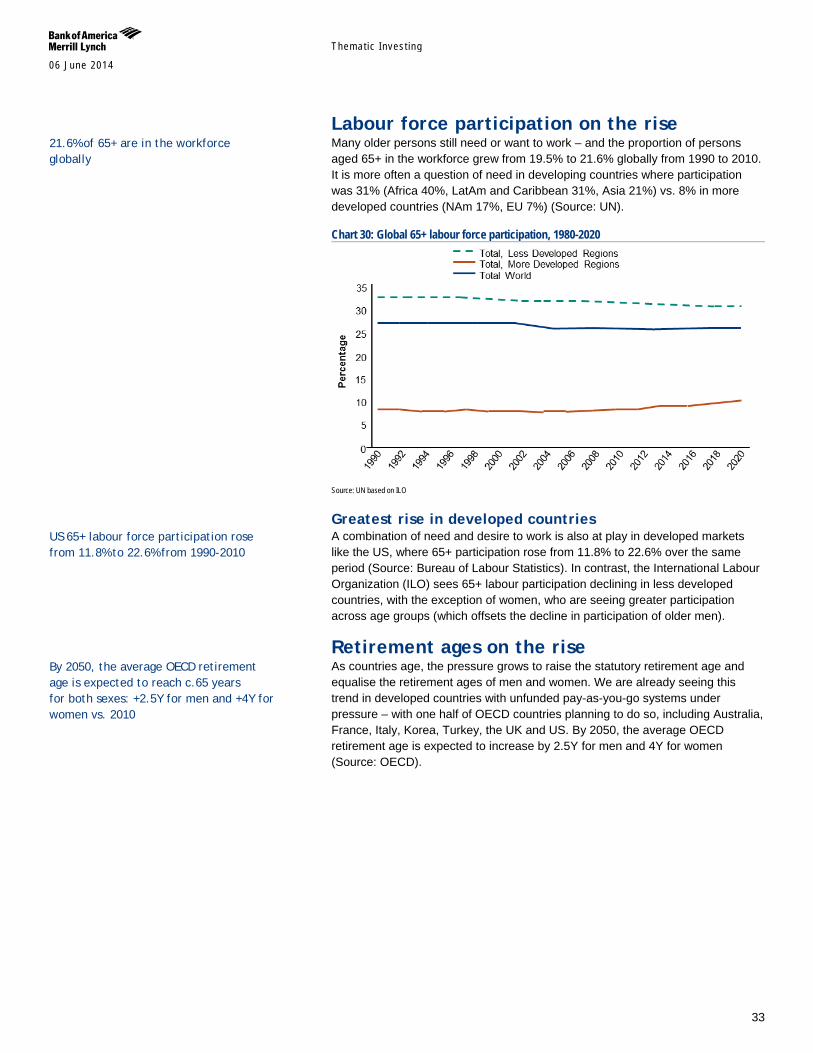
Themat ic Inves t ing 06 June 2014
33
Labour force participation on the rise Many older persons still need or want to work – and the proportion of persons aged 65+ in the workforce grew from 19.5% to 21.6% globally from 1990 to 2010. It is more often a question of need in developing countries where participation was 31% (Africa 40%, LatAm and Caribbean 31%, Asia 21%) vs. 8% in more developed countries (NAm 17%, EU 7%) (Source: UN).
Chart 30: Global 65+ labour force participation, 1980-2020
Source: UN based on ILO
Greatest rise in developed countries A combination of need and desire to work is also at play in developed markets like the US, where 65+ participation rose from 11.8% to 22.6% over the same period (Source: Bureau of Labour Statistics). In contrast, the International Labour Organization (ILO) sees 65+ labour participation declining in less developed countries, with the exception of women, who are seeing greater participation across age groups (which offsets the decline in participation of older men).
Retirement ages on the rise As countries age, the pressure grows to raise the statutory retirement age and equalise the retirement ages of men and women. We are already seeing this trend in developed countries with unfunded pay-as-you-go systems under pressure – with one half of OECD countries planning to do so, including Australia, France, Italy, Korea, Turkey, the UK and US. By 2050, the average OECD retirement age is expected to increase by 2.5Y for men and 4Y for women (Source: OECD).
21.6% of 65+ are in the workforce globally
By 2050, the average OECD retirement age is expected to reach c.65 years for both sexes: +2.5Y for men and +4Y for women vs. 2010
US 65+ labour force participation rose from 11.8% to 22.6% from 1990-2010
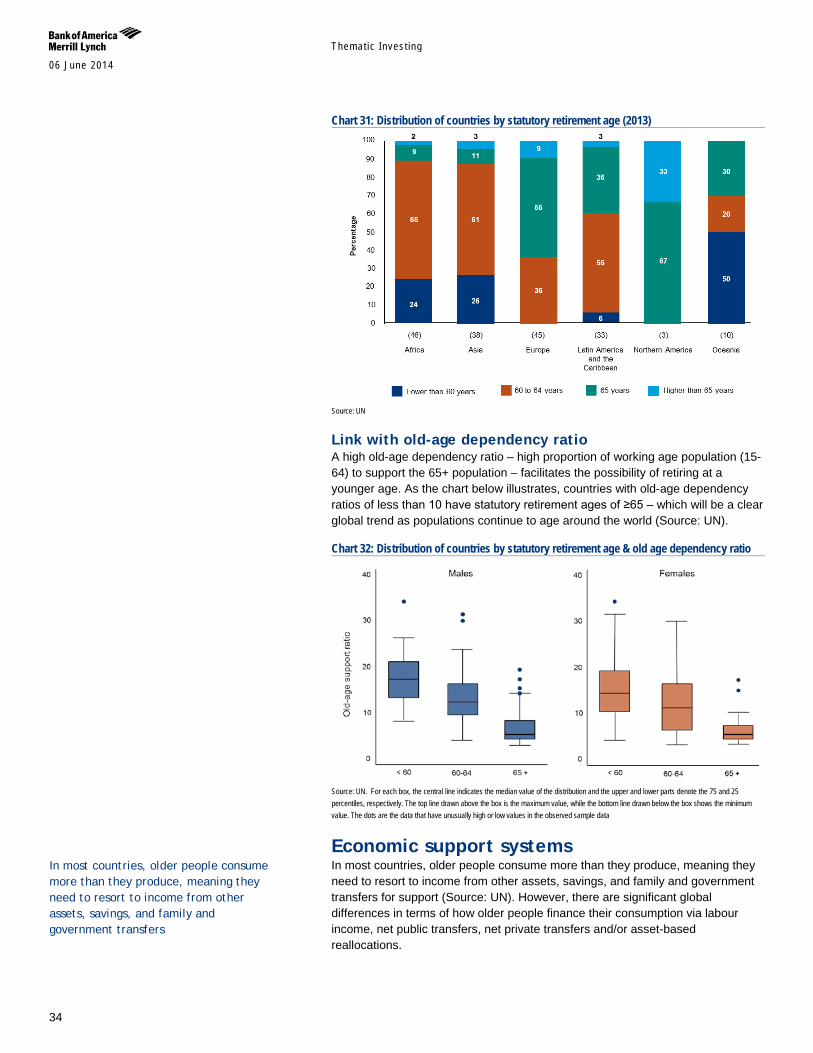
Themat ic Inves t ing 06 June 2014
34
Chart 31: Distribution of countries by statutory retirement age (2013)
Source: UN
Link with old-age dependency ratio A high old-age dependency ratio – high proportion of working age population (15-64) to support the 65+ population – facilitates the possibility of retiring at a younger age. As the chart below illustrates, countries with old-age dependency ratios of less than 10 have statutory retirement ages of ≥65 – which will be a clear global trend as populations continue to age around the world (Source: UN).
Chart 32: Distribution of countries by statutory retirement age & old age dependency ratio
Source: UN. For each box, the central line indicates the median value of the distribution and the upper and lower parts denote the 75 and 25 percentiles, respectively. The top line drawn above the box is the maximum value, while the bottom line drawn below the box shows the minimum value. The dots are the data that have unusually high or low values in the observed sample data
Economic support systems In most countries, older people consume more than they produce, meaning they need to resort to income from other assets, savings, and family and government transfers for support (Source: UN). However, there are significant global differences in terms of how older people finance their consumption via labour income, net public transfers, net private transfers and/or asset-based reallocations.
In most countries, older people consume more than they produce, meaning they need to resort to income from other assets, savings, and family and government transfers

Themat ic Inves t ing 06 June 2014
35
Labour income, working to finance consumption For persons aged 55-64, labour income (employment earnings and self-employment income) is the primary source of support as they are largely still working – accounting for 90-100% of consumption in more developed countries and 75-100% in less developed countries. For the 65-69 age group, reliance on labour income falls significantly – to as low <10% in many developed countries vs. >45% in the majority of developing countries. For the 70+, labour income finances less than 25% of consumption globally (Source: UN).
Net public transfers, major source in developed markets Public transfers via formal government programmes (e.g. health care, public safety, pensions, cash allowances) are a major source of post-retirement income security – accounting for >50% of older persons’ consumption in one half of developed countries (30-50% in US and Japan, vs. 100% in Sweden). Such transfers play a smaller role in EMs (Source: UN).
Family transfers, older persons are net givers Private transfers from family members are especially important where social security systems and financial markets are either weak or non-existent. However, contrary to common assumption, older persons tend to be net givers of private transfers – i.e. they give more than they receive – in most countries:
Not surprising for developed countries: because of a combination of a string of social security systems, higher incomes, accumulated lifetime savings and/or assets. In markets like the US, Spain and Sweden, older persons are net givers well into their old age, while in Japan, older persons become net receivers after turning 70.
But also true for most EMs either because of economies being dominated by the informal sector (Mexico, Indonesia, Philippines), extended living arrangements, or generous public transfers (LatAm). However, private transfers are an important source of old-age income in Asia (China, Korea, Singapore, and Thailand), where cultural values of filial obligation and inter-generational co-residence are still the norm (Source: UN).
Assets, strong regional disparities Asset-based transfers – including net asset income and dis-savings (e.g. interest, profits, dividends, imputed rent) – vary widely by region from <1% of support in old age (Hungary, Sweden) to >66% (Indonesia, Mexico). They account for 10-20% of transfers in the EU (ex-Germany and Spain), one third to two thirds in LatAm, and much higher levels in regions with less generous or extended public transfer systems (US, Japan, Mexico, Asia) (Source: UN).
Employment income accounts for 10-45% of support for 65-69Y olds and <25% for 70Y+ globally
Public transfers account for >50% of support for older persons in half of developed countries
Older persons are net givers well into old age in US, Spain & Sweden
Cultural values & practices mean family transfers remain an important source of support in Asia
Assets tend to be a major source of old-age support in countries with limited public transfer systems
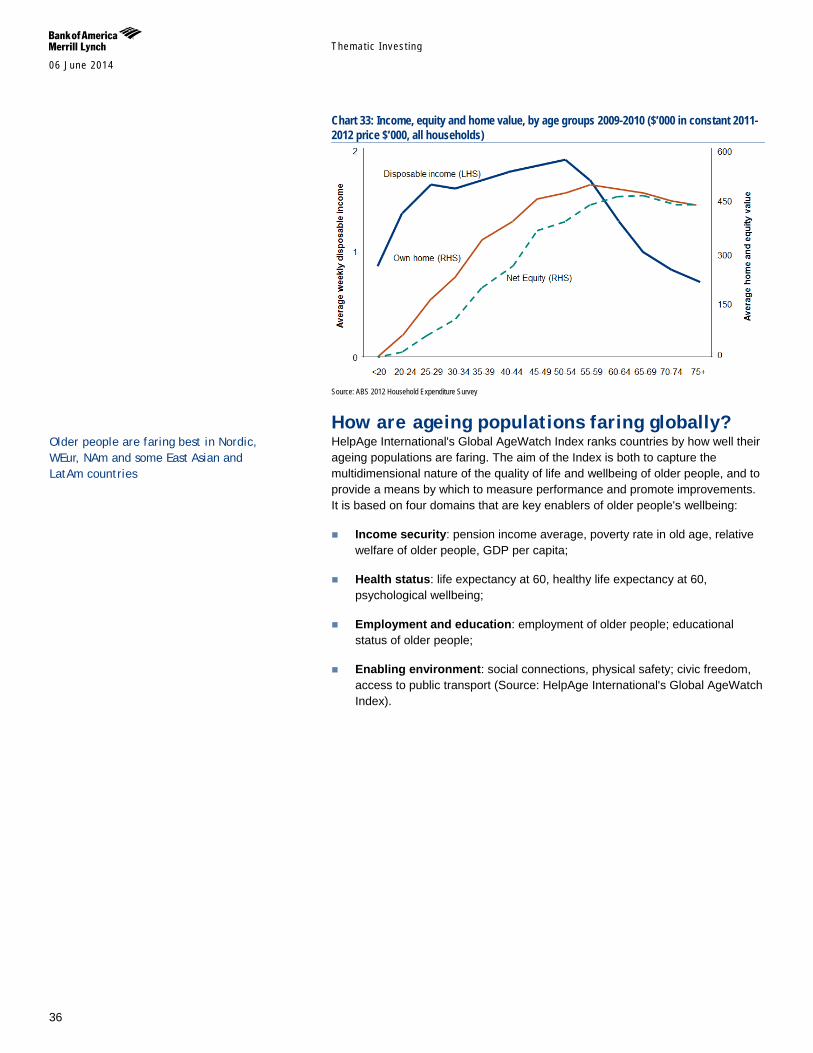
Themat ic Inves t ing 06 June 2014
36
Chart 33: Income, equity and home value, by age groups 2009-2010 ($’000 in constant 2011-2012 price $’000, all households)
Source: ABS 2012 Household Expenditure Survey
How are ageing populations faring globally? HelpAge International's Global AgeWatch Index ranks countries by how well their ageing populations are faring. The aim of the Index is both to capture the multidimensional nature of the quality of life and wellbeing of older people, and to provide a means by which to measure performance and promote improvements. It is based on four domains that are key enablers of older people's wellbeing:
Income security: pension income average, poverty rate in old age, relative welfare of older people, GDP per capita;
Health status: life expectancy at 60, healthy life expectancy at 60, psychological wellbeing;
Employment and education: employment of older people; educational status of older people;
Enabling environment: social connections, physical safety; civic freedom, access to public transport (Source: HelpAge International's Global AgeWatch Index).
Older people are faring best in Nordic, WEur, NAm and some East Asian and LatAm countries
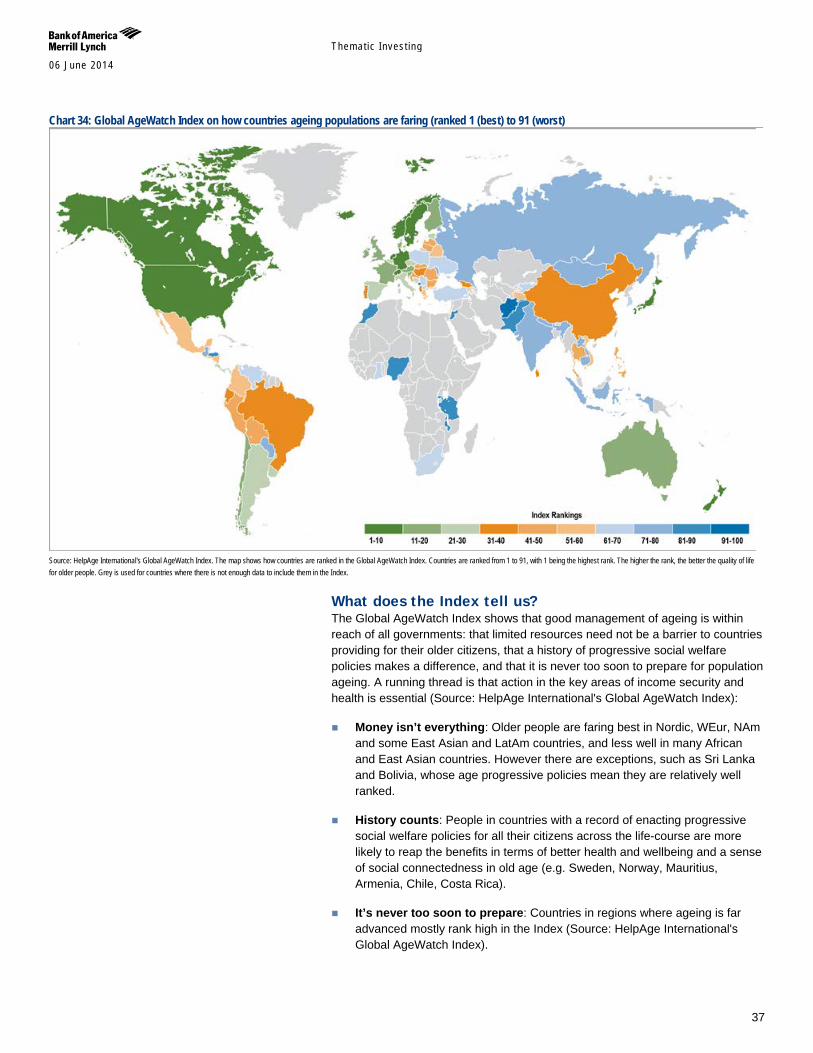
Themat ic Inves t ing 06 June 2014
37
Chart 34: Global AgeWatch Index on how countries ageing populations are faring (ranked 1 (best) to 91 (worst)
Source: HelpAge International's Global AgeWatch Index. The map shows how countries are ranked in the Global AgeWatch Index. Countries are ranked from 1 to 91, with 1 being the highest rank. The higher the rank, the better the quality of life for older people. Grey is used for countries where there is not enough data to include them in the Index.
What does the Index tell us? The Global AgeWatch Index shows that good management of ageing is within reach of all governments: that limited resources need not be a barrier to countries providing for their older citizens, that a history of progressive social welfare policies makes a difference, and that it is never too soon to prepare for population ageing. A running thread is that action in the key areas of income security and health is essential (Source: HelpAge International's Global AgeWatch Index):
Money isn’t everything: Older people are faring best in Nordic, WEur, NAm and some East Asian and LatAm countries, and less well in many African and East Asian countries. However there are exceptions, such as Sri Lanka and Bolivia, whose age progressive policies mean they are relatively well ranked.
History counts: People in countries with a record of enacting progressive social welfare policies for all their citizens across the life-course are more likely to reap the benefits in terms of better health and wellbeing and a sense of social connectedness in old age (e.g. Sweden, Norway, Mauritius, Armenia, Chile, Costa Rica).
It’s never too soon to prepare: Countries in regions where ageing is far advanced mostly rank high in the Index (Source: HelpAge International's Global AgeWatch Index).
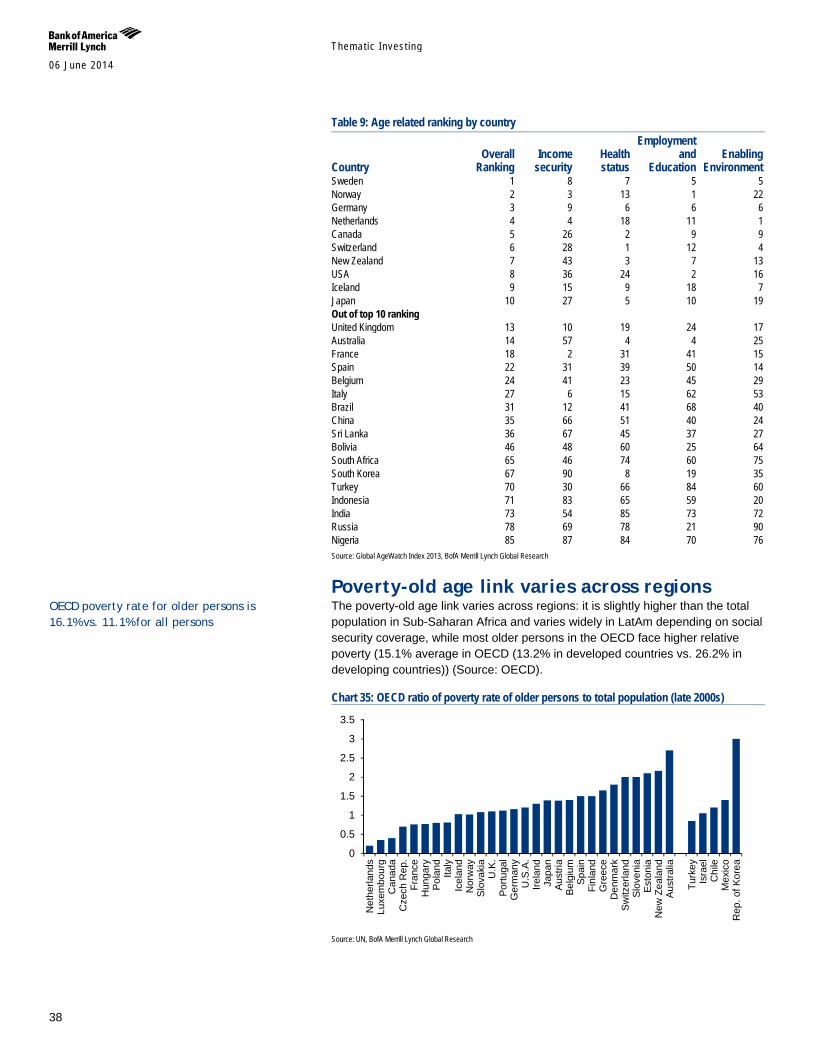
Themat ic Inves t ing 06 June 2014
38
Table 9: Age related ranking by country
Country Overall
Ranking Income
security Health status
Employment and
Education Enabling
Environment Sweden 1 8 7 5 5 Norway 2 3 13 1 22 Germany 3 9 6 6 6 Netherlands 4 4 18 11 1 Canada 5 26 2 9 9 Switzerland 6 28 1 12 4 New Zealand 7 43 3 7 13 USA 8 36 24 2 16 Iceland 9 15 9 18 7 Japan 10 27 5 10 19 Out of top 10 ranking United Kingdom 13 10 19 24 17 Australia 14 57 4 4 25 France 18 2 31 41 15 Spain 22 31 39 50 14 Belgium 24 41 23 45 29 Italy 27 6 15 62 53 Brazil 31 12 41 68 40 China 35 66 51 40 24 Sri Lanka 36 67 45 37 27 Bolivia 46 48 60 25 64 South Africa 65 46 74 60 75 South Korea 67 90 8 19 35 Turkey 70 30 66 84 60 Indonesia 71 83 65 59 20 India 73 54 85 73 72 Russia 78 69 78 21 90 Nigeria 85 87 84 70 76 Source: Global AgeWatch Index 2013, BofA Merrill Lynch Global Research
Poverty-old age link varies across regions The poverty-old age link varies across regions: it is slightly higher than the total population in Sub-Saharan Africa and varies widely in LatAm depending on social security coverage, while most older persons in the OECD face higher relative poverty (15.1% average in OECD (13.2% in developed countries vs. 26.2% in developing countries)) (Source: OECD).
Chart 35: OECD ratio of poverty rate of older persons to total population (late 2000s)
Source: UN, BofA Merrill Lynch Global Research
0
0.5
1
1.5
2
2.5
3
3.5
Net
herla
nds
Luxe
mbo
urg
Can
ada
Cze
ch R
ep.
Fran
ceH
unga
ryPo
land
Italy
Icel
and
Nor
way
Slov
akia
U.K
.Po
rtuga
lG
erm
any
U.S
.A.
Irela
ndJa
pan
Aust
riaBe
lgiu
mSp
ain
Finl
and
Gre
ece
Den
mar
kSw
itzer
land
Slov
enia
Esto
nia
New
Zea
land
Aust
ralia
Turk
eyIs
rael
Chi
leM
exic
oR
ep. o
f Kor
ea
OECD poverty rate for older persons is 16.1% vs. 11.1% for all persons
Themat ic Inves t ing 06 June 2014
39
The longevity economy, US$15tn+ by 2020E The longevity economy is becoming an increasingly powerful force – encompassing both the economic activity serving the needs and wants of the 50+ global population, as well as directly purchased products and services, and the knock-on economic activity that this generates (jobs, wages, productivity, taxes, charitable giving, etc).
The size of the US longevity economy alone is estimated at US$7.1tn, making it the world’s #3 economy. This segment of the economy is expected to grow to account for over 50% of US and Japanese GDP by the 2030s (Source: Oxford Economics, NLI Research Institute). While we are careful about extrapolating such data globally, we are seeing similar trends in other countries with ageing populations.
The spending power of consumers aged 60+ will reach US$15tn+ globally by 2020E (Source: Euromonitor). This reflects their high net worth, with US households headed by someone aged 50+ averaging US$765,000, and in the UK £541,000 (Source: Oxford Economics; PFRC-ILC UK). It also reflects their unprecedented spending power, with boomers accounting for c.60% of US consumer spending and c.50% of UK spending (Source: AARP, Saga). They also drive the healthcare industry, accounting for 73% of US spending (Source: Oxford Economics).
The importance of the silver dollar will grow as the over 50s become the fastest-growing demographic globally (Source: UN). For instance, there are more boomers in the US alone than the combined populations of the UK, Switzerland and Israel. The demographic drivers we discussed earlier – including increasing life expectancy, raised retirement ages, longer working lives and inheritance – will further boost the incomes and spending power of older consumers.
We need to remember that ageing has its costs notably in terms of financial insecurity vis-à-vis older people’s dependence on social benefits and the decline of employer-based pensions (Source: Oxford Economics) as well as healthcare costs, which are expected to double by 2020 (Source: AARP). It is also important to note that many older people are conservative consumers or burdened by bills – and the very real issues they face should not be forgotten (Source: PFRC-ILC UK).
Companies need to develop effective strategies to address the longevity economy. The two main strategies used to date are (1) explicitly targeting the 50+ market with products and services specifically designed for segments of that market; and (2) maximising market opportunities by expanding into the 50+ market. Additional strategies include age-, design-, and message-targeted approaches and modifications for products and services for older consumers (Source: AARP).
What is the longevity economy? The longevity economy represents the sum of all economic activity serving the needs of those aged 50+ including both the products and services they purchase directly and the further economic activity this spending generates (Source: Oxford Economics). The American Association of Retired Persons (AARP)’s non-
The Longevity Economy is refuting the conventional wisdom that consumers over 50 spend less. In fact, they spend more than any other age group, and will increasingly challenge businesses to win their attention (Source: Oxford Economics) “This phenomenon presents a unique opportunity for individuals, corporations, and governments to find new, smarter ways to live, work, and prepare for a future with a significantly greater proportion of the population over the age of 60” – Global Coalition on Aging
Sum of all economic activity serving the needs of those aged 50+ including both the products and services they purchase directly & the further economic activity this spending generates
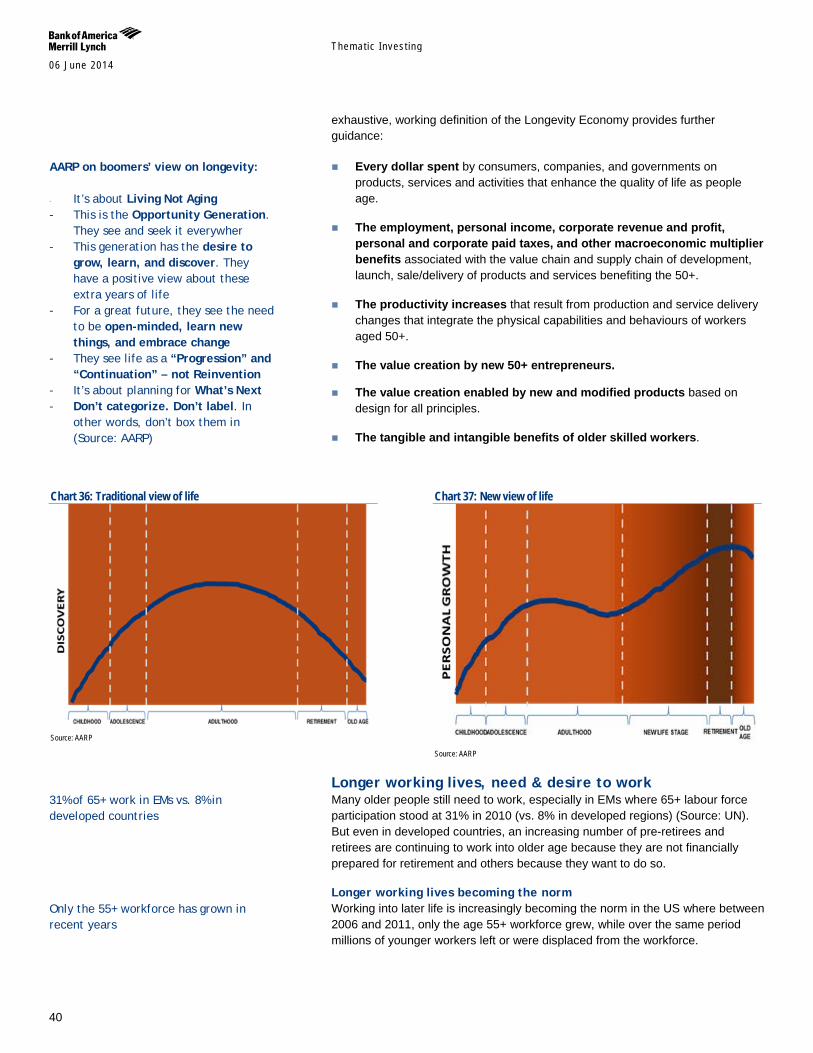
Themat ic Inves t ing 06 June 2014
40
exhaustive, working definition of the Longevity Economy provides further guidance:
Every dollar spent by consumers, companies, and governments on products, services and activities that enhance the quality of life as people age.
The employment, personal income, corporate revenue and profit, personal and corporate paid taxes, and other macroeconomic multiplier benefits associated with the value chain and supply chain of development, launch, sale/delivery of products and services benefiting the 50+.
The productivity increases that result from production and service delivery changes that integrate the physical capabilities and behaviours of workers aged 50+.
The value creation by new 50+ entrepreneurs.
The value creation enabled by new and modified products based on design for all principles.
The tangible and intangible benefits of older skilled workers.
Chart 36: Traditional view of life
Source: AARP
Chart 37: New view of life
Source: AARP
Longer working lives, need & desire to work Many older people still need to work, especially in EMs where 65+ labour force participation stood at 31% in 2010 (vs. 8% in developed regions) (Source: UN). But even in developed countries, an increasing number of pre-retirees and retirees are continuing to work into older age because they are not financially prepared for retirement and others because they want to do so.
Longer working lives becoming the norm Working into later life is increasingly becoming the norm in the US where between 2006 and 2011, only the age 55+ workforce grew, while over the same period millions of younger workers left or were displaced from the workforce.
AARP on boomers’ view on longevity:
- It’s about Living Not Aging
- This is the Opportunity Generation. They see and seek it everywher
- This generation has the desire to grow, learn, and discover. They have a positive view about these extra years of life
- For a great future, they see the need to be open-minded, learn new things, and embrace change
- They see life as a “Progression” and “Continuation” – not Reinvention
- It’s about planning for What’s Next - Don’t categorize. Don’t label. In
other words, don’t box them in (Source: AARP)
31% of 65+ work in EMs vs. 8% in developed countries
Only the 55+ workforce has grown in recent years
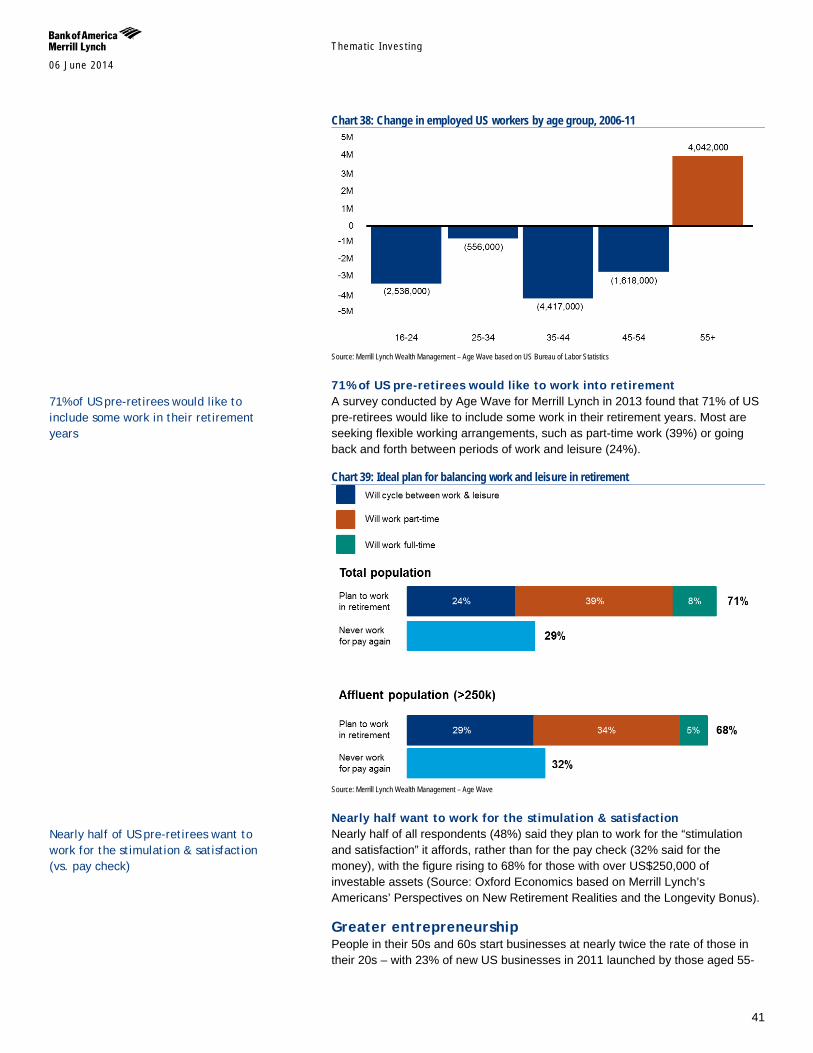
Themat ic Inves t ing 06 June 2014
41
Chart 38: Change in employed US workers by age group, 2006-11
Source: Merrill Lynch Wealth Management – Age Wave based on US Bureau of Labor Statistics
71% of US pre-retirees would like to work into retirement A survey conducted by Age Wave for Merrill Lynch in 2013 found that 71% of US pre-retirees would like to include some work in their retirement years. Most are seeking flexible working arrangements, such as part-time work (39%) or going back and forth between periods of work and leisure (24%).
Chart 39: Ideal plan for balancing work and leisure in retirement
Source: Merrill Lynch Wealth Management – Age Wave
Nearly half want to work for the stimulation & satisfaction Nearly half of all respondents (48%) said they plan to work for the “stimulation and satisfaction” it affords, rather than for the pay check (32% said for the money), with the figure rising to 68% for those with over US$250,000 of investable assets (Source: Oxford Economics based on Merrill Lynch’s Americans’ Perspectives on New Retirement Realities and the Longevity Bonus).
Greater entrepreneurship People in their 50s and 60s start businesses at nearly twice the rate of those in their 20s – with 23% of new US businesses in 2011 launched by those aged 55-
71% of US pre-retirees would like to include some work in their retirement years
Nearly half of US pre-retirees want to work for the stimulation & satisfaction (vs. pay check)
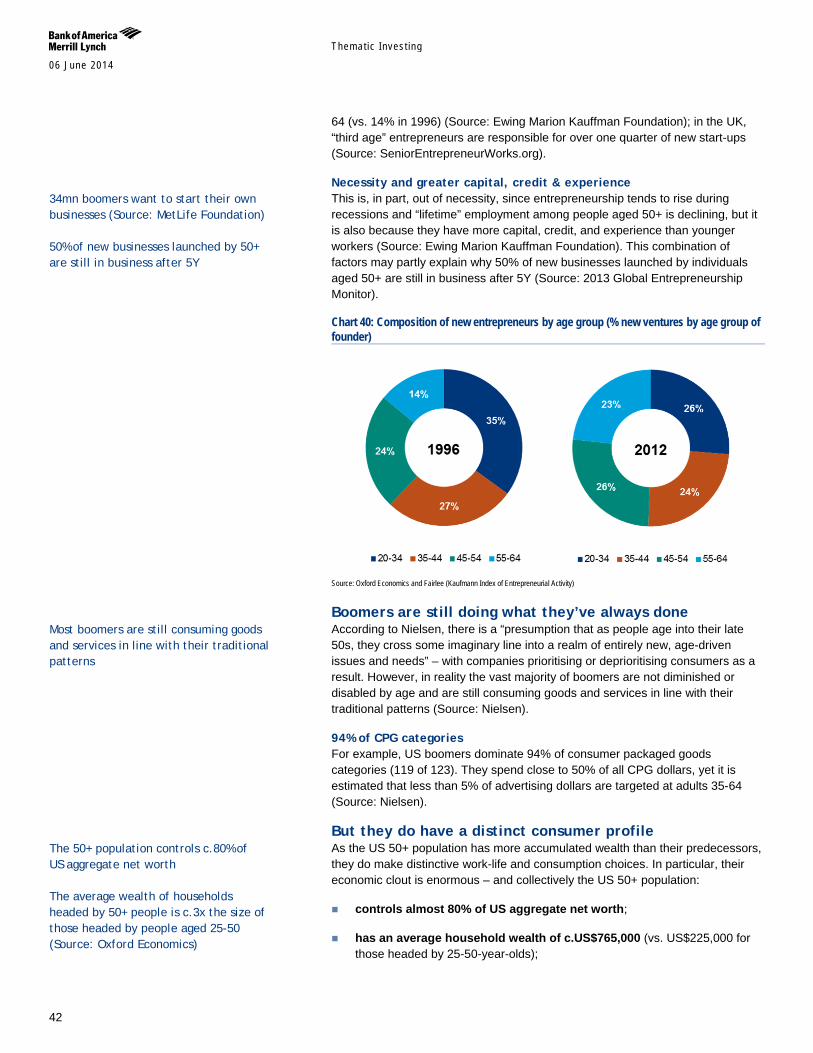
Themat ic Inves t ing 06 June 2014
42
64 (vs. 14% in 1996) (Source: Ewing Marion Kauffman Foundation); in the UK, “third age” entrepreneurs are responsible for over one quarter of new start-ups (Source: SeniorEntrepreneurWorks.org).
Necessity and greater capital, credit & experience This is, in part, out of necessity, since entrepreneurship tends to rise during recessions and “lifetime” employment among people aged 50+ is declining, but it is also because they have more capital, credit, and experience than younger workers (Source: Ewing Marion Kauffman Foundation). This combination of factors may partly explain why 50% of new businesses launched by individuals aged 50+ are still in business after 5Y (Source: 2013 Global Entrepreneurship Monitor).
Chart 40: Composition of new entrepreneurs by age group (% new ventures by age group of founder)
Source: Oxford Economics and Fairlee (Kaufmann Index of Entrepreneurial Activity)
Boomers are still doing what they’ve always done According to Nielsen, there is a “presumption that as people age into their late 50s, they cross some imaginary line into a realm of entirely new, age-driven issues and needs” – with companies prioritising or deprioritising consumers as a result. However, in reality the vast majority of boomers are not diminished or disabled by age and are still consuming goods and services in line with their traditional patterns (Source: Nielsen).
94% of CPG categories For example, US boomers dominate 94% of consumer packaged goods categories (119 of 123). They spend close to 50% of all CPG dollars, yet it is estimated that less than 5% of advertising dollars are targeted at adults 35-64 (Source: Nielsen).
But they do have a distinct consumer profile As the US 50+ population has more accumulated wealth than their predecessors, they do make distinctive work-life and consumption choices. In particular, their economic clout is enormous – and collectively the US 50+ population:
controls almost 80% of US aggregate net worth;
has an average household wealth of c.US$765,000 (vs. US$225,000 for those headed by 25-50-year-olds);
The 50+ population controls c.80% of US aggregate net worth The average wealth of households headed by 50+ people is c.3x the size of those headed by people aged 25-50 (Source: Oxford Economics)
34mn boomers want to start their own businesses (Source: MetLife Foundation) 50% of new businesses launched by 50+ are still in business after 5Y
Most boomers are still consuming goods and services in line with their traditional patterns
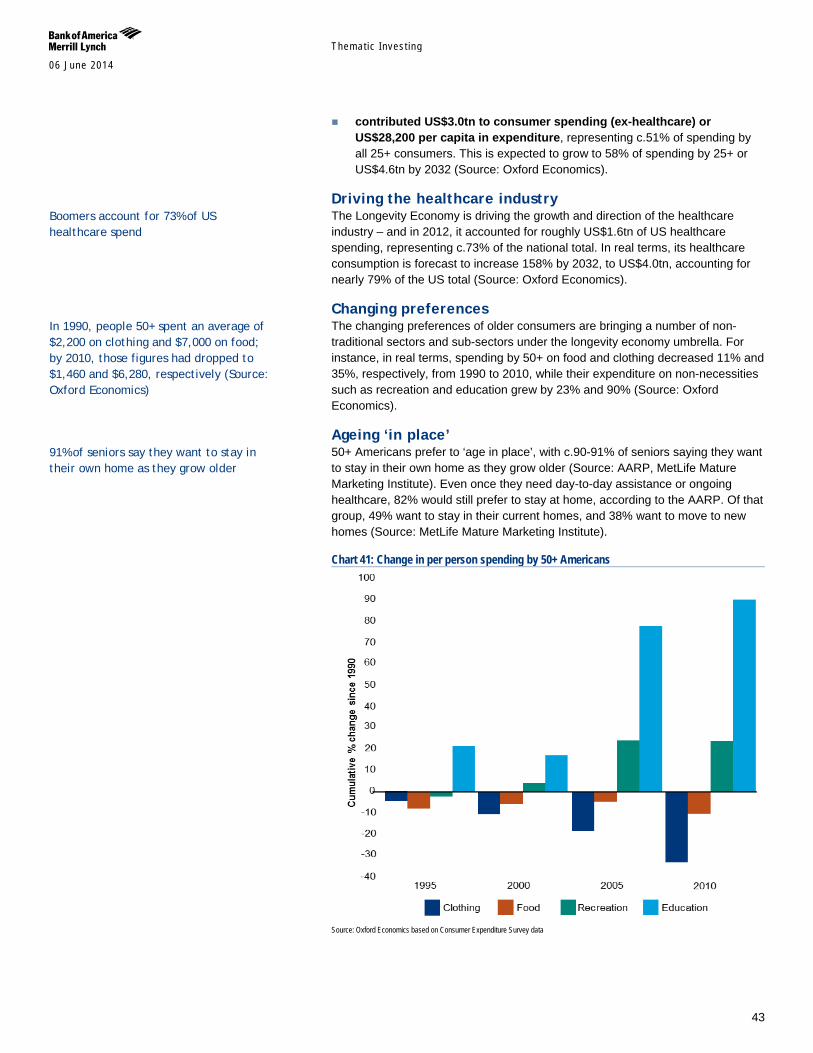
Themat ic Inves t ing 06 June 2014
43
contributed US$3.0tn to consumer spending (ex-healthcare) or US$28,200 per capita in expenditure, representing c.51% of spending by all 25+ consumers. This is expected to grow to 58% of spending by 25+ or US$4.6tn by 2032 (Source: Oxford Economics).
Driving the healthcare industry The Longevity Economy is driving the growth and direction of the healthcare industry – and in 2012, it accounted for roughly US$1.6tn of US healthcare spending, representing c.73% of the national total. In real terms, its healthcare consumption is forecast to increase 158% by 2032, to US$4.0tn, accounting for nearly 79% of the US total (Source: Oxford Economics).
Changing preferences The changing preferences of older consumers are bringing a number of non-traditional sectors and sub-sectors under the longevity economy umbrella. For instance, in real terms, spending by 50+ on food and clothing decreased 11% and 35%, respectively, from 1990 to 2010, while their expenditure on non-necessities such as recreation and education grew by 23% and 90% (Source: Oxford Economics).
Ageing ‘in place’ 50+ Americans prefer to ‘age in place’, with c.90-91% of seniors saying they want to stay in their own home as they grow older (Source: AARP, MetLife Mature Marketing Institute). Even once they need day-to-day assistance or ongoing healthcare, 82% would still prefer to stay at home, according to the AARP. Of that group, 49% want to stay in their current homes, and 38% want to move to new homes (Source: MetLife Mature Marketing Institute).
Chart 41: Change in per person spending by 50+ Americans
Source: Oxford Economics based on Consumer Expenditure Survey data
In 1990, people 50+ spent an average of $2,200 on clothing and $7,000 on food; by 2010, those figures had dropped to $1,460 and $6,280, respectively (Source: Oxford Economics)
Boomers account for 73% of US healthcare spend
91% of seniors say they want to stay in their own home as they grow older
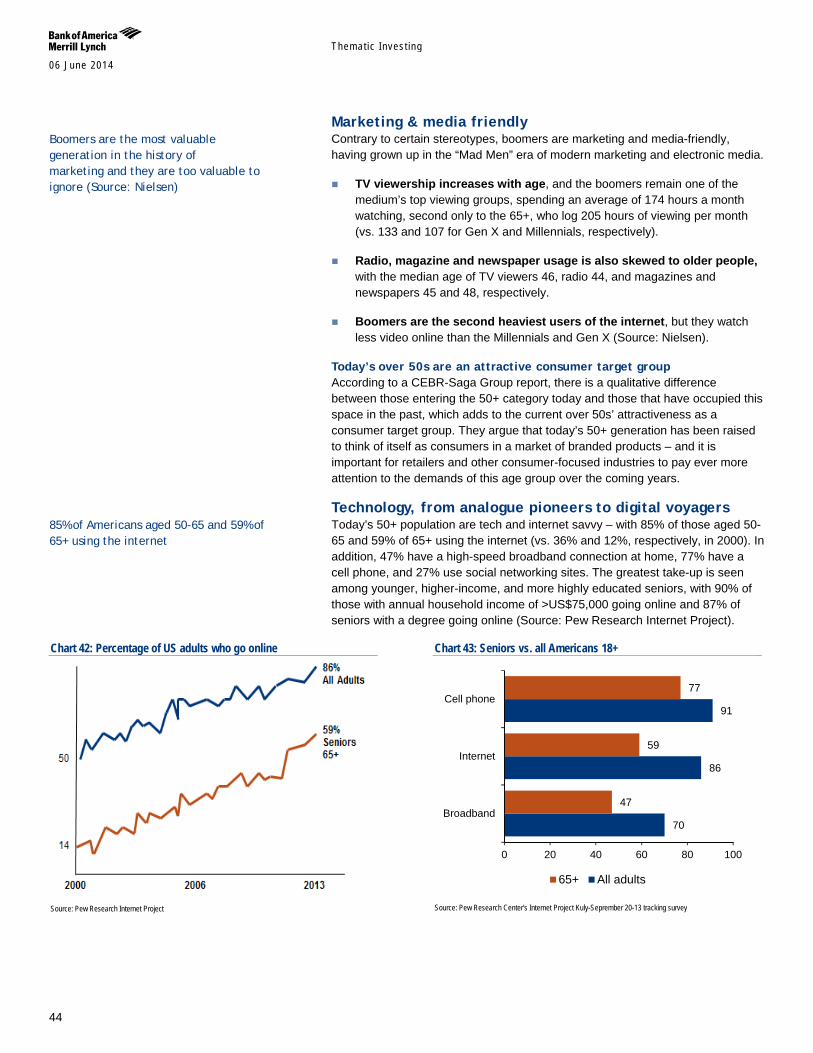
Themat ic Inves t ing 06 June 2014
44
Marketing & media friendly Contrary to certain stereotypes, boomers are marketing and media-friendly, having grown up in the “Mad Men” era of modern marketing and electronic media.
TV viewership increases with age, and the boomers remain one of the medium’s top viewing groups, spending an average of 174 hours a month watching, second only to the 65+, who log 205 hours of viewing per month (vs. 133 and 107 for Gen X and Millennials, respectively).
Radio, magazine and newspaper usage is also skewed to older people, with the median age of TV viewers 46, radio 44, and magazines and newspapers 45 and 48, respectively.
Boomers are the second heaviest users of the internet, but they watch less video online than the Millennials and Gen X (Source: Nielsen).
Today’s over 50s are an attractive consumer target group According to a CEBR-Saga Group report, there is a qualitative difference between those entering the 50+ category today and those that have occupied this space in the past, which adds to the current over 50s’ attractiveness as a consumer target group. They argue that today’s 50+ generation has been raised to think of itself as consumers in a market of branded products – and it is important for retailers and other consumer-focused industries to pay ever more attention to the demands of this age group over the coming years.
Technology, from analogue pioneers to digital voyagers Today’s 50+ population are tech and internet savvy – with 85% of those aged 50-65 and 59% of 65+ using the internet (vs. 36% and 12%, respectively, in 2000). In addition, 47% have a high-speed broadband connection at home, 77% have a cell phone, and 27% use social networking sites. The greatest take-up is seen among younger, higher-income, and more highly educated seniors, with 90% of those with annual household income of >US$75,000 going online and 87% of seniors with a degree going online (Source: Pew Research Internet Project).
Chart 42: Percentage of US adults who go online
Source: Pew Research Internet Project
Chart 43: Seniors vs. all Americans 18+
Source: Pew Research Center's Internet Project Kuly-Seprember 20-13 tracking survey
70
86
91
47
59
77
0 20 40 60 80 100
Broadband
Internet
Cell phone
65+ All adults
Boomers are the most valuable generation in the history of marketing and they are too valuable to ignore (Source: Nielsen)
85% of Americans aged 50-65 and 59% of 65+ using the internet
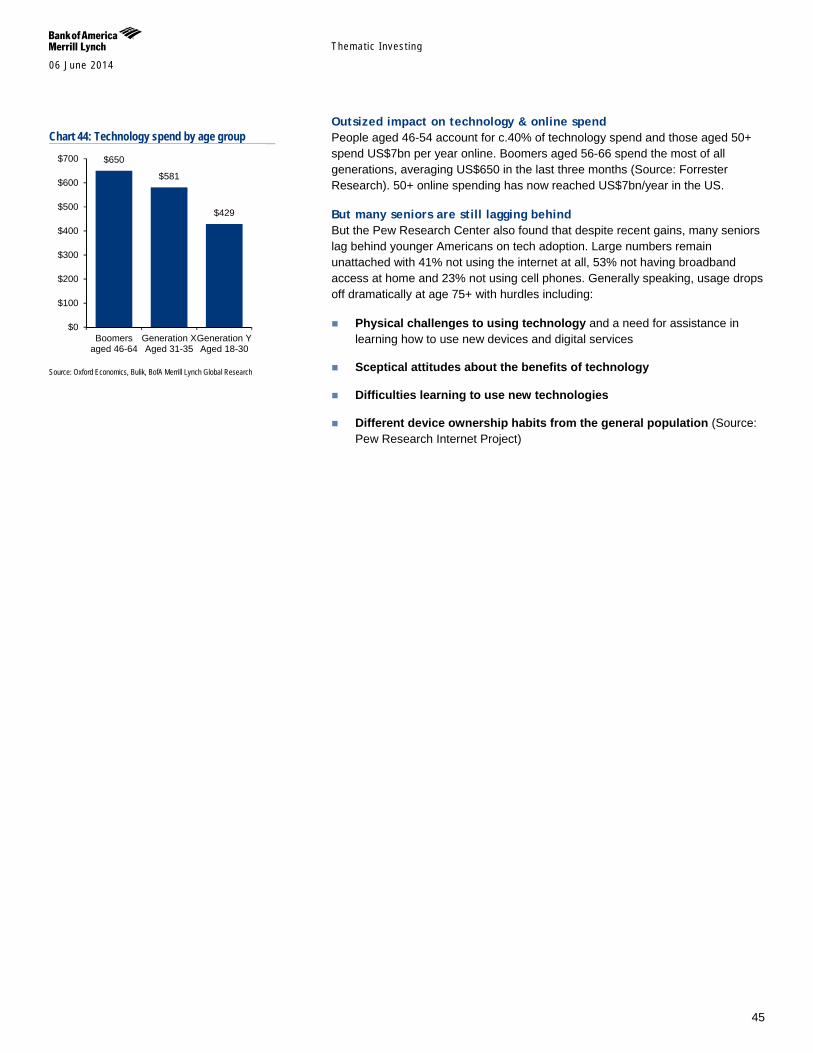
Themat ic Inves t ing 06 June 2014
45
Outsized impact on technology & online spend People aged 46-54 account for c.40% of technology spend and those aged 50+ spend US$7bn per year online. Boomers aged 56-66 spend the most of all generations, averaging US$650 in the last three months (Source: Forrester Research). 50+ online spending has now reached US$7bn/year in the US.
But many seniors are still lagging behind But the Pew Research Center also found that despite recent gains, many seniors lag behind younger Americans on tech adoption. Large numbers remain unattached with 41% not using the internet at all, 53% not having broadband access at home and 23% not using cell phones. Generally speaking, usage drops off dramatically at age 75+ with hurdles including:
Physical challenges to using technology and a need for assistance in learning how to use new devices and digital services
Sceptical attitudes about the benefits of technology
Difficulties learning to use new technologies
Different device ownership habits from the general population (Source: Pew Research Internet Project)
Chart 44: Technology spend by age group
Source: Oxford Economics, Bulik, BofA Merrill Lynch Global Research
$650
$581
$429
$0
$100
$200
$300
$400
$500
$600
$700
Boomersaged 46-64
Generation XAged 31-35
Generation YAged 18-30
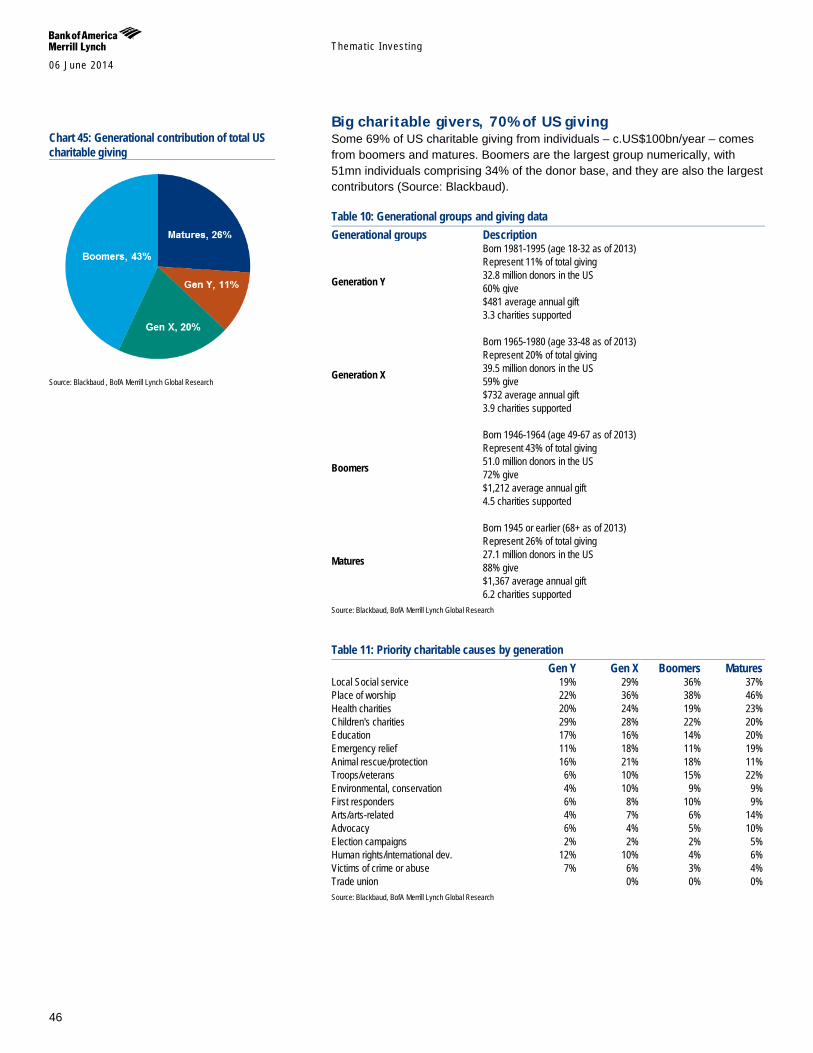
Themat ic Inves t ing 06 June 2014
46
Big charitable givers, 70% of US giving Some 69% of US charitable giving from individuals – c.US$100bn/year – comes from boomers and matures. Boomers are the largest group numerically, with 51mn individuals comprising 34% of the donor base, and they are also the largest contributors (Source: Blackbaud).
Table 10: Generational groups and giving data Generational groups Description
Generation Y
Born 1981-1995 (age 18-32 as of 2013) Represent 11% of total giving 32.8 million donors in the US 60% give $481 average annual gift 3.3 charities supported
Generation X
Born 1965-1980 (age 33-48 as of 2013) Represent 20% of total giving 39.5 million donors in the US 59% give $732 average annual gift 3.9 charities supported
Boomers
Born 1946-1964 (age 49-67 as of 2013) Represent 43% of total giving 51.0 million donors in the US 72% give $1,212 average annual gift 4.5 charities supported
Matures
Born 1945 or earlier (68+ as of 2013) Represent 26% of total giving 27.1 million donors in the US 88% give $1,367 average annual gift 6.2 charities supported
Source: Blackbaud, BofA Merrill Lynch Global Research
Table 11: Priority charitable causes by generation Gen Y Gen X Boomers Matures Local Social service 19% 29% 36% 37% Place of worship 22% 36% 38% 46% Health charities 20% 24% 19% 23% Children's charities 29% 28% 22% 20% Education 17% 16% 14% 20% Emergency relief 11% 18% 11% 19% Animal rescue/protection 16% 21% 18% 11% Troops/veterans 6% 10% 15% 22% Environmental, conservation 4% 10% 9% 9% First responders 6% 8% 10% 9% Arts/arts-related 4% 7% 6% 14% Advocacy 6% 4% 5% 10% Election campaigns 2% 2% 2% 5% Human rights/international dev. 12% 10% 4% 6% Victims of crime or abuse 7% 6% 3% 4% Trade union 0% 0% 0% Source: Blackbaud, BofA Merrill Lynch Global Research
Chart 45: Generational contribution of total US charitable giving
Source: Blackbaud , BofA Merrill Lynch Global Research
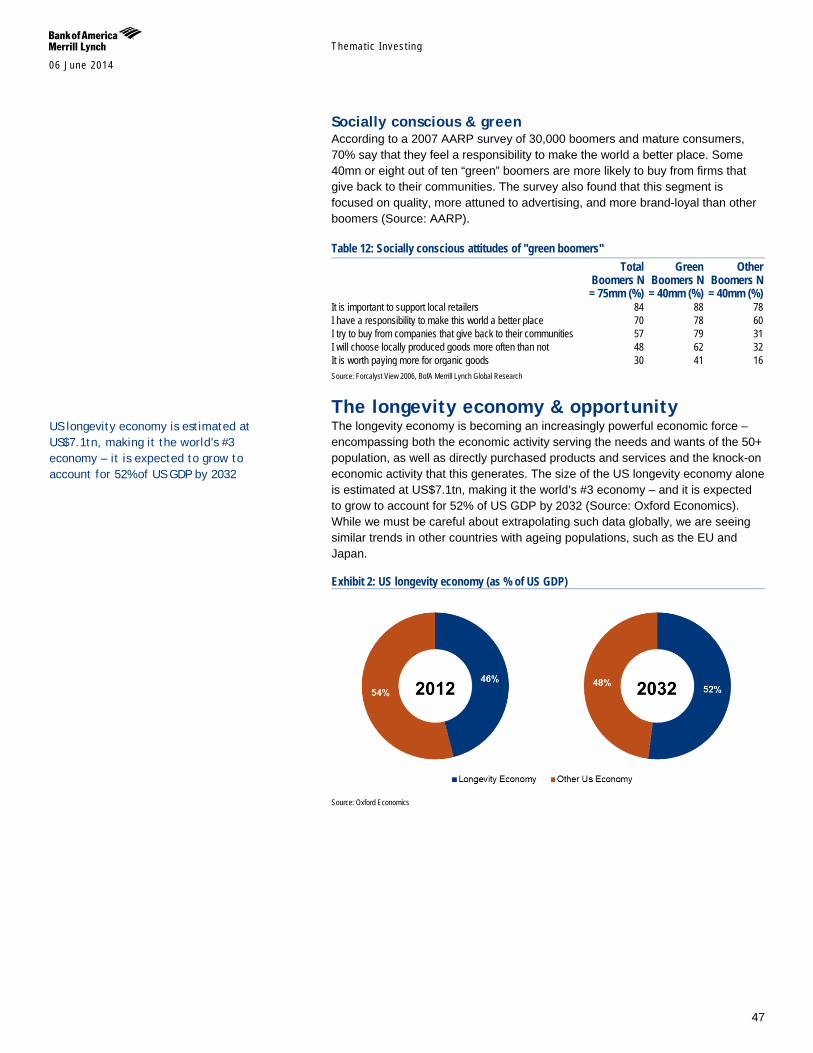
Themat ic Inves t ing 06 June 2014
47
Socially conscious & green According to a 2007 AARP survey of 30,000 boomers and mature consumers, 70% say that they feel a responsibility to make the world a better place. Some 40mn or eight out of ten “green” boomers are more likely to buy from firms that give back to their communities. The survey also found that this segment is focused on quality, more attuned to advertising, and more brand-loyal than other boomers (Source: AARP).
Table 12: Socially conscious attitudes of "green boomers"
Total Boomers N = 75mm (%)
Green Boomers N = 40mm (%)
Other Boomers N = 40mm (%)
It is important to support local retailers 84 88 78 I have a responsibility to make this world a better place 70 78 60 I try to buy from companies that give back to their communities 57 79 31 I will choose locally produced goods more often than not 48 62 32 It is worth paying more for organic goods 30 41 16 Source: Forcalyst View 2006, BofA Merrill Lynch Global Research
The longevity economy & opportunity The longevity economy is becoming an increasingly powerful economic force – encompassing both the economic activity serving the needs and wants of the 50+ population, as well as directly purchased products and services and the knock-on economic activity that this generates. The size of the US longevity economy alone is estimated at US$7.1tn, making it the world’s #3 economy – and it is expected to grow to account for 52% of US GDP by 2032 (Source: Oxford Economics). While we must be careful about extrapolating such data globally, we are seeing similar trends in other countries with ageing populations, such as the EU and Japan.
Exhibit 2: US longevity economy (as % of US GDP)
Source: Oxford Economics
US longevity economy is estimated at US$7.1tn, making it the world’s #3 economy – it is expected to grow to account for 52% of US GDP by 2032
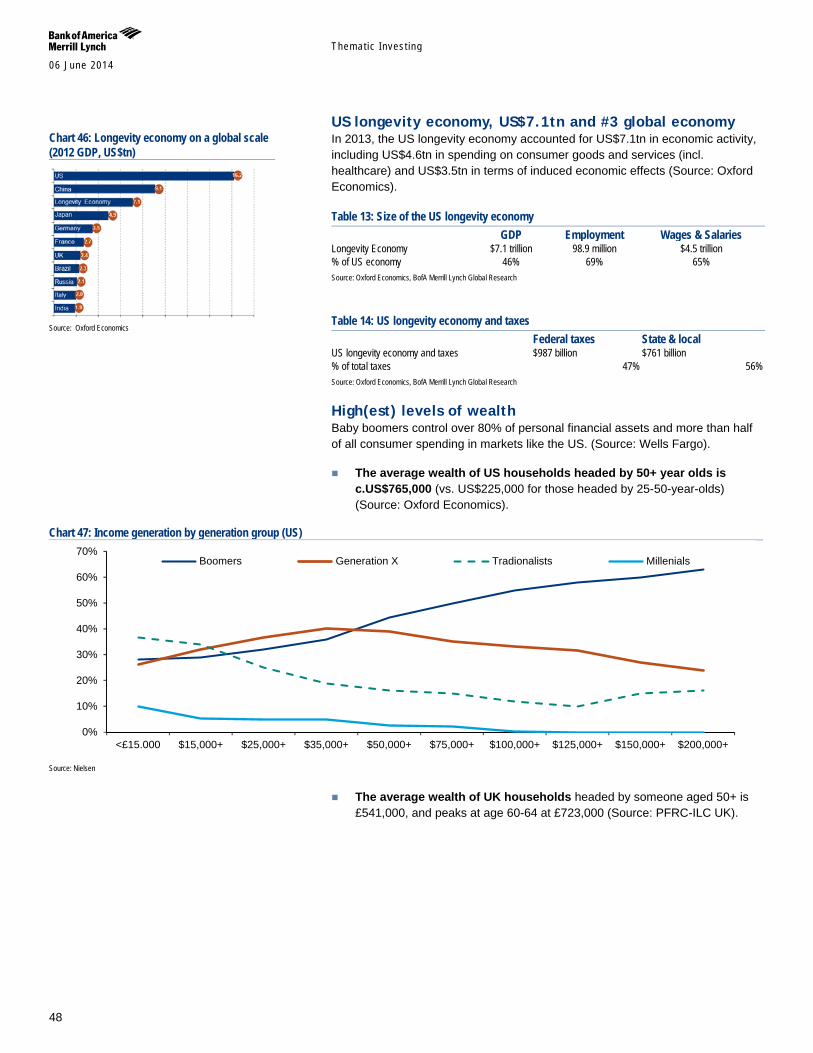
Themat ic Inves t ing 06 June 2014
48
US longevity economy, US$7.1tn and #3 global economy In 2013, the US longevity economy accounted for US$7.1tn in economic activity, including US$4.6tn in spending on consumer goods and services (incl. healthcare) and US$3.5tn in terms of induced economic effects (Source: Oxford Economics).
Table 13: Size of the US longevity economy GDP Employment Wages & Salaries Longevity Economy $7.1 trillion 98.9 million $4.5 trillion % of US economy 46% 69% 65% Source: Oxford Economics, BofA Merrill Lynch Global Research
Table 14: US longevity economy and taxes Federal taxes State & local US longevity economy and taxes $987 billion $761 billion % of total taxes 47% 56% Source: Oxford Economics, BofA Merrill Lynch Global Research
High(est) levels of wealth Baby boomers control over 80% of personal financial assets and more than half of all consumer spending in markets like the US. (Source: Wells Fargo).
The average wealth of US households headed by 50+ year olds is c.US$765,000 (vs. US$225,000 for those headed by 25-50-year-olds) (Source: Oxford Economics).
Chart 47: Income generation by generation group (US)
Source: Nielsen
The average wealth of UK households headed by someone aged 50+ is £541,000, and peaks at age 60-64 at £723,000 (Source: PFRC-ILC UK).
0%
10%
20%
30%
40%
50%
60%
70%
<£15.000 $15,000+ $25,000+ $35,000+ $50,000+ $75,000+ $100,000+ $125,000+ $150,000+ $200,000+
Boomers Generation X Tradionalists Millenials
Chart 46: Longevity economy on a global scale (2012 GDP, US$tn)
Source: Oxford Economics
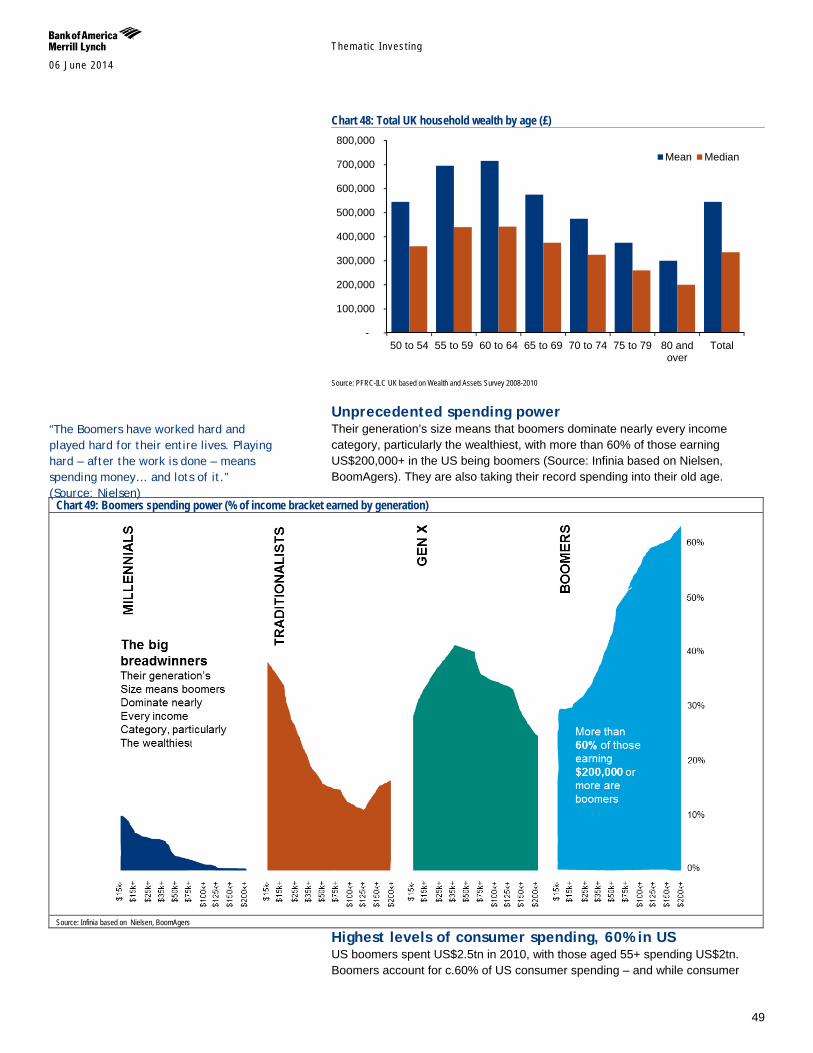
Themat ic Inves t ing 06 June 2014
49
Chart 48: Total UK household wealth by age (£)
Source: PFRC-ILC UK based on Wealth and Assets Survey 2008-2010
Unprecedented spending power Their generation’s size means that boomers dominate nearly every income category, particularly the wealthiest, with more than 60% of those earning US$200,000+ in the US being boomers (Source: Infinia based on Nielsen, BoomAgers). They are also taking their record spending into their old age.
Chart 49: Boomers spending power (% of income bracket earned by generation)
Source: Infinia based on Nielsen, BoomAgers
Highest levels of consumer spending, 60% in US US boomers spent US$2.5tn in 2010, with those aged 55+ spending US$2tn. Boomers account for c.60% of US consumer spending – and while consumer
-
100,000
200,000
300,000
400,000
500,000
600,000
700,000
800,000
50 to 54 55 to 59 60 to 64 65 to 69 70 to 74 75 to 79 80 andover
Total
Mean Median
“The Boomers have worked hard and played hard for their entire lives. Playing hard – after the work is done – means spending money… and lots of it.” (Source: Nielsen)
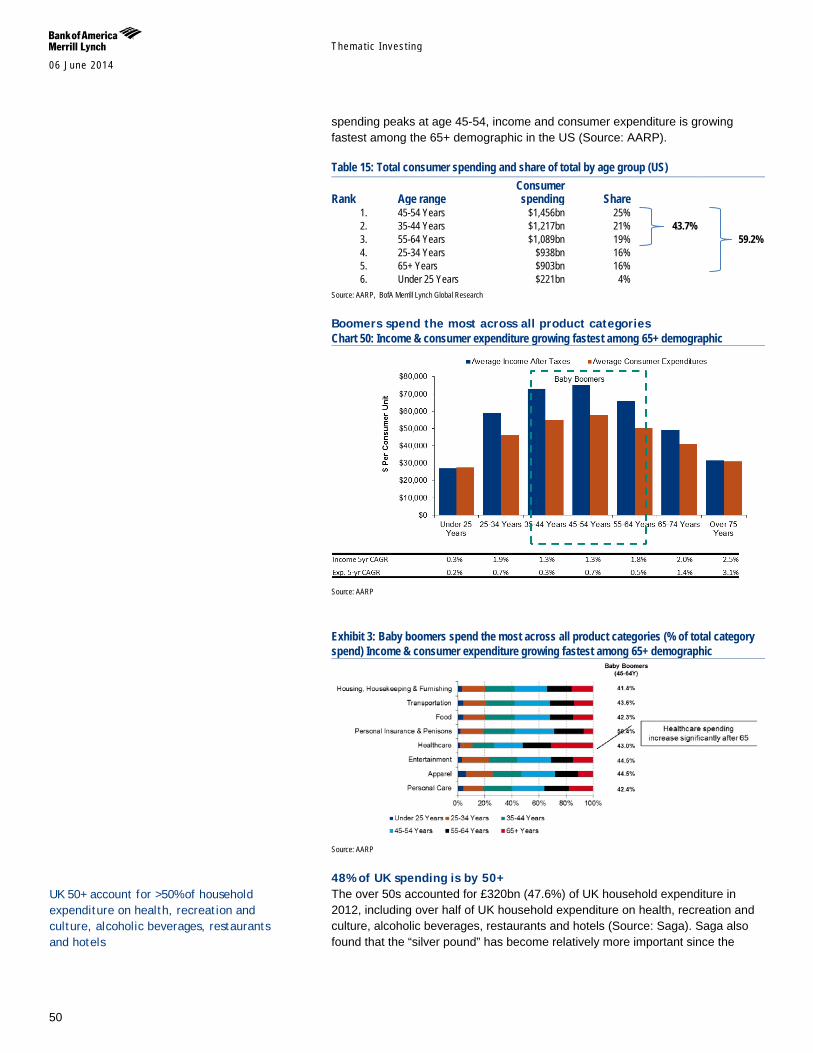
Themat ic Inves t ing 06 June 2014
50
spending peaks at age 45-54, income and consumer expenditure is growing fastest among the 65+ demographic in the US (Source: AARP).
Table 15: Total consumer spending and share of total by age group (US)
Rank Age range Consumer spending Share
1. 45-54 Years $1,456bn 25% 2. 35-44 Years $1,217bn 21% 43.7% 3. 55-64 Years $1,089bn 19% 59.2% 4. 25-34 Years $938bn 16% 5. 65+ Years $903bn 16% 6. Under 25 Years $221bn 4%
Source: AARP, BofA Merrill Lynch Global Research
Boomers spend the most across all product categories Chart 50: Income & consumer expenditure growing fastest among 65+ demographic
Source: AARP
Exhibit 3: Baby boomers spend the most across all product categories (% of total category spend) Income & consumer expenditure growing fastest among 65+ demographic
Source: AARP
48% of UK spending is by 50+ The over 50s accounted for £320bn (47.6%) of UK household expenditure in 2012, including over half of UK household expenditure on health, recreation and culture, alcoholic beverages, restaurants and hotels (Source: Saga). Saga also found that the “silver pound” has become relatively more important since the
UK 50+ account for >50% of household expenditure on health, recreation and culture, alcoholic beverages, restaurants and hotels
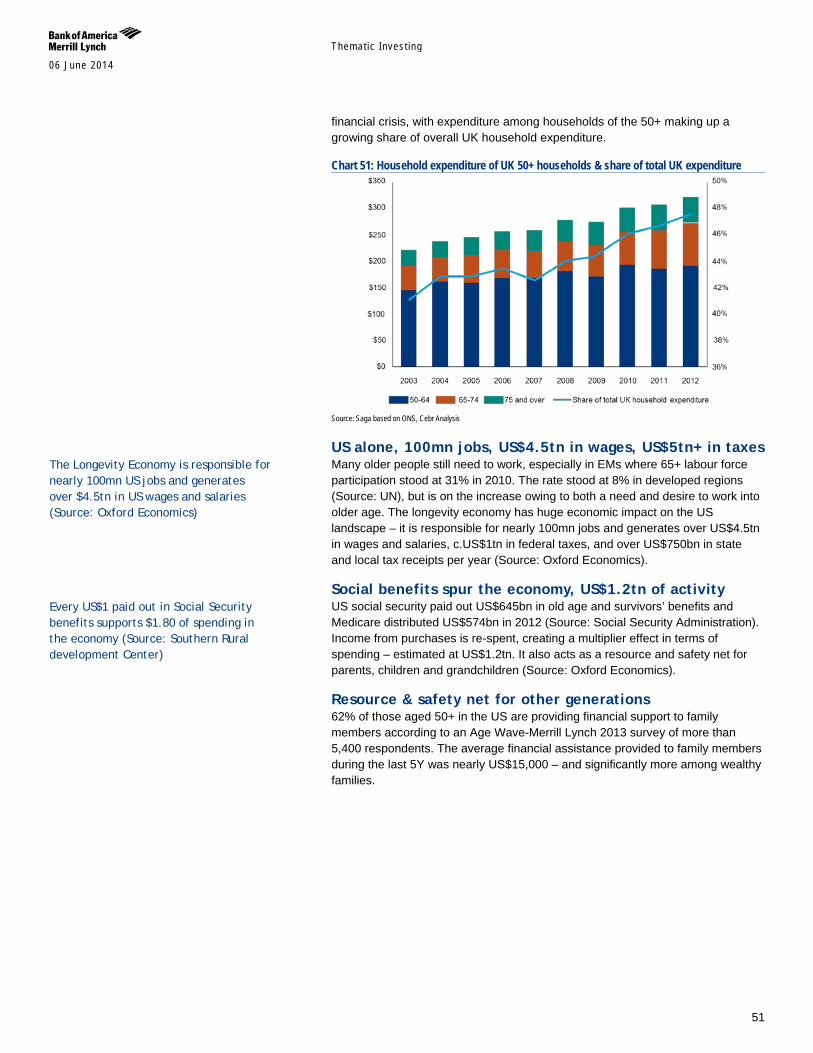
Themat ic Inves t ing 06 June 2014
51
financial crisis, with expenditure among households of the 50+ making up a growing share of overall UK household expenditure.
Chart 51: Household expenditure of UK 50+ households & share of total UK expenditure
Source: Saga based on ONS, Cebr Analysis
US alone, 100mn jobs, US$4.5tn in wages, US$5tn+ in taxes Many older people still need to work, especially in EMs where 65+ labour force participation stood at 31% in 2010. The rate stood at 8% in developed regions (Source: UN), but is on the increase owing to both a need and desire to work into older age. The longevity economy has huge economic impact on the US landscape – it is responsible for nearly 100mn jobs and generates over US$4.5tn in wages and salaries, c.US$1tn in federal taxes, and over US$750bn in state and local tax receipts per year (Source: Oxford Economics).
Social benefits spur the economy, US$1.2tn of activity US social security paid out US$645bn in old age and survivors’ benefits and Medicare distributed US$574bn in 2012 (Source: Social Security Administration). Income from purchases is re-spent, creating a multiplier effect in terms of spending – estimated at US$1.2tn. It also acts as a resource and safety net for parents, children and grandchildren (Source: Oxford Economics).
Resource & safety net for other generations 62% of those aged 50+ in the US are providing financial support to family members according to an Age Wave-Merrill Lynch 2013 survey of more than 5,400 respondents. The average financial assistance provided to family members during the last 5Y was nearly US$15,000 – and significantly more among wealthy families.
Every US$1 paid out in Social Security benefits supports $1.80 of spending in the economy (Source: Southern Rural development Center)
The Longevity Economy is responsible for nearly 100mn US jobs and generates over $4.5tn in US wages and salaries (Source: Oxford Economics)
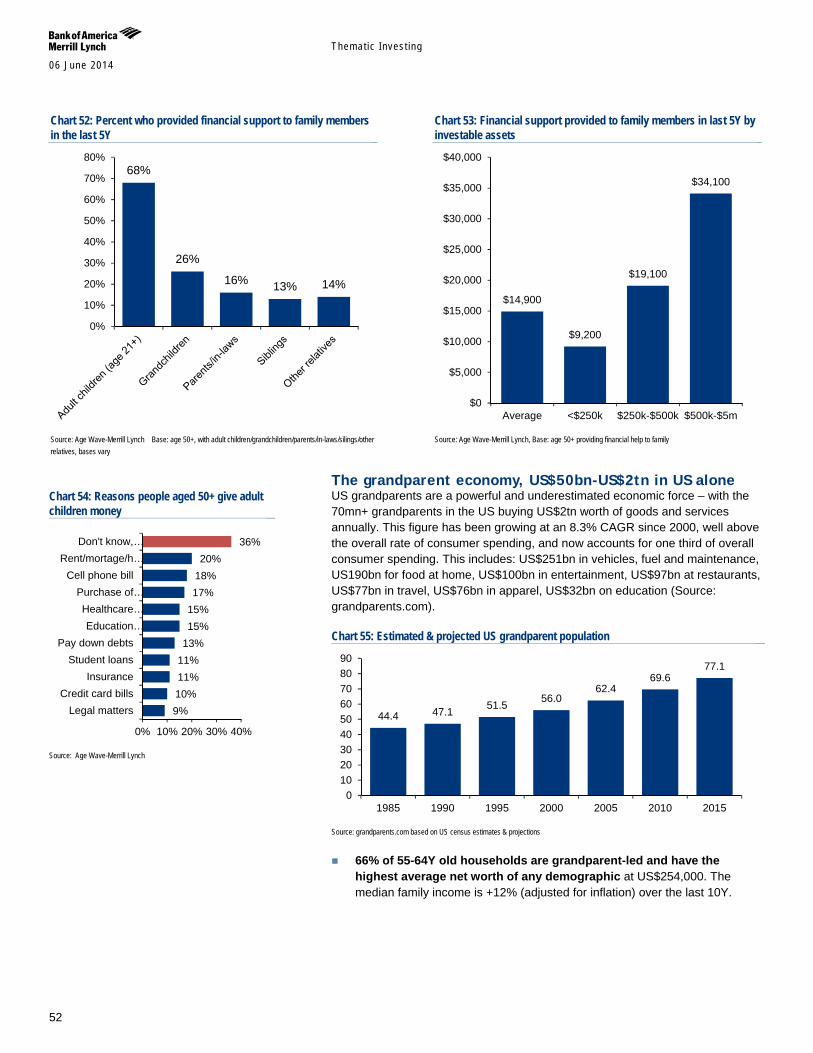
Themat ic Inves t ing 06 June 2014
52
Chart 52: Percent who provided financial support to family members in the last 5Y
Source: Age Wave-Merrill Lynch Base: age 50+, with adult children/grandchildren/parents/in-laws/silings/other relatives, bases vary
Chart 53: Financial support provided to family members in last 5Y by investable assets
Source: Age Wave-Merrill Lynch, Base: age 50+ providing financial help to family
The grandparent economy, US$50bn-US$2tn in US alone US grandparents are a powerful and underestimated economic force – with the 70mn+ grandparents in the US buying US$2tn worth of goods and services annually. This figure has been growing at an 8.3% CAGR since 2000, well above the overall rate of consumer spending, and now accounts for one third of overall consumer spending. This includes: US$251bn in vehicles, fuel and maintenance, US190bn for food at home, US$100bn in entertainment, US$97bn at restaurants, US$77bn in travel, US$76bn in apparel, US$32bn on education (Source: grandparents.com).
Chart 55: Estimated & projected US grandparent population
Source: grandparents.com based on US census estimates & projections
66% of 55-64Y old households are grandparent-led and have the highest average net worth of any demographic at US$254,000. The median family income is +12% (adjusted for inflation) over the last 10Y.
68%
26%
16% 13% 14%
0%
10%
20%
30%
40%
50%
60%
70%
80%
$14,900
$9,200
$19,100
$34,100
$0
$5,000
$10,000
$15,000
$20,000
$25,000
$30,000
$35,000
$40,000
Average <$250k $250k-$500k $500k-$5m
44.4 47.1 51.5 56.0 62.4
69.6 77.1
0102030405060708090
1985 1990 1995 2000 2005 2010 2015
Chart 54: Reasons people aged 50+ give adult children money
Source: Age Wave-Merrill Lynch
9% 10% 11% 11% 13% 15% 15% 17% 18% 20%
36%
0% 10% 20% 30% 40%
Legal mattersCredit card bills
InsuranceStudent loans
Pay down debtsEducation…
Healthcare…Purchase of…
Cell phone billRent/mortage/h…
Don't know,…
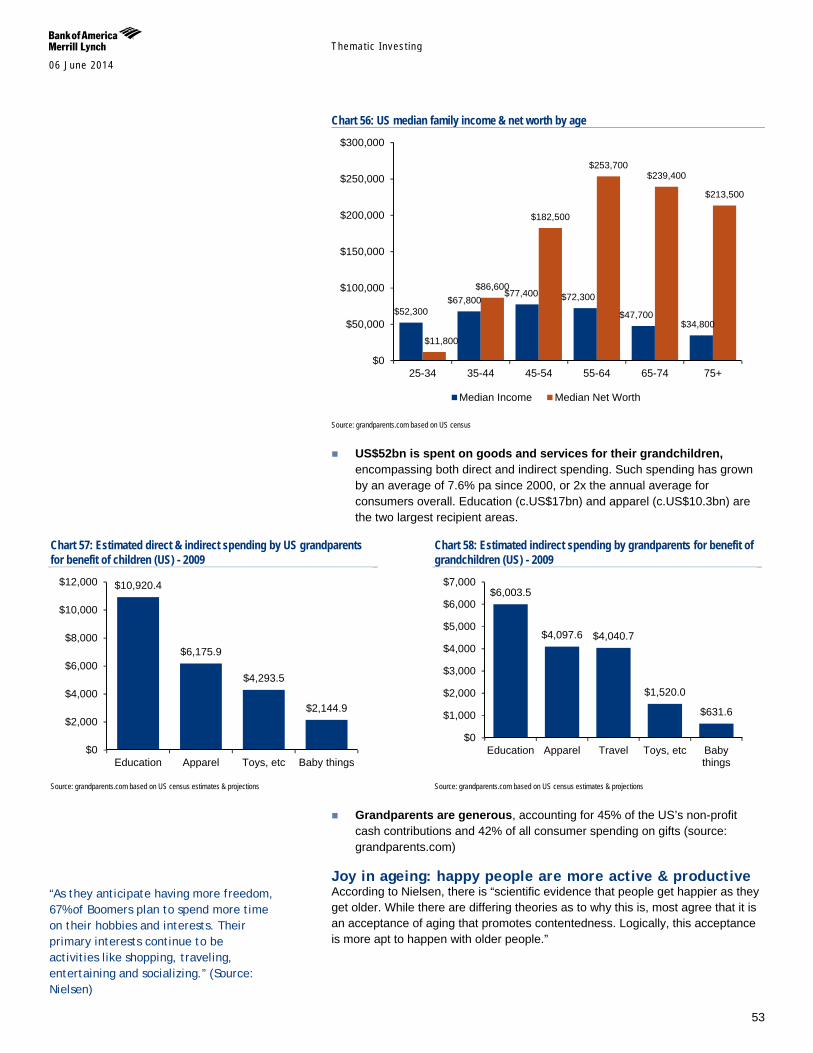
Themat ic Inves t ing 06 June 2014
53
Chart 56: US median family income & net worth by age
Source: grandparents.com based on US census
US$52bn is spent on goods and services for their grandchildren, encompassing both direct and indirect spending. Such spending has grown by an average of 7.6% pa since 2000, or 2x the annual average for consumers overall. Education (c.US$17bn) and apparel (c.US$10.3bn) are the two largest recipient areas.
Chart 57: Estimated direct & indirect spending by US grandparents for benefit of children (US) - 2009
Source: grandparents.com based on US census estimates & projections
Chart 58: Estimated indirect spending by grandparents for benefit of grandchildren (US) - 2009
Source: grandparents.com based on US census estimates & projections
Grandparents are generous, accounting for 45% of the US’s non-profit cash contributions and 42% of all consumer spending on gifts (source: grandparents.com)
Joy in ageing: happy people are more active & productive According to Nielsen, there is “scientific evidence that people get happier as they get older. While there are differing theories as to why this is, most agree that it is an acceptance of aging that promotes contentedness. Logically, this acceptance is more apt to happen with older people.”
$52,300 $67,800
$77,400 $72,300
$47,700 $34,800
$11,800
$86,600
$182,500
$253,700 $239,400
$213,500
$0
$50,000
$100,000
$150,000
$200,000
$250,000
$300,000
25-34 35-44 45-54 55-64 65-74 75+
Median Income Median Net Worth
$10,920.4
$6,175.9
$4,293.5
$2,144.9
$0
$2,000
$4,000
$6,000
$8,000
$10,000
$12,000
Education Apparel Toys, etc Baby things
$6,003.5
$4,097.6 $4,040.7
$1,520.0
$631.6
$0
$1,000
$2,000
$3,000
$4,000
$5,000
$6,000
$7,000
Education Apparel Travel Toys, etc Babythings
“As they anticipate having more freedom, 67% of Boomers plan to spend more time on their hobbies and interests. Their primary interests continue to be activities like shopping, traveling, entertaining and socializing.” (Source: Nielsen)
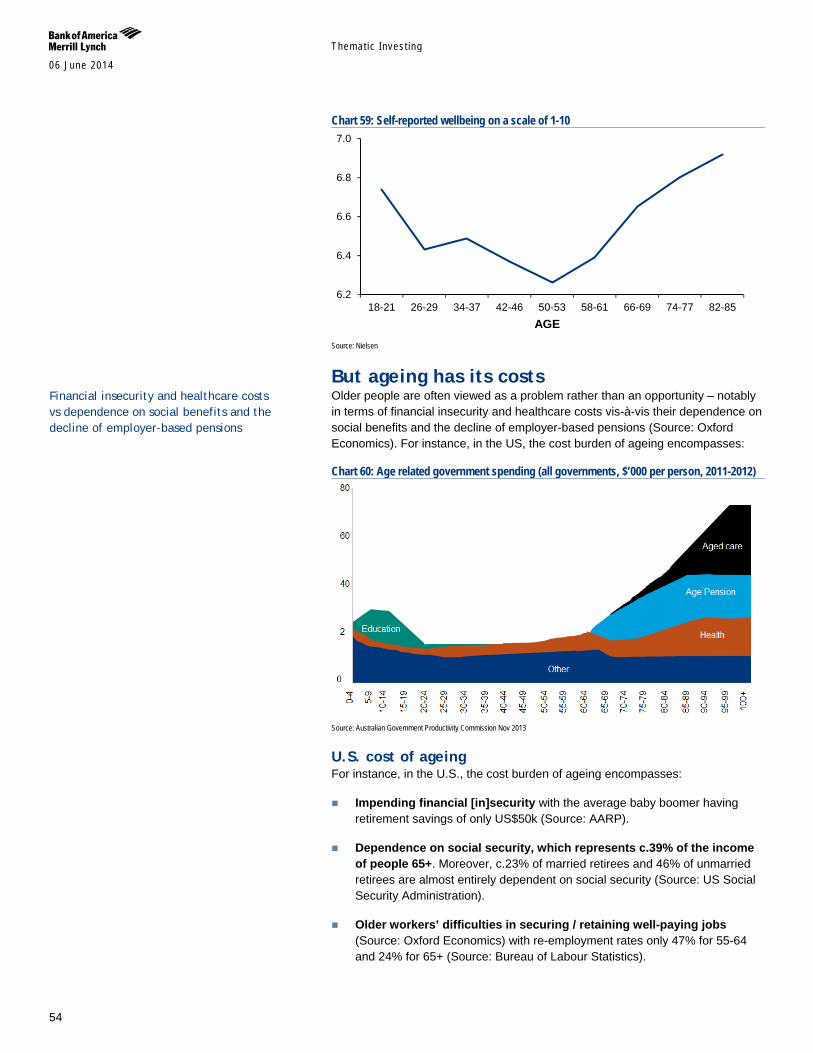
Themat ic Inves t ing 06 June 2014
54
Chart 59: Self-reported wellbeing on a scale of 1-10
Source: Nielsen
But ageing has its costs Older people are often viewed as a problem rather than an opportunity – notably in terms of financial insecurity and healthcare costs vis-à-vis their dependence on social benefits and the decline of employer-based pensions (Source: Oxford Economics). For instance, in the US, the cost burden of ageing encompasses:
Chart 60: Age related government spending (all governments, $’000 per person, 2011-2012)
Source: Australian Government Productivity Commission Nov 2013
U.S. cost of ageing For instance, in the U.S., the cost burden of ageing encompasses:
Impending financial [in]security with the average baby boomer having retirement savings of only US$50k (Source: AARP).
Dependence on social security, which represents c.39% of the income of people 65+. Moreover, c.23% of married retirees and 46% of unmarried retirees are almost entirely dependent on social security (Source: US Social Security Administration).
Older workers’ difficulties in securing / retaining well-paying jobs (Source: Oxford Economics) with re-employment rates only 47% for 55-64 and 24% for 65+ (Source: Bureau of Labour Statistics).
6.2
6.4
6.6
6.8
7.0
18-21 26-29 34-37 42-46 50-53 58-61 66-69 74-77 82-85AGE
Financial insecurity and healthcare costs vs dependence on social benefits and the decline of employer-based pensions
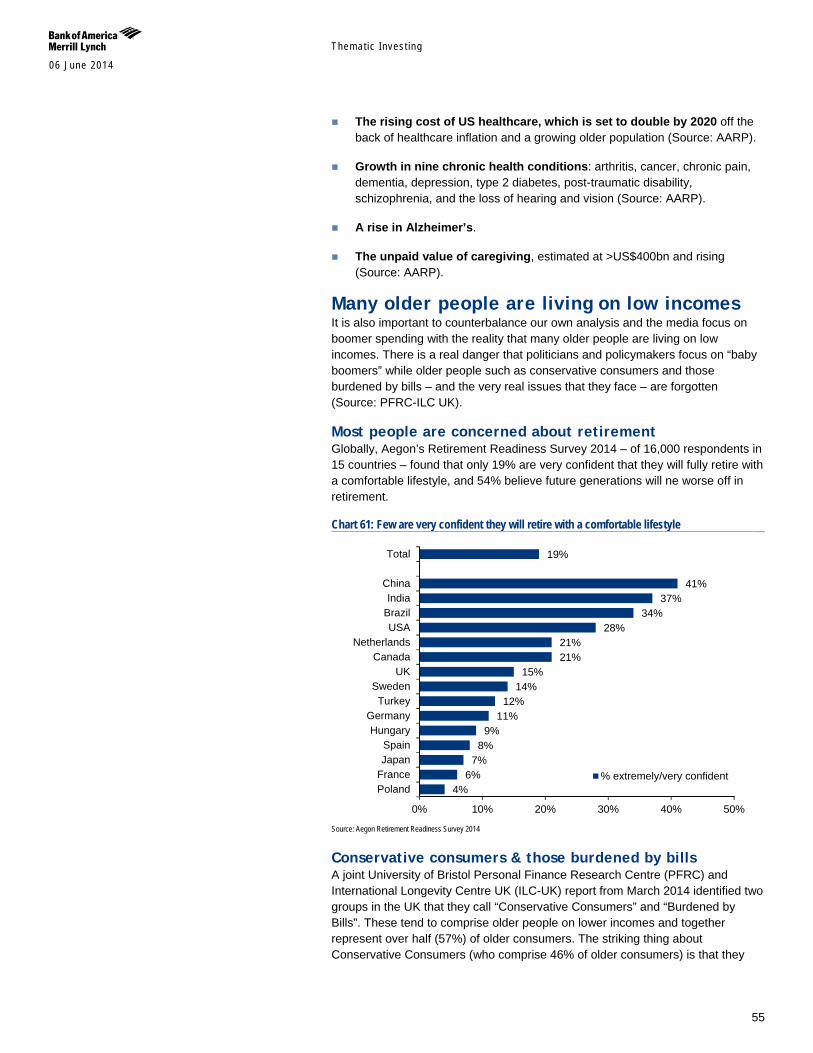
Themat ic Inves t ing 06 June 2014
55
The rising cost of US healthcare, which is set to double by 2020 off the back of healthcare inflation and a growing older population (Source: AARP).
Growth in nine chronic health conditions: arthritis, cancer, chronic pain, dementia, depression, type 2 diabetes, post-traumatic disability, schizophrenia, and the loss of hearing and vision (Source: AARP).
A rise in Alzheimer’s.
The unpaid value of caregiving, estimated at >US$400bn and rising (Source: AARP).
Many older people are living on low incomes It is also important to counterbalance our own analysis and the media focus on boomer spending with the reality that many older people are living on low incomes. There is a real danger that politicians and policymakers focus on “baby boomers” while older people such as conservative consumers and those burdened by bills – and the very real issues that they face – are forgotten (Source: PFRC-ILC UK).
Most people are concerned about retirement Globally, Aegon’s Retirement Readiness Survey 2014 – of 16,000 respondents in 15 countries – found that only 19% are very confident that they will fully retire with a comfortable lifestyle, and 54% believe future generations will ne worse off in retirement.
Chart 61: Few are very confident they will retire with a comfortable lifestyle
Source: Aegon Retirement Readiness Survey 2014
Conservative consumers & those burdened by bills A joint University of Bristol Personal Finance Research Centre (PFRC) and International Longevity Centre UK (ILC-UK) report from March 2014 identified two groups in the UK that they call “Conservative Consumers” and “Burdened by Bills”. These tend to comprise older people on lower incomes and together represent over half (57%) of older consumers. The striking thing about Conservative Consumers (who comprise 46% of older consumers) is that they
4% 6%
7% 8%
9% 11%
12% 14%
15% 21% 21%
28% 34%
37% 41%
19%
0% 10% 20% 30% 40% 50%
PolandFranceJapanSpain
HungaryGermany
TurkeySweden
UKCanada
NetherlandsUSA
BrazilIndia
China
Total
% extremely/very confident

Themat ic Inves t ing 06 June 2014
56
spend far less on non-essentials than older households as a whole. Older households that are Burdened by Bills (11% of older consumers) are distinct because they spend £4 in every £10 on housing, fuel and power – which is twice the national average.
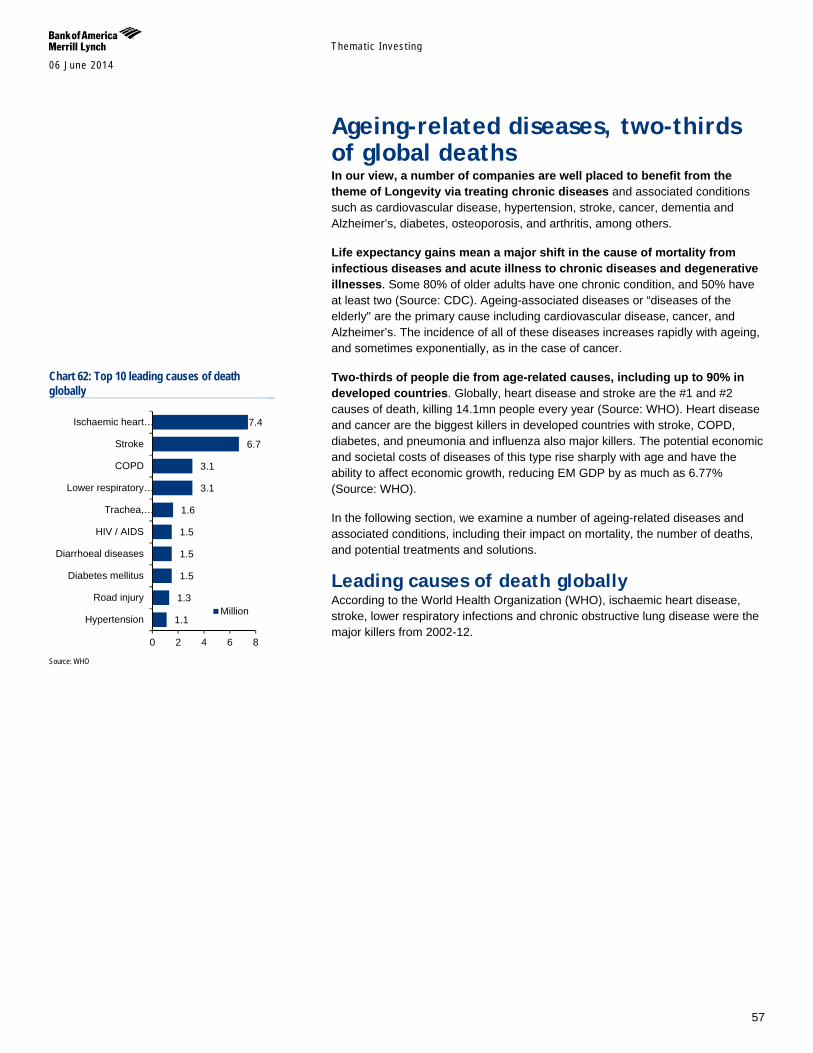
Themat ic Inves t ing 06 June 2014
57
Ageing-related diseases, two-thirds of global deaths In our view, a number of companies are well placed to benefit from the theme of Longevity via treating chronic diseases and associated conditions such as cardiovascular disease, hypertension, stroke, cancer, dementia and Alzheimer’s, diabetes, osteoporosis, and arthritis, among others.
Life expectancy gains mean a major shift in the cause of mortality from infectious diseases and acute illness to chronic diseases and degenerative illnesses. Some 80% of older adults have one chronic condition, and 50% have at least two (Source: CDC). Ageing-associated diseases or “diseases of the elderly" are the primary cause including cardiovascular disease, cancer, and Alzheimer’s. The incidence of all of these diseases increases rapidly with ageing, and sometimes exponentially, as in the case of cancer.
Two-thirds of people die from age-related causes, including up to 90% in developed countries. Globally, heart disease and stroke are the #1 and #2 causes of death, killing 14.1mn people every year (Source: WHO). Heart disease and cancer are the biggest killers in developed countries with stroke, COPD, diabetes, and pneumonia and influenza also major killers. The potential economic and societal costs of diseases of this type rise sharply with age and have the ability to affect economic growth, reducing EM GDP by as much as 6.77% (Source: WHO).
In the following section, we examine a number of ageing-related diseases and associated conditions, including their impact on mortality, the number of deaths, and potential treatments and solutions.
Leading causes of death globally According to the World Health Organization (WHO), ischaemic heart disease, stroke, lower respiratory infections and chronic obstructive lung disease were the major killers from 2002-12.
Chart 62: Top 10 leading causes of death globally
Source: WHO
1.1
1.3
1.5
1.5
1.5
1.6
3.1
3.1
6.7
7.4
0 2 4 6 8
Hypertension
Road injury
Diabetes mellitus
Diarrhoeal diseases
HIV / AIDS
Trachea,…
Lower respiratory…
COPD
Stroke
Ischaemic heart…
Million
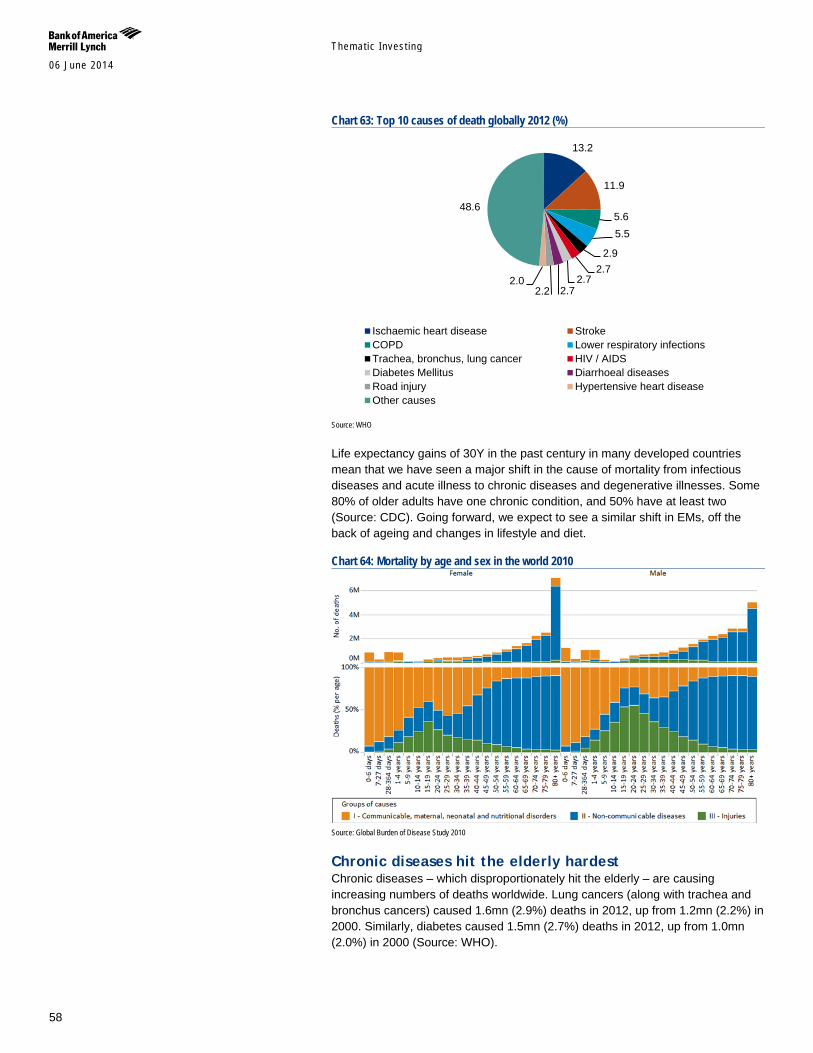
Themat ic Inves t ing 06 June 2014
58
Chart 63: Top 10 causes of death globally 2012 (%)
Source: WHO
Life expectancy gains of 30Y in the past century in many developed countries mean that we have seen a major shift in the cause of mortality from infectious diseases and acute illness to chronic diseases and degenerative illnesses. Some 80% of older adults have one chronic condition, and 50% have at least two (Source: CDC). Going forward, we expect to see a similar shift in EMs, off the back of ageing and changes in lifestyle and diet.
Chart 64: Mortality by age and sex in the world 2010
Source: Global Burden of Disease Study 2010
Chronic diseases hit the elderly hardest Chronic diseases – which disproportionately hit the elderly – are causing increasing numbers of deaths worldwide. Lung cancers (along with trachea and bronchus cancers) caused 1.6mn (2.9%) deaths in 2012, up from 1.2mn (2.2%) in 2000. Similarly, diabetes caused 1.5mn (2.7%) deaths in 2012, up from 1.0mn (2.0%) in 2000 (Source: WHO).
13.2
11.9
5.6 5.5
2.9 2.7
2.7 2.7 2.2
2.0
48.6
Ischaemic heart disease StrokeCOPD Lower respiratory infectionsTrachea, bronchus, lung cancer HIV / AIDSDiabetes Mellitus Diarrhoeal diseasesRoad injury Hypertensive heart diseaseOther causes
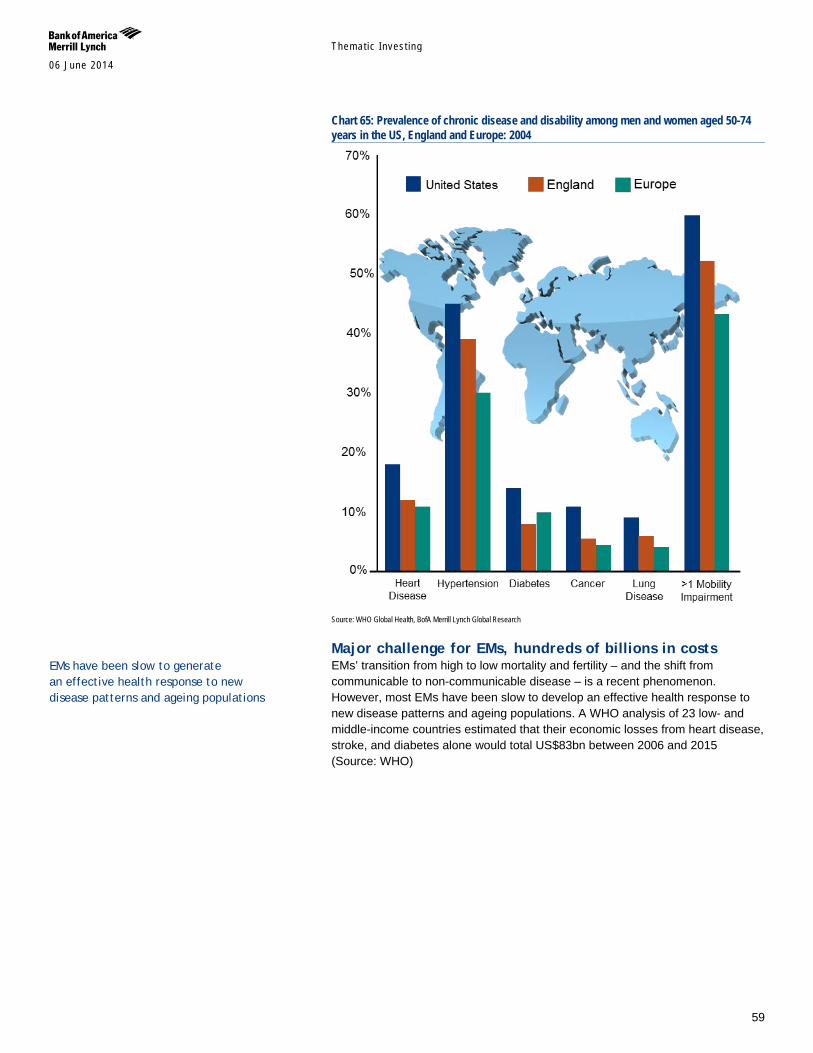
Themat ic Inves t ing 06 June 2014
59
Chart 65: Prevalence of chronic disease and disability among men and women aged 50-74 years in the US, England and Europe: 2004
Source: WHO Global Health, BofA Merrill Lynch Global Research
Major challenge for EMs, hundreds of billions in costs EMs’ transition from high to low mortality and fertility – and the shift from communicable to non-communicable disease – is a recent phenomenon. However, most EMs have been slow to develop an effective health response to new disease patterns and ageing populations. A WHO analysis of 23 low- and middle-income countries estimated that their economic losses from heart disease, stroke, and diabetes alone would total US$83bn between 2006 and 2015 (Source: WHO)
EMs have been slow to generate an effective health response to new disease patterns and ageing populations
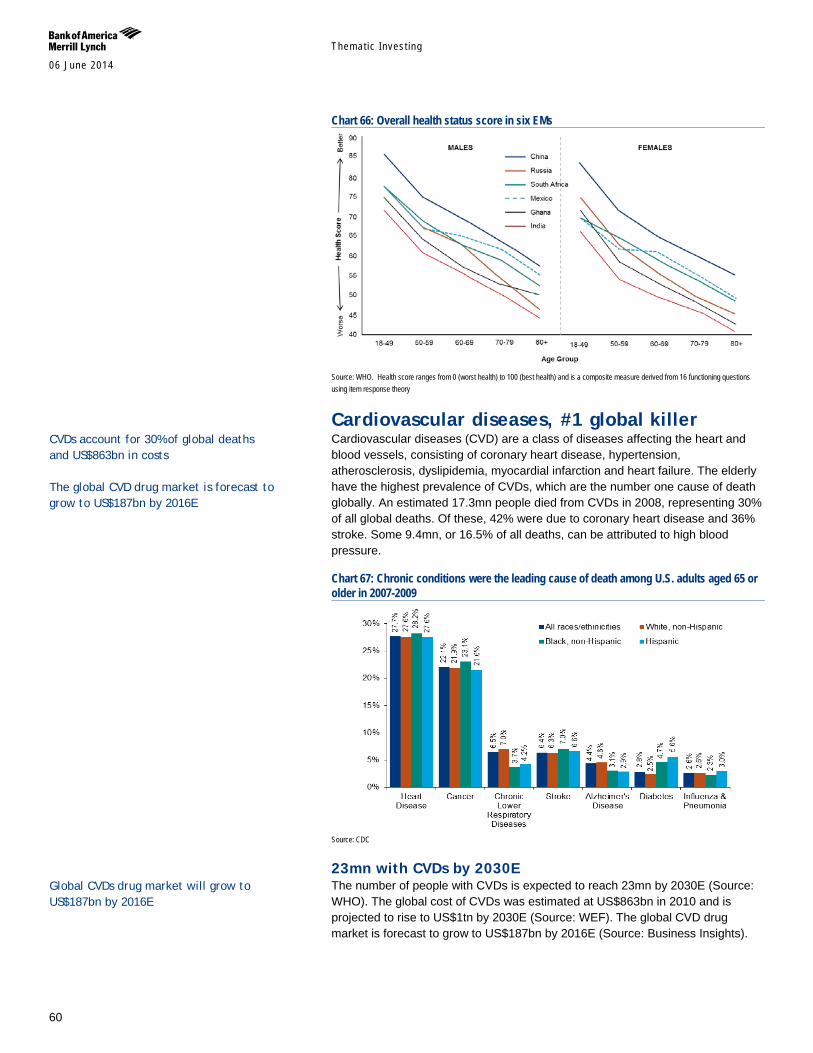
Themat ic Inves t ing 06 June 2014
60
Chart 66: Overall health status score in six EMs
Source: WHO. Health score ranges from 0 (worst health) to 100 (best health) and is a composite measure derived from 16 functioning questions using item response theory
Cardiovascular diseases, #1 global killer Cardiovascular diseases (CVD) are a class of diseases affecting the heart and blood vessels, consisting of coronary heart disease, hypertension, atherosclerosis, dyslipidemia, myocardial infarction and heart failure. The elderly have the highest prevalence of CVDs, which are the number one cause of death globally. An estimated 17.3mn people died from CVDs in 2008, representing 30% of all global deaths. Of these, 42% were due to coronary heart disease and 36% stroke. Some 9.4mn, or 16.5% of all deaths, can be attributed to high blood pressure.
Chart 67: Chronic conditions were the leading cause of death among U.S. adults aged 65 or older in 2007-2009
Source: CDC
23mn with CVDs by 2030E The number of people with CVDs is expected to reach 23mn by 2030E (Source: WHO). The global cost of CVDs was estimated at US$863bn in 2010 and is projected to rise to US$1tn by 2030E (Source: WEF). The global CVD drug market is forecast to grow to US$187bn by 2016E (Source: Business Insights).
CVDs account for 30% of global deaths and US$863bn in costs The global CVD drug market is forecast to grow to US$187bn by 2016E
Global CVDs drug market will grow to US$187bn by 2016E
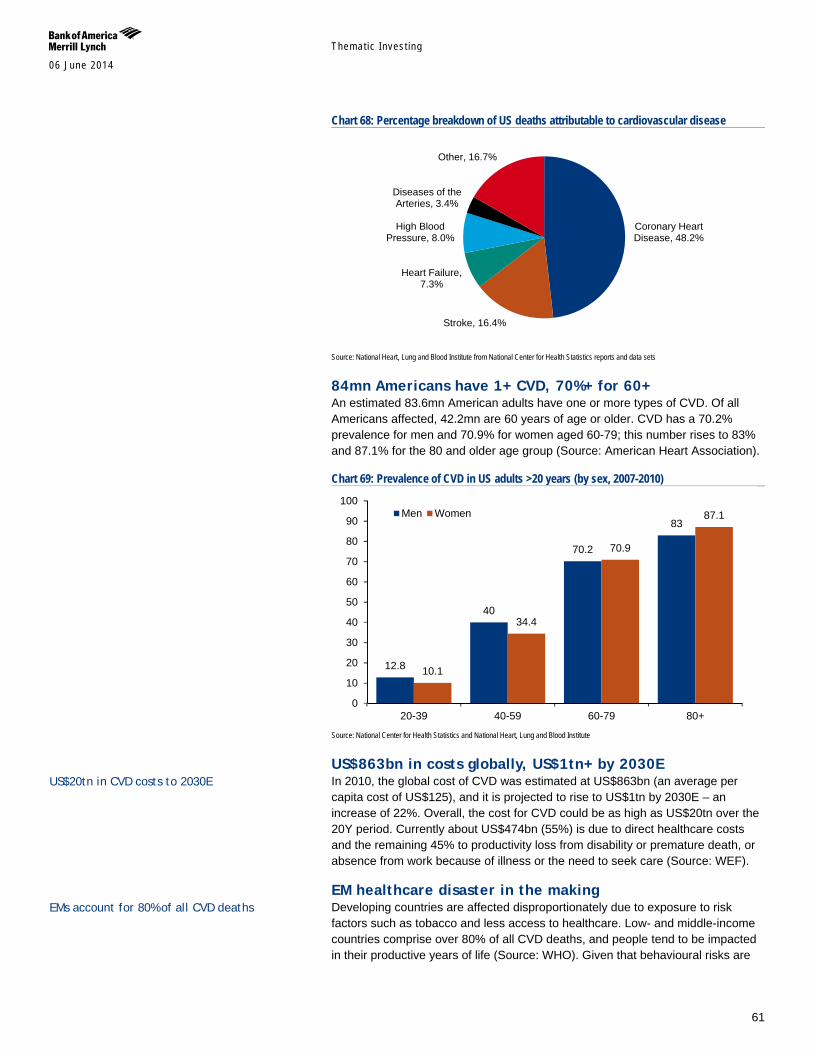
Themat ic Inves t ing 06 June 2014
61
Chart 68: Percentage breakdown of US deaths attributable to cardiovascular disease
Source: National Heart, Lung and Blood Institute from National Center for Health Statistics reports and data sets
84mn Americans have 1+ CVD, 70%+ for 60+ An estimated 83.6mn American adults have one or more types of CVD. Of all Americans affected, 42.2mn are 60 years of age or older. CVD has a 70.2% prevalence for men and 70.9% for women aged 60-79; this number rises to 83% and 87.1% for the 80 and older age group (Source: American Heart Association).
Chart 69: Prevalence of CVD in US adults >20 years (by sex, 2007-2010)
Source: National Center for Health Statistics and National Heart, Lung and Blood Institute
US$863bn in costs globally, US$1tn+ by 2030E In 2010, the global cost of CVD was estimated at US$863bn (an average per capita cost of US$125), and it is projected to rise to US$1tn by 2030E – an increase of 22%. Overall, the cost for CVD could be as high as US$20tn over the 20Y period. Currently about US$474bn (55%) is due to direct healthcare costs and the remaining 45% to productivity loss from disability or premature death, or absence from work because of illness or the need to seek care (Source: WEF).
EM healthcare disaster in the making Developing countries are affected disproportionately due to exposure to risk factors such as tobacco and less access to healthcare. Low- and middle-income countries comprise over 80% of all CVD deaths, and people tend to be impacted in their productive years of life (Source: WHO). Given that behavioural risks are
Coronary Heart Disease, 48.2%
Stroke, 16.4%
Heart Failure, 7.3%
High Blood Pressure, 8.0%
Diseases of the Arteries, 3.4%
Other, 16.7%
12.8
40
70.2
83
10.1
34.4
70.9
87.1
0
10
20
30
40
50
60
70
80
90
100
20-39 40-59 60-79 80+
Men Women
EMs account for 80% of all CVD deaths
US$20tn in CVD costs to 2030E
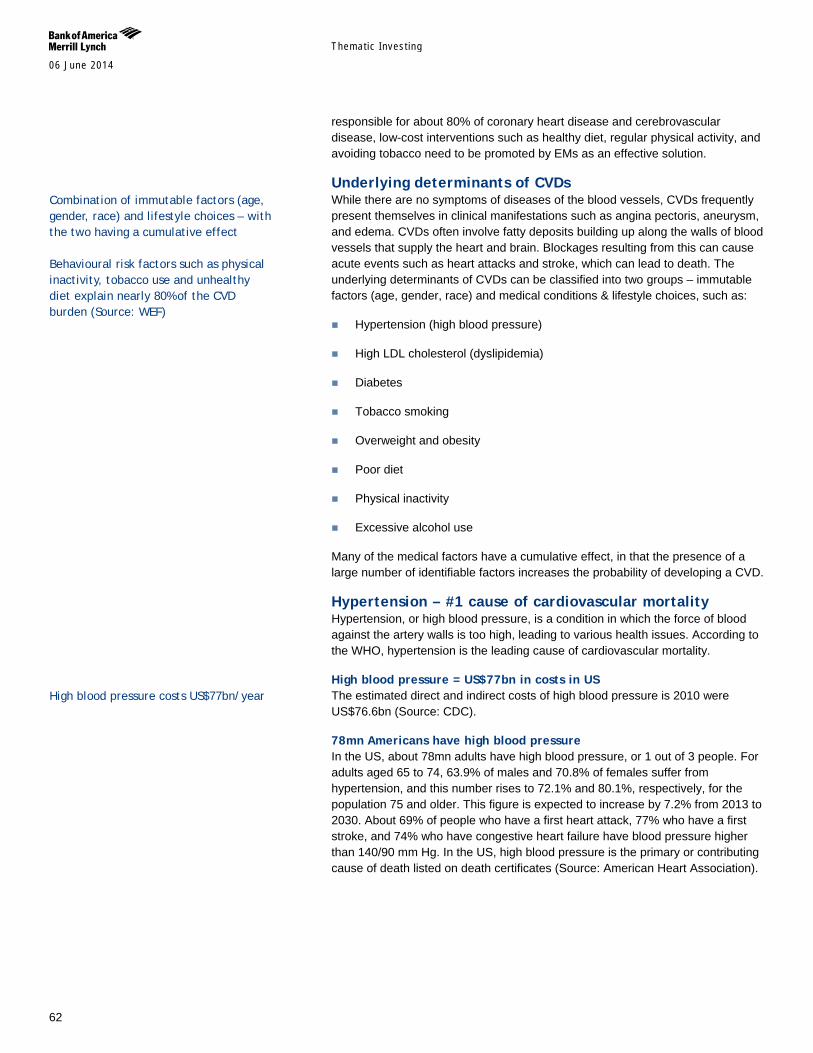
Themat ic Inves t ing 06 June 2014
62
responsible for about 80% of coronary heart disease and cerebrovascular disease, low-cost interventions such as healthy diet, regular physical activity, and avoiding tobacco need to be promoted by EMs as an effective solution.
Underlying determinants of CVDs While there are no symptoms of diseases of the blood vessels, CVDs frequently present themselves in clinical manifestations such as angina pectoris, aneurysm, and edema. CVDs often involve fatty deposits building up along the walls of blood vessels that supply the heart and brain. Blockages resulting from this can cause acute events such as heart attacks and stroke, which can lead to death. The underlying determinants of CVDs can be classified into two groups – immutable factors (age, gender, race) and medical conditions & lifestyle choices, such as:
Hypertension (high blood pressure)
High LDL cholesterol (dyslipidemia)
Diabetes
Tobacco smoking
Overweight and obesity
Poor diet
Physical inactivity
Excessive alcohol use
Many of the medical factors have a cumulative effect, in that the presence of a large number of identifiable factors increases the probability of developing a CVD.
Hypertension – #1 cause of cardiovascular mortality Hypertension, or high blood pressure, is a condition in which the force of blood against the artery walls is too high, leading to various health issues. According to the WHO, hypertension is the leading cause of cardiovascular mortality.
High blood pressure = US$77bn in costs in US The estimated direct and indirect costs of high blood pressure is 2010 were US$76.6bn (Source: CDC).
78mn Americans have high blood pressure In the US, about 78mn adults have high blood pressure, or 1 out of 3 people. For adults aged 65 to 74, 63.9% of males and 70.8% of females suffer from hypertension, and this number rises to 72.1% and 80.1%, respectively, for the population 75 and older. This figure is expected to increase by 7.2% from 2013 to 2030. About 69% of people who have a first heart attack, 77% who have a first stroke, and 74% who have congestive heart failure have blood pressure higher than 140/90 mm Hg. In the US, high blood pressure is the primary or contributing cause of death listed on death certificates (Source: American Heart Association).
Combination of immutable factors (age, gender, race) and lifestyle choices – with the two having a cumulative effect Behavioural risk factors such as physical inactivity, tobacco use and unhealthy diet explain nearly 80% of the CVD burden (Source: WEF)
High blood pressure costs US$77bn/year
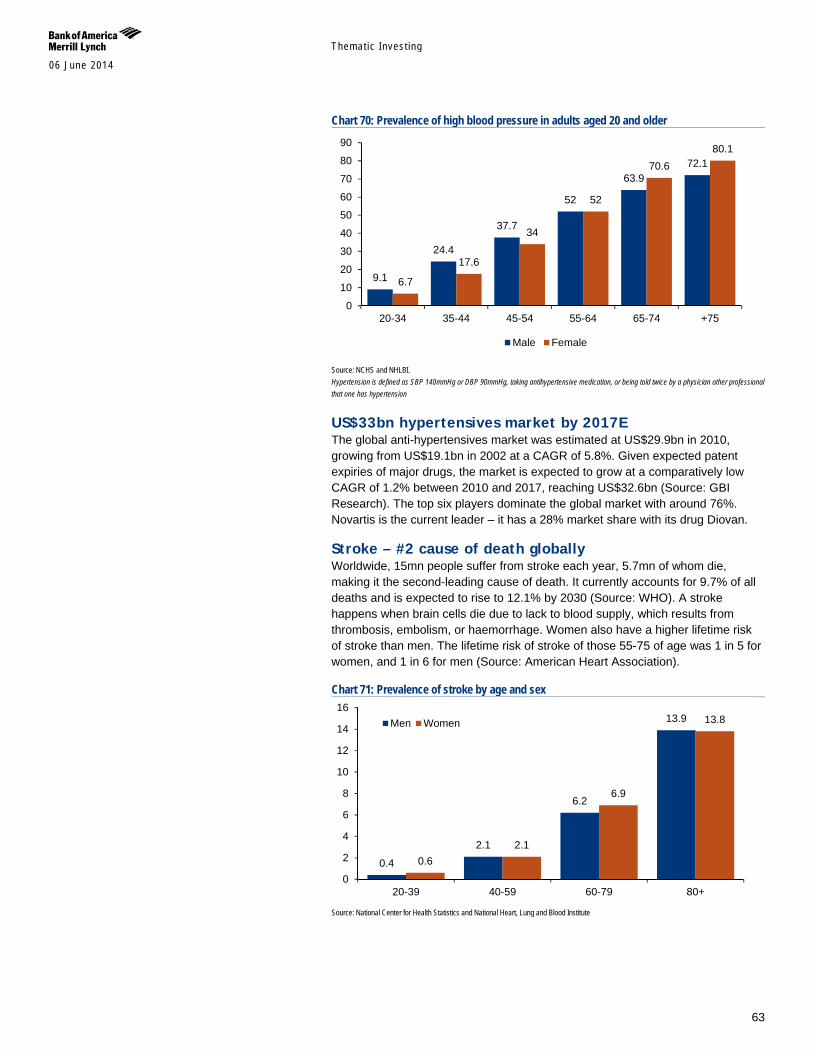
Themat ic Inves t ing 06 June 2014
63
Chart 70: Prevalence of high blood pressure in adults aged 20 and older
Source: NCHS and NHLBI. Hypertension is defined as SBP 140mmHg or DBP 90mmHg, taking antihypertensive medication, or being told twice by a physician other professional that one has hypertension
US$33bn hypertensives market by 2017E The global anti-hypertensives market was estimated at US$29.9bn in 2010, growing from US$19.1bn in 2002 at a CAGR of 5.8%. Given expected patent expiries of major drugs, the market is expected to grow at a comparatively low CAGR of 1.2% between 2010 and 2017, reaching US$32.6bn (Source: GBI Research). The top six players dominate the global market with around 76%. Novartis is the current leader – it has a 28% market share with its drug Diovan.
Stroke – #2 cause of death globally Worldwide, 15mn people suffer from stroke each year, 5.7mn of whom die, making it the second-leading cause of death. It currently accounts for 9.7% of all deaths and is expected to rise to 12.1% by 2030 (Source: WHO). A stroke happens when brain cells die due to lack to blood supply, which results from thrombosis, embolism, or haemorrhage. Women also have a higher lifetime risk of stroke than men. The lifetime risk of stroke of those 55-75 of age was 1 in 5 for women, and 1 in 6 for men (Source: American Heart Association).
Chart 71: Prevalence of stroke by age and sex
Source: National Center for Health Statistics and National Heart, Lung and Blood Institute
9.1
24.4
37.7
52
63.9 72.1
6.7
17.6
34
52
70.6 80.1
0
10
20
30
40
50
60
70
80
90
20-34 35-44 45-54 55-64 65-74 +75
Male Female
0.4
2.1
6.2
13.9
0.6 2.1
6.9
13.8
0
2
4
6
8
10
12
14
16
20-39 40-59 60-79 80+
Men Women
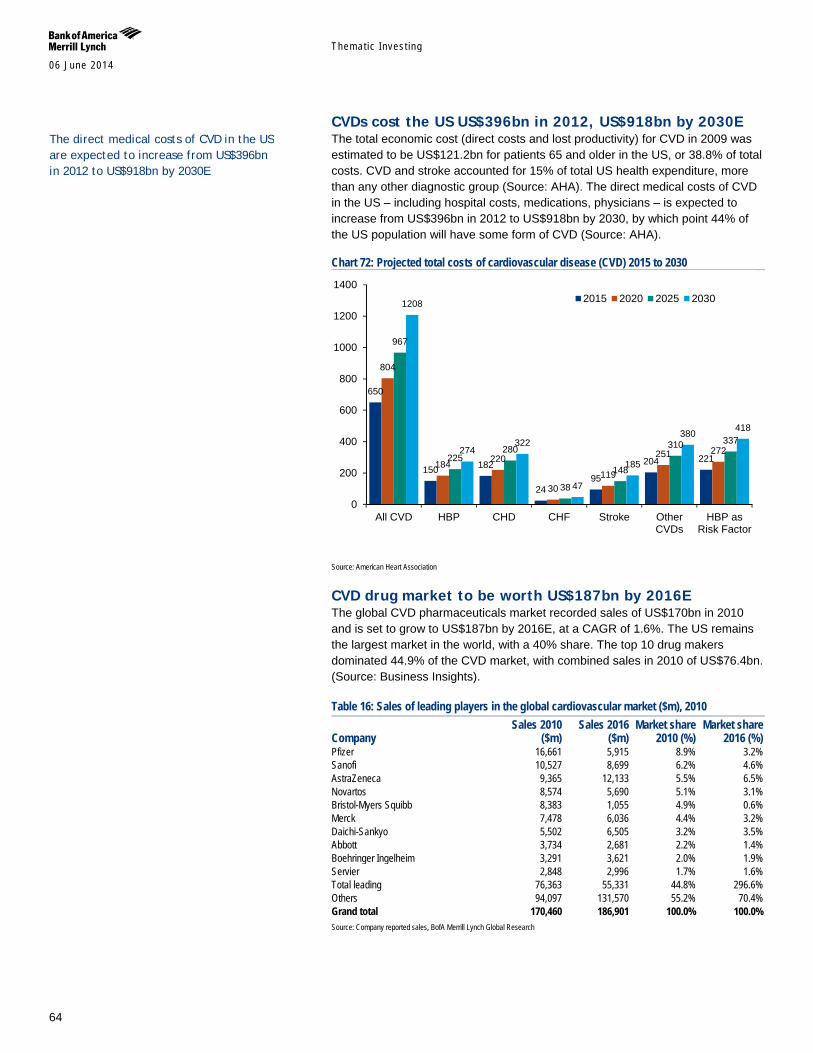
Themat ic Inves t ing 06 June 2014
64
CVDs cost the US US$396bn in 2012, US$918bn by 2030E The total economic cost (direct costs and lost productivity) for CVD in 2009 was estimated to be US$121.2bn for patients 65 and older in the US, or 38.8% of total costs. CVD and stroke accounted for 15% of total US health expenditure, more than any other diagnostic group (Source: AHA). The direct medical costs of CVD in the US – including hospital costs, medications, physicians – is expected to increase from US$396bn in 2012 to US$918bn by 2030, by which point 44% of the US population will have some form of CVD (Source: AHA).
Chart 72: Projected total costs of cardiovascular disease (CVD) 2015 to 2030
Source: American Heart Association
CVD drug market to be worth US$187bn by 2016E The global CVD pharmaceuticals market recorded sales of US$170bn in 2010 and is set to grow to US$187bn by 2016E, at a CAGR of 1.6%. The US remains the largest market in the world, with a 40% share. The top 10 drug makers dominated 44.9% of the CVD market, with combined sales in 2010 of US$76.4bn. (Source: Business Insights).
Table 16: Sales of leading players in the global cardiovascular market ($m), 2010
Company Sales 2010
($m) Sales 2016
($m) Market share
2010 (%) Market share
2016 (%) Pfizer 16,661 5,915 8.9% 3.2% Sanofi 10,527 8,699 6.2% 4.6% AstraZeneca 9,365 12,133 5.5% 6.5% Novartos 8,574 5,690 5.1% 3.1% Bristol-Myers Squibb 8,383 1,055 4.9% 0.6% Merck 7,478 6,036 4.4% 3.2% Daichi-Sankyo 5,502 6,505 3.2% 3.5% Abbott 3,734 2,681 2.2% 1.4% Boehringer Ingelheim 3,291 3,621 2.0% 1.9% Servier 2,848 2,996 1.7% 1.6% Total leading 76,363 55,331 44.8% 296.6% Others 94,097 131,570 55.2% 70.4% Grand total 170,460 186,901 100.0% 100.0% Source: Company reported sales, BofA Merrill Lynch Global Research
650
150 182
24 95
204 221
804
184 220
30 119
251 272
967
225 280
38
148
310 337
1208
274 322
47
185
380 418
0
200
400
600
800
1000
1200
1400
All CVD HBP CHD CHF Stroke OtherCVDs
HBP asRisk Factor
2015 2020 2025 2030
The direct medical costs of CVD in the US are expected to increase from US$396bn in 2012 to US$918bn by 2030E
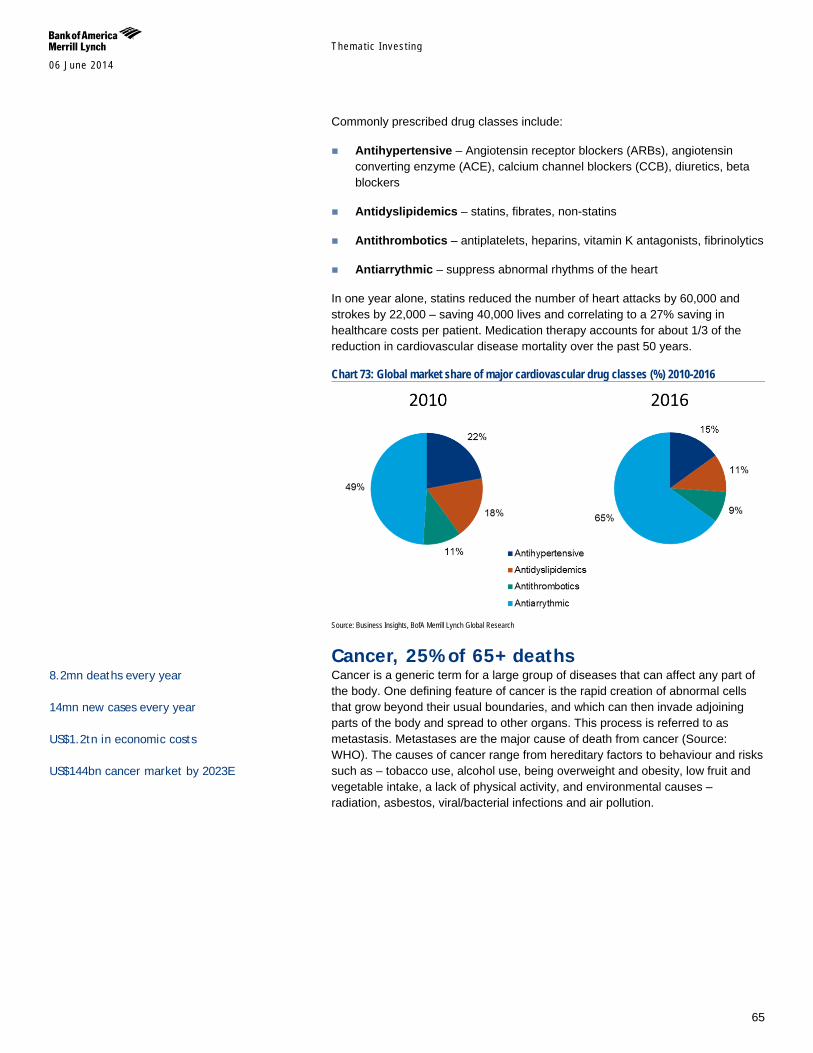
Themat ic Inves t ing 06 June 2014
65
Commonly prescribed drug classes include:
Antihypertensive – Angiotensin receptor blockers (ARBs), angiotensin converting enzyme (ACE), calcium channel blockers (CCB), diuretics, beta blockers
Antidyslipidemics – statins, fibrates, non-statins
Antithrombotics – antiplatelets, heparins, vitamin K antagonists, fibrinolytics
Antiarrythmic – suppress abnormal rhythms of the heart
In one year alone, statins reduced the number of heart attacks by 60,000 and strokes by 22,000 – saving 40,000 lives and correlating to a 27% saving in healthcare costs per patient. Medication therapy accounts for about 1/3 of the reduction in cardiovascular disease mortality over the past 50 years.
Chart 73: Global market share of major cardiovascular drug classes (%) 2010-2016
Source: Business Insights, BofA Merrill Lynch Global Research
Cancer, 25% of 65+ deaths Cancer is a generic term for a large group of diseases that can affect any part of the body. One defining feature of cancer is the rapid creation of abnormal cells that grow beyond their usual boundaries, and which can then invade adjoining parts of the body and spread to other organs. This process is referred to as metastasis. Metastases are the major cause of death from cancer (Source: WHO). The causes of cancer range from hereditary factors to behaviour and risks such as – tobacco use, alcohol use, being overweight and obesity, low fruit and vegetable intake, a lack of physical activity, and environmental causes – radiation, asbestos, viral/bacterial infections and air pollution.
8.2mn deaths every year 14mn new cases every year US$1.2tn in economic costs US$144bn cancer market by 2023E
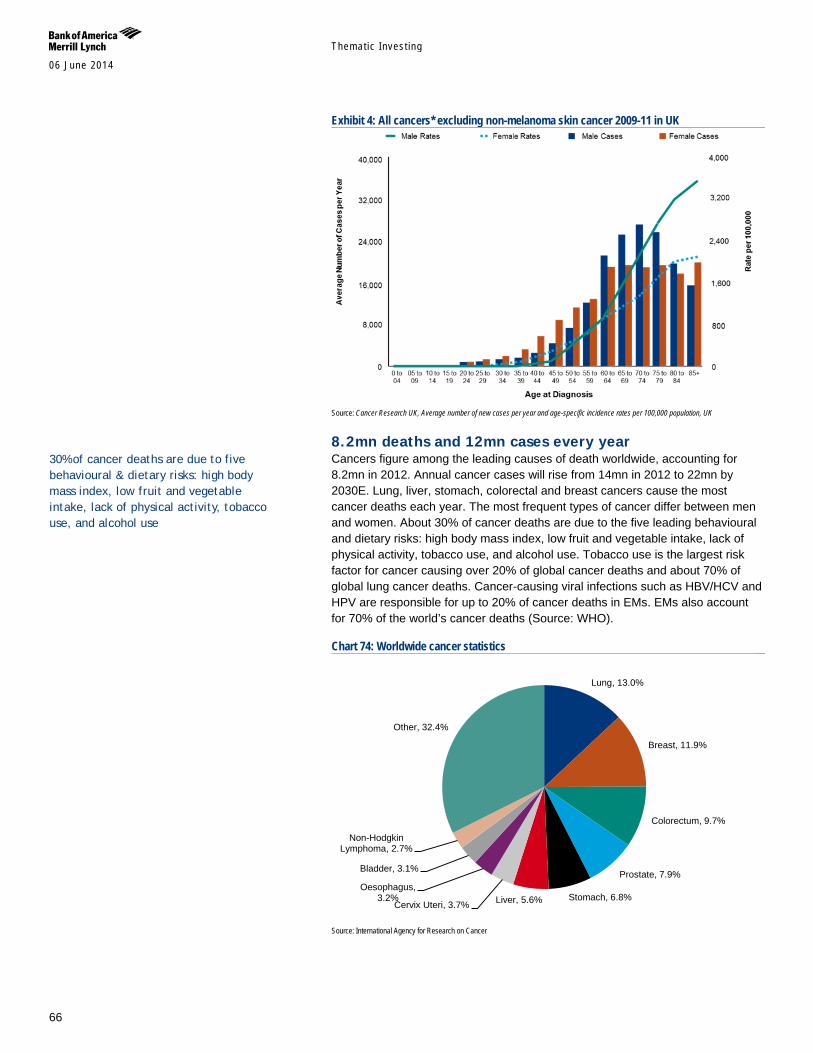
Themat ic Inves t ing 06 June 2014
66
Exhibit 4: All cancers* excluding non-melanoma skin cancer 2009-11 in UK
Source: Cancer Research UK, Average number of new cases per year and age-specific incidence rates per 100,000 population, UK
8.2mn deaths and 12mn cases every year Cancers figure among the leading causes of death worldwide, accounting for 8.2mn in 2012. Annual cancer cases will rise from 14mn in 2012 to 22mn by 2030E. Lung, liver, stomach, colorectal and breast cancers cause the most cancer deaths each year. The most frequent types of cancer differ between men and women. About 30% of cancer deaths are due to the five leading behavioural and dietary risks: high body mass index, low fruit and vegetable intake, lack of physical activity, tobacco use, and alcohol use. Tobacco use is the largest risk factor for cancer causing over 20% of global cancer deaths and about 70% of global lung cancer deaths. Cancer-causing viral infections such as HBV/HCV and HPV are responsible for up to 20% of cancer deaths in EMs. EMs also account for 70% of the world’s cancer deaths (Source: WHO).
Chart 74: Worldwide cancer statistics
Source: International Agency for Research on Cancer
Lung, 13.0%
Breast, 11.9%
Colorectum, 9.7%
Prostate, 7.9%
Stomach, 6.8% Liver, 5.6% Cervix Uteri, 3.7%
Oesophagus, 3.2%
Bladder, 3.1%
Non-Hodgkin Lymphoma, 2.7%
Other, 32.4%
30% of cancer deaths are due to five behavioural & dietary risks: high body mass index, low fruit and vegetable intake, lack of physical activity, tobacco use, and alcohol use
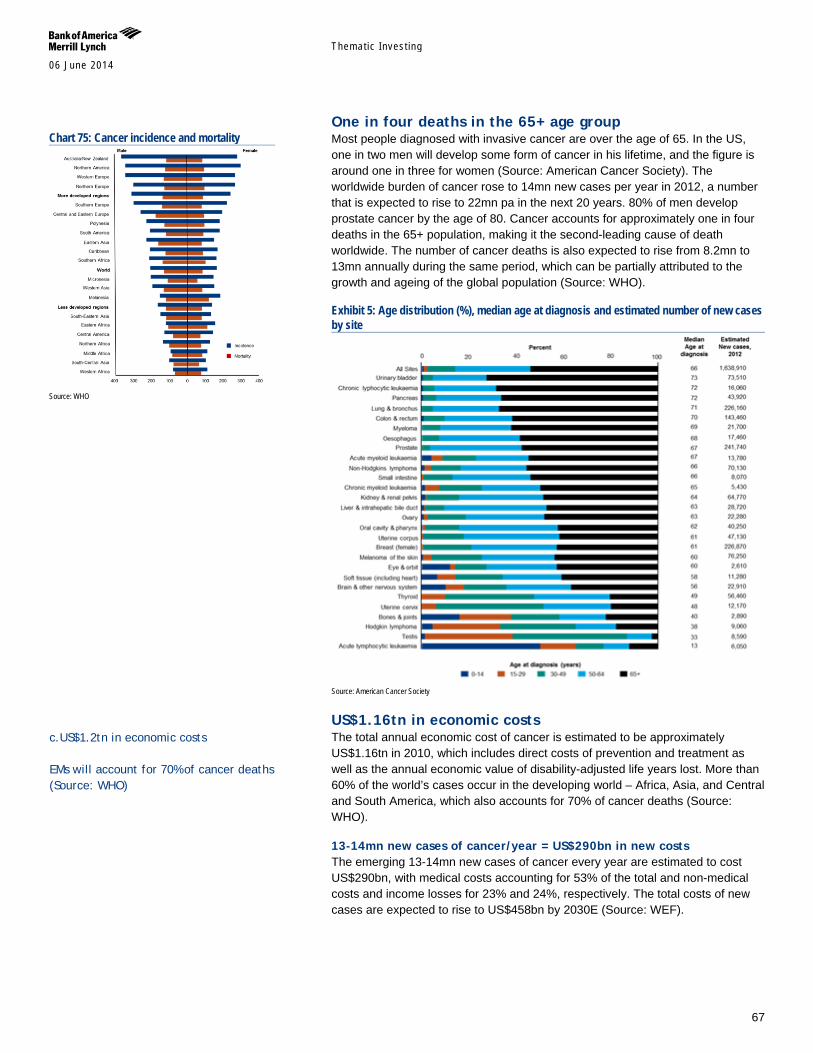
Themat ic Inves t ing 06 June 2014
67
One in four deaths in the 65+ age group Most people diagnosed with invasive cancer are over the age of 65. In the US, one in two men will develop some form of cancer in his lifetime, and the figure is around one in three for women (Source: American Cancer Society). The worldwide burden of cancer rose to 14mn new cases per year in 2012, a number that is expected to rise to 22mn pa in the next 20 years. 80% of men develop prostate cancer by the age of 80. Cancer accounts for approximately one in four deaths in the 65+ population, making it the second-leading cause of death worldwide. The number of cancer deaths is also expected to rise from 8.2mn to 13mn annually during the same period, which can be partially attributed to the growth and ageing of the global population (Source: WHO).
Exhibit 5: Age distribution (%), median age at diagnosis and estimated number of new cases by site
Source: American Cancer Society
US$1.16tn in economic costs The total annual economic cost of cancer is estimated to be approximately US$1.16tn in 2010, which includes direct costs of prevention and treatment as well as the annual economic value of disability-adjusted life years lost. More than 60% of the world’s cases occur in the developing world – Africa, Asia, and Central and South America, which also accounts for 70% of cancer deaths (Source: WHO).
13-14mn new cases of cancer/year = US$290bn in new costs The emerging 13-14mn new cases of cancer every year are estimated to cost US$290bn, with medical costs accounting for 53% of the total and non-medical costs and income losses for 23% and 24%, respectively. The total costs of new cases are expected to rise to US$458bn by 2030E (Source: WEF).
Chart 75: Cancer incidence and mortality
Source: WHO
c.US$1.2tn in economic costs EMs will account for 70% of cancer deaths (Source: WHO)
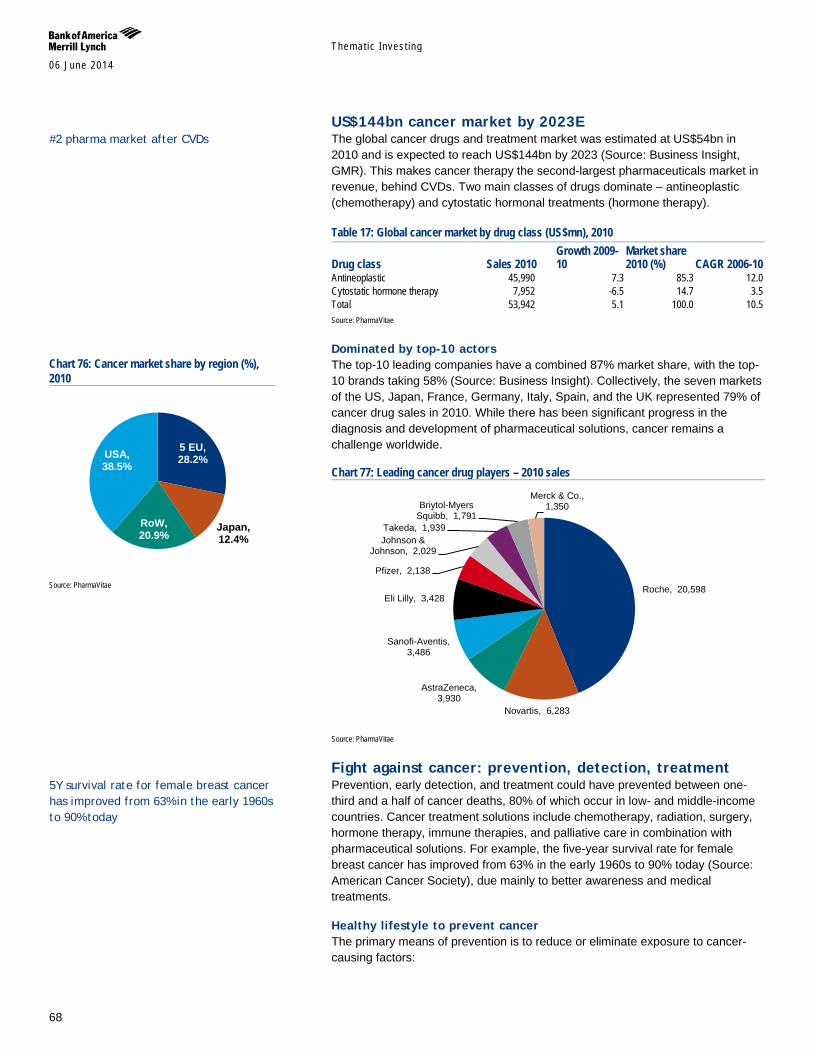
Themat ic Inves t ing 06 June 2014
68
US$144bn cancer market by 2023E The global cancer drugs and treatment market was estimated at US$54bn in 2010 and is expected to reach US$144bn by 2023 (Source: Business Insight, GMR). This makes cancer therapy the second-largest pharmaceuticals market in revenue, behind CVDs. Two main classes of drugs dominate – antineoplastic (chemotherapy) and cytostatic hormonal treatments (hormone therapy).
Table 17: Global cancer market by drug class (US$mn), 2010
Drug class Sales 2010 Growth 2009-10
Market share 2010 (%) CAGR 2006-10
Antineoplastic 45,990 7.3 85.3 12.0 Cytostatic hormone therapy 7,952 -6.5 14.7 3.5 Total 53,942 5.1 100.0 10.5 Source: PharmaVitae
Dominated by top-10 actors The top-10 leading companies have a combined 87% market share, with the top-10 brands taking 58% (Source: Business Insight). Collectively, the seven markets of the US, Japan, France, Germany, Italy, Spain, and the UK represented 79% of cancer drug sales in 2010. While there has been significant progress in the diagnosis and development of pharmaceutical solutions, cancer remains a challenge worldwide.
Chart 77: Leading cancer drug players – 2010 sales
Source: PharmaVitae
Fight against cancer: prevention, detection, treatment Prevention, early detection, and treatment could have prevented between one-third and a half of cancer deaths, 80% of which occur in low- and middle-income countries. Cancer treatment solutions include chemotherapy, radiation, surgery, hormone therapy, immune therapies, and palliative care in combination with pharmaceutical solutions. For example, the five-year survival rate for female breast cancer has improved from 63% in the early 1960s to 90% today (Source: American Cancer Society), due mainly to better awareness and medical treatments.
Healthy lifestyle to prevent cancer The primary means of prevention is to reduce or eliminate exposure to cancer-causing factors:
Roche, 20,598
Novartis, 6,283
AstraZeneca, 3,930
Sanofi-Aventis, 3,486
Eli Lilly, 3,428
Pfizer, 2,138
Johnson & Johnson, 2,029
Takeda, 1,939
Briytol-Myers Squibb, 1,791
Merck & Co., 1,350
Chart 76: Cancer market share by region (%), 2010
Source: PharmaVitae
5 EU, 28.2%
Japan, 12.4%
RoW, 20.9%
USA, 38.5%
#2 pharma market after CVDs
5Y survival rate for female breast cancer has improved from 63% in the early 1960s to 90% today

Themat ic Inves t ing 06 June 2014
69
Reduce alcohol and tobacco intake
Maintain healthy body weight through better nutrition and exercise
Avoid excessive sun exposure
Reduce occupational exposure to carcinogens
Early detection for more effective treatment Screening tests for early detection of cancers provide patients with a greater opportunity to obtain effective treatment.
Cancer screening – mammography for breast cancer; pap test for cervical cancer; the fecal occult blood test for colorectal cancer; and a colorectal endoscopy for colorectal cancer.
Genetic testing for genes that predisposes individuals to cancer – BRCA1 and BRCA2 for breast, ovarian, and pancreatic cancer; and HNPCC, MLH1, MSH2, MSH6, PMS1, and PMS2 for colon, uterine, small bowel, stomach, and urinary tract cancer. Other commonly screened genes include PTEN, APC, RB1, MEN1, RET, and VHL. Hereditary genetic mutations are responsible for 5-10% of all cancers.
Treatment solutions Surgery – possible for early stage cancer, often before the tumour
metastasizes. More common for skin, lung, breast, kidney, and colon cancer.
Radiation – using high-energy beams to kill rapidly dividing cancer cells, usually safe and effective in older adults.
Chemotherapy – drug treatment for cancer; older people may suffer more organ damage and greater difficulty in breaking down the toxins from the drug.
Hormone therapy – often used in conjunction with other therapies; more common for breast, prostate, endometrium cancers; used to prevent cancer recurring.
Immunotherapy – often used in conjunction with other therapies; uses the immune system to fight cancer; attractive option for older adults.
Dementia + Alzheimer’s, US$1tn in costs 2030E Dementia is a syndrome characterised by deterioration in cognitive function. It affects memory, thinking, orientation, comprehension, calculation, learning capacity, language and judgement and hampers the ability to perform everyday activities. Worldwide, 36mn people have dementia and this figure is expected to triple by 2050E (Source: WHO). The global cost of dementia is estimated to be US$605bn (Source: World Alzheimer Report). Assuming the cost of care increases in line with the prevalence of dementia, the cost of the condition will rise to US$1.12tn by 2030 (Source: World Alzheimer Report). There is no proven effective measure in preventing or treating the underlying causes of Alzheimer’s disease, and a cure is considered to be a “holy grail” for the pharmaceutical industry.
36mn people have dementia and there are close to 8mn new cases every year Alzheimer’s and dementia cost US$605bn every year, 1% of global GDP
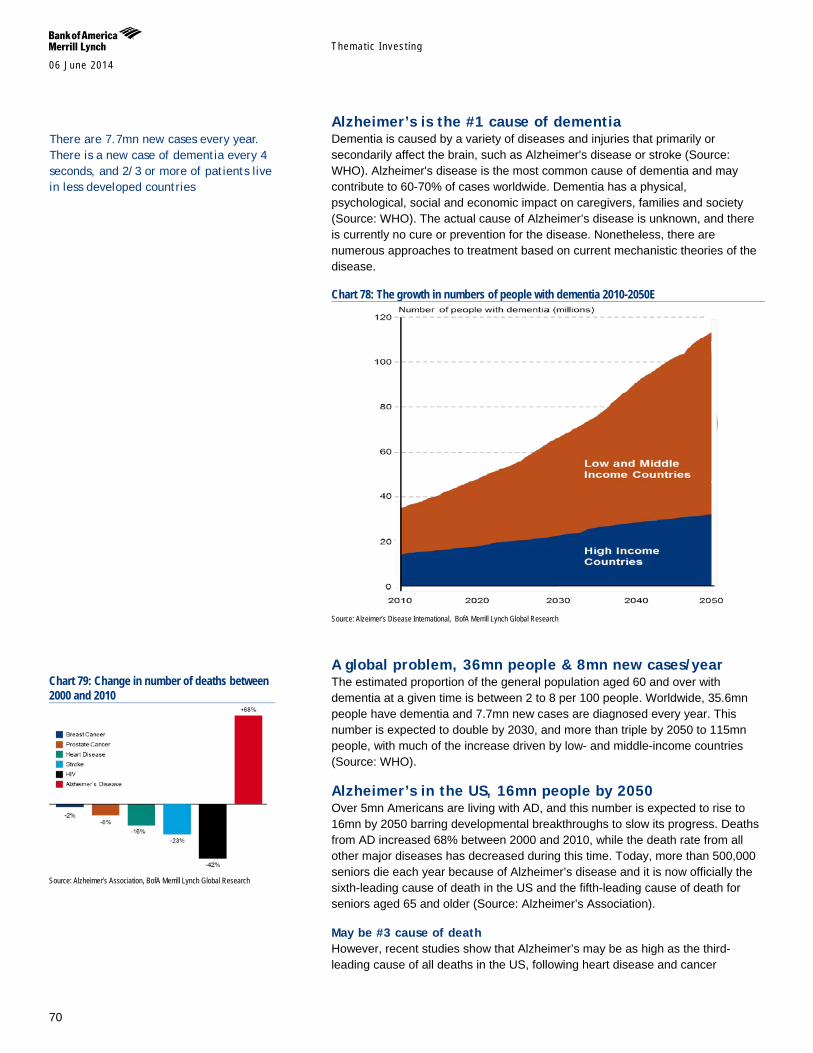
Themat ic Inves t ing 06 June 2014
70
Alzheimer’s is the #1 cause of dementia Dementia is caused by a variety of diseases and injuries that primarily or secondarily affect the brain, such as Alzheimer's disease or stroke (Source: WHO). Alzheimer's disease is the most common cause of dementia and may contribute to 60-70% of cases worldwide. Dementia has a physical, psychological, social and economic impact on caregivers, families and society (Source: WHO). The actual cause of Alzheimer’s disease is unknown, and there is currently no cure or prevention for the disease. Nonetheless, there are numerous approaches to treatment based on current mechanistic theories of the disease.
Chart 78: The growth in numbers of people with dementia 2010-2050E
Source: Alzeimer’s Disease International, BofA Merrill Lynch Global Research
A global problem, 36mn people & 8mn new cases/year The estimated proportion of the general population aged 60 and over with dementia at a given time is between 2 to 8 per 100 people. Worldwide, 35.6mn people have dementia and 7.7mn new cases are diagnosed every year. This number is expected to double by 2030, and more than triple by 2050 to 115mn people, with much of the increase driven by low- and middle-income countries (Source: WHO).
Alzheimer’s in the US, 16mn people by 2050 Over 5mn Americans are living with AD, and this number is expected to rise to 16mn by 2050 barring developmental breakthroughs to slow its progress. Deaths from AD increased 68% between 2000 and 2010, while the death rate from all other major diseases has decreased during this time. Today, more than 500,000 seniors die each year because of Alzheimer’s disease and it is now officially the sixth-leading cause of death in the US and the fifth-leading cause of death for seniors aged 65 and older (Source: Alzheimer’s Association).
May be #3 cause of death However, recent studies show that Alzheimer’s may be as high as the third-leading cause of all deaths in the US, following heart disease and cancer
Chart 79: Change in number of deaths between 2000 and 2010
Source: Alzheimer’s Association, BofA Merrill Lynch Global Research
There are 7.7mn new cases every year. There is a new case of dementia every 4 seconds, and 2/3 or more of patients live in less developed countries
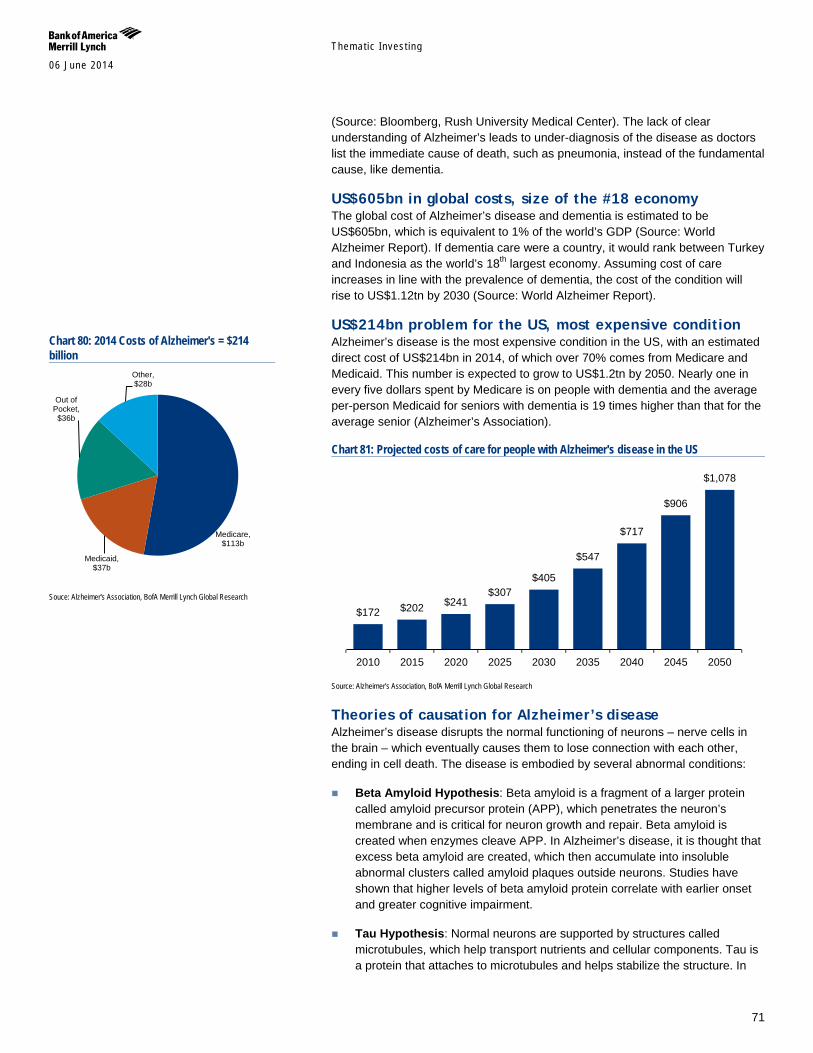
Themat ic Inves t ing 06 June 2014
71
(Source: Bloomberg, Rush University Medical Center). The lack of clear understanding of Alzheimer’s leads to under-diagnosis of the disease as doctors list the immediate cause of death, such as pneumonia, instead of the fundamental cause, like dementia.
US$605bn in global costs, size of the #18 economy The global cost of Alzheimer’s disease and dementia is estimated to be US$605bn, which is equivalent to 1% of the world’s GDP (Source: World Alzheimer Report). If dementia care were a country, it would rank between Turkey and Indonesia as the world’s 18th largest economy. Assuming cost of care increases in line with the prevalence of dementia, the cost of the condition will rise to US$1.12tn by 2030 (Source: World Alzheimer Report).
US$214bn problem for the US, most expensive condition Alzheimer’s disease is the most expensive condition in the US, with an estimated direct cost of US$214bn in 2014, of which over 70% comes from Medicare and Medicaid. This number is expected to grow to US$1.2tn by 2050. Nearly one in every five dollars spent by Medicare is on people with dementia and the average per-person Medicaid for seniors with dementia is 19 times higher than that for the average senior (Alzheimer’s Association).
Chart 81: Projected costs of care for people with Alzheimer's disease in the US
Source: Alzheimer's Association, BofA Merrill Lynch Global Research
Theories of causation for Alzheimer’s disease Alzheimer’s disease disrupts the normal functioning of neurons – nerve cells in the brain – which eventually causes them to lose connection with each other, ending in cell death. The disease is embodied by several abnormal conditions:
Beta Amyloid Hypothesis: Beta amyloid is a fragment of a larger protein called amyloid precursor protein (APP), which penetrates the neuron’s membrane and is critical for neuron growth and repair. Beta amyloid is created when enzymes cleave APP. In Alzheimer’s disease, it is thought that excess beta amyloid are created, which then accumulate into insoluble abnormal clusters called amyloid plaques outside neurons. Studies have shown that higher levels of beta amyloid protein correlate with earlier onset and greater cognitive impairment.
Tau Hypothesis: Normal neurons are supported by structures called microtubules, which help transport nutrients and cellular components. Tau is a protein that attaches to microtubules and helps stabilize the structure. In
$172 $202 $241 $307
$405
$547
$717
$906
$1,078
2010 2015 2020 2025 2030 2035 2040 2045 2050
Chart 80: 2014 Costs of Alzheimer's = $214 billion
Souce: Alzheimer's Association, BofA Merrill Lynch Global Research
Medicare, $113b
Medicaid, $37b
Out of Pocket, $36b
Other, $28b
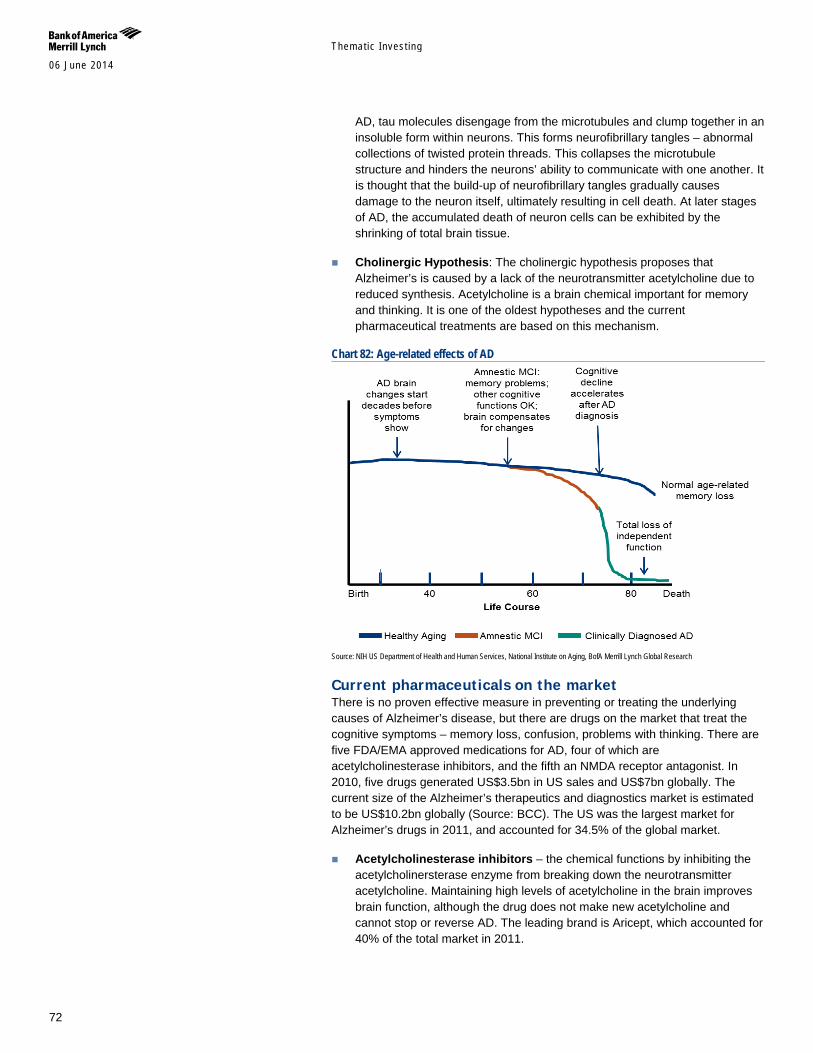
Themat ic Inves t ing 06 June 2014
72
AD, tau molecules disengage from the microtubules and clump together in an insoluble form within neurons. This forms neurofibrillary tangles – abnormal collections of twisted protein threads. This collapses the microtubule structure and hinders the neurons’ ability to communicate with one another. It is thought that the build-up of neurofibrillary tangles gradually causes damage to the neuron itself, ultimately resulting in cell death. At later stages of AD, the accumulated death of neuron cells can be exhibited by the shrinking of total brain tissue.
Cholinergic Hypothesis: The cholinergic hypothesis proposes that Alzheimer’s is caused by a lack of the neurotransmitter acetylcholine due to reduced synthesis. Acetylcholine is a brain chemical important for memory and thinking. It is one of the oldest hypotheses and the current pharmaceutical treatments are based on this mechanism.
Chart 82: Age-related effects of AD
Source: NIH US Department of Health and Human Services, National Institute on Aging, BofA Merrill Lynch Global Research
Current pharmaceuticals on the market There is no proven effective measure in preventing or treating the underlying causes of Alzheimer’s disease, but there are drugs on the market that treat the cognitive symptoms – memory loss, confusion, problems with thinking. There are five FDA/EMA approved medications for AD, four of which are acetylcholinesterase inhibitors, and the fifth an NMDA receptor antagonist. In 2010, five drugs generated US$3.5bn in US sales and US$7bn globally. The current size of the Alzheimer’s therapeutics and diagnostics market is estimated to be US$10.2bn globally (Source: BCC). The US was the largest market for Alzheimer’s drugs in 2011, and accounted for 34.5% of the global market.
Acetylcholinesterase inhibitors – the chemical functions by inhibiting the acetylcholinersterase enzyme from breaking down the neurotransmitter acetylcholine. Maintaining high levels of acetylcholine in the brain improves brain function, although the drug does not make new acetylcholine and cannot stop or reverse AD. The leading brand is Aricept, which accounted for 40% of the total market in 2011.
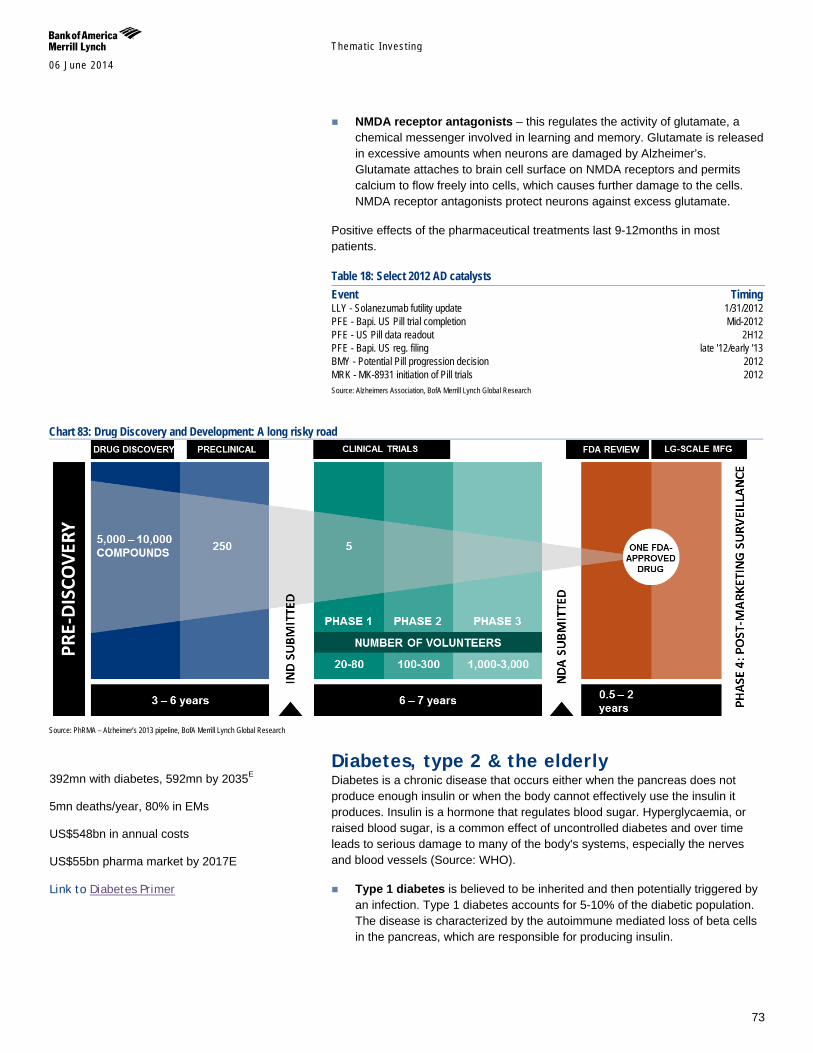
Themat ic Inves t ing 06 June 2014
73
NMDA receptor antagonists – this regulates the activity of glutamate, a chemical messenger involved in learning and memory. Glutamate is released in excessive amounts when neurons are damaged by Alzheimer’s. Glutamate attaches to brain cell surface on NMDA receptors and permits calcium to flow freely into cells, which causes further damage to the cells. NMDA receptor antagonists protect neurons against excess glutamate.
Positive effects of the pharmaceutical treatments last 9-12months in most patients.
Table 18: Select 2012 AD catalysts Event Timing LLY - Solanezumab futility update 1/31/2012 PFE - Bapi. US Pill trial completion Mid-2012 PFE - US Pill data readout 2H12 PFE - Bapi. US reg. filing late '12/early '13 BMY - Potential Pill progression decision 2012 MRK - MK-8931 initiation of Pill trials 2012 Source: Alzheimers Association, BofA Merrill Lynch Global Research
Chart 83: Drug Discovery and Development: A long risky road
Source: PhRMA – Alzheimer’s 2013 pipeline, BofA Merrill Lynch Global Research
Diabetes, type 2 & the elderly Diabetes is a chronic disease that occurs either when the pancreas does not produce enough insulin or when the body cannot effectively use the insulin it produces. Insulin is a hormone that regulates blood sugar. Hyperglycaemia, or raised blood sugar, is a common effect of uncontrolled diabetes and over time leads to serious damage to many of the body's systems, especially the nerves and blood vessels (Source: WHO).
Type 1 diabetes is believed to be inherited and then potentially triggered by an infection. Type 1 diabetes accounts for 5-10% of the diabetic population. The disease is characterized by the autoimmune mediated loss of beta cells in the pancreas, which are responsible for producing insulin.
392mn with diabetes, 592mn by 2035E 5mn deaths/year, 80% in EMs US$548bn in annual costs US$55bn pharma market by 2017E
Link to Diabetes Primer
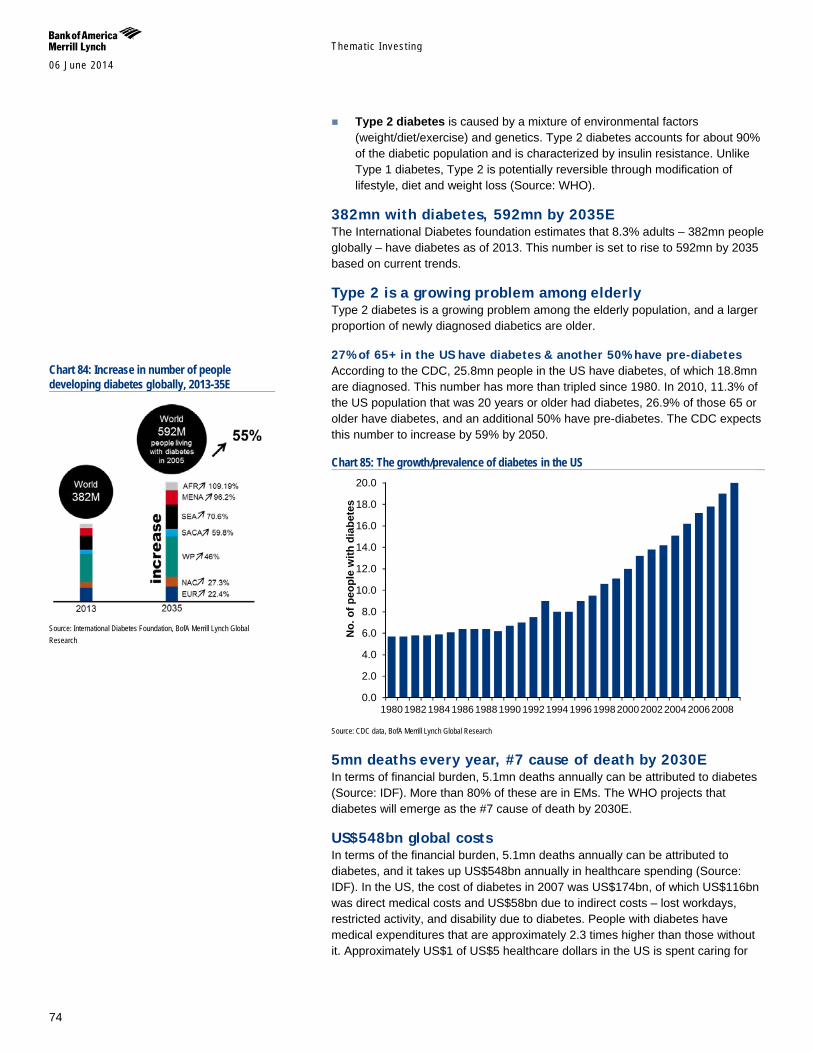
Themat ic Inves t ing 06 June 2014
74
Type 2 diabetes is caused by a mixture of environmental factors (weight/diet/exercise) and genetics. Type 2 diabetes accounts for about 90% of the diabetic population and is characterized by insulin resistance. Unlike Type 1 diabetes, Type 2 is potentially reversible through modification of lifestyle, diet and weight loss (Source: WHO).
382mn with diabetes, 592mn by 2035E The International Diabetes foundation estimates that 8.3% adults – 382mn people globally – have diabetes as of 2013. This number is set to rise to 592mn by 2035 based on current trends.
Type 2 is a growing problem among elderly Type 2 diabetes is a growing problem among the elderly population, and a larger proportion of newly diagnosed diabetics are older.
27% of 65+ in the US have diabetes & another 50% have pre-diabetes According to the CDC, 25.8mn people in the US have diabetes, of which 18.8mn are diagnosed. This number has more than tripled since 1980. In 2010, 11.3% of the US population that was 20 years or older had diabetes, 26.9% of those 65 or older have diabetes, and an additional 50% have pre-diabetes. The CDC expects this number to increase by 59% by 2050.
Chart 85: The growth/prevalence of diabetes in the US
Source: CDC data, BofA Merrill Lynch Global Research
5mn deaths every year, #7 cause of death by 2030E In terms of financial burden, 5.1mn deaths annually can be attributed to diabetes (Source: IDF). More than 80% of these are in EMs. The WHO projects that diabetes will emerge as the #7 cause of death by 2030E.
US$548bn global costs In terms of the financial burden, 5.1mn deaths annually can be attributed to diabetes, and it takes up US$548bn annually in healthcare spending (Source: IDF). In the US, the cost of diabetes in 2007 was US$174bn, of which US$116bn was direct medical costs and US$58bn due to indirect costs – lost workdays, restricted activity, and disability due to diabetes. People with diabetes have medical expenditures that are approximately 2.3 times higher than those without it. Approximately US$1 of US$5 healthcare dollars in the US is spent caring for
0.0
2.0
4.0
6.0
8.0
10.0
12.0
14.0
16.0
18.0
20.0
1980 1982 1984 1986 1988 1990 1992 1994 1996 1998 2000 2002 2004 2006 2008
No.
of p
eopl
e w
ith d
iabe
tes
Chart 84: Increase in number of people developing diabetes globally, 2013-35E
Source: International Diabetes Foundation, BofA Merrill Lynch Global Research
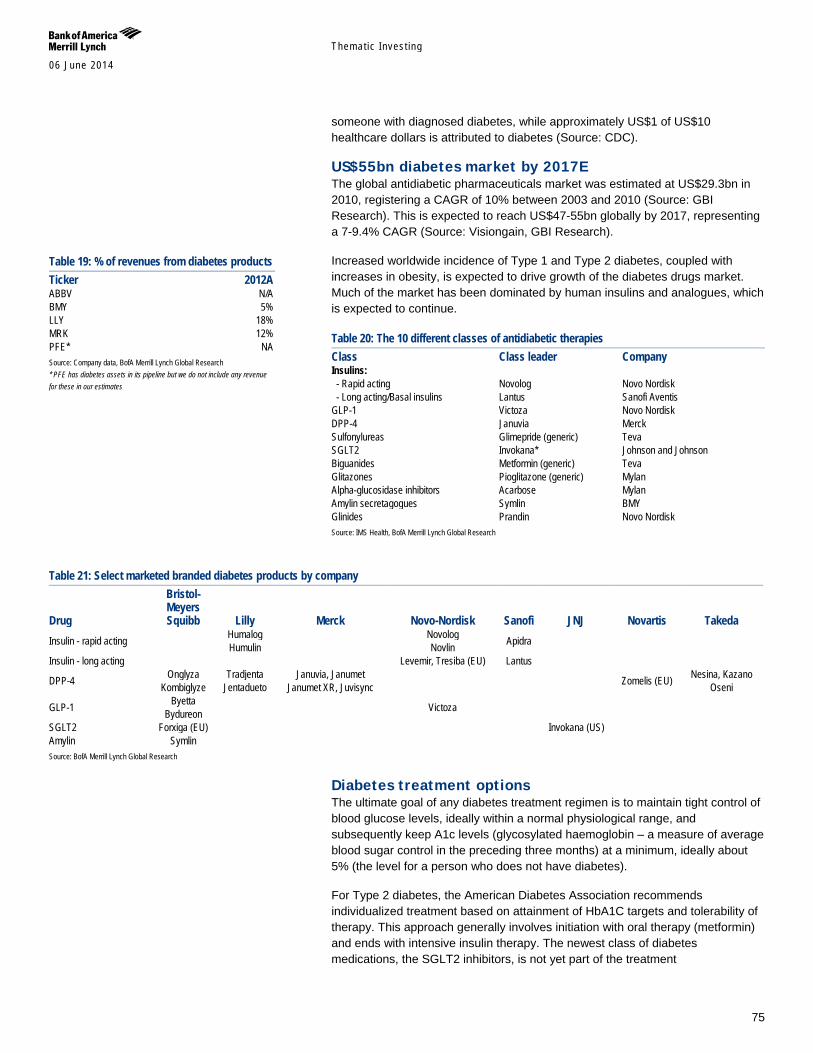
Themat ic Inves t ing 06 June 2014
75
someone with diagnosed diabetes, while approximately US$1 of US$10 healthcare dollars is attributed to diabetes (Source: CDC).
US$55bn diabetes market by 2017E The global antidiabetic pharmaceuticals market was estimated at US$29.3bn in 2010, registering a CAGR of 10% between 2003 and 2010 (Source: GBI Research). This is expected to reach US$47-55bn globally by 2017, representing a 7-9.4% CAGR (Source: Visiongain, GBI Research).
Increased worldwide incidence of Type 1 and Type 2 diabetes, coupled with increases in obesity, is expected to drive growth of the diabetes drugs market. Much of the market has been dominated by human insulins and analogues, which is expected to continue.
Table 20: The 10 different classes of antidiabetic therapies Class Class leader Company Insulins: - Rapid acting Novolog Novo Nordisk - Long acting/Basal insulins Lantus Sanofi Aventis GLP-1 Victoza Novo Nordisk DPP-4 Januvia Merck Sulfonylureas Glimepride (generic) Teva SGLT2 Invokana* Johnson and Johnson Biguanides Metformin (generic) Teva Glitazones Pioglitazone (generic) Mylan Alpha-glucosidase inhibitors Acarbose Mylan Amylin secretagogues Symlin BMY Glinides Prandin Novo Nordisk Source: IMS Health, BofA Merrill Lynch Global Research
Table 21: Select marketed branded diabetes products by company
Drug
Bristol-Meyers Squibb Lilly Merck Novo-Nordisk Sanofi JNJ Novartis Takeda
Insulin - rapid acting Humalog Novolog Apidra Humulin Novlin
Insulin - long acting Levemir, Tresiba (EU) Lantus
DPP-4 Onglyza Tradjenta Januvia, Janumet Zomelis (EU) Nesina, Kazano Kombiglyze Jentadueto Janumet XR, Juvisync Oseni
GLP-1 Byetta Victoza Bydureon
SGLT2 Forxiga (EU) Invokana (US) Amylin Symlin Source: BofA Merrill Lynch Global Research
Diabetes treatment options The ultimate goal of any diabetes treatment regimen is to maintain tight control of blood glucose levels, ideally within a normal physiological range, and subsequently keep A1c levels (glycosylated haemoglobin – a measure of average blood sugar control in the preceding three months) at a minimum, ideally about 5% (the level for a person who does not have diabetes).
For Type 2 diabetes, the American Diabetes Association recommends individualized treatment based on attainment of HbA1C targets and tolerability of therapy. This approach generally involves initiation with oral therapy (metformin) and ends with intensive insulin therapy. The newest class of diabetes medications, the SGLT2 inhibitors, is not yet part of the treatment
Table 19: % of revenues from diabetes products Ticker 2012A ABBV N/A BMY 5% LLY 18% MRK 12% PFE* NA Source: Company data, BofA Merrill Lynch Global Research * PFE has diabetes assets in its pipeline but we do not include any revenue for these in our estimates

Themat ic Inves t ing 06 June 2014
76
recommendations (first SGLT2 inhibitor was approved in the US on 3/29/13). It remains unclear when physicians will ultimately use Invokana, which combines GLP-1-like efficacy (including weight loss) with the convenience of an oral route of administration.
If a patient is newly diagnosed with Type 2 diabetes and requires medication, the first therapy is usually metformin (oral). If this is inadequate or the disease severity worsens, patients will be offered various other oral therapies, usually in combination regimens. If the oral options continue to provide insufficient glucose control then patients may move to an injectable therapy such as a GLP-1 analogue or, if more intensive control is required, an insulin regimen.
Diabetes treatment options are complex and each patient’s treatment is tailored based on his/her disease severity, lifestyle, tolerance to certain agents and general preference (needle vs. pill).
Table 22: Summary of anti-diabetic therapies
What is the mechanism of action Oral or
injection Typical regimen Common side effects Metformin Decreases amount of glucose produced by
liver (also sensitizes muscles to insulin) Oral Twice daily Gastrointestinal upset/diarrhoea
Sulfonylureas Stimulate beta cells in pancreas to produce more insulin Oral Once or twice daily Weight gain, gastrointestinal upset, low blood sugar
Alpha-glucosidase inhibitors Block breakdown of starch Oral Taken before meals Gas, diarrhoea
Meglitinides Stimulate beta cells in pancreas to produce more insulin Oral Taken before meals Weight gain, low blood sugar
Thiazolidnediones (glitazones)
Reduces insulin resistance and increases insulin sensitivity Oral Once or twice daily Mild weight gain, increased risk of heart failure
DPP-4 inhibitors Prevent breakdown of GLP-1, which lowers blood sugar Oral Once daily Cold-like symptoms, skin reactions
SGLT2 inhibitors Prevent reabsorption of glucose in the kidney, causing it to be excreted in the urine
Oral Once daily Female genital mycotic infections, urinary tract infection
GLP-1 analogues Increase levels of GLP-1, which increase insulin levels, lowering blood sugar Injection Once or twice daily Gastrointestinal upset
Synthetic amylins Aid in absorption of glucose and inhibit inappropriate secretion of glucagon, which increases blood sugar
Injection Taken before meals Nausea, low blood sugar
Insulin Replaces/supplements the body's natural insulin to lower blood sugar Injection Variable - dependant on type of
insulin and patient requirements Low blood sugar
Source: BofA Merrill Lynch Global Research
Osteoporosis: women hit hardest Osteoporosis (“porous bone”) is characterized by low bone mass and density, and micro-structural deterioration of bone tissue, leading to bone fragility and increases in fracture. It is defined as having a bone mineral density (BMD) of 2.5 standard deviations or more below the mean of normal healthy adults. The disease affects more than 200mn people worldwide, 80% of which are women (including a tenth of women aged 60, one-fifth of women aged 70, two-fifths of women aged 80 and two-thirds of women aged 90) (Source: International Osteoporosis Foundation). Osteoporosis is categorized into two groups:
Primary osteoporosis – age-related osteoporosis, postmenopausal osteoporosis; more common in women.
Secondary osteoporosis – an agent or disease that causes bone loss such as inflammatory disorders, disorders of bone marrow, endocrine disorders.
28-35% of people aged 65+ fall each year, 32-42% for 70+ Morbidity following hip fracture is around 20-24% in first year after the fracture US spends US$30bn a year treating older adults for the effects of falls US$16bn osteoporosis market by 2015E
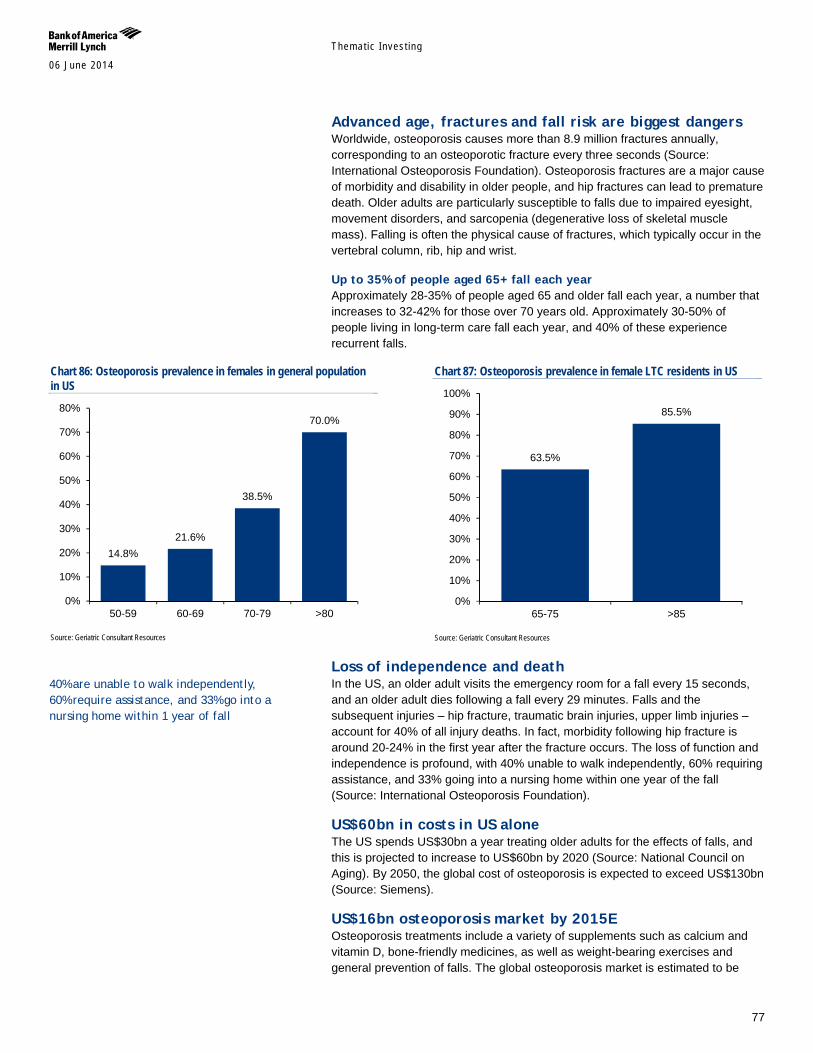
Themat ic Inves t ing 06 June 2014
77
Advanced age, fractures and fall risk are biggest dangers Worldwide, osteoporosis causes more than 8.9 million fractures annually, corresponding to an osteoporotic fracture every three seconds (Source: International Osteoporosis Foundation). Osteoporosis fractures are a major cause of morbidity and disability in older people, and hip fractures can lead to premature death. Older adults are particularly susceptible to falls due to impaired eyesight, movement disorders, and sarcopenia (degenerative loss of skeletal muscle mass). Falling is often the physical cause of fractures, which typically occur in the vertebral column, rib, hip and wrist.
Up to 35% of people aged 65+ fall each year Approximately 28-35% of people aged 65 and older fall each year, a number that increases to 32-42% for those over 70 years old. Approximately 30-50% of people living in long-term care fall each year, and 40% of these experience recurrent falls.
Chart 86: Osteoporosis prevalence in females in general population in US
Source: Geriatric Consultant Resources
Chart 87: Osteoporosis prevalence in female LTC residents in US
Source: Geriatric Consultant Resources
Loss of independence and death In the US, an older adult visits the emergency room for a fall every 15 seconds, and an older adult dies following a fall every 29 minutes. Falls and the subsequent injuries – hip fracture, traumatic brain injuries, upper limb injuries – account for 40% of all injury deaths. In fact, morbidity following hip fracture is around 20-24% in the first year after the fracture occurs. The loss of function and independence is profound, with 40% unable to walk independently, 60% requiring assistance, and 33% going into a nursing home within one year of the fall (Source: International Osteoporosis Foundation).
US$60bn in costs in US alone The US spends US$30bn a year treating older adults for the effects of falls, and this is projected to increase to US$60bn by 2020 (Source: National Council on Aging). By 2050, the global cost of osteoporosis is expected to exceed US$130bn (Source: Siemens).
US$16bn osteoporosis market by 2015E Osteoporosis treatments include a variety of supplements such as calcium and vitamin D, bone-friendly medicines, as well as weight-bearing exercises and general prevention of falls. The global osteoporosis market is estimated to be
14.8% 21.6%
38.5%
70.0%
0%
10%
20%
30%
40%
50%
60%
70%
80%
50-59 60-69 70-79 >80
63.5%
85.5%
0%
10%
20%
30%
40%
50%
60%
70%
80%
90%
100%
65-75 >85
40% are unable to walk independently, 60% require assistance, and 33% go into a nursing home within 1 year of fall
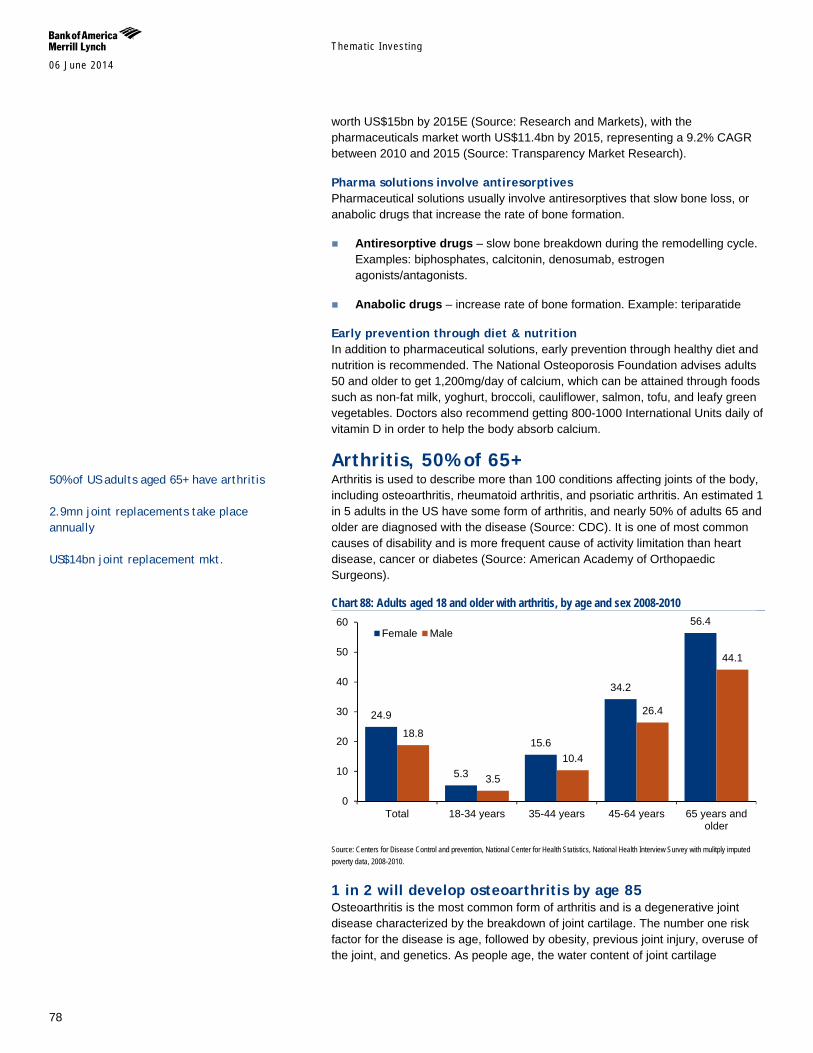
Themat ic Inves t ing 06 June 2014
78
worth US$15bn by 2015E (Source: Research and Markets), with the pharmaceuticals market worth US$11.4bn by 2015, representing a 9.2% CAGR between 2010 and 2015 (Source: Transparency Market Research).
Pharma solutions involve antiresorptives Pharmaceutical solutions usually involve antiresorptives that slow bone loss, or anabolic drugs that increase the rate of bone formation.
Antiresorptive drugs – slow bone breakdown during the remodelling cycle. Examples: biphosphates, calcitonin, denosumab, estrogen agonists/antagonists.
Anabolic drugs – increase rate of bone formation. Example: teriparatide
Early prevention through diet & nutrition In addition to pharmaceutical solutions, early prevention through healthy diet and nutrition is recommended. The National Osteoporosis Foundation advises adults 50 and older to get 1,200mg/day of calcium, which can be attained through foods such as non-fat milk, yoghurt, broccoli, cauliflower, salmon, tofu, and leafy green vegetables. Doctors also recommend getting 800-1000 International Units daily of vitamin D in order to help the body absorb calcium.
Arthritis, 50% of 65+ Arthritis is used to describe more than 100 conditions affecting joints of the body, including osteoarthritis, rheumatoid arthritis, and psoriatic arthritis. An estimated 1 in 5 adults in the US have some form of arthritis, and nearly 50% of adults 65 and older are diagnosed with the disease (Source: CDC). It is one of most common causes of disability and is more frequent cause of activity limitation than heart disease, cancer or diabetes (Source: American Academy of Orthopaedic Surgeons).
Chart 88: Adults aged 18 and older with arthritis, by age and sex 2008-2010
Source: Centers for Disease Control and prevention, National Center for Health Statistics, National Health Interview Survey with mulitply imputed poverty data, 2008-2010.
1 in 2 will develop osteoarthritis by age 85 Osteoarthritis is the most common form of arthritis and is a degenerative joint disease characterized by the breakdown of joint cartilage. The number one risk factor for the disease is age, followed by obesity, previous joint injury, overuse of the joint, and genetics. As people age, the water content of joint cartilage
24.9
5.3
15.6
34.2
56.4
18.8
3.5
10.4
26.4
44.1
0
10
20
30
40
50
60
Total 18-34 years 35-44 years 45-64 years 65 years andolder
Female Male
50% of US adults aged 65+ have arthritis 2.9mn joint replacements take place annually US$14bn joint replacement mkt.

Themat ic Inves t ing 06 June 2014
79
decreases as a result of reduced proteoglycan content, which then causes the cartilage to be less resilient. Osteoarthritis of the hip and knee is a common cause of pain, stiffness, and disability in elderly patients. Nearly 1 in 2 people will develop osteoarthritis by age 85 (Source: CDC), and globally 250mn people live with osteoarthritis of the knee.
No known cure While there is no cure for osteoarthritis, there are many medical solutions both over-the-counter and by prescription that help with the pain of the disease such as analgesic acetaminophen, nonsteroidal anti-inflammatory drugs (NAISDs), and opioid analgesics, and glucocorticoids.
Growing demand for joint replacements Total joint replacement (TJR) of the hip and knee have been rising in popularity given the prevalence of osteoarthritis in the growing elderly population and now comprise 1/3 of all global orthopaedic revenues. Nearly 2.9mn joint replacement take place annually in the world including – 1.4mn hip (US$5.8bn), 1.1mn knee (US$6.9bn), and more than 100k shoulder replacements.
US$14bn joint replacement mkt. dominated by 8 companies It is estimated that sales of joint replacement products exceeded US$13.8bn in 2011, with the world’s largest 8 companies – Zimmer, Johnson & Johnson (DePuy division), Stryker, Biomet, Smith & Nephew, Wright Medical, Aesculap, and Tornier taking 95% market share (Source: Orthoworld). Recovery period is usually several weeks, but older adults show significant improvements in walking, and ability to perform household chores (Source: Archives of Internal Medicine).
In the US, knee replacement increased by 89% for people aged 65-84 from 2000 to 2009, and increased 54% for hip replacement. By now there are 7mn Americans living with an artificial knee or hip, and this number is expected to increase at a rate even higher than growth of the older population (Source: Academy of Orthopaedic Surgeons).
Themat ic Inves t ing 06 June 2014
80
Other ageing-related conditions In our view, a number of companies are well placed to benefit from the theme of longevity via ageing-related conditions including hearing loss and aids, dental care, vision care, and incontinence.
Over 650mn people suffering from hearing impairment globally (Source: WHO), including up to 20% of the population in industrialised countries. Some 35-40% of the total 65+ population is hearing impaired (Source: Hearing Health Matters), yet only 10-25% take advantage of a hearing aid (Source: Amplifon, Donova). The hearing aid market is estimated at US$5.4bn (Source: Hearing Health Matters) and has high barriers to entry and pricing power from technological innovation. Long-term growth drivers include demographic trends, increasing acceptance and rapid growth in EMs (Source: Amplifon).
25% of all adults aged 60 years and older have lost all of their teeth (Source: CDC). Oral disease is considered to be the fourth most costly ailment to treat, and industrialized countries spend 5-10% of their national public health resources on dental care every year (Source: WHO). The global dental industry is worth an estimated US$21bn, and the market is less volatile than the broader economy, has typically grown at 1-2x GDP, and is less dependent on government reimbursement than the medical market (Source: Dentsply). Long-term drivers include the ageing population, greater care needed for ageing populations, and low implant penetration rates.
4.3bn people need vision correction with c50% of those aged 50+ exhibiting hyperopic conditions such as presbyopia, myopia, and hyperopia (Source: Research and Markets). Yet, visual correction has low penetration, especially in EMs. The global vision care market stood is expected to reach US$46bn by 2017E with much of the growth driven by the ageing population (Source: Research and Markets). We anticipate a two-tier market, with developed world optical markets growing by 1-2% while EMs are experiencing volume growth of 5-6%, as by 2020E - the number of wearers of corrective lenses is set to hit 2.2bn those with myopia 2.0bn and those with presbyopia 2.3bn (Source: Essilor).
Up to 35% of the total population aged 60+ is estimated to be incontinent with women twice as likely as men (Source: NIH). Over 50% of homebound elderly people or those living in long-term care facilities are incontinent; and it is the #2 cause of institutionalization (Source: National Association For Incontinence). The global incontinence and ostomy care market is expected to reach US$17.2bn by 2020E (Source: Grand View Research). drivers include high patient awareness, demographics, EMs, and the advent of technologically advanced products
Hearing loss and aids Over 650mn people suffering from hearing impairment globally (Source: WHO), including up to 20% of the population in industrialised countries. 35-40% of the total 65+ population is hearing impaired (Source: Hearing Health Matters), yet only 10-25% take advantage of a hearing aid (Source: Amplifon, Donova). The hearing aid market is estimated at US$5.4bn (Source: Hearing Health Matters) and has high barriers to entry and pricing power from technological innovation. Long-term growth drivers include demographic trends, increasing acceptance and rapid growth in EMs (Source: Amplifon).
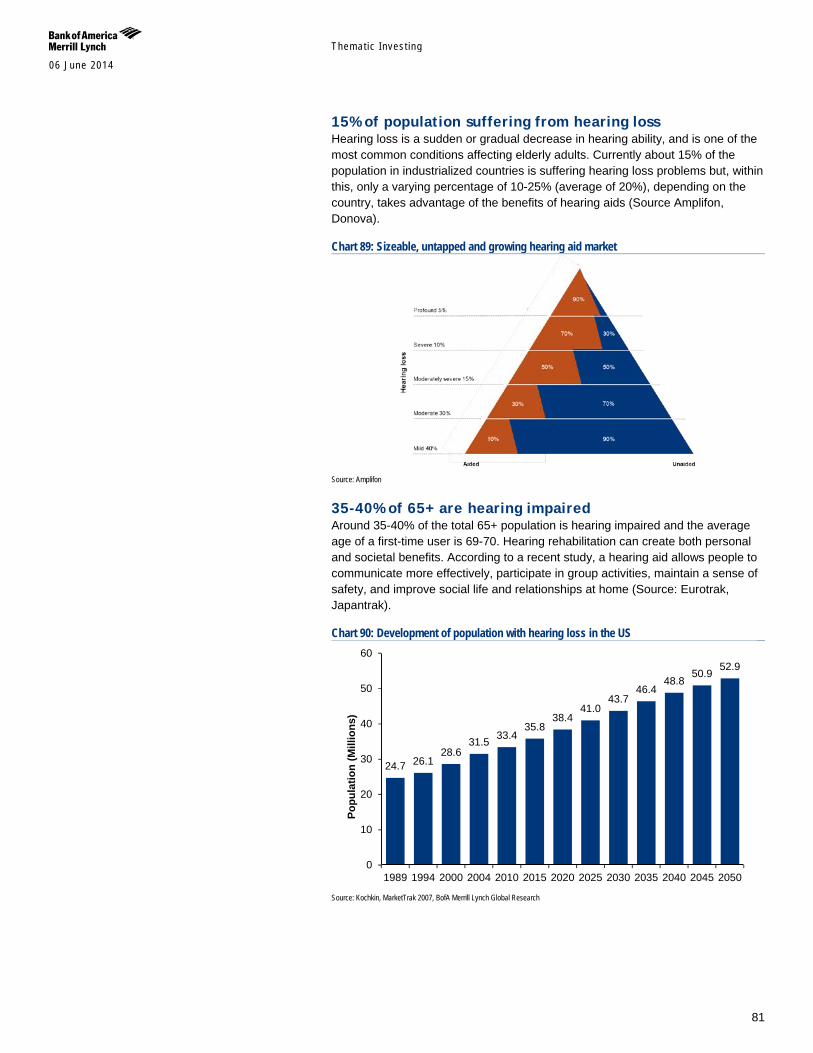
Themat ic Inves t ing 06 June 2014
81
15% of population suffering from hearing loss Hearing loss is a sudden or gradual decrease in hearing ability, and is one of the most common conditions affecting elderly adults. Currently about 15% of the population in industrialized countries is suffering hearing loss problems but, within this, only a varying percentage of 10-25% (average of 20%), depending on the country, takes advantage of the benefits of hearing aids (Source Amplifon, Donova).
Chart 89: Sizeable, untapped and growing hearing aid market
Source: Amplifon
35-40% of 65+ are hearing impaired Around 35-40% of the total 65+ population is hearing impaired and the average age of a first-time user is 69-70. Hearing rehabilitation can create both personal and societal benefits. According to a recent study, a hearing aid allows people to communicate more effectively, participate in group activities, maintain a sense of safety, and improve social life and relationships at home (Source: Eurotrak, Japantrak).
Chart 90: Development of population with hearing loss in the US
Source: Kochkin, MarketTrak 2007, BofA Merrill Lynch Global Research
24.7 26.1 28.6
31.5 33.4 35.8
38.4 41.0
43.7 46.4
48.8 50.9 52.9
0
10
20
30
40
50
60
1989 1994 2000 2004 2010 2015 2020 2025 2030 2035 2040 2045 2050
Popu
latio
n (M
illio
ns)
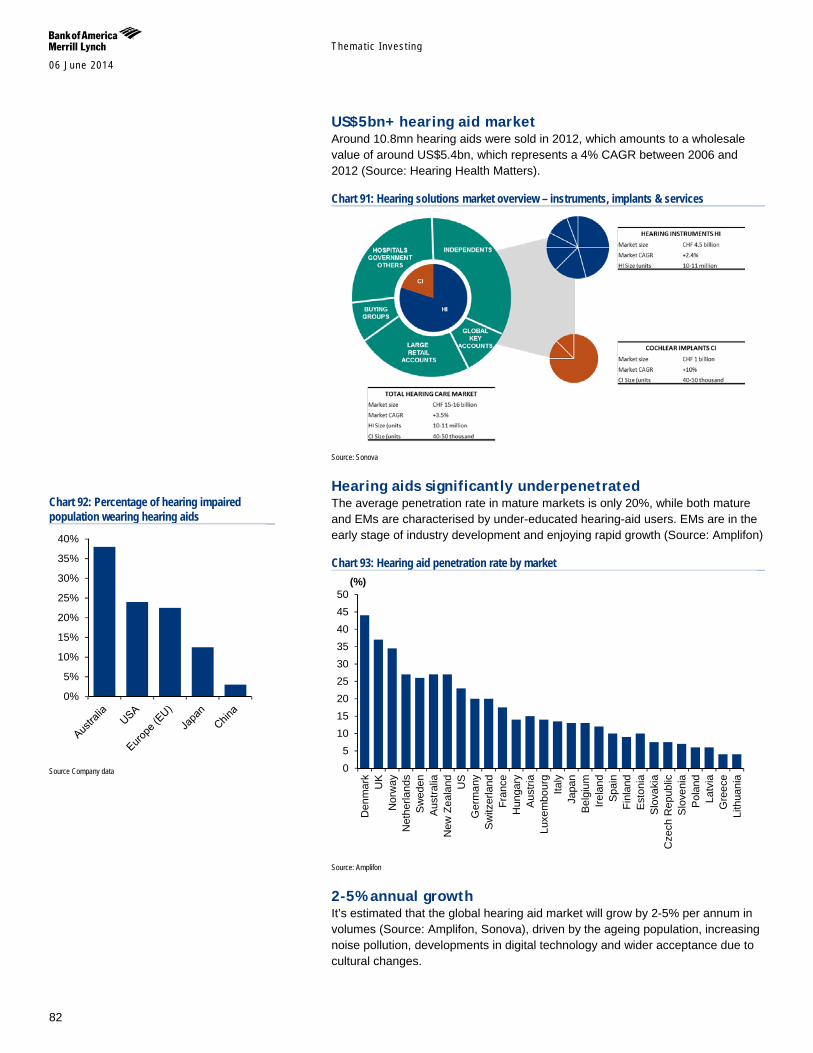
Themat ic Inves t ing 06 June 2014
82
US$5bn+ hearing aid market Around 10.8mn hearing aids were sold in 2012, which amounts to a wholesale value of around US$5.4bn, which represents a 4% CAGR between 2006 and 2012 (Source: Hearing Health Matters).
Chart 91: Hearing solutions market overview – instruments, implants & services
Source: Sonova
Hearing aids significantly underpenetrated The average penetration rate in mature markets is only 20%, while both mature and EMs are characterised by under-educated hearing-aid users. EMs are in the early stage of industry development and enjoying rapid growth (Source: Amplifon)
Chart 93: Hearing aid penetration rate by market
Source: Amplifon
2-5% annual growth It’s estimated that the global hearing aid market will grow by 2-5% per annum in volumes (Source: Amplifon, Sonova), driven by the ageing population, increasing noise pollution, developments in digital technology and wider acceptance due to cultural changes.
05
101520253035404550
Den
mar
kU
KN
orw
ayN
ethe
rland
sS
wed
enA
ustra
liaN
ew Z
eala
nd US
Ger
man
yS
witz
erla
ndFr
ance
Hun
gary
Aus
tria
Luxe
mbo
urg
Italy
Japa
nB
elgi
umIre
land
Spa
inFi
nlan
dE
ston
iaS
lova
kia
Cze
ch R
epub
licS
love
nia
Pol
and
Latv
iaG
reec
eLi
thua
nia
(%)
Chart 92: Percentage of hearing impaired population wearing hearing aids
Source Company data
0%
5%
10%
15%
20%
25%
30%
35%
40%

Themat ic Inves t ing 06 June 2014
83
Europe is the biggest global market accounting for 45% of sales (Source: Hearing Health Matters). It is a fairly mature market although penetration is still low at only 20% (Source: Amplifon).
North America is the second biggest market with 29% of sales (Source: Hearing Health Matters). It is highly fragmented with a low penetration rate of 25% (Source: Amplifon).
Boomers will drive growth, lower first-time buying age The current average customer age for hearing aids is 72 but this is expected to decline off the back of tech-savvy and health-aware boomers, who have a first buying age of 55 (Source: Amplifon).
Cochlear implants seeing fastest growth The US$1bn cochlear implant market will see the greatest growth at 10-15% per annum (Source: Hearing Health Matters).
Chart 94: How a cochlear implant works
Source: Sonova
Market with high barriers to entry & pricing power The hearing aid market has high barriers to entry and pricing power from technological innovation, making it one of the best positioned to benefit from the ageing demographic theme.
Long-term drivers Long-term growth drivers include demographic trends (population growth, longer life expectancy, noise pollution, boomers’ lower first-time buying age), increasing acceptance of hearing aids (technological developments, miniaturization, awareness, retail experience) and rapid growth in EMs (Source: Amplifon).
Personalization is key The sale of hearing aids is inseparable from the fitting process – and the success of a product largely depends on accurate diagnosis, technical specification and personalized adaptation of the device to a customer’s need (i.e., trained audiologists/hearing aid specialists, long-lasting relationship) (Source: Amplifon).
Six manufacturers control 98% of market The six largest manufacturers of hearing aids held a total market share of 98% last year. The major players are Amplifon, Sonova Holding AG, GN Store Nord, William Demant Holding A/S, Siemens Healthcare, and private companies
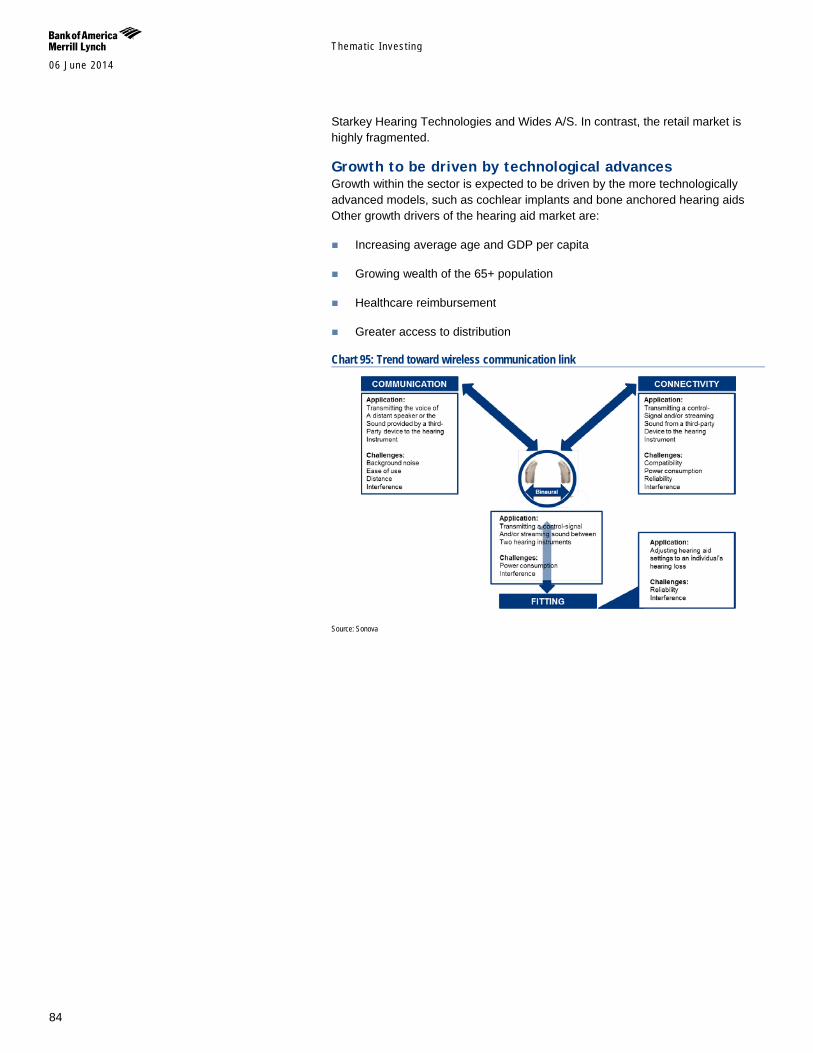
Themat ic Inves t ing 06 June 2014
84
Starkey Hearing Technologies and Wides A/S. In contrast, the retail market is highly fragmented.
Growth to be driven by technological advances Growth within the sector is expected to be driven by the more technologically advanced models, such as cochlear implants and bone anchored hearing aids Other growth drivers of the hearing aid market are:
Increasing average age and GDP per capita
Growing wealth of the 65+ population
Healthcare reimbursement
Greater access to distribution
Chart 95: Trend toward wireless communication link
Source: Sonova

Themat ic Inves t ing 06 June 2014
85
Overview of hearing aids There are several types of hearing aid that differ by size, placement and the degree to which they amplify sound.
Behind-the-ear (BTE): hard plastic case worn behind the ear and connected to a plastic earmold that fits inside the outer ear
In-the-ear (ITE): fits completely inside the outer ear and is used for mild to severe hearing loss
In-the-canal (ITC): fits the size and shape of the ear canal
Completely-in-canal (CIC): fits the size and shape of the ear canal and is nearly hidden when worn
Bone anchored hearing aids (BAHA): auditory prosthetic that can be surgically implanted, bypasses external auditory canal and middle ear, stimulating the functioning cochlea
Cochlear implants (CI): surgically implanted electronic device that includes a transmitter and receiver/stimulator, which bypass the ear and send signals directly to the auditory nerve
Dental care Some 25% of all adults aged 60 years and older have lost all of their teeth (Source: CDC) and oral disease is considered to be the fourth most costly ailment to treat (Source: WHO). The global dental industry is worth an estimated US$21bn, and the market is less volatile than the broader economy, has typically grown at 1-2x GDP, and is less dependent on government reimbursement than the medical market (Source: Dentsply). Long-term drivers include the ageing population, greater care needed for this group, and low implant penetration rates
25% of 60+ have lost all of their teeth According to the CDC, 25% of all adults aged 60 years and older have lost all of their teeth, and 20.5% of all US adults aged 65 and older have lost all of their teeth due to tooth decay or gum disease.
Oral disease, #4 most costly ailment to treat Oral disease is the fourth most expensive ailment to treat in most industrialized countries, according to WHO’s World Oral Health Report. Industrialized countries spend 5-10% of their national public health resources on dental care every year. The burden of oral disease is likely to grow in many EMs because of unhealthy diets rich in sugars and high consumption of tobacco, but most allocate no budget at all to the control of oral disease (Source: WHO).
Chart 96: Types of hearing aids
Source: NIH
Industrialized countries spend 5–10% of their national public health resources on dental care a year
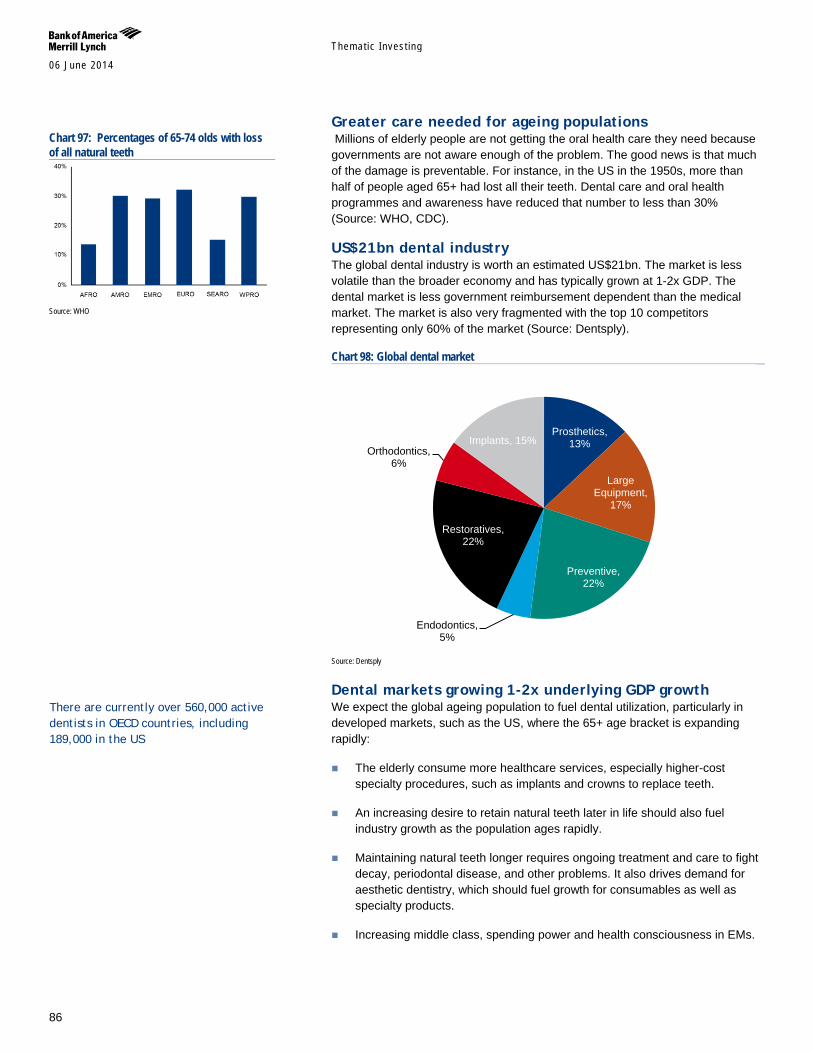
Themat ic Inves t ing 06 June 2014
86
Greater care needed for ageing populations Millions of elderly people are not getting the oral health care they need because governments are not aware enough of the problem. The good news is that much of the damage is preventable. For instance, in the US in the 1950s, more than half of people aged 65+ had lost all their teeth. Dental care and oral health programmes and awareness have reduced that number to less than 30% (Source: WHO, CDC).
US$21bn dental industry The global dental industry is worth an estimated US$21bn. The market is less volatile than the broader economy and has typically grown at 1-2x GDP. The dental market is less government reimbursement dependent than the medical market. The market is also very fragmented with the top 10 competitors representing only 60% of the market (Source: Dentsply).
Chart 98: Global dental market
Source: Dentsply
Dental markets growing 1-2x underlying GDP growth We expect the global ageing population to fuel dental utilization, particularly in developed markets, such as the US, where the 65+ age bracket is expanding rapidly:
The elderly consume more healthcare services, especially higher-cost specialty procedures, such as implants and crowns to replace teeth.
An increasing desire to retain natural teeth later in life should also fuel industry growth as the population ages rapidly.
Maintaining natural teeth longer requires ongoing treatment and care to fight decay, periodontal disease, and other problems. It also drives demand for aesthetic dentistry, which should fuel growth for consumables as well as specialty products.
Increasing middle class, spending power and health consciousness in EMs.
Prosthetics, 13%
Large Equipment,
17%
Preventive, 22%
Endodontics, 5%
Restoratives, 22%
Orthodontics, 6%
Implants, 15%
Chart 97: Percentages of 65-74 olds with loss of all natural teeth
Source: WHO
There are currently over 560,000 active dentists in OECD countries, including 189,000 in the US
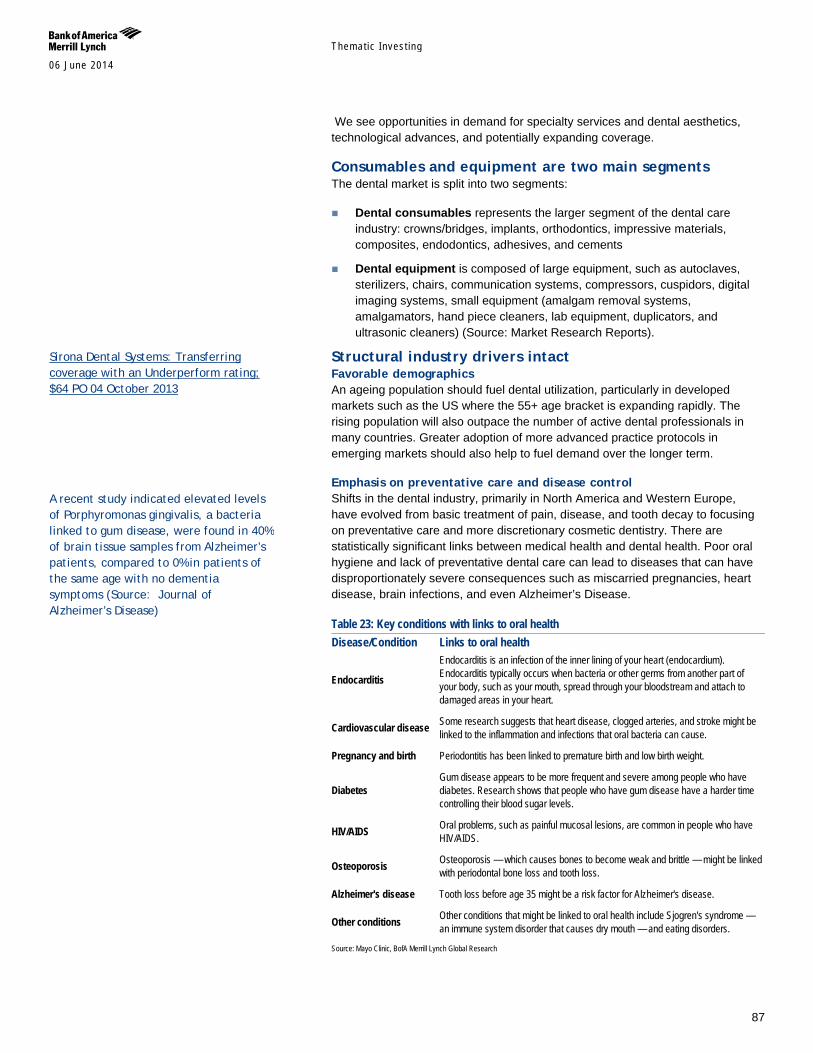
Themat ic Inves t ing 06 June 2014
87
We see opportunities in demand for specialty services and dental aesthetics, technological advances, and potentially expanding coverage.
Consumables and equipment are two main segments The dental market is split into two segments:
Dental consumables represents the larger segment of the dental care industry: crowns/bridges, implants, orthodontics, impressive materials, composites, endodontics, adhesives, and cements
Dental equipment is composed of large equipment, such as autoclaves, sterilizers, chairs, communication systems, compressors, cuspidors, digital imaging systems, small equipment (amalgam removal systems, amalgamators, hand piece cleaners, lab equipment, duplicators, and ultrasonic cleaners) (Source: Market Research Reports).
Structural industry drivers intact Favorable demographics An ageing population should fuel dental utilization, particularly in developed markets such as the US where the 55+ age bracket is expanding rapidly. The rising population will also outpace the number of active dental professionals in many countries. Greater adoption of more advanced practice protocols in emerging markets should also help to fuel demand over the longer term.
Emphasis on preventative care and disease control Shifts in the dental industry, primarily in North America and Western Europe, have evolved from basic treatment of pain, disease, and tooth decay to focusing on preventative care and more discretionary cosmetic dentistry. There are statistically significant links between medical health and dental health. Poor oral hygiene and lack of preventative dental care can lead to diseases that can have disproportionately severe consequences such as miscarried pregnancies, heart disease, brain infections, and even Alzheimer’s Disease.
Table 23: Key conditions with links to oral health Disease/Condition Links to oral health
Endocarditis
Endocarditis is an infection of the inner lining of your heart (endocardium). Endocarditis typically occurs when bacteria or other germs from another part of your body, such as your mouth, spread through your bloodstream and attach to damaged areas in your heart.
Cardiovascular disease Some research suggests that heart disease, clogged arteries, and stroke might be linked to the inflammation and infections that oral bacteria can cause.
Pregnancy and birth Periodontitis has been linked to premature birth and low birth weight.
Diabetes Gum disease appears to be more frequent and severe among people who have diabetes. Research shows that people who have gum disease have a harder time controlling their blood sugar levels.
HIV/AIDS Oral problems, such as painful mucosal lesions, are common in people who have HIV/AIDS.
Osteoporosis Osteoporosis — which causes bones to become weak and brittle — might be linked with periodontal bone loss and tooth loss.
Alzheimer's disease Tooth loss before age 35 might be a risk factor for Alzheimer's disease.
Other conditions Other conditions that might be linked to oral health include Sjogren's syndrome — an immune system disorder that causes dry mouth — and eating disorders.
Source: Mayo Clinic, BofA Merrill Lynch Global Research
Sirona Dental Systems: Transferring coverage with an Underperform rating; $64 PO 04 October 2013
A recent study indicated elevated levels of Porphyromonas gingivalis, a bacteria linked to gum disease, were found in 40% of brain tissue samples from Alzheimer’s patients, compared to 0% in patients of the same age with no dementia symptoms (Source: Journal of Alzheimer’s Disease)
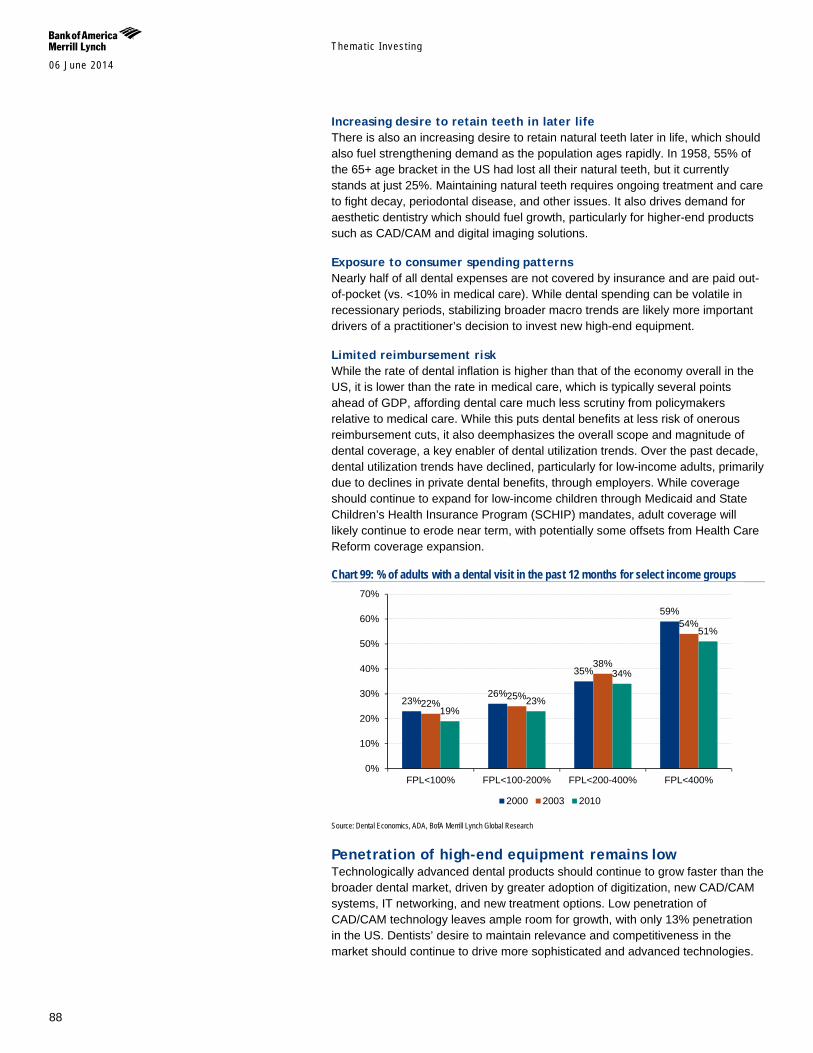
Themat ic Inves t ing 06 June 2014
88
Increasing desire to retain teeth in later life There is also an increasing desire to retain natural teeth later in life, which should also fuel strengthening demand as the population ages rapidly. In 1958, 55% of the 65+ age bracket in the US had lost all their natural teeth, but it currently stands at just 25%. Maintaining natural teeth requires ongoing treatment and care to fight decay, periodontal disease, and other issues. It also drives demand for aesthetic dentistry which should fuel growth, particularly for higher-end products such as CAD/CAM and digital imaging solutions.
Exposure to consumer spending patterns Nearly half of all dental expenses are not covered by insurance and are paid out-of-pocket (vs. <10% in medical care). While dental spending can be volatile in recessionary periods, stabilizing broader macro trends are likely more important drivers of a practitioner’s decision to invest new high-end equipment.
Limited reimbursement risk While the rate of dental inflation is higher than that of the economy overall in the US, it is lower than the rate in medical care, which is typically several points ahead of GDP, affording dental care much less scrutiny from policymakers relative to medical care. While this puts dental benefits at less risk of onerous reimbursement cuts, it also deemphasizes the overall scope and magnitude of dental coverage, a key enabler of dental utilization trends. Over the past decade, dental utilization trends have declined, particularly for low-income adults, primarily due to declines in private dental benefits, through employers. While coverage should continue to expand for low-income children through Medicaid and State Children’s Health Insurance Program (SCHIP) mandates, adult coverage will likely continue to erode near term, with potentially some offsets from Health Care Reform coverage expansion.
Chart 99: % of adults with a dental visit in the past 12 months for select income groups
Source: Dental Economics, ADA, BofA Merrill Lynch Global Research
Penetration of high-end equipment remains low Technologically advanced dental products should continue to grow faster than the broader dental market, driven by greater adoption of digitization, new CAD/CAM systems, IT networking, and new treatment options. Low penetration of CAD/CAM technology leaves ample room for growth, with only 13% penetration in the US. Dentists’ desire to maintain relevance and competitiveness in the market should continue to drive more sophisticated and advanced technologies.
23%26%
35%
59%
22%25%
38%
54%
19%23%
34%
51%
0%
10%
20%
30%
40%
50%
60%
70%
FPL<100% FPL<100-200% FPL<200-400% FPL<400%
2000 2003 2010
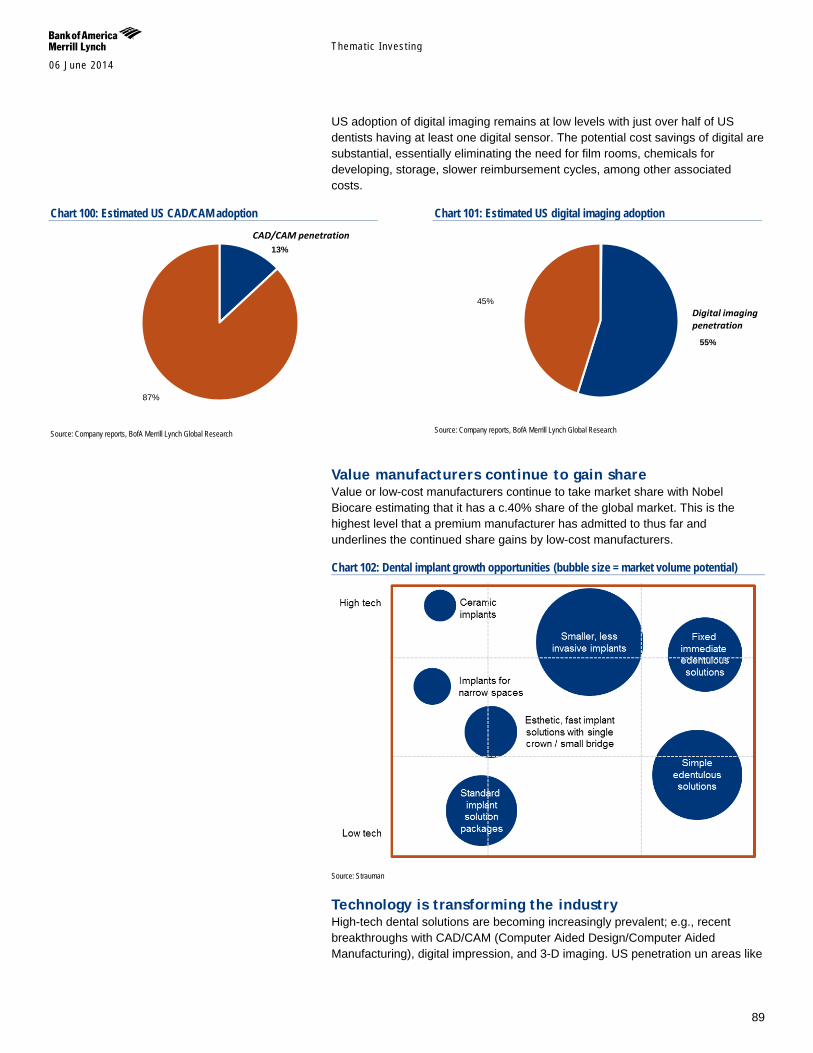
Themat ic Inves t ing 06 June 2014
89
US adoption of digital imaging remains at low levels with just over half of US dentists having at least one digital sensor. The potential cost savings of digital are substantial, essentially eliminating the need for film rooms, chemicals for developing, storage, slower reimbursement cycles, among other associated costs.
Chart 100: Estimated US CAD/CAM adoption
Source: Company reports, BofA Merrill Lynch Global Research
Chart 101: Estimated US digital imaging adoption
Source: Company reports, BofA Merrill Lynch Global Research
Value manufacturers continue to gain share Value or low-cost manufacturers continue to take market share with Nobel Biocare estimating that it has a c.40% share of the global market. This is the highest level that a premium manufacturer has admitted to thus far and underlines the continued share gains by low-cost manufacturers.
Chart 102: Dental implant growth opportunities (bubble size = market volume potential)
Source: Strauman
Technology is transforming the industry High-tech dental solutions are becoming increasingly prevalent; e.g., recent breakthroughs with CAD/CAM (Computer Aided Design/Computer Aided Manufacturing), digital impression, and 3-D imaging. US penetration un areas like
13%
87%
CAD/CAM penetration
55%
45%Digital imaging penetration
Themat ic Inves t ing 06 June 2014
90
CAD/CAM stands at only c.13%, suggesting ample room to grow as standards of care evolve.
CAD/CAM – a productivity-enhancing system CAD/CAM technology dramatically improves practice productivity, eliminating several steps in the traditional process. We estimate the global CAD/CAM market represents a realistic revenue opportunity of US$56bn in OECD countries and US$13bn in the US, assuming an addressable market of 85% of dentists, as price may be somewhat prohibitive for low-volume practices (506,000 dental practices worldwide and 120,000 US1 x 85% x c.US$130,000 price/unit). However, overall penetration among dental practices remains low (only an estimated 13% US). However, penetration is higher in other geographies – 14% in Germany and high teens in Switzerland (the highest utilization rate of CAD/CAM technology) – underscoring the value proposition and market opportunity of the technology.
Vision care 4.3bn people need vision correction with c50% of those aged 50+ exhibiting hyperopic conditions such as presbyopia, myopia, and hyperopia (Source: Research and Markets). Yet, visual correction has low penetration, especially in EMs. The global vision care market stood is expected to reach US$46bn by 2017E with much of the growth driven by the ageing population (Source: Research and Markets). We anticipate a two-tier market, with developed world optical markets growing by 1-2% while EMs are experiencing volume growth of 5-6%, as by 2020E - the number of wearers of corrective lenses is set to hit 2.2bn those with myopia 2.0bn and those with presbyopia 2.3bn (Source: Essilor).
Low penetration of visual correction The number of people requiring visual correction who actually use contact lenses or glasses is low in both the developing and developed economies. Of c.65% of the adult population in the Western world who need visual correction, only c.85-90% actually use glasses or lenses. In fact, only 44% of Europeans with vision loss actually use glasses/ contacts. This number is even lower for the rest of the globe. There is a two-tier market, with developed world optical markets growing by 1-2% while emerging markets are experiencing volume growth of 5-6%.
1 WW estimate is based on 560,000 active dentists in OECD countries, 80% of which are solo practitioners; US metric based on Kaiser Family Foundation data (as of November 2012).
Essilor: Emerging markets, vertical integration can sustain growth 16 June 2011
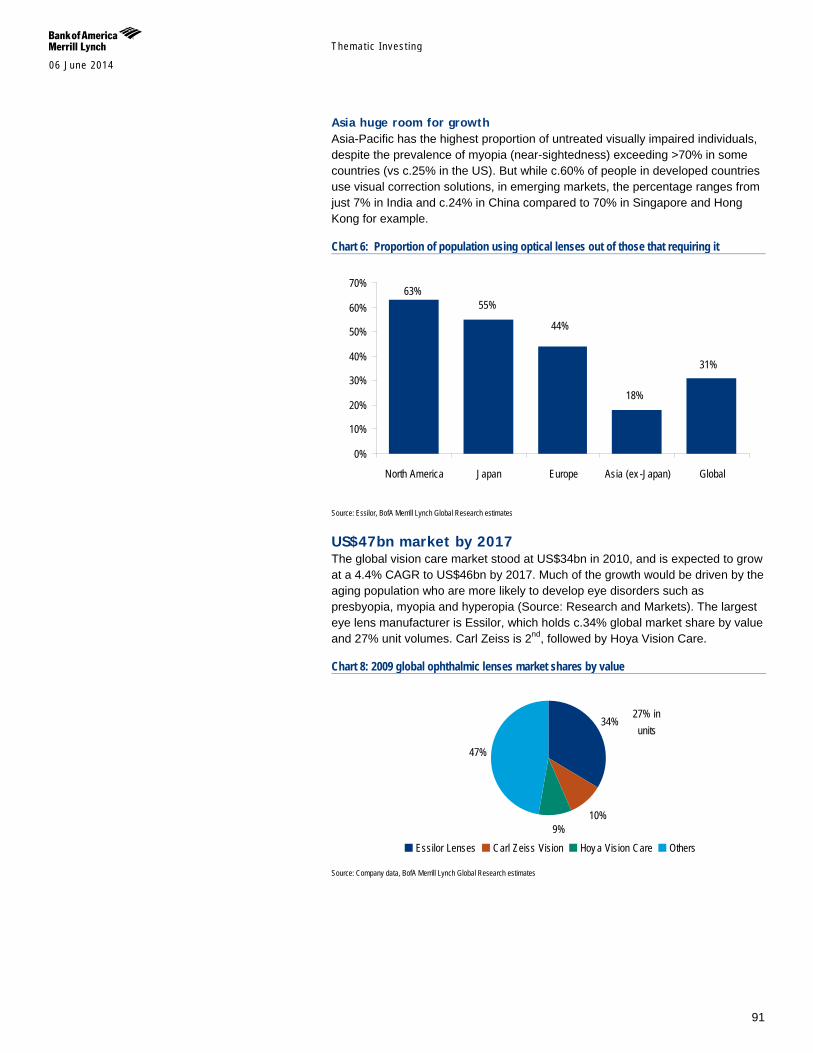
Themat ic Inves t ing 06 June 2014
91
Asia huge room for growth Asia-Pacific has the highest proportion of untreated visually impaired individuals, despite the prevalence of myopia (near-sightedness) exceeding >70% in some countries (vs c.25% in the US). But while c.60% of people in developed countries use visual correction solutions, in emerging markets, the percentage ranges from just 7% in India and c.24% in China compared to 70% in Singapore and Hong Kong for example.
Chart 6: Proportion of population using optical lenses out of those that requiring it
Source: Essilor, BofA Merrill Lynch Global Research estimates
US$47bn market by 2017 The global vision care market stood at US$34bn in 2010, and is expected to grow at a 4.4% CAGR to US$46bn by 2017. Much of the growth would be driven by the aging population who are more likely to develop eye disorders such as presbyopia, myopia and hyperopia (Source: Research and Markets). The largest eye lens manufacturer is Essilor, which holds c.34% global market share by value and 27% unit volumes. Carl Zeiss is 2nd, followed by Hoya Vision Care.
Chart 8: 2009 global ophthalmic lenses market shares by value
Source: Company data, BofA Merrill Lynch Global Research estimates
31%
18%
44%
55%63%
0%
10%
20%
30%
40%
50%
60%
70%
North America Japan Europe Asia (ex -Japan) Global
34%
10%9%
47%
Essilor Lenses Carl Zeiss Vision Hoy a Vision Care Others
27% in units
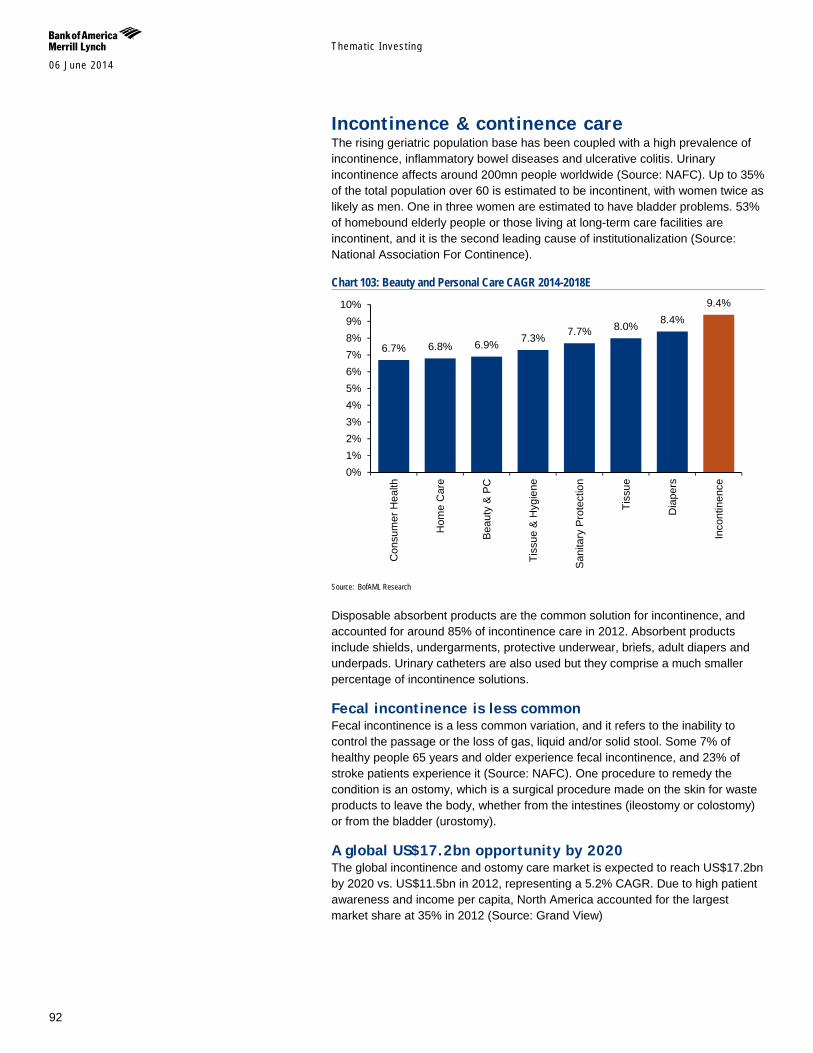
Themat ic Inves t ing 06 June 2014
92
Incontinence & continence care The rising geriatric population base has been coupled with a high prevalence of incontinence, inflammatory bowel diseases and ulcerative colitis. Urinary incontinence affects around 200mn people worldwide (Source: NAFC). Up to 35% of the total population over 60 is estimated to be incontinent, with women twice as likely as men. One in three women are estimated to have bladder problems. 53% of homebound elderly people or those living at long-term care facilities are incontinent, and it is the second leading cause of institutionalization (Source: National Association For Continence).
Chart 103: Beauty and Personal Care CAGR 2014-2018E
Source: BofAML Research
Disposable absorbent products are the common solution for incontinence, and accounted for around 85% of incontinence care in 2012. Absorbent products include shields, undergarments, protective underwear, briefs, adult diapers and underpads. Urinary catheters are also used but they comprise a much smaller percentage of incontinence solutions.
Fecal incontinence is less common Fecal incontinence is a less common variation, and it refers to the inability to control the passage or the loss of gas, liquid and/or solid stool. Some 7% of healthy people 65 years and older experience fecal incontinence, and 23% of stroke patients experience it (Source: NAFC). One procedure to remedy the condition is an ostomy, which is a surgical procedure made on the skin for waste products to leave the body, whether from the intestines (ileostomy or colostomy) or from the bladder (urostomy).
A global US$17.2bn opportunity by 2020 The global incontinence and ostomy care market is expected to reach US$17.2bn by 2020 vs. US$11.5bn in 2012, representing a 5.2% CAGR. Due to high patient awareness and income per capita, North America accounted for the largest market share at 35% in 2012 (Source: Grand View)
6.7% 6.8% 6.9% 7.3% 7.7% 8.0% 8.4% 9.4%
0%1%2%3%4%5%6%7%8%9%
10%
Con
sum
er H
ealth
Hom
e C
are
Bea
uty
& P
C
Tiss
ue &
Hyg
iene
San
itary
Pro
tect
ion
Tiss
ue
Dia
pers
Inco
ntin
ence
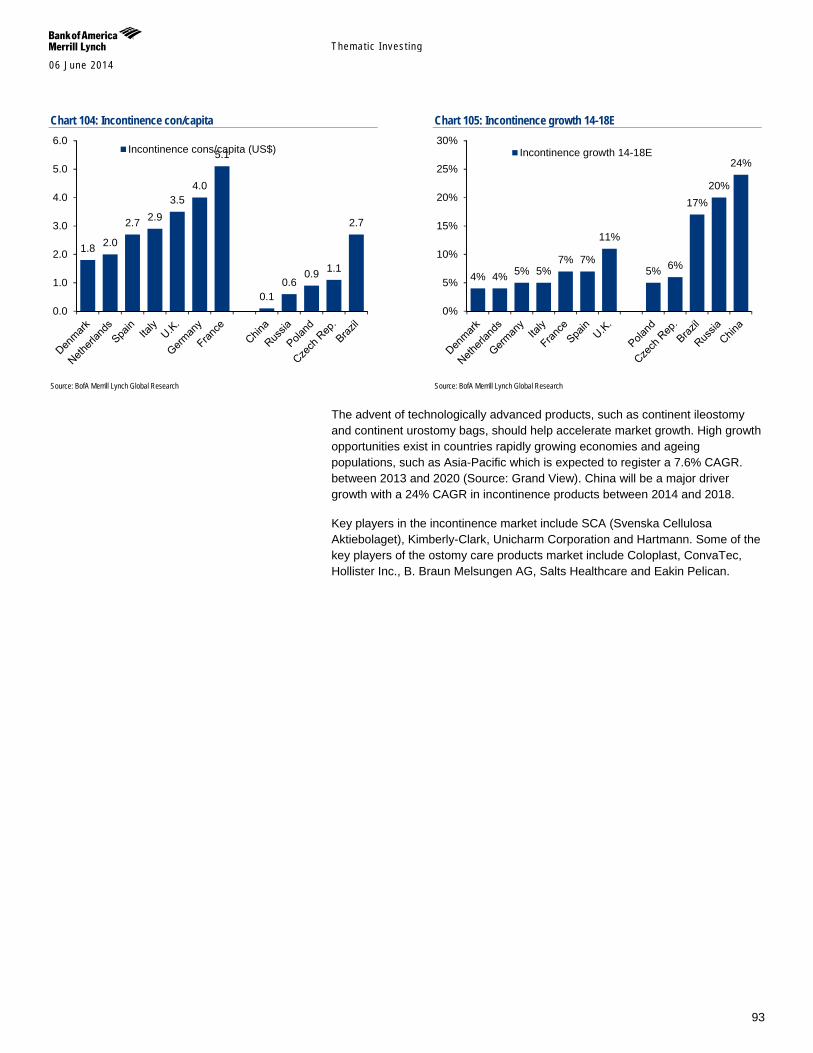
Themat ic Inves t ing 06 June 2014
93
Chart 104: Incontinence con/capita
Source: BofA Merrill Lynch Global Research
Chart 105: Incontinence growth 14-18E
Source: BofA Merrill Lynch Global Research
The advent of technologically advanced products, such as continent ileostomy and continent urostomy bags, should help accelerate market growth. High growth opportunities exist in countries rapidly growing economies and ageing populations, such as Asia-Pacific which is expected to register a 7.6% CAGR. between 2013 and 2020 (Source: Grand View). China will be a major driver growth with a 24% CAGR in incontinence products between 2014 and 2018.
Key players in the incontinence market include SCA (Svenska Cellulosa Aktiebolaget), Kimberly-Clark, Unicharm Corporation and Hartmann. Some of the key players of the ostomy care products market include Coloplast, ConvaTec, Hollister Inc., B. Braun Melsungen AG, Salts Healthcare and Eakin Pelican.
1.8 2.0
2.7 2.9 3.5
4.0
5.1
0.1 0.6
0.9 1.1
2.7
0.0
1.0
2.0
3.0
4.0
5.0
6.0Incontinence cons/capita (US$)
4% 4% 5% 5% 7% 7%
11%
5% 6%
17% 20%
24%
0%
5%
10%
15%
20%
25%
30%Incontinence growth 14-18E
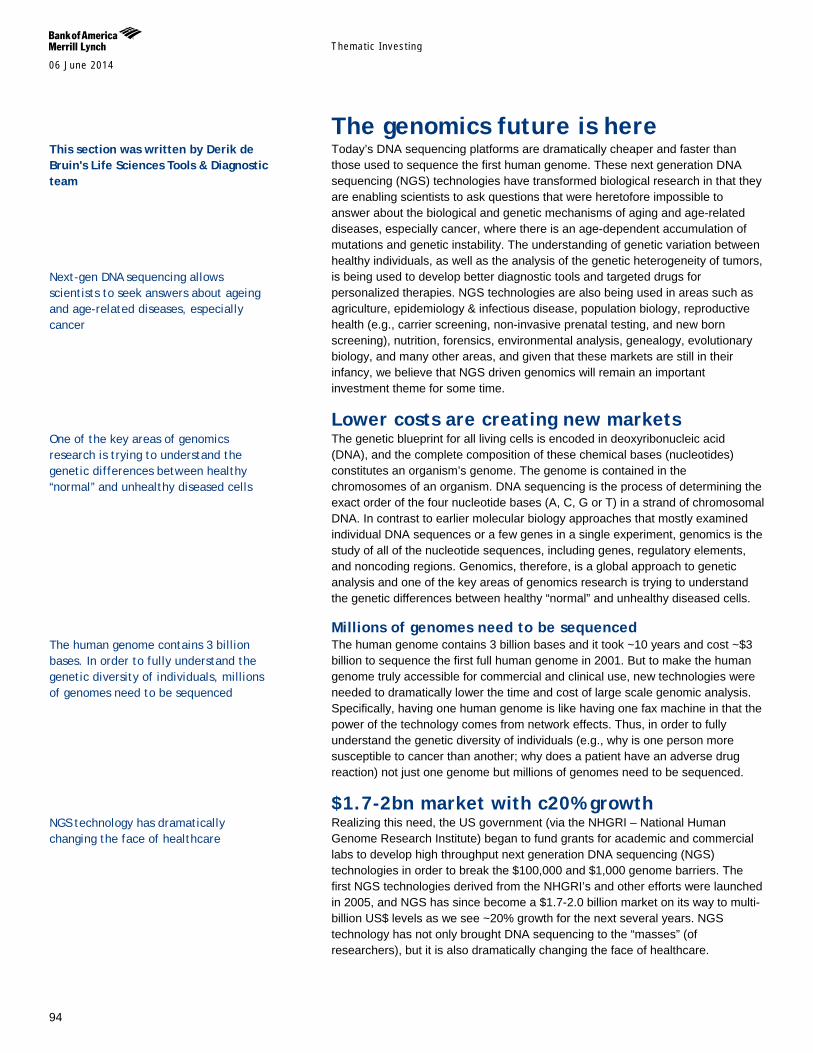
Themat ic Inves t ing 06 June 2014
94
The genomics future is here Today’s DNA sequencing platforms are dramatically cheaper and faster than those used to sequence the first human genome. These next generation DNA sequencing (NGS) technologies have transformed biological research in that they are enabling scientists to ask questions that were heretofore impossible to answer about the biological and genetic mechanisms of aging and age-related diseases, especially cancer, where there is an age-dependent accumulation of mutations and genetic instability. The understanding of genetic variation between healthy individuals, as well as the analysis of the genetic heterogeneity of tumors, is being used to develop better diagnostic tools and targeted drugs for personalized therapies. NGS technologies are also being used in areas such as agriculture, epidemiology & infectious disease, population biology, reproductive health (e.g., carrier screening, non-invasive prenatal testing, and new born screening), nutrition, forensics, environmental analysis, genealogy, evolutionary biology, and many other areas, and given that these markets are still in their infancy, we believe that NGS driven genomics will remain an important investment theme for some time.
Lower costs are creating new markets The genetic blueprint for all living cells is encoded in deoxyribonucleic acid (DNA), and the complete composition of these chemical bases (nucleotides) constitutes an organism’s genome. The genome is contained in the chromosomes of an organism. DNA sequencing is the process of determining the exact order of the four nucleotide bases (A, C, G or T) in a strand of chromosomal DNA. In contrast to earlier molecular biology approaches that mostly examined individual DNA sequences or a few genes in a single experiment, genomics is the study of all of the nucleotide sequences, including genes, regulatory elements, and noncoding regions. Genomics, therefore, is a global approach to genetic analysis and one of the key areas of genomics research is trying to understand the genetic differences between healthy “normal” and unhealthy diseased cells.
Millions of genomes need to be sequenced The human genome contains 3 billion bases and it took ~10 years and cost ~$3 billion to sequence the first full human genome in 2001. But to make the human genome truly accessible for commercial and clinical use, new technologies were needed to dramatically lower the time and cost of large scale genomic analysis. Specifically, having one human genome is like having one fax machine in that the power of the technology comes from network effects. Thus, in order to fully understand the genetic diversity of individuals (e.g., why is one person more susceptible to cancer than another; why does a patient have an adverse drug reaction) not just one genome but millions of genomes need to be sequenced.
$1.7-2bn market with c20% growth Realizing this need, the US government (via the NHGRI – National Human Genome Research Institute) began to fund grants for academic and commercial labs to develop high throughput next generation DNA sequencing (NGS) technologies in order to break the $100,000 and $1,000 genome barriers. The first NGS technologies derived from the NHGRI’s and other efforts were launched in 2005, and NGS has since become a $1.7-2.0 billion market on its way to multi-billion US$ levels as we see ~20% growth for the next several years. NGS technology has not only brought DNA sequencing to the “masses” (of researchers), but it is also dramatically changing the face of healthcare.
This section was written by Derik de Bruin's Life Sciences Tools & Diagnostic team Next-gen DNA sequencing allows scientists to seek answers about ageing and age-related diseases, especially cancer
One of the key areas of genomics research is trying to understand the genetic differences between healthy “normal” and unhealthy diseased cells
The human genome contains 3 billion bases. In order to fully understand the genetic diversity of individuals, millions of genomes need to be sequenced
NGS technology has dramatically changing the face of healthcare
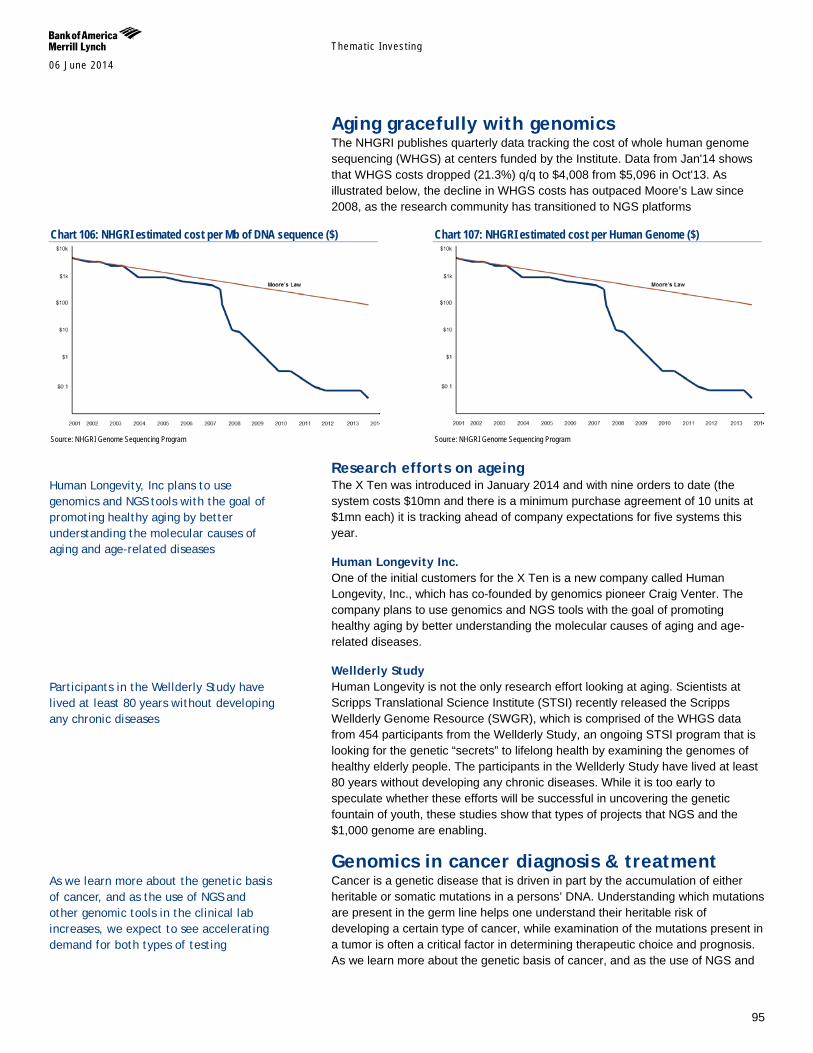
Themat ic Inves t ing 06 June 2014
95
Aging gracefully with genomics The NHGRI publishes quarterly data tracking the cost of whole human genome sequencing (WHGS) at centers funded by the Institute. Data from Jan'14 shows that WHGS costs dropped (21.3%) q/q to $4,008 from $5,096 in Oct'13. As illustrated below, the decline in WHGS costs has outpaced Moore’s Law since 2008, as the research community has transitioned to NGS platforms
Chart 106: NHGRI estimated cost per Mb of DNA sequence ($)
Source: NHGRI Genome Sequencing Program
Chart 107: NHGRI estimated cost per Human Genome ($)
Source: NHGRI Genome Sequencing Program
Research efforts on ageing The X Ten was introduced in January 2014 and with nine orders to date (the system costs $10mn and there is a minimum purchase agreement of 10 units at $1mn each) it is tracking ahead of company expectations for five systems this year.
Human Longevity Inc. One of the initial customers for the X Ten is a new company called Human Longevity, Inc., which has co-founded by genomics pioneer Craig Venter. The company plans to use genomics and NGS tools with the goal of promoting healthy aging by better understanding the molecular causes of aging and age-related diseases.
Wellderly Study Human Longevity is not the only research effort looking at aging. Scientists at Scripps Translational Science Institute (STSI) recently released the Scripps Wellderly Genome Resource (SWGR), which is comprised of the WHGS data from 454 participants from the Wellderly Study, an ongoing STSI program that is looking for the genetic “secrets” to lifelong health by examining the genomes of healthy elderly people. The participants in the Wellderly Study have lived at least 80 years without developing any chronic diseases. While it is too early to speculate whether these efforts will be successful in uncovering the genetic fountain of youth, these studies show that types of projects that NGS and the $1,000 genome are enabling.
Genomics in cancer diagnosis & treatment Cancer is a genetic disease that is driven in part by the accumulation of either heritable or somatic mutations in a persons’ DNA. Understanding which mutations are present in the germ line helps one understand their heritable risk of developing a certain type of cancer, while examination of the mutations present in a tumor is often a critical factor in determining therapeutic choice and prognosis. As we learn more about the genetic basis of cancer, and as the use of NGS and
Human Longevity, Inc plans to use genomics and NGS tools with the goal of promoting healthy aging by better understanding the molecular causes of aging and age-related diseases
Participants in the Wellderly Study have lived at least 80 years without developing any chronic diseases
As we learn more about the genetic basis of cancer, and as the use of NGS and other genomic tools in the clinical lab increases, we expect to see accelerating demand for both types of testing
Themat ic Inves t ing 06 June 2014
96
other genomic tools in the clinical lab increases, we expect to see accelerating demand for both types of testing. While an in depth review on the growing use of genomic tools for clinical applications is beyond the scope of this report, below we briefly discuss how these technologies are impacting oncology diagnosis and treatment.
Hereditary cancer risk determination According to the National Cancer Institute (NCI), 5-10% of breast and ovarian cancer cases in the general public are hereditary. The most common condition that predisposes women to breast or ovarian cancer is hereditary breast and ovarian cancer (HBOC) syndrome. This condition typically occurs via germ line mutations of tumor suppressor genes, such as BRCA1 and BRCA2 (breast cancer susceptibility gene 1 and 2; ‘BRCA1/2’). The BRCA1/2 genes encode proteins involved in DNA repair.
A woman’s lifetime risk for developing breast and/or ovarian cancer is heightened if she inherits a harmful mutation in BRCA1/2. According to the NCI, roughly 12% of women in the general public will develop cancer during their lives, versus a 60% probability for women who have an inherited harmful BRCA1/2 mutation. For ovarian cancer, women in the general population have a 1.4% lifetime risk of developing the disease, versus 15-40% of women who have a harmful BRCA1 or BRCA2 mutation.
BRCA1/2 gene testing is currently indicated for individuals with ovarian cancer, breast cancer at age 50 or younger, two primary breast cancers, male breast cancers, triple negative breast cancer, pancreatic cancer with an additional HBOC associated cancer, Ashkenazi Jewish with an HBOC-associated cancer, and a previously identified BRCA mutation in the family. Patients that receive a BRACAnalysis positive result may opt to begin a course of tamoxifen or raloxifene (selective estrogen receptor modulators or SERMs), which can reduce the lifetime risk of breast cancer by about 50%. Women can also elect to start oral contraceptives to help the risk of developing ovarian cancer by up to 60%. Additionally, individuals may have prophylactic mastectomy (surgical removal of one or both breasts) to reduce breast cancer risk by at least 90%. Prophylactic oophorectomy (surgical removal of ovaries) reduces ovarian cancer risk by up to 96% and breast cancer risk by up to 68%.
Until quite recently Myriad Genetics’ (MYGN, Neutral) flagship BRACAnalysis test was the only predictive medicine test available in the U.S. to analyze the BRCA1/2 genes for harmful mutations. The test requires a blood sample or saliva sample from a patient typically collected at a physician’s office. The sample is then analyzed at Myriad’s CLIA laboratory via DNA sequencing and data analysis, with results typically provided within 7-10 days. According to the company, about 97-98% of patients who undergo BRACAnalysis testing receive a definitive result (positive or negative), while the remaining 2-3% receive a variant of unknown significance (VUS) or indeterminate result.
In 2013, in a well-publicized case that was heard before the Supreme Court of the United States, Myriad lost some of its patent protection and as a result, its monopoly on BRCA1/2 testing. Over the last year companies such as LabCorp, Quest Diagnostics, and BioReference Labs have entered the BRCA1/2 testing market. While many companies now offer BRCA1/2 testing, there is still much debate on how comparable the tests are to each other given the different VUS rates. Moreover, price competition has prompted CMS and some commercial

Themat ic Inves t ing 06 June 2014
97
payors to lower their reimbursement rate for BRCA1/2 testing, the combination of which has caused significant volatility in Myriad’s share price.
While single gene BRCA1/2 testing has proven to be an invaluable molecular diagnostic tool, the BRCA1/2 genes do not explain all heritable breast cancers. This is also the situation for hereditary colon cancers, which is most commonly linked to mutations in one of five mismatch repair genes (i.e., MLH1, MSH2, MSH6, EPCAM and PMS2). Some of these atypical cancer cases can be linked to mutation in other lower frequency genes that are not routinely examined due to the cost of testing. The arrival of cheaper and more accurate NGS platforms has not only reduced the cost and time needed for single gene testing, but also the technology has spurred the introduction of multi-gene hereditary cancer panels that cost effectively examine multiple genes in a single test.
One such gene panel is Myriad’s myRisk Hereditary Cancer panel, a test that analyzes 25 different genes associated with eight different cancers including breast, ovarian, colorectal, endometrial, pancreatic, prostate, gastric, and melanoma. By the end of calendar 2015 Myriad anticipates transitioning all of its BRACAnalysis testing to myRisk. Other companies, including privately held InVitae and Ambry Genetics, are also offering multi-gene hereditary cancer panels, and although it remains to be see how such tests will be reimbursed, we believe that the greater diagnostic yield offered by these panels will increase the number of people who get tested. That being said, this is good news for companies that supply NGS tools to clinical testing labs.
Personalized medicine Companion diagnostics and precision therapy Due to genetic variability of individuals and the molecular heterogeneity of tumors, it is estimated that about 80-90% of the drugs now on the market work in less than 50% of individuals. Thus, not only do most patients not get the right drug at the right dose, but also this implies some $350-400 billion in ineffective prescriptions. In broad terms, personalized medicine refers to customizing drug therapy to a patient’s genetic background (i.e., pharmacogenomics) in order to optimize therapeutic benefit for the patient and lower costs to the healthcare system.
Companion diagnostics are genetic tests that are co-marketed with a drug to help predict the efficacy or optimal dose for a targeted patient group. Well known examples of single gene companion diagnostic tests include assays that measure HER2/neu receptor expression in breast cancer patients prior to treatment with Herceptin, the analysis of KRAS mutations in colon cancer patients prior to treatment with Erbitux, the determination of BCR-ABL fusion gene status prior to treatment with Gleevec in CML (chronic myeloid leukemia) patients, and the finding of ALK gene rearrangements in NSCLC (non-small cell lung cancer) prior to treatment with Xalkori. In each of these cases the drug works best in patients with a specific genetic background.
However, as in the case of hereditary cancers, because of NGS technology many labs are moving away from single gene tests to multi-gene somatic cancer panels. While hereditary tests are done using a common blood or saliva sample (since the mutations are germ line and thus present in every cell), somatic cancer panels analyze genetic material harvested from tumor biopsies. These multi-gene panels target specific genes or mutations that are relevant to a particular cancer phenotype and provide a molecular fingerprint of the tumor. This molecular detail
80-90% of the drugs now on the market work in less than 50% of individuals, meaning $350-400 billion in ineffective prescriptions Personalized medicine refers to customizing drug therapy to a patient’s genetic background (i.e., pharmacogenomics) in order to optimize therapeutic benefit for the patient and lower costs to the healthcare system

Themat ic Inves t ing 06 June 2014
98
provides more information about the nature of the tumor than conventional approaches that have relied on histology and the location of the lesion in the body. Given that cancer is a genetic disease, a deeper understanding of the genetic underpinnings of the tumor can provide the clinical oncologist with different therapeutic options.
Today many cancer centers have begun to incorporate genomic profiling as part of their diagnostic and treatment paradigm. While many large academic medical centers use their own “home brew” cancer panels, there are also “off the shelf” panels from companies like QIAGEN (QGEN), and Life Technologies (now part of Thermo Fisher Scientific, TMO) that supply cancer “hotspot” panels for research purposes. A number of commercial labs are also offering cancer panels. In particular, Foundation Medicine (FMI) offers its FoundationOne and FoundationOne Heme panels for solid and hematologic tumors, respectively. The FoundationOne panel contains 236 cancer-related genes plus 47 introns from 19 genes often rearranged in solid tumor cancers. Recently, Quest Diagnostics and Memorial Sloan-Kettering Cancer Center began a collaboration to offer their own multi-gene cancer panels.
In our view, the next few years will see the accelerating use of cancer panels to guide therapeutic choice and to monitor disease progression. In time, as NGS becomes even cheaper, faster and more sensitive, and as researchers learn more about cancer genomics and therapeutic outcomes, we believe that the market will move to whole exome (i.e., the 1-2% of the genome that encompasses all of the protein coding genes) and ultimately whole genome cancer sequencing. That being said, we note that there are still many questions concerning the clinical utility of large scale genomic data, the ultimate cost to the healthcare system, regulatory issues, reimbursement, and the ability to manage, analyze, and protect the vast amounts of data generated by these tools that need to be addressed before NGS becomes ubiquitous.
Prostate cancer management Given that this is a report about aging, we thought a discussion on new diagnostic tests for prostate cancer would be appropriate. Optimal medical management of prostate cancer is difficult because this cancer type is generally highly variable, slow growing and non-aggressive. More men will die with prostate cancer than because of this disease. Many men diagnosed with prostate cancer have non-aggressive disease that can be monitored with active surveillance, whereas some patients have aggressive cancer requiring immediate medical intervention, such as radical prostatectomy (removal of the prostate gland and some surrounding tissue) or radiation therapy.
Unfortunately, clinical measures typically used by doctors today for prostate cancer risk stratification have several shortcomings. For example, the Gleason score, a pathology scoring system used to help evaluate the prognosis of men with prostate cancer, has challenges related to reproducibility stemming from variability in histological tumor grading. In addition, PSA (prostate-specific antigen), a test that measures the level of prostate-specific antigen in a patient’s blood, is limited as a diagnostic marker due to low tumor specificity.
Indeed, in October 2011, the US Preventative Services Task Force (USPSTF), an independent panel of non-Federal experts in prevention and evidence-based medicine, reviewed available clinical evidence on PSA screening and concluded that this assay led to little or no reduction in prostate cancer mortality during a 10-year follow-up period. As a result, in May 2012 the USPSTF recommended
Themat ic Inves t ing 06 June 2014
99
against the use of PSA screening for prostate cancer in all age groups, noting that the test leads to over-diagnosis and overtreatment
As such, over treatment of prostate cancer is common. It is estimated that only 10-20% of prostate cancers are aggressive, but the majority of men (80-90%) opt for medical treatment that carry serious side effects (eg, incontinence and impotence) and place an unnecessary financial burden on the health care system. In our view, new tools to help distinguish between aggressive and indolent prostate cancer are needed.
Genomic Health (GHDX, UP), with its OncotypeDx Prostate test, and Myriad Genetics with its Prolaris test, are currently marketing multi-gene prostate cancer tests to help physicians distinguish between aggressive forms of diseases requiring immediate treatment (eg, surgery or radiation therapy) and indolent forms of cancer that can be managed through active surveillance when used alongside traditional clinical parameters, such Gleason Score and PSA. Although volumes for both tests are still relatively low due to the fact that neither test has yet received CMS or commercial reimbursement (about 50% of the prostate patient market is covered by CMS / Medicare), we are optimistic on the uptake of these tests. Of note, both tests were developed and are run using quantitative PCR (polymerase chain reaction) based technologies, as work on these tests began before the NGS platforms were optimized.
Investing in genomics Overall, we remain very bullish on the genomics future and believe that there are many opportunities for growth, although we remind investors that genomics stocks can be very volatile and that they are more appropriate for clients with a high tolerance for risk as part of a well-diversified portfolio.
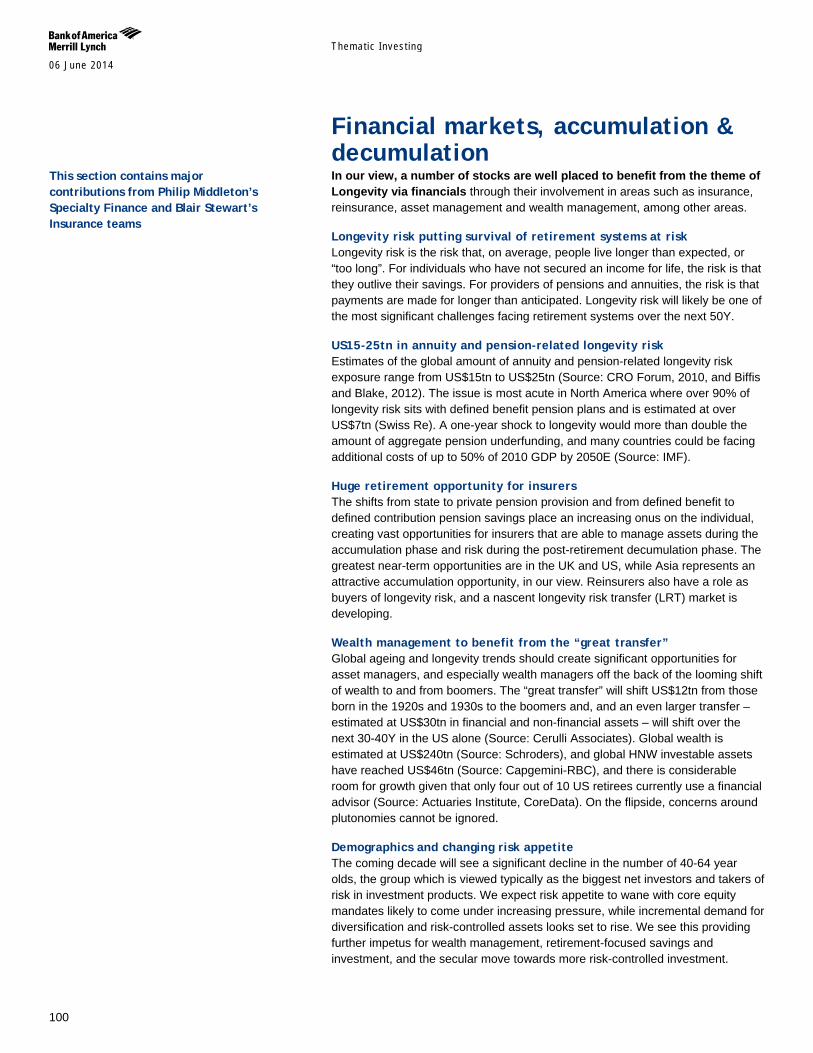
Themat ic Inves t ing 06 June 2014
100
Financial markets, accumulation & decumulation In our view, a number of stocks are well placed to benefit from the theme of Longevity via financials through their involvement in areas such as insurance, reinsurance, asset management and wealth management, among other areas.
Longevity risk putting survival of retirement systems at risk Longevity risk is the risk that, on average, people live longer than expected, or “too long”. For individuals who have not secured an income for life, the risk is that they outlive their savings. For providers of pensions and annuities, the risk is that payments are made for longer than anticipated. Longevity risk will likely be one of the most significant challenges facing retirement systems over the next 50Y.
US15-25tn in annuity and pension-related longevity risk Estimates of the global amount of annuity and pension-related longevity risk exposure range from US$15tn to US$25tn (Source: CRO Forum, 2010, and Biffis and Blake, 2012). The issue is most acute in North America where over 90% of longevity risk sits with defined benefit pension plans and is estimated at over US$7tn (Swiss Re). A one-year shock to longevity would more than double the amount of aggregate pension underfunding, and many countries could be facing additional costs of up to 50% of 2010 GDP by 2050E (Source: IMF).
Huge retirement opportunity for insurers The shifts from state to private pension provision and from defined benefit to defined contribution pension savings place an increasing onus on the individual, creating vast opportunities for insurers that are able to manage assets during the accumulation phase and risk during the post-retirement decumulation phase. The greatest near-term opportunities are in the UK and US, while Asia represents an attractive accumulation opportunity, in our view. Reinsurers also have a role as buyers of longevity risk, and a nascent longevity risk transfer (LRT) market is developing.
Wealth management to benefit from the “great transfer” Global ageing and longevity trends should create significant opportunities for asset managers, and especially wealth managers off the back of the looming shift of wealth to and from boomers. The “great transfer” will shift US$12tn from those born in the 1920s and 1930s to the boomers and, and an even larger transfer – estimated at US$30tn in financial and non-financial assets – will shift over the next 30-40Y in the US alone (Source: Cerulli Associates). Global wealth is estimated at US$240tn (Source: Schroders), and global HNW investable assets have reached US$46tn (Source: Capgemini-RBC), and there is considerable room for growth given that only four out of 10 US retirees currently use a financial advisor (Source: Actuaries Institute, CoreData). On the flipside, concerns around plutonomies cannot be ignored.
Demographics and changing risk appetite The coming decade will see a significant decline in the number of 40-64 year olds, the group which is viewed typically as the biggest net investors and takers of risk in investment products. We expect risk appetite to wane with core equity mandates likely to come under increasing pressure, while incremental demand for diversification and risk-controlled assets looks set to rise. We see this providing further impetus for wealth management, retirement-focused savings and investment, and the secular move towards more risk-controlled investment.
This section contains major contributions from Philip Middleton’s Specialty Finance and Blair Stewart’s Insurance teams
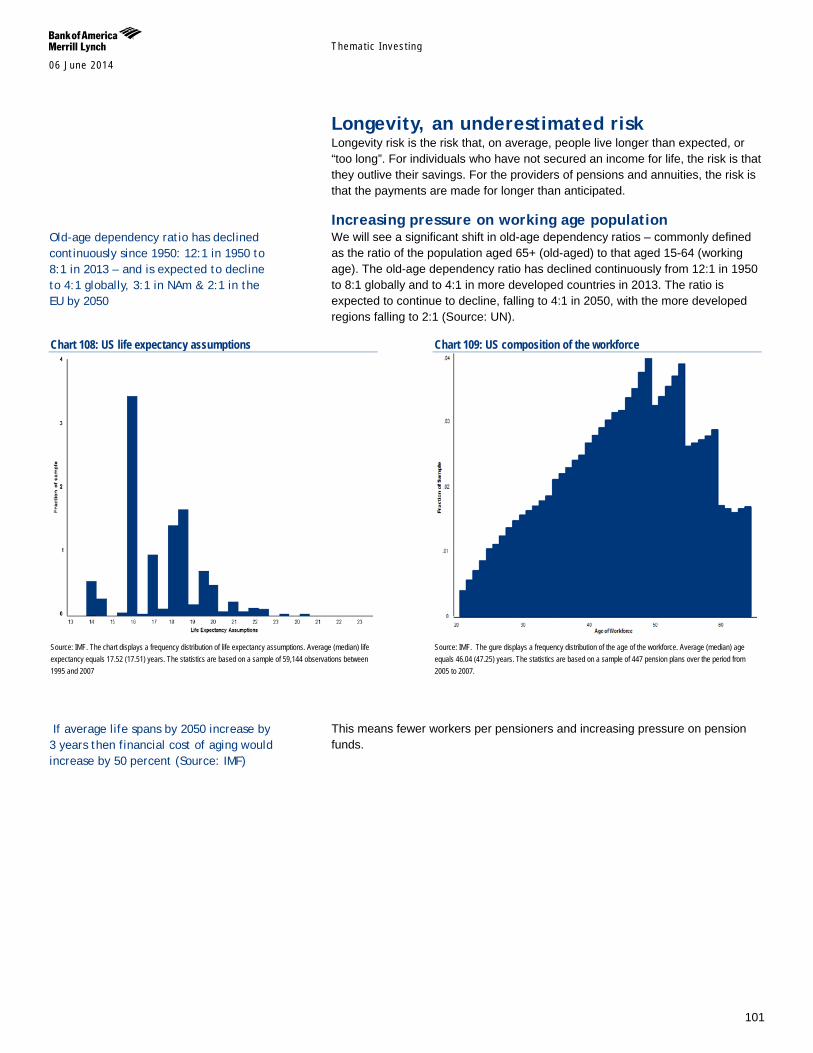
Themat ic Inves t ing 06 June 2014
101
Longevity, an underestimated risk Longevity risk is the risk that, on average, people live longer than expected, or “too long”. For individuals who have not secured an income for life, the risk is that they outlive their savings. For the providers of pensions and annuities, the risk is that the payments are made for longer than anticipated.
Increasing pressure on working age population We will see a significant shift in old-age dependency ratios – commonly defined as the ratio of the population aged 65+ (old-aged) to that aged 15-64 (working age). The old-age dependency ratio has declined continuously from 12:1 in 1950 to 8:1 globally and to 4:1 in more developed countries in 2013. The ratio is expected to continue to decline, falling to 4:1 in 2050, with the more developed regions falling to 2:1 (Source: UN).
Chart 108: US life expectancy assumptions
Source: IMF. The chart displays a frequency distribution of life expectancy assumptions. Average (median) life expectancy equals 17.52 (17.51) years. The statistics are based on a sample of 59,144 observations between 1995 and 2007
Chart 109: US composition of the workforce
Source: IMF. The gure displays a frequency distribution of the age of the workforce. Average (median) age equals 46.04 (47.25) years. The statistics are based on a sample of 447 pension plans over the period from 2005 to 2007.
This means fewer workers per pensioners and increasing pressure on pension funds.
If average life spans by 2050 increase by 3 years then financial cost of aging would increase by 50 percent (Source: IMF)
Old-age dependency ratio has declined continuously since 1950: 12:1 in 1950 to 8:1 in 2013 – and is expected to decline to 4:1 globally, 3:1 in NAm & 2:1 in the EU by 2050
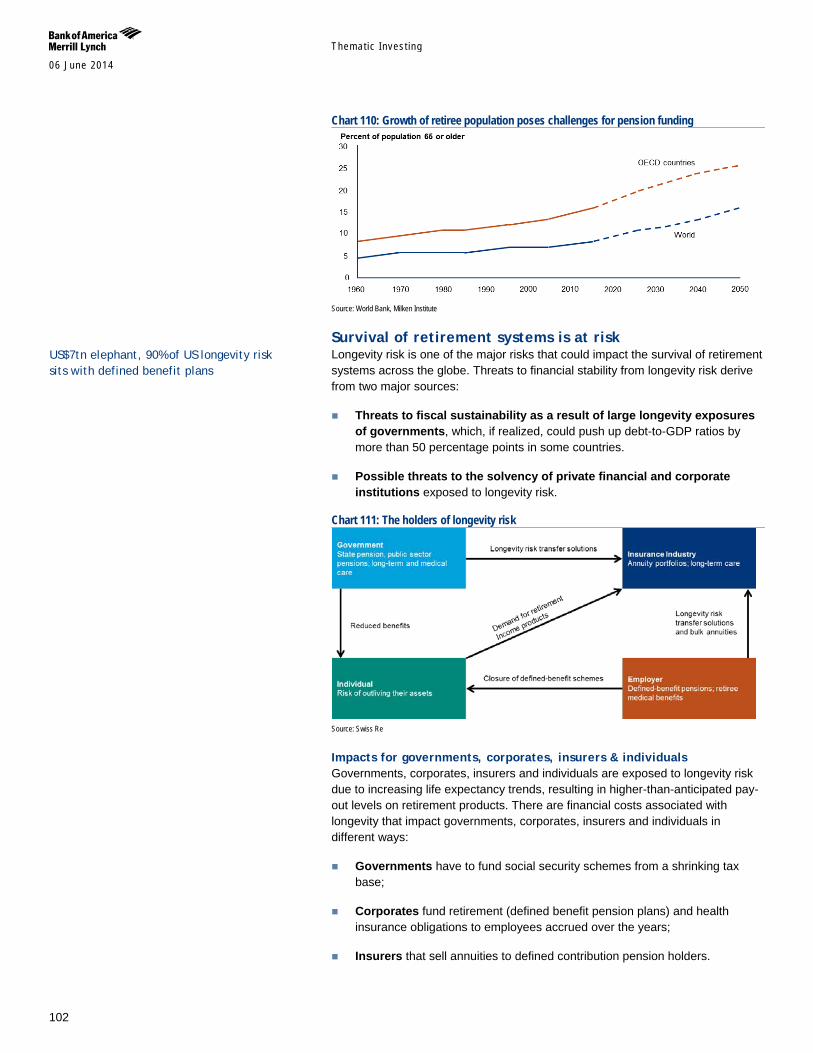
Themat ic Inves t ing 06 June 2014
102
Chart 110: Growth of retiree population poses challenges for pension funding
Source: World Bank, Milken Institute
Survival of retirement systems is at risk Longevity risk is one of the major risks that could impact the survival of retirement systems across the globe. Threats to financial stability from longevity risk derive from two major sources:
Threats to fiscal sustainability as a result of large longevity exposures of governments, which, if realized, could push up debt-to-GDP ratios by more than 50 percentage points in some countries.
Possible threats to the solvency of private financial and corporate institutions exposed to longevity risk.
Chart 111: The holders of longevity risk
Source: Swiss Re
Impacts for governments, corporates, insurers & individuals Governments, corporates, insurers and individuals are exposed to longevity risk due to increasing life expectancy trends, resulting in higher-than-anticipated pay-out levels on retirement products. There are financial costs associated with longevity that impact governments, corporates, insurers and individuals in different ways:
Governments have to fund social security schemes from a shrinking tax base;
Corporates fund retirement (defined benefit pension plans) and health insurance obligations to employees accrued over the years;
Insurers that sell annuities to defined contribution pension holders.
US$7tn elephant, 90% of US longevity risk sits with defined benefit plans
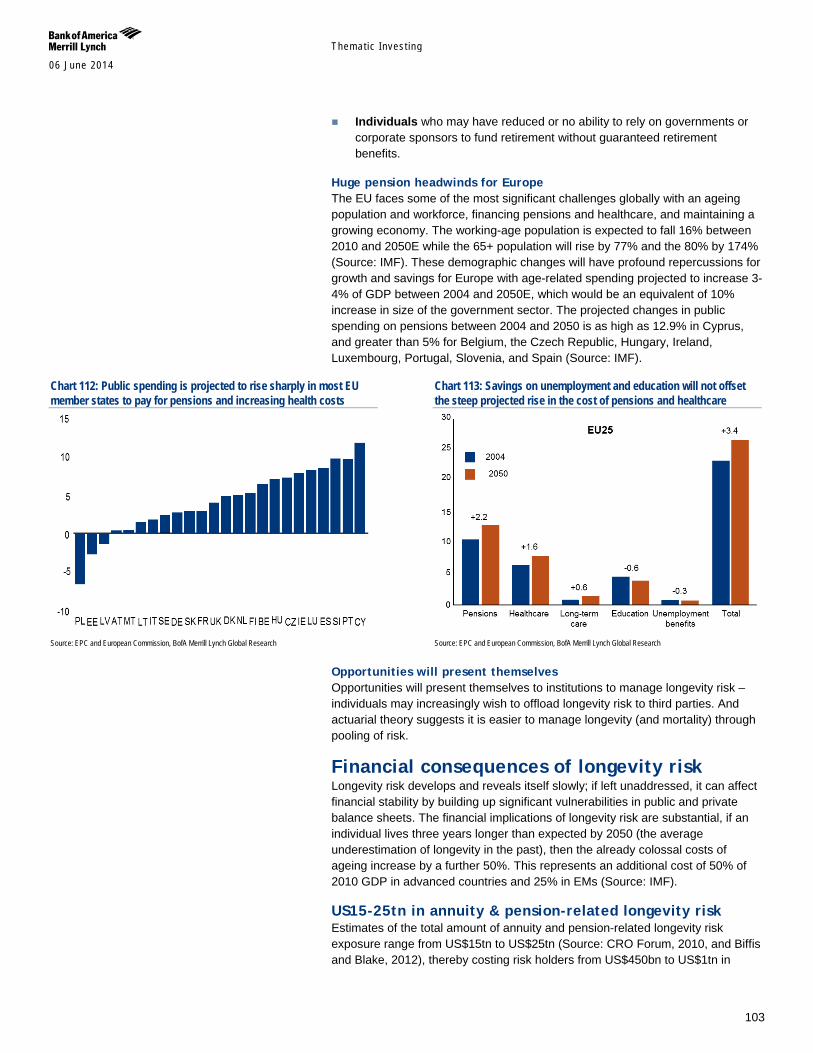
Themat ic Inves t ing 06 June 2014
103
Individuals who may have reduced or no ability to rely on governments or corporate sponsors to fund retirement without guaranteed retirement benefits.
Huge pension headwinds for Europe The EU faces some of the most significant challenges globally with an ageing population and workforce, financing pensions and healthcare, and maintaining a growing economy. The working-age population is expected to fall 16% between 2010 and 2050E while the 65+ population will rise by 77% and the 80% by 174% (Source: IMF). These demographic changes will have profound repercussions for growth and savings for Europe with age-related spending projected to increase 3-4% of GDP between 2004 and 2050E, which would be an equivalent of 10% increase in size of the government sector. The projected changes in public spending on pensions between 2004 and 2050 is as high as 12.9% in Cyprus, and greater than 5% for Belgium, the Czech Republic, Hungary, Ireland, Luxembourg, Portugal, Slovenia, and Spain (Source: IMF).
Chart 112: Public spending is projected to rise sharply in most EU member states to pay for pensions and increasing health costs
Source: EPC and European Commission, BofA Merrill Lynch Global Research
Chart 113: Savings on unemployment and education will not offset the steep projected rise in the cost of pensions and healthcare
Source: EPC and European Commission, BofA Merrill Lynch Global Research
Opportunities will present themselves Opportunities will present themselves to institutions to manage longevity risk – individuals may increasingly wish to offload longevity risk to third parties. And actuarial theory suggests it is easier to manage longevity (and mortality) through pooling of risk.
Financial consequences of longevity risk Longevity risk develops and reveals itself slowly; if left unaddressed, it can affect financial stability by building up significant vulnerabilities in public and private balance sheets. The financial implications of longevity risk are substantial, if an individual lives three years longer than expected by 2050 (the average underestimation of longevity in the past), then the already colossal costs of ageing increase by a further 50%. This represents an additional cost of 50% of 2010 GDP in advanced countries and 25% in EMs (Source: IMF).
US15-25tn in annuity & pension-related longevity risk Estimates of the total amount of annuity and pension-related longevity risk exposure range from US$15tn to US$25tn (Source: CRO Forum, 2010, and Biffis and Blake, 2012), thereby costing risk holders from US$450bn to US$1tn in
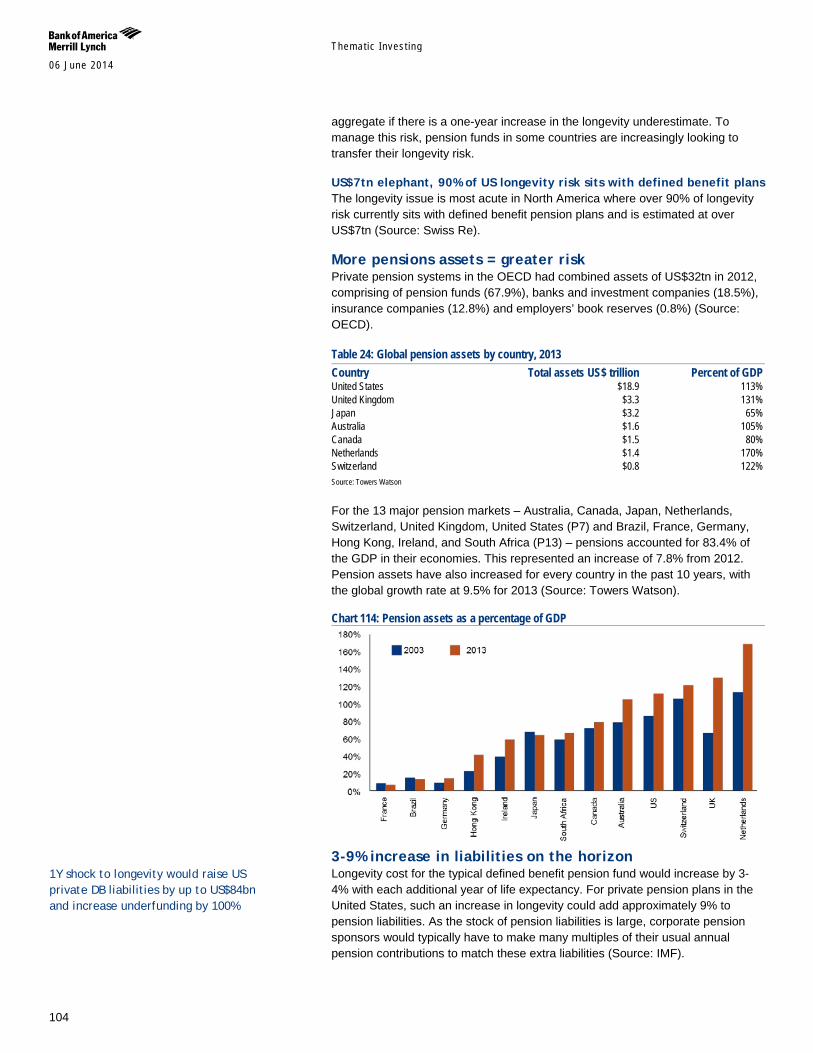
Themat ic Inves t ing 06 June 2014
104
aggregate if there is a one-year increase in the longevity underestimate. To manage this risk, pension funds in some countries are increasingly looking to transfer their longevity risk.
US$7tn elephant, 90% of US longevity risk sits with defined benefit plans The longevity issue is most acute in North America where over 90% of longevity risk currently sits with defined benefit pension plans and is estimated at over US$7tn (Source: Swiss Re).
More pensions assets = greater risk Private pension systems in the OECD had combined assets of US$32tn in 2012, comprising of pension funds (67.9%), banks and investment companies (18.5%), insurance companies (12.8%) and employers’ book reserves (0.8%) (Source: OECD).
Table 24: Global pension assets by country, 2013 Country Total assets US$ trillion Percent of GDP United States $18.9 113% United Kingdom $3.3 131% Japan $3.2 65% Australia $1.6 105% Canada $1.5 80% Netherlands $1.4 170% Switzerland $0.8 122% Source: Towers Watson
For the 13 major pension markets – Australia, Canada, Japan, Netherlands, Switzerland, United Kingdom, United States (P7) and Brazil, France, Germany, Hong Kong, Ireland, and South Africa (P13) – pensions accounted for 83.4% of the GDP in their economies. This represented an increase of 7.8% from 2012. Pension assets have also increased for every country in the past 10 years, with the global growth rate at 9.5% for 2013 (Source: Towers Watson).
Chart 114: Pension assets as a percentage of GDP
3-9% increase in liabilities on the horizon Longevity cost for the typical defined benefit pension fund would increase by 3-4% with each additional year of life expectancy. For private pension plans in the United States, such an increase in longevity could add approximately 9% to pension liabilities. As the stock of pension liabilities is large, corporate pension sponsors would typically have to make many multiples of their usual annual pension contributions to match these extra liabilities (Source: IMF).
1Y shock to longevity would raise US private DB liabilities by up to US$84bn and increase underfunding by 100%
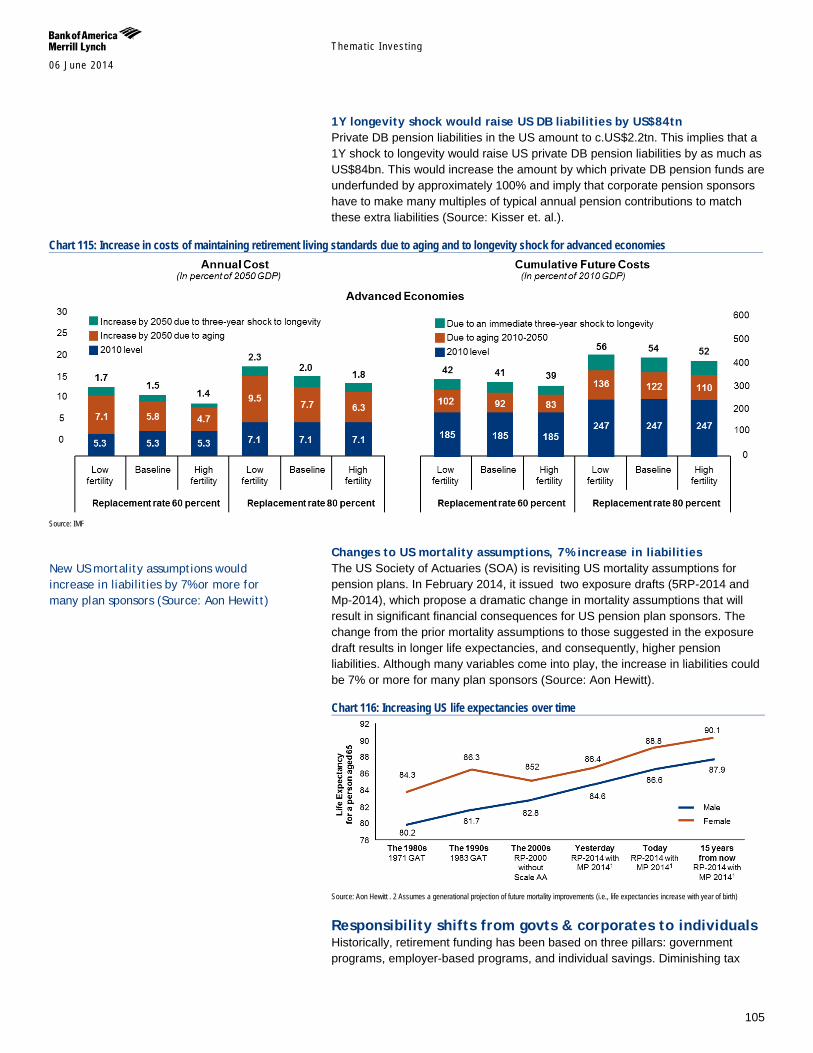
Themat ic Inves t ing 06 June 2014
105
1Y longevity shock would raise US DB liabilities by US$84tn Private DB pension liabilities in the US amount to c.US$2.2tn. This implies that a 1Y shock to longevity would raise US private DB pension liabilities by as much as US$84bn. This would increase the amount by which private DB pension funds are underfunded by approximately 100% and imply that corporate pension sponsors have to make many multiples of typical annual pension contributions to match these extra liabilities (Source: Kisser et. al.).
Chart 115: Increase in costs of maintaining retirement living standards due to aging and to longevity shock for advanced economies
Source: IMF
Changes to US mortality assumptions, 7% increase in liabilities The US Society of Actuaries (SOA) is revisiting US mortality assumptions for pension plans. In February 2014, it issued two exposure drafts (5RP-2014 and Mp-2014), which propose a dramatic change in mortality assumptions that will result in significant financial consequences for US pension plan sponsors. The change from the prior mortality assumptions to those suggested in the exposure draft results in longer life expectancies, and consequently, higher pension liabilities. Although many variables come into play, the increase in liabilities could be 7% or more for many plan sponsors (Source: Aon Hewitt).
Chart 116: Increasing US life expectancies over time
Source: Aon Hewitt . 2 Assumes a generational projection of future mortality improvements (i.e., life expectancies increase with year of birth)
Responsibility shifts from govts & corporates to individuals Historically, retirement funding has been based on three pillars: government programs, employer-based programs, and individual savings. Diminishing tax
New US mortality assumptions would increase in liabilities by 7% or more for many plan sponsors (Source: Aon Hewitt)
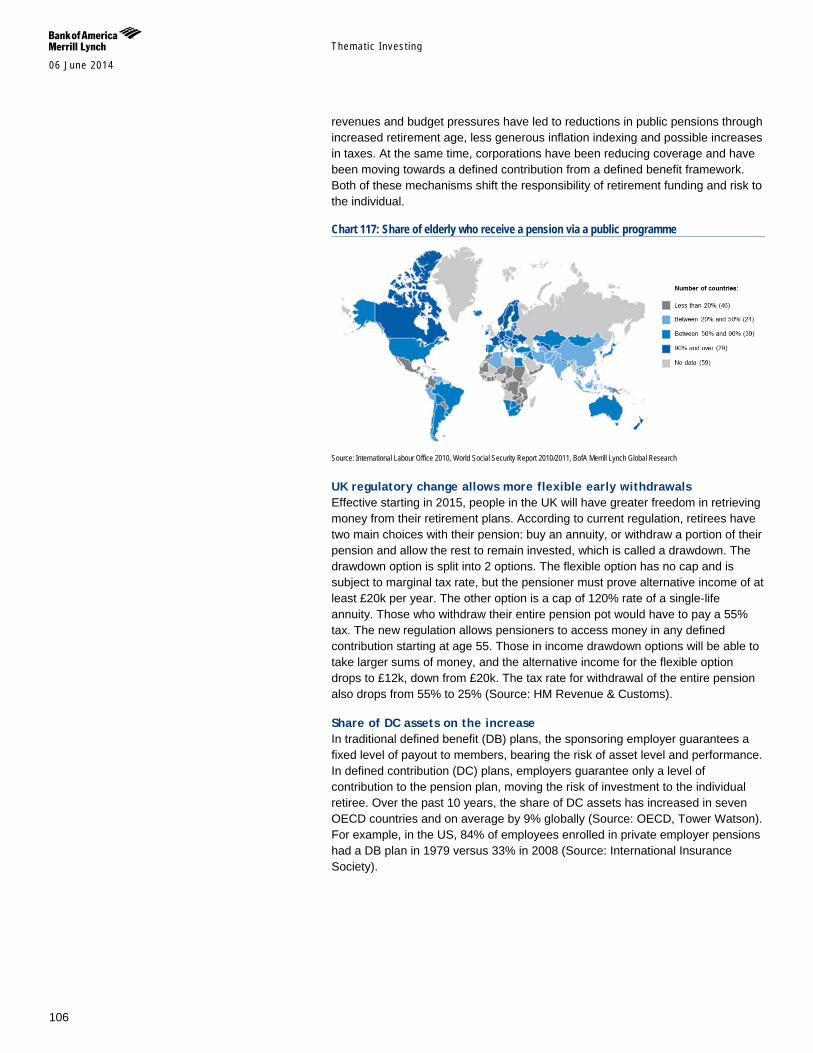
Themat ic Inves t ing 06 June 2014
106
revenues and budget pressures have led to reductions in public pensions through increased retirement age, less generous inflation indexing and possible increases in taxes. At the same time, corporations have been reducing coverage and have been moving towards a defined contribution from a defined benefit framework. Both of these mechanisms shift the responsibility of retirement funding and risk to the individual.
Chart 117: Share of elderly who receive a pension via a public programme
Source: International Labour Office 2010, World Social Security Report 2010/2011, BofA Merrill Lynch Global Research
UK regulatory change allows more flexible early withdrawals Effective starting in 2015, people in the UK will have greater freedom in retrieving money from their retirement plans. According to current regulation, retirees have two main choices with their pension: buy an annuity, or withdraw a portion of their pension and allow the rest to remain invested, which is called a drawdown. The drawdown option is split into 2 options. The flexible option has no cap and is subject to marginal tax rate, but the pensioner must prove alternative income of at least £20k per year. The other option is a cap of 120% rate of a single-life annuity. Those who withdraw their entire pension pot would have to pay a 55% tax. The new regulation allows pensioners to access money in any defined contribution starting at age 55. Those in income drawdown options will be able to take larger sums of money, and the alternative income for the flexible option drops to £12k, down from £20k. The tax rate for withdrawal of the entire pension also drops from 55% to 25% (Source: HM Revenue & Customs).
Share of DC assets on the increase In traditional defined benefit (DB) plans, the sponsoring employer guarantees a fixed level of payout to members, bearing the risk of asset level and performance. In defined contribution (DC) plans, employers guarantee only a level of contribution to the pension plan, moving the risk of investment to the individual retiree. Over the past 10 years, the share of DC assets has increased in seven OECD countries and on average by 9% globally (Source: OECD, Tower Watson). For example, in the US, 84% of employees enrolled in private employer pensions had a DB plan in 1979 versus 33% in 2008 (Source: International Insurance Society).
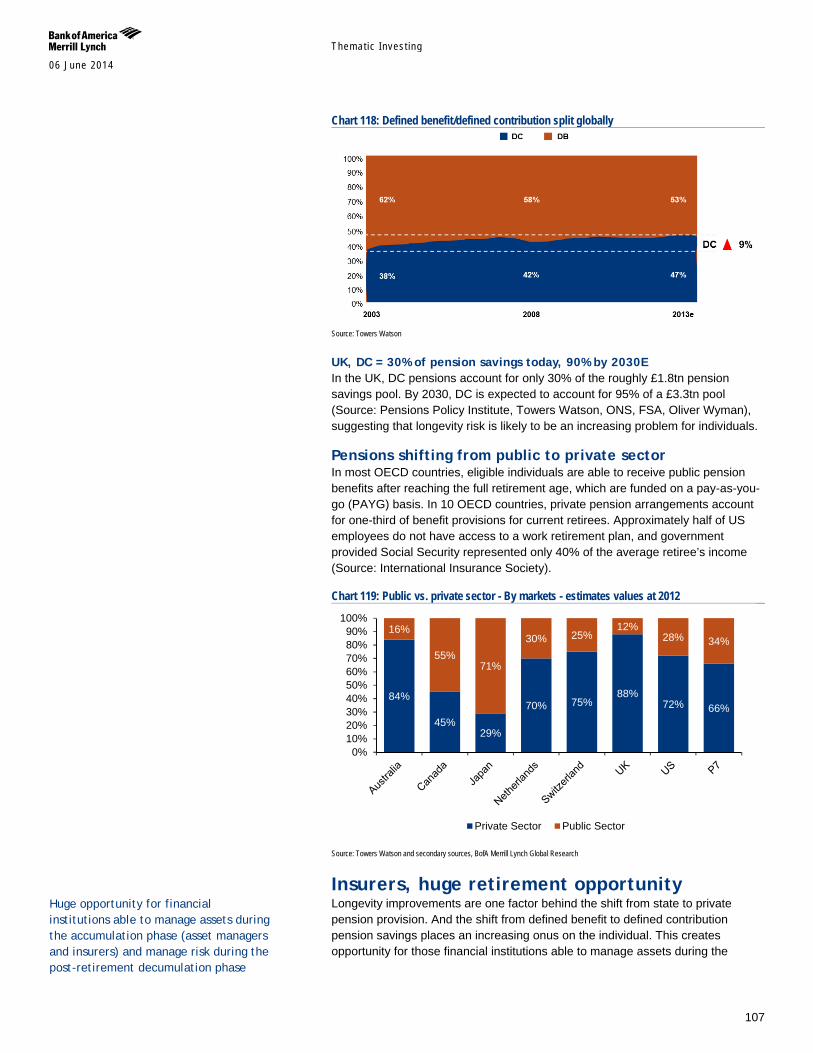
Themat ic Inves t ing 06 June 2014
107
Chart 118: Defined benefit/defined contribution split globally
Source: Towers Watson
UK, DC = 30% of pension savings today, 90% by 2030E In the UK, DC pensions account for only 30% of the roughly £1.8tn pension savings pool. By 2030, DC is expected to account for 95% of a £3.3tn pool (Source: Pensions Policy Institute, Towers Watson, ONS, FSA, Oliver Wyman), suggesting that longevity risk is likely to be an increasing problem for individuals.
Pensions shifting from public to private sector In most OECD countries, eligible individuals are able to receive public pension benefits after reaching the full retirement age, which are funded on a pay-as-you-go (PAYG) basis. In 10 OECD countries, private pension arrangements account for one-third of benefit provisions for current retirees. Approximately half of US employees do not have access to a work retirement plan, and government provided Social Security represented only 40% of the average retiree’s income (Source: International Insurance Society).
Chart 119: Public vs. private sector - By markets - estimates values at 2012
Source: Towers Watson and secondary sources, BofA Merrill Lynch Global Research
Insurers, huge retirement opportunity Longevity improvements are one factor behind the shift from state to private pension provision. And the shift from defined benefit to defined contribution pension savings places an increasing onus on the individual. This creates opportunity for those financial institutions able to manage assets during the
84%
45% 29%
70% 75% 88%
72% 66%
16%
55% 71%
30% 25% 12%
28% 34%
0%10%20%30%40%50%60%70%80%90%
100%
Private Sector Public Sector
Huge opportunity for financial institutions able to manage assets during the accumulation phase (asset managers and insurers) and manage risk during the post-retirement decumulation phase
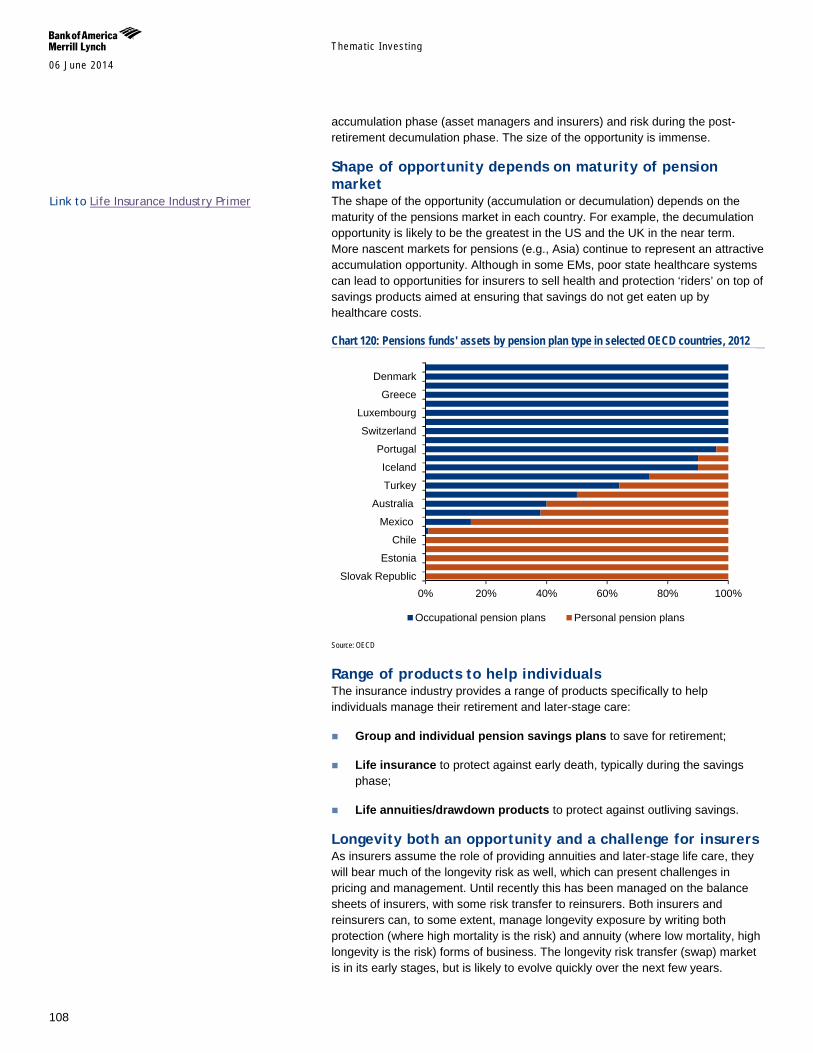
Themat ic Inves t ing 06 June 2014
108
accumulation phase (asset managers and insurers) and risk during the post-retirement decumulation phase. The size of the opportunity is immense.
Shape of opportunity depends on maturity of pension market The shape of the opportunity (accumulation or decumulation) depends on the maturity of the pensions market in each country. For example, the decumulation opportunity is likely to be the greatest in the US and the UK in the near term. More nascent markets for pensions (e.g., Asia) continue to represent an attractive accumulation opportunity. Although in some EMs, poor state healthcare systems can lead to opportunities for insurers to sell health and protection ‘riders’ on top of savings products aimed at ensuring that savings do not get eaten up by healthcare costs.
Chart 120: Pensions funds' assets by pension plan type in selected OECD countries, 2012
Source: OECD
Range of products to help individuals The insurance industry provides a range of products specifically to help individuals manage their retirement and later-stage care:
Group and individual pension savings plans to save for retirement;
Life insurance to protect against early death, typically during the savings phase;
Life annuities/drawdown products to protect against outliving savings.
Longevity both an opportunity and a challenge for insurers As insurers assume the role of providing annuities and later-stage life care, they will bear much of the longevity risk as well, which can present challenges in pricing and management. Until recently this has been managed on the balance sheets of insurers, with some risk transfer to reinsurers. Both insurers and reinsurers can, to some extent, manage longevity exposure by writing both protection (where high mortality is the risk) and annuity (where low mortality, high longevity is the risk) forms of business. The longevity risk transfer (swap) market is in its early stages, but is likely to evolve quickly over the next few years.
0% 20% 40% 60% 80% 100%Slovak Republic
Estonia
Chile
Mexico
Australia
Turkey
Iceland
Portugal
Switzerland
Luxembourg
Greece
Denmark
Occupational pension plans Personal pension plans
Link to Life Insurance Industry Primer
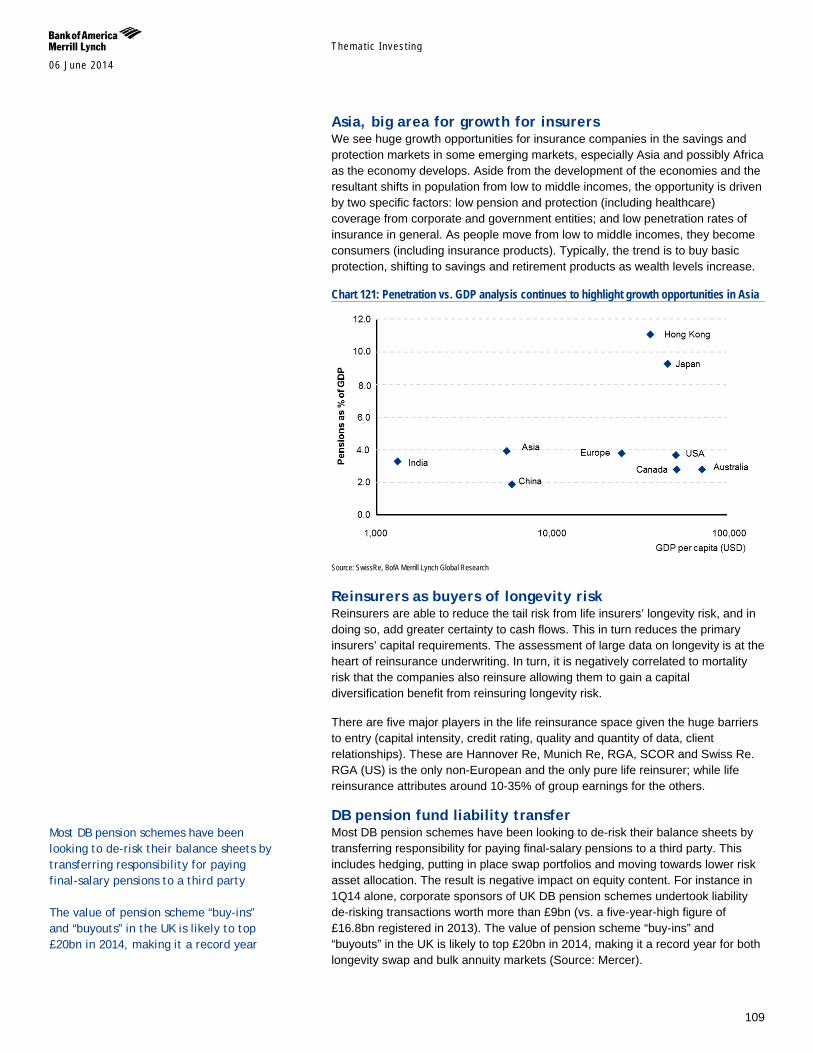
Themat ic Inves t ing 06 June 2014
109
Asia, big area for growth for insurers We see huge growth opportunities for insurance companies in the savings and protection markets in some emerging markets, especially Asia and possibly Africa as the economy develops. Aside from the development of the economies and the resultant shifts in population from low to middle incomes, the opportunity is driven by two specific factors: low pension and protection (including healthcare) coverage from corporate and government entities; and low penetration rates of insurance in general. As people move from low to middle incomes, they become consumers (including insurance products). Typically, the trend is to buy basic protection, shifting to savings and retirement products as wealth levels increase.
Chart 121: Penetration vs. GDP analysis continues to highlight growth opportunities in Asia
Source: SwissRe, BofA Merrill Lynch Global Research
Reinsurers as buyers of longevity risk Reinsurers are able to reduce the tail risk from life insurers’ longevity risk, and in doing so, add greater certainty to cash flows. This in turn reduces the primary insurers’ capital requirements. The assessment of large data on longevity is at the heart of reinsurance underwriting. In turn, it is negatively correlated to mortality risk that the companies also reinsure allowing them to gain a capital diversification benefit from reinsuring longevity risk.
There are five major players in the life reinsurance space given the huge barriers to entry (capital intensity, credit rating, quality and quantity of data, client relationships). These are Hannover Re, Munich Re, RGA, SCOR and Swiss Re. RGA (US) is the only non-European and the only pure life reinsurer; while life reinsurance attributes around 10-35% of group earnings for the others.
DB pension fund liability transfer Most DB pension schemes have been looking to de-risk their balance sheets by transferring responsibility for paying final-salary pensions to a third party. This includes hedging, putting in place swap portfolios and moving towards lower risk asset allocation. The result is negative impact on equity content. For instance in 1Q14 alone, corporate sponsors of UK DB pension schemes undertook liability de-risking transactions worth more than £9bn (vs. a five-year-high figure of £16.8bn registered in 2013). The value of pension scheme “buy-ins” and “buyouts” in the UK is likely to top £20bn in 2014, making it a record year for both longevity swap and bulk annuity markets (Source: Mercer).
Most DB pension schemes have been looking to de-risk their balance sheets by transferring responsibility for paying final-salary pensions to a third party The value of pension scheme “buy-ins” and “buyouts” in the UK is likely to top £20bn in 2014, making it a record year
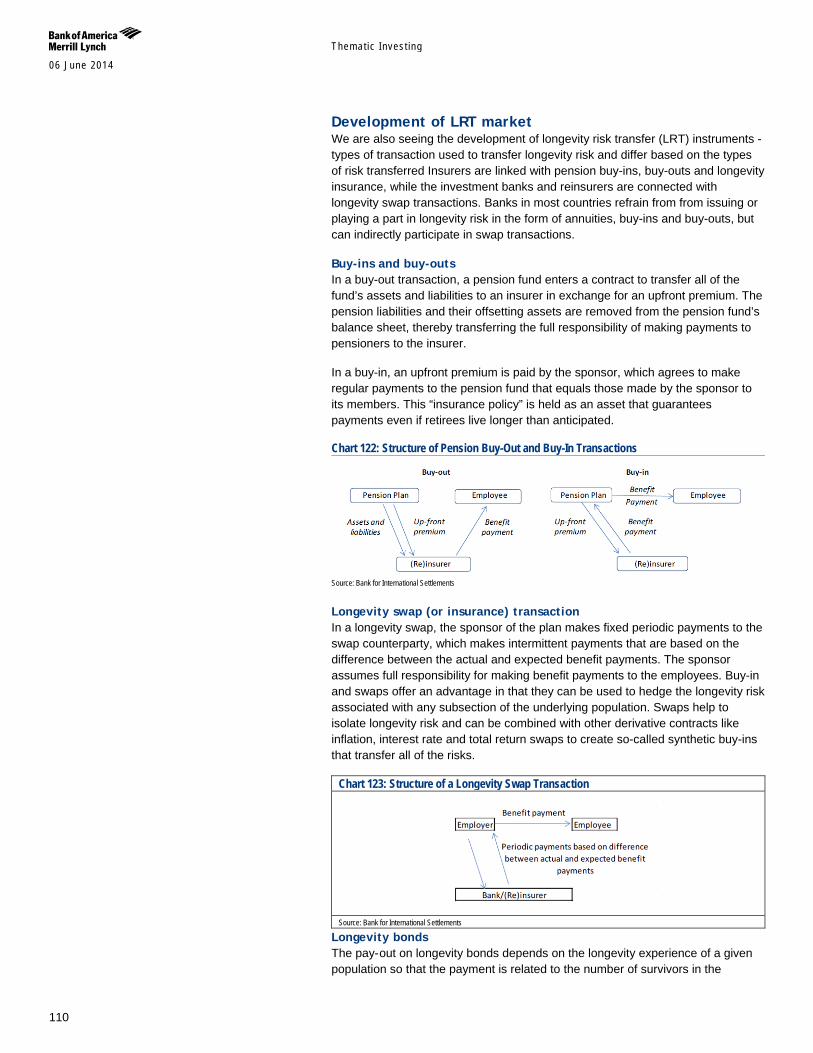
Themat ic Inves t ing 06 June 2014
110
Development of LRT market We are also seeing the development of longevity risk transfer (LRT) instruments - types of transaction used to transfer longevity risk and differ based on the types of risk transferred Insurers are linked with pension buy-ins, buy-outs and longevity insurance, while the investment banks and reinsurers are connected with longevity swap transactions. Banks in most countries refrain from from issuing or playing a part in longevity risk in the form of annuities, buy-ins and buy-outs, but can indirectly participate in swap transactions.
Buy-ins and buy-outs In a buy-out transaction, a pension fund enters a contract to transfer all of the fund’s assets and liabilities to an insurer in exchange for an upfront premium. The pension liabilities and their offsetting assets are removed from the pension fund’s balance sheet, thereby transferring the full responsibility of making payments to pensioners to the insurer.
In a buy-in, an upfront premium is paid by the sponsor, which agrees to make regular payments to the pension fund that equals those made by the sponsor to its members. This “insurance policy” is held as an asset that guarantees payments even if retirees live longer than anticipated.
Chart 122: Structure of Pension Buy-Out and Buy-In Transactions
Source: Bank for International Settlements
Longevity swap (or insurance) transaction In a longevity swap, the sponsor of the plan makes fixed periodic payments to the swap counterparty, which makes intermittent payments that are based on the difference between the actual and expected benefit payments. The sponsor assumes full responsibility for making benefit payments to the employees. Buy-in and swaps offer an advantage in that they can be used to hedge the longevity risk associated with any subsection of the underlying population. Swaps help to isolate longevity risk and can be combined with other derivative contracts like inflation, interest rate and total return swaps to create so-called synthetic buy-ins that transfer all of the risks.
Chart 123: Structure of a Longevity Swap Transaction
Source: Bank for International Settlements
Longevity bonds The pay- out on longevity bonds depends on the longevity experience of a given population so that the payment is related to the number of survivors in the
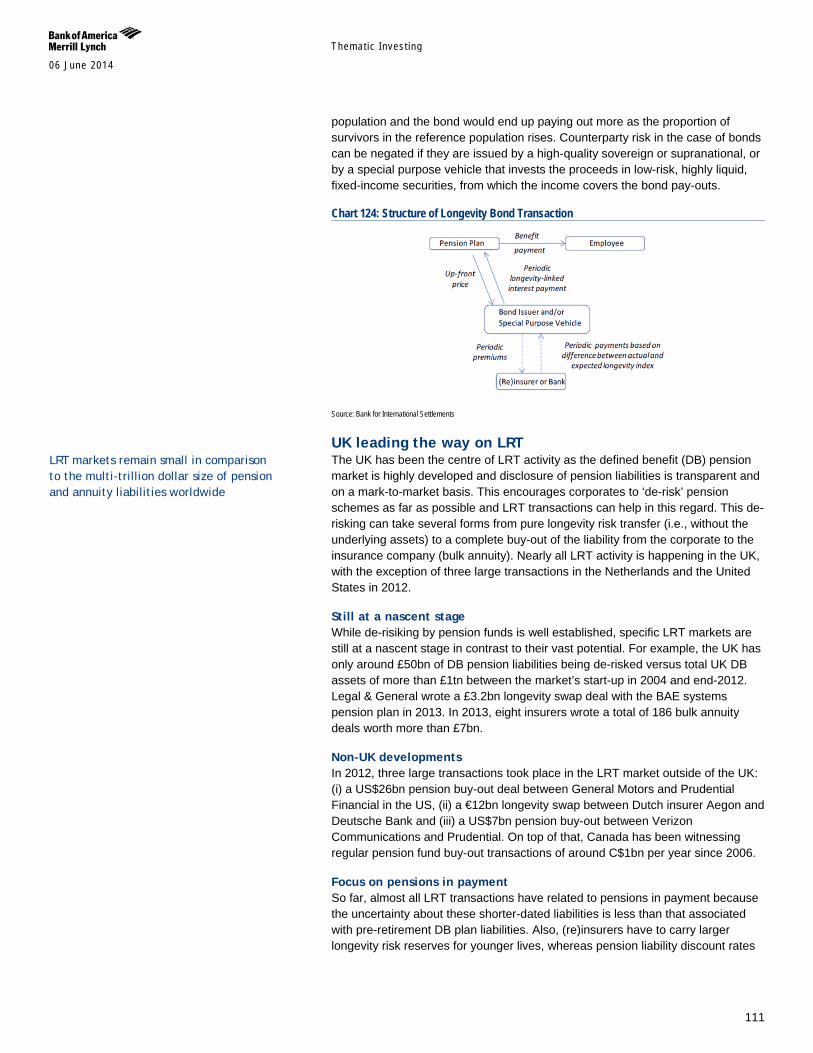
Themat ic Inves t ing 06 June 2014
111
population and the bond would end up paying out more as the proportion of survivors in the reference population rises. Counterparty risk in the case of bonds can be negated if they are issued by a high-quality sovereign or supranational, or by a special purpose vehicle that invests the proceeds in low-risk, highly liquid, fixed-income securities, from which the income covers the bond pay-outs.
Chart 124: Structure of Longevity Bond Transaction
Source: Bank for International Settlements
UK leading the way on LRT The UK has been the centre of LRT activity as the defined benefit (DB) pension market is highly developed and disclosure of pension liabilities is transparent and on a mark-to-market basis. This encourages corporates to ‘de-risk’ pension schemes as far as possible and LRT transactions can help in this regard. This de-risking can take several forms from pure longevity risk transfer (i.e., without the underlying assets) to a complete buy-out of the liability from the corporate to the insurance company (bulk annuity). Nearly all LRT activity is happening in the UK, with the exception of three large transactions in the Netherlands and the United States in 2012.
Still at a nascent stage While de-risiking by pension funds is well established, specific LRT markets are still at a nascent stage in contrast to their vast potential. For example, the UK has only around £50bn of DB pension liabilities being de-risked versus total UK DB assets of more than £1tn between the market’s start-up in 2004 and end-2012. Legal & General wrote a £3.2bn longevity swap deal with the BAE systems pension plan in 2013. In 2013, eight insurers wrote a total of 186 bulk annuity deals worth more than £7bn.
Non-UK developments In 2012, three large transactions took place in the LRT market outside of the UK: (i) a US$26bn pension buy-out deal between General Motors and Prudential Financial in the US, (ii) a €12bn longevity swap between Dutch insurer Aegon and Deutsche Bank and (iii) a US$7bn pension buy-out between Verizon Communications and Prudential. On top of that, Canada has been witnessing regular pension fund buy-out transactions of around C$1bn per year since 2006.
Focus on pensions in payment So far, almost all LRT transactions have related to pensions in payment because the uncertainty about these shorter-dated liabilities is less than that associated with pre-retirement DB plan liabilities. Also, (re)insurers have to carry larger longevity risk reserves for younger lives, whereas pension liability discount rates
LRT markets remain small in comparison to the multi-trillion dollar size of pension and annuity liabilities worldwide
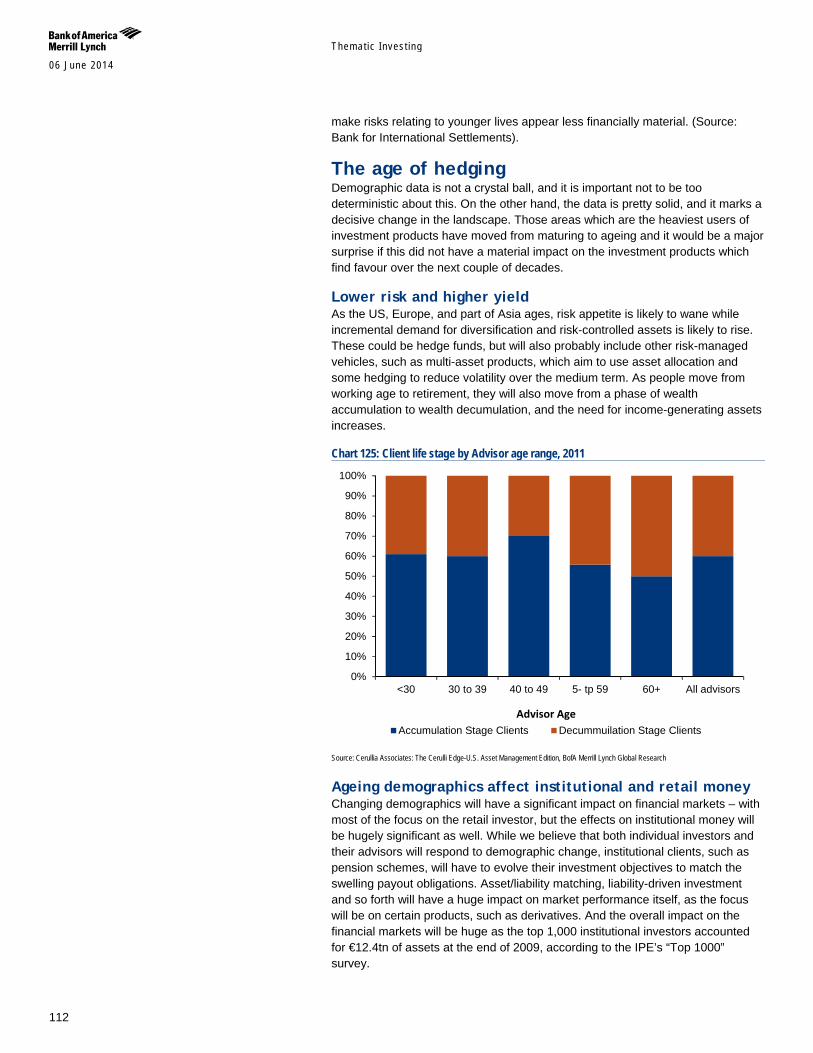
Themat ic Inves t ing 06 June 2014
112
make risks relating to younger lives appear less financially material. (Source: Bank for International Settlements).
The age of hedging Demographic data is not a crystal ball, and it is important not to be too deterministic about this. On the other hand, the data is pretty solid, and it marks a decisive change in the landscape. Those areas which are the heaviest users of investment products have moved from maturing to ageing and it would be a major surprise if this did not have a material impact on the investment products which find favour over the next couple of decades.
Lower risk and higher yield As the US, Europe, and part of Asia ages, risk appetite is likely to wane while incremental demand for diversification and risk-controlled assets is likely to rise. These could be hedge funds, but will also probably include other risk-managed vehicles, such as multi-asset products, which aim to use asset allocation and some hedging to reduce volatility over the medium term. As people move from working age to retirement, they will also move from a phase of wealth accumulation to wealth decumulation, and the need for income-generating assets increases.
Chart 125: Client life stage by Advisor age range, 2011
Source: Cerullia Associates: The Cerulli Edge-U.S. Asset Management Edition, BofA Merrill Lynch Global Research
Ageing demographics affect institutional and retail money Changing demographics will have a significant impact on financial markets – with most of the focus on the retail investor, but the effects on institutional money will be hugely significant as well. While we believe that both individual investors and their advisors will respond to demographic change, institutional clients, such as pension schemes, will have to evolve their investment objectives to match the swelling payout obligations. Asset/liability matching, liability-driven investment and so forth will have a huge impact on market performance itself, as the focus will be on certain products, such as derivatives. And the overall impact on the financial markets will be huge as the top 1,000 institutional investors accounted for €12.4tn of assets at the end of 2009, according to the IPE’s “Top 1000” survey.
0%
10%
20%
30%
40%
50%
60%
70%
80%
90%
100%
<30 30 to 39 40 to 49 5- tp 59 60+ All advisors
Accumulation Stage Clients Decummuilation Stage ClientsAdvisor Age
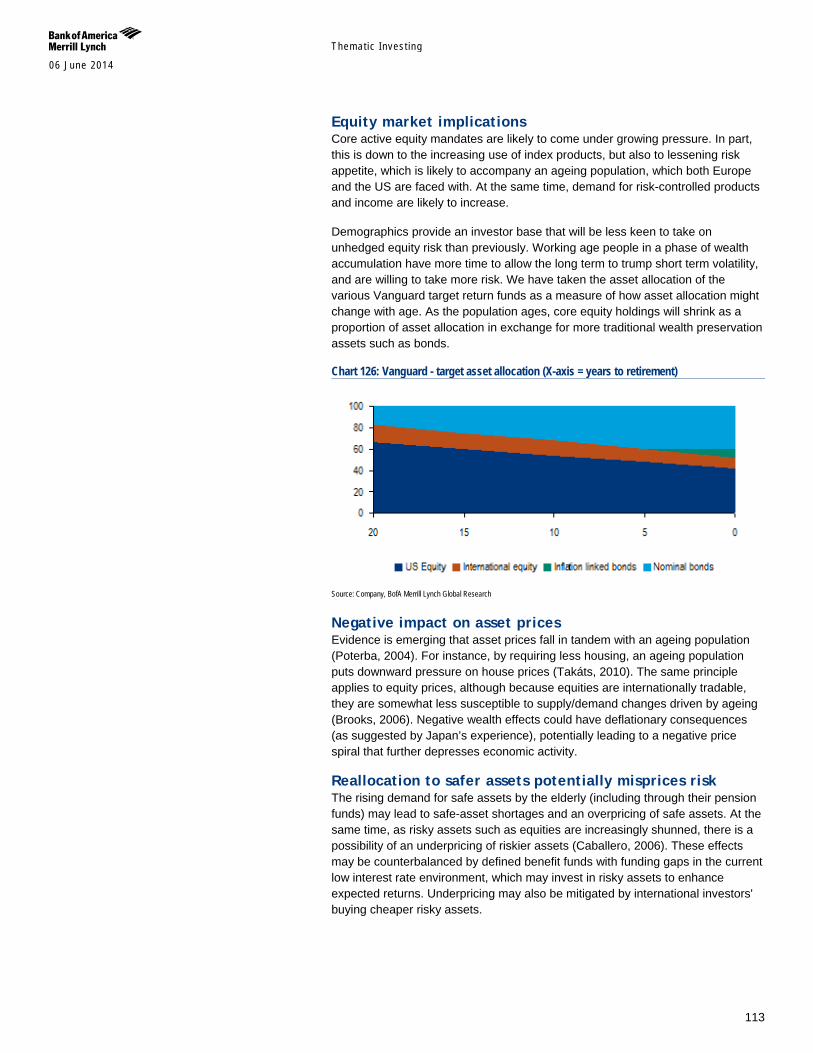
Themat ic Inves t ing 06 June 2014
113
Equity market implications Core active equity mandates are likely to come under growing pressure. In part, this is down to the increasing use of index products, but also to lessening risk appetite, which is likely to accompany an ageing population, which both Europe and the US are faced with. At the same time, demand for risk-controlled products and income are likely to increase.
Demographics provide an investor base that will be less keen to take on unhedged equity risk than previously. Working age people in a phase of wealth accumulation have more time to allow the long term to trump short term volatility, and are willing to take more risk. We have taken the asset allocation of the various Vanguard target return funds as a measure of how asset allocation might change with age. As the population ages, core equity holdings will shrink as a proportion of asset allocation in exchange for more traditional wealth preservation assets such as bonds.
Chart 126: Vanguard - target asset allocation (X-axis = years to retirement)
Source: Company, BofA Merrill Lynch Global Research
Negative impact on asset prices Evidence is emerging that asset prices fall in tandem with an ageing population (Poterba, 2004). For instance, by requiring less housing, an ageing population puts downward pressure on house prices (Takáts, 2010). The same principle applies to equity prices, although because equities are internationally tradable, they are somewhat less susceptible to supply/demand changes driven by ageing (Brooks, 2006). Negative wealth effects could have deflationary consequences (as suggested by Japan’s experience), potentially leading to a negative price spiral that further depresses economic activity.
Reallocation to safer assets potentially misprices risk The rising demand for safe assets by the elderly (including through their pension funds) may lead to safe-asset shortages and an overpricing of safe assets. At the same time, as risky assets such as equities are increasingly shunned, there is a possibility of an underpricing of riskier assets (Caballero, 2006). These effects may be counterbalanced by defined benefit funds with funding gaps in the current low interest rate environment, which may invest in risky assets to enhance expected returns. Underpricing may also be mitigated by international investors' buying cheaper risky assets.
Themat ic Inves t ing 06 June 2014
114
A case for fixed income, derivatives, and hedge funds Demographic change means that investors are likely to want to take less risk over the next decade than they have done previously, which may pressure traditional equities. However, opportunities exist for other asset classes as the ageing demographic approaches the financial markets in a more risk-controlled investing:
Fixed income – demand for fixed income and high-yielding equities that provide income for seniors to use.
Derivatives – the default risk asset of the past few decades, cash equities, has demonstrated downside volatility, which could make life uncomfortable for people nearing retirement. There would be increased demand for hedging and risk-mitigation options. Another approach is to use derivatives directly to generate income, such as call overwriting and underwriting.
Structured products – a range of equity-linked products that are structured using vanilla equity options, turn capital into income by investing passively in a portfolio of bonds and writing puts. For example, there are products which offer something like “x% yield per annum and your capital back unless index y falls by more than z%” (in other words, unless the puts are exercised).
Hedge funds – technological and evolutionary advancements have put hedge funds in the range of alternative investment for the ageing population, as they could serve as risk-mitigation vehicles.
Asset managers – the challenge for asset managers is to build products that are scalable and meet the general desire for risk-managed, diversifying investment.
Public pension funds, 22% of institutional capital invested in HFs Public pension funds represent the largest proportion of capital invested in hedge funds by institutional investors at over 22% (vs. 9% in terms of the overall numbers of investors in the asset class). They have been increasing their allocation to the asset class steadily over the past few years with 7.5% of assets allocated to hedge funds in 2012 (Source: preqin).
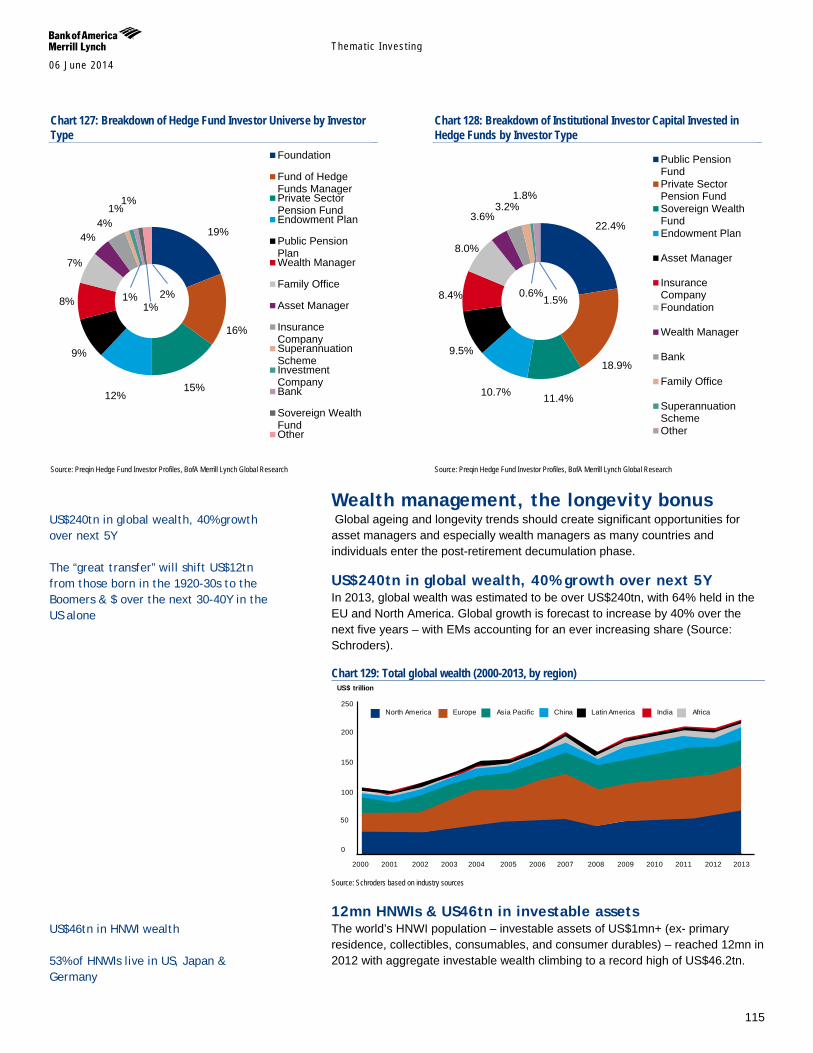
Themat ic Inves t ing 06 June 2014
115
Chart 127: Breakdown of Hedge Fund Investor Universe by Investor Type
Source: Preqin Hedge Fund Investor Profiles, BofA Merrill Lynch Global Research
Chart 128: Breakdown of Institutional Investor Capital Invested in Hedge Funds by Investor Type
Source: Preqin Hedge Fund Investor Profiles, BofA Merrill Lynch Global Research
Wealth management, the longevity bonus Global ageing and longevity trends should create significant opportunities for asset managers and especially wealth managers as many countries and individuals enter the post-retirement decumulation phase.
US$240tn in global wealth, 40% growth over next 5Y In 2013, global wealth was estimated to be over US$240tn, with 64% held in the EU and North America. Global growth is forecast to increase by 40% over the next five years – with EMs accounting for an ever increasing share (Source: Schroders).
Chart 129: Total global wealth (2000-2013, by region)
Source: Schroders based on industry sources
12mn HNWIs & US46tn in investable assets The world’s HNWI population – investable assets of US$1mn+ (ex- primary residence, collectibles, consumables, and consumer durables) – reached 12mn in 2012 with aggregate investable wealth climbing to a record high of US$46.2tn.
19%
16%
15% 12%
9%
8%
7%
4% 4%
1% 1%
1% 1% 2%
Foundation
Fund of HedgeFunds ManagerPrivate SectorPension FundEndowment Plan
Public PensionPlanWealth Manager
Family Office
Asset Manager
InsuranceCompanySuperannuationSchemeInvestmentCompanyBank
Sovereign WealthFundOther
22.4%
18.9%
11.4% 10.7%
9.5%
8.4%
8.0%
3.6% 3.2%
1.8%
0.6% 1.5%
Public PensionFundPrivate SectorPension FundSovereign WealthFundEndowment Plan
Asset Manager
InsuranceCompanyFoundation
Wealth Manager
Bank
Family Office
SuperannuationSchemeOther
2005 2004 2003 2002 2001 2000 2010 2009 2008 2007 2006 2013 2012 2011
US$ trillion
Europe North America Africa India Latin America China Asia Pacific
0
50
100
150
200
250
US$240tn in global wealth, 40% growth over next 5Y The “great transfer” will shift US$12tn from those born in the 1920-30s to the Boomers & $ over the next 30-40Y in the US alone
US$46tn in HNWI wealth 53% of HNWIs live in US, Japan & Germany
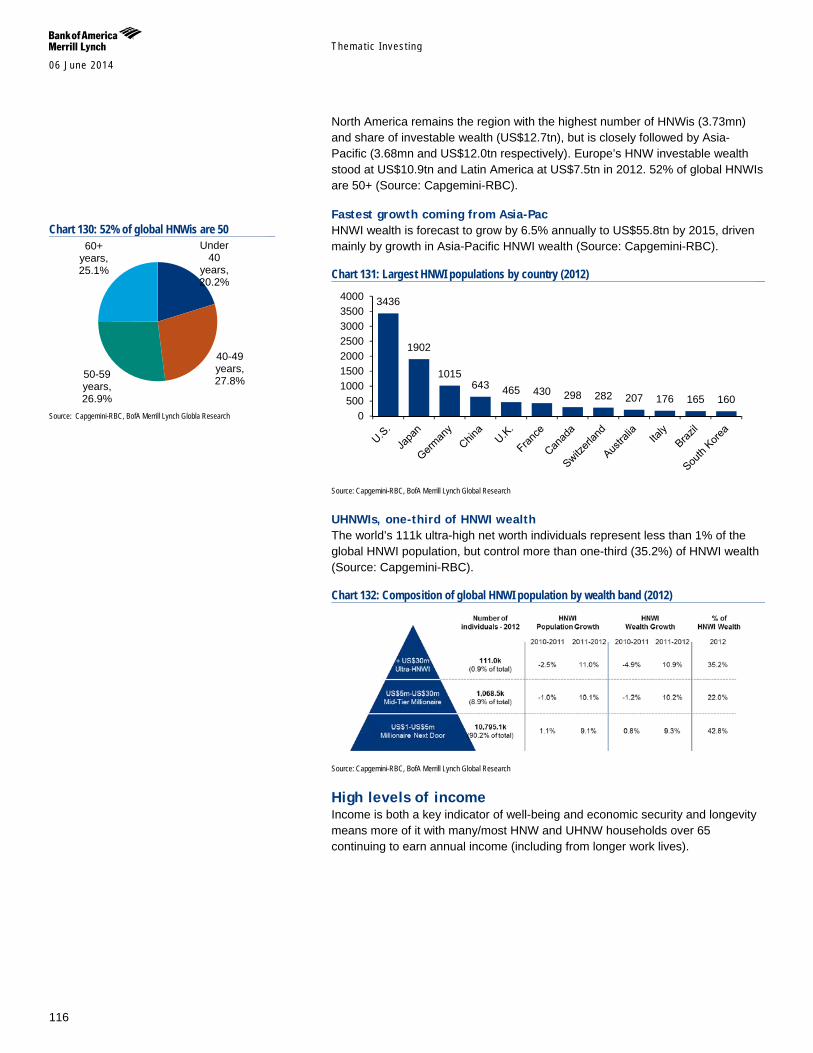
Themat ic Inves t ing 06 June 2014
116
North America remains the region with the highest number of HNWis (3.73mn) and share of investable wealth (US$12.7tn), but is closely followed by Asia-Pacific (3.68mn and US$12.0tn respectively). Europe’s HNW investable wealth stood at US$10.9tn and Latin America at US$7.5tn in 2012. 52% of global HNWIs are 50+ (Source: Capgemini-RBC).
Fastest growth coming from Asia-Pac HNWI wealth is forecast to grow by 6.5% annually to US$55.8tn by 2015, driven mainly by growth in Asia-Pacific HNWI wealth (Source: Capgemini-RBC).
Chart 131: Largest HNWI populations by country (2012)
Source: Capgemini-RBC, BofA Merrill Lynch Global Research
UHNWIs, one-third of HNWI wealth The world’s 111k ultra-high net worth individuals represent less than 1% of the global HNWI population, but control more than one-third (35.2%) of HNWI wealth (Source: Capgemini-RBC).
Chart 132: Composition of global HNWI population by wealth band (2012)
Source: Capgemini-RBC, BofA Merrill Lynch Global Research
High levels of income Income is both a key indicator of well-being and economic security and longevity means more of it with many/most HNW and UHNW households over 65 continuing to earn annual income (including from longer work lives).
3436
1902
1015 643 465 430 298 282 207 176 165 160
0500
1000150020002500300035004000
Chart 130: 52% of global HNWis are 50
Source: Capgemini-RBC, BofA Merrill Lynch Globla Research
Under 40
years, 20.2%
40-49 years, 27.8% 50-59
years, 26.9%
60+ years, 25.1%
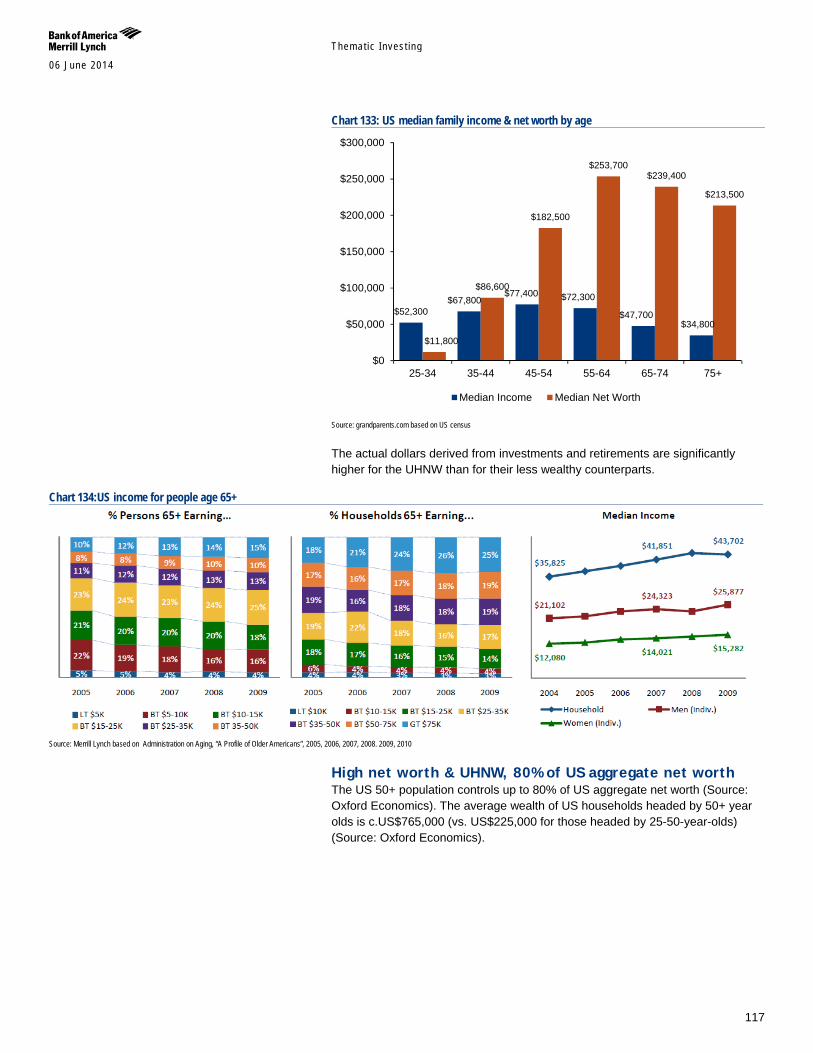
Themat ic Inves t ing 06 June 2014
117
Chart 133: US median family income & net worth by age
Source: grandparents.com based on US census
The actual dollars derived from investments and retirements are significantly higher for the UHNW than for their less wealthy counterparts.
Chart 134:US income for people age 65+
Source: Merrill Lynch based on Administration on Aging, “A Profile of Older Americans”, 2005, 2006, 2007, 2008. 2009, 2010
High net worth & UHNW, 80% of US aggregate net worth The US 50+ population controls up to 80% of US aggregate net worth (Source: Oxford Economics). The average wealth of US households headed by 50+ year olds is c.US$765,000 (vs. US$225,000 for those headed by 25-50-year-olds) (Source: Oxford Economics).
$52,300 $67,800
$77,400 $72,300
$47,700 $34,800
$11,800
$86,600
$182,500
$253,700 $239,400
$213,500
$0
$50,000
$100,000
$150,000
$200,000
$250,000
$300,000
25-34 35-44 45-54 55-64 65-74 75+
Median Income Median Net Worth
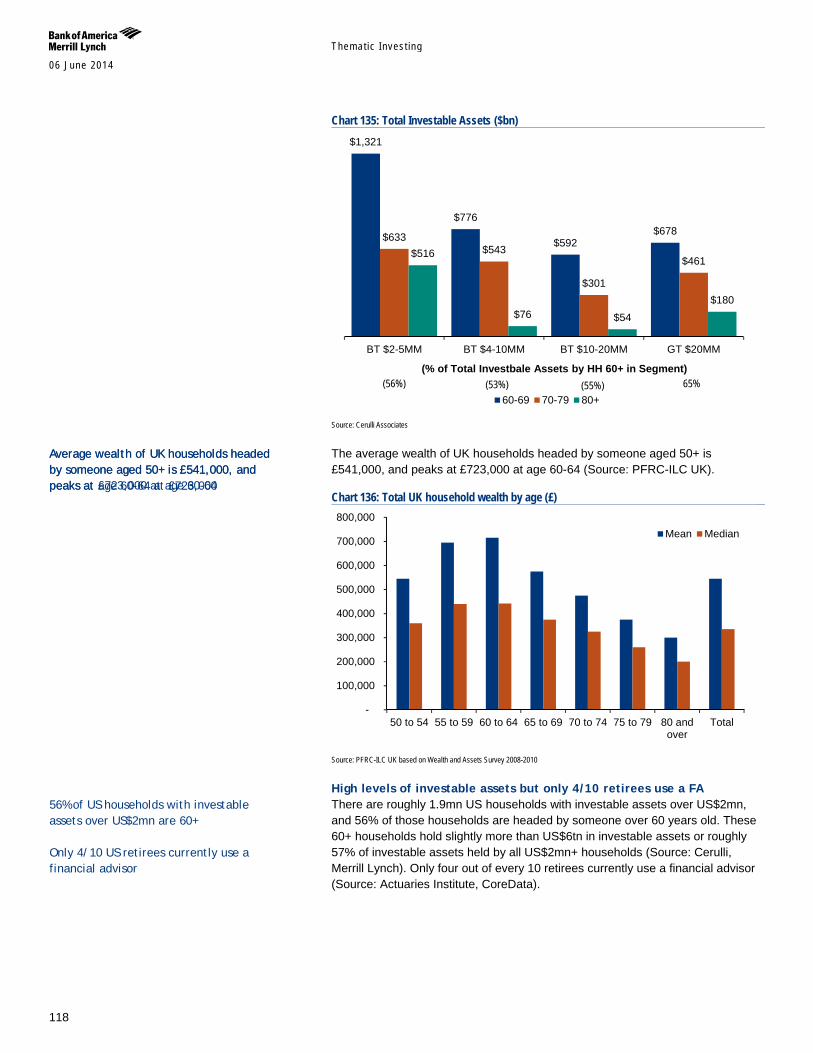
Themat ic Inves t ing 06 June 2014
118
Chart 135: Total Investable Assets ($bn)
Source: Cerulli Associates
The average wealth of UK households headed by someone aged 50+ is £541,000, and peaks at £723,000 at age 60-64 (Source: PFRC-ILC UK).
Chart 136: Total UK household wealth by age (£)
Source: PFRC-ILC UK based on Wealth and Assets Survey 2008-2010
High levels of investable assets but only 4/10 retirees use a FA There are roughly 1.9mn US households with investable assets over US$2mn, and 56% of those households are headed by someone over 60 years old. These 60+ households hold slightly more than US$6tn in investable assets or roughly 57% of investable assets held by all US$2mn+ households (Source: Cerulli, Merrill Lynch). Only four out of every 10 retirees currently use a financial advisor (Source: Actuaries Institute, CoreData).
$1,321
$776
$592 $678 $633
$543
$301
$461 $516
$76 $54 $180
BT $2-5MM BT $4-10MM BT $10-20MM GT $20MM
60-69 70-79 80+
(% of Total Investbale Assets by HH 60+ in Segment) (56%) (53%) (55%) 65%
-
100,000
200,000
300,000
400,000
500,000
600,000
700,000
800,000
50 to 54 55 to 59 60 to 64 65 to 69 70 to 74 75 to 79 80 andover
Total
Mean Median
Average wealth of UK households headed by someone aged 50+ is £541,000, and peaks at age 60-64 at £723,000
Average wealth of UK households headed by someone aged 50+ is £541,000, and peaks at £723,000 at age 60-64
56% of US households with investable assets over US$2mn are 60+ Only 4/10 US retirees currently use a financial advisor
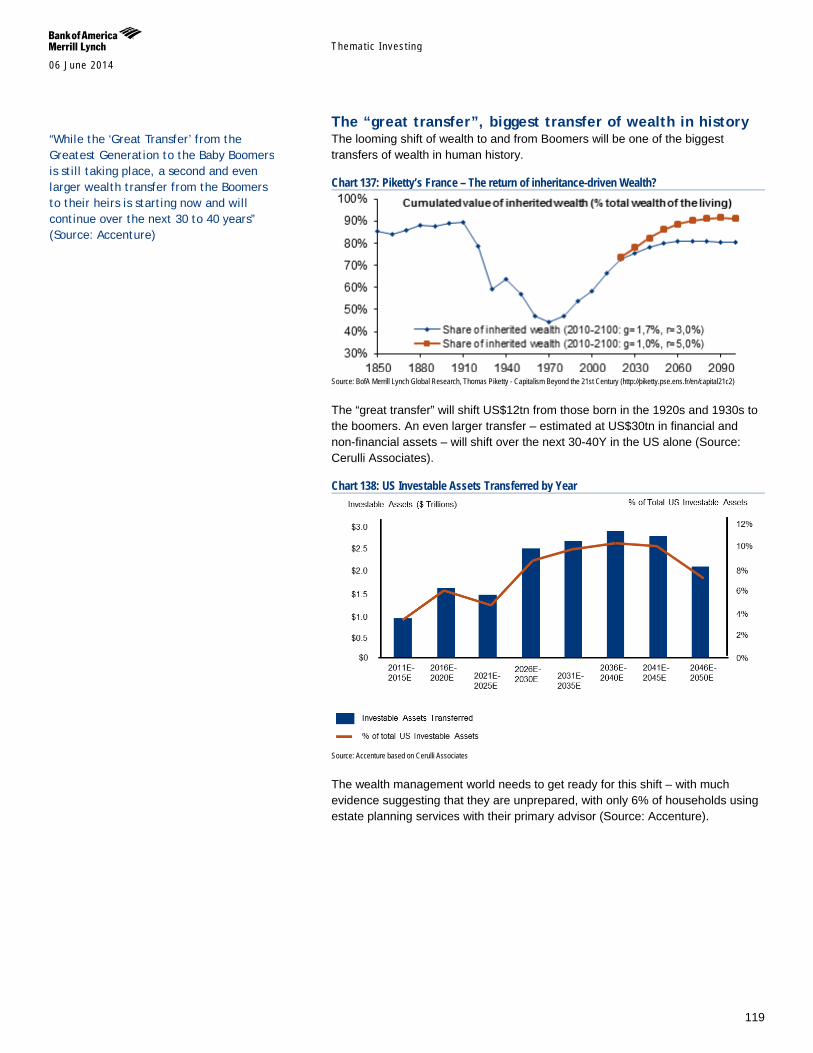
Themat ic Inves t ing 06 June 2014
119
The “great transfer”, biggest transfer of wealth in history The looming shift of wealth to and from Boomers will be one of the biggest transfers of wealth in human history.
Chart 137: Piketty’s France – The return of inheritance-driven Wealth?
Source: BofA Merrill Lynch Global Research, Thomas Piketty - Capitalism Beyond the 21st Century (http://piketty.pse.ens.fr/en/capital21c2)
The “great transfer” will shift US$12tn from those born in the 1920s and 1930s to the boomers. An even larger transfer – estimated at US$30tn in financial and non-financial assets – will shift over the next 30-40Y in the US alone (Source: Cerulli Associates).
Chart 138: US Investable Assets Transferred by Year
Source: Accenture based on Cerulli Associates
The wealth management world needs to get ready for this shift – with much evidence suggesting that they are unprepared, with only 6% of households using estate planning services with their primary advisor (Source: Accenture).
“While the ‘Great Transfer’ from the Greatest Generation to the Baby Boomers is still taking place, a second and even larger wealth transfer from the Boomers to their heirs is starting now and will continue over the next 30 to 40 years” (Source: Accenture)
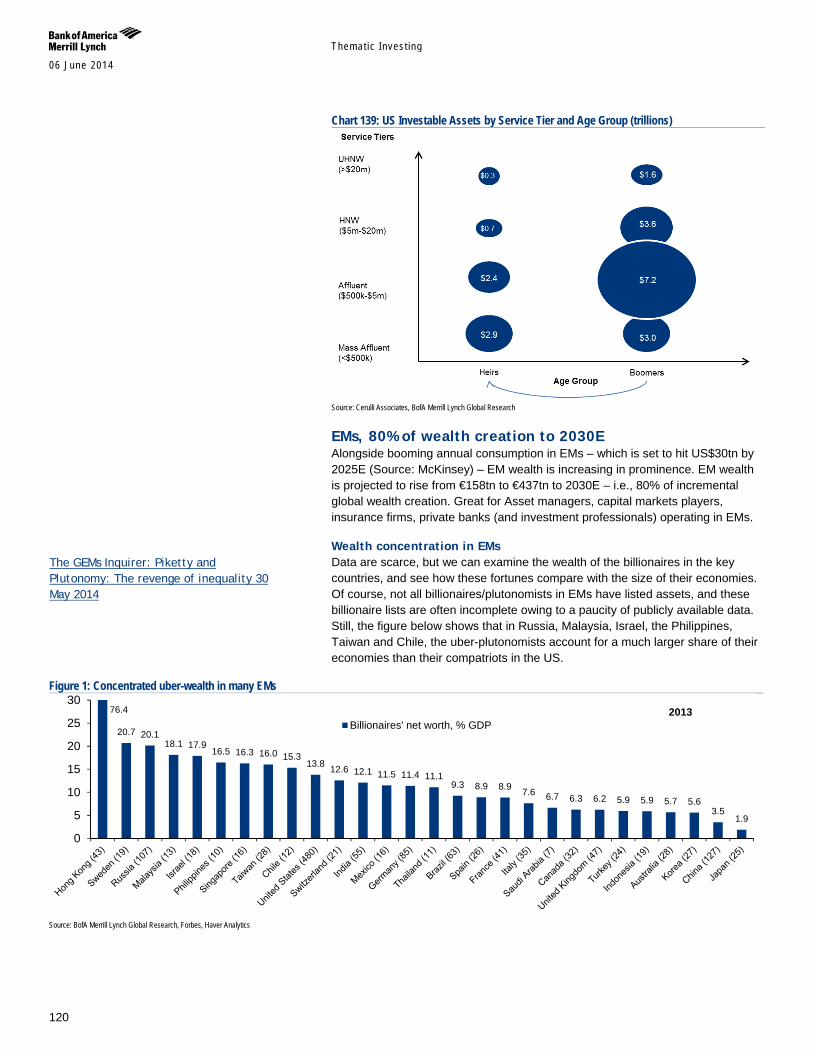
Themat ic Inves t ing 06 June 2014
120
Chart 139: US Investable Assets by Service Tier and Age Group (trillions)
Source: Cerulli Associates, BofA Merrill Lynch Global Research
EMs, 80% of wealth creation to 2030E Alongside booming annual consumption in EMs – which is set to hit US$30tn by 2025E (Source: McKinsey) – EM wealth is increasing in prominence. EM wealth is projected to rise from €158tn to €437tn to 2030E – i.e., 80% of incremental global wealth creation. Great for Asset managers, capital markets players, insurance firms, private banks (and investment professionals) operating in EMs.
Wealth concentration in EMs Data are scarce, but we can examine the wealth of the billionaires in the key countries, and see how these fortunes compare with the size of their economies. Of course, not all billionaires/plutonomists in EMs have listed assets, and these billionaire lists are often incomplete owing to a paucity of publicly available data. Still, the figure below shows that in Russia, Malaysia, Israel, the Philippines, Taiwan and Chile, the uber-plutonomists account for a much larger share of their economies than their compatriots in the US.
Figure 1: Concentrated uber-wealth in many EMs
Source: BofA Merrill Lynch Global Research, Forbes, Haver Analytics
20.7 20.1 18.1 17.9
16.5 16.3 16.0 15.3 13.8 12.6 12.1 11.5 11.4 11.1
9.3 8.9 8.9 7.6 6.7 6.3 6.2 5.9 5.9 5.7 5.6 3.5
1.9
0
5
10
15
20
25
30
Billionaires' net worth, % GDP2013 76.4
The GEMs Inquirer: Piketty and Plutonomy: The revenge of inequality 30 May 2014
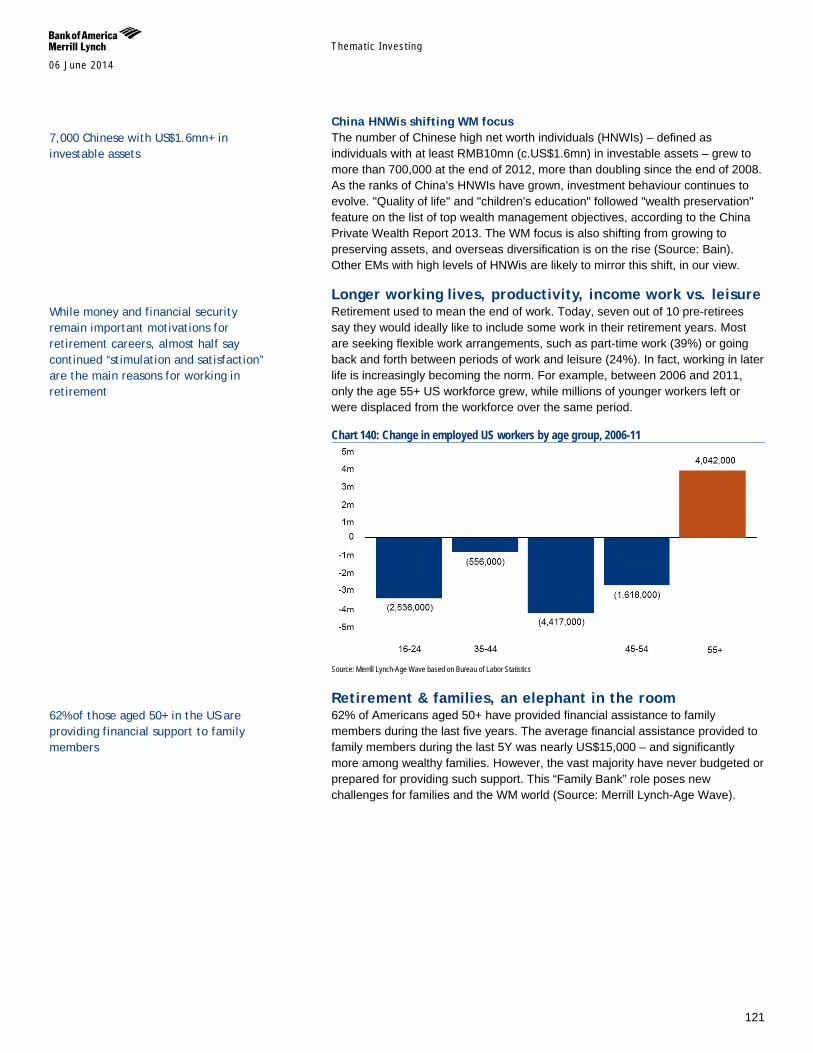
Themat ic Inves t ing 06 June 2014
121
China HNWis shifting WM focus The number of Chinese high net worth individuals (HNWIs) – defined as individuals with at least RMB10mn (c.US$1.6mn) in investable assets – grew to more than 700,000 at the end of 2012, more than doubling since the end of 2008. As the ranks of China's HNWIs have grown, investment behaviour continues to evolve. "Quality of life" and "children's education" followed "wealth preservation" feature on the list of top wealth management objectives, according to the China Private Wealth Report 2013. The WM focus is also shifting from growing to preserving assets, and overseas diversification is on the rise (Source: Bain). Other EMs with high levels of HNWis are likely to mirror this shift, in our view.
Longer working lives, productivity, income work vs. leisure Retirement used to mean the end of work. Today, seven out of 10 pre-retirees say they would ideally like to include some work in their retirement years. Most are seeking flexible work arrangements, such as part-time work (39%) or going back and forth between periods of work and leisure (24%). In fact, working in later life is increasingly becoming the norm. For example, between 2006 and 2011, only the age 55+ US workforce grew, while millions of younger workers left or were displaced from the workforce over the same period.
Chart 140: Change in employed US workers by age group, 2006-11
Source: Merrill Lynch-Age Wave based on Bureau of Labor Statistics
Retirement & families, an elephant in the room 62% of Americans aged 50+ have provided financial assistance to family members during the last five years. The average financial assistance provided to family members during the last 5Y was nearly US$15,000 – and significantly more among wealthy families. However, the vast majority have never budgeted or prepared for providing such support. This “Family Bank” role poses new challenges for families and the WM world (Source: Merrill Lynch-Age Wave).
7,000 Chinese with US$1.6mn+ in investable assets
While money and financial security remain important motivations for retirement careers, almost half say continued “stimulation and satisfaction” are the main reasons for working in retirement
62% of those aged 50+ in the US are providing financial support to family members

Themat ic Inves t ing 06 June 2014
122
Chart 141: Percent who provided financial support to family members in the last 5Y
Source: Age Wave-Merrill Lynch Base: age 50+, with adult children/grandchildren/parents/in-laws/silings/other relatives, bases vary
Chart 142: Financial support provided to family members in last 5Y by investable assets
Source: Age Wave-Merrill Lynch, Base: age 50+ providing financial help to family
Estate planning, necessary and lacking At the projected peak between 2031 and 2045, 10% of the total wealth in US will be changing hands every five years; US$30tn transfer in financial and nonfinancial assets in North America alone (Source: Accenture). While all transfers of assets create risks and opportunities for wealth management firms, those that fail to act on this great wealth transfer in the coming decade will run the risk of losing assets at an accelerating rate. Estate planning services and managing the costs of ageing will be an increasingly important concern. Only 6% of households use estate planning services with their primary advisor (Source: Accenture).
Eldercare services, an emerging market With increasing longevity, there is an increasing likelihood that family members will at some point need some form of eldercare services (estate settlement and trust; power of attorney, healthcare directive, and/or trustee; budgets to address ongoing needs; contingencies for long-term care and life insurance; liquidity needs; retirement/financial strategy) (Source: Merrill Lynch). Family and health – and the impact on financial commitments – will become an increasing challenge and opportunity for the WM world:
37% of boomers’ greatest health concern in later life is Alzheimer’s; 45% of those ages 85+ have Alzheimer’s or related dementias.
72% are concerned about rising healthcare costs. 37% believe they’ll need long-term care but estimates actually put the figure at 70%.
56% of adult children have never spoken with parents about net worth, paying for long-term care, where to live, their will or inheritance plans (Source: Merrill Lynch).
68%
26%
16% 13% 14%
0%
10%
20%
30%
40%
50%
60%
70%
80%
$14,900
$9,200
$19,100
$34,100
$0
$5,000
$10,000
$15,000
$20,000
$25,000
$30,000
$35,000
$40,000
Average <$250k $250k-$500k $500k-$5m
10% of the total wealth in US will be changing hands every 5Y to 2045E Only 6% of US households use estate planning services with their primary advisor
Family and health – and the impact on financial commitments – will become an increasing challenge and opportunity for the WM world
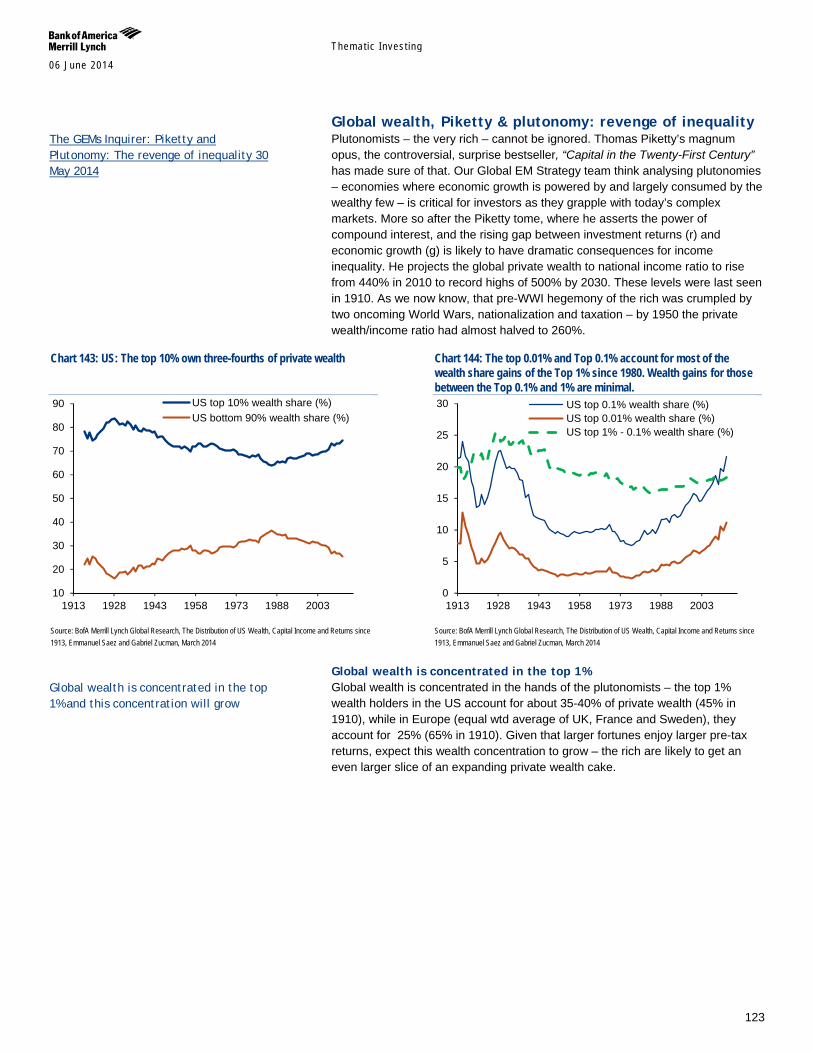
Themat ic Inves t ing 06 June 2014
123
Global wealth, Piketty & plutonomy: revenge of inequality Plutonomists – the very rich – cannot be ignored. Thomas Piketty’s magnum opus, the controversial, surprise bestseller, “Capital in the Twenty-First Century” has made sure of that. Our Global EM Strategy team think analysing plutonomies – economies where economic growth is powered by and largely consumed by the wealthy few – is critical for investors as they grapple with today’s complex markets. More so after the Piketty tome, where he asserts the power of compound interest, and the rising gap between investment returns (r) and economic growth (g) is likely to have dramatic consequences for income inequality. He projects the global private wealth to national income ratio to rise from 440% in 2010 to record highs of 500% by 2030. These levels were last seen in 1910. As we now know, that pre-WWI hegemony of the rich was crumpled by two oncoming World Wars, nationalization and taxation – by 1950 the private wealth/income ratio had almost halved to 260%.
Chart 143: US: The top 10% own three-fourths of private wealth
Source: BofA Merrill Lynch Global Research, The Distribution of US Wealth, Capital Income and Returns since 1913, Emmanuel Saez and Gabriel Zucman, March 2014
Chart 144: The top 0.01% and Top 0.1% account for most of the wealth share gains of the Top 1% since 1980. Wealth gains for those between the Top 0.1% and 1% are minimal.
Source: BofA Merrill Lynch Global Research, The Distribution of US Wealth, Capital Income and Returns since 1913, Emmanuel Saez and Gabriel Zucman, March 2014
Global wealth is concentrated in the top 1% Global wealth is concentrated in the hands of the plutonomists – the top 1% wealth holders in the US account for about 35-40% of private wealth (45% in 1910), while in Europe (equal wtd average of UK, France and Sweden), they account for 25% (65% in 1910). Given that larger fortunes enjoy larger pre-tax returns, expect this wealth concentration to grow – the rich are likely to get an even larger slice of an expanding private wealth cake.
10
20
30
40
50
60
70
80
90
1913 1928 1943 1958 1973 1988 2003
US top 10% wealth share (%)US bottom 90% wealth share (%)
0
5
10
15
20
25
30
1913 1928 1943 1958 1973 1988 2003
US top 0.1% wealth share (%)US top 0.01% wealth share (%)US top 1% - 0.1% wealth share (%)
The GEMs Inquirer: Piketty and Plutonomy: The revenge of inequality 30 May 2014
Global wealth is concentrated in the top 1% and this concentration will grow
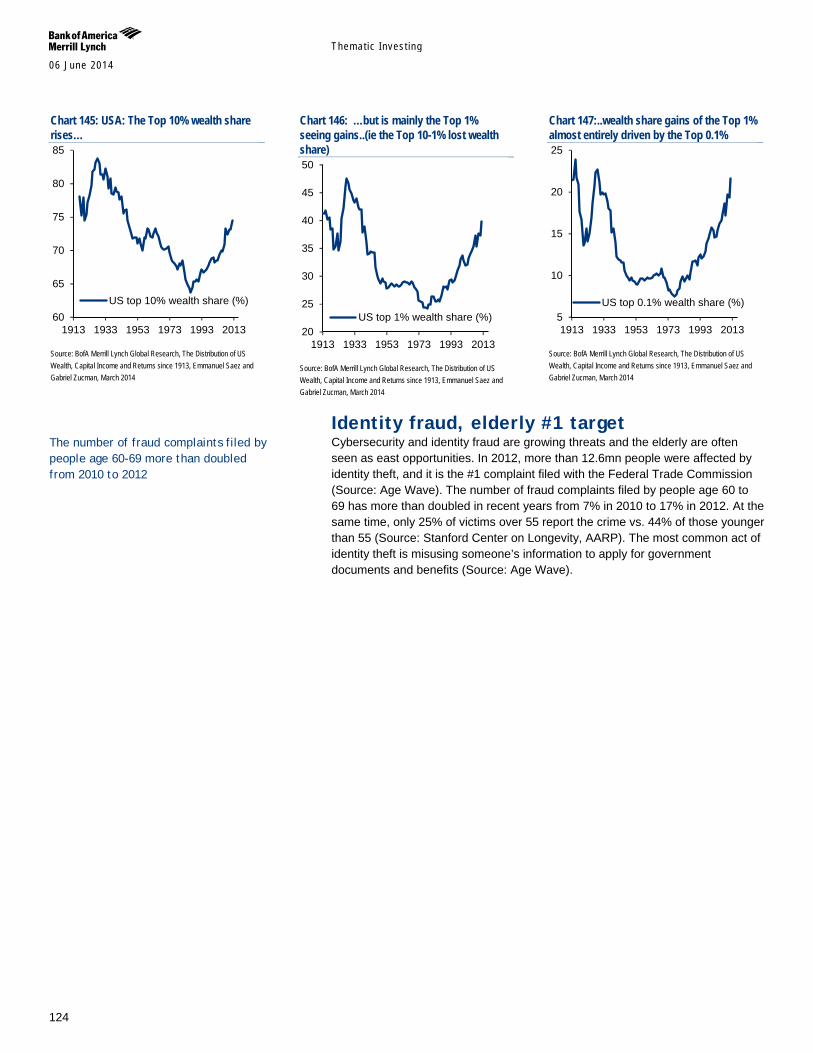
Themat ic Inves t ing 06 June 2014
124
Chart 145: USA: The Top 10% wealth share rises…
Source: BofA Merrill Lynch Global Research, The Distribution of US Wealth, Capital Income and Returns since 1913, Emmanuel Saez and Gabriel Zucman, March 2014
Chart 146: …but is mainly the Top 1% seeing gains..(ie the Top 10-1% lost wealth share)
Source: BofA Merrill Lynch Global Research, The Distribution of US Wealth, Capital Income and Returns since 1913, Emmanuel Saez and Gabriel Zucman, March 2014
Chart 147:..wealth share gains of the Top 1% almost entirely driven by the Top 0.1%
Source: BofA Merrill Lynch Global Research, The Distribution of US Wealth, Capital Income and Returns since 1913, Emmanuel Saez and Gabriel Zucman, March 2014
Identity fraud, elderly #1 target Cybersecurity and identity fraud are growing threats and the elderly are often seen as east opportunities. In 2012, more than 12.6mn people were affected by identity theft, and it is the #1 complaint filed with the Federal Trade Commission (Source: Age Wave). The number of fraud complaints filed by people age 60 to 69 has more than doubled in recent years from 7% in 2010 to 17% in 2012. At the same time, only 25% of victims over 55 report the crime vs. 44% of those younger than 55 (Source: Stanford Center on Longevity, AARP). The most common act of identity theft is misusing someone’s information to apply for government documents and benefits (Source: Age Wave).
60
65
70
75
80
85
1913 1933 1953 1973 1993 2013
US top 10% wealth share (%)
20
25
30
35
40
45
50
1913 1933 1953 1973 1993 2013
US top 1% wealth share (%) 5
10
15
20
25
1913 1933 1953 1973 1993 2013
US top 0.1% wealth share (%)
The number of fraud complaints filed by people age 60-69 more than doubled from 2010 to 2012
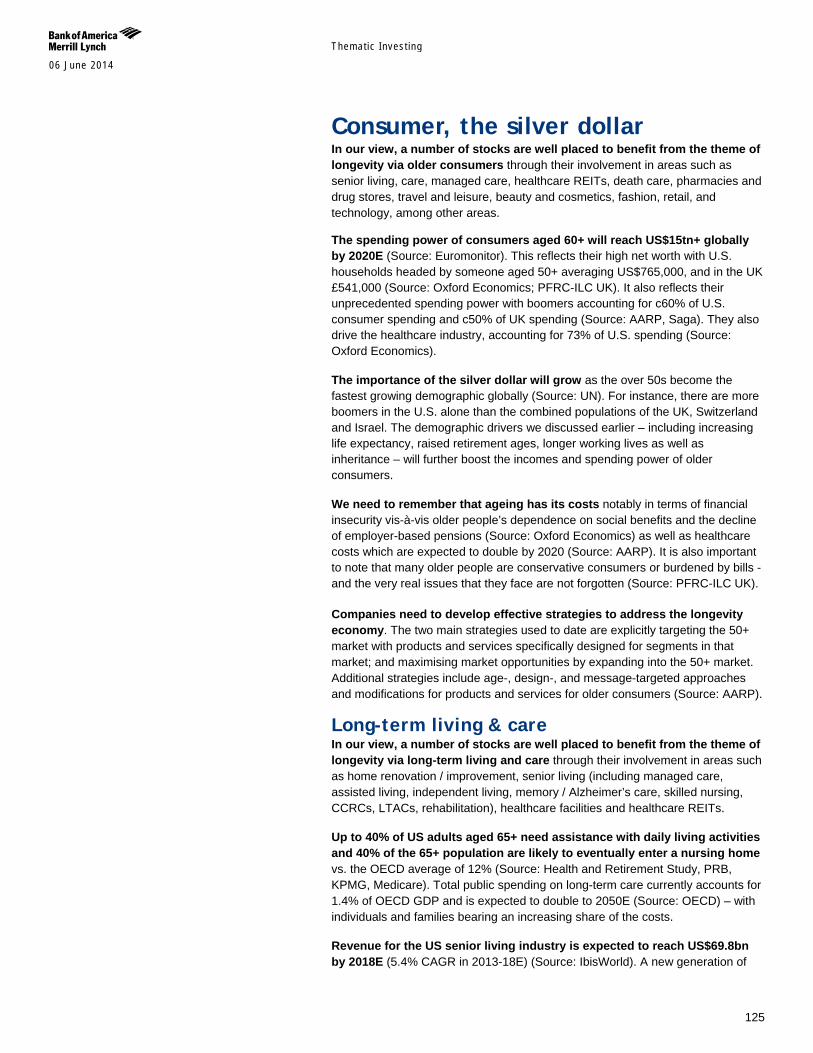
Themat ic Inves t ing 06 June 2014
125
Consumer, the silver dollar In our view, a number of stocks are well placed to benefit from the theme of longevity via older consumers through their involvement in areas such as senior living, care, managed care, healthcare REITs, death care, pharmacies and drug stores, travel and leisure, beauty and cosmetics, fashion, retail, and technology, among other areas.
The spending power of consumers aged 60+ will reach US$15tn+ globally by 2020E (Source: Euromonitor). This reflects their high net worth with U.S. households headed by someone aged 50+ averaging US$765,000, and in the UK £541,000 (Source: Oxford Economics; PFRC-ILC UK). It also reflects their unprecedented spending power with boomers accounting for c60% of U.S. consumer spending and c50% of UK spending (Source: AARP, Saga). They also drive the healthcare industry, accounting for 73% of U.S. spending (Source: Oxford Economics).
The importance of the silver dollar will grow as the over 50s become the fastest growing demographic globally (Source: UN). For instance, there are more boomers in the U.S. alone than the combined populations of the UK, Switzerland and Israel. The demographic drivers we discussed earlier – including increasing life expectancy, raised retirement ages, longer working lives as well as inheritance – will further boost the incomes and spending power of older consumers.
We need to remember that ageing has its costs notably in terms of financial insecurity vis-à-vis older people’s dependence on social benefits and the decline of employer-based pensions (Source: Oxford Economics) as well as healthcare costs which are expected to double by 2020 (Source: AARP). It is also important to note that many older people are conservative consumers or burdened by bills - and the very real issues that they face are not forgotten (Source: PFRC-ILC UK).
Companies need to develop effective strategies to address the longevity economy. The two main strategies used to date are explicitly targeting the 50+ market with products and services specifically designed for segments in that market; and maximising market opportunities by expanding into the 50+ market. Additional strategies include age-, design-, and message-targeted approaches and modifications for products and services for older consumers (Source: AARP).
Long-term living & care In our view, a number of stocks are well placed to benefit from the theme of longevity via long-term living and care through their involvement in areas such as home renovation / improvement, senior living (including managed care, assisted living, independent living, memory / Alzheimer’s care, skilled nursing, CCRCs, LTACs, rehabilitation), healthcare facilities and healthcare REITs.
Up to 40% of US adults aged 65+ need assistance with daily living activities and 40% of the 65+ population are likely to eventually enter a nursing home vs. the OECD average of 12% (Source: Health and Retirement Study, PRB, KPMG, Medicare). Total public spending on long-term care currently accounts for 1.4% of OECD GDP and is expected to double to 2050E (Source: OECD) – with individuals and families bearing an increasing share of the costs.
Revenue for the US senior living industry is expected to reach US$69.8bn by 2018E (5.4% CAGR in 2013-18E) (Source: IbisWorld). A new generation of
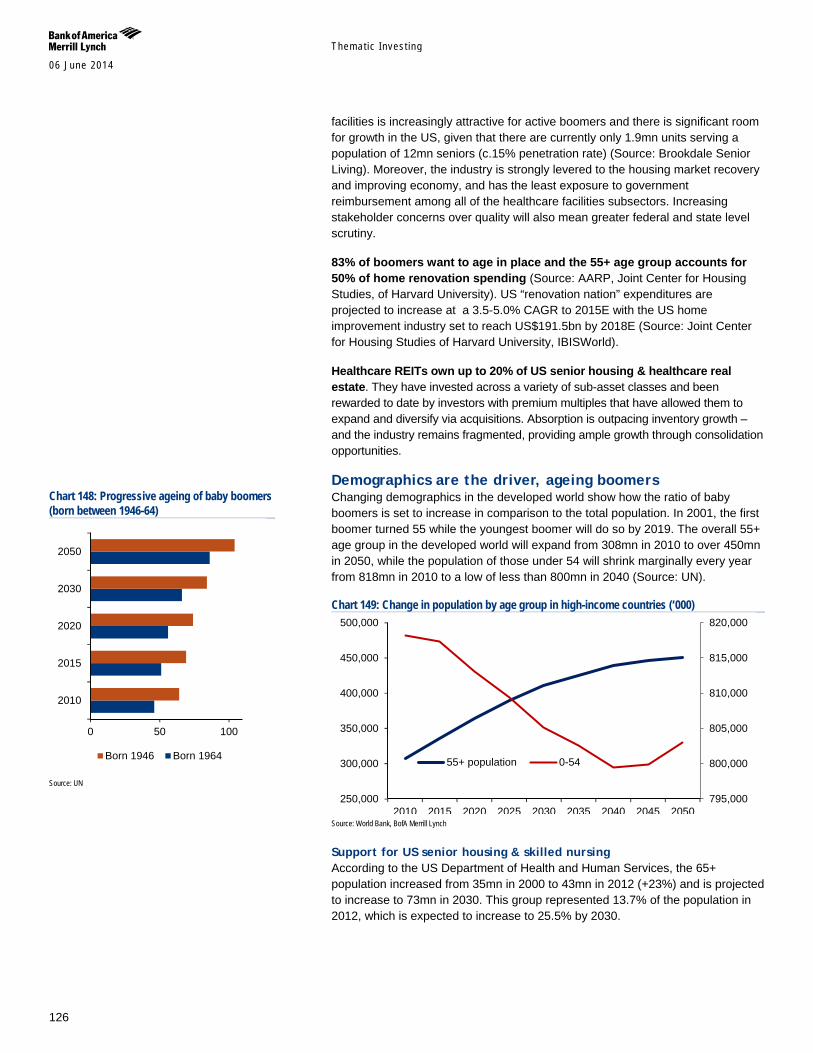
Themat ic Inves t ing 06 June 2014
126
facilities is increasingly attractive for active boomers and there is significant room for growth in the US, given that there are currently only 1.9mn units serving a population of 12mn seniors (c.15% penetration rate) (Source: Brookdale Senior Living). Moreover, the industry is strongly levered to the housing market recovery and improving economy, and has the least exposure to government reimbursement among all of the healthcare facilities subsectors. Increasing stakeholder concerns over quality will also mean greater federal and state level scrutiny.
83% of boomers want to age in place and the 55+ age group accounts for 50% of home renovation spending (Source: AARP, Joint Center for Housing Studies, of Harvard University). US “renovation nation” expenditures are projected to increase at a 3.5-5.0% CAGR to 2015E with the US home improvement industry set to reach US$191.5bn by 2018E (Source: Joint Center for Housing Studies of Harvard University, IBISWorld).
Healthcare REITs own up to 20% of US senior housing & healthcare real estate. They have invested across a variety of sub-asset classes and been rewarded to date by investors with premium multiples that have allowed them to expand and diversify via acquisitions. Absorption is outpacing inventory growth – and the industry remains fragmented, providing ample growth through consolidation opportunities.
Demographics are the driver, ageing boomers Changing demographics in the developed world show how the ratio of baby boomers is set to increase in comparison to the total population. In 2001, the first boomer turned 55 while the youngest boomer will do so by 2019. The overall 55+ age group in the developed world will expand from 308mn in 2010 to over 450mn in 2050, while the population of those under 54 will shrink marginally every year from 818mn in 2010 to a low of less than 800mn in 2040 (Source: UN).
Chart 149: Change in population by age group in high-income countries (‘000)
Source: World Bank, BofA Merrill Lynch
Support for US senior housing & skilled nursing According to the US Department of Health and Human Services, the 65+ population increased from 35mn in 2000 to 43mn in 2012 (+23%) and is projected to increase to 73mn in 2030. This group represented 13.7% of the population in 2012, which is expected to increase to 25.5% by 2030.
795,000
800,000
805,000
810,000
815,000
820,000
250,000
300,000
350,000
400,000
450,000
500,000
2010 2015 2020 2025 2030 2035 2040 2045 2050
55+ population 0-54
Chart 148: Progressive ageing of baby boomers (born between 1946-64)
Source: UN
0 50 100
2010
2015
2020
2030
2050
Born 1946 Born 1964
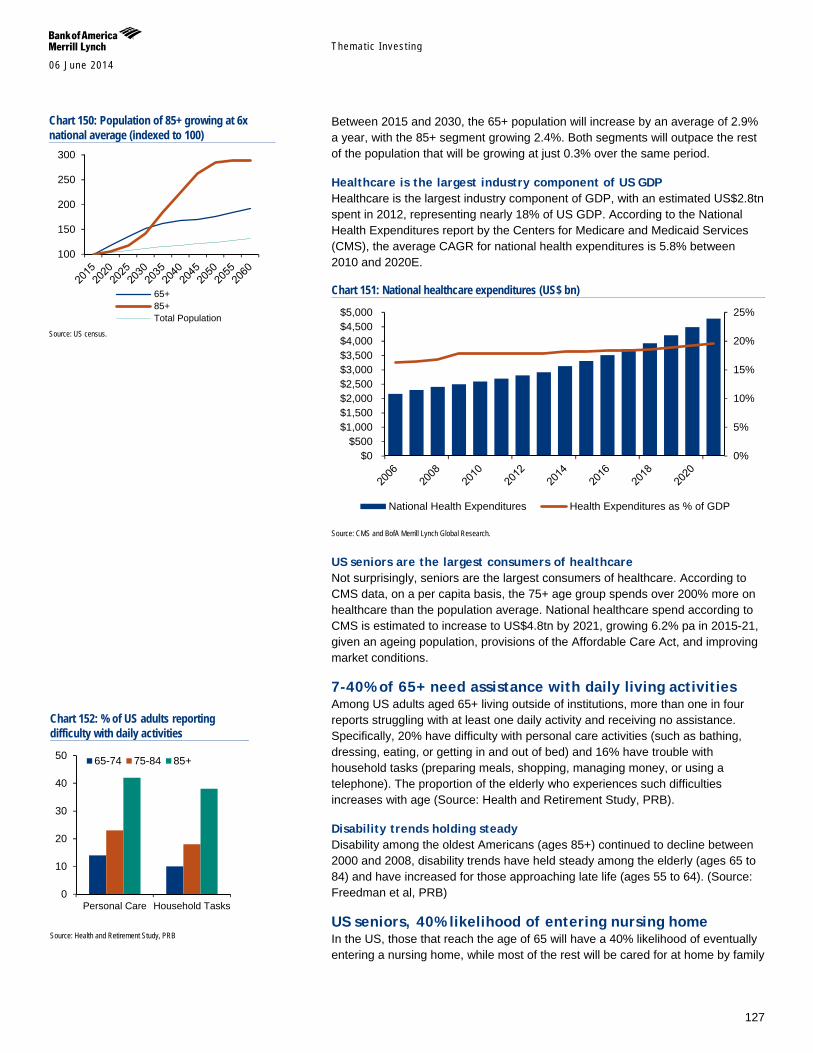
Themat ic Inves t ing 06 June 2014
127
Between 2015 and 2030, the 65+ population will increase by an average of 2.9% a year, with the 85+ segment growing 2.4%. Both segments will outpace the rest of the population that will be growing at just 0.3% over the same period.
Healthcare is the largest industry component of US GDP Healthcare is the largest industry component of GDP, with an estimated US$2.8tn spent in 2012, representing nearly 18% of US GDP. According to the National Health Expenditures report by the Centers for Medicare and Medicaid Services (CMS), the average CAGR for national health expenditures is 5.8% between 2010 and 2020E.
Chart 151: National healthcare expenditures (US$ bn)
Source: CMS and BofA Merrill Lynch Global Research.
US seniors are the largest consumers of healthcare Not surprisingly, seniors are the largest consumers of healthcare. According to CMS data, on a per capita basis, the 75+ age group spends over 200% more on healthcare than the population average. National healthcare spend according to CMS is estimated to increase to US$4.8tn by 2021, growing 6.2% pa in 2015-21, given an ageing population, provisions of the Affordable Care Act, and improving market conditions.
7-40% of 65+ need assistance with daily living activities Among US adults aged 65+ living outside of institutions, more than one in four reports struggling with at least one daily activity and receiving no assistance. Specifically, 20% have difficulty with personal care activities (such as bathing, dressing, eating, or getting in and out of bed) and 16% have trouble with household tasks (preparing meals, shopping, managing money, or using a telephone). The proportion of the elderly who experiences such difficulties increases with age (Source: Health and Retirement Study, PRB).
Disability trends holding steady Disability among the oldest Americans (ages 85+) continued to decline between 2000 and 2008, disability trends have held steady among the elderly (ages 65 to 84) and have increased for those approaching late life (ages 55 to 64). (Source: Freedman et al, PRB)
US seniors, 40% likelihood of entering nursing home In the US, those that reach the age of 65 will have a 40% likelihood of eventually entering a nursing home, while most of the rest will be cared for at home by family
0%
5%
10%
15%
20%
25%
$0$500
$1,000$1,500$2,000$2,500$3,000$3,500$4,000$4,500$5,000
National Health Expenditures Health Expenditures as % of GDP
Chart 150: Population of 85+ growing at 6x national average (indexed to 100)
Source: US census.
Chart 152: % of US adults reporting difficulty with daily activities
Source: Health and Retirement Study, PRB
100
150
200
250
300
65+85+Total Population
0
10
20
30
40
50
Personal Care Household Tasks
65-74 75-84 85+
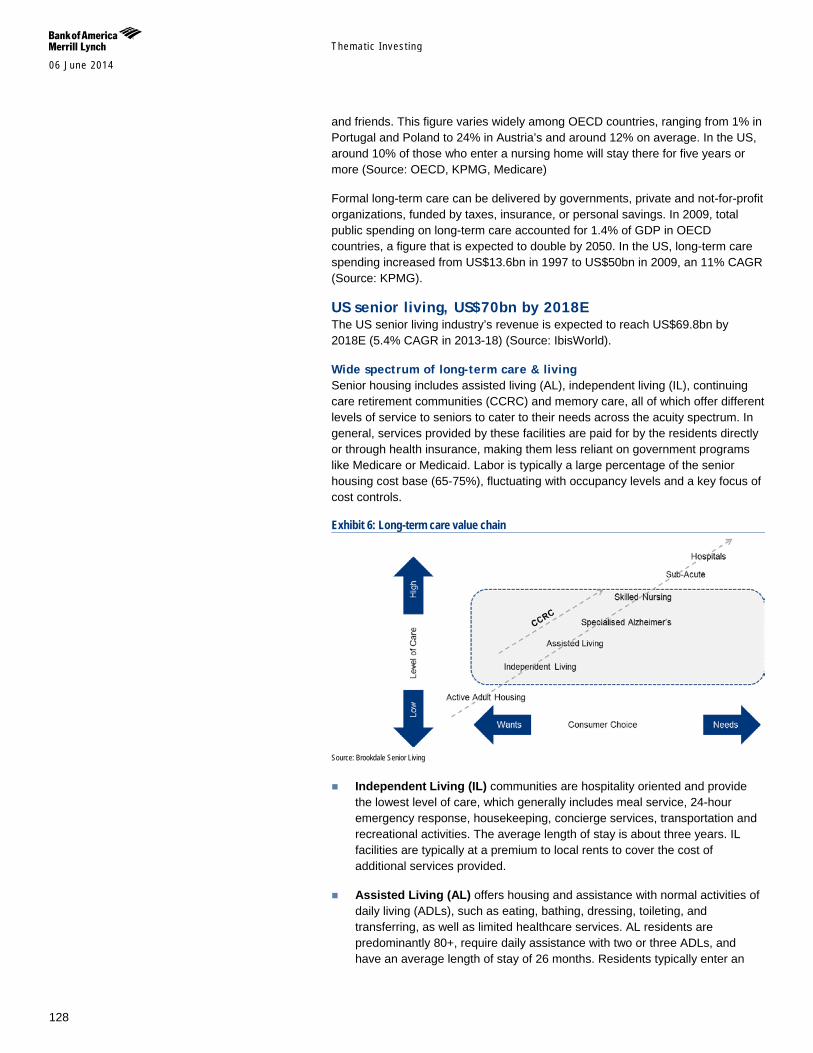
Themat ic Inves t ing 06 June 2014
128
and friends. This figure varies widely among OECD countries, ranging from 1% in Portugal and Poland to 24% in Austria’s and around 12% on average. In the US, around 10% of those who enter a nursing home will stay there for five years or more (Source: OECD, KPMG, Medicare)
Formal long-term care can be delivered by governments, private and not-for-profit organizations, funded by taxes, insurance, or personal savings. In 2009, total public spending on long-term care accounted for 1.4% of GDP in OECD countries, a figure that is expected to double by 2050. In the US, long-term care spending increased from US$13.6bn in 1997 to US$50bn in 2009, an 11% CAGR (Source: KPMG).
US senior living, US$70bn by 2018E The US senior living industry’s revenue is expected to reach US$69.8bn by 2018E (5.4% CAGR in 2013-18) (Source: IbisWorld).
Wide spectrum of long-term care & living Senior housing includes assisted living (AL), independent living (IL), continuing care retirement communities (CCRC) and memory care, all of which offer different levels of service to seniors to cater to their needs across the acuity spectrum. In general, services provided by these facilities are paid for by the residents directly or through health insurance, making them less reliant on government programs like Medicare or Medicaid. Labor is typically a large percentage of the senior housing cost base (65-75%), fluctuating with occupancy levels and a key focus of cost controls.
Exhibit 6: Long-term care value chain
Source: Brookdale Senior Living
Independent Living (IL) communities are hospitality oriented and provide the lowest level of care, which generally includes meal service, 24-hour emergency response, housekeeping, concierge services, transportation and recreational activities. The average length of stay is about three years. IL facilities are typically at a premium to local rents to cover the cost of additional services provided.
Assisted Living (AL) offers housing and assistance with normal activities of daily living (ADLs), such as eating, bathing, dressing, toileting, and transferring, as well as limited healthcare services. AL residents are predominantly 80+, require daily assistance with two or three ADLs, and have an average length of stay of 26 months. Residents typically enter an
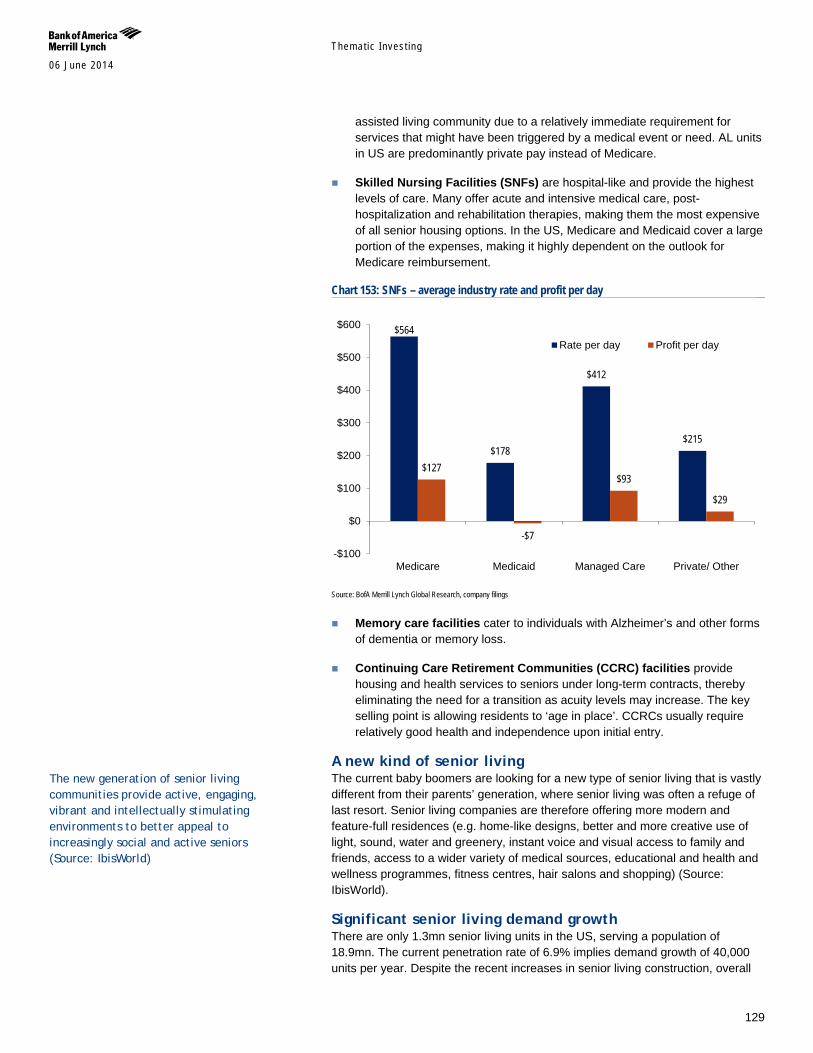
Themat ic Inves t ing 06 June 2014
129
assisted living community due to a relatively immediate requirement for services that might have been triggered by a medical event or need. AL units in US are predominantly private pay instead of Medicare.
Skilled Nursing Facilities (SNFs) are hospital-like and provide the highest levels of care. Many offer acute and intensive medical care, post-hospitalization and rehabilitation therapies, making them the most expensive of all senior housing options. In the US, Medicare and Medicaid cover a large portion of the expenses, making it highly dependent on the outlook for Medicare reimbursement.
Chart 153: SNFs – average industry rate and profit per day
Source: BofA Merrill Lynch Global Research, company filings
Memory care facilities cater to individuals with Alzheimer’s and other forms of dementia or memory loss.
Continuing Care Retirement Communities (CCRC) facilities provide housing and health services to seniors under long-term contracts, thereby eliminating the need for a transition as acuity levels may increase. The key selling point is allowing residents to ‘age in place’. CCRCs usually require relatively good health and independence upon initial entry.
A new kind of senior living The current baby boomers are looking for a new type of senior living that is vastly different from their parents’ generation, where senior living was often a refuge of last resort. Senior living companies are therefore offering more modern and feature-full residences (e.g. home-like designs, better and more creative use of light, sound, water and greenery, instant voice and visual access to family and friends, access to a wider variety of medical sources, educational and health and wellness programmes, fitness centres, hair salons and shopping) (Source: IbisWorld).
Significant senior living demand growth There are only 1.3mn senior living units in the US, serving a population of 18.9mn. The current penetration rate of 6.9% implies demand growth of 40,000 units per year. Despite the recent increases in senior living construction, overall
$564
$178
$412
$215
$127
-$7
$93
$29
-$100
$0
$100
$200
$300
$400
$500
$600
Medicare Medicaid Managed Care Private/ Other
Rate per day Profit per day
The new generation of senior living communities provide active, engaging, vibrant and intellectually stimulating environments to better appeal to increasingly social and active seniors (Source: IbisWorld)
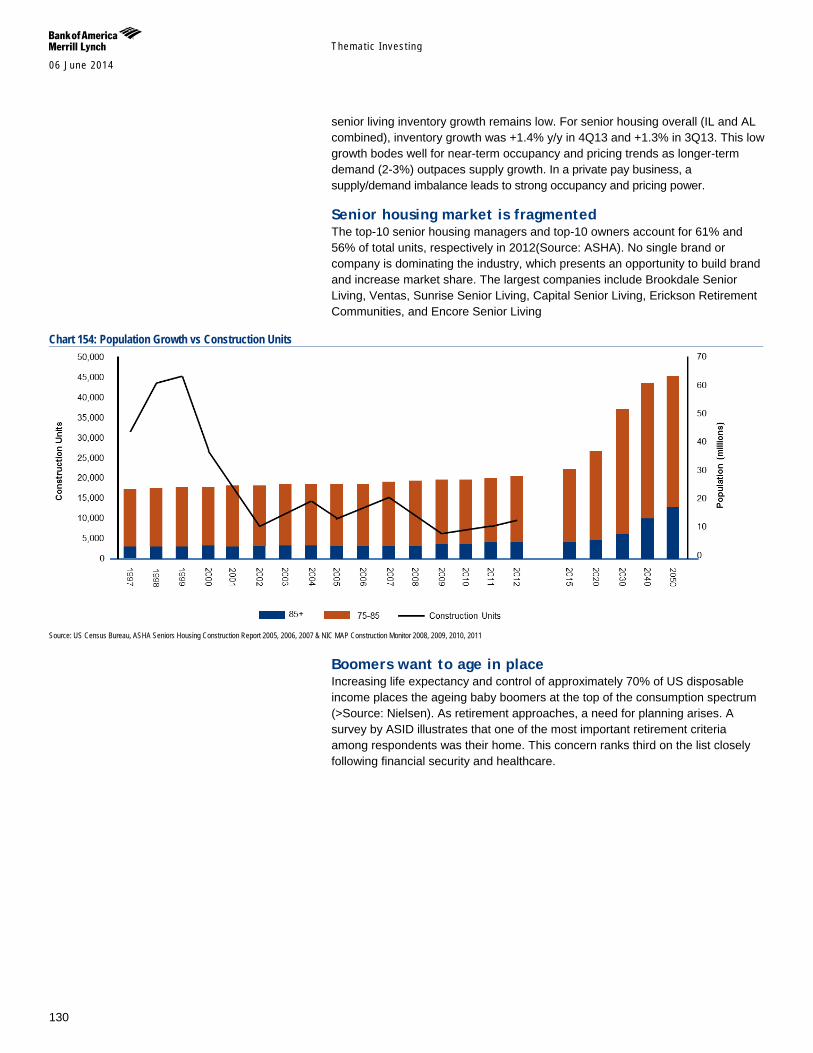
Themat ic Inves t ing 06 June 2014
130
senior living inventory growth remains low. For senior housing overall (IL and AL combined), inventory growth was +1.4% y/y in 4Q13 and +1.3% in 3Q13. This low growth bodes well for near-term occupancy and pricing trends as longer-term demand (2-3%) outpaces supply growth. In a private pay business, a supply/demand imbalance leads to strong occupancy and pricing power.
Senior housing market is fragmented The top-10 senior housing managers and top-10 owners account for 61% and 56% of total units, respectively in 2012(Source: ASHA). No single brand or company is dominating the industry, which presents an opportunity to build brand and increase market share. The largest companies include Brookdale Senior Living, Ventas, Sunrise Senior Living, Capital Senior Living, Erickson Retirement Communities, and Encore Senior Living
Chart 154: Population Growth vs Construction Units
Source: US Census Bureau, ASHA Seniors Housing Construction Report 2005, 2006, 2007 & NIC MAP Construction Monitor 2008, 2009, 2010, 2011
Boomers want to age in place Increasing life expectancy and control of approximately 70% of US disposable income places the ageing baby boomers at the top of the consumption spectrum (>Source: Nielsen). As retirement approaches, a need for planning arises. A survey by ASID illustrates that one of the most important retirement criteria among respondents was their home. This concern ranks third on the list closely following financial security and healthcare.
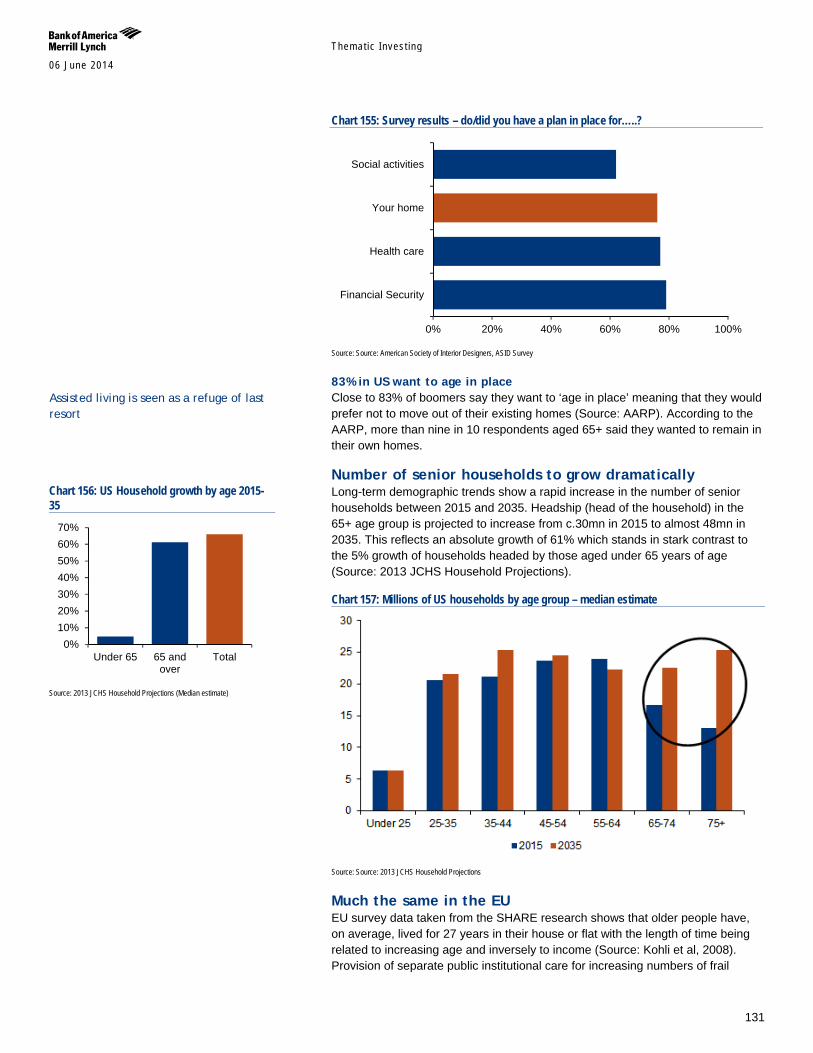
Themat ic Inves t ing 06 June 2014
131
Chart 155: Survey results – do/did you have a plan in place for…..?
Source: Source: American Society of Interior Designers, ASID Survey
83% in US want to age in place Close to 83% of boomers say they want to ‘age in place’ meaning that they would prefer not to move out of their existing homes (Source: AARP). According to the AARP, more than nine in 10 respondents aged 65+ said they wanted to remain in their own homes.
Number of senior households to grow dramatically Long-term demographic trends show a rapid increase in the number of senior households between 2015 and 2035. Headship (head of the household) in the 65+ age group is projected to increase from c.30mn in 2015 to almost 48mn in 2035. This reflects an absolute growth of 61% which stands in stark contrast to the 5% growth of households headed by those aged under 65 years of age (Source: 2013 JCHS Household Projections).
Chart 157: Millions of US households by age group – median estimate
Source: Source: 2013 JCHS Household Projections
Much the same in the EU EU survey data taken from the SHARE research shows that older people have, on average, lived for 27 years in their house or flat with the length of time being related to increasing age and inversely to income (Source: Kohli et al, 2008). Provision of separate public institutional care for increasing numbers of frail
0% 20% 40% 60% 80% 100%
Financial Security
Health care
Your home
Social activities
Chart 156: US Household growth by age 2015-35
Source: 2013 JCHS Household Projections (Median estimate)
0%10%20%30%40%50%60%70%
Under 65 65 andover
Total
Assisted living is seen as a refuge of last resort
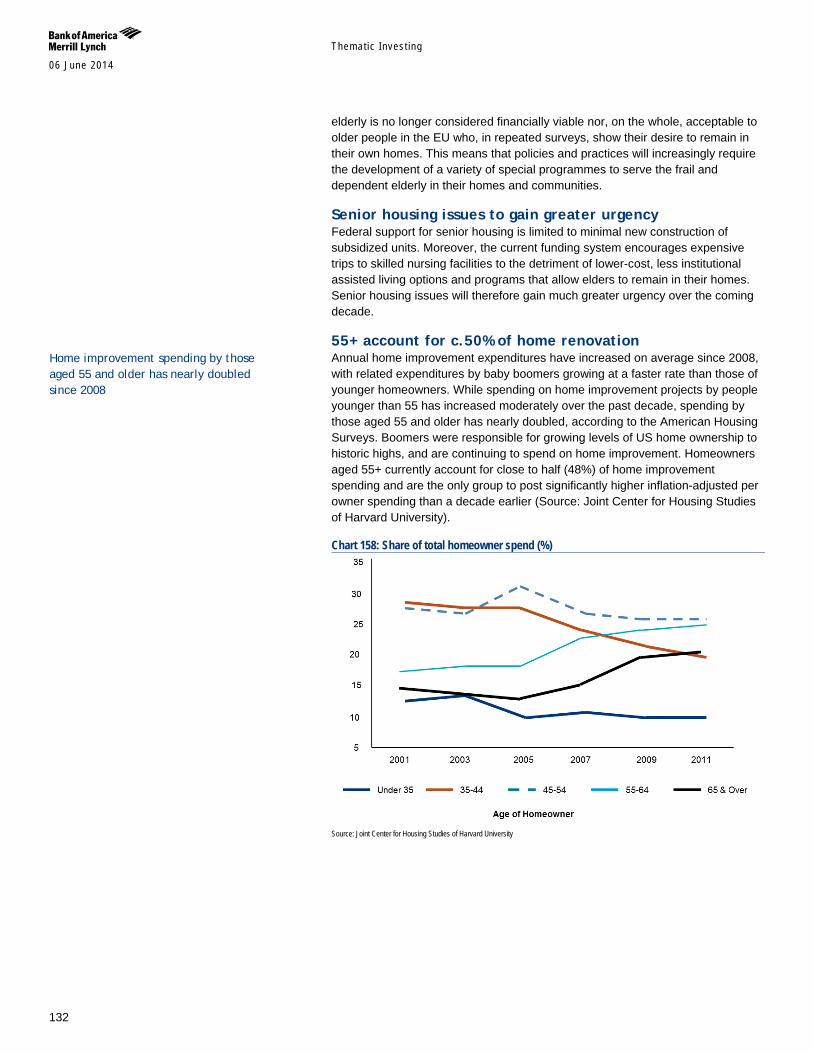
Themat ic Inves t ing 06 June 2014
132
elderly is no longer considered financially viable nor, on the whole, acceptable to older people in the EU who, in repeated surveys, show their desire to remain in their own homes. This means that policies and practices will increasingly require the development of a variety of special programmes to serve the frail and dependent elderly in their homes and communities.
Senior housing issues to gain greater urgency Federal support for senior housing is limited to minimal new construction of subsidized units. Moreover, the current funding system encourages expensive trips to skilled nursing facilities to the detriment of lower-cost, less institutional assisted living options and programs that allow elders to remain in their homes. Senior housing issues will therefore gain much greater urgency over the coming decade.
55+ account for c.50% of home renovation Annual home improvement expenditures have increased on average since 2008, with related expenditures by baby boomers growing at a faster rate than those of younger homeowners. While spending on home improvement projects by people younger than 55 has increased moderately over the past decade, spending by those aged 55 and older has nearly doubled, according to the American Housing Surveys. Boomers were responsible for growing levels of US home ownership to historic highs, and are continuing to spend on home improvement. Homeowners aged 55+ currently account for close to half (48%) of home improvement spending and are the only group to post significantly higher inflation-adjusted per owner spending than a decade earlier (Source: Joint Center for Housing Studies of Harvard University).
Chart 158: Share of total homeowner spend (%)
Source: Joint Center for Housing Studies of Harvard University
Home improvement spending by those aged 55 and older has nearly doubled since 2008
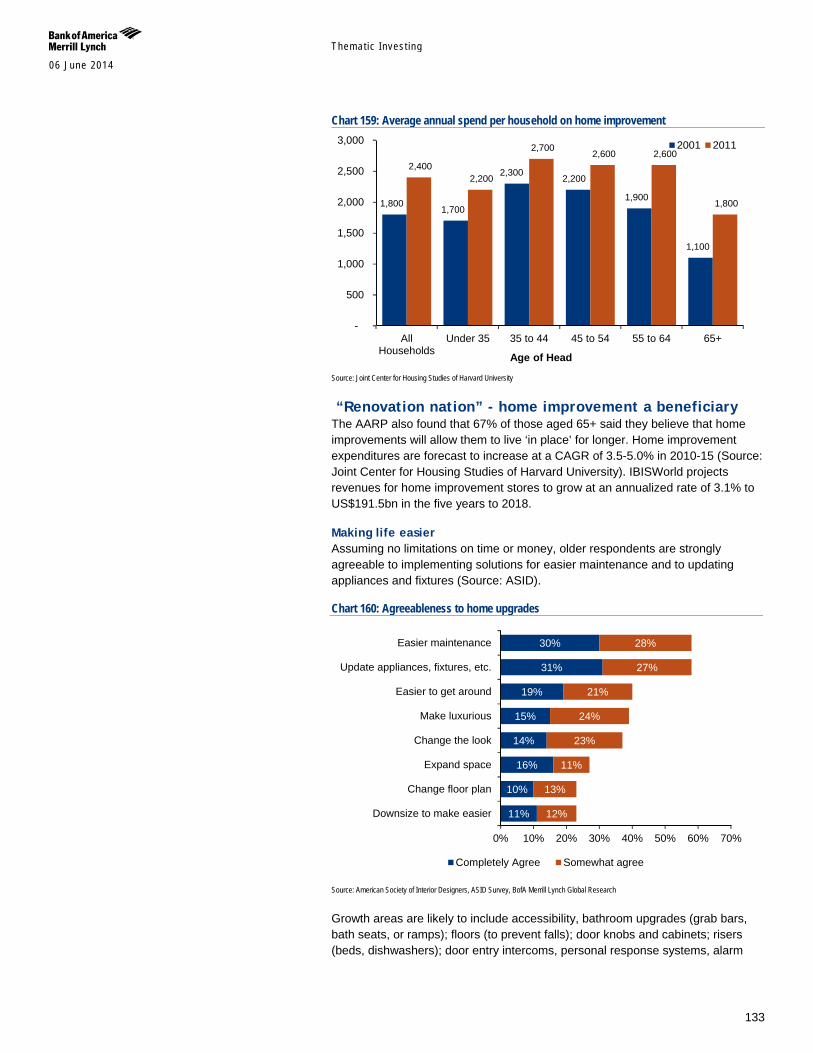
Themat ic Inves t ing 06 June 2014
133
Chart 159: Average annual spend per household on home improvement
Source: Joint Center for Housing Studies of Harvard University
“Renovation nation” - home improvement a beneficiary The AARP also found that 67% of those aged 65+ said they believe that home improvements will allow them to live ‘in place’ for longer. Home improvement expenditures are forecast to increase at a CAGR of 3.5-5.0% in 2010-15 (Source: Joint Center for Housing Studies of Harvard University). IBISWorld projects revenues for home improvement stores to grow at an annualized rate of 3.1% to US$191.5bn in the five years to 2018.
Making life easier Assuming no limitations on time or money, older respondents are strongly agreeable to implementing solutions for easier maintenance and to updating appliances and fixtures (Source: ASID).
Chart 160: Agreeableness to home upgrades
Source: American Society of Interior Designers, ASID Survey, BofA Merrill Lynch Global Research
Growth areas are likely to include accessibility, bathroom upgrades (grab bars, bath seats, or ramps); floors (to prevent falls); door knobs and cabinets; risers (beds, dishwashers); door entry intercoms, personal response systems, alarm
1,800 1,700
2,300 2,200
1,900
1,100
2,400 2,200
2,700 2,600 2,600
1,800
-
500
1,000
1,500
2,000
2,500
3,000
AllHouseholds
Under 35 35 to 44 45 to 54 55 to 64 65+
2001 2011
Age of Head
11%
10%
16%
14%
15%
19%
31%
30%
12%
13%
11%
23%
24%
21%
27%
28%
0% 10% 20% 30% 40% 50% 60% 70%
Downsize to make easier
Change floor plan
Expand space
Change the look
Make luxurious
Easier to get around
Update appliances, fixtures, etc.
Easier maintenance
Completely Agree Somewhat agree
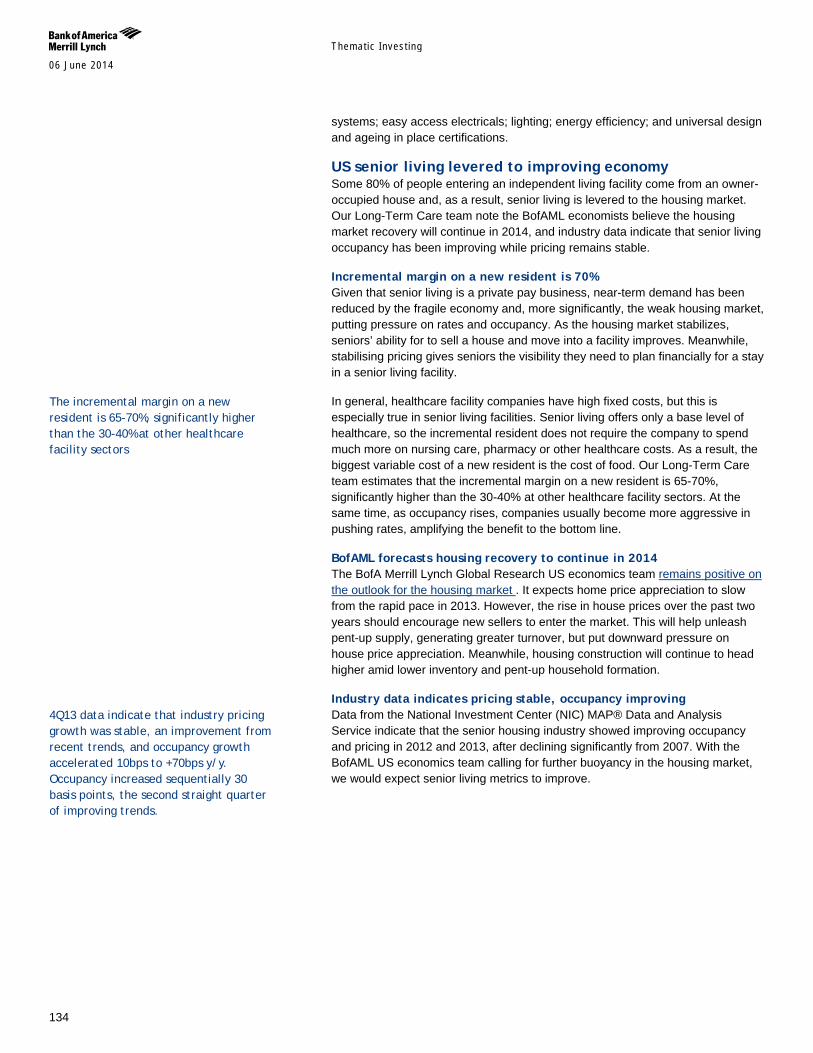
Themat ic Inves t ing 06 June 2014
134
systems; easy access electricals; lighting; energy efficiency; and universal design and ageing in place certifications.
US senior living levered to improving economy Some 80% of people entering an independent living facility come from an owner-occupied house and, as a result, senior living is levered to the housing market. Our Long-Term Care team note the BofAML economists believe the housing market recovery will continue in 2014, and industry data indicate that senior living occupancy has been improving while pricing remains stable.
Incremental margin on a new resident is 70% Given that senior living is a private pay business, near-term demand has been reduced by the fragile economy and, more significantly, the weak housing market, putting pressure on rates and occupancy. As the housing market stabilizes, seniors’ ability for to sell a house and move into a facility improves. Meanwhile, stabilising pricing gives seniors the visibility they need to plan financially for a stay in a senior living facility.
In general, healthcare facility companies have high fixed costs, but this is especially true in senior living facilities. Senior living offers only a base level of healthcare, so the incremental resident does not require the company to spend much more on nursing care, pharmacy or other healthcare costs. As a result, the biggest variable cost of a new resident is the cost of food. Our Long-Term Care team estimates that the incremental margin on a new resident is 65-70%, significantly higher than the 30-40% at other healthcare facility sectors. At the same time, as occupancy rises, companies usually become more aggressive in pushing rates, amplifying the benefit to the bottom line.
BofAML forecasts housing recovery to continue in 2014 The BofA Merrill Lynch Global Research US economics team remains positive on the outlook for the housing market . It expects home price appreciation to slow from the rapid pace in 2013. However, the rise in house prices over the past two years should encourage new sellers to enter the market. This will help unleash pent-up supply, generating greater turnover, but put downward pressure on house price appreciation. Meanwhile, housing construction will continue to head higher amid lower inventory and pent-up household formation.
Industry data indicates pricing stable, occupancy improving Data from the National Investment Center (NIC) MAP® Data and Analysis Service indicate that the senior housing industry showed improving occupancy and pricing in 2012 and 2013, after declining significantly from 2007. With the BofAML US economics team calling for further buoyancy in the housing market, we would expect senior living metrics to improve.
The incremental margin on a new resident is 65-70%, significantly higher than the 30-40% at other healthcare facility sectors
4Q13 data indicate that industry pricing growth was stable, an improvement from recent trends, and occupancy growth accelerated 10bps to +70bps y/y. Occupancy increased sequentially 30 basis points, the second straight quarter of improving trends.
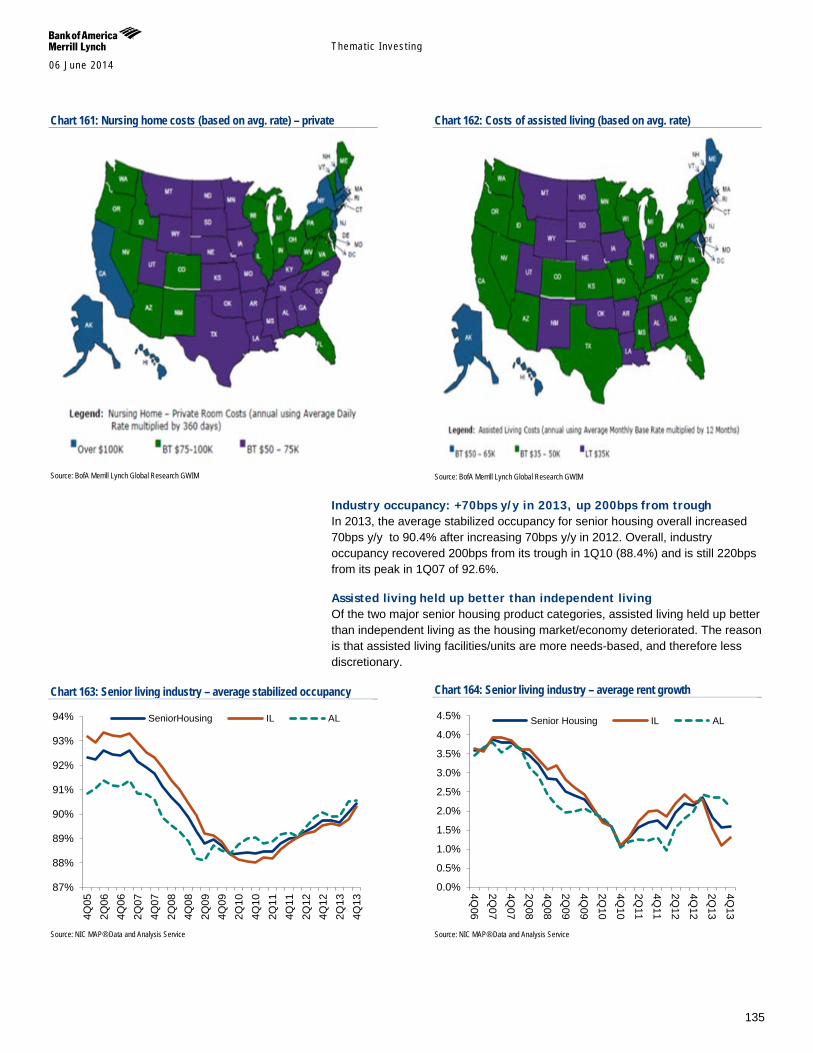
Themat ic Inves t ing 06 June 2014
135
Chart 161: Nursing home costs (based on avg. rate) – private
Source: BofA Merrill Lynch Global Research GWIM
Chart 162: Costs of assisted living (based on avg. rate)
Source: BofA Merrill Lynch Global Research GWIM
Industry occupancy: +70bps y/y in 2013, up 200bps from trough In 2013, the average stabilized occupancy for senior housing overall increased 70bps y/y to 90.4% after increasing 70bps y/y in 2012. Overall, industry occupancy recovered 200bps from its trough in 1Q10 (88.4%) and is still 220bps from its peak in 1Q07 of 92.6%.
Assisted living held up better than independent living Of the two major senior housing product categories, assisted living held up better than independent living as the housing market/economy deteriorated. The reason is that assisted living facilities/units are more needs-based, and therefore less discretionary.
Chart 163: Senior living industry – average stabilized occupancy
Source: NIC MAP® Data and Analysis Service
Chart 164: Senior living industry – average rent growth
Source: NIC MAP® Data and Analysis Service
87%
88%
89%
90%
91%
92%
93%
94%
4Q05
2Q06
4Q06
2Q07
4Q07
2Q08
4Q08
2Q09
4Q09
2Q10
4Q10
2Q11
4Q11
2Q12
4Q12
2Q13
4Q13
SeniorHousing IL AL
0.0%
0.5%
1.0%
1.5%
2.0%
2.5%
3.0%
3.5%
4.0%
4.5%
4Q06
2Q07
4Q07
2Q08
4Q08
2Q09
4Q09
2Q10
4Q10
2Q11
4Q11
2Q12
4Q12
2Q13
4Q13
Senior Housing IL AL

Themat ic Inves t ing 06 June 2014
136
Senior living has no exposure to US government reimbursement Of all the healthcare facilities subsectors, senior living has the least exposure to government payors (see Chart 165).
Pricing is determined by market For the industry as a whole, Medicare/Medicaid represents about 10% of revenues. Given the minimal exposure to Medicare/Medicaid, the industry does not have the same exposure to state and federal budget pressures and the ongoing discussions of potential provider cuts. Instead, pricing is determined by market forces, such as supply and demand. This dynamic has its own risks, such as overbuilding in the late 1990s, or the dent in demand from the housing/economic slump during the most recent recession. However, there is more visibility on market trends, which develop over time, as opposed to government reimbursement, where rate changes can occur overnight and often are driven by factors beyond the underlying cost growth.
Immune from rate cuts to fund reform Because the majority of the business is private pay, the senior living industry does not benefit from the coverage expansion under reform, but is also immune from any rate cuts to fund reform.
Healthcare REITs, own 20% of senior housing Industry estimates of the total value of senior housing and related healthcare real estate range from US$650bn to more than US$1tn, with public healthcare REIT ownership accounting for 14-20% of assets. This means the industry remains fragmented and provides ample growth through consolidation opportunities.
Five areas of exposure to seniors Healthcare REIT assets fall within the following sub-asset classes each with their own niche in meeting the needs of seniors: 1) Senior housing (including independent living; assisted living and continuing care retirement communities; 2) skilled nursing facilities; 3) hospitals; 4) medical office buildings (MOBs); and 5) life sciences. Across the acuity spectrum, hospitals have the highest levels of acuity, followed by SNFs and then senior housing.
HCA REITs have thrived HCA REITs are an exception to REIT peers, in that diversified portfolios have thrived. The "Big 3" REITs (Health Care REIT, HCP Inc, and Ventas) have invested across a variety of sub-asset classes and been rewarded to date by investors with premium multiples that have allowed them to expand and diversify via acquisitions.
Chart 165: Exposure to government payors by subsector
Source: BofA Merrill Lynch Global Research
0%10%20%30%40%50%60%70%80%90%
100%
Average: 50%
Absorption is outpacing inventory growth
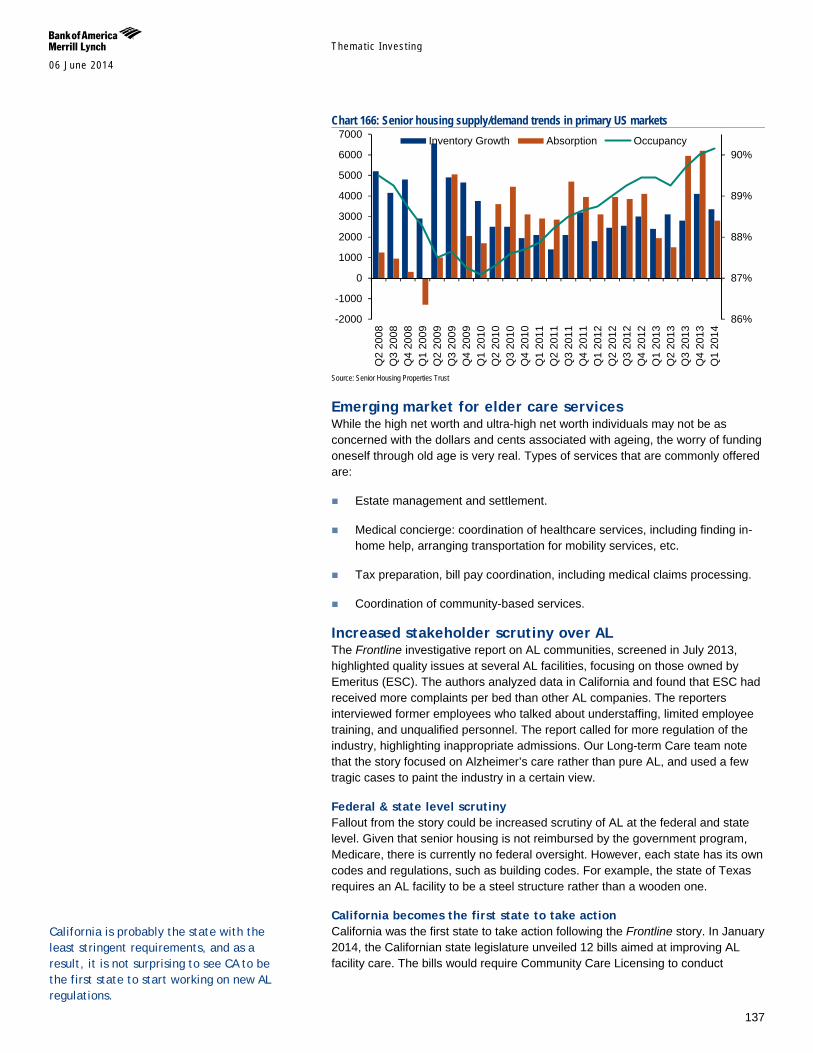
Themat ic Inves t ing 06 June 2014
137
Chart 166: Senior housing supply/demand trends in primary US markets
Source: Senior Housing Properties Trust
Emerging market for elder care services While the high net worth and ultra-high net worth individuals may not be as concerned with the dollars and cents associated with ageing, the worry of funding oneself through old age is very real. Types of services that are commonly offered are:
Estate management and settlement.
Medical concierge: coordination of healthcare services, including finding in-home help, arranging transportation for mobility services, etc.
Tax preparation, bill pay coordination, including medical claims processing.
Coordination of community-based services.
Increased stakeholder scrutiny over AL The Frontline investigative report on AL communities, screened in July 2013, highlighted quality issues at several AL facilities, focusing on those owned by Emeritus (ESC). The authors analyzed data in California and found that ESC had received more complaints per bed than other AL companies. The reporters interviewed former employees who talked about understaffing, limited employee training, and unqualified personnel. The report called for more regulation of the industry, highlighting inappropriate admissions. Our Long-term Care team note that the story focused on Alzheimer’s care rather than pure AL, and used a few tragic cases to paint the industry in a certain view.
Federal & state level scrutiny Fallout from the story could be increased scrutiny of AL at the federal and state level. Given that senior housing is not reimbursed by the government program, Medicare, there is currently no federal oversight. However, each state has its own codes and regulations, such as building codes. For example, the state of Texas requires an AL facility to be a steel structure rather than a wooden one.
California becomes the first state to take action California was the first state to take action following the Frontline story. In January 2014, the Californian state legislature unveiled 12 bills aimed at improving AL facility care. The bills would require Community Care Licensing to conduct
86%
87%
88%
89%
90%
-2000
-1000
0
1000
2000
3000
4000
5000
6000
7000
Q2
2008
Q3
2008
Q4
2008
Q1
2009
Q2
2009
Q3
2009
Q4
2009
Q1
2010
Q2
2010
Q3
2010
Q4
2010
Q1
2011
Q2
2011
Q3
2011
Q4
2011
Q1
2012
Q2
2012
Q3
2012
Q4
2012
Q1
2013
Q2
2013
Q3
2013
Q4
2013
Q1
2014
Inventory Growth Absorption Occupancy
California is probably the state with the least stringent requirements, and as a result, it is not surprising to see CA to be the first state to start working on new AL regulations.
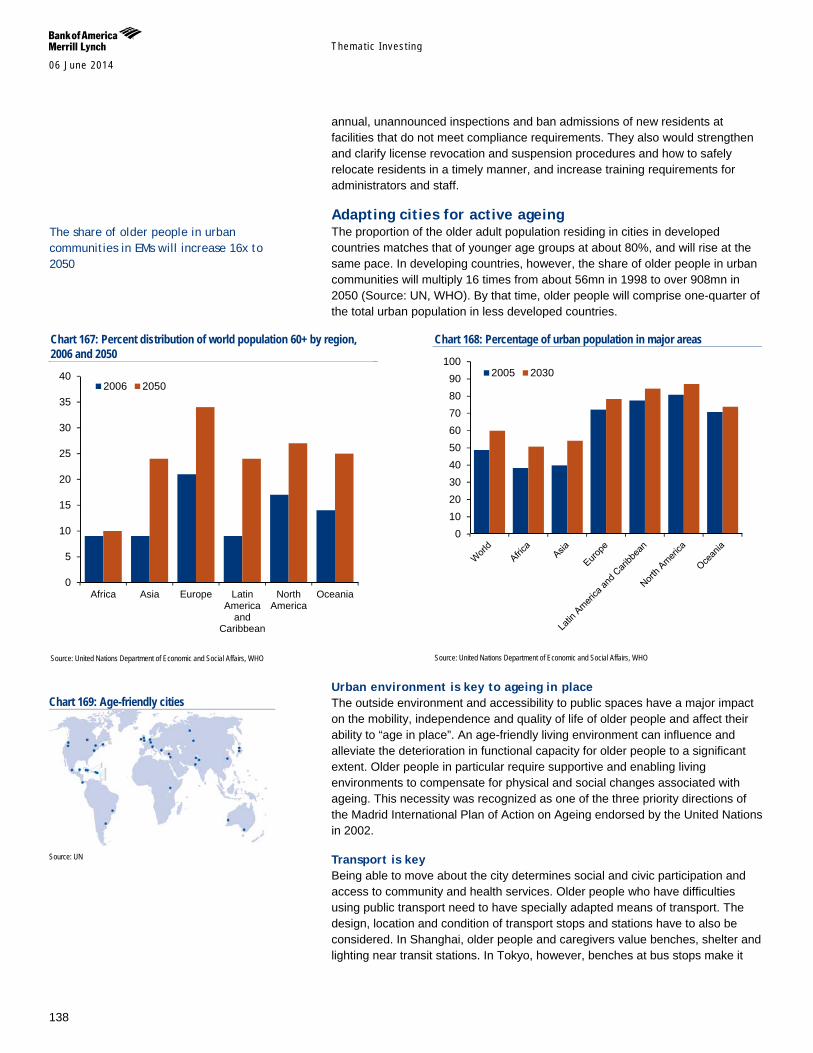
Themat ic Inves t ing 06 June 2014
138
annual, unannounced inspections and ban admissions of new residents at facilities that do not meet compliance requirements. They also would strengthen and clarify license revocation and suspension procedures and how to safely relocate residents in a timely manner, and increase training requirements for administrators and staff.
Adapting cities for active ageing The proportion of the older adult population residing in cities in developed countries matches that of younger age groups at about 80%, and will rise at the same pace. In developing countries, however, the share of older people in urban communities will multiply 16 times from about 56mn in 1998 to over 908mn in 2050 (Source: UN, WHO). By that time, older people will comprise one-quarter of the total urban population in less developed countries.
Chart 167: Percent distribution of world population 60+ by region, 2006 and 2050
Source: United Nations Department of Economic and Social Affairs, WHO
Chart 168: Percentage of urban population in major areas
Source: United Nations Department of Economic and Social Affairs, WHO
Urban environment is key to ageing in place The outside environment and accessibility to public spaces have a major impact on the mobility, independence and quality of life of older people and affect their ability to “age in place”. An age-friendly living environment can influence and alleviate the deterioration in functional capacity for older people to a significant extent. Older people in particular require supportive and enabling living environments to compensate for physical and social changes associated with ageing. This necessity was recognized as one of the three priority directions of the Madrid International Plan of Action on Ageing endorsed by the United Nations in 2002.
Transport is key Being able to move about the city determines social and civic participation and access to community and health services. Older people who have difficulties using public transport need to have specially adapted means of transport. The design, location and condition of transport stops and stations have to also be considered. In Shanghai, older people and caregivers value benches, shelter and lighting near transit stations. In Tokyo, however, benches at bus stops make it
0
5
10
15
20
25
30
35
40
Africa Asia Europe LatinAmerica
andCaribbean
NorthAmerica
Oceania
2006 2050
0102030405060708090
1002005 2030
Chart 169: Age-friendly cities
Source: UN
The share of older people in urban communities in EMs will increase 16x to 2050
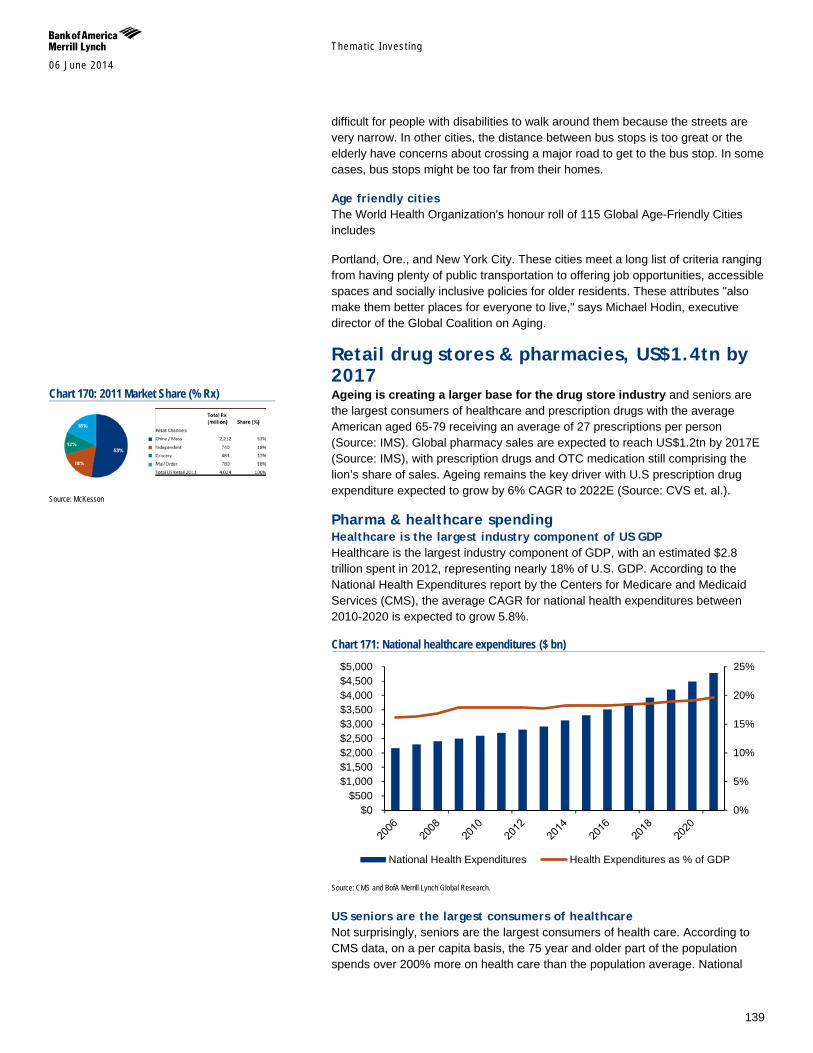
Themat ic Inves t ing 06 June 2014
139
difficult for people with disabilities to walk around them because the streets are very narrow. In other cities, the distance between bus stops is too great or the elderly have concerns about crossing a major road to get to the bus stop. In some cases, bus stops might be too far from their homes.
Age friendly cities The World Health Organization's honour roll of 115 Global Age-Friendly Cities includes
Portland, Ore., and New York City. These cities meet a long list of criteria ranging from having plenty of public transportation to offering job opportunities, accessible spaces and socially inclusive policies for older residents. These attributes "also make them better places for everyone to live," says Michael Hodin, executive director of the Global Coalition on Aging.
Retail drug stores & pharmacies, US$1.4tn by 2017 Ageing is creating a larger base for the drug store industry and seniors are the largest consumers of healthcare and prescription drugs with the average American aged 65-79 receiving an average of 27 prescriptions per person (Source: IMS). Global pharmacy sales are expected to reach US$1.2tn by 2017E (Source: IMS), with prescription drugs and OTC medication still comprising the lion’s share of sales. Ageing remains the key driver with U.S prescription drug expenditure expected to grow by 6% CAGR to 2022E (Source: CVS et. al.).
Pharma & healthcare spending Healthcare is the largest industry component of US GDP Healthcare is the largest industry component of GDP, with an estimated $2.8 trillion spent in 2012, representing nearly 18% of U.S. GDP. According to the National Health Expenditures report by the Centers for Medicare and Medicaid Services (CMS), the average CAGR for national health expenditures between 2010-2020 is expected to grow 5.8%.
Chart 171: National healthcare expenditures ($ bn)
Source: CMS and BofA Merrill Lynch Global Research.
US seniors are the largest consumers of healthcare Not surprisingly, seniors are the largest consumers of health care. According to CMS data, on a per capita basis, the 75 year and older part of the population spends over 200% more on health care than the population average. National
0%
5%
10%
15%
20%
25%
$0$500
$1,000$1,500$2,000$2,500$3,000$3,500$4,000$4,500$5,000
National Health Expenditures Health Expenditures as % of GDP
Chart 170: 2011 Market Share (% Rx)
Source: McKesson
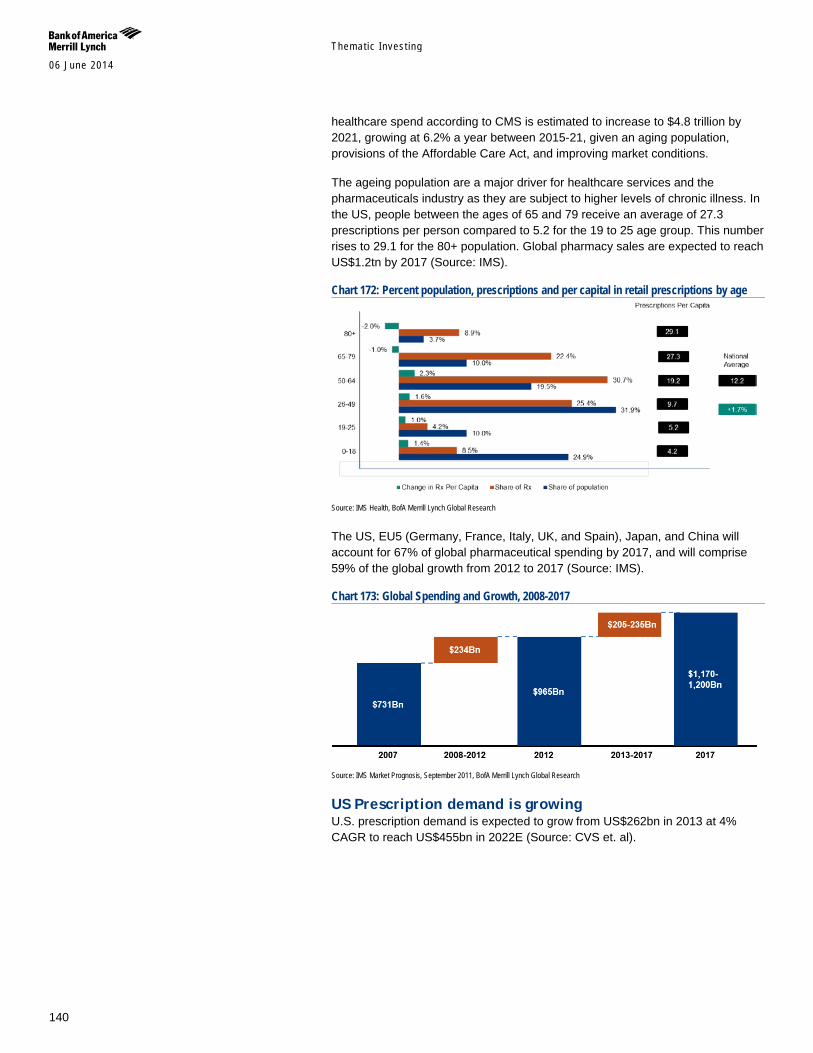
Themat ic Inves t ing 06 June 2014
140
healthcare spend according to CMS is estimated to increase to $4.8 trillion by 2021, growing at 6.2% a year between 2015-21, given an aging population, provisions of the Affordable Care Act, and improving market conditions.
The ageing population are a major driver for healthcare services and the pharmaceuticals industry as they are subject to higher levels of chronic illness. In the US, people between the ages of 65 and 79 receive an average of 27.3 prescriptions per person compared to 5.2 for the 19 to 25 age group. This number rises to 29.1 for the 80+ population. Global pharmacy sales are expected to reach US$1.2tn by 2017 (Source: IMS).
Chart 172: Percent population, prescriptions and per capital in retail prescriptions by age
Source: IMS Health, BofA Merrill Lynch Global Research
The US, EU5 (Germany, France, Italy, UK, and Spain), Japan, and China will account for 67% of global pharmaceutical spending by 2017, and will comprise 59% of the global growth from 2012 to 2017 (Source: IMS).
Chart 173: Global Spending and Growth, 2008-2017
Source: IMS Market Prognosis, September 2011, BofA Merrill Lynch Global Research
US Prescription demand is growing U.S. prescription demand is expected to grow from US$262bn in 2013 at 4% CAGR to reach US$455bn in 2022E (Source: CVS et. al).
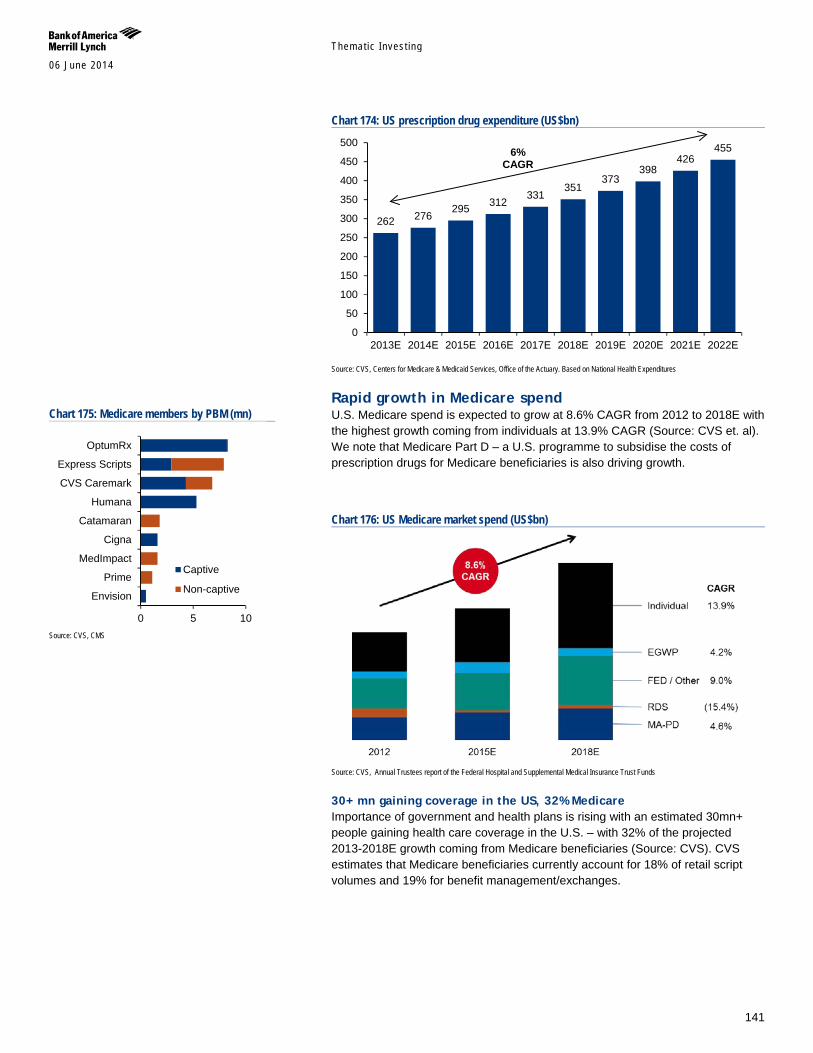
Themat ic Inves t ing 06 June 2014
141
Chart 174: US prescription drug expenditure (US$bn)
Source: CVS, Centers for Medicare & Medicaid Services, Office of the Actuary. Based on National Health Expenditures
Rapid growth in Medicare spend U.S. Medicare spend is expected to grow at 8.6% CAGR from 2012 to 2018E with the highest growth coming from individuals at 13.9% CAGR (Source: CVS et. al). We note that Medicare Part D – a U.S. programme to subsidise the costs of prescription drugs for Medicare beneficiaries is also driving growth.
Chart 176: US Medicare market spend (US$bn)
Source: CVS, Annual Trustees report of the Federal Hospital and Supplemental Medical Insurance Trust Funds
30+ mn gaining coverage in the US, 32% Medicare Importance of government and health plans is rising with an estimated 30mn+ people gaining health care coverage in the U.S. – with 32% of the projected 2013-2018E growth coming from Medicare beneficiaries (Source: CVS). CVS estimates that Medicare beneficiaries currently account for 18% of retail script volumes and 19% for benefit management/exchanges.
262 276 295 312
331 351
373 398
426 455
0
50
100
150
200
250
300
350
400
450
500
2013E 2014E 2015E 2016E 2017E 2018E 2019E 2020E 2021E 2022E
6% CAGR
Chart 175: Medicare members by PBM (mn)
Source: CVS, CMS
0 5 10
Envision
Prime
MedImpact
Cigna
Catamaran
Humana
CVS Caremark
Express Scripts
OptumRx
Captive
Non-captive
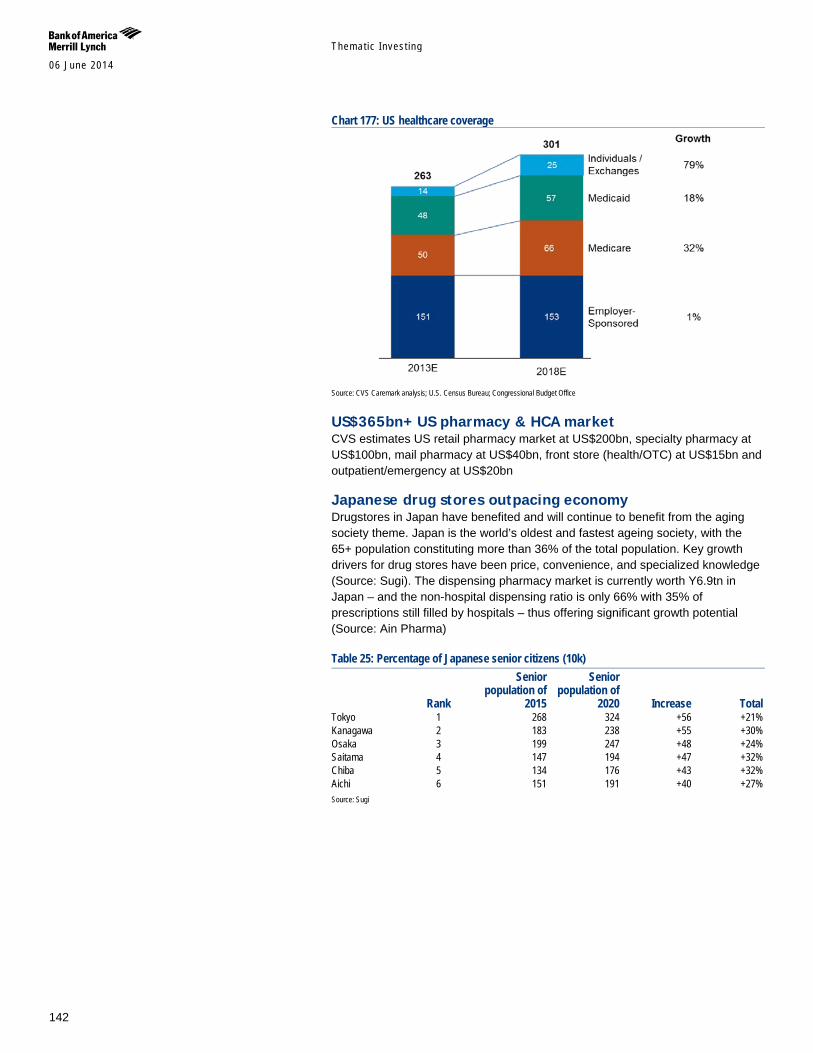
Themat ic Inves t ing 06 June 2014
142
Chart 177: US healthcare coverage
Source: CVS Caremark analysis; U.S. Census Bureau; Congressional Budget Office
US$365bn+ US pharmacy & HCA market CVS estimates US retail pharmacy market at US$200bn, specialty pharmacy at US$100bn, mail pharmacy at US$40bn, front store (health/OTC) at US$15bn and outpatient/emergency at US$20bn
Japanese drug stores outpacing economy Drugstores in Japan have benefited and will continue to benefit from the aging society theme. Japan is the world’s oldest and fastest ageing society, with the 65+ population constituting more than 36% of the total population. Key growth drivers for drug stores have been price, convenience, and specialized knowledge (Source: Sugi). The dispensing pharmacy market is currently worth Y6.9tn in Japan – and the non-hospital dispensing ratio is only 66% with 35% of prescriptions still filled by hospitals – thus offering significant growth potential (Source: Ain Pharma)
Table 25: Percentage of Japanese senior citizens (10k)
Rank
Senior population of
2015
Senior population of
2020 Increase Total Tokyo 1 268 324 +56 +21% Kanagawa 2 183 238 +55 +30% Osaka 3 199 247 +48 +24% Saitama 4 147 194 +47 +32% Chiba 5 134 176 +43 +32% Aichi 6 151 191 +40 +27% Source: Sugi
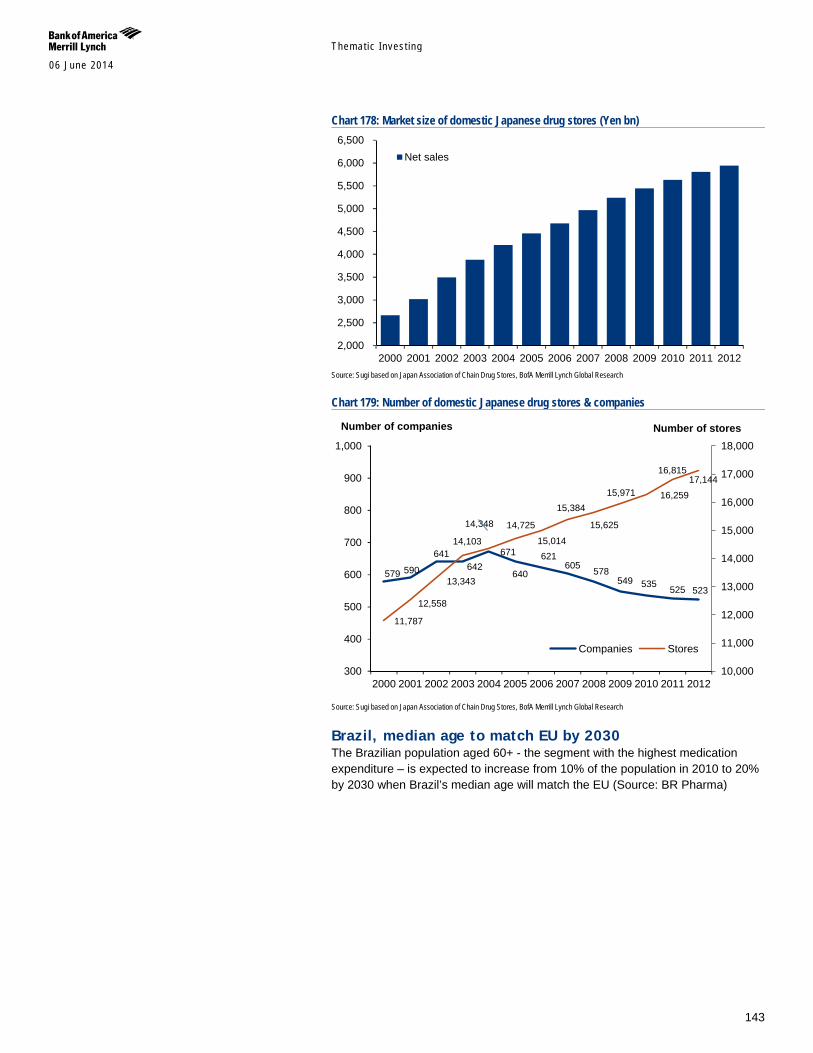
Themat ic Inves t ing 06 June 2014
143
Chart 178: Market size of domestic Japanese drug stores (Yen bn)
Source: Sugi based on Japan Association of Chain Drug Stores, BofA Merrill Lynch Global Research
Chart 179: Number of domestic Japanese drug stores & companies
Source: Sugi based on Japan Association of Chain Drug Stores, BofA Merrill Lynch Global Research
Brazil, median age to match EU by 2030 The Brazilian population aged 60+ - the segment with the highest medication expenditure – is expected to increase from 10% of the population in 2010 to 20% by 2030 when Brazil’s median age will match the EU (Source: BR Pharma)
2,000
2,500
3,000
3,500
4,000
4,500
5,000
5,500
6,000
6,500
2000 2001 2002 2003 2004 2005 2006 2007 2008 2009 2010 2011 2012
Net sales
579 590
641 642
671
640
621 605 578
549 535 525 523
11,787
12,558
13,343
14,103
14,348 14,725
15,014
15,384
15,625
15,971 16,259
16,815 17,144
10,000
11,000
12,000
13,000
14,000
15,000
16,000
17,000
18,000
300
400
500
600
700
800
900
1,000
2000 2001 2002 2003 2004 2005 2006 2007 2008 2009 2010 2011 2012
Companies Stores
Number of companies Number of stores
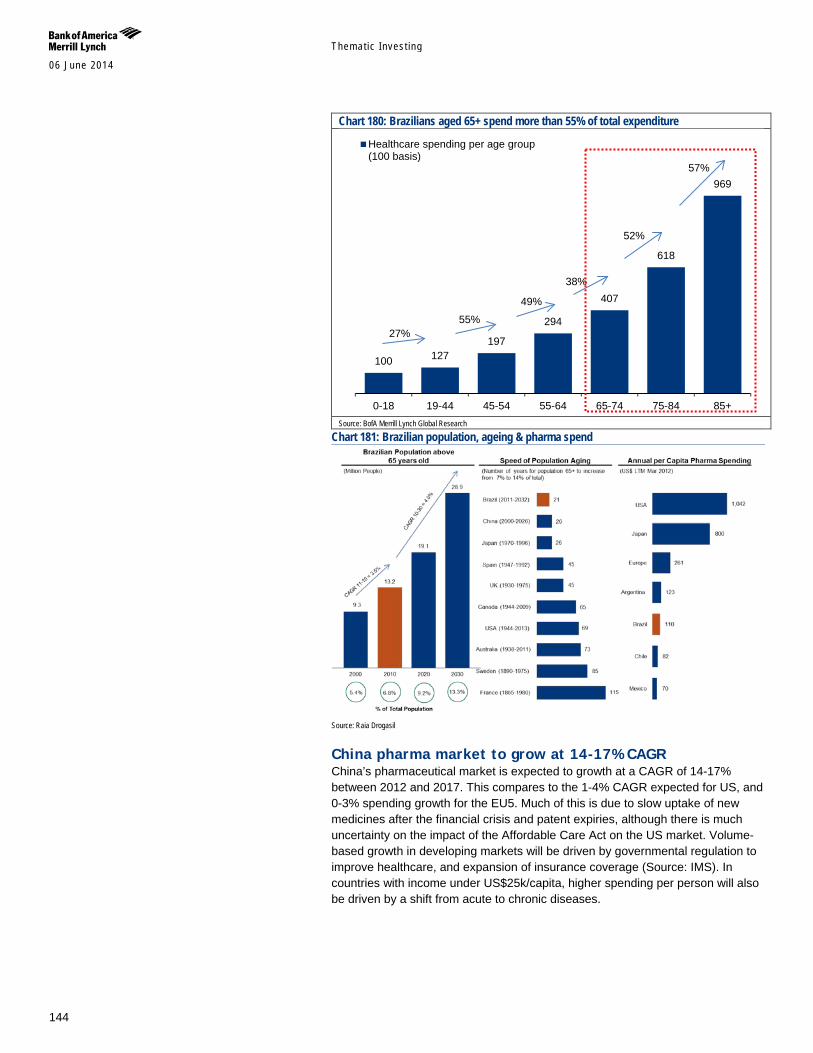
Themat ic Inves t ing 06 June 2014
144
Chart 180: Brazilians aged 65+ spend more than 55% of total expenditure
Source: BofA Merrill Lynch Global Research
Chart 181: Brazilian population, ageing & pharma spend
Source: Raia Drogasil
China pharma market to grow at 14-17% CAGR China’s pharmaceutical market is expected to growth at a CAGR of 14-17% between 2012 and 2017. This compares to the 1-4% CAGR expected for US, and 0-3% spending growth for the EU5. Much of this is due to slow uptake of new medicines after the financial crisis and patent expiries, although there is much uncertainty on the impact of the Affordable Care Act on the US market. Volume-based growth in developing markets will be driven by governmental regulation to improve healthcare, and expansion of insurance coverage (Source: IMS). In countries with income under US$25k/capita, higher spending per person will also be driven by a shift from acute to chronic diseases.
100 127 197
294
407
618
969
0-18 19-44 45-54 55-64 65-74 75-84 85+
Healthcare spending per age group(100 basis)
27% 55%
49%
38%
52%
57%
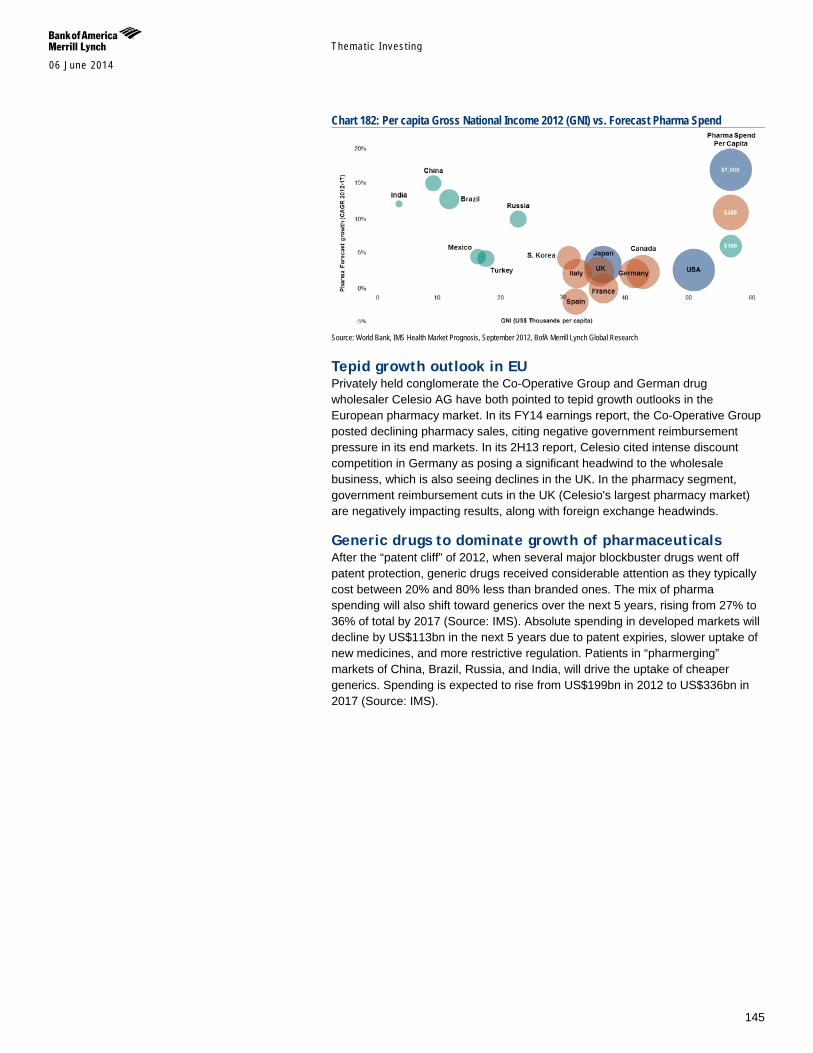
Themat ic Inves t ing 06 June 2014
145
Chart 182: Per capita Gross National Income 2012 (GNI) vs. Forecast Pharma Spend
Source: World Bank, IMS Health Market Prognosis, September 2012, BofA Merrill Lynch Global Research
Tepid growth outlook in EU Privately held conglomerate the Co-Operative Group and German drug wholesaler Celesio AG have both pointed to tepid growth outlooks in the European pharmacy market. In its FY14 earnings report, the Co-Operative Group posted declining pharmacy sales, citing negative government reimbursement pressure in its end markets. In its 2H13 report, Celesio cited intense discount competition in Germany as posing a significant headwind to the wholesale business, which is also seeing declines in the UK. In the pharmacy segment, government reimbursement cuts in the UK (Celesio's largest pharmacy market) are negatively impacting results, along with foreign exchange headwinds.
Generic drugs to dominate growth of pharmaceuticals After the “patent cliff” of 2012, when several major blockbuster drugs went off patent protection, generic drugs received considerable attention as they typically cost between 20% and 80% less than branded ones. The mix of pharma spending will also shift toward generics over the next 5 years, rising from 27% to 36% of total by 2017 (Source: IMS). Absolute spending in developed markets will decline by US$113bn in the next 5 years due to patent expiries, slower uptake of new medicines, and more restrictive regulation. Patients in “pharmerging” markets of China, Brazil, Russia, and India, will drive the uptake of cheaper generics. Spending is expected to rise from US$199bn in 2012 to US$336bn in 2017 (Source: IMS).
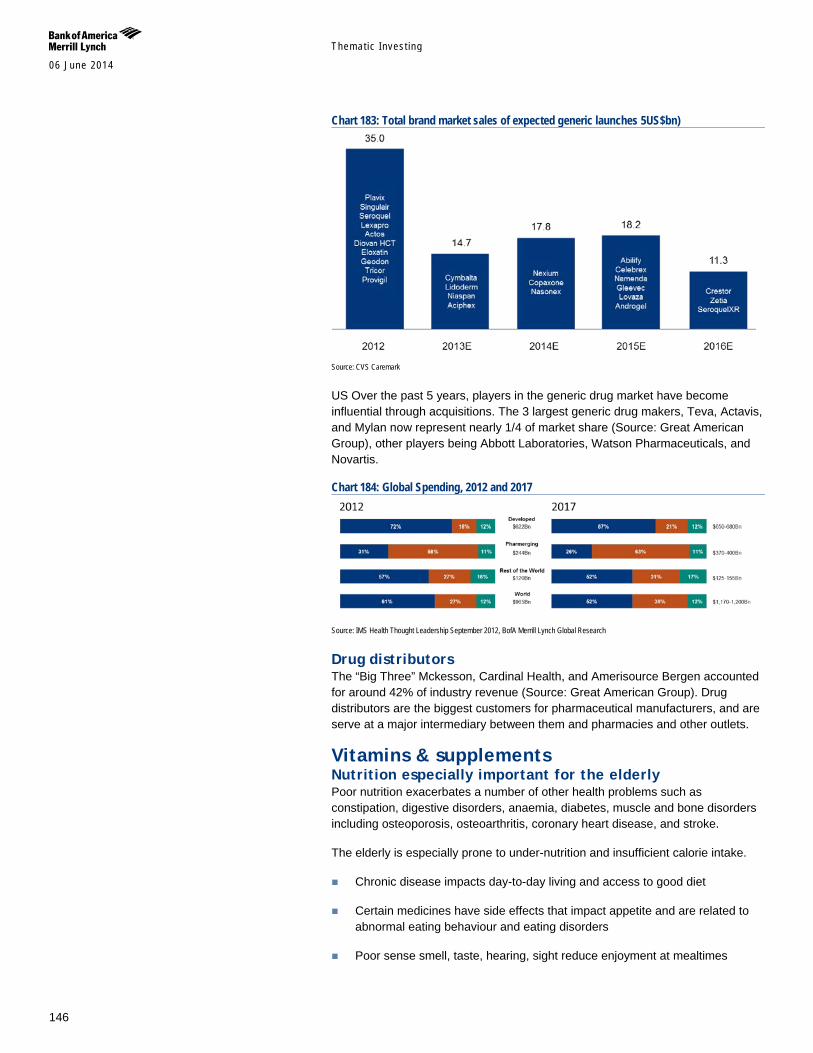
Themat ic Inves t ing 06 June 2014
146
Chart 183: Total brand market sales of expected generic launches 5US$bn)
Source: CVS Caremark
US Over the past 5 years, players in the generic drug market have become influential through acquisitions. The 3 largest generic drug makers, Teva, Actavis, and Mylan now represent nearly 1/4 of market share (Source: Great American Group), other players being Abbott Laboratories, Watson Pharmaceuticals, and Novartis.
Chart 184: Global Spending, 2012 and 2017
Source: IMS Health Thought Leadership September 2012, BofA Merrill Lynch Global Research
Drug distributors The “Big Three” Mckesson, Cardinal Health, and Amerisource Bergen accounted for around 42% of industry revenue (Source: Great American Group). Drug distributors are the biggest customers for pharmaceutical manufacturers, and are serve at a major intermediary between them and pharmacies and other outlets.
Vitamins & supplements Nutrition especially important for the elderly Poor nutrition exacerbates a number of other health problems such as constipation, digestive disorders, anaemia, diabetes, muscle and bone disorders including osteoporosis, osteoarthritis, coronary heart disease, and stroke.
The elderly is especially prone to under-nutrition and insufficient calorie intake.
Chronic disease impacts day-to-day living and access to good diet
Certain medicines have side effects that impact appetite and are related to abnormal eating behaviour and eating disorders
Poor sense smell, taste, hearing, sight reduce enjoyment at mealtimes
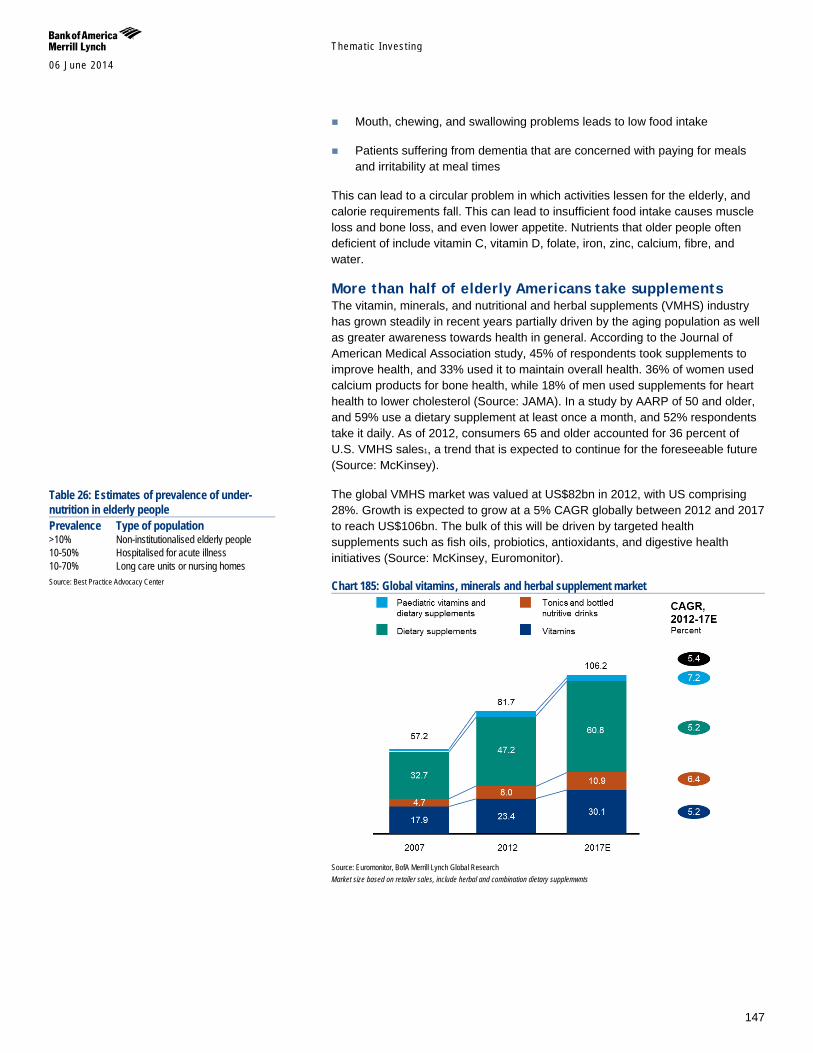
Themat ic Inves t ing 06 June 2014
147
Mouth, chewing, and swallowing problems leads to low food intake
Patients suffering from dementia that are concerned with paying for meals and irritability at meal times
This can lead to a circular problem in which activities lessen for the elderly, and calorie requirements fall. This can lead to insufficient food intake causes muscle loss and bone loss, and even lower appetite. Nutrients that older people often deficient of include vitamin C, vitamin D, folate, iron, zinc, calcium, fibre, and water.
More than half of elderly Americans take supplements The vitamin, minerals, and nutritional and herbal supplements (VMHS) industry has grown steadily in recent years partially driven by the aging population as well as greater awareness towards health in general. According to the Journal of American Medical Association study, 45% of respondents took supplements to improve health, and 33% used it to maintain overall health. 36% of women used calcium products for bone health, while 18% of men used supplements for heart health to lower cholesterol (Source: JAMA). In a study by AARP of 50 and older, and 59% use a dietary supplement at least once a month, and 52% respondents take it daily. As of 2012, consumers 65 and older accounted for 36 percent of U.S. VMHS sales1, a trend that is expected to continue for the foreseeable future (Source: McKinsey).
The global VMHS market was valued at US$82bn in 2012, with US comprising 28%. Growth is expected to grow at a 5% CAGR globally between 2012 and 2017 to reach US$106bn. The bulk of this will be driven by targeted health supplements such as fish oils, probiotics, antioxidants, and digestive health initiatives (Source: McKinsey, Euromonitor).
Chart 185: Global vitamins, minerals and herbal supplement market
Source: Euromonitor, BofA Merrill Lynch Global Research Market size based on retailer sales, include herbal and combination dietary supplemwnts
Table 26: Estimates of prevalence of under-nutrition in elderly people Prevalence Type of population >10% Non-institutionalised elderly people 10-50% Hospitalised for acute illness 10-70% Long care units or nursing homes Source: Best Practice Advocacy Center
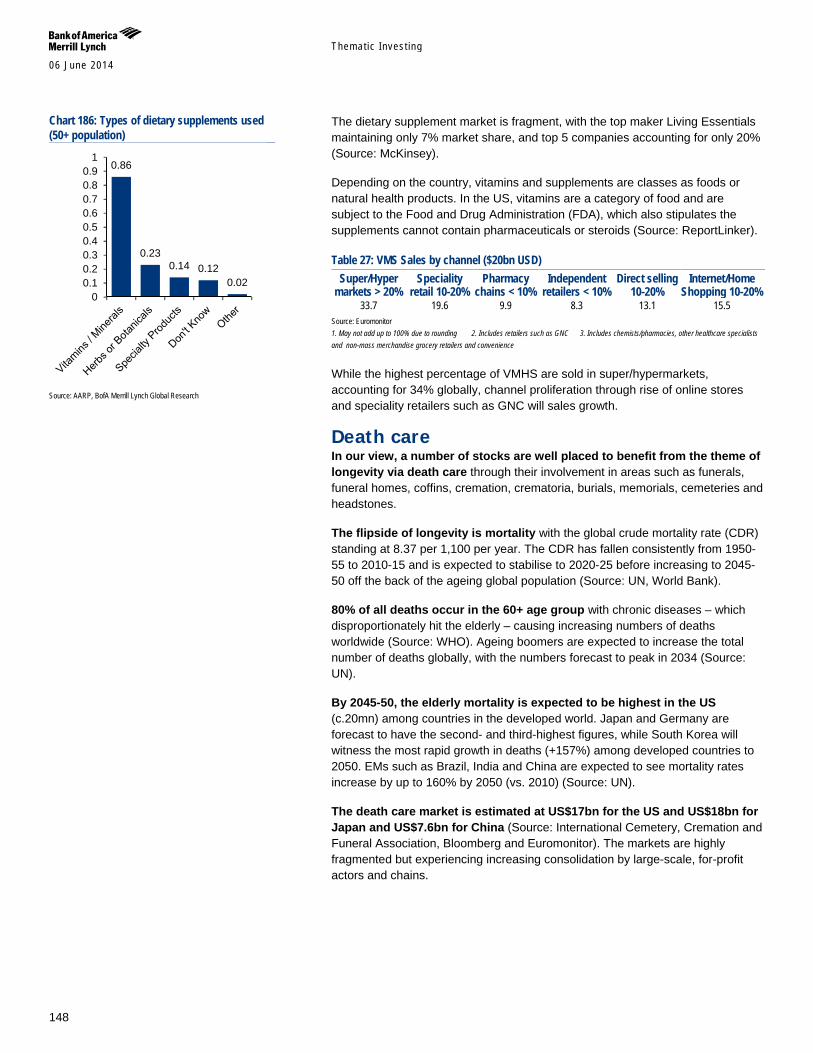
Themat ic Inves t ing 06 June 2014
148
The dietary supplement market is fragment, with the top maker Living Essentials maintaining only 7% market share, and top 5 companies accounting for only 20% (Source: McKinsey).
Depending on the country, vitamins and supplements are classes as foods or natural health products. In the US, vitamins are a category of food and are subject to the Food and Drug Administration (FDA), which also stipulates the supplements cannot contain pharmaceuticals or steroids (Source: ReportLinker).
Table 27: VMS Sales by channel ($20bn USD) Super/Hyper
markets > 20% Speciality
retail 10-20% Pharmacy
chains < 10% Independent
retailers < 10% Direct selling
10-20% Internet/Home
Shopping 10-20% 33.7 19.6 9.9 8.3 13.1 15.5
Source: Euromonitor 1. May not add up to 100% due to rounding 2. Includes retailers such as GNC 3. Includes chemists/pharmacies, other healthcare specialists and non-mass merchandise grocery retailers and convenience
While the highest percentage of VMHS are sold in super/hypermarkets, accounting for 34% globally, channel proliferation through rise of online stores and speciality retailers such as GNC will sales growth.
Death care In our view, a number of stocks are well placed to benefit from the theme of longevity via death care through their involvement in areas such as funerals, funeral homes, coffins, cremation, crematoria, burials, memorials, cemeteries and headstones.
The flipside of longevity is mortality with the global crude mortality rate (CDR) standing at 8.37 per 1,100 per year. The CDR has fallen consistently from 1950-55 to 2010-15 and is expected to stabilise to 2020-25 before increasing to 2045-50 off the back of the ageing global population (Source: UN, World Bank).
80% of all deaths occur in the 60+ age group with chronic diseases – which disproportionately hit the elderly – causing increasing numbers of deaths worldwide (Source: WHO). Ageing boomers are expected to increase the total number of deaths globally, with the numbers forecast to peak in 2034 (Source: UN).
By 2045-50, the elderly mortality is expected to be highest in the US (c.20mn) among countries in the developed world. Japan and Germany are forecast to have the second- and third-highest figures, while South Korea will witness the most rapid growth in deaths (+157%) among developed countries to 2050. EMs such as Brazil, India and China are expected to see mortality rates increase by up to 160% by 2050 (vs. 2010) (Source: UN).
The death care market is estimated at US$17bn for the US and US$18bn for Japan and US$7.6bn for China (Source: International Cemetery, Cremation and Funeral Association, Bloomberg and Euromonitor). The markets are highly fragmented but experiencing increasing consolidation by large-scale, for-profit actors and chains.
Chart 186: Types of dietary supplements used (50+ population)
Source: AARP, BofA Merrill Lynch Global Research
0.86
0.23 0.14 0.12
0.02 0
0.10.20.30.40.50.60.70.80.9
1
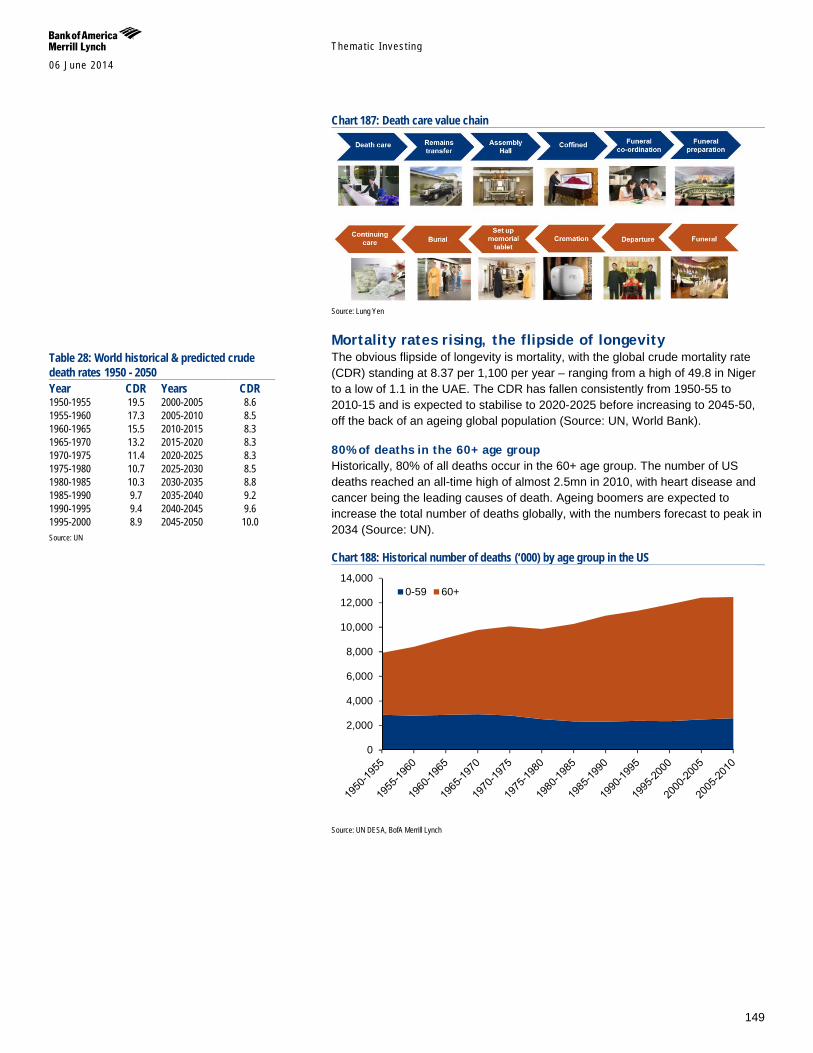
Themat ic Inves t ing 06 June 2014
149
Chart 187: Death care value chain
Source: Lung Yen
Mortality rates rising, the flipside of longevity The obvious flipside of longevity is mortality, with the global crude mortality rate (CDR) standing at 8.37 per 1,100 per year – ranging from a high of 49.8 in Niger to a low of 1.1 in the UAE. The CDR has fallen consistently from 1950-55 to 2010-15 and is expected to stabilise to 2020-2025 before increasing to 2045-50, off the back of an ageing global population (Source: UN, World Bank).
80% of deaths in the 60+ age group Historically, 80% of all deaths occur in the 60+ age group. The number of US deaths reached an all-time high of almost 2.5mn in 2010, with heart disease and cancer being the leading causes of death. Ageing boomers are expected to increase the total number of deaths globally, with the numbers forecast to peak in 2034 (Source: UN).
Chart 188: Historical number of deaths (‘000) by age group in the US
Source: UN DESA, BofA Merrill Lynch
0
2,000
4,000
6,000
8,000
10,000
12,000
14,0000-59 60+
Table 28: World historical & predicted crude death rates 1950 - 2050 Year CDR Years CDR 1950-1955 19.5 2000-2005 8.6 1955-1960 17.3 2005-2010 8.5 1960-1965 15.5 2010-2015 8.3 1965-1970 13.2 2015-2020 8.3 1970-1975 11.4 2020-2025 8.3 1975-1980 10.7 2025-2030 8.5 1980-1985 10.3 2030-2035 8.8 1985-1990 9.7 2035-2040 9.2 1990-1995 9.4 2040-2045 9.6 1995-2000 8.9 2045-2050 10.0 Source: UN
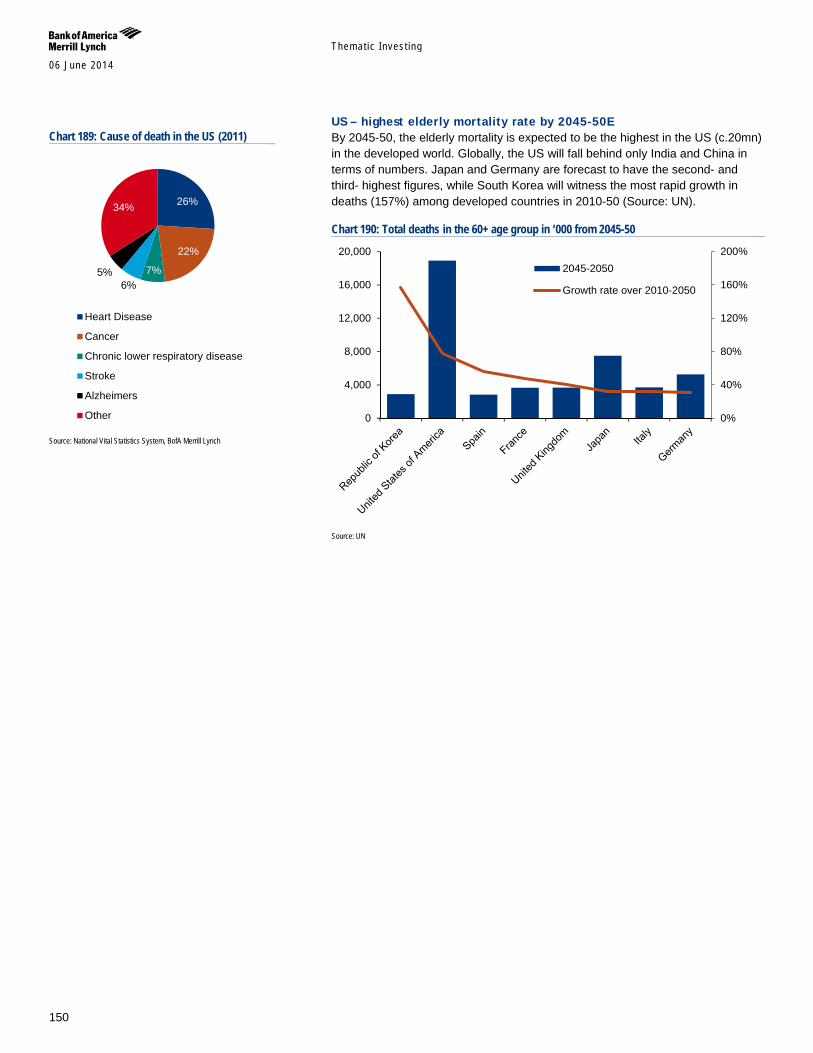
Themat ic Inves t ing 06 June 2014
150
US – highest elderly mortality rate by 2045-50E By 2045-50, the elderly mortality is expected to be the highest in the US (c.20mn) in the developed world. Globally, the US will fall behind only India and China in terms of numbers. Japan and Germany are forecast to have the second- and third- highest figures, while South Korea will witness the most rapid growth in deaths (157%) among developed countries in 2010-50 (Source: UN).
Chart 190: Total deaths in the 60+ age group in ‘000 from 2045-50
Source: UN
0%
40%
80%
120%
160%
200%
0
4,000
8,000
12,000
16,000
20,0002045-2050
Growth rate over 2010-2050
Chart 189: Cause of death in the US (2011)
Source: National Vital Statistics System, BofA Merrill Lynch
26%
22%
7% 6%
5%
34%
Heart Disease
Cancer
Chronic lower respiratory disease
Stroke
Alzheimers
Other
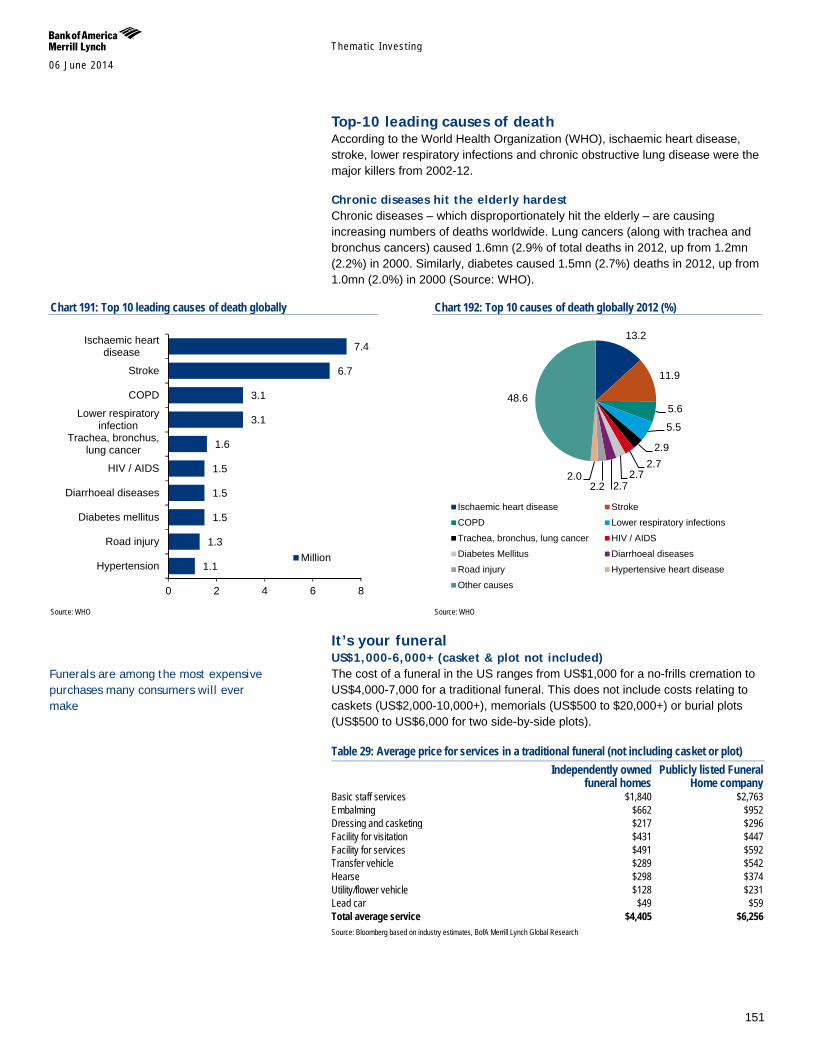
Themat ic Inves t ing 06 June 2014
151
Top-10 leading causes of death According to the World Health Organization (WHO), ischaemic heart disease, stroke, lower respiratory infections and chronic obstructive lung disease were the major killers from 2002-12.
Chronic diseases hit the elderly hardest Chronic diseases – which disproportionately hit the elderly – are causing increasing numbers of deaths worldwide. Lung cancers (along with trachea and bronchus cancers) caused 1.6mn (2.9% of total deaths in 2012, up from 1.2mn (2.2%) in 2000. Similarly, diabetes caused 1.5mn (2.7%) deaths in 2012, up from 1.0mn (2.0%) in 2000 (Source: WHO).
Chart 191: Top 10 leading causes of death globally
Source: WHO
Chart 192: Top 10 causes of death globally 2012 (%)
Source: WHO
It’s your funeral US$1,000-6,000+ (casket & plot not included) The cost of a funeral in the US ranges from US$1,000 for a no-frills cremation to US$4,000-7,000 for a traditional funeral. This does not include costs relating to caskets (US$2,000-10,000+), memorials (US$500 to $20,000+) or burial plots (US$500 to US$6,000 for two side-by-side plots).
Table 29: Average price for services in a traditional funeral (not including casket or plot)
Independently owned
funeral homes Publicly listed Funeral
Home company Basic staff services $1,840 $2,763 Embalming $662 $952 Dressing and casketing $217 $296 Facility for visitation $431 $447 Facility for services $491 $592 Transfer vehicle $289 $542 Hearse $298 $374 Utility/flower vehicle $128 $231 Lead car $49 $59 Total average service $4,405 $6,256 Source: Bloomberg based on industry estimates, BofA Merrill Lynch Global Research
1.1
1.3
1.5
1.5
1.5
1.6
3.1
3.1
6.7
7.4
0 2 4 6 8
Hypertension
Road injury
Diabetes mellitus
Diarrhoeal diseases
HIV / AIDS
Trachea, bronchus,lung cancer
Lower respiratoryinfection
COPD
Stroke
Ischaemic heartdisease
Million
13.2
11.9
5.6
5.5
2.9 2.7
2.7 2.7 2.2
2.0
48.6
Ischaemic heart disease Stroke
COPD Lower respiratory infections
Trachea, bronchus, lung cancer HIV / AIDS
Diabetes Mellitus Diarrhoeal diseases
Road injury Hypertensive heart disease
Other causes
Funerals are among the most expensive purchases many consumers will ever make
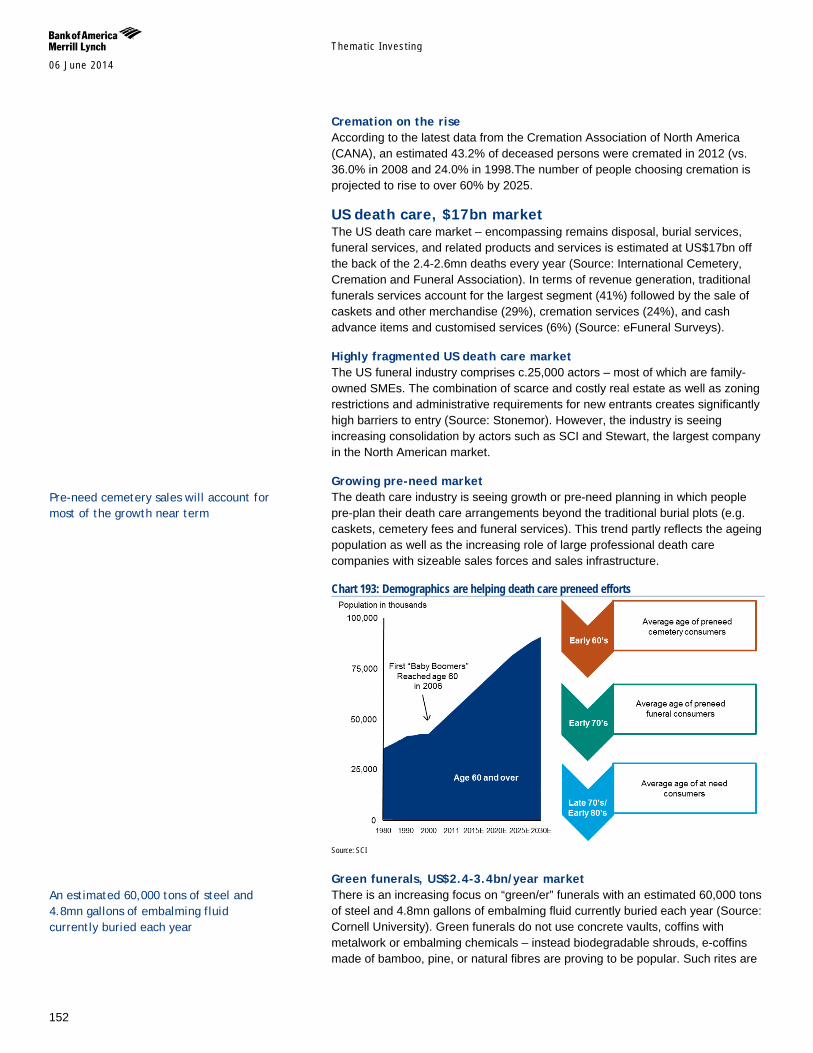
Themat ic Inves t ing 06 June 2014
152
Cremation on the rise According to the latest data from the Cremation Association of North America (CANA), an estimated 43.2% of deceased persons were cremated in 2012 (vs. 36.0% in 2008 and 24.0% in 1998.The number of people choosing cremation is projected to rise to over 60% by 2025.
US death care, $17bn market The US death care market – encompassing remains disposal, burial services, funeral services, and related products and services is estimated at US$17bn off the back of the 2.4-2.6mn deaths every year (Source: International Cemetery, Cremation and Funeral Association). In terms of revenue generation, traditional funerals services account for the largest segment (41%) followed by the sale of caskets and other merchandise (29%), cremation services (24%), and cash advance items and customised services (6%) (Source: eFuneral Surveys).
Highly fragmented US death care market The US funeral industry comprises c.25,000 actors – most of which are family-owned SMEs. The combination of scarce and costly real estate as well as zoning restrictions and administrative requirements for new entrants creates significantly high barriers to entry (Source: Stonemor). However, the industry is seeing increasing consolidation by actors such as SCI and Stewart, the largest company in the North American market.
Growing pre-need market The death care industry is seeing growth or pre-need planning in which people pre-plan their death care arrangements beyond the traditional burial plots (e.g. caskets, cemetery fees and funeral services). This trend partly reflects the ageing population as well as the increasing role of large professional death care companies with sizeable sales forces and sales infrastructure.
Chart 193: Demographics are helping death care preneed efforts
Source: SCI
Green funerals, US$2.4-3.4bn/year market There is an increasing focus on “green/er” funerals with an estimated 60,000 tons of steel and 4.8mn gallons of embalming fluid currently buried each year (Source: Cornell University). Green funerals do not use concrete vaults, coffins with metalwork or embalming chemicals – instead biodegradable shrouds, e-coffins made of bamboo, pine, or natural fibres are proving to be popular. Such rites are
An estimated 60,000 tons of steel and 4.8mn gallons of embalming fluid currently buried each year
Pre-need cemetery sales will account for most of the growth near term
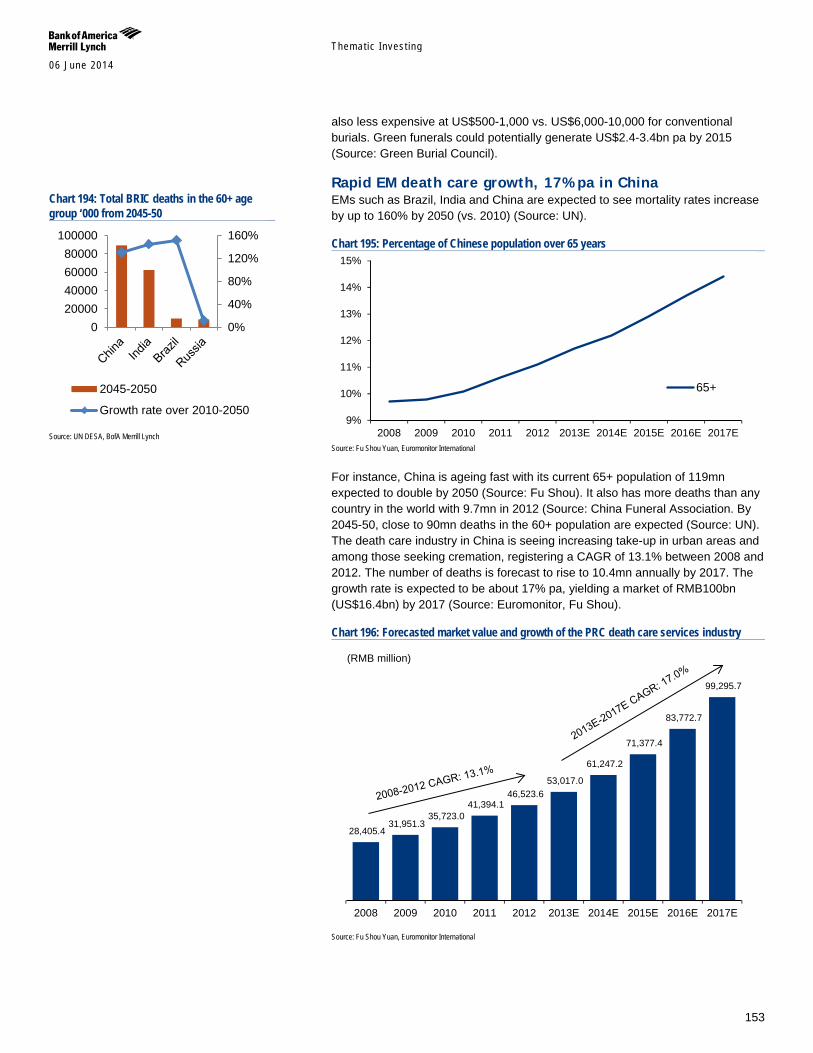
Themat ic Inves t ing 06 June 2014
153
also less expensive at US$500-1,000 vs. US$6,000-10,000 for conventional burials. Green funerals could potentially generate US$2.4-3.4bn pa by 2015 (Source: Green Burial Council).
Rapid EM death care growth, 17% pa in China EMs such as Brazil, India and China are expected to see mortality rates increase by up to 160% by 2050 (vs. 2010) (Source: UN).
Chart 195: Percentage of Chinese population over 65 years
Source: Fu Shou Yuan, Euromonitor International
For instance, China is ageing fast with its current 65+ population of 119mn expected to double by 2050 (Source: Fu Shou). It also has more deaths than any country in the world with 9.7mn in 2012 (Source: China Funeral Association. By 2045-50, close to 90mn deaths in the 60+ population are expected (Source: UN). The death care industry in China is seeing increasing take-up in urban areas and among those seeking cremation, registering a CAGR of 13.1% between 2008 and 2012. The number of deaths is forecast to rise to 10.4mn annually by 2017. The growth rate is expected to be about 17% pa, yielding a market of RMB100bn (US$16.4bn) by 2017 (Source: Euromonitor, Fu Shou).
Chart 196: Forecasted market value and growth of the PRC death care services industry
Source: Fu Shou Yuan, Euromonitor International
9%
10%
11%
12%
13%
14%
15%
2008 2009 2010 2011 2012 2013E 2014E 2015E 2016E 2017E
65+
28,405.4 31,951.3
35,723.0 41,394.1
46,523.6 53,017.0
61,247.2
71,377.4
83,772.7
99,295.7
2008 2009 2010 2011 2012 2013E 2014E 2015E 2016E 2017E
(RMB million)
Chart 194: Total BRIC deaths in the 60+ age group ‘000 from 2045-50
Source: UN DESA, BofA Merrill Lynch
020000400006000080000
100000
0%
40%
80%
120%
160%
2045-2050
Growth rate over 2010-2050
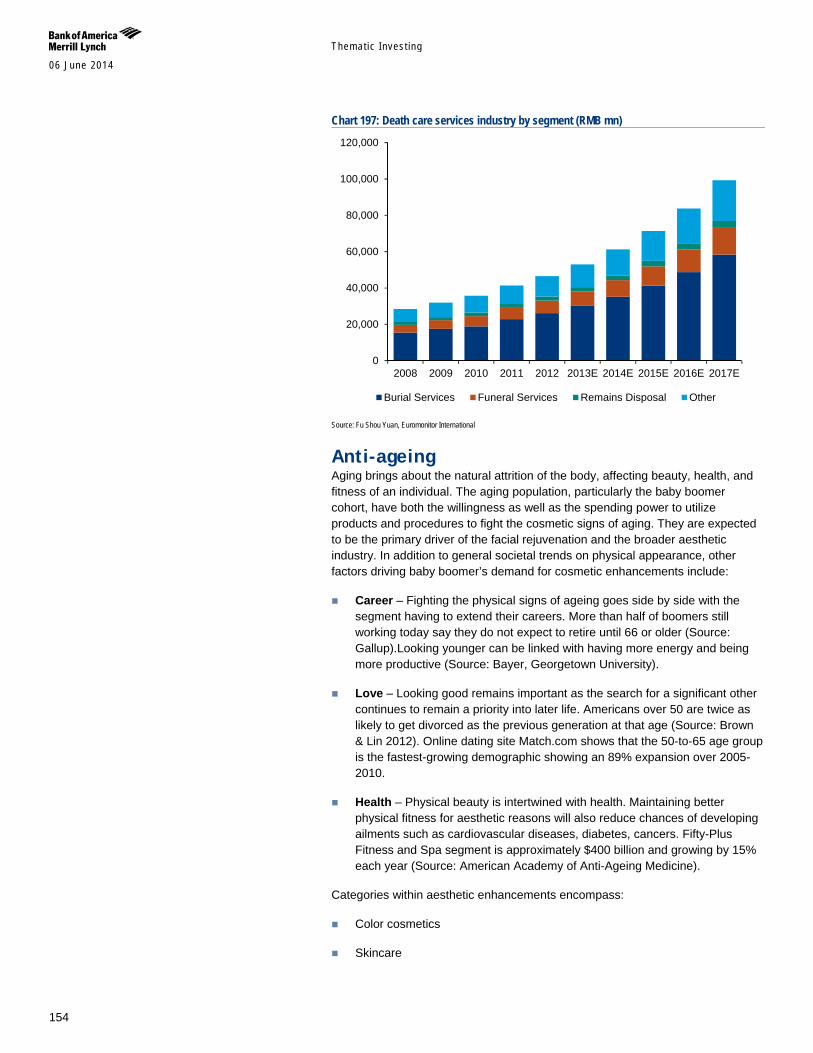
Themat ic Inves t ing 06 June 2014
154
Chart 197: Death care services industry by segment (RMB mn)
Source: Fu Shou Yuan, Euromonitor International
Anti-ageing Aging brings about the natural attrition of the body, affecting beauty, health, and fitness of an individual. The aging population, particularly the baby boomer cohort, have both the willingness as well as the spending power to utilize products and procedures to fight the cosmetic signs of aging. They are expected to be the primary driver of the facial rejuvenation and the broader aesthetic industry. In addition to general societal trends on physical appearance, other factors driving baby boomer’s demand for cosmetic enhancements include:
Career – Fighting the physical signs of ageing goes side by side with the segment having to extend their careers. More than half of boomers still working today say they do not expect to retire until 66 or older (Source: Gallup).Looking younger can be linked with having more energy and being more productive (Source: Bayer, Georgetown University).
Love – Looking good remains important as the search for a significant other continues to remain a priority into later life. Americans over 50 are twice as likely to get divorced as the previous generation at that age (Source: Brown & Lin 2012). Online dating site Match.com shows that the 50-to-65 age group is the fastest-growing demographic showing an 89% expansion over 2005-2010.
Health – Physical beauty is intertwined with health. Maintaining better physical fitness for aesthetic reasons will also reduce chances of developing ailments such as cardiovascular diseases, diabetes, cancers. Fifty-Plus Fitness and Spa segment is approximately $400 billion and growing by 15% each year (Source: American Academy of Anti-Ageing Medicine).
Categories within aesthetic enhancements encompass:
Color cosmetics
Skincare
0
20,000
40,000
60,000
80,000
100,000
120,000
2008 2009 2010 2011 2012 2013E 2014E 2015E 2016E 2017E
Burial Services Funeral Services Remains Disposal Other
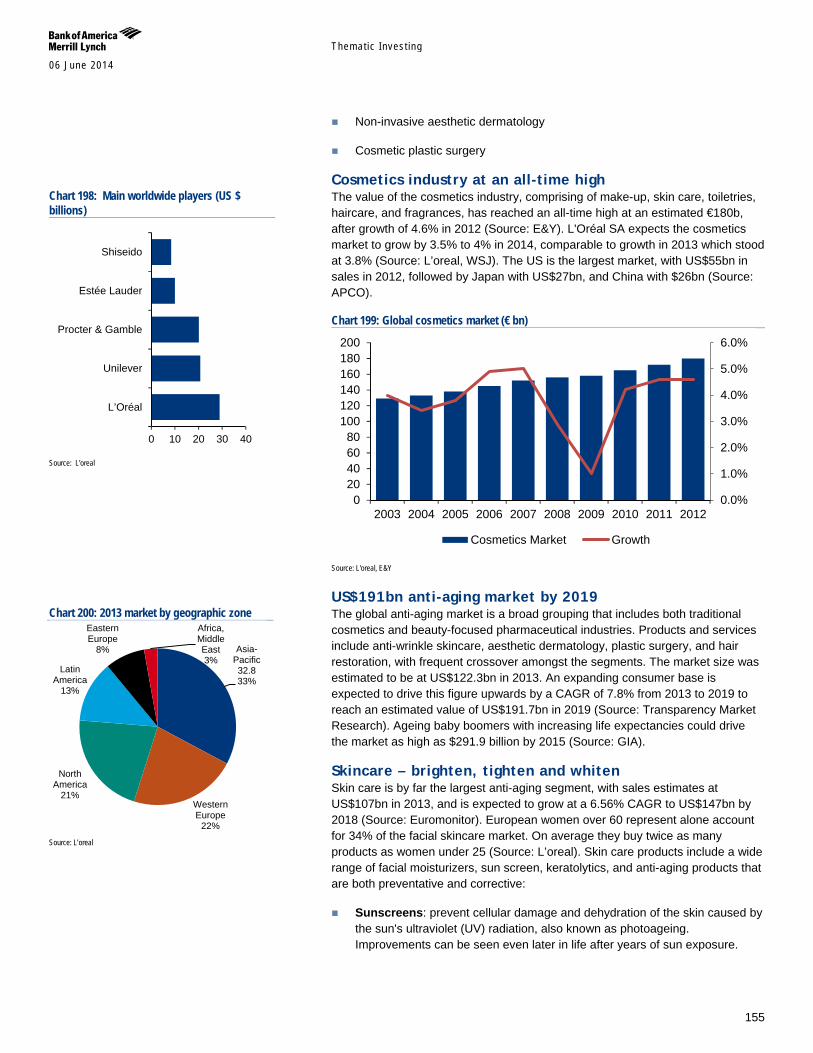
Themat ic Inves t ing 06 June 2014
155
Non-invasive aesthetic dermatology
Cosmetic plastic surgery
Cosmetics industry at an all-time high The value of the cosmetics industry, comprising of make-up, skin care, toiletries, haircare, and fragrances, has reached an all-time high at an estimated €180b, after growth of 4.6% in 2012 (Source: E&Y). L'Oréal SA expects the cosmetics market to grow by 3.5% to 4% in 2014, comparable to growth in 2013 which stood at 3.8% (Source: L’oreal, WSJ). The US is the largest market, with US$55bn in sales in 2012, followed by Japan with US$27bn, and China with $26bn (Source: APCO).
Chart 199: Global cosmetics market (€ bn)
Source: L'oreal, E&Y
US$191bn anti-aging market by 2019 The global anti-aging market is a broad grouping that includes both traditional cosmetics and beauty-focused pharmaceutical industries. Products and services include anti-wrinkle skincare, aesthetic dermatology, plastic surgery, and hair restoration, with frequent crossover amongst the segments. The market size was estimated to be at US$122.3bn in 2013. An expanding consumer base is expected to drive this figure upwards by a CAGR of 7.8% from 2013 to 2019 to reach an estimated value of US$191.7bn in 2019 (Source: Transparency Market Research). Ageing baby boomers with increasing life expectancies could drive the market as high as $291.9 billion by 2015 (Source: GIA).
Skincare – brighten, tighten and whiten Skin care is by far the largest anti-aging segment, with sales estimates at US$107bn in 2013, and is expected to grow at a 6.56% CAGR to US$147bn by 2018 (Source: Euromonitor). European women over 60 represent alone account for 34% of the facial skincare market. On average they buy twice as many products as women under 25 (Source: L’oreal). Skin care products include a wide range of facial moisturizers, sun screen, keratolytics, and anti-aging products that are both preventative and corrective:
Sunscreens: prevent cellular damage and dehydration of the skin caused by the sun's ultraviolet (UV) radiation, also known as photoageing. Improvements can be seen even later in life after years of sun exposure.
0.0%
1.0%
2.0%
3.0%
4.0%
5.0%
6.0%
020406080
100120140160180200
2003 2004 2005 2006 2007 2008 2009 2010 2011 2012
Cosmetics Market Growth
Chart 198: Main worldwide players (US $ billions)
Source: L'oreal
Chart 200: 2013 market by geographic zone
Source: L’oreal
0 10 20 30 40
L’Oréal
Unilever
Procter & Gamble
Estée Lauder
Shiseido
Asia-Pacific 32.8 33%
Western Europe
22%
North America
21%
Latin America
13%
Eastern Europe
8%
Africa, Middle East 3%
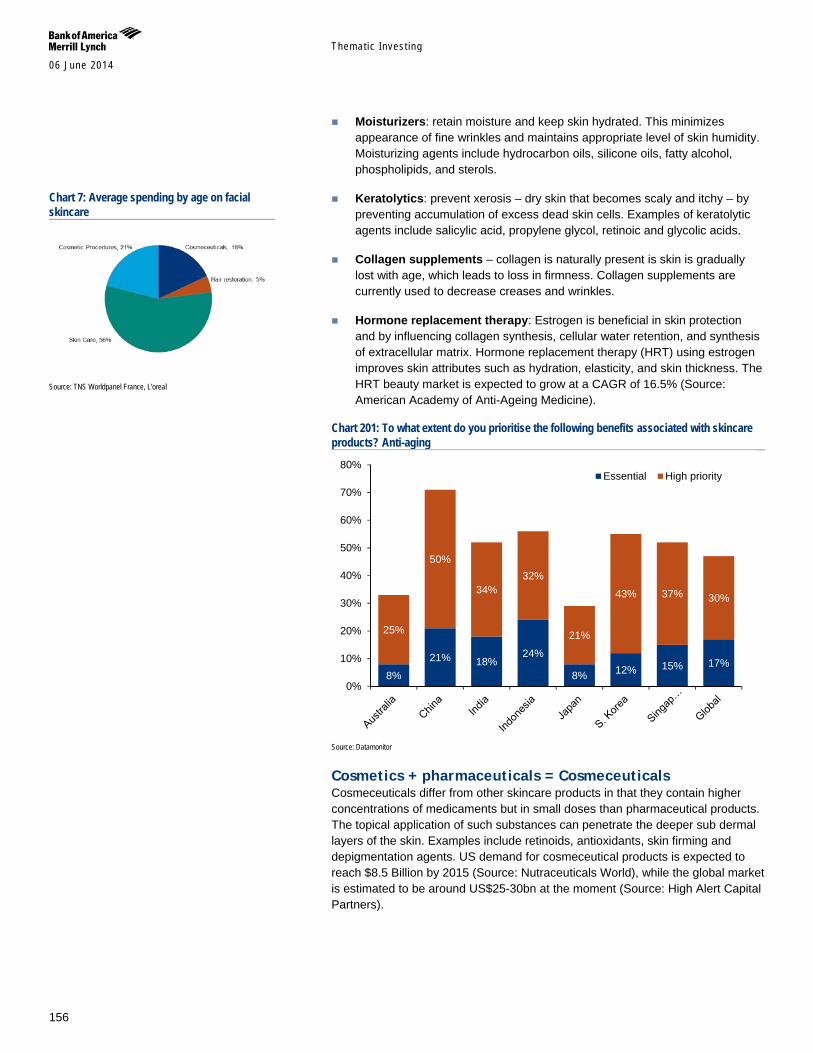
Themat ic Inves t ing 06 June 2014
156
Moisturizers: retain moisture and keep skin hydrated. This minimizes appearance of fine wrinkles and maintains appropriate level of skin humidity. Moisturizing agents include hydrocarbon oils, silicone oils, fatty alcohol, phospholipids, and sterols.
Keratolytics: prevent xerosis – dry skin that becomes scaly and itchy – by preventing accumulation of excess dead skin cells. Examples of keratolytic agents include salicylic acid, propylene glycol, retinoic and glycolic acids.
Collagen supplements – collagen is naturally present is skin is gradually lost with age, which leads to loss in firmness. Collagen supplements are currently used to decrease creases and wrinkles.
Hormone replacement therapy: Estrogen is beneficial in skin protection and by influencing collagen synthesis, cellular water retention, and synthesis of extracellular matrix. Hormone replacement therapy (HRT) using estrogen improves skin attributes such as hydration, elasticity, and skin thickness. The HRT beauty market is expected to grow at a CAGR of 16.5% (Source: American Academy of Anti-Ageing Medicine).
Chart 201: To what extent do you prioritise the following benefits associated with skincare products? Anti-aging
Source: Datamonitor
Cosmetics + pharmaceuticals = Cosmeceuticals Cosmeceuticals differ from other skincare products in that they contain higher concentrations of medicaments but in small doses than pharmaceutical products. The topical application of such substances can penetrate the deeper sub dermal layers of the skin. Examples include retinoids, antioxidants, skin firming and depigmentation agents. US demand for cosmeceutical products is expected to reach $8.5 Billion by 2015 (Source: Nutraceuticals World), while the global market is estimated to be around US$25-30bn at the moment (Source: High Alert Capital Partners).
8%
21% 18% 24%
8% 12% 15% 17%
25%
50%
34% 32%
21%
43% 37% 30%
0%
10%
20%
30%
40%
50%
60%
70%
80%Essential High priority
Chart 7: Average spending by age on facial skincare
Source: TNS Worldpanel France, L'oreal
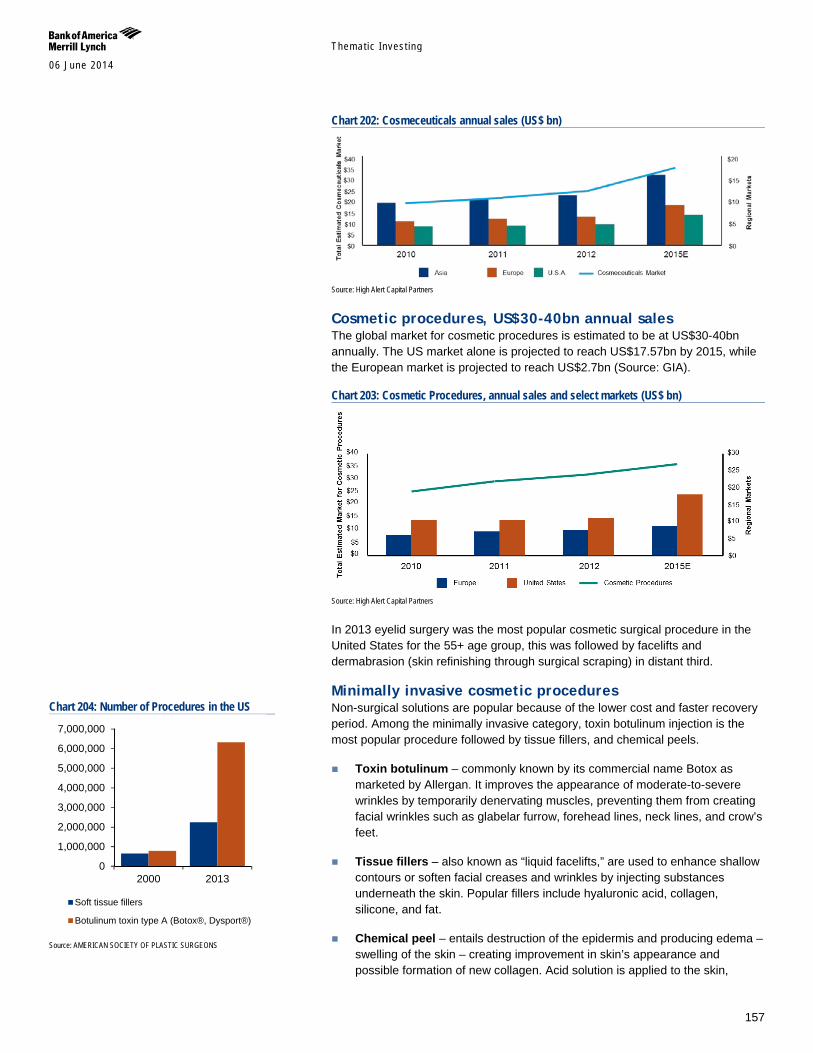
Themat ic Inves t ing 06 June 2014
157
Chart 202: Cosmeceuticals annual sales (US$ bn)
Source: High Alert Capital Partners
Cosmetic procedures, US$30-40bn annual sales The global market for cosmetic procedures is estimated to be at US$30-40bn annually. The US market alone is projected to reach US$17.57bn by 2015, while the European market is projected to reach US$2.7bn (Source: GIA).
Chart 203: Cosmetic Procedures, annual sales and select markets (US$ bn)
Source: High Alert Capital Partners
In 2013 eyelid surgery was the most popular cosmetic surgical procedure in the United States for the 55+ age group, this was followed by facelifts and dermabrasion (skin refinishing through surgical scraping) in distant third.
Minimally invasive cosmetic procedures Non-surgical solutions are popular because of the lower cost and faster recovery period. Among the minimally invasive category, toxin botulinum injection is the most popular procedure followed by tissue fillers, and chemical peels.
Toxin botulinum – commonly known by its commercial name Botox as marketed by Allergan. It improves the appearance of moderate-to-severe wrinkles by temporarily denervating muscles, preventing them from creating facial wrinkles such as glabelar furrow, forehead lines, neck lines, and crow’s feet.
Tissue fillers – also known as “liquid facelifts,” are used to enhance shallow contours or soften facial creases and wrinkles by injecting substances underneath the skin. Popular fillers include hyaluronic acid, collagen, silicone, and fat.
Chemical peel – entails destruction of the epidermis and producing edema – swelling of the skin – creating improvement in skin’s appearance and possible formation of new collagen. Acid solution is applied to the skin,
Chart 204: Number of Procedures in the US
Source: AMERICAN SOCIETY OF PLASTIC SURGEONS
0
1,000,000
2,000,000
3,000,000
4,000,000
5,000,000
6,000,000
7,000,000
2000 2013
Soft tissue fillers
Botulinum toxin type A (Botox®, Dysport®)
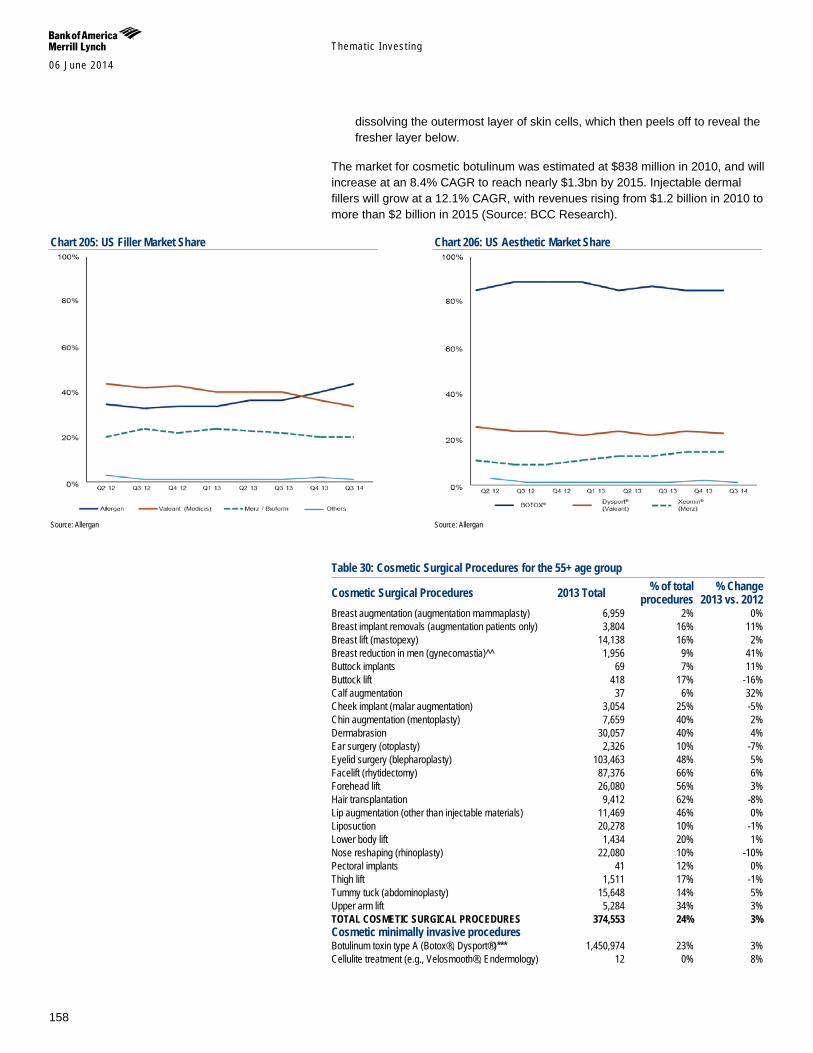
Themat ic Inves t ing 06 June 2014
158
dissolving the outermost layer of skin cells, which then peels off to reveal the fresher layer below.
The market for cosmetic botulinum was estimated at $838 million in 2010, and will increase at an 8.4% CAGR to reach nearly $1.3bn by 2015. Injectable dermal fillers will grow at a 12.1% CAGR, with revenues rising from $1.2 billion in 2010 to more than $2 billion in 2015 (Source: BCC Research).
Chart 205: US Filler Market Share
Source: Allergan
Chart 206: US Aesthetic Market Share
Source: Allergan
Table 30: Cosmetic Surgical Procedures for the 55+ age group
Cosmetic Surgical Procedures 2013 Total % of total procedures
% Change 2013 vs. 2012
Breast augmentation (augmentation mammaplasty) 6,959 2% 0% Breast implant removals (augmentation patients only) 3,804 16% 11% Breast lift (mastopexy) 14,138 16% 2% Breast reduction in men (gynecomastia)^^ 1,956 9% 41% Buttock implants 69 7% 11% Buttock lift 418 17% -16% Calf augmentation 37 6% 32% Cheek implant (malar augmentation) 3,054 25% -5% Chin augmentation (mentoplasty) 7,659 40% 2% Dermabrasion 30,057 40% 4% Ear surgery (otoplasty) 2,326 10% -7% Eyelid surgery (blepharoplasty) 103,463 48% 5% Facelift (rhytidectomy) 87,376 66% 6% Forehead lift 26,080 56% 3% Hair transplantation 9,412 62% -8% Lip augmentation (other than injectable materials) 11,469 46% 0% Liposuction 20,278 10% -1% Lower body lift 1,434 20% 1% Nose reshaping (rhinoplasty) 22,080 10% -10% Pectoral implants 41 12% 0% Thigh lift 1,511 17% -1% Tummy tuck (abdominoplasty) 15,648 14% 5% Upper arm lift 5,284 34% 3% TOTAL COSMETIC SURGICAL PROCEDURES 374,553 24% 3% Cosmetic minimally invasive procedures Botulinum toxin type A (Botox®, Dysport®)*** 1,450,974 23% 3% Cellulite treatment (e.g., Velosmooth®, Endermology) 12 0% 8%
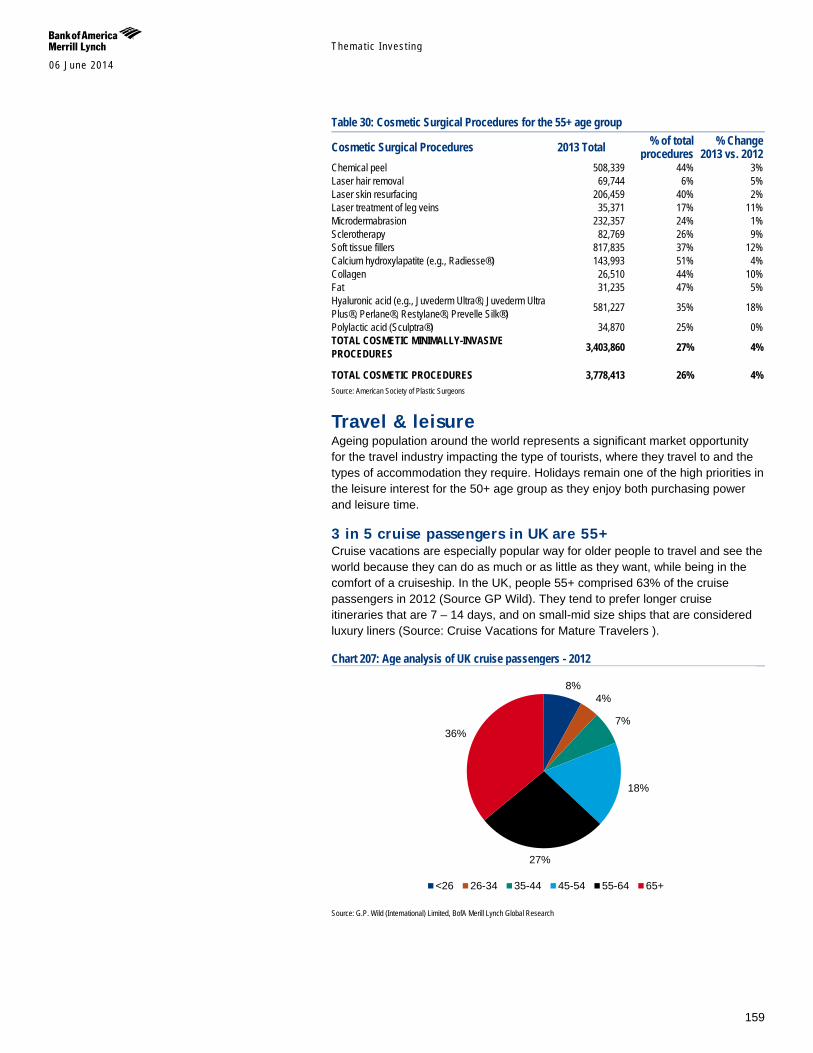
Themat ic Inves t ing 06 June 2014
159
Table 30: Cosmetic Surgical Procedures for the 55+ age group
Cosmetic Surgical Procedures 2013 Total % of total procedures
% Change 2013 vs. 2012
Chemical peel 508,339 44% 3% Laser hair removal 69,744 6% 5% Laser skin resurfacing 206,459 40% 2% Laser treatment of leg veins 35,371 17% 11% Microdermabrasion 232,357 24% 1% Sclerotherapy 82,769 26% 9% Soft tissue fillers 817,835 37% 12% Calcium hydroxylapatite (e.g., Radiesse®) 143,993 51% 4% Collagen 26,510 44% 10% Fat 31,235 47% 5% Hyaluronic acid (e.g., Juvederm Ultra®, Juvederm Ultra Plus®, Perlane®, Restylane®, Prevelle Silk®) 581,227 35% 18%
Polylactic acid (Sculptra®) 34,870 25% 0% TOTAL COSMETIC MINIMALLY-INVASIVE PROCEDURES 3,403,860 27% 4% TOTAL COSMETIC PROCEDURES 3,778,413 26% 4% Source: American Society of Plastic Surgeons
Travel & leisure Ageing population around the world represents a significant market opportunity for the travel industry impacting the type of tourists, where they travel to and the types of accommodation they require. Holidays remain one of the high priorities in the leisure interest for the 50+ age group as they enjoy both purchasing power and leisure time.
3 in 5 cruise passengers in UK are 55+ Cruise vacations are especially popular way for older people to travel and see the world because they can do as much or as little as they want, while being in the comfort of a cruiseship. In the UK, people 55+ comprised 63% of the cruise passengers in 2012 (Source GP Wild). They tend to prefer longer cruise itineraries that are 7 – 14 days, and on small-mid size ships that are considered luxury liners (Source: Cruise Vacations for Mature Travelers ).
Chart 207: Age analysis of UK cruise passengers - 2012
Source: G.P. Wild (International) Limited, BofA Merill Lynch Global Research
8% 4%
7%
18%
27%
36%
<26 26-34 35-44 45-54 55-64 65+
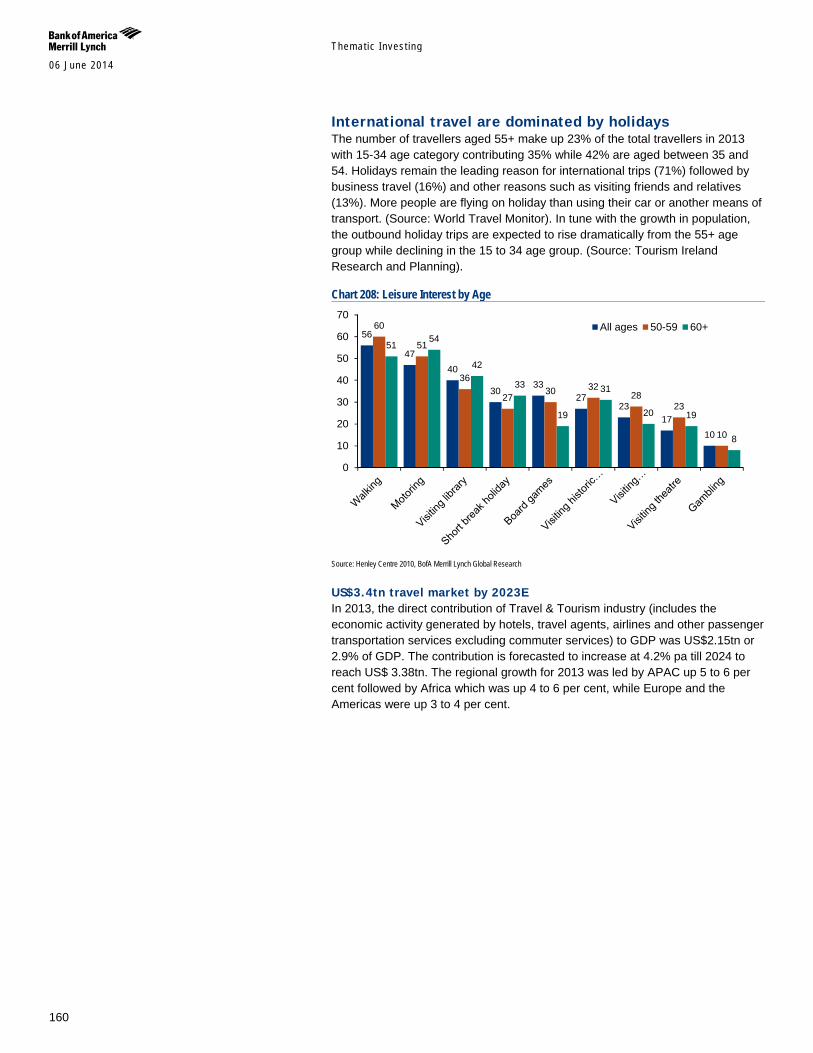
Themat ic Inves t ing 06 June 2014
160
International travel are dominated by holidays The number of travellers aged 55+ make up 23% of the total travellers in 2013 with 15-34 age category contributing 35% while 42% are aged between 35 and 54. Holidays remain the leading reason for international trips (71%) followed by business travel (16%) and other reasons such as visiting friends and relatives (13%). More people are flying on holiday than using their car or another means of transport. (Source: World Travel Monitor). In tune with the growth in population, the outbound holiday trips are expected to rise dramatically from the 55+ age group while declining in the 15 to 34 age group. (Source: Tourism Ireland Research and Planning).
Chart 208: Leisure Interest by Age
Source: Henley Centre 2010, BofA Merrill Lynch Global Research
US$3.4tn travel market by 2023E In 2013, the direct contribution of Travel & Tourism industry (includes the economic activity generated by hotels, travel agents, airlines and other passenger transportation services excluding commuter services) to GDP was US$2.15tn or 2.9% of GDP. The contribution is forecasted to increase at 4.2% pa till 2024 to reach US$ 3.38tn. The regional growth for 2013 was led by APAC up 5 to 6 per cent followed by Africa which was up 4 to 6 per cent, while Europe and the Americas were up 3 to 4 per cent.
56
47 40
30 33
27 23
17 10
60
51
36
27 30 32
28 23
10
51 54
42
33
19
31
20 19
8
0
10
20
30
40
50
60
70All ages 50-59 60+
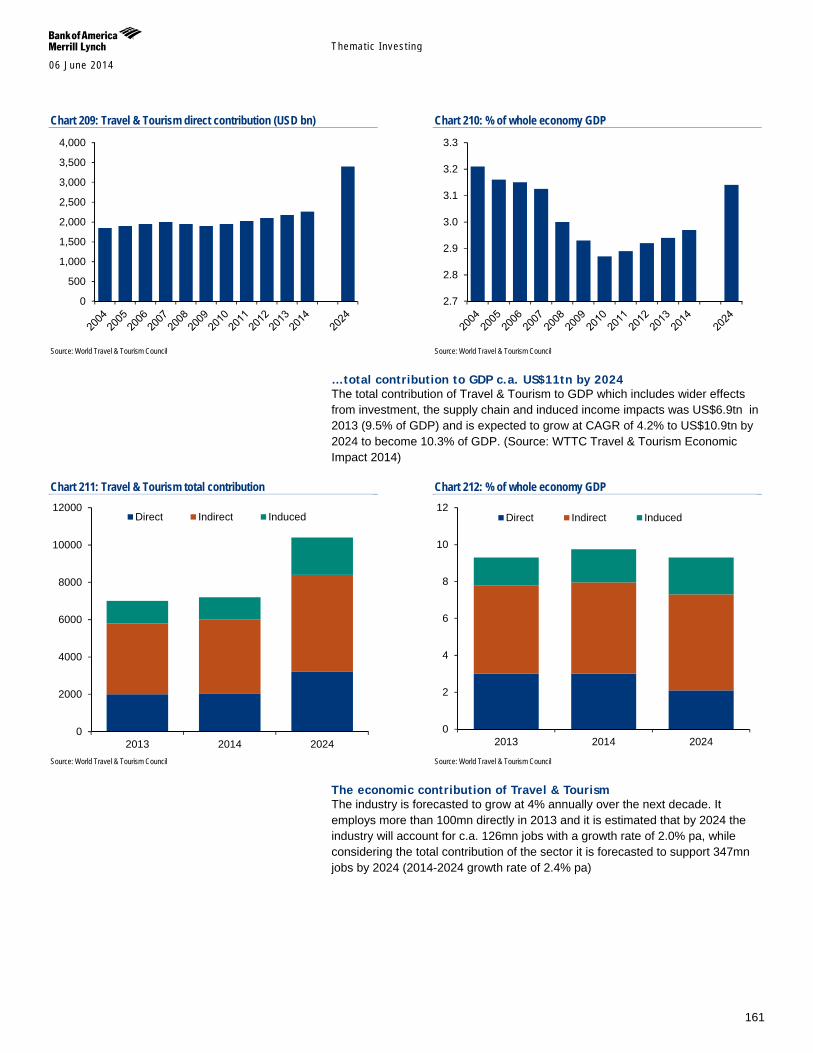
Themat ic Inves t ing 06 June 2014
161
Chart 209: Travel & Tourism direct contribution (USD bn)
Source: World Travel & Tourism Council
Chart 210: % of whole economy GDP
Source: World Travel & Tourism Council
…total contribution to GDP c.a. US$11tn by 2024 The total contribution of Travel & Tourism to GDP which includes wider effects from investment, the supply chain and induced income impacts was US$6.9tn in 2013 (9.5% of GDP) and is expected to grow at CAGR of 4.2% to US$10.9tn by 2024 to become 10.3% of GDP. (Source: WTTC Travel & Tourism Economic Impact 2014)
Chart 211: Travel & Tourism total contribution
Source: World Travel & Tourism Council
Chart 212: % of whole economy GDP
Source: World Travel & Tourism Council
The economic contribution of Travel & Tourism The industry is forecasted to grow at 4% annually over the next decade. It employs more than 100mn directly in 2013 and it is estimated that by 2024 the industry will account for c.a. 126mn jobs with a growth rate of 2.0% pa, while considering the total contribution of the sector it is forecasted to support 347mn jobs by 2024 (2014-2024 growth rate of 2.4% pa)
0
500
1,000
1,500
2,000
2,500
3,000
3,500
4,000
2.7
2.8
2.9
3.0
3.1
3.2
3.3
0
2000
4000
6000
8000
10000
12000
2013 2014 2024
Direct Indirect Induced
0
2
4
6
8
10
12
2013 2014 2024
Direct Indirect Induced
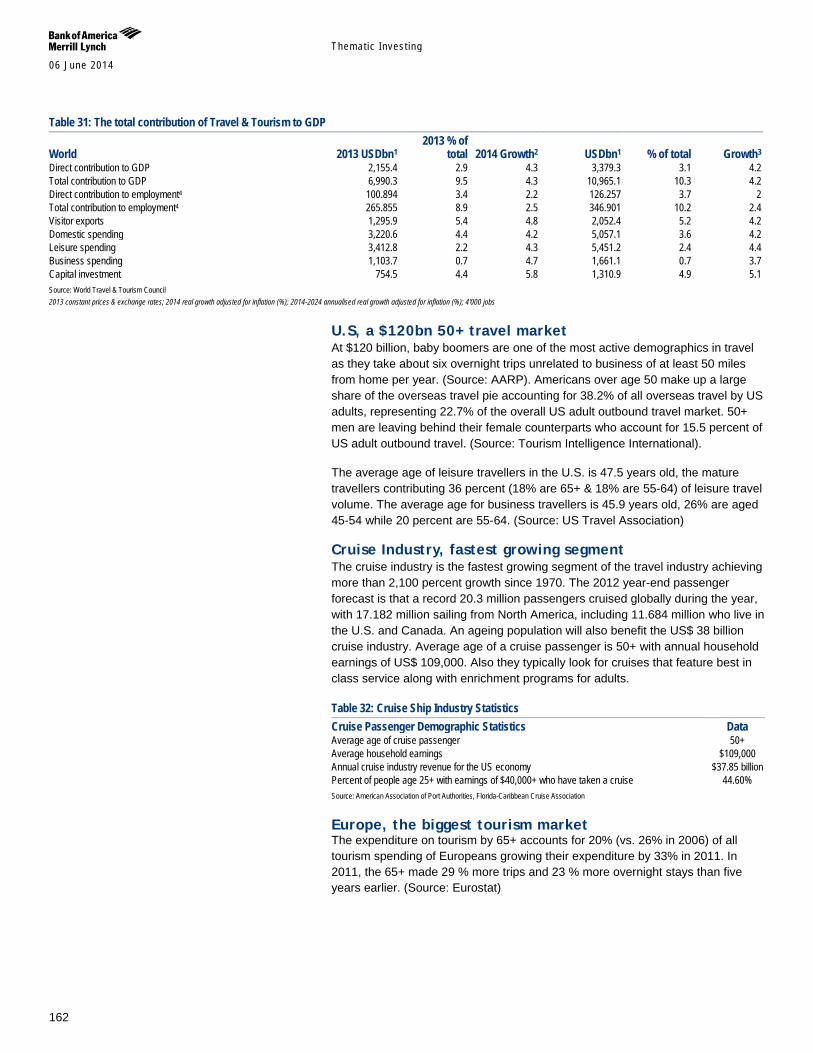
Themat ic Inves t ing 06 June 2014
162
Table 31: The total contribution of Travel & Tourism to GDP
World 2013 USDbn1 2013 % of
total 2014 Growth2 USDbn1 % of total Growth3 Direct contribution to GDP 2,155.4 2.9 4.3 3,379.3 3.1 4.2 Total contribution to GDP 6,990.3 9.5 4.3 10,965.1 10.3 4.2 Direct contribution to employment4 100.894 3.4 2.2 126.257 3.7 2 Total contribution to employment4 265.855 8.9 2.5 346.901 10.2 2.4 Visitor exports 1,295.9 5.4 4.8 2,052.4 5.2 4.2 Domestic spending 3,220.6 4.4 4.2 5,057.1 3.6 4.2 Leisure spending 3,412.8 2.2 4.3 5,451.2 2.4 4.4 Business spending 1,103.7 0.7 4.7 1,661.1 0.7 3.7 Capital investment 754.5 4.4 5.8 1,310.9 4.9 5.1 Source: World Travel & Tourism Council 2013 constant prices & exchange rates; 2014 real growth adjusted for inflation (%); 2014-2024 annualised real growth adjusted for inflation (%); 4'000 jobs
U.S, a $120bn 50+ travel market At $120 billion, baby boomers are one of the most active demographics in travel as they take about six overnight trips unrelated to business of at least 50 miles from home per year. (Source: AARP). Americans over age 50 make up a large share of the overseas travel pie accounting for 38.2% of all overseas travel by US adults, representing 22.7% of the overall US adult outbound travel market. 50+ men are leaving behind their female counterparts who account for 15.5 percent of US adult outbound travel. (Source: Tourism Intelligence International).
The average age of leisure travellers in the U.S. is 47.5 years old, the mature travellers contributing 36 percent (18% are 65+ & 18% are 55-64) of leisure travel volume. The average age for business travellers is 45.9 years old, 26% are aged 45-54 while 20 percent are 55-64. (Source: US Travel Association)
Cruise Industry, fastest growing segment The cruise industry is the fastest growing segment of the travel industry achieving more than 2,100 percent growth since 1970. The 2012 year-end passenger forecast is that a record 20.3 million passengers cruised globally during the year, with 17.182 million sailing from North America, including 11.684 million who live in the U.S. and Canada. An ageing population will also benefit the US$ 38 billion cruise industry. Average age of a cruise passenger is 50+ with annual household earnings of US$ 109,000. Also they typically look for cruises that feature best in class service along with enrichment programs for adults.
Table 32: Cruise Ship Industry Statistics Cruise Passenger Demographic Statistics Data Average age of cruise passenger 50+ Average household earnings $109,000 Annual cruise industry revenue for the US economy $37.85 billion Percent of people age 25+ with earnings of $40,000+ who have taken a cruise 44.60% Source: American Association of Port Authorities, Florida-Caribbean Cruise Association
Europe, the biggest tourism market The expenditure on tourism by 65+ accounts for 20% (vs. 26% in 2006) of all tourism spending of Europeans growing their expenditure by 33% in 2011. In 2011, the 65+ made 29 % more trips and 23 % more overnight stays than five years earlier. (Source: Eurostat)
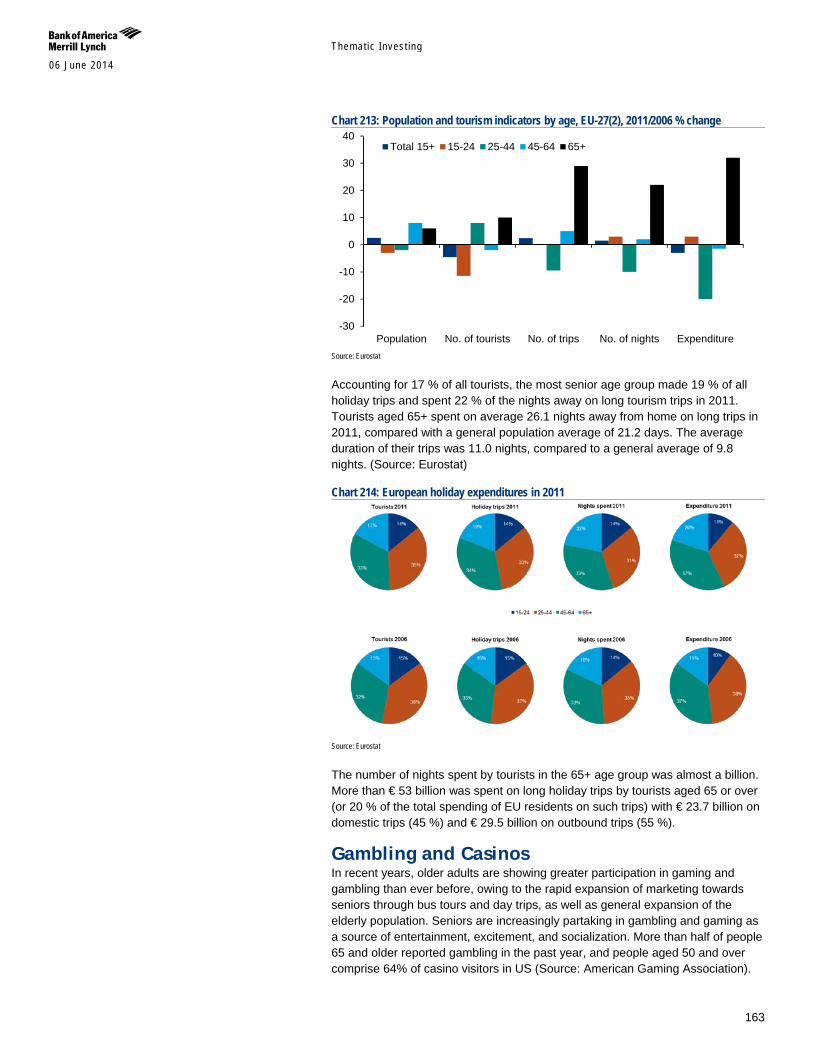
Themat ic Inves t ing 06 June 2014
163
Chart 213: Population and tourism indicators by age, EU-27(2), 2011/2006 % change
Source: Eurostat
Accounting for 17 % of all tourists, the most senior age group made 19 % of all holiday trips and spent 22 % of the nights away on long tourism trips in 2011. Tourists aged 65+ spent on average 26.1 nights away from home on long trips in 2011, compared with a general population average of 21.2 days. The average duration of their trips was 11.0 nights, compared to a general average of 9.8 nights. (Source: Eurostat)
Chart 214: European holiday expenditures in 2011
Source: Eurostat
The number of nights spent by tourists in the 65+ age group was almost a billion. More than € 53 billion was spent on long holiday trips by tourists aged 65 or over (or 20 % of the total spending of EU residents on such trips) with € 23.7 billion on domestic trips (45 %) and € 29.5 billion on outbound trips (55 %).
Gambling and Casinos In recent years, older adults are showing greater participation in gaming and gambling than ever before, owing to the rapid expansion of marketing towards seniors through bus tours and day trips, as well as general expansion of the elderly population. Seniors are increasingly partaking in gambling and gaming as a source of entertainment, excitement, and socialization. More than half of people 65 and older reported gambling in the past year, and people aged 50 and over comprise 64% of casino visitors in US (Source: American Gaming Association).
-30
-20
-10
0
10
20
30
40
Population No. of tourists No. of trips No. of nights Expenditure
Total 15+ 15-24 25-44 45-64 65+
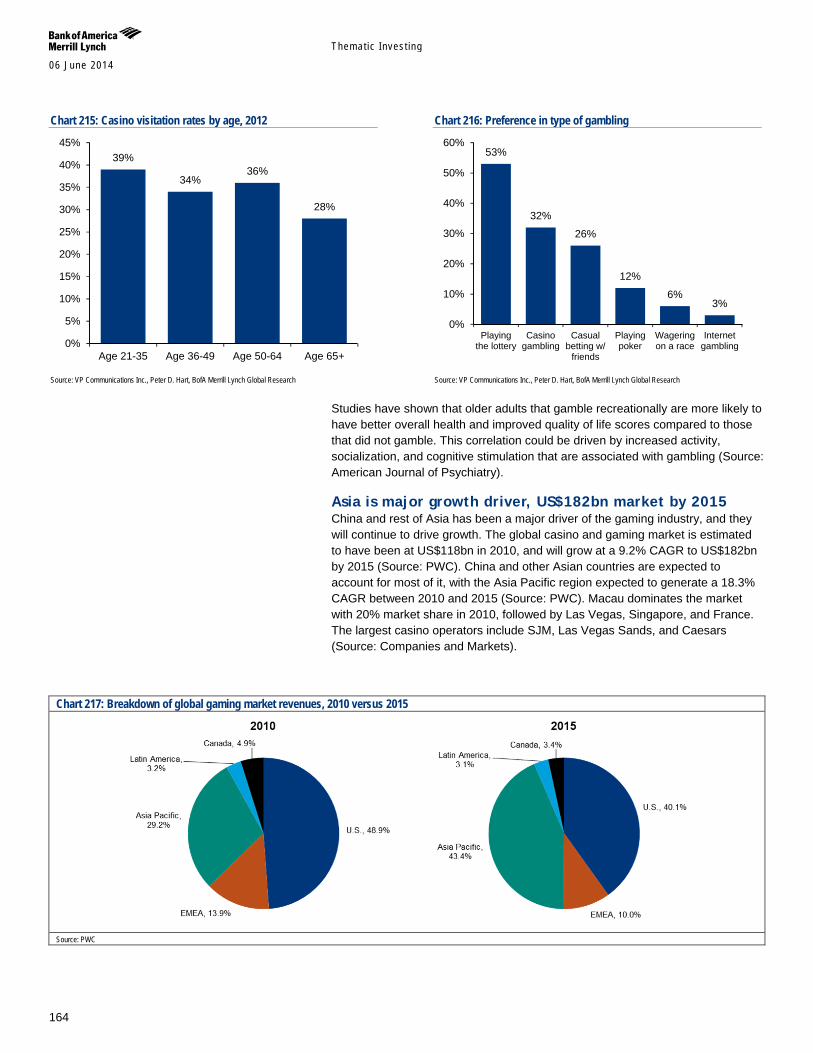
Themat ic Inves t ing 06 June 2014
164
Chart 215: Casino visitation rates by age, 2012
Source: VP Communications Inc., Peter D. Hart, BofA Merrill Lynch Global Research
Chart 216: Preference in type of gambling
Source: VP Communications Inc., Peter D. Hart, BofA Merrill Lynch Global Research
Studies have shown that older adults that gamble recreationally are more likely to have better overall health and improved quality of life scores compared to those that did not gamble. This correlation could be driven by increased activity, socialization, and cognitive stimulation that are associated with gambling (Source: American Journal of Psychiatry).
Asia is major growth driver, US$182bn market by 2015 China and rest of Asia has been a major driver of the gaming industry, and they will continue to drive growth. The global casino and gaming market is estimated to have been at US$118bn in 2010, and will grow at a 9.2% CAGR to US$182bn by 2015 (Source: PWC). China and other Asian countries are expected to account for most of it, with the Asia Pacific region expected to generate a 18.3% CAGR between 2010 and 2015 (Source: PWC). Macau dominates the market with 20% market share in 2010, followed by Las Vegas, Singapore, and France. The largest casino operators include SJM, Las Vegas Sands, and Caesars (Source: Companies and Markets).
Chart 217: Breakdown of global gaming market revenues, 2010 versus 2015
Source: PWC
39%
34% 36%
28%
0%
5%
10%
15%
20%
25%
30%
35%
40%
45%
Age 21-35 Age 36-49 Age 50-64 Age 65+
53%
32%
26%
12%
6% 3%
0%
10%
20%
30%
40%
50%
60%
Playingthe lottery
Casinogambling
Casualbetting w/
friends
Playingpoker
Wageringon a race
Internetgambling
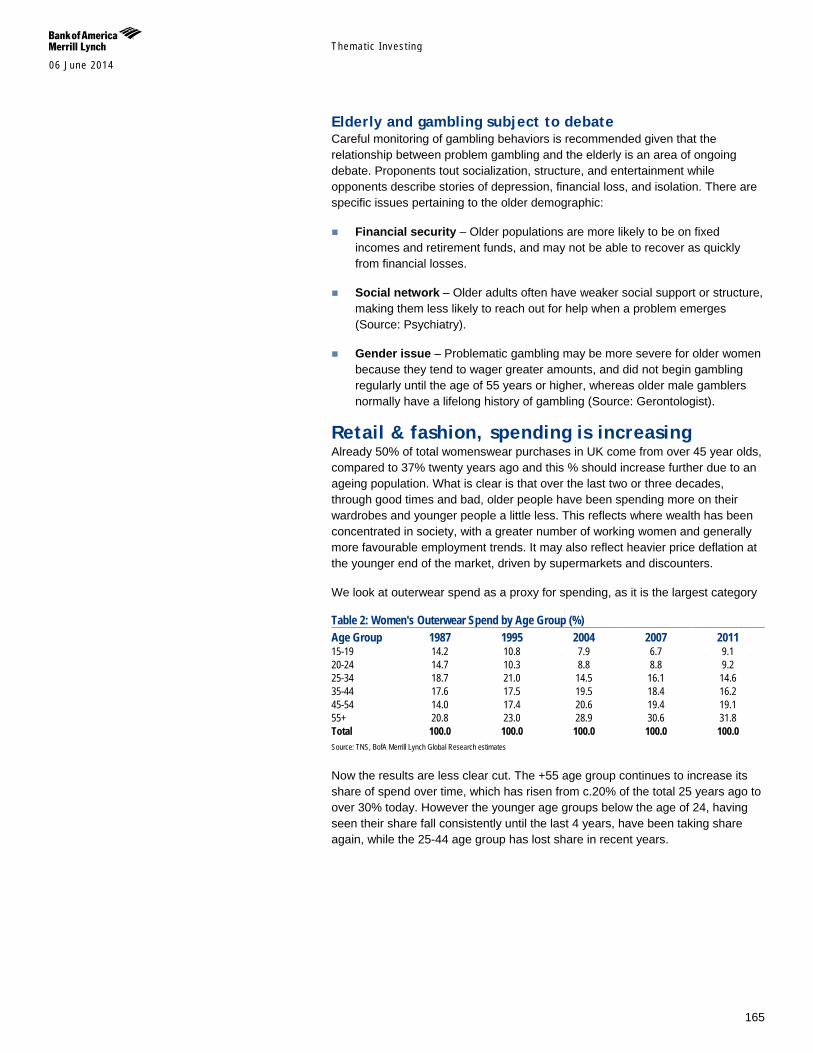
Themat ic Inves t ing 06 June 2014
165
Elderly and gambling subject to debate Careful monitoring of gambling behaviors is recommended given that the relationship between problem gambling and the elderly is an area of ongoing debate. Proponents tout socialization, structure, and entertainment while opponents describe stories of depression, financial loss, and isolation. There are specific issues pertaining to the older demographic:
Financial security – Older populations are more likely to be on fixed incomes and retirement funds, and may not be able to recover as quickly from financial losses.
Social network – Older adults often have weaker social support or structure, making them less likely to reach out for help when a problem emerges (Source: Psychiatry).
Gender issue – Problematic gambling may be more severe for older women because they tend to wager greater amounts, and did not begin gambling regularly until the age of 55 years or higher, whereas older male gamblers normally have a lifelong history of gambling (Source: Gerontologist).
Retail & fashion, spending is increasing Already 50% of total womenswear purchases in UK come from over 45 year olds, compared to 37% twenty years ago and this % should increase further due to an ageing population. What is clear is that over the last two or three decades, through good times and bad, older people have been spending more on their wardrobes and younger people a little less. This reflects where wealth has been concentrated in society, with a greater number of working women and generally more favourable employment trends. It may also reflect heavier price deflation at the younger end of the market, driven by supermarkets and discounters.
We look at outerwear spend as a proxy for spending, as it is the largest category
Table 2: Women's Outerwear Spend by Age Group (%) Age Group 1987 1995 2004 2007 2011 15-19 14.2 10.8 7.9 6.7 9.1 20-24 14.7 10.3 8.8 8.8 9.2 25-34 18.7 21.0 14.5 16.1 14.6 35-44 17.6 17.5 19.5 18.4 16.2 45-54 14.0 17.4 20.6 19.4 19.1 55+ 20.8 23.0 28.9 30.6 31.8 Total 100.0 100.0 100.0 100.0 100.0 Source: TNS, BofA Merrill Lynch Global Research estimates
Now the results are less clear cut. The +55 age group continues to increase its share of spend over time, which has risen from c.20% of the total 25 years ago to over 30% today. However the younger age groups below the age of 24, having seen their share fall consistently until the last 4 years, have been taking share again, while the 25-44 age group has lost share in recent years.
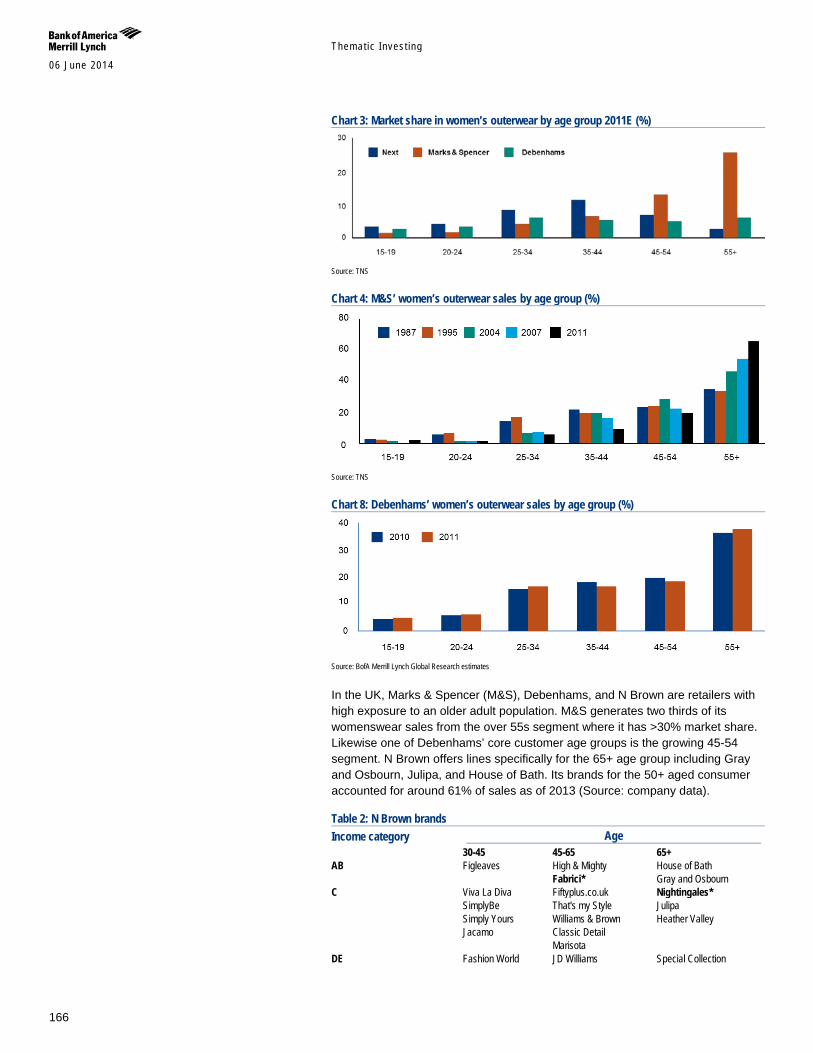
Themat ic Inves t ing 06 June 2014
166
Chart 3: Market share in women’s outerwear by age group 2011E (%)
Source: TNS
Chart 4: M&S’ women’s outerwear sales by age group (%)
Source: TNS
Chart 8: Debenhams’ women’s outerwear sales by age group (%)
Source: BofA Merrill Lynch Global Research estimates
In the UK, Marks & Spencer (M&S), Debenhams, and N Brown are retailers with high exposure to an older adult population. M&S generates two thirds of its womenswear sales from the over 55s segment where it has >30% market share. Likewise one of Debenhams’ core customer age groups is the growing 45-54 segment. N Brown offers lines specifically for the 65+ age group including Gray and Osbourn, Julipa, and House of Bath. Its brands for the 50+ aged consumer accounted for around 61% of sales as of 2013 (Source: company data).
Table 2: N Brown brands Income category Age 30-45 45-65 65+ AB Figleaves High & Mighty House of Bath Fabrici* Gray and Osbourn C Viva La Diva Fiftyplus.co.uk Nightingales* SimplyBe That's my Style Julipa Simply Yours Williams & Brown Heather Valley Jacamo Classic Detail Marisota DE Fashion World JD Williams Special Collection

Themat ic Inves t ing 06 June 2014
167
Table 2: N Brown brands Income category Age Naturally Close Ambrose Wilson* Oxendales* Premier Man Source: company data, BofA Merrill Lynch Global Research estimates *Brands we estimate might get consolidated
Retailers, marketers, service providers have to adapt Retailers and service providers in general will need to grow with their customer and not be caught moving in the opposite direction of demographic change. According to the latest Nielsen Global Survey about Aging, 51% of older adults do not see ads that reflect their age group, 43% have trouble finding packages that are easy to open, and 46% have difficulty navigating service-oriented industries. There needs to be momentous changes to better cater to the aging consumer:
Product – goods and services that for aging-needs
Store layout – ample lighting, wider aisles, easy shelving, benches
Advertising – older non-patronizing models, more reflective of age group
Labelling – larger and clearer fonts and signage
Location – easy to transport, handicap accessibility
Customer service – more courteous and understanding of needs
Smart technology, facilitating eldercare Rising life expectancy combined with falling birth and mortality rates lead to an acute case of high dependency in old age. As global populations age, questions will arise as to who will take care of the elderly. Automation, smart technology, and the rise of the service robot could well be a solution, especially in age stressed countries like Japan and Germany. Many structural and societal factors have created the “care gap”:
Rising Dependency Ratios
Migrating youth
Shortage of Nurses
Ageing caregivers
Dependency Ratios By 2050 the world average old age dependency rations i.e. the percentage of people 65 and over to the 15-64 year old population, is expected to be just under 25%. Most of the developed world is set to exceed this figure with six countries in particular stand in stark contrast namely Japan, Spain, Korea, Portugal, Italy and Germany.
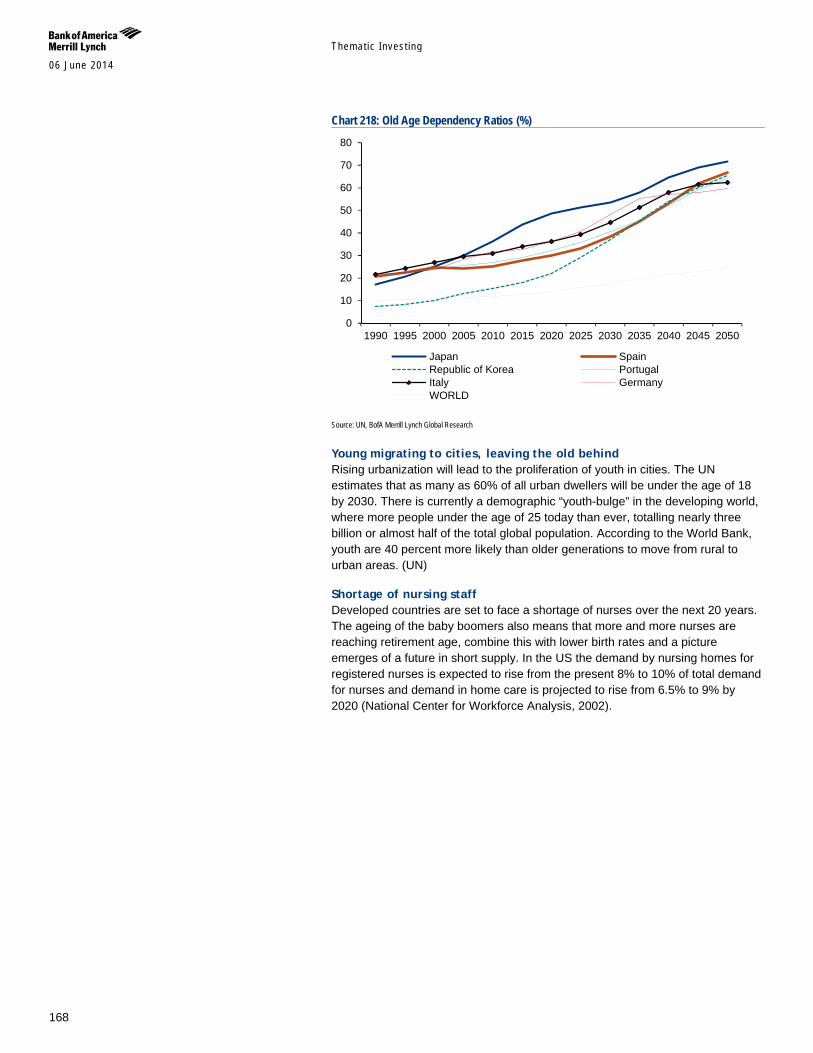
Themat ic Inves t ing 06 June 2014
168
Chart 218: Old Age Dependency Ratios (%)
Source: UN, BofA Merrill Lynch Global Research
Young migrating to cities, leaving the old behind Rising urbanization will lead to the proliferation of youth in cities. The UN estimates that as many as 60% of all urban dwellers will be under the age of 18 by 2030. There is currently a demographic “youth-bulge” in the developing world, where more people under the age of 25 today than ever, totalling nearly three billion or almost half of the total global population. According to the World Bank, youth are 40 percent more likely than older generations to move from rural to urban areas. (UN)
Shortage of nursing staff Developed countries are set to face a shortage of nurses over the next 20 years. The ageing of the baby boomers also means that more and more nurses are reaching retirement age, combine this with lower birth rates and a picture emerges of a future in short supply. In the US the demand by nursing homes for registered nurses is expected to rise from the present 8% to 10% of total demand for nurses and demand in home care is projected to rise from 6.5% to 9% by 2020 (National Center for Workforce Analysis, 2002).
0
10
20
30
40
50
60
70
80
1990 1995 2000 2005 2010 2015 2020 2025 2030 2035 2040 2045 2050
Japan SpainRepublic of Korea PortugalItaly GermanyWORLD
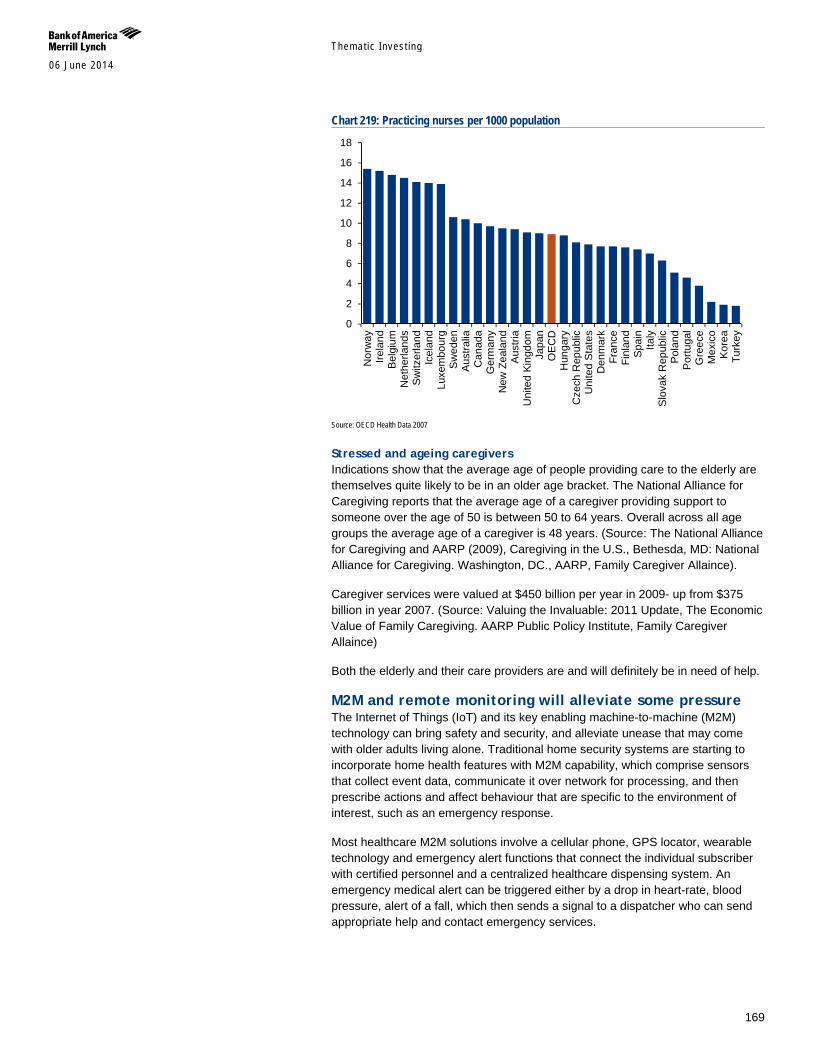
Themat ic Inves t ing 06 June 2014
169
Chart 219: Practicing nurses per 1000 population
Source: OECD Health Data 2007
Stressed and ageing caregivers Indications show that the average age of people providing care to the elderly are themselves quite likely to be in an older age bracket. The National Alliance for Caregiving reports that the average age of a caregiver providing support to someone over the age of 50 is between 50 to 64 years. Overall across all age groups the average age of a caregiver is 48 years. (Source: The National Alliance for Caregiving and AARP (2009), Caregiving in the U.S., Bethesda, MD: National Alliance for Caregiving. Washington, DC., AARP, Family Caregiver Allaince).
Caregiver services were valued at $450 billion per year in 2009- up from $375 billion in year 2007. (Source: Valuing the Invaluable: 2011 Update, The Economic Value of Family Caregiving. AARP Public Policy Institute, Family Caregiver Allaince)
Both the elderly and their care providers are and will definitely be in need of help.
M2M and remote monitoring will alleviate some pressure The Internet of Things (IoT) and its key enabling machine-to-machine (M2M) technology can bring safety and security, and alleviate unease that may come with older adults living alone. Traditional home security systems are starting to incorporate home health features with M2M capability, which comprise sensors that collect event data, communicate it over network for processing, and then prescribe actions and affect behaviour that are specific to the environment of interest, such as an emergency response.
Most healthcare M2M solutions involve a cellular phone, GPS locator, wearable technology and emergency alert functions that connect the individual subscriber with certified personnel and a centralized healthcare dispensing system. An emergency medical alert can be triggered either by a drop in heart-rate, blood pressure, alert of a fall, which then sends a signal to a dispatcher who can send appropriate help and contact emergency services.
0
2
4
6
8
10
12
14
16
18
Nor
way
Irela
ndB
elgi
umN
ethe
rland
sS
witz
erla
ndIc
elan
dLu
xem
bour
gS
wed
enA
ustra
liaC
anad
aG
erm
any
New
Zea
land
Aus
tria
Uni
ted
King
dom
Japa
nO
EC
DH
unga
ryC
zech
Rep
ublic
Uni
ted
Stat
esD
enm
ark
Fran
ceFi
nlan
dS
pain
Italy
Slo
vak
Rep
ublic
Pol
and
Por
tuga
lG
reec
eM
exic
oK
orea
Turk
ey
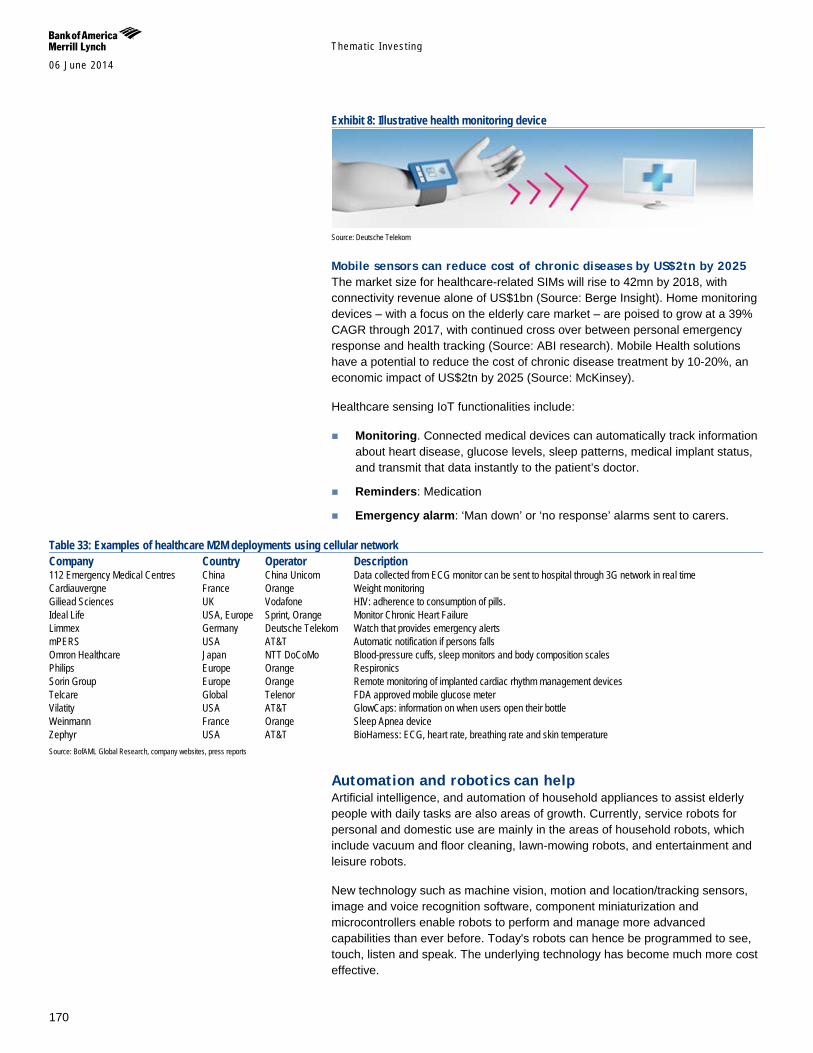
Themat ic Inves t ing 06 June 2014
170
Exhibit 8: Illustrative health monitoring device
Source: Deutsche Telekom
Mobile sensors can reduce cost of chronic diseases by US$2tn by 2025 The market size for healthcare-related SIMs will rise to 42mn by 2018, with connectivity revenue alone of US$1bn (Source: Berge Insight). Home monitoring devices – with a focus on the elderly care market – are poised to grow at a 39% CAGR through 2017, with continued cross over between personal emergency response and health tracking (Source: ABI research). Mobile Health solutions have a potential to reduce the cost of chronic disease treatment by 10-20%, an economic impact of US$2tn by 2025 (Source: McKinsey).
Healthcare sensing IoT functionalities include:
Monitoring. Connected medical devices can automatically track information about heart disease, glucose levels, sleep patterns, medical implant status, and transmit that data instantly to the patient’s doctor.
Reminders: Medication
Emergency alarm: ‘Man down’ or ‘no response’ alarms sent to carers.
Table 33: Examples of healthcare M2M deployments using cellular network Company Country Operator Description 112 Emergency Medical Centres China China Unicom Data collected from ECG monitor can be sent to hospital through 3G network in real time Cardiauvergne France Orange Weight monitoring Giliead Sciences UK Vodafone HIV: adherence to consumption of pills. Ideal Life USA, Europe Sprint, Orange Monitor Chronic Heart Failure Limmex Germany Deutsche Telekom Watch that provides emergency alerts mPERS USA AT&T Automatic notification if persons falls Omron Healthcare Japan NTT DoCoMo Blood-pressure cuffs, sleep monitors and body composition scales Philips Europe Orange Respironics Sorin Group Europe Orange Remote monitoring of implanted cardiac rhythm management devices Telcare Global Telenor FDA approved mobile glucose meter Vilatity USA AT&T GlowCaps: information on when users open their bottle Weinmann France Orange Sleep Apnea device Zephyr USA AT&T BioHarness: ECG, heart rate, breathing rate and skin temperature Source: BofAML Global Research, company websites, press reports
Automation and robotics can help Artificial intelligence, and automation of household appliances to assist elderly people with daily tasks are also areas of growth. Currently, service robots for personal and domestic use are mainly in the areas of household robots, which include vacuum and floor cleaning, lawn-mowing robots, and entertainment and leisure robots.
New technology such as machine vision, motion and location/tracking sensors, image and voice recognition software, component miniaturization and microcontrollers enable robots to perform and manage more advanced capabilities than ever before. Today's robots can hence be programmed to see, touch, listen and speak. The underlying technology has become much more cost effective.
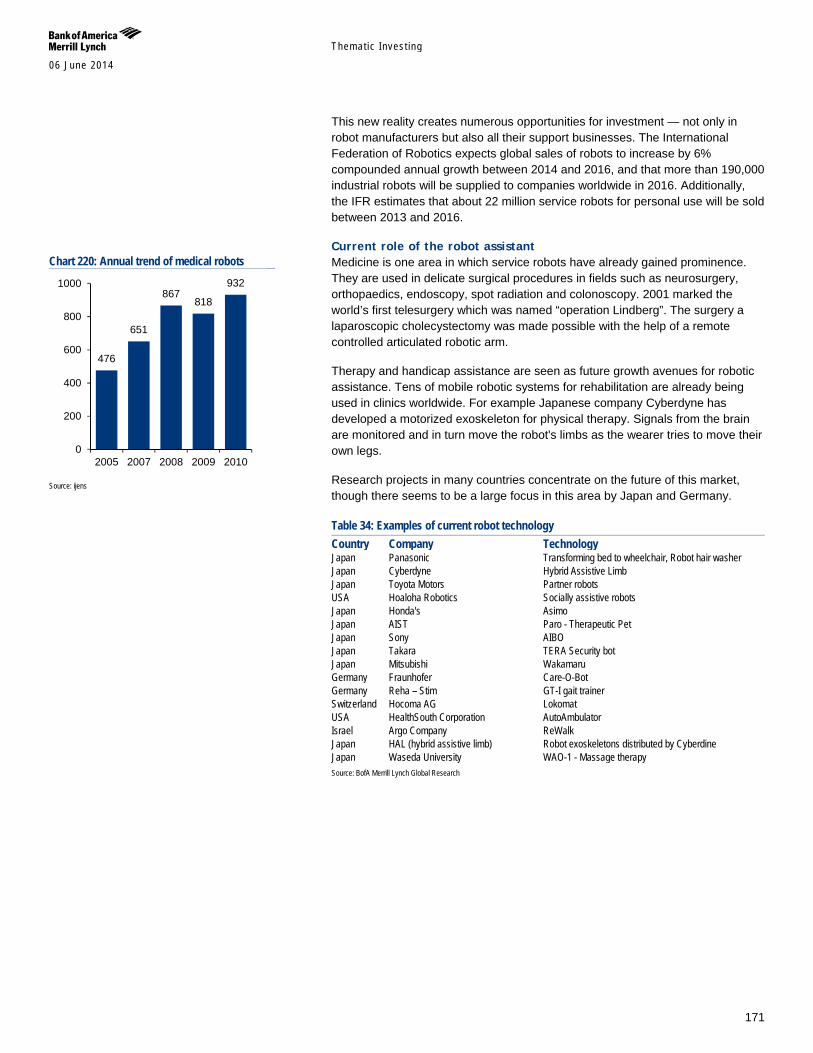
Themat ic Inves t ing 06 June 2014
171
This new reality creates numerous opportunities for investment — not only in robot manufacturers but also all their support businesses. The International Federation of Robotics expects global sales of robots to increase by 6% compounded annual growth between 2014 and 2016, and that more than 190,000 industrial robots will be supplied to companies worldwide in 2016. Additionally, the IFR estimates that about 22 million service robots for personal use will be sold between 2013 and 2016.
Current role of the robot assistant Medicine is one area in which service robots have already gained prominence. They are used in delicate surgical procedures in fields such as neurosurgery, orthopaedics, endoscopy, spot radiation and colonoscopy. 2001 marked the world’s first telesurgery which was named “operation Lindberg”. The surgery a laparoscopic cholecystectomy was made possible with the help of a remote controlled articulated robotic arm.
Therapy and handicap assistance are seen as future growth avenues for robotic assistance. Tens of mobile robotic systems for rehabilitation are already being used in clinics worldwide. For example Japanese company Cyberdyne has developed a motorized exoskeleton for physical therapy. Signals from the brain are monitored and in turn move the robot's limbs as the wearer tries to move their own legs.
Research projects in many countries concentrate on the future of this market, though there seems to be a large focus in this area by Japan and Germany.
Table 34: Examples of current robot technology Country Company Technology Japan Panasonic Transforming bed to wheelchair, Robot hair washer Japan Cyberdyne Hybrid Assistive Limb Japan Toyota Motors Partner robots USA Hoaloha Robotics Socially assistive robots Japan Honda's Asimo Japan AIST Paro - Therapeutic Pet Japan Sony AIBO Japan Takara TERA Security bot Japan Mitsubishi Wakamaru Germany Fraunhofer Care-O-Bot Germany Reha – Stim GT-I gait trainer Switzerland Hocoma AG Lokomat USA HealthSouth Corporation AutoAmbulator Israel Argo Company ReWalk Japan HAL (hybrid assistive limb) Robot exoskeletons distributed by Cyberdine Japan Waseda University WAO-1 - Massage therapy Source: BofA Merrill Lynch Global Research
Chart 220: Annual trend of medical robots
Source: ijens
476
651
867 818
932
0
200
400
600
800
1000
2005 2007 2008 2009 2010
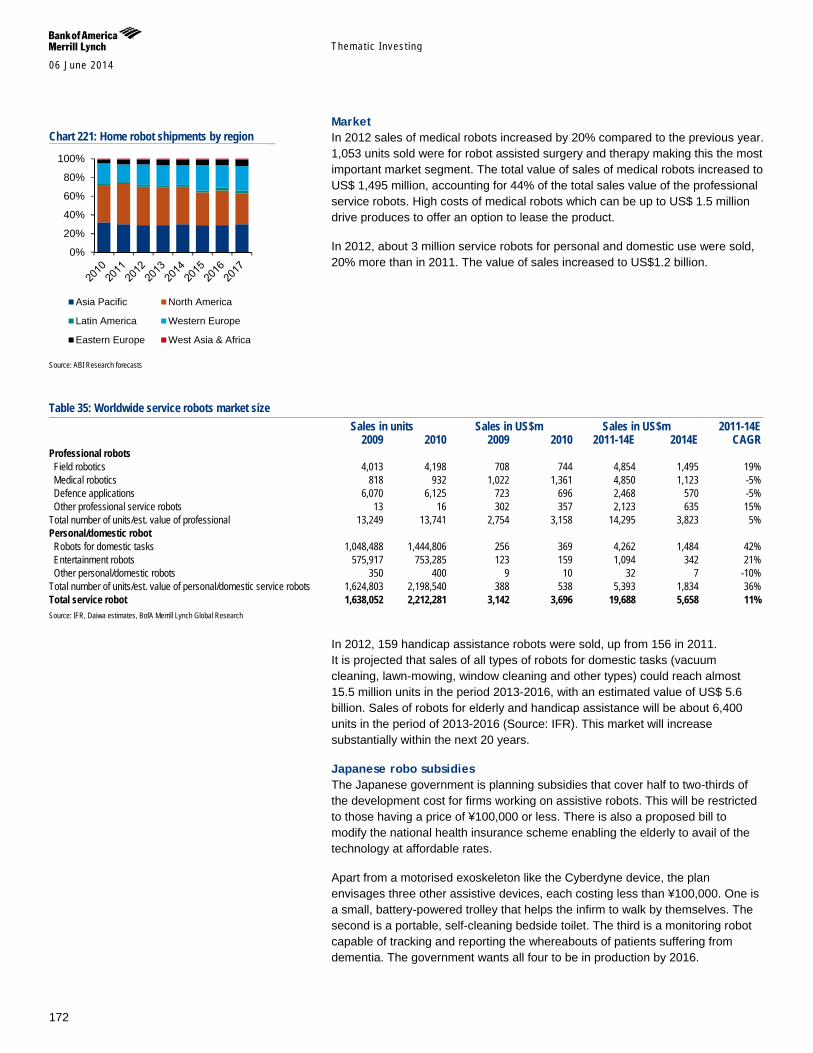
Themat ic Inves t ing 06 June 2014
172
Market In 2012 sales of medical robots increased by 20% compared to the previous year. 1,053 units sold were for robot assisted surgery and therapy making this the most important market segment. The total value of sales of medical robots increased to US$ 1,495 million, accounting for 44% of the total sales value of the professional service robots. High costs of medical robots which can be up to US$ 1.5 million drive produces to offer an option to lease the product.
In 2012, about 3 million service robots for personal and domestic use were sold, 20% more than in 2011. The value of sales increased to US$1.2 billion.
Table 35: Worldwide service robots market size Sales in units Sales in US$m Sales in US$m 2011-14E 2009 2010 2009 2010 2011-14E 2014E CAGR Professional robots Field robotics 4,013 4,198 708 744 4,854 1,495 19% Medical robotics 818 932 1,022 1,361 4,850 1,123 -5% Defence applications 6,070 6,125 723 696 2,468 570 -5% Other professional service robots 13 16 302 357 2,123 635 15% Total number of units/est. value of professional 13,249 13,741 2,754 3,158 14,295 3,823 5% Personal/domestic robot Robots for domestic tasks 1,048,488 1,444,806 256 369 4,262 1,484 42% Entertainment robots 575,917 753,285 123 159 1,094 342 21% Other personal/domestic robots 350 400 9 10 32 7 -10% Total number of units/est. value of personal/domestic service robots 1,624,803 2,198,540 388 538 5,393 1,834 36% Total service robot 1,638,052 2,212,281 3,142 3,696 19,688 5,658 11% Source: IFR, Daiwa estimates, BofA Merrill Lynch Global Research
In 2012, 159 handicap assistance robots were sold, up from 156 in 2011. It is projected that sales of all types of robots for domestic tasks (vacuum cleaning, lawn-mowing, window cleaning and other types) could reach almost 15.5 million units in the period 2013-2016, with an estimated value of US$ 5.6 billion. Sales of robots for elderly and handicap assistance will be about 6,400 units in the period of 2013-2016 (Source: IFR). This market will increase substantially within the next 20 years.
Japanese robo subsidies The Japanese government is planning subsidies that cover half to two-thirds of the development cost for firms working on assistive robots. This will be restricted to those having a price of ¥100,000 or less. There is also a proposed bill to modify the national health insurance scheme enabling the elderly to avail of the technology at affordable rates.
Apart from a motorised exoskeleton like the Cyberdyne device, the plan envisages three other assistive devices, each costing less than ¥100,000. One is a small, battery-powered trolley that helps the infirm to walk by themselves. The second is a portable, self-cleaning bedside toilet. The third is a monitoring robot capable of tracking and reporting the whereabouts of patients suffering from dementia. The government wants all four to be in production by 2016.
Chart 221: Home robot shipments by region
Source: ABI Research forecasts
0%
20%
40%
60%
80%
100%
Asia Pacific North America
Latin America Western Europe
Eastern Europe West Asia & Africa

Themat ic Inves t ing 06 June 2014
173
Appendix 1 – Global population pyramids: 2010, 2050E, 2100E The following section includes population pyramids, also called age pyramids - graphicals illustration based on UN data, showing the distribution of various age groups globally and for se selection of countries in the AMRS, EMEA, and APAC in 2010, 2050E, and 2100E.
Understanding the pyramids A population pyramid that is very triangular shows a population with a high
number of young dependants and a low life expectancy.
A population pyramid that has fairly straight sides (more like a barrel) shows a population with a falling birth rate and a rising life expectancy.
Over time, as a country develops, the shape changes from triangular to barrel-like.
Places with an ageing population and a very low birth rate have a structure that looks like an upside-down pyramid.
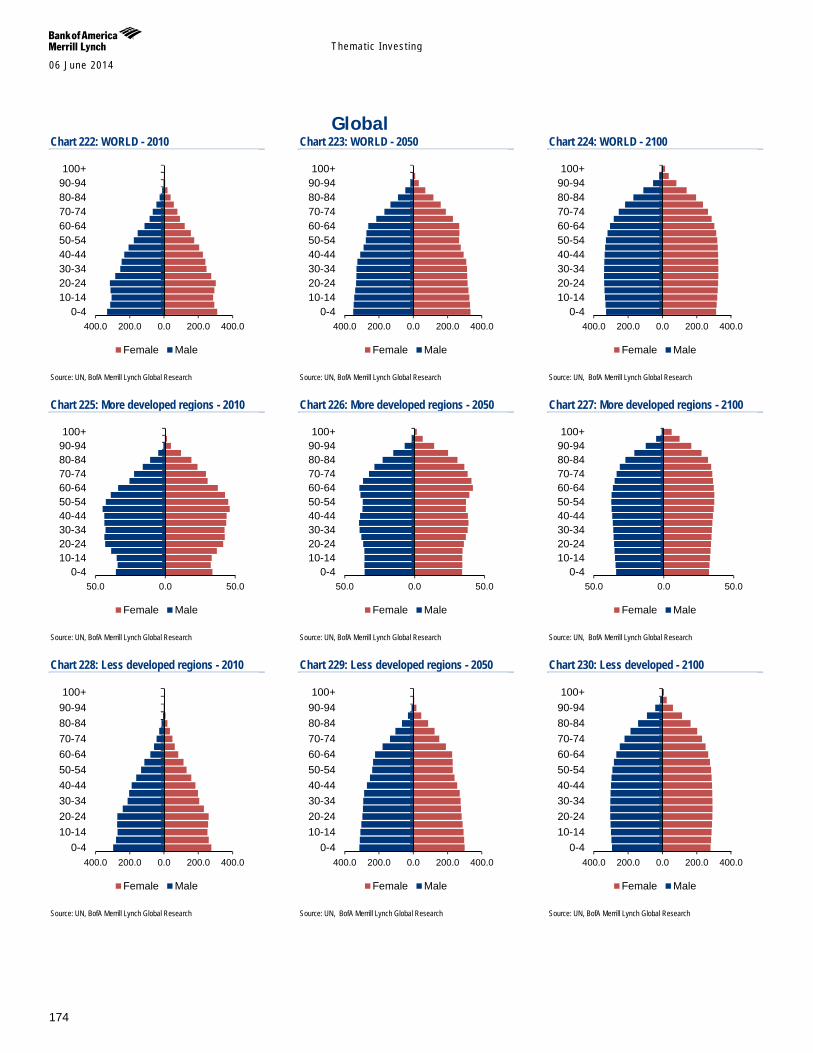
Themat ic Inves t ing 06 June 2014
174
Global Chart 222: WORLD - 2010
Source: UN, BofA Merrill Lynch Global Research
Chart 223: WORLD - 2050
Source: UN, BofA Merrill Lynch Global Research
Chart 224: WORLD - 2100
Source: UN, BofA Merrill Lynch Global Research
Chart 225: More developed regions - 2010
Source: UN, BofA Merrill Lynch Global Research
Chart 226: More developed regions - 2050
Source: UN, BofA Merrill Lynch Global Research
Chart 227: More developed regions - 2100
Source: UN, BofA Merrill Lynch Global Research
Chart 228: Less developed regions - 2010
Source: UN, BofA Merrill Lynch Global Research
Chart 229: Less developed regions - 2050
Source: UN, BofA Merrill Lynch Global Research
Chart 230: Less developed - 2100
Source: UN, BofA Merrill Lynch Global Research
400.0 200.0 0.0 200.0 400.00-4
10-1420-2430-3440-4450-5460-6470-7480-8490-94100+
Female Male
400.0 200.0 0.0 200.0 400.00-4
10-1420-2430-3440-4450-5460-6470-7480-8490-94100+
Female Male
400.0 200.0 0.0 200.0 400.00-4
10-1420-2430-3440-4450-5460-6470-7480-8490-94100+
Female Male
50.0 0.0 50.00-4
10-1420-2430-3440-4450-5460-6470-7480-8490-94100+
Female Male
50.0 0.0 50.00-4
10-1420-2430-3440-4450-5460-6470-7480-8490-94100+
Female Male
50.0 0.0 50.00-4
10-1420-2430-3440-4450-5460-6470-7480-8490-94100+
Female Male
400.0 200.0 0.0 200.0 400.00-4
10-1420-2430-3440-4450-5460-6470-7480-8490-94100+
Female Male
400.0 200.0 0.0 200.0 400.00-4
10-1420-2430-3440-4450-5460-6470-7480-8490-94100+
Female Male
400.0 200.0 0.0 200.0 400.00-4
10-1420-2430-3440-4450-5460-6470-7480-8490-94100+
Female Male
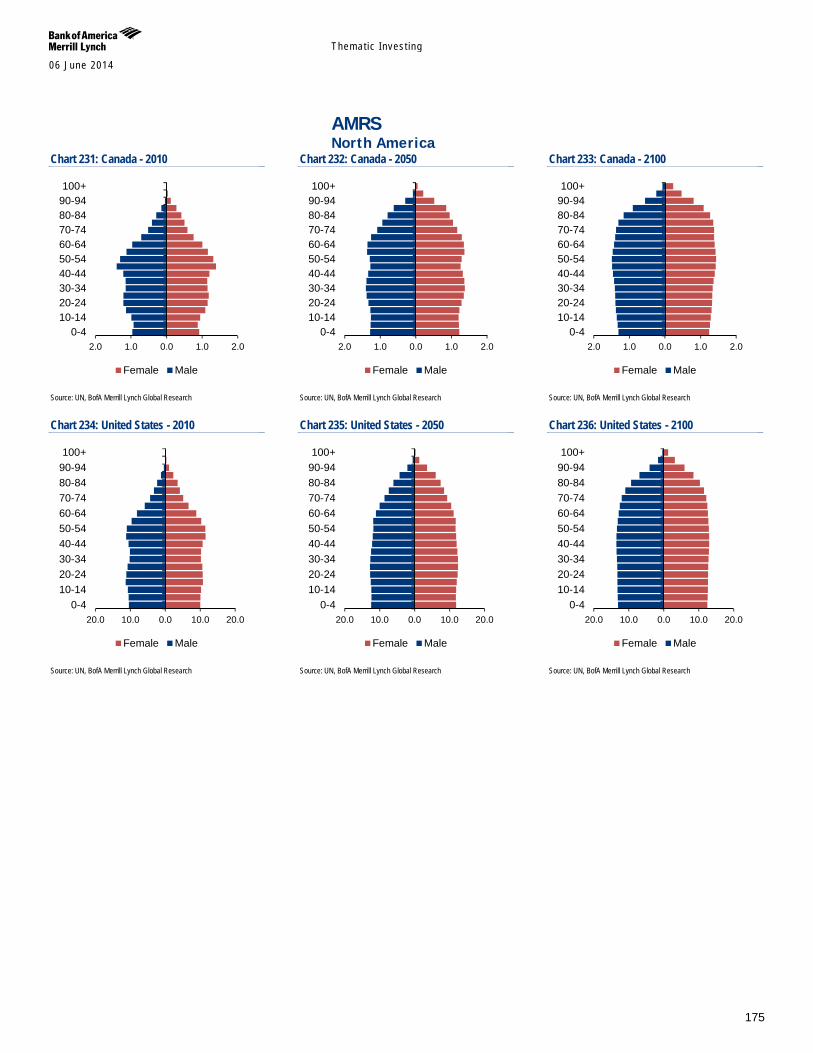
Themat ic Inves t ing 06 June 2014
175
AMRS North America
Chart 231: Canada - 2010
Source: UN, BofA Merrill Lynch Global Research
Chart 232: Canada - 2050
Source: UN, BofA Merrill Lynch Global Research
Chart 233: Canada - 2100
Source: UN, BofA Merrill Lynch Global Research
Chart 234: United States - 2010
Source: UN, BofA Merrill Lynch Global Research
Chart 235: United States - 2050
Source: UN, BofA Merrill Lynch Global Research
Chart 236: United States - 2100
Source: UN, BofA Merrill Lynch Global Research
2.0 1.0 0.0 1.0 2.00-4
10-1420-2430-3440-4450-5460-6470-7480-8490-94100+
Female Male
2.0 1.0 0.0 1.0 2.00-4
10-1420-2430-3440-4450-5460-6470-7480-8490-94100+
Female Male
2.0 1.0 0.0 1.0 2.00-4
10-1420-2430-3440-4450-5460-6470-7480-8490-94100+
Female Male
20.0 10.0 0.0 10.0 20.00-4
10-1420-2430-3440-4450-5460-6470-7480-8490-94100+
Female Male
20.0 10.0 0.0 10.0 20.00-4
10-1420-2430-3440-4450-5460-6470-7480-8490-94100+
Female Male
20.0 10.0 0.0 10.0 20.00-4
10-1420-2430-3440-4450-5460-6470-7480-8490-94100+
Female Male
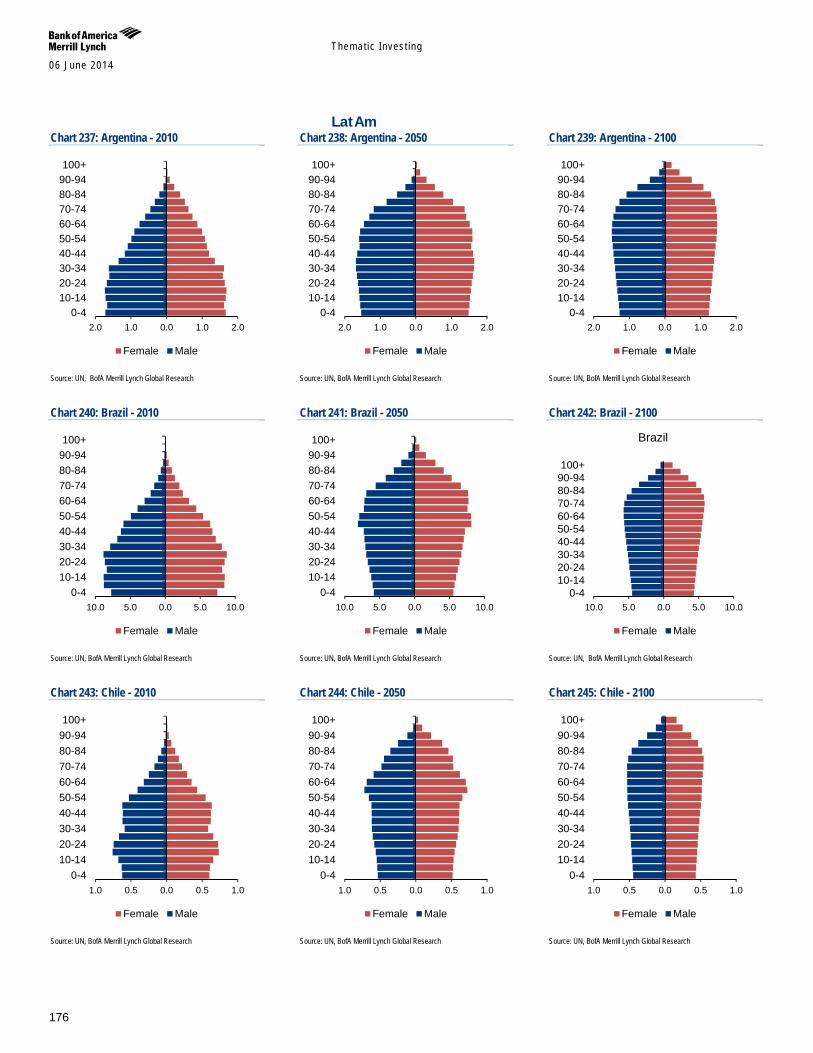
Themat ic Inves t ing 06 June 2014
176
LatAm Chart 237: Argentina - 2010
Source: UN, BofA Merrill Lynch Global Research
Chart 238: Argentina - 2050
Source: UN, BofA Merrill Lynch Global Research
Chart 239: Argentina - 2100
Source: UN, BofA Merrill Lynch Global Research
Chart 240: Brazil - 2010
Source: UN, BofA Merrill Lynch Global Research
Chart 241: Brazil - 2050
Source: UN, BofA Merrill Lynch Global Research
Chart 242: Brazil - 2100
Source: UN, BofA Merrill Lynch Global Research
Chart 243: Chile - 2010
Source: UN, BofA Merrill Lynch Global Research
Chart 244: Chile - 2050
Source: UN, BofA Merrill Lynch Global Research
Chart 245: Chile - 2100
Source: UN, BofA Merrill Lynch Global Research
2.0 1.0 0.0 1.0 2.00-4
10-1420-2430-3440-4450-5460-6470-7480-8490-94100+
Female Male
2.0 1.0 0.0 1.0 2.00-4
10-1420-2430-3440-4450-5460-6470-7480-8490-94100+
Female Male
2.0 1.0 0.0 1.0 2.00-4
10-1420-2430-3440-4450-5460-6470-7480-8490-94100+
Female Male
10.0 5.0 0.0 5.0 10.00-4
10-1420-2430-3440-4450-5460-6470-7480-8490-94100+
Female Male
10.0 5.0 0.0 5.0 10.00-4
10-1420-2430-3440-4450-5460-6470-7480-8490-94100+
Female Male
10.0 5.0 0.0 5.0 10.00-4
10-1420-2430-3440-4450-5460-6470-7480-8490-94100+
Brazil
Female Male
1.0 0.5 0.0 0.5 1.00-4
10-1420-2430-3440-4450-5460-6470-7480-8490-94100+
Female Male
1.0 0.5 0.0 0.5 1.00-4
10-1420-2430-3440-4450-5460-6470-7480-8490-94100+
Female Male
1.0 0.5 0.0 0.5 1.00-4
10-1420-2430-3440-4450-5460-6470-7480-8490-94100+
Female Male
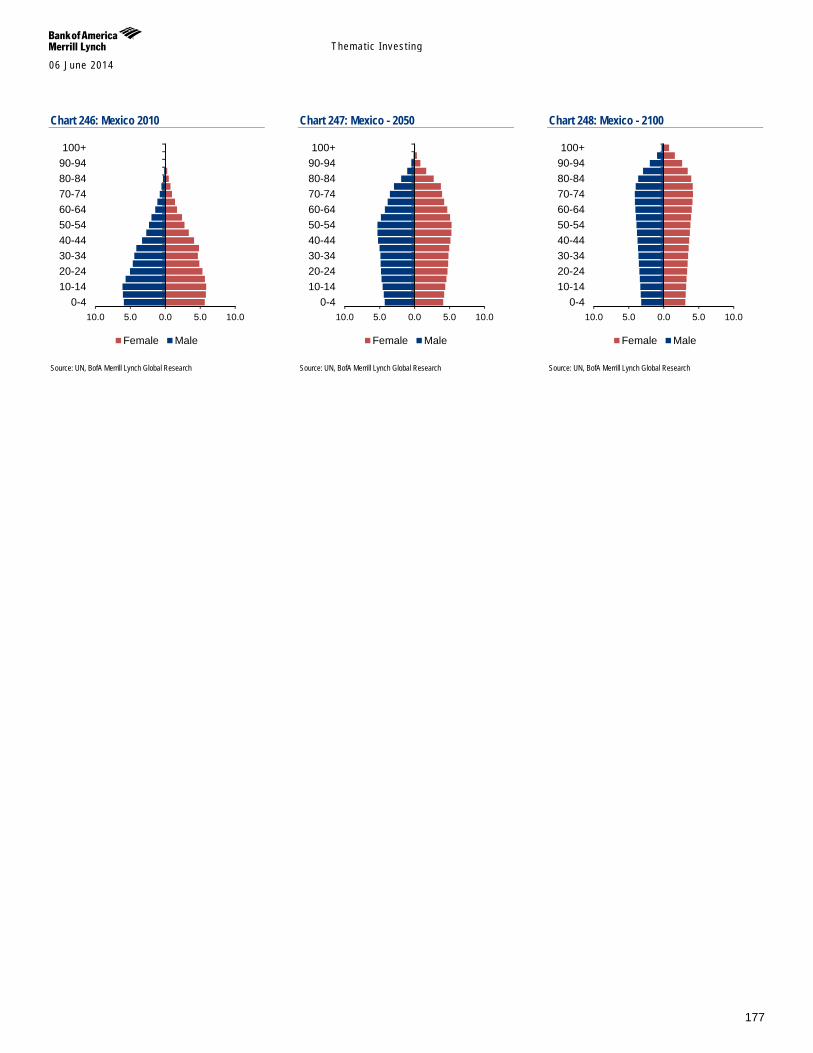
Themat ic Inves t ing 06 June 2014
177
Chart 246: Mexico 2010
Source: UN, BofA Merrill Lynch Global Research
Chart 247: Mexico - 2050
Source: UN, BofA Merrill Lynch Global Research
Chart 248: Mexico - 2100
Source: UN, BofA Merrill Lynch Global Research
10.0 5.0 0.0 5.0 10.00-4
10-1420-2430-3440-4450-5460-6470-7480-8490-94100+
Female Male
10.0 5.0 0.0 5.0 10.00-4
10-1420-2430-3440-4450-5460-6470-7480-8490-94100+
Female Male
10.0 5.0 0.0 5.0 10.00-4
10-1420-2430-3440-4450-5460-6470-7480-8490-94100+
Female Male
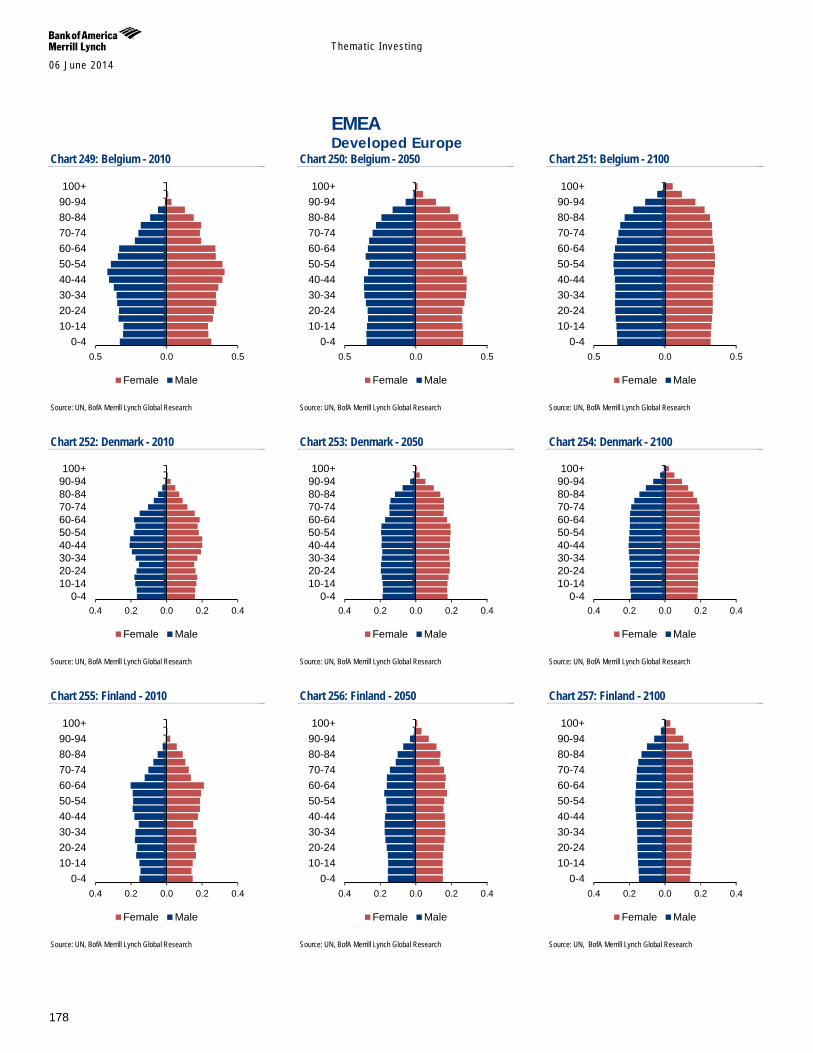
Themat ic Inves t ing 06 June 2014
178
EMEA Developed Europe
Chart 249: Belgium - 2010
Source: UN, BofA Merrill Lynch Global Research
Chart 250: Belgium - 2050
Source: UN, BofA Merrill Lynch Global Research
Chart 251: Belgium - 2100
Source: UN, BofA Merrill Lynch Global Research
Chart 252: Denmark - 2010
Source: UN, BofA Merrill Lynch Global Research
Chart 253: Denmark - 2050
Source: UN, BofA Merrill Lynch Global Research
Chart 254: Denmark - 2100
Source: UN, BofA Merrill Lynch Global Research
Chart 255: Finland - 2010
Source: UN, BofA Merrill Lynch Global Research
Chart 256: Finland - 2050
Source: UN, BofA Merrill Lynch Global Research
Chart 257: Finland - 2100
Source: UN, BofA Merrill Lynch Global Research
0.5 0.0 0.50-4
10-1420-2430-3440-4450-5460-6470-7480-8490-94100+
Female Male
0.5 0.0 0.50-4
10-1420-2430-3440-4450-5460-6470-7480-8490-94100+
Female Male
0.5 0.0 0.50-4
10-1420-2430-3440-4450-5460-6470-7480-8490-94100+
Female Male
0.4 0.2 0.0 0.2 0.40-4
10-1420-2430-3440-4450-5460-6470-7480-8490-94100+
Female Male
0.4 0.2 0.0 0.2 0.40-4
10-1420-2430-3440-4450-5460-6470-7480-8490-94100+
Female Male
0.4 0.2 0.0 0.2 0.40-4
10-1420-2430-3440-4450-5460-6470-7480-8490-94100+
Female Male
0.4 0.2 0.0 0.2 0.40-4
10-1420-2430-3440-4450-5460-6470-7480-8490-94100+
Female Male
0.4 0.2 0.0 0.2 0.40-4
10-1420-2430-3440-4450-5460-6470-7480-8490-94100+
Female Male
0.4 0.2 0.0 0.2 0.40-4
10-1420-2430-3440-4450-5460-6470-7480-8490-94100+
Female Male
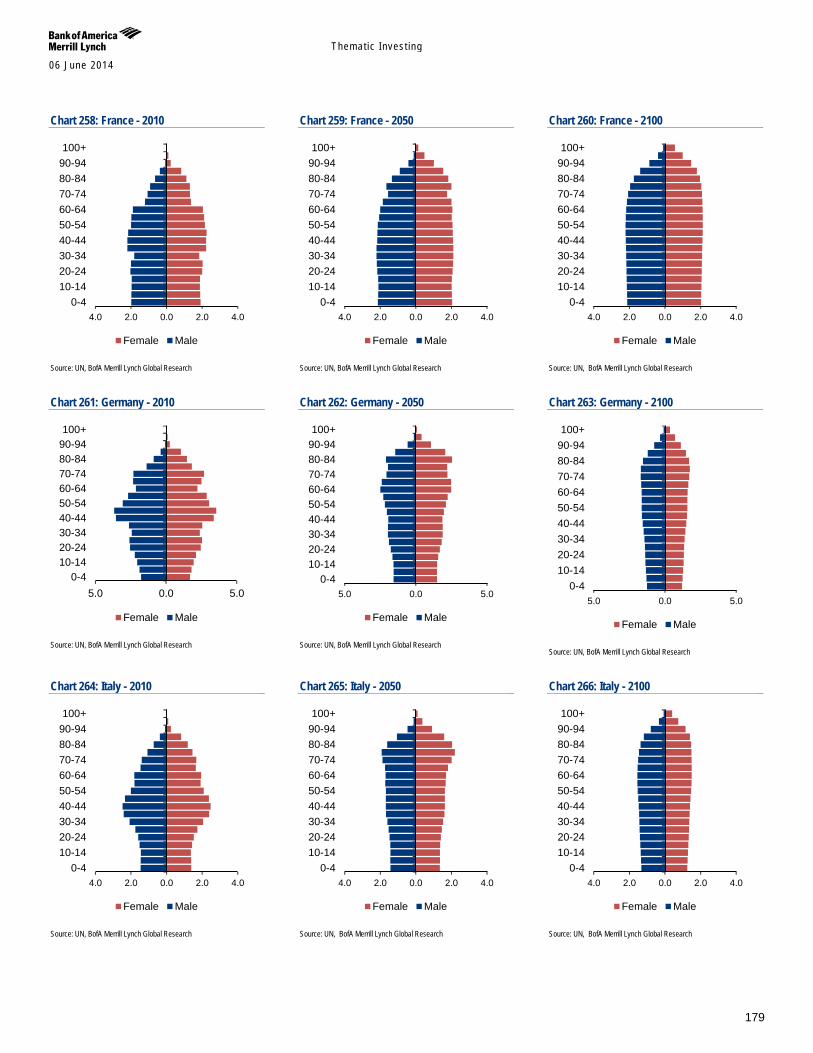
Themat ic Inves t ing 06 June 2014
179
Chart 258: France - 2010
Source: UN, BofA Merrill Lynch Global Research
Chart 259: France - 2050
Source: UN, BofA Merrill Lynch Global Research
Chart 260: France - 2100
Source: UN, BofA Merrill Lynch Global Research
Chart 261: Germany - 2010
Source: UN, BofA Merrill Lynch Global Research
Chart 262: Germany - 2050
Source: UN, BofA Merrill Lynch Global Research
Chart 263: Germany - 2100
Source: UN, BofA Merrill Lynch Global Research
Chart 264: Italy - 2010
Source: UN, BofA Merrill Lynch Global Research
Chart 265: Italy - 2050
Source: UN, BofA Merrill Lynch Global Research
Chart 266: Italy - 2100
Source: UN, BofA Merrill Lynch Global Research
4.0 2.0 0.0 2.0 4.00-4
10-1420-2430-3440-4450-5460-6470-7480-8490-94100+
Female Male
4.0 2.0 0.0 2.0 4.00-4
10-1420-2430-3440-4450-5460-6470-7480-8490-94100+
Female Male
4.0 2.0 0.0 2.0 4.00-4
10-1420-2430-3440-4450-5460-6470-7480-8490-94100+
Female Male
5.0 0.0 5.00-4
10-1420-2430-3440-4450-5460-6470-7480-8490-94100+
Female Male
5.0 0.0 5.00-4
10-1420-2430-3440-4450-5460-6470-7480-8490-94100+
Female Male5.0 0.0 5.0
0-410-1420-2430-3440-4450-5460-6470-7480-8490-94100+
Female Male
4.0 2.0 0.0 2.0 4.00-4
10-1420-2430-3440-4450-5460-6470-7480-8490-94100+
Female Male
4.0 2.0 0.0 2.0 4.00-4
10-1420-2430-3440-4450-5460-6470-7480-8490-94100+
Female Male
4.0 2.0 0.0 2.0 4.00-4
10-1420-2430-3440-4450-5460-6470-7480-8490-94100+
Female Male
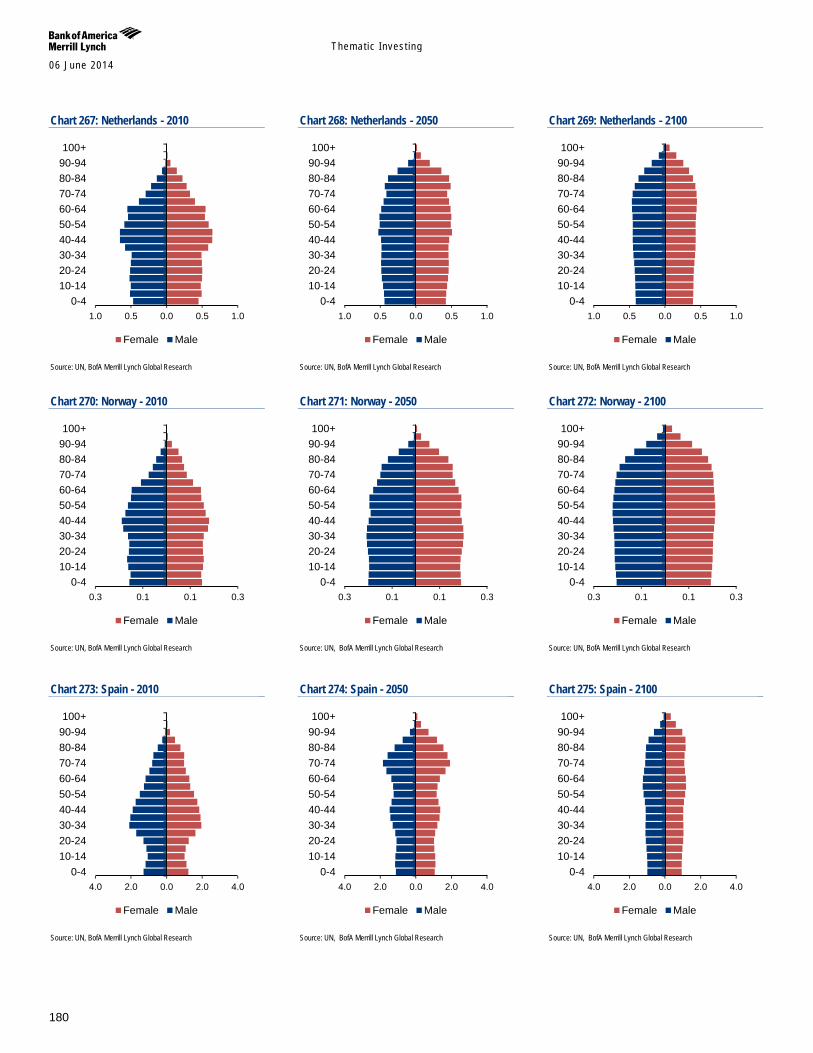
Themat ic Inves t ing 06 June 2014
180
Chart 267: Netherlands - 2010
Source: UN, BofA Merrill Lynch Global Research
Chart 268: Netherlands - 2050
Source: UN, BofA Merrill Lynch Global Research
Chart 269: Netherlands - 2100
Source: UN, BofA Merrill Lynch Global Research
Chart 270: Norway - 2010
Source: UN, BofA Merrill Lynch Global Research
Chart 271: Norway - 2050
Source: UN, BofA Merrill Lynch Global Research
Chart 272: Norway - 2100
Source: UN, BofA Merrill Lynch Global Research
Chart 273: Spain - 2010
Source: UN, BofA Merrill Lynch Global Research
Chart 274: Spain - 2050
Source: UN, BofA Merrill Lynch Global Research
Chart 275: Spain - 2100
Source: UN, BofA Merrill Lynch Global Research
1.0 0.5 0.0 0.5 1.00-4
10-1420-2430-3440-4450-5460-6470-7480-8490-94100+
Female Male
1.0 0.5 0.0 0.5 1.00-4
10-1420-2430-3440-4450-5460-6470-7480-8490-94100+
Female Male
1.0 0.5 0.0 0.5 1.00-4
10-1420-2430-3440-4450-5460-6470-7480-8490-94100+
Female Male
0.3 0.1 0.1 0.30-4
10-1420-2430-3440-4450-5460-6470-7480-8490-94100+
Female Male
0.3 0.1 0.1 0.30-4
10-1420-2430-3440-4450-5460-6470-7480-8490-94100+
Female Male
0.3 0.1 0.1 0.30-4
10-1420-2430-3440-4450-5460-6470-7480-8490-94100+
Female Male
4.0 2.0 0.0 2.0 4.00-4
10-1420-2430-3440-4450-5460-6470-7480-8490-94100+
Female Male
4.0 2.0 0.0 2.0 4.00-4
10-1420-2430-3440-4450-5460-6470-7480-8490-94100+
Female Male
4.0 2.0 0.0 2.0 4.00-4
10-1420-2430-3440-4450-5460-6470-7480-8490-94100+
Female Male
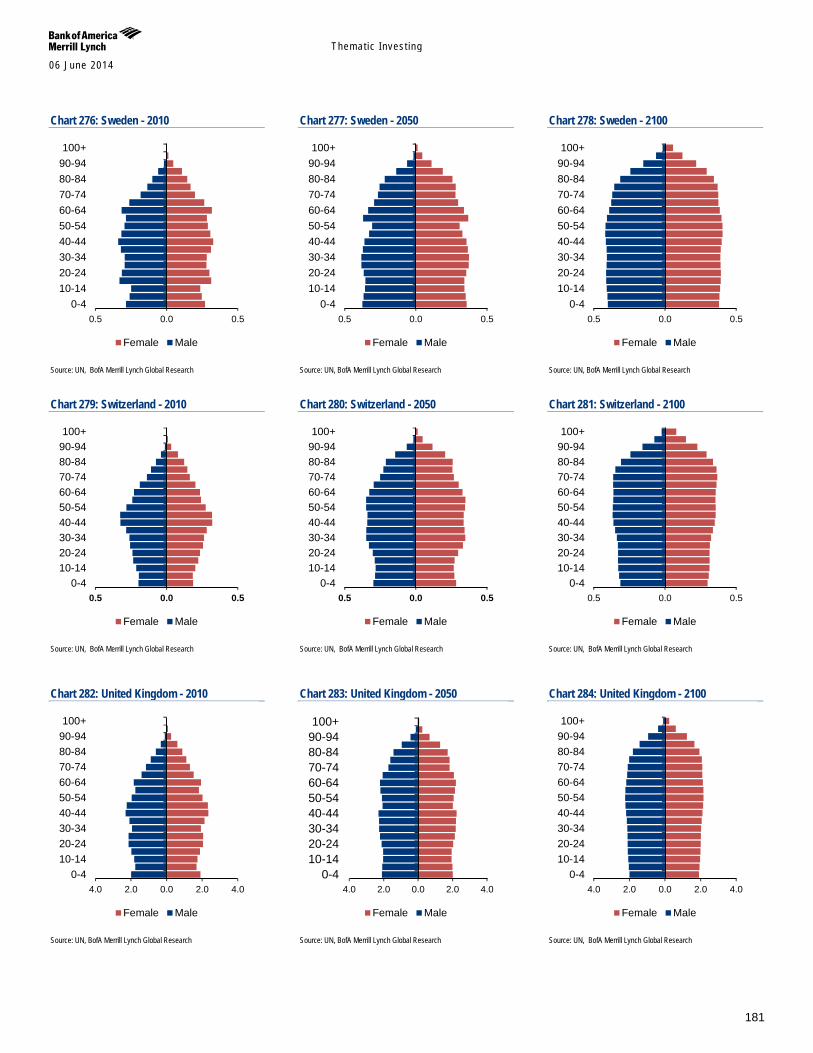
Themat ic Inves t ing 06 June 2014
181
Chart 276: Sweden - 2010
Source: UN, BofA Merrill Lynch Global Research
Chart 277: Sweden - 2050
Source: UN, BofA Merrill Lynch Global Research
Chart 278: Sweden - 2100
Source: UN, BofA Merrill Lynch Global Research
Chart 279: Switzerland - 2010
Source: UN, BofA Merrill Lynch Global Research
Chart 280: Switzerland - 2050
Source: UN, BofA Merrill Lynch Global Research
Chart 281: Switzerland - 2100
Source: UN, BofA Merrill Lynch Global Research
Chart 282: United Kingdom - 2010
Source: UN, BofA Merrill Lynch Global Research
Chart 283: United Kingdom - 2050
Source: UN, BofA Merrill Lynch Global Research
Chart 284: United Kingdom - 2100
Source: UN, BofA Merrill Lynch Global Research
0.5 0.0 0.50-4
10-1420-2430-3440-4450-5460-6470-7480-8490-94100+
Female Male
0.5 0.0 0.50-4
10-1420-2430-3440-4450-5460-6470-7480-8490-94100+
Female Male
0.5 0.0 0.50-4
10-1420-2430-3440-4450-5460-6470-7480-8490-94100+
Female Male
0.5 0.0 0.50-4
10-1420-2430-3440-4450-5460-6470-7480-8490-94100+
Female Male
0.5 0.0 0.50-4
10-1420-2430-3440-4450-5460-6470-7480-8490-94100+
Female Male
0.5 0.0 0.50-4
10-1420-2430-3440-4450-5460-6470-7480-8490-94100+
Female Male
4.0 2.0 0.0 2.0 4.00-4
10-1420-2430-3440-4450-5460-6470-7480-8490-94100+
Female Male
4.0 2.0 0.0 2.0 4.00-4
10-1420-2430-3440-4450-5460-6470-7480-8490-94100+
Female Male
4.0 2.0 0.0 2.0 4.00-4
10-1420-2430-3440-4450-5460-6470-7480-8490-94100+
Female Male
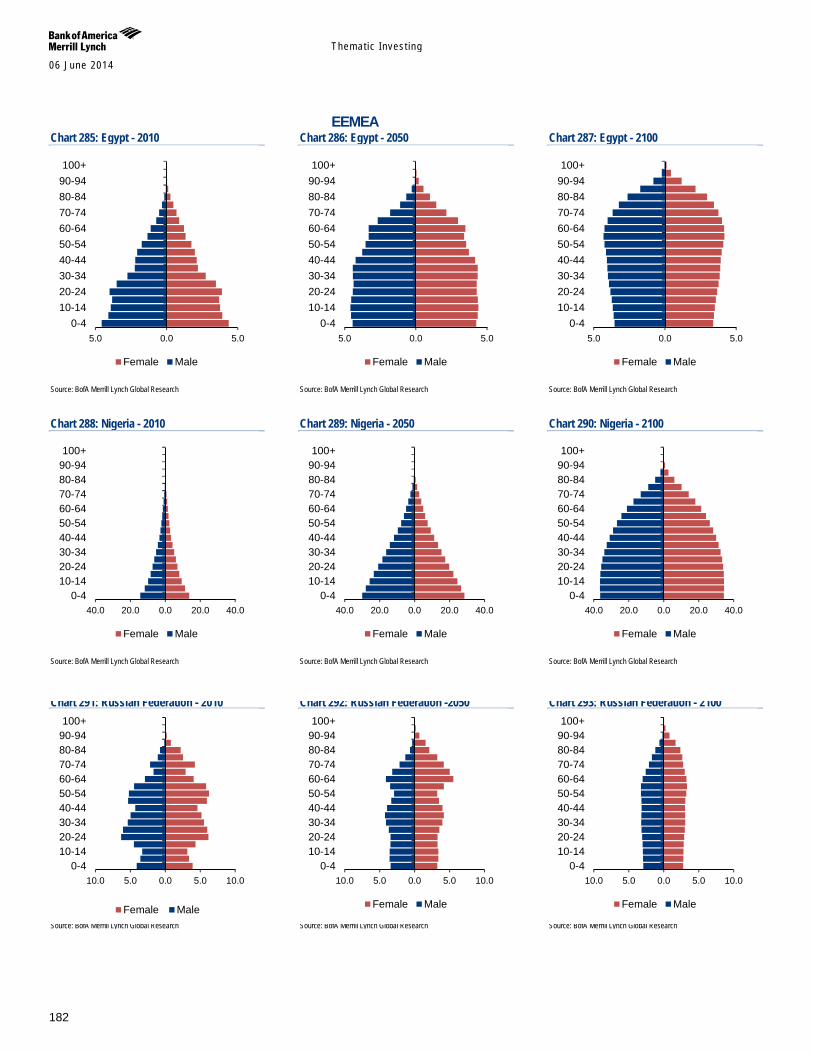
Themat ic Inves t ing 06 June 2014
182
EEMEA Chart 285: Egypt - 2010
Source: BofA Merrill Lynch Global Research
Chart 286: Egypt - 2050
Source: BofA Merrill Lynch Global Research
Chart 287: Egypt - 2100
Source: BofA Merrill Lynch Global Research
Chart 288: Nigeria - 2010
Source: BofA Merrill Lynch Global Research
Chart 289: Nigeria - 2050
Source: BofA Merrill Lynch Global Research
Chart 290: Nigeria - 2100
Source: BofA Merrill Lynch Global Research
Chart 291: Russian Federation - 2010
Source: BofA Merrill Lynch Global Research
Chart 292: Russian Federation -2050
Source: BofA Merrill Lynch Global Research
Chart 293: Russian Federation - 2100
Source: BofA Merrill Lynch Global Research
5.0 0.0 5.00-4
10-1420-2430-3440-4450-5460-6470-7480-8490-94100+
Female Male
5.0 0.0 5.00-4
10-1420-2430-3440-4450-5460-6470-7480-8490-94100+
Female Male
5.0 0.0 5.00-4
10-1420-2430-3440-4450-5460-6470-7480-8490-94100+
Female Male
40.0 20.0 0.0 20.0 40.00-4
10-1420-2430-3440-4450-5460-6470-7480-8490-94100+
Female Male
40.0 20.0 0.0 20.0 40.00-4
10-1420-2430-3440-4450-5460-6470-7480-8490-94100+
Female Male
40.0 20.0 0.0 20.0 40.00-4
10-1420-2430-3440-4450-5460-6470-7480-8490-94100+
Female Male
10.0 5.0 0.0 5.0 10.00-4
10-1420-2430-3440-4450-5460-6470-7480-8490-94100+
Female Male
10.0 5.0 0.0 5.0 10.00-4
10-1420-2430-3440-4450-5460-6470-7480-8490-94100+
Female Male
10.0 5.0 0.0 5.0 10.00-4
10-1420-2430-3440-4450-5460-6470-7480-8490-94100+
Female Male
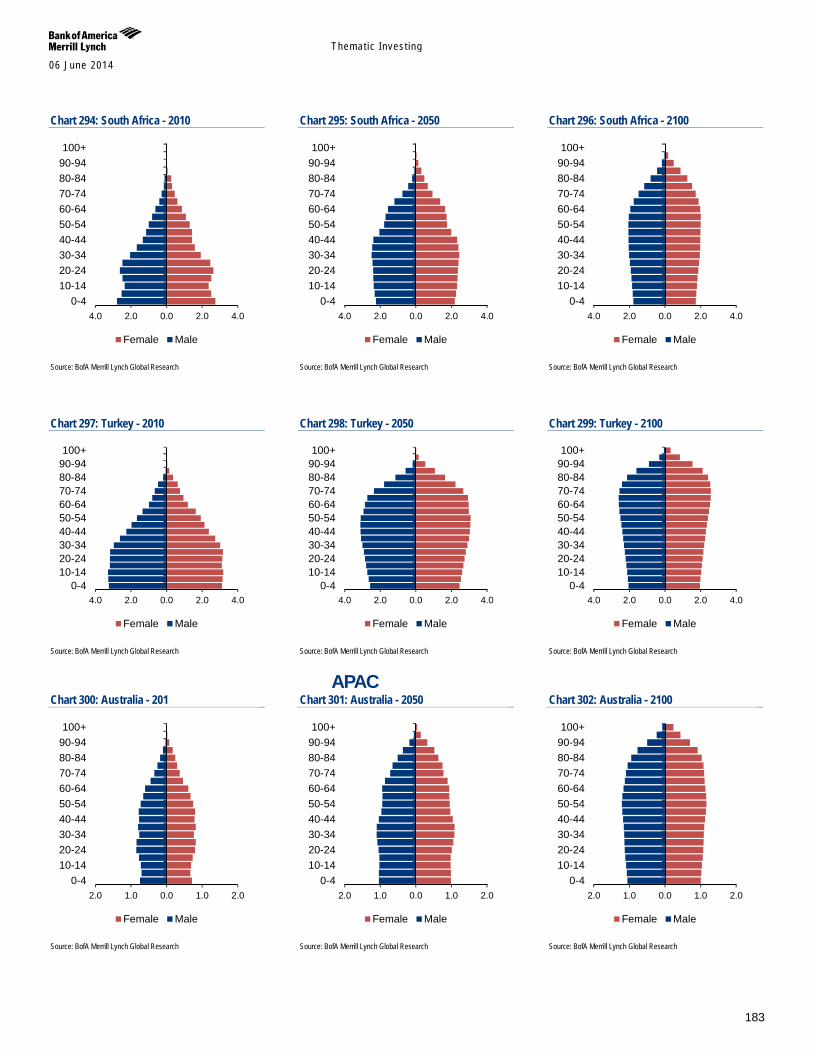
Themat ic Inves t ing 06 June 2014
183
Chart 294: South Africa - 2010
Source: BofA Merrill Lynch Global Research
Chart 295: South Africa - 2050
Source: BofA Merrill Lynch Global Research
Chart 296: South Africa - 2100
Source: BofA Merrill Lynch Global Research
Chart 297: Turkey - 2010
Source: BofA Merrill Lynch Global Research
Chart 298: Turkey - 2050
Source: BofA Merrill Lynch Global Research
Chart 299: Turkey - 2100
Source: BofA Merrill Lynch Global Research
APAC Chart 300: Australia - 201
Source: BofA Merrill Lynch Global Research
Chart 301: Australia - 2050
Source: BofA Merrill Lynch Global Research
Chart 302: Australia - 2100
Source: BofA Merrill Lynch Global Research
4.0 2.0 0.0 2.0 4.00-4
10-1420-2430-3440-4450-5460-6470-7480-8490-94100+
Female Male
4.0 2.0 0.0 2.0 4.00-4
10-1420-2430-3440-4450-5460-6470-7480-8490-94100+
Female Male
4.0 2.0 0.0 2.0 4.00-4
10-1420-2430-3440-4450-5460-6470-7480-8490-94100+
Female Male
4.0 2.0 0.0 2.0 4.00-4
10-1420-2430-3440-4450-5460-6470-7480-8490-94100+
Female Male
4.0 2.0 0.0 2.0 4.00-4
10-1420-2430-3440-4450-5460-6470-7480-8490-94100+
Female Male
4.0 2.0 0.0 2.0 4.00-4
10-1420-2430-3440-4450-5460-6470-7480-8490-94100+
Female Male
2.0 1.0 0.0 1.0 2.00-4
10-1420-2430-3440-4450-5460-6470-7480-8490-94100+
Female Male
2.0 1.0 0.0 1.0 2.00-4
10-1420-2430-3440-4450-5460-6470-7480-8490-94100+
Female Male
2.0 1.0 0.0 1.0 2.00-4
10-1420-2430-3440-4450-5460-6470-7480-8490-94100+
Female Male
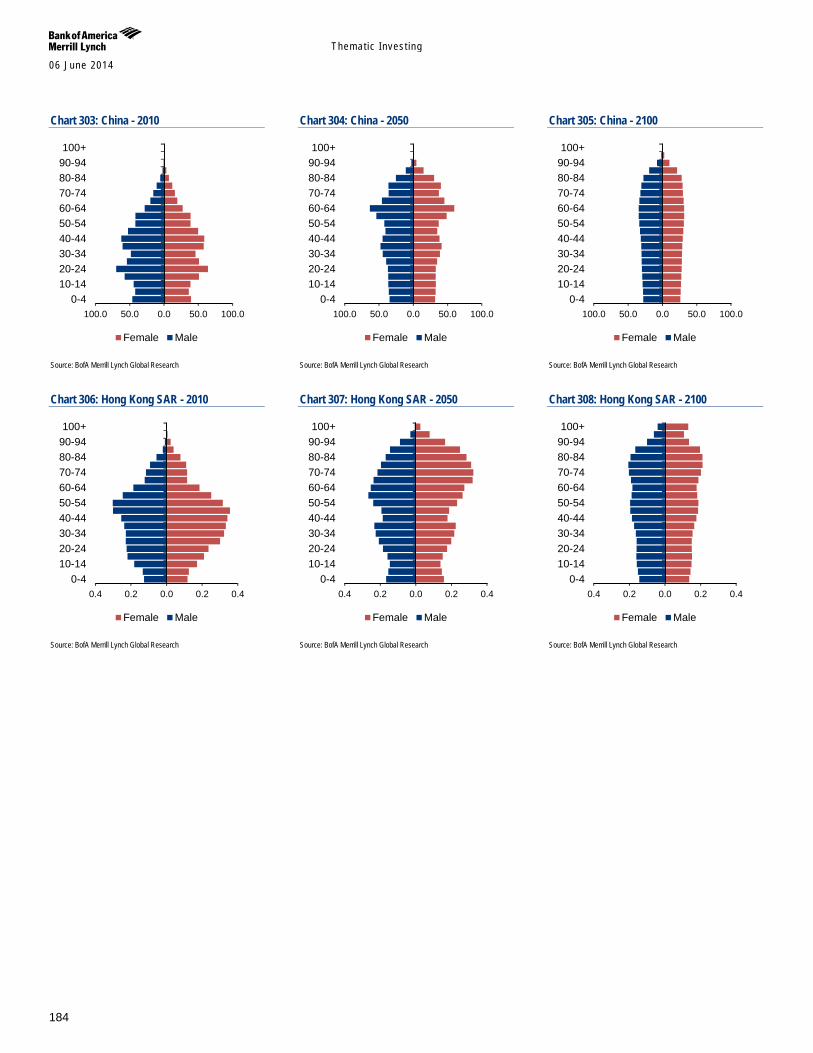
Themat ic Inves t ing 06 June 2014
184
Chart 303: China - 2010
Source: BofA Merrill Lynch Global Research
Chart 304: China - 2050
Source: BofA Merrill Lynch Global Research
Chart 305: China - 2100
Source: BofA Merrill Lynch Global Research
Chart 306: Hong Kong SAR - 2010
Source: BofA Merrill Lynch Global Research
Chart 307: Hong Kong SAR - 2050
Source: BofA Merrill Lynch Global Research
Chart 308: Hong Kong SAR - 2100
Source: BofA Merrill Lynch Global Research
100.0 50.0 0.0 50.0 100.00-4
10-1420-2430-3440-4450-5460-6470-7480-8490-94100+
Female Male
100.0 50.0 0.0 50.0 100.00-4
10-1420-2430-3440-4450-5460-6470-7480-8490-94100+
Female Male
100.0 50.0 0.0 50.0 100.00-4
10-1420-2430-3440-4450-5460-6470-7480-8490-94100+
Female Male
0.4 0.2 0.0 0.2 0.40-4
10-1420-2430-3440-4450-5460-6470-7480-8490-94100+
Female Male
0.4 0.2 0.0 0.2 0.40-4
10-1420-2430-3440-4450-5460-6470-7480-8490-94100+
Female Male
0.4 0.2 0.0 0.2 0.40-4
10-1420-2430-3440-4450-5460-6470-7480-8490-94100+
Female Male
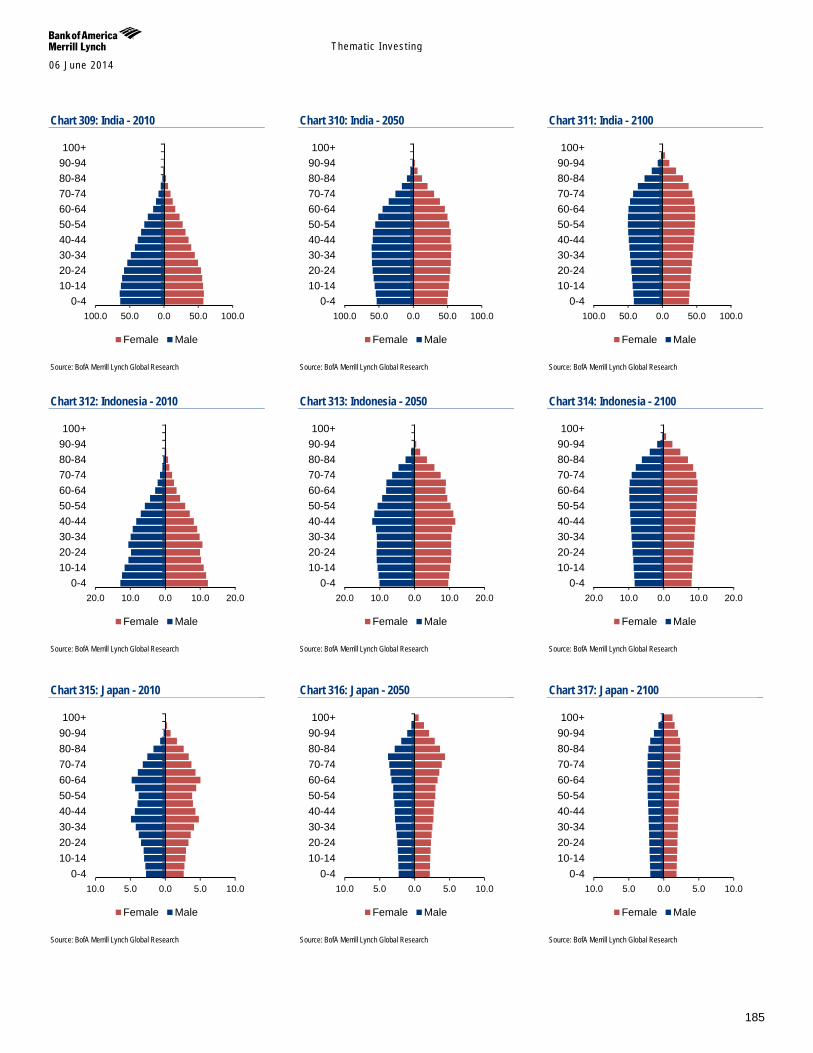
Themat ic Inves t ing 06 June 2014
185
Chart 309: India - 2010
Source: BofA Merrill Lynch Global Research
Chart 310: India - 2050
Source: BofA Merrill Lynch Global Research
Chart 311: India - 2100
Source: BofA Merrill Lynch Global Research
Chart 312: Indonesia - 2010
Source: BofA Merrill Lynch Global Research
Chart 313: Indonesia - 2050
Source: BofA Merrill Lynch Global Research
Chart 314: Indonesia - 2100
Source: BofA Merrill Lynch Global Research
Chart 315: Japan - 2010
Source: BofA Merrill Lynch Global Research
Chart 316: Japan - 2050
Source: BofA Merrill Lynch Global Research
Chart 317: Japan - 2100
Source: BofA Merrill Lynch Global Research
100.0 50.0 0.0 50.0 100.00-4
10-1420-2430-3440-4450-5460-6470-7480-8490-94100+
Female Male
100.0 50.0 0.0 50.0 100.00-4
10-1420-2430-3440-4450-5460-6470-7480-8490-94100+
Female Male
100.0 50.0 0.0 50.0 100.00-4
10-1420-2430-3440-4450-5460-6470-7480-8490-94100+
Female Male
20.0 10.0 0.0 10.0 20.00-4
10-1420-2430-3440-4450-5460-6470-7480-8490-94100+
Female Male
20.0 10.0 0.0 10.0 20.00-4
10-1420-2430-3440-4450-5460-6470-7480-8490-94100+
Female Male
20.0 10.0 0.0 10.0 20.00-4
10-1420-2430-3440-4450-5460-6470-7480-8490-94100+
Female Male
10.0 5.0 0.0 5.0 10.00-4
10-1420-2430-3440-4450-5460-6470-7480-8490-94100+
Female Male
10.0 5.0 0.0 5.0 10.00-4
10-1420-2430-3440-4450-5460-6470-7480-8490-94100+
Female Male
10.0 5.0 0.0 5.0 10.00-4
10-1420-2430-3440-4450-5460-6470-7480-8490-94100+
Female Male
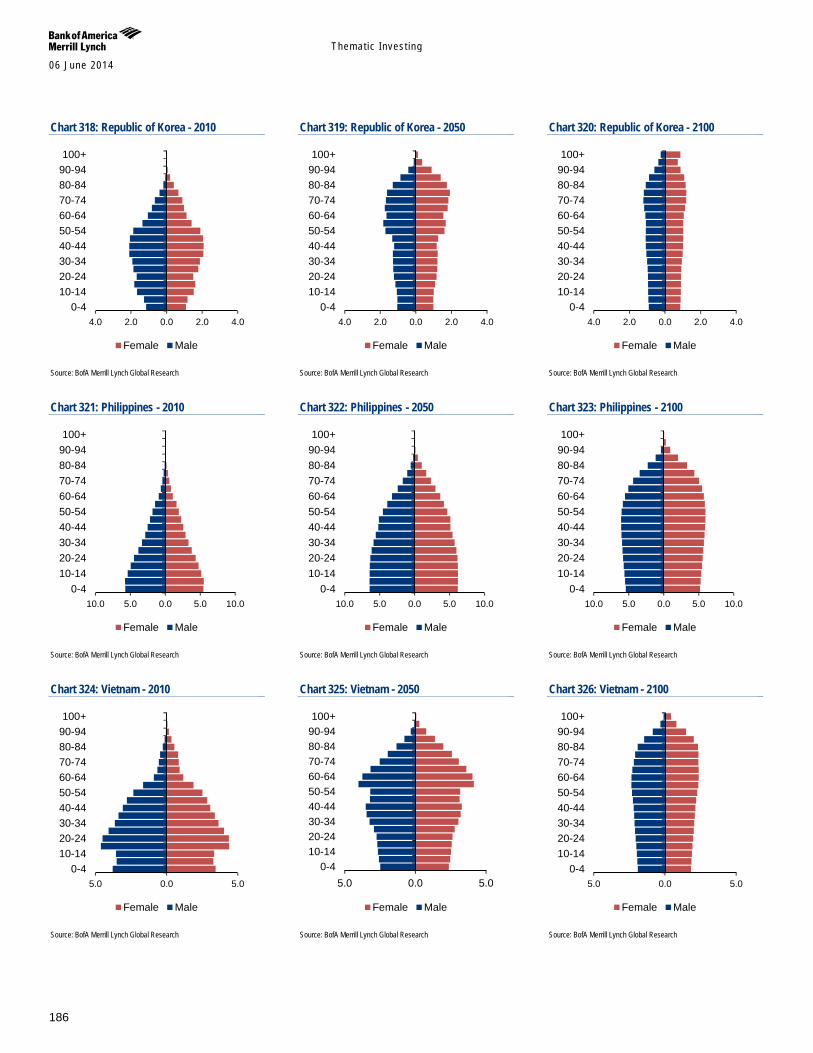
Themat ic Inves t ing 06 June 2014
186
Chart 318: Republic of Korea - 2010
Source: BofA Merrill Lynch Global Research
Chart 319: Republic of Korea - 2050
Source: BofA Merrill Lynch Global Research
Chart 320: Republic of Korea - 2100
Source: BofA Merrill Lynch Global Research
Chart 321: Philippines - 2010
Source: BofA Merrill Lynch Global Research
Chart 322: Philippines - 2050
Source: BofA Merrill Lynch Global Research
Chart 323: Philippines - 2100
Source: BofA Merrill Lynch Global Research
Chart 324: Vietnam - 2010
Source: BofA Merrill Lynch Global Research
Chart 325: Vietnam - 2050
Source: BofA Merrill Lynch Global Research
Chart 326: Vietnam - 2100
Source: BofA Merrill Lynch Global Research
4.0 2.0 0.0 2.0 4.00-4
10-1420-2430-3440-4450-5460-6470-7480-8490-94100+
Female Male
4.0 2.0 0.0 2.0 4.00-4
10-1420-2430-3440-4450-5460-6470-7480-8490-94100+
Female Male
4.0 2.0 0.0 2.0 4.00-4
10-1420-2430-3440-4450-5460-6470-7480-8490-94100+
Female Male
10.0 5.0 0.0 5.0 10.00-4
10-1420-2430-3440-4450-5460-6470-7480-8490-94100+
Female Male
10.0 5.0 0.0 5.0 10.00-4
10-1420-2430-3440-4450-5460-6470-7480-8490-94100+
Female Male
10.0 5.0 0.0 5.0 10.00-4
10-1420-2430-3440-4450-5460-6470-7480-8490-94100+
Female Male
5.0 0.0 5.00-4
10-1420-2430-3440-4450-5460-6470-7480-8490-94100+
Female Male
5.0 0.0 5.00-4
10-1420-2430-3440-4450-5460-6470-7480-8490-94100+
Female Male
5.0 0.0 5.00-4
10-1420-2430-3440-4450-5460-6470-7480-8490-94100+
Female Male
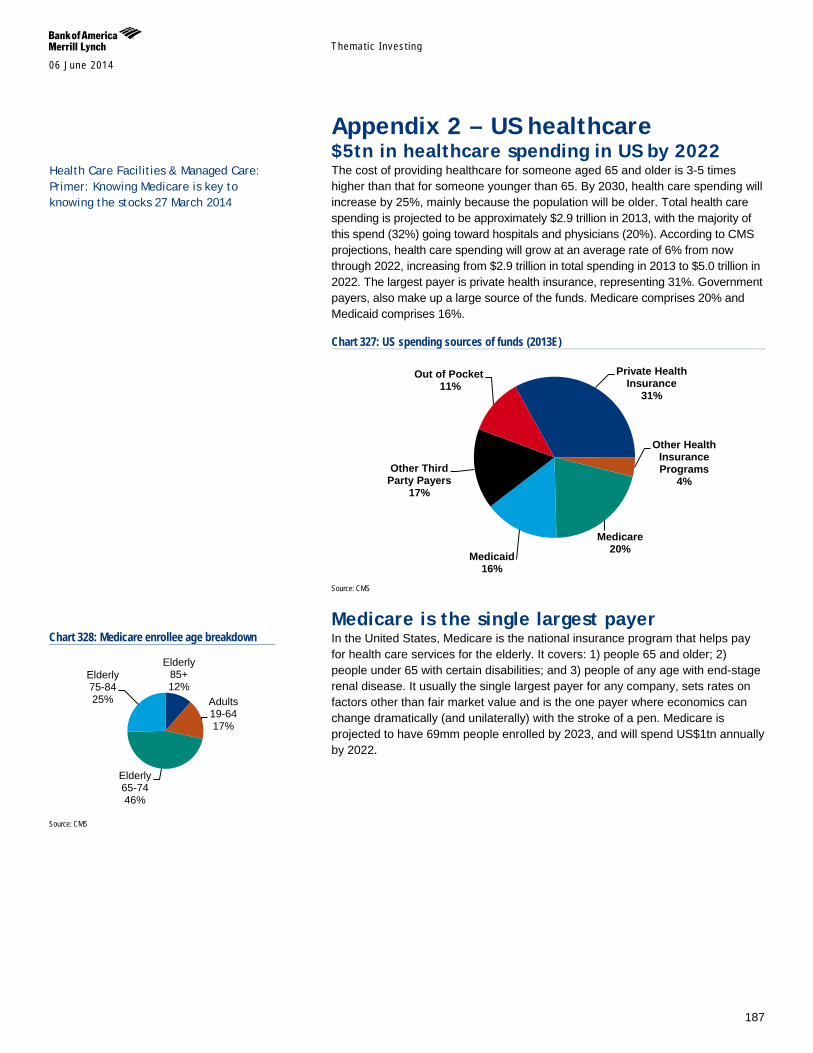
Themat ic Inves t ing 06 June 2014
187
Appendix 2 – US healthcare $5tn in healthcare spending in US by 2022 The cost of providing healthcare for someone aged 65 and older is 3-5 times higher than that for someone younger than 65. By 2030, health care spending will increase by 25%, mainly because the population will be older. Total health care spending is projected to be approximately $2.9 trillion in 2013, with the majority of this spend (32%) going toward hospitals and physicians (20%). According to CMS projections, health care spending will grow at an average rate of 6% from now through 2022, increasing from $2.9 trillion in total spending in 2013 to $5.0 trillion in 2022. The largest payer is private health insurance, representing 31%. Government payers, also make up a large source of the funds. Medicare comprises 20% and Medicaid comprises 16%.
Chart 327: US spending sources of funds (2013E)
Source: CMS
Medicare is the single largest payer In the United States, Medicare is the national insurance program that helps pay for health care services for the elderly. It covers: 1) people 65 and older; 2) people under 65 with certain disabilities; and 3) people of any age with end-stage renal disease. It usually the single largest payer for any company, sets rates on factors other than fair market value and is the one payer where economics can change dramatically (and unilaterally) with the stroke of a pen. Medicare is projected to have 69mm people enrolled by 2023, and will spend US$1tn annually by 2022.
Private Health Insurance
31%
Other Health Insurance Programs
4%
Medicare 20%
Medicaid 16%
Other Third Party Payers
17%
Out of Pocket 11%
Chart 328: Medicare enrollee age breakdown
Source: CMS
Elderly 85+ 12%
Adults 19-64 17%
Elderly 65-74 46%
Elderly 75-84 25%
Health Care Facilities & Managed Care: Primer: Knowing Medicare is key to knowing the stocks 27 March 2014
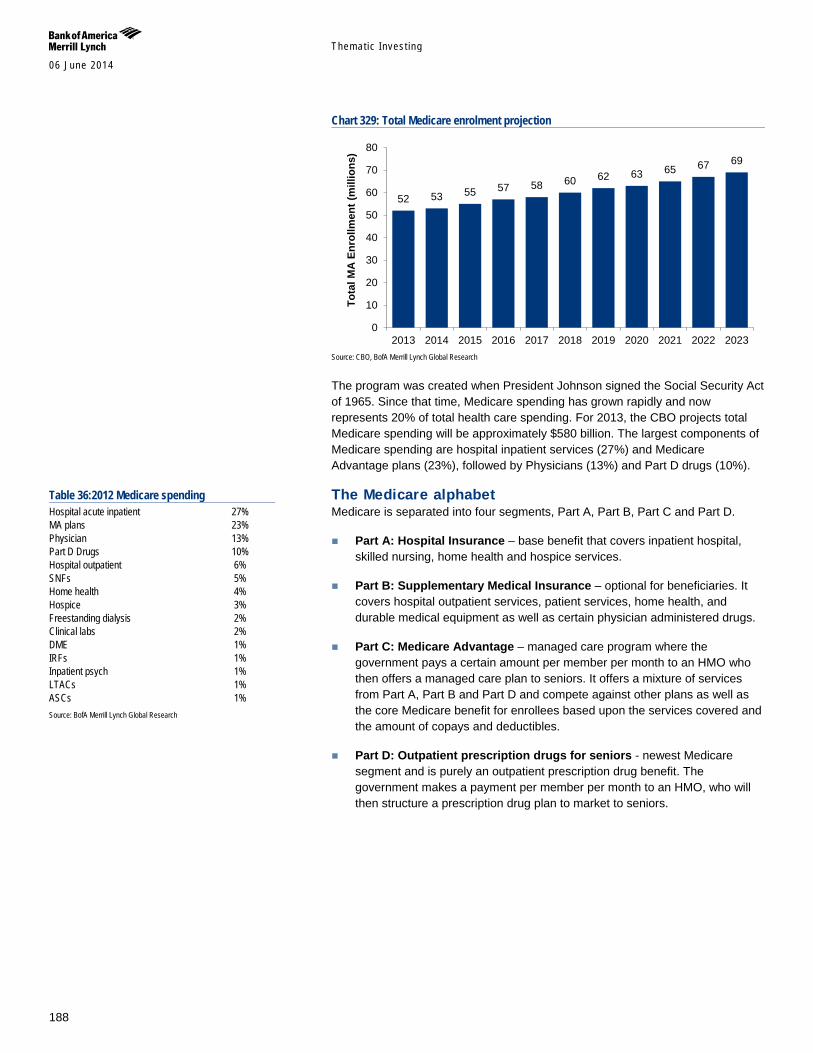
Themat ic Inves t ing 06 June 2014
188
Chart 329: Total Medicare enrolment projection
Source: CBO, BofA Merrill Lynch Global Research
The program was created when President Johnson signed the Social Security Act of 1965. Since that time, Medicare spending has grown rapidly and now represents 20% of total health care spending. For 2013, the CBO projects total Medicare spending will be approximately $580 billion. The largest components of Medicare spending are hospital inpatient services (27%) and Medicare Advantage plans (23%), followed by Physicians (13%) and Part D drugs (10%).
The Medicare alphabet Medicare is separated into four segments, Part A, Part B, Part C and Part D.
Part A: Hospital Insurance – base benefit that covers inpatient hospital, skilled nursing, home health and hospice services.
Part B: Supplementary Medical Insurance – optional for beneficiaries. It covers hospital outpatient services, patient services, home health, and durable medical equipment as well as certain physician administered drugs.
Part C: Medicare Advantage – managed care program where the government pays a certain amount per member per month to an HMO who then offers a managed care plan to seniors. It offers a mixture of services from Part A, Part B and Part D and compete against other plans as well as the core Medicare benefit for enrollees based upon the services covered and the amount of copays and deductibles.
Part D: Outpatient prescription drugs for seniors - newest Medicare segment and is purely an outpatient prescription drug benefit. The government makes a payment per member per month to an HMO, who will then structure a prescription drug plan to market to seniors.
52 53 55 57 58 60 62 63 65 67 69
0
10
20
30
40
50
60
70
80
2013 2014 2015 2016 2017 2018 2019 2020 2021 2022 2023To
tal M
A En
rollm
ent (
mill
ions
)
Table 36:2012 Medicare spending Hospital acute inpatient 27% MA plans 23% Physician 13% Part D Drugs 10% Hospital outpatient 6% SNFs 5% Home health 4% Hospice 3% Freestanding dialysis 2% Clinical labs 2% DME 1% IRFs 1% Inpatient psych 1% LTACs 1% ASCs 1% Source: BofA Merrill Lynch Global Research

Themat ic Inves t ing 06 June 2014
189
Chart 330: Total Medicare spending since 1965 ($ millions)
Source: CMS
US$1tn Medicare spending by 2022 Medicare spending in the US is projected to be increase from US$555bn in 2011 to US$1tn in 2022 (Source: CMS). People with chronic illnesses often have multiple health issues. For example, someone with diabetes will often also have hypertension, heart disease, chronic respiratory disease and arthritis. While death is unavoidable, physical and mental decline associated with illnesses can be delayed or even prevented.
Managed care helps control cost of healthcare Managed care organizations (MCOs) provide and administer health insurance through risk-based and administrative services only (ASO) products. Most of the publicly traded companies primarily focus on the U.S. managed care industry, which has a market size of over $770 billion. There are multiple products in the managed care industry with fundamentally different characteristics. Accordingly, it is important to recognize the varying product mixes at the publicly traded companies when analyzing industry trends.
There are three main business categories:
Medicare – health insurance (Medicare Advantage) and drug coverage (Medicare Part D) for seniors (65+). MCOs also sell Medigap plans (also known as Medicare Supplement Insurance), which supplement government-run Medicare coverage.
Commercial – health insurance for employees and individuals/families. Currently covering approximately 186 million employees and individuals/families.
Medicaid – health insurance for low income individuals.
$0
$200
$400
$600
$800
$1,000
$1,200
1965
1967
1969
1971
1973
1975
1977
1979
1981
1983
1985
1987
1989
1991
1993
1995
1997
1999
2001
2003
2005
2007
2009
2011
2013
2015
2017
2019
2021
Total Medicare Spending
Move to PPS
Balanced Budget Act of 1997
Balanced Budget Refinement Act of 1999
Benefits Improvement and Protection Act of 2000
Patient Protection and Affordable Care Act
Managed Care: Managed Care Primer 2014 – Analyzing a sector in transition 22 April 2014
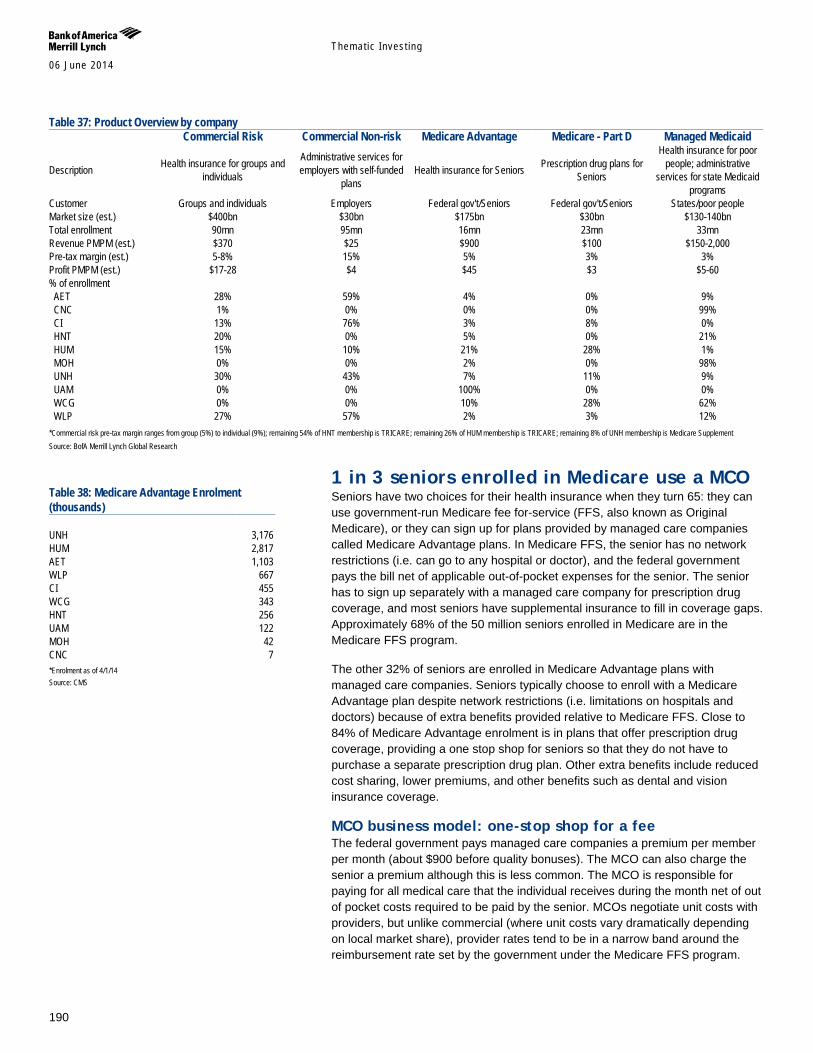
Themat ic Inves t ing 06 June 2014
190
Table 37: Product Overview by company Commercial Risk Commercial Non-risk Medicare Advantage Medicare - Part D Managed Medicaid
Description Health insurance for groups and individuals
Administrative services for employers with self-funded
plans Health insurance for Seniors Prescription drug plans for
Seniors
Health insurance for poor people; administrative
services for state Medicaid programs
Customer Groups and individuals Employers Federal gov't/Seniors Federal gov't/Seniors States/poor people Market size (est.) $400bn $30bn $175bn $30bn $130-140bn Total enrollment 90mn 95mn 16mn 23mn 33mn Revenue PMPM (est.) $370 $25 $900 $100 $150-2,000 Pre-tax margin (est.) 5-8% 15% 5% 3% 3% Profit PMPM (est.) $17-28 $4 $45 $3 $5-60 % of enrollment AET 28% 59% 4% 0% 9% CNC 1% 0% 0% 0% 99% CI 13% 76% 3% 8% 0% HNT 20% 0% 5% 0% 21% HUM 15% 10% 21% 28% 1% MOH 0% 0% 2% 0% 98% UNH 30% 43% 7% 11% 9% UAM 0% 0% 100% 0% 0% WCG 0% 0% 10% 28% 62% WLP 27% 57% 2% 3% 12% *Commercial risk pre-tax margin ranges from group (5%) to individual (9%); remaining 54% of HNT membership is TRICARE; remaining 26% of HUM membership is TRICARE; remaining 8% of UNH membership is Medicare Supplement Source: BofA Merrill Lynch Global Research
1 in 3 seniors enrolled in Medicare use a MCO Seniors have two choices for their health insurance when they turn 65: they can use government-run Medicare fee for-service (FFS, also known as Original Medicare), or they can sign up for plans provided by managed care companies called Medicare Advantage plans. In Medicare FFS, the senior has no network restrictions (i.e. can go to any hospital or doctor), and the federal government pays the bill net of applicable out-of-pocket expenses for the senior. The senior has to sign up separately with a managed care company for prescription drug coverage, and most seniors have supplemental insurance to fill in coverage gaps. Approximately 68% of the 50 million seniors enrolled in Medicare are in the Medicare FFS program.
The other 32% of seniors are enrolled in Medicare Advantage plans with managed care companies. Seniors typically choose to enroll with a Medicare Advantage plan despite network restrictions (i.e. limitations on hospitals and doctors) because of extra benefits provided relative to Medicare FFS. Close to 84% of Medicare Advantage enrolment is in plans that offer prescription drug coverage, providing a one stop shop for seniors so that they do not have to purchase a separate prescription drug plan. Other extra benefits include reduced cost sharing, lower premiums, and other benefits such as dental and vision insurance coverage.
MCO business model: one-stop shop for a fee The federal government pays managed care companies a premium per member per month (about $900 before quality bonuses). The MCO can also charge the senior a premium although this is less common. The MCO is responsible for paying for all medical care that the individual receives during the month net of out of pocket costs required to be paid by the senior. MCOs negotiate unit costs with providers, but unlike commercial (where unit costs vary dramatically depending on local market share), provider rates tend to be in a narrow band around the reimbursement rate set by the government under the Medicare FFS program.
Table 38: Medicare Advantage Enrolment (thousands) UNH 3,176 HUM 2,817 AET 1,103 WLP 667 CI 455 WCG 343 HNT 256 UAM 122 MOH 42 CNC 7 *Enrolment as of 4/1/14 Source: CMS
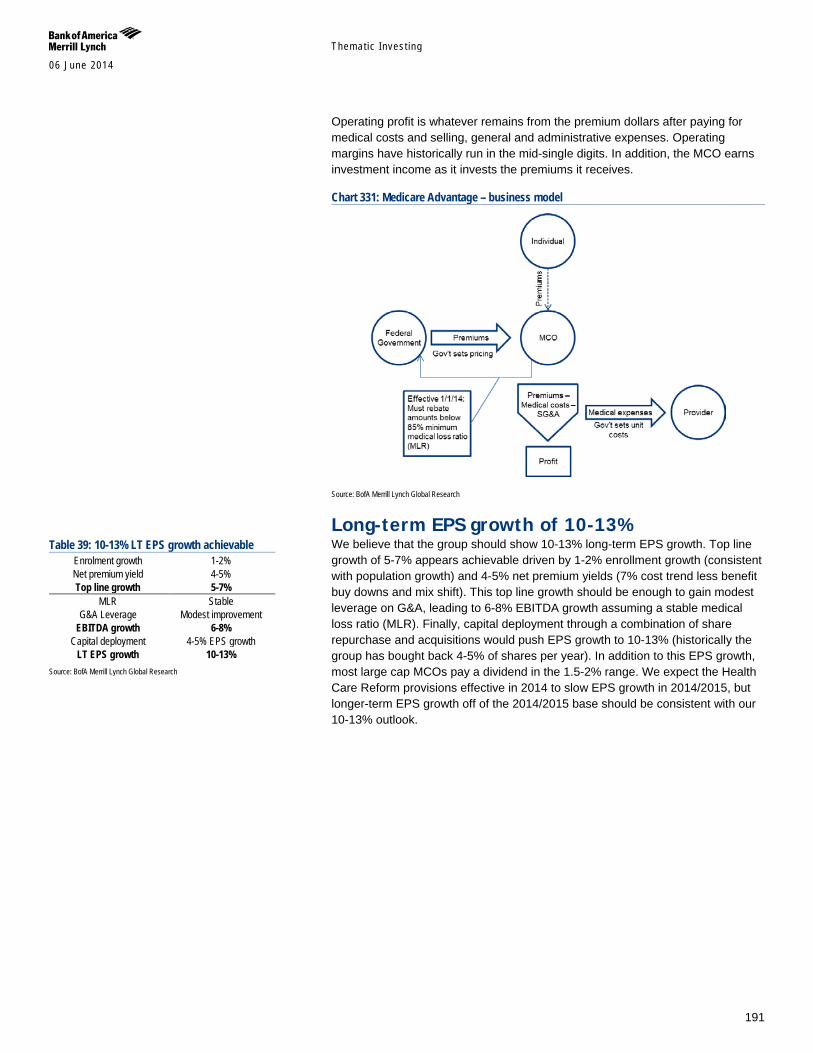
Themat ic Inves t ing 06 June 2014
191
Operating profit is whatever remains from the premium dollars after paying for medical costs and selling, general and administrative expenses. Operating margins have historically run in the mid-single digits. In addition, the MCO earns investment income as it invests the premiums it receives.
Chart 331: Medicare Advantage – business model
Source: BofA Merrill Lynch Global Research
Long-term EPS growth of 10-13% We believe that the group should show 10-13% long-term EPS growth. Top line growth of 5-7% appears achievable driven by 1-2% enrollment growth (consistent with population growth) and 4-5% net premium yields (7% cost trend less benefit buy downs and mix shift). This top line growth should be enough to gain modest leverage on G&A, leading to 6-8% EBITDA growth assuming a stable medical loss ratio (MLR). Finally, capital deployment through a combination of share repurchase and acquisitions would push EPS growth to 10-13% (historically the group has bought back 4-5% of shares per year). In addition to this EPS growth, most large cap MCOs pay a dividend in the 1.5-2% range. We expect the Health Care Reform provisions effective in 2014 to slow EPS growth in 2014/2015, but longer-term EPS growth off of the 2014/2015 base should be consistent with our 10-13% outlook.
Table 39: 10-13% LT EPS growth achievable Enrolment growth 1-2% Net premium yield 4-5% Top line growth 5-7%
MLR Stable G&A Leverage Modest improvement
EBITDA growth 6-8% Capital deployment 4-5% EPS growth
LT EPS growth 10-13% Source: BofA Merrill Lynch Global Research
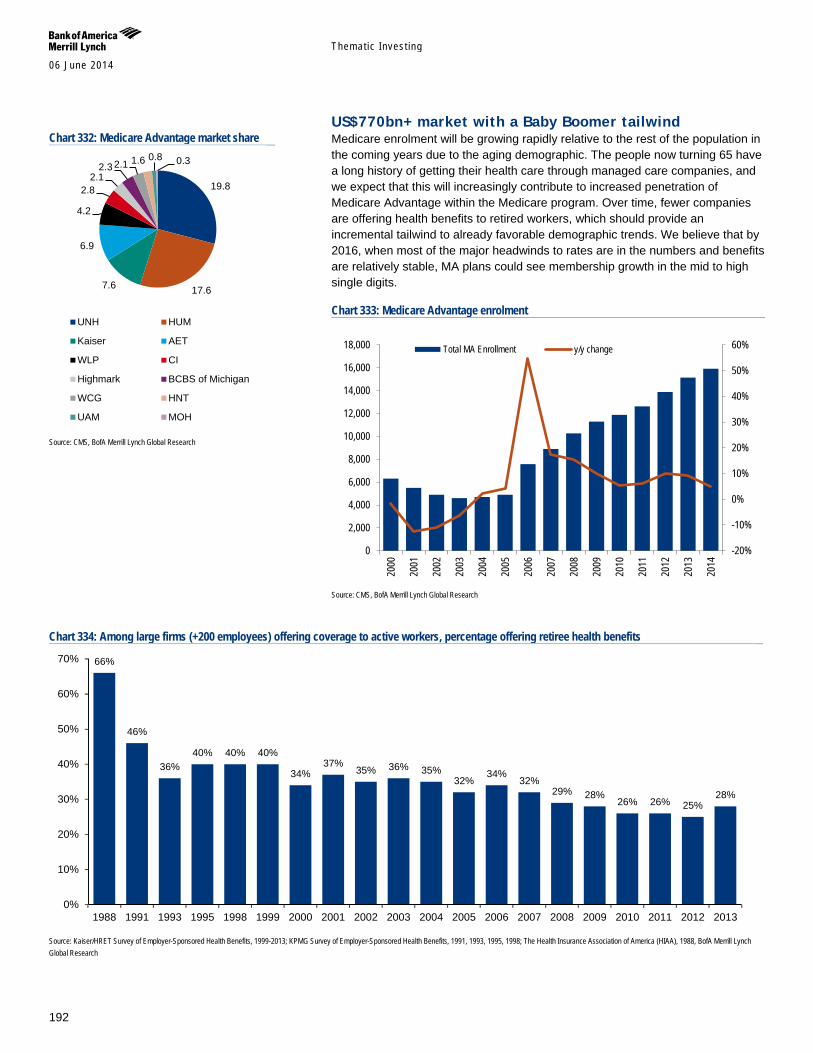
Themat ic Inves t ing 06 June 2014
192
US$770bn+ market with a Baby Boomer tailwind Medicare enrolment will be growing rapidly relative to the rest of the population in the coming years due to the aging demographic. The people now turning 65 have a long history of getting their health care through managed care companies, and we expect that this will increasingly contribute to increased penetration of Medicare Advantage within the Medicare program. Over time, fewer companies are offering health benefits to retired workers, which should provide an incremental tailwind to already favorable demographic trends. We believe that by 2016, when most of the major headwinds to rates are in the numbers and benefits are relatively stable, MA plans could see membership growth in the mid to high single digits.
Chart 333: Medicare Advantage enrolment
Source: CMS, BofA Merrill Lynch Global Research
Chart 334: Among large firms (+200 employees) offering coverage to active workers, percentage offering retiree health benefits
Source: Kaiser/HRET Survey of Employer-Sponsored Health Benefits, 1999-2013; KPMG Survey of Employer-Sponsored Health Benefits, 1991, 1993, 1995, 1998; The Health Insurance Association of America (HIAA), 1988, BofA Merrill Lynch Global Research
-20%
-10%
0%
10%
20%
30%
40%
50%
60%
0
2,000
4,000
6,000
8,000
10,000
12,000
14,000
16,000
18,000
2000
2001
2002
2003
2004
2005
2006
2007
2008
2009
2010
2011
2012
2013
2014
Total MA Enrollment y/y change
66%
46%
36% 40% 40% 40%
34% 37%
35% 36% 35% 32%
34% 32%
29% 28% 26% 26% 25%
28%
0%
10%
20%
30%
40%
50%
60%
70%
1988 1991 1993 1995 1998 1999 2000 2001 2002 2003 2004 2005 2006 2007 2008 2009 2010 2011 2012 2013
Chart 332: Medicare Advantage market share
Source: CMS, BofA Merrill Lynch Global Research
19.8
17.6 7.6
6.9
4.2
2.8 2.1
2.3 2.1 1.6 0.8 0.3
UNH HUM
Kaiser AET
WLP CI
Highmark BCBS of Michigan
WCG HNT
UAM MOH
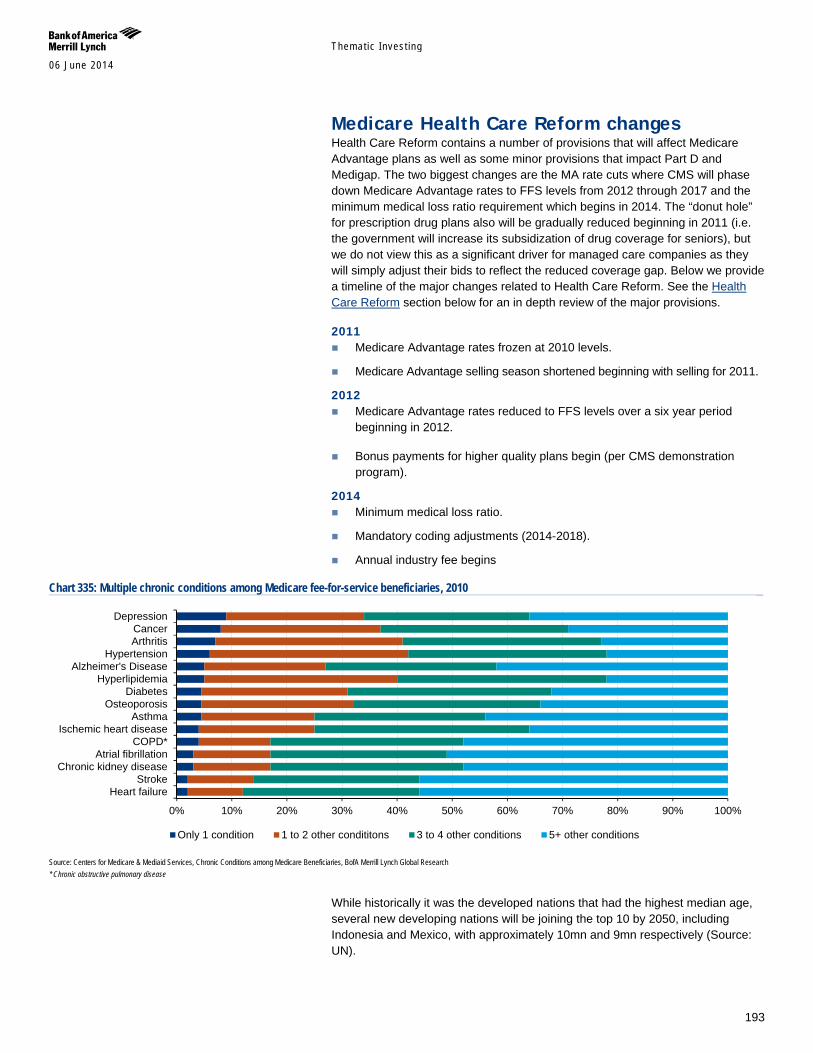
Themat ic Inves t ing 06 June 2014
193
Medicare Health Care Reform changes Health Care Reform contains a number of provisions that will affect Medicare Advantage plans as well as some minor provisions that impact Part D and Medigap. The two biggest changes are the MA rate cuts where CMS will phase down Medicare Advantage rates to FFS levels from 2012 through 2017 and the minimum medical loss ratio requirement which begins in 2014. The “donut hole” for prescription drug plans also will be gradually reduced beginning in 2011 (i.e. the government will increase its subsidization of drug coverage for seniors), but we do not view this as a significant driver for managed care companies as they will simply adjust their bids to reflect the reduced coverage gap. Below we provide a timeline of the major changes related to Health Care Reform. See the Health Care Reform section below for an in depth review of the major provisions.
2011 Medicare Advantage rates frozen at 2010 levels.
Medicare Advantage selling season shortened beginning with selling for 2011.
2012 Medicare Advantage rates reduced to FFS levels over a six year period
beginning in 2012.
Bonus payments for higher quality plans begin (per CMS demonstration program).
2014 Minimum medical loss ratio.
Mandatory coding adjustments (2014-2018).
Annual industry fee begins
Chart 335: Multiple chronic conditions among Medicare fee-for-service beneficiaries, 2010
Source: Centers for Medicare & Mediaid Services, Chronic Conditions among Medicare Beneficiaries, BofA Merrill Lynch Global Research * Chronic obstructive pulmonary disease
While historically it was the developed nations that had the highest median age, several new developing nations will be joining the top 10 by 2050, including Indonesia and Mexico, with approximately 10mn and 9mn respectively (Source: UN).
0% 10% 20% 30% 40% 50% 60% 70% 80% 90% 100%
Heart failureStroke
Chronic kidney diseaseAtrial fibrillation
COPD*Ischemic heart disease
AsthmaOsteoporosis
DiabetesHyperlipidemia
Alzheimer's DiseaseHypertension
ArthritisCancer
Depression
Only 1 condition 1 to 2 other condititons 3 to 4 other conditions 5+ other conditions

Themat ic Inves t ing 06 June 2014
194
Link to Definitions Industrials Click here for definitions of commonly used terms.
Macro Click here for definitions of commonly used terms.
Themat ic Inves t ing 06 June 2014
195
Important Disclosures
FUNDAMENTAL EQUITY OPINION KEY: Opinions include a Volatility Risk Rating, an Investment Rating and an Income Rating. VOLATILITY RISK RATINGS, indicators of potential price fluctuation, are: A - Low, B - Medium and C - High. INVESTMENT RATINGS reflect the analyst’s assessment of a stock’s: (i) absolute total return potential and (ii) attractiveness for investment relative to other stocks within its Coverage Cluster (defined below). There are three investment ratings: 1 - Buy stocks are expected to have a total return of at least 10% and are the most attractive stocks in the coverage cluster; 2 - Neutral stocks are expected to remain flat or increase in value and are less attractive than Buy rated stocks and 3 - Underperform stocks are the least attractive stocks in a coverage cluster. Analysts assign investment ratings considering, among other things, the 0-12 month total return expectation for a stock and the firm’s guidelines for ratings dispersions (shown in the table below). The current price objective for a stock should be referenced to better understand the total return expectation at any given time. The price objective reflects the analyst’s view of the potential price appreciation (depreciation). Investment rating Total return expectation (within 12-month period of date of initial rating) Ratings dispersion guidelines for coverage cluster*
Buy ≥ 10% ≤ 70% Neutral ≥ 0% ≤ 30%
Underperform N/A ≥ 20% * Ratings dispersions may vary from time to time where BofA Merrill Lynch Research believes it better reflects the investment prospects of stocks in a Coverage Cluster.
INCOME RATINGS, indicators of potential cash dividends, are: 7 - same/higher (dividend considered to be secure), 8 - same/lower (dividend not considered to be secure) and 9 - pays no cash dividend. Coverage Cluster is comprised of stocks covered by a single analyst or two or more analysts sharing a common industry, sector, region or other classification(s). A stock’s coverage cluster is included in the most recent BofA Merrill Lynch Comment referencing the stock.
BofA Merrill Lynch Research personnel (including the analyst(s) responsible for this report) receive compensation based upon, among other factors, the overall profitability of Bank of America Corporation, including profits derived from investment banking revenues.
Other Important Disclosures
Officers of MLPF&S or one or more of its affiliates (other than research analysts) may have a financial interest in securities of the issuer(s) or in related investments.
From time to time research analysts conduct site visits of covered companies. BofA Merrill Lynch policies prohibit research analysts from accepting payment or reimbursement for travel expenses from the company for such visits.
BofA Merrill Lynch Global Research policies relating to conflicts of interest are described at http://www.ml.com/media/43347.pdf. "BofA Merrill Lynch" includes Merrill Lynch, Pierce, Fenner & Smith Incorporated ("MLPF&S") and its affiliates. Investors should contact their BofA
Merrill Lynch representative or Merrill Lynch Global Wealth Management financial advisor if they have questions concerning this report. "BofA Merrill Lynch" and "Merrill Lynch" are each global brands for BofA Merrill Lynch Global Research.
Information relating to Non-US affiliates of BofA Merrill Lynch and Distribution of Affiliate Research Reports: MLPF&S distributes, or may in the future distribute, research reports of the following non-US affiliates in the US (short name: legal name): Merrill Lynch (France):
Merrill Lynch Capital Markets (France) SAS; Merrill Lynch (Frankfurt): Merrill Lynch International Bank Ltd., Frankfurt Branch; Merrill Lynch (South Africa): Merrill Lynch South Africa (Pty) Ltd.; Merrill Lynch (Milan): Merrill Lynch International Bank Limited; MLI (UK): Merrill Lynch International; Merrill Lynch (Australia): Merrill Lynch Equities (Australia) Limited; Merrill Lynch (Hong Kong): Merrill Lynch (Asia Pacific) Limited; Merrill Lynch (Singapore): Merrill Lynch (Singapore) Pte Ltd.; Merrill Lynch (Canada): Merrill Lynch Canada Inc; Merrill Lynch (Mexico): Merrill Lynch Mexico, SA de CV, Casa de Bolsa; Merrill Lynch (Argentina): Merrill Lynch Argentina SA; Merrill Lynch (Japan): Merrill Lynch Japan Securities Co., Ltd.; Merrill Lynch (Seoul): Merrill Lynch International Incorporated (Seoul Branch); Merrill Lynch (Taiwan): Merrill Lynch Securities (Taiwan) Ltd.; DSP Merrill Lynch (India): DSP Merrill Lynch Limited; PT Merrill Lynch (Indonesia): PT Merrill Lynch Indonesia; Merrill Lynch (Israel): Merrill Lynch Israel Limited; Merrill Lynch (Russia): OOO Merrill Lynch Securities, Moscow; Merrill Lynch (Turkey I.B.): Merrill Lynch Yatirim Bank A.S.; Merrill Lynch (Turkey Broker): Merrill Lynch Menkul Değerler A.Ş.; Merrill Lynch (Dubai): Merrill Lynch International, Dubai Branch; MLPF&S (Zurich rep. office): MLPF&S Incorporated Zurich representative office; Merrill Lynch (Spain): Merrill Lynch Capital Markets Espana, S.A.S.V.; Merrill Lynch (Brazil): Bank of America Merrill Lynch Banco Multiplo S.A.; Merrill Lynch KSA Company, Merrill Lynch Kingdom of Saudi Arabia Company.
This research report has been approved for publication and is distributed in the United Kingdom to professional clients and eligible counterparties (as each is defined in the rules of the Financial Conduct Authority and the Prudential Regulation Authority) by Merrill Lynch International and Bank of America Merrill Lynch International Limited, which are authorized by the Prudential Regulation Authority and regulated by the Financial Conduct Authority and the Prudential Regulation Authority, and is distributed in the United Kingdom to retail clients (as defined in the rules of the Financial Conduct Authority and the Prudential Regulation Authority) by Merrill Lynch International Bank Limited, London Branch, which is authorised by the Central Bank of Ireland and subject to limited regulation by the Financial Conduct Authority and Prudential Regulation Authority - details about the extent of our regulation by the Financial Conduct Authority and Prudential Regulation Authority are available from us on request; has been considered and distributed in Japan by Merrill Lynch Japan Securities Co., Ltd., a registered securities dealer under the Financial Instruments and Exchange Act in Japan; is distributed in Hong Kong by Merrill Lynch (Asia Pacific) Limited, which is regulated by the Hong Kong SFC and the Hong Kong Monetary Authority (note that Hong Kong recipients of this research report should contact Merrill Lynch (Asia Pacific) Limited in respect of any matters relating to dealing in securities or provision of specific advice on securities); is issued and distributed in Taiwan by Merrill Lynch Securities (Taiwan) Ltd.; is issued and distributed in India by DSP Merrill Lynch Limited; and is issued and distributed in Singapore to institutional investors and/or accredited investors (each as defined under the Financial Advisers Regulations) by Merrill Lynch International Bank Limited (Merchant Bank) and Merrill Lynch (Singapore) Pte Ltd. (Company Registration No.’s F 06872E and 198602883D respectively). Merrill Lynch International Bank Limited (Merchant Bank) and Merrill Lynch (Singapore) Pte Ltd. are regulated by the Monetary Authority of Singapore. Bank of America N.A., Australian Branch (ARBN 064 874 531), AFS License 412901 (BANA Australia) and Merrill Lynch Equities (Australia) Limited (ABN 65 006 276 795), AFS License 235132 (MLEA) distributes this report in Australia only to 'Wholesale' clients as defined by s.761G of the Corporations Act 2001. With the exception of BANA Australia, neither MLEA nor any of its affiliates involved in preparing this research report is an Authorised Deposit-Taking Institution under the Banking Act 1959 nor regulated by the Australian Prudential Regulation Authority. No approval is required for publication or distribution of this report in Brazil and its local distribution is made by Bank of America Merrill Lynch Banco Múltiplo S.A. in accordance with applicable regulations. Merrill Lynch (Dubai) is authorized and regulated by the Dubai Financial Services Authority (DFSA). Research reports prepared and issued by Merrill Lynch (Dubai) are prepared and issued in accordance with the requirements of the DFSA conduct of business rules.
Merrill Lynch (Frankfurt) distributes this report in Germany. Merrill Lynch (Frankfurt) is regulated by BaFin.

Themat ic Inves t ing 06 June 2014
196
This research report has been prepared and issued by MLPF&S and/or one or more of its non-US affiliates. MLPF&S is the distributor of this research report in the US and accepts full responsibility for research reports of its non-US affiliates distributed to MLPF&S clients in the US. Any US person receiving this research report and wishing to effect any transaction in any security discussed in the report should do so through MLPF&S and not such foreign affiliates.
General Investment Related Disclosures: Taiwan Readers: Neither the information nor any opinion expressed herein constitutes an offer or a solicitation of an offer to transact in any securities or other
financial instrument. No part of this report may be used or reproduced or quoted in any manner whatsoever in Taiwan by the press or any other person without the express written consent of BofA Merrill Lynch.
This research report provides general information only. Neither the information nor any opinion expressed constitutes an offer or an invitation to make an offer, to buy or sell any securities or other financial instrument or any derivative related to such securities or instruments (e.g., options, futures, warrants, and contracts for differences). This report is not intended to provide personal investment advice and it does not take into account the specific investment objectives, financial situation and the particular needs of any specific person. Investors should seek financial advice regarding the appropriateness of investing in financial instruments and implementing investment strategies discussed or recommended in this report and should understand that statements regarding future prospects may not be realized. Any decision to purchase or subscribe for securities in any offering must be based solely on existing public information on such security or the information in the prospectus or other offering document issued in connection with such offering, and not on this report.
Securities and other financial instruments discussed in this report, or recommended, offered or sold by Merrill Lynch, are not insured by the Federal Deposit Insurance Corporation and are not deposits or other obligations of any insured depository institution (including, Bank of America, N.A.). Investments in general and, derivatives, in particular, involve numerous risks, including, among others, market risk, counterparty default risk and liquidity risk. No security, financial instrument or derivative is suitable for all investors. In some cases, securities and other financial instruments may be difficult to value or sell and reliable information about the value or risks related to the security or financial instrument may be difficult to obtain. Investors should note that income from such securities and other financial instruments, if any, may fluctuate and that price or value of such securities and instruments may rise or fall and, in some cases, investors may lose their entire principal investment. Past performance is not necessarily a guide to future performance. Levels and basis for taxation may change.
This report may contain a short-term trading idea or recommendation, which highlights a specific near-term catalyst or event impacting the company or the market that is anticipated to have a short-term price impact on the equity securities of the company. Short-term trading ideas and recommendations are different from and do not affect a stock's fundamental equity rating, which reflects both a longer term total return expectation and attractiveness for investment relative to other stocks within its Coverage Cluster. Short-term trading ideas and recommendations may be more or less positive than a stock's fundamental equity rating.
BofA Merrill Lynch is aware that the implementation of the ideas expressed in this report may depend upon an investor's ability to "short" securities or other financial instruments and that such action may be limited by regulations prohibiting or restricting "shortselling" in many jurisdictions. Investors are urged to seek advice regarding the applicability of such regulations prior to executing any short idea contained in this report.
Foreign currency rates of exchange may adversely affect the value, price or income of any security or financial instrument mentioned in this report. Investors in such securities and instruments, including ADRs, effectively assume currency risk.
UK Readers: The protections provided by the U.K. regulatory regime, including the Financial Services Scheme, do not apply in general to business coordinated by BofA Merrill Lynch entities located outside of the United Kingdom. BofA Merrill Lynch Global Research policies relating to conflicts of interest are described at http://www.ml.com/media/43347.pdf.
Officers of MLPF&S or one or more of its affiliates (other than research analysts) may have a financial interest in securities of the issuer(s) or in related investments.
MLPF&S or one of its affiliates is a regular issuer of traded financial instruments linked to securities that may have been recommended in this report. MLPF&S or one of its affiliates may, at any time, hold a trading position (long or short) in the securities and financial instruments discussed in this report.
BofA Merrill Lynch, through business units other than BofA Merrill Lynch Global Research, may have issued and may in the future issue trading ideas or recommendations that are inconsistent with, and reach different conclusions from, the information presented in this report. Such ideas or recommendations reflect the different time frames, assumptions, views and analytical methods of the persons who prepared them, and BofA Merrill Lynch is under no obligation to ensure that such other trading ideas or recommendations are brought to the attention of any recipient of this report.
In the event that the recipient received this report pursuant to a contract between the recipient and MLPF&S for the provision of research services for a separate fee, and in connection therewith MLPF&S may be deemed to be acting as an investment adviser, such status relates, if at all, solely to the person with whom MLPF&S has contracted directly and does not extend beyond the delivery of this report (unless otherwise agreed specifically in writing by MLPF&S). MLPF&S is and continues to act solely as a broker-dealer in connection with the execution of any transactions, including transactions in any securities mentioned in this report.
Copyright and General Information regarding Research Reports: Copyright 2014 Merrill Lynch, Pierce, Fenner & Smith Incorporated. All rights reserved. iQmethod, iQmethod 2.0, iQprofile, iQtoolkit, iQworks are service marks
of Bank of America Corporation. iQanalytics®, iQcustom®, iQdatabase® are registered service marks of Bank of America Corporation. This research report is prepared for the use of BofA Merrill Lynch clients and may not be redistributed, retransmitted or disclosed, in whole or in part, or in any form or manner, without the express written consent of BofA Merrill Lynch. BofA Merrill Lynch Global Research reports are distributed simultaneously to internal and client websites and other portals by BofA Merrill Lynch and are not publicly-available materials. Any unauthorized use or disclosure is prohibited. Receipt and review of this research report constitutes your agreement not to redistribute, retransmit, or disclose to others the contents, opinions, conclusion, or information contained in this report (including any investment recommendations, estimates or price targets) without first obtaining expressed permission from an authorized officer of BofA Merrill Lynch.
Materials prepared by BofA Merrill Lynch Global Research personnel are based on public information. Facts and views presented in this material have not been reviewed by, and may not reflect information known to, professionals in other business areas of BofA Merrill Lynch, including investment banking personnel. BofA Merrill Lynch has established information barriers between BofA Merrill Lynch Global Research and certain business groups. As a result, BofA Merrill Lynch does not disclose certain client relationships with, or compensation received from, such companies in research reports. To the extent this report discusses any legal proceeding or issues, it has not been prepared as nor is it intended to express any legal conclusion, opinion or advice. Investors should consult their own legal advisers as to issues of law relating to the subject matter of this report. BofA Merrill Lynch Global Research personnel’s knowledge of legal proceedings in which any BofA Merrill Lynch entity and/or its directors, officers and employees may be plaintiffs, defendants, co-defendants or co-plaintiffs with or involving companies mentioned in this report is based on public information. Facts and views presented in this material that relate to any such proceedings have not been reviewed by, discussed with, and may not reflect information known to, professionals in other business areas of BofA Merrill Lynch in connection with the legal proceedings or matters relevant to such proceedings.
This report has been prepared independently of any issuer of securities mentioned herein and not in connection with any proposed offering of securities or as agent of any issuer of any securities. None of MLPF&S, any of its affiliates or their research analysts has any authority whatsoever to make any representation or warranty on behalf of the issuer(s). BofA Merrill Lynch Global Research policy prohibits research personnel from disclosing a recommendation, investment rating, or investment thesis for review by an issuer prior to the publication of a research report containing such rating, recommendation or investment thesis.
Any information relating to the tax status of financial instruments discussed herein is not intended to provide tax advice or to be used by anyone to provide tax advice. Investors are urged to seek tax advice based on their particular circumstances from an independent tax professional.
The information herein (other than disclosure information relating to BofA Merrill Lynch and its affiliates) was obtained from various sources and we do not guarantee its accuracy. This report may contain links to third-party websites. BofA Merrill Lynch is not responsible for the content of any third-party website or any linked content contained in a third-party website. Content contained on such third-party websites is not part of this report and is not incorporated by reference into

Themat ic Inves t ing 06 June 2014
197
this report. The inclusion of a link in this report does not imply any endorsement by or any affiliation with BofA Merrill Lynch. Access to any third-party website is at your own risk, and you should always review the terms and privacy policies at third-party websites before submitting any personal information to them. BofA Merrill Lynch is not responsible for such terms and privacy policies and expressly disclaims any liability for them.
Subject to the quiet period applicable under laws of the various jurisdictions in which we distribute research reports and other legal and BofA Merrill Lynch policy-related restrictions on the publication of research reports, fundamental equity reports are produced on a regular basis as necessary to keep the investment recommendation current.
Certain outstanding reports may contain discussions and/or investment opinions relating to securities, financial instruments and/or issuers that are no longer current. Always refer to the most recent research report relating to a company or issuer prior to making an investment decision.
In some cases, a company or issuer may be classified as Restricted or may be Under Review or Extended Review. In each case, investors should consider any investment opinion relating to such company or issuer (or its security and/or financial instruments) to be suspended or withdrawn and should not rely on the analyses and investment opinion(s) pertaining to such issuer (or its securities and/or financial instruments) nor should the analyses or opinion(s) be considered a solicitation of any kind. Sales persons and financial advisors affiliated with MLPF&S or any of its affiliates may not solicit purchases of securities or financial instruments that are Restricted or Under Review and may only solicit securities under Extended Review in accordance with firm policies.
Neither BofA Merrill Lynch nor any officer or employee of BofA Merrill Lynch accepts any liability whatsoever for any direct, indirect or consequential damages or losses arising from any use of this report or its contents.