Embed Size (px)
Citation preview

(This is a sample cover image for this issue. The actual cover is not yet available at this time.)
This article appeared in a journal published by Elsevier. The attachedcopy is furnished to the author for internal non-commercial researchand education use, including for instruction at the authors institution
and sharing with colleagues.
Other uses, including reproduction and distribution, or selling orlicensing copies, or posting to personal, institutional or third party
websites are prohibited.
In most cases authors are permitted to post their version of thearticle (e.g. in Word or Tex form) to their personal website orinstitutional repository. Authors requiring further information
regarding Elsevier’s archiving and manuscript policies areencouraged to visit:
http://www.elsevier.com/copyright

Author's personal copy
Ecological Indicators 24 (2013) 543–551
Contents lists available at SciVerse ScienceDirect
Ecological Indicators
jo ur nal homep age: www.elsev ier .com/ locate /eco l ind
Thermodynamic oriented ecological indicators: Application of Eco-Exergy andSpecific Eco-Exergy in capturing environmental changes between disturbed andnon-disturbed tropical reservoirs
Joseline Molozzia,b,∗, Fuensanta Salasb,c, Marcos Callistoa, João Carlos Marquesb
a Laboratório de Ecologia de Bentos, Departamento de Biologia Geral, Instituto de Ciências Biológicas, Universidade Federal de Minas Gerais, Av. Antônio Carlos, 6627, CP 486,30161-970 Belo Horizonte, MG, Brazilb IMAR – Institute of Marine Research, Department of Life Sciences, Faculty of Sciences and Technology, University of Coimbra, 3004-517 Coimbra, Portugalc TRAGSA, Avenida Primero de Mayo, s/n, Murcia,8 Spain
a r t i c l e i n f o
Article history:Received 22 May 2012Received in revised form 3 August 2012Accepted 3 August 2012
Keywords:Eco-ExergySpecific Eco-ExergyDiversity measuresBenthic communitiesMonitoringReservoirs
a b s t r a c t
Effective assessment of ecological quality in aquatic ecosystems has become an important issue forresearchers and environmental managers worldwide. The potential of thermodynamic oriented ecolog-ical indicators in environmental assessment and management was tested and compared with diversitymeasures in three tropical reservoirs located in the basin of the Paraopeba River, Minas Gerais State-Brazil. We computed Eco-Exergy based indices (Eco-Exergy and Specific Eco-Exergy) and the Margalefand Shannon–Wiener indices and tested differences in their responses to change in benthic commu-nities across reservoirs characterised by different degrees of anthropogenic disturbance. Indices wereestimated based on biotic descriptors (macrofauna biomass, composition, and abundance) and theirvalues analysed against abiotic descriptors (pH, conductivity, transparency, turbidity, nutrients concen-tration, dissolved oxygen, chlorophyll a, and total dissolved solids). The Margalef index showed significantdifferences between reference and impacted sites, with the highest values in the former type of sites,(Pseudo F2.719 = 24,506, p = 0.001), while the Shannon–Wiener index values showed no significant dif-ferences between reference and impacted sites. Eco-Exergy values were significantly higher at stationslocated in more disturbed sites (Pseudo F2.719 = 80.319, p = 0.001), but Specific Eco-Exergy did not showreally significant differences between disturbed and non-disturbed sites, although values were higherin the non-disturbed sites type. This might be explained by the fact that opportunistic tolerant speciespresent high biomass values in polluted sites, since Eco-Exergy values may vary due to changes in biomassor information. On the other hand, differences in information between disturbed and non-disturbed siteswere more subtle (although the number of species was higher in the less disturbed sites, it was not clearlyreflected in Specific Eco-Exergy values). Our results suggest that thermodynamic oriented indicators cancapture coherent structural changes in biological communities, highlighting its indicator potential forassessing the ecological condition/integrity of highly modified water bodies, such as reservoirs.
© 2012 Published by Elsevier Ltd.
1. Introduction
Reservoirs are highly modified ecosystems, built to meet thedemands of economic growth. These systems caused significantchanges in the prevailing hydrological and ecological conditions ofrivers and watersheds (Tundisi, 2006). The impact of impoundmentcoupled with perturbations induced by urbanisation, agriculturaland industrial activities result in higher instability and lower
∗ Corresponding author at: Laboratório de Ecologia de Bentos, Departamento deBiologia Geral, Centro de Ciências Biológicas e da Saúde, Universidade Estadual daParaíba, Rua Baraúnas, 351, Bairro Universitário, CEP: 58429-500, Campina Grande-PB, Brazil. Tel.: +55 83 3315 3531.
E-mail address: [email protected] (J. Molozzi).
resilience of the aquatic communities (Fore et al., 1994; Klemmet al., 2003).
Large river reservoir systems are some of the most difficultaquatic ecosystems to assess because they are essentially artificialand, consequently, it is hard to find minimally disturbed sites thatcan be used to determine as comparable reference conditions. Thisreservoir type, characterised by a low retention time is essentiallya transitional system between rivers and lakes (Terra and Aráujo,2011).
To evaluate the ecological condition of these aquatic ecosys-tems, a panoply of ecological indicators has been used inenvironmental assessment studies. Nevertheless, most ecologicalindicators take into consideration only a few ecosystem compo-nents and result from non-universal theoretical approaches. Some
1470-160X/$ – see front matter © 2012 Published by Elsevier Ltd.http://dx.doi.org/10.1016/j.ecolind.2012.08.002
Author's personal copy
544 J. Molozzi et al. / Ecological Indicators 24 (2013) 543–551
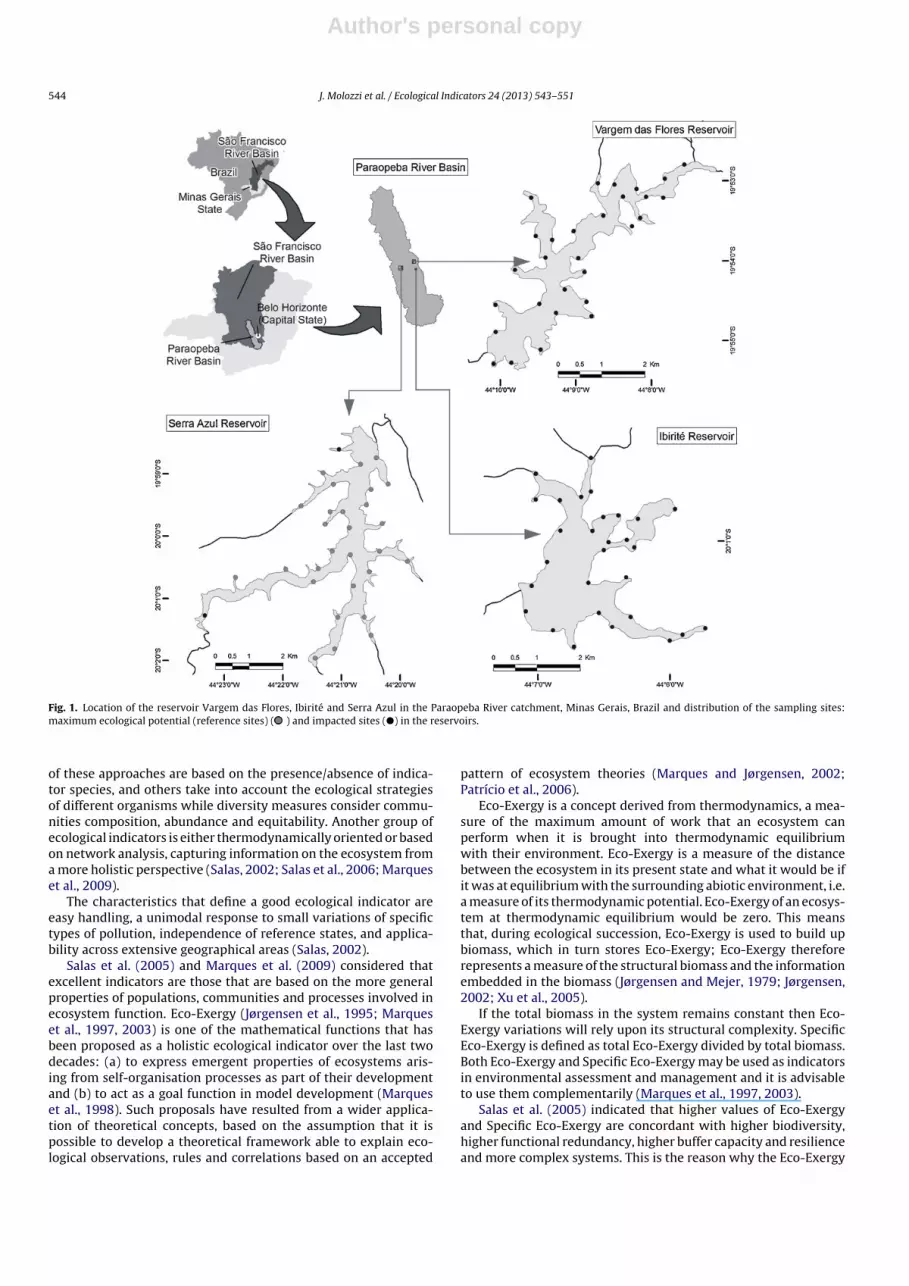
Fig. 1. Location of the reservoir Vargem das Flores, Ibirité and Serra Azul in the Paraopeba River catchment, Minas Gerais, Brazil and distribution of the sampling sites:maximum ecological potential (reference sites) ( ) and impacted sites (�) in the reservoirs.
of these approaches are based on the presence/absence of indica-tor species, and others take into account the ecological strategiesof different organisms while diversity measures consider commu-nities composition, abundance and equitability. Another group ofecological indicators is either thermodynamically oriented or basedon network analysis, capturing information on the ecosystem froma more holistic perspective (Salas, 2002; Salas et al., 2006; Marqueset al., 2009).
The characteristics that define a good ecological indicator areeasy handling, a unimodal response to small variations of specifictypes of pollution, independence of reference states, and applica-bility across extensive geographical areas (Salas, 2002).
Salas et al. (2005) and Marques et al. (2009) considered thatexcellent indicators are those that are based on the more generalproperties of populations, communities and processes involved inecosystem function. Eco-Exergy (Jørgensen et al., 1995; Marqueset al., 1997, 2003) is one of the mathematical functions that hasbeen proposed as a holistic ecological indicator over the last twodecades: (a) to express emergent properties of ecosystems aris-ing from self-organisation processes as part of their developmentand (b) to act as a goal function in model development (Marqueset al., 1998). Such proposals have resulted from a wider applica-tion of theoretical concepts, based on the assumption that it ispossible to develop a theoretical framework able to explain eco-logical observations, rules and correlations based on an accepted
pattern of ecosystem theories (Marques and Jørgensen, 2002;Patrício et al., 2006).
Eco-Exergy is a concept derived from thermodynamics, a mea-sure of the maximum amount of work that an ecosystem canperform when it is brought into thermodynamic equilibriumwith their environment. Eco-Exergy is a measure of the distancebetween the ecosystem in its present state and what it would be ifit was at equilibrium with the surrounding abiotic environment, i.e.a measure of its thermodynamic potential. Eco-Exergy of an ecosys-tem at thermodynamic equilibrium would be zero. This meansthat, during ecological succession, Eco-Exergy is used to build upbiomass, which in turn stores Eco-Exergy; Eco-Exergy thereforerepresents a measure of the structural biomass and the informationembedded in the biomass (Jørgensen and Mejer, 1979; Jørgensen,2002; Xu et al., 2005).
If the total biomass in the system remains constant then Eco-Exergy variations will rely upon its structural complexity. SpecificEco-Exergy is defined as total Eco-Exergy divided by total biomass.Both Eco-Exergy and Specific Eco-Exergy may be used as indicatorsin environmental assessment and management and it is advisableto use them complementarily (Marques et al., 1997, 2003).
Salas et al. (2005) indicated that higher values of Eco-Exergyand Specific Eco-Exergy are concordant with higher biodiversity,higher functional redundancy, higher buffer capacity and resilienceand more complex systems. This is the reason why the Eco-Exergy
Author's personal copy
J. Molozzi et al. / Ecological Indicators 24 (2013) 543–551 545
and the Specific Eco-Exergy have been used as indicators of eco-logical condition in a number of European lakes (Jørgensen, 2000;Jørgensen et al., 1995; Nielsen, 1994; Ludovisi and Poletti, 2003;Jørgensen and Ulanowicz, 2009; Xu et al., 2005, 2011), coastallagoons (Salas et al., 2005), freshwater systems and estuaries(Marques et al., 1997, 2003; Jørgensen and Padisak, 1996; Patrícioet al., 2009) and coastal areas (Patrício et al., 2006; Salas et al., 2006).
The main aim of the present study is to test the Eco-Exergy andSpecific Eco-Exergy as indicators of ecosystem condition, in threetropical reservoirs in order to assess whether they can differenti-ate areas with maximum ecological potential (taken as referencefor comparisons) from impacted sites. We compared the Eco-Exergy and Specific Eco-Exergy estimations with the values of theShannon–Wiener and Margalef indices in order to assess the degreeof their coherence in describing ecosystem ecological condition,based on benthic macroinvertebrate communities.
2. Materials and methods
2.1. Study sites
We sampled three reservoirs (Ibirité, Vargem das Flores andSerra Azul) located in the Paraopeba river (a tributary of the SãoFrancisco River) catchment, in Minas Gerais, South-eastern Brazil.The region climate is tropical sub-humid (Cwb), with summer rains(November–April) and a dry winter (May–October). The averageannual temperature is 20 ◦C (Moreno and Callisto, 2006) (Fig. 1).
The Ibirité reservoir (20◦01′13.39S; 44◦06′44.88′ ′W), was builtin 1968 at an altitude of 773 m. This reservoir has an area of 2.8 km2,a volume of 15,423,000 m3 and an average depth of 16 m. Landuse around the reservoir basin not only consists predominantlyof Eucalyptus plantations, but also includes a large condominium,small farms, and several industrial plants (Pinto-Coelho et al., 2010;Molozzi et al., 2011).
The Vargem das Flores reservoir (19◦54′25.0622′ ′S;44◦09′17.78′ ′W), built in 1971, is located at 838 m. Main usesare potable water supply for the cities of Contagem and BeloHorizonte and leisure for population of approximately 100,000people living around the reservoir (COPASA, 2004) (Companhia deSaneamento de Minas Gerais). The Vargem das Flores reservoir hasa surface area of 4.9 km2, contains 37,000,000 m3 of water and hasa maximum depth of 18 m. The maximum height of sill spillwayis 838 m and the reservoir has a hydraulic retention time of 365days. An area of about 12.3 ha of the area around the reservoir wastransformed into a state environmental protection area in 2006(Decree 20.793 on 07/08/80).
The Serra Azul reservoir (19◦59′24.92′ ′S; 44◦20′46.74′ ′W), builtin 1981, is located at an altitude of 760 m, has a water surface of7.5 km2, a water volume of 88,000,000 m3, and a maximum depth of40 m. The maximum height of sill spillway is 760 m and the reser-voir has a hydraulic retention time of 351 days. The reservoir issurrounded by an environmental protected area of 27,000 ha estab-lished in 1980. Within the protected area, 3.2 ha situated around thereservoir are property of COPASA (2004), the industry that managesthe reservoir (Decree 20.792 on 08/07/80); no tourism or fisheriesare allowed in this area.
2.2. Sampling stations
Ninety sampling stations were sampled in the three reservoirsat sites representative of the different biocenoses at minimally dis-turbed reference sites and the principal polluted areas. Sampleswere collected every three months, in March, June, September andDecember, in 2008 and 2009.
Twenty-eight different stations located at the Serra Azul reser-voir were considered as having maximum ecological potential(MEP) in a previous work (Molozzi et al., 2012), and therefore clas-sified as reference sites in the present study.
2.3. Environmental parameters
For each sampling occasion, and at each sampling site the fol-lowing water physical and chemical parameters were measuredin situ using an YSI Model Multiprobe: oxygen dissolved, conduc-tivity, turbidity, total dissolved solids (TDS) and pH. Sub-surfacewater samples were collected with a Van Dorn type bottle for sub-sequent analysis of total nitrogen (TN), total phosphorus (TP) andorthophosphates (PO4), in accordance with “Standard Methods forthe Examination of Water and Wastewater” (APHA, 1992). The con-centration of chlorophyll a (Chla) was determined according toGolterman et al. (1978). Transparency was estimated using a Sec-chi disc, and water column depth was estimated using a portablesonar.
2.4. Biological samples
Macroinvertebrates were sampled at 90 sites in the littoral zoneof the three reservoirs using an Eckman-Birge dredge (0.0225 m2).Samples were fixed in 70% formalin and carried to the laboratoryfor processing. Invertebrates collected were almost always identi-fied to the family level (Merritt and Cummins, 1996; Fernandezand Domingues, 2001; Costa et al., 2006; Mugnai et al., 2010).However, Chironomidae larvae were treated with 10% lactophe-nol solution and identified to the genus level, under a microscope(400×), according to Trivinho-Strixino (2011) and Epler (2001).After taxonomic identification, organisms were dried in an oven at60 ◦C for 48 h and weighed (precision 10−4 mg) for biomass deter-mination, the Mollusca, which after drying were burned in furnaceat 450 ◦C for 4 h to estimate ash free dry weight.
2.5. Ecological indicators computation
2.5.1. Eco-Exergy estimationsEco-Exergy can be computed from (Jørgensen, 2010) (Eq. (1)):
i=0∑i=n
ˇici (1)
where ˇi are weighting factors applicable to the various compo-nents (i) of the ecosystem, reflecting the Exergy that those variouscomponents possess as a function of their chemical energy and theinformation embodied in their genome (Jørgensen, 2010). ˇi valuesbased on Exergy detritus equivalents have been found for variousspecies (Fonseca et al., 2000; Jørgensen et al., 2005). The unit Exergydetritus equivalents expressed in g m−2 can be converted to kJ/m−2
by multiplying by 18.7, corresponding to the approximate averageenergy content of 1 g of detritus.
Over time, the variation of Eco-Exergy in an ecosystem will bedue to the variation of the quantity of biomass (g m) and the infor-mation embodied in each unit of biomass (expressing the qualityof the biomass) (Marques et al., 1997) (Eq. (2)):
�EXtot = �Biom × ˇi × �ˇi × Biom (2)
If the total biomass (Btot) in a system remains constant throughtime, then the variation of Eco-Exergy (EXtot) will be only afunction of changes in the information embodied in the biomass.

Author's personal copy
546 J. Molozzi et al. / Ecological Indicators 24 (2013) 543–551
Such information is called Specific Eco-Exergy (SpEx), expressingEco-Exergy per unit of biomass (Eq. (3)):
SpEx = Extot
Biomtot(3)
Values of Eco-Exergy and Specific Eco-Exergy were calculatedfrom the biomass of the different organisms (g m−2) through theuse of weighting factors able to discriminate different ‘qualities’ ofbiomass. Taking into account the available set of weighting factors,data on organisms’ biomass were pooled as a function of highertaxonomic levels (Marques et al., 1997). An overview of the majortaxonomic groups contributing to the exergy in this system is pro-vided in Table 1.
2.5.2. Diversity measuresWe estimated the Margalef and the Shannon–Wiener indices in
order to compare them with the values of Eco-Exergy and SpecificEco-Exergy. Our aim was to assess the degree of their coherence indescribing ecosystem condition.
The Margalef index (Margalef, 1969) is given by (Eq. (4)):
D = S − 1logeN
(4)
where S is the number of species and N is total number of individ-uals.
The Shannon–Wiener index (Shannon and Weaver, 1963) isgiven by (Eq. (5)):
H′ = −∑
pi log2 pi (5)
where pi is the proportion of the individuals found in the species i.In the sample, the real value of pi is unknown, but it is estimatedthrough the ratio Ni/N, where Ni is the number of individuals of thespecies i, and N is the total number of individuals.
2.6. Data analysis
A previous work (Molozzi et al., 2012) carried out in the samestudy areas showed no significant differences in the communities
Table 1Exergy/biomass conversion factors (ˇ) for benthic communities, based on Jørgensenet al. (2005).
Organism Exergyconversionfactor (ˇ)
Organism Exergyconversionfactor (ˇ)
Virus 1.01 Kinorhynch 165Minimal cell 5.8 Gastrotric, MetI 76Bacteria 8.5 Rotifera 163Algae 20 Gnahostom 143Archaea 13.8 Gastrotric, MetII 116Protists 21 Ctenophora 167Diatoms 66 Entoprocta 165Yeast 17.4 Nematoda (Worms) 133Fungi 61 Nematina 76Protozoa, Amoebe 31–46 Mollusc 310Prolifera 97 Gastropods 312Angiosmperm 147 Bivalve 297Rhodophyta 92 Annelida (f.i. leeches) 133Bryophyta 173 Brachiopods 109Pteridophyta 146 Sea squirt 191Psilophyta 170 Crustacean 232Pinus mono 314 Coleoptera (Beetles) 156Mustard weed 147 Diptera (Flies) 184Rice 275 Hemiptera 159Eudicot 268 Hymenoptera 267Monocot 393 Lepidoptera 221Placozoa 35 Phasmida 43Cnidaria 91 Mosquito 322Platyhelminthes 120 Chordata 246Mesozoa 30 Fish 499
between different periods of the year (e.g. rainy season vs. dry sea-son) (Table 2), and therefore, there was no reason for separatelyanalysing the data collected quarterly over the two-year studyperiod (2008 and 2009) data underwent square root transforma-tion.
In order to examine the similarity between communities fromreference (28 sites, with maximum ecological potential at SerraAzul reservoir) and impacted sites (62 sites at Serra Azul, Ibir-ité and Vargem das Flores reservoirs) (see Molozzi et al., 2012),multivariate analysis was performed using the PRIMER 6 software
Table 2Results of ANOSIM pair wise tests between the samples of Serra Azul, Vargem das Flores, and Ibirité reservoirs; ns indicates p values >0.05 (Molozzi et al., 2012).
Months Serra Azul (R, p) Vargem das Flores (R, p) Ibirité (R, p)
March/08–March/09 0.08, 0.0004 0.18, 0.001 0.21, 0.001March/08–June/08 0.04, ns −0.01, ns 0.04, 0.04March/08–June/09 0.09, 0.002 0.04, 0.05 0.07, 0.007March/08–September/08 0.02, ns 0.03, ns 0.09, 0.001March/08–September/09 0.09, 0.001 0.06, 0.015 0.39, 0.001March/08–December/08 0.04, 0.025 0.06, 0.015 0.21, 0.001March/08–December/09 0.15, 0.001 0.10, 0.001 0.31, 0.001March/09–June/08 0.05, 0.018 0.20, 0.001 0.20, 0.001March/09–June/09 0.02, 0.094 0.22, 0.001 0.14, 0,001March/09–Setember/08 0.05, 0.025 0.13, 0.003 0.10, 0.001March/09–Setember/09 −0.01, ns 0.25, 0.001 0.13, 0.005March/09–December/08 0.08, 0.004 0.14, 0.001 0.07, 0.005March/09–December/09 0.02, ns 0.34, 0.001 0.20, 0.001June/08–June/09 0.06, 0.015 0.1, 0.001 0.07, 0.007June/08–September/08 0.05, 0.023 0.01, ns 0.05, 0.03June/08–September/09 0.04, 0.035 0.15, 0.001 0.22, 0.001June/08–December/08 0.03, 0.038 0.07, 0.015 0.21, 0.001June/08–December/09 0.10, 0.002 0.21, 0.001 0.26, 0.001June/09–September/08 0.04, 0.029 0.09, 0.004 0.11, 0.001June/09–September/09 0.03, 0.054 −0.02, ns 0.17, 0.001June/09–December/08 0.08, 0.002 0.12, 0.001 0.25, 0.001June/09–December/09 0.04, 0.036 0.01, ns 0.22, 0.001September/08–September/09 0.05, 0.014 0.13, 0.004 0.11, 0.003September/08–December/08 0.01, ns 0.02, ns 0.09, 0.006September/08–December/09 0.10, 0.001 0.18, 0.001 0.23, 0.001September/09–December/08 0.06, 0.008 0.16, 0.001 0.18, 0.001September/09–December/09 −0.01, ns 0.001, ns 0.06, 0.007December/08–December/09 0.10, 0.001 0.16, 0.001 0.35, 0.001

Author's personal copy
J. Molozzi et al. / Ecological Indicators 24 (2013) 543–551 547
package (Plymouth Marine Laboratory, UK). Data (species abun-dance and biomass) underwent square root transformation. A BrayCurtis similarity matrix was calculated and used to generate two-dimensional plot using the non-metric Multi-dimensional Scalinganalysis (nMDS) technique (Clarke and Warwick, 2001; Clarke andGorley, 2006). Stress values were computed for each nMDS plot toindicate the goodness of representation of differences among sam-ples. PERMANOVA tests (Permutational Multivariate Analysis ofVariance; Anderson, 2001a,b; Anderson and Braak, 2003; Andersonet al., 2008; software package PERMANOVA + for PRIMER, 2006)considering 999 permutations were applied to see which of theproposed groups were significantly distinct with regard to biomassand abundance data (species abundance and biomass) underwentsquare root transformation, using Bray Curtis similarity matrixwas calculated). Differences between reference and impacted sitesbased on results from the Margalef and Shannon–Wiener indices,Eco-Exergy and Specific Eco-Exergy values were assessed with aPERMANOVA test and graphically presented by Box–Whisker plots(Software Statistica 7.0).
Pearson’s correlations (p ≤ 0.05) were estimated to assess rela-tionships between indicator values and environmental parameters(Software Statistic 7.0). The correlation coefficient itself, ratherthan its probability, is more critical as far as measuring agreementbetween parameters is concerned, because the coefficient reflectsthe ratio of covariance between different variables (Willby and Birk,2010). Thus, a minimum value for r of 0.4–0.5 is required to considera correlation between indicators and environmental parameters assignificant.
3. Results
3.1. Benthic communities’ response to pressures
Results obtained from the nMDS multivariate analysis forbiomass and abundance data on the biological communities areillustrated in Fig. 2. Stress values computed were relatively high(0.19 and 0.20, respectively), and therefore the reliability of thegraphic representations’ detail had to be taken into account care-fully.
Nevertheless, PERMANOVA shows significant differences inbiomass (Pseudo F1.89 = 43.05, p = 0.001) and abundance (PseudoF1.89 = 61.50, p = 0.001) between the reference sites and impactedsites. Taxa such as Melanoides tuberculatus, Oligochaeta and Chi-ronomus occurred in higher proportions at impacted sites (25.47%,
Fig. 2. nMDS ordination plot based on macrobenthic biomass data (A) and abun-dance data (B) from 90 sites located in the studied reservoirs.
24.83% and 9.27%, respectively) and lower proportions at referencesites (2.62%, 3.42%, and 1.05%, respectively). However, taxa suchas Fissimentum, Philopotamidae, Hydrobiosidae and Procladiusoccurred in higher proportions in reference sites (5.45%, 0.04%,0.04% and 3.16%, respectively), but were present in much lowerproportions or absent from impacted sites (0.24%, 0%, 0%, and0.09%, respectively) (Molozzi et al., 2012).The highest biomass
Fig. 3. Temporal and spatial variation of biomass of the groups used the calculated Eco-Exergy index for reference sites and impacted sites: (A) Diptera, (B) Annelida, (C)Gastropoda and (D) Bivalve.

Author's personal copy
548 J. Molozzi et al. / Ecological Indicators 24 (2013) 543–551
Fig. 4. Variation of the applied indices in the reference sites and impacted sites in two years: (A) Margalef index, (B) Shannon–Wiener index, (C) Eco-Exergy, (D) and SpecifcEco-Exergy.
Table 3Mean values (±SD) Margalef, Shannon–Whiner, Eco-Exergy and Specific Eco-Exergyindex, for reference sites and impacted sites in three reservoir in Brazil.
Index Reference sites Impacted sites
Margalef 1.16 ± 0.59 0.76 ± 0.58Shannon–Wiener (Bits/ind) 0.86 ± 0.82 0.84 ± 0.76Eco-Exergy (kJ m−2) 7541 ± 3891 92,153 ± 192Specific Eco-Exergy (kJ g−1) 290 ± ± 39 272 ± 67
values for all taxonomic groups occurred at impacted sites for bothsampling years (Fig. 3). Gastropoda was the taxonomic group thatcontributed the most to total biomass, at impacted sites, due to thepresence of M. tuberculatus, an exotic species. The total biomassof M. tuberculatus attained maxima of 5484.55 g m−2 at impactedsites, and 140.20 g m−2 at reference sites. Annelida (Oligochaetaand Hirudinea) biomass was also much higher at impacted sitesthan at reference sites (63.96 g m−2 and 1.11 g m−2, respectively),and a similar pattern was observed for Diptera.
3.2. Eco-Exergy, Specific Eco-Exergy, and diversity measuresperformance
Results regarding the capability of the selected indicators to cap-ture differences between reference sites and the impacted ones aregiven in Fig. 4 and Table 3.
The Margalef index (Fig. 4A; Table 3) (Pseudo F2.719 = 24.50,p = 0.001) showed significant differences between sites, withclearly higher values at reference sites. Eco-Exergy presented sig-nificantly higher values in stations located in impacted reservoirs(Fig. 4C; Table 3) (Pseudo F2.719 = 29.82, p = 0.001), while SpecificEco-Exergy and Shannon–Wiener presented no statistically signif-icant differences between reference and impacted sites (Fig. 4D;Table 3 and Fig. 4B; Table 3), (Pseudo F2.719 = 6.57, p = 0.92; PseudoF2.719 = 4.76, p = 0.83, respectively).
The analysis of the values of the four tested indicators and envi-ronmental parameters usually associated with impacts showed, insome cases, significant but not clearly interpretable correlations:
The Margalef index showed significant negative correlationswith conductivity and TDS, usually associated with poor qualitywaters (Table 4).
Eco-Exergy showed a significant positive correlation with con-ductivity and pH, Specific Eco-Exergy was positively correlatedwith water transparency and depth, and negatively correlated withconductivity and TN.
4. Discussion
The occurrence of high values of biomass of a reduced numberof species at impacted sites found in the present study has alsobeen observed in other tropical eutrophic reservoirs in Brazil. Thisis probably a result of high secondary productivity due to excessavailability of organic matter (Takahashi et al., 2008). The samebiomass distribution pattern as a function of eutrophication hasalso been detected in lakes (Callisto et al., 2002).
Chironomidae constitute the dominant benthic group in reser-voirs, attaining particularly higher biomasses at eutrophic sites, orsites impacted by other types of pollution (Vos et al., 2000). Thisis due to the overall tolerance of this group to strong variationsin climatic, hydrological, and limnological conditions (Jorcin andNogueira, 2008).
Vos et al. (2000) showed that detritus with high nitrogen, phos-phorous, carbon, and fatty acid contents is usually associated withthe presence of larger Chironomidae larvae and is therefore acontrolling factor of Chironomidae population composition, abun-dance, and biomass. Further, increased Chironomidae biomassesappear to be associated with fine sediments with a high organicmatter content that can be used for building tubes to provide refugefrom predators, minimising their visibility resulting from their red

Author's personal copy
J. Molozzi et al. / Ecological Indicators 24 (2013) 543–551 549
Table 4Pearson’s correlation coefficients between the different indices and the different environmental variable samples in 3 different reservoirs, Brazil.
Margalef Shannon–Winer Eco-Exergy Specific Eco-Exergy
Margalef 1.000Shannon–Wiener 0.673 1.000Eco-Exergy −0.280 −0.036 1.000Specific Eco-Exergy 0.115 −0.140 −0.116 1.000Depth (m) 0.125 −0.137 −0.334 0.177Secchi (m) 0.386 −0.134 −0.373 0.425*
pH −0.360 −0.076 0.458* −0.077Conductivity −0.443* 0.090 0.466* −0.441*
TDS (mg L−1) −0.525* −0.005 0.379 −0.267Turbidity −0.331 0.013 0.248 −0.369O2 (m/L) 0.389 0.107 0.001 −0.014Chlorophyll a (�g L−1) −0.322 −0.014 0.300 −0.120Total nitrogen (mg L−1) −0.340 0.123 0.374 −0.446*
Total phosphorus (�g L−1) −0.187 0.104 0.057 −0.293Orthophosphates (�g L−1) −0.054 0.099 −0.064 −0.223
* r > 0.4.
colour (Butler and Anderson, 1990; Helson et al., 2006; Takahashiet al., 2008).
Gastropoda can be easily transported, is adaptable to all kinds ofsubstrates and can form abundant populations with high biomassin eutrophic environments (Livishts and Fishelson, 1983). Forinstance, we found very high biomasses of M. tuberculatus, an “r-strategist” gastropod species with parthenogenetic reproductionand potential to maintain high population densities for long peri-ods (Silva et al., 2010). M. tuberculatus has a fast growth rate duringthe juvenile phase, reaching sexual maturity and near maximumsize within 90–279 days (Dudgeon, 1986; Livishts and Fishelson,1983; Elkarmi and Ismail, 2007). In adverse conditions (low tem-peratures or lack of food) M. tuberculatus can slow down growth oreven aestivate for long periods (Livishts and Fishelson, 1983; Supianand Ikhwanuddin, 2002), which may explain the low populationdensities and biomasses in oligotrophic environments.
This briefly summarises the characteristics of the benthic com-partment observed in the present study, as well as in other tropicalreservoirs, based on which diversity measures, Eco-Exergy, andSpecific Eco-Exergy were estimated.
Values of the Margalef index behaved as one could expectagainst environmental pressures, with significantly higher valuesat reference sites and lower values at the disturbed sites (eutroph-ication in this case). The Margalef index showed significant andeasily interpretable correlations with some of the environmentalparameters usually associated to increasing eutrophication.
Eco-Exergy response was in accordance with what we shouldexpect theoretically. Eco-Exergy values were significantly higher atmore disturbed (eutrophic) sites and lower at reference sites, whichcan be interpreted as a response to eutrophication, namely higherbiomass in association with increased concentrations of nutrients(Jørgensen et al., 1995). Thus Eco-Exergy increases as a function ofvariation in biomass (see Eq. (1)).
Specific Eco-Exergy showed higher values at reference sitesand lower values at impacted sites. Specific Eco-Exergy normallyexhibits a maximum at low levels of eutrophication, since olig-otrophic lakes and reservoirs have low biomasses due to lownutrient concentrations. However, such systems have less biomassas detritus (ˇi = 1), and therefore relatively more biomass of inver-tebrates with higher ˇi values. Although differences were notstatistically significant, we should expect a higher average ˇi value,which is expressed in higher Specific Eco-Exergy values (Jørgensenet al., 1995; Jørgensen, 2010).
Thus, Specific Eco-Exergy was higher at reference sites due tohigher organism’s ˇi values.
Our results were similar to those obtained in Jørgensen et al.’s(1995) study on 15 lakes where he found clear correlations
between indicators and ecological eutrophication states. In ourcase, although Specific Eco-Exergy did not show significant sta-tistical differences between reference and impacted sites, valueswere higher in reference sites. Specific Eco-Exergy is computed bydividing total Eco-Exergy by total biomass (see Eq. (3)), thus whenthere is less biomass there will be a higher average value. In ourcase, although usually Mollusca are only moderately tolerant topollution, occurring in less disturbed areas (Xu et al., 2011), alienmollusc populations (M. tuberculatus) biomasses were higher at themost impacted sites.
According to Odum (1988), ecosystem response to increasingenvironmental stress include a reduction in food chains, decreasein diversity, an increase in the proportion of “r-strategists”, and areduction in organism size in order to improve resource use effi-ciency. Our results agree with this theory, showing a reduction indiversity and an increase of “r-strategists” (which generally havelower ˇi values) but although there was an increase in popula-tion density there was no reduction in organisms size resulting ina significant increase in biomass at impacted sites.
5. Conclusions
Our results support the findings of previous studies namelythat when applied as ecological indicators of ecosystem condi-tion/status, Eco-Exergy and Specific Eco-Exergy are effective inassessing reservoir water quality, but that they should be usedtogether with other indices.
Additionally, increased eutrophication implies an increase inEco-Exergy but a decrease in Specific Eco-Exergy; therefore thesetwo thermodynamic oriented indicators should always be usedcomplementarily.
As observed in previous studies, there is a need to improvethe accuracy of Bi values, to better express biomass informationcontent (information embodied in the genome) at more discretetaxonomic levels although higher discrimination of Bi values mustnot disregard limits of practicability in applying thermodynamicoriented holistic ecological indicators as tools in environmentalquality assessment.
Acknowledgements
The authors would like to thank FAPEMIG and CAPES for thedoctoral fellowship and “sandwich” scholarship awarded to thefirst author, and the logistic and financial support provided bythe following projects and partnerships: Project Manuelzão/UFMG,PETROBRAS-SA, COPASA, FAPEMIG, CNPq, CAPES, USFish and

Author's personal copy
550 J. Molozzi et al. / Ecological Indicators 24 (2013) 543–551
Wildlife Service and IMAR-Coimbra. The authors are indebted toall the colleagues of the Laboratório de Ecologia de Bentos – UFMGfor their support in the field collections, especially Sophia de SousaMorais (in memory) and Débora Regina de Oliveira. This paper waswritten while MC was a sabbatical visitor (CAPES fellowship No.4959/09-4) at the IMAR – Institute of Marine Research, Marine andEnvironmental Research Centre (IMAR-CMA), University of Coim-bra, Portugal.
References
American Public Health Ageny, 1992. Standard Methods for the Examination ofWater and Wastewater, 18th ed. American Public Health Association, Wash-ington, DC.
Anderson, M.J., 2001a. A new method for non-parametric multivariate analysis ofvariance. Aust. J. Ecol. 26, 32–46.
Anderson, M.J., 2001b. Permutation tests for univariate or multivariate analysis ofvariance and regression. Can. J. Fish. Aquat. Sci. 58, 626–639.
Anderson, M.J., Braak, C.J.F., 2003. Permutation tests for multi-factorial analysis ofvariance. J. Stat. Comput. Simul. 73, 85–113.
Anderson, M.J., Gorley, R.N., Clarke, K.R., 2008. PERMANOVA + for PRIMER: Guide toSoftware and Statistical Methods. PRIMER-E, Plymouth.
Butler, M.G., Anderson, D.H., 1990. Cohort structure, biomass, and production of amerovoltine Chironomus population in a Winsconsin bog lake. J. N. Am. Benthol.Soc. 9, 180–192.
Callisto, M., Moreno, P., Gonc alves-Jr, J.F., Leal, J.J.F., Esteves, F.A., 2002. Diversity andbiomass of Chironomidae (Diptera) larvae in an impacted coastal lagoon in Riode Janeiro, Brazil. Braz. J. Biol. 62, 77–84.
Clarke, K.R., Warwick, R.M., 2001. Change in Marine Communities: An Approach toStatistical Analysis and Interpretation, 2nd ed. Primer-e Ltd., Plymouth MarineLaboratory.
Clarke, K.R., Gorley, R.M., 2006. Primer v. 6: User Manual. PRIMER-E Ltd., PlymouthMarine Laboratory, Plymouth, UK, p. 192.
COPASA, Companhia de Saneamento de Minas Gerais, 2004. LevantamentoBatimétrico do Reservatório Serra Azul Mateus Leme e Vargem das Flores – MG.Hydrologic Data Collection Engenharia S/C Ltda, p. 14.
Costa, C., Ide, S., Simonka, C.S., 2006. Insetos Imaturos Metamorfose e Identificac ão.Helos, Ribeirão Preto, p. 249.
Decree 20.792, 1980 on 08 the July 1980-COPASA: http://www.copasa.com.br(accessed 10.08.10).
Decree 20.793, 1980 on the July 1980-COPASA: http://www.copasa.com.br(accessed 10.08.10).
Dudgeon, D., 1986. The life cycle, population dynamics and productivity ofMelanoides tuberculatus (Müller, 1774) (Gastropoda, Prosob., Thiaridae) in HongKong. J. Zool. 208, 37–53.
Elkarmi, A.Z., Ismail, S.I., 2007. Growth models and shell morphometrics of twopopulations of Melanoides tuberculatus (Thiaridae) living in hot springs andfreshwater pools. J. Limnol. 66, 90–96.
Epler, J.H., 2001. Identification Manual for the Larval Chironomidae (Diptera)of North and South Carolina. Aquatic Entomologist. North Carolina Depart-ment of Environmental and Natural Resources, Division of Water Quality,p. 1073.
Fernandez, H.R., Domingues, E., 2001. Guia para la determinación de los artropodosbentônicos. Sudamericanos, Tucumán, UNT, p. 39.
Fonseca, J.C., Marques, J.C., Paiva, A.A., Freitas, A.M., Madeira, V.M.C., Jørgensen, S.E.,2000. Nuclear DNA in the determination of weighting factors to estimate exergyfrom organisms’ biomass. Ecol. Model. 126, 179–189.
Fore, L.S., Karr, J.R., Conquest, L.L., 1994. Statistical properties of and index of bio-logical integrity used to evaluate water resources. Can. J. Fish. Aquat. Sci. 51,1077–1087.
Golterman, H.L., Clymo, R.S., Ohnstad, M.A.M., 1978. Methods for Physical and Chem-ical Analysis of Freshwaters, 2nd ed. Blackwell Scientific Publications (IBP 8),Oxford, pp. 324–343.
Helson, J.E., Williams, D.D., Turner, D., 2006. Larval Chironomidae community orga-nization in four tropical rivers: human impacts and longitudinal zonation.Hydrobiologia 559, 413–431.
Klemm, D.J., Blocksom, F.A., Fulk, A.T., Herlihy, R.M., 2003. Development and evalua-tion of a macroinvertebrate biotic integrity index (MBII) for regionally assessingMid-Atlantic highlands streams. Environ. Manage. 31, 656–669.
Jorcin, A., Nogueira, M.G., 2008. Benthic macroinvertebrates in the Paranapanemareservoir cascade (Southeast Brazil). Braz. J. Biol. 68, 1013–1024.
Jørgensen, S.E., 2000. State of the art of ecological modelling. In: McAller, M. (Ed.),Proceedings of the International Congress on Modelling and Simulation. Univer-sity of Western Australia, Sydney, pp. 455–481.
Jørgensen, S.E., 2002. Integration of Ecosystem Theories. A Pattern., 3rd ed. KluwerAcademic Publishing Company, Dordrecht, The Netherlands, p. 432.
Jørgensen, S.E., 2010. Eco-Exergy as ecological indicator, pp. 77–87. In: Jørgensen,S.E., Constanza, R., Xu, F.L. (Eds.), Handbook of Ecological Indicators for Assess-ment of Ecosystem Health. CRC Press, p. 484.
Jørgensen, S.E., Ulanowicz, S.E., 2009. Network calculations and ascendancy basedon eco-exergy. Ecol. Model. 220, 1893–1896.
Jørgensen, S.E., Mejer, H., 1979. A holistic approach to ecological modelling. Ecol.Model. 7, 169–189.
Jørgensen, S.E., Ladegaard, N., Debeljal, M., Marques, J.C., 2005. Calculations of exergyfor organisms. Ecol. Model. 185, 165–175.
Jørgensen, S.E., Nielsen, S.N., Mejer, H., 1995. Energy, environment, exergy and eco-logical modelling. Ecol. Model. 77, 99–109.
Jørgensen, S.E., Padisak, J., 1996. Does the intermediate disturbance hypothesis com-ply with thermodynamics? Hydrobiologia 323, 9–21.
Livishts, G., Fishelson, L., 1983. Biology and reproduction of the freshwater snailMelanoides tuberculata (Gastropoda: Prosobranchia) in Israel. Isr. J. Zool. 32,21–35.
Ludovisi, A., Poletti, A., 2003. Use of thermodynamic indices as ecological indica-tors of the development state of lake ecosystems 2. Exergy and specific exergyindices. Ecol. Model. 159, 223–238.
Margalef, R., 1969. Perspectives in Ecological Theory. The University of Chicago Press,Chicago, pp. 111–119.
Marques, J.C., Pardal, M.A., Nielsen, S.N., Jorgensen, S.E., 1997. Analysis of the prop-erties of exergy and biodiversity along an estuarine gradient of eutrophication.Ecol. Model. 102, 155–167.
Marques, J.C., Nielsen, S.N., Jørgensen, S.E., 1998. Applying thermodynamic orien-tors: The use of Exergy as an indicator in environmental management. In: Müller,F., Leupelt, M. (Eds.), Ecotargets, Goal Functions, and Orientors. TheoreticalConcepts and Interdisciplinary Fundamentals for an Integrated, System-basedEnvironmental Management. Springer-Verlag, Berlin, pp. 481–491, Ch. 5.3.
Marques, J.C., Jørgensen, S.E., 2002. Three selected ecological observations inter-preted in terms of a thermodynamic hypothesis. Contribution to a generaltheoretical framework. Ecol. Model. 158, 213–221.
Marques, J.C., Nielsen, S.N., Pardal, M.A., Jørgensen, S.E., 2003. Impact of eutrophi-cation and river management within a framework of ecosystem theories. Ecol.Model. 166, 147–168.
Marques, J.C., Salas, F., Patrício, J., Teixeira, H., Neto, J.M., 2009. Ecological Indicatorsfor Coast and Estuarine Environmental Assessment. A User Guide. Wit PressSouthampton, Boston, pp. 183–189.
Merritt, R.W., Cummins, K.W., 1996. An Introduction to the Aquatic Insects of NorthAmerica, 3rd ed. Kendall/Hunt Publishing Company, Dubuque, IA, p. 722.
Mugnai, R., Nessimian, J.L., Baptista, D.F., 2010. Manual de identificac ão de macroin-vertebrados aquáticos do Estado do Rio de Janeiro. Technical Books Editora, Riode Janeiro, p. 174.
Molozzi, J., Franc a, J.S., Araujo, T.L.A., Viana, T.H., Hughes, R.M., Callisto, M., 2011.Diversidade de habitats físicos e sua relac ão com macroinvertebrados ben-tônicos em reservatórios urbanos em Minas Gerais, Iheringia. Série Zool. 101,191–199.
Molozzi, J., Feio, M.J., Salas, F., Marques, J.C., Callisto, M., 2012. Development andtest of statistical model for ecological assessment of tropical reservoirs basedon benthic macroinvertebrates. Ecol. Indic. 23, 155–165.
Moreno, P., Callisto, M., 2006. Benthic macroinvertebrates in the watershed of anurban reservoir in southeastern, Brazil. Hydrobiologia 560, 311–321.
Nielsen, S.N., 1994. Modelling structural dynamic changes in a Danish shallow lake.Ecol. Model. 73, 13–30.
Odum, E.P., 1988. Ecologia. Guanabara Koogan S.A., Rio de Janeiro, p. 422.Patrício, J., Salas, F., Pardal, A.M., Jørgensen, S.E., Marques, J.C., 2006. Ecological indi-
cators performance during a re-colonisation field experiment and its compliacewith ecosystem theoris. Ecol. Indic. 6, 43–57.
Patrício, J., Neto, M.J., Teixeira, H., Salas, F., Marques, J.C., 2009. The robustness of eco-logical indicators to detect long-term changes in the macrobenthos of estuarinesystems. Mar. Environ. Res. 68, 25–36.
Pinto-Coelho, R.M., Brighenti, L.S., Bezerra-Neto, J.F., Morais Jr., C.A., Gonzaga, A.,2010. Effects of sampling effort on the estimation of spatial gradients in a tropicalreservoir impacted by a oil refinery. Limnology 40, 126–133.
Salas, F., 2002. Valoración y aplicabilidad de los ídices e indicadores biológicos decontaminación orgánica en la gestión del medio marino, Tesis de doctorado.Universidad de Murcia, Murcia.
Salas, F., Marcos, C., Pérez-Ruzafa, A., Marques, J.C., 2005. Application of the exergyindex as ecological indicator of organical enrichment areas in the Mar Menorlagoon (south-eastern Spain). Energy 30, 2505–2522.
Salas, F., Patrício, J., Marcos, C., Pardal, M.A., Ruzafa- Pérez, A., Marques, J.C., 2006.Are taxonomic distinctness measures compliant to other ecological indicatorsin assessing ecological status? Mar. Pollut. Bull. 52, 817–829.
Silva, E.C., Molozzi, J., Callisto, M., 2010. Size-mass relationships of Melanoidestuberculatus (Thiaridae: Gastropoda) in a eutrophic reservoir. J. Zool. 27,691–695.
Supian, Z., Ikhwanuddin, A.P., 2002. Population dynamics of freshwater molluscs(Gastropoda Melanoides tuberculatus) in Crocker Range Park, Sabah. Asian Rev.Biodiversit. Environ. Conser. 1, 1–19.
Shannon, C.E., Weaver, W., 1963. The Mathematical Theory of Communication. Uni-versity of Illinois Press, Chicago, p. 117.
Takahashi, M.A., Higuti, J., Bagatini, Y.M., Zviejkovski, I.P., Velho, L.F.M., 2008. Compo-sition and biomass of larval chironomid (Insecta Diptera) as potential indicatorof trophic conditions in southern Brazil reservoirs. Acta Limnol. Brazil 20, 5–13.
Terra, B.F., Aráujo, G.F., 2011. A preliminary fish assemblage index for a transitionalriver–reservoir system in southeastern Brazil. Ecol. Indic. 11, 874–881.
Trivinho-Strixino, S., 2011. Larvas de Chironomidae, Guia de Identificac ão. Departa-mento Hidrologia Entomologia Aquática/UFSCAR, 2011, São Carlos, p. 371.
Tundisi, J.G., 2006. Gerenciamento Integrado de Bacias Hidrográficas eReservatórios-Estudo de Caso e Perspectivas. In: Nogueira, M.G., Henry,R., Jorcin, A. (Eds.), Ecologia de Reservatórios: impactos potenciais,ac ões de manejo e sistemas em cascata, vol. 2. RIMA, São Carlos,pp. 1–21.

Author's personal copy
J. Molozzi et al. / Ecological Indicators 24 (2013) 543–551 551
Vos, J.H., Oijevaar, M.A.G., Postman, J.F., Admiraal, W., 2000. Interaction betweenfood availability and food quality during growth of early instar chironomidlarvae. J. N. Am. Benthol. Soc. 19, 158–168.
Xu, F.L., Zhao, Z.Y., Zhan, W., Zao, S.S., Dawson, R.W., Tao, S., 2005. An ecosystemhealth index methodology (EHIM) for lake ecosystem health assessment. Ecol.Model. 188, 327–339.
Xu, F.L., Yang, Z.F., Chen, B., Zhao, Y.W., 2011. Ecosystem health assessment ofthe plant-dominated Baiyangdian Lake based on eco-exergy. Ecol. Model. 222,201–209.
Willby, N., Birk, S., 2010. A case study of three techniques for assessing comparabilityof national methdos of ecological classification, technical report. University ofDuisburg-Essen.
![Ecological and Sustainable Urban Design: Eco-Villages, Eco-Districts, and Eco-Cities [2011]](https://img.pdfslide.net/doc/110x75/631eab414c5c8fb3a00e4d69/ecological-and-sustainable-urban-design-eco-villages-eco-districts-and-eco-cities.jpg)


