Embed Size (px)
Citation preview

The copyright of this thesis rests with the University of Cape Town. No
quotation from it or information derived from it is to be published
without full acknowledgement of the source. The thesis is to be used
for private study or non-commercial research purposes only.
Univers
ity of
Cap
e Tow
n

1
Bayesian Participatory-Based Decision Analysis: An Evolutionary, Adaptive Formalism for Integrated
Analysis of Complex Challenges to Social-Ecological Systems Sustainability
PhD Dissertation : Final Version
(25 May 2010)
Author: Camaren Peter
Department of Commerce: University of Cape Town Graduate School of Business
Student Number PTRCAM002
Supervisors: Prof Kurt April & Dr Anet Potgieter
Abstract
This dissertation responds to the need for integration between researchers and
decision-makers who are dealing with complex social-ecological system
sustainability and decision-making challenges. To this end, we propose a new
approach, called Bayesian Participatory-based Decision Analysis (BPDA),
which makes use of graphical causal maps and Bayesian networks to facilitate
integration at the appropriate scales and levels of descriptions. The BPDA
approach is not a predictive approach, but rather, caters for a wide range of
future scenarios in anticipation of the need to adapt to unforeseeable changes
as they occur. We argue that the graphical causal models and Bayesian
networks constitute an evolutionary, adaptive formalism for integrating
research and decision-making for sustainable development. The approach was
implemented in a number of different interdisciplinary case studies that were
concerned with social-ecological system scale challenges and problems,
culminating in a study where the approach was implemented with decision-
makers in Government. This dissertation introduces the BPDA approach, and
shows how the approach helps identify critical cross-scale and cross-sector
linkages and sensitivities, and addresses critical requirements for
understanding system resilience and adaptive capacity.
Univers
ity O
f Cap
e Tow
n

2
Univers
ity O
f Cap
e Tow
n
3
Keywords: sustainability, transdisciplinarity, complexity, hyperstructures, case
studies, social-ecological systems, decision-makers, multi-scale, complex adaptive
systems, self-organisation.
I would like to extend my gratitude to the following people for their support
during this dissertation. They include; Pedro Monteiro, firstly, for his inspiring
leadership, example and dedication to my personal development, and secondly, for
creating the space for the idea behind this dissertation to emerge. Rasigan Maharaj,
for first believing in and supporting the BPDA idea with Council for Scientific and
Industrial Research (CSIR) presidential funds. Alex Weaver, Michelle Audoin and
Mike Burns for their active support in developing the BPDA approach, and to Mina
Anthony for providing a great deal of practical advice and support at crucial turning
points in my career. David Le Maitre for his endless support on both intellectual and
emotional levels, and for patiently reading and re-reading many early scripts of the
work which led to the BPDA approach. Anet Potgieter and Kurt April for providing
supervision at various stages in the development of this dissertation, and for extending
friendship to me beyond my expectations. Kurt Kruger, for his patient rendering of
hundreds of versions of Sisyphus software as we moved up towards modelling at
massive scale. The CSIR, whose funding bodies contributed generously in funding the
development of the technology (Sisyphus), and funded the application of the BPDA
idea in all the case studies conducted in this dissertation through the ECO3
(The
Ecology and Economics of Ecosystems) Strategic Review Panel funded project (i.e.
competitive funds). Moreover, it was in 2001, while working as a systems engineer at
the CSIR that the author first began using Bayesian networks to model joint command
and control timeline scenarios, while facilitating doctrine development between the
different armed force, and it was through this opportunity that the author had the
insight into the broader applications of the approach.
Vanya Gastrow, the undying love of my life who has continually brought me
back to reality so beautifully throughout this process and before. Every member of my
family, as you have all contributed to who I am, but especially my father, who has
played a key role in the development of my ideas. All my friends - I am nothing
without you.
Univers
ity O
f Cap
e Tow
n

4
Univers
ity O
f Cap
e Tow
n

5
“The masterwork is unknown, only the work is known, knowable. The master is the
head, the capital, the reserve, the stock and the source, the beginning, the bounty.
It lies in the intermediary interstices between manifestations of work. No one can
produce a work without labouring in this sheer sheeting cascade from which now and
then arises a form. One must swim in language and sink, as though lost, in its
noise, if a proof or a poem that is dense is to be born. The work is made of forms,
the masterwork is a formless fount of forms, the work is made of time, the
masterwork is the source of times, the work is a confident chord, the masterwork
trembles with noise. He who does not hear this noise has never composed any
sonatas. The masterwork never stops rustling and calling. Everything can be found
in this matrix, nothing is in this matrix; one could call it smooth, one could call it
chaotic, a laminar waterfall or clouds storm-crossed, a crowd. What are called
phenomena alone are known and knowable, avatars of a secret remote proteus
emerge from the clamourous sea. Visible and beautiful are the dispersed tableaux;
beneath the green serge veil, lies the well. Empty, full, will we ever know? When
there is an infinity of dispersed information in the well, it is really the same well as if it
were devoid of information.”
Michel Serres (Genesis 1982 - 1998)
Univers
ity O
f Cap
e Tow
n

6
Univers
ity O
f Cap
e Tow
n

7
1. Overview of Dissertation ................................................ 13
1.1 Introduction ....................................................................................................... 13 1.1.1 The Need for Sustainability............................................................................................. 13 1.1.2 Social-Ecological Systems ............................................................................................... 15 1.1.3 The Emerging Discourse on Sustainability ...................................................................... 17 1.1.4 Transdisciplinarity ........................................................................................................... 18 1.1.5 Complexity, Self-Organisation and Emergence .............................................................. 19 1.1.6 Implications for Case Study Research of Social-Ecological Systems ............................... 22 1.1.7 Research Goals: Methodological and Analytical Considerations.................................... 23 1.1.8 Research Contribution .................................................................................................... 27 1.1.9 Outline of Dissertation.................................................................................................... 30
2. The Basics: Complexity Theory & Social-Ecological Systems
Sustainability ....................................................................... 33
2.1 Sustainability: Strategy-Making, Scenario Planning and Adaptive Management 33
2.2 Scenarios, Projections, Causality & Conditionality ............................................. 37
2.3 A New ‘Science’ for Sustainability? ................................................................... 39 2.3.1 The Need for a New Approach: Systems & Complexity.................................................. 39 2.3.2 Transdisciplinarity: The Need for Shared Knowledge ..................................................... 49
2.3.2.1 “Undecideability”: A Necessary Evil ...................................................................... 52 2.3.2.2 Transdisciplinarity & Complexity ........................................................................... 53
2.3.3 Resilience, Adaptive Cycles & Panarchy ......................................................................... 54
2.4 Complexity & Hierarchy: Emergence & Hyperstructures.................................... 60 2.4.1 Emergence & Hierarchy: An Unholy Mix ........................................................................ 60 2.4.2 Emergence, Learning & Hyperstructures........................................................................ 62 2.4.3 The Case for Heterarchy ................................................................................................. 66
3. Bayesian Networks and Graphical Causal Models as
Hyperstructures for Social-Ecological Systems ...................... 69
3.1 Capturing Shared Knowledge in Ontology’s ....................................................... 69 3.1.1 Modelling Social-Ecological Systems: Requirements for Ontologies .............................. 69
3.1.1.1 Learning, Causality & Classification ....................................................................... 70 3.1.1.2 Alternative Conceptual Schema’s & Causality ...................................................... 72
3.2 What are Bayesian Networks and Graphical Causal Maps? ............................... 75
3.3 Bayesian Networks as Hyperstructures & Requirements for Social-Ecological Systems .......................................................................................................................... 79
3.3.1 Multi-Participatory Process Facilitation: ........................................................................ 80 3.3.2 Learning, Conditionality and Causality ........................................................................... 80 3.3.3 Addressing the Complexity of Social-Ecological Systems as Multi-Agent Systems......... 81
3.4 Why Bayesian Networks & Graphical Causal Maps? .......................................... 82 3.4.1 Conditionality, Causality & Organisation ........................................................................ 82 3.4.2 Contrary Views and Sets of Evidence ............................................................................. 84 3.4.3 Learning: Observations & Interventions ......................................................................... 85 3.4.4 Complexity: Scale, Non-Linearity, Adaptive Capacity & Resilience ................................ 85
Univers
ity O
f Cap
e Tow
n
8
3.4.5 Participatory Process Facilitation ................................................................................... 86
3.5 Summary............................................................................................................ 88
4. Research Methodology: Strategy & Design Considerations
91
4.1 Background: A Review of Research & Decision-Support Tools for Sustainability 92
4.1.1 Scenario Planning & Participatory Processes for Modelling Multiple Futures ............... 92 4.1.2 Modelling the Complexity of Social-Ecological Systems ................................................. 94
4.1.2.1 Modelling Complexity: Hierarchy & the Multi-Agent System ............................... 94 4.1.2.2 The Role of Narrative: Multiple Perspectives........................................................ 99
4.1.3 Case Study Research: Strategies & Methodologies ...................................................... 101
4.2 Proposed Case Study Research Strategy .......................................................... 109
4.3 Aims of single and cross-case study analysis .................................................... 115 4.3.1 Testing Specific Requirements for Social-Ecological Systems....................................... 115 4.3.2 Summary of Methodological and Analytical Objectives ............................................... 120
4.3.2.1 Integration Across Scales .................................................................................... 121 4.3.2.2 Integration Across Disciplines and Sectors.......................................................... 121 4.3.2.3 Facilitating Transdisciplinarity Research ............................................................. 122 4.3.2.4 Developing New Indices ...................................................................................... 123 4.3.2.5 Incorporating Non-Linear Effects ........................................................................ 123 4.3.2.6 Resilience & Adaptive Capacity: Critical Limits & Thresholds ............................. 124 4.3.2.7 Decision Support for Adaptive Management ...................................................... 124 4.3.2.8 Supporting the Future Integration of Manual and Automatic Engineering ........ 125
5. Modelling Methodology: Hyperstructures for Case Study
Research on Social-Ecological Systems ............................... 127
5.1 Overview: Methodological Framework for Reasoning using Graphical Causal Models & Bayesian Networks....................................................................................... 128
5.1.1 Facilitating Interdisciplinary Problem Formulation, Review & Validation of Case Study Inputs, Outputs, Conclusions & Recommendations ................................................................... 132
5.1.1.1 Initial Phase: Problem Formulation and Research Design: ................................. 132 5.1.1.2 Feedback Phase: Review of Case Study Outputs, Conclusions and Recommendations ................................................................................................................. 135
5.1.2 Formulating Hyperstructures: Bayesian Models & Graphical Causal Models ............. 137 5.1.3 Detailed Embedded Unit & System Analysis ................................................................ 139
5.2 Formulating Hyperstructures: Graphical Causal Models & Bayesian Networks 141 5.2.1 Formulating Graphical Causal Models .......................................................................... 142 5.2.2 Formulating & Populating Bayesian Networks ............................................................. 145 5.2.3 Developing New Indices ............................................................................................... 153 5.2.4 Sensitivity Analysis & Running Scenarios...................................................................... 153 5.2.5 Interpreting Model Results & Making Recommendations ........................................... 155 5.2.6 Enabling Learning & Reasoning with Hyperstructures ................................................. 155
6. Case Studies: Single Case Analyses................................ 157
6.1 Incomati Catchment – Maputo Bay Study ........................................................ 160
Univers
ity O
f Cap
e Tow
n

9
6.2 National Scale Model: Climate Change - Irrigated Agriculture ......................... 175
6.3 National Scale Model: Climate Change – Biofuels Production.......................... 182
6.4 Magisterial District Scales: Nelspruit & Mbombela .......................................... 195 6.4.1 Water-Based Household Informal and Subsistence Activities Module: ....................... 205 6.4.2 Biodiversity Intactness Module: ................................................................................... 207 6.4.3 The Nelspruit Bayesian Model: ..................................................................................... 207
6.5 Province: Western Cape ................................................................................... 210 6.5.1 Description of General Scenarios A- I ........................................................................... 225 6.5.2 Results for Projected Short, Medium and Long Term Growth Scenarios A - I .............. 231 6.5.3 Description: Short Term (Less Growth) Scenarios ........................................................ 236 6.5.4 Results: Projected Short Term “Less-Growth” Trajectories.......................................... 240 6.5.5 Determining Climate Change Related Thresholds on Provincial Multi-Sector Growth 242 6.5.6 General Results Summary: Western Cape Study .......................................................... 248
6.5.6.1 Summary of Water Use ....................................................................................... 248 6.5.6.2 Summary of Energy Use ...................................................................................... 249 6.5.6.3 Summary of Employment.................................................................................... 250 6.5.6.4 Summary of CO2 Emissions ................................................................................. 251 6.5.6.5 Summary of Residential Energy, Water Use & Household Income ..................... 251 6.5.6.6 NOX Emissions ..................................................................................................... 252 6.5.6.7 Solid Waste.......................................................................................................... 252 6.5.6.8 General Summary................................................................................................ 252
6.5.7 Brief Discussion: What did we Learn? .......................................................................... 257 6.5.7.1 Participatory Processes ....................................................................................... 257 6.5.7.2 Massive Scale-Ability ........................................................................................... 258 6.5.7.3 Integration Across Sectors .................................................................................. 258 6.5.7.4 Critical Limits, Thresholds & Resilience ............................................................... 258 6.5.7.5 Adaptive Capacity................................................................................................ 259
6.6 Facilitation Using Graphical Causal Maps......................................................... 261 6.6.1 Cholera Study................................................................................................................ 261
6.6.1.1 Divergence Phase ................................................................................................ 271 6.6.1.2 Convergence........................................................................................................ 279 6.6.1.3 What Did We Learn? ........................................................................................... 283
6.6.2 Gauteng Urban Growth Study: Built Environment ....................................................... 284
7. BPDA & Cross-Case Analysis & Discussion ..................... 287
7.1 Integration across Scales.................................................................................. 291
7.2 Integrative Modelling across Disciplines & Sectors using Bayesian Networks . 293
7.3 Developing New Indices & Embedded Units .................................................... 295
7.4 Facilitating and Enabling Transdisciplinarity .................................................... 296
7.5 Incorporating Non-Linearity ............................................................................. 298
7.6 Resilience & Adaptive Capacity ........................................................................ 299
7.7 Critical Limits & Thresholds.............................................................................. 300
7.8 Monitoring & Multiple Futures ........................................................................ 301
7.9 Choosing Connectors or Integrators................................................................. 302
7.10 Participatory Process Facilitation ..................................................................... 304
7.11 Decision Support for Adaptive Management ................................................... 310
Univers
ity O
f Cap
e Tow
n

10
8. BPDA & Case Study Research ........................................ 313
8.1 Case Study Research Design Considerations .................................................... 314 8.1.1 Introduction: Purpose of Research Design ................................................................... 314 8.1.2 Components of Research Design .................................................................................. 316 8.1.3 Evaluation, Validity & Causality .................................................................................... 318
8.2 Implementation Considerations of the Research Strategy ............................... 322 8.2.1 Conceptualising the Study ............................................................................................ 322 8.2.2 Pattern-Matching ......................................................................................................... 326 8.2.3 Rival Explanations as Patterns ...................................................................................... 327 8.2.4 Explanation Building ..................................................................................................... 329 8.2.5 Third Strategy – Time Series Analysis ........................................................................... 330 8.2.6 Chronologies ................................................................................................................. 331 8.2.7 Lesser Analytical Modes of Analysis: Embedded Units, Repeated Observations & Case Surveys 332
9. Frameworks for Future Development of BPDA Approach
333
9.1 Introduction ..................................................................................................... 333
9.2 Social-Ecological System Integration: Conceptual Frameworks Used in Case Studies 335
9.2.1 Human, Manufactured and Natural Capitals of Social-Ecological System.................... 337 9.2.2 Total Economic Value ................................................................................................... 342
9.3 Manual and Automatic Engineering of Emergence Revisited ........................... 346 9.3.1 Manual Engineering of Emergence............................................................................... 346 9.3.2 Automatic Engineering of Emergence .......................................................................... 348 9.3.3 Converging Manual & Automatic Engineering ............................................................. 349
9.4 Can Bayesian Hyperstructures Support Dynamic Systems and Agent-Based Models 351
9.4.1 Bayesian Hyperstructures: Incorporating Dynamic Systems and Agent-Based Models 351 9.4.2 Visualising Real-Time Evolution of System in Heterarchical Framework...................... 354
9.5 Shared Understanding for Decision-Support in Adaptive Management .......... 360 9.5.1 Understanding Resilience using Agents and Ontology’s .............................................. 360 9.5.2 Understanding Agency, Resilience & Adaptive Management ...................................... 365 9.5.3 Accommodating Values, Beliefs, Norms & Behaviours ................................................ 368 9.5.4 Representing Multiple Mental Models of High Uncertainty Decision-Making Scenarios 373
10. Summary and Conclusions ......................................... 375
11. References ................................................................ 379
12. Appendix A: Cholera Study ........................................ 401
Univers
ity O
f Cap
e Tow
n

11
13. Appendix B: Urban Growth in Gauteng – Sub-Module
Illustrations & Descriptions ................................................ 411
14. Appendix C: Western Cape Provincial Model – Individual
Modules ............................................................................ 423
15. Appendix D: Mbombela Model Sub-System Modules . 449
16. Appendix E ................................................................ 473
Univers
ity O
f Cap
e Tow
n

12
Univers
ity O
f Cap
e Tow
n

13
1. Overview of Dissertation
1.1 Introduction
1.1.1 The Need for Sustainability
We are living in a new era of human development, where the long-term
sustainability of human and ecological systems is under increasing pressure from
global and local change effects. Notable changes are occurring in the growth and
decline of the populations of humans and other species, in the rates of social and
economic globalisation, and in the rates of change in the decline of the earth’s natural
support systems (Holling, Gunderson & Ludwig, 2002; Lubchenco, 1998; Malhotra,
1999). Variations in climate and the global economy are also occurring more
suddenly and at faster rates than experienced in recent human history. Consequently,
traditional leadership and management approaches often fail to adapt quickly enough
to the fast pace of changes (Malhotra, 1999) (Folke et al., 2005; Malhotra, 1999,
Perlas, 2000).
Moreover, decisions and actions taken toward sustainability are increasingly
thwarted by externalities. As global systems become more interconnected, actions
taken in one area or sector can have disastrous effects on the sustainability of other
areas and sectors. According to Folke et al. (2005); “human activities have become
globally interconnected and intensified through new technology, capital markets and
systems of governance, with decisions in one place influencing people elsewhere.”
Therefore, decision-making for sustainable development in the 21st
Century is
faced with the critical challenge of adapting to the increasing rates of change and
inter-connectivity between human, natural and technological systems. These factors,
taken together, are having increasingly noticeable effects on both developed and
developing nations alike (Lubchenco, 1998).
It is widely acknowledged that historical approaches towards human
development and ecological resource exploitation haven’t and will not prove effective
Univers
ity O
f Cap
e Tow
n

14
in reducing the immense and pervasive human pressures that are being placed on
earths’ ecologically driven life support systems (Burns & Weaver, 2008; Holling et
al., 2002; Lubchenco, 1998; Malhotra, 1999; Stern, 2000; Van Kerkhoff & Lebel,
2006). It is unlikely that more of the same approach will lead to the sustainability of
human and ecological systems and their critical interdependencies. As a result higher
levels of uncertainty are being faced in both leadership and management levels in
organizations than ever before (Folke et al., 2005; Folke et al., 2002, Malhotra, 1999;
Max-Neef, 2005; Pahl-Wostl, 2007), and are searching for frameworks that enhance
broader understanding of social-ecological systems (Anderies, Jansen & Ostrom,
2004).
According to Van der Sluijs (2007) the failure of traditional management
approaches in coping with these new challenges is also due to “imperfect
understanding of the complex systems involved”. When the collective behaviour of
decision-makers lacks overall coordination, they can often act in conflicting ways that
bring pressure on the ability of the system to sustain itself. Socio-economic and
ecological systems are interconnected at different scales and levels of description1.
They have multiple nested or embedded sub-systems, many of which are complex in
nature and adaptive themselves (Levin, 2006). Socio-economic systems in particular
are constantly adapting and changing by virtue of their ability to self-organise at the
individual and collective level (i.e. as groups (Ehrlich & Levin, 2005)), and to evolve
according to socio-cultural norms (Ehrlich & Levin, 2005, Stern, 2000). Therefore,
these groups and individuals can, through their individual behaviours, bring about
reflexivity2
1 According to Ingram (2007), “ “scale”, is the spatial, temporal quantitative or analytical dimension used to measure and study any phenomenon, and “level” is the unit of analysis that is located at different positions on a scale.” (Gibson et al, 2000; Cash et al, 2006)”. Panarchy is the term used to describe the interconnectedness that exists across scales within a social-ecological system.
at the whole system scale i.e. emergent behaviours or ‘emergent higher
order structure’ (Ehrlich & Levin, 2005). The self-organisation and reflexivity of
social systems places difficult methodological demands on case study research of
social-ecological systems and on decision-makers seeking to ensure sustainability
(Folke et al., 2005).
2 Reflexivity, is used here to describe how behaviour, at the individual level can be informed by a variety of considerations (e.g. values, norms), and as such, gives rise to behavioural responses of which the individual may not be directly aware (i.e. to act reflexively or without thought). These responses may be similar or dissimilar at the group level, leading to emergence at the system scale.
Univers
ity O
f Cap
e Tow
n

15
Ensuring the sustainability of current human development trajectories in the
fast changing political, environmental and social context of the 21st Century will
therefore require decision-makers to; (1) be self-reflexive3
, (2) be able to adapt to
unforeseeable changes and faster rates of change, and (3) to cope with an increasingly
inter-connected set of developmental problems and challenges that spans across
sectors and institutions.
Enabling sustainability necessitates that researchers and decision-makers deal
with socio-economic and ecological systems as integrated ‘whole’ systems. This has
led to the introduction of the term ‘social-ecological systems’ or ‘socio-ecological
systems’ by a growing body of researchers involved in research for sustainability
(Holling et al., 2002).
1.1.2 Social-Ecological Systems
Social-ecological systems are real-world, multi-scale, complex adaptive
systems (Folke et al., 2005; Levin, 2006). The dependence of social-ecological
systems on emerging social, economic, ecological and technological dynamics means
that social-ecological systems are often more dependent on current context than
historical context i.e. due to the faster rates of change in economy, ecology and
society (Folke et al., 2002; Folke et al., 2005; Gregory & Oerlemans, 2009; Holling,
2004; Kates & Clarke, 1996; Kates & Dasgupta, 2007; Malhotra, 1999).
The use of the term ‘social-ecological system’ does not imply that there is a
universal theory of social-ecological systems. A social-ecological system is also
complex in that it can be defined differently, and from different perspectives,
depending on the context of inquiry. Disciplinary fragmentation in the research of
social-ecological system scale problems results in ‘tunnel vision' and consequently,
fragmented decision-making and actions in the governance and management of
3 The term ‘self-reflexive’ is used here in the same sense that it is used in action research methodologies i.e. reflecting the need for researchers and decision-makers to be aware of their own value positions and how they may contribute to the dominance of adverse effects in relation to the
Univers
ity O
f Cap
e Tow
n

16
social-ecological systems (Folke et al., 2002; Holling et al., 2002, pp .24). Hence, to
some extent, the term ‘social-ecological systems’ has emerged from the need to
overcome the limitations and dominance of “partial truths” (Holling, Gunderson &
Ludwig, 2002, pp. 24) in research and decision-making for sustainability. The
dominance of partial truths (or alternatively; partial perspectives) often results in
conflicting actions in different spheres of governance, management and research, to
the detriment of the sustainability of social-ecological systems as a whole.
Enabling the sustainability of social-ecological systems necessitates that
researchers and decision-makers can collectively self-organise to address unforeseen
changes in a self-reflexive manner and can transcend the limitations of partial-
perspectives. One of the key reasons for introducing the collective term ‘social-
ecological systems’ is to help engender a shared understanding of sustainability
challenges, that can translate into more effective and coordinated actions towards
sustainability across different scales and levels of governance.
Where the sustainability of social-ecological systems is concerned, there is a
particular need to understand the ‘resilience’ of the system in different scenarios. The
resilience of social-ecological systems results from its’ adaptive capacity, i.e. the
ability of adaptive agents to self-organise in relation to each other and the external
environment; and in such a manner that the system stays within its internal critical
limits and thresholds (Walker et al, 2004). When self-organisation occurs in this way
the system’s global behaviour, internal structure and processes do not undergo
fundamental changes, and the system is regarded as stable or ‘resilient’ in relation to
its’ environment (Walker et al, 2004).
sustainability of the ‘whole’ system. Note that this term should not be confused with the use of the term ‘reflexivity’ in the text.
Univers
ity O
f Cap
e Tow
n

17
1.1.3 The Emerging Discourse on Sustainability
As outlined earlier, the need for new ways of achieving sustainability is the
key challenge of our era. The notion and question of sustainability engages a wide
range of theories, experts, sectors, methodologies and schemes for observation and
intervention in a quest to enable decisions towards sustainability to be made.
In response, a new discourse is emerging regarding the role of science in
realising and actualising sustainability (Clarke et al., 2004; Holling et al., 2002;
Lubchenco, 1998, Stern, 2000; Van Kerkhoff & Lebel, 2006). A diverse array of
social and natural science research strategies can be used to arrive at very different
conclusions about what actions are necessary to remedy a particular situation. The
broad challenge is appreciating and understanding the multiplicity of futures the
system may have, and putting in place research and management strategies to
strengthen the adaptive capacity of the system. This requires employing conceptual
frameworks that are capable of coping with what emerges out of a range of possible
futures, including the unexpected or surprising (Clarke, Crutzen & Schellnhuber,
2004; Holling, Gunderson & Ludwig., 2002; Holling, 2004; Folke et al., 2002;
Malhotra, 1999; Peterson et al., 2003).
In this new discourse, two new areas of research have emerged as critical for
providing the understanding that is required to make decisions and take actions in
support of sustainability:
1. Observing the “whole” - multiple perspectives: The first critical area from
which surprises emanates is from the “fragmentation” in perspectives and a
consequent fragmentation in decision-making, often leading to unintended,
unforeseen and undesired impacts on the sustainability of social-ecological
systems. This fragmentation in perspectives and actions is a result of traditional
disciplinary and institutional limitations, which prevent a researcher or decision-
maker from making decisions (about how they study and evaluate the system and
consequently decide to act) that relate to whole system sustainability (Folke, 2002;
Holling et al., 2002).
Univers
ity O
f Cap
e Tow
n

18
2. Understanding the causal relationships amongst the behaviour of the “parts”
and behaviour of the “whole” - the multi-agent system: We need to understand
how social and ecological systems are nested and inter-linked, what their critical
limits and thresholds are, and how these linkages affect the sustainability of the
whole ‘social-ecological’ system in different scenarios. Here it is crucial that the
role of multiple agents within the system can be visualised and understood by
decision-makers, as sustainability is critically dependent on their interactions.
This is especially so where cross-scale and cross-sector linkages are concerned
(Holling et al., 2002).
In summary, research and decision-making for the sustainability of social-
ecological systems are currently hampered at global, regional and local scales by two
types of fragmentation (Holling et al., 2002); (1) the inability of researchers to
effectively integrate beyond disciplinary boundaries to address the complexity of
social-ecological systems as integrated wholes, and (2) the fragmentation in decisions
and actions taken by decision-makers in social-ecological systems.
The former (1) is a critical area of focus for complexity theory, which is
mainly concerned with self-organisation and emergence in multi-agent systems. The
latter (2) is a critical area of focus for emerging thinking on transdisciplinarity, which
is concerned with the inability of monodisciplinary approaches to deal with complex
real-world phenomena, events and systems.
1.1.4 Transdisciplinarity
Research processes attempting to deal with the sustainability of social-
ecological systems must necessarily engage with the “political processes of decision-
making and change” through the processes of “learning, participation, integration,
learning and negotiation” (Van Kerkhoff & Lebel, 2006). The current era of human
development therefore requires more from the natural and social sciences than they
have provided in recent history (Clarke et al., 2004; Ehrlich & Levin, 2005; Holling,
Univers
ity O
f Cap
e Tow
n

19
Gunderson & Ludwig, 2002; Lubchenco, 1998; Starzomski, 2004; Stern, 2000; Van
Kerkhoff & Lebel, 2006). It calls for science to transcend its disciplinary and
epistemological boundaries in order to help deal with the key global “problematiques”
facing humankind (Max-Neef, 2006).
According to Max-Neef (2005) the call to transdisciplinarity is a response to
the need to understand real-world phenomena; such as those involving the
sustainability of natural resources, war, water, globalisation, forced migration, poverty
and inequality. Transdisciplinarity requires researchers to find “a different manner of
seeing the world, more systemic and more holistic”. It also, by necessity, must
engage with the complexity of real-world systems (Max-Neef, 2005).
According to Max-Neef (2005) transdisciplinarity also requires an
understanding of complexity. As already outlined in the previous section, both are key
concepts for enabling research for sustainability of social-ecological systems.
1.1.5 Complexity, Self-Organisation and Emergence
“The multiple as such. Here’s a set undefined by elements or
boundaries. Locally, it is not individuated; globally, it is not summed
up. So it’s neither a flock, nor a school, nor a heap, nor a swarm, nor a
herd, nor a pack. It is not an aggregrate; it is not discrete. It’s a bit
viscous perhaps. A lake under the mist, the sea, a white plain,
background noise, the murmur of a crowd, time. I have no idea, or am
dimly aware, where its individual sites may be. I’ve no notion of its
points, very little idea of its bearings. I have only the feeblest
conception of its internal interactions, the lengthiness and
entanglement of its connections and relations, only the vaguest idea of
its environment. It invades the space or it fades out, takes a place,
either gives it up or creates it, by its essentially unpredictable
movement. Am I immersed in this multiple, am I, or am I not a part of
it? Its edge a pseudopod takes me and leaves me. I hear the sound and
Univers
ity O
f Cap
e Tow
n

20
I lose it, I have only fragmentary information on this multiplicity.
(Serres, 1998).
In the preceding sections we have introduced and elaborated on the role of
self-organisation and emergence as central themes in the governance and management
of social-ecological systems. We also noted the fragmentation of perspectives (or
lack of shared understanding) by agents in social-ecological systems often thwarts
sustainability. The inability of system actors to comprehend the systemic effects of
their decisions and actions, results in the emergence of collective behaviours that are
not sustainable (Holling et al., 2002). Here complexity theory is especially relevant.
Complexity theory is a theory that is primarily concerned with the multi-agent
system (Heylighen et al., 2007); systems with adaptive agents which self-organise
(Ashby, 1962) at individual and group level in relation to their environments. Self-
organisation, as an ontological phenomenon, occurs as a result of interactions between
agents themselves and agents and their environments. These interactions “comprise a
complex set of causal relationships” (Potgieter, 2004). Self-organisation as an
epistemological phenomenon varies with the “graining” or “levels” of observation or
description implemented on the system (Gershenson & Heylighen, 2003).
Similarly the concept of emergence, or ‘surprise’ in complex, adaptive
systems has both ontological and epistemological origins, respectively:
Emergence, in the first case, is due to the lower-level dynamics that are
responsible for generating collective behaviour (Baas & Emmeche, 1997, in Potgieter
2004, p.10), and this is indeed the case for social-ecological systems, which “are
complex, adaptive systems” (Cilliers, 2008; Levin 2006). Human and natural (or
social and ecological) systems are inseparable, open systems (Gillaume et al. 2004),
the whole of which must necessarily be sustainable. As already discussed, the
‘whole’ social-ecological system has emergent properties due to the dynamic
behaviour of self-organizing agents. These agents enable system level adaptations to
be innovated (Levin, 2006). In this sense, emergence results from the reflexivity and
Univers
ity O
f Cap
e Tow
n

21
self-organisation of agents within the system and their collective actions (Ehrlich &
Levin, 2005; Folke et al., 2002, Stern, 2000; Van Kerkhoff & Lebel, 2006).
Emergence, in the second case, results because no one ‘fragmented
perspective’ alone (Holling et al., 2002; Islam et al., 2006; Allenby, 2006) can
satisfactorily reflect or explain the nature of the ‘whole’ system as a shared
phenomenon amongst people. In complexity theory the concept of ‘perceptual
emergence’ (Islam et al., 2006) puts forward the idea that emergence results because
no single perspective can adequately account for the full complexity of real-world
systems i.e. there will always be surprises because our models cannot fully replicate
complex reality (Cilliers, 2001/2008). The ‘whole’ in this case is the elusive,
emergent product of different perspectives (Islam et al., 2006) or “ways of looking” at
the system, and how it is self-organized (Gershenson & Heylighen, 2003). Islam et
al. (2006) argue that there is no single ‘objective’ “whole system” that exists as a
metaphysical entity. No single interpretation of a complex whole can adequately
represent it, and hence no universal theory can exist for the analysis or description of
complex, adaptive systems (Cilliers, 2008; Holling et al., 2002; Van der Sluijs, 2007).
Emergence, as observed in complex systems therefore occurs “relative to a
model” (Cariani, 1991, in Potgieter 2004, p.10). In this sense, all complex adaptive
systems “maintain internal models, consisting of hyperstructures representing
“regularities” in the information about the system’s environment and its own
interaction with that environment. Hyperstructures are higher-order structures or
“emergent phenomena” that emerge from the collective behaviour of agents.
Complex adaptive systems use these hyperstructures to act in the real world (Gell-
Mann, 1994) (Holland, 1995)” (Potgieter 2004, p1, emphasis added: italics).
Hyperstructures must necessarily be adaptive and flexible enough to incorporate new
evidence in order to cope with emergence. Emergence ‘relative to a model’ (Cariani,
1991), in this case, constitutes observed deviations from the models that constitute
these hyperstructures (see section 2.4.2). Our ways of observing, interpreting and
analysing complex events and systems are therefore always subject to revision in fast
changing contexts i.e. our ‘models’ of systems are never fully correct, and emergence
occurs when our observations don’t agree with our models of a phenomena or event.
Univers
ity O
f Cap
e Tow
n

22
1.1.6 Implications for Case Study Research of Social-Ecological Systems
In summary of the key points, understanding and coping with emergence in
social-ecological systems is concerned with; (1) the multiple perspectives of what
constitutes the ‘whole’ social-ecological system in relation to context, (2) complexity
and reflexivity; how its constituent ‘parts’ and adaptive agents are inter-related and
can adapt to bring about different social-ecological system behaviours, and (3) the
real-world context in which the social-ecological system is located and the context of
inquiry.
As already discussed in the preceding sections, social-ecological systems are
complex, adaptive systems (Levin, 2006). Decisions and behaviours resulting from
the values, beliefs and norms of human actors in the system (Stern, 2000) leads to the
emergence of higher order structure in these systems (Ehrlich & Levin, 2005). This
higher order structure is indivisible from its context. It is too complex to be
exhaustively formulated from a top-down general set of rules - and too variational and
expansive to be described exclusively from bottom-up parsimonious approaches.
We can only obtain a resolved understanding of a social-ecological system
when it is viewed in its context, and the particular purpose (or question) for which the
system has been formulated4
. We also explained earlier how real-world complex
adaptive systems such as social-ecological systems are dynamically changing systems
and depend strongly on the current context for analysis and interpretation of system
behaviours (Malhotra, 1999). The relevance of the historical behaviour of these
systems fades when compared to the influence of current contextual factors
(Malhotra, 1999). The sensitivity of the currently observed behavioural trajectory of
the system is more likely to sway with the influences in its environment that are
currently significant. While system ‘memory’ is important in understanding the
evolution of the system, it does not exclusively govern the behaviour of the system as
it journeys through changing external and internal contexts.
4 The purpose for which a question is constructed is as important as the question itself.
Univers
ity O
f Cap
e Tow
n

23
In the case of social-ecological systems the ways in which the complex causal
relationships underlying self-organisation can be envisaged may differ substantially
between researchers and decision-makers from different disciplines and sectors.
Explanation of existing behaviours and changes in a social-ecological system cannot
be achieved through a single case study. Each case study can be represented by a
different model or set of hyperstructures ‘explaining’ the phenomena. Identifying
regularities (hyperstructures) necessitates democratic sharing of perspectives on the
system as a whole, and its constituent embedded units (or sub-systems and / or
agents). Within a single case study the analysis of embedded units (and / or agents)
will be bound by the context of that particular case study. Hyperstructures
representing the internal models of social-ecological systems may therefore differ
significantly within a case study, and between case studies of the same system or
event.
1.1.7 Research Goals: Methodological and Analytical Considerations
The need for more cooperative, collective governance of resources, while
desired, is thwarted by fragmentation, as outlined earlier in this chapter. It is
therefore clear that there is a need for ways of bringing about shared understanding
across disciplines, sectors and levels of governance. An ‘action research’ approach is
required, where researchers and decision-makers can be enabled towards more self-
reflexive programmes of research, decision-making and implementation.
The goal of this dissertation is therefore to introduce a complexity based
modelling framework that helps integrate case study analyses, and can help engender
shared understanding amongst researchers and decision-makers that are concerned
with the challenge of sustainability of social-ecological systems.
We use hyperstructures to engender shared understanding. Shared
understanding, in the context of this dissertation, is achieved when researchers and
decision-makers from different disciplines and sectors reach a common understanding
of the causal relationships amongst the behaviour of the “parts” and behaviour of the
“whole”. This allows them to be more self-reflexive in their analyses and decision-
Univers
ity O
f Cap
e Tow
n
24
making, and can contribute significantly to helping bring about more sustainable
decisions and actions.
Generally speaking, social-ecological systems and the question of
sustainability are themselves both quantitatively and qualitatively complex i.e. at
various scales and levels of description, respectively (Ingram, 2007). In this
dissertation, we contend that the nature of the problem must dictate the means of
inquiry, and not the other way round. Since social-ecological systems are complex,
adaptive systems (Levin, 2006), it stands to reason that an adaptive formalism is
required. This formalism should also be able to accommodate complexity and
uncertainty, and help provide a ‘whole’ systems perspective on social-ecological
systems. At the philosophical level, this dissertation proposes and tests the notion that
Bayesian probability theory, enabled by software interface technology, can serve as a
formalism that can satisfy these requirements, at least in part.
As a formalism, Bayesian networks do not dictate the completeness or
consistency of any model formulated using Bayesian networks, except in two aspects;
that of conditionality, and of causality. In the BPDA approach, these are the only
two conditions we impose in engendering shared understanding in multi-participant
programmes.
We argue that the BPDA approach provides a framework for informing
collective actions and interventions in social-ecological systems. It is intended to
assist in bringing about better coordinated collective governance and management
programmes across sectors and disciplines. We contend that the BPDA approach, if
intelligently applied, can help assist in arriving at reliable, verifiable, valid models of
SES’s. Furthermore, we propose that these models can help engender shared
understanding between researchers and decision-makers because they rely on a basic
and intuitive understanding of the principles of causality and conditionality to share
understanding.
To this end, this dissertation argues and tests the proposition that a
combination of graphical causal models and Bayesian networks provides an open,
heterarchical framework of reasoning that can be used as hyperstructures to maintain
Univers
ity O
f Cap
e Tow
n
25
the internal models of inter- and transdisciplinary case studies of complex adaptive
social-ecological systems.
Graphical causal maps and Bayesian networks are used as hyperstructures to
formulate and maintain the internal models around which the case studies are
designed and conducted. These hyperstructures are collections of overlapping and
non-overlapping models which represent regularities in observed information in the
systems environment, and in regularities in its interactions (e.g. interventions) with
that environment. We evaluate the ability of these hyperstructures to support
complex decision-making challenges in social-ecological systems. Bayesian
networks have recently been used in other studies to address issues concerning
sustainability such as Baran & Jantunen (2004), Borsuk, Stow & Rekhow (2004) and
Bromley et al. (2005).
The emphasis in this dissertation is on conducting a number of case studies of
complex, interdisciplinary social-ecological systems problems facing researchers.
Every case study is an instance of some higher order structure and can be represented
by a group of hyperstructures. These case studies were conducted at different scales
and levels of description, and deal with a variety of research questions pertaining to
complex social-ecological systems. The case studies were incrementally built up to
include greater complexity and variations in scale and levels of description.
The scales of governance that the case studies dealt with were the magisterial
district, municipality, provincial and national scales. The variety of research
questions explored in individual case studies ranged from; catchment-coastal
interactions, rural-urban ecosystem benefit flows, the effect of climate change effects
on agriculture and evaluating the potential for biofuels production, to the
environmental causes of cholera. In the penultimate case study, an interdisciplinary
review team worked with decision-makers to review a provincial level strategy for
climate change in the Western Cape, South Africa. This involved evaluating climate
change effects and inter-related consequences on food, energy and water sectors, and
assessing climate-related provincial multi-sector growth limitations.
Univers
ity O
f Cap
e Tow
n

26
In order to test the BPDA approach incrementally, we systematically built up
the complexity of hyperstructures for social-ecological system in terms of scale and
the number of embedded units involved in conducting each case study. The case
studies were conducted using interdisciplinary workshops that were facilitated by
using graphical causal maps and Bayesian networks to articulate system
interdependencies. They were used to capture cause-and-effect relationships. These
hyperstructures are a representation of the shared knowledge in interdisciplinary case
studies, and may consist of overlapping and non-overlapping explanations. In this
way the internal models are maintained by a multi-participant and interdisciplinary
group that is engaged in a process of adapting to emergence, whether through learning
(i.e. the introduction of new evidence), or through changes in the real-world context.
The learning process is dependent on how well the approach proposed and
tested in this dissertation (i.e. the BPDA approach) can accommodate emergence and
surprise or ‘deviations from a model’ (Cariani, 1991, in Potgieter 2004, p.10).
Understanding and modelling the complexity of social-ecological systems also
depends on how well the proposed approach can be employed in dealing with some of
the complex features of social-ecological systems, such as; non-linearity, cross-scale
effects, cross-sector and remote effects, thresholds and critical limits, adaptive
capacity, participatory processes and new evidence representing significant changes
in the current context of the system.
Understanding and researching the resilience of a social-ecological system as
a whole (Holling et al., 2002) requires a broad understanding of several factors.
These are firstly, to obtain an understanding of the adaptive capacity of the system in
a variety of ‘what-if’ scenarios. Secondly, to identify what the critical variables for
observation and intervention in the system are. Thirdly, to understand the critical
limits and thresholds which provide cross-scale stability and sustainability of social-
ecological systems.
We use Bayesian hyperstructures to obtain an understanding of social-
ecological system thresholds and adaptive capacity in different ‘what-if’ scenarios.
Both observations and interventions of system behaviours can be employed in the
progressive modification of Bayesian hyperstructures (Meder, Hagmayer &
Univers
ity O
f Cap
e Tow
n

27
Waldmann, 2005). Bayesian hyperstructures can therefore be used to help identify
and differentiate between observational and interventional variables. As such, they
can play a critical role in decision-making and adaptive management towards
sustainability of social-ecological systems by helping decision-makers collectively
understand; (a) what to observe, and (b) where to intervene in the system, in different
what-if scenarios.
We show how the approach can be used to help decision-makers consider the
consequences of a potential decision on other parts or sectors of the system, and on
the sustainability of the system as a whole, in a variety of what-if scenarios. We also
show how the approach can be used to help adapt models used in decision-making to
reflect changes occurring in the real-world context, and thereby to support efforts in
adaptive management of social-ecological systems.
Cross-case analysis is used to evaluate the extent to which graphical causal
models and Bayesian networks can be used to; (1) understand complexity and
resilience (in particular, to model the critical limits and thresholds of non-linear and
cross-scale interactions in social-ecological systems), (2) to facilitate
transdisciplinarity (i.e. to support democratic, inter-research participatory process
management, dialogue and sharing of different opinions, views and causal models of
reasoning), and (3) to support decision-making.
1.1.8 Research Contribution
The key research contributions of this dissertation lies in; (1) introducing a
new approach (i.e. the BPDA approach) for conducting cross-disciplinary, multi-
participant case studies of social-ecological systems using a combination of graphical
causal models and Bayesian networks to maintain the internal models of case studies.
The uniqueness in our approach lies in pulling together a multiplicity of views that are
held on “single reality” to achieve a shared understanding of emergence. (2) In
laying the foundations for the future development of the approach i.e. to
accommodate near-real time adaptability using agent-based Bayesian models for
decision-support research, and (3) in proposing how the approach could be abstracted
Univers
ity O
f Cap
e Tow
n

28
to support concepts in resilience theory, and to accommodate more general classes of
case studies of complex systems.
These contributions are outlined in more detail below:
1. The approach proposed in this dissertation (i.e. the BPDA approach) is tested
in a variety of social-ecological system case studies and cross-case analysis is
conducted to assess the strengths and weaknesses of the approach in; (a) dealing
with the complexity of social-ecological systems, (b) its suitability for supporting
case study research on social-ecological systems, and (c) for supporting complex
decision-making challenges concerning the sustainability of social-ecological
systems.
2. A framework is proposed, which conceptually illustrates how the approach can
be extended (in future research) to accommodate near-real time inputs to the
hyperstructures, and be used to support decision-making for the sustainability of
social-ecological systems.
3. A third contribution of this dissertation is that we show how the BPDA
approach can be used to elucidate and complement concepts in resilience theory,
such as the adaptive cycle, and can be generalised to address case studies of
broader classes of complex systems (not exhaustively), or other classes of
complex systems that are akin to social-ecological systems.
At the philosophical core of this dissertation, Bayesian probability theory is
being suggested as an alternative and complementary formalism to traditional systems
formalisms (e.g. dynamic systems models (Bennet, Cumming & Peterson, 2005)) in
the study of social-ecological systems. We locate Bayesian probability theory in a
larger participatory-based framework (i.e. BPDA). The overall contribution of this
dissertation lies in evaluating the extent to which Bayesian probability theory can be
applied to social-ecological scale problems. In particular, we assess the extent to
which the BPDA approach can be used to elucidate complexity, engender shared
understanding, and can be adapted to accommodate real-world changes as they occur.
Univers
ity O
f Cap
e Tow
n

29
We argue that; as an approach for integrating between disciplines, and creating
shared understanding between researchers and decision-makers, the BPDA approach
yields a wider range of benefits than traditional approaches. This is because the
BPDA approach can be implemented to accommodate the key elements of complexity
theory, transdisciplinarity and resilience theory in addressing case studies into social-
ecological systems. These are all critical areas of research that must necessarily be
taken into account in the study of social-ecological system scale problems. In this
dissertation, we show how the BPDA approach can be used to satisfy these critical
areas, as we evaluate the extent of its applicability in a range of case studies.
As far as economic theory is concerned, the BPDA approach is located within
the Schumpertarian or ‘evolutionary’ theory of economics and development. Our
contribution is to propose a formalism that is adaptive and heterarchical in that it
allows for the co-evolution of categories, conditionalities and causalities. We do not
propose a new theory of economics or development. Rather we propose a formalism
that allows for theoretical considerations to be made that remains governed by the
particular context of inquiry. As such, we argue that the BPDA approach is a basis on
which to develop context-governed, adaptable models that support integration, and
enables an evolutionary economics-based perspective to be maintained on critical
issues that affect sustainable development. While we test the BPDA approach in case
studies that mainly deal with the challenges of sustainability through the ‘lens’ of
social-ecological systems, we envisage that in the future it can be broadened to
support a range of development studies that require an evolutionary approach. As
such, the BPDA approach has the potential to provide a valuable contribution to the
field of evolutionary economics and the emerging ‘resilience theory’ of social-
ecological systems (Gunderson & Holling, 2002).
Univers
ity O
f Cap
e Tow
n

30
1.1.9 Outline of Dissertation
Ch 1: Overview of key concepts and outline of
research
Ch 2-3: Literature Review and
Interpretation
Ch 4 & 5: Proposed Research Strategy &
Modelling Methodology
Ch 6: Single Case Study Analyses
Ch 7-10: Discussion and Conclusions:• Ch 7 - Cross-Case Analyses•Ch 8 – BPDA & Case Study Research•Ch 9 – Frameworks for Future Development•Ch 10: Summary & Conclusions
A
B
C
D
E
Overview, Literature Review and Interpretation
Interpretation into Approach
Implementation
Learning
A-E: Flow Chart of Dissertation by Parts
Reflection on Claims Made in Previous Chapters
Figure 1: Flow Chart of Dissertation in Parts A to E.
A broad outline of the parts of this dissertation is illustrated above in Figure 1.
As illustrated, chapters 1 to 3 and parts of chapter 4 constitute the literature review of
this dissertation. However, some concepts are reviewed in more detail in later
chapters where detailed interpretation and discussions of case studies conducted in
this dissertation are made. Chapter 2 outlines the key concepts concerning
sustainability, transdisciplinarity, complexity, heterarchy. The requirements for
Univers
ity O
f Cap
e Tow
n

31
representing shared knowledge of social-ecological systems, and the use of ontology’s
is also outlined in Chapter 2.
Chapter 3 makes the case for using graphical causal models and Bayesian
networks as hyperstructures in maintaining the internal models for case studies of
social-ecological systems. These hyperstructures can also play a role in integrating
research and decision-making activities, and provide an adaptive framework to
support adaptive management.
Chapter 4 reviews research and decision-support approaches for dealing with
the sustainability of social-ecological systems (scenario planning, adaptive
management, modelling & case study research), and proposes a research strategy for
dealing with social-ecological system scale sustainability challenges.
Chapter 5 discusses the facilitation of case study research using
hyperstructures, and links the role of hyperstructures to the key requirements of case
study research and design. It proposes a research strategy and research design for
this dissertation, and outlines the aims of single and cross-case analysis for the case
studies conducted in this dissertation in support of the goal of this dissertation. It also
details the modelling methodology used in this dissertation, which makes use of
Bayesian networks and graphical causal models as hyperstructures for case study
management of social-ecological systems. Implementation considerations are also
outlined in this section.
Chapter 6 constitute the case study outlines for this dissertation. Chapter 6
introduces and discusses the individual case studies conducted in support of this
dissertation, and outlines the key elements of learning obtained from each case study
in respect of the aims and goals of cross-case analysis for this dissertation. Chapter 6
also deals with case studies that were conducted using only graphical causal maps to
facilitate interdisciplinary research and cooperation through integrated causal
modelling.
Chapters 7, 8, 9 and 10 constitute the discussion sections of this dissertation.
Chapter 7 presents the cross-case case study analyses, and interprets the results in
Univers
ity O
f Cap
e Tow
n

32
terms of requirements established for the BPDA approach in this dissertation. Cross-
case comparison is made here; each factor for cross-case analysis is evaluated and
discussed. It contains a discussion of the methodology proposed in this dissertation,
and evaluates its effectiveness in coping with the requirements of modelling complex
social-ecological systems.
Chapter 8 discusses in detail how the BPDA approach satisfies the
requirements for case study research. A conceptual framework is motivated in
Chapter 9, which shows how this approach could support agent-based modelling for
decision-support in adaptive governance and management of social-ecological
systems.
In the conclusion (Chapter 10), a summary of key insights regarding the
strengths and the weaknesses of the approach are outlined.
Univers
ity O
f Cap
e Tow
n

33
2. The Basics: Complexity Theory & Social-
Ecological Systems Sustainability
2.1 Sustainability: Strategy-Making, Scenario Planning and Adaptive Management
… the concept and practise of sustainable development as a guiding
institutional principle, as concrete policy goal, and as focus of political
struggle remains salient in confronting the multiple challenges of this new
global order. Yet how sustainable development is conceptualized and
practised hinges crucially on … the willingness of scholars and
practitioners to embrace a plurality of epistemological and normative
perspectives on sustainability … embracing pluralism provides a way out
of the ideological and epistemological straightjackets that deter more
cohesive and politically effective interpretations of sustainable
development. (Sneddon, Howarth & Norgaard, 2006)
The term ‘sustainable development’, in the broadest sense, refers to the
sustainability of socio-economic systems, ecological resources and ecosystem services
from this generation to the next (and beyond). Since its inception in the Brundlandt
Report (also known as Our Common Future) in 1987, the term ‘sustainable
development’ has its fair share of critics. One of the founders of systems theory,
Stafford Beer (1992) referred to the term ‘sustainable development’ as a “misnomer”,
because it brings together incompatible ideas; that of sustainability, and that of
development. Beer argues that the rapid pace of human and economic development,
such as population expansion and economic growth, leaves little space for the more
long-term goals of sustainability. Sustainability may require a slowing down of the
rapid pace of human development. Short term goals would necessarily have to be
sacrificed where they conflicted with long-term needs. Beer (1992) states it more
strongly; “Out of 'political correctness', no one talks about the exploitation of either
nature or indigenous peoples any more. They talk instead about 'sustainable
Univers
ity O
f Cap
e Tow
n

34
development' - but there is no such thing. Not only can development not be
sustained; even the existing fabric cannot be sustained any longer.”
In the current, highly competitive, global economic climate, survive-ability of
human development and enterprise depends on making effective short-term
adjustments to foreseeable and unforeseeable changes as they occur (Folke et al.,
2005). It has become more difficult to envisage long-term sustainability in the
context of highly variable short-term changes in organisational and governance
systems that often cannot be predicted, but only reacted or adapted to (Malhotra,
1999). If sustainable development is conceptualised as development that is sensitive
to the needs of future generations, this ‘short-termism’ can have disastrous effects
(Beer, 1992). In the race to satisfy human needs in the short term in a highly
competitive global socio-economy, our current rates of development are placing a
large cost on future generations. Simply put, future generations will have to invest a
great deal into the rejuvenation of ecological system functions and processes in order
to obtain the same services that we currently benefit from.
In some cases, these ecosystem services may disappear entirely, for example,
due to rapid human expansion or climate change effects (Lubchenco, 1998). The
availability of natural resources such as freshwater resources are threatened by
multiple factors, not all of which are within the direct control of those that are
immediately affected by it. Sustainability, in this case, depends on the ability of
human beings to plan for and adapt to foreseen and unforeseen changes as they occur.
In this sense, adaptability and adaptive capacity is a critical requirement for the
sustainability of social systems in relation to ecological systems, and vice versa (Folke
et al., 2002).
However, adaptability is hampered by the lack of coordination of governance
and institutional organisations. The failure to realise more sustainable human
development activities in recent history can be put down to “ineffective institutions
and a general lack of political will of governments and citizens at multiple scales”
(Sneddon et al., 2006). Sustainable development is therefore an institutional and
organizational challenge at multiple scales, which requires strategy-making at various
levels of governance and management within social-ecological systems.
Univers
ity O
f Cap
e Tow
n

35
Strategy-making is about asking the right questions about the future and
having appropriate strategies to deal with the multiplicity of futures that may unfold
(Peterson, Cumming & Carpenter, 2003). It involves handling real-world contexts
that have varying levels of uncertainty. Strategy, broadly speaking, has two schools
of thought which are located at different ends of the decision-making spectrum
because they handle different levels of uncertainty, namely strategic leadership and
strategic management.
At the one end, strategic leadership is often confronted with irreducible and
uncontrollable uncertainties of a system that can be observed but not directly
influenced by strategy-makers. Strategic leadership (in this context) is focussed on
framing the right questions, and building institutional or organizational capacity to
adapt or react to unforeseeable changing circumstances which lie beyond the control
of strategy-makers. The general perception usually held at this level of strategy-
making is that there is little point trying to obtain a predictive, measureable analytical
framework of the system because ‘things will emerge’ over time (Malhotra, 1999).
At the other end of the spectrum, strategic management is usually more
concerned with measurables that can be observed and interventions that can be
implemented and adapted. Where strategic management is concerned the reliance on
measurables is a direct consequence of the need for accountability within management
hierarchies. Management accountability is often interpreted as the need for
measureable results and accounts of management processes. Often, strategy-makers
at management levels have the attitude that ‘can’t manage what they can’t measure’.
At this end of the spectrum a more ‘scientific’ approach to strategy-making is
implemented because the availability of measured evidence means that traditional
science and statistical methods can be applied to the data. Policy-making is usually
an activity associated with strategic leadership based approaches, whereas
implementation of policy is performed with strategic management based approaches.
The same governance-management tensions are apparent in the strategic
approaches used for social-ecological systems i.e. the two strategy making approaches
that are currently used for social-ecological systems sustainability questions.
Univers
ity O
f Cap
e Tow
n

36
Adaptive governance (strategic leadership) makes use of scenario planning
exercises to cope with high levels of uncertainty and predictability (Folke et al.,
2005). In this domain, system actors have little or no influence upon the greater
system forces they are subject to, and can only observe changes as they occur.
Scenario planning entails envisioning and discussing system futures and possible
adaptation options through facilitated dialogues and interactions (Peterson et al.,
2003). Generally the accounts are structured in a story-telling framework where
narrative and dialogue are central to ensuring rigour. Scenario planning is a tool to
handle questions about the future in a robust framework that is open to various levels
of critique. It creates a space for conversation and learning to occur (Peterson et al.,
2003), increasing the ability of strategy-makers (system actors, stakeholders, system
users) to cooperatively adapt to uncontrollable changes.
Adaptive management (Walters, 1986) is distinguished from scenario
planning in that it permits observations and interventions to be made upon the system
(Peterson et al., 2003) and deals with a more controllable range of issues than scenario
planning does.
Strategy-making for social-ecological systems is concerned with two types of
learning processes. In scenario planning the learning process is restricted to learning
from observations because the action(s) of strategy-makers upon the system brings
about negligible influence at ‘whole’ systems level. Rather, scenario planning is
concerned with merging a broader spectrum of quantitative and qualitative
information to stimulate people into new insights about the system or problem they
are concerned with. In adaptive (co)management, the learning occurs from
observations and interventions made upon the system. Management interventions
have an influence upon the system and bring about observable effects that can be
learnt from. Scenario planning and adaptive management operate at different levels
of uncertainty and predictability. Scenario planning draws on observational
information whereas adaptive management makes use of both observations and
interventions of the system. Learning from both observations and interventions is
therefore a self-evident requirement for dealing with social-ecological systems.
Univers
ity O
f Cap
e Tow
n

37
2.2 Scenarios, Projections, Causality & Conditionality
So far we’ve discussed scenario planning, but the issue of what a scenario is
deserves some attention. So what is a scenario? Peterson et al. (2003) define a
scenario as a ‘structured account of a possible future’. In this case of scenario
planning this structure often takes the form of narrative and dialogue. So how do we
formulate a “structured account of a possible future”, or a scenario? This question is
intimately concerned with prediction, forecasts and projections (Peterson et al., 2003).
Prediction has different interpretations, but it can be defined as “the best possible
estimate of future conditions”. A forecast is a “best possible estimate from a
particular method, model or individual”. Projections are made when a ‘prediction’ is
“heavily dependent on assumptions about drivers and may have unknown, imprecise
or unspecified probabilities. Projections lead to “if this, then that” statements
(MacCracken, 2001)” (Peterson et al., 2003). Thus, a scenario as a structured
account of a possible future relies on causality to express predictions. Moreover,
these causal relationships are conditional upon a set of assumptions:
Whereas scientists understand that predictions are conditional probabilistic
statements, nonscientists often understand them as things that will happen no
matter what they do (Sarewits et al., 2000; MacCracken, 2001). (Peterson et
al., 2003, emphasis added: bold)
To summarise, a structured account of a scenario involves several key
features. Causality is the logic used to express predictions. This causality is
conditional upon a set of assumptions about system controls, functions and processes.
In addition, information gleaned from both observations and interventions are used to
learn about and iteratively improve the ‘structured account’ of the scenario.
Three “fundamental, interacting problems” (Carpenter, 2001; Peterson et al.,
2003) are associated with ecological predictions; uncertainty, contingency and
reflexivity. Where complex systems are concerned, uncertainties in models and their
results are often “not rigorously evaluated” (Peterson et al., 2003). Where forecasts
are concerned the future system state may have very different multiple futures, each
Univers
ity O
f Cap
e Tow
n

38
with equal probability of occurring. Contingency refers to the dependence of
ecological predictions on unpredictable drivers. Human behaviour is given as an
example of this (Peterson et al., 2003). Reflexivity is concerned with dynamic
feedback due to actors (or agents) within the system acting upon individually and
collectively held perceptions about the future. This dynamic feedback has a
significant effect on critical thresholds, system functions and controls of the system.
Reflexivity scuppers prediction, because it is concerned with how actors within the
system may change their behaviour in response to predictions that are ‘taken
seriously’, thereby changing the evolution of the system. Reflexivity can bring about
self-fulfilling prophecies. For example, panic-buying of petroleum often increases
where perceptions of looming fuel shortages are held, resulting in exactly the kind of
crisis (low fuel supply at service points) that people individually attempt to avert by
buying more than they usually would.
According to Peterson et al. (2003) predictions, forecasts and projections fall
in the realm of “the probable”, while scenarios deal with “the possible”. While this
distinction can be made for the purposes of distinguishing between the roles of
scenario planning and adaptive management, there exists a continuum between the
functions of strategic leadership and adaptive management of social-ecological
systems. Adaptive governance (Folke et al., 2005) and adaptive management may
generally be considered as being more concerned with strategic leadership and
strategic management roles, respectively. Both processes must interact effectively to
engender system resilience and adaptive capacity to change (Folke et al., 2005).
Adaptive governance has come to represent alternatives to “conventional top-down
government control, including collaboration, partnerships, and networks” (Folke et
al., 2005).
Issues of legitimacy and accountability are often stressed in the literature on
governance … and good governance of ecosystems has been interpreted as
solving the trilemma characterised by tensions between effectiveness,
participation and legitimacy. (Folke et al., 2005)
Univers
ity O
f Cap
e Tow
n

39
Legitimacy and accountability are key requirements for adaptive governance
and management programmes. Therefore, how we evaluate (or verify and validate)
adaptive governance and management programmes is critical to the levels of
confidence we associate with them. Accordingly Bellamy et al., state the importance
of validity (verification) and reliability (validation) in the evaluation of such
programmes (Bellamy, Walker, McDonald & Syme 2001, p. 408). Furthermore Van
Kerkhoff & Lebel emphasise that evaluation also relies on participation (Van
Kerkhoff & Lebel, 2006; Peter et al., 2008). Evaluation necessitates participation as
a mechanism for evaluating the reliability upon which assumptions and evidence
pertaining to a particular scenario is contingent.
2.3 A New ‘Science’ for Sustainability?
2.3.1 The Need for a New Approach: Systems & Complexity
What may be sustainable in a human or ecological system alone, researched
and managed by itself, does not necessarily ensure sustainability at the whole system
scale. Research and management strategies that follow this type of approach often
fail to produce sustainable actions in social-ecological systems due to fragmented
knowledge and consequent decision-making by key human actors within the social-
ecological system (Holling, Gunderson & Ludwig, 2002, pp.8).
In a chapter entitled “In quest of a theory of adaptive change” Holling,
Gunderson & Ludwig (2002, pp.19) summarises the key elements of the quest for a
research strategy for social-ecological systems as;
In our quest, we would like to discover ways to integrate and extend existing
theory to achieve a requisite level of simplicity, just complex enough to
capture and explain the behaviours we see. Those include explanations of
discontinuous patterns in space, time and structure and explanations for how
novelty emerges, is suppressed, or is entrained. For prescriptive purposes we
also seek adaptive ways to deal with surprise and the unpredictable. We
Univers
ity O
f Cap
e Tow
n

40
concentrate on adaptive approaches that do not smother opportunity, in
contrast to control approaches that presume that knowledge is sufficient and
that consequences of policy implementation are unpredictable.
The quest to “integrate and extend existing theory” is not unique to the
research that is conducted on social-ecological systems, and the challenge of
sustainability of these systems (Lubchenco, 1998; Allen, 2005). Inter and trans-
disciplinarity and coping with emergence are the key requirements for solving
problems in many different arenas of research and practise, especially where complex,
adaptive systems are the subject of interest (Holling, 2004; Max-Neef, 2005;
Starzomski et al., 2004). It is a quest that is shared by many researchers, in many
different disciplines, who have come to share the view that real-world complex
systems requires interdisciplinary and transdisciplinary approaches in order to
appropriately address the complexity of the real-world system or problem that
confronts them (Cilliers, 2008; Holling, Gunderson & Ludwig, 2002; Max Neef,
2005). In particular, social-ecological systems exhibit emergent behaviour; requiring
adaptive learning approaches to research (Folke, 2005; Van Kerkhoff & Lebel, 2006)
in order to cope with uncertainty and surprising, discontinuous behaviour.
Van Kerkhoff & Lebel (2006) relate the need for natural scientists to migrate
towards social science based ‘action research’ methodologies in order to increase their
relevance at the levels of political negotiation and decision-making. In relation to
linking theory and practise in the social sciences through action research, Gustavson
(2001, p.17) states that: “most proponents of action research argue that theory alone
has little power to create change and that there is a need for a more complex
interplay between theory and practise” (Gustavson, 2001, p.17). Similarly, research
and decision-making for sustainable development of social-ecological systems are
presented with the challenge of “linking knowledge and action” (Van Kerkhoff &
Lebel, 2006) and that actions for sustainable development must necessarily engage
with a combination of “scientific, social and political knowledge and judgements”.
Van Kerkhoff & Lebel (2006) review the theories and strategies that have come about
or into use in response to this challenge across the categories of “participation,
integration, learning and negotiation”, and emphasize the need for a “system-wide”
Univers
ity O
f Cap
e Tow
n

41
perspective that covers multiple scales and remote effects on sectors/groups beyond
those directly affected by decisions made in social-ecological systems.
As a consequence of this challenge, researchers have great difficulty in
negotiating the multiple dimensions that formulating sustainable actions requires, and
in working effectively with decision-makers, stakeholders and system users to
implement actions. Van Kerkhoff & Lebel (2006) take the view that “the authority
of research emerges from the interaction of the research processes with the political
processes of decision-making and change”. They then identify theories and strategies
for addressing the goal of linking knowledge to actions for sustainability, which
involve learning, participation, cooperation and negotiation. Any research paradigm
that seeks to become relevant in the arena of decision-making, must necessarily
engage with the fact that social-ecological systems are complex, adaptive systems
(Levin, 2006), which self-organise, and also require an interdisciplinary, sometimes
transdisciplinary approach towards research (Max-Neef, 2005).
In summary, sustainability research necessarily engages a broad range of
issues and factors and requires an open approach towards methodologies, as
methodologies are used where they ‘fit’ a problem and its context of application
appropriately. Such research efforts must necessarily be sensitivity to real-world
changes and events, and how they occur in the current context (Folke et al., 2002;
Folke et al., 2005; Malhotra, 1999). A researcher may have to interact with a wide
range of experts from different disciplinary orientations in order to obtain a balanced
and fair understanding of the problem from a whole social-ecological systems
perspective. It may also require that the researcher consults with stakeholders and
system users directly in order to obtain contextually reliable and verifiable
information. Finally, a researcher in sustainable development seeking to deal with
complex, integrative problems should aspire to enabling a true transdisciplinary
approach towards knowledge (Max-Neef, 2005), where a democratic, unbiased study
can emerge from the various understandings of the system, even if they contain
conflicting positions and assumptions. This is an important development in theory,
and has emerged in order to avoid the dominance of “partial truths” (Holling et al.,
2002, p.19) or partial perspectives from developing within the research effort.
Normative views are therefore significant where research and decision-making for the
Univers
ity O
f Cap
e Tow
n

42
sustainability of social-ecological systems is concerned, and an awareness of
normative frameworks employed in both are required of the researchers involved.
In the next few sections of this chapter a more detailed account is given of the
need for such an approach and the philosophical, conceptual and methodological
issues that are involved in implementing such an approach. It is meant to introduce
the reader into the range of background issues that have a bearing on the content of
this dissertation. The challenge of reconciling the epistemological and ontological
differences between the social and natural sciences is the subject of the next part of
this section.
Even in ‘purer’ sciences, however, since Kuhn (1970) it has been
reasonably accepted that science, as a human activity, necessarily reflects its
time and place in many ways, and to that extent is not a ‘purely objective’
activity. Moreover, science and engineering are self-selective processes, in
that those who choose to pursue such professions as opposed to, say, law or
economics or crime, choose to do so for a number of reasons, many of which
are not ‘objective’ in the usual sense (such as, for example, status,
employment opportunities, desire to create a better world, and the like). The
context within which science occurs, and individual scientists self-select,
therefore, is heavily normative. (Allenby, 2006)
It is widely recognised that even the ‘pure’ sciences involve both objective and
normative components in the ‘identification and formulation of hypotheses’ (Allenby,
2006; Kuhn, 1970) that can be tested for ‘falsifiability5
’. Moreover, where the
overlap of academic disciplines is further strained by having to accommodate non-
academic discourse; the balance between normative and objective inquiry can sway
between these two aspects as the context changes. This is also the case with adaptive
governance and co-management programmes for sustainable development.
What we call ‘science’ is often a matter of worldviews and paradigms.
Science advances through changes in paradigms (Kuhn, 1970). In particular, when
5 The author has coined the term ‘falsifiability’ for ease of use in the sentence.
Univers
ity O
f Cap
e Tow
n

43
we insist that science provides objective knowledge we assume that we are not a part
of creating the reality we observe, or attribute meaning to. In this view (the
Cartesian6
worldview), reality occurs and we observe it. From this, various
interpretations can be tested against one another and consensus reached about which
theory (or theories) best fit our observations and understanding. In this way we
refine theories until they approximate reality. In the classical sciences, these
‘refinements’ are believed to be achievable through observation of known, measurable
indicators. That is why science has long enjoyed a privileged position amongst
disciplines. The very use of the word ‘science’ itself lends credibility to insights that
are made using its methods and techniques of observation and analysis. Science
relies on ‘repeatability’ and testability. Experiments and observations are repeated to
ensure that ‘objectivity’ of the hypothesis is ensured. Hypotheses are repeatedly
tested for consistency of results. The idea that an objective reality can be interpreted
is seductive because it implies that deterministic predictability and control over
natural systems is possible. However, what we call ‘science’ is often tied up with
what we want science to be and reflects our worldview(s) of reality to some degree.
When the science of social-ecological systems is considered, however, the
ethical and ‘scientific’ considerations of human and natural systems must be merged.
It is necessary for this kind of science to bridge disciplinary, institutional and socio-
economic boundaries in order to deal with the level of complexity of social-ecological
systems appropriately. It is clear that ‘objective’ scientific knowledge is useless in the
real-world context unless a further step is taken to integrate the interpretation of
objectively determined scientific ‘facts’ with its context (Van Kerkhoff & Lebel,
2006). This view mirrors movements towards holism in the philosophy of governance
in the 20th and 21st
6 Descartes proposed that the mind and body were two distinct, separate entities. This forms the roots
for subject-object separation that underlies human-nature dualism. He also proposed that reductionism
should lie at the core of rational scientific inquiry. The Cartesian worldview lies at the basis of
reductionism, which in turn lies at the core of scientific determinism - the successes of which led to the
dominance of science since the 18th century. There are many critiques of the Cartesian worldview,
from the time of its inception until now.
century (e.g. Smuts, 1926). The need for holism is also the basis
Univers
ity O
f Cap
e Tow
n

44
on which the need for transdisciplinarity can be proposed, for example, in dealing
with global scale problems Max-Neef7
(2005). Three key areas for enabling an
ethical idea, which goes beyond the reach of pure ‘objective’ scientific knowledge,
are identified by Gandhi (1968); self-awareness, knowledge representation and taking
action. When it comes to social-ecological systems, the awareness and
representation of knowledge is a key step towards formulating and taking actions for
sustainable change, especially at different levels of organisation and decision-making
within social-ecological systems. A more distributed intelligence is therefore
required for better whole systems coordination and sustainability.
… the process of consciously generating and spreading sustainable ideas may
be termed sustainable governance. The process that leads to sustainable
governance is management of sustainable change. (Lamberts, 2006)
In this dissertation, adaptive governance and adaptive management (Folke et
al., 2005) are viewed as complementary processes which need to interact in order to
bring about successful results at various levels and scales of involvement. As already
discussed, adaptive governance refers to the higher level functions of policy and
decision-making at larger scales, whereas adaptive management is concerned with
practical implementation of intervention and monitoring programmes. Both require
effective and transparent participation in order to legitimise the eventual approach
taken towards the problem. However, for the purposes of this dissertation, a clear
distinction between the two is not necessary, as the dissertation aims to deal with both
simultaneously and to facilitate interaction between both.
Therefore, dealing with the awareness and representation of knowledge
generated firstly from the facilitation of interdisciplinary and cross-boundary
dialogue, and secondly from scientific models, simulations, experiments and
observations, are key requirements for ensuring good adaptive management and
governance. In summary, the challenge of social-ecological systems sustainability is
7 Transdisciplinarity (Max-Neef, 2005) must be enabled in order to deal with the problematiques of social-ecological systems. The domain of transdisciplinarity, according to Max-Neef (2005) is tangled up with ideas of ‘what is’, ‘what we can do’, ‘what we want to do’ and ‘what we ought to do’ i.e.
Univers
ity O
f Cap
e Tow
n

45
not just an analytical one; it also involves the realms of governance and management.
The parties or actors involved in these functions are influenced by the values, beliefs
and norms that they bring to the analysis of a problem and the decisions that are made
about how to deal with it. The worldviews, assumptions and observations that
underlie their (often different) ways of thinking and acting has, in reality, a significant
effect on social-ecological system resilience. We are required to understand the
conditionality upon which causal relationships are inferred, and predictions made is
required. An approach for dealing with sustainability challenges must necessarily
engage with this level of knowledge representation in order to stimulate the
emergence of new knowledge i.e. knowledge that could be regarded as
transdisciplinary in nature.
The term ‘sustainability’ can be interpreted in many ways, depending on the
perspective from which sustainability is being interpreted. An ecologist might lean
towards assessing the sustainability of ecological systems in response to human
pressures, whereas a politician might focus on the sustainability of human
communities and ‘ways of life’ in response to increasing ecological crises or
uncontrollable ecological changes (e.g. climate change and natural disasters). If the
ecologist had a natural science background, she may by virtue of the security of her
training tend towards a predisposition for using measurable evidence rather than
qualitative evidence. A politician, however, might instead seek to gauge perceptions
though participation with various actors at different levels in the system. Therefore,
adaptive governance and management programmes may tend to ‘pull’ in different
directions, depending on how hard and soft factors combine to impact upon the
specific goals of the programme.
Where adaptive co-management is concerned, normative, value-based
problematiques are found to be as important as objective scientific analyses and
experiments (Levin, 2005; Stern, 2000; Van Kerkhoff & Lebel, 2006). Moreover, it
has become necessary to overcome the dominance of partial perspectives (Gunderson
& Holling, 2002) in dealing the social-ecological systems sustainability. These multi
and interdisciplinary approaches attempt to deal with the research problem through
transdisciplinarity engages with empirical, purposive, normative and value (ethical) levels (see later
Univers
ity O
f Cap
e Tow
n

46
jointly defining the overall research problem, but by resorting exclusively to
traditional disciplinary approaches in addressing specific questions. This often leads
to fragmented mono-disciplinary research outputs and evaluations which are ‘stapled’
together, but don’t address the problem at whole systems level sufficiently. It is
widely acknowledged that a more holistic, systems-based view of social-ecological
systems is desirable (Allenby, 2006; Gunderson & Holling, 2002; Levin, 2006;
Starzomski et al., 2004). Both normative and objective inquiries become relevant in
different measures where research attempts to engage the ‘political processes of
decision-making and change’ (Stern, 2000).
This is not without conflicts in values and beliefs about the ‘universality’ or
‘context specificity’ of rules, procedures and principles that can be formulated for
such systems. This is especially so where the formulation and implementation of
policy, law and legislature are concerned; critical elements of governance and
management. For example, regarding the application of legal principles, rules and
procedures, Isaiah Berlin (1969) writes that:
… since some values may conflict intrinsically, the very notion that a pattern
must in principle be discoverable in which they are all rendered harmonious is
founded on a false a priori view of what the world is like. If … the human
condition is such that men cannot always avoid choices … (this is) for one
central reason … namely, that ends collide; that one cannot have everything ...
Even those who are aware of the complex texture of experience, of what is not
reducible to generalisation or capable of computation, can, in the end, justify
their decisions only by their coherence with some over-all pattern of a
desirable form of personal or social life, of which they may become fully
conscious, it may be, when faced with the need to resolve conflicts of this
kind. If this seems vague, it is so of necessity.
This view provides a good parallel insight into the nature of the problem being
faced by adaptive governance and management practitioners and researchers, and
legislators. Berlin acknowledges the limitations of pure calculable rationale as a basis
text on transdisciplinarity in section 2.3.2).
Univers
ity O
f Cap
e Tow
n
47
for the formulation universally applicable rules and procedures when considerations
regarding human agency become important. There is lively debate amongst
researchers and practioners about whether research into ‘social-ecological systems’
can be defined as ‘science’ or ‘scientific field’ (Allenby, 2006) in itself, but these
debates often focus on narrow definitions of science (Lubchenco, 1998; Holling et al.,
2002; Holling, 2004).
The Cartesian view on the ‘method’ of scientific inquiry and the mind-body
problem, have had a profound effect on how human-nature interactions are
scientifically articulated, explored and analysed. It is widely recognised as the
overriding normative epistemological and ontological background underlying the
natural and social sciences. It has been posed by some authors that the fragmentation
of disciplines is a consequence of Cartesian reductionism (Capra, 1997; Cilliers, 2008;
Max-Neef 2005; Hodgson, 1993). It is responsible for the prevalence of ‘partial
perspectives’ which now needs to be overcome. The normative foundation of
traditional natural and social sciences needs reconsideration where complex,
integrated systems are concerned (Max-Neef, 2005). To view social-ecological
system through absolute objective or normative filters is to not acknowledge the
complexity of practically dealing with real-world social-ecological systems
sustainability challenges. However, social-ecological systems theory as a way of
thinking and doing is recognised as a necessary tool for dealing with the real-world
complexity of social-ecological systems challenges.
A framework is needed for how we describe human-nature (and other)
relationships within a single social-ecological system. One method to approach the
complexity of systems is, for example, found in the work of Descartes. To Descartes,
everything in the material world obeyed mechanistic laws and could be reduced to
‘atomic’ components. At the core of his method is the idea that from decomposing a
system and analysing its components the behaviour of the whole could be understood.
Though this reductionist method has been very successfully in the basic sciences, for
example, in physics, biology and chemistry, it has its shortcomings when it comes to
social-ecological systems because it fails even at the level of dealing with ecosystem
complexity alone, as stated by Gillaume et al. (2004) “A reductionist approach fails
in modelling such mutual interactions and feedback processes.”
Univers
ity O
f Cap
e Tow
n

48
Hodgson (1993) reaches a similar conclusion when critiquing the roots of the
epistemological basis of economics:
Contrary to Descartes, we ‘cannot begin from complete doubt. We must
begin with all the prejudices which we actually have.’ Peirce (1934,
p.156) … The search for knowledge … is a social endeavour, in which
we inevitably rely on both the recent work of others and on the
undersigned, mysterious and sometimes unsatisfactory conventions of
usage and meaning that have been built up over centuries. (Hodgson,
2003, p.15)
In particular, it fails when complex systems exhibit emergent properties which
result from the interaction of its parts: ‘systemic properties are destroyed when a
system is dissected into isolated elements’ (Capra, 1996/7). In this case, the
conceptual framework of reductionism is not any longer appropriate since higher level
(emergent) properties of the system cannot be analysed from giving a rigorous
description of the behaviour of its parts.
An alternative view to the classic reductionist approach is provided by systems
theory, general systems theory (Le Moigne, 1994) and complexity theory (Heylighen,
Cilliers & Gershenson, 20078
). In particular, these theories stress the importance of
the interconnectedness of complex systems entities. This results in emergent
properties which cannot be analysed by decomposing the system. Complexity theory
views all entities in a system as system agents. A complexity-based analysis of a
system must acknowledge the different levels of description in which a system can be
understood. The existence of emergent properties arising in complex systems has the
immediate consequence that within a particular scientific discipline, a proper analysis
of a system must acknowledge the fact that higher level properties cannot always be
reduced to lower level descriptions.
8 Where, complexity theory is the theory of complex, adaptive systems.
Univers
ity O
f Cap
e Tow
n

49
Moreover, an adequate analysis of complex systems might also require the
consideration of different conceptual frameworks across scientific disciplines.
Researchers from different disciplines may have different non-overlapping and
overlapping conceptual schemes. For example, HIV and AIDS are research subjects
in both medicine and epidemiology, though they take different perspectives on the
issue (i.e. describing the development of AIDS versus investigating the spread of the
disease among individuals). From a systems perspective, two types of systems are
involved, which are also characterised by different boundaries. A physician
investigates the causal mechanisms within a biological system (i.e. the human body)
whose boundaries are defined in biological terms. In contrast, the epidemiologist
whose goal is to understand the spread of the disease also needs to take into account
social factors (e.g. pertinent to the context people live in). The inclusion of this
perspective is crucial because the disease spreads by interaction (e.g. sexual
intercourse) among the individuals. As a consequence, the system investigated by the
epidemiologist might be characterised more by specific social and political
circumstances, or norms and values inherent in the prevailing discourse around HIV
in South Africa (e.g. in investigating the spread of HIV in South Africa or in a certain
community). The epidemiologist has to grapple with the greater influence of
individual and collective agency within the system to adequately understand how and
why the disease spreads at the observed rates. It cannot be understood from analysing
data about the spread of infection alone.
2.3.2 Transdisciplinarity: The Need for Shared Knowledge
Transdisciplinarity is a term which is used to describe many kinds of
interdisciplinary cooperation. The interpretation of transdisciplinarity used in this
dissertation was proposed by Nobel laureate for economics Max-Neef (2005). He
outlined a framework in which transdisciplinarity could be visualised and
conceptualised, as shown in Figure 2. The reason for his proposal was to outline a
framework for transdisciplinarity that could practically help deal with the main
‘problematiques’ of the century. These problematiques include the sustainability of
natural resources, forced migration, poverty, war, water, globalisation global and
cyber terrorism etc.
Univers
ity O
f Cap
e Tow
n

50
Figure 2: Transdisciplinarity: “Transdiscipline. Reading the graph from bottom to top, the
lower level refers to what exists. The second level to what we are capable of doing. The third to
what we want to do. And finally, the top level refers to what we must do, or rather, how to do
what we want to do. In other words, we travel from an empirical level, towards a purposive or
pragmatic level, continuing to a normative level, and finishing at a value level. Any multiple
vertical relations including all four levels, defines a transdisciplinary action.” Max-Neef (2005:
Graph 3)
A framework for transdisciplinarity is presented in Figure 2 (Max-Neef, 2005)
with a detailed caption. Transdisciplinarity (Max-Neef, 2005) must be enabled in
order to deal with the integrative, real-world problematiques facing humankind. The
domain of transdisciplinarity, according to Max-Neef (2005) is tangled up with ideas
of ‘what is’, ‘what we can do’, ‘what we want to do’ and ‘what we ought to do’ i.e.
transdisciplinarity engages with empirical, purposive, normative and value (ethical)
levels. A “transdisciplinary action” is an action which traverses vertical and
horizontal levels (see Figure 2) in order to address a question (Max-Neef, 2005). It
therefore stands to reason that a process that allows researchers to operate at all levels
of Max-Neef’s (2001) hierarchy in Figure 2 is required in order for transdisciplinarity
to emerge.
Univers
ity O
f Cap
e Tow
n

51
Max-Neef suggests two possible classes of transdisciplinarity; weak and
strong transdisciplinarity. Weak transdisciplinarity “can be applied following
traditional methods and logic, and is essentially practical”, while strong
transdisciplinarity requires a great deal more i.e. it, “represents an epistemological
challenge that introduces a kind of quantum logic (Nicolescu, 2000), as a substitute
for linear logic, and breaks with the assumption of a single reality.” The basis of
strong transdisciplinarity, according to Max-Neef (2005), includes three basic pillars,
namely, “Levels of Reality; the Axiom of the Included Middle; and Complexity”, as
three “Three Laws of Transdisciplinarity”. He concludes that ‘strong’
transdisciplinarity is “still in the making, thus representing an unfinished scientific
programme that offers fascinating possibilities for advanced reflection and research”.
In the context of this dissertation, which is concerned with sustainability,
transdisciplinarity must negotiate a wide range of issues and sectors. It is therefore
necessarily concerned with overlap of power, ethics, philosophy with the value,
normative, purposive and empirical levels of reality. The added attractiIt iveness of
Max-Neef’s framework (2005) is that socio-political features such as power can be
located within and across different levels, from the empirical to value levels of reality.
There are actors from various power domains that can be located at different levels of
influence and organisation. The issue of global sustainability is tied to governance,
civil society and business power structures (Perlas, 2002). Participatory efforts
towards sustainable decision-making often involve a wide range of researchers,
stakeholders, decision-makers and system users. Transdisciplinarity, in some sense, is
not an end in itself, but emerges from the participation, interaction, dialogue,
negotia tion and evidence-based r esearch conducted around a su bject.
In order to enable strong transdisciplinarity for social-ecological systems as
complex adaptive systems, we have to cater for the multiplicity of views that are held
on a single reality. Moreover, two more distinctions are required where social-
ecological systems are concerned; that of undecideability and complexity. These are
reviewed in the next two sub-sections:
Univers
ity O
f Cap
e Tow
n

52
2.3.2.1 “Undecideability”: A Necessary Evil
“So I asked Derrida; what’s the difference between an undecideable
and the impossible? He thought for a bit and replied, ‘Well that’s an
undecideable!’” John Comaroff (2007, private communication,
anecdotal)
The ‘included middle’ makes a good comparison to the ‘undecideable’ in
political processes of decision-making as described by Derrida (1992);
“The undecideable is not merely the oscillation or the tension between two
decisions, it is the experience of that which, though heterogeneous, foreign to
the order of the calculable and the rule, is still obliged — it is of obligation
that we must speak — to give itself up to the impossible decision, while taking
account of law and rules. A decision that didn’t go through the ordeal of the
undecideable would not be a free decision, it would only be the programmable
application or unfolding of a calculable process.” In Banisch (2002).
A political decision made without the consideration of undecideables would
be achieved through applying a set of rules as though they defined reality perfectly
(Derrida, 1992). Engaging effectively with the political processes of decision-making
and change as researchers of social-ecological systems therefore requires
acknowledging and dealing with the inherent undecideability which accompanies
political decision-making. According to Nicolescu (2000), “ Transdisciplinarity is
the transgression of duality (;) opposing binary pairs: subject/object,
subjectivity/objectivity, matter/consciousness, nature/divine, simplicity/complexity,
reductionism/holism, diversity/unity”. The incontrovertible presence of
undecideables in political decision-making introduces uncertainty, and highlights the
need to transcend philosophical dualism.
In the context of sustainability, undecideability emerges from contrary views,
and/or contrary sets of evidence. This usually emerges from the variety of
worldviews, value and belief systems held by participants and stakeholders. That is, it
Univers
ity O
f Cap
e Tow
n

53
emerges from attempting to maintain the diversity of belief systems involved in taking
a decision. This emergent undecideability is due, in large part, to the limitations of
being able to reconcile ‘partial perspectives’ and consequent fragmented decision-
making. In this sense, undecideability also occurs (at another level) with respect to
the limitations of understanding and prediction, and with respect to emergence in
systems behaviours.
Both contrary views and contrary sets of evidence involve learning from
observation and/or intervention. It is entirely plausible that some views and
explanations may converge, while others may diverge over time in a process of
learning and interacting with a particular social-ecological system. Even legal
loopholes may be considered undecideables, and are a good illustration of the power
of undecideables in making critical decisions. Taxonomic uncertainty, in the case of
legal loopholes, provides spaces of uncertainty that can be exploited for reasons of
prosecution or defence of a charge of crime.
2.3.2.2 Transdisciplinarity & Complexity
It is also necessary that in order for transdisciplinarity to be enabled, an
appreciation and understanding of complexity is required (Max-Neef 2005).
Transdisciplinarity is concerned with real-world contexts and problems, where
traditional approaches no longer find appropriate application. Transdisciplinarity as
articulated by Max-Neef (2005) is concerned with integrating across the empirical,
normative, purposive and value levels of reality (see Figure 2), and must therefore
negotiate complex issues related to scale, agency, context and interconnectedness.
It is of this necessity that integration between disciplines has become an
imperative. As previously outlined, complexity theory is concerned with multi-agent
systems where adaptive agents self-organise and bring about emergent behaviours.
As such, complexity theory has great relevance for transdisciplinarity in social-
ecological systems research, especially where resilience theory is concerned.
Univers
ity O
f Cap
e Tow
n

54
2.3.3 Resilience, Adaptive Cycles & Panarchy
Buzz Hollings initial formulation of the concept of resilience was established
upon the developments in computer based chaos simulations. These revealed that
systems that followed deterministic rules could break down in their ability to make
absolute deterministic predictions and behaved unpredictably and chaotically under
specific conditions. However, even when behaviours were highly unpredictable they
were bounded; they did not exhibit truly random behaviour. This prompted a large
amount of interest in analysing how systems with critical non-linear relationships
evolved. In order to obtain better understanding of the various ‘stability regimes’ in
which these systems could exist, they were analysed in phase space. Phase space is
where multiple attractors represent the various ‘solution states’ in which the system
may exist. The idea of a system being able to exist in multiple stable states is being
used in adaptive management of ecosystems; especially where lakes, grasslands,
savannahs, rangelands etc. have been the subject of interest (Witten, 2001), and
social-ecological systems themselves have been the subject of interest (Gunderson &
Holling, 2002; Peterson et al., 2003).
A system’s resilience is tested by emergence. There is a critical difference
between the concept of resilience as understood in engineering, when compared with
how the concept of resilience is interpreted when referring social-ecological systems.
With engineering systems, resilience refers to the capacity of a system to remain in
equilibrium. Complex adaptive systems find stability far away from equilibrium,
through their ability to self-organise through non-linear controls such as reinforcing
and dampening feedback loops.
Social-ecological systems also maintain themselves in stability far away from
equilibrium through networked feedback mechanisms with different order effects.
Social-ecological systems are complex, and therefore, the concept of stability used in
chaos theory was adapted to reflect the stability basin, or ‘attractor’ of social
ecological systems, where the depth and width of an attractor which would describe a
stable social-ecological system state. There are five interconnected factors with
which resilience theorists are concerned; latitude, precariousness, connectedness,
rigidity and potential (Gunderson & Holling, 2002). These can be used to describe
Univers
ity O
f Cap
e Tow
n

55
the potential for innovation (or adaptive capacity), stability conditions and
interdependencies of a social-ecological system.
It can be argued that resilience theory has found easier implementation in the
study of the complexity of biophysical ecosystems than social systems. It yields a
collection of metaphors however, which provide a basis for an evolutionary approach
towards social-ecological systems and it is acknowledged that the theory of resilience
itself is expected to evolve. The concept of resilience has evolved since its conception
and is now defined on the resilience website as:
Ecosystem resilience is the capacity of an ecosystem to tolerate
disturbance without collapsing into a qualitatively different state that is
controlled by a different set of processes. (www.resalliance.org)
Note that the definition above implicitly recognises that there are multiple
stability regimes that a social-ecological system can revert to. Resilience is a concept
with many possible definitions, some of which are listed here (Gunderson, 2000;
www.resalliance.org):
• “The amount of change the system can undergo and still retain the same
controls on function and structure.
• The degree to which the system is capable of self-organization.
• The ability to build and increase the capacity for learning and adaptation.”
According to Walker et al. (2004), resilience is the “capacity of a system
to absorb disturbance and re-organise while undergoing change so as to retain
essentially the same function, structure, identity and feedback”.
Walker et al. (2004) go further and includes the factor of ‘identity’ in the
definition and interpretation of the concept of resilience. The ‘identity’ of a social-
ecological system may be characterised using another metaphoric analytical tool; the
Univers
ity O
f Cap
e Tow
n
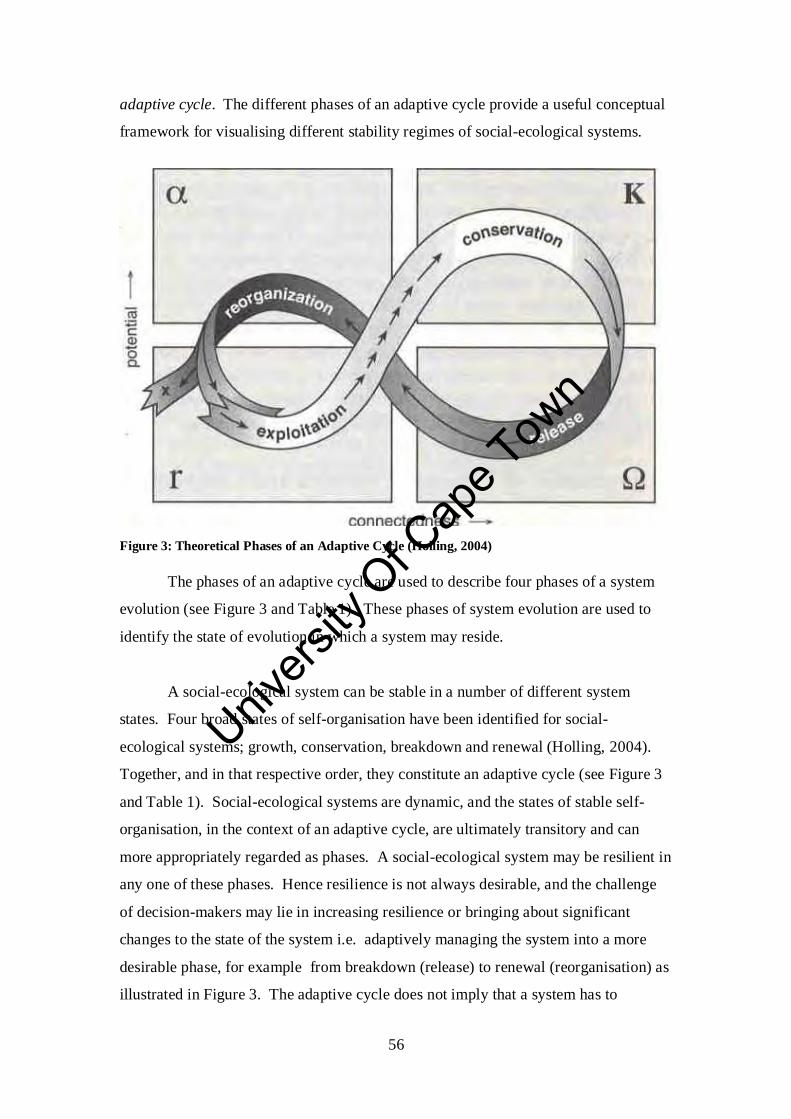
56
adaptive cycle. The different phases of an adaptive cycle provide a useful conceptual
framework for visualising different stability regimes of social-ecological systems.
Figure 3: Theoretical Phases of an Adaptive Cycle (Holling, 2004)
The phases of an adaptive cycle are used to describe four phases of a system
evolution (see Figure 3 and Table 1). These phases of system evolution are used to
identify the state of evolution in which a system may reside.
A social-ecological system can be stable in a number of different system
states. Four broad states of self-organisation have been identified for social-
ecological systems; growth, conservation, breakdown and renewal (Holling, 2004).
Together, and in that respective order, they constitute an adaptive cycle (see Figure 3
and Table 1). Social-ecological systems are dynamic, and the states of stable self-
organisation, in the context of an adaptive cycle, are ultimately transitory and can
more appropriately regarded as phases. A social-ecological system may be resilient in
any one of these phases. Hence resilience is not always desirable, and the challenge
of decision-makers may lie in increasing resilience or bringing about significant
changes to the state of the system i.e. adaptively managing the system into a more
desirable phase, for example from breakdown (release) to renewal (reorganisation) as
illustrated in Figure 3. The adaptive cycle does not imply that a system has to
Univers
ity O
f Cap
e Tow
n

57
conform to the evolutionary path in a strict sense and go through each phase
sequentially. It uses the concept of evolutionary phases to help identify system
properties like resilience and connectedness. In this view of social-ecological systems
a system is identifiable as having some kind of ‘organization’ by virtue of the system
existing in one of the phases of an adaptive cycle.
Table 1: Description of Phases of the Adaptive Cycle r-Phase:
(Exploitation
phase)
Resilience high, connectedness low, innovation high, capitalisation of resources,
relationships consolidated but flexible.
K-Phase
(Conservation
phase)
Resilience low, connectedness high & rigid, innovation low, large capital base,
processes optimize but rigidity increases to such a degree that if external shocks to
the system are too frequent, or too asymmetric, then the vulnerability of the system
increases (and conversely resilience decreases) until …
Omega-Phase
(Release phase)
Resilience very low, connections broken, regulatory feedbacks weaken, resources
released and strong destabilizing feedbacks develop, transient state where
uncertainty is high and the system is subject to regular periods of chaos. In this
phase self-organization may take a very destructive and resilient, if undesired, form
in human social systems.
Alpha-phase
(Reorganization
phase)
Resilience increasing, loose connectivity, capital more available, unexpected
reorganizations to minimize losses, innovation tested by short chaotic periods.
Panarchy (Holling, Gunderson & Peterson, 2002) may be visualized as an
aggregation of sub-systems (embedded units) and super systems all in particular
phases of the adaptive cycle individually, but related through cross-scale effects that
are governed by the context of application (see Figure 4). It is a view that stresses the
importance of causal influences between adaptive cycles (and underlying processes)
occurring at various scales.
One of the key aims of viewing social-ecological systems as a panarchy of
adaptive cycles related through cross-scale influences is to overcome the partial
disciplinary perspectives often used to evaluate the social-ecological system interface.
This leads to disciplinary bias in multi-disciplinary efforts and unbiased collation of
partial perspectives in inter-disciplinary efforts (i.e. without an understanding of the
Univers
ity O
f Cap
e Tow
n

58
sensitivities of cross-disciplinary and cross-scale influences). If we picture the
adaptive cycles constituting the panarchy in Figure 4, there are a variety of
interactions that come to mind, for example; what is the effect if one sub-system, such
as agriculture, is in a particular phase, say, the ‘r’ or exploitative phase. What then
would be the cross-scale effects on other sectors such as food production, water,
human health, etc? If food production, or human health is already in a vulnerable
phase (such as the release phase), then one could expect an overall improvement in
the system due to the agricultural sector growth. If the food production, water and
human health are in the conservative phase (K-phase) then more noticeable
improvements in these sectors can be expected as long as stability is maintained in the
environment. However, if real-world changes exceed their capacity to adapt as top-
heavy, capital intensive, rigid systems, then they will become increasingly vulnerable.
It is therefore possible to consider a range of cross-scale effects between sub-systems
and embedded units in different phases of the adaptive cycle, and with different
combinatorial outcomes.
The concept ‘panarchy’ (Gunderson & Holling, 2002) is therefore a useful tool
for visualising multi-scale system dynamics; a global system is identifiable as
consisting of a number of systems, each of which may be in some phase of the
adaptive cycle. It stresses the role of processes and inter-relationships in constituting
a system that evolves, or which can evolve, over time, spatially, or in phase space etc.
Resilience of whole social-ecological systems is thought to be brought about by cross-
scale dependencies in the system. Biodiversity, for example, increases resilience by
strengthening and broadening the number of inter-relationships between species and
ecosystem functions (Peterson et al., 1998). Resilience theory therefore indicates that
we need to account for cross-scale and intra-scale influences in estimating system
resilience.
Univers
ity O
f Cap
e Tow
n

59
Figure 4: Panarchy of Adaptive Cycles Related Through Cross-Scale Influences
Univers
ity O
f Cap
e Tow
n
60
2.4 Complexity & Hierarchy: Emergence & Hyperstructures
2.4.1 Emergence & Hierarchy: An Unholy Mix
There are many interpretations of the concept of emergence, but they are all
primarily concerned with coping with the unexpected behaviours and events. As
already outlined, emergence is the concept that the behaviour of real-world systems
will always deviate from model-based predictions because no model can fully
represent the real-world system without replicating it. Absolute predictability is
difficult for systems that are governed by complex agent-driven behaviours. In this
sense, emergence is that which observationally (perceptually or empirically)
disconfirms our hypotheses regarding the structure, content, processes and behaviour
of systems. The description given by Ashby (1962) of observer-subject relationality
below, has relevance for the concept of emergence:
The real world gives the subset of what is; the product space represents
the uncertainty of the observer. The product space may therefore
change if the observer changes; and two observers may legitimately use
different product spaces within which to record the same subset of
actual events in some actual thing. The “constraint” is thus a relation
between observer and thing; the properties of any particular constraint
will depend on both the real thing and on the observer. (Ashby, 1962,
pp. 258)
Earlier we stated that Islam et al. (2006) take the view that emergence is due
to observer-subject relationality and call this “perceptual emergence”. They attack the
concept of “absolute emergence”, that is, of a whole which is absolute and distinct
from its parts as a singular ‘thing’. Perceptual emergence takes the view that
emergence results because the whole can be many things to many different observers,
depending on the perspective taken on the system. The conceptual framework that is
Univers
ity O
f Cap
e Tow
n

61
used to ‘observe’ or ‘interact’ with a system is thus critical to what is considered
emergent, that is, in the sense where emergence is interpreted as deviation from a
model (Cariani, 1991, in Potgieter, 2004, p.10).
So how are conceptual frameworks constituted and organised? Concepts are
usually grouped in terms of classification and hierarchy. A hierarchy of
subsystems/agents is different from a hierarchy of concepts, in that the structure into
which subsystems/agents are arranged in the former, constitute an organization i.e. of
a system. Conceptual hierarchies, in contrast, depend heavily on the taxonomic
classification criteria that are used to evaluate the system. For social-ecological
systems these classification criteria are in turn derived differently, according to the the
underlying institutional and epistemological perspectives (e.g. disciplinary, political or
civil) taken on the system
Classical universal and taxonomic hierarchies can be derived from arranging a
taxonomy of conceptual classifications (or classes) into super and sub-classes.
Concepts are often defined in terms of a hierarchy. These are definitional hierarchies,
where if one concept class is present so is its super and sub-classes. One does not
cause another, except in defining one another i.e. it is a conceptual, and not a dynamic
scheme. There are no driver-response relationships between classes, objects and
attributes. The hierarchy of concepts, classes and states is rigid, and in some sense
absolute, where definitional (or taxonomic) hierarchies are concerned.
Scientific categorization schemes are numerous and are designed for a variety
of purposes. Universal taxonomies are constrained by hierarchical classification
schemas. A hierarchy is not allowed to evolve with context in a non-linear fashion.
Rather, the taxonomy and hierarchy is viewed as existing independently of the context
in which it is applied and is therefore universally applicable in all contexts9
9 The view that universal classification systems, taxonomies and models exist is based on the assumption that
there is a reducible ‘essence’ to which the classification, function and behaviour of a system can be attributed.
Philosophically, this reflects a perspective that reality is reducible to an ultimate ‘truth’. This is consistent with
the perspective emanating from Cartesianism and becomes problematic as more complex, dynamic systems are
considered for analysis.
. The idea
Univers
ity O
f Cap
e Tow
n
62
of hierarchy is useful where; systems are well-understood, only slight variations occur
from historical behaviour, and change is incremental. Hierarchies do not cater for
complex, adaptive systems where non-linear, often irreversible and non-repeatable
changes occur, as occurs in real-world systems. We require an approach that can go
beyond interpreting behavioural change using fixed hierarchies and having
expectations of linear change. We need an approach that can cope with complex,
adaptive ‘heterarchical’ changes in the hierarchical organisation and taxonomy of
systems in relation to sub-systems and their environment. Therefore, an evolutionary
and interdisciplinary approach towards understanding systems is needed; one which
goes beyond traditional, monodisciplinary classification systems and hierarchies,
while accommodating them at the same time.
2.4.2 Emergence, Learning & Hyperstructures
Emergence is the critical feature of complex, adaptive systems. Emergence
implies holism, where a phenomena, event, object, agent or system displays features
and behaviours that cannot be explained by simply summing up its constituent parts.
According to Minsky (1988, in Potgieter 2004) holism can be described as “a lack of
understanding (of an observer) due to the unexpected emergence of a phenomena that
had not seemed inherent in the system components, showing that a whole is more than
the sum of its parts”. Emergence is inherent in our perceptual experience of system
level behaviours and their self-organisation (Islam et al., 2006). Our ways of seeing,
or lenses and filters we impose upon what we observe restricts our ability to fully
observe the whole, even though we have a sense of it, and our part in it. This is the
cornerstone of subject-object inseparability as it relates to complexity theory, and to
social-ecological systems sustainability.
According to Ronald, Sipper & Capcarrere (1999, in Potgieter, 2004) a test for
emergence can be conducted in terms of “design, observation and surprise of a system
designer and a system observer (which could be the same), as follows:
Univers
ity O
f Cap
e Tow
n
63
1. Design: The system has been constructed by the designer, by
describing local interactions between components (e.g. artificial creatures and
elements of the environment), in a language L1.
2. Observation: The observer is fully aware of the design, but describes
global behaviours and properties of the running system, over a period of time,
using a language L2.
3. Surprise: The language of design L1 and the language of observation
L2 are distinct, and the causal link between the elementary interactions
programmed in L1, and the behaviours observed in L2 is non-obvious to the
observer – who therefore experiences surprise. In other words, there is a
cognitive dissonance between the observer’s mental image of the system’s
design stated in L1 and his contemporaneous observation of the systems
behaviour stated in L2.”
The design-observation-surprise loop represents an incremental process of
adaptive learning. When studying simple phenomena we expect to reach greater
levels of predictability and certainty regarding its internal structure over iterations of
the design-observation-surprise loop, and to converge in understanding over the
phenomena. With complex phenomena such as social-ecological systems the changes
in the current real-world context of the system can have a large influence upon the
observed system level behaviours. In the case of complex adaptive systems iterations
over the design-observation-surprise loop have to deal with real-time emergence. The
iterations over the design-observation-surprise loop yield ongoing divergence and
convergence of multiple explanations of real-world phenomena. This presents a
challenge of Sisyphus proportions for software approaches and ontology’s aiming to
support adaptive learning.
To recap, hyperstructures are “emergent higher order structures” or “emergent
explanations” (Baas & Emmeche, 1997, in Potgieter, 2004). They are used “for
explanation and understanding” by “separating regularities from randomness in its
input stream” (Gell-Mann, 1994, in Potgieter, 2004). As such, hyperstructures
constitute the internal model of a complex adaptive system, and emergence can then
Univers
ity O
f Cap
e Tow
n

64
simply be understood as deviations identified in the “input stream” from what is
expected. Indeed, this is known as “Emergence, Relative to a Model” (Cariani 1991,
in Potgieter, 2004). With heterarchical hyperstructures, ‘hierarchy’ is allowed to
emerge, that is, in relation to context; where function and authority are determined.
Emergent software engineering refers to the continuous process of
adapting the hyperstructures to accommodate new regularities in the input
stream. The hyperstructures can be adapted manually through human
interventions, or automatically. Manual emergent engineering is a very
cumbersome process requiring constant involvement from the human software
engineer. In automatic emergent engineering, the hyperstructures are
adaptive and able to evolve, eliminating the need for human intervention.
(Potgieter, 2004: Emphasis added: bold)
The internal models (sets of) of complex, adaptive systems are maintained by
hyperstructures, which can constitute a variety of “schemas” (Gell-Mann, 1994),
consisting of overlapping and non-overlapping explanations of a phenomena that can
be verified or vice versa by remaining sensitive to deviations from regularities in its
input stream. Learning, where complex adaptive systems are concerned therefore
involves adaptively managing hyperstructures in relation to a multiplicity of factors in
its environment and internal structure, and is hence demanding and often bewildering.
Economists also encounter the limitations of economic theory when attempting
to address the adaptive nature of social aspect of economic systems. In response to
this, the economist, Alfred North Whitehead promoted an organicist philosophy of
economics. In this view:
In an organicist ontology, relations between entities are internal rather than
external, and the essential characteristics of any element are outcomes or
relations with other entities. This relates to the central question in social
theory as to whether or not structure may be represented simply as the property
of the interactions between given individuals. Organicism denies that
individuals may be treated as elemental or immutable building blocks of
Univers
ity O
f Cap
e Tow
n

65
analysis. Just as society cannot exist without individuals, the individual does
not exist prior to the social reality. Individuals both constitute, and are
constituted by, society. The organicist does not deny this, but insists that
individuality itself is a social phenomenon. Hodgson (1993, p. 11)
Hodgson’s reference to an organicist ontology reflects a desire to link adaptive
self-organisation of a system its internal structure and in relation to its environment.
De Wit refers to the need for “multiple learning loop frameworks” (De Wit, 2001, p.
159-161) for adaptive research in support of economic policymaking for complex
environmental problems. These learning loops involve watching, thinking, doing and
feeling. Two loops are required (De Wit, 2001);
In loop I ..., the policy process loop, the focus would be more on the
physical and more practical aspects of group processes and facilitation, while
loop II ..., the theoretical learning loop, would be more cognitive, focussing on
applications on economic theories on the environment and public policies.
These learning loops constitute complex, adaptive frameworks of learning that
can adjust with changes in understanding and in the real-world context in which a
problem or system is located. Hyperstructures, in this context, would be used to
maintain verification and validation of assumptions regarding self-organisation of the
system’s internal structure, and in relation to its environment in a real-world context.
Visualising and understanding how overlapping and non-overlapping
explanations can be managed in a joint framework towards adaptiveness and degrees
of understanding involves employing a non-hierarchical representation of the internal
organisation, and the interactions between the system and its greater environment.
This is explored further in the next section, where the concept of heterarchy is
introduced to help address this need.
Univers
ity O
f Cap
e Tow
n

66
2.4.3 The Case for Heterarchy
Heterarchy is defined by Heylighen, Joslyn & Turchin (2001) as, “a form of
organization resembling a network or fishnet. Authority is determined by knowledge
and function.” Heterarchy is a useful concept for engaging with systems, one that
invokes visualisations of a ‘flattened’ relativist framework, which ‘unflattens’ itself
when applied in context. The concept of heterarchy finds application in many diverse
fields where traditional hierarchies do not fit the problem context. For example, Kintz
(2004) takes the view that a better understanding of Mayan socio-economic and
cultural organization and spatial and temporal household variability can be obtained
by using mechanisms to interpret both hierarchical and heterarchical organizational
arrangements10
. Kintz (2004) outlines the historical and current definitions of
heterarchy as a concept for self-organization:
... According to the Principia Cybernetica (Heylighen et al. 2003), heterarchy
in its modern usage refers to an organizational structure that operates as a
network rather than topdown hierarchical management, with decision making
based on uncertainty and the person at the apex unable to compile or
comprehend all the facts necessary to make a decision. Decision making is
decentralized, focused and occurring where knowledge is located. (Kintz,
2004, emphasis added: bold)
Where social-ecological systems are concerned, fragmented decision-making
occurs because decision-making is distributed throughout the system without shared
understanding and/or explicit incentives for cooperative governance. Predictive
models are destined to fail at predicting the behaviour of social-ecological systems
because intelligence and decision-making is distributed throughout the social-
ecological system through agents, and is closely linked to the current real-world
context. Their reflexivity ensures that there will always be emergence in social-
ecological systems.
10 “Hierarchy and heterarchy are suggested as organizational principles that reflect the variability
characteristic of the Maya households past and present” (Kintz 2004).
Univers
ity O
f Cap
e Tow
n

67
Elements of global behaviour are also distributed throughout the system.
Where social-ecological system are concerned, adaptive cycles are distributed at
different scales and levels of the system, and together, these adaptive cycles constitute
a “panarchy” (Holling, Gunderson & Peterson, 2002). As explained earlier, the
concept of ‘panarchy’ allows a system to be defined in terms of adaptive cycles and
the inter-relationships (intra-scale, cross-scale) between them. Panarchy represents a
process-based view of the system where a flexible hierarchical organization of
concepts/subsystems/agents is required for social-ecological systems. Due to their
rich interconnectedness at multiple scales social-ecological systems, remote effects
can often lead to significant emergent behaviours. This has implications for what kind
of hierarchy is relevant for modelling social-ecological systems. Fixed or absolute
hierarchies that can be derived for social-ecological systems aren’t feasible because
social-ecological systems are agent-based complex, adaptive systems, for which a
more adaptive kind of ‘hierarchy’ (i.e. a heterarchy) is required.
In social-ecological systems, the question becomes one of how do we adapt to
real world contexts? A heterarchy is a complex adaptive hierarchy. Heterarchy
serves this purpose well, as it is essentially a flexible hierarchy, where both
conceptual and sub-system/agent hierarchies change. In the approach proposed in this
dissertation it is argued that, proceeding from a heterarchical perspective on the
system, more insight can be obtained regarding the cross-scale effects within a social,
ecological system and between its’ environment. Top-down and bottom-up reasoning
are jointly required to arrive at an understanding of a complex system, and for
modelling a complex adaptive system (Richardson 2002).
Every system contains subsystems, while being contained in one or more
supersystems. Thus, it forms part of a hierarchy which extends upwards
towards ever larger wholes, and downwards towards ever smaller parts (de
Rosnay, 1979) ... Systems theory considers both directions, the downward
direction of reduction or analysis, and the upward direction of holism or
emergence, as equally important for understanding the true nature of the
system. It does not deny the utility of the analytical method, but complements
it by adding the integrative method, which considers the system in the broader
Univers
ity O
f Cap
e Tow
n

68
context of its relations with other systems together with which it forms a
supersystem. (Heylighen, Cilliers & Gershenson, 2007)
Top-down and bottom-up descriptions of systems constrain each other. The
challenge for social-ecological systems is to develop a methodology which allows the
flexible exploration of relationships between sub-system components and agents.
Moreover the methodology should be restricted by universal hierarchies, but should
remain open to factors that have greater contextual relevance than historical context or
fixed rules. Heterarchy is an appropriate concept for studying emergence in social-
ecological systems. Emergence, in the case of social-ecological systems, results from
self-organisation of adaptive agents in relation to each other and the external
environment where intelligence is distributed throughout the system and no fixed
hierarchy is maintained over a long period of time. The concept of heterarchy
accommodates emergence by allowing for changes in hierarchical arrangement and
classification of concepts in relation to their contextual relevance at a particular
moment in time. Learning and adapting to change is the key element of the approach
we desire. So how do we represent knowledge heterarchically? Some key concepts
are introduced in the next chapter.
Univers
ity O
f Cap
e Tow
n

69
3. Bayesian Networks and Graphical Causal
Models as Hyperstructures for Social-Ecological
Systems
3.1 Capturing Shared Knowledge in Ontology’s
3.1.1 Modelling Social-Ecological Systems: Requirements for Ontologies
An ontology is defined by Gruber (1995) as a ‘specification of a
conceptualisation’ or a ‘description of concepts and relationships, which if it is to be
shared; requires a ‘commitment to use a shared vocabulary’ to express different views
on the same domain.
Knowledge regarding the scope and goals of sub-systems integration can be
captured using software ontologies11
. Ontologies are symbolic reasoning languages
(consisting of objects, entities, classes, and attributes) that are used to help integrate
software-based models (Helsper & Van der Gaag, 2002). The word ‘ontology’ has a
different interpretation in computer science from its use in the discipline of
philosophy. In computer science, ontologies are used to help reason, understand and
share knowledge between users and makers of software systems. This shared
understanding is used as a basis for collaboration on software engineering design and
implementation during software development. Ontologies that focus more on
taxonomic (classification) of sub-systems tend to be more hierarchical, whereas
ontologies that place emphasis on defining and keeping track of system
interdependencies tend to be have more flexible, adaptable hierarchies.
In the context of sustainable development and adaptive governance and
management programmes a shared understanding is required to enable a more
11 Where reference is made to philosophical ontology in this dissertation it will be clarified in the text through the context of its use.
Univers
ity O
f Cap
e Tow
n
70
transdisciplinary approach towards problem solving. Ontologies provide a way to
visualise concepts, definitions, inter-relationships and agency between
interdisciplinary and multi-participant action-research based programmes. They may
also help identify mechanisms and sensitivities that are key to understanding system
behaviours. Moreover, ontologies can provide a way to adapt shared understanding
and sub-system agent and/or model configuration as real-world changes occur, or
understanding of the system changes with new insights. This is a key feature of the
approach proposed in this dissertation because coping with ‘emergence’ or the
surprises that occur when real-world system behaviours deviate from the software and
mental models. This is also an essential requirement for dealing with the challenge of
assisting with adaptive management through action-based research.
In order to achieve this, the formulation of system understanding (in terms of
interdependencies between sub-systems and/or agents) must depart from a static
hierarchical perspective. This brings into question how knowledge and decision-
making is formulated at the cognitive level of human awareness i.e. how do we learn
and make decisions about the world before we are ‘trained’ into disciplinary
perspectives?
3.1.1.1 Learning, Causality & Classification
“Causal laws, such as the fact that smoking causes heart disease, can
only be noticed on the basis of events that are categorized (e.g., events
of smoking and cases of heart disease). Without such categories causal
laws neither could be detected nor could causal knowledge be applied
to new cases. Thus, causal knowledge not only affects the creation of
categories, it also presupposes already existing categories for the
description of causes and effects.”(Waldmann & Hagmayer, 2006)
Human beings observe the world by making causal inferences about events
that are observed to be “contiguous” in space and time (Hume, 1739, in Meder, 2006,
p.6). They also make decisions from information based on the causal relationships
that they ‘think’ explains the observations they make (Waldmann & Hagmayer, 2006).
Univers
ity O
f Cap
e Tow
n

71
Causality, it seems, is central to how we learn about and make decisions about
information i.e. how we generate knowledge from information. It is also central to
how organization between sub-system components (and/or agents) is perceived to
exist.
The philosopher, Sir David Hume (Hume, 1739, in Meder, 2006, p.6), viewed
causality as essential for understanding the world around us, even though he did not
assert that events and things are necessarily causally interrelated in the world around
us. Causality is a key component of how we learn and reason about the world around
us; its events, systems and sub-systems. We observe events and infer causal
relationships and intervene on systems on the basis of this understanding.
Learning involves categorisation and causality, and the emergence of
causalities and categories in a process of learning are closely inter-related. In a broad
sense, they are co-evolving and give rise to one another. There is a dynamic
interaction and the co-evolution of categories and causality is ongoing. However,
there is a tendency to rely on memory and established causalities and categorisation
until there is a clear non-overlap, at which point new categories are made (Waldmann
& Hagmayer, 2006). In order to provide a clear understanding of how Waldmann &
Hagmayer (2006) arrived at their conclusions regarding the relationship between
causal inference and categorisation, a detailed explanation is provided below:
According to the dynamic theory modification hypothesis, the choice of
a reference class is a more flexible process than envisaged by the perceptual
learning hypothesis, and is guided by both bottom-up and top-down factors.
We hypothesize that the decision between old and new categories is driven by
intuitive theories about the domain (top-down) and by a tendency to be
parsimonious (bottom-up). As for the bottom-up component, we believe that
in general people are reluctant to induce several competing category systems in
parallel even though parsimony may come at the cost of suboptimal
predictability. If maximizing predictability was the main goal of category
learning (see Anderson, 1991; Lien & Cheng, 2000) people should tend to
induce a new category system for each target feature or target causal effect
they are trying to predict (these category systems may overlap, of course). Old
Univers
ity O
f Cap
e Tow
n

72
categories are in most cases not as predictive as new ones that could be
induced from scratch. However, we believe that people try to minimize the
number of alternative categorical schemes whenever possible. As long as the
old categories allow us to make sufficiently satisfying predictions, people
should have a tendency to continue to use them. … Thus, we expect to see a
general tendency to use old categorical schemes whenever they have at least
some predictive value. In contrast, when the categories and the target effect
seem hard to interrelate, then people may decide to abandon the old
categories and induce new ones that are better suited for the current context
of discovery … Indirect empirical support for this hypothesis comes from a
number of studies using paradigms different from ours … Lassaline (1996) has
supported this hypothesis by showing that undergraduates were more likely to
project a new property when the categories share a common cause of the
property (see also Rehder & Hastie, 2004; Sloman, 1994). (Waldmann &
Hagmayer, 2006, emphasis added: bold)
Categories (or taxonomies) play a critical role in the development of theories
of all systems, whether they are theories of the natural sciences, philosophies, social
theories and even indigenous knowledge. Categories are essential frameworks
because they create a shared language for shared understanding amongst people, who
may relate to and influence the system in a variety of ways, based on a variety of value
systems. Categorisation is indivisible from the causalities that are known, observed or
intuited by the observers of the system. Where categories and causal dependencies
evolve during a process of learning about or system, or whether they emerge as real-
world changes in the current context, an approach is needed that can cater for a
flexible, evolving hierarchy. It is for this reason that we identify the need to enable
learning with a heterarchical framework of reasoning.
3.1.1.2 Alternative Conceptual Schema’s & Causality
A promising model of pluralism can be forged from understanding that
causal models are abstractions that will always remain idealizations. By
making simplifying assumptions regarding the non-interference of other
Univers
ity O
f Cap
e Tow
n

73
potential causes, causal models describe only what would be expected in
idealized circumstances (Levins, 1968). This conception of theories helps to
explain how it can be that models of different causal factors qua models do not
directly conflict. However, even if the models may be jointly consistent in the
application of models to the explanation of a concrete case, conflict can arise.
In actual cases, multiple causes are likely to be present, and interact, and other
local elements may also contribute to a specific causal history. Thus in
explanation, models of variant possible contributing factors must be integrated
to yield the correct description of the actual constellation of causes and
conditions that brought about the event to be explained. (Mitchell, 2004,
emphasis added: bold)
Waldmann & Hagmayer (2006) note that both philosophers and historians of
science have “evidence that alternative categorizations are not only a theoretical
possibility, but also a practical reality”, such as the observation that “Kuhn’s (1962)
concept of scientific paradigms can be reconstructed as denoting categorical schemes
(see Hacking, 1993; Thagard, 1999))”. Indeed, according to Sorokine et al. (2005),
there exists “an infinite number of descriptions of the world with a potentially infinite
number of statistical regularities entailed by these descriptions”. They also highlight
that “many philosophers have argued that there are alternative conceptual schemes that
can be used to describe reality and that truth is a joint function of reality and the
conceptual scheme being used to describe states of affairs in the world (see Dupré,
1993; Goodman, 1978; Hacking, 2000; Nozick, 2001; Putnam, 1987).” The clear
conclusion Sorokine et al. (2005) arrive at is that this view implies that “the causal
relations we see in the world will depend on the categorical schemes we use to
describe causes and effects.” Waldmann and Hagmayer (2006) show that the
converse is also true. A process of co-creation and hence co-evolution is therefore at
work between causal and taxonomic knowledge.
Causal models that seek to separate regularities from randomness necessarily
rely on the omission of a group or set of potential causes in order to construct an
idealised ‘laboratory’ for modelling (Mitchell, 2004). Therefore, the existence of
alternative causal models is always possible, and where complex systems are
Univers
ity O
f Cap
e Tow
n

74
concerned; probable. Researchers investigating different levels or scales of system
understanding can conceivably construct a range of causal models that may overlap or
not. There are often necessary and justifiable conflicts between views of how causal
relationships function at sub-system and whole system scales, and at different levels of
description. Modelling without integration amongst the mental models in the minds of
the researchers (including decision-makers and stakeholders in the case of adaptive
management programmes) does not bring about true transdisciplinarity. An approach
for dealing with social-ecological systems must take into account the different
perspectives, hypotheses and causal models of the system structure, function and
behaviour, and incorporate a wide range of evidence and case studies.
In the next section we explore the use of graphical causal models and Bayesian
networks as hyperstructures for integration of case study research on social-ecological
systems sustainability. In the BPDA approach the dominance of partial perspectives
(Holling, Gunderson & Ludwig, 2002) in research and adaptive management of social-
ecological systems is subverted by utilising a framework in which multiple
representations of system understanding can be formulated, tested and adapted. This is
achieved using hyperstructures consisting of graphical causal maps and Bayesian
networks, which is explored in more detail in the next section.
Univers
ity O
f Cap
e Tow
n

75
3.2 What are Bayesian Networks and Graphical Causal Maps?
MARGINAL PROBABILITY DISTRIBUTIONS: NO PARENT NODES
CALCULATED DISTRIBUTIONS: USING EQUATIONS OR CONDITIONAL PROBABILITY TABLES: MAY HAVE PARENT AND CHILD NODES
Average Annual Temperature
Average Annual Evaporation Rate
Evaporation Losses Per Annum
Average Rainfall Per Annum
Mean Annual Runoff Per Annum
Bayesian causal link
Description arrow
Figure 5: Example of Bayesian Network Nodes: Related through conditional causal links.
A Bayesian network is a directed acyclic graph (DAG) that consists of a set of
variables (or nodes) that can be linked by cause-effect directional links (see Figure 5
& Figure 6). These cause-effect links are linked by parent and child node. Parent
nodes (e.g. “average rainfall per annum and “average annual temperature”: see Figure
5) have marginal distributions, and have no parents themselves, while child nodes (e.g.
“mean annual runoff”, “average annual evaporation rate”, and “evaporation losses per
annum”: see Figure 5) and child nodes. Their interdependencies are formulated in
terms of “the conditional probabilities that a node can have given the values of the
parent nodes (Pearl, 1988; Dechter, 1996)” (Potgieter, 2004, p. 21). Each node
represents a system variable, often a variable about which the quantity is uncertain.
Each variable can be described by “a finite set of mutually exclusive propositions,
called states” (Potgieter 2004, p. 21). Each node or variable is characterised by a
Univers
ity O
f Cap
e Tow
n

76
probabilistic distribution over these states (see Figure 6). These states can take a
variety of forms; from numeric intervals (see Figure 6) to qualitative states such as
‘acceptable, unacceptable, or neither’.
Bayesian networks use conditional probability tables (or matrices) to relate
parent and child nodes to each other (Dechter, 1996; Pearl, 1988, in Potgieter 2004,
p.22). These conditional probability tables can be automatically generated by relating
nodes with equations, or they can be manually composed using expert judgement (see
section 5.2.2 later in text: Figure 12 and Figure 13). Nodes characterised by marginal
probability distributions (compare Figure 5 and Figure 6) are those nodes that don’t
have any parents and have no posterior distributions (e.g. the area of maize under
cultivation at a particular moment in time is known and can be formulated as a sole
input itself). Child nodes have distributions which are calculated using equations,
such as the nodes shown in Figure 6, which have numeric intervals for states, over
which a probability distribution is calculated through inference. They may also be
formulated using other states, using expert opinion and consultation to formulate the
conditional probability tables and verify and validate their sources.
Scenario-based inference can be conducted using Bayesian networks. A
combination of parent nodes can be assigned to a particular state reflecting the
scenario. The Bayesian model is ‘run’ or propagated, and the changes in output
variable probability distributions can be assessed. As explained in Potgieter (2004)
inference is conducted using Bayes Rule; “Bayesian inference is the process of
calculating the posterior probability of a hypothesis H (involving a set of query
variables) given some observed event (assignment of values of a set of evidence
variables e)”:
P(H | e) = P(e)P(H)/P(e)
Univers
ity O
f Cap
e Tow
n
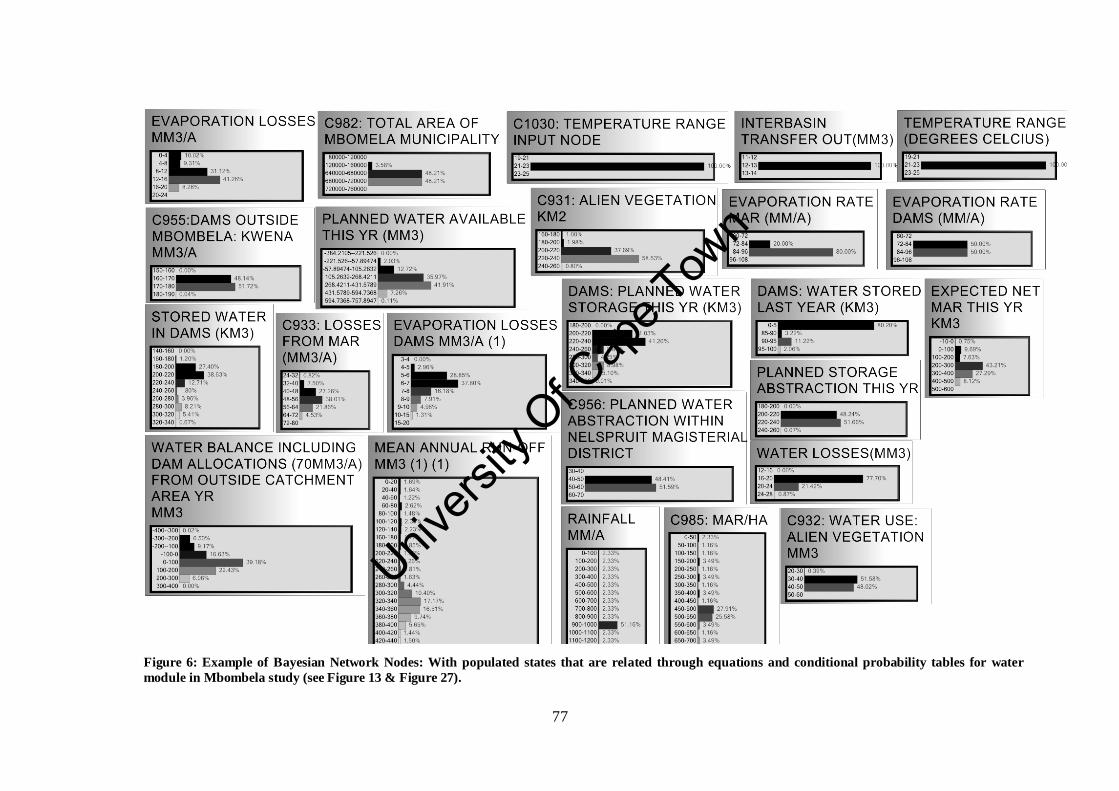
77
Figure 6: Example of Bayesian Network Nodes: With populated states that are related through equations and conditional probability tables for water module in Mbombela study (see Figure 13 & Figure 27).
Univers
ity O
f Cap
e Tow
n

78
As outlined earlier in section 2.4.2, Bayesian networks can be static or
dynamic (Potgieter, 2004, p. 24). Dynamic Bayesian networks can be used to
incorporate variables which change over time. When these changes are automatically
updated it is referred to as automatic engineering of emergence. In this sense, this
dissertation is mainly concerned with static Bayesian networks, which are manually
updated by consultation with an interdisciplinary research group and/or decision-
makers (i.e. manual engineering of emergence) (Potgieter, 2004, p. 4, 8-19). Manual
engineering of emergence is also used to effect changes to the Bayesian network
because reasoning with Bayesian networks for social-ecological systems involves
testing a variety of what-if scenarios that are agreed upon by the interdisciplinary
research group.
When formulating the Bayesian model and updating the model with changes,
the qualitative reasoning which underlies conditionality can be expressed and
captured using graphical causal maps (Helsper & van der Gaag, 2002). In this
dissertation, causal graphical causal maps are formulated using a combination of
ontology’s of directional arcs proposed by Helsper & Van der Gaag (2002) and
Nadkarnay & Shenoy (see later: section 5.2.1: Figure 11). The causal ontology used
to describe the causal relationships consists of initiating, enabling, resulting and
definitional arcs. These can be used to conceptualise and formulate the Bayesian
networks in a trace-able, reviewable manner (Helsper & Van der Gaag, 2002). We
make use of the ontology for Bayesian networks formulated by Helsper & Van der
Haag (2002) and expand it to include elements of an ontology for Bayesian networks
that was formulated by Nadkarni & Shenoy (2004), namely; one that indicates
positive and negative relationships (see Figure 11 later in section 5.2.1). The
graphical causal maps are formulated using a specialised software interface, wherein a
wide variety of information can be trace-ably captured. Information and evidence
from case studies, histories, archival information, surveys, empirical and modelled
outputs, and publications can be captured in support of the reasoning (or
conditionality) for the existence of causal relationships that are reflected in the
Bayesian model. Alternative perspectives can be captured and catered for in this
manner, providing a flexible explanatory and descriptive framework for integration of
hypotheses, sub-systems (embedded units), and / or models and simulations. This
constitutes the BPDA approach as proposed in this dissertation.
Univers
ity O
f Cap
e Tow
n

79
3.3 Bayesian Networks as Hyperstructures & Requirements for Social-Ecological Systems
Beliefs are formed as a “distillation of sensory experiences” during a
process in which the actual experiences are learnt in terms of averages,
weights or qualitative relationships that are used to determine future actions
(Pearl, 1988). Bayesian networks (also called Bayesian belief networks or
causal networks) provide the ideal formalism to express these probabilistic
regularities. These networks encode beliefs and causal relationships between
beliefs and provide a formalism for reasoning about partial beliefs under
conditions of uncertainty (Pearl, 1988). A complex adaptive system can use
a Bayesian network as a probabilistic model of what the emergent effects are
of certain interactions and behaviours in response to certain environmental
states (the causes). Such a causal model can then be queried by an arbitration
process to decide which action(s) are most relevant given a certain state of the
environment. Bayesian networks are therefore ideally suited to be used as
hyperstructures in the internal models of complex systems Potgieter (2004:
P18, emphasis added: bold).
This dissertation, and this section, deals with why graphical causal models and
Bayesian networks are suitable for use as hyperstructures for integrating, testing and
maintaining the ‘internal models’ of social-ecological systems that are used in case
study research. A variety of requirements, specific to the qualities of social-
ecological systems must be taken into account, but first, we can draw on previous
research which addresses the role of Bayesian networks as hyperstructures for
complex adaptive systems in general (Potgieter, 2004, p. 18, 28-30):
This dissertation argues that a heterachical approach towards social-ecological
systems is a necessary departure point for multi-power and interdisciplinary
cooperation and for modeling complex adaptive systems. Potgieter (2004) argues that
Univers
ity O
f Cap
e Tow
n

80
Bayesian networks can be used as hyperstructures for managing the internal models of
complex systems, and illustrates why in detail. We know that Bayesian networks can
be used as hyperstructures for complex, adaptive systems in general (Potgieter, 2004,
p.37-38). In this section, we provide reasons why Bayesian networks and graphical
causal models are suitable for use as hyperstructures to maintain the internal models
of social-ecological systems. In order to address the needs of supporting multi-
participatory research for decision support social-ecological systems, several areas
can be identified as critical areas for hyperstructures that are required to deal with the
complexity of social-ecological systems. They relate directly the broad requirements
for coping with; multiple perspectives, the multi-agent system and the real-world
context. These areas are outlined in the next few sub-sections:
3.3.1 Multi-Participatory Process Facilitation:
The sustainability of social-ecological systems requires the integration of
research and decision-making across scales, sectors and different levels of
organisation and decision-making or influence. This is characterised by contrary
views and contrary sets of evidence. This leads to differences of opinion and
undecideability in decision-making for sustainability that need to be shared and tested.
Two issues are critical requirements for conducting case study research and decision
support for social-ecological systems, while taking into account contrary views and
sets of evidence; (1) how well these contrary views and sets of evidence match the
real-world context, and (2) to what extent observations and interventions can be
designed to test these contrary views and accompanying sets of evidence,
respectively.
3.3.2 Learning, Conditionality and Causality
The process of learning involves iteratively articulating, testing, refuting and
validating contrary views and sets of evidence arranged into hypotheses. Learning
involves categorising information and identifying patterns of influence between
different categories. As outlined earlier, according to Hume, causality is a critical
Univers
ity O
f Cap
e Tow
n

81
element affecting how we reason about what we observe in the world. We infer that
causal connections are present when we are able to provide reasoning for why and
how events that appear contiguous in space and time are causally linked. Causality is
therefore a critical element in identifying patterns from observations. Moreover,
causality is closely linked to categories that are inferred by people, and vice versa i.e.
categories and causalities co-evolve.
Causality and categorization co-evolves when social-ecological systems are
observed and analysed in their real-world contexts. Causal relations and
categorisation may change, depending on the context of application. This context is
embedded in the conditionalities assigned to causal relationships. Hence, a flexible,
adaptive, heterarchical approach that can accommodate bottom-up and top-down
reasoning and an analytical capability to interrogate these conditional relationships is
required.
Moreover, quantitative and qualitative (interpretive) considerations must be
made when dealing with complex adaptive social-ecological systems in real-world
contexts. An analytical capability for modelling and simulating complex systems
must be capable of integrating both sources of information (Richardson, 2002).
Hence, it must be able to accommodate social science methodologies such as action
research, mixed methodologies and narrative approaches into case study research for
social-ecological systems. It must also be capable of integrating evidence from
different sources of information and disciplines.
3.3.3 Addressing the Complexity of Social-Ecological Systems as Multi-Agent Systems
At the same time, the quantitative analytical requirements of a capability for
modelling and simulating complex social-ecological systems must be satisfied. The
critical elements of dealing with the complexity of social-ecological systems relate to
non-linearity, feedback, scale and emergence. Distributed decision-making, actions
and feedback at multiple scales within a social-ecological system leads to the
Univers
ity O
f Cap
e Tow
n

82
emergence of behaviours that are recognizable as systemic. Efforts to promote the
sustainability of social-ecological systems are concerned with the adaptive
governance and adaptive management of social-ecological systems. Understanding
the adaptive capacity of social-ecological systems requires gaining insight into the
resilience and stability conditions of a social-ecological system. At a quantitative,
analytical level this translates into the need for our approach to be able to incorporate
non-linearity and feedback effects, and to help identify and verify critical limits and
thresholds under a variety of future and current scenarios.
3.4 Why Bayesian Networks & Graphical Causal Maps?
This section expands on the aforementioned areas and explain what features of
Bayesian and graphical causal models/maps are identified, which indicates their
suitability for meeting the requirements outlined above (i.e. for hyperstructures that
can deal with the complexity of social-ecological systems). Their suitability for these
purposes are tested later in this dissertation through case study analysis conducted in
support of this dissertation, the results of which are presented and discussed in later
sections.
3.4.1 Conditionality, Causality & Organisation
Ashby (1962), in his exploration of conditionality, states that “as soon as the
relation between two entities A and B becomes conditional on C’s value or state then
a necessary component of “organization” is present” and therefore concludes that the,
“theory of organizations is partly co-extensive with the theory of functions of more
than one variable” (Ashby, 1962)’. Conditionality, as outlined by Ashby (1962) is
therefore a prerequisite for organisation to be present between a set of entities or
agents.
Conditional dependence and independence is the basis of Bayesian network
theory and constitutes the underlying foundation of the probabilistic method of
Univers
ity O
f Cap
e Tow
n
83
analysis it conducts on variables. Graphical causal models and Bayesian networks
employ conditional dependence as a basic rule which governs the articulation of
causal system interdependencies. Conversely, conditional independence signifies that
no direct causal dependence can be made between two agents or sub-system
components. Causal conditional dependence, in particular is a way of probing the
degree of organization of a system. This view is reinforced by Ashby (1962), who
states that;
The treatment of “conditionality” (whether by functions or many
variables, by correlation analysis, by uncertainty analysis, or by other ways)
makes us realize that the essential idea is that there is first a product space –
that of the possibilities – within which some subset of points indicates the
actualities. This way of looking at “conditionality” makes us realise that it is
quite related to that of “communication”; and it is, of course, quite plausible
that we should define parts as being “organized” when “communication (in
some generalised sense) occurs between them. (Again the natural converse is
that of independence, which represents non-communication.)
Taxonomy and classifications that are chosen to represent a system rely
heavily on the assumptions that are assumed to govern causal relationships in the
system. As explained earlier in section 3.1.1.1, classifications are founded upon
causal assumptions, which are conditionality-based (if this, then that) and vice versa.
Graphical causal maps and Bayesian networks also allow definitional relationships to
be incorporated into the framework (Helsper & Van der Gaag, 2002). A classification
of an entity, process or concept is also sometimes implicit in the causal conditionality
underlying why it exists in a particular context.
Both Bayesian networks and graphical causal maps can be manually adapted
(using a specialist, customised software interface) to reflect changes in a complex
system as they are observed or learnt. As such, we felt that they would also be
suitable for dealing with systems where categories and causalities may change,
whether over a process of learning, or from observations of the current real-world
context in which the system is located. In this dissertation, we assert and test the idea
Univers
ity O
f Cap
e Tow
n

84
that they can serve as hyperstructures for maintaining the internal models of complex
systems in a heterarchical manner (i.e. adapting relative hierarchy in response to
contextual changes as they unfold). We test the ability of graphical causal models and
Bayesian networks as a framework for characterising the extent of organisation of
social-ecological systems in particular problem contexts.
3.4.2 Contrary Views and Sets of Evidence
The heterarchical approach enabled by Bayesian networks and graphical
causal maps, when used as hyperstructures; provides a framework in which categories
and causal relationships can be re-arranged to accommodate different causal models
of the same phenomenon. Helsper & Van Der Gaag (2002) show how different
causal models can be formulated using an ontology to formulate different graphical
causal maps for factors contributing to cancer of the oesophagus. They used the
causal ontology to describe the causal relationships that underlie different hypotheses
or explanations (causal models) of system structure and behaviour. The customized
software used in this dissertation to formulate graphical causal maps enables a virtual
library of information pertaining to causal linkages to be formulated and stored in a
methodical, trace-able manner where necessary. In this way, contrary sets of
evidence can be compared and case studies designed to investigate the different causal
linkages in a shared framework of understanding which allows them to interrogate
each other’s interpretations and evidence. Contrary views are maintained and verified
by further directed research, creating a process of learning and consensus building
amongst interdisciplinary groups. This is a critical element for dealing with research
and decision-making for social-ecological system sustainability, which is further
tested in this dissertation through case study analysis conducted in later sections.
The approach taken towards undecideability in this dissertation involves
elucidating the context around undecideability in decision-making. The transparency
of beliefs which underlie the graphical causal and Bayesian belief models is facilitated
by a software based approach that is used for interdisciplinary cooperation, workshops
and model integration. This helps elucidate the undecideability between different
levels and scales of involvement in social-ecological systems, from the local to
Univers
ity O
f Cap
e Tow
n
85
macro-scales of governance and economics. This does not mean that it will resolve
undecideability, but rather that it will help engender shared understanding of
undecideability.
3.4.3 Learning: Observations & Interventions
Graphical causal maps and Bayesian networks enable a probabilistic reasoning
framework of overlapping categories that are not strictly structured in a bottom-up or
top-down fashion (Potgieter, 2004, p. 32). Inference with Bayesian networks can
support top-down and bottom-up reasoning, and a combination of both. It also helps
understand what is observable (can be monitored) and what can be intervened upon,
and allows for causal relationships and categories to evolve (Meder et al., 2005). For
these reasons, we felt that Bayesian networks were suitable for the role of providing a
heterarchical framework for reasoning, where issues of scale do not restrict top-down
and bottom-up inference.
Quantitative and qualitative evidence can be incorporated into a Bayesian
network. Graphical causal maps themselves constitute qualitative frameworks of
reasoning. Graphical causal maps help interrogate conditionality between system
variables. When graphical causal maps are used in combination with Bayesian
network, they can provide trace-ability of reasoning in processes of formulating
different conceptual causal models of a system or phenomenon (Helsper & Van der
Gaag, 2002).
3.4.4 Complexity: Scale, Non-Linearity, Adaptive Capacity & Resilience
Bayesian networks consist of variables or nodes that are described by
probabilistic states. These states can be discrete or continuous. Nodes can be related
to each other through any kind of linear or non-linear equation describing their
conditional causal inter-relationship. By incorporating these non-linear effects, it
stands to reason that cumulative thresholds and critical limits will also be reflected in
Univers
ity O
f Cap
e Tow
n

86
the outputs of Bayesian networks when run in different scenarios, as long as they are
correctly conceived and are evidence-based. This understanding of critical limits and
thresholds, in different scenarios, is the basis for understanding the stability
conditions and resilience of the system in different scenarios, and may therefore
contribute to understanding the general adaptive capacity of the system. The
reasoning provided here is tested in more detail in the case studies conducted later in
this dissertation.
3.4.5 Participatory Process Facilitation
We propose and argue that causal or cause and effect (driver-response) based
articulation of system interdependenh cies using graphical causal maps and/or
Bayesian networks, serves as an effective mechanism for facilitating constructive
dialogue and debate around social-ecological system futures.
Traditional associative learning theories only deal with observations (Meder,
Waldmann & Hagmayer, 2005). However, Bayesian networks provide an opportunity
to integrate learning from both observational and interventional inputs in a single
framework (Meder et al., 2005) in which they can be evaluated and compared. The
Bayesian approach can also incorporate and elucidate probabilistic uncertainty, and
can be adapted to reflect complex changes as they occur i.e. serve as hyperstructures
(Potgieter, 2004). For these reasons, we propose that adaptive governance based on
observation-based learning from scenario planning, and adaptive management based
on observation and interaction-based learning can be integrated in a single framework
using Bayesian networks and graphical causal models.
Other frameworks for analysing the resilience and robustness of social-
ecological systems place emphasis on uncovering the content of variables (e.g. fast or
slow varying variables (Bennet, Cummings & Peterson, 2005) or key drivers
(Anderies et al., 2004)). However, they usually lack an explicit means of analyzing
interdependencies between sub-system entities (and/or agents). In particular,
computer-based systems for elucidating, analyzing and critiquing complexity-based
approaches are scant in the literature. This is true of analytical frameworks for
Univers
ity O
f Cap
e Tow
n

87
complexity in general (Vellupillai, 2003). Scenario planning generally involves soft-
system methodologies whereas dynamic systems and agent-based models are used
when finer scale understanding of systems is required at a more manageable scale.
However, the processes are usually distinct and the integration is managed mainly in
the minds of researchers. Usually, the project leader of interdisciplinary teams is the
only one to have a complete understanding of how integration was conducted in the
project. The approach proposed in this dissertation aims to facilitate a more
integrated, evaluate-able integration of strategic management (high level uncertainty)
with adaptive management (lower level uncertainty) enabled by computer-based
model integration.
Bayesian networks are increasingly finding use in application to
environmental management research (Clarke, 2005). Some deal with participatory
process management and stakeholder participation (Baran & Jantunen, 2004). Others
are concerned with integrating detailed high-resolution models of environmental
phenomena for decision support (e.g. estuarine eutrophication (Borsuk, Stow &
Reckhow, 2004) to detailed ecological systems (Clark, 2005). This doctoral
dissertation is concerned with proposing an approach for supporting transdisciplinary
research for adaptive governance and adaptive management programmes.
Participation is enabled by a software platform that makes use of graphical causal
maps and Bayesian networks. Graphical causal maps and Bayesian networks are used
to visualise and express predictions as conditional causal dependencies in a
probabilistic modelling framework.
We envisage that the additional advantage gained by enabling an
understanding of critical observational and interventional variables will prove of great
use in adaptive management programmes, that is; (1) in coping with emergence in
decision-making programmes (i.e. enabling adaptive management), and, (2) in
identifying areas of undecideability and gaps in knowledge to guide case study
research on an ongoing basis.
As previously outlined, where self-organization occurs; different sub-system
level drivers up to system level significance according to their contextual significance
as the system evolves with collective and individual agent observations, decision-
Univers
ity O
f Cap
e Tow
n

88
making and intervention. We propose that managing a changing system within a
heterarchical framework as proposed in this dissertation (i.e. using graphical causal
maps and Bayesian networks as hyperstructures) which can keep track of changes as
they occur, may provide a valuable contribution to the facilitation of multi-
participatory adaptive management programmes. The approach proposed in this
dissertation therefore aims to keep researchers focussed on both emerging system
level behaviours, and bottom-up sub-system level interactions, in a single quali-
quantitative analytical framework. In this dissertation, we therefore test the degree to
which uncertainty due to ‘contingency’ can be evaluated and scrutinised in multi-
participatory research and decision-making programmes using the proposed approach.
3.5 Summary
It is not just that we lack the methodologies for understanding the
complexity of the systems that industrial ecology purports to treat. It is
deeper than that. We lack the language to not just express the
relationships, (but) the system structure and behaviour, and even perhaps
to perceive them. (Allenby, 2006)
We respond to the need articulated by Allenby (2006) by proposing an
approach which can help facilitate a shared understanding of the description of system
interdependencies amongst diverse participants in adaptive co-management
programmes. For the purposes of this dissertation, the approach is named the
“Bayesian Participatory-Based Decision Analysis”, as has already been referred to in
the text of this dissertation as the “BPDA approach”.
We propose a framework (i.e. BPDA) for the articulation of social-ecological
system dependencies and self-organization in a framework consisting in a shared
ontology between participants in multi-participant and interdisciplinary cooperation.
Graphical causal maps, Bayesian networks, systems models and agent based models
are referred to as hyperstructures, which are used to understand and reason about
system sensitivities and dependencies. The collective set of hyperstructures serves as
the ‘shared ontology’ or ‘shared specification of the conceptualisation’ of the social-
Univers
ity O
f Cap
e Tow
n

89
ecological system linkages describing sub-model integration in research efforts. This
conceptual framework is integrated by a software enabled Bayesian modelling
framework which helps visualise the articulated framework of model sensitivities and
adaptive responses mechanisms in a heterarchical framework of causal dependencies.
The graphical causal models (and Bayesian nets) are used in different phases of model
development to help visualise and create shared understanding about causal system
interdependencies. Simply put, simple graphical causal models are used to facilitate
the dialogue between participants, and focus the dialogue around the causalities
underlying hypotheses making and testing.
To summarise our reasoning about the use of Bayesian networks, several
factors are outlined:
Bayes rule is a statistical rule based on conditional dependence between parent
and child variables (or Bayesian nodes). In this dissertation, the articulation and
visualisation of causal conditional dependence relationships is used to probe the
‘organization’ of systems, and the potential for self-organization of the system under
different conditions. Graphical causal maps and Bayesian networks provide a
causality-based framework for reasoning. We contend that this framework enables a
simple and human-intuitive framework for reasoning about drivers, responses,
influences, interdependencies, constraints, thresholds and limits of the system in
relation to its sub-systems.
Bayesian approaches also consider any system entity as a set of states, with
rules and laws governing its behaviour. Therefore, our reasoning follows that multi-
scale systems and cross-scale effects can be represented using Bayesian Belief
networks because every Bayesian entity, agent or ‘node’ is described in terms of
states. These states can be used to represent different scales. Drivers and responses
are elucidated in a heterarchy of causal relations. Moreover, as already outlined,
Bayesian networks allow for both observational and interventional based learning to
be facilitated by a single graphical causal model (Meder et al., 2005).
We propose that the Bayesian framework allows for understanding of
categories and causal relationships between members of these categories to be jointly
Univers
ity O
f Cap
e Tow
n

90
understood and adapted by an interdisciplinary research group. It also enables new
categories and causal relationships to be incorporated into the framework and adapted
as new understanding or events unfold. In this way, new indices can be developed
and monitoring programmes put in place to assess how well these indices perform as
mechanisms for increasing understanding of the adaptive capacity, and hence
resilience of the system; by helping understand critical limits and thresholds.
In this dissertation, a heterarchical framework (where overlapping categories
are not strictly structured in a bottom-up or top-down fashion) is used in case studies
of social-ecological systems to facilitate shared understanding amongst researchers,
decision-makers and users of (and in) these systems. Coping with emergence is a
matter of understanding how top-down and bottom-up understandings of system
diverge. We therefore contend that the heterarchical organisation of concepts and
agents into a causal driver-response framework provides a more flexible, adaptive
conceptual foundation for the exploring the self-organisation of social-ecological
systems.
In the BPDA approach causal models help visualise the various types of
driver-response influences. Over time, a hierarchy of how system entities
(agents/sub-systems) influence one another emerges from a facilitated participatory
dialogue conducted around the structure and sensitivity of the causal model entities.
This hierarchy may be derived purely from the context in which the system exists. It
is not restricted by the universally applicable definitions of terms, concepts and
relationships. Rather, definitions of concepts, agent roles and behaviours emerge
from a shared, contextual understanding of causal system influences.
In respect of social-ecological systems, many different processes are brought
to bear on research, strategy-making, decision-making and adaptive management as
tools for understanding and coping with emergence. These are described in the next
section.
Univers
ity O
f Cap
e Tow
n

91
4. Research Methodology: Strategy & Design
Considerations
“So once I started having thoughts like this, everything began looking
different to me. To my eyes, this system I was observing, this ‘trial’12
thing itself, began to take on the appearance of some special, weird
creature.”
“Wierd creature?”
“Like, say, an octopus. A giant octopus living way down deep at the
bottom of the ocean. It has this tremendously powerful life force, a
bunch of long, undulating legs, and it’s heading somewhere, moving
through the darkness of the ocean. I’m sitting there listening to these
trials, and all I can see in my head is this creature. It takes on all kinds
of different shapes – sometimes it’s ‘the nation’, and sometimes it’s
‘the law,’ and sometimes it takes on shapes that are more difficult and
dangerous than that. You can try cutting off its legs, but they just keep
growing back. Nobody can kill it. It’s too strong, and it lives too far
down in the ocean. Nobody knows where its heart is. What I felt then
was a deep terror. And a kind of hopelessness, a feeling that I could
never run away from this thing, no matter how far I went. And this
creature, this thing, doesn’t give a dam I’m me or you’re you. In its
presence, all human beings lose their names and faces. We all turn
into signs, into numbers.”
Murakami (2008, pp.97-98, anecdotal)
Univers
ity O
f Cap
e Tow
n

92
4.1 Background: A Review of Research & Decision-Support Tools for Sustainability
Before the research methodology considerations made in this dissertation can
be presented, there are several background areas of research that must be shared with
the reader. These background areas are concerned with approaches that are already in
existence and use in dealing with complex social-ecological system problems, even
though they may be better suited to either social or ecological systems respectively.
In this section we discuss approaches that are used in support of sustainable
development programmes. These involve the use of narrative accounts in scenario
planning, modelling complex social-ecological systems and case study approaches.
These are discussed in more detail in the following sections.
4.1.1 Scenario Planning & Participatory Processes for Modelling Multiple Futures
Human beings are well adapted to living with the complexity of real-world
challenges that they face. Humans have the unique ability to conduct a dialogue
around system interdependencies and sensitivities, which involves considering the
softer and harder aspects at hand in order to reach a decision about how to respond to
undesirable system behaviours. Humans are also able to predict the possible future
states of systems under different scenarios through dialogue involving a wide range of
discourses. Analyses of power, culture and gender have proved powerful tools for
understanding and influencing the evolution of social norms at different scales and
levels of description used to understand socio-political systems. These require a more
nuanced understanding of context, and top-down universality may be difficult to
obtain where such bottom-up richness of systems largely influences whole-system
level behaviours. Information overload and ‘too much objectivity’ (Allenby, 2006)
further hinder the ability of human beings to comprehend the complexity of systems.
12 Referring to law trials in general.
Univers
ity O
f Cap
e Tow
n

93
In unlocking this complexity, Allenby (2006) states that; “narrative is the key to
dealing with complexity without compromise”.
On a daily basis human beings navigate uncertain futures by using a mixture
of normative and objective judgements to adapt to or influence their environment.
Narrative, or ‘story telling’ is an essential element of dialogue, and is “inherently
interdisciplinary” (Riessman, 1993). It “extends the interpretive in the social sciences”
(Riessman, 1993). Both are powerful conceptual modelling tools that are used to
rationalise objective and subjective elements of the argument being considered
(Riessman, 1993). More importantly, predictability (and its limits) is garnered
through dialogue and conversation where the adaptation of social-ecological systems
is concerned. We survive real-world emergence through adaptation from agent-
driven self-organization, and predictions drawn from problem solving conversations
which draw on a diverse range of participating agents. A modelling approach which
seeks to enhance the dialogue amongst participants in adaptive co-management
efforts is more likely to have an impact upon the “political processes of decision-
making and change” as required by Van Kerkhoff & Lebel (2006). This is because
dialogue is the main analytical tool employed in adaptive governance and adaptive co-
management programmes and is hence a significant ‘soft’ element which can improve
or hinder system resilience.
As already explained, scenario planning and adaptive management are ways of
coping with uncertainty through participation and dialogue (Peterson et al., 2003).
Prediction is always limited by the set of assumptions underlying it. Where models of
social-ecological systems are concerned the formulation of model structure and the
sensitivities of interdependent variables are dependent on a variety of perceptions and
interpretations. The level of uncertainty associated with model-based assessments
may range considerably depending on the level of understanding, historical
knowledge and availability of empirical data. Often, rigorous assessment of the
uncertainties in understanding the sensitivities of critical systems interdependencies
necessitates a dialogue that involves participants from a relevant but diverse set of
worldviews. Scenario planning embraces uncertainty by analysing problem contexts
using multi-participatory dialogue (often facilitated by soft systems methods) as a
means of ‘modelling’ historical, current and future system states and interpreting
Univers
ity O
f Cap
e Tow
n

94
different perspectives within the dialogue space. Quantitative and qualitative
(Peterson et al., 2003) information, whether subjectively assessed or objectively
measured may be integrated to serve the purposes of prediction, forecasting and
projections in scenario planning. This makes scenario-planning suitable for dealing
with the reflexivity of social-ecological systems, which adapt and change as human
and other agents self-organise to ward off perceived future threats or to adapt to
current uncontrollable external pressures.
4.1.2 Modelling the Complexity of Social-Ecological Systems
4.1.2.1 Modelling Complexity: Hierarchy & the Multi-Agent System
Ecosystems and social-ecological systems are open systems (Cilliers, 2008).
They are complex, multi-scale systems (Gillaume et al., 2004), where the “organism
complex” is inseparable from the environment, with which they “form one physical
system” (Tansley, 1935, in Gillaume et al., 2004). General systems theory views
systems as a “set of interacting elements which are characterised by the following
aspects: mutual dependence … emergence of organisations … (and) feedback
processes”’ (Le Moigne, 1994, in Gillaume, 2004). Ecosystems (and social-
ecological systems) also satisfy this definition. Therefore, they can be regarded as
subsets of complex social-ecological systems. Hierarchical systems organization is
generated from the iterative and recursive action of the processes that lead to
emergence of “new entities” (Gillaume et al., 2004). Gillaume et al. (2004) take the
view that an adapted description, SOHOS or Self-Organized Holarchic Open Systems
(Koestler and Smythies, 1969), must be taken on ecosystems (though the authors are
more concerned with aquatic ecosystems in particular).
According to Gillaume et al. (2004), “a holarchy is a non-directional hierarchy
in which the members are called a holon”. Ecosystems as holarchic systems may have
different levels of description and scales of observation, intervention and analysis13
13 Levels and scales of description are distinguished in Ingram (2007).
.
These multiple scales of interaction are ‘crossed by fluxes (mass transport or energy)
Univers
ity O
f Cap
e Tow
n

95
which dynamically structure them’. If the ecosystems concept is broadened to that of
a social-ecological system, then the multiple levels of description may also be said to
be dynamically structured by the conceptual, normative, performative and constative
factors that underlie the conceptualisation of the different levels of description (by
actors within the system). The interaction between these actors (or agents) may be
modelled using rule-based approaches. In this approach, entities (or agents) ‘and their
behaviour are described by a set of rules’. Dynamic, agent-based simulations are
often used to generate these behaviours and identify system thresholds and derive
system laws where possible. With law-based modelling approaches, which are more
classical, ‘The level of description is always global with global variables on which we
apply the equations of the model’. (Gillaume et al., 2004)
Gillaume et al. (2004) advocate a ‘mixed-model’ approach where laws and
rule-based approaches are used complementarily. Using this approach an “ecosystem
could be globally described as a set of ecosystems states”, individuals as individual
states and population as population states. Each element of the model is therefore
considered as a set of states. In this respect, the compatibility of Bayesian networks
with this requirement is obvious. As explained in the previous chapter, Bayesian
networks are a state-based probabilistic formalism, and can serve as hyperstructures
which are heterarchically adapted (as outlined in section 3.4). Moreover, quantitative
and qualitative reasoning can be used to formulate and populate a Bayesian network.
In addition to this Bayesian networks as hyperstructures for social-ecological systems
will also have to accommodate non-linearity, feedback, and providing and
understanding of resilience through critical limits and thresholds, is a necessary
requirement for modelling social-ecological systems.
However, complexity, is also related to decision-making, in particular,
negotiating the undecideable decision. Indeed, Zellmer et al. (2006) relate a similar
view, that; “complexity arises when there is no paradigm, when critical decisions are
left unmade”. Predictive modelling of complex systems are often to no avail in these
situations, and models, in general are limited by the assumptions that govern the
fundamental causalities, conditionalities, constraints and parameters of the model in
question. This is more robustly stated by Beer (1992):
Univers
ity O
f Cap
e Tow
n

96
But here's the rub. In programming a computer, one needs a model. Models
are provided by brains. Models are necessarily massive variety attenuators,
because they select only those aspects of the world that are relevant to the
model's purpose. Worse still, the models adopted are not the best that we can
provide: they are consensual models put in place and held together by
ideologies.
Zellmer et al. (2006) recant their earlier position that “measureable
characteristics” of what makes a system complex could be determined. Indeed, they
suggested a range of characteristics of complex systems in earlier work (Allen et al.,
1999, McCormick et al., 2004), that in retrospect, was in fact reducing a complex
system to classes of simple “things”. They assert that this is the standard approach
towards complexity and hierarchy in general. Simplifying a system is the role of
modelling. The benefit of models is that help make explicit assumptions that underlie
the simplifications that have to be made to formulate a model and the possible
consequences of the assumptions in different scenarios. Models help simplify and
share understanding of systems. Zellmer et al. (2006) explore what simplification
means in this context:
A system is simple when the observer has decided on the following
distinctions: What is: structure versus behaviour; rate-independent versus rate
dependent; meaningfuls change versus mere dynamics, discrete versus
continuous? … Before simplicity, there is complexity.
According to (Zellmer et al., 2006), law based models tend towards
universality because they are independent of structure and dependent on rate. Rule-
based models, however, “are the observer’s contribution what is observed, that which
arises because of explicit observer decisions.” Rules are therefore a record of how the
observer defines the boundaries of a model, and, “the model becomes the rules for
equivalence” (Zellmer et al., 2006)
The issue of categorisation or taxonomy occurs whenever an equivalence class
that underlies model construction, is uncovered; “underpinning every model is an
Univers
ity O
f Cap
e Tow
n

97
equivalence class14
”. The aim of research is to find the basis of equivalence in
observed entities, the reason for the patterns we recognize’. The identification of
‘equivalence’ is then a matter of identifying the essence of a particular entity or
phenomenon. This is where ‘observer-subject relationality’ throws a spanner into the
works; namely that the unique interpretation of experience into narrative and other
models of reality are also important.
Often, a singular essence of a particular entity or phenomenon cannot be
satisfy-ably or rigorously determined. The notion of essence itself is challenged by
Zellmer et al. (2006), who conclude that “essence is undefineable and linked to the
definitions that fix the level of analysis”. The complexity of ‘essence’ lies in the fact
that upward and downward causation is involved in the level of analysis of the
equivalence class and because it is inseparable from the participation of the observer.
The notion of ‘essence’ is subverted when its relationship to the equivalence class is
determined in contradictory ways by when utilizing downward (top-down) or upward
(bottom-up) directions of analysis. This is illustrated with the use of examples in
Zellmer et al. (2006).
Essence and self-organization15
14 This is consistent with the view that an entity or individual instantiates a class for ecosystems. (Allenby,
2006).
are therefore relegated, in some sense, to the
as the entities used to describe them, lying between both the realm of the observer and
undefinable ‘other’ as defined by Zellmer et al. (2006). When scientists or
researchers identify a model, the model defines an equivalence class, and further
research endeavours relate to testing and verifying (i.e. through various analytical and
observational methods) whether old and newly identified entities belong to this class.
According to Zellmer et al. (2006) “this act closes the loop of model building:
assignment to a class and verification of membership”. After a model that articulates
system structure (in one way or another) has been formulated, the measurement phase
of research can begin (Zellmer et al., 2006). The key objectives of this phase are to
identify the scale and type of entity. Where social-ecological systems are concerned
15 With self-organisation, multiple understandings (that may agree in areas or disagree completely) can be
derived about whether the system is self-organizing or disorganizing.
Univers
ity O
f Cap
e Tow
n

98
a variety of other factors need to be taken into account when addressing the
complexity of modelling these systems (e.g non-linearity, scale, emergence,
thresholds and critical limits). However, no complex system can be modelled
exhaustively, that is, it is not reproducible in infinite detail (Cilliers, 2001; Cilliers,
2008; Richardson, 2002).
Zellmer et al. (2006) summarise their position on modelling by stating that
“any unified account is lacking, because it fails to capture the contradictions and
complementarity”. Moreover, there are no ‘correct’ or ‘incorrect’ models, “so long as
what they posit follows logically”. The issue of scale is important for formal models
as they are usually constituted by a set of “scaling rules, like the laws of
aerodynamics”, and are hence themselves scale independent. On the issue of
modelling, Zellmer concludes that “the point of all this encoding and decoding (into
the world of observation) is an attempt to link the causal entailment in material
systems to the logical entailment of the model.”
This ‘causal entailment’ often results from differences in downward and
upward directions of causal logic. Causality occurs both in the conceptual domain
and the dynamic domain of interacting entities. With taxonomies, causality may be
identified where the presence of an individual or entity instantiates a class. A model
and entities of a model, may therefore instantiate a hierarchy of classes. This
hierarchy of classes is difficult to fix into universal laws for complex systems because
the ‘essence’ changes with different understandings and perceptions of what the
‘essence’ of the system constitutes. Downward and upward directions of analysis
reveal contradictions in agreement over what constitutes a particular class in terms of
a singular essence. Indeed, other systems theorists agree;
… the concept of emergent property receives a more solid definition via
the ideas of constraint and downward causation. Systems that through
their coupling form a supersystem are constrained: they can no longer act
as if they are independent from the others; the supersystem imposes a
certain coherence or coordination on its components. This means that not
only is the behavior of the whole determined by the properties of its parts
(“upwards causation”), but the behavior of the parts is to some degree
Univers
ity O
f Cap
e Tow
n
99
constrained by the properties of the whole (“downward causation”
(Campbell, 1974)). (Heylighen, Cilliers & Gershenson, 2007)
Hence, there is more to what makes social-ecological systems complex.
Social-ecological systems are not just what our models are able to represent in law
and rule-based models, which are abstract simplified understandings of system
interdependencies. What makes a system complex is its fundamental inability to be
characterised within a single scientific (or other) paradigm (Zellmer et al., 2006).
This is an identifiable crisis of invoking “a duality between the observer and the
observed” (Zellmer et al., 2006) - or the Cartesian observer and subject.
4.1.2.2 The Role of Narrative: Multiple Perspectives
Zellmer et al. (2006) take a constructivist philosophical approach and make
use of the concept of “the other”, as “that which arises above and beyond the choices
and decisions of the observer”. They go on to say that “the things in the other are not
only undefined, they are undefinable”, and that their approach towards dealing with
the ‘other’ is through the use of narrative, “where the observer’s knowledge and
understanding is constructed by interaction with experience (Piaget, 1963)” (Zellmer
et al., 2006).
Zellmer et al. (2006) therefore introduce the idea of the narrative as a means
of modelling that can “rise above” formal law and rule based models because the
narrative “is still in business” when formal models break down. The authors make a
comparison between the irreducible attractor, which still exhibits identifiable form,
and the process of an unfolding narrative, that may contain contradictory factors but
still have form and still functions when causality or taxonomy breaks down.
The narrative is “an expression … of the values that are shifting as the story
unfolds”. It is therefore a complex model itself because it “works at a higher level of
analysis, and transcends the model”. Most importantly:
Univers
ity O
f Cap
e Tow
n

100
Narrative can still apply when the model is driven into contradiction,
because it is about the decisions of the narrator, not some internally
consistent representation as occurs in the model (Zellmer et al., 2006).
The value of incorporating the narrative into scientific enquiry is also stressed
in other studies (Cilliers, 2008). Most notably, Cilliers identifies the inclusion of the
narrative into the body of science as a crucial need (i.e. from a complexity theory
perspective), and one that would engender useful and beneficial academic enquiry.
Narrative can be converted into an evaluable conditional, taxonomical, and
hierarchical framework using causality and Bayesian networks (hyperstructures) as a
means for expressing system interdependencies, be they taxonomic or influence -
based. Although it can never completely capture the narrative, or help predict how
the narrative would unfold over time, it can nevertheless provide a valuable aid to
understanding how changes in understanding evolve, by adapting the causal models to
reflect changes in basic understanding. We propose that the BPDA approach can be
used as a tool around which the narrative can be tested. Zellmer argues for a different
perspective of the usefulness of science in relation to the narrative. The narrative
serves as the higher level of complex modelling that engenders shared understanding
for decision-making, as stated;
The point of science is not prediction. Rather, the undeniable power of
science comes from its capacity to get us convinced that we are all seeing
the same thing, at least if we adherents to the same paradigm, the same
story. Prediction makes the story convincing. (Zellmer et al., 2006)
By extending scientific enquiry into the realm of the narrative more
effectively, science can start to participate in complexity based systems research
more usefully. We therefore recognise the importance of narrative, as a social
science methodology in the negotiation of the role of science in decision-
making. Accordingly, we therefore embrace the role of dialogue, discussion,
narrative as constituents of learning, participation, negotiation and cooperation
as required by Van Kerkhoff & Lebel (2006).
Univers
ity O
f Cap
e Tow
n

101
The power of narratives, as with the power of myths, is their capacity to
rise above contradiction, when the juxtaposition of large disparate issues
is given meaning. Zellmer et al. (2006)
The “undefine-able” realm is “out there” (Zellmer, 2006), because it is
indivisible from how the many observers understand it. This leads to the inevitable
influence of the undecideable upon decision-making. The realm of ‘the other’ is
viewed by Zellmer et al., 2006, as consisting of undefineables, impossible to
understand in terms of a single essence. ‘Undecideability’ in decision-making is the
natural consequence of such a situation.
Narrative is also a critical mechanism for elucidating and resolving the
inevitable undecideable decisions that attempts at sustainability must necessarily face.
We respond to the need for research to engage at the level of political decision-
making by adopting the narrative as a tool for conducting multi-participatory
engagements. In this dissertation we achieve this by employing participation to
capture contradictions in the narrative in causal models as a way of engendering
shared understanding, and dealing with conflicts in understanding within the greater
frameworks of understanding that help constitute perceptions of sustainability
challenges in social-ecological systems.
4.1.3 Case Study Research: Strategies & Methodologies
April (1994) draws on a number of sources to compile a comparison of
research traditions in the social sciences as outlined in detail in Table 2. These
research traditions show that a range of approaches can be brought to bear on social
systems that lie outside of the scope of the natural sciences. In this dissertation, we
focus more deliberately on enabling case study research in developing the BPDA
approach, as case study research can serve as an integrative framework for insights
and conclusions drawn from other research traditions, and can accommodate a wide
Univers
ity O
f Cap
e Tow
n
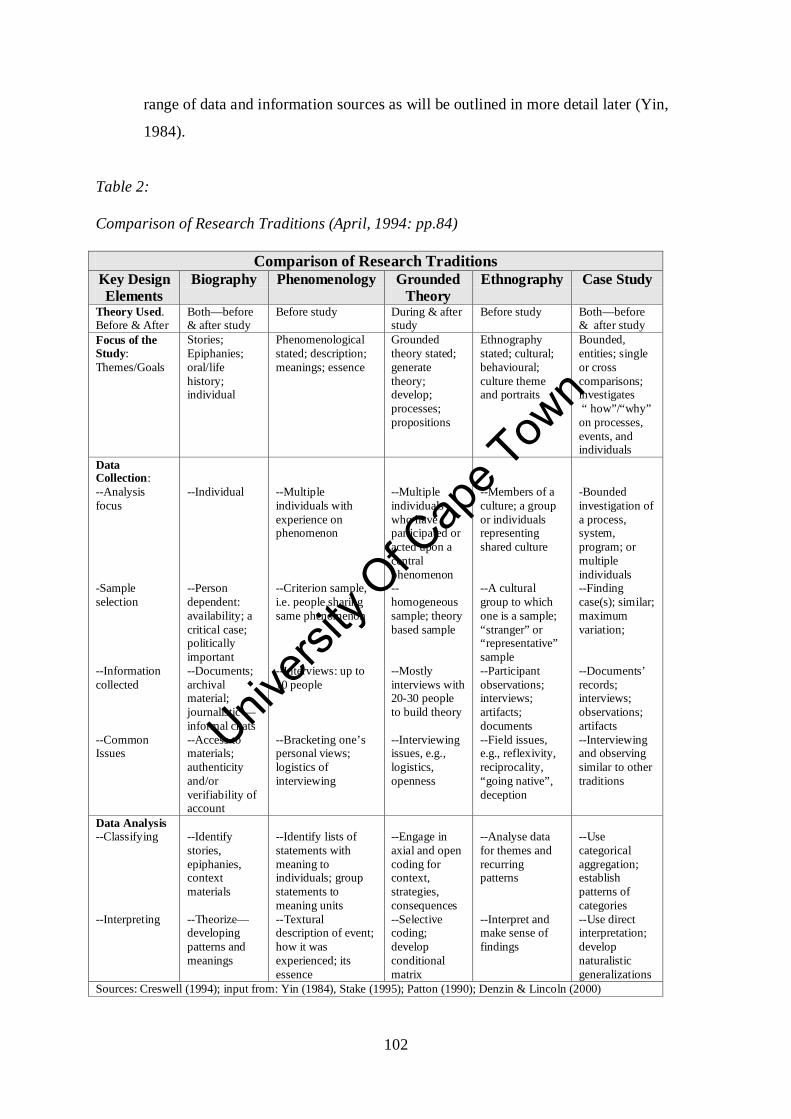
102
range of data and information sources as will be outlined in more detail later (Yin,
1984).
Table 2: Comparison of Research Traditions (April, 1994: pp.84)
Comparison of Research Traditions Key Design Elements
Biography Phenomenology Grounded Theory
Ethnography Case Study
Theory Used. Before & After
Both—before & after study
Before study During & after study
Before study Both—before & after study
Focus of the Study: Themes/Goals
Stories; Epiphanies; oral/life history; individual
Phenomenological stated; description; meanings; essence
Grounded theory stated; generate theory; develop; processes; propositions
Ethnography stated; cultural; behavioural; culture theme and portraits
Bounded, entities; single or cross comparisons; investigates “ how”/“why” on processes, events, and individuals
Data Collection: --Analysis focus -Sample selection --Information collected --Common Issues
--Individual --Person dependent: availability; a critical case; politically important --Documents; archival material; journalistic —informal chats --Access to materials; authenticity and/or verifiability of account
--Multiple individuals with experience on phenomenon --Criterion sample, i.e. people sharing same phenomenon --Interviews: up to 10 people --Bracketing one’s personal views; logistics of interviewing
--Multiple individuals who have participated or acted upon a central phenomenon --homogeneous sample; theory based sample --Mostly interviews with 20-30 people to build theory --Interviewing issues, e.g., logistics, openness
--Members of a culture; a group or individuals representing shared culture --A cultural group to which one is a sample; “stranger” or “representative” sample --Participant observations; interviews; artifacts; documents --Field issues, e.g., reflexivity, reciprocality, “going native”, deception
-Bounded investigation of a process, system, program; or multiple individuals --Finding case(s); similar; maximum variation; --Documents’ records; interviews; observations; artifacts --Interviewing and observing similar to other traditions
Data Analysis --Classifying --Interpreting
--Identify stories, epiphanies, context materials --Theorize—developing patterns and meanings
--Identify lists of statements with meaning to individuals; group statements to meaning units --Textural description of event; how it was experienced; its essence
--Engage in axial and open coding for context, strategies, consequences --Selective coding; develop conditional matrix
--Analyse data for themes and recurring patterns --Interpret and make sense of findings
--Use categorical aggregation; establish patterns of categories --Use direct interpretation; develop naturalistic generalizations
Sources: Creswell (1994); input from: Yin (1984), Stake (1995); Patton (1990); Denzin & Lincoln (2000)
Univers
ity O
f Cap
e Tow
n
103
According to Yin (1984), “the core contribution of research is to create
relationships between actors, and arenas where they can meet in democratic
dialogue.” (Yin, 1984, p.xxxii), and that “unless two people can relate in a
democratic way to each other, no new ideas, no just causes, or indeed any science, be
it social or other, is possible” (Yin, 1984, p.25). Research into complex social-
ecological scale problems usually involves working with an cross-disciplinary team,
rather than a single researcher to address the various dimensions of the social-
ecological system research questions being posed. As such, it requires a researcher to
go beyond pure quantitative research methods, and to embrace a less theoretical and
more practical, investigative stance towards research. Indeed in case study research,
“the need to balance adaptiveness with rigor but not rigidity – cannot be
overemphasized”. (Yin, 1984, p.x)
The goal is not merely to obtain historical information of key variables and to
develop an understanding of the causal and correlative relationships in order to fit
them to a classical model that will enable us to predict the future of a social-
ecological system. Social-ecological systems can have multiple futures, as they can
adapt or re-organise internally into different stable (and sometimes unstable) states
because they are complex, adaptive systems (Levin, 2006; Holling et al., 2002). The
future is an emergent property of the complex, adaptive, self-organisation of social-
ecological systems, and cannot be predicted from mere historical knowledge of the
system. The researcher must therefore also engage deeply with the current context of
a social-ecological problem (and across disciplines), and in this sense, each study of a
social-ecological system is in some ways unique, and a case study in its own right
because it is so heavily influenced by context (historical, and especially current). It is
not guaranteed that the case study itself will be generalise-able to larger scales, or
levels of description and abstraction towards theoretical universality. Rather, the
emphasis is on elucidating the rich influence of context, and how it relates to the
research question; a link that must constantly be maintained by the researcher through
a variety of interactions with experts from substantially different disciplinary
perspectives and information assimilation and data gathering efforts.
Various research strategies and designs have been employed in the different,
traditionally distinct academic disciplines, to address their respective disciplinary
Univers
ity O
f Cap
e Tow
n

104
methodological requirements. Generally, research is a strategy for increasing learning
and understanding about a system, phenomenon, case, object, subject or concept that
is of interest, that is; to a researcher, group of researchers, society, governance
organisations and the like. According to Checkland (1985), this involves three
elements; “(a) some linked ideas in a framework, (b) a way of applying these ideas in
a methodology, and (c) an application area (Checkland, 1985)” (Flood, 2001, p. 135).
In a chapter assessing the relationships between systems thinking and action research,
Flood states that, “after employing a methodology there is reflection on what has been
learned about the three elements. Modifications might be called for.” (Flood, 2001, p.
135). Research is therefore an adaptive, evolutionary and iterative process of
learning and testing hypotheses and understanding about a phenomena, problem,
context, situation, event, object, subject, process etc., that is, anything that is of
interest to a researcher or group of researchers.
As already argued in this dissertation, social-ecological systems are complex,
adaptive systems (Levin, 2006) by virtue of their ability to self-organise in different
and sometimes unique ways, in relation to their context. Research into social-
ecological systems therefore requires a strategy for research that matches the nature of
social-ecological systems. In particular, we require a strategy that helps build the
capability to iteratively improve understanding of the adaptive capacity of the system.
According to Yin (1984, p. 17), research strategies constitute a wide variety of
approaches towards addressing research questions, for example: ‘case studies,
experiments, surveys, histories and the analysis of archival information’. Each
research strategy is ‘a different way of collecting and analyzing empirical evidence’,
and ‘can be used for all three purposes – exploratory, descriptive, or explanatory’
(Yin, 1984, p. 16).
The most appropriate research strategy to match a particular research question
depends on how well or badly three conditions can be satisfied by each research
strategy i.e. the “ 1) type of research question, 2) extent of control over actual
behavioural events, and 3) degree of focus on contemporary as opposed to historical
events’). These three conditions distinguish the different strategies, and not any
hierarchy between them (Yin, 1984, p. 16).
Univers
ity O
f Cap
e Tow
n

105
Yin lists the types of research questions as “exploratory, explanatory and
descriptive” (Yin, 1984, p. 13, 17, 18, 19). In most research into social-ecological
systems, all three may be required (and often are) in addressing the broader goal of a
research group. However, where research is conducted with the specific aim of
addressing issues of sustainability (for decision-makers or decision-making
audiences), the ultimate aim of the inquiry is to provide some kind of explanatory
model or understanding that can be used to consider different strategies for addressing
possible multiple futures of the system.
Social-ecological systems contain many actors (decision-makers, stakeholders,
system users) at different levels and scales of influence in the system. However, due
to the rich influence of context on social-ecological systems, the extent of control over
actual behavioural events is rather limited, being restricted to interventions and
observations (or monitoring). Moreover, it is not always helpful to focus purely on
understanding the historical evolution of the system in the hope of obtaining a
predictive model of the system. Social-ecological systems self-organise and adapt in
often unpredictable ways, depending on the influence of current context, and the
systems’ vulnerability to externalities that are beyond their control (e.g. global and
regional economics). The adaptive co-management of social-ecological systems
needs to be understood in terms of how its present context comes to bear upon the
present ‘state’ of the system, however that may be defined, hence the need for
approaches based on action-research principles (Van Kerkhoff & Lebel, 2006;
Malhotra, 1999).
According to Yin, “Research questions have both substance (what is the study
about?), and form (is it a “who”, “what”, “where”, “how much”, “how many”, “how”
or “why” question?)” (Yin, 1984, p. 19). This encompasses a broad range of
possibilities all of which may find application in research into social-ecological
systems. Due to the nuanced and complex influence of context on social-ecological
systems, they often need to be studied and understood on a case-by-case basis.
Moreover, while general models are useful, they do not provide a definitive or
explanatory understanding of the ‘real’ ontological social-ecological system when
located in its context. This is true of both social and ecological systems alone too.
Research into, and decision-making about social-ecological systems, generally suffers
Univers
ity O
f Cap
e Tow
n

106
from fragmentation in perspectives (disciplinary or otherwise) and their
accompanying ‘partial truths’ (Holling, Gunderson & Ludwig., 2002, p.19).
According to Flood (2001, p.136), “the socio-ecological perspective takes the open
systems principle as its intellectual framework of ideas ... a system is defined by the
‘system principle (i.e. the organizing principle), which can be used to characterise the
intra- and inter-relationships existing in and between a system and its environment.
These relationships are referred to as ‘lawful relationships’ reflecting the view that
systems and individuals are capable of knowing their environments ...”. They are
therefore useful in themselves as ‘modellers’ of complex events and situations.
What is required for research into social-ecological systems is an open
systems approach that is inclusive, representative and transparent to whatever
methodological problem best suits the particular nature of the problem or case that
needs to be solved. That is, we require an approach that; encourages interdisciplinary
understanding to grow and to be iteratively tested, can adequately account for the
understanding of self-organisation in the system, can adapt to new problem contexts,
and can be broadened to include and share understanding with decision-makers, users
and stakeholders (Flood, 2001, pp.136; Holling, Gunderson & Ludwig, 2002).
In discussing moving beyond ‘fragmentation’ in his chapter on the
‘relationship of ‘systems thinking’ to action research’, Flood (2001) states that
complexity theory is a new form of systemic thinking which offers a systemic logic
that accepts that reality can never be fully modelled or understood in its infinite detail,
due the “vastness of interrelationships and emergence in which people are immersed”.
As previously mentioned, in addressing the issue of self-organisation Gershenson &
Heylighen (2003) argue that self-organisation depends on the levels or ‘graining’ of
description used to formulate an understanding of a system. Soft systems thinking is
complementary in this regard, as it sees “reality as the creative construction of human
beings (Jackson, 1991)”, takes a subjective position on knowledge and meaning, and
is “firmly linked to interpretive theory” in this way. Soft systems thinking, “generates
and works with an evolving appreciation of people’s points of view and intentions.”
(Flood, 2001, pp.137)
Univers
ity O
f Cap
e Tow
n

107
This does not discount dynamic systems models; “Systems models, or indeed
any other model may be employed in a heuristic fashion to see if they generate insight
and assist in the construction process. With soft systems thinking, however, models
must never be taken as representations of reality. Each model is employed like a pair
of spectacles through which we can look at and interpret reality … systems models
are likely to be particularly useful in achieving meaningful understanding” (Flood,
2001, p. 138).
In a recent book chapter entitled, “complexity theory as a general framework
for sustainability science”, Cilliers (2008, p.39) argues for an explanatory framework
“which makes explicit why these problems are so difficult”, rather than a predictive,
exhaustively descriptive framework “that will generate foolproof methods for dealing
with complex problems”. By understanding complex systems better, we can devise
better measures for dealing with them (Cilliers, 2008, p. 40), but there are limits to
understanding that must be acknowledged. This is especially the case where scientific
knowledge is concerned, that is, in dealing with the full realm of considerations
regarding ‘values’ and ‘perceptions’ that become important in dealing with the issue
of sustainability of social-ecological systems (Stern, 2000).
Cillier’s highlights the distinction that Morin (2007) makes between
“restricted complexity” and “general complexity” (Cilliers, 2008, p. 42-43).
Restricted complexity characterises the research spaces in which mathematical and
statistical computer models are employed to characterise complex phenomena, and
which recognises ‘interdisciplinary potentialities’. However, due to an underlying
quest for universalism or “laws of complexity”, these approaches fall within the
paradigm of classical science. General complexity “is not merely a methodology”
but, “involves a fundamental rethink of what knowledge is” (Cilliers, 2008, p. 43). It
requires “that one tries to comprehend the relations between the whole and the parts”,
as a way of substituting the for reductionist principle of classical science. According
to Cilliers (2008, p. 43), maintaining distinction, but establishing the relation, is
suggested by Morin (2007, p. 18-20) as an improvement on the classical science
principle of disjunction. Morin does not argue for relativism, nor for “a “generality”
which is naively holistic or vague”. Universal determinism, the third principle of
classical science (Cilliers, 2001, p. 32), is subverted by the rich influence of context,
Univers
ity O
f Cap
e Tow
n

108
where distinctions between classes are always “contextualised within a set of
relationships”.
Cilliers (2001, p. 45) proposes that if one “follows an open research strategy –
a strategy which is open to new insights as well as to its own limitations” then it is
possible to develop a better understanding of both the epistemological complexity and
ontological complexity (Cilliers, 2001, p. 44). He stresses that there is good reason to
pursue both with a good understanding of the limitations of descriptive and
explanatory models of complex systems16
. Cilliers goes further to state it is important
to bring together the knowledge and meaning created through restricted complexity-
based approaches (which are generally more akin to ‘hard’ systems approaches), and
general complexity-based approaches (that are more akin to open, soft systems
approaches). This must be achieve in a manner which; supports an adaptive stance
towards learning and understanding, recognises the multiple dimensions involved in
the soft systems perspective, and “is brave enough to think the uncomfortable
consequences of its insights through to the end” (Cilliers, 2001, p. 43).
While a list of characteristics of a complex system can be listed (e.g. Cilliers
(2001, pp. 45)), it is important to note that complex social-ecological systems do not
necessarily have to be exhibiting overt complexity in its behaviours at all times.
Rather, social-ecological systems can be in different phases (some stable, some
unstable) for different periods of time, depending on factors which can be explained
using metaphorical frameworks such as the adaptive cycle (Holling & Gunderson,
2002, pp. 27-28, 34-35).
Cilliers’ notes that “when there are a lot of simultaneous, non-linear
interactions, it soon becomes impossible to keep track of causal relationships between
components”, and that due to the non-linearity of interactions, were “incompressible”.
However, Holling et al. (2002) state that despite the vast interrelatedness of social-
ecological systems; complex behaviour can usually be understood by understanding a
handful of key variables - and presumably their causal relations. For example, a
system may appear complicated until a few factors combine, rendering the system in a
Univers
ity O
f Cap
e Tow
n

109
complex, often catastrophic state, as is common in disasters and disastrous
mechanical failures which emerge from a combination of errors and factors specific to
the context.
The critical issue for any research strategy dealing with complex social-
ecological systems is not in keeping track of causal relations between components in
an exhaustive framework. Rather, the task is to harness all forms of knowledge and
understanding on the case being researched into a framework that is useful in helping
identify the critical relationships, interdependences and key variables and factors that
are of concern or interest in that they give rise to complex behaviour(s). The aim of
the BPDA approach is in finding the appropriate scales of analysis, levels of
description, constraints and inter-relationship sensitivities that are required to research
and model the social-ecological system challenge. In the BPDA approach, this, as a
research objective, is more important than modelling the entire system exhaustively.
4.2 Proposed Case Study Research Strategy
The view taken in this dissertation regarding modelling - is that modelling the
complexity of social-ecological systems is not about replicating the system
exhaustively in all its complexity. Rather it is about being able to arrive at an
understanding of complex phenomena and behaviours using any and all appropriate
methodologies in combination, according to the needs of the study. The modelling
approach proposed and tested in this dissertation deliberately enables a heterarchical
framework of reasoning for conducting open systems research. Both ‘soft’ and ‘hard’
systems approaches are brought together in a unique way in this dissertation, in order
to better coordinate between processes underlying decision-making and research -
towards better mutual effectiveness.
A claim that has been laid in this dissertation is that a heterarchical framework
of reasoning enables the democratic evaluation of system variables in relation to the
context and the topic of the study, where variables “rise to authority depending on
16 Formulating explanatory and descriptive models of reasoning are the core elements behind case study research methodologies, especially conceptualizing the study (see later in text section : Yin, 1984: P100)
Univers
ity O
f Cap
e Tow
n

110
their form and function” (Heylighen, Joslyn & Turchin, 2001) in relation to the
problem or issue being studied. The concept of heterarchy therefore subverts the
traditional idea of hierarchies as ‘nested’ (Cilliers, 2001, pp. 49) and allows for the
possibility of relationships that cut ‘across hierarchies’ in different ways, depending
on the context. It is comparable with the concept of ‘panarchy’ (Holling, Gunderson
& Peterson, 2002, pp. 74-76) that has been introduced in resilience theory in order to
enable an understanding of cross-scale relationships between nested cycles (i.e.
adaptive cycles) in an open framework. However, the concept of heterarchy is more
generalised. Moreover, in this framework, the boundaries that are defined remain
“simultaneously a function of the activity of the system itself, and a product of the
strategy of description involved” (Cilliers, 2001, pp. 47), and can remain open, yet
bounded for the purposes of analysis of a particular scenario or situation.
In this doctoral dissertation, the focus was mainly on; (1) establishing whether
graphical causal maps and Bayesian networks could be used in conjunction with
facilitated open-systems participatory processes for researchers to establish a shared
model and understanding of a social-ecological system, and (2) whether meaningful
and useful results could be obtained from the Bayesian models. The Bayesian models
serve as the integrator of the extent of reliable shared knowledge of the systems causal
structure, its sensitivities and thresholds. These were obtained from data, empirical
knowledge and/or well defined and constrained sub-system models.
This necessarily engages both the realms of ‘restricted complexity’ and
‘general complexity’ based (Cilliers, 2008; Morin, 2007) research and decision-
support approaches. In this dissertation, both these realms are linked by the
heterarchical framework of reasoning consisting of graphical causal maps and
Bayesian networks, as outlined in Figure 7. Methodologies employed in restricted
complexity approaches are usually more quantitative, empirical, and mathematical
and statistical. Methodologies employed in general complexity approaches utilise
softer facilitation techniques for knowledge building, and require more qualitative,
interpretive analysis, interpretation and evaluation of the role of context in evaluating
the system, such as participatory process facilitation.
Univers
ity O
f Cap
e Tow
n

111
These two levels of ‘modelling’ (i.e. modelling with mental models and
modelling with mathematical and statistical models) are critical components of
enabling the link between knowledge and action as far as sustainability of social-
ecological systems is concerned, and generally where complex systems modelling is
concerned. A key goal of this dissertation is exploring the effectiveness of using a
heterarchical, causal framework of reasoning to bring these softer and harder systems
thinking approaches into closer alignment. The aim of this is to enable closer
alignment between research and decision-making for the sustainability of social-
ecological systems. The manner and extent to which restricted complexity and
general complexity-based approaches are used, depends on what the requirements of
the particular case study being investigated dictates is necessary to arrive at reliable
conclusions and recommendations of a social-ecological system. The process
outlined in Figure 7 is therefore implemented to varying degrees in each case study
undertaken in this doctoral dissertation.
Univers
ity O
f Cap
e Tow
n

112
A: GENERAL COMPLEXITY
MENTAL MODELS
B: RESTRICTED COMPLEXITY: MATHEMATICAL & STATISTICAL MODELS
A+B:
HETERARCHICAL FRAMEWORK
OF REASONING USING
GRAPHICAL CAUSAL & BAYESIAN MODELS
Case Study
Elements Considered
Elements Considered
All influence Research Design for
Each Case Study
Large influence on Research
Design & Adaptation
Figure 7: BPDA & Complexity: How soft general complexity approaches are combined with harder, more empirical restricted complexity approaches towards modelling social-ecological systems.
The modelling approach that is core to this dissertation helps hinge the
research design effectively between both processes and to quickly adapt the research
design as changes in understanding unfold or as real-world events change the system
considerably. It is shown in Figure 7, and can be briefly described as consisting of
three broad areas of developing understanding:
• A: General complexity approaches that are more qualitative and
interpretive processes of reasoning about complexity.
• B: Restricted complexity approaches are more quantitative, empirical,
mathematical and statistical processes of reasoning
• A + B: A heterarchical framework of reasoning that uses graphical
causal maps and Bayesian networks as a device for verifying mutual
understanding between the two processes i.e. qualitative and
Univers
ity O
f Cap
e Tow
n

113
quantitative processes of reasoning involved in evaluation and
decision-making social-ecological systems and complex systems in
general.
o This framework has a large influence on research design, as it
enables full traceability of the adaptations made to the research
design as new understanding is obtained, or as changes occur in
the real world system that require re-orientation of the research
design (see Figure 7).
This dissertation does not present any framework for the unification of
theories but deals with the interface between disciplines in a context-based open
systems approach where a heterarchical view of the system can be taken. Each social-
ecological system is seen as a case study in its own right, and any generalizable
conclusions that emerge from the cross-case comparison would be of benefit, but this
is not the sole intention of this approach.
In this dissertation, eight case studies were undertaken (see chapter 6) of
social-ecological system problems facing interdisciplinary research teams in order to
explore the extent to which the methodology could find application in modelling
complex social-ecological systems. Each study had its own specific objectives, but
fitted the profile required for testing the modelling approach proposed in this
dissertation. The case studies were incrementally undertaken and the complexity of
case studies were built up as more insight and understanding was gained into the
implementation of the soft and hard systems modelling approaches, through
application in various research cases. The case studies were incrementally built up to
handle greater levels of scale, level of description, integration and shared
understanding between disciplines, interdisciplinary participatory process
management, and decision-maker engagement. Careful considerations have to be
made regarding the characterising, planning and implementing of effective ‘case
studies’ of social-ecological systems. This is dealt with in detail in chapter 7, after the
case studies, so the BPDA approach could be assessed in terms of its value in
addressing critical aspects of internal and external case study validity and present
critical learning points that emerged from implementing BPDA.
Univers
ity O
f Cap
e Tow
n

114
For the purposes of this dissertation, case study as a research strategy is taken
to be a valid research strategy for dealing with social-ecological systems, and as a
general framework for research design, because it is essentially an open systems
methodology, which encourages the use of multiple sources of evidence (Yin, 1984,
pp. 20, 23). As such, it can provide a framework to help integrate the outputs of
general complexity (more qualitative, interpretive) and restricted complexity (more
quantitative, empirical) exercises undertaken in support of the case study.
A misconception regarding the role of case study’s as traditionally understood
and used in research is that the case study was not seen as a separate research strategy
in itself, but was seen as part of one or more of the phases of research strategies (Yin,
1984, pp. 13). Yin asserts that case studies constitute a research strategy that is
distinct from other research strategies such as ‘experiments, surveys, histories and the
analysis of archival information’ (Yin, 1984, pp. 13). The case study as a research
strategy is defined by Yin (1984, pp. 23) as “an empirical inquiry that:
• Investigates a phenomenon in its real-life context, when
• The boundaries between phenomenon and context are not clearly evident,
and in which,
• Multiple sources of evidence are used.”
Yin states that “In general, case studies are the preferred strategy when,
“how” or “why” questions are being posed, when the investigator has little control
over events, and when the focus is on a contemporary phenomena within some real-
life context. Such “explanatory” case studies also can be complemented by two other
types – “exploratory” and “descriptive” case studies.” (Yin, 1984, p: 13)
Case studies are used in different real-world research areas, for example:
strategy-making, policy-making and policy implementation guidelines, planning and
planning research, organisational and management studies, psychology, sociology,
and the political and social sciences (pp. 13). Case studies are often essential inputs
into evaluation and planning research outputs to decision-makers, stakeholders,
system users and the general public. In a sense, an adaptive management programme
Univers
ity O
f Cap
e Tow
n

115
is itself an ongoing a case study for decision-makers involved in the programme, as it
involves learning, participating, integrating, observing and intervening in a system
that is characterised by emergence.
Yin (1984, pp. 24) states that case studies can both include, and be “limited to
quantitative evidence” and that the difference “between quantitative and qualitative
evidence does not distinguish the various research strategies”. Where social-
ecological systems are concerned, a mix of qualitative and quantitative evidence is
often necessary to different degrees. This mix depends on the nature of the research
question or problem. All of the stated research strategies come into play in dealing
with the problem of sustainability of social-ecological systems, that is; according to
Yin’s (1984, pp. 13) categories of research strategies (i.e. including case studies,
experiments, surveys, histories, and analysis of archival evidence). However, the
integrative nature of the case study as a research strategy, which has the strength of
being able to accommodate multiple sources of evidence, deal with a “real-life
context”, where the “boundaries are not clearly evident”. This makes it a compatible
and suitable research strategy for dealing with a broad range of social-ecological
systems problems and research questions. Case study approaches fundamentally
underlie research and decision-making on sustainability of social-ecological systems.
The case study research strategy was therefore used as a basis for investigating the
claims made for the modelling methodology proposed in this dissertation.
4.3 Aims of single and cross-case study analysis
4.3.1 Testing Specific Requirements for Social-Ecological Systems
Modeling and simulations play a large role in advancing our understanding of
human and ecological systems and the relationships between them. However, it is
increasingly becoming more recognized as an aid to understanding the adaptive
capacity of a social-ecological system under a variety of projected system future
scenarios - rather than providing a accurate predictions of the possible futures
decision-makers may face. The processes involved in formulating future scenarios
Univers
ity O
f Cap
e Tow
n

116
and projected system futures necessarily involves; (1) a degree of scenario planning
and participatory process facilitation (Peterson et al., 2003; Richardson, 2002), and
(2) integration of models representing sub-system components (and agents) at
appropriate scales and levels of description (Bennet et al., 2003; Richardson, 2002).
The value of participatory processes, such as scenario planning (Peterson et
al., 2003) cannot be underestimated as a means of modeling complex system futures.
According to Richardson (2002), “The (nonlinear) modeling process is regarded as an
ongoing dialectic between stakeholders (modelers, users, customer, decision makers,
etc.)”. Non-linearities in complex systems are often best elucidated through a
qualitative modeling process involving dialogue and exchange, indicating that human
beings are very capable of using their mental models to get a grasp of the complexity
of the challenges they are faced with. Model integration is necessary in order to
enable researchers to determine thresholds, critical limits and key intervention and
monitoring points (or variables). These points are determined in support of
characterizing the adaptive capacity of the social-ecological system in question more
thoroughly and rigorously.
Model integration, however, is often constrained by pragmatic bottom-up
considerations such as availability of data, and availability of models (Richardson,
2002). More subtly, it is constrained by the soft interactions and qualitative (or
subjective) judgements that are made amongst researchers in deciding on how
integration will be performed. Richardson states that “it is essential that quantitative
methods be incorporated into a qualitative (nonlinear) analytical framework … so that
linear application of non-linear models is avoided”, revealing the need for a
qualitative framework of integration that can accommodate non-linearity. In
modeling complex systems, affording appropriate attention and scrutiny to the process
of modeling is as important, if not more important, than the computer-based model(s)
that are being used to understand system behaviours (Richardson, 2002).
Predictive models of complex systems often fail to produce sufficiently
adaptive decision-support systems and results that are useful to decision-makers when
unforeseeable changes occur. Predictive modeling approaches often result in
integration of models and simulations to service a rather small set of future scenarios.
Univers
ity O
f Cap
e Tow
n

117
As such, predictive approaches are difficult and tedious to adapt when real-world
changes occur. These may be changes in understanding, or changes in the system
context due to real world changes to the system (whether internal or external
influences occur). Behavioural models are designed to improve understanding of a
complex system in an iterative manner, which calls for extensive adaptability of the
modeling framework in order to be able to handle a variety of scenarios, complete
with drivers, constraints and responses. Richardson (2002) cites Kolman et al.
(1997), who states the challenge of behavioural modeling well, “[a]n ideal tool for
social science inquiry would combine the flexibility of qualitative theory with the
rigor of mathematics. But the flexibility comes at the cost of rigor.” Richardson
therefore prescribes a “healthy skepticism” of these (behavioural) frameworks. In this
dissertation, the proposed BPDA methodology is tested and evaluated in a series of
case studies to establish whether it, and to what extent, it satisfies the need for a
complexity based approach towards modeling complex social-ecological systems.
Predictive, more quantitative approaches towards research and problem-
solving tend to be mainly bottom-up, to draw on theoretical frameworks, and to
collect evidence ‘objectively’ in support or denial of these theoretical frameworks –
while qualitative, interpretive approaches are more subjective and tend to emphasize
the role of the context in which the research problem is situated (April, 1994). Top-
down research and decision-support inquiries into social-ecological systems often
involve a range of qualitative modeling approaches such as scenario planning
(Peterson et al., 2003). The dichotomy between quantitative and qualitative
approaches (April, 1994, see Table 3.1) is useful for understanding the processes
involved in investigating a research question (or set of research questions). However,
quantitative and qualitative processes of reasoning both play a part, to varying
degrees, in supporting the construction of a model of any complex system. This is
especially so where computer simulations of complex systems are concerned
(Richardson, 2002).
Where social-ecological systems are concerned, the challenge involves tying
the research problem closely to the context in which the problem is situated and trying
to prevent the fragmentation that results in research and decision-making as a result of
partial disciplinary and sectoral perspectives (Holling, Gunderson & Ludwig, 2002,
Univers
ity O
f Cap
e Tow
n

118
pp. 19). This necessitates the engagement of both qualitative (mainly top-down) and
bottom-up (mainly quantitative) research approaches in order to maintain a shared
awareness of the apriori assumptions that inform model development. Moreover,
according to Holling, Gunderson & Ludwig (2002), “What are needed are alternative
hypotheses and specific predictions that can be tested empirically” revealing the
additional need for flexible modeling frameworks that can adapt to different
hypotheses and a variety of scenarios.
This invokes the need for a flexible modelling methodology (as described in
the previous chapter), where non-linearity, quantitative and qualitative information,
and cross-scale interactions are accommodated. All elements of reasoning are
required to hinge a complex problem to its context; both qualitative and quantitative.
Arguments that focus on which approach is superior often deter from the purpose of
research into complex problems; which is to acknowledge as far as is appropriate and
relevant, the full complexity of the problem being faced. The focus of this
dissertation is not an argument for attempting to exhaustively model a complex
problem or system. Rather we propose an approach for employing both qualitative
and quantitative processes of reasoning in conjunction with each other to arrive at a
reliable and valid model and shared understanding of a social-ecological system. That
is; it is valid in relation to the problem that is being addressed and researched, and it
reflects the extent of shared understanding of the system.
It is inevitable that different, often conflicting views are held about how to
approach such complex problems in research and decision support. This often results
in ‘causal ambiguity’, as previously outlined, where different causal models can seem
to exhibit the same behavior or phenomenon (Helsper & Van der Gaag, 2002).
Different causal pathways of logic and reasoning can apply to the same situation, even
at the disciplinary level, for example, in medical diagnoses of cancer (Helsper & van
der Gaag, 2002). A critical element of research into complex systems involves
acknowledging such differences and creating a shared understanding of why
participants in research or decision-making programs may differ in opinion about; (1)
which methodology to employ, (2) what is causing what in a system (including
‘causal ambiguity’ or ‘causal confounds’ (Meder et al., 2006)) and (3) what steps to
Univers
ity O
f Cap
e Tow
n

119
take to remedy the problem in adaptive governance and adaptive management
programs.
A fact that often remains unacknowledged when more traditional bottom-up
approaches towards modeling are employed is that they employ a degree of
subjectivity. This subjectivitiy lies in the decisions (judgements) that are made in
defining system structure and configuring system constraints, parameters and
functions. Equally, more qualitative or interpretive top-down approaches often
employ evidence gleaned from bottom-up research to make sense out of the problem
and complex system. The apriori assumptions that are made in both quantitative and
qualitative modeling efforts often go unrecorded and remain untraceable, especially
where convergence between different views is ‘forced’ to some extent, by pragmatic
decisions made earlier on in the research effort. This is especially the case where the
tendency of researchers is to rigidly employ only readily available data and models as
a basis for the research integration effort in conceptualizing how they can address the
problem.
In general, models and modeling of complex, adaptive systems, including
social-ecological systems, (Levin, 2006) are constrained by the underlying apriori
assumptions that are made during model formulation and implementation. These
apriori assumptions inform the different, often conflicting opinions or mental models
that are held regarding the complexity of the system or problem. Exposing these
differing apriori assumptions and creating a shared understanding of them is critical to
transcending multi and inter-disciplinary approaches towards research. Moreover, it
is a critical requirement if a transdisciplinary understanding of the system, context and
problem are to emerge from a research effort that aims to support decision-making
about social-ecological systems. To this end, the research methodology explored and
tested in this dissertation (i.e. BPDA) aims to provide a framework for integration that
aims to achieve several aims. Firstly, to harness both qualitative and quantitative
approaches appropriately. Secondly, to help bridge the gap between these generally
top-down and bottom-up approaches, and thirdly, to provide a framework to catalyze
shared understanding in research efforts that support decision-making in social-
ecological systems, and in other systems where appropriate.
Univers
ity O
f Cap
e Tow
n
120
Richardson observes that models and simulations of systems that are complex
in nature should not be built from the bottom-up purely from pragmatic considerations
regarding available tools and information (Richardson, 2002). Bottom-up approaches
are more appropriate when a very good understanding of the system is available to
researchers, and the linkages between subsystem components are well understood.
The modeling approach developed in this dissertation provides a way to integrate
participatory processes with interdisciplinary cases studies and models and
simulations for social-ecological systems to be built and adapted iteratively. That is,
in both a top-down and bottom-up manner.
4.3.2 Summary of Methodological and Analytical Objectives
To summarise; in this dissertation, we are testing if this approach helps
produce verifiable, reproducible results for single case studies into social-ecological
systems that illustrates the usefulness of the approach. However, we are also testing
whether the approach can deal with a spread of case studies that characterise the range
of challenges of research and decision-making in social-ecological systems. Then we
interpret what generalizations can be made from cross-case comparison regarding the
approach taken in this dissertation and present findings and conclusions.
In doing so, the approach must first satisfy the requirements of case study
methodology research and design as described in detail the preceding sections to this
section, and summarised in Table 19 (see later in section 8.1.3). Each social-
ecological system case study’s requirements, as determined from the outline in the
previous sections, must be individually met by the approach proposed in this
dissertation. This includes ensuring validity of the single case studies in addressing
their individual objectives through the variety of mechanisms proposed in the
previous sections for addressing construct, internal and external validity, and
reliability (as outlined later in Table 19). A variety of mechanisms are brought to
bear, and in combination, upon individual case studies through the BPDA modelling
approach as proposed in this dissertation, and as outlined and detailed in the next
chapter i.e. chapter 5.
Univers
ity O
f Cap
e Tow
n

121
However, that is not the end of analysis. The methodological framework
proposed in this dissertation was applied in a number of case studies for the purpose
of identifying whether the approach served the cause of modelling for decision
support in social-ecological systems sustainability across a range of social-ecological
systems research requirements. Over all the case studies conducted there are several
key priority application areas in which the implementation of the approach was tested.
These were specific requirements that must be satisfied in order to support the central
aims of the approach of this dissertation i.e. to be able to use modelling for decision-
support in sustainable development of social-ecological systems. The latter issues
discussed in regard to cross-case analysis are important for the goals of this
dissertation as a whole and as such will form a critical component of the discussion
section of this dissertation. Listed in the next few sections (i.e. 4.3.2.1 to 4.3.2.8), are
the application areas that were tested and evaluated in this dissertation i.e. to what
extent can the methodology help as outlined in the next few sections:
4.3.2.1 Integration Across Scales
The prevalence of cross-scale and remote effects in social-ecological systems
is a critical element of its complexity. To some degree, its openness as a system
allows for externalities to become significant drivers of social-ecological system
behaviour under certain conditions. Therefore, it is essential that cross-scale effects
be explicitly conceptualised and empirically evaluated where possible in a
methodology or formalism that seeks to model social-ecological system interactions
as it is critical for an understanding of system resilience and vulnerability (Holling,
Gunderson & Peterson, 2002, pp. 75; Peterson, Allen & Holling, 1998).
4.3.2.2 Integration Across Disciplines and Sectors
The major global ‘problematiques’ (Max-Neef, 2005) affecting humanity
today (e.g. poverty, forced migration, water, climate change) are of a highly
integrated nature, and require integration between disciplines. Many of these
Univers
ity O
f Cap
e Tow
n

122
problematiques are also directly or indirectly concerned with social-ecological system
sustainability. The fragmented response to complex problems of such a highly
integrated nature is deemed to be due to a deeper fragmentation that lies between
traditional disciplines and sectors. In particular, this fragmentation is due to their
respective ways of understanding these problems, and the translation of these
differences into the worldviews of stakeholders, users and decision-makers in a multi-
institutional governance system (Folke et al., 2002; Folke et al., 2005; Holling et al.,
2002, pp. 19, Stern, 2000; Van Kerkhoff & Lebel, 2006).
In response, participatory processes have emerged at all levels of research and
decision-making in attempts to set up adaptive management programmes for social-
ecological systems sustainability. Participatory process facilitation requires close
attention when dealing with inter-disciplinary and transdisciplinary case studies. In
this respect, we view shared understanding as the first step towards more cooperative
governance.
4.3.2.3 Facilitating Transdisciplinarity Research
The value of transdisciplinarity (Max-Neef, 2005) is increasingly being
appreciated in areas where the types of problems being dealt with demand a more
integrated response. This response must considers a diversity of views and manages to
transcend disciplinary boundaries in solving the problem. There is no recipe for
transdisciplinarity, although Max-Neef (2005) does put forward a framework which
can be used to enable transdisciplinarity (Figure 2). The requirement for
transdisciplinarity, from a modelling perspective, requires an open systems approach
to be followed. Any transdisciplinarity that occurs will emerge from an unbiased
consideration of the various systems that come to bear on a social-ecological systems
problem. As such, maintaining and accommodating conflicting views, and preventing
the dominance of a single disciplinary framework from subsuming the research effort
is a paramount requirement of any methodology that hopes to deal with social-
ecological systems from a transdisciplinary perspective.
Univers
ity O
f Cap
e Tow
n

123
4.3.2.4 Developing New Indices
Where there are gaps in understanding, it is sometimes possible to establish a
conceptual framework to assess a measurable index or set of indices that is tailored to
suit a specific context. Any rigorous analytical transdisciplinary research framework
will be required to gear itself around adaptively improving understanding of system
indices. Indeed, this constitutes a critical requirement for identifying and monitoring
emergent system level behaviours. It would also be of use in developing monitoring
and evaluation programmes, and can help guide research effort allocation, and an
iterative migration towards a better understanding of system behaviours. In complex
systems, where the basket of measures required to understand the particular behaviour
or phenomenon may change, models are required to be adaptive enough to include
and reflect these changes in a trace-able manner.
4.3.2.5 Incorporating Non-Linear Effects
Non-linearity is a critical feature of complex systems (Richardson, 2002), and
usually involves non-linear interdependencies including positive and negative
feedback and feed-forward relationships. Non-linear relationships usually lead to
faster rates of change or sometimes abrupt changes (such as step functions, or abrupt
changes in system state) between the variables that are non-linearly related. Non-
linearity has implications for how the critical limits and thresholds of a system will
evolve under different scenarios, and as such; is a critical and requisite feature for the
modelling of complex, adaptive social-ecological systems. As a rule, when dealing
with complex systems, statistical linearization should be employed only when it is
clearly understood what complexity is lost in the linearization, and what assumptions
have been made in the linearization of certain functions. Statistical distributions
usually contain non-linearity’s in the line wings of the distribution, that is, non-linear
effects are usually lower probability events, and under ‘normal’ conditions do not
dominate the statistical distribution. However, under different driver scenarios the
non-linear effects can come to dominate the distribution and produce unexpected
behaviours such as runaway feedback effects.
Univers
ity O
f Cap
e Tow
n

124
4.3.2.6 Resilience & Adaptive Capacity: Critical Limits & Thresholds
Understanding the linear and non-linear thresholds and critical limits of a
system leads to a better characterisation of the resilience of a system under different
conditions. Changes of state in a system result from non-linear variation in the
dynamics of variables in the system. However, for open social-ecological systems a
change of state can often result from a purely anthropocentric perspective on the
system, and the ‘state’ of a system is purely defined with respect to the research
question being posed. As such, understanding how indicators of changes in the
system state occur and evolve usually consists of observing how thresholds and
critical limits of the defined set of system variables, which taken together, loosely
describes the system state.
A better understanding of what the observational and interventional variables
are in a system, and which critical linkages can be measured or intervened upon,
constitutes a key requirement for understanding the adaptive capacity of a social-
ecological system. Moreover, understanding the human elements behind agency and
self-organisation (e.g. community, institutional) also plays a critical role in
characterising the resilience and adaptive capacity of a social-ecological system.
4.3.2.7 Decision Support for Adaptive Management
Adaptive management is mainly concerned with understanding and improving
the adaptive capacity of systems to cope with unpredictable and emergent challenges.
As such, adaptive management requires a broad, yet critical understanding of system
interdependencies, thresholds and critical limits and its vulnerability to remote effects
and externalities. Moreover, adaptive management requires a flexible and adaptive
supporting framework of research, models and methodologies that can all be
employed, where relevant, to a particular emergent problem that is facing decision-
makers at a particular moment in time, and that they may face in the future. Involving
decision-makers in research, and vice-versa, requires that a shared understanding is
Univers
ity O
f Cap
e Tow
n

125
obtained of the system in question that reflects the views, opinions and evidence of all
participants appropriately (i.e. as jointly agreed) in the research programme. .
4.3.2.8 Supporting the Future Integration of Manual and Automatic Engineering
In traditional modelling, human intellect and experience was used to identify
patterns of behaviour from data and used to construct models (manual engineering of
emergence), whereas non-traditional techniques can be used to ‘learn’ model structure
from raw data. Bayesian networks can also be used to automatically learn both model
structure and classifications from data (automatic engineering of emergence), and to
verify the causalities that underlie hypotheses and models of systems. In complex
systems, spurious correlations can sometimes be established from correlative
techniques, and even learnt structure needs to be validated by some kind of causal
model that explains and describes what the logical basis is for the relationship. As
such, both manual and automatic processes of engineering must necessarily be
brought together if a system is to be understood in near real-time. How this may be
achieved is discussed later in this document in section 9.3.3, which presents a
conceptual framework showing how manual and automatic engineering of emergence
can be integrated.
Univers
ity O
f Cap
e Tow
n

126
Univers
ity O
f Cap
e Tow
n

127
5. Modelling Methodology: Hyperstructures
for Case Study Research on Social-Ecological
Systems
So how can such an integrative framework for modeling complex social-
ecological problems be appropriately conceived, explored and developed? In this
chapter we will detail the modelling methodology that is proposed in this dissertation,
and show how it is designed to cater for the critical elements of case study research
strategies as outlined in the previous chapter.
The aim of this section is to provide a detailed description of the approach,
and to highlight precisely where, in the phases of the modeling approach, the various
requirements are met, and present a rationale for these claims (in sections 5.1 and
5.2). Later, in the case study section will show how the various requirements were
met in practice, through individual case studies and cross-case analysis.
Univers
ity O
f Cap
e Tow
n

128
5.1 Overview: Methodological Framework for Reasoning using Graphical Causal Models & Bayesian
Networks
MENTAL MODELS
COMPUTER, LAB, EMPIRICAL MODELS, FIELD EVIDENCE & DATA
Soft System ModelsGraphical Causal Models
BAYESIAN MODELS
Dynamic System Models
Agent-Based Models
SensitivitiesUncertainties
Figure 8: The BPDA Approach: Simple illustration of proposed modelling methodology for complex social-ecological systems.
The simplest illustration of the methodological process proposed in this
dissertation is shown in Figure 8, which shows a conceptual model of how the
processes involving top-down mental modeling of a complex problem is linked to
bottom-up research involving laboratory research, computer models, empirical and
theoretical models, and samples of field evidence and data. These two areas are
Univers
ity O
f Cap
e Tow
n

129
characterized by the need for methodologies that stem from a generalized complexity,
and restricted complexity perspective, respectively, as shown in Figure 7. It is a three
stage process that consists of the following phases, which are sequential at the outset
of research, but which gradually become more overlapped during the course of the
research effort:
1. Phase One: Iinterdisciplinary participatory processes were facilitated using
open-systems approaches (e.g. concept mapping, scenario planning
(Peterson et al., 2003) and in those listed in chapter 8 (Yin, 1984, pp. 100),
discussion, debate, scrutiny), to characterize the research problem in terms
of its critical concepts and hypotheses. As a facilitative tool, the mental
models of participants are captured in soft systems models and graphical
causal models to establish the causal relationships that underlie key
hypotheses that are made by individual participants or the group itself.
2. Phase Two: In phase two chains of evidence are formalized into
probabilistic relationships. The outputs of the soft, open systems approach
are then used to formulate and used to formulate and populate Bayesian
models with evidence. These are combined with graphical causal maps in
a software interface, which are then used as an integrating framework to
interrogate and model bottom-up sub-system integration of embedded
units within each case study.
3. Phase Three: By conducting more focused quantitative modeling and
research on the critical gaps in understanding of the overall system,
embedded systems and the relationships between them, the outputs can
then be used to re-constrain the Bayesian models and mental models
through managing feedback of information and learning to phase two and
phase one. In this way, an iterative process of learning is enabled. This
process of learning can be referred to as a “multiple learning loop
framework” (De Wit, 2001). De Wit identifies multiple learning loop
frameworks as the overarching essential requirement for enabling
sustainability in economic decision-making.
Research that has been conducted in this dissertation has involved establishing
and testing the process in Figure 8, and the extent to which it enables and ensures the
Univers
ity O
f Cap
e Tow
n

130
validity and reliability of case studies and cross-case comparison into social-
ecological systems; in the following two general ways:
• Interdisciplinary systems development and collaboration for
case study research of social-ecological systems:
o Establish a software enabled process of workshop
collaboration for hypotheses development and interdisciplinary
systems definition, enabled by graphical causal models, which
supports the formulation and development of probabilistic
Bayesian models.
• Modelling and simulation for complex adaptive social-
ecological systems:
o Satisfying requirements for a complexity based
modelling approach for social-ecological systems.
Elucidating causal mechanisms for adaptive
capacity and increased resilience of social-ecological
systems.
Univers
ity O
f Cap
e Tow
n

131
MENTAL MODELS
COMPUTER, LAB, EMPIRICAL MODELS, FIELD EVIDENCE & DATA
Soft System ModelsGraphical Causal Models
BAYESIAN MODELS
Dynamic System Models
Agent-Based Models
SensitivitiesUncertainties
INPUTS
OUTPUTS
1a: Conceptualizing the System:
Strategy-making & participatory processes
Symbolic reasoning Languages: Soft and Open Systems Methodologies e.g. Graphical Causal Models
2a: Mixed Models:
Mixing Quantitative and Qualitative variables in a heterarchical framework for integration
3a: Single-case Analysis:
1. Integrated research teams
2. Multi-method research
3. Embedded units
TOP-DOWN
BOTTOM UP
1b: Mainly Qualitative: Learning, participation, negotiation and cooperation:
Cross-scale influences
High uncertainty and non-linearity
Too much data
Gaps in data and understanding
Conflicting conceptual models
3b: Mainly Qualitative Analyses:
Well-bounded dynamic models
Verification and validation
Thresholds
Stability regimes
Emergence from human behaviour
2b: Mixed Models
Figure 9: BPDA Illustrated: Detailed description of integrative modelling approach proposed in this dissertation
The methodology proposed in this dissertation outlines a process for model
integration, as illustrated in Figure 9. The methodology employs the use of graphical
causal models and Bayesian networks as hyperstructures for integration between top-
down and bottom-up directions of system inquiry (see Figure 9: 2a & 2b). The
methodology (in this dissertation) proposes and tests the idea that Bayesian
hyperstructures can help as translators of the gap between mental modeling and
software/research based modeling.
The methodological process outlined in Figure 7 & Figure 9 can be described
in 3 broad phases (as outlined earlier), which interact with each other iteratively as
new understanding emerges from the research-based participatory processes and the
engagement of participants. These three broad processes are outlined below in the
next three sections (i.e. 5.1.1, 5.1.2 & 5.1.3).
Univers
ity O
f Cap
e Tow
n

132
5.1.1 Facilitating Interdisciplinary Problem Formulation, Review & Validation of Case Study Inputs, Outputs, Conclusions & Recommendations
5.1.1.1 Initial Phase: Problem Formulation and Research Design:
In this phase of the research approach, interdisciplinary workshops are
facilitated using open systems approaches, in order to establish a widely reflective
view on the critical issues that the individual case study should be concerned with. In
keeping with the spirit of an ‘open systems approach’ the boundaries of the study are
not set in place upfront, at the outset of the study, by imposing any general or specific
theoretical framework upon the study. Rather, participant researchers from different
disciplines are given the choice of how they would like to proceed to describe the
system and the problem set they are concerned with, and how they are related. Often,
elements of other approaches are used. This includes scenario planning (Peterson et
al., 2003) which involves envisaging multiple possible futures. It also involves case
study conceptualization techniques (see section 8.2.1)). Case study research, in turn
involves classifying and grouping factors, system components (or embedded units)
and identifying the critical relationships that underlie key hypotheses regarding the
system phenomena or behavior under investigation.
Sometimes, broad integrative conceptual frameworks are used for framing the
key issues of the study. These frameworks, such as Total Economic Value (TEV: see
later section 9.2.2 for more detail) are used only where they appropriately fit the
context and purposes of the study. The frameworks help initiate classification,
grouping, clustering and ordering of information and evidence. Skilled facilitation
techniques are required for managing such interdisciplinary processes. This
necessitates the ability to allow the process to emerge from the interactions amongst
the various individuals. This helps establish trust between participants and promotes
consensus and buy-in to the process of problem formulation and system definition
itself. This early phase of problem formulation and research design process focuses
Univers
ity O
f Cap
e Tow
n

133
on establishing a shared understanding of what the study’s questions and propositions
are, and start exploring the units of analysis that will be necessary to address the
“questions” and test the “propositions” of the study (see section 8.1.2: Yin 1984, pp.
29).
In the next phase of problem formulation and research design a better
understanding of the “units of analysis”, “the logic linking data to its propositions”
and the “criteria for interpreting the findings” are rigorously established (see section
8.1.2: Yin 1984, pp. 29). Knowledge and shared understanding is captured using
symbolic reasoning languages such as soft and open systems methodologies (e.g.
graphical causal models and dynamic systems models to explain hypotheses or
opinions about causality in the social-ecological system). The methodologies are used
to facilitate a basic understanding, from which a ‘straw dog’ graphical causal model
of the system can be composed; one which although likely oversimplified, stimulates
interdisciplinary scrutiny of the model, and helps initiate the process of modeling
using graphical causal mapping. In this phase, the key hypotheses are expressed
through making graphical causal maps of the chains of variables (and their causal
interactions) that underlie the hypotheses (explanatory), or to reflect the extent of
knowledge of system (descriptive).
In this phase, the embedded units are detailed in relation to the objectives of
research detailed at the whole system level and scale as more and more causal
influences are articulated during model formulation. The units of analysis at whole
system scale are related to the scale that is required of the embedded units as model
formulation unfolds iteratively. For each causal chain in the model, suitable evidence
of the causal relationship must be provided in the participatory workshops, and
recorded in the software-based graphical user interface that is used to formulate the
graphical causal maps. The software graphical user interface allows for versioning
such that older iterations can be reviewed by the multi-participant group, and re-
scrutinized to improve learning. A library of evidence for each causal chain in the
model is thus established. Where there are overlapping or non-overlapping (rival)
explanations these are recorded, the evidence is presented and the research team
decides whether a rival hypothesis is strong enough to warrant further research and
Univers
ity O
f Cap
e Tow
n

134
investigation. Examples of this will be given in the section on formulating graphical
causal models (see section 5.2.1), and in the section on case studies (see chapter 6).
Already, in this initial phase of research design, it becomes critical to envisage
the multiple system futures that the social-ecological system is faced with, that the
main research questions relate to. Establishing the context of inquiry, the boundaries
of the study, and a preliminary understanding of the critical linkages to be studied
requires many iterations. Anywhere from one to three workshops may be necessary
to obtain consensus in this phase of case study research and an interdisciplinary team
or reference group is set up to support the study. This phase involves mainly
qualitative analyses of the system, and considering multiple system futures and
influential and sometimes unpredictable externalities. The key issues that are
constantly reflected upon in this phase involve staying focussed on identifying:
• Core hypotheses and underlying causal chains of evidence.
• Relevant cross-scale influences (Gunderson & Holling, 2002).
• Variables that are linked with high uncertainty and non-linearity to other
variables.
• Gaps in data and understanding.
• Conflicting conceptual models and data sets.
• Recording multiple sets of interface in graphical causal modelling software
graphical user interface.
In this phase, participants become intimate with the whole system, including
data sources, inputs, outputs, causal logic, hypotheses etc. The foundations for
pattern matching exercises to be conducted in later phases of the study are set up in
this phase, where explanatory causal chains of evidence are articulated and tested by
the interdisciplinary team and embedded units are identified for further investigation.
Univers
ity O
f Cap
e Tow
n

135
5.1.1.2 Feedback Phase: Review of Case Study Outputs, Conclusions and Recommendations
The interdisciplinary team or reference group that is set up to support the
study also serves a role as an interdisciplinary review mechanism. They review the
outputs conducted from more model and data-oriented research processes conducted
in the ‘restricted complexity’ phase of research on the approach (see Figure 7). The
interdisciplinary team formulates the research design and reviews results from
implementation of the design in areas that have been determined to be critical to
furthering understanding. This usually involves paying closer attention to the
dynamics of various embedded units and their critical interdependencies. Here,
explanation building is conducted using graphical causal maps, where overlapping or
non-overlapping rival explanations are identified. These are verified through
iterations of research by the broader research groups as the latter phases of the
approach unfold. The evaluation requirements for pattern-matching (see 10.2.2) are
implemented in this phase of the approach. It also in this phase that the results of
Bayesian model runs (that correspond to different scenarios), and each causal chain
underlying the results, is evaluated by the interdisciplinary review team.
Univers
ity O
f Cap
e Tow
n

136
ADAPTIVE MANAGEMENT DECISION SUPPORT PROCESS
SCOPE OFSTUDY
DATA COLLECTION
& MODEL FORMULATION
CONSENSUS&
AGREEMENT
DESIGN OFEXPERIMENT
SENSITIVITYANALYSIS RESULTS REVIEW
IDENTIFY GAPS:KNOWLEDGE,
INFORMATION, DATA,AREAS OF EMPHASIS &
INTERVENTIONS
EVALUATE EMPHASIS OF STRATEGICPROGRAMMES
IMPLEMENT MITIGATION &ADAPTATION
PROGRAMMES
IMPLEMENT MONITORINGPROGRAMMES
REVIEW
Figure 10: Decision-Support Process: Illustration of how methodology is employed in support of an adaptive management programme, in this case, the Western Cape Climate Change Strategy and Action Plan.
The interdisciplinary team also plays a key role in formulating and reviewing
the overall results of the study, and any possible recommendations that are made as a
result of the findings of the study. In decision-maker consultation, the symbolic
reasoning languages can also be used to facilitate the processes of verifying the shared
knowledge and understanding that underlies learning, participation, negotiation and
cooperation (Van Kerkhoff & Lebel, 2006). We can also use symbolic reasoning
languages to facilitate research processes that engage with the “political processes of
decision-making and change” that are required for action-based research into social-
ecological systems (Van Kerkhoff & Lebel, 2006). The review group plays a key role
in interactions with the decision-maker. Mutual reviews and workshops between the
review group and the decision-makers builds understanding and confidence in that the
outcomes of the study as they are tested in both arenas. Any “analytical
generalization” that results from the study should therefore be tested through both
Univers
ity O
f Cap
e Tow
n

137
empirical means and qualitative (interpretive) means of inquiry across disciplines and
methodologies. That is the perspective taken in this dissertation.
Supporting adaptive management with modelling requires that process is in
place for managing the various stages of participation and research, as illustrated in
Figure 9, and requires that process is in place for managing the various stages of
participation and research, (see Figure 10).
The illustrated process was implemented in support of the Western Cape
Climate Change Strategy and Action Plan (CCSAPWC, 2007). This was a case study
in which the BPDA methodology was applied (see section 6.5 for more details). It
involved conducting an integrated review of a variety of provincial strategies in order
to assess decision-making challenges. It also involved conducting scenario based
strategy development with decision-makers regarding options for implementation, and
adaptation.
5.1.2 Formulating Hyperstructures: Bayesian Models & Graphical Causal Models
This phase of research involves using the graphical causal models derived in
the previous phase to populate Bayesian networks, which match the same causal
structure. The chains of evidence established and recorded in the software interface
are researched and the results are used to populate the Bayesian networks with
probabilities and constraints obtained from the restricted complexity based phase.
This phase involves using multiple research methodologies to investigate and
scrutinise embedded research units and key system intra- and inter-relationships more
closely in the third phase of the approach. At the same time, qualitative judgements
that are made concerning the fundamental assumptions about key relationships and
variables that are made in the study play a large role in arriving at a more complete
understanding of the social-ecological system in its current context.
We argue that when graphical causal models and Bayesian networks are
brought together, as they have been in the software interface, they become
Univers
ity O
f Cap
e Tow
n

138
‘hyperstructures’ themselves. The iterative, adaptive ability of the hyperstructures
provide two avenues of adaptation. Firstly, through information and evidence
obtained from emerging from qualitative analysis of causalities identified by the
interdisciplinary group in the study. Secondly from evidence obtained from more
quantitative analysis of embedded units and their inter-relationships. These are used to
help formulate the system constituents and interdependencies in relation to a
particular problem. The quantitative foundation for explanation building and pattern-
matching as outlined in Yin (1984) is set up in this phase of the approach, when
Bayesian networks are populated with probabilities and the model is run in different
scenarios and each causal chain is evaluated in the context of a scenario. Causal
chronologies are verified through empirical and modeling-based evidence and from
qualitative assessment by an interdisciplinary research group or review team.
The overarching and extensive role of the hyperstructure serving a dual role as
an interface for social-ecological systems complexity modelling, and for an interface
between arenas of generalised and restricted complexity, involves:
a. Managing mixed models: Mixing quantitative and qualitatively
deduced information resulting from multiple research methods in a
heterarchical framework for integration.
b. Managing between the top-down and bottom-up interfaces of research
using Bayesian networks as a framework for model integration, with a
particular emphasis on resilience & adaptive capacity, through helping
with:
i. Understanding monitoring and intervention points for adaptive
governance and management.
ii. Understanding thresholds, stability regimes and transitions
between system states.
iii. Understanding and adapting to emergence and reflexivity of
systems.
iv. Overcoming partial perspectives, fragmentation, ‘causal
ambiguity’ and undecideability.
Univers
ity O
f Cap
e Tow
n
139
In summary, we contend that graphical causal maps provide a heterarchical
causality-based framework for interdisciplinary interaction. The hyperstructures
enable a simple and human-intuitive framework for reasoning about drivers,
responses, influences, interdependencies, constraints, thresholds and limits of the
system in question. The heterarchical approach provides a framework in which
categories always overlap, even if causal models do not. The heterarchy of graphical
causal maps and Bayesian networks enable a framework of overlapping categories
that are not strictly structured in a bottom-up or top-down fashion.
We propose and test whether the causality-based articulation of system
interdependencies serves as an effective mechanism for facilitating constructive
dialogue and debate around social-ecological system futures. A causality-based
articulation also allows for causal relationships and categories to co-evolve (Meder et
al., 2005); a feature that is in concert with the concept of heterarchy.
Moreover, as previously outlined, Bayesian networks also offer the benefit of
integrating both observational and interventional learning in a single framework. As
such, they can be used to differentiate between what is observable (can be monitored)
and what can be intervened upon (influenced).
5.1.3 Detailed Embedded Unit & System Analysis In this phase of research computer, laboratory, empirical models, and case
study field surveys and evidence and data are brought to bear on investigating the
often complex relationships within and between embedded units, and externalities
such as climate change (e.g. temperature and rainfall variations) and global change
effects (e.g. demand changes, growth). These methodologies can be employed
because the case study is well bounded and directed, due to the activities conducted in
the previous two phases of the approach.
While this phase of research involves pursuing well-bounded problems,
embedded units themselves can have complex underlying relationships and
complexity occurs at all scales and levels of description in social-ecological systems.
Univers
ity O
f Cap
e Tow
n

140
The more complex the question; the more insight is required into the degree of self-
organization that is required to understand the system, especially where social-
ecological systems are concerned. The key elements of complexity, such as self-
organisation and non-linearity, can occur at various scales and levels of description
that is applied to a complex, social-ecological system. The techniques for dealing
with them are well understood at the disciplinary level, as most embedded units
usually reflect sub-system components that fall recognizably within disciplinary
boundaries. For example there are complexities in economics that are articulated
through economic theory, as there are complexities in engineering and ecology
articulated through the language of their disciplines. They themselves often require
the individual effort of whole research teams to solve in themselves and are
characterized by the following features:
1. Case analysis conducted from:
a. Integrated research teams,
b. Multi-method research, and
c. Embedded units, and
2. Evidence is gathered from bottom-up quantitative and empirical analysis
using:
a. Well-bounded dynamic models
b. Observation and measurement
c. Time series analysis
d. Surveys and case study investigation
e. Thresholds and stability regimes
Time series analysis is usually conducted in this phase of research, and can
include observation (monitoring, measuring), the use of models and simulations, or
facilitated participatory processes where the system ‘history’ is uncovered (in
particular, rural participatory processes: Cundill, 2008, pp. 548-549). Some time
series data is used to perform validation on model integration through forecasting or
hind-casting methods. Time series data also helps identify and validate chronology,
even though the actual causal linkages underlying the chronology may not always be
apparent in correlation analyses. In addition, existing surveys may be used or new
Univers
ity O
f Cap
e Tow
n

141
ones conducted in this phase of research, which involves more detailed investigation
and research into the key interdependencies, embedded units and variables that are
thought to underlie system level research questions.
Detailed system analyses or studies of any kind, both qualitative and
quantitative, can be used in this phase of research, including detailed, high resolution
dynamic systems (and other) models of embedded units. Models of embedded units
can also be complex and adaptive, but their boundaries are understood more clearly.
Therefore, the study of them are regarded to lie within the realm of “restricted
complexity” based approaches for the purposes of this dissertation, where the
complexity of embedded units can sometimes rival that of the whole system itself.
Often, the proverbial ‘devil in the detail’ is a complexity hidden or latent within an
embedded unit until the conditions for its emergence arises. Even well-bounded, well
understood systems can display complex, unpredictable behavior and these can
reasonably be regarded to lie within the realm of “restricted complexity”.
5.2 Formulating Hyperstructures: Graphical Causal Models & Bayesian Networks
As already discussed Bayesian networks and graphical causal models allow
for both quantitative and qualitative variables to be inter-related in a causal
framework. In this dissertation they are used to integrate results from case study
research, and more detailed dynamic sub-systems models. These are mainly used to
understand bottom-up system dynamics. From a purely numerical perspective a
larger number of variables (both quantitative and qualitative) can be included in our
hyperstructures. From systems perspective, a greater variety of causal sub-system
interdependencies is captured using a graphical causal mapping framework especially
because different types of causal interdependencies are accommodated.
Univers
ity O
f Cap
e Tow
n

142
5.2.1 Formulating Graphical Causal Models
In the conceptual systems development phase system definition is conceived
(mentally modelled), verified and tested with the Bayesian network and knowledge
engineering language derived for this purpose. In this phase only a mixture of
quantitative and qualitative information is available. This is conducted during the
early phases of research in order to obtain joint consensus on the interdisciplinary
model being used in the conceptual system development phase. In the conceptual
system development phase of the research process the key consideration of the
approach is to investigate alternative causal structures representing the various
influence linkages.
The implementation of causal structure of variables and conditionally
dependent and independent relationships is tested by a Bayesian Network (BN)
modelling exercise, depending on the complexity of the modelling effort and the
degree to which sensitivities within the system are understood. Dealing with multiple
influence linkages is emphasised as it enables system scientists and decision-makers
to consider multiple scenarios and futures. Building chains of evidence is the key
objective. Sources of evidence are recorded in the software-based graphical user
interface and are later used to populate Bayesian networks with probabilities.
Univers
ity O
f Cap
e Tow
n

143
Fisheries Value
Commercial Profit
SubsistenceProfit
Price
Regulations
Harvest & ExtractionRate
(Process)
Income
QuantityCapital
Investment Labor
Cost
Entrepreneurship
Demand
Price
Regulations
Harvest & ExtractionRate
(Process)
Income
Quantity Capital Investment
Cost
Entrepreneurship
Demand
Marine spawningStock (adult)
Growth & abundance FisheriesOfftake
Spawning
BIOPHYSICAL PRODUCTION
ECONOMIC PRODUCTION
Labor
+ +
++ - -
+
-
+
-
+
-
+
-
+
++
++ ++ +
+ ++
+
++
+ +
Definitional: Is-a/Part- of (Static)
Initiating: (+,-)
Resulting: (+,-)
Enabling: (+,-)
Graphical Causal Language
Figure 11: Example of Graphical Causal Model: Prawn Fisheries Production in Maputo Bay
An illustration of an economic model of prawn fisheries in Maputo Bay
derived using the knowledge engineering language is shown in Figure 11 (this model
was derived in interdisciplinary workshops as part of a larger coupled catchment-
coastal ecosystem; see Figure 15). The approach uses elements of knowledge
engineering languages developed from different perspectives (Helsper & Van der
Haag, 2002; Nadkarni & Shenoy, 2004). They are drawn as visual arcs preceding the
construction of Bayesian networks and enables easier conceptualisation of cause and
effect influence relationships through a variety of relationships. This way of defining
the influence linkages between drivers and responses is more intuitive and readily
understandable than most ‘cause and effect’ (Helsper and Van der Haag, 2002) type
descriptions which are too general and don’t capture the nature of the influence
relationship adequately. These are defined as influences of the type:
• Initiating arc: a dynamic cause which initiates an effect.
• Resulting arc: a dynamic cause which results in an effect.
• Enabling arc: a dynamic cause which enables an effect.
• Definitional arc: a static cause which defines an effect.
Univers
ity O
f Cap
e Tow
n

144
• Initiating and Enabling arc: a cause which initiates an effect and also
enables it by maintaining the relationship.
• User-Defined: This provides flexibility for evolution of the knowledge
engineering language.
The user may further define these influences having a positive or negative
effect (Nadkarni & Shenoy, 2004):
• A positive (+) symbol next to a linkage indicates that a positive
influence occurs where an increase in the influencing variable
increases the influenced variable. Positive feedback may be
represented in this way.
• A negative (-) symbol next to a linkage indicates that a negative
influence occurs where an increase in the influencing variable
decreases the influenced variable. Negative feedback may be
represented in this way.
o For example, a negative enabling arc is a disabling arc: a
dynamic cause which disables an effect.
These relationships can therefore be used to represent the effect of positive
and feedback using feed-forward relationships in a causal influence structure, from
one instance in time to the next i.e chronologically. Characterising these relationships
with probabilities can be conducted using data or expert judgement, as shown in the
next section. All arcs are influence relationships, bound by cause and effect. If an arc
exists between two variables then those variables are said to be conditionally
dependent and vice versa. An arc thus represents a conditionally dependent linkage
between two variables, which can be tested within a greater framework of linkages
and variables. The nodes are either objects or processes which may be assigned
subclasses of attributes. These attributes are valuable for interpretation into
probabilistic states for Bayesian networks.
Univers
ity O
f Cap
e Tow
n

145
5.2.2 Formulating & Populating Bayesian Networks
To summarise the qualities of Bayesian networks as discussed in this
dissertation, Bayesian networks contain a variety of Bayesian nodes (or variables) that
are inter-related through conditional causal relationships. A parent node influences a
child node, which in turn may become a parent node for another child node.
Characterising and constraining Bayesian networks for the purpose of modelling can
be achieved using a variety of information sources. The Bayesian propagation
algorithm ensures that each probability distribution can be added, subtracted,
multiplied, etc. Parent and child nodes can therefore be related through equations
(drawn from detailed sub-models or empirical evidence), or conditional probability
tables (drawn from expert opinion). Both qualitative and quantitative information can
therefore be incorporated into the nodes (or variables) of a Bayesian model.
In the case studies conducted in this dissertation, characterising a Bayesian
network with probabilities most often involved establishing a baseline state of the
system that matches the current state of the system, or averaged over some time
period such as a year, with the current or closest year used as the baseline. The
marginal distributions (i.e. parent nodes without parent nodes), in particular, usually
reflect measured evidence about the current state of the variables, and with all
resultant distributions peaking at the current value (as estimated from reliable, recent
data or evidence of the variable). When these distributions match observed evidence
and data, their reliability is verified. This necessitates a degree of sensitivity analyses
during the process of constructing conditional causal linkages between variables.
As far as social-ecological systems are concerned, we are more concerned
with the current context of the system than its history. If the underlying dynamics of
the current system matches that of a previous period in history, then its standard
devitation may offer some relevant information (i.e. to the current decision-making
context). However, we are often concerned with problems where the historical
dynamics behaviour of the system does not match current trends. In these cases,
historical standard deviations and other estimates of uncertainty and correlation often
do not adequately provide a predictive understanding of the system. For example, we
may be concerned with the area of maize under cultivation and may draw on several
Univers
ity O
f Cap
e Tow
n

146
recent surveys to estimate the current value. The uncertainty, in this case, is with
respect to the accuracy of our knowledge of the area currently under maize, and no
precise predictions can be obtained from historical data in this respect. Decision-
making and circumstance are responsible for the area of maize under cultivation, and
not history.
Generally speaking, two types of evidence can be used i.e. quantitative and
qualitative.
Quantitative information about probabilities and equations that link variables
in a Bayesian network can be drawn from empirical and modelled evidence that help
characterise the probability distributions of Bayesian nodes. Academic publications,
census data, expert consultation, case studies, and a variety of other sources can be
used to help characterise the probability distributions of Bayesian networks with
quantitative information regarding marginal probabilities and equations (e.g. non-
linear, exponential, linear and other) that describe the causal relationships between
parent and child nodes, especially their thresholds and critical limits.
Qualitative information regarding the relationship between nodes can be
characterised using conditional probability tables (CPTs). CPTs allow an expert or a
group of experts to prescribe what function (linear, non-linear, exponential, etc) the
relationships between two or more variables. There are no known limits (to the
knowledge of this author) to the types of algebraic functions that can be related using
either CPTs or equations in a Bayesian modelling framework. By way of illustration,
Figure 12 and Figure 13 show how non-linear functions can be composed in a CPT
using a complex equation to prescribe the non-linearity of the relationship. In both
the aforementioned figures, the x-axis describes what percentage of the total area of a
chosen location falls under protected area and light use area, respectively. The y-axis
in each figure describes the biodiversity intactness index measure that correlates to the
area under protected and light use respectively. As protected area increases, the
biodiversity intactness index increases. As light use area increases, the biodiversity
intactness index decreases, but at a lower rate than if the area was degraded, for
example. The CPTs can also be populated in the same way without using equations,
but rather facilitating experts to hypothesise the shape of the curve from considering
Univers
ity O
f Cap
e Tow
n

147
the matrix describing the CPT in a step-by-step fashion. Where-ever expert opinion is
used to characterise a Bayesian network, that part of the network is treated as groups
of hypotheses that need to be tested against empirical data. The sensitivity of the non-
linear inter-relationships in particular, must be established through verification against
empirically bounded, well-defined models of the system or embedded units, or against
empirical measurements.
The conditional probability tables of the variables that constitute the models
formulated in this dissertation are very long in size, due to the large number of states
that were attributed to parent variables and the child variable itself. Two illustrative
examples of conditional probability tables in the water module of the Mbombela
model are shown in Appendix D, from Figure 96 to Figure 109. These probability
tables were included to give the reader an idea of what they are constituted of. Due to
their large size, it was not possible to include every probability table of every case
study conducted in this dissertation. And neither is that the intention where
verification is concerned. To remind the reader, we are more concerned with the
sensitivities of output variables to input variables, that is, in specific scenarios. In this
way, every scenario is verified using the sensitivities of output variables, over a range
of input variable values. This is a more reliable way of ensuring that what results
from the propagation of CPT values through the network is valid for the specific
scenario in which it is being used. Sensitivity analyses can be conducted at every
node in a causal pathway, allowing for thorough and complete sensitivity analysis.
Most of the CPTs are governed by equations relating their input variables. As such,
they are governed by the Bayesian rule, and we can trust that the CPTs are correctly
constituted. It is only marginal variables for which the CPTs must be correct, but this
is easily verified using the figures given in the appendices of this dissertation because
all marginal probabilities are exactly the same as they appear in the CPTs. That is, the
marginal probability distributions are exactly the same as their CPTs. CPTs only
become complicated when they have input nodes. In this sense, the reader does not
need to view the CPTs where marginal input probabilities are concerned, the
probability distributions are sufficient as provided.
Univers
ity O
f Cap
e Tow
n

148
Figure 12: Non-linear Positive Amplification between Two Variables
Univers
ity O
f Cap
e Tow
n

149
Figure 13: Non-linear Negative Amplification between Two Nodes
Univers
ity O
f Cap
e Tow
n

150
Figure 14: Example of the Customised Software Interface; Water Module for Mbombela Case Study (see section 6.3): for detailed illustration of individual nodes and probability distributions see Figure 5.
Univers
ity O
f Cap
e Tow
n

151
Figure 15: Illustration of Bayesian Model Linking Incomati Catchment and Maputo Bay Shrimp Biophysical Production & Fisheries Production.
Univers
ity O
f Cap
e Tow
n
152
A software interface (named Sisyphus: see Peter C, 2008, pp. 493-494)
(see Figure 14) has been developed to facilitate the graphical causal modelling
language and process during interdisciplinary workshops. During each case
study, assumptions underlying relationships, functions, thresholds, parameters
are recorded using the software interface. Agreements and disagreements
amongst experts and literature sources are also recorded, so different views of
system integration can be tested. In the phases of development where
quantitative and qualitative variables are mixed using Bayesian networks, the
Bayesian networks are derived from best available information and expertise.
Data and information sources used to characterise probabilities the network
are captured in the graphical causal modelling software. Full traceability of
underlying assumptions, sources of information etc. are provided for review
and scrutiny to participants during a particular case study in order to help
engender a shared understanding of different ways of thinking about a
phenomenon or behaviour. An example of a case study in this dissertation is
shown in a Bayesian model in Figure 15. It represents the causal influence of
catchment activities in the Incomati Catchment of South Africa on Maputo
Bay in Mozambique. Note that Figure 11 and Figure 14 may be identified as
sub-system components in the right half of Figure 15, illustrating the degree of
modularity and reuse-ability of embedded units that is enabled through using a
Bayesian approach.
Bayesian network software interfaces, in general, enable a linkage,
module or drivers and responses to be added, deleted or changed without
having to reconstitute the entire model. The Bayesian approach enables the
derivation and quantification of causal influences representing the system for
different contexts or scenarios. The knowledge engineering language (when
converted into an object orientated software platform) ensures that the
modularity, reuse-ability, trace-ability and upgrade-ability of the Bayesian
models involved is appropriately ensured and accommodated at the input-
output causal level. In addition, the correct variable sensitivities required of
the Bayesian effort are preserved. This approach enables a ‘learning model’
approach (see section 5.2.6); one that can evolve with a long term
interdisciplinary effort supported by modular, incremental testing and
Univers
ity O
f Cap
e Tow
n

153
validation. In systems and software engineering there is often a need to
underlie the use of a particular methodology in research efforts with a systems
language or ‘knowledge engineering language’. This enables easier
management of changes in understanding of the mental model being built by
the group of experts.
5.2.3 Developing New Indices
When characterising a Bayesian network with equations or conditional
probability tables (CPTs) and populating it with probabilities, there are often
areas of the model about which there is poor understanding and data, and
which has not been studied a great enough depth to provide any useful
empirical information. This is where the role of CPTs is greatest. It allows for
experts to debate the nature of a function (linear, non-linear, etc) and to create
the function using the CPT framework. The CPT framework basically
provides a matrix of comparison in which a function, relating two or more
nodes, can be hypothesized. This hypothetical function can then be tested by
more focussed and detailed modelling and research and monitoring efforts,
that is, in more quantitative bottom-up studies where possible. In this way, a
hypothetical, contextual index or set of indices can be iteratively tested, and
knowledge of the ‘gaps in understanding’ can be better characterised and
understood. The development of new indices such as direct and total value
add and the biodiversity intactness index were explored in the case studies
conducted in this dissertation and are discussed in detail in the case studies
later on.
5.2.4 Sensitivity Analysis & Running Scenarios
Sensitivity analysis involves testing the sensitivity of one variable
against another variable, or a group of variables i.e. deviations from the
baseline established in section 5.2.2 are tested in various scenarios and verified
by an interdisciplinary group who use expert opinion, empirical evidence, data
and theoretical models to help characterise the Bayesian network. In this
Univers
ity O
f Cap
e Tow
n

154
dissertation, the dependency of the variable being tested, that is, to its parent
variables; is managed and tested using Bayesian networks. As long as there is
a causal chain of conditional dependencies between two or more variables the
driver-response sensitivity of these variables can then be assessed and
validated against empirical evidence or expert opinion, using a Bayesian
network.
Where Bayesian networks are used in assessing a particular scenario,
the driver and response relationships being evaluated must be specifically
verified and validated for that particular scenario. In other words, a full
sensitivity analysis is conducted for each scenario that is run, in order to
ensure that the scenario itself is valid, and that conclusions can be reliably
made from the run. This is critical where a mix of empirical and expert
judgement is used to characterise the probabilities and relationships between
variables in a Bayesian network. The boundaries of application of a model
must always be thoroughly ensured and how it relates to the context of
application must be verified.
The software interface allows for exhaustive sensitivity analysis of
driver-response relationships included in the model (as long as they are
conditionally related through some causal chain). Often, the sensitivities of a
wide range of responses are tested to a particular driver, in order to ensure that
the ‘basket of measures’ that are used for that scenario react in ways that are
verifiable and validate-able. In the process of sensitivity analysis, knowledge
of key non-linear relationships, their thresholds and critical system limits are
established and shared. These are usually identified as causal chains are tested
for their sensitivities and iteratively verified by the interdisciplinary group, and
drawn into the arena of generalised complexity for review and analysis,
especially where model results from scenario runs are concerned.
Univers
ity O
f Cap
e Tow
n

155
5.2.5 Interpreting Model Results & Making Recommendations
Establishing the sensitivities quantitatively is but one part of the
process of sensitivity analysis and verification and validation of the model.
There are many contextual factors that must be interpreted appropriately in
running the model and evaluating its results. In the case of social-ecological
systems this requires the close participation of the interdisciplinary group in
interpreting the results of any inference run that is conducted using the
Bayesian network. Model results can easily be misinterpreted if they are
located within an argument that makes incorrect assumptions about the context
of application. For example, a threshold that might be fixed in one context of
application, might not be fixed in another context; and because the models are
not exhaustive in terms of the causal relations that constitutes it, additional
contextual considerations can play a critical role in interpretation.
Moreover, each scenario must be independently verified in terms of the
quantitative logic applied to the scenario, and the quantitative evidence
reflected in the probabilities of the model. It therefore becomes critical that
the interdisciplinary team or reference group that is involved in the study play
a part in the interpretation. The multiple dimensions of social-ecological
systems extend beyond our ability to exhaustively model them (Cilliers, 2008,
pp. 40). For each context of interpretation there may be critical assumptions
upon which interpretation of results is conducted, which must be made explicit
so that the interpretive elements of explaining model results are incorporated
in the outputs of the study.
5.2.6 Enabling Learning & Reasoning with Hyperstructures
In this dissertation, the combination of graphical causal maps and
Bayesian networks provides the user with the dual ability to; (1) scrutinise
data and information that underlies causal linkages (this information may be
qualitative or quantitative, but is usually mainly qualitative as it is interpreted
Univers
ity O
f Cap
e Tow
n

156
in context), and (2) to verify and test the quantitative basis upon which the
model has been constructed, by conducting a sensitivity analysis upon key
variables. It also allows for the processes of generalised and restricted
complexity research to overlap and merge and support an iterative “multiple-
learning-loop framework” (de Wit, 2001) learning process that requires
adaptability. This is a model that seeks to cope with emergence as that
behaviour which deviates from a model.
A key feature that supports learning is that the heterarchical causal
framework allows for categories and causalities to emerge from a process of
co-creation during learning, and that this can be captured, shared and
scrutinized in the framework of reasoning. This process of co-created
causality and taxonomy lies at the heart of the concept of heterarchy enabled
in the approach in this dissertation.
As has been observed by Waldmann & Hagmayer (2006) in
psychological experimentation, these constitute critical elements of
explanation building or theory-forming. As these categories emerge, and are
updated and reflected in the hyperstructures (e.g. through new indices); a
framework of learning is enabled. In this framework critical interdependencies
(non-linearity, thresholds, critical limits), cross-sector sensitivities and the
difference between observational and interventional variables can be adapted
and shared as new understanding emerges. This allows for the resilience of
the system to be characterised; using an understanding of what cross-sector
interdependencies, non-linearities, thresholds and critical limits exist. Through
identifying and understanding the role of observational and interventional
variables (Meder, 2005) in the context of these system features, these in turn
can be used to obtain an understanding of the adaptive capacity of the system.
Univers
ity O
f Cap
e Tow
n

157
6. Case Studies: Single Case Analyses
In this section a narrative is provided of the case studies conducted in
support of this dissertation. The single case studies range from case studies in
which the full BPDA approach was implemented, to ones where only parts of
the BPDA approach were implemented. In chapter 7 we conduct cross-case
analyses, and in chapter 8 we assess how the approach addresses the elements
of cross-case analysis that are required to test the approach proposed in this
dissertation (i.e. BPDA).
The case studies conducted in this dissertation were closely co-
produced with the cross-disciplinary teams and team members. This is
illustrated in the number of joint publications and research reports that resulted
from close collaboration and specific team members in the consolidation
phases of the case studies. In the case of the Incomati-Maputo catchment case
study, Peter, Monteiro and de Wit (2007) collaborated on writing up the study.
The national irrigated agriculture - climate change case study was published
by Musango & Peter (2007). The consequent case study on how climate
change might impact on biofuel production targets was co-written for
conference presentation by Peter, Musango & de Lange (2007). This was
revised to reflect the new biofuels production target and later published by
Peter, Musango & de Lange (2009). Lastly, the cholera case study was
captured in a CSIR report by Peter et al. (2007*).
That is, the scientific foundations, foundational assumptions and
evidence for the case studies were already published elsewhere when writing
this dissertation, and it served no purpose to repeat the same information to the
reader, except where information was relevant to the objectives of this
dissertation. We considered including some of the publications and reports of
studies as appendices to this dissertation, but due to word and size limitations,
and the copyrights associated with the publications, we were unable to do so.
Rather, priority was given in this dissertation to articulating the nature of the
Univers
ity O
f Cap
e Tow
n

158
case studies through a clear case study narrative, and highlighting the key
issues that were explored in each, and what was learnt from each case study.
While the case studies are supported by evidence published elsewhere,
the aim of our analysis in this dissertation is not to repeat these case studies
but rather to link the studies to the claims made about the ability of the BPDA
approach in this dissertation. In each case study, we tabulate the key learning
points of the case study in relation to the claims that were made regarding the
ability of the approach. These are later integrated in cross-case analyses. The
reader is therefore advised to consult the publications and reports listed here
for more details regarding the specific assumptions that were made in each
study, and the conclusions of the study.
A: Incomati Catchment-Maputo Bay Study
B: National Climate Change Irrigated Agriculture Study
C: National Climate Change, Irrigated Agriculture,
Biofuels Study
D: Municipality & Magisterial District Scale:
Ecosystem Benefit Flows / Rural Urban Interactions
E: Western Cape Provincial Climate Change Strategy
Review:Full Multi-Sector Model
F-G: Case studies facilitated using only graphical causal maps i.e. partial case studies.
A-G: Flow Chart of Single Case Study Analyses
F: Cholera ModelG: Gauteng
Urban Growth
A-E: Case studies facilitated using graphical causal maps & Bayesian networks i.e. full case studies.
A-E: Increm
entally Increasing Levels of Scale & Com
plexity in Im
plementation and Testing of BPD
A approach
Figure 16: Flow Chart of Single Case Study Analyses
A flow chart of single case studies conducted in chapter 6 is shown in
Figure 16. It also shows the order in which case studies in this dissertation
were incrementally developed in order to negotiate issues of scale and
complexity. The single case studies incrementally grow and test the scope and
flexibility of the approach to accommodate; (1) an increasing number of
Univers
ity O
f Cap
e Tow
n

159
embedded units (and consequently; an increasing number of variables), and (2)
to provide valuable understanding of cross-scale and cross-sector linkages at
different scales of integration (regional, national, magisterial district,
municipality, provincial), analysis and decision-making.
The earlier case studies conducted in support of this dissertation made
use of a few embedded units (agricultural land-use production models, water
use and water availability models, sectors such as fisheries (e.g. shrimp
biophysical and economic production models) in model formulation and
analysis for development of social-ecological systems. In later case studies,
this was extended to include a range of embedded units. The embedded units
integrated in later case studies includes biodiversity intactness index, GDP,
GGP, employment, CO2 emissions, solid waste, air pollution/noxious gases,
household informal activities, manufacturing, energy and water production
and savings, etc.
A strong thread that runs through most (but not all) the case studies
was the need to deal with climate change related scenarios, and how they
affect social-ecological systems sustainability. The author of this dissertation
has been closely involved in climate change adaptation research for the past
six years, and therefore, this topical area of research heavily influenced the
case studies conducted in this dissertation. However, the case studies were
always focussed on a broad range of critical issues, and were not restricted to
assessing climate change related scenarios alone.
At the same time, the single case studies allowed for an incremental
understanding to be built around participatory process management of cross-
disciplinary research, facilitated using graphical causal maps and Bayesian
networks.
The penultimate case study involves working with government
decision-makers in the Department of Environmental Assessment and
Development Planning (DEADP) in the Western Cape Government of South
Africa in 2008. It also shows how the limits to provincial growth can be
Univers
ity O
f Cap
e Tow
n

160
determined with respect to climate – related effects on water availability and
energy consumption in a variety of future economic growth scenarios, and at
the social-ecological system scale.
6.1 Incomati Catchment – Maputo Bay Study
This case study was the first undertaken in support of the BPDA
approach proposed in this dissertation. At the time, we were mainly
concerned with testing the BPDA approach’s ability to link economic and
biophysical systems, and for this case study in particular; linking land-use
changes in the catchment to changes in shrimp productivity at the coast. We
were also concerned with the ability of the approach to cope with challenges
of interdisciplinary research into socio-economic and biophysical systems
challenges and problems. In that context, this case study served as a learning
point for all subsequent case studies conducted in this dissertation. We learnt
that the approach could be used to integrate across the economics-biophysics
interface, cope with issues of non-linearity, scale and aggregation. We also
showed that two sectors (agriculture in the Incomati catchment and shrimp
fisheries in Maputo Bay) could be inter-related through the biophysical
systems underlying them, and has the potential for supporting decisions made
at the regional economic scale.
We used the results of a 3 year interdisciplinary research project named
Catchment2Coast (Monteiro & Mathews, 2003), which was conducted into the
linkages between the Incomati catchment (which runs from South Africa to
Maputo Bay in Mocambique. The Catchment2Coast project was an EU
funded project involving several teams of international researchers from the
UK (England, Scotland), Portugal, South Africa, Swaziland and Mocambique.
In its initial phases, this case study was developed and presented during the
last year of the Catchment2Coast project. Some of the researchers from the
Catchment2Coast project were involved in the case study presented here
throughout its entire evolution, including close collaboration and supervision
of the project leader Dr Pedro Monteiro (CSIR), who is originally from
Univers
ity O
f Cap
e Tow
n

161
Maputo and had a deep understanding of the context of the study, and how the
multidisciplinary modelling project had integrated its various models to obtain
its results. The author also received a great deal of support from Vivek
Naidoo (CSIR) who conducted the hydrological modelling component of the
Catchment2Coast project using the Soils, Water, Air and Temperature
(SWAT), and Dr Pete Ashton (CSIR), who is a widely recognised expert with
over 25 years of research experience into the Incomati catchment. Dr Ashton
played a key role in providing data and verifying the Bayesian model that was
eventually formulated in a series of day-long workshops. His input was
invaluable, as it played a key role in determining where the emphasis of the
model should lie in terms of land-use and catchment activities. Professor
Martin de Wit (then CSIR, now de Wit Sustainable Options Pty Ltd) is an
economist who collaborated with the author on the case study and helped
guide the study significantly by introducing the use of the conceptual
framework (Total Economic Value – see later in this section), which enabled
us to construct the link between the biophysical and economic systems that the
model was concerned with.
Maputo is heavily dependent, economically, on its shrimp fisheries.
The Catchment2Coast project linked river flow features of the Incomati
catchment to its downstream effects on coastal ecosystem productivity. In
particular, the project explored the effects of reduced water in-flow to Maputo
Bay on the shrimp biophysical and economic systems (through a significant
proxy indicator - P Indicus - of shrimp productivity in Maputo Bay (Monteiro,
2007)).
The Catchment2Coast study explored critical inter and intra system
linkages using historical evidence, GIS data, detailed modelling and fieldwork
to develop biophysical and economic models. This was used to develop a
decision support tool, which integrated the various models and scenarios
explored in the research project, and was verified against data hindcasted over
a ten-year period. However, this decision support tool, which relied on
integrating detailed numerical models and simulations, was only able to be
used in a small set of scenarios, namely, those explored for the purposes of the
Univers
ity O
f Cap
e Tow
n

162
research project. Also, if significant changes were to come about in the
system, which weren’t catered for in the original studies around which the
project and decision support tool were orientated, then a great deal of re-work
and expense would be required by researchers in order to provide decision
support. This raised the question of how a flexible framework for integration
of the various embedded units in the study could be established. These
allowed for a broad range of scenarios to be tested, and which could be
adapted to reflect real-world changes as they unfold.
We explored conceptual frameworks for integrating between
biophysical and economic systems, and developed a Bayesian network of
these linkages between catchment and coast. We used the conceptual
framework of Total Economic Value (TEV) (Blignaut & de Wit 2004) as a
first level of integration of economic and biophysical systems, with a long-
term view to dealing with more complex social-ecological systems (TEV is
explained in more detail in section 9.2.2). According to Blignaut & de Wit
(2004) TEV necessitates the consideration of a broader range of variables.
These range from; “life support services (regulatory and structural functions),
human development support services (recreational, cultural, spiritual), sources
(renewable and non-renewable) and sinks (pollution and waste absorption).”
This framework is illustrated, in part, in Figure 17, that is; direct and indirect
use values are outlined, while non-use values such as existence and bequest
values are not illustrated.
The concept classes identified in Figure 17 were then used to explore a
wide range of TEV – related services for a coastal ecosystem, as shown in
Figure 18. The conceptual frameworks shown in Figure 17 and Figure 18
were both used to stimulate discussion between an interdisciplinary workshop
group, and to formulate graphical causal maps Figure 19 and Figure 20, which
shows the Incomati-Maputo Bay model at various stages of development,
before it is eventually formalised into a Bayesian model using a software
interface, as shown in Figure 21.
Univers
ity O
f Cap
e Tow
n

163
Graphical causal models were used to facilitate a series of workshops
where the linkages were determined, verified and validated or substantiated.
Univers
ity O
f Cap
e Tow
n

164
Metals
Sinks
waste absorptionpollution
Radioactive substance
Toxics
Air, Water, Soil, Land
ClimateRegulation
Detoxification/Waste Treatment
Biological &DiseaseVector Control
Water Regulation
Nutrient Cycling
Soil Formation
Structuralfunctions
Regulatory functionrenewable
Sources Life Support Services
spiritualcultural recreationnon-
renewable
Space:Availability and
pattern of use of land & water.
Reproduction/Habitat
Fisheries
Forests &Woodlands
Livestock
Fauna
Pollination
Biodiversity(Genetic to Landscape)
Flood, Erosion& Storm Control
AtmosphericCompositionRegulation
Landscape Interconnection& Structure / Refugia
spiritualcultural
Human Dev Support Services
Freshwater:Quantity
Flora
Food & Fibre
Biochemicals,Medicines
Non-renewableEnergy
Mineral Resources
RenewableEnergy
Ornamental
Total Economic Value
Use Values Non-Use Values
Existence BequestDirect Use Indirect Use
+ Direct & Total VAD
Figure 17: Illustration of Total Economic Value Conceptual Framework Univ
ersity
Of C
ape T
own

165
SPACE:
Biophysical Services
AnthropogenicServices
Natural ProcessesSuitable Habitat
Development
Waste Sinks (Disposal & Dissemination)
Water ColumnTransport Absorption &
Dispersion
Sedimentation/Resuspension
Biological Uptake &Breakdown of Waste
Toxicity or NutrientSource
Spawning Areas
Eutrophication
Fisheries
Nursery Areas
Quality ofNursery Habitat
Predator Protection
Migration Routes
RecruitmentIndex
Freshwater Input& Nutrients
Open/ClosedEstuaries
Catchabilty
Nutrient Production
River – Open/ClosedWith Seepage
Deep Water Space
Sea Trade & Transport
Land Availability
Sheltered Envt
Port Growth
PortEcosystem
Remote Effects
Space for IDZ
Low Dredging
Recreation & Tourism
Coastal RealEstate
Recreationalfishing
Eco-Tourism
Biodiversity
Development:Housing & Infrastr
Recreation & Tourism Impacts
Tourism Revenue
IndirectRevenues
Asset: Property Values
IndirectRevenues
Remote Effects
Beach Erosion
Pollution
Golf CourseImpacts
DevelopmentImpacts
Coastalization
Absorption Rate
DispersionRate
Different LifeCycles
Biodiversity
Mining: Dune & Offshore
Sediment
Rehabilitation
Beach Erosion
Development
Impact on Local Communities
Revenue
Estuary Health
Total Economic Value (Coastal)
COASTAL ZONE
Figure 18: Using TEV Framework to Select Salient Factors for a Coastal System
Univers
ity O
f Cap
e Tow
n

166
Formulating Bayesian Models Using Graphical Causal Maps
We made use of the knowledge engineering language outlined in
section 5.2.1. The language is comprised of initiating, enabling, resulting and
definitional arcs to represent driver response relationships, and positive and
negative signs to indicate positive and negative amplification between parent
and child nodes. We used our customised Bayesian software interface, which
allows the user to compose graphical causal maps before converting them into
Bayesian networks. As previously explained, this software capability captures
information around nodes and linkages to be characterised and recorded for
review and evaluation. This can be conducted by both the internal
interdisciplinary workshop team, and experts external to the study.
The Incomati Catchment – Maputo Bay model is shown at different
levels of abstraction in Figure 19 and Figure 20. The Incomati Catchment –
Maputo Bay system was treated as a single aggregated basin. Ecosystem
services and land-uses, and shrimp biophysical and economic production; are
distinguished in Figure 19 and developed to further detail in Figure 20. The
causal chains, in a sense, represent hypotheses about how the system is
integrated, and may be formulated and characterised from correlation – based
studies, expert opinion, historical and archival evidence, survey information
and case studies. The structure of the model was verified and validated by a
team consisting of field experts with long term knowledge and experience of
the area and against the results of the Catchment2Coast study.
The causal links constituting the structure of the model we formulated
were characterised using; expert judgement, a variety of sources of
information containing empirical, qualitative, numerical and simulated outputs
from publications (Sengo et al., 2004; Hassan, 2003, Janse van Rensburg,
2001; Nkomo & van der Zaag, 2003) and internal reports from government
departs such as the Department of Water Affairs and Forestry’s ‘State of the
River Reports’ and CSIR Natural Resource and Environment data records and
reports. We used and consulted the models that were developed during the
Univers
ity O
f Cap
e Tow
n

167
Catchment2Coast project. These included a detailed catchment hydrology
models using the Soils, Water, Air, Temperature (SWAT), and a decision
support tool (DELFT3D) which integrated the various sub-systems or
‘embedded units’ of the system. Moreover, the overall results of the 3 year
multidisciplinary project Catchment2Coast were also used to characterise the
baseline probability distributions of the Incomati Catchment – Maputo Bay
Model. For areas in the catchment, known and modelled sources of
information were used to characterise data for river flow, rainfall, temperature
abstraction types and related volumes, inter-basin transfers and water quality.
TEV was used as an integrative framework, and two new indices were
introduced, relating to the direct and total economic value add to water by
various agricultural (land-use) crop production types (e.g. maize, wheat, sugar
cane). Direct and total economic value add were estimated using conversion
factors established in a study by Hassan (2003) on the Crocodile Catchment, a
major constituent catchment of the Incomati. We used the same conversion
factors for horticulture as for grain, as there was no precedent in the study.
This provided, at a very coarse level, the distinction between micro and
macro-economic levels of impact.
Univers
ity O
f Cap
e Tow
n

168
TEV
BiophysicalProduction
EcosystemServices
Land-UseProduction
BiophysicalConstraints
Catchment/Basin
River Flow& Water Quality
Catchment/Basin Model
Nature BasedTourism
Inter-BasinTransfer
Power Station
Biodiversity
SugarCane
FruitFarming
Effluent Dams Abstractions
Alien Vegetation
Water QualityInput
River FlowInput
Small Towns
Ecosystem Services
Land-UseValues
Total Economic Value
ForestryTrout/GameFarming
Urban Popn
RuralPopn
Water QualityOutput (CH)
Acid Rain
SummerRainfall,
WinterRainfall
Rainfall,
SummerTemp,
WinterTemp
Temperature
TEV
BiophysicalProduction
EcosystemServices
Land-UseProduction
BiophysicalConstraints
Maputo Bay Estuary
MangroveStocks
Nutrient/WasteFiltering
Total Economic Value (Bay)
Shrimp EconomicProduction
Shrimp BiophysicalProduction
River FlowOutput (CH)
Bay Use Value(Shrimp)
Ecosystem Services Value
CarbonSequestration
Figure 19: Model Linking Catchment to Maputo Bay - First Level Conceptual Model
Univers
ity O
f Cap
e Tow
n

169
ESTUARY
Shrimp Profit
Price
Regulations &Incentives
Harvest & ExtractionRate
Income
Quantity Capital Investment
Labor
Cost
Entrepreneurship
Demand
SHRIMP BIOPHYSICAL PRODUCTION
Total Adult Biomass
Growth Rate & Abundance
FisheriesOfftake
Spawning
Food Supply
MPB Biomass
Salinityin Mangroves
Juvenile ShrimpAbundance
PreviousMarine spawning
Stock (adult)
Wood for Construction
WoodFor Fuel
SHRIMP ECONOMIC PRODUCTION
Ecosystem Services
Bay Use Value(Shrimp)
AvicenniaStocks
Other MangroveStocks
Total MangroveStocks
CarbonSequestration
CATCHMENT
Nature BasedTourism
Power Station
Biodiversity
FruitFarming
Effluent Abstractions
Water QualityInput
River FlowInput
Small Towns
Ecosystem Services
Land-UseValues
Total Economic Value
(Catchment)
ForestryTrout
Water QualityOutput (CH)
Acid Rain
River FlowOutput (CH)
Inter-Basin Transfer
Rainfall
Temperature Range
Expected NetMAR this year
EvaporationLosses
Evaporation Rate (MAR)
Water Losses (Dams)
Stored Water (Dams)
Dam EvaporationLosses
Dams: Planned Water Storage
Dams: Previous Yrs Storage
Dam Evaporation Rate
Alien Vegetation
Urban Effluent Effluent
Urban Waste Works Rural Effluent
Urban Population
RuralPopulation
Annual Rainfall
Planned Water Available
Planned Storage Abstractions
Climate Change & Water Storage Module
Water Availability In Rivers
MAR: MeanAnnual Runoff
SugarCane
Nutrient/WasteFiltering
Total Economic Value (Bay)
Juvenile GrowthRate
Juvenile ShrimpRecruitment Biomass
PredatorProtection
Natural MortalityRate for Adults
N Fixation
Figure 20: Bayesian Network Linking Catchment Land-Uses to Biophysical and Economic Consequences on Maputo Bay Estuary
Univers
ity O
f Cap
e Tow
n

170
Figure 21: The Incomati-Maputo Bay Model as Formulated in a Bayesian Software Interface. It contains a knowledge capturing facility for all nodes and arcs.
Univers
ity O
f Cap
e Tow
n

171
Having constituted and formulated a Bayesian model, sensitivity
analyses was conducted on the Incomati Catchment – Maputo Bay model to
ensure robustness of the model structure in general. Where a particular
scenario is concerned, the full range of driver-response relationships used in
the scenario must be verified. Calibrating the model to represent a scenario
depends, in some part on the qualitative judgements underlying the causal
hypotheses made in formulating the model structure.
This model explored integration at cumulative regional scales, and
scenarios were designed to explore three key questions, namely (Peter et al.,
2007, in prep for resubmission):
1. “What type of agro-development strategies would best ensure
that international water sharing obligations will be met?
2. How would projected climate change effects impact on water
availability in the catchment and at the coast?
3. Optimising local activities in relation to systems level
dependencies. How can shrimp fishery production be
optimised in relation to its biophysical and economic
production system?”
The scenarios in which the model was used related directly to the
above questions, and focussed on (respectively);
1. Exploring different land-use development strategies, in
particular, assessing the difference between ‘one-on-one’
trade-off’s in agro-production against moderate
combinations of agricultural land-use.
2. Exploring sensitivity to climate change effects on rainfall
and temperature, and the relationships between water
catchment output to Mocambique and (1) dam storage
practises within the catchment and (2) the level of water
intensive land-use activities conducted in the catchment.
Univers
ity O
f Cap
e Tow
n

172
3. Exploring the sensitivities of multiple biophysical drivers
on shrimp production. For example river flow, salinity,
spawning, juvenile food production from mature Avicennia
mangrove stocks. This is because of microbes that are
attached to mature Avicennia mangroves, which are
responsible for the production of juvenile food production
or’ macrophytobenthos’. These were related in our model
to produce an estimate of adult shrimp biomass production
for Maputo Bay (Monteiro, 2007).
The results of the study show that:
1. More nuanced combinations of land-use changes can
provide the same, if not better overall system level effects.
2. When planning for water resource planning so that
international water sharing agreements are met, it is
important that the inter-relationships between dam storage
practises, slight changes in rainfall and temperature,
various land-use combinations, evaporation from stored
water and mean annual runoff must be considered in
unison. The results showed that a good rainfall year could
still result in significant stored water shortages if annual
temperatures were higher. Adaptations that may result
from climate-related water shortages, involving increasing
water storage capacity (e.g. through dams) would prove
ineffective should these conditions exist.
3. Multiple biophysical and economic factors can impact on
shrimp fisheries and shrimp biophysical production. These
were explored using the Incomati – Maputo Bay Model,
and the study showed that the tendency to emphasize one
factor above others without considering the causal chain
between factors could be overcome by creating a shared
understanding of the sensitivity of these linkages between
participant disciplinary experts.
Univers
ity O
f Cap
e Tow
n

173
The study was used to explore how the BPDA approach could be used
to provide an integrated understanding of catchment – coastal linkages. It was
also to explore the range of possibilities that the approach would unleash, and
the new directions of research that would emerge as a result of the learning
conducted in this study. For example, incorporating non-linearity into
Bayesian networks proved easier than anticipated and exciting possibilities
emerged for representing known or speculated feedback effects using
Bayesian networks.
Table 3: Critical Learning Points for BPDA in Incomati-Maputo Bay Case Study
Critical Learning
Points (BPDA)
Description
Cross-scale Regional scale effects are evaluated at an aggregated scale in
this case study. This was achieved by linking land-use
activities upstream in the Incomati catchment to its
downstream impacts in Maputo Bay.
Cross-sector Regional scale economic interactions, mediated by
biophysical system services, and human impacts on land-use
changes upstream were evaluated in this case study. This
proved encouraging, in the sense that it would be possible to
build larger models, and with greater numbers of embedded
units that represent different sectors or biophysical systems.
Non-linearity A variety of non-linear relationships were incorporated into
the model, for example, including water availability – crop
production relationships, salinity and new production, and
various others (see Figure 21).
Critical Limits &
Thresholds
The resultant sensitivities of variable interdependencies and
were verified against known data and expert opinion for the
model in general, and for each scenario in particular.
New Indices We evaluate total economic value by introducing economic
value-add indices and a value for ecosystem services (see
Figure 21).
Univers
ity O
f Cap
e Tow
n

174
Participation A range of workshop and one-on-one sessions were conducted
to formulate, populate and verify the model involving the
aforementioned participants in groups, or as individuals, at
various stages of the case study. The initial learning we
obtained regarding participation in this regard was simply that
through detailed inspection of causal linkages, researchers
from different disciplines could contribute to building a
shared picture of the system.
Decision Support The Bayesian model formulated for this case study proved
effective at coping with a much larger range of scenarios (and
adaptations) than the highly detailed Delft3D model could.
This study served as an initial point of learning for this dissertation,
and the methodology employed in this case study was expanded, in later case
studies, to include a wider variety of system components and measures for
analysis. As such, while the study provided useful results, the learning that
emerged from later case studies, for example, regarding estimating system
resilience in future scenarios through establishing scenario-based critical limits
and thresholds, was yet to be revealed to its full extent.
Univers
ity O
f Cap
e Tow
n
175
6.2 National Scale Model: Climate Change - Irrigated Agriculture
In this case study, we developed an understanding of the linkages
between water, climate and irrigated agricultural land-use requirements by
developing a Bayesian network of these linkages. We assessed the ability of
the BPDA approach to model at the national cumulative scale of integration
i.e. of water requirements versus water availability for irrigated crop
production, and the respective sensitivity of water availability (storage and
rainfall) to climate related changes in temperature and annual rainfall.
We formulated an understanding of the national scale model using
graphical causal maps and Bayesian networks (Musango & Peter, 2007). We
re-used the model structure formula of the Incomati Catchment – Maputo Bay
Model, formulated in the previous case study, to assess the impacts of climate
change on irrigated agriculture in South Africa. The study was an
interdisciplinary collaboration between the author and a resource/agricultural
economist (Musango & Peter, 2007).
Agricultural production in South Africa consists of a developed
commercial sector, and a large number of subsistence-based farming
homesteads and communities. The percentage of GDP contributed by the
agricultural sector has dropped steadily since the 1930’s, that is, from 20% to
less than 7% in the 1990’s. Cyclical droughts are a regular occurrence in the
agricultural sectors of South Africa, which calls into question the increased
vulnerability of the agricultural sector to possible climate change effects, and
their combined effect in different scenarios.
The prospect of using the Bayesian approach to assess climate change
related effects on land-use adaptations, discussed in the previous case study,
begged further investigation. This is due to several concerns. Firstly, the
topical nature of climate change as a global concern, the lack of research into
human adaptation to climate change (Reilly, 1999) in developing countries and
secondly, inaction at the national scale of decision-making in South Africa,
Univers
ity O
f Cap
e Tow
n
176
which is a water-scarce country (Mendelsohn et al., 2000). We envisaged that
a cumulative framework in which a variety of what-if’s relating to land-use
combinations in different climate change scenarios can be tested at the
national scale, and that this would prove a valuable decision support tool for
land-use adaptation planning for climate change, in particular, agricultural
land-use planning (i.e. Musango & Peter, 2007).
We formulated the model in such a way that we could simultaneously
test the potential total and direct value add at the national scale in two ways.
Firstly, as projected from a proposed land-use strategy for agriculture without
considering climate change effects, and secondly, considering the same
strategy with climate change effects (see Figure 22).
The same economic multipliers derived by Hassan (2003) were used to
establish the baseline probabilities of the Climate Change – Irrigated
Agriculture Model. The water use amounts for various water intensive land-
use activities that were obtained from a study on the Incomati Basin by Sengo
et al. (2004). The model was also populated using known crop yields and
related incomes as outlined in Aquastat (FAO, 2005). An illustration of some
nodes in the populated model is shown in Figure 23.
In this study, we developed a better understanding of how to model the
sensitivity of different land-use combinations to a range of climate change
scenarios; as forecast by IPCC based Global Climate Model (GCMs)
projections (Midgeley, 2005).
We ran the model in a series of scenarios that deal with projected
climate related changes in rainfall and temperature. We increased temperature
by 3o
C and tested a variety of scenarios related to rainfall, and the extent and
combinations of different types of irrigated agriculture in South Africa
(Musango & Peter, 2007).
Univers
ity O
f Cap
e Tow
n

177
The sensitivity of irrigated agricultural practises to climate change
effects on rainfall, temperature, water storage were determined for a variety of
scenarios, as outlined in Musango & Peter (2007).
Univers
ity O
f Cap
e Tow
n

178
Planning Considering
Climate Change and Water Storage Practises
Temperature, Rainfall and Water Storage Module
Planning Without Considering Climate Change and Water Storage Practises
Crop Land-Use Module
Figure 22: Detailed Model of Climate Change – Agriculture at National Scale (Musango & Peter, 2007)
Univers
ity O
f Cap
e Tow
n

179
Figure 23: Bayesian network Constructed for South African Agriculture
Univers
ity O
f Cap
e Tow
n
180
In the scenarios conducted in this study we found that in
order to increase the resilience of the national agricultural system to climate
change under climate change related conditions the following measures would
have to be considered, and in combination (Musango & Peter, 2007):
1. Reduce inter-basin transfers slightly
2. Store more water in dams.
3. Increase area under fruit and nut cultivation by 160% of
current value.
4. Maintain area under wheat, grain and sugar-cane
cultivation at current levels.
This study showed how embedded units formulated in a
previous study (Incomati-Maputo Bay), could be adapted at the national scale
to model the cumulative effects of climate change related variables on
irrigated agriculture. The study mainly focussed on demonstrating how
adaption measures could be formulated using the BPDA approach and the
Climate Change – Irrigated Agriculture Model and no significant predictive
conclusions were formulated. Rather, this study explored the usefulness of the
approach in providing an integrated understanding of a larger scale system and
the methods developed in this study would be further expanded in later case
studies. The learning engendered in this case study for the purposes of the
BPDA approach is summarised in Table 4, as shown below.
Table 4: Critical Learning Points for BPDA from National Scale Climate Change – Irrigated Agriculture Case Study
Critical Learning
Points (BPDA)
Description
Cross-scale National scale effects are evaluated at an aggregated scale in
this case study. This involved aggregating certain
relationships at the national scale, and relating them in a
verifiable manner. The global cross-scale effect of climate
Univers
ity O
f Cap
e Tow
n
181
change upon the water and (consequently) agricultural sectors
is also conducted, thereby linking effects at the global and
regional scale to the national scale capacity for agricultural
production.
Cross-sector The agriculture and water sectors are related at a national
scale in this case study, and furthermore, linked to potential
climate change effects.
Non-linearity A variety of non-linear relationships were incorporated into
the model, for example, including water availability – crop
production relationships.
Critical Limits &
Thresholds
We learnt that we could use the model to get an understanding
of critical limits and thresholds in different climate change
and agricultural land-use scenarios.
New Indices We evaluate total economic value by introducing economic
value-add indices, including direct value add and total value
add – in order to get a feel for the economic impact of land-
use activities in relation to water at local and national scales,
respectively.
Adaptability We were able to adapt the model formulated at regional scale
for a catchment (see previous case study) to deal with
questions of agriculture at a national scale, and in a different
context i.e. assessing the possible impact of climate change
effects on different land-use adaptation scenarios.
Decision Support The Bayesian model formulated for this case study proved
effective at coping with a large combinatorial range of climate
change and agricultural land-use adaptations scenarios. The
learning from this case study was presented at a local
conference and published in a local journey, as an initial
starting point for testing our understanding that the BPDA
approach that could enhance decision-support.
Univers
ity O
f Cap
e Tow
n

182
6.3 National Scale Model: Climate Change – Biofuels Production
The Draft National Biofuels Industrial Strategy (DME, 2007)
was announced in South Africa in 2007 by the Department of Minerals and
Energy (DME). This brought into question the possible effects of this
intervention on food crop production, and hence, food security in South
Africa. This case study therefore presented the opportunity to assess the
flexibility of the approach BPDA to adapt to real-world strategic changes as
they are announced (Peter et al., 2007) and developed. Moreover, our research
goal was informed by emerging concerns that biofuels production may
threaten food security, as evidenced in the United States of America (MIT
Technology Review, 2007), where biofuels production in the Midwest has led
to competition between buyers of biofuel feedstock and food producers.
Moreover, there were growing concerns regarding the linkages between
biofuels production and global food security. In South Africa, the perception
amongst dairy farmers was that the increases in prices of animal feedstock
were driven by the competition for maize for bioethanol production in the US.
This study explored the importance of considering the linkages between
biofuels production, and other sectors such as the food and water sectors,
under a variety of projected climate change and land-use change scenarios.
In this case study, the author collaborated mainly with two
agricultural economists, namely, Ms Josephine Musango and Dr Willem de
Lange. We formulated a model to explore the linkages between food and
energy production, and water availability, under projected climate change
scenarios. We re-used the model formulated in the previous study (see section
6.2). In this case study, we tested the flexibility of the BPDA approach to
accommodate the new biofuels strategy into the modelling framework
developed in the previous case study (see section 6.2) as a new embedded unit,
and thereby demonstrating how an existing model can be modified and/or
changed in order to assess a new, emerging development strategy at the
national scale.
Univers
ity O
f Cap
e Tow
n

183
We conducted a study that involved formulating an
embedded unit for biofuels production and linking production to agricultural
yield, and water availability in South Africa. The model is cumulative, and
does not reflect spatial changes and how they may affect crops, and aggregates
at the national scale.
We adapted the model from the previous study to include a
biofuels production module, which we linked to the irrigated agricultural
sector. We re-constrained and re-parametrised the model at the national scale.
We used a variety of information sources and options, elicited in cross-
disciplinary participatory workshops that were held to guide the research effort
and to validate the model structure and parametrisation.
Four basic modules compose the model (see Figure 24 taken
from Peter et al., 2009, In Press), namely:
1. a & b: Economics modules that calculate the economic
value add to water that is created through food-based
agriculture. Two economics modules are used; one
which includes the effect of climate changes, and another
which excludes the effect of climate changes, so that
immediate comparisons can be made when the model is
run.
2. c: A biofuels production module, which allows the user
to select the percentage of cultivated crops that can be
dedicated as biofuels feedstock, and assess levels of
biodiesel and bioethanol production.
3. d: A water availability module, which allows the user to
set different levels of water storage, annual temperature
and rainfall, inter-basin transfers
Univers
ity O
f Cap
e Tow
n

184
Figure 24: Detailed Illustration of Climate Change - Biofuels Bayesian Model: Including four constituent modules a-d (in Peter et al., 2009, In Press).
Univers
ity O
f Cap
e Tow
n

185
A diverse array of information sources were solicited in cross-
disciplinary participatory workshops and used in this study. We used the
economic multipliers derived by Hassan for the crocodile catchment as a
baseline indicator of the value-add to water by individual crop production per
unit. We estimated multipliers for those crops for which there was no
information regarding economic value add to water i.e. using expert opinion.
A feasibility study (Lemmer, 2006) for a bio-ethanol production plant was
used to constrain some of the crop-biofuel production relationships. Dam
evaporation rates were obtained from CSIR records and reports, and
information about current irrigation levels was obtained from FAO (2005).
The model parameters and constraints were verified in interdisciplinary
workshops and with individual experts in one-on-one interactions conducted at
the later stages of the study.
Sensitivity analysis was also conducted over the range of scenarios
conducted in the study. The sensitivity of response variables chosen for a
particular scenario are tested over the full range of driver variable states,
producing graphs. This provides easy verification of critical limits and
thresholds. In this way, for each scenario, driver and response variable inter-
relationships and sensitivities are verified and validated against known
information and expert knowledge.
We ran the model in a variety of land-use combinations and climate
change projection based scenarios and assessed the resilience of the national
industrial biofuels strategy in terms of the crop-types that have been identified
for use as biofuel feedstock. In the first study (i.e. Peter et al., 2007) we tested
the feasibility of meeting the targets proposed by the Draft National Industrial
Biofuels Strategy (2007), that is, that biofuels production capability could be
established by 2013 that would see biofuel production at 4.5% of national fuel
production (DME, 2006).
A number of crops were proposed for cultivation, including maize,
soya beans, sunflowers and sugar cane. These were tested in a variety of
scenarios, only one of which was presented in the study by Peter et al. (2007)
Univers
ity O
f Cap
e Tow
n

186
for the purposes of illustrating the effectiveness of the approach in assessing
the levels of surplus agricultural production that would be required to meet the
national biofuels production targets. It was clear from the study that larger
surpluses would be required under climate change conditions than envisaged
by the Draft National Industrial Biofuels Strategy.
After presenting the study at a conference in Fiji (Peter et al., 2007),
we re-worked the study for submission in a special edition of the Journal of
Climate Research. In the interim period, during which the study was under
review by the journal, the national biofuels strategy was finalised (DME,
2007). This finalised strategy contained significant changes from the draft
strategy; namely; the overall target was slashed to 2% of national petroleum
production, maize and jatropha were excluded from the strategy (citing
concerns over food security) and new biofuel crops were announced as
potential feedstock candidates. These included sugar cane, sugar beet,
biodiesel sunflower, canola and soy beans. These crops are intended to be
grown in the short term by small scale farmers in the former rural homelands
such as the Eastern Cape (KPMG, 2007), under dryland conditions.
Therefore, the land-use strategies and scenarios were amended to reflect these
changes in the study, mid-way through submission (Peter et al., 2009, In
Press), to reflect the changes that had been made to the strategy.
The final study (Peter et al., 2009, In Press) drew on two scenarios that
were selected from a range of scenarios that were explored. This range was
conducted by incrementally increasing the growth area of each crop, and
establishing what levels of growth are required at the system scale in order to
meet the national biofuels production target. We chose two scenarios which
met the national target and tested their resilience to climate change related
changes in rainfall and temperature, to illustrate the usefulness of the approach
in determining the robustness of a particular strategy, given a range of future
scenarios. We therefore tested the resilience of these strategies over a range of
annual rainfall and temperature, in order to determine where limits to growth
may lie. This was consistent with climate change related forecasts and
projections made by the IPCC (2008) and drawn from global climate change
Univers
ity O
f Cap
e Tow
n

187
models (GCMs). They make forecasts and projections for 2099, and simple
linear regression of these trends is not representative of the ways in which
climate change related effects are expected to unfold. The IPCC (2008)
acknowledges this, and warns scientists that considering a range of changes,
which can occur on faster timescales in the short and long term is more
appropriate for this type of system and problem. Indeed, recent research have
shown that rates of glacial melt are faster than originally thought (Gregory &
Oerlemans, Nature, 2009).
We tested the two scenarios (and the land-use combinations they were based
on) for their critical limits in relation to temperature and rainfall by testing iterative,
incremental combinations of both. In this way, we were able to establish an
understanding of what the limits to growth were for a particular strategy i.e. under
which climate change scenario was it resilient, and conversely vulnerable,
respectively. This is shown in Table 6, which is taken from Peter et al. (2009: In
Press). It shows how two biofuels production strategies (i.e. 1 & 2) respond to
increasing temperatures (a-d) over the annual rainfall range, as outlined in Peter et al.
(2009, In Press):
The average annual temperature is raised in 1 0 Celsius
increments; from the average 22 0 (no increase in annual temperature)
to 26 0 Celsius in each consecutive row in Table 6; where total
biofuels, biodiesel and bioethanol production in response to rainfall at
each temperature is shown. Meeting a total biofuels production of
approximately 400 million litres per annum would require higher and
higher annual rainfall to achieve, and the point at which rainfall meets
the requirements of the agricultural land-use strategy is clearly shown
to change from row to row.
In this way we are able to determine the critical limits and thresholds
of the ability of a system to sustain growth under a variety of different climate
change – related scenarios.
Univers
ity O
f Cap
e Tow
n

188
This study showed also that we can change and adapt not only a model,
but our lines of inquiry into the same study as real-world changes occur.
Using the BPDA approach, we were able to follow and analyse the strategy
from its draft to final form, as the changes were made, illustrating the
usefulness of the approach to decision-makers and researchers alike, in linking
their analyses to changing, real-world contexts. In short, we were able to
assess a strategy dynamically as it was changed, demonstrating the usefulness
of the approach in supporting decision-making in changing real-world
contexts. The study achieved this primarily through providing an
understanding of the resilience through visualising critical limits and
thresholds in a variety of possible future climate change scenarios (especially
with respect to changes in rainfall, temperature and water storage).
In summary, in this case study we used the BPDA approach to
successfully adapt to changing ideas and decisions about how a strategy is
implemented at the national scale, in this case, for biofuels production. This
study has been published in the Journal of Climate Research (Peter et al.,
2009, In Press). We adapted previous study, which was presented at a
conference in Fiji (Peter et al., 2007) to assess national biofuels strategy based
on draft biofuels strategy. The first submission of paper had to be revised with
new scenarios as the national biofuels strategy was finalised and significant
changes were made to it in the period between first submission of our
manuscript and receiving the reviewers’ comments. These are detailed later in
the cross-case analysis, but are also summarised in Table 5 below.
Univers
ity O
f Cap
e Tow
n

189
Table 5: Critical Learning Points for BPDA approach from Climate Change – Biofuels Production Case Study
Critical Learning
Points (BPDA)
Description
Cross-scale National scale effects are evaluated at an aggregated scale in
this case study. This involved aggregating certain
relationships at the national scale, and relating them in a
verifiable manner. The global cross-scale effect of climate
change upon the water and (consequently) agricultural sectors
is also conducted, thereby linking effects at the global and
regional scale to the national scale capacity for agricultural
production, and hence biofuels production.
Cross-sector The agriculture, energy (biofuels) and water sectors are all
directly inter-related in this case study, increasing the
complexity of this case study from the previous. Through
limits imposed on the available surplus agricultural
production we were hence also able to get an understanding of
how food security might consequently be affected.
Non-linearity A variety of non-linear relationships were incorporated into
the model.
Critical Limits &
Thresholds
We determine the limits to biofuels production in different
projected climate change scenarios, and we could evaluate a
variety of different land-use strategies to find more a more
nuanced, balanced options for production of biofuels using a
range of crops, beyond those considered in the official
strategy.
Adaptability We were able to adapt the model formulated at national scale
to assess climate change – irrigated agriculture
interdependencies ( in the previous case study) to assess the
national strategy for biofuels production in relation to
agriculture, to assess the possible impact of climate change
effects on different land-use adaptation scenarios. Thereafter,
as the national industrial biofuels strategy was finalised from
Univers
ity O
f Cap
e Tow
n
190
draft form, significant changes were made, which we were
able to incorporate in a short amount of time, as described
earlier in this section.
Decision Support The Bayesian model formulated for this case study proved
effective at coping with a large combinatorial range of climate
change and agricultural land-use adaptations scenarios, and
relating agricultural production to possible biofuels
production alternatives. The learning from this case study
was presented at an international conference in Fiji, and was
later published in an international journey (Climate Research).
This served to further establish the idea that the BPDA
approach that could be used to enhance decision-support in
social-ecological systems.
Univers
ity O
f Cap
e Tow
n

191
Table 6
Land - Use Strategy 1 and 2: Compared Over a Temperature Range from 22 0 C to 27 0 C (see: Peter et al., 2009, In Press).
Strategy 1 Strategy 2
1a: 22 0 C
2a: 22 0 C
Univers
ity O
f Cap
e Tow
n

192
1b: 23 0 C
2b: 23 0 C
1c: 24 0 C
2c: 24 0 C
Univers
ity O
f Cap
e Tow
n

193
1d: 25 0 C
2d: 25 0 C
1e: 26 0 C
2e: 26 0 C
Univers
ity O
f Cap
e Tow
n

194
1f: 27 0 C
2f: 27 0 C
Univers
ity O
f Cap
e Tow
n

195
6.4 Magisterial District Scales: Nelspruit & Mbombela
This study leveraged learning obtained from a two-year
interdisciplinary Strategic Review Panel (CSIR) funded research project, and
was conducted in close collaboration with Dr David Le Maitre of the
Ecosystems and Biodiversity Unit at CSIR. In addition, Dr Belinda Reyers
was involved in developing an understanding of the Biodiversity Intactness
Index (BII), and provided data for the formulation of the BII module. The
project researched the ecosystem benefit flows in the Incomati Water
Management System (WMA), which lies in the Mpumalanga Province of
South Africa (see Figure 25). Ecosystem benefit flows include both actual
flows of materials, and flows of cash and other types of human benefits. We
focussed on the Mbombela Local Municipality, as this is the scale at which
local government decision-making and implementation occurs, in particular
through Integrated Development Plans (IDPs). We learnt that we could adapt
the BPDA approach to deal with a different contextual view of social-
ecological systems i.e. one that was concerned with rural-urban benefit flows
and ecosystem services. We also learnt that we could build a model at
municipality scale (which is the scale of decision-making implementation in
South Africa), using the learning obtained from previous case studies
conducted at the national scale.
Univers
ity O
f Cap
e Tow
n

196
Figure 25: Mombela Map 1: Incomati catchment and Mbombela local municipality
showing the major sub-catchments of the Komati, Crocodile and Sabie Rivers and the
international boundaries. South African sub-catchment data and designations include
Swaziland but end at the Mozambican border (Courtesy of Le Maitre).
This case study focussed on the Mbombela Local Municipality because
it is an area with high densities of rural populations, situated around Nelspruit,
which is a fast-growing hub of economic activity, migrant labour, trade and
transport situated in a fast-growing economic corridor (i.e. from Johannesburg
in South Africa to Maputo in Mocambique). The Mbombela Local
Municipality consists of three magisterial districts, namely; Nelspruit, White
River and Nsikazi (see Figure 26).
Univers
ity O
f Cap
e Tow
n

197
Figure 26: Mbombela Map 2: The Mbombela Local Municipality showing the
magisterial districts (italics) and major towns. The magisterial districts are still used as
the basis for reporting social and economic statistics although they are not the units for
local governance, socio-economic management and development planning (Courtesy of
Le Maitre).
We used research and expertise from the Ecosystem Benefit Flows
Project, and conducted cross-disciplinary participatory workshops over a two-
year period to formulate an understanding of ecosystem benefit flows (i.e.
identifying sources, sinks and flows) using graphical causal maps and
Bayesian networks using members of the project, which was led and
coordinated by Dr David Le Maitre.
The results of 2-year Ecosystem Benefit Flows study and other sources
of knowledge were used for informing integration and formulation of
graphical causal maps and Bayesian models. Economic, biophysical and
social analyses were integrated in this study, through interdisciplinary
workshops and consultations with individual experts over a two-year period.
A cross-disciplinary group that was small but diverse was used to rigorously
Univers
ity O
f Cap
e Tow
n

198
verify model formulation, characterisation and parametrisation. This included
GIS, spatial planners, resource economists, hydrologists and social scientists,
and various individual experts at the CSIR.
BIOFUELSPRODUCTION
RENEWABLE ENERGYTARGETS
TOTALECONOMIC VALUE
BIODIVERSITYINTACTNESS
INDEXDIRECT VALUE
ADDTOTAL VALUE
ADD
WATER
Climate Change
Water StoragePlanning
IrrigatedLandcover Non-Irrigated
Landcover Water StoragePlanning
Mining
Natural Landcover
SPECIESRICHNESS
Industry
RESPONSES
RESOURCES
DRIVERS
PERFORMANCE
Population
ECOSYSTEM INTEGRITY
Figure 27: Conceptual Illustration of the Bayesian Network Model for the Mbombela
Local Municipality: The arrows represent influences and causes and directions of
interactions not flows of material goods or information.
A set of guiding questions (“what are the key ecosystem benefit flows,
where are they going to? ... (and) are benefits being equitably shared?”), and
a high-level model (see Figure 27) were used to stimulate the process of model
formulation. The study focussed mainly on water related services as a point of
integration and crop production because there was a bias of existing expertise
in this area and they are critical ecosystem services. However, while the
framework for relating water availability and agro-production was used in
previous case studies, here it was expanded to include a variety of new
embedded units, and associated measures of performance (see Figure 28).
This includes modules for dryland and irrigated agriculture, irrigated and
Univers
ity O
f Cap
e Tow
n

199
dryland biofuel production modules, forestry mining and industry water use,
sugar mill water use, population water use, biodiversity intactness index,
household water-based subsistence and informal activities and a water storage,
rainfall and temperature module (see Figure 28). For example, the water
availability module in Figure 28 is shown in Figure 29, is extended to include
a wide range of driver variables; for example, the impact of alien plant
coverage is taken into account in this case study, a slight, but significant
improvement upon the previous water availability modules used in previous
studies.
Univers
ity O
f Cap
e Tow
n

200
Figure 28: Full Bayesian Model for the Mbombela Local Municipality with Embedded Units: The Modules are shown in More Detail in Appendix C.
Univers
ity O
f Cap
e Tow
n

201
Figure 29: Planned Water Available (PWA): As the aggregate outome of the various factors which determine water availability.
Univers
ity O
f Cap
e Tow
n

202
We focussed on identifying and characterising existing
ecosystem benefit flows, and assessing the future state of ecosystem benefit
flows, given a set of development and climate change scenarios. In this case
study, it is necessary to provide more detail regarding the individual scenarios
that were used, in order to ensure that the reader is able to interpret and
appreciate the results that are presented later in this section while keeping in
mind the context informing the study.
The scenarios take the following sequence. First the
sensitivity of production of the system to current levels of human development
activities to rainfall was established. This acted as a baseline for the
Mbombela Bayesian Model i.e. against which other scenarios were compared.
We then assessed the sensitivity of production to rainfall under different
conditions of economic growth and development from the current baseline.
Lastly, we increased annual average temperatures for the region over a range
to test the sensitivity of production to evaporation and moisture stress.
Through sensitivity analyses we were able to identify the optimal rainfall and
temperature ranges, for sustainable growth conditions to continue.
The set of scenarios A-D from the study are listed below.
These scenarios were developed by Peter & Le Maitre joint case study in
2008:
• “Scenario A: Vary mean annual rainfall from 0 mm to 1770
mm per annum – 100 % below the mean to 181 % above
the mean (i.e. 975mm/a). All sectors are kept at current
levels of productivity.
• Scenario B: The level of economic activity in each sector is
increased by 10% except forestry which has already been
limited by law to an allowable water-use. This is intended
to be a medium to long-term growth strategy for the
Mbombela magisterial district that could feasibly deliver
the provincial growth required by ASGISA at the national
Univers
ity O
f Cap
e Tow
n

203
scale (i.e. 6%) in the short term. Urban centres in provinces
need to achieve a benchmark of 10 percent growth in order
to achieve the provincial targets in general across South
Africa.
• Scenario C: Scenario B plus an increase in the mean annual
temperature by 4°C. Regional climate change model
predictions predict an average temperature increase of 2-
3°C, but this scenario provides an extreme conditions test
for temperature.
• Scenario D: The total planned water available (PWA) to the
catchment, which aggregates the effect of rainfall,
temperature, water storage, evaporation losses and alien
plants, is varied from -210 to 493 Mm3/a per annum – 276
% above the average at approximately 178 Mm3
/a per
annum. The model makes allowance for evaporation losses
and water demand by alien plants to become so large that a
negative value can be derived for planned water available.
As far as the model is concerned, the negative values are
treated as a 0 state input to child nodes (responses) of the
planned water available variable”.
The results for scenarios A – D are shown in part, in Figure
30, of which column 1 is illustrated in greater detail in Figure 31 in order to
provide more detail for the reader. The rainfall ranges over which direct and
total value add can be ensured are shown in the dashed regions outlined in
Figure 30 and Figure 31. These indicate the rainfall ranges over which
scenarios A-D are feasible, given the variations in temperature and other
variables in the individual scenarios A-D, as listed above. Scenario C tests an
extreme climate change scenario, where a mean annual temperature of 4°C is
applied to scenario B.
Univers
ity O
f Cap
e Tow
n

204
COLUMN 1: IRRIGATED CROPS (DIRECT VAD)
COLUMN 4: IRRIGATED AGRICULTURE (TOTAL VAD)
SCENARIO B
SCENARIO C
SCENARIO D
SCENARIO B
SCENARIO C
SCENARIO D
SCENARIO A
0 500 1000 1500
1.0
0.5
0.0Dir
ect V
AD
(10
9R
/a)
SCENARIO A
To
tal V
AD
(10
9R
/a) 2.0
1.0
0.00 500 1000 1500
1.0
0.5
0.0Dir
ect V
AD
(10
9R
/a)
0 500 1000 1500T
ota
l V
AD
(10
9R
/a) 2.0
1.0
0.0
To
tal
VA
D (
109
R/a
) 2.0
1.0
0.0
0 500 1000 1500
0 500 1000 15000 500 1000 1500
1.0
0.5
0.0Dir
ect V
AD
(10
9R
/a)
-1000 0 1000 -1000 0 1000
Rainfall (mm/a) Rainfall (mm/a)1.0
0.5
0.0Dir
ect V
AD
(10
9R
/a)
To
tal
VA
D (
109
R/a
) 2.0
1.0
0.0
Planned water available (Mm3) Planned water available (Mm3)
COLUMN 3: MBOMBELA MUNICIPALITY (DIRECT VAD)
SCENARIO B
SCENARIO C
SCENARIO D
SCENARIO A
Dir
ect V
AD
(10
9R
/a)
0.0
0.8
1.4
0 500 1000 1500
0 500 1000 1500
Dir
ect V
AD
(10
9R
/a)
0.0
0.8
1.4
0 500 1000 1500
Dir
ect V
AD
(10
9R
/a)
0.0
0.8
1.4
-1000 0 1000
Rainfall (mm/a)
Dir
ect V
AD
(10
9R
/a)
0.0
0.8
1.4
Planned water available (Mm3)
COLUMN 2: DRYLAND CROPS (DIRECT VAD)
SCENARIO B
SCENARIO C
SCENARIO D
SCENARIO A
10
0
20
Dir
ect V
AD
(10
6R
/a)
0 500 1000 1500
0 500 1000 1500
10
0Dir
ect V
AD
(10
6R
/a)
20
0 500 1000 1500
10
0Dir
ect V
AD
(10
6R
/a)
20
-1000 0 1000
Rainfall (mm/a)
10
0Dir
ect V
AD
(10
6R
/a)
20
Planned water available (Mm3)
Figure 30: Results 1: Figure illustrating results for scenarios A to D, with the dotted
boxes indicating the ranges which maintain the system in a desired state.
For the purposes of this dissertation, the key results of this case study
relate to how critical limits can be visualised using the Bayesian interface (as
shown in Figure 29 and Figure 30), and used to establish an idea of the
resilience of a system in a variety of different scenarios. Cross-sector driver
and response effects can be tested in a variety of scenarios, and the users of the
BPDA approach obtain an understanding of system behaviours, limits and
thresholds in a variety of circumstances, thus ‘getting a feel’ for system
resilience.
Univers
ity O
f Cap
e Tow
n

205
Scenario A - see Figure 6: All sector productivities at current value – evaluating current sensitivity of system to variations in annual rainfall given the current temperature scenario
Scenario B – see Figure 7: Sensitivity of system level productivity to rainfall under growth conditions where every sector except forestry has been increased by approximately 10% growth
Scenario C – see Figure 8: Sensitivity of water-intensive production (esp agriculture) to rainfall, with critical stable growth regimes approximately characterized, with average temperature increased by 4 degrees at roughly 10 percent growth in each sector except forestry
Scenario D – see Figure 9: Sensitivity of production to water availability in the catchment, with stability regimes generally characterized (i.e. with rough interpolation at roughly 10 percent growth in each sector (except forestry).
Y: DESIRED STABILITY RANGE FOR RESPONSE VARIABLE
X: CORRESPONDING STABILITY RANGE FOR DRIVER VARIABLE
COLUMN 1: IRRIGATED CROPS
SCENARIO B
SCENARIO C
SCENARIO D
SCENARIO A
0 500 1000 1500
1.0
0.5
0.0Dir
ect V
AD
(10
9R
/a)
1.0
0.5
0.0Dir
ect V
AD
(10
9R
/a)
0 500 1000 1500
0 500 1000 1500
1.0
0.5
0.0Dir
ect V
AD
(10
9R
/a)
-1000 0 1000
Rainfall (mm/a)1.0
0.5
0.0Dir
ect V
AD
(10
9R
/a)
Planned water available (Mm3)
Figure 31: Results 1 in Detail: Results of scenarios A to D, illustrated with hypothetical
desired ranges and thresholds within which system variables must remain in order to
provide provide system level stability.
The other significant aspects of this study are related to the new sub-
modules or embedded units that were introduced into the basic Bayesian
framework that has informed previous case studies.
6.4.1 Water-Based Household Informal and Subsistence Activities Module:
A study by de Mendiguren Castresana (2003) focussed on identifying
and quantifying the value add to water from household informal and
subsistence activities such as brewing, construction, hair salons, livestock
farming (goats and cattle), fruit and vegetable farming and ice block making.
Univers
ity O
f Cap
e Tow
n

206
In the effort to model cross-sector linkages pertaining to ecosystem benefit
flows between rural and urban areas composing Nelspruit magisterial district,
we made use of the de Mendiguren Castresana (2003).
The de Mendiguren Castresana study was conducted on the
Bushbuckridge area, which is located very near Mbombela, and is a very
similar to the densely populated rural areas in Mbombela. We formulated a
Bayesian model for the Mbombela Local Municipality (i.e. based on an
understanding of rural-urban households in Mbombela) to assess the benefit of
subsidising water to low-income households in order to promote household
and informal activity productivity. This provides a significantly different view
of water as a mechanism for poverty alleviation from that taken through a
‘trick-down economics’ view, where water is subsidized to large industries
and the socio-economic benefits are felt through employment and
remuneration, and creating a value chain of activities associated with the
primary industry.
In this case study, returns on water subsidized development schemes
for promoting resilience of rural-scale informal and household economies can
be compared with returns on water used in industry and farming (in terms of
employment and remuneration). The study found that given the profile of
rural and informal households in the Mbombela Local Municipality R7500 per
annum could be added per household for an average household water use
ranging from 20-30 m3.a-1. This translates to direct household earnings at low-
income levels of R800 million per annum for the Mbombela Local
Municipality, at a cost of 3.1 Mm3.a-1; a trivial cost in terms of the total water
use of Mbombela, which is around 350 Mm3.a-1
.
In the Mbombela Municipality Bayesian Model, the view enabled by
the household income module allows for trade-offs and benefits to be
considered at both top-down and bottom-up levels of decision-making
regarding how ecosystem benefits can be used to stimulate economy and
alleviate poverty. In one sense, a key benefit is being able to contemplate
Univers
ity O
f Cap
e Tow
n

207
assess interventions at different levels in the system, within and between
embedded units or sub-modules contained in the larger model.
6.4.2 Biodiversity Intactness Module:
We also developed a framework for biodiversity intactness index (BII)
based on a study conducted by Scholes & Biggs (2005), which showed how
biodiversity intactness could be estimated using expert elicited sensitivities
regarding land-use change types. We used this study to formulate a Bayesian
Biodiversity Intactness Module, and tested it in a range of scenarios. Each
land-use change scenario can potentially be related to a change in biodiversity
intactness. The usefulness of formulating this module in the case study is not
only in the analytical results obtained from it. The case study helped us
understand how expert opinion can be obtained and interpreted into the
Bayesian network for BII estimation by making use of conditional probability
tables (as shown and illustrated earlier in section 5.2.2 , and as explained in
5.2.3), resulting in a Bayesian framework that enables a multiplicity of
possible scenarios to be tested.
6.4.3 The Nelspruit Bayesian Model:
In order to test the scale-ability of the BPDA approach, we applied the
model framework to one of the constituent magisterial districts of the
Mbombela, namely; the magisterial district of Nelspruit. The same causal
structure that was used for Mbombela can be used for a smaller area of
decision-making and monitoring, i.e. the magisterial district level. We
intended to test whether the approach would prove useful at both larger and
smaller scales of integration. However, this proved to be a matter that was
more dependent on the ability of Bayesian network software to be able to cope
with massive scale-ability in models. However, funding limitations
constrained the study in pursuing a massive model, which linked the
magisterial district to the municipal level of decision making. The issue of
massive scale-ability is thoroughly addressed in the next case study, which is
Univers
ity O
f Cap
e Tow
n

208
the final and penultimate case study involving using Bayesian networks, in
this dissertation.
The overall learning engendered in this case study is summarised
below in Table 7.
Table 7: Critical Learning for BPDA Approach from Mbombela Case Study
Critical Learning
Points (BPDA)
Description
Cross-scale Here we adapt our understanding at the national scale to
formulate a model at the municipality scale. This is the scale
on which Integrated Development Plans (IDPs) are planned
and implemented in South Africa, and constitutes a critical
decision-making scale. Within this municipality scale model
we were also able to assess informal economic activities at the
household scale. We then formulated a model at the
Magisterial district scale, namely the Nelspruit Magisterial
District, with a view to linking these different scale models in
future research.
Cross-sector In this case study we explored how water-related ecosystem
benefit flows relates rural, per-urban and urban populations,
through the formal and informal economic sectors.
New Indices We formulated two new models; namely the informal
household economic activities module, and the biodiversity
intactness index module, thereby broadening the extent of
indices from the previous case study.
Resilience and
Adaptive Capacity
In this case study we derived critical limits and thresholds as
in the previous case study, and learnt that by establishing
these in a range of scenarios a characterisation and
understanding of system resilience could be obtained, in the
context of a variety of land-use and household adaptations.
Adaptability We also adapted the learning from previous studies to a new
context of inquiry. We were more concerned with
introducing indices through developing an understanding of
Univers
ity O
f Cap
e Tow
n

209
rural household level informal economics and BII, and with
agricultural and other land-use activities.
Decision Support We also showed that the BPDA approach can be employed to
assess various scales of decision-making and influence i.e.
municipality, magisterial district and household scales.
Univers
ity O
f Cap
e Tow
n
210
6.5 Province: Western Cape
The opportunity to deal with the issue of massive scale-ability of
Bayesian models, and their usefulness at large decision-making scales
emerged with this case study, which is the penultimate case study in which the
BPDA approach was fully applied. We learnt that the BPDA approach could
be implemented at massive scale, and could integrate across a wide range of
interdependent sectors. The project involved reviewing the climate change
strategy of the Western Cape Province in relation to other sub-sectoral
strategies (e.g. water, energy, transport, and a large range for formal and
informal economic sectors). The CSIR review team included Dr Alex
Weaver, Dr Mike Burns, Dr Michelle Audoin, Dr Willem de Lange, Ms
Josephine Musango and Dr David Le Maitre. The decision-makers included
from provincial government were; the director Mark Gordon, and deputy
directors Dr Dennis Laidler and Victor Nicholson. The various heads of
provincial government in other areas were also briefed, in presentations, of
recommendations that emerged as a result of the review.
In this case study we embarked upon a project to support decision-
making at the provincial scale, working with the Western Cape Government’s
Department of Environmental Assessment and Development Planning
(DEADP). The author was approached by DEADP to perform a review of
their recently finalised Climate Change Strategy and Action Plan for the
Western Cape (CCSAPWC, 2007), which identified adaptation and mitigation
response programmes, and particular focus areas as outlined in Table 8 below
(CCSAPWC, 2007). We proposed implementing the BPDA approach in
support of the review. The project involved a collaboration between the
author, as a senior researcher of the CSIR and Complex Adaptive Systems Pty
Ltd, a local research-based SME that built the software interface in earlier
collaborations with the CSIR. This collaboration was necessary in order to
develop the software to be able to handle a large number of variables and
Univers
ity O
f Cap
e Tow
n

211
embedded units in a single Bayesian model, and to ensure that the challenge of
massive scale-ability could be realised
The Western Cape Climate Change Strategy and Action Plan
(CCSAPWC, 2007) was the outcome of a large multidisciplinary study and
interactions between participants in a range of very large stakeholder
participation processes. The process that was followed in producing the
strategy attempted to solicit expertise, opinions and insight from as broad a
range of the private, public and civil society sectors. The main outcome of the
strategy was to establish adaptation and mitigation programmes with a range
of areas of focus, as outlined in Table 8. These areas of focus were
determined as those that would best address the key linkages and gaps in
knowledge that would bring about sustainable growth in the short, medium
and long-term.
Univers
ity O
f Cap
e Tow
n

212
Table 8 Description of Climate Change Adaptation and Mitigation Programmes Proposed by CCSAPWC (2008) Programme Type Name of Programme Focus Areas of Programme
Adaptation response
strategy and programmes:
Integrated Water Management
Programme:
1. Conserving wetlands, estuaries and rivers.
2. Establish and implement the ecological reserve.
3. Foster science/environmental/government dialogue.
4. Systems maintenance and repairs.
5. Strengthen resilience against 1:100 year drought.
6. Establish uninterrupted water conservancy targets.
7. Increase water efficiency through pricing strategies.
8. Research areas: demand, cost benefit of irrigation efficiency
and profitability.
Climate Change, weather
research and information
programme:
1. Weather stations.
2. Foster science/environmental/government dialogue.
3. Research irrigation efficiency.
4. Research pest sensitivity to climate change.
5. Increase number of Air Quality stations; integrate other data –
e.g. traffic.
Univers
ity O
f Cap
e Tow
n

213
Land Stewardship and
Livelihoods Programme:
Establish clear linkages between land stewardship, livelihoods and
the economy:
Land Stewardship:
1. Effective land usage and land care.
2. Protect, maintain and enhance natural resources.
Mitigation
response strategy
and programmes:
Energy, transport, waste and
air quality management
programme:
1. Reduce Carbon footprint.
2. Air quality monitoring.
3. Waste management, energy conversion and recycling
initiatives
4. Develop the provincial renewable resources.
5. Energy efficiency – drive targets, incentivise through
pricing strategies.
6. Develop provincial industry and innovations – electric
car, SWH, installation capacity.
7. Transport fuel replacement.
8. Household fuel replacement.
Univers
ity O
f Cap
e Tow
n

214
The concern that decision-makers expressed is that; (1) there were a
number of different proposed interventions and they desired a way of knowing
where to focus their efforts and funding to create impact, (2) they were
concerned with the alignment of the strategy with other provincial
departmental strategies and proposed interventions that were being
implemented, such as:
1. The Ikapa Growth and Development Strategy (IKAPA GDS,
2008),
2. The Sustainable Energy Strategy for the Western Cape (SESWC,
2007),
3. The Western Cape Sustainable Development Implementation Plan
(WCSSDIP, 2007), and
4. The Western Cape Water Supply Reconciliation Strategy Study
(WCWSSRSS, 2007).
A key challenge of this case study was to ensure that the alignment
between the focal areas of programmes proposed in the climate change
strategy (CCSAPWC, 2007) and various interventions proposed in the
abovementioned strategies (e.g. water and energy), could be tested in an
integrated modelling framework representing the Western Cape Province
system.
The sustainable energy strategy for the Western Cape (SESWC, 2007)
is but one strategy with which the climate change strategy (CCSAPWC, 2007)
must align, but it is presented here because it was of critical importance to the
climate change strategy (CCSAPWC, 2007). The energy strategy for the
Western Cape suggests a number of strategic interventions that could be used
in combination to reduce energy consumption and emissions from the various
sectors, as outlined in Table 9 below (SESWC, 2007). A number of energy
savings are proposed, which focus on savings in the transport, industrial,
commercial, governmental and residential sectors.
Univers
ity O
f Cap
e Tow
n

215
Table 9
Proposed Energy Savings Interventions Proposed in SESWC (2007)
Sector Energy Use (% of Total
Energy Consumption in
Western Cape)
Proposed Interventions (SESWC
2007)
Transport Uses 34 % of total energy
consumption
1. Model shift from private
(reduce by 25 %) to
public transport
(increased to 75 %).
2. Taxi shift to diesel (100
% of taxis).
3. Switch to Biodiesel: 15
% of diesel market.
Industry Uses 46 % of total energy
consumption, produces 48
% of emissions:
1. Energy efficiency.
2. Fuel Switching – half of
thermal energy to be
supplied by natural gas
instead of coal.
Commerce &
Government
4 % of total energy
consumption.
1. Lighting (CFL
replacement).
2. Heating Ventilation and
Cooling
Residential % of energy supply and
produces 15% of CO2
1. Solar Water Heaters: 15
% replacement.
emissions 2. CFL – 100%.
3. Energy efficient new
households.
Buildings Energy efficiency of
buildings e.g. ceilings
No clear proposed interventions
Univers
ity O
f Cap
e Tow
n

216
Of key concern to the implementation programmes proposed in the
western cape climate change strategy and action plan (CCSAPWC, 2008) is
whether the proposed savings as outlined in the sustainable energy strategy of
the Western Cape (SESWC, 2007) are aligned, or will act in a complementary
way.
The proposed interventions are shown in Table 9. The energy strategy
also proposes options for increasing the energy supply of the Western Cape:
1. Coal generated electricity.
2. Nuclear Energy.
3. Natural Gas.
4. Wind energy.
5. Biomass.
6. Solar radiation.
7. Wave power.
8. Waste.
9. Hydropower.
Another critical concern revolved around the fundamental assumptions
made in supporting studies of the CCSAPWC (2008) regarding climate change
effects, and how they would unfold in the short and medium terms. As
mentioned before, global climate change models make projections for 2099, as
that is the resolution at which they are currently capable of providing reliable
sensitivity at for global and regional climate change simulations. The
economic projections used in formulating the CCSAPWC (2008) were based
on a linear projection, backwards from 2099, of climate change effects such as
changes in rainfall and temperature. As acknowledged by the IPCC (2008)
such linear projections are unlikely to provide reliable and resilient human
adaptations in the short and medium term. This is because more drastic
changes and higher variability generally characterise the forecasted trends that
global climate change models show in future scenarios (IPCC, 2008).
Univers
ity O
f Cap
e Tow
n
217
Therefore, it was necessary to test the resilience of growth and
development in the Western Cape Province over a range of climate change
scenarios, instead of basing an understanding of resilience on a simple linear
regression of trends, backward from 2099.
Two processes, which form the core of the BPDA approach proposed
in this dissertation, were tested in this penultimate case study, namely; (1)
participatory processes between decision-makers and cross-disciplinary
research groups, and (2) model-based integration across disciplines, sectors,
programmes and strategic foci of respective strategies.
We conducted a review process, which included participatory process
facilitation with both decision-makers and cross-disciplinary researchers. The
review process, which included a series of workshops with and between
decision-makers and researchers, is shown in Figure 32. The DEADP
provincial government decision-makers played a role in the model
development and verification at various stages of the review. The general
focus of outcomes of the review focus on; (1) identifying gaps in knowledge,
information and data about critical linkages (especially cross-sector) in the
Western Cape Province, and (2) evaluating whether the emphasis of the
strategic adaptation and mitigation programmes that have been set in place, is
appropriately focussed on linkages that will make the desired impact on
sustainability of growth, development and ecological integrity in the Western
Cape Province.
Univ
ersity
Of C
ape T
own

218
/ Figure 32: BPDA Review Process Western Cape: The process undertaken to perform the
review, which involved a series of client consultations and review team workshops.
The Western Cape Bayesian Model is shown in broad outline in Figure
33. The model extends the models formulated in previous case studies to
include a wide variety of diverse sectors of the Western Cape Province, and at
various levels of detail. These include; irrigated and dryland agriculture,
livestock, tourism, transport, informal and SMME sector, construction,
manufacturing, water-based household subsistence and informal activities,
transport, energy and water. Some of these modules have been included in
Appendix C, so that the reader can conveniently familiarise themselves with
the illustrations while reading the text.
We made use of known sector productivities for 2004-2005 were used
to establish a core set of measures of performance for each of these sectors.
The top system level measures of performance of the model include; noxious
gases (VOC, PM10, PM2.5, SO2, NOX), solid waste, CO2 emissions, water
and energy consumption, Gross Domestic Product (GDP), Gross Geographic
Process Description
SCOPE OF REVIEW
DATA COLLECTION
& MODEL FORMULATION
CONSENSUS &
AGREEMENT DESIGN OF
EXPERIMENT
SENSITIVITY ANALYSIS RESULTS REVIEW
IDENTIFY GAPS: KNOWLEDGE,
INFORMATION, DATA, AREAS OF EMPHASIS &
INTERVENTIONS
EVALUATE EMPHASIS OF STRATEGIC PROGRAMMES
Univers
ity O
f Cap
e Tow
n
219
Product (GGP) and Employment. These are formulated according to the
classes in which the information was obtained, and therefore involves a degree
of aggregation. However, reliable information was available regarding
historical and current ratios and expert judgement was employed in verifying
these aggregations.
Irrigated and dryland agriculture modules were formulated in order to
assess their water use levels in different scenarios, value add to water per crop
type and yield, and total value add per crop type and yield. Crop yields are
constrained to be sensitive to their water requirements by a generalised
relationship, and will not meet full production under less than optimal water
supply conditions (or alternatively, excessive water saturation conditions).
The total hectares’ under agricultural cultivation is set to current levels.
Energy use for irrigation constitutes a significant share of farm-scale expenses
and is also calculated in the model.
The livestock, tourism, informal and SMME sector, construction and
manufacturing modules, were formulated according to the level of aggregated
data available on the sector, and what was available in the literature at the
time.
The water and energy modules constitute the core modules around
which all other sectors were integrated in formulating the Western Cape
Bayesian Model. The information and data sources used to populate the water
and energy modules include a wide variety of known data and embedded sub-
modules to assess for example; savings options, the impact of changes in
climate related variables on water and energy.
The Bayesian energy module calculates the electrical energy
production of the Western Cape according to a permutation of a range of
productions options ranging from coal, new coal, nuclear, new nuclear,
PBMR, gas turbine, wind, ocean, solar to wind energy production. It also
Univers
ity O
f Cap
e Tow
n

220
takes into account backup options, savings in demand side management
measures and household fuel replacement.
The water module aggregates the water supply over the entire Western
Cape, a cumulative aggregation of catchments within the Western Cape. The
water availability module is largely generic, and contains a variety of drivers,
of which average rainfall and temperature are mainly used.
Lastly, the transport module was formulated and populated according
to the availability of reliable information regarding; the number of vehicles,
their average mileage per annum, and associated emissions, depending on the
type of fuel used (petrol or diesel). The transport module also allows some of
the transport sector emissions savings actions to be tested, such as fuel
switching and passenger switching, respectively.
Current state of electricity production includes savings from adaptation
measures, and with mitigation and backup options.
To summarise, the system level measures of performance included in
the Western Cape Bayesian Model includes the following top-level measures
of performance (see Appendix C for detailed illustrations of embedded units or
sub-systems):
1. GDP,
2. GGP,
3. Employment & unemployment,
4. CO2
5. Noxious gas emissions (NOX, VOC, SO2, etc.),
emissions,
6. GHG emissions,
7. Water use and potential for savings,
8. Energy use and potential for savings,
9. Household informal and subsistence activities,
10. Pollution and waste loads (solid and air),
11. Biodiversity intactness index (heuristic)
Univers
ity O
f Cap
e Tow
n

221
Significant sub-system level measures of performance include:
• Planned water abstraction and storage, and,
• Water Module: Including evaporation losses - from mean
annual runoff (MAR) and dams.
The sub-system level drivers, contained within embedded units that are
catered for in the model are indeed numerous in the case of each module and
may be viewed in more detail Appendix C.
It is worth noting that a linear extrapolation between water and energy
deficit in production when compared to demand, is used to determine losses to
sectors. This broad simplification is used to illustrate the extent of variation
that occurs, rather than to predict actual measures (for example, exactly how
much GDP might reduce as a consequence of water and energy shortages).
The climate change scenarios conducted in this case study are
consistent with the linear projections adopted in the CCSAPWC (2007), and in
the growth scenarios adopted in IPCC (2008) predictions.
We take linear projections as a point of departure from which
variations should be assessed. Since we are more concerned with the variation
in the supply and demand of energy, the value of such an analysis is in
estimating the impact of water and energy shortages, in this case, with linear
projections serving as a baseline for analysis.
Univers
ity O
f Cap
e Tow
n

222
BIODIVERSITY INTACTNESS INDEX
LIVESTOCK MODULEIRRIGATED AGRICULTURE MODULE ONE
IRRIGATED AGRICULTURE MODULE TWO
DRYLAND AGRICULTURE MODULE TWO
ENERGY PRODUCTION AND SAVINGS MODULE
CLIMATE CHANGE AND WATER STORAGE MODULE
HOUSEHOLD SUBSISTENCE & INFORMAL ACTIVITIES
TOURISM MODULE
CONSTRUCTION MODULE
INFORMAL AND SMME SECTOR
MANUFACTURING MODULE
TRANSPORT MODULE
PRODUCTIVITY OF SECTORS MODULE
HOUSEHOLD SUBSISTENCE & INFORMAL ACTIVITIES
UNEMP MODULE
ENERGY CONSUMPTION,
CO2 EMISSIONS & WATER USE MODULE MODULE
GGP MODULE
GDP MODULE
NOXIOUS GASES, SOLID WASTE
INTERNAL VERIFICATION MODULE: ENERGY USE AND EMISSIONS
FORESTRY, INDUSTRY AND MINING
Figure 33: Illustration of Modules in the Western Cape Bayesian Model (CSIR & CAS Pty Ltd): Selected module causal maps shown in
Appendix B.
Univers
ity O
f Cap
e Tow
n

223
The Bayesian model was formulated to evaluate the following areas of
concern, paraphrased from the Review of the Western Cape Climate Change
Strategy & Action Plan (RCCSAPWC, Peter, 2008):
1. Establishing an integrated understanding of the ‘current’ or
baseline state of the Western Cape Provincial system based on
2003-2005 statistics. This scenario forms the baseline for
comparison for the scenarios that reflect growth within sectors
constituting the Western Cape Province socio-economic base.
2. Evaluating water and energy sector related limitations of the
Western Cape Province in scenarios with equal growth of sectors
(i.e. all sectors except agriculture, forestry and fishing).
3. Evaluating scenarios that reflect lower levels of growth than at the
levels projected by supporting studies of growth (guidelines were
drawn RCCSAPWC (Peter, 2008), and from information used as
guidelines from source material (which includes: WCTT, 2005;
WCTB, 2007; SESWC, 2007; TSB, 2005/6; WCSER, 2003;
IKAPA GDS, 2008; WCWSSRSS, 2007). These were discussed
and reviewed by the review team and in consultations with
DEADP.
4. Evaluating scenarios that grow sectors at approximately the same
levels as projected by supporting studies of growth in the short
term (5 years), but decreased from short term growth projections in
the medium (10 years) and long term scenarios (guidelines were
drawn from source material in: WCTT, 2005; WCTB, 2007;
SESWC, 2007; TSB, 2005/6; WCSER, 2003; IKAPA GDS, 2008;
WCWSSRSS, 2007; CCSAPWC, 2007). These were discussed
and reviewed by the review team and in consultations with
DEADP.”
5. Evaluating the sensitivity of the water availability to the Western
Cape provincial system to increases in temperature across different
rainfall ranges as outlined in the climate change strategy and action
plan (CCSAPWC, 2007), based on projections from global climate
Univers
ity O
f Cap
e Tow
n

224
change models published by the International Panel for Climate
Change (IPCC, 2008).
6. Testing the potential of combining backup electricity production
alternatives and demand side management of electricity such as
residential electricity use in the Western Cape.
7. Testing different energy production scenarios i.e. combinations of
renewable and no-renewable energy production strategies for short,
medium and long term stability of the Western Cape provincial
system.
8. Testing the sensitivity of these energy production scenarios to
temperature induced transmission losses on lines that range about
1800km away from the Western Cape, using an average loss
estimate of 10% (losses vary between 8-20%; CCSAPWC, 2007).
9. Testing transport fuel use and emission savings options against
short, medium and long term growth scenarios for the transport
sector. The savings options include, switching fuel use to diesel, a
possible switch from private to public transportation.
10. Testing household income for informal and rural households
generated through water-based informal and subsistence household
activity income generation activities such as hair salons, fruit trees,
vegetable cultivation, brewing).
11. Tourism – assess possible growth of tourism sector.
12. Agriculture - identify efficiency measures and possible growth
strategies.
The results of this study are too long to be shown in complete detail in
this dissertation. Key excerpts from the RCCSAPWC (2008), containing a
detailed description of scenarios and general descriptions of results are
outlined in Appendix A
The full results of this study can be viewed by the reader in the Review
of the Western Cape Climate Change Strategy and Action Plan (RCCSAPWC,
2008), and are too elaborate and detailed to be presented in this dissertation in
Univers
ity O
f Cap
e Tow
n

225
full. Rather, the results of the study are summarised in this section, as they are
outlined in (RCCSAPWC, 2008).
The scenarios conducted for the study were both intended to test limits
and to identify levels of water and energy savings that will be required for
growth in the future, if the current strategy is pursued. This can then be
compared against IPCC rainfall reductions and temperature variations, and
used as a basis for discussion, interactively in the workshops.
6.5.1 Description of General Scenarios A- I
The study first assessed the current, baseline conditions and used this
to verify the constraints of the Western Cape Bayesian Model. We then
assessed system level responses to a range of possible growth trajectories (90-
130%) associated with each variable. Thereafter we evaluated different
combinations of growth in different sectors; in order to find out which
combinations of sectoral growth conditions provide resilience to climate
change effects. This was conducted in a fashion similar to that conducted in
the previous case study (i.e. the Mbombela case study).
Scenarios A-I (see Table 10) deal with a range of short, medium and
long-term scenarios that were chosen after many model runs to test various
assumptions in the western cape climate change strategy (CCSAPWC, 2008)
about the emphasis of programmes, interventions and the future sustainability
of the Western Cape Province. Projected growth scenarios were drawn from a
number of studies and from expert judgements, and climate change scenarios
were aligned to the scenarios results of GCM models as published by the
International Panel for Climate Change (IPCC, 2008). Scenarios A-I are
described briefly in Table 10. These descriptions are elaborately detailed in
Table 11, and the results of scenarios A-I are presented in Table 12.
Univers
ity O
f Cap
e Tow
n

226
Table 10
Description of Scenarios A - I: Western Cape Province (excerpts from RCCSAPWC 2008)
A Short term growth per annum –
5yrs. Growth of Tertiary Sectors
(% growth from current values).
Finance, real estate and business, Tourism, Informal sector and SMMEs, construction
and manufacturing are the lead growth sectors. Other sectors (e.g. agriculture) are
left at 0 or 1% growth from current growth.
B Short term– 5yrs. Growth of
tertiary, agro-forestry,
manufacturing and other sectors.
This scenario is the same as scenario A, except that agriculture, forestry and fishing
and other producers is grown by 5% from its current value.
C Short term growth– 5yrs. Growth as in scenario B with 5% decrease in agro-forestry and fishing (i.e. more
water and energy efficient) (% growth from current values).
D D: Short term growth– 5yrs. Scenario D: Growth as in scenario C with additional 5% decrease in alien plant cover
(which results in additional water savings to the system).
F F: Short term growth – 5yrs. Scenario F: Higher short term growth of selected sectors with 15% alien plant cover
removal, agroforestry water and energy efficiency reduced by 15% (% growth from
current values), and mining reduced by 5%.
Univers
ity O
f Cap
e Tow
n

227
G G: Medium term projected
growth 10yrs.
Scenario G: Growth of tertiary sectors increased to almost double the short term
growth levels, with agro-forestry efficiencies implemented in scenario F; alien plant
clearance increased to 15%, and agriculture, forestry and fishing decreased by 15%, ,
and mining reduced by 5%; resulting in more water and energy savings in the
medium to long-term.
H Long term growth per annum –
20yrs (% growth from current
values).
Growth of tertiary sectors and general govt increased substantially to represent long-
term growth. Savings are the same as in scenario G (aliens, agroforestry and fishing,
and mining).
I Long term growth per annum –
Scenario I 20 yrs (% growth
from current values).
Increase growth substantially from scenario H: including general govt, community,
social and personal services, construction and household income.
Univers
ity O
f Cap
e Tow
n

228
Table 11:
Specifications for Short, Medium and Long-Term Growth of Tertiary Sectors - Estimated Conservatively from Projected Growth Levels SCENARIO A B C D F G H I
SECTOR
PRODUCTIVITY
DRIVERS
(% growth from
current values)
Short term
growth per
annum –
5yrs:
Scenario A:
Growth of
Tertiary
Sectors
(% growth
from
current
values)
Short term–
5yrs:
Scenario B:
Growth of
tertiary,
agro-
forestry,
manufactur
ing and
other
sectors
(% growth
from
current
values)
Short term
growth– 5yrs:
Scenario C:
Growth as in
scenario B with
5% decrease in
agro-forestry
and other
sectors (i.e.
more water
and energy
efficient)
(% growth
from current
values)
Short term
growth–
5yrs:
Scenario D:
Growth as
in scenario
C with 5%
decrease in
alien plant
cover (%
growth
from
current
values)
Short term
growth – 5yrs:
Scenario F:
Higher short
term growth of
selected sectors
with 20% alien
plant cover
removal and
agro-forestry
water and
energy
efficiency
reduced by
15% (%
growth from
current values)
Medium term
projected growth
10yrs: Scenario
G: Growth of
tertiary sectors
with agro-
forestry
efficiencies
implemented in
scenario F (%
growth from
current values).
Long term
growth per
annum –
Scenario H 20yrs
(% growth from
current values)
Long term
growth per
annum –
Scenario I
20yrs(% growth
from current
values)
HOUSEHOLD
INCOME
9 9 9 9 9 9 22.5 47.5
FINANCE, REAL 37.5 37.5 37.5 37.5 22.5 47.5 95 95
Univers
ity O
f Cap
e Tow
n

229
ESTATE AND
BUSINESS
TOURISM 32.5 32.5 32.5 32.5 17.5 42.5 95 95
INFORMAL
SECTOR &
SMMES
22.5 22.5 22.5 22.5 22.5 42.5 95 95
TRANSPORT 22.5 22.5 22.5 22.5 7 7 17.5 17.5
CONSTRUCTION 37.5 37.5 37.5 37.5 9 17.5 32.5 47.5
MANUFACTURIN
G
17.5 17.5 17.5 17.5 22.5 22.5 55 75
WATER &
ELECTRICITY
1 1 1 1 1 5 9 9
AGRICULTURE,
FORESTRY &
FISHING
Initial State:
0
5 -5 -5 -15 -15 -15 -15
AGRICULTURE 1 5 -5 -5 -15 -15 -15 -15
FORESTRY 1 5 -5 -5 -15 -15 -15 -15
OTHER
PRODUCERS
1 5 5 5 Initial State: 0 Initial State: 0 Initial State: 0 Initial State: 0
GENERAL
GOVERNMENT
Initial State:
0
Initial State:
0
Initial State: 0 Initial State:
0
5 9 17.5 47.5
COMMUNITY,
SOCIAL &
PERSONAL
SERVICES
Initial State:
0
Initial State:
0
Initial State: 0 Initial State:
0
Initial State: 0 Initial State: 0 17.5 47.5
MINING Initial State: Initial State: Initial State: 0 Initial State: -5 -5 -5 0
Univers
ity O
f Cap
e Tow
n

230
0 0 0
ALIEN PLANT
COVER
Initial State:
0
Initial State:
0
Initial State: 0 -5 -15 -15 -15 -55
TAXES LESS
SUBSIDIES ON
PRODUCTS
Initial State:
0
Initial State:
0
Initial State: 0 Initial State:
0
Initial State: 0 Initial State: 0 Initial State: 0 17.5
Univers
ity O
f Cap
e Tow
n

231
6.5.2 Results for Projected Short, Medium and Long Term Growth Scenarios A - I
The results for short, medium and long-term growth projections are
shown in Table 12. These scenarios were both intended to test limits and to
identify levels of water and energy savings that will be required for growth in
the future, if the current strategy is pursued and forecasted levels of growth
become a reality. This can then be compared against IPCC rainfall reductions
and temperature variations, and was used as a basis for discussion,
interactively in the review workshops. This is shown in more detail in Table
14 in (RCCSAPWC, 2008).
Univers
ity O
f Cap
e Tow
n

232
Table 12: Western Cape Province: Results for Scenarios A-I Scenario Sector Configuration for Scenario
A In this scenario, GDP growth is expected to increase from approximately R199Bn to R243.7Bn (roughly 22.5%
increase from current GDP), but water and electricity supply (which contains both current energy supply
limitations and the contribution of projected energy savings and demand side management interventions) is too
low to maintain expected growth, and will affect GDP adversely. Without any additional interventions or
demand side adaptation to water and energy shortages, whether from the consumer, business owner, industry or
government, growth will not be possible under current conditions.
Water use is between 2444-2580 Mm3a-1
Energy use is between 78.706-83.078Bn kwha
, approximately 15% more than currently provided.
• Electricity required is 24.59-25.95Bn kwha
-1 -1
, approximately 19% more than current capacity, including
projected energy related savings and backup power options, can provide.
B Same as scenario C, with increase in agriculture, forestry and fishing activities.
GDP is approximately around R224.7Bn.
Water use increases to between 2580-2715 Mm3a-1
Energy use is between 78.705Bn kwha
, approximately 17% more than currently provided.
• Electricity required between 24.59-25.95 kwha
-1 -1, approximately 19% more than current capacity,
Univers
ity O
f Cap
e Tow
n

233
including projected energy related savings and backup power options, can provide.
C Growth as in scenario B with 5% decrease in agriculture, forestry and fishing.
The reduction in these sectors is intended to reflect savings in energy and water use through greater efficiency
(i.e. resulting in 5% savings, rather than just a simple decrease in production. The agricultural sector, in
particular, will show great sensitivity to climate change effects on water supply, and efficiency measures will
have to be taken, in any event, in the long-term, to preserve the value and contribution of the agricultural sector
to employment and export of produce in the Western Cape, but it’s water dependence will require resilience in
the long term in through adaptation and mitigation measures towards more efficient water use in agriculture
and forestry activities..
GDP remains unchanged from scenario B.
Water required/use decreases to between 2308 Mm3a-1-2444 Mm3a-1
Energy usage and electricity requirement is approximately the same as in scenario B.
due to savings. 8% less water is
currently produced in the system than is required.
D Growth as in scenario C with 5% decrease in alien plant cover (percentage growth from current values).
Growth as in scenario C with 5% decrease in agriculture, forestry and fishing and 5% clearance of alien plants.
Energy usage and electricity requirement remains unchanged.
Water use remains largely unchanged, with alien plant clearance as an intervention. It stands to reason that the
Univers
ity O
f Cap
e Tow
n

234
alien plant clearance programme alone will not provide sufficient water savings in the short term under
scenarios A-D.
F In this scenario, more even growth of sectors, with higher savings from agriculture, forestry and fishing, and
alien plant clearance programmes. Higher short term growth of selected sectors (manufacturing, informal
sectors and SMES) and lower short term growth in finance, insurance, real estate and business and tourism,
with 20% alien plant cover removal and agro-forestry water and energy efficiency reduced by 15% (percentage
growth from current values).
Both energy and water use is significantly decreased in this approach:
Water required (~2172 Mm3a-1) is brought within range of current water available in the
system (2200 Mm3a-1
Electricity required (~21.86-23.22Bn kwha
). -1
).
G Growth of tertiary sectors with agro-forestry efficiencies implemented in scenario F (% growth from current
values).
Water use lies between 2172-2308 Mm3a
Electricity requirement lies between 23.22-24.59Bn kwha
-1
-1
H Long term growth of tertiary sectors with 15% water and energy efficiency imposed on agriculture and
forestry, and 15% alien plant clearance
Univers
ity O
f Cap
e Tow
n

235
Projected GDP lies between R249.9Bn-R265.25Bn, approximately 30% increase in GDP from current value.
Water use remains low, between 2172-2308 Mm3a
Electricity requirement lies between 25.96.22-27.32Bn kwha
-1
This long-term scenario is achievable as its water and energy requirements can foreseeably be met in the
future.
-1
I Long term growth of tertiary sectors with 15% water and energy efficiency imposed on agriculture and
forestry, and 55% alien plant clearance.
Projected GDP lies between R312.85Bn-R325.44Bn, approximately 30% increase in GDP from current value.
Water use remains low, between 2172-2308 Mm3a
Electricity requirement lies between 25.96-27.32Bn kwha
-1 -1
Univers
ity O
f Cap
e Tow
n

236
6.5.3 Description: Short Term (Less Growth) Scenarios
Towards the end of this case study, the global financial collapse of
2008 occurred. This brought the projected growth scenarios being considered
by the study into question. For the ‘less growth’ scenarios, the rates of growth
into the short term future were generally reduced, as sustained growth of high
performing sectors at their current levels cannot be assured in the current 2009
global financial crisis. Rather, lower estimates of growth were used, in order
to help explore how short term growth targets may be achieved in limited
growth scenarios. The purpose of introducing these scenarios into the study
were to adapt the study to the changing real-world context with which it was
concerned, to address the feasibility of lower levels of growth than expected.
By effecting changes midway through the execution of the project, the
flexibility of the BPDA approach is also tested in a real-world decision-
making context, where significant changes can occur at any time that require
re-formulating and adapting an implementation strategy.
Three scenarios, referred to as “B LESS GROWTH, C LESS
GROWTH and D LESS GROWTH”, explore possible scenarios for
development with savings in agriculture and alien plant removal. Current state
of electricity production includes savings from adaptation measures, and with
mitigation and backup options. The specifications of B LESS GROWTH, C
LESS GROWTH and D LESS GROWTH in the short term (5yrs) are shown
briefly in Table 13 and in elaborate detail in Table 14, while the results are
recorded in Table 15 (excerpts from RCCSAPWC 2008).
Univers
ity O
f Cap
e Tow
n

237
Table 13:
Less Growth Scenario Brief Descriptions
SCENARIO DESCRIPTION
B LESS
GROWTH
B LESS GROWTH: Lower rates of overall growth in the short term in tertiary, agro-forestry and manufacturing
sectors – intended to probe system limits to low growth. In this scenario, finance & investment, manufacturing and
construction lead growth while agriculture, forestry and fishing are grown by 5%.
C LESS
GROWTH
C LESS GROWTH: Lower rates of overall growth as in scenario B with 5% decrease in agro-forestry and 5 %
decrease in alien plant cover. In this scenario, by lowering the productivity of agro-forestry and fishing, and
reducing alien plant cover by 5%, less water and energy is used in the system, and is reflected in the energy
produced/energy required ratios in the tables. This does not imply that agriculture should be curtailed in
production, but rather that more efficient methods of water and energy use in this sector could have major impact
on the other water and energy dependent sectors. GDP, GGP and employment ‘after’ measurements are therefore
lower estimates too.
D LESS
GROWTH
D LESS GROWTH: Growth as in scenario C LESS GROWTH with 15% decrease in agriculture productivity and
15% decrease in alien plant cover. Again, this reduction is intended to reflect possible savings in water that could
be achieved through increasing efficiency of agricultural water use and alien plant clearance programmes in the
short term.
Univers
ity O
f Cap
e Tow
n

238
Table 14
Detailed Specifications for Short Term Growth of Tertiary Sectors, at Much Less than Projected Growth Levels. SCENARIO B LESS GROWTH C LESS GROWTH D LESS GROWTH
SECTOR
PRODUCTIVITY
DRIVERS
(% growth from current
values)
Short term– 5yrs:
Scenario B: Lower rates of
overall growth in short term:
tertiary, agro-forestry,
manufacturing and other
sectors
(% growth from current
values)
Short term growth– 5yrs:
Scenario C: Lower rates of
overall growth as in scenario
B with 5% decrease in agro-
forestry and 5% decrease in
alien plant cover (i.e. more
water and energy efficient
system)
(% growth from current
values)
Short term growth– 5yrs:
Scenario D: Growth as in
scenario C
with 15% decrease in agriculture
(or water and energy use of
agriculture)
and alien plant cover (% growth
from
current values)
HOUSEHOLD INCOME 9 9 9
FINANCE, REAL
ESTATE AND BUSINESS
17.5 17.5 17.5
TOURISM 7 7 7
INFORMAL SECTOR &
SMMES
7 5 7
TRANSPORT 7 7 7
CONSTRUCTION 9 9 9
MANUFACTURING 17.5 17.5 17.5
WATER & 1 1 1
Univers
ity O
f Cap
e Tow
n

239
ELECTRICITY
AGRICULTURE,
FORESTRY & FISHING
5 -7 -15
AGRICULTURE 5 -5 -15
FORESTRY 5 -5 -15
OTHER PRODUCERS 5 5 5
GENERAL
GOVERNMENT
1 1 1
COMMUNITY, SOCIAL
& PERSONAL
SERVICES
5 5 5
MINING Initial State: 0 Initial State: 0 Initial State: 0
ALIEN PLANT COVER 1 -5 -15
TAXES LESS SUBSIDIES
ON PRODUCTS
Initial State: 0 Initial State: 0 Initial State: 0
Univers
ity O
f Cap
e Tow
n

240
6.5.4 Results: Projected Short Term “Less-Growth” Trajectories
The results indicate that 5% water and energy efficiency in agriculture
combined with alien plant clearance can provide a significant proportion of the
required water savings in the short term, while a 10-15% savings in agriculture
in combination with alien plant clearance programmes will increase the
resilience of the system to water supply, under current rainfall and temperature
conditions.
Univers
ity O
f Cap
e Tow
n

241
Table 15:
Results for Less Growth Scenario Brief Descriptions
SCENARIO DESCRIPTION
B LESS
GROWTH
In this scenario, water use (~2,580,137,000 Mm3a-1) is significantly more than the available water (2,200,000,000
Mm3a-1
), and only 85% of water requirements can be met, while 96% of energy requirements can be met.
C LESS
GROWTH
Lower rates of overall growth as in scenario B with 5% decrease in agro-forestry and 5 % decrease in alien plant cover.
In this scenario, by lowering the productivity of agro-forestry and fishing, and reducing alien plant cover by 5%, less
water (92% of requirements met) and energy (96% of requirements met) is used in the system, and is reflected in the
energy produced/energy required ratios in the tables. This does not imply that agriculture should be curtailed in
production, but rather that more efficient methods of water and energy use in this sector could have major impact on the
other water and energy dependent sectors. GDP, GGP and employment ‘after’ measurements are therefore lower
estimates too.
D LESS
GROWTH
Growth as in scenario C LESS GROWTH with 15% decrease in agriculture productivity and 15% decrease in alien
plant cover. Water requirements are met up to 98%, while 96% of energy requirements are met.
Univers
ity O
f Cap
e Tow
n

242
6.5.5 Determining Climate Change Related Thresholds on Provincial Multi-Sector Growth
The results shown in Table 16, show thresholds for water and energy
usage in various scenarios, which allows us to assess and discuss the possible
impacts of projected climate change effects in the future as prescribed in GCM
models (IPCC, 2008). As temperature is increased, the average rainfall
required to meet the desired production increases. This is shown in Table 16,
where in each new row the temperature is raised by 1 degree Celsius. The
effectiveness of the Berg water management scheme has been assessed (results
not shown here, but included in CD of results), but showed no significant
improved resilience to climate changes in rainfall and temperature. Overall
the model indicates that a change of just 1 degree Celsius (average
temperature) significantly affects the water available to the Western Cape, due
to high evaporation rates, and the large amounts of dammed water that might
be necessary to meet future demand.
Univers
ity O
f Cap
e Tow
n

243
Table 16:
Total Water Available Measured by 3 Output Variables at Current to Increasing Temperatures, over the Rainfall Range 0-1100mm Per
Annum
Initial State: R varied, T = 21 deg C
Univers
ity O
f Cap
e Tow
n
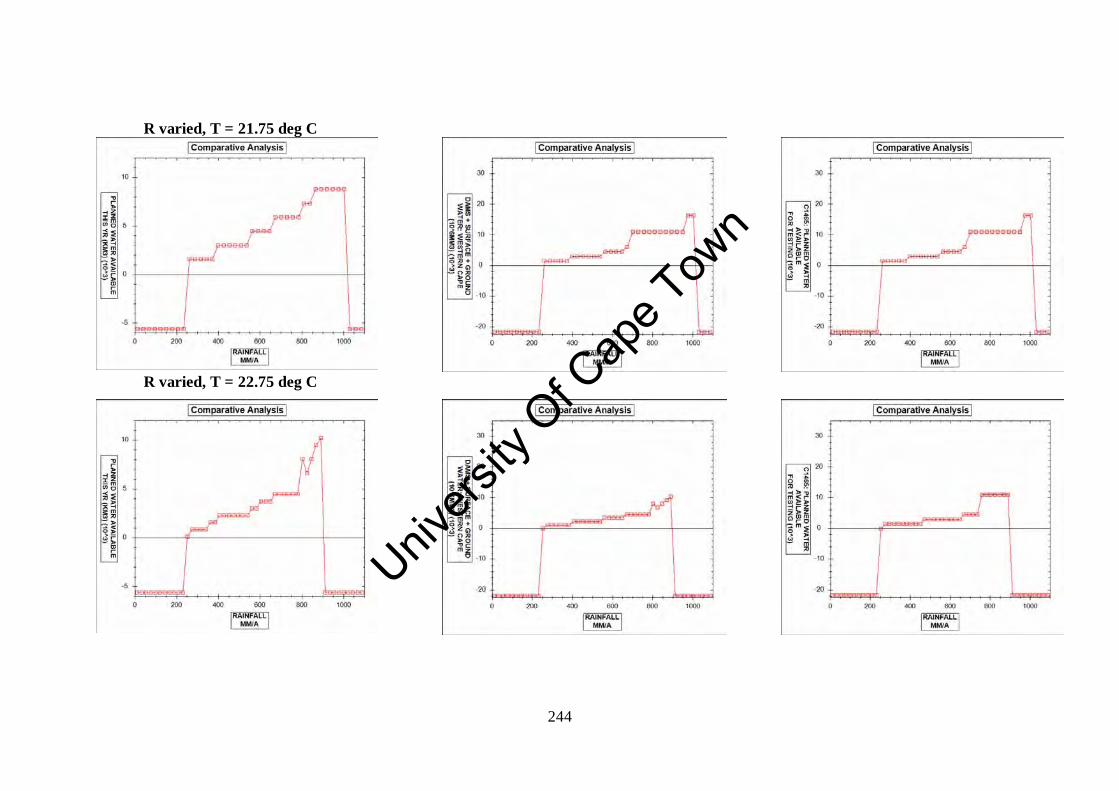
244
R varied, T = 21.75 deg C
R varied, T = 22.75 deg C
Univers
ity O
f Cap
e Tow
n

245
R varied, T = 23.75 deg C
R varied, T = 24.75 deg C
Univers
ity O
f Cap
e Tow
n

246
R varied, T = 25.75 deg C
R varied, T = 26.75 deg C
Univers
ity O
f Cap
e Tow
n

247
Example: Crop Sensitivity
Univers
ity O
f Cap
e Tow
n

248
6.5.6 General Results Summary: Western Cape Study
As already mentioned, these results are presented in detail in
Table 14 in the review of the Western Cape climate change strategy and action
plan (RCCSAPWC, 2008). Please refer to this report for more detailed
analysis and discussion. We summarise the results from this report in this
section, as outlined below.
6.5.6.1 Summary of Water Use
Water use can be brought within range of current water
availability if efficiency interventions in agriculture and alien plant removal
are implemented. The vulnerability of current water availability to climate
change effects deserves continued attention and monitoring. In the long-term,
water use can be brought within range of current water availability limits, as
shown in scenarios A-I but this requires that the linear growth trend in water
demand be met with appropriate interventions to prevent growth.
To some degree this aim can be met by water use efficiency
increases that have been identified and suggested in the climate strategy (e.g.
savings in the residential, commerce, industry and government sectors) in the
short term. However, medium and long term savings would require that
continual improvement of water use efficiency becomes a part of strategic
planning of sectors and legacy equipment and infrastructure replacement and
upgrade programmes. This is already the case for the City of Cape Town
(CCT). Most reviewers were of the opinion that efficiency management
constitutes a temporary solution and that growth in demand will eventually
cancel efficiency gains, so a programme of continual, iterative efficiency
improvement across all sectors is necessary in the medium to long term future.
Univers
ity O
f Cap
e Tow
n

249
In most of the scenarios (A-I) considered in this review, the
order of water users from largest to smallest is agricultural, urban, alien and
afforestation related water use. Agricultural and urban water use are the
largest, but agricultural water use is approximately double that of urban water
use. This is the case for all catchments in the Western Cape apart from the
Berg water catchment; where urban use of water outstrips agricultural use.
The pressing issue concerning urban water use is that potable water is required
for human use in the residential, commercial and industrial sectors.
Population increase may increase water demand and the need for wastewater
treatment plants, should adverse water supply conditions occur due to climate
related changes in rainfall and temperature.
6.5.6.2 Summary of Energy Use
In most of the scenarios (A-I: considered in this review, the
order of energy users from largest to smallest is industrial, transport,
residential, agriculture and mining energy use. Total energy use ranges from
69.91Bn kwha-1 - 87.45Bn kwha-1
. F is the lowest energy usage scenario in
the long-term.
As far as energy is concerned, industry and transport are the
biggest energy users in all scenarios, but residential energy use levels are
significantly high and the residential sector is a good candidate for mitigation
and adaptation measures to save energy to be taken up. The growth of the
provincial economy (which is especially dependent on industry and tertiary
sector development in the future) might be severely adversely affected by
energy shortages.
To some degree, required savings can be met by energy use
efficiency measures that have been identified and suggested (e.g. savings in
the residential, transport, commerce, industry and government sectors) in the
short term. However, medium and long term savings would require that
continual improvement of energy use efficiency becomes a part of strategic
Univers
ity O
f Cap
e Tow
n
250
planning of sectors and legacy equipment and infrastructure replacement and
upgrade programmes. To some degree, energy efficiency of current
technologies look set to increase, as energy and fuel costs have risen globally
providing the incentive to develop new cleaner, more energy and water
efficient technologies and infrastructures.
An increase in energy efficiency in the transport,
government and agricultural sector can be achieved using some of the
mechanisms available (such as switching to public transport, and taxi switch to
diesel fuel use) but in the medium and long term, the ability to meet energy
requirements will increasingly depend on how energy use demand evolves into
the future. It is foreseeable that a linear growth rate (such as 3% in the case of
water) when applied to the electrical energy, cannot be met in the future
without considerable start-up and operating costs for new electricity
production be established. Backup options provide considerable resilience to
energy demand increases, but aren’t available all year round as a supply
option.
6.5.6.3 Summary of Employment
Employment may be increased from approximately 1.4 to
2.1 million, if the condition that growth of these sectors would linearly
increase employment in them is assumed. The largest to smallest employing
sectors in the Western Cape are Finance, Insurance, Real Estate and Business;
Manufacturing, Wholesale, Retail Trade and Accommodation; General
Government and Agro-forestry and Fishing, respectively.
The agricultural sector is a large employer of people who fall
in the minimum wage and lower income groups in the Western Cape. It is
likely that due to the large water use of this sector that employment in the
agricultural sector may become adversely affected in the future. Increases in
extreme events may compound the stability of employment in this sector,
where seasonal work is often dependent on the reliability of harvests. Extreme
Univers
ity O
f Cap
e Tow
n

251
events such as flooding, fire and pest explosion conditions are more difficult to
plan for and predict, and agriculture is especially vulnerable to these
conditions. Drought may be easier to predict as understanding of the
sensitivity of El Nino and La Nina cycles in relation to climate change effects,
becomes more apparent over time.
6.5.6.4 Summary of CO2 Emissions
Carbon emissions lie between 6 and 21% more than current
levels of emission across scenarios A-I. In these scenarios, efficiency
requirements could be balanced by requiring a mandatory minimum of 5%
reduction or efficiency improvement in low to medium level energy users.
This can be implemented while imposing increasing levels of energy
efficiency into the medium and long-term for high-energy using industries, so
that improvements might be made as legacy equipment is replaced.
Carbon emissions per sector from largest to smallest per
sector may be listed as; Industry; Transport; Residential; Commerce and
Government; Agriculture and Mining, respectively. Carbon efficiency
measures constitute a critical element of climate change adaptation
programmes, and carbon credits as a mechanism for change now has the
support of the global political and scientific communities as a key point of
focus if the human contribution to climate change effects is to be minimised.
6.5.6.5 Summary of Residential Energy, Water Use & Household Income
Household energy and water use is 9% for scenarios A-F,
and increased to 22.5 and 47.5% for scenarios H and I respectively. The lower
rates of growth reflect a degree of growth that can be tolerated in terms of
residential energy and water use-age levels.
Univers
ity O
f Cap
e Tow
n

252
6.5.6.6 NOX Emissions
Total noxious emissions increase from approximately
285 000 - 550 000 in scenarios A-I. Transport, commerce and the residential
sector contribute the most, in general to VOC, PM10, PM2.5, SO3 and NOX
emissions (collectively termed as noxious emissions in this report).
6.5.6.7 Solid Waste
Solid waste increases from approximately 3m tons per
annum to 3.7m tons per annum in scenarios A-I. The largest to smallest
sources of solid waste in the Western Cape are the residential sector,
commercial sector, industrial sector, gardens and builders. It is clear that the
residential sector is by far the largest contributor and consequently the most
likely suitable candidate for mitigation and adaptation measures to be effected.
Recycling of residential solid waste will need to include more sectors of
society in the Western Cape in order to be effective in combating solid waste.
Residential recycling of paper, glass and plastic waste also provides valuable
opportunities for green small businesses and green collar government
employment to be developed into the future, and can play a significant role in
reducing the landfill requirements of the Western Cape annual solid waste
output.
6.5.6.8 General Summary
The residential sector is a significantly cross-cutting sector in
terms of energy use, water use, solid waste and CO2 emissions to justify its
inclusion as a target for both adaptation and mitigation programmes in the
short, medium and long-term. In the scenarios used for the review (A-I), the
growth of the household sector is restricted to 9% in the short term and
medium, and 22.5% and 47.5% in the long term. In reality, the growth of
energy use, water use, solid waste and CO2 emission output from the
residential sector is increasing at higher rates of growth than used in the
Univers
ity O
f Cap
e Tow
n

253
scenarios; which deliberately restrict growth in order to obtain growth
scenarios that remain resilient to water and energy supply limitations that
could result from climate change effects. That is, we deliberately restricted
growth in order to obtain growth scenarios that remain resilient to water and
energy supply limitations that could result from climate change effects.
The priority areas that have been identified for development
within the adaptation and response programmes through the process conducted
in this review are listed below:
1. Agricultural water efficiency regulation
2. Alien plant clearance programme
3. Residential & Urban energy use
4. Residential solid waste
5. Transport & Emissions
6. Finance & Investment
The residential sector is a significantly cross-cutting sector in
terms of energy use, water use, solid waste and CO2 emissions to justify its
inclusion as a target for both adaptation and mitigation programmes in the
short, medium and long-term. In the scenarios used for the review (A-I), the
growth of the household sector is restricted to 9% in the short term and
medium, and 22.5% and 47.5% in the long term. In reality, the growth of
energy use, water use, solid waste and CO2
emission output from the
residential sector is increasing at higher rates of growth than used in the
scenarios.
The energy strategy for the Western Cape suggests a number
of strategic interventions that could be used in combination to reduce energy
consumption and emissions from the various sectors (SESWC, 2007). In this
review, scenarios were run with sectors at lower levels of growth, reflecting
savings in energy as outlined in the results. From these results, adequate
savings could be made in electricity use, fuel use and emissions if these
efficiency criteria could be introduced in the medium to long term:
Univers
ity O
f Cap
e Tow
n

254
1. Transport: reduced by 10-15%
2. Industry: reduced by 15 %
3. Commerce and Government: reduced by 9-15 % of total
energy consumption
4. Residential: reduced by 9% - 25%
5. Agriculture: reduced by 10-15%
6. Energy efficiency of buildings e.g commerce and
industry: reduced by 5-10%
This is consistent with an overall 15% efficiency target for
all sectors by 2014, although realistically achievable by most sectors in the
medium to long term. Maintenance of technology and replacement of legacy
equipment occurs over medium to long term cycles; hence these targets are
more likely achievable in the medium to long term.
In the analysis of electrical energy production alternatives
conducted in this review we tested various combinations of renewable and
non-renewable future options. We also evaluated their energy and emission
output, and cost of production as possible propositions for increasing the
energy supply of the Western Cape. This need should inform research into a
multiple sources of supply of electrical energy, and should become a key
element of developing the provincial resources in an innovative and multi-
faceted manner. The decentralisation of energy production is viewed as a
likely possibility under climate change conditions, especially where rising fuel
costs are concerned.
The energy losses resulting from the effect of temperature on
transmission lines from coal-fired plants in Mpumalanga was shown in the
review to be significant enough to be the subject of research and technological
innovation to support resilience to climate change.
A general comment on the mitigation and adaptation
programmes is that there is no clear programme to deal with the social impacts
Univers
ity O
f Cap
e Tow
n

255
of climate change, especially at the lower income level households and
informal settlements. Climate change can exacerbate social conditions such as
poverty and unemployment. The failure of subsistence and agricultural
activities in a climate of rising food, household energy and transport prices,
etc. can have severe effects at the household level and it might require a
dedicated programme, with an interdisciplinary approach and structure, in
order to be effective.
The study also included a detailed but in-exhaustive list of
the types of issues that have emerged as significant gaps in understanding, or
actions that could help increase resilience to climate change in the Western
Cape. These included:
1. Understanding local effects of wind, rain and temperature
relationships and how crops, biodiversity and ecological
integrity may be affected at local scale.
2. The response of crops and biodiversity to pest and alien
species explosions under climate change induced climatic
changes such as: droughts, floods, storms, fires, pests and
alien invasive species.
3. Generally, for all sectors, sectoral water and energy use
statistics and studies into sector sensitivities to water and
energy shortages is required.
4. Programmes for buffering low income households and
informal settlements from the effects of climate change and
helping increase household resilience.
5. There are also complex hydrological and water quality
issues surrounding making any predictions regarding
climate change and water pollution loading levels.
Univers
ity O
f Cap
e Tow
n

256
6. Tariff planning for water and energy requires a better
understanding of sector dependencies, and should be
determined through inclusive processes involving debate,
discussion, negotiation and dialogue.
7. The sensitivity of the tourism to climate change related
effects such as extreme events, water and energy shortages,
potential sea level rise still needs to be more clearly
determined before any reliable conclusions can be reached
regarding the sector and how growth may be affected in the
future. In addition, more research into understanding the
difference between ecotourism vs non ecotourism activities.
A significant driver of change, as addressed in the analysis
is the potential increase in long-haul flight expenses due to
increased jet fuel prices and possible carbon taxation.
8. As far as the transport sector is concerned a few valid
concerns threaten any strategy for load-shifting from private
passenger to public transport. The key issues involve
establishing safety and security and reliability in the
transport sector using innovative mechanisms that help
improve the quality of life of people using the service.
Identifying gaps in knowledge and understanding informing the basis of strategy-
making was a key requirement of decision-makers and was an explicit aim of the
review. The detailed analyses conducted in this case study was very well received by
the decision-makers for whom the study was conducted i.e. the provincial government
(DEADP).
Univers
ity O
f Cap
e Tow
n

257
6.5.7 Brief Discussion: What did we Learn?
The challenges involved in realising this project were
manifold, involving; (1) participatory process facilitation: facilitating a
participatory process involving both decision-makers and researchers from
different disciplines, (2) modelling at massive scale: ensuring that the software
interface could cope with a large model constituted by a variety of detailed
embedded units, (3) using the model and participatory workshop processes to
perform a review which integrated across sectors, government department
strategies, (4) determining the critical limits and thresholds to growth in the
Western Cape in relation to energy and water supply and (5) obtaining an
understanding of system resilience from cross-comparison between scenarios,
and (6) coping with real-world contexts and changes.
6.5.7.1 Participatory Processes
By the time this case study was undertaken, the author had
been involved in facilitating participatory processes with graphical causal
maps and Bayesian networks for over seven years as a full time researcher at
the CSIR. We therefore understood the requirements better and put a great
deal of effort into planning for participatory processes. Even with this degree
of preparation, participatory processes between decision-makers and
researchers aren’t always guaranteed to flow smoothly because each problem
context is different. Moreover, what may have worked with one group of
researchers or decision-makers can often prove unsuitable for researchers and
decision-makers who are located in a different context.
For that reason, the primary responsibilities as far as
facilitation is concerned are; (1) to focus the group on defining their
problem(s) clearly, (2) to ensure that equal and democratic participation
occurs, (3) that a reasonable understanding of system components and key
causalities are obtained, and (4) to remember that each process will customise
itself around the problem and people who are participating.
Univers
ity O
f Cap
e Tow
n

258
6.5.7.2 Massive Scale-Ability
Ensuring massive scale-ability in Bayesian models
introduced software challenges that were iteratively resolved over the course
of the project. Of more concern, was whether a probabilistic framework
would experience an ‘overload’ of sensitivities, resulting in too much noise
and not enough sensitivity to reach conclusions using the model. While this
should ostensibly not be the case, it was still a valid concern where large
multiplicitous systems, models and simulations are concerned. Ensuring that
cross-scale and other sensitivities are verified and validated appropriately
remains the task of the main case study investigator, who can draw on a broad
interdisciplinary review group to help with verification and validation of
model structure, constraints and outputs. In this case it is clear that the BPDA
approach is scale-able to massive scale (approximately 1500 variables) and
still produces meaningful results from scenario-based sensitivity analyses.
6.5.7.3 Integration Across Sectors
In this study, the water and energy sectors as integrators to
all other sectors, as they were the primary resources, the limitation of which
the study was mainly concerned with. The challenge of linking every sector to
the water and energy sectors with known reliable information on sensitivities
was overcome by drawing on a wide range of information and expertise to
arrive at an understanding of these relationships.
6.5.7.4 Critical Limits, Thresholds & Resilience
The approach can be used to assess the limits to growth of
the provincial system in a variety of sector growth, land-use and climate
change scenarios. As shown in this case study, the ‘resilience’ of the system
can be determined from building up a history of the critical limits and
thresholds in a variety of scenarios, thereby obtaining an understanding of the
range of limits and hence resilience of the system.
Univers
ity O
f Cap
e Tow
n

259
6.5.7.5 Adaptive Capacity
The ability of the BPDA approach to support adaptive
management and decision-making was tested, when real-world changes that
occurred towards the end of the project, namely; the 2008 economic recession.
We were able to quickly adapt our analysis by running new scenarios. While
this may seem trivial, the ability of large complex simulations to be quickly
adapted to address new scenarios is often impossible. The BPDA approach
allows for a wide range of scenarios to be run and verified due to the
flexibility and modularity of Bayesian models. Even introducing new
embedded units or adapting internal relationships of embedded units becomes
almost as simple as ‘cut and paste’ task. Most traditional models and
simulations are primarily integrated around a set of scenarios that the
integration is hoped to address, and are usually adapted only with great time
and expense. Coping with multiple futures, that is, dealing with systems that
aren’t necessarily predictable, requires approaches that ensure flexibility at the
structural and parametrisation levels of modelling, so that models can be
quickly adapted to cope with newly unfolding contexts.
Overall, the critical learning points for BPDA in the Western Cape Climate Strategy
Review Case Study are outlined in Table 17.
Table 17: Critical Learning for BPDA from Western Province Case Study
Critical Learning
Points (BPDA)
Description
Cross-scale Here we adapt our understanding at the national, municipality
and magisterial district scales to formulate a detailed model at
the provincial scale. We learnt that the BPDA approach could
be used to inter-relate a wide range of sectors as embedded
units that were formulated in great detail. Interventions at
different scales in the system and embedded sub-systems, and
Univers
ity O
f Cap
e Tow
n

260
influences at different scale (e.g. climate change) can be
assessed.
Cross-sector A large variety of sectors were included in the model, and we
were able to inter-relate these models in ways that questions at
the whole systems scale could be answered in relation to
changes in rates of growth in these sectors, in relation to
climate change. In each sector or embedded unit, sub-scale
interventions (e.g. for savings in water, energy or emissions)
were also implemented where possible.
New Indices A broad range of indices can be evaluated alongside one
another using the BPDA approach. This is clearly illustrated
in this case study, and has been discussed earlier in the text.
Resilience and
Adaptive Capacity
We derived critical limits and thresholds in a range of
different scenarios, and were able to evaluate various sector-
growth combinations in relation to one another using the
BPDA approach.
Adaptability At the end of this case study the financial collapse prompted a
re-assessment of the possible growth of the Western Cape in
the short-term. We were able to accommodate these changes
easily, and provide support to decision-makers nonetheless.
Participation In this case study, we used the BPDA approach to facilitate
the processes of interaction between decision-makers in
provincial government, and a cross-disciplinary research and
review team.
Decision Support In this case study we showed that the BPDA approach can be
extended to support decision-making at the provincial scale in
great detail, including a wide range of sectors, themselves
modelled in great detail. The BPDA approach can provide an
understanding of system resilience by revealing the system
level thresholds and critical limits across a range of different
projected scenarios. It can also help evaluate different
adaptation options in response to these scenarios. As such,
the value of the BPDA approach in decision-making is self-
evident.
Univers
ity O
f Cap
e Tow
n

261
6.6 Facilitation Using Graphical Causal Maps
Graphical causal maps are used to facilitate explanation
building, pattern matching and using rival patterns as explanations in
formulating an interdisciplinary case study research design. In the two case
studies presented in this section, no Bayesian networks were built. The
purpose of these studies was to assist two different cross-disciplinary research
projects to integrate their research plans and understanding using graphical
causal maps. As such, these case studies focussed purely on facilitating an
inter-disciplinary learning, participation, negotiation and cooperation at the
level of cross-disciplinary research projects concerned with social-ecological
systems problems.
6.6.1 Cholera Study
This study involved assisting a cross-disciplinary CSIR SRP
project that was concerned with biophysical drivers of cholera in the
environment. The project sought to explain observed correlations between, for
example, observed lagged correlations between high rainfall and high
temperatures, and peaks in the rate of first infection to human beings, as
recorded at clinics. Interdisciplinary workshops were conducted with the full
host of Cholera SRP project participants, but mainly including Dr Stephan
Woodborne, Dr Marna van der Merwe, Martella du Preez, Wouter le Roux,
Mr Graham von Maltitz, and Dr Sally Archibald during the whole sequence of
workshops. The full list of participants in the project included:
Micro-biologists:
• Martella du preez
• Wouter le Roux
Univers
ity O
f Cap
e Tow
n

262
Modellers and data analysts:
• Marna van der Merwe (spectral and time series analysis using neural
networks and principles from chaos theory).
• Frans van den Bergh (spectral analysis).
• Stephan Woodborne (wavelet analysis).
• Marc Pienaar (wavelet analysis).
• Graham von Maltitz.
• Renee Koen (stats - time series analysis).
• Jenny Holloway (stats -time series analysis).
• Chris Elphinstone (stats -time series analysis).
• Bongani Majeke (satellite data analysis).
• Christo Wittle (UCT - oceanography: satellite data)
• Tarron Lamont (UCT - oceanography: satellite dataChris Elphinstone
(stats)
A variety of research disciplines were brought to bear on the
problem of understanding the environmental causes of cholera, including;
epidemiologists, marine scientists, estuarine specialists, statisticians, sediment
scientists and a few participants with general analytical skills. The
methodologies employed in the project ranged from; using alternative
techniques such as wavelet analysis to identify hidden frequency patterns in
noisy data, offshore and estuarine sampling and analysis, using GIS
information and models, sediment sampling and analysis, applying traditional
statistical methods to identify patterns in complex data sets (i.e. purely from
data), and various other smaller supporting studies.
However, the main challenge of the cholera SRP project at
this stage was the need to create a shared understanding between different
project sub-groups of the different hypotheses and system linkages they were
actively researching. The aim of this study was to use graphical causal maps
to facilitate and catalyse the emergence of shared understanding that the
project required in order to successfully integrate their research efforts.
Univers
ity O
f Cap
e Tow
n

263
We used graphical causal maps to explore the full range of
causalities that researchers felt could feasibly explain their observations, in a
process of hypotheses building, facilitated by building graphical causal maps.
This study focussed completely on the effectiveness of
graphical causal maps as facilitators of interdisciplinary research, particularly
in a biophysics-intensive epidemiological problem.
A week of workshops involving the Cholera project team
were held at the team’s offices at the CSIR in Pretoria (South Africa), where
we formulated graphical causal maps to match the main or key hypotheses that
were being investigated in the project.
A ‘straw dog’ model was composed (see Figure 34) in order
to help stimulate discussion amongst the full cross-disciplinary project team
during the workshops in which they would be composing graphical causal
maps.
Univers
ity O
f Cap
e Tow
n

264
TERRESTRIAL
Definitional: Is-a/Part- of (Static)
Initiating
Resulting
Enabling
Rainfall Upwellings
Bacteria:Residual Sea-Water
Pool
Nutrient Status
Blue GreenAlgae
Production
Region:Latitude
Salinity
Currents
Flooding
River Flow(Land)
Socio-EconomicDrivers
First Infection
Sea-SurfaceTemps
Temperature TempRainfall
PreviousCholera
Occurrence
Outbreak:Bacteria Pool (Sea)
EpidemicScale of Infection
Bacteria:Residual Land-River
Pool
Outbreak:Bacteria Pool:Land and River
Later outbreaksBacteria Pool:Land and River
MARINE
ESTUARINE
or or
Non-Human CholeraDispersal
Food Source
Figure 34: Cholera ‘Strawdog’ Model of Environmental Causes: The shared ontology is illustrated in a very simple graphical causal map relating biophysical sub-system components as drivers of cholera peaks in the environment.
Univers
ity O
f Cap
e Tow
n
265
The main hypotheses that had developed during the Cholera focussed
on several areas and are listed here (excerpts from Peter, 2007*)
1. “Marine Hypotheses: Cholera forms in the near-shore environment when
conditions for blue-green algal blooms are good, providing an environment
for cholera hosting and food production. Cholera is then transported to the
land by advective sea currents into bays and estuaries, or by hosts and
carriers of cholera (fish, birds, larvae, fishermen, crustaceans etc.).
2. Estuarine Hypothesis: The less turbid estuarine environment has algal
blooms and mangroves (N-fixation) which could also provide an
appropriate environment for cholera reproduction.
3. Terrestrial Hypotheses: Cholera is resident on land and awaits the right
conditions for rapid bacterial reproduction to occur and may be triggered
by a combination of:
a. High temperatures, high rainfall and large amounts of standing
water (wetland conditions) or by flooding (river flow):
i. Exposure – contaminants washed into drinking water
and direct contact with humans, and/or
ii. A bloom cycle for algae and cholera is initiated leading
to rapid cholera production and higher infection rates.
4. Change in water tables upriver is experienced more drastically at the coast,
raising groundwater levels and more exposure to cholera from pit latrines
etc. to occur.
5. Terrestrial-Marine Link Sub-Hypotheses: Link between river and
marine/estuarine cholera production (1) occurs through:
a. River impact on salinity in estuary and nearshore environment –
lower salinity drives cholera production.
b. River impact on nutrient loads in estuary and nearshore
environment – algal blooms provide a habitat or iron in system acts
as a driver.
Univers
ity O
f Cap
e Tow
n

266
c. This river impact could be directly into the estuary or may occur
north of the estuary via huge outflows observed from the Zambezi
river – high nutrient loads and may link to nearshore advection of
sediment/nutrients in chlorophyll a remote sensing data.
6. Human causes of spread of cholera (socio-economic conditions play a
role i.e. 33):
a. Hypotheses may focus around whether 30a or 32 plays a stronger
role i.e. human spread of disease or more cholera bacteria in the
environment through biophysical processes. To some extent, both
play a role but it is important to understand which driver is more
significant under certain conditions and why.”
The linkages that are thought to underlie these general hypotheses were
tabulated as part of a pre-planning phase of development, as shown in Table
18 in more detail. These were then used to formulate the graphical causal map
in Figure 35, where every link that is numbered corresponds to a description in
Table 18.
Univers
ity O
f Cap
e Tow
n

267
7810
17a
1120a
20
21a
2122
2323a
33
35 35a1918
16 17
912
Definitional: Is-a/Part- of (Static)
InitiatingResultingEnabling
Rainfall Upwellings
Bacteria:Residual Sea-Water
Pool
Blue GreenAlgae
Production
Region:Latitude
Salinity
Currents
Flooding
River Flow(Land)
Socio-EconomicDrivers
First Infection
Sea-SurfaceTemps
Temperature
Temp
Rainfall
PreviousCholera
Occurrence
Outbreak:Bacteria Pool
EpidemicScale of Infection
Outbreak:Bacteria Pool:Land and River
Later outbreaksBacteria Pool:Land and River
NEARSHORE/ESTUARINE TERRESTRIAL
or
Non-Human CholeraDispersalFood Source &
Hosting
1: Zambezi/Estuary
2
34 5
6
Mangroves
1314 15
24
Beira Wet LandConditions Humidity
28
32
34
30a
3130b
24a
Nutrient Status
Bacteria:Residual Land-River
PoolPreviousCholera
Occurrence
HUMAN FACTORS
Figure 35: Cholera Model 1 of Environmental Causes: Graphical Causal Model for Cholera Origin Hypotheses
Univers
ity O
f Cap
e Tow
n

268
At this point of the study we were ready to delve into formulating
detailed causal maps of embedded units corresponding to the main hypotheses,
from the outlines provided in Table 18 and Figure 35. This unfolded as two
distinct phases of explanation and hypotheses building; namely, a phase of
divergence and a phase of convergence, respectively. The divergent phase
involved delving into specific hypotheses that ‘reside’ within the embedded
units that specific project sub-teams were concerned with (e.g. sediment). The
convergent phase emerged from a shared understanding between participants
of the various hypotheses and embedded units that informed hypotheses that
were held within the project team
Univers
ity O
f Cap
e Tow
n

269
Table 18
Description of Linkages Displayed in Figure 35 # Description of Linkage, Assumptions, etc.
1 Link between river and marine/estuarine cholera production: either through nutrient load or impact on salinity (flow) through rivers running directly
into the estuary, or through the Zambezi north of the estuary impacting on nearshore processes.
2 Critical amount of cholera bacteria in environment leads to overall epidemic from sea: seems unlikely to be a strong link given the amount of water
that needs to be consumed for infection to occur. Weak link.
3&4 Strong link assumed between sea-water bacterial pool to first infection. The key questions are whether it occurs through:
• Contact with water.
• 4: Contact with food sources (fish, crab, shrimp, etc.).
5 Outbreak on land leads to first infection.
6 People contaminate water sources leading to land and river bacterial pools.
7&8 Upwellings contributing to sea surface temperature and nutrient loading – not significant for this case study.
9 Ambient temperature variations induce critical temperature variations with seasonal changes.
10 Direct Rainfall (Estuary/Sea) may contribute nutrients.
11 River Flow impacts on nutrients through runoff.
12 River flow impacts on salinity through runoff: how does salinity gradient in estuary respond to seasons/tides?
13,14,15 Nutrients, Salinity and Sea Surface Temp are assumed to initiate blue-green algae production in nearshore or estuarine environment.
16 Previous occurrence of cholera leaves a residual in system which waits until the conditions are right to multiply.
17&17a 17: Blue-green algal blooms provide environment for cholera to host and feed, resulting in a bacterial pool of cholera.
17a: Perhaps mangroves may provide the environment for cholera to be hosted and feed (N fixation also performed by mangroves).
18&19 Residual bacterial pool (18) provided with food source and host (19) results in a outbreak of bacteria in a pool.
20&20a Terrestrial rainfall leading to flooding (20) or sustained wet conditions over land (20a).
Univers
ity O
f Cap
e Tow
n

270
21&21a Flooding or sustained wet overland conditions leads.
22-24a Conditions for outbreak of cholera bacterial pool over land – 2 main avenues; through river or sustained wet overland conditions.
24 Outbreak of cholera over land in river or wet overland areas.
Comments: host and food source not clearly stipulated if a bloom cycle initiates cholera production.
31 First infection enables later outbreaks but is a weaker link than 34.
32&33 Human vector for spread of cholera (socio-economic conditions play a role i.e. 33). Hypotheses may focus around whether 30a or 32 plays a
stronger role i.e. human spread of disease or more cholera bacteria in the environment through biophysical processes. To some extent, both play a
role but it is important to understand which driver is more significant under certain conditions and why.
30a&30
b
Possible bidirectional influences considered between outbreaks of bacterial pool on land: temporal question about what comes first; 30b or 6 and
how strong are these linkages if relevant. This assumes the marine/estuarine hypotheses holds for first infection.
34 Later outbreaks on land result from epidemic spread of cholera through human beings. A whole chain of feedback effects to the human system may
be modelled here but require consideration of socio-economic drivers more clearly.
Univers
ity O
f Cap
e Tow
n

271
6.6.1.1 Divergence Phase
When the process of formulating graphical causal maps was initiated, it
required that the hypotheses that had been posed earlier be articulated in terms
of the causal chain of events upon which the hypotheses were based. Project
team sub-groups and members had previously tended to focus their attention
either on the sub-system domain on which they had most expertise, or on
macro-scale evaluations of correlation based evidence on data sets.
When the participants were forced to make causal inferences explicit in
a graphical framework, a cross-conversation was initiated between the micro-
scale and macro-scale observations of the system. Team members started to
co-operate over ‘finding the link’ which may substantiate one or both of their
hypotheses on the problem.
However, during the divergence phase they still remained focussed
mainly on the sub-system ‘parts’ or embedded units where they held greatest
expertise for hypotheses making. A host of divergent hypotheses, each
described by a complete causal structure was formulated during
interdisciplinary workshops where they were exposed to scrutiny of the whole
team. These resulted in five different graphical causal models as shown in
Figure 36, Figure 37, Figure 38, Figure 39, & Figure 40. Each graphical
causal model corresponds to an embedded unit, upon which a series of
hypotheses are made. The modules are called:
1. The Sediment Hypotheses Module (see Figure 36):
a. This is the hypothesis that cholera is endemic to aquatic
sediments, and that two mechanisms can be identified for
amplifying and distributing cholera in sediment. Temperature
is the main amplifier of the sediment reservoir, while turbation
is the distributing amplifier - and brings it into the area where
Univers
ity O
f Cap
e Tow
n

272
people are exposed to it. Runoff may act as a contributing
distributor.
2. The Pond Hypotheses Module (see Figure 37).
a. We assume cholera doesn't survive dry-land conditions.
However, it may lie latent or dormant in ponds and generally
where-ever standing water is found.
3. The River Hypotheses Module (see Figure 38)
a. There are two hypotheses regarding cholera
concentration changes, that is; (1) that both zooplankton and
phytoplankton play a role as nutrient sources and carriers (see
arc A: Figure 38), (2), that the nutrient source alone leads to
changes in cholera concentration (see arc B: Figure 38), or (3)
both A & B drive cholera concentration in combination (see arc
C in: Figure 38 i.e. all 3 edges).
4. The Sea Hypotheses Module (see Figure 39)
a. Here, we tested published opinions on biophysical
sources of cholera (Bangladesh, Bay of Bengal). The first sea
hypothesis is essentially that zooplankton serves as a host for
cholera, and that cholera multiplies in large amounts in large-
scale offshore marine algal blooms.
b. This still leaves the requirement for a mechanism for
transport of cholera to humans, for example, through
contaminating drinking water near the sea when sea-surface
rises occurs.
c. The second sea hypothesis related to sediment on sea-
bed as a reservoir where cholera concentrates, and can be
amplifies in zooplankton through high nutrient availability.
Univers
ity O
f Cap
e Tow
n

273
5. The Human Epidemic Hypotheses Module (see Figure 40)
a. There are many socio-economic (and behavioural)
factors affecting cholera transmission, including what people
eat and drink and vulnerability – and softer aspects such as
access to running water, electricity, radio communication,
clinics and primary healthcare, etc. The core focus of the
cholera SRP project was on the environmental causes of
cholera, and as such, the project was only concerned with social
transmission of cholera in as far as it involved the system
features they were researching. Therefore, we did not build an
elaborate model of causes and effects, but rather focussed on
obtaining a general characterisation of the diversity of drivers
and responses involved in social transmission of cholera.
Univers
ity O
f Cap
e Tow
n

274
Figure 36: Sediment Hypothesis
Univers
ity O
f Cap
e Tow
n

275
Figure 37: Pond Hypotheses Model
Univers
ity O
f Cap
e Tow
n

276
Figure 38: River Hypotheses Model
Univers
ity O
f Cap
e Tow
n
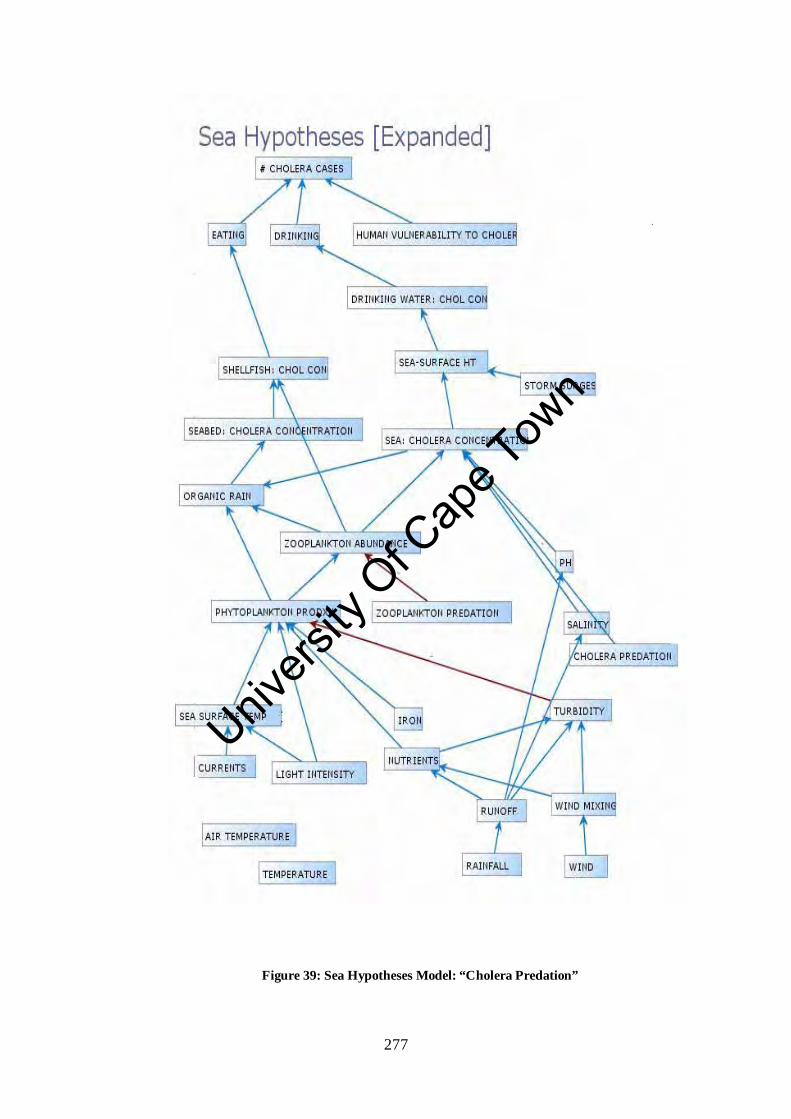
277
Figure 39: Sea Hypotheses Model: “Cholera Predation”
Univers
ity O
f Cap
e Tow
n
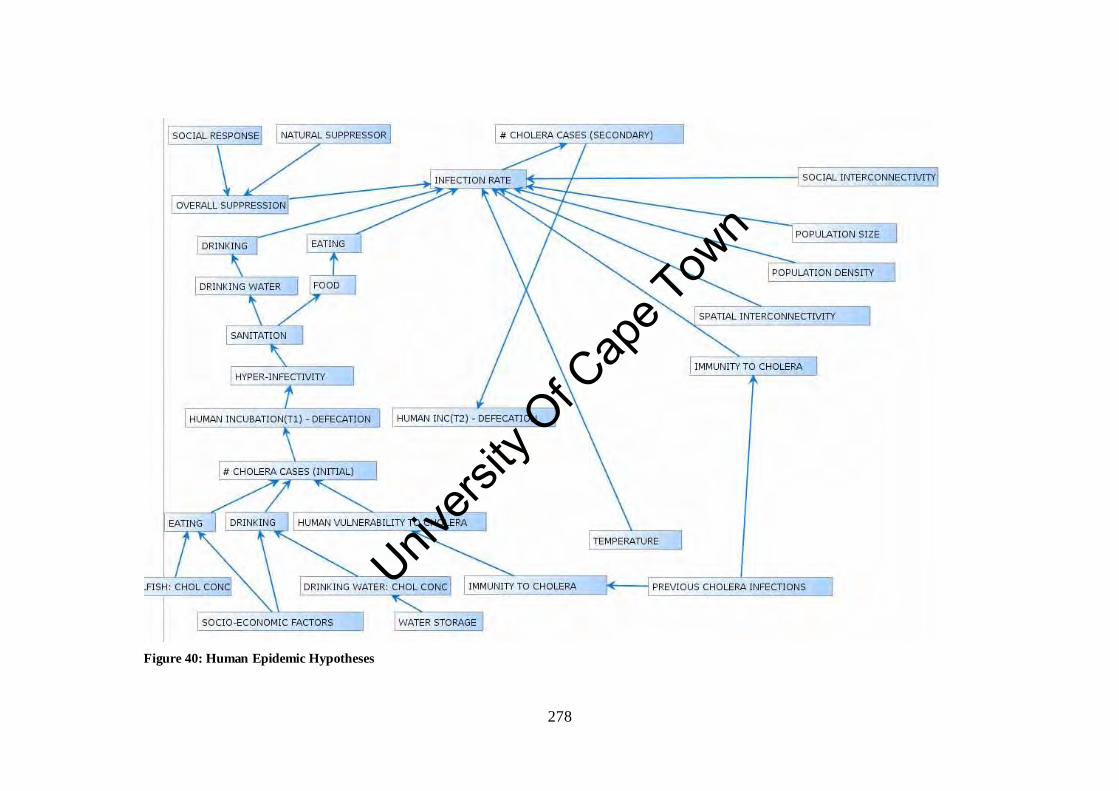
278
Figure 40: Human Epidemic Hypotheses
Univers
ity O
f Cap
e Tow
n

279
An interesting development occurred during the project that is worth
mentioning in this dissertation The Cholera project team decided to ‘take a
step back’ so they could work out how they wanted to engage with the
graphical causal methodology themselves. They then developed a vocabulary
or terminology for understanding the causal linkages in the system, which they
identified as reservoirs, amplification mechanisms, exposure mechanisms,
general transmission mechanisms and long and short term de-amplification
mechanisms – see Table 20 in Appendix A: Cholera Study. What is striking
about the terminology they used is that it illustrates how a ‘systems level’
understanding of the system (i.e. dynamic systems theory; involving stocks,
flows, leads and lags) emerged from the contemplation of causal linkages.
The ‘amplification’ and ‘de-amplification’ mechanisms that the team
identified are direct matches to positive and negative feedback effects in
dynamic systems theory. The reservoirs are the ‘stocks’, and exposure and
transmission mechanisms involve ‘flows’. This is important because it
emphasizes the compatability of a causal hyperstructure based approach with
other soft system methodologies (Checkland & Scholes, 1990) and dynamic
systems models. The BPDA approach allows for flexible evolution of
hierarchy, definition and terminology within a framework in which shared
understanding can be engendered.
6.6.1.2 Convergence
In the previous phase, the focus of workshop participants remained
mainly on sub-systems or embedded units of study. While they were able to
help share understanding of each other’s respective hypotheses, they had not
yet started to make insights into possible hypotheses that existed between the
respective embedded units, at the whole social-ecological system scale.
However, when the model was displayed to the participants as
displayed in Figure 41, where the various sub-modules are shown together,
this began to facilitate a different level of shared understanding between them.
Researchers started to make hypotheses based on linkages between different
Univers
ity O
f Cap
e Tow
n

280
embedded units (usually corresponding with areas of expertise). By
considering inter-relationships between various hypotheses models (linked to
sub-system level components), the participants were able to consider the
linkages between previously non-overlapping models. They made full use of
the terminology and vocabulary developed earlier in the study to
communicate, interrogate and debate how the embedded units might be linked.
Reservoirs, amplification and transmission mechanisms of different types were
explored to identify cross-system linkages and intra-scale linkages within
embedded units.
In this phase the team viewed each model in relation to each other
while making system level hypotheses. Each sub-hypotheses model was able
to fit to each others’ causal structures to formulate system level hypotheses. A
variety of different linkages could be envisaged. At this stage maximum
cooperation amongst researchers was achieved, as they explored system level
hypotheses with the comfortable knowledge that their sub-system level
hypotheses were still being included and addressed. For example, in Figure
42, we illustrate how a sub-system component such as ‘sediment’ from one
embedded unit may be linked to others supporting system level hypotheses
making. Issues regarding sediment could then be viewed as possibly
underlying the hypotheses made regarding other system components (rivers,
ponds, etc.). In this way, the research project was facilitated towards a greater,
systems level understanding of their system.
Univers
ity O
f Cap
e Tow
n

281
Cholera Integrated
Hypotheses Model
Figure 41: Figure Illustrating the Various Hypotheses Modules in a Single Framework: Hypotheses focussed on different sub-system components (sea, rivers, sediment, ponds) and human agents.
Univers
ity O
f Cap
e Tow
n

282
Figure 42: Making System Level Hypotheses: Researchers identified that the ‘Sediment Hypotheses Model’ could be linked to sea, riverine and terrestrial
sub-system components, and were able to articulate hypotheses using causal linkages.
Univers
ity O
f Cap
e Tow
n

283
6.6.1.3 What Did We Learn?
In this study we observed how a diverse cross-disciplinary project
team, consisting of sub-groups of experts with specific disciplinary expertise,
could arrive at a shared understanding of the various hypotheses and
embedded units being researched in the study, and how they are or might be
related.
Graphical causal maps are especially suited to explanation building as
they force the process of hypotheses making into specifying causal
relationships, and allowing the rest of the project team to interrogate their
decision-making.
The project team were able to ‘take ownership’ of the BPDA approach,
and developed their own vocabulary for explaining system level features and
effects such as stocks, flows, leads, lags and feedback, and used this
vocabulary increasingly as the workshop exercises unfolded.
As each “hypotheses module” was formulated, the project team dug
out research publications, articles, books, computer models, presentations and
data to support the hypotheses they tendered. These sources of information,
and explanatory notes were captured in the graphical user interface, and
provide a record of thinking that can serve as a transparent, trace-able record
of the thinking that informs the research design of the project.
Perhaps the most significant outcome of this case study is that the team
broke through to systems level understanding – reflected in system level
hypotheses formulation after workshops. Whereas before workshops there
was fragmented embedded unit level competing hypotheses that were being
pursued by researchers, after these workshops researchers identified
significant relationships between embedded units and formulated system level
hypotheses. This system level understanding emerged from a rigorous multi-
Univers
ity O
f Cap
e Tow
n

284
participant interrogation of the causalities underlying the key research
hypotheses.
6.6.2 Gauteng Urban Growth Study: Built Environment
This study was undertaken in two two-day workshops with a research
group in the CSIR Built Environment division which focuses mainly on
planning and implementation in the built environment. It was mainly
concerned with the issue of urban growth in Gauteng, the main economic
province of South Africa, in which the city of Johannesburg is located. The
aim of this study was to explore the linkages between the different sectors in
Gauteng and assess, at a cumulative scale, the impact of growth on various
limiting resources, such as water and energy.
We held a series of two workshops with the research group to help
establish a baseline causal model of how sectors are limited and inter-related
through different levels of, for example; economic, population and transport
growth.
In this study, the research group took ownership of the participatory
process, and used their extensive experience with such processes to explore
the full range of system components and inter-relationships.
We then used the information collected at the workshop, and our
experience with building embedded sub-system modules to formulate
graphical causal maps to articulate the critical interdependencies between
embedded units. We followed a similar process as was undertaken in the
Cholera project, and put together a preliminary graphical causal model of how
urban growth in Gauteng might be modelled using a Bayesian network. This
is shown in Figure 43, where a number of sectors are shown as embedded
units or sub-modules, as detailed in chapter 13; appendix B.
Univers
ity O
f Cap
e Tow
n

285
LIMITING FACTORS TO GROWTH
GROWTH PER SECTOR: DRIVER
GROWTH INDUCED SOLID WASTE OUTPUT
GROWTH INDUCED NOXIOUS EMISSIONS
GROWTH INDUCED GDPRGROWTH INDUCED CO2 EMISSIONS
GROWTH INDUCED ENERGY USEGROWTH INDUCED SPATIAL GROWTH & BII IMPACT
GROWTH INDUCED WATER USE
GROWTH INDUCED INFRASTRUCTURE DEMANDS
TRANSPORT, ACCESSIBILITY & EMPLOYMENT
POPULATION GROWTH, STRUCTURE, SKILLS AND DEMAND FOR RESOURCES
WATER AVAILABILITY & SENSITIVITY TO CLIMATE CHANGES (R,T)
TRANSPORT, EMISSIONS, ROAD USE, CONGESTION PER TRANSPORT MODEENERGY PRODUCTION: RENEWABLE AND
NON-RENEWABLE OPTIONS, DEMAND SIDE MANAGEMENT, BACKUP OPTIONS & HOUSEHOLD ENERGY USE
Figure 43: Gauteng Urban Growth Model: All modules are shown
Univers
ity O
f Cap
e Tow
n

286
A graphical causal framework for inter-related causes and effects for
the City of Gauteng is shown in Figure 43. Various sector-based models can
be formulated by scrutinising driver and response measures needed to answer
broadly scoped and detailed questions. The model and sub-models shown
here are not exhaustively formulated and are mere illustrations of how sector-
based models can be constructed in an adaptive modelling framework, and
linked in different ways to answer system level questions regarding
cumulative effects. At this stage, the model is exclusively focussed on
cumulative effects, but models can be developed for smaller or larger spatial
regions which can be interconnected using the outputs of more detailed
systems dynamics and agent based models that focus on the dynamics and
reflexivity of the social-ecological system.
This model was only developed to a preliminary stage, as the time
period allocated for the study was short. The key learning revolved not around
urban growth in Gauteng, but rather about what the key requirements for
participatory processes involving a wide range of disciplinary considerations,
involves. The level of awareness required for a researcher employing the
BPDA approach is such that the researcher will have to be able to adapt to new
and different ways of viewing and characterising an issue or problem. The
ability to ‘thrive’ in the often chaotic environment of participatory workshops
by being able to ‘let go’ and trust how the process unfolds, is essential. A
process that is too tightly or too loosely prescribed and managed leads the
researcher to encounter resistance from the research group concerned.
Univers
ity O
f Cap
e Tow
n

287
7. BPDA & Cross-Case Analysis & Discussion
The extent of collaboration that resulted from using the BPDA
approach is evidenced in the number of co-authored interdisciplinary
publications that resulted from the study. The author also collaborated
extensively on the conceptual development of the BPDA approach, as
evidenced in the early conference publication by Peter, Potgieter & Monteiro
(2007). However, as the author gained more insight into the conceptual
foundations of the BPDA approach during the course of this PhD, a single
authored book chapter was published, i.e. Peter (2008), which detailed the
fundamental principles underlying the approach, even though it had not been
given the name BPDA yet. That is, the BPDA approach underwent refinement
as we engaged with case studies of increasing complexity in terms of scale and
number of variables and embedded units, and in terms of progressively more
inclusive participatory processes.
When we first considered what methodology we could employ to test
the BPDA approach, we settled on a case study based approach. We therefore
decided to take 'slices' of social-ecological system interfaces, progressively
increasing the slices in complexity, scale of application, number variables and
embedded units, number of states of individual variables, number of cross-
disciplinary participants, eventually working up to large scale models and
interfacing with decision-makers. We progressively increased the scale and
complexity of case studies in order to build up our understanding of how to
formulate, test and verify Bayesian models and how to employ them
effectively in scenario planning.
In addition, the Sisyphus software was developed in parallel, and the
development cycle was closely tied to the order in which case studies were
developed. That is, we had to consider the development cycles of the software
in developing the case studies, as the software was increasingly being pushed
to higher levels of computational complexity, as more variables and
interdependencies were introduced with every successive case study.
Univers
ity O
f Cap
e Tow
n

288
Moreover, starting off with smaller case studies also allowed us to
progressively learn and engage with the nuances involved in participatory
process management.
As we progressed through each case study, which originated from a
range of ongoing CSIR projects and programmes of research, we learnt how
suited the BPDA approach was to ensuring rigour, robustness, internal and
external validity of social-ecological system case studies. Even though an
open systems approach was taken towards cross-disciplinary workshop
facilitation in each case study (i.e. each group was able to design its own way
of using the BPDA approach, depending on what the problem demanded),
when participants got to the stage where they were speaking the 'language' of
causality, (i.e. building, interrogating and debating hypotheses using graphical
causal maps and eventually, Bayesian networks), the power of the approach in
dealing with contradictions and creating shared understanding became clear to
participants. From thereon, workshops usually became highly constructive
debates around the fundamental assumptions governing key hypotheses
around which their interdisciplinary case studies were oriented.
Perhaps the key observation that emerged from engaging a wide set of
case studies and problem spaces is that the BPDA approach is flexible enough
to act as an integrator of more general classes of case studies than that
conducted on social-ecological systems. Where case study integration is
concerned, hypothesis formulation necessitates articulating and scrutinizing
causal interdependencies in the system in question, and this is where the
BPDA approach is strongest. The approach does not impose any strict top-
down conceptual frameworks, and therein lies its strength. It only prescribes
that hypotheses and system interdependencies be visualised as conditional
causalities. This frees up the BPDA approach to find application
independently of the specific context of inquiry of a particular study.
Whether BPDA can be effectively employed in all classes of case
studies, however, is contentious. Indeed, for some case studies, such as those
involving deep and textured ethnographies, an approach such as BPDA may
Univers
ity O
f Cap
e Tow
n

289
be of no use at all, because the objective of the study is to arrive at subjective
conclusions through an embedded experience, and not necessarily to build
hypotheses and test them.
From conception to conclusion, each case study benefited greatly from
using the BPDA approach (whether in full or not) in terms of achieving shared
understanding that did not exist before the study. Different problem sets and
contexts were encountered in different case studies, and by cross-disciplinary
teams from varying ends of the methodological spectrum. In general, both
tacit and explicit knowledge was generated through navigating the sequence of
case studies. The tacit elements relate to know-how and experiential learning
that was engendered regarding technical aspects involved in building Bayesian
networks, and to facilitating participatory processes between researchers,
decision-makers, and combinations of both. The tacit elements can only be
obtained from 'doing', and as such, the BPDA approach will require the same
of anyone who wants to implement BPDA.
Consequently, the role of the author also grew and evolved with the
case studies as learning increased. The author's key role in conducting the
case studies was, in broad terms:
Firstly, to facilitate disciplinary interaction in participatory processes
(this will be discussed in more detail later in this chapter). Secondly, the
author played a central role in; model formulation, construction, population
and verification, running scenarios, conducting preliminary analysis and
coordinating the feedback from multiple participants to revise scenarios and
analyses. The author was at the core of integrating analyses and writing up
most of the research. Thirdly, the author conceived of, and played a close
supervisory role in the development of the Sisyphus software and worked
closely with the local based SME Complex Adaptive Systems Pty Ltd to
develop the design to its full potential.
The authors role evolved from playing a very central role in the initial
case studies, to gradually playing more of a background, facilitator role in the
Univers
ity O
f Cap
e Tow
n

290
final case studies. This initial learning curve was exponential, because the
detailed nuances of how to employ the approach in different problem spaces
was not yet clearly understood. However, as the author became more
confident through the progression of diverse encounters, in case studies with
different disciplinary emphases, participants and methodological
contributions, a personal store of know-how developed, admittedly, mainly to
the benefit of the author. However, the intention of the BPDA approach is not
to educate participants about how to build Bayesian networks. Rather, the
purpose of the BPDA approach is to introduce them to integrated hypothesis-
building, to participate in formulating a shared understanding of systemic
interdependencies, and in a sense, to enable them to engage with Bayesian
networks without becoming Bayesian experts. It is most likely that a
newcomer to implementing the BPDA approach in the role of the author will
embark upon a similar exponential learning curve in learning to engage with
the technical, detailed aspects of both Bayesian network model development
and participatory process management.
So far, we have dealt with what we learnt about the role of the BPDA
approach in case study research, that is, in supporting and enhancing case
study as a research methodology. The key learning points that arose from
implementing the BPDA approach in case study research are carefully detailed
in chapter 8. We also discussed the role of the author, as it emerged through
the series of case studies that were performed.
For the remainder of this chapter, cross-case comparison is made in
respect of the key factors that were identified as necessary for dealing with the
complexity of social-ecological systems, as articulated earlier in this
dissertation. Here, we summarise the overall learning that was gained through
conducting the single case studies. We attempt to isolate its particular
advantages for supporting case study research into social-ecological systems
challenges that are concerned with sustainability. We base this on the learning
Univers
ity O
f Cap
e Tow
n

291
that was summarised for each full17 Table 3 case study (i.e. in , Table 4, Table
5, Table 7, and Table 17). The conclusions that are drawn regarding the
critical factors that this dissertation aimed to test regarding the range of
capabilities of the BPDA approach are made on the basis of the conclusions
that were reached in the aforementioned list of tables. These tables examine to
what extent the BPDA approach was successful in addressing a specific list of
factors for each full case study. A summary table, estimating the degree to
which required factors were addressed (on a scale of 1-5) in each case study is
shown in Appendix E, Table 21. These factors are accounted for in the next
sections of this chapter, where more detailed explanation is given in respect of
each.
7.1 Integration across Scales
The case studies show that the BPDA approach can be used to model
systems at the key decision-making scales in South Africa, namely;
magisterial district, municipality, provincial, national and regional scales of
integration can be supported at cumulative scales. Although we did not
explore linking models at, for example; the magisterial district scale, with
municipal or provincial scales, the Western Cape Province Bayesian Model
illustrates that it is indeed possible to integrate across different levels of
decision-making using a large number of embedded units.
We progressively included more embedded units in successive case
studies, broadening the scope of research and modelling in terms of providing
meaningful sensitivity analysis with increasing complexity and scale. The
Western Cape case study illustrates that intra-scale (within embedded units)
and cross-scale (between embedded units) sensitivities can be evaluated within
the Bayesian framework at massive scale (in terms of numbers of variables
17 Tables were only drawn up for the first five of the case studies presented in this dissertation. This is because the remaining two did not involve using the full BPDA approach, where Bayesian networks are built and used as part of the process. The last two case studies are only relevant in so far as they interrogate the ability of graphical causal models to help orientate hypothesis-making in participatory processes for complex social-ecological systems.
Univers
ity O
f Cap
e Tow
n

292
and scope of system). This allows researchers and decision-makers to
evaluate interventions within a sector, or to evaluate regulations between
sectors.
In all case the full case studies embedded units were detailed at
different scales and at different levels of influence in relation to the broader
system. It is not difficult to envisage cross-scale influences using the BPDA
approach, because cross-scale influences are treated alongside all other causal
interdependencies as 'equals'. The Bayesian hyperstructures make no
distinction between an intra-scale and inter-scale effect. We can visualise
these interdependencies clearly using the BPDA approach, and the software
based visualisation makes all causal dependencies clear to the participant.
There is no limit to the amount of detail that can be developed within
embedded units, except software memory limitations. In general, each
Bayesian node can be expanded into a more detailed model. This is achieved
with ease using Bayesian hyperstructures, as evidenced in the progression
from the simple Incomati-Maputo Bay case study to the Western Cape
Province climate change study. We were able to develop a more detailed
system understanding with each new, increasingly complex, case study. We
also designed the Sisyphus software to run over a computer LAN so that we
could distribute processing as the models became larger and more detailed. In
theory there is no limit to the integration of embedded units at different scales.
Lastly, the number of states that the Sisyphus software can handle in
individual variables simultaneously is very large compared to other Bayesian
network software interfaces. We had variables with up to 60 states, included
in some of the models. This is because at the whole systems level, we were
testing the system under extreme driver ranges, and the variables needed more
states in order to be able to vary across these ranges themselves. Thus, in
terms of fine-scale testing of driver changes, the software that was developed
in support of the BPDA approach proved exceptional and provided a deeper
level of flexibility, and system response to fine changes in driver values could
be tested in scenarios.
Univers
ity O
f Cap
e Tow
n

293
In summary, the BPDA approach works well for integrating across
scales and levels of detail. However, as employed in the case studies in this
dissertation, the BPDA approach was applied mainly at cumulative scales. It
remains questionable to what level of precision and accuracy Bayesian
networks can be employed in more dynamic, spatial models, such as transport,
but they can certainly link to and collect probabilistic output from more
detailed models. Implementing Bayesian networks at finer spatial and
temporal scales remains an ongoing subject of research for the author, and is
also an area of focus in other recent efforts that use Bayesian networks to
address sustainability questions (e.g. Baran & Jantunen, 2004; Borsuk et al,
2004, Bromley et al, 2005).
7.2 Integrative Modelling across Disciplines & Sectors using Bayesian Networks
From a modelling perspective, we began our case studies by relating
the human development and economic components to the biophysical
components of a system (Incomati catchment – Maputo bay case study). This
included the water, agriculture, mining, population, shrimp fisheries sectors.
In later case studies, this was progressively built up to include an increasing
number of sectors such as water, energy, manufacturing, tourism, household
informal activities, etc. We incrementally built up to greater levels of
complexity and included more embedded units as each single case study
unfolded.
The case studies covered a variety of inter-disciplinary research group
facilitation workshops that were concerned with social-ecological systems
scale issues, and the BPDA approach proved useful in facilitating
interdisciplinary researcher (and ultimately decision-maker) interactions. It
achieved this by enabling researchers and decision-makers to engage with the
core assumptions around how the research was integrated to address the
questions they were interested in. Cross-disciplinary workshop facilitation is
difficult, and we used a variety of soft mechanisms to improve communication
Univers
ity O
f Cap
e Tow
n

294
and understanding. At the outset of workshops, orienting participants around
the BPDA approach often proved slow and laboured. However, once
participants started to make and interrogate causal linkages and causal chains
to explain their hypotheses, they would begin to appreciate the value that the
approach brought to their integration efforts.
In modelling terms, each sector is 'represented', in a sense, by the
inclusion of an embedded unit representing it. Moreover, it's cross-scale and
inter-sector dependencies are also made explicit through the integration of
embedded units in graphical causal models and Bayesian networks. This
allows sector representation, or analysis by proxy sector representation. This
is because we can envisage sector interventions within a sector, and between
sectors, and test them in scenarios.
As far as eliciting expert opinion the BPDA approach worked well to
extract causal structure. However, where conditional probability tables were
extremely large it was difficult to populate them one step at a time. It required
a deeper understanding of how to use equations to generate distributions,
which could then be adapted by experts. Thus, anyone attempting to
implement the BPDA approach by solely eliciting expert-generated CPTs will
take a long time to build case studies at the scales and levels of detail that were
conducted in this dissertation. The added benefit of using equations to
generate the CPTs before experts analyse and interrogate them, is that the
participants are automatically forced to start thinking about the equations, and
hence, can design research to improve understanding of the nature of these
relationships from an early stage in the research effort.
The core strength of the BPDA approach in integrative modelling is
simply in its capacity to help visualise cross-sector and cross-disciplinary
interactions. In this respect, the software-based approach to employing
graphical causal maps and Bayesian networks has enormous advantages over
paper based processes. It allows for careful contemplation of the fundamental
assumptions that underlies sector integration in the model. Some disciplinary
experts are sector based. For example, those working in water will be more
Univers
ity O
f Cap
e Tow
n

295
concerned about water and how it relates to other sectors in the model, and
likewise with those working in energy or conservation of the environment.
Accordingly, these disciplinary experts orientate their analyses around the
sector they are concerned with. With the BPDA approach however, they
benefit from interdisciplinary views on how their sector inter-relates with
other sectors, and are able to participate in constructing a shared understanding
of their role in the system, whether from a research or decision-support
perspective.
7.3 Developing New Indices & Embedded Units
We also increased the number of indices for top-level measures of
performance included in the model(s) over the course of our research. We
began our case studies by calculating simple indices such as water availability,
water use and direct and total economic value-add. We increased the number
of indices per model as we included new embedded units in each new case
study, to suit its particular needs. Our penultimate case study (Western Cape)
had top level indices that included; five different noxious gas emissions, total
energy use, total water use, total energy availability, total water availability,
CO2 emissions, Gross Domestic Product (GDP), Gross Geographic Product
(GGP), solid waste, and waste-water abstraction from population pressure.
Moreover, within each embedded unit there are useful indices that have
been formulated for each model, particular to its needs. For example in the
Western Cape case study; the tourism module has indices ranging from the
number of tourists from different countries to the revenue obtained from each,
and relevant totals. On the other hand, the energy production module contains
a range of indices ranging from total energy production, total CO2 emissions,
total water use and total cost of energy production. Thus, indices can be set up
at multiple scales, simultaneously within the Bayesian framework.
Moreover, due to the large numbers of variables included in a single
case study model, and at different scales, we can design different sets of
Univers
ity O
f Cap
e Tow
n

296
indicators, and different aggregate indicators, to suit the particular research
question and context of inquiry at hand. This is of critical importance and a
main benefit of the BPDA approach. Users can use different sets of indicators
to help explore and explain different system level behaviours.
Indices must also be able to evolve and change if required; with the
insights that unfold as the research effort progresses, and with changing real-
world events. Here, the BPDA approach is at its strongest. Bayesian
hyperstructures can easily be updated with new information, and simple 'cut
and paste' type of tasks characterise the modelling activity involved. The
BPDA framework allows us to model large numbers of variables and their
interdependencies. The inherent uncertainty in social-ecological systems, due
to their dense intra and inter-connectedness, implies that there is little point
trying to predictive its future behaviour more and more accurately. The BPDA
approach can accommodate a large number of variables because of its
suitability to handing information that is uncertain. Bayesian networks are
designed for reasoning with uncertainty and they serve their purpose in the
BPDA approach here extremely well. The flexibility afforded by Bayesian
networks comes at a small cost in certainty (Bayesian networks model
causalities to between 10 and 20% uncertainty), but this lies within the
inherent uncertainty of the system itself, and as such is not really a trade off.
In summary, the hyperstructures, which consist of graphical causal
maps and Bayesian networks can be easily adapted to include new indices and
embedded units, depending on the quality of information available in
formulating the index. Indices can be adaptively monitored and new indices
can be added and developed within the framework.
7.4 Facilitating and Enabling Transdisciplinarity
Often, when contemplating the causal relationships using graphical
causal maps or Bayesian networks participants are able to postulate the
existence of new relationships and indices. The very fact that the
Univers
ity O
f Cap
e Tow
n

297
hyperstructure based approach enables a flexible, adaptive, non-hierarchical
modelling framework where new indices can be developed alongside old
indices means that transdisciplinarity, at an analytical level, becomes a real
possibility.
Moreover, the very insistence on expressing hypotheses at the causal
level, where different overlapping and non-overlapping explanations can be
developed for a system, phenomena or event, encourages a more democratic
exchange of views. The facilitated graphical causal mapping and Bayesian
network formulation exercises rid inter-disciplinary dialogues of opaqueness
and lack of shared understanding because it employs the visual expression of
causal relationships as a basic language for communication between different
disciplinary and other experts.
The range of different hypotheses that can be tested within a single
model is astounding. Moreover, we can develop contrary and different
understandings of the system by expressing the causal linkages to formulate
different views, whether these views are overlapping or non-overlapping. This
shared understanding forms a good basis for transdisciplinarity to emerge.
Moreover, for transdisciplinarity to occur in practise, the issue of
creating a shared language to address context-specific observations and
deductions must be addressed. That is, the integrating formalism must be
'open' enough to allow for different top-down and bottom up frameworks to be
incorporated, and for the shared language to evolve as and when disciplinary
participants have new insights and find new terms to describe them. In
practise, the BPDA approach makes no restrictions on how participants engage
with it except in stipulating causality and conditionality. Earlier in this
dissertation we described how taxonomies (i.e. classifications) and causalities
co-evolve. This was indeed the case in the cholera case study, where after first
engaging with graphical causal maps, the team 'took a step back' and
formulated their own set of terms and classifications, as tabulated in Appendix
A. They intuited a set of terms that resembled systems dynamics terms such
Univers
ity O
f Cap
e Tow
n

298
as stocks, flows, leads and lags, which were all consequently encoded into
graphical causal models.
The hyperstructures employed in all the case studies progressively
increased in detail or scale, and embedded units were added or deleted as their
relevance to the particular case study dictated. This allowed for the
exploration of different ideas of how embedded units are inter-related in
relation to system level behaviours, and the core benefit of the BPDA
approach as far as transdisciplinarity is concerned is the shared understanding
it helps set up , which can then serve as a basis for new knowledge and
understanding to emerge (i.e. from a set of transdisciplinary actions (Max-
Neef, 2005)). In short, the BPDA approach provides a valuable framework
for sharing and managing the evolution of new knowledge, as it emerges, and
in this sense is suited to supporting transdisciplinarity.
7.5 Incorporating Non-Linearity
In all the case studies presented in this dissertation a wide variety of
linear and non-linear relationships are incorporated into the models using
equations or conditional probability tables to relate parent and child nodes.
What is important, is that these non-linearity's show up at the correct
sensitivities at the output end of the model, especially where full sensitivity
analyses were conducted for each scenario. This distinguishes the BPDA
approach apart from other MCDA type approaches, where 'linearising' the
system is a procedural requirement for the underlying statistics. Feedback and
feed forward effects can be incorporated as probabilistic relationships (not
dynamic) that are easily understood, and can be debated by a variety of
disciplinary experts due to the simple manner in which sensitivity analyses are
presented. In all the full case studies presented in this dissertation, extensive
sensitivity analyses were conducted between different combinations of
variables.
Univers
ity O
f Cap
e Tow
n

299
In conventional maximum likelihood approaches, were system
predictions are desired, the probability distributions governing their behaviour
'linearise out' the lower probabilities in the line wings of the statistical
distribution, and with that, these often non-linear second and third order
effects are lost or ignored in the resulting analyses. This is not the case in the
BPDA approach, where the full probability distributions are preserved in the
Bayesian models. In the BPDA approach, a low probability 'state' is set to a
higher value, its effect immediately shows up in the system level behaviours
(i.e. after inference). If an underlying non-linearity is associated with the
lower probability state in relation system level behavioural response, then this
shows up in inference and sensitivity analyses conducted over a range of
inference tests. This is automated in the Sisyphus software, where the user can
set the scenario and let the inference run over a series of driver ranges, after
which graphs are automatically generated and posted to the screen. In all the
full case studies conducted in this dissertation these non-linear relationships
formed the basis of recommendations regarding system extremes, as they
dictated where system level thresholds and critical limits lay. This
understanding is critical for decision-making, and the BPDA approach is
especially suited to this by virtue of it being based on Bayesian networks.
7.6 Resilience & Adaptive Capacity
The resilience of a system is essentially its ability to withstand a wide
variety of changes which lie outside of its control, by adapting its internal
structure, organisation and processes (Walker et al., 2004). It is self-evident
that the resilience of system to one particular scenario does not characterise
it’s resilience in another scenario. In order to build up an understanding of
resilience there is a need to build up an understanding of the critical limits and
thresholds of a system in different scenarios. The resilience alliance therefore
maintains an online database of thresholds in order to support future research
into the resilience of social-ecological systems (see www.resalliance.org).
Univers
ity O
f Cap
e Tow
n

300
This was also our approach, and as in all the complete single case
studies we were able to test the resilience of the social-ecological system in
question by conducting a wide range of ‘what-if’ future scenarios and possible
adaptations. Being able to characterise the resilience through an
understanding of critical limits and thresholds within embedded units, and
between embedded units, across a wide range of scenarios goes some way
towards characterising system resilience and adaptive capacity because cross-
scale and cross-sector sensitivities are made explicit.
Moreover, because the BPDA framework is not solely a predictive
tool, with maximum likelihood pretensions, but a probabilistic tool, we could
adapt the models and frameworks to suit changing real-world circumstances,
as in the case of the biofuels case studies. That is, Bayesian models of the
kind formulated using the BPDA approach, are more flexible, and in this
respect BPDA suits efforts that are oriented towards adaptive governance and
management of social-ecological systems.
7.7 Critical Limits & Thresholds
The Bayesian network approach, and by implication the BPDA
approach, is a probability theory based approach, and is therefore able to
incorporate known or hypothesized linear and non-linear relationships into its
modelling framework. A variety of critical limits and thresholds are derived in
the case studies, in particular with respect to climate change related effects,
water and energy availability, limits to levels of economic and population
growth, etc.
Moreover, as explained earlier, non-linear effects, which usually
dominate at lower probability ranges in the probability distribution of a said
variable, emerge as significant drivers of system level critical limits and
thresholds, as they themselves are located in the extremes as 'low probability'
events. Therefore, in generating a realistic understanding of critical limits and
thresholds of a system under a wide range of scenario permutations the BPDA
Univers
ity O
f Cap
e Tow
n

301
approach is exceptional. In each case study, the critical limits and thresholds
that emerged from sensitivity analysis 'made sense' to everyone who was
involved in the study, and could be verified against other models, empirical
evidence or external expert opinion.
In all cases, the limits and thresholds that were obtained using the
BPDA approach in all case studies agreed well with known thresholds and
expected limits. Moreover, they were all verified by expert interrogation. In
the case of the Western Cape climate change case study, the limits and
thresholds served as recommendations to the provincial government and were
vetted by decision-makers. These limits and thresholds, when understood in
terms of the range of scenarios in which they were generated, help build
understanding of system resilience in different contexts. The ability of the
BPDA approach to produce sensible and understandable graphs showing
where critical limits lie, and what threshold values exist at the whole system
level makes it of significant importance to adaptive management efforts, in
which research is often playing catch-up with decision-makers. In summary,
non-linear relationships and critical limits and thresholds are sensitively
handled using the BPDA approach, and the approach thus has to potential to
provide great value to sustainability efforts.
7.8 Monitoring & Multiple Futures
A wide range of scenarios can be tested using the BPDA approach due
to the flexibility provided by the models, and because they include embedded
units at various scales and levels of description in the models. We also
showed how a model could be adapted to incorporate real-world changes that
directly affected the cross-disciplinary research efforts. Dealing with a vast
range of futures is a strength that Bayesian network models have over
predictive models of large integrated systems. Predictive models are usually
constrained to handle only a few, selected scenarios, and if major changes
occur predictive models require a great deal more effort to rework and re-
constrain for use.
Univers
ity O
f Cap
e Tow
n

302
Bayesian networks contain and make explicit different observational
and interventional variables. This is a critical feature in that an understanding
of where to monitor and where to intervene in a system are among the key
concerns of most hands-on managers and decision-makers dealing with
complex social-ecological scale system problems. A knowledge of which
variables can be measured, and which can be intervened upon, is required in
order to design monitoring regimes and interventions for sustainable
development, and to design cross-disciplinary research and case studies into
social-ecological systems. We have shown how this functionality can be
translated into meaningful decision support in the case studies conducted in
this dissertation with suggestions made in publications and reports to decision-
makers about 'gaps' in monitoring and measurement. The Hegelian mindset
that what cannot be measured cannot be managed, means that where gaps
aren't identified, huge problems can grow and appear as if by surprise. The
BPDA approach proved very successful at identifying gaps in monitoring and
intervention, especially where cross-sector and cross-scale dependencies were
concerned, for example; in the climate change - irrigated agriculture and
biofuels case studies, and Western Cape Province case studies, critical inter-
sector and cross-scale influences would have been ignored if the BPDA
approach had not been implied. Moreover, in a changing world, monitoring
requirements may change, and the flexibility of the BPDA approach ensures
that the model can be adapted with minimal effort to address changing
circumstances.
7.9 Choosing Connectors or Integrators
System connectors or integrators (as they are referred to in this
dissertation) usually consists of the critical resources that are shared between
sectors or users. Water and energy are good examples of system connectors
where climate change considerations are made on human development
scenarios. For example, water and energy availability, shortages and
allocations can have significant effects on the ability of human and natural
Univers
ity O
f Cap
e Tow
n
303
systems sustainability precisely because it enables and supplies a multiplicity
of sectors. The choice of connector(s) depends critically on the key questions
and the context in which those questions are asked – for example; the carbon
cycle could also be considered a connector or systems integrator if a system is
considered within the full scope of its carbon cycle.
It is critical that the choice of system integrators is well defined and
relevant to the key questions being explored. Often the system integrators can
be assessed and determined easily at the outset of the study. However, it is
often the case that as system formulation is underway (i.e. graphical causal
models and Bayesian networks are being built) it becomes clear what role the
connectors play in integrating across sectors. Moreover, an understanding of
the key integrating sectors can also emerge from multiple participants
engaging with the processes of graphical causal and Bayesian modelling. In
the graphical causal modelling and Bayesian network formulation phases it is
important to allow a full discussion of how system connectors are inter-related
with sub-system level drivers, responses and constraints. In this respect the
visualisation capabilities of the Sisyphus software help facilitate a deeper
understanding of system connectors or integrators and the issues of scale and
aggregation that are associated with them.
Moreover, the role that connectors or integrators play as loci of
integration for other embedded units (or sectors) can change depending on the
research question and the context of inquiry. Here, the main benefit of the
BPDA approach is its flexibility, which allows the user to change how the
connector, or locus of integration, is inter-related in the model. As the
emphasis of analysis changes, and different research questions are brought to
bear on the system, different sub-system influences become relevant. In one
context water may act as the integrator, whereas in another context energy
may act as the integrator. Catering for this flexibility is critical, and the BPDA
approach is especially suited to the flexible management of system integrators,
whether they be whole sectors, sub-sectors, or embedded units and sub-units,
respectively.
Univers
ity O
f Cap
e Tow
n

304
7.10 Participatory Process Facilitation
Participatory processes are required for research and decision-making
for sustainability of social-ecological systems because actualising
sustainability involves negotiating, cooperating, participating and learning
(Van Kerkhoff & Lebel, 2006). This requires that a shared understanding is
engendered between researchers from different disciplines, and between the
decision-makers, system users and actors from different sectors, spheres of
governance, spheres of influence.
In the case studies conducted in this dissertation, we mainly conducted
workshops at the outset of projects, and then worked with individuals and
smaller expert groups to formulate, verify and validate embedded units
specific to their discipline. The graphical causal maps and Bayesian networks
helped keep the smaller groups focussed on their particular ‘research module’
while keeping in mind its relationship(s) with the rest of the system.
One irrefutable feature of participatory process is “hypothesis
deadlock” and associated undecideability in research and decision-making for
sustainability. The challenge of transdisciplinarity is the requirement for
context-based integration at various scales of analysis, observation and
intervention, and value systems, and allowing for the emergence of new
knowledge and understanding regarding how sustainable options can be
determined. Hyperstructures are especially suited to dealing with conflicting
hypotheses because hyperstructures can contain a set of conflicting hypotheses
about a complex system at the same time, in anticipation of its behaviour
observed from in a variety of historical and current case studies, and
behaviours projected in future scenarios.
Univers
ity O
f Cap
e Tow
n

305
In each case study, graphical causal maps are used for explanation
building, pattern matching and identifying and testing rival explanations. This
ensures that conditional dependence between variables is stipulated, justified
and verified between cross-disciplinary workshop participants. This ensures a
rigorous level of ‘democratic’ interaction between participants in formulating
and adapting the research design over the duration of the study.
There are major differences between various expert groups and how
they engage with the methodology. Therefore, the main facilitator must
remain open to adaptation on the spot. How different expert groups create
different classifications schemas and terminologies to help them better
understand their problem or system (e.g. cholera study), differs from group to
group. There is no single formalised approach that an a practitioner of the
BPDA approach can rely on to facilitate workshops. However, there are a set
of guidelines that have been identified from the case studies conducted in this
dissertation which may prove useful. They include:
1. Ensuring sufficient preparation and background knowledge of the
problem context before planning and executing workshops. The scope
of the case study may vary significantly, and anywhere between two
days to two weeks of workshops may be necessary.
2. Being able to envision how previous models and sub-modules may be
brought to bear on the case in question, or how they may be adapted or
customised to fit a different problem context, for example, by
intelligently re-using the structure of a previously formulated model.
3. Preparing ‘straw dog’ models with one or two of the workshop
participants before a workshop, to use as a point of engagement for
workshop participants. Usually, the straw dog acts more as an
antagonistic stimulus, and participants critique the straw dog, and then
formulate their own models. The straw dog, however, introduces the
problem and the approach to workshop participants upfront.
4. Having examples of other graphical causal map and Bayesian network
– based case studies on hand for participants to familiarize themselves
with the BPDA approach.
Univers
ity O
f Cap
e Tow
n

306
5. Focussing the participants on the core research questions and key
hypotheses that their study is concerned with, identifying the over-
arching causalities and identifying system components or embedded
units that are relevant to the study.
6. Calling on participants to break into groups to formulate their
hypotheses using graphical causal maps and presenting this to the rest
of the group, where, in turn, they get to critique each other’s ideas.
7. Remaining observant of participant and inter-participant behaviours,
being able to break non-constructive side-dialogues and ensure that
participants who tend to fade to the background in the presence of
more dominant participants are afforded a chance to share their views.
8. However, allowing for changes of direction in how the participatory
process unfolds is also required. To some extent, the sensitivity that is
required to recognise when a change of direction is necessary, and does
not necessarily constitute a diversion, cannot be taught. It is acquired
through experience with actively working with cross-disciplinary
workshops and participatory processes involving researchers,
stakeholders and decision-makers alike.
9. In the rare cases where a participant is obstructive, to the point of
sabotaging the process from moving forward it is best to handle the
situation directly, and give the participant the choice to leave, or in
very drastic circumstances, to ask the participant to leave.
10. Remain sensitive to the need for contemplation. There are many
occasions within a single participatory workshop where the
phenomenon of ‘analysis-paralysis’ arises, purely because too much
information and too many ideas are being sounded too quickly for a
systematic evaluation to be made on the spot. It is desirable to have
body and food breaks regularly, and to have half-day workshops
instead of full-day workshops, where participants can reflect overnight
about progress made during the day.
The main goal of participatory processes is creating the shared
understanding that can serve as basis for constructive learning, participation,
negotiation and cooperation, and there is no formula or process that will
Univers
ity O
f Cap
e Tow
n

307
ensure this kind of convergence. The usefulness of the BPDA approach lies in
that it uses causality as a ‘common language’ between participants. Moreover
the visual software interface removes the need for participants to fully
understand complex mathematical and statistical theory, but keeps them
focussed on the core linkages and embedded units they are concerned with,
and how they relate to others in the system being researched.
The role of the author, in regard to facilitating participatory processes,
begs further inquiry. Generally, the author was engaged in real-world projects
as a senior researcher at the CSIR, and the case studies presented in this
dissertation were located in these projects. They key role that the author
played was being the 'glue' between decision-makers, between researchers
from different disciplines, and between both, to various degrees in the case
studies. The role of facilitator required that the author develop and refine the
ability to shed personal bias and disciplinary 'clothing' in the various
interactions that the case studies required. As a 'glue' to interaction the author
engaged in facilitating day to week long workshops, summarising and
collating information from day to day, and hour to hour, to follow the process
of knowledge construction that emerged in the case studies.
Additionally, the author was responsible for designing, formulating,
populating, verifying and validating all the models that were used in the case
studies in this dissertation. At each stage of model construction the author
either conducted one-on-one sessions, group sessions or large workshops to
validate and verify the functions, relationships and sensitivities that the model
outputs revealed. In all case studies, the author was acting in a professional
capacity, which required building trust, sincerity and honesty in all
interactions. The more open the author remained to different points of view,
the more people were able to share their views. To summarise, the author's
role involved acting more as a facilitator than a consensus builder i.e. through
patient negotiation, cooperation and participation.
The role of the interdisciplinary teams involved more than just helping
frame and compose Bayesian network models. They played a critical role in
Univers
ity O
f Cap
e Tow
n

308
formulating, verifying and validating the causal structure, sensitivities and
scenario runs that were conducted in the case studies. That is, they played a
key role in ensuring the validity, rigour and robustness of case studies.
Moreover, they often 'took control' of the process as the particular case study
desired, and as their collective consensus dictated, and the author needed to
remain sensitive of the needs of the group in relation to the process they were
engaging in. The key learning point in this regard is that the need for an 'open'
systems approach is required in the initial phases of implementing the BPDA
approach with a cross-disciplinary team. The only conditions that BPDA
imposes in the final stages of model formulation are that of causality and
conditionality. Hypothesis forming and testing is therefore a key element of
the BPDA approach and the facilitator and group need to remain sensitive to
hypotheses that emerge, or can be inferred from the discussions conducted in
workshops, whether explicit or embedded in narratives, debates and dialogues.
One of the key learning points revolved around hypothesis deadlock or
'analysis-paralysis'. Over time, it became apparent that whenever deadlock
ensued, a breakthrough was not far off. It required having the patience to
work through the various conflicting positions, and reach shared
understanding. That then served as a basis for discussion and revision. In all,
deadlock mostly turned into opportunity, and revealed the most salient and
critical perspectives on key factors of interest to all and sundry participating in
the workshops.
As each case study unfolded, we learnt more about coping with issues
of scale, non-linearity, larger numbers of embedded units, challenges of
aggregation. We learnt that the BPDA approach can be scaled up or down as
far as cumulative effects are concerned, without losing any complexity, but as
yet, they cannot easily be employed to assess spatial dynamics at fine scale.
This does not mean that Bayesian networks are incapable of providing this
kind of analysis, merely that this was not the focus of the case studies
conducted in this dissertation. Later, in chapter 9, we explore how both spatial
and temporal frameworks can be established for Bayesian networks, drawing
on current trends in research.
Univers
ity O
f Cap
e Tow
n

309
As far as the decision-maker and inter-disciplinary team experiences
are concerned, the BPDA approach was highly appreciated as a mechanism for
increasing shared understanding between them. Participants would often
relate that they 'saw the value of the process' in one way or another, and would
stick with it. Stephan Woodborne, of the Cholera case study, in a moment of
revelation exclaimed, "I have never done science this way before!". In the
Western Cape Government case study, the key decision-maker, Dennis Laidler
stressed the need for continued implementation of the BPDA approach in
decision-making in government, writing in recommendation to his superiors,
"this report should not languish on a shelf somewhere." In all, even sceptics
usually relented their initial positions after embarking on a process of joint
exploration facilitated using the BPDA approach.
In these cases the knowledge was co-produced and in some cases, peer
reviewed for publication. The extent of collaboration is displayed in the joint
publication of the papers and research reports that resulted from the case
studies, as detailed at the beginning of this chapter. Even the conceptual
foundations of the approach was formulated with the input of many
participants.
Two of the project teams (cholera case study team18 and
catchment2coast team19
18 CSIR Natural Resources and the Environment Excellence Awards 2007: Cholera Team: For outstanding contribution by a team.
) were awarded for outstanding interdisciplinary
collaboration and innovative, cross-boundary research by the CSIR. It is due
to the research environment provided by the CSIR that the author was able to
conduct such extensive interdisciplinary workshops, and to be able to conduct
one-on-one engagements with a wide variety of experts. The CSIR is heavily
concerned with integration, as it serves a joint research and application
agenda, and must engage with real-world problems. Hence, the CSIR
19 CSIR Environmentek Awards 2005: Catchment2Coast: Cross-Boundary Team Award: For demonstrating the ability to successfully undertake a complex, multidisciplinary project requiring close cooperation between teams from different organisations with diverse operational cultures, resulting in effective and innovative outputs.
Univers
ity O
f Cap
e Tow
n

310
supported and heavily funded most stages of the research conducted in this
dissertation. A sense of exploration and discovery accompanied most case
study research efforts, and this is in no small part due to the environment
cultivated at the CSIR. The open-minded but critical environment created by
the CSIR served as fertile ground for exploring and refining the BPDA
approach.
7.11 Decision Support for Adaptive Management
The case studies conducted in support of this dissertation gradually
built up towards working with decision-makers, and in the penultimate case
study on the Western Cape province the BPDA approach was used in a
collaboration with decision-makers who were faced with real-world decision-
making challenges. Not only did the BPDA approach help create shared
understanding between decision-makers and researchers, it also helped them
communicate their concerns, disagreements and ideas with each other more
clearly than in the absence of the approach.
In the Western Cape case study the BPDA approach was employed
with decision-makers and was used to make recommendations to the
provincial government of the Western Cape Department of Environmental
Assessment and Development Planning. The decision-makers found the
Bayesian models intriguing, and engaged directly with interrogating the causal
structure, underlying assumptions, validity of evidence used to constrain
marginal conditional probability distributions, the equations used to inter-
relate nodes and the sensitivity analyses outputs. They helped design
scenarios and often, we were able to test scenarios on the spot to help frame
the discussion. The input of decision-makers was critical to orienting the
study. Often, decision-makers spend many hours in dialogue, conversation
and debate, where they 'model' complex multiple futures using their
experience and ability to envisage the future, including surprise and the
unexpected (that is, the low probability 'externalities that are often omitted in
scenario planning exercises, but which increasingly have to feature in
Univers
ity O
f Cap
e Tow
n

311
decision-maker planning). They found the BPDA approach extremely useful
in two aspects. Firstly, in helping them understand how researchers envisaged
the integration of the system in a particular problem context. Secondly, they
found that the approach helped them interrogate such a wide variety of
possible future system trajectories and intervention and observation devices,
that they were able to test their differing, often sector based understandings of
future trajectories and suggested interventions.
The BPDA approach yields hyperstructures that are flexible, non-
hierarchical and adaptive. As shown in the biofuels case study, and the
Western Cape province case study, unfolding real-world changes can be
quickly incorporated. Moreover, the wide range of what-if’s and scenarios
afforded by using the BPDA approach makes it suitable for supporting
scenario-planning processes before, during and after implementation of a
strategy. The BPDA approach can, in a sense, follow the decision-makers
needs in a transparent, traceable, verifiable manner. It enables ‘on the spot’
sensitivity analysis and link interrogation in participatory workshops, and can
easily be adapted to reflect changing circumstances.
The value of employing a probabilistic approach in dealing with the
complexity of social-ecological systems is uncannily similar to the role of
probability theory in dealing with the ‘particle zoo’ in quantum physics. It
allows a variety of alternative permutations to be jointly considered within a
probabilistic evaluative (not predictive) framework. There is no absolute
predictability, only the ability to understand the variety of potential outcomes
of a system. As we have consistently argued in this thesis, the BPDA
approach to modelling complex, real-world systems is far more valuable due
to the heavy dependence of these systems on changes in the current context.
The current context is itself emerging and hence changing, and hence the
BPDA approach is designed to incorporate a large number of variables
simultaneously so that a variety of alternative future scenarios can be catered
for as they unfold. This is in contradiction to approaches that deal with
systems that are heavily reliant on historical context - where hind-casted and
forecasted models dominate the methodologies for researching and
Univers
ity O
f Cap
e Tow
n

312
understanding these systems. Where relevant, the BPDA approach makes use
of historical information and hind casted models - as in the case of the
Incomati-Maputo case study, where models that hind casted over ten years
were used as a basis for constraining relationships in the Incomati-Maputo Bay
model. However, the BPDA approach is not constrained in the same way as
maximum likelihood based approaches are to the need for historical data,
because of its emphasis on current context.
All the case studies conducted in this dissertation involved exploring
inter sector and cross-disciplinary linkages. This was also reflected in the
outputs of the case studies. Where findings and recommendations were
concerned, they were usually focussed on cross-sector and cross-disciplinary
linkages. The focus of the Western Cape study was to review how well the
Western Cape climate change strategy integrated with other provincial level
strategies on economic growth, water, energy and waste, and this is where the
BPDA approach proved most successful and provoked the most enthusiastic
response from decision-makers in the Western Cape provincial government.
Univers
ity O
f Cap
e Tow
n

313
8. BPDA & Case Study Research
In the previous chapter we discussed the use of the BPDA approach to
support the requirements for modelling the sustainability of complex social-
ecological systems. In the BPDA approach, as proposed in this dissertation,
we used graphical causal maps and Bayesian models as hyperstructures for
managing the internal models of a complex, interdisciplinary social-ecological
system case studies concerned with system scale sustainability.
In every phase of case study research design, and implementation
discussed in the next two sections, we make the case for using hyperstructures
to facilitate shared understanding between researchers from different
disciplinary backgrounds and decision-makers on case studies in general, but
not without exception.
Earlier, we argued that the BPDA approach can be used to strengthen
coordination in case study research of complex, interdisciplinary problems in
general. We now draw on the learning engendered in conducting individual
case studies of social-ecological systems and the cross-case analyses presented
in the previous section to explain why the BPDA approach is suited to
supporting interdisciplinary case studies involving complex systems. In this
section we discuss how the BPDA approach plays a role in merging more
analytical natural science based methodologies with social science based case
study methodologies.
Univers
ity O
f Cap
e Tow
n
314
8.1 Case Study Research Design Considerations
8.1.1 Introduction: Purpose of Research Design
Case study research design is not a trivial undertaking – more so if
multiple case studies are being used (Yin, 1984, pp. 22). This dissertation
engages a wide range of research strategies in a series of case studies that are
mainly quantitative, structural and behavioural in nature. Qualitative
interpretation is used to formulate a descriptive and exploratory modelling
framework that is formulated solely in the context of the question being asked
and the system being investigated. Many of the case studies in this
dissertation were conducted using multiple-case embedded research designs
(Yin, 1984, pp. 42) because each case study has more than one unit of
analysis. The uppermost unit of analysis is the social-ecological system itself,
when analysed in a particular context and scenario. However, a variety of sub-
units of analysis (embedded case studies) play a critical role in helping assess
system level behaviour at the social-ecological system level.
According to Yin the four applications of case studies are:
- “to explain the causal links in real life interventions that are too
complex for the survey or experimental strategies.”
- “to describe the real-life context in which an intervention has
occurred.”
- “[that] an evaluation can benefit, again in descriptive model, from an
illustrative case study … of the intervention itself.
- “[that] the case study may be used to explore those situations in
which an intervention being evaluated has no clear, single set of outcomes.”
In this dissertation, the proposed modelling approach specifically
focuses on; explaining causal linkages, describing the context, formulating a
Univers
ity O
f Cap
e Tow
n

315
descriptive model of the intervention, and exploring the combinatorial20
outcomes (Richardson, 2002) of an intervention, or set of interventions in
different scenarios. These four application areas of case studies match the
critical requirements of research for the sustainability of social-ecological
systems.
An open systems approach is used to support case study design and
development and the models formulated and used to assess scenarios are
qualitative in the sense that it attempts to “avoid any prior commitments to any
theoretical model” (Yin, 1984, pp. 25) i.e. causal linkages aren’t bounded by
any generic or theoretical frameworks but are tied to the context of
interpretation in which they are determined. The modelling approach
employed in this dissertation provides trace-ability of changing understanding
regarding causal linkages and provides a framework for validation and
verification as adaptation occurs. The hyperstructures allow for both the
interrogation of the qualitative judgements underlying causal linkages - and
the empirical, quantitative and theoretical (equations) evidence used in
populating the sensitivities between variables in the Bayesian models
formulated from the basis of graphical causal maps. Hyperstructures, as used
and defined in this dissertation, offer a framework that helps bridge the divide
between the use of models (using quantifiables as inputs and outputs) and the
qualitative interpretation of the results of these models (using expert
interdisciplinary groups).
The purposes of a research design are to ensure that the evidence
addresses the initial research questions, and to ensure that logic behind
collecting and interpreting evidence (Yin, 1984, pp. 29) is maintained
correctly (especially in conceiving of the causal chains of evidence (Yin,
1984, pp. 28)) in an iterative process of learning. In defining what a research
design is, Yin (1984, pp. 28) calls on two writers, who “have described a
research design as a plan that guides the investigator in the process of
20 Combinatorial here refers to the overlapping and non-overlapping explanations, and equifinal and non-equifinal outcomes referred to later in the text (see sections 10.2.2, 10.2.3 & 10.2.4 for further explanation of terms).
Univers
ity O
f Cap
e Tow
n

316
collecting, analyzing, and interpreting observations. It is a logical model of
proof that allows the researcher to draw inferences concerning causal relations
among the variables under investigation. The research design also defines the
domain of generalizability, that is, whether the obtained interpretations can be
generalized to a larger population or to different situations (Nachmias and
Nachmias, 1976 pp77-78; emphasis added) (Yin, 1984, pp. 28).” Research can
also be thought of as a “blueprint of research” which addresses “at least four
problems: what questions to study, what data are relevant, what data to collect,
and how to analyze the results (see Philliber, Schwab, & Samsloss, 1980)”
(Yin, 1984, pp. 29).
Research designs go through many iterative phases of verification
before being finalised and even then may have to be revised during the study
itself. This dissertation showcases a modelling approach (BPDA) that helps
manage this process of revising the case study research design by elucidating
and revising the causal chains of events or influences that are envisaged to
underlie the key hypotheses that address the research questions.
8.1.2 Components of Research Design
According to Yin (1984, pp. 29), “For case studies, five components of
a research design are especially important:
1) a study’s questions;
2) its propositions, if any;
3) its unit(s) of analysis;
4) the logic linking the data to the propositions; and
5) the criteria for interpreting the findings.”
For social-ecological systems, to formulate a case study design
according to the list of components shown above engages both general
complexity based approaches and restricted complexity based approaches.
The first two components, “a study’s questions” and “its propositions” require
Univers
ity O
f Cap
e Tow
n

317
more qualitative, interpretive reasoning between different disciplines in order
to define these components adequately for a social-ecological system case
study i.e. a general complexity-based approach. Determining the “units of
analysis” and “the logic linking data to the propositions” requires a more
restricted complexity-based approach as it relates to formulating and testing
the critical boundaries, variables and interdependencies in the system, while
the “criteria for interpreting the findings” necessarily engages with a general
complexity based approach in order to ‘make sense’ of the studies outputs and
findings. In considering the components of a case study in the context of
social-ecological systems, the observation can be made that general
complexity is in a sense, required for both ‘opening’ and ‘closing’ the research
process. General complexity serves as a filter to the inputs and outputs of the
case study investigation of a social-ecological system and serves to frame and
give context to the overall study (i.e. its ‘outer’ boundaries or interface with
reality), while restricted complexity represents the ‘inner’ boundaries of the
case study investigation.
The modelling approach caters for all components (1-5) of a case study
design in detail, because it merges general complexity approaches with
restricted complexity (Cilliers, 2008; Morin, 2007) approaches in a single
modelling framework or ‘hyperstructure’ from which shared understanding
can be encouraged and engendered. The story of evidence behind every causal
link is independently verified in the process of formulating the graphical
causal models and performing sensitivity analysis when verifying the Bayesian
networks. The strength of this approach is primarily focussed at managing the
joint understanding of the five components of case studies into social-
ecological systems, in particular, and can be used in other systems problems in
general, to varying degrees of usefulness.
Univers
ity O
f Cap
e Tow
n

318
8.1.3 Evaluation, Validity & Causality
The critical issue in most decision support for sustainability is
evaluation (Peter C, 2008, pp. 472) to ensure validity, that is; of assumptions,
models, evidence, conclusions and recommendations. Where adaptive co-
management of social-ecological systems is concerned the need for systems
evaluation in support of ensuring validity is stressed by Bellamy, Walker,
McDonald & Syme (2001, pp. 408, in Peter C, 2008, pp. 473), who identify
that “evaluation in natural resource management policy has been neglected
and a substantial gap is emerging between theory and practise”. Operating in
the space between theory and practise is where case study research is most
effective. However, according to Yin (1984, pp. 37) those who are critical of
case study research mostly highlight cases where “a case study investigator
fails to develop a sufficiently operational set of measures and that “subjective”
judgements are used to collect the data”. Yin therefore suggests that two steps
are requisite for any case study investigator (Yin, 1984, pp. 37):
1. “Select the specific types of changes that are to be studied (in relation
to the original objectives of the study) and
2. Demonstrate that the selected measures of these changes do indeed
reflect the specific types of change that have been selected.”
Case studies rely on “analytical generalisation” instead of statistical
generalisation (Yin 1984, pp. 39). Therefore, ensuring the logic behind
building hypotheses and models, and collecting evidence to test them is a
critical element of ensuring the validity of the research and evaluation of case
studies. Building robustness in a case study requires that the causal chains of
logic and evidence suitably address the particular research question or set of
questions that is under investigation. As outlined earlier, causality is critical
to our understanding of the world. According to Hume (1739/2000) we
observe events that are contiguous in space and time and infer causal relations
that explain our observations, even if they do not necessarily have to exist,
according to Hume, in the real world. Even pure correlative evidence
undergoes scepticism in research circles if there is no causal explanation for
Univers
ity O
f Cap
e Tow
n

319
the correlation. As previously highlighted, causality is a critical issue, and is
the basis upon which lack of detailed scientific evidence has been exploited,
for example; by pro-smoking legal lobbies. Causality is the basis upon which
research validity rests. Even if correlative evidence is brought before a
researcher, it is useless unless it provides a causal explanation of how or why a
particular phenomena exists, because without an understanding of the causal
relationship one would not be able to express any understanding of why a
particular relationship exists, except for personal intuition. Validity for a case
study or set of studies requires reliability, in the sense that research should be
repeatable upon the same set of evidence on the system. This is reflected in
the tests Yin (Kidder, 1981, pp. 7-8, in Yin, 1984, P36) identifies as critical for
ensuring case study research design (also shown in Table 19):
• “Construct validity: establishing correct operational
measures for the concepts being studied;
• Internal validity (for explanatory or causal studies only,
and not for descriptive or exploratory studies): establishing a causal
relationship, whereby certain conditions are shown to lead to other
conditions, as distinguished from spurious relationships;
• External validity: establishing the domain to which a
study’s findings can be generalized; and
• Reliability: demonstrating that the operations of a study
– such as the data collection procedures – can be repeated, with the
same results.”
Theoretical generalisation, however, requires acting on the same and
different sets of evidence in order to establish the extent to which a particular
model can be abstracted to higher levels of generality or universalism. This
ensures applicability across a broader context, usually at different scales of
levels of description.
Univers
ity O
f Cap
e Tow
n

320
Table 19:
Four Tests for Research Design (Table taken from Yin, 1984, pp. 36)
Tests Case Study Tactic Phase of Research in
Which Tactic Occurs
Construct
validity
Use multiple
sources of evidence
Establish chain of
evidence
Have key
informants review
draft case study
report
Data collection
Data collection
Composition
Internal
validity
Do pattern matching
Do explanation
building
Do time-series
analysis
Data analysis (all)
External
validity
Use replication logic
in multiple case
studies
Research Design
Reliability Use case study
protocol
Develop case study
data base
Data collection (all)
The case study tactics involved in ensuring validity are outlined in
Table 19, and includes the phases of research in which each tactic is used. The
modelling methodology proposed in this dissertation (BPDA) addresses each
aspect of validity outlined in explicitly, and enables shared understanding of
these aspects amongst interdisciplinary research groups.
Univers
ity O
f Cap
e Tow
n

321
Six sources of evidence can be collected when conducting case studies
(Yin, 1984) i.e. documentation (Yin, 1984, pp. 79), archival records (Yin,
1984, pp. 81), interviews (Yin, 1984, pp. 82), direct observation (Yin, 1984,
pp. 85), participant observation (Yin, 1984, pp. 86) and physical artefacts
(Yin, 1984, pp. 87). Three principles of data collection apply (Yin, 1984, pp.
89):
• Using multiple sources of evidence (Yin, 1984, pp. 90)
• Creating a case study data base (Yin, 1984, pp. 92)
• Maintaining a chain of evidence (Yin, 1984, pp. 96)
It is at the heart of the processes of construct validity and data
collection, as outlined above, that the graphical causal map & Bayesian
network hyperstructure comes into its own. Casual chains of evidence are
visualised, made explicit, shared and interrogated by an interdisciplinary
research team. The hyperstructures help; maintain the chain of evidence,
adaptively maintain changes in thinking and understanding of the system, and
provide a linked data base that allows access to the sources of evidence used.
It acts as a visual representation of shared knowledge and understanding of the
causal chains of evidence being constructed in the research effort and acts as a
library of information about the key assumptions and core evidence that is
used to formulate the model.
Univers
ity O
f Cap
e Tow
n

322
8.2 Implementation Considerations of the Research Strategy
8.2.1 Conceptualising the Study
“too many times, the investigators start case studies without having the
foggiest notion about how the evidence is to be analyzed” (Yin, 1984).
In discussing the desired skills of case study investigator – Yin stresses
that a senior researcher is required for such an undertaking and not merely a
research assistant who is sent out to collect data. The case study investigator
must have a requisite understanding and appreciation of qualitative
judgements that are necessary in order to guide the quantitative surveys or
evidence-gathering. In this dissertation, research that was conducted with a
variety of interdisciplinary teams, consisting of senior researchers with
requisite knowledge and experience of case study areas and material, some
with several decades of fieldwork conducted in the case study areas. Each
researcher that contributed to case study development was specifically chosen
to ensure the validity of embedded units that are included in the models i.e.
validity of their causal structures.
The case studies conducted in this doctoral dissertation rarely involved
any visits to any particular ‘site’ or spatial location. Rather, experts from
various disciplines, with expert knowledge of these particular sites, were
sought out. They were included in formulating and verifying the model in
interdisciplinary workshops, and screening the model outputs and conclusions
and recommendations that were made. All of the studies, except two (i.e. no
Bayesian models were built for the cholera & gauteng urban growth case
studies), involved gathering extensive quantitative data and evidence in order
to populate the Bayesian model with probabilities.
Univers
ity O
f Cap
e Tow
n

323
Finding a ‘starting point’ for researching a complex social-ecological
system problem can be difficult. Research questions and hypotheses can often
seem to be endless in interdisciplinary workshops that are held to ‘frame the
study’ at the outset of research, as different views emerge regarding the overall
goals of the study, and where specific research questions and hypotheses are
concerned. Often no descriptive framework and clear theoretical propositions
can be made, precisely because of the complexity of the system and the focus
of research (which is usually integrative in nature if it is linked to a question of
sustainability of the system). An open systems approach is required in this
phase of research, as researchers need time to explore the domain of factors,
variables and relationships that characterise the social-ecological system (or
any case study) that is under investigation. In this phase of research where
little is known or understood about the system as a whole Yin (1984, pp. 119)
suggests that, “In the absence of a strategy based on theoretical propositions or
a basic descriptive framework the investigator is encouraged to “play with
data” in a preliminary sense, as a prelude to developing a systematic sense of
what is worth analyzing and how it should be analyzed.”
This may involve the use of various types of analytical techniques, and
in the study in this dissertation; the inclusion of facilitation approaches for
interdisciplinary participatory processes. For case studies, Yin (1984, pp. 100)
lists some of the techniques:
• “Putting information into different arrays;
• Making a matrix of categories and placing the evidence within such
categories;
• Creating data displays –flow charts and other devices – for examining
the data
• Tabulating the frequency of different events;
• Examining the complexity of such tabulations and their relationships
by calculating second order numbers such as means and variances; and
• Putting information in chronological order or using some other
temporal scheme”
Univers
ity O
f Cap
e Tow
n

324
These forms of knowledge sharing suit the facilitation of scenario
planning and interdisciplinary research processes well, as they allow for many
degrees of flexibility in providing a description of the system. These
techniques may all be used alone, and in combination, to varying degrees of
effectiveness in interpreting the problem, system and context appropriately. It
is also appropriate to allow for flexibility in the chronology of implementation,
that is, to match different phases of problem solving to appropriate knowledge
facilitation techniques.
One of the findings of this dissertation is that where the interaction
between multiple participants, from different disciplines is facilitated through
the use of these techniques, an open systems approach often works best. That
is, we should allow the group itself to choose what approaches (or
combination of approaches) work best for characterising the particular
problem and system that is under scrutiny, and allowing the full expression of
views and opinions of the group. The aim of this process is to give the group
enough room to allow for reliably scrutinized research questions, and
hypotheses, explanations and propositions to be obtained. The process also
aims to help researchers to select the appropriate techniques from those
available to them, in order begin the analytic phase of case study research with
a well defined idea of the how the study is bounded.
A critical element of the analytic phase involves ruling out ‘alternative
interpretations’ (Yin, 1984, pp. 100. Yin identifies two strategies for the
analytic phase of case studies where theoretical propositions and a description
for the case study exists, or have been developed:
• “Relying on theoretical propositions” (Yin, 1984, pp. 100):
o To formulate an understanding of, ‘a set of research
questions, reviews of the literature, and new insights’ that
led to the propositions.
Univers
ity O
f Cap
e Tow
n

325
• Developing a case study description (Yin, 1984, pp. 101):
o When theoretical propositions are absent “A second general
analytic strategy is to develop a descriptive framework for
organizing the case study”.
These two approaches basically consist in formulating an explanatory
and descriptive model respectively, in order to help rule out alternative
explanations. Yin states that the case study description strategy is “less
preferable” presumably because of the perception that too many levels of
detail might be generated in a case study description.
In this dissertation we take a systems approach. A systems description
is seen as a facilitative framework for developing and testing theoretical
propositions. In particular, the heterarchical framework used in the modelling
approach enables the interrogation, monitoring, and testing of theoretical
propositions that are made within the causal framework of reasoning. The
graphical causal maps, and Bayesian networks which constitute the
heterarchical framework of reasoning has a descriptive role, and also helps
reason about the various causal linkages that may underlie observed
behaviours. It can be easily adapted with changes in understanding, to reflect
new, emerging shared understanding of the system, and can be employed in an
iterative process of learning and reasoning about a social-ecological system. It
also plays a critical role in the analytic phase of research, because it serves as
an integrative framework that reflects shared understanding and is the
quantitative basis upon which the study is being conducted.
When a general analytic strategy has been established and
implemented, Yin identifies several ‘specific analytic strategies’ that can be
used. These include; “pattern-matching, explanation building and time series
analysis,” which are deemed as “effective ways of laying the groundwork for
high quality case studies,” and “incomplete ways of doing case study
analysis”, which includes; “analyzing embedded units, making repeated
observations, and doing case surveys”. The incomplete strategies “must be
Univers
ity O
f Cap
e Tow
n

326
used in conjunction with one of the other techniques in order to have an
effective analysis” (Yin 1984, pp. 119).
The dominant modes of analysis, according to Yin (1984, pp. 103) for
ensuring internal and external validity of the case study research are described
in the next few section (see sections 8.2.2 to 8.2.7):
8.2.2 Pattern-Matching
According to Yin (1984, pp. 103), pattern-matching is “one of the most
desirable strategies” for dealing with case studies. Pattern-matching compares
“an empirically based pattern with a predicted one (or with several alternative
predictions)”. Coincident patterns strengthen the internal validity of the case
study by verifying whether “the patterns may be related to the dependent or
independent variables of study (or both)”. For descriptive studies the
“predicted pattern of specific variables” must be defined “prior to data
collection”.
Pattern matching is an element of the BPDA approach as the approach
is used to validate and establish reliable shared understanding of ‘chains of
evidence’ in the formulation of Bayesian models and graphical causal maps
(or hyperstructure). Dependent and independent variables and conditional
dependencies are clearly articulated and visualised in the approach. The
proposed approach brings together descriptive and explanatory approaches by
providing, and the description is iteratively adapted as new explanations or
more precise explanations are obtained through learning and participation.
Pattern-matching also includes using “non-equivalent variables as a
pattern”. Yin cites Cook & Campbell (1979, pp. 118) who introduce a “non-
equivalent, dependent variables design” where “According to this design, an
experiment or quasi-experiment may have multiple dependent variables – that
is, a variety of outcomes. If, for each outcome, the initially predicted values
have been found, and at the same time alternative “patterns” of predicted
Univers
ity O
f Cap
e Tow
n

327
values (including those deriving from methodological artefacts or “threats” to
validity) have not been found, strong causal inferences can be made”.
One of the main strengths of the proposed approach is that it uses
hyperstructures to assess a variety of equifinal and non-equifinal outcomes
from changes in underlying (Richardson, 2002) relationships, where different
combinations of system drivers can yield the same overall global system
behaviour in the case of equifinality, and where they yield different global
system behaviours in the case of non-equifinality. The BPDA approach makes
these equifinal and non-equifinal combinations explicit, so that they can be
tested for validity through interdisciplinary scrutiny. These may be underlaid
by overlapping and/or non-overlapping descriptive and explanatory models.
In this manner, explanations can be verified, eliminated or researched further,
and gaps in knowledge can be identified and targeted.
Using the BPDA approach, hyperstructures consisting of Bayesian
networks and graphical causal models are used to represents the shared
understanding of the system by the interdisciplinary group. They enable a
more informed level of interdisciplinary inquiry to be conducted into the
social-ecological system. This involves the use of the probabilistic Bayesian
model in evaluating a large range of conditional causal sensitivities that are
believed to underlie real social ecological system behaviours, functions and
relationships by the interdisciplinary group, in different scenarios. Pattern-
matching is conducted at this stage, where model outputs are compared against
observed evidence, model outputs, empirical evidence or expert opinions
regarding the casual links (and its various inter-linkages) under question in the
study.
8.2.3 Rival Explanations as Patterns
Using rival explanations (Yin, 1984, pp. 105) as a strategy for analysis
involves eliminating rival explanations which can be considered “threats to
validity” (Yin, 1984, pp. 105-106). If the explanation was applied across
Univers
ity O
f Cap
e Tow
n

328
multiple case studies with the same results, then the goal of “literal
replication” would have been accomplished across cases, and the validity of
the explanation could be considered stronger. The goal of “theoretical
replication” requires the explanation to be tried on a second group of cases,
and to fail “due to predictably different circumstances”.
The key characteristic of rival explanations, as discussed by Yin, is that
“each involves a pattern of variables that is mutually exclusive: If one
explanation is to be valid, the others cannot be.” He goes on to state that,
“This means that the presence of certain independent variables (predicted by
one explanation) precludes the absence of other independent variables
predicted by a rival explanation. The independent variables may involve
several or many different types of characteristics or events, each assessed with
different measures and instruments.”
Rival and alternative explanations of the same phenomenon are rife in
both social theories and ecological theories, not to mention where they are
linked. Even diseases such as cancer, can result from different causal
pathways (Helsper & Van der Gaag, 2002) involving the same, and sometimes
different variables. There are often overlapping and non-overlapping causal
logical pathways that can provide an explanation for complex phenomena
(Richardson, 2002). In Yin’s estimation, “The concern of the case study
analysis, however, is with the overall pattern of results and the degree to which
a pattern match(es) the predicted one”.
The BPDA approach, in particular the use of Bayesian networks and
graphical causal maps as hyperstructures, enables each causal chain of
evidence, underlying each explanation, hypothesis or proposition of the social-
ecological system phenomenon to be assessed fairly against all others.
Moreover, overlapping and non-overlapping explanations can be considered,
and the causalities underlying them can be scrutinised fairly by all participants
in the study, through facilitated interaction using the software interface
developed for the purposes of supporting the research conducted in this
dissertation. The hyperstructures serve as an integrative framework for
Univers
ity O
f Cap
e Tow
n

329
reasoning about existing and emerging patterns of observed and projected
behaviours.
8.2.4 Explanation Building
Yin (1984, pp. 107) calls explanation building ‘a special type of pattern
matching’ and states that “to “explain” a phenomenon is to stipulate a set of
causal links about it.” Explanation building involves arriving at a final
explanation only as a “result of a series of iterations” (Yin, 1984), and has
historically mainly been conducted in “narrative form” in case study research.
In the approach proposed in this dissertation, using graphical causal maps and
Bayesian networks for facilitated interdisciplinary explanation-building
extends and strengthens the narrative story-telling conducted within the
dialogue conducted amongst participants. This is because the BPDA approach
maintains the focus on the precise causalities underlying explanations that are
proposed to explain a phenomena, problem or behaviour.
While it is true that “in most studies, the links may be complex and
difficult to measure in any precise manner” (Yin, 1984) the Bayesian
framework allows for using qualitative expert opinion to quantify conditional
causal relationships between variables by using conditional probability tables
to describe the relationship (see later in text– section 5.2.2). These (CPTs)
allow for completely hypothetical propositions to be qualified (relationally)
and quantified (even in the absence of data). The BPDA approach plays a
critical role in the explanation building phase of a case study; which undergoes
more iteration at the outset of the study than later. By focussing explanation
building into a causal framework, different explanations can be made explicit.
These inform the research design plans, and these explanations are tested
during implementation. This process can be used iteratively to improve the
research design as the study unfolds.
Understanding causality lies at the foundation of explanation building
because “the casual links may reflect critical insights into public policy
Univers
ity O
f Cap
e Tow
n

330
process or into social science theory. The public policy propositions, if
correct, can lead to recommendations for future policy actions; the social
science propositions, if correct, can lead to major contributions to theory-
building.” (Yin, 1984, pp. 107). The BDPA approach enables a full
probabilistic framework, complete with interventional and observational
variables; that can guide research and decision-making.
8.2.5 Third Strategy – Time Series Analysis
Simple and complex time series are critical where case studies of
systems with memory are conducted, and allow for patterns (e.g. seasonal,
cyclic) to be identified, and act as a stimulus for hypothesis building. For
example, in a study exploring the environmental causes of cholera, cited later
in this dissertation (see section 6.6.1), it was observed that cholera peaks
seemed to correlate strongly with rainfall highs, after a lag period. This
stimulated a great deal of thinking, discussion and theorizing about the causal
linkages through which this relationship might be working, and various
research areas and linkages were identified relating to various embedded units
or relationships between them.
In the case studies in this dissertation, historical time series evidence
was used to characterise relationships only where they were relevant to the
context and scenarios being considered. The judgement involved in using
historical time series analysis relies on the context in which the time series
analysis finds application. For example, if seasonal variations are observed
over the duration of a yearly period, then those seasonal variations are not
accounted for if the model aggregates at the annual scale, and must be
considered at a different temporal scale. The BPDA approach yields models
that can adapt to different temporal and spatial scales of analysis are of great
use when dealing with multiple-scale systems with significant cross-scale
effects, such as social-ecological systems.
Univers
ity O
f Cap
e Tow
n

331
8.2.6 Chronologies
Chronology must necessarily be compared with an explanatory theory
which “specifies one or more of the following conditions:
• Some events must always occur before other events, with the reverse
sequence being impossible;
• Some events must always be followed by other events, on a
contingency basis;
• Some events can only follow other events after a prespecified passage
of time; or
• Certain time periods in a case study may be marked by classes of
events that differ substantially from those of other time periods” (Yin,
1984, pp. 113).
Chronology involves specifying sequences of events, some fixed, lags,
and temporal changes in classes of events. The heterarchical approach
adopted in this dissertation helps manage these changes in classes of event, as
classes “rise to authority based on form and function” (Heylighen et al., 2001)
as understanding changes, or as the system changes due to real-world events,
and the case study must adapt to incorporate these changes.
Chronology is clearly articulated and tested in the hyperstructures that
are used as the basis of the modelling approach in this dissertation, in
particular, a causal chronology. This causal chronology is more generalised
than spatial and temporal causality, but does not exclude them. Moreover, the
heterarchical approach taken in this dissertation, based on causality; is
bolstered by the observations by Waldmann & Hagmayer (2006) that causality
and taxonomy are co-producing.
Univers
ity O
f Cap
e Tow
n
332
8.2.7 Lesser Analytical Modes of Analysis: Embedded Units, Repeated Observations & Case Surveys
Amongst the ‘lesser modes of analysis’, or “incomplete ways of doing
case study analysis” (Yin, 1984, pp. 119) Yin, includes embedded unit
analysis, repeated observations and the case survey approach. Embedded
analysis refers to a case where embedded units within a case study, or system,
require propositions internal to the embedded unit to be tested in order to
support the hypotheses made about the inter-relationships between embedded
units, and how this results in global system behaviour (Yin, 1984, pp. 115).
The embedded units may be constructed with evidence from a variety
of sources including, “survey analysis, economic analysis, historical analysis,
or even operations research”. The BPDA approach is particularly strong at
embedded unit analysis, especially due to its scale-ability; where many
embedded units (or sub-units) can be constructed, if it is deemed necessary for
the research effort. In this dissertation, all the case studies conducted into
social-ecological systems required extensive sub-system or embedded unit
analysis, in order to trace the root causes of global system unit analysis to their
independent sources (i.e. independent variables or marginal probabilities in a
Bayesian sense).
Repeated observations are also used in case studies conducted in this
dissertation where they find relevance to a particular problem context. No
individual case study investigators were sent into a particular region or area to
investigate phenomena or collect data. Rather, due to the highly integrated
nature of social-ecological systems many sources of survey data were used in
combination, as outlined earlier in this section. Using the BPDA approach the
appropriate scales and levels of integration of embedded units are
appropriately maintained.
Univers
ity O
f Cap
e Tow
n

333
9. Frameworks for Future Development of
BPDA Approach
9.1 Introduction
As already outlined in great detail in this dissertation the need for
evaluation in adaptive management for sustainable development is especially
critical (Plummer & Armitage, 2007), that is, in an era where unprecedented
rates of change are being experienced, in terms of economy, society and
environment on local and global scales (Holling et al., 2002; Lubchenco,
1998). Plummer & Armitage (2007) cite Bellamny et al., (2001, pp. 408), on
the need for systems evaluation; “evaluation is fundamental to identifying
change, supporting an adaptive approach that is flexible enough to meet the
challenge of change, and enabling progressive learning at individual,
community, institutional, and policy levels. However, evaluation in natural
resource management policy has been neglected and a substantial gap is
emerging between theory and practise.”
Making decisions about changing real-world systems and challenges,
especially where development is concerned, requires that appropriate forms of
verification and validation (or evaluation) are used to ensure that decisions are
made upon the best available information. Moreover, we are required to ensure
that these decisions are informed by the most recent developments in the
current context, in order to help ensure effective implementation. Traditional
scientific techniques, which aim for providing predictability, and are based on
historical knowledge of the system, are sometimes called into question where
decision-making for sustainability is concerned. As a result, the importance of
participation is stressed by Van der Sluijs (2007), who states that “the
traditional dominance of ‘hard fact’ over ‘soft values’ has been inverted: hard
policy decisions may have to be made, based on soft facts”, in particular,
because due to the “many uncertainties, traditional science is not able to
sufficiently legitimize the drastic steps that may be needed to deal with
Univers
ity O
f Cap
e Tow
n

334
complex risks.” This uncertainty is associated with the reflexivity of human
systems, in particular, the inability to predict exactly how decision-making
may aggregate from the individual to the collective levels, and behaviours
often emerge as surprises (Holling, 1986; Kates & Clarke, 1996).
We contend that research and modelling that serves to play a useful
role in decision-support for development are required to have the flexibility to
trace-able adapt to and appropriately reflect the multiple levels of stability, re-
organisation and disorganisation of real-world systems, in a shared model of
understanding that is used for directing research and supporting decisions
(Peter, 2008).
In this section, we motivate a conceptual framework of ideas, which
shows how the BPDA approach can be developed in the future. This involves
several areas in which the approach can be developed further, as outlined in
more detail in the sections in this chapter, as listed below, respectively:
1. We outline a variety of conceptual frameworks can be used to
facilitate top-down and bottom-up system definition (see section
9.2).
2. To migrate towards ‘mixed’ Bayesian model-based hyperstructures
(Peter C, 2008) that are both manually supervised (i.e. formulated
by the user), and which learn from real-time data-bases
automatically (where trends and patterns are identified by
algorithms rather than the user) (see section 9.3),
3. To illustrate how the Bayesian hyperstructures proposed in this
dissertation can be extended to include a variety of different
systems and taxonomic ontology’s within its causal framework (see
section 9.4),
4. To help articulate and share understanding of areas where
researchers and decision-makers are faced with the enigma of the
undecided-able, where different overlapping and non-overlapping
hypotheses or explanations of a particular phenomena, or reasoning
behind a decision, bring about deadlock (see section 9.4.2),
Univers
ity O
f Cap
e Tow
n

335
5. What implications the BPDA approach has for helping researchers
and decision-makers understand social-ecological system
resilience, adaptive cycles and cross-scale effects (see section 9.5),
and,
6. To help visualise system interdependencies in near-real time and
support the research and decision-making challenges that face
sustainability efforts (see section 9.5).
It must be stressed that the subject matter dealt with in this section is mainly
conceptual in nature and remains the subject of ongoing and future research.
9.2 Social-Ecological System Integration: Conceptual Frameworks Used in Case Studies
There are no definitive top-down frameworks for formulating a social-
ecological system mapping or model, because the study of complex social-
ecological system problems is often richly contextual. Generic models
generally don’t find purchase with researchers and decision-makers alike,
especially when held up to scrutiny with respect to the context in which the
model is applied. The purpose of top-down frameworks, in the context of
maintaining the sustainability of social-ecological systems, is generally to
ensure that a system-wide perspective is maintained when identifying and
formulating the systemic problems facing researchers, decision-makers, users
and stakeholders who are concerned with overall social-ecological system
sustainability.
In particular, most systems-based top-down approaches towards
modelling complex behaviour place great emphasis on understanding the
nature of critical interdependencies and cross-scale system linkages that drive
overall system behaviour. This does not negate the development of detailed
sub-system models, but places emphasis on how these models inter-relate to
answer different questions regarding the systemic behaviours of the system in
different contexts. However, it should be noted that systems level behaviours
Univers
ity O
f Cap
e Tow
n

336
often can only be understood from a detailed sub-system level understanding
where specific interactions (e.g. positive feedback, which can lead to non-
linearity and runaway behaviours). Therefore, a top-down approach is never
completely ‘top-down’. It often involves drawing on detailed sub-system level
knowledge to assist the participant in exchanging views and understanding of
the system. Here, the purpose of the top-down approach must be emphasised;
it is to prevent the dominance of a single sub-system (often disciplinary) i.e. in
taking over the primary research goal. The top-down approach, in short, is
intended to keep participants focussed upon the big picture, and to draw on
details from sub-system level understanding as appropriate and required for
the problem and context being studied.
In the next few sections a series of top-down frameworks that were
used, to varying degrees, in formulating graphical causal models and Bayesian
networks for the case studies conducted for this dissertation, are outlined and
discussed. They include; human, manufactured and natural capital, Total
Economic Value (TEV) and the development of indices such as direct and
total value add to a resource such as water or energy through human-activities,
to the biodiversity intactness index (BII). These frameworks are illustrative,
and are by no means intended to be interpreted as an exhaustive framework for
top-down definition of a social-ecological system. Rather, the conceptual
frameworks are discussed and critiqued so that the reader will obtain some
insight into them, and how they can be applied to conceptualise social-
ecological systems as whole systems for top-down strategic governance and
management imperatives. These top-down frameworks are used flexibly to
enable an open systems approach, where no single framework influences the
boundaries of the study. Rather, frameworks can be used or discarded as fits
the nature of the problem appropriately in terms of levels of description and
scale.
Some of the frameworks that were used as top-down conceptual
frameworks for system definition in case studies, are outlined in the next few
sections.
Univers
ity O
f Cap
e Tow
n

337
9.2.1 Human, Manufactured and Natural Capitals of Social-Ecological System
Human, manufactured and natural capitals (Costanza & Daly, 1992)
provide a useful framework with which to characterise a social-ecological
system. It is not an exhaustive framework however, as it does not consider the
various flows between capitals (or stocks) explicitly. In order to enable a
framework that explicitly considers human, manufactured and natural capitals
in systems oriented formulation and design methodology, it must necessarily
be extended to include the important influences and interdependencies in the
system between the capitals themselves, and other driving factors that affect
social-ecological system resilience under various scenarios.
Natural capital is a useful concept, as it often contains the resource
bases from which human and manufactured capitals are derived. Water and
energy are examples of two such sectors, that are supported by and enabled by
ecosystems, and which have an impact on ecosystems. Natural capital is a
stock, from which flows of natural income into various human and
manufactured capital stocks originate. The value of the concept of natural
capital (for the purposes of conceptualising sustainable development) over
utility is that; “Utility cannot be bequeathed, but natural capital can be”
(Costanza & Daly, 1992). From a systems or complexity perspective, the
value in understanding natural capital from this perspective is that actions (on
stocks and key linkages between these stocks) can be taken to preserve the
integrity of crucial natural capital stocks for the use of future generations
(Costanza & Daly, 1992), without having to worry about how future
generations choose to make use of it. It helps enable a more sensible approach
to the issue of sustainability, rather than judging the future by the current
socio-economy and way of life, and its living standards, and projecting
historical or current values, norms, beliefs and behaviours on future
generations. In this small way, the natural capital approach helps to cope with
the undecideability regarding the lifestyle of future generations; something
Univers
ity O
f Cap
e Tow
n

338
that is impossible to accurately imagine or predict, and hence to decide upon,
even though a decision has to be made.
The question of evaluating natural capital necessarily engages a
broader range of social-ecological system issues. At some times natural
capital may be a renewable service provider such as an ‘ecosystem’ for
example. The consideration of an entire ‘ecosystem’ as a stock in itself is not
entirely problematic, but it can be challenged by those who would feel the
word ‘system’ implies that it contains stocks, flows, leads and lags and should
be considered precisely as that. Simply allocating an economic value (or an
indicator such as species count) to natural capital, and regarding that
measurement as an aggregated measure of the ‘stock’ of natural capital, is
inadequate for understanding resilience – precisely because it does not address
the issue of ecosystem integrity, and hence its sustainability. The concept of
natural capital, used alone or in isolation, would constitute a limited top-down
conceptual framework because while it acknowledges whole system
complexity (e.g. of ecosystems) it provides no new way of interpreting natural
capital alongside human and manufactured capitals in a whole systems
perspective. Since the inception of this concept however, other ideas about
dealing with the social-ecological system in its entirety has evolved as a very
genuine response to the demands of scientists, policy-makers, decision-makers
and stakeholders alike (e.g. Ehrlich & Levin, 2005; Gunderson & Holling,
2002; Lubchenco, 1998; Stern, 2000; Levin, 2006; Van Kerkhoff & Lebel,
2006).
The trend towards integration is also a result of changes in the global
socio-economy and climate. Some of the value provided by this approach is
for dealing with social-ecological systems (e.g. transdisciplinarity, complexity,
resilience, climate change, institutional and stakeholder approaches). Placing
natural capital alongside human and manufactured capitals in an appropriate
social-ecological systems framework (i.e. one that addresses the central
questions we are concerned with) might prove a valuable approach towards
formulating key system interdependencies (see Figure 44 & Figure 45) to
support integration efforts.
Univers
ity O
f Cap
e Tow
n

339
INSTITUTIONS DRIVERS OFCHANGE
NATURAL CAPITAL STOCK
RESILIENCEUNDERSTANDINGLINKAGES:•Organisation•Adaptive capacity•Thresholds•Scenarios & Interventions
UNDERSTANDINGRESILIENCE
CLIMATE CHANGE
GLOBAL CHANGE
LAND MGMT
RIVER MGMT
COASTAL MGMT
TOURISM
MANUFACTURING
WATER
SERVICES
ENERGY
AGRICULTURE
MANUFACTUREDCAPITAL STOCK
HEALTH
RECREATION
HUMAN CAPITAL STOCK
EDUCATION
EMPLOYMENT
DWAF
DTI/DEAT
IPCC/UN
UNIVERSITIES
Figure 44: Conceptual Map for System Integration
Univers
ity O
f Cap
e Tow
n

340
INSTITUTIONS DRIVERS OFCHANGE
NATURAL CAPITAL STOCK
RESILIENCEUNDERSTANDINGLINKAGES:•Organisation•Adaptive capacity•Thresholds•Scenarios & Interventions
UNDERSTANDINGRESILIENCE
CLIMATE CHANGE
GLOBAL CHANGE
LAND MGMT
RIVER MGMT
COASTAL MGMT
BIODIVERSITY
ECOSYSTEM SERVICES
IRRIGATEDAGRICULTURE
DRYLANDAGRICULTURE
LIVESTOCK
FORESTRY
INDUSTRY:
MANUFACTURING
MINING
SERVICES
MANUFACTUREDCAPITAL STOCK
DWAF
DTI/DEAT
IPCC/UN
UNIVERSITIES
HUMAN CAPITAL STOCK
WESTERN CAPE PROVINCE
INFRASTRUCTURE: ENERGY: Energy Supply, emissions,
cost & savings options
WATER: Water supply & savings options
TRANSPORT: Vehicle
POPULATION DYNAMICS: Simple population increase and decrease impacts on
water and energy use
HEALTH: Noxious Emissions (SO2, VOC, NOX, PM10, PM2.5)
RECREATION
ECONOMICS: GDP, GGP, Value Add
EDUCATION: Not included
EMPLOYMENT: No of employed per sector
COMMERCE:FINANCE, INSURANCE,
REAL ESTATE & BUSINESS
TOURISM
SMME & INFORMAL BUSINESSES
WHOLESALE, RETAIL, TRADE, CATERING & ACCOMMODATION
INFORMAL & SUBSISTENCE HOUSEHOLD
WATER- BASED ACTIVITIES
DEADP
DWAF
DME
DME
Figure 45: Implementation of Conceptual Map: Using conceptual map to map out the areas of concern in the social-ecological system by considering human, manufactured and natural capital stocks for the Western Cape Case Study.
The natural, human and manufactured capital stocks of the Western
Cape Province in South Africa are outlined and detailed (not exhaustively) in
Figure 44 and Figure 45. The illustration is not exhaustive but attempts to
capture some of the key factors and issues that could be related to natural,
human and manufactured capital. These illustrations show how we could use
descriptions of natural, human and manufactured capital as a starting point to
outline the institutions involved and consider the key drivers of social-
ecological system change and sectors and services that could be related to
human and manufactured capital stock and resilience. From an illustration
such as Figure 45, we can detail the key system components, stocks, flows, etc
and then compose a graphical causal model of the system helping initiate an
understanding of how the system is inter-linked.
Multi-participatory workshops with strategic planning and graphical
causal mapping exercises can be used to help understand the ‘linkages’
Univers
ity O
f Cap
e Tow
n

341
between social, economic and natural systems - in order to migrate to a more
holistic understanding of the system. Linkages, or interdependencies, are
important for several reasons:
1. By understanding linkages we get a better idea of where we can
intervene or act in a system, and were we can’t (i.e. distinguishing
between observational and interventional variables).
2. Understanding the linkages or interdependencies at whole system scale
will help us answer the question; “what are the key system
interdependencies that constitute the resilience of the system in
different scenarios?”
Populating a Bayesian network with probabilities from both
quantitative (empirical, detailed sub-system models) and qualitative (expert
opinion using conditional probability tables) would help us start to identify the
key sensitivities of the integrated system, as we currently understand them. As
demonstrated in the case studies, we could then build upon this understanding
in an iterative manner through discussion and/or workshops when we review
progress on the project. Dynamic systems models can then be built after
we’ve identified critical areas of sensitivity within the system and decide to
probe their function and processes deeper. In future, we could feed back the
results of these higher resolution dynamic systems (or other e.g. GIS) models
to the Bayesian network and estimate the scale influence of improving
understanding of those particular parts (chosen to represent natural, human or
manufactured capital) of the system. It is entirely feasible to use this
framework in two ways; firstly, as a top-down conceptual framework from
which detailed embedded units could be constructed for a system that services
decision-making over the wide range of areas that are required to be managed
(e.g. land management, etc.), and secondly, for getting to grips with the full
scope of requirements that we identified in this dissertation as necessary for
treating social-ecological systems as complex adaptive systems.
Univers
ity O
f Cap
e Tow
n

342
9.2.2 Total Economic Value
The framework for natural, human and manufactured capitals itself is
insufficient, however, for the purpose of discovering system
interdependencies. Therefore, the consideration of additional evaluative
frameworks are needed in order to obtain the context specific sub-system level
definition required for Bayesian models, especially in terms of cause and
effect relationships (including flows such as ecosystem services).
In most case studies conducted in this dissertation, Total Economic
Value (TEV) (Blignaut & de Wit, 2004) is used as a conceptual framework to
inform the articulation of social-ecological system benefits in most case
studies attempted. It must be stressed that TEV is not necessarily useful as an
indicator, but as an evaluative framework for articulating, considering and
understanding social-ecological system benefits, and creating a shared
understanding of cross-system interdependencies. Neither is it exhaustively
applied to each case study system, but is customised to suit the problem at
hand and the context in which the problem is located.
Univers
ity O
f Cap
e Tow
n

343
Metals
Sinks
waste absorptionpollution
Radioactive substance
Toxics
Air, Water, Soil, Land
ClimateRegulation
Detoxification/Waste Treatment
Biological and DiseaseVector Control
Water Regulation
Nutrient Cycling
Soil Formation
Structuralfunctions
Regulatory functionrenewable
Sources Life Support Services
spiritualcultural recreationnon-
renewable
Space: Availability and pattern of use
Reproduction/Habitat
Fisheries
Forests &Woodlands
Livestock
Fauna
Pollination
Biodiversity(Genetic to Landscape)
Flood, Erosion& Storm Control
AtmosphericCompositionRegulation
Landscape Interconnection& Structure/Refugia
spiritualcultural
Human Dev Support Services
Freshwater:Quantity
Flora
Food & Fibre
Biochemicals,Medicines
Non-renewableEnergy
Mineral ResourcesRenewableEnergy
Ornamental
Total Economic Value
Use Values Non-Use Values
Existence BequestDirect Use Indirect Use
Figure 46: Total Economic Value Framework for Considering Ecosystem Services.
The top-down derivation of the social-ecological interface is in relation to
Total Economic Value (TEV). Total Economic Value (TEV) necessitates the
consideration of a broad range of ecosystem services (see Figure 46, or
Blignaut & de Wit, 2004):
• “Life Support Services (regulatory and structural functions)
• Human Dev Support Services (recreation, cultural, spiritual)
• Sources (renewable and non-renewable)
• Sinks (pollution and waste absorption)”
The following description of TEV was formulated in private communication
with Prof Martin de Wit, while developing the methodology proposed in this
dissertation in a case study. The following interpretation was co-written with
De Wit during case study development. We wrote in support of the use of
Univers
ity O
f Cap
e Tow
n
344
TEV as a top-down conceptual systems framework for engaging with social-
ecological systems21
:
“The concept of TEV (Blignaut & De Wit, 2004) goes beyond the dominant
neo-classical economic value system, enabling the economic value of
biophysical services provided by coastal ecosystem to be expressed. This can
be achieved using both market prices and estimated values where markets do
not exist. In particular, TEV can be used as a concept to differentiate the
values of biophysical services provided to commercial and
artesanal/subsistence economies. The concept of TEV facilitates a discussion
on the economically most important goods and services provided within a
particular system, whether it is the provision of water, the assimilation of
waste or providing attributes for recreation to name a few. This has the
following benefits:
• Trade-Off Analysis: Locally optimised activities (e.g. a commercially
optimised agricultural production process) can then be evaluated in
relation to other important ecosystem activities and services at
ecosystem scale. This will inform a decision on trade-offs between
economic and biophysical goods and services at a broader ecosystem
scale, rather than the local scale only. It therefore provides a
mechanism to deal with ever-increasing importance of off-site
externalities of a particular economic process on other ecosystem
services and human actors.
• Gaps in knowledge, partnerships or competencies can be developed
where a linkage(s) is not well enough understood but is seen as crucial
to the systems behaviour. As a strategic concept, TEV is expected, at
least initially, to be broad enough to accommodate a constructive
debate between various disciplines during the systems formulation
phase of modelling. Using an open framework such as TEV enables
the science base to be continually built upon and improved as
21 The text in quotes was co-written with Martin de Wit for a paper, but we dropped this part in the
Univers
ity O
f Cap
e Tow
n

345
investigation into the economics-biophysics interface continues.
TEV does not provide an exhaustive framework for interpretation of social-
ecological systems and is used merely to engage the interface and is viewed as
a flexible and adaptable framework that can conceptually evolve over time to
include other measurement systems.”
final submission. It has been included here because it describes the role of TEV rather well.
Univers
ity O
f Cap
e Tow
n

346
9.3 Manual and Automatic Engineering of Emergence Revisited
In this section we discuss how the BPDA approach could, in the future,
support both manual and emergent engineering of emergence. We present a
rationale for how the BPDA approach can be developed in the future, and
what direction(s) must be taken in terms of methodologies. We explore and
explain how using hyperstructures that are enabled by agent-based Bayesian
models can be used to provide decision-support in adaptive governance and
management of social-ecological systems.
The purposes of bringing these two processes together are; (1) to
provide a new level of cross-verification (Peter C, 2008) of large, complex,
interdisciplinary models for decision-making, one that involves enabling all
participants to grasp the basic logic of the model i.e. causality, and (2) to
ensure a development path for the BPDA approach that will facilitate the
development of decision-support models towards near real-time and real-time
decision-support frameworks.
9.3.1 Manual Engineering of Emergence
In this dissertation, manual engineering of emergence was conducted at
two levels; (1) between cross-disciplinary research group participants, and (2)
between researchers and decision-makers. This was mainly conducted in
interdisciplinary workshops, supplemented by one-on-one interactions with
experts with specialist disciplinary knowledge (to be scrutinised later by the
multi-participant group). In this way, each causal relationship in every
embedded unit was verified and validated by more than one participant. Each
embedded unit underwent a series of sensitivity analyses to ensure its validity
in the scenarios in which it was employed.
Univers
ity O
f Cap
e Tow
n

347
We used soft facilitation techniques in participatory workshops in
order to formulate a heterarchical, causality-based formulation of system
interdependencies using the BPDA approach. It involved interdisciplinary
workshops between researchers and decision-makers. Although there were no
opportunities to work directly with stakeholders in the case studies conducted
in this dissertation, there is room for adapting how the BPDA approach is
implemented in different participatory processes that involve stakeholder
participation. While the BPDA approach engages the use of different
conceptual frameworks for stimulating reasoning between workshop
participants, the main purpose of participatory process facilitation is ultimately
to stimulate learning, dialogue, negotiation, participation, debate and
cooperation. This is with the ultimate goal of creating shared understanding
and shared awareness of decision-making contexts amongst participants. To
this end, the softer aspects of facilitating participatory processes take
precedence in any workshop exercise.
The BPDA approach enables both researchers from different
disciplines and decision-makers obtain a shared understanding of how the
social-ecological system is integrated at the level of research-based models,
and can interrogate the fundamental assumptions upon which the causal
relationships that constitute the model are founded. In this way, the
participatory process enables a strong platform for verification of the Bayesian
hyperstructures that are used in decision-support models that are constituted
using the BPDA approach. This is critical where the issue of evaluation in
adaptive management programmes is concerned. The fundamental
assumptions governing the detailed intra-relations of sub-units can be
scrutinised by an informed and experienced decision-maker. The software
interface enables an easy-to-understand view of causal relationships, and the
fundamental assumptions governing these relationships are transparent and
trace-able.
In almost all of the case studies conducted in this dissertation, the
Bayesian models were flexible enough that they could be adapted to suit
Univers
ity O
f Cap
e Tow
n

348
consequent studies, and to incorporate new information pertaining to the
particular context of the new study.
9.3.2 Automatic Engineering of Emergence
The case studies in this dissertation did not involve any automatic
learning from data. Data and information was interpreted and used to
manually formulate hyperstructures consisting of graphical causal maps and
Bayesian networks. However, it is possible that in the future, the BPDA
approach might be extended to include automatic learning from real-time data-
bases such as weather, rainfall, temperature, pricing, demand indices, etc.
through automatic learning from on-line data feeds. In the case of the BPDA
approach, the key requirement is a computational Bayesian framework with
the ability to cope with a large number of variables (or nodes), each with a
large number of discrete states over which its probability distribution is
comprised in conditional probability tables.
As far as temporal reasoning is concerned, recent developments in the
application of Bayesian networks yield a measure of hope. Osunmakinde
(2009) has developed a framework in his PhD for dealing with 'evolving
dynamic Bayesian networks'. Osunmakinde & Bagula (2009) have applied
temporal probabilistic reasoning for emergent situational awareness that is
generated without any input from domain experts. The BPDA approach has
much simpler requirements for temporal reasoning. It will involve linking to
historical and real-time or near real-time databases and/or empirical and
numerical models. It does not require the higher level reasoning that is
required for situational awareness. Automatic engineering can already be used
to learn from other models, in particular, high resolution models of embedded
units (for example, in Borsuk et al., 2004), which often have complex data sets
of their own to interpret, if every variable is taken into account in the model.
It is therefore feasible that the BPDA approach can, in the future, be
developed to incorporate automatic learning from real-time data feeds because
Univers
ity O
f Cap
e Tow
n

349
it helps researchers and decision-makers distinguish between observational
and interventional variables. In this way, observational variables (new and
old) can be identified and monitoring programmes can be put in place, which
can be used to update Bayesian network sensitivities over time.
9.3.3 Converging Manual & Automatic Engineering
It is doubtful that pure automatic engineering techniques could produce
the complex models formulated in the case studies conducted in this
dissertation. Generating Bayesian models such as those formulated in this
dissertation requires verification and validation by human beings, so that a
complex system can be integrated in order to address a particular problem
context.
The long term view for the BPDA approach is that both processes of
manual and automatic engineering can be combined in a single software
framework, although this is beyond the scope of this dissertation. The BaBe
framework (illustrated in Figure 47), a patented agent-based Bayesian engine,
holds some promise in this regard. As illustrated in the figure, the Babe
contains three levels of agents, which can be grouped to form agencies, in a
heterarchical manner. Real-time feeder agents are feeds that can be distributed
at remote sources (e.g. real-time databases) to collect streamed data.
Reasoning agents are agents which ‘reason’ using rules, logical models,
deductive models and inference based models to make decisions about
information that is collected by real-time feeder agents. Competence agents
lie at a higher level of decision-making within the framework and can make
decisions or ‘intervene’ upon the system, using a fair level of intelligence,
currently. This framework is still under development but we envisage that in
future, the BPDA approach will provide the capability to provide near real-
time decision support.
Univers
ity O
f Cap
e Tow
n

350
DISTRIBUTED EVIRONMENTData Store
Data Store
Real-time Feeder Agents
Internal Model:EvolvingHyper-
structures
Data Store Data Store
Learning AgenciesReasoning
Agencies
Competence Agencies
Manual Emergent Engineering
Tacit Knowledge(process graphs)
Automatic Emergent Engineering
1. REPOSITORY
2. META MODEL
3. CREATE/IMPORT MODELS & ARTIFACTS
4. EXTRACT REPOSITORY INFO
Supports Gartner’s Requirements:
Sisyphus OMT Phase IIISisyphus OMT Phases I & II
Sisyphus Phase II
Developed by CSIR & CAS Pty Ltd
Figure 47: Sisyphus Software Structure: Sisyphus is enabled by the BaBe (Bayesian behavioural) framework of feeder, learning, reasoning and competence agents (Peter C, 2008: from Potgieter, 2005)
Univers
ity O
f Cap
e Tow
n

351
9.4 Can Bayesian Hyperstructures Support Dynamic Systems and Agent-Based Models
9.4.1 Bayesian Hyperstructures: Incorporating Dynamic Systems and Agent-Based Models
The information contained in the graphical causal models and
underlying the sensitivities exhibited by Bayesian networks helps define the
requirements for dynamic systems and agent based models. System feedbacks
are determined and resilience stability regimes and thresholds may be derived
and compared against empirical data and expert opinion. High resolution
numerical modelling, observational data and evidence and explicit feedback
modelling and analysis may be used to verify interdisciplinary hypotheses.
Total Adult Biomass
Growth Rate & Abundance
FisheriesOfftake
Spawning
SHRIMP BIOPHYSICAL
PRODUCTION
Juvenile ShrimpRecruitment
Biomass
Food Supply
Total MangroveStocks
MPB Biomass
N Fixation
Avicennia Stocks
Other MangroveStocks
Salinityin Mangroves
River Flow
Juvenile GrowthRate
Juvenile ShrimpAbundance
PreviousMarine spawning
Stock (adult)
Natural MortalityRate for Adults
Wood for Construction Wood
For Fuel
Juvenile Shrimp Abundance
Juvenile Shrimp Recruitment Biomass
Spawning Stock
TotalMangrove Stocks
Previous Spawning Stock
Avicennia Mangrove Stocks
Other Mangrove Stocks
MPB Biomass Stock: Food
Salinity Level
+
-
-
-
PredatorProtection
+
Mortality Rate = f(Predator Protection, Tot Mangrove Stock)
Mortality Rate
N-fixation Rate =
f(Salinity Level(-))+ +
Figure 48: How Dynamic Systems Models are Derived Using Bayesian Networks
Univers
ity O
f Cap
e Tow
n

352
The BPDA approach is not restricted to the limitations of systems
models; which are based on defining stocks, flows, leads and lags of the
system. In dynamic systems models, flows define the interaction between
variables whereas in Bayesian and graphical causal models causal relations
(initiating, resulting, enabling, defining and combinations thereof) are used to
articulate interactions between variables. In the graphical causal model (and
Bayesian nets), stocks and flows are defined as variables linked by causal
relations (or influences) and are linked to variables that may not be
‘assessable’ using measurements (e.g. aesthetic judgements, which may only
be subjectively assessable).
In Figure 48, a systems diagram consisting of stocks and flows are
derived from a graphical causal model. Note how rates are defined in relation
to the variables considered in the Bayesian network e.g. nitrogen fixation rate
is expressed as a function of salinity levels, which in turn is a function of river
flow. The top-down interpretation of the system is therefore derived from a
perspective that considers a wider range of variables in a trace-able fashion,
some of which are qualitatively defined.
However, the language of systems theory; stocks, flows, leads and lags
does not adequately account for the full spectrum of causal inter-relationships
that may exist between social-ecological systems processes, actors/agents,
components, functions, values etc. The information contained in the graphical
causal models and the sensitivities exhibited by Bayesian networks helps
define the requirements for dynamic systems and agent based models. System
feedbacks can be determined and resilience stability regimes and thresholds
may be derived and compared against empirical data and expert opinion. High
resolution numerical modelling, observational data and evidence and explicit
feedback modelling and analysis may be used to verify interdisciplinary
hypotheses that are tendered in explanation of observed behaviours and
correlations.
Agent based models require a good understanding of the rules under
which an agent may be programmed. Defining the system from a perspective
Univers
ity O
f Cap
e Tow
n

353
of causal influences made explicit in causal maps (such as in the BPDA
approach), therefore provides a useful framework for definition of agent and
agent environments. The different causal paths of influence available to an
agent; to respond to - or affect the system is made explicit. Agent
environment can be described in terms of the causal mechanisms available to
the agent to intervene upon, and helps understand how what is observed is
causally related to these points of intervention.
Using the BPDA approach more avenues of influence available to an
agent is made explicit than when using traditional soft system methodologies.
For example, different possible response strategies may be devised from an
integrated view of the system and a greater variety of system interventions for
an agent may be conceived. For instance, the strategy of an agricultural
manager may be played out against that of water, energy and forestry
managers. The agricultural manager may discover that managing within the
constraints of the agricultural sector alone may be an insufficient strategy.
The influence of the agricultural manager in other key sectors may in fact be
equally necessary for survival of the agricultural sector. Moreover traditional
management controls within the agricultural sector may be assessed and a
greater number of leverage points within the system elucidated through
sensitivity analysis.
Using agents, other high resolution models and data sets can be
directly linked to the Bayesian framework, which can integrate these inputs
and a broader framework. In this way more detailed spatial and temporal
trends can be accommodated in the network. Learning and reasoning is
performed in terms of learning from historical data and characterizing the
probability distributions and uncertainty associated with variables - which can
be extended to include real-time data feeds and inputs in future.
The strength of computer-based Bayesian models is that they can be
made dynamic in several ways. Spatial, temporal and agent-based dynamics
may be assessed using the Bayesian methodology; all of which are important
for social-ecological system complexity. In future it is hoped that some
Univers
ity O
f Cap
e Tow
n

354
progress will be made towards exploring how agents can potentially be used
for learning, reasoning and decision-making in the system - and to represent
decision-making sub-systems and people that have a significant influence on
the system.
9.4.2 Visualising Real-Time Evolution of System in Heterarchical Framework
The heterarchical hyperstructure argued for in the BPDA approach is
an adaptive hyperstructure. As such, it can be adapted to reflect real-world
changes that influence the system in question at different scales and levels of
inquiry. In particular, the hyperstructures used in the BPDA approach enable
both upward and downward directions of systems analysis (i.e. the downward
direction of analysis or reductionism, and the upward direction of holism or
emergence (Peter 2008, pp. 487). In this dissertation, we showed how a
heterarchical hyperstructure based approach (i.e. BPDA) is employed as a
mechanism for ensuring democratic interaction between disciplines and
guiding cross-disciplinary research and case studies into large-scale social-
ecological systems.
In this dissertation we used Bayesian networks and graphical causal
maps as hyperstructures that helped understand and reason about system
sensitivities and dependencies in a variety of case studies relating to social-
ecological systems problems. For each case study, a set of hyperstructures can
be used to help create shared understanding that bridges disciplinary divides
and focuses and orients participatory research and decision-making processes.
In the future, we aim to extend the BPDA methodology by making full use of
the BaBe agent-based Bayesian behavioural modelling framework to enable
distributed real-time data feeds, in order to provide near real-time modelling
for decision support.
The causal ‘fishnet’ enabled by graphical causal maps and Bayesian
networks, provide a framework in which the evolution of causal influence
sensitivities can be illustrated, as shown in Figure 49, where agents (in red) are
Univers
ity O
f Cap
e Tow
n

355
assigned (i.e. learning, reasoning and competence agents) to real-time or near
real-time databases, and automatically update the sensitivities in the Bayesian
network, as shown by the white causal chains in Figure 50 and Figure 51.
Different causal chains may then rise to significance in the hierarchy as
sensitivities are automatically updated from information drawn from real-time
or near-real time data feeds.
Univers
ity O
f Cap
e Tow
n

356
k
i
Q
b
G h
Sa
d
H
F z
ce
t
U
o
s
u w
J
v
z3
Kf
qT
D
N
VE
A
r
MP
Z
z1
O R
I
L z2
mC
g
l n xB
X
j
y
Yp
A
A
A
AAA
A
A
A
AA
A
A
AA
A A
AA
HYPERSTRUCTURE
SYSTEMS, AGENT-BASED MODELS AND LEARNING FROM HISTORICAL DATABASES AND REAL-TIME DATA FEEDS
Knowledge Set 1
Knowledge2
KnowledgeSet 3
Knowledge Set 4
A
Figure 49: Heterarchical Causal Framework for Visualising System Evolution in Real-Time (Peter 2008)
Univers
ity O
f Cap
e Tow
n

357
k
i
Q
b
G h
S
a
d
H
Fz
c
e
t
U
o
s
uw
J
v
z3
Kf
qT
D
N
VE
A
r
M
P
Z
z1
O R
I
L z2
mC
g
l n xB
X
j
y
Yp
A
A
A
AAA
A
A
A
AA
A
A
AA
A
A
A
AA
Knowledge Set 1
Knowledge2
KnowledgeSet 3
Knowledge Set 4
SYSTEMS, AGENT-BASED MODELS AND LEARNING FROM HISTORICAL DATABASES AND REAL-TIME DATA FEEDS
EVOLVING HYPERSTRUCTURE
k
i
Q
b
G h
S
a
d
H
F z
c
e
t
U
o
s
uw
J
v
z3
Kf
qT
D
N
VE
A
r
MP
Z
z1
O R
I
L z2
mC
g
l n xB
X
j
y
Yp
A
A
A
AAA
A
A
A
AA
A
A
AA
A
A
A
AA
Knowledge Set 1
Knowledge2
KnowledgeSet 3
Knowledge Set 4
SYSTEMS, AGENT-BASED MODELS AND LEARNING FROM HISTORICAL DATABASES AND REAL-TIME DATA FEEDS
EVOLVING HYPERSTRUCTURE
Causal Chain with Higher Authority (Significance)
AAgents collecting outputs of systems models, agent-based models & data-bases
Graphical Causal and Bayesian Model Nodes
A
B
Figure 50: Heterarchical Causal Framework for Visualising System Evolution in Real-Time A & B
Univers
ity O
f Cap
e Tow
n

358
k
i
Q
b
G h
S
a
d
H
Fz
c
e
t
U
o
s
uw
J
v
z3
Kf
qT
D
N
VE
A
r
M
P
Z
z1
O R
I
L z2
mC
g
l n xB
X
j
y
Yp
A
A
A
AAA
A
A
A
AA
A
A
AA
A
A
A
AA
Knowledge Set 1
Knowledge2
KnowledgeSet 3
Knowledge Set 4
SYSTEMS, AGENT-BASED MODELS AND LEARNING FROM HISTORICAL DATABASES AND REAL-TIME DATA FEEDS
EVOLVING
HYPERSTRUCTURES
k
i
Q
b
G h
S
a
d
H
F z
c
e
t
U
o
s
uw
J
v
z3
Kf
qT
D
N
VE
A
r
M
P
Z
z1
O R
I
L z2
mC
g
l n xB
X
j
y
Yp
Knowledge Set 1
Knowledge2
KnowledgeSet 3
Knowledge Set 4
A
A
A
AAA
A
A
A
AA
A
A
AA
A
A
A
AA
SYSTEMS, AGENT-BASED MODELS AND LEARNING FROM HISTORICAL DATABASES AND REAL-TIME DATA FEEDS
EVOLVING HYPERSTRUCTURES
Causal Chain with Higher Authority (Significance)
AAgents collecting outputs of systems models, agent-based models & data-bases
Graphical Causal and Bayesian Model Nodes
C
D
Figure 51: Heterarchical Causal Framework for Visualising System Evolution in Real-Time: C & D
Univers
ity O
f Cap
e Tow
n

359
B: Potential Responses and Options for adaptation:
- Possible system responses based on the ability to innovate or facilitate a chance mutation due to interconnections.
Adaptation:
Possible Responses
ExternalDrivers
Response
A B
CD
A: External Drivers:
-May be feedbacks, externalities
-Different scenarios, cross-scale relationships, conditional relations, etc.
C: System Adapts: Response based on :
-Automatic: Mechanistic Response
-Intelligent: Purposive Response
D: Adaptation
-Tested against external environment.
Systems and Learning
-Adaptation will not always have the desired effects.
-There will always be a ‘gap’ in
understanding/response.
Rule Set 1 Rule Set 2 Rule Set 3 Rule Set 4
Rule Set 1
Figure 52: The Dynamic Chain of Cause and Effect Relationships that Binds a System to its Environment of Systems
Deriving causal models of social-ecological system inter-relatedness
makes explicit the various causal relationships between a defined system and
its external environment. In Figure 52, a social-ecological system is viewed as
having a variety of possible responses (B) to an external influence (A). The
eventual response (C) may or may not lead to an adaptation (D) which helps
mitigate the undesired external influence (A). This may be interpreted within
a research framework as the conceptualisation of various scenarios (A),
possible strategies or responses (B), and a way of testing whether these
responses result in the appropriate adaptations (C and D).
For example, a variety of hypotheses may exist to explain
eutrophication of a lake, which is densely settled by humans. However,
researchers and stakeholders may disagree on the required responses to the
eutrophication problem both at the biophysical and socio-economic system
Univers
ity O
f Cap
e Tow
n
360
levels. An integrated response strategy may integrate community intervention
strategies, legal strategies, policy development strategies and biophysical
systems monitoring strategies.
The BPDA approach, as proposed, will support the representation and
testing of these diverse hypotheses and facilitate interdisciplinary scrutiny of
the general research integration strategy, and the integration of computer
models with empirical data and fieldwork (sampling or case study’s). These
may be used to obtain better understanding of system stability regimes and
resilience before an adaptation (or set of them) may be implemented.
9.5 Shared Understanding for Decision-Support in Adaptive Management
9.5.1 Understanding Resilience using Agents and Ontology’s
This dissertation is generally concerned with stimulating and
understanding resilience for improved adaptive governance and management
sustainability programmes:
1. Stimulating actual resilience of the system through strengthening
dialogue and cooperation amongst adaptive governance and
management programme participants. We make use of metaphors and
conceptual tools from resilience theory, such as resilience, the adaptive
cycle, panarchy and cross-scale interactions to obtain better mutual
understanding of the goals, objectives and opinions of various system
users and stakeholders. Through exploring this in a multi-participant
process, we enable a more ‘shared’ understanding of the desired and
undesired system states to be obtained by participants. In a sense, a
shared understanding or collective ‘self-awareness’ is encouraged
through a focused, facilitated dialogue. In particular, a more shared
understanding of the diverse beliefs, value systems and normative
Univers
ity O
f Cap
e Tow
n

361
views (as required by many authors including Ehrlich & Levin, 2006,
Max-Neef, 2005; Stern, 2000) may be obtained using the approach (see
later in section 9.5.3).
2. Improving the understanding of resilience by elucidating perceived
and measured thresholds, critical interdependencies (e.g. non-linear
feedbacks) within and between embedded units (e.g. cross-scale) in
relation in different future scenarios. The aim of the approach is to
create a better shared understanding of the mechanisms of resilience
and test this understanding through high-resolution sub-system models,
empirical observations and tests, and dynamic systems and agent-based
models.
These two aspects are coupled to each other in bringing about better
collective adaptive governance and management. Implicit to this view is the
idea that as shared understanding increases amongst the variety of researchers,
stakeholders and users involved in adaptive governance and management
programmes, so does the actual resilience of the system. Converting tacitly
held knowledge to explicit, shared knowledge boosts the effectiveness of the
social-network in question to overcome barriers and adapt to new challenges.
Causality is used to constrain the dialogue, but also to stimulate it. The
shared understanding of system interdependencies, critical thresholds and
agent-behaviours is visualised and elucidated in graphical causal models. In
this dissertation, it is claimed that the traditional soft systems language of
systems theory (i.e. stocks, flows, leads and lags) does not account for the full
spectrum of causal inter-relationships that may exist between social-ecological
systems processes, actors/agents, components, functions, values etc.
The approach proposed and tested in this dissertation aims to use
causal modelling to overcome the limitations of traditional systems theory
approaches (Checkland & Scholes, 1990) in facilitating the type of
transdisciplinary research and interaction for adaptive management. The
BPDA approach is based on using graphical causal maps and Bayesian
Univers
ity O
f Cap
e Tow
n
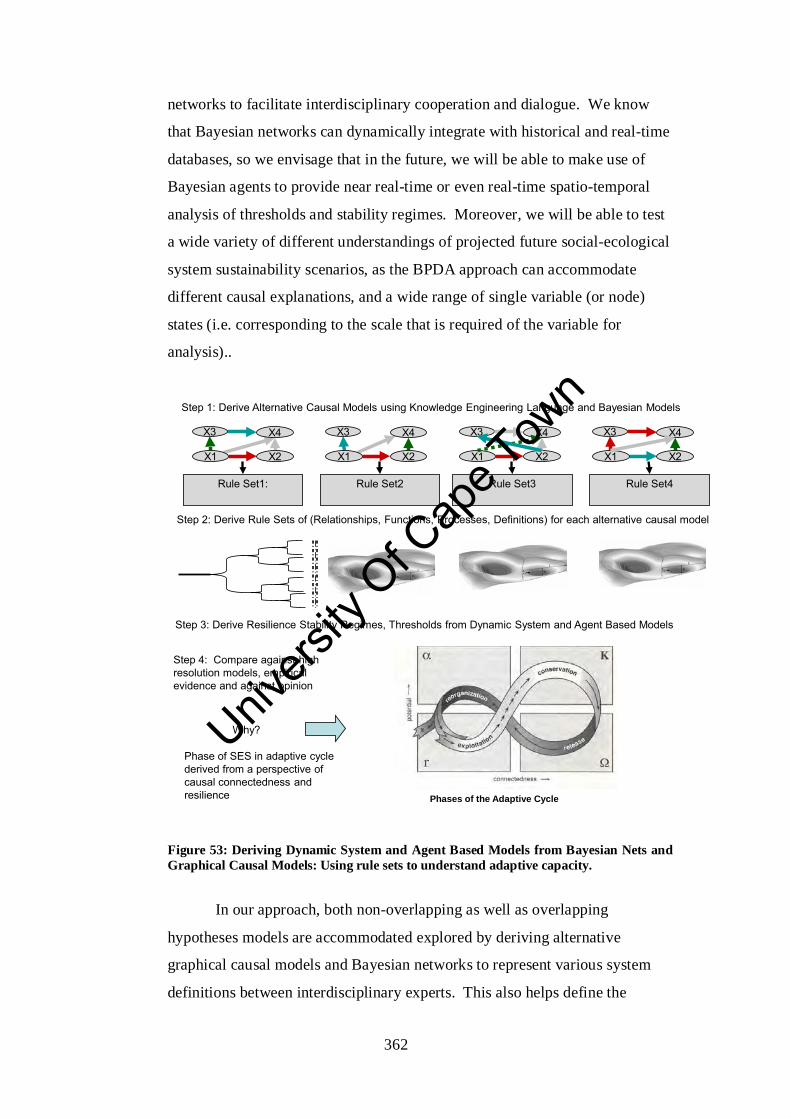
362
networks to facilitate interdisciplinary cooperation and dialogue. We know
that Bayesian networks can dynamically integrate with historical and real-time
databases, so we envisage that in the future, we will be able to make use of
Bayesian agents to provide near real-time or even real-time spatio-temporal
analysis of thresholds and stability regimes. Moreover, we will be able to test
a wide variety of different understandings of projected future social-ecological
system sustainability scenarios, as the BPDA approach can accommodate
different causal explanations, and a wide range of single variable (or node)
states (i.e. corresponding to the scale that is required of the variable for
analysis)..
X2
X4
X1
X3
X2
X4
X1
X3
X2
X4
X1
X3
X2
X4
X1
X3
Rule Set1: Rule Set2 Rule Set3 Rule Set4
Step 2: Derive Rule Sets of (Relationships, Functions, Processes, Definitions) for each alternative causal model
Phases of the Adaptive Cycle
Why?
Phase of SES in adaptive cycle derived from a perspective of causal connectedness and resilience
Step 1: Derive Alternative Causal Models using Knowledge Engineering Language and Bayesian Models
Step 3: Derive Resilience Stability Regimes, Thresholds from Dynamic System and Agent Based Models
Step 4: Compare against high resolution models, empirical evidence and against opinion
Figure 53: Deriving Dynamic System and Agent Based Models from Bayesian Nets and Graphical Causal Models: Using rule sets to understand adaptive capacity.
In our approach, both non-overlapping as well as overlapping
hypotheses models are accommodated explored by deriving alternative
graphical causal models and Bayesian networks to represent various system
definitions between interdisciplinary experts. This also helps define the
Univers
ity O
f Cap
e Tow
n

363
boundaries between variables that can be modeled in mathematical and
probabilistic fashion and those which are so subjective as to remove them
from quantifiable analysis.
The graphical causal models are software enabled to record
descriptions of the functional/mathematical ‘rule-set’ of each alternative
causal structure using parameters and thresholds based on state-based
descriptions as inputs to dynamic modelling and simulations (see Figure 53).
Dynamic systems models may then be derived from parameters, thresholds
and functions interpreted from the alternative causal Bayesian models.
Dynamic system models may be used to obtain stability regimes i.e. multiple
stable states and thresholds of embedded sub-system unit. Comparing the
resultant thresholds and stability regimes against historical and current
empirical evidence and observation enables more traceable and rigorous
verification of which mental model(s) best describes the system. Various rule
sets can be tested in this way against models, empirical data and expert
opinion. This understanding can be used in integration at the ‘whole’ system.
This, in turn, can be used to help establish a shared understanding of resilience
(in terms of threshold and critical limits) at the ‘whole’ systems scale and level
of description employed for analysis.
Where convergence between observed evidence and modeled
behaviours are found more confidence in the assumptions underlying the
correct model is obtained. Where disagreement is observed, the underlying
causal chain of sensitivities (and assumptions) can be analysed and tested in a
step-wise manner. The models therefore provide a verification capability that
can be used to engender deeper understanding of system sensitivities.
Through an iterative learning cycle it is hoped that a better context
governed understanding of the interconnectedness, resilience and stability
regimes of the social-ecological system may be obtained. Context refers to
historical and current state of the system, itself an emergent of the evolution of
interactions over time. Through this iterative learning process it is possible to:
Univers
ity O
f Cap
e Tow
n

364
1. Improve understanding of resilience through dynamic systems analysis
and agent based modeling.
2. Improve understanding of causal interconnectedness of the system
variables and between agents,
3. Improve understanding of system sensitivities and iteratively improve
them.
4. Reduce uncertainty in system variables,
5. Migrate modelling to agent-based techniques, and finally,
6. Furnish a coherent set of reasoning underlying the relationships,
sensitivities and uncertainties regarding system variables.
The phases of an adaptive cycle are defined by different combinations
of potential, resilience and connectedness, which change along the axes of an
adaptive cycle. Identifying which phase of an adaptive cycle a system may be
in is a valuable, sometimes critical input to adaptive management plans. The
factors mentioned in the list above may be used to inform the reasoning behind
which phase of the adaptive cycle the social-ecological system being
researched most likely resides in at present, and perhaps which phase it has
been in the past. Moreover, the traceability of the process enables easier
verification of the entire process of interdisciplinary cooperation and model
integration planning. This is achieved precisely through elucidating and
testing the:
• Causal interconnectedness of the social-ecological system components
and agents, and the,
• Resilience of overlapping and non-overlapping models of explanation.
Resilience theory views the evolution of social-ecological systems as
consisting of a four phase cycle i.e. the adaptive cycle. The four phases are
characterised by differences in resilience and connectedness as explained
earlier in this dissertation.
Resilience theory indicates that we need to account for cross-scale and
intra-scale influences. These are causal driver-response relationships of all
Univers
ity O
f Cap
e Tow
n

365
kinds; any change in a variable that produces a change in a variable which is
conditionally dependent upon it must be accounted for.
The BPDA approach attempts to link the conceptualised connectedness
envisaged by a crossdisciplinary group (i.e. the shared understanding) to the
stability (and instability) regimes of the system. It also aims to provide full
trace-ability of the underlying assumptions and logic thereof. The aim of the
approach is thus to provide a better way of understanding connectedness and
resilience of a social-ecological system. In doing so the evolutionary phase of
the adaptive cycle in which a social-ecological system is said to exist will be
trace-ably identified and verified. That is, by using the software enabled
Bayesian knowledge engineering language and by Bayesian sensitivity
analysis, dynamic systems modelling, respectively.
Knowledge of which phase of an adaptive cycle a social-ecological
system is regarded to currently exist is of key importance in conceptualising,
planning and implementing adaptive management strategies. An approach
such as the BPDA approach has the potential to facilitate trace-able iterative
learning as a system evolves through different phases of an adaptive cycle. It
may therefore prove valuable in the adaptive management of social-ecological
systems.
9.5.2 Understanding Agency, Resilience & Adaptive Management
One of the key advantages of the BPDA approach is that it can be used
to help establish which phase of an adaptive cycle a social-ecological system
may be in at a particular moment in time. Moreover, through scenario-based
testing of different interventions, it can also help envision how to either; keep
the social-ecological system in a particular phase (e.g. conservation), or
migrate it from one phase to another (.e.g from exploitation to conservation:
see Figure 54). Correctly understanding and classifying a social-ecological
system in terms of the phases of an adaptive cycle requires in-depth
Univers
ity O
f Cap
e Tow
n

366
knowledge of cross-scale and intra-scale sensitivities and of critical limits and
thresholds.
The BPDA approach is especially suited to this as the Bayesian
hyperstructures helps to distinguish cross-scale effects and to identify where
interventions can be made, and where only observations can be made. This
helps put in place monitoring systems for early warning and guides researchers
and decision-makers as to the system-level effects of interventions at any
particular level within the system, and in a variety of future scenarios. This
has the potential to benefit decision-makers in dealing with adaptation at
multiple scales of governance.
Univers
ity O
f Cap
e Tow
n
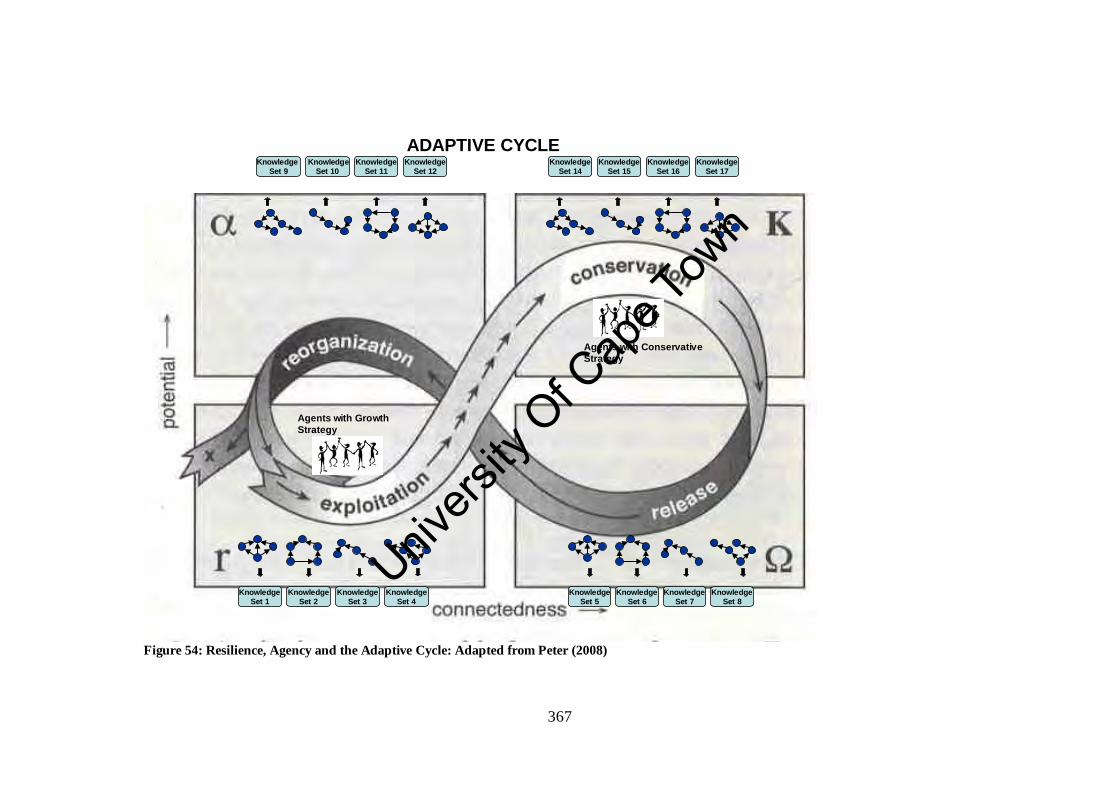
367
KnowledgeSet 1
KnowledgeSet 2
KnowledgeSet 3
KnowledgeSet 4
KnowledgeSet 12
KnowledgeSet 11
KnowledgeSet 10
Knowledge Set 9
KnowledgeSet 17
KnowledgeSet 16
KnowledgeSet 15
KnowledgeSet 14
KnowledgeSet 5
KnowledgeSet 6
KnowledgeSet 7
KnowledgeSet 8
ADAPTIVE CYCLE
Agents with Conservative Strategy
Agents with Growth Strategy
Figure 54: Resilience, Agency and the Adaptive Cycle: Adapted from Peter (2008)
Univers
ity O
f Cap
e Tow
n

368
9.5.3 Accommodating Values, Beliefs, Norms & Behaviours
Establishing the required norms and behaviours that are
required for sustainable decision-making and actions, requires understanding
the ‘nature and origin of filters’ (Peter, 2008, in Clarke, 2003) in order to
formulate actions that bring about sustainability. The BPDA approach allows
for multiple hypotheses and levels of description to be formulated, precisely in
order to facilitate learning, participation, negotiation and cooperation at all
decision-making levels and across sectors.
In this section we deal with the future of the BPDA approach
in accommodating the higher level frameworks of reasoning used by agents
and actors in the system i.e. within a framework of values, beliefs, norms and
behaviours. The rationale for this is shown in Figure 55 (which is detailed at
length in Peter (2008, pp. 496-498), and can be summarised as follows, in
reference to Figure 55. The BPDA approach, if extended to include full agent-
based modelling, will be able to follow the complex analytical chain from A –
E, as shown in Figure 55, thereby aligning with the requirements for
elucidating, understanding and analysing the various elements of the VBN
chain. That is, we are not testing predictions about how norms and behaviours
will evolve; we merely test what possible norms and behaviours may exist, or
may result from a set of decisions and actions or interventions. We suggest
that the five phases listed below serve as a future framework in which we can
envisage extending the BPDA approach to accommodate the values, beliefs
and norms of agents or system actors, all in aid of obtaining a deeper
understanding of the ‘rule sets’ governing agent decision-making and
behaviours.
A. Phase A involves using participatory workshops to formulate
shared understanding amongst workshop participants. The BPDA
approach can accommodate a wide variety of top-down
frameworks (e.g. TEV, human, manufactured and natural capitals),
Univers
ity O
f Cap
e Tow
n

369
and allows for new indices to be determined and verified. Most
importantly, it allows for exchange of views and creating the
shared understanding and transparency that is required for adaptive
management processes to be yield successful coordinated
programmes that bring about the desired results.
B. Graphical causal maps and Bayesian networks are used to capture
the belief structure underlying the model and the constraints,
parameters and equations underlying the belief structure,
respectively.
C. Phase C involves assessing what effect the belief structures
formulated in step B may have on the required, observed and
projected norms. This can be conducted in discussions between
cross-disciplinary workshop participants.
D. Phase D involves using rule sets for the norms, and the knowledge
of decision-maker constraints (such as the distinction between
observational and interventional variables, and knowledge of cross-
sector and cross-scale effects) to formulate an understanding of
agent environments and constraints. In addition to using Bayesian
inference to derive critical limits and thresholds, in future, it is
envisaged that virtual agents could play out scenarios and help
refine understanding of their effect on critical limits and thresholds.
In this way a variety of different possible adaptations can be tested,
at a variety of different levels of detail and scale.
E. Phase E involves coping with emergence or surprise. We have
already shown how the hyperstructures can be manually updated
(or adapted) to accommodate unexpected real-world changes in the
case studies conducted in this dissertation. In future, we would like
to develop the automatic engineering of emergence i.e. where real-
time data-bases (e.g. weather, stock prices) are monitored by
agents, and used to automatically update the hyperstructures as
Univers
ity O
f Cap
e Tow
n

370
changes unfold, as shown in the previous sections (see Figure 50 &
Figure 51). By obtaining a deeper understanding of system agents
and actors we aim to model their roles in social-ecological systems
more appropriately.
Univers
ity O
f Cap
e Tow
n

371
Values Beliefs Norms Behaviours EmergenceSelf Organisation
Self Organisation
Self Organisation
Self Organisation
Self Organisation
Self Organisation
Self Organisation
Self Organisation
Total Economic Value Conceptual Framework
Framework for Transdisciplinarity
Research for ActioningSustainable Development:
Learning, Participation, Integration
Interpret causal belief structures into Bayesian Belief Networks which capture:
Structures of beliefs regarding organization of resources, agents, rights, behaviours, norms and values etc.
We test these causal belief structures which describe different perspectives on social-ecological system organization. We relate these causal belief structures to a norm or set of norms by providing the full context underlying the beliefs in hypothesized causal relations
We relate these causal belief structures to a norm or set of norms by providign the full context underlying the beliefs in hypothesized causal relations.
Emergence and self-organisation relative to the levels of description chosen to probe and uncover system. Emergence results from:
-Agency
- Social networks
- Non-linearity
-‘Engineering SES Resilience’ (Peter et al, 2007)
Agent-based models used to assess behaviours generated from norms.
Complexity-based approach.
(1) (2) (3)
(1)
(2)(3)
(1) = (x1,…,xn)
(2) = (y1, …, yn)(3) = (x1, …zn)
e.g. crimee.g. breakdown in truste.g. self-preservation
A B C D E
e.g. socio-economic Inequality
Figure 55: Framework for Adaptive Management of Social-Ecological Systems (Peter C 2008: adapted from Stern 2002)
Univers
ity O
f Cap
e Tow
n

372
Univers
ity O
f Cap
e Tow
n

373
9.5.4 Representing Multiple Mental Models of High Uncertainty Decision-Making Scenarios
The BPDA approach also helps elucidate and articulate the complex linkages,
sensitivities, thresholds and scales and the underlying framework of assumptions that
is required to elucidate the spaces in which decision-making is considered
‘decideable’ and ‘undecideable’.
In Figure 56 a description is given of a situation where a decision-making
strategy of one ecosystem user may conflict with others and it is unclear which
strategy should be adopted. In these cases a simple binary proposition isn’t helpful
for decision-making; there is no clear ‘yes’ or ‘no’ decision. Alternative causal
models can be used to represent the various mental models of the multiple stakeholder
and decision-maker group. In the BPDA approach graphical causal maps and
Bayesian nets are used to derive probabilistic models representing the sensitivities of
causal influences. These, in turn may be used to derive different rule sets for
competing proposed responses. These rule sets can be used to compose scenarios in
Bayesian networks and the results can be tested against cross-disciplinary scrutiny,
real-world evidence over time, validating or invalidating some explanations above
others. While this may not address the full range and complexity of agent behaviours,
it is nonetheless a valuable complementary framework that can be broadened, in
future, to help define agents in terms of rule sets, constraints, boundary conditions and
extent of influence. This could feasibly be used to better assess roles and
responsibilities where collective actions are concerned in much the same way agent-
based simulations are used for decision-making today, but with more cross-
disciplinary rigour and trace-ability around agent characterisation.
Univers
ity O
f Cap
e Tow
n

374
‘Zone of Undecideability’:
How we deal with undecideability i.e. elucidating context in which undecideability emerges
+/YES -/NO
-/NO
Rule Set 1 Rule Set 2 Rule Set 3
+/YES
Clear Opposites - Either/Or; Yes/No Type of Decision:
Unclear Opposites - Neither Yes or No options exist clearly:
Zone of Undecideability:
-Usually trans and interdisciplinary variables under consideration. Alternative perceptions arise as they emerge from the study of different contexts.
Alternative Causal Conditional Relationship Structures:
-How conditional causal relationships (hypotheses) compare in different contexts (Scenarios, Thresholds, Pressures, Constraints, Structure).
Derived into Bayesian Nets
-Captures sensitivities of causal conditional relationships (linear/non-linear) –enables hypotheses testing. They may be quantitatively or qualitatively defined and multiple scales: cross-scale relationships accomodated
Verification of Rule Sets:
-Test Against Real and Virtual Observations: Empirical Evidence, High Resolution Simulations, Artificial Neural Nets, Fuzzy Logic, Random Matrices
-Constant re-calibration to context: history, memory and latent or possible system states required for full contextual understanding of thresholds
Derive Rule Sets:
-Thresholds, parameters, functional relationships, uncertainties, sensitivities used to run
Rule Set 4
Figure 56: How we Deal with Undecideability: We elucidating context in which undecideability emerges
Univers
ity O
f Cap
e Tow
n

375
10. Summary and Conclusions
To summarise, in this dissertation we showed that the BPDA approach is a
complexity-based approach for dealing with the challenge of integration in social-
ecological systems research, that is; research that has the ultimate purpose of
supporting sustainable development research and adaptive management programmes.
A great deal of effort was made in this dissertation to develop and test an approach
that had practical value, but which was also soundly grounded in complexity theory.
As such, this dissertation draws heavily on philosophical concepts for its foundation,
but also devotes a great deal of attention to implementing and testing the approach
through a series of case studies that incrementally increased in complexity.
However, throughout this dissertation, it is acknowledged that there is no
single approach or methodology that can sufficiently cope with a system in all its real-
world complexity. That is, the BPDA approach does not seek to model systems
exhaustively but aims to keep the contextually relevant variables continually present
in the analytical space that forms the basis for shared understanding.
As a general framework for dealing with the complex challenges facing
attempts at sustainable development the BPDA approach has enormous potential for
application, and in a variety of problem domains. We have argued for future
avenues of development that could extend that approach beyond its current capacity to
support decision-making i.e. to near real-time and real-time simulation.
The hyperstructures serve as a quantitative interface for pattern-matching
between conceptualised and observed or modelled empirical understandings of the
social-ecological system problem under study. Moreover, the distinction between
observational and interventional variables is made evident in a Bayesian network
(Meder, 2005; Waldmann & Hagmayer, 2005), and categories can evolve as
understanding of causal relationships unfolds (Waldmann & Hagmayer, 2006). This
provides a critical insight into the differences between what needs to be measured,
and what needs to be acted upon. As such it provides a valuable research and
Univers
ity O
f Cap
e Tow
n

376
decision-making framework. Monitoring programmes and intervention programmes
(e.g. adaptation and mitigation) can be set up with a clear understanding of the
boundaries of knowledge regarding the system and what needs to be done to obtain a
better understanding of the system over time. We have shown how this is achievable
in the case studies conducted in support of this dissertation.
Our broad conclusions regarding the BPDA approach is that; (1)
hyperstructures provide a causality-based framework for interdisciplinary interaction
and thereby enable a simple and human-intuitive framework for reasoning, and (2)
that this includes reasoning about drivers, responses, influences, interdependencies,
constraints, thresholds and limits of the ‘whole’ system in relation to its sub-systems
in a joint bottom-up and top-down framework. Hyperstructures are also an effective
mechanism for facilitating constructive dialogue and debate around social-ecological
system futures and engendering shared understanding. Bayesian networks, in
particular, offer the benefit of integrating both observational and interventional
learning in a single framework, while maintaining the distinction between them. It
also helps understand what is observable (can be monitored) and what can be
intervened upon (influenced), and allows for causal relationships and categories to
evolve. The heterarchical approach provides a framework in which categories always
overlap, even if causal models do not. The heterarchy of graphical causal maps and
Bayesian networks enable a framework of overlapping categories that are not strictly
structured in a bottom-up or top-down fashion. The BPDA approach also provides a
methodological framework that is largely un-restricted by disciplinary boundaries,
scale and non-linearity. As such, the BPDA approach accommodates a wide range of
the requirements for conducting research into social-ecological systems i.e. from the
perspective of the emerging theories of complexity and resilience.
As demonstrated in this dissertation, the BPDA approach is one way to
provide an unbiased framework in which different disciplinary perspectives can be
shared, scrutinised, integrated into a research design, and tested, and adapted as new
understanding unfolds. It provides a democratic framework for testing hypotheses
evidence and opinions; regarding the question of what leads to system behaviours of
concern in the study. It therefore satisfies the requirements set out by de Wit (2001)
in a PhD dissertation. De Wit (2001) emphasized the role of “multiple-loop learning
Univers
ity O
f Cap
e Tow
n

377
frameworks” (2001, pp. 154) for advancing towards merging theory with practise in
the arena of “economic policy making for complex and dynamic environmental
problems”.
The BPDA approach is a new way of integrating between researchers
themselves, and researchers, decision-makers and stakeholders tasked with ensuring
sustainable development, and requiring adaptive management approaches. The
BPDA approach has its own limitations, but its strengths are sufficient to provide a
valuable contribution to the field of sustainability. Some of these limitations can
feasibly be dealt with in the future (as outlined in the previous section). The BPDA
approach can be implemented in a number of different areas of research and may be
generalised to deal with case studies in general, although not exhaustively.
The BPDA approach also has a clear direction for future development, where
it can be extended to deal with greater levels of decision-making, and research and
modelling integration challenges. It has not been explored to its full potential in this
dissertation. However, even as presented and tested in this dissertation, the BPDA
approach provides a new and hopefully valuable contribution to the field of
sustainability research. It also integrates well with historical and newly emerging
theories that attempt to shed light on the complexity of social-ecological systems (e.g.
resilience theory) and sustainable development (e.g. action research). We intend to
build on the research conducted in this dissertation, and to extend the BPDA
framework, as far as is valuable, in respect of its potential to help visualise cross-
sectoral development and sustainability of economic development in terms of its
resource relationships.
In conclusion, as a formalism, graphical causal maps and Bayesian networks
satisfy all the requirements for modelling the complexity of social-ecological systems
at a bio-physical level that were identified in this dissertation. We showed how, by
using the BPDA approach, the challenges of dealing with scale and non-linearity, for
example, can be overcome. Moreover, it helps engender shared understanding
between diverse participants in research programmes. We also showed how, in
theory, the approach could be extended in future to accommodate full agent-based
support for near real-time and real-time simulations.
Univers
ity O
f Cap
e Tow
n

378
In the BPDA approach the hyperstructures are heterarchical. These
hyperstructures therefore constitute an adaptive, evolutionary formalism. We
explained how we think that the approach could, in future, be expanded to learn from
data sources in real-time or near real-time, and play an even greater role in decision
support. While we can only speculate as to the future of the BPDA approach, the
approach, as applied to social-ecological systems, provides valuable insights that can
be extended to help provide a more inclusive, and evolutionary perspective of
economic systems in relation to the key challenge of economic development. That is,
that economic development does not occur in isolation and involves social and
ecological systems perspectives to be included in order for sustainability to be
realised. Moreover, nuances regarding the balance between the development
trajectories of different sectors can be more important for ensuring whole system
sustainability in relation to the available resource base.
The BPDA approach, by accommodating embedded units and variables at
massive scale, enables a wide range of future scenarios and adaptation options to be
envisaged and tested. This is in contrast to predictive modelling approaches, which
seek to predict future system trajectories. By allowing for a greater number and
variety of system variables to be analysed, a more varied analysis can be conducted
around, for example; balancing multi-sectoral growth in relation to a range of
forecasted and projected resource limitations. As such, the BPDA approach is not a
theory of development or economics, but rather it seeks to provide a formalism to
match a model to its particular context in an adaptive manner. Heterachy ensures that
an evolutionary perspective is maintained.
The BPDA approach enables a shared understanding of a complex, adaptive
system to be maintained, while it is adapted and changed. As such, it has the potential
to contribute to a variety of problems and case studies that researchers’ and decision-
makers may be concerned with currently, and in the future.
Univers
ity O
f Cap
e Tow
n

379
11. References
Allen, T.F.H., Tainter, J.A., Hoekstra, T.W. (1999). Supply-side sustainability. Syst.
Res. Behav. Sci., 16 (5), 403–427.
Allen, T.F.H., Zellmer, A.J., Wuennenberg, C. (2005). The loss of narrative. In
Cuddington, K., Beisner, B.E. (Eds.), Ecological Paradigms Lost: Routes to
Theory Change. Academic Press, New York, pp. 333–370.
Allenby, B. (2006). The ontologies of industrial ecology? [electronic version].
Progress in Industrial Ecology, 3 (1-2), 28-40.
Anderies, J.M., Janssen, M.A., Ostrom, E. (2004). A framework to analyse the
robustness of social-ecological systems from an institutional perspective
[electronic version]. Ecology & Society, 9(1), 18, URL:
http://www.ecologyandsociety.org/vol9/iss1/art18/ .
Anderson, J. R. (1991). The adaptive nature of human categorization. Psychological
Review, 98, 409-429.
April, K. (2004). A Resource-Based View of the Firm: Integrating The Role of IT as a
Strategic Resource: An Empirical Study of South African Personal Financial
Services Firms: 1999-2003. Unpublished PhD Dissertation, Graduate School
of Business, University of Cape Town & Templeton College, University of
Oxford, August 2004, pp. 1 - 531.
Ashby, W.R. (1962). Principles of the self-organizing system [electronic version]. In
Von Foerster H. & Zopfr, Jr, G.W. (Eds.), The principles of self-organization:
Transactions of the University of Illinois Symposium, London, Pergamon
Press, pp. 255-278.
Univers
ity http://www.ecologyandsociety.org/vol9/iss1/art18/
Univers
ity http://www.ecologyandsociety.org/vol9/iss1/art18/
Univers
ity
Anderson, J. R. (1991). The adaptive nature of human categorization.
Univers
ity
Anderson, J. R. (1991). The adaptive nature of human categorization.
409
Univers
ity
409-
Univers
ity
-429.
Univers
ity
429.
April, K. (2004).Univers
ity
April, K. (2004). A ResourceUnivers
ity
A Resource
Strategic Resource: Univers
ity
Strategic Resource:
Of ecological systems from an institutional perspective
Of ecological systems from an institutional perspective
Ecology & Society
Of Ecology & Society
http://www.ecologyandsociety.org/vol9/iss1/art18/Of http://www.ecologyandsociety.org/vol9/iss1/art18/Of C
ape
Anderies, J.M., Janssen, M.A., Ostrom, E. (2004). A framework to analyse the
Cape
Anderies, J.M., Janssen, M.A., Ostrom, E. (2004). A framework to analyse the
ecological systems from an institutional perspective Cape
ecological systems from an institutional perspective
Ecology & SocietyCape
Ecology & Society
Town
trial ecology?
Town
trial ecology? [electronic version]
Town
[electronic version]

380
Ashby W. R. (1964). An Introduction to Cybernetics [electronic version]. Methuen,
London, 1964.
Ashby, F. G., Waldron, E. M., Lee, W. W., & Berkman, A. (2001). Suboptimality in
human categorization and identification [electronic version]. Journal of
Experimental Psychology: General, 130, 77-96.
Ashton, P. J. (2002). Avoiding conflicts over Africa’s water [electronic version].
Ambio, 31(3), 236- 242.
Baas, N. A., & Emmeche, C. (1997). On emergence and explanation. Intellectica, 25,
67-83. Retrieved March 22, 2001, from
http://www.nbi.dk/~emmeche/coPubl/97d.NABCE/ExplEmer.html
Banisch, M. (2002). Derrida, Schmitt and the essence of the political [electronic
version]. Refereed paper presented as part of the Political Theory Stream
Jubilee Conference of the Australasian Political Studies Association,
Australian National University, Canberra, Australia.
Baran, E., Jantunen, T. (2004) Stakeholder consultation for Bayesian decision support
systems in environmental management. Proceedings of the Regional
Conference on Ecological and Environmental Modeling (ECOMOD 2004),
Universiti Sains Malaysia, 15-16 September 2004, Penang, Malaysia.
Beer, S. (1992). World in Torment [electronic version]. URL:
http://www.ototsky.mgn.ru/it/papers/world_in_torment.pdf
Bennet, E.M., Cumming, G.S., & Peterson, G.D. (2005). A systems model approach
to determining resilience surrogates for case studies [electronic version].
Ecosystems, 8, 1-14.
Berlin, I. (1969). Four Essays on Liberty. Oxford: Oxford University Press.
Univers
ity
T. (2004)
Univers
ity
T. (2004) Stakeholder consultation for Bay
Univers
ity
Stakeholder consultation for Bay
systems in environmental management.
Univers
ity
systems in environmental management.
Univers
ity
Conference on Ecological and Environmental Modeling (ECOMOD 2004),
Univers
ity
Conference on Ecological and Environmental Modeling (ECOMOD 2004),
Universiti Sains Malaysia, 15
Univers
ity
Universiti Sains Malaysia, 15
Of Jubilee Conference of the Australasian Political Studies Association,
Of Jubilee Conference of the Australasian Political Studies Association,
Australian National University Of Australian National University, Canberra, Australia.Of , Canberra, Australia.Cap
e Banisch, M. (2002). Derrida, Schmitt and the essence of the political [electronic
Cape Banisch, M. (2002). Derrida, Schmitt and the essence of the political [electronic
. Refereed paper presented as part of the Political Theory Stream
Cape
. Refereed paper presented as part of the Political Theory Stream
Jubilee Conference of the Australasian Political Studies Association, Cape
Jubilee Conference of the Australasian Political Studies Association,
Town Emmeche, C. (1997). On emergence and explanation.
Town Emmeche, C. (1997). On emergence and explanation. Intellectica
Town Intellectica
83. Retrieved March 22, 2001, from
Town 83. Retrieved March 22, 2001, from
http://www.nbi.dk/~emmeche/coPubl/97d.NABCE/ExplEmer.htmlTown
http://www.nbi.dk/~emmeche/coPubl/97d.NABCE/ExplEmer.html

381
Bijker, W.E., Hughes, T.P. & Pinch, T. (Eds.) (1997). The Social Construction of
Technological Systems. Cambridge, MIT Press.
Blignaut, J., & de Wit, M.P. (2004). Sustainable options: Development lessons from
applied environmental economics. Cape Town: University of Cape Town
Press.
Boulding, K. E. (1956). General systems theory – the skeleton of science.
Management Science, 2(3), 197-264.
Borsuk, M. E., Stow, C. A. and Reckhow, K. H. (2004). A Bayesian network of
eutrophication models for synthesis, prediction and uncertainty analysis,
Ecological Modelling, ISSN 0304-3800, 173, 219-239.
Bromley J., Jackson N. A., Clymer O. J., Giacomello A. M., Jensen F. V. (2005). The
use of Hugin to develop Bayesian networks as an aid to integrated water
resource planning, Environmental Modelling and Software, 20, 231-242.
Carpenter, S. R. (2002). Ecological Futures: Building an ecology of the long now,
Ecology, 83, 2069–2083.
Campbell, D. T. (1974). Downward causation in hierarchically organized biological
systems. In Ayala F.J., & Dobzhansky T. (Eds.) Studies in the Philosophy of
Biology, New York, Macmillan.
Cash, D.W.W., Adger, W.N., Berkes, F., Garden, P., Lebel, L., Olsson, P., Pritchard,
L., & Young, O. (2006). Scale and cross-scale dynamics: governance and
information in a multilevel world [electronic copy]. Ecology and Society,
11(2), 8.
Univers
ity
Carpenter, S. R. (2002). Ecological Futu
Univers
ity
Carpenter, S. R. (2002). Ecological Futu
,
Univers
ity
, 2069
Univers
ity
2069–
Univers
ity
–2083.
Univers
ity
2083.
Of ayesian networks as an aid to integrated water
Of ayesian networks as an aid to integrated water
Environmental Modelling and Software
Of Environmental Modelling and SoftwareCape
Bromley J., Jackson N. A., Clymer O. J., Giacomello A. M., Jensen F. V. (2005).
Cape
Bromley J., Jackson N. A., Clymer O. J., Giacomello A. M., Jensen F. V. (2005).
ayesian networks as an aid to integrated water Cape
ayesian networks as an aid to integrated water
Environmental Modelling and SoftwareCape
Environmental Modelling and Software
Town (2004). A Bayesian network of
Town (2004). A Bayesian network of
eutrophication models for synthesis, prediction and uncertainty a
Town eutrophication models for synthesis, prediction and uncertainty a
239.Town
239.

382
Clarke, K. (2003). The limits of simplicity: toward geocomputational honesty in urban
modelling. Proceedings of the 7th International Conference on
Geocomputation, Southampton, UK.
Clark, K. (2005). Why environmental scientists are becoming Bayesians. Ecology
Letters, 8, 2–14.
Clarke, K., Crutzen, P.J., & Schellnhuber, H.J. (2004). Science for global
sustainability: Towards a new paradigm. In Schellnhuber, H.J., Crutzen, P.J.,
Clark, W.C., Claussen, M. & Held, H. (Eds.), Earth system analysis for
sustainability, Cambridge MA: M.I.T. Press, pp. 1-28.
Capra, F. (1997). The web of life (2nd ed). Great Britain, Flamingo.
Cariani, P. (1991). A review of emergence and artificial life. In Langton, C., Taylor,
C., Farmer, J. & Rasmussen, S. (Eds.), Artificial Life II, Vol. X of Santa Fe
Institute Studies in the Sciences of Complexity, Addison-Wesley, Reading,
pp. 775-797.
CCSAPWC (2007). A Climate change strategy and action plan for the Western Cape:
Final, Department of Environmental Affairs and Planning, Western Province,
South Africa.
Checkland, P.B. (1985). From optimising to learning: a development of systems
thinking for the 1990s [electronic version]. Journal of Operational Research
Society, 36, 757-767.
Checkland, P.B., & Scholes, J. (1990). Soft systems methodology in action. Wiley,
Chichester.
Univers
ity Institute Studies in the Sciences of Complexity
Univers
ity Institute Studies in the Sciences of Complexity
CCSAPWC (2007). A Climate change strategy and action plan for the Western Cape:
Univers
ity
CCSAPWC (2007). A Climate change strategy and action plan for the Western Cape:
Univers
ity
Final, Department of Environmental Affairs and Planning, Western Province,
Univers
ity
Final, Department of Environmental Affairs and Planning, Western Province,
South Africa.Univers
ity
South Africa.
Of Cariani, P. (1991). A review of emergence and artificial life.
Of Cariani, P. (1991). A review of emergence and artificial life.
C., Farmer, J. & Rasmussen, S.Of C., Farmer, J. & Rasmussen, S. (EOf (EdsOf ds
Cape Great Britain
Cape Great Britain,
Cape , Flamingo
Cape Flamingo
Cariani, P. (1991). A review of emergence and artificial life.Cape
Cariani, P. (1991). A review of emergence and artificial life.
Town sustainability: Towards a new paradigm. In Schellnhuber, H.J., Crutzen, P.J.,
Town sustainability: Towards a new paradigm. In Schellnhuber, H.J., Crutzen, P.J.,
Earth system analysis for
Town Earth system analysis for
, pp. 1 Town
, pp. 1- Town
-28Town
28. Town
.

383
Cilliers, P. (2001). Boundaries, hierarchies and networks in complex systems.
International Journal of Innovation Management, 179-186.
Cilliers, P. (2008). Complexity theory as a general framework for sustainability
science. In Burns, M. & Weaver, A. (Eds), Exploring sustainability science: A
Southern African perspective (1st ed). Stellenbosch, Sun Press, pp. 39-57.
Cook, T.D., & Campbell, D.T. (1979). Quasi-experimentation: Design and analysis
for field settings, Chicago, Illinois, Rand McNally.
Costanza, R., & Daly, H.E. (1992). Natural capital and sustainable development
[electronic version]. Conservation Biology, 6(1), 37-46.
Cundill, G. (2008). Adaptive co-management under resource-poor conditions. In A.
Weaver, & M. Burns (Eds), Exploring Sustainability Science: A Southern
African Perspective, Stellenbosch, SUN Press, pp. 471-505.
Dawid, A. P. (2002). Influence diagrams for causal modelling and influence.
International Statistical Review, ISSN 0306-7734, 70 (2): 161–189.
Derrida, J. (1992). ‘Force of law: “The mystical foundation” of authority’, in D.
Cornell, In Rosenfeld, M., & Carlson D. (Eds.), Deconstruction and the
Possibility of Justice, New York: Routledge.
Dechter, R. (1996). Bucket elimination: A unifying framework for probabilistic
inference [electronic version]. Uncertainty in Artificial Intelligence, 196, 211-
219.
de Mendiguren Castresana, J.C.P. (2003). Productive uses of water at the household
level: evidence from Bushbuckridge, South Africa. International Symposium
Univers
ity 2002). Influence diagrams for causal modelling and i
Univers
ity 2002). Influence diagrams for causal modelling and i
Univers
ity
International Statistical Review,
Univers
ity
International Statistical Review,
Derrida, J. (1992). ‘Force of law: “The mystical foundation”
Univers
ity
Derrida, J. (1992). ‘Force of law: “The mystical foundation”
Cornell, In Rosenfeld, M.Univers
ity
Cornell, In Rosenfeld, M.
Possibility of JusticeUniv
ersity
Possibility of Justice
Of 2002). Influence diagrams for causal modelling and iOf 2002). Influence diagrams for causal modelling and i
Cape management under resource
Cape management under resource
Exploring Sustainability Science: A Southern
Cape Exploring Sustainability Science: A Southern
, Stellenbosch, SUN Press
Cape
, Stellenbosch, SUN Press, pp. 471
Cape
, pp. 471
Town capital and sustainable development
Town capital and sustainable development
46
Town 46.
Town .
management under resourceTown
management under resource

384
on Water, Poverty and Productive uses of Water and the Household Level, 21-
22 January, Muldersdrift, South Africa.
de Rosnay J. (1979). The macroscope: a new world scientific system, HarperCollins.
De Wit, M., (2001). Economic policy making for complex and dynamic environmental
problems: A conceptual framework. Unpublished doctoral dissertation,
Department of Commerce, University of Pretoria, South Africa.
DME (2006). Draft biofuels industrial strategy of the Republic of South Africa.
Department of Minerals and Energy, South Africa.
DME (2007) Biofuels industrial strategy of the Republic of South Africa. Department
of Minerals and Energy, South Africa.
Dupré, J. (1993). The disorder of things: Metaphysical foundations of the disunity of
science. Cambridge MA, Harvard University Press.
Ehrlich, P.R., & Levin, S.A. (2005). The evolution of norms [electronic version].
Public Library of Science Biology, 6, 943-948.
Food and Agricultural Organisation (FAO) (2005). Aquastat: FAO’s Information
System on Water and Agriculture.
www.fao.org/ag/agl/aglw/aquastat/countries/south_africa/index.stm
Flood, R.L. (2001). The relation of systems thinking to action research. In Reason, P.
& Bradbury, H. (Eds.), Handbook of Action Research. London, Sage
Publications Ltd, pp. 133-144.
Folke, C., Hahn, T., Olsson, P., & Norberg, J. (2005). Adaptive governance of social-
ecological systems. Annu. Rev. Environ. Resour., 30, 441-473.
Folke, C., Carpenter, S., Elmqvist, T., Gunderson, L., Holling, C.S., Walker, B.,
Bengtsson, J., Berkes, F., Colding, J., Danell, K., Falkenmark, M., Gordon, L.,
Univers
ity (2005)
Univers
ity (2005).
Univers
ity .
Public Library of Science Biology
Univers
ity
Public Library of Science Biology
Food and Agricultural Organisation (FAO) (2005)
Univers
ity
Food and Agricultural Organisation (FAO) (2005)
Univers
ity
System on Water and Agriculture
Univers
ity
System on Water and Agriculture
www.fao.org/ag/agl/aglw/aquastat/countries/south_africa/index.stmUnivers
ity
www.fao.org/ag/agl/aglw/aquastat/countries/south_africa/index.stmUnivers
ity
www.fao.org/ag/agl/aglw/aquastat/countries/south_africa/index.stmUnivers
ity
www.fao.org/ag/agl/aglw/aquastat/countries/south_africa/index.stmUnivers
ity O
f Harvard University Press.
Of Harvard University Press.
The evolution of normsOf The evolution of norms
Cape
The disorder of things: Metaphysical foundations of the disunity of
Cape
The disorder of things: Metaphysical foundations of the disunity of
Harvard University Press.Cape
Harvard University Press.
Town
industrial strategy of the Republic of South Africa.Town
industrial strategy of the Republic of South Africa.

385
Kasperson, R., Kautsky, N., Kinzig, A., Levin, S., Maler, K-G., Moberg, F.,
Ohlsson, L., Olsson, P., Ostrom, E., Reid, W., Rockstrom, J., Savenije, H., &
Svedin, U. (2002). Resilience and Sustainable Development: Building
Adaptive Capacity in a World of Transformations, International Council for
Science, ICSU Series on Science for Sustainable Development, 3.
Gandhi, M., K. In Narayan S. (Ed.) (1968). The selected works of Mahatma Gandhi:
Satyagraha in South Africa. Ahmedabad: The Navajivan Trust.
Gell-Mann, M. (1994). The quark and the jaguar. New York: W H Freemen & Co.
Gibson, C.C., Ostron, E., & Ahn, T.K. (2000). The concept of scale and the human
dimensions of global change: a survey. Ecological Economics, 32, 217-239.
Gillaume, P., Tranouez, P., Bertelle, C., Olivier, D., Lerebourg, S. (2004).
Methodology for holarchic ecosystem model based on ontological tool. In
ESMc'2004 Conf., Paris (France), October 2004.
Glymour, C. N. (2001). The minds arrows: Bayes nets and graphical causal models in
psychology, ISBN 0262072203.
Glymour, Clark, Spirtes, P., and Scheines, R. (1993). Thinking things through, M.I.T.
Press.
Gunderson, L. H. (2000). Ecological resilience – in theory and application, Annual
Review of Ecology and Systematics, ISSN 0066-4162, 31, 425-39.
Gunderson, L.H., & Holling C.S. (Eds.). (2002). Panarchy: Understanding
transformations in human and natural systems, Washington DC, Island Press.
Gruber, T. R. (1995). Toward principles for the design of ontologies used for
knowledge sharing. International Journal of Human-Computer Studies, ISSN
1071-5819.
Univers
ity The minds arrows: Bayes nets and graphical causal models in
Univers
ity The minds arrows: Bayes nets and graphical causal models in
, ISBN 0262072203.
Univers
ity
, ISBN 0262072203.
, Spirtes, P., and Scheines, R. (1993).
Univers
ity
, Spirtes, P., and Scheines, R. (1993).
Of ESMc'2004 Conf., Paris (France), October 2004.
Of ESMc'2004 Conf., Paris (France), October 2004.
The minds arrows: Bayes nets and graphical causal models in Of The minds arrows: Bayes nets and graphical causal models in
Cape Gillaume, P., Tranouez, P., Bertelle, C., Olivier, D., Lerebourg, S. (2004).
Cape Gillaume, P., Tranouez, P., Bertelle, C., Olivier, D., Lerebourg, S. (2004).
Methodology for holarchic ecosystem model based on ontological t
Cape
Methodology for holarchic ecosystem model based on ontological t
ESMc'2004 Conf., Paris (France), October 2004.Cape
ESMc'2004 Conf., Paris (France), October 2004.
Town Gibson, C.C., Ostron, E., & Ahn, T.K. (2000). The concept of scale and the human
Town Gibson, C.C., Ostron, E., & Ahn, T.K. (2000). The concept of scale and the human
dimensions of global change: a survey. Ecological Economics, 32, 217Town
dimensions of global change: a survey. Ecological Economics, 32, 217

386
Gustavson, B. (2001). Theory and practise the mediating discourse. In Reason, P. &
Bradbury, H. (Eds.), Handbook of Action Research. London, Sage
Publications Ltd, pp.17-26.
Gershenson, C., & Heylighen, F. (2003). When can we call a system self-organizing?
[electronic version]. In Banzhaf, W. Christaller, T. Dittrich, P., Kim, J.T., &
Ziegler, J. (Eds.) Advances in artificial life, 7th European conference.
Dortmund. Springer, pp. 606-614.
Goodman, N. (1978). Ways of worldmaking. Indianapolis IND, Harvester Press.
Gregory, J.M., & Oerlemans, J. (2009). Simulated future sea-level rise due to glacier
melt based on regionally and seasonally resolved temperature changes. Nature,
391, 474-476.
Hassan, R.M., (2003). Economy-wide benefits from water-intensive industries in
South Africa: quasi-input–output analysis of the contribution of irrigation
agriculture and cultivated plantations in the Crocodile River catchment,
Development Southern Africa, 20, 2
Hacking, I. (2000). The social construction of what. Cambridge, MA: Harvard
University Press.
Heylighen, F., Cilliers, P., & Gershenson, C. (2007). Complexity and philosophy. In
Blogg, J., & Geyer, R (Eds), Complexity, science and society. Oxford:
Radcliffe Publishing.
Heylighen, F., Joslyn, C., & Turchin, V. (2001). Principia cybernetic web [online].
URL: http://pcp.lanl.gov/. (Last accessed March 18 2002 – in Potgieter 2004).
Helsper, E.M., & Van der Gaag, L.C. (2002). Building Bayesian networks through
ontologies. In van Harmelen, F. (Ed.), Proceedings of the 15th European
conference on artificial intelligence. Amsterdam. IOS Press, pp. 680-684.
Univers
ity Development Southern Africa,
Univers
ity Development Southern Africa, 20,
Univers
ity 20,
Univers
ity
The social construction of what
Univers
ity
The social construction of what
University Press.
Univers
ity
University Press.
Univers
ity
Heylighen, F., Cilliers, P., & Gershenson, C. (Univers
ity
Heylighen, F., Cilliers, P., & Gershenson, C. (
Of output analysis of the contribution of irriga
Of output analysis of the contribution of irriga
agriculture and cultivated plantations in the Crocodile River catchment, Of agriculture and cultivated plantations in the Crocodile River catchment,
20,Of
20,
Cape
wide benefits from water
Cape
wide benefits from water
output analysis of the contribution of irrigaCape
output analysis of the contribution of irriga
Town level rise du
Town level rise du
melt based on regionally and seasonally resolved temperature changes. Town
melt based on regionally and seasonally resolved temperature changes.

387
Hodgson, G. M. (1993) Economics and Evolution: Bringing Life Back Into
Economics. University Of Michigan Press & Polity Press.
Holland, J.H. (1995). Hidden order: how adaptation builds complexity. Reading MA:
Addison-Wesley.
Holling, C.S., Gunderson, L.H., & Ludwig, D. (2002). In quest of a theory of adaptive
change. In L.H. Gunderson, & C.S. Holling (Eds.), Panarchy: Understanding
transformations in human and natural systems. Washington DC, Island Press,
pp. 3-24.
Holling, C.S., & Gunderson, L.H. (2002). Resilience and adaptive cycles. In
Gunderson, L.H., & Holling C.S. (Eds.), Panarchy: Understanding
transformations in human and natural systems. (25-62), Washington DC,
Island Press.
Holling, C.S., Gunderson, L.H., & Peterson, G.D. (2002). Sustainability and
panarchies. In L.H. Gunderson, & C.S. Holling (Eds.), Panarchy:
Understanding transformations in human and natural systems. Washington
DC, Island Press, pp. 63-102.
Holling, C. S. (2004). From complex regions to complex worlds, Ecology and Society,
9 (1): 11
Hume, D. (1739/2000). A treatise of human nature. Oxford, Oxford University Press.
IKAPA GDS (2008). The Ikapa Growth and Development Strategy, Serves as a White
Paper for the Western Cape, Provincial Gazette Extraordinary 6500, Province
of the Western Cape [electronic version].
Ingram, J. (2007). Spatial and temporal scales and levels in human systems: some
examples in the context of food security. Presented at Regional Expert
Univers
ity Understanding transformations in human and natural systems
Univers
ity Understanding transformations in human and natural systems
, pp. 63
Univers
ity
, pp. 63
Univers
ity
-
Univers
ity
-102
Univers
ity
102.
Univers
ity
.
ng, C. S. (2004). From complex regi
Univers
ity
ng, C. S. (2004). From complex regi
9 (1): 11
Univers
ity
9 (1): 11
Of L.H., & Peterson, G.D
Of L.H., & Peterson, G.D
Gunderson, & C.SOf Gunderson, & C.S
Understanding transformations in human and natural systemsOf Understanding transformations in human and natural systems
Cape transformations in human and natural systems
Cape transformations in human and natural systems
L.H., & Peterson, G.DCape
L.H., & Peterson, G.D
Town Resilience and adaptive cycles. In
Town Resilience and adaptive cycles. In
Panarchy: Understanding Town
Panarchy: Understanding
(25Town
(25

388
Meeting, IPCC TGICA Expert Meeting Integrating Analysis of Regional
Climate Change and Response Options, 20-22 June 2007, Nadi, Fiji.
IPCC (2008). (Eds) Bates, B., Kundsewicz, Z.W., Wu, S., Palutikof, J., Climate
Change and Water, Intergovernmental Panel on Climate Change Technical
Paper VI, WMO, UNEP [electronic version].
Islam, G., Zyphur, M., J., Beal, D., J. (2006). Can a whole be greater than the sum of
its parts? A critical appraisal of “emergence”, IBMEC Working Paper - WPE –
11 – 2006, Sao Paulo: IBMEC.
Jackson, M.C. (1991). Systems methodology for the management sciences. New York,
Plenum.
Janse van Rensburg, J., Gorgens, AHM, (2001). Komati Basin: Juxtaposing
conflicting water resource interests via a water resources systems model. Tenth
South African National Hydrology Symposium, 26-28 September 2001.
Kates, R. W., & Clarke, W. C. (1996). Expecting the unexpected. Environment, 38
(2), 6-11.
Kates, R. W., & Dasgupta, P. (2007). African poverty: A grand challenge for
sustainability science, PNAS, 104 (43), 16747-16750.
Kintz, E. R. (2004). Considering the ties that bind: Kinship, marriage, household and
territory among the Maya [electronic version]. Ancient Mesoamerica, 15, 149-
158.
Koestler, A. and Smythies, J. (1969). Beyond reductionism. Hutchinson.
Kolman, K., Miller, J.H., & Page, S. (1997). Computational political economy. In
W.B. Arthur, S.N. Durlauf, , & D.A. Lane (Eds.), The economy as an evolving
complex system II. Reading MA, Addison-Wesley, pp 463.
Univers
ity Clarke, W. C. (1996). Expecting the u
Univers
ity Clarke, W. C. (1996). Expecting the u
Univers
ity
Kates, R. W., &
Univers
ity
Kates, R. W., & Dasgupta, P. (2007). African poverty: A grand challenge for
Univers
ity
Dasgupta, P. (2007). African poverty: A grand challenge for
Univers
ity
sustainability science, Univers
ity
sustainability science,
Of South African National Hydrology Symposium
Of South African National Hydrology SymposiumCape (
Cape (2001
Cape 2001)
Cape ). Komati Basin: Juxtaposing
Cape . Komati Basin: Juxtaposing
conflicting water resource interests via a water resources sCape
conflicting water resource interests via a water resources s
South African National Hydrology SymposiumCape
South African National Hydrology Symposium
Town
Systems methodology for the management sciences
Town
Systems methodology for the management sciences

389
Kuhn, T. S. (1962). Structure of scientific revolutions. Chicago, ILL: Chicago
University Press.
Kuhn T. S. (1970). The structure of scientific revolutions. Chicago: Chicago
University Press.
Lamberts, S.W.J. (2006). Adaptive networks: the governance for sustainable
development [electronic version]. Netherlands, Eburon Publishers.
Lemmer, W. (2006). Bio-ethanol production in the Western Cape: value adding to
winter cereal through ethanol, DDGS, and CO2 production. Department of
Agriculture, Western Cape.
Levin, S.A. (2006). Learning to live in a global commons: Socio-economic challenges
for a sustainable environment [electronic version]. Ecological Research
Special Feature, 21, 328-333.
Levins, R. (1968). Evolution in changing environments. Princeton, Princeton
University Press.
Lien, Y., & Cheng, P. W. (2000). Distinguishing genuine from spurious causes: A
coherence hypothesis. Cognitive Psychology, 40, 87-137.
Lubchenco, J. (1998). Entering the century of the environment: A new social contract
for science [electronic version]. Science, 279, 491-497.
MacCracken, M. (2001). Prediction versus projection: forecast versus possibility.
WeatherZine, 26, URL: http://sciencepolicy.colorado. edu/zine/archives/1-
29/26/index.html
Max-Neef, M. A. (1991). Human Scale Development. New York & London, APEX
Press.
Univers
ity Evolution in c
Univers
ity Evolution in changing environments
Univers
ity hanging environments
Lien, Y., & Cheng, P. W. (2
Univers
ity
Lien, Y., & Cheng, P. W. (2
Univers
ity
000). Distinguishing genuine from spurious causes: A
Univers
ity
000). Distinguishing genuine from spurious causes: A
coherence hypothesis.
Univers
ity
coherence hypothesis.
Of hanging environmentsOf hanging environments
Cape Learning to live in a global comm
Cape Learning to live in a global commons: Socio
Cape ons: Socio
[electronic version]
Cape
[electronic version]
Town ethanol production in the Western Cape: value adding to
Town ethanol production in the Western Cape: value adding to
winter cereal through ethanol, DDGS, and CO2 production. Department of
Town winter cereal through ethanol, DDGS, and CO2 production. Department of
390
Max-Neef, M.A. (2005). Foundations of transdisciplinarity [electronic version].
Ecological Economics, 53, 5-16.
Malhotra, Y. (1999). Toward a knowledge ecology for organizational white-
waters [electronic version]. Knowledge Management, 2(6), 18-21.
McCormick, R.J., Zellmer, A.J., Allen, T.F.H. (2004). Type, scale, and adaptive
narrative: keeping models of salmon, toxicology and risk alive to the
world. In Kapustka, L.A., Gilbraith, H., Luxon, M., Biddinger, G.R.
(Eds.), Landscape Ecology and Wildlife Habitat Evaluation: Critical
Information for Ecological Risk Assessment, Land-Use Management
Activities, and Biodiversity Enhancement Practices. ASTM STP 1458,
ASTM International, West Conshohocken, PA.
Meder, B., Hagmayer, Y., & Waldmann, M.R. (2005). Doing after seeing
[electronic version]. In Bara B.G., Barsalou L., & Bucciarelli M. (Eds.),
The Proceedings of the Twenty Seventh Annual Conference of the
Cognitive Science Society, Mahwah NJ, Erlbaum, pp. 1461-1466.
Meder, B., Hagmayer, Y., Waldmann, M.R. (2006). Understanding the causal
logic of confounds. In R. Sun, & N. Miyake (Eds), Proceedings of the
Twenty Eighth Annual Conference of the Cognitive Science Society, pp.
1461-1466.
Mendelsohn, R., Dinar A. and Dalfelt A. (2000). Climate change impacts on
African agriculture, Centre for Environmental Economics and Policy in
Africa.
Midgley, G.F., Chapman, R.A., Hewitson, B., Johnston, P., de Wit M.,
Ziervogel, G., Mukheibir, P., van Niekerk, L., Tadross, M., van Wilgen,
B.W., Kgope, B., Morant, P.D., Theron, A., Scholes, R.J., Forsyth, G.G.
(2005). A Status Quo, Vulnerability and Adaptation Assessment of the
Physical and Socio-economic Effects of Climate Change in the Western
Univers
ity
Meder, B., Hagmayer, Y., Waldmann,
Univers
ity
Meder, B., Hagmayer, Y., Waldmann, M.R. (2006). Understanding the causal
Univers
ity M.R. (2006). Understanding the causal
Univers
ity
logic of confounds. In
Univers
ity
logic of confounds. In R. Sun, & N. Miyake (Eds),
Univers
ity
R. Sun, & N. Miyake (Eds),
Twenty Eighth Annual Conference of the Cognitive Science Society
Univers
ity
Twenty Eighth Annual Conference of the Cognitive Science Society
1466.
Univers
ity
1466.
Of The Proceedings of the Twenty Seventh Annual Conference of the
Of The Proceedings of the Twenty Seventh Annual Conference of the
, Mahwah NJ,Of , Mahwah NJ,Cap
e Meder, B., Hagmayer, Y., & Waldmann, M.R. (2005). Doing after
Cape Meder, B., Hagmayer, Y., & Waldmann, M.R. (2005). Doing after
. In Bara B.G., Barsalou L., & Bucciarelli M. (Eds.),
Cape
. In Bara B.G., Barsalou L., & Bucciarelli M. (Eds.),
The Proceedings of the Twenty Seventh Annual Conference of the Cape
The Proceedings of the Twenty Seventh Annual Conference of the
Town Use Management
Town Use Management
. ASTM STP 1458,
Town . ASTM STP 1458,
391
Cape. Report to the Western Cape Government, Cape Town, South
Africa. CSIR Report No. ENV-S-C 2005-073, Stellenbosch.
MIT Technology Review (2007) Ethanol demand threatens food prices.
www.technologyreview.com/Energy/18173/ (accessed Feb 13, 2009)
Mitchell S. D. (2004) Why integrative pluralism? [electronic version]. In
Richardson, K.A., Goldstein, J.A., Allen, P.M., & Snowden D (Eds.),
E:CO Special Double Issue, 6 (1-2), 81-89. Mansfield MA, ISCE
Publishing.
Minsky, M. (1988). The Society of Mind (1st ed). New York: Simon & Schuster.
Monteiro, P. M. S. and Mathews, S. (2003). Catchment2Coast: Making the link
between coastal resource variability and river input, South African
Journal of Science, 99.
Monteiro, P.M.S., A. Pascall, N. Machava, J.L. Graça, E. André, (2007).
Biogeochemical characteristics of a tropical mangrove in a nutrient poor
river – coastal system. Council for Scientific and Industrial Research, In
prep for Estuarine, Coastal and Shelf Science in April 2007,
ftp://ftp.cordis.europa.eu/pub/inco/docs/coastal2/22_cat_2002_10059catc
hment_en.pdf .
Morin, E. (2007). Restricted complexity, general complexity. In Gershenson, C.,
Aerts, D. & Edmonds, B. (Eds.) Worldviews, science and us: Philosophy and
complexity. Singapore. World Scientific, pp. 5-29.
Mukheibir P., Sparks, D., 2003. Water resource management and climate change in
South Africa: Visions, driving factors and sustainable development
indicators, April 2003, Report for Phase I of the Sustainable Development
Univers
ity eochemical characteristics of a tropical mangrove in a nutrient poor
Univers
ity eochemical characteristics of a tropical mangrove in a nutrient poor
coastal system.
Univers
ity
coastal system. Council for Scientific and Industrial Research, In
Univers
ity
Council for Scientific and Industrial Research, In
prep for Estuarine, Coastal and Shelf Science in April 2007,
Univers
ity
prep for Estuarine, Coastal and Shelf Science in April 2007,
ftp://ftp.cordis.europa.eu/pub/inco/docs/coastal2/22_cat_2002_10059catc
Univers
ity
ftp://ftp.cordis.europa.eu/pub/inco/docs/coastal2/22_cat_2002_10059catc
Univers
ity
hment_en.pdf
Univers
ity
hment_en.pdf
Univers
ity
.
Univers
ity
. hment_en.pdf . hment_en.pdf
Univers
ity
hment_en.pdf . hment_en.pdf
Of Monteiro, P.M.S., A. Pascall, N. Machava, J.L. Graça, E. André,Of Monteiro, P.M.S., A. Pascall, N. Machava, J.L. Graça, E. André,
eochemical characteristics of a tropical mangrove in a nutrient poor Of eochemical characteristics of a tropical mangrove in a nutrient poor
Cape Monteiro, P. M. S. and Mathews, S. (2003). Catchment2Coast: Making the link
Cape Monteiro, P. M. S. and Mathews, S. (2003). Catchment2Coast: Making the link
between coastal resource variability and river input,
Cape between coastal resource variability and river input, South African
Cape South African
Town New York: Simon &
Town New York: Simon & Schuster
Town Schuster
Monteiro, P. M. S. and Mathews, S. (2003). Catchment2Coast: Making the link Town
Monteiro, P. M. S. and Mathews, S. (2003). Catchment2Coast: Making the link

392
and Climate Change project, Energy and Development Research Centre
(EDRC), University of Cape Town.
Murakami, H. (2008). After dark. Vintage Books (First Published as “Afutadaku” by
Kodansha, Tokyo in 2004).
Musango, J., & Peter, C. (2007). A Bayesian approach towards facilitating climate
change adaptation research on the South African agricultural sector. South
African Journal of Agricultural Economics, 46(2), 245-259.
Nadkarni, S. & Shenoy. P. (2004). A causal mapping approach to constructing
Bayesian networks [electronic version]. Decision Support Systems, 38, 259-
281.
Nicolescu, B. (2000). Levels of reality as a source of quantum indeterminacy. In F.
Tito Arecchi F. T. (Ed.). Roma: Determinismo e complessit`a, Fondazione
Nova Spes and Armando Editore, 2000, pp. 127-158.
Nkomo, S., Van der Zaag, P. (2003). Equitable water allocation in a heavily
committed international catchment area: the case of the Komati Catchment,
15th – 17th October, 2003, 4th WaterNet/WARFSA Annual Symposium:
Water, Science, Technology and Policy: Convergence and Action by all,
Gabarone.
Nozick, R. (2001). Invariances: The structure of the objective world. Cambridge,
MA: Harvard University Press.
Univers
ity Levels of reality as a source of quantum indeterminacy
Univers
ity Levels of reality as a source of quantum indeterminacy
Tito Arecchi F. T. (Ed.). Roma: Determinismo e co
Univers
ity
Tito Arecchi F. T. (Ed.). Roma: Determinismo e co
Univers
ity
Nova Spes and Armando Editore, 2000, pp. 127
Univers
ity
Nova Spes and Armando Editore, 2000, pp. 127
Nkomo, S., Van der Zaag, P.Univers
ity
Nkomo, S., Van der Zaag, P.
Of Levels of reality as a source of quantum indeterminacyOf Levels of reality as a source of quantum indeterminacy
Cape Decision Support S
Cape Decision Support STow
n A causal mapping approach to constructing Tow
n A causal mapping approach to constructing
Decision Support STown
Decision Support S

393
Osunmakinde, Isaac (2009) Computational intelligent systems: Evolving dynamic
Bayesian networks. Unpublished doctoral dissertation, Department of
Computer Science, University of Cape Town.
Osunmakinde, I O and A Bagula (2009) Emergent future situation awareness: A
temporal probabilistic reasoning in the absence of domain experts. In
Kolehmainen et al., M. , (Eds.) Proceedings ICANNGA 2009 5495, pages
340-349.
Pahl-Wostl, C. (2007). The implications of complexity for integrated resource
management [electronic version]. Environmental Modelling and Software,
22, 561-569.
Pearl, J. (1988). Probabilistic reasoning in intelligent systems: Networks of
plausible inference (2nd ed). San Mateo, USA, Morgan Kauffman Publishers.
Perlas, N. (2000). Shaping globalization: civil society, cultural power and
threefolding. Co-published by the Centre for Alternative Development
Studies & The Novalis Press. Cape Town, Falcon Press.
Peter, C. Potgieter, A.G.E., Monteiro P.M.S. (2007). Engineering social-ecological
system resilience. In Kay, R. & Richardson, K.A. (Eds.), Building and
Sustaining Resilience in Complex Organizations, Pre-proceedings of the 1st
international workshop on complexity and organizational resilience, MA,
ISCE Publishing, MA, pp.35-64.
Peter, C., Meder, B., von Maltitz, G., van der Merwe, M., (2007*). Analysing
Analysis! A Study of Causal Reasoning for Complex Biophysical Problem-
Univers
ity Shaping globalization: civil society, cultural power and
Univers
ity Shaping globalization: civil society, cultural power and
published by the Centre for Alternative Development
Univers
ity
published by the Centre for Alternative Development
& The Novalis Press. Cape Town,
Univers
ity
& The Novalis Press. Cape Town,
Peter, C. Potgieter, A.G.E., Monteiro P.M.S.Univers
ity
Peter, C. Potgieter, A.G.E., Monteiro P.M.S.
Of Shaping globalization: civil society, cultural power and Of Shaping globalization: civil society, cultural power and
Cape Probabilistic reasoning in intelligent systems
Cape Probabilistic reasoning in intelligent systems
). San Mateo, USA
Cape
). San Mateo, USA,
Cape
, Morgan Kauffman Publishers.
Cape
Morgan Kauffman Publishers.
Town
Environmental Modelling and Software
Town
Environmental Modelling and Software

394
Solving and Hypotheses Making, Council for Scientific and Industrial
Research, GWDS Number: Pretorial General, 143891.
Peter, C., Monteiro, P., M., S. De Wit, M. (2007). Understanding the socio-
ecological complexity of water allocation in coupled river – coastal systems:
A Bayesian approach for linking the Incomati Catchment & Maputo Bay
systems, Journal of Ecological Economics, provisionally accepted Nov 2007
(In Prep for resubmission).
Peter, C., Musango, J. K., De Lange, W. (2007). Case study of national climate
change, water storage, irrigated agriculture and biofuel - food security
relationships: Using Bayesian networks to model the impact of climate
change scenarios on biofuels production from irrigated agriculture –
analyzing water, energy and food sector interdependencies. Presented at
Regional Expert Meeting, IPCC TGICA Expert Meeting Integrating Analysis
of Regional Climate Change and Response Options, 20-22 June 2007, Nadi,
Fiji.
Peter, C. (2008). Complexity based modeling for sustainability and resilience of
social-ecological systems. In A. Weaver, & M. Burns (Eds), Exploring
Sustainability Science: A Southern African Perspective, Stellenbosch, SUN
Press, pp. 471-505.
Peter, C., de Lange, W., Musango, J.K., April, K., Potgieter, A.G.E. (2009).
Applying Bayesian modelling to assess climate change impacts on biofuel
production, Climate Research, (Accepted September 2009: In Press).
Univers
ity
Complexity based m
Univers
ity
Complexity based m
ecological s
Univers
ity
ecological systems
Univers
ity
ystems
Univers
ity
Sustainability Science: A Southern African PerspectiveUnivers
ity
Sustainability Science: A Southern African Perspective
pp. 471Univers
ity
pp. 471
Of of Regional Climate Change and Response Options
Of of Regional Climate Change and Response OptionsCape ge scenarios on biofuels production from irrigated agriculture
Cape ge scenarios on biofuels production from irrigated agriculture
sector interdependencies.
Cape sector interdependencies.
, IPCC TGICA Expert Meeting Integrating Analysis
Cape
, IPCC TGICA Expert Meeting Integrating Analysis
Cape
of Regional Climate Change and Response OptionsCape
of Regional Climate Change and Response Options
Town Peter, C., Musango, J. K., De Lange, W. (2007). Case study of national climate
Town Peter, C., Musango, J. K., De Lange, W. (2007). Case study of national climate
change, water storage, irrigated agriculture and biofuel
Town change, water storage, irrigated agriculture and biofuel -
Town - food security
Town food security
relationships: Using Bayesian networks to model the impact of climate Town
relationships: Using Bayesian networks to model the impact of climate
ge scenarios on biofuels production from irrigated agriculture Town
ge scenarios on biofuels production from irrigated agriculture

395
Peirce, C. S. (1934). Collected papers of Charles Sanders Peirce, Volume 5. Charles
Hartshorne, C. and Paul Weiss, P, (Eds.). Cambridge, Mass, Harvard
University Press, pp. 156.
Pepper, S.C. (1926). Emergence. The Journal of Philosophy, 23(9), 241-245.
Peterson, G.D., Allen, C.R., & Holling, C.S. (1998). Ecological resilience,
biodiversity and scale [electronic version]. Ecosystems, 1, 6-18.
Peterson, G.D., Cumming, G.S., & Carpenter, S.R. (2003). Scenario planning: a tool
for conservation in an uncertain world [electronic version]. Conservation
Biology, 17(2), 358-366.
Piaget, J., 1963. The origins of intelligence in children. New York, W.W. Norton &
Company, Inc.
Plummer, R. & Armitage, D. (2007). A resilience-based framework for evaluating
adaptive co-management: Linking ecology, economics and society in a
complex world [electronic version]. Ecological Economics, 61, 62-74.
Potgieter, A.E.G. (2004). The engineering of emergence in complex adaptive systems.
Unpublished doctoral dissertation, Faculty of Engineering, Built Environment
and Information Technology, University of Pretoria, South Africa.
Putnam, H. (1975). The meaning of "meaning". In H. Putnam, Mind, language, and
reality. Philosophical papers (Vol. 2, pp. 215-271). London, Cambridge
University Press.
Putnam, H. (1987). The many faces of realism. LaSalle, ILL: Open Court.
RCCSAPWC (2008). Analytical Review of Western Cape Climate Change Strategy
and Action Plan: Water and Energy as Integrators. By Peter C., Council for
Scientific & Industrial Resources, Natural Resources and Environment,
Univers
ity management: Lin
Univers
ity management: Lin
[electronic version]
Univers
ity [electronic version]
Potgieter, A.E.G. (2004).
Univers
ity
Potgieter, A.E.G. (2004). The engineering of emergence in complex adaptive systems.
Univers
ity
The engineering of emergence in complex adaptive systems.
Unpublished doctoral dissertation, Faculty of Engineering, Bu
Univers
ity
Unpublished doctoral dissertation, Faculty of Engineering, Bu
Univers
ity
and Information Technology, University of Pretoria, South Africa.Univers
ity
and Information Technology, University of Pretoria, South Africa.
Of Plummer, R. & Armitage, D. (2007). A resilience
Of Plummer, R. & Armitage, D. (2007). A resilience
management: Lin Of management: Linking ecology, economics and society in a Of
king ecology, economics and society in a management: Linking ecology, economics and society in a management: Lin Of management: Linking ecology, economics and society in a management: Lin
Cape hildren
Cape hildren.
Cape . New York,
Cape New York,
Plummer, R. & Armitage, D. (2007). A resilienceCape
Plummer, R. & Armitage, D. (2007). A resilience
Town
Scenario planning: a tool
Town
Scenario planning: a tool
ic version]
Town ic version].
Town . Conservation
Town Conservation
New York, Town
New York,
396
Sustainability Science Group, for Department of Environmental Assessment
and Development Planning, Western Cape Provincial Government, South
Africa. Report number PTA General #174799.
Reilly J (1999). What does climate change mean for agriculture in developing
countries? A Comment on Mendelsohn and Dinar [electronic version]. The
World Band Research Observer, 14(2), 295-305.
Rehder, B., & Hastie, R. (2004). Category coherence and category-based property
induction. Cognition, 91, 113-153.
Richardson, K.A. (2002). On the limits of bottom-up computer simulation: Towards a
nonlinear modelling culture [electronic version]. Proceedings of the 36th
Hawaii International Conference on System Sciences, 7-10 January, 2003
Hawaii, California, IEEE Computer Society.
Richardson, K. A. (2005). Systems theory and complexity: Part 3, E:CO Emergence,
Complexity and Organisation, ISCE Research, 7, 104-1144.
Richardson, K.A., & Cilliers, P. (2001). What is complexity science? A view from
different directions [electronic version]. Special Issue of Emergence, 3(1), 5-
22.
Riessman, C.K. (1993). Narrative analysis. Qualitative Research Methods Series 30:
A Sage University Paper, London, SAGE publications.
Ronald, E.M.A., Sipper, M., & Capcarrère, M.S. (1999). Design, observation,
surprise! A test of emergence, Artificial Life, 5 (3): 225-239.
Sarewitz, D., Pielke, R. A., & Byerly, R. (2000). Prediction: science, decision
making, and the future of nature. Washington D.C., Island Press.
SDIP (2007). Sustainable Development Implementation Plan [electronic version],
Environmental Evaluation Unit, Incite Sustainability.
Univers
ity
Richardson, K.A., & Cilliers, P
Univers
ity
Richardson, K.A., & Cilliers, P.
Univers
ity
. (2001)
Univers
ity
(2001)
fferent directions
Univers
ity
fferent directions [electronic version]
Univers
ity
[electronic version]
Riessman, C.K. Univers
ity
Riessman, C.K. Univers
ity
(1993). Narrative aUnivers
ity
(1993). Narrative a
Of Richardson, K. A. (2005). Systems theory and complexity: Part 3,
Of Richardson, K. A. (2005). Systems theory and complexity: Part 3,
Complexity and Organisation Of Complexity and Organisation, Of , ISCE Research, Of ISCE Research, Cap
e l Conference on System Sciences, 7
Cape l Conference on System Sciences, 7
IEEE Computer Society.
Cape IEEE Computer Society.
Richardson, K. A. (2005). Systems theory and complexity: Part 3, Cape
Richardson, K. A. (2005). Systems theory and complexity: Part 3,
Town up computer simulation: Towards a
Town up computer simulation: Towards a
[electronic version] Town
[electronic version]. Town
. Proceedings of the 36Town
Proceedings of the 36
l Conference on System Sciences, 7Town
l Conference on System Sciences, 7

397
SESWC (2007). Sustainable Energy Strategy for the Western Cape: Draft Summary
Document [electronic version], Department of Environmental Affairs and
Planning.
Sengo, D.J., Kachapila, A., van der Zaag, P., Mul, M. and Nkomo, S, (2004). Valuing
environmental water pulses into the Incomati estuary: key to achieving
equitable and sustainable utilisation of transboundary waters. Presented at the
5th Waternet/WARFSA Symposium, ‘Integrated Water Resources Management
and the Millenium Development Goals: Managing water for peace and
prosperity’, 2-4 November, Windhoek.
Serres, M. (1995/1982). Genesis. USA: University of Michigan Press. James, G. &
Nielson J. (translators). Originally published in French by Editions Grasset et
Fasquelle (1982).
Skyttner, L. (2001). General systems theory: Ideas and applications. River Edge, NJ,
World Scientific, ISBN 9810241755.
Sloman, S. A. (1994). When explanations compete: The role of explanatory coherence
on judgments of likelihood. Cognition, 52, 1-21.
Smuts, J. C. (1926). Holism and Evolution, MacMillan.
Sneddon, C., Howarth, R.B., & Norgaard, R.B. (2006). Sustainable development in a
post-Brundtland world [electronic version]. Ecological Economics, 57, 2, 253-
268.
Sorokine et al., (2005). Ontological Investigation of Ecosystem Hierarchies and
Formal Theory for Multi-scale Ecosystem Classifications [electronic version].
Geoinformatica, 10, 313-335.
Spirtes, P., Glymour, C. and Scheines, P. (1993). Causation, prediction, and search.
New York, Springer-Verlag.
Univers
ity
n explanations compete: The role of explanatory coherence
Univers
ity
n explanations compete: The role of explanatory coherence
on judgments of likelihood.
Univers
ity
on judgments of likelihood.
Smuts, J. C. (1926).
Univers
ity
Smuts, J. C. (1926). Holism and Evolution
Univers
ity
Holism and Evolution
Of theory: Ideas and applications
Of theory: Ideas and applications
World Scientific, ISBN 9810241755Of World Scientific, ISBN 9810241755Cap
e Nielson J. (translators). Originally published in French by Editions Grasset et
Cape Nielson J. (translators). Originally published in French by Editions Grasset et
theory: Ideas and applicationsCape
theory: Ideas and applications
Town
. USA: University of Michigan Press. JTown
. USA: University of Michigan Press. J
Nielson J. (translators). Originally published in French by Editions Grasset et Town
Nielson J. (translators). Originally published in French by Editions Grasset et

398
Starzomski, B. M., Cardinale, B. J., Dunne, J. A., Hillery, M. J., Holt, C. A.,
Krawchuk, M. A, Lage, M., McMahon, S. and Melnychuk, M. C. (2004).
Contemporary visions of progress in ecology and thoughts for the future,
Ecology and Society, ISSN 1708-3087, 9 (1), 14. URL:
http://www.ecologyandsociety.org/vol9/iss1/art14. (Last accessed 15 Nov
2007).
Statistics South Africa (2004). Provincial Profile 2004, Western Cape, South Africa.
Stern, P.C. (2000). Toward a coherent theory of environmentally significant
behaviour [electronic version]. Journal of Social Issues, 5(3), 407-424.
Strategy Study, Department of Water Affairs and Forestry, Directorate: National
Water Resource Planning.
Tansley, A. (1935). The use and abuse of vegetational concepts and terms. Ecology,
16(3), 299.
Thagard, P. (1999). How scientists explain disease. Princeton, NJ: Princeton
University Press.
TIA, 29 August 2002. Tripartite Interim Agreement between Mocambique, South
Africa and Swaziland for cooperation on the protection and sustainable
utilisation of water resources of the Incomati and Maputo watercourses,
Johannesburg.
TSB (2005/6). Tourism Sector Brief [electronic version], WESGRO, URL:
http://www.wesgro.co.za/publications/publications.asp?CatId=14
Van der Sluijs, J.P. (2007). Uncertainty and precaution in environmental
management: insights from UPEM conference [electronic version].
Environmental Modelling and Software, 22, 590-598.
Univers
ity
How scientists explain diseas
Univers
ity
How scientists explain diseas
University Press.
Univers
ity
University Press.
TIA, 29 August 2002. Tripartite Interim Agreement between Mocambique, South
Univers
ity
TIA, 29 August 2002. Tripartite Interim Agreement between Mocambique, South
Univers
ity
Africa and Swaziland for cooperation on the protection and sustainable Univers
ity
Africa and Swaziland for cooperation on the protection and sustainable
Of Tansley, A. (1935). The use and abuse of vegetational concepts and terms.
Of Tansley, A. (1935). The use and abuse of vegetational concepts and terms. Cape Strategy Study, Department of Water Affairs and Forestry, Directorate: National
Cape Strategy Study, Department of Water Affairs and Forestry, Directorate: National
Tansley, A. (1935). The use and abuse of vegetational concepts and terms. Cape
Tansley, A. (1935). The use and abuse of vegetational concepts and terms.
Town Toward a coherent theory of environmentally significant
Town Toward a coherent theory of environmentally significant
Journal of Social Issues
Town Journal of Social Issues, 5(3), 407
Town , 5(3), 407
Strategy Study, Department of Water Affairs and Forestry, Directorate: National Town
Strategy Study, Department of Water Affairs and Forestry, Directorate: National
399
Van Kerkhoff, L., & Lebel, L. (2006). Linking knowledge and action for sustainable
development [electronic version]. Annual Review of Environmental Resources,
31, 445-477.
Vellupillai, K. V. (2003). Economics and the complexity vision: chimerical partners
or Elysian Adventurers? [electronic version]. Dept of Economics, National
University of Ireland, Galway & Dept of Economics, University of Trento,
Italy: September 29.
Waldmann, M.R., & Hagmayer, Y. (2005). Seeing versus doing: Two modes of
accessing causal knowledge [electronic version]. Journal of Experimental
Psychology: Memory, Learning and Cognition, 31(2), 216-227.
Waldmann, M.R., & Hagmayer, Y. (2006). Categories and causality: The neglected
direction [electronic version]. Cognitive Psychology, 53, 27-58.
Walker, B., Holling, C.S., Carpenter, C.R., & Kinzig, A. (2004). Resilience,
adaptability and transformability in social-ecological systems. Ecology &
Society, 9(2), 5, URL: http://www.ecologyandsociety.org/vol9/iss2/art5
Walters, C. J. (1986). Adaptive management of renewable resources. New York,
Macmillan.
Wegener, M. (1994). Operational urban models: State of the art, Journal of the
American Planning Association, 60 (1), 17-30.
Witten G. Q. & Richardson F. D. (2001). Managing arid and semi-arid rangelands
accounting for the variability of key factors over space and time [electronic
version]. Arid Zone Ecology Forum, Calitzdorp, September 5-7.
WCSER (2003). Socio Economic Review [electronic version], Western Cape
Provincial Treasury.
Univers
ity http://www.ecologyandsociety.org/vol9/iss2/art5
Univers
ity http://www.ecologyandsociety.org/vol9/iss2/art5
Univers
ity
Univers
ity
Walters, C. J. (1986).
Univers
ity
Walters, C. J. (1986). Adaptive managem
Univers
ity
Adaptive managem
Univers
ity
egener, M. (1994). Operational urban models: State of the art, Univers
ity
egener, M. (1994). Operational urban models: State of the art,
Of Walker, B., Holling, C.S., Carpenter, C.R., & Kinzig, A. (2004). Resilien
Of Walker, B., Holling, C.S., Carpenter, C.R., & Kinzig, A. (2004). Resilien
adaptability and transformability in socialOf adaptability and transformability in social
http://www.ecologyandsociety.org/vol9/iss2/art5Of http://www.ecologyandsociety.org/vol9/iss2/art5
Cape Categories and causality: The neglected
Cape Categories and causality: The neglected
Cognitive Psychology, 53,
Cape Cognitive Psychology, 53,
Walker, B., Holling, C.S., Carpenter, C.R., & Kinzig, A. (2004). ResilienCape
Walker, B., Holling, C.S., Carpenter, C.R., & Kinzig, A. (2004). Resilien
Town Journal of Experimental
Town Journal of Experimental
216
Town 216-
Town -227
Town 227
Categories and causality: The neglected Town
Categories and causality: The neglected

400
WCSSDIP (2007). The Western Cape Sustainable Development Implementation Plan
[electronic version].
WCTB (2007). Western Cape Tourism Barometer, v1:1, The Provincial Tourism
Intelligence Source [electronic version].
WCTT (2005). Western Cape Trade Trends: An Analysis of Trends in Western Cape
merchandise trade between 2000 and 2004 [electronic version], WESGRO.
WCWSSRSS (2007). Western Cape Water Supply System Reconciliation [electronic
version]. Department of Water Affairs and Forestry, Directorate: National Water
Resource Planning.
Weaver, W. (1948). Science and complexity [electronic version]. American Scientist,
36, 536-544.
Yin, R.K, (1984). Case study research: Design and methods. London. Sage
Publications Ltd.
Zellmer, A.J., Allen, T.F.H, Kesseboehmer K., 2006, The nature of ecological
complexity: A protocol for building the narrative [electronic version].
Ecological Complexity, 3, 171-182.
Univers
ity
Zellmer, A.J., Allen, T.F.H, Kesseboehmer K.,
Univers
ity
Zellmer, A.J., Allen, T.F.H, Kesseboehmer K.,
Univers
ity
complexity: A protocol for building the narrative
Univers
ity
complexity: A protocol for building the narrative
Ecological Complexity,
Univers
ity
Ecological Complexity,
Of Case study research: Design and methods
Of Case study research: Design and methodsCape [electronic version]
Cape [electronic version]
Case study research: Design and methodsCape
Case study research: Design and methods
Town Department of Water Affairs and Forestry, Directorate: National Water
Town Department of Water Affairs and Forestry, Directorate: National Water
[electronic version]Town
[electronic version]

401
12. Appendix A: Cholera Study
A sample of the classification schema that was designed and used in the cholera case
study is shown in Table 20. It shows how the schema that was chosen by the cholera
team was used to explore systemic interdependencies. The team evaluated the pros
and cons of mechanisms that cause cholera, and determined test criteria that could
lead to an understanding of which causal relationships would form the core
hypotheses. The mechanisms were conceptualised as 'reservoirs, amplifiers, de-
amplifiers and transmission mechanisms'. These match system level definitions
extremely well, being a metaphoric framework for 'stocks, flows, leads and lags' as
they are traditionally understood in systems theory.
Univers
ity O
f Cap
e Tow
n amplifiers and transmission mechanisms'. These match system level definitions
Town amplifiers and transmission mechanisms'. These match system level definitions
ework for 'stocks, flows, leads and lags' as
Town ework for 'stocks, flows, leads and lags' as

402
Table 20:
Sample of Tables Used to Explore Pros and Cons of Hypotheses for ‘Reservoirs, Amplifiers, Transmission and Exposure Mechanisms’ of
Cholera
1o PROSReservoir CONS Test Criteria
Sea Sediment (Nearshore
and Offshore)
1 - Documented evidence of cholera being
able to survive in coral sea-beds (ref:
NeryBelle Perez-Rosas & Terry C Hazen: In
situ survival of Vibrio Cholera and … in
tropical choral reefs, 1988).
2 - Temporal Occurrence of Vibrio Species
and Aeromonas Hydrophila in Estuarine
Sediments (Leslee A Williams and Paul A
LaRock, 1985).
3 – Cholera can survive through re-
arrangement on a cellular level to low
nutrient (food) supply (Ref: Effect of
Nutrient Deprivation on Lipid,
Carbohydrate, DNA, RNA and Protein
levels in Vibrio Cholera (Mary A Hood et
1 - Sea: coral reefs off Beira are far away and
may not influence cholera infections
- Inland outbreaks sometimes occur before
coastal outbreaks
2 – Patchy records of cholera in sediments
- High concentrations of cholera is associated
with floc (incomplete description).
Pure saltwater would lie outside the preferred
salinity band but the survival range is 0-45%
and they may survive for other reasons
(nutrients) and may have adaptive mechanisms.
- Locate cholera in
sediment during all seasons.
- To start testing marine
molluscs.
Univers
ity and Aeromonas Hydrophila in Estuarine
Univers
ity and Aeromonas Hydrophila in Estuarine
Sediments (Leslee A Williams and Paul A
Univers
ity
Sediments (Leslee A Williams and Paul A
Cholera can survive through re
Univers
ity
Cholera can survive through re-
Univers
ity
-
arrangement on a cellular level to low
Univers
ity
arrangement on a cellular level to low
nutrient (food) supply (Ref: Effect of Univers
ity
nutrient (food) supply (Ref: Effect of Univers
ity
Univers
ity O
f coastal outbreaks
Of coastal outbreaks
2Of 2 – Of
– Patchy records of cholera in sedimentsOf Patchy records of cholera in sedimentsOf Of C
ape Sea: coral reefs off Beira are far away and
Cape Sea: coral reefs off Beira are far away and
may not influence cholera infections
Cape may not influence cholera infections
Cape
Inland outbreaks Cape
Inland outbreaks
coastal outbreaksCape
coastal outbreaks
Town
Sea: coral reefs off Beira are far away and Town
Sea: coral reefs off Beira are far away and Town

403
al., 1986).
Sea Sediment (Nearshore
and Offshore):
Amplification
mechanisms
PROS CONS Test Criteria
Temperature driven
multiplication of bacteria
in the sediment.
- Based on simple correlation between
temperature and cholera incidences.
- Sea water is hotter in summer: water
column temperature.
- Tests for drivers are complicated by the
possibility of multiple factors being involved in
amplification.
- Sediment amplification on it’s own can’t
explain an outbreak – there has to be a vector
or transmission mechanism.
- Air temperature is measured on land, which is
the basis of our correlation. Does this hold in
the sea case?
- Do controlled
experiments at sites
(or labs) on
sediment (heat them
up and measure
response).
- Test water column
temperatures near
sediment (lower
Univers
ity
Based on simple correlation between
Univers
ity
Based on simple correlation between
perature and cholera incidences.
Univers
ity
perature and cholera incidences.
Sea water is hotter in summer: water
Univers
ity
Sea water is hotter in summer: water
Univers
ity O
f -Of - Tests for drivers are complicated by the Of Tests for drivers are complicated by the
posOf posOf Of C
ape
Cape T
own
Town

404
layers of water
column).
- General: Test
whether cholera is
always a
summertime disease
(see Eastern Cape
data).
Plankton Precipitation:
Phytoplankton/Zooplankto
n decay and settling on
sea-floor (flow)
- There seems to be a link between
chitin and cholera (Ref1: Caldwell
(link to climate change and
copepods; Bartlett DH and Azam F,
Chitin Cholera and Competence,
Science Vol 310, 2005 Dec).
- Competing for food paper (need to
find): peak in cholera lagged
significantly after plankton peak.
- Paper on plankton & rain.
-
- There is evidence that cholera also multiplies
when unattached to a host.
Experimental proof of
amplification through
addition of chitin or detritus
(as substrate).
Univers
ity copepods; Bartlett DH and Azam F,
Univers
ity copepods; Bartlett DH and Azam F,
Chitin Cholera and Competence,
Univers
ity
Chitin Cholera and Competence,
Science Vol 310, 2005 Dec)
Univers
ity
Science Vol 310, 2005 Dec).
Univers
ity
.
Competing for food paper (need to
Univers
ity
Competing for food paper (need to
find): peak in cholera lagged
Univers
ity
find): peak in cholera lagged
significantly after plankton peak.Univers
ity
significantly after plankton peak.Univers
ity
Univers
ity O
f Of Cap
e
Cape T
own

405
Sea-Water Column:
Amplification
mechanism
PROS CONS Test Criteria
Amplification
mechanism (Land)PROS CONS Test Criteria
Exposure Mechanisms
(Sea)PROS CONS Test Criteria
Sea water ingestion
Direct exposure to sea water (20ml on
average is swallowed (Wouter Ref). A toxic
dose may result from one copepod (INSERT
REF).
Many people who have cholera are not exposed
to sea-water.
- Gender exposure (men are
predominantly fishermen).
- Distance from Coast.
Shellfish/Finfish
- Cholera has affinity for chitin (see
REF).
- May multiply when attached to
chitin (boom).
- Sea Sediment link: Higher
concentrations of cholera on the
seabed would give shellfish etc a
higher exposure to cholera. Would
- Major contaminations occur in KZN with
very low dependency on fish or shellfish.
Univers
ity Cholera has affinity for chitin (see
Univers
ity Cholera has affinity for chitin (see
Univers
ity
May multiply when attached to
Univers
ity
May multiply when attached to
Sea Sediment link: Higher
Univers
ity
Sea Sediment link: Higher
concentrations of cholera on the Univers
ity
concentrations of cholera on the Univers
ity
Univers
ity
Univers
ity O
f to sea
Of to sea
Of Of Of Cap
e Many people who have cholera are not exposed
Cape
Many people who have cholera are not exposed
to sea Cape
to sea- Cape
-waterCape
waterCape T
own
Town

406
also explain ‘lag’ effect between
algae and cholera cases
(Bangladesh).
General Transmission
MechanismsProc Cons Test Criteria
Contamination of food by
humans
-Contamination of food through poor.
hygiene practises or availability of clean
water (washing dishes, vegetables) may
result in cholera transmission.
-Would only apply to food that’s uncooked.
-Would not explain seasonality of cholera cases
and this is a serious problem.
Exposure Mechanisms
(Land)PROS CONS Test Criteria
Drinking Water
- Well recognised transmission hypothesis
- Cholera cases seem to be rare in places of
good quality water reticulation
- Boiling drinking water to prevent cholera
is a well established practise (INSERT REF)
- Wells are predominantly dark and have
- We haven’t detected cholera in Beira’s
drinking water. However, our sample is too
low (one well).
- Columns of pure water seem to have low
infectivity. We haven’t found cholera in the
wells, limited numbers in standing water.
- Test for cholera in
drinking water.Univers
ity
Univers
ity
Univers
ity CONS
Univers
ity CONS
Univers
ity
Univers
ity
Well recognised transmission hypothesis
Univers
ity
Well recognised transmission hypothesis
Cholera cases seem to be rare in places of
Univers
ity
Cholera cases seem to be rare in places of
Univers
ity
good quality water reticulation
Univers
ity
good quality water reticulation
Boiling drinking water to preveUnivers
ity
Boiling drinking water to preveUnivers
ity O
f Of Of Of Cap
e Would only apply to food that’s uncooked.
Cape Would only apply to food that’s uncooked.
Would not explain seasonality of cholera cas
Cape Would not explain seasonality of cholera cas
and this is a serious problem.Cape
and this is a serious problem.
Town
Town
Would only apply to food that’s uncooked.Town
Would only apply to food that’s uncooked.Town

407
still water which might not hold plankton
and bacteria (cholera might exist in the
sediment but not in the water column).
Copepods in drinking
water
- Simple filtering of drinking water
through sari cloth significantly
reduces cholera outbreaks (INSERT
REF).
- Seems to be no debate about cholera
being found on copepods
- Test for cholera on
copepods (land)
- Does cholera occur
in water sources that
have a basic
filtering (e.g.
groundwater)
De-amplification (Short
Term)PROS CONS Test Criteria
Iron
1. The toxogenic strain of cholera survives
twice as long if iron is in the environment
(REF: Marna van der Merwe).
Test for iron where we find
cholera?
Temperature - Strong evidence that temperature both
enables and disables cholera
- Questionable whether temperature is a trigger
mechanism or rather provides a suitable
environment.
- Endemic and Introduced?
- Test literature for
evidence whether the
cholera cycle is due to
‘introduction’ of cholera to
Univers
ity
Univers
ity
The toxogenic strain of cholera survives
Univers
ity
The toxogenic strain of cholera survives
on is in the environment
Univers
ity
on is in the environment
van der Merwe
Univers
ity
van der Merwe).
Univers
ity
).
Univers
ity
Univers
ity
Univers
ity
Univers
ity
Univers
ity
Univers
ity
Strong evidence that temperature both Univers
ity
Strong evidence that temperature both Univers
ity O
f CONSOf CONSOf Of C
ape
Cape T
own

408
an area e.g. polluted well in
London. Presume human
influence.
- In the endemic case, the
amplification mechanism is
of more importance
- If temperature is a key
driver then the duration of
outbreaks should change in
cooler environments (can
be tested):
-- Inland to coast
--Towards equator
Salinity
- Below a certain salinity cholera does
not thrive and multiply
- However, cholera survives over a
large salinity range
- No evidence that salinity is a major driver of
cholera density and seems to play more of a
role in providing an ‘enabling environment’ for
cholera.
- Test for direct correlation
between salinity and
cholera density
De-amplification (Long PROS CONS Test Criteria
Univers
ity
Univers
ity
Univers
ity
Below a certain salinity cholera does
Univers
ity
Below a certain salinity cholera does
not thrive and multiply
Univers
ity
not thrive and multiply
However, cholera survives over a
Univers
ity
However, cholera survives over a
large salinity rangeUnivers
ity
large salinity rangeUnivers
ity O
f Of Cap
e Tow
n

409
Term)
Viral Predation
Very high concentration of viruses in stools
of patients as they recover (INSERT REF:
Graham) seems to coincide with reduction in
cholera bacteria.
- Why then, does Stephans temperature driven
model give good results?
Test parameters with classic
predator-prey model and
compare with literature.
Immunity (natural)
Human populations develop immunity to
cholera with exposure. This holds for the 01
strain. (INSERT Ref: Mercedes-Pascall)
However, for the 0139 strain, no immunity
seems to develop over a generation.
- Find out whether a
cholera patient can
get cholera twice in
the same season.
- Test for longer term
cycles of immunity
- Test for impacts on
demography of
cases -- Places
where once off
cases of cholera
exist should have a
different
demography of
Univers
ity This holds for the 01
Univers
ity This holds for the 01
Pascall)
Univers
ity
Pascall)
Univers
ity
Univers
ity O
f However, for the 0139 strain, no immunity Of However, for the 0139 strain, no immunity Of Of C
ape T
own
Town

410
cholera cases.
Human-induced Immunity
(vaccine)
Human adaptation responses – vaccines, etc
which may last 2 years.
There is evidence to suggest that cholera dies
off through its own natural cycle and remains
unaffected by human interventions to prevent
the spread of the disease.
Univers
ity O
f Cap
e Tow
n cycle and remains
Town cycle and remains
unaffected by human interventions to prevent
Town unaffected by human interventions to prevent
the spread of the disea
Town
the spread of the disease.
Town
se.
Town
Town

411
13. Appendix B: Urban Growth in Gauteng – Sub-Module Illustrations & Descriptions
Graphical causal models were used to formulate hypotheses and causal interdependencies throughout the case studies conducted in this
dissertation. In this section, some of the sub-modules that constitute the model for urban growth in Gauteng are presented for the benefit of
closer inspection by the reader. Each figure is accompanied by a detailed caption, which explains the sub-module being illustrated. These
graphical causal models are conceptual, and were not developed to the stage where they were populated with probabilities. This study remains a
focus of ongoing research, and the opportunity has now emerged to apply this model in support of the City of Joburg, and is the subject of
ongoing conversations between the author and the City of Joburg.
Univers
ity ongoing conversations between the author and the City of Joburg.
Univers
ity ongoing conversations between the author and the City of Joburg. Of focus of ongoing research, and the opportunity has now emerged to apply this model in support of the City of Joburg, and is the subject of
Of focus of ongoing research, and the opportunity has now emerged to apply this model in support of the City of Joburg, and is the subject of Cape modules that constitute the model for urban growth in Gauteng are presented for the benefit of
Cape modules that constitute the model for urban growth in Gauteng are presented for the benefit of
closer inspection by the reader. Each figure is accompanied by a detailed caption, which explains the sub
Cape closer inspection by the reader. Each figure is accompanied by a detailed caption, which explains the sub
al causal models are conceptual, and were not developed to the stage where they were populated with probabilities. This studCape
al causal models are conceptual, and were not developed to the stage where they were populated with probabilities. This studCape
focus of ongoing research, and the opportunity has now emerged to apply this model in support of the City of Joburg, and is the subject of Cape
focus of ongoing research, and the opportunity has now emerged to apply this model in support of the City of Joburg, and is the subject of
Town
Graphical causal models were used to formulate hypotheses and causal interdependencies throughout the case studies conducted Town
Graphical causal models were used to formulate hypotheses and causal interdependencies throughout the case studies conducted
modules that constitute the model for urban growth in Gauteng are presented for the benefit of Town
modules that constitute the model for urban growth in Gauteng are presented for the benefit of

412
LIMITING FACTORS TO GROWTH
GROWTH PER SECTOR: DRIVER
EMPLOYMENT/ HOUSEHOLD INC
Figure 57: The growth potential for various sectoral land-uses are shown in this model (Figure 57), and a baseline can be established for growth in terms of the current state of productivity (of emissions, GDPR, water use, etc) from which growth can be inferred, keeping in mind whether the relationships are linear, non-linear, exponential or otherwise. The potential for growth is explored in the ‘limiting factors to growth’ module, where a few ‘token’ factors are shown (e.g. costs, fixed investment and availability of suitable space). These are not yet exhaustively developed, and are shown for illustration. For example, the agricultural sector can be developed into a full sub-module including the full range of crops, livestock, etc.
Univers
ity
Univers
ity
Univers
ity
LIMITING FACTORS TO GROWTH
Univers
ity
LIMITING FACTORS TO GROWTH
Univers
ity O
f Cap
e
Cape
Cape T
own
Town

413
GROWTH INDUCED WATER USE
GROWTH INDUCED SPATIAL GROWTH & BII IMPACT
Figure 58: From an understanding of what the spatial requirements are for a particular land-use, we can project how much spatial area would be required (cumulatively and per land-use) to satisfy certain growth conditions. This information can also be used to estimate the impact of growth and development on the biodiversity intactness index/indices (Figure 58).
Univers
ity
Univers
ity O
f Cap
e
Cape
Cape T
own

414
GROWTH INDUCED CO2 EMISSIONS
GROWTH INDUCED ENERGY USE
Figure 59: Using reliable sector and sub-sector related energy requirement and CO2 emission data, we can estimate the impact of growth and development on the cumulative CO2 and energy usage at a cumulative system scale (Figure 59).
Univers
ity
Univers
ity O
f Cap
e
Cape
GROWTH INDUCED ENERGY USECape
GROWTH INDUCED ENERGY USECape
Cape T
own

415
GROWTH INDUCED SOLID WASTE OUTPUT
GROWTH INDUCED NOXIOUS EMISSIONS
GROWTH INDUCED GDPR
Figure 60: Growth induced GDPR, solid waste and noxious emissions can also be calculated from reliable sector and sub-sector data, and related to a set of growth and development scenarios. However, these data sets are usually collected according to different classes, and verification will be needed where aggregations of classes shown above are made.
Univers
ity
Univers
ity
Univers
ity
Univers
ity O
f Cap
e
Cape
GROWTH INDUCED NOXIOUS EMISSIONS
Cape
GROWTH INDUCED NOXIOUS EMISSIONS
Cape T
own
Town
Town
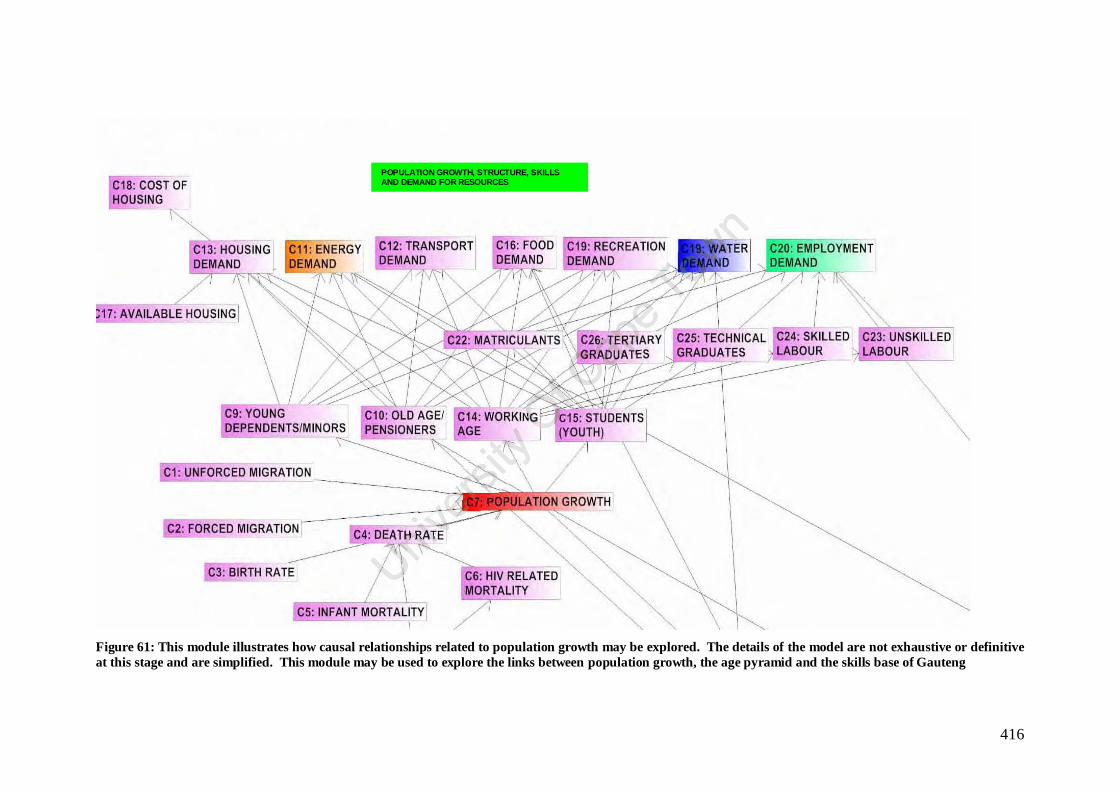
416
POPULATION GROWTH, STRUCTURE, SKILLS AND DEMAND FOR RESOURCES
Figure 61: This module illustrates how causal relationships related to population growth may be explored. The details of the model are not exhaustive or definitive at this stage and are simplified. This module may be used to explore the links between population growth, the age pyramid and the skills base of Gauteng
Univers
ity O
f Cap
e Tow
n

417
WATER AVAILABILITY & SENSITIVITY TO CLIMATE CHANGES (R,T)
Figure 62: This is an illustrated model of how the total water available to the Gauteng system may be assessed, either at a cumulative scale, or at a catchment scale, even including remote water sources. Rainfall and temperature, water storage regimes (dams and planned construction of dams), water use by alien plants, return flows, etc.
Univers
ity O
f Cap
e Tow
n

418
ENERGY PRODUCTION: RENEWABLE AND NON-RENEWABLE OPTIONS, DEMAND SIDE MANAGEMENT, BACKUP OPTIONS & HOUSEHOLD ENERGY USE
Figure 63: This module shows how a range of non-renewable (e.g. nuclear, coal, gas, new nuclear, new coal, clean coal) and renewable (e.g. hydropower, wind, ocean, solar thermal, solar pv) can be used to estimate total energy availability to Gauteng, total water use, total cost of energy production per kwh, total CO2 emissions and possibly total noxious emissions. In addition, a range of demand side management energy savings (residential, buildings, loadshedding) can be estimated, utilising % savings and planned savings (even projected savings due to tariff increases, or other measures. Household energy dependence and usages can also be determined, because total electrified and non-electrified households can be detailed and assessed in different scenarios. Energy use profiles of households can also be detailed, and paraffin use levels estimated and evaluated against LPG and other fuel-switching options that have less emissions and are more stable (in terms of volatility) and less likely to give rise to fires in informal settlements.
Univers
ity
Univers
ity
This module shows how a range of nonUnivers
ity
This module shows how a range of non-Univers
ity
-Univers
ity
renewable (Univers
ity
renewable (ocean, solar thermal, solar pv) can be used to estimate total energy availability to Gauteng, total water use, total cost of energy production per kwh, total CO2 Univ
ersity
ocean, solar thermal, solar pv) can be used to estimate total energy availability to Gauteng, total water use, total cost of energy production per kwh, total CO2 In addition, a range of demand side management energy savings (residential, buildings, loadshedding) can be Univ
ersity
In addition, a range of demand side management energy savings (residential, buildings, loadshedding) can be
Of Cap
e Tow
n
Town
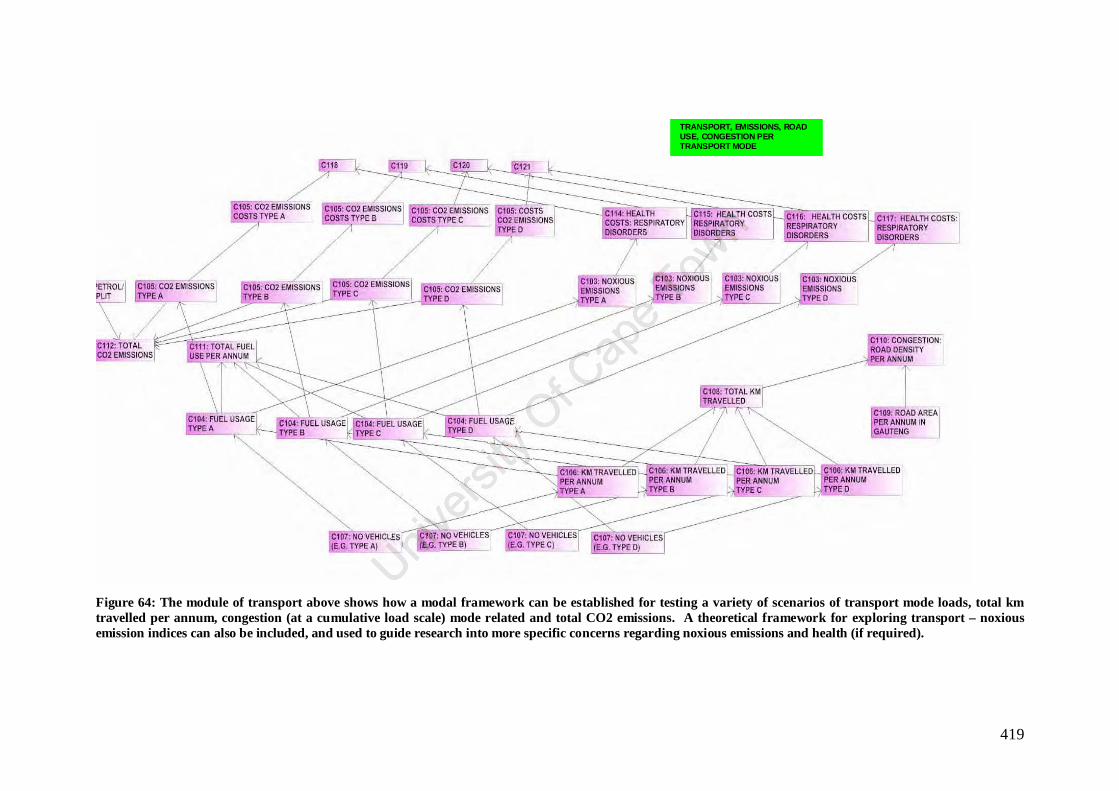
419
TRANSPORT, EMISSIONS, ROAD USE, CONGESTION PER TRANSPORT MODE
Figure 64: The module of transport above shows how a modal framework can be established for testing a variety of scenarios of transport mode loads, total km travelled per annum, congestion (at a cumulative load scale) mode related and total CO2 emissions. A theoretical framework for exploring transport – noxious emission indices can also be included, and used to guide research into more specific concerns regarding noxious emissions and health (if required).
Univers
ity
Univers
ity O
f Cap
e Tow
n

420
TRANSPORT, ACCESSIBILITY & EMPLOYMENT
Figure 65: This module was established to explore the question “3. How will increased access and mobility impact on labour market absorption?” and may be linked to the transport module where different modes (bus, taxi) will be included. The aim of this module is to explore the links between increased working age population, accessibility to areas of employment, demand for public transport and its availability. Making the link to labour market absorption will be theoretical at this stage. Perhaps this module would be more relevant if developed at smaller scales within the Gauteng area.
Univers
ity O
f Cap
e Tow
n

421
GROWTH INDUCED INFRASTRUCTURE DEMANDS
Figure 66: This module as a sketchy attempt to show how the demand for bulk infrastructure can be explored. This module will need to be developed more thoroughly (as will many others) with a user group, who can help identify critical linkages of concern with respect to the demand and provision of bulk infrastructure. Currently, we explored the availability and demand for potable water (and losses), land-fill demand (which can be related to the growth induced solid waste module), electricity demand (which can be related to the population growth and sectoral, land-use growth rates. Demand for road infrastructure can be related to the transport module congestion variable, and population growth can be related to the demand for wastewater plants.
Univers
ity
Univers
ity
Univers
ity
This module as a sketchy attempt to show how the demand for bulk infrastructure can be exploredUniv
ersity
This module as a sketchy attempt to show how the demand for bulk infrastructure can be explored
Of Cap
e Tow
n

422
Univers
ity O
f Cap
e Tow
n

423
14. Appendix C: Western Cape Provincial Model – Individual Modules
The models shown in this section are fully functioning Bayesian models that have been populated with the large range of data sources that were
used in the review of the Western Cape climate change strategy and action plan (RCCSAPWC, 2008). It is not feasible or useful to display
every CPT and relationship that was used in formulating and constructing the model in this dissertation due to the large number of variables and
states used in Bayesian nodes and the resulting large CPTs. The software serves the purpose of carrying this record. Moreover, detailed
appendices of sensitivity analyses and scenario runs are presented in the review (RCCSAPWC, 2008), and should be referred to for more
information, where the reader may be interested in specific model outputs, and how they were generated - full probability distributions,
sensitivities and analyses are presented in the review. An appendix of approximately 200 pages of results were tabulated, graphed and presented,
on a scenario by scenario basis in the review (RCCSAPWC, 2008), and the appendices are too large to be included in this doctoral dissertation.
The reader is advised to refer to the review for a more detailed and nuanced review of the actual figures and probabilities that were generated in
each range of scenario runs for the sole reason that the review itself focus's heavily on the analytical elements of the study and links the
recommendations to the analysis and model outputs with a great deal of clarity.
Univers
ity is advised to refer to the review for a more detailed and nuanced review of the actual figures and probabilities that were ge
Univers
ity is advised to refer to the review for a more detailed and nuanced review of the actual figures and probabilities that were ge
each range of scenario runs for the sole reason that the review itself focus's heavily on the analytical elements of th
Univers
ity
each range of scenario runs for the sole reason that the review itself focus's heavily on the analytical elements of th
Univers
ity
recommendations to the analysis and model outputs with a great deal of clarity.
Univers
ity
recommendations to the analysis and model outputs with a great deal of clarity.
Of An appendix of approximately 200 pages of results were tabulated, graphed and presented,
Of An appendix of approximately 200 pages of results were tabulated, graphed and presented,
on a scenario by scenario basis in the review (RCCSAPWC, 2008), and the appendices are too large to be included in this doctoOf on a scenario by scenario basis in the review (RCCSAPWC, 2008), and the appendices are too large to be included in this docto
is advised to refer to the review for a more detailed and nuanced review of the actual figures and probabilities that were geOf is advised to refer to the review for a more detailed and nuanced review of the actual figures and probabilities that were ge
Cape
states used in Bayesian nodes and the resulting large CPTs. The software serves the purpose of carrying this record. Moreov
Cape
states used in Bayesian nodes and the resulting large CPTs. The software serves the purpose of carrying this record. Moreov
esented in the review (RCCSAPWC, 2008), and should be referred to for more
Cape esented in the review (RCCSAPWC, 2008), and should be referred to for more
information, where the reader may be interested in specific model outputs, and how they were generated
Cape
information, where the reader may be interested in specific model outputs, and how they were generated
An appendix of approximately 200 pages of results were tabulated, graphed and presented, Cape
An appendix of approximately 200 pages of results were tabulated, graphed and presented,
Town The models shown in this section are fully functioning Bayesian models that have been populated with the large
Town The models shown in this section are fully functioning Bayesian models that have been populated with the large
used in the review of the Western Cape climate change strategy and action plan (RCCSAPWC, 2008). It is not feasible or usefu
Town used in the review of the Western Cape climate change strategy and action plan (RCCSAPWC, 2008). It is not feasible or usefu
this dissertation due to the large number of variables and
Town
this dissertation due to the large number of variables and
states used in Bayesian nodes and the resulting large CPTs. The software serves the purpose of carrying this record. MoreovTown
states used in Bayesian nodes and the resulting large CPTs. The software serves the purpose of carrying this record. Moreov

424
Figure 67: Illustrated causal model of Energy Production, Savings, Demand Side Management & Backup Options for Electricity Supply: Including Renewable and Non-Renewable Energy Production Options. Cost, Water Use, Energy Production and CO2 Emissions are calculated. This energy module was formulated and populated in compliance with the information and data in which classes were available. Total electricity production from a variety of sources, and in various combinations, can be tested in the model. The sensitivity to temperature changes on electricity production is included, and cost of production, water use and carbon
Univers
ity
Univers
ity O
f Cap
e Tow
n

425
emission counts are calculated for different electricity production combinations. The effects of increased rates of household electrification is also catered for. Lastly, backup options for electricity supply that already exist in the Western Cape system are included, and the feasibility of demand side management, including loadshedding options, is provided for.
Univers
ity O
f Cap
e Tow
n

426
Figure 68: Sub-Module of Energy Production Module - Backup and Demand Side Management Options. The sub-module for backup and demand side management of energy systems caters for a range of backup options, and the user can experiment with different permutations. Efficiency of buildings and residences is also catered for.
Univers
ity
Univers
ity
Module of Energy Production Module Univers
ity
Module of Energy Production Module - Univers
ity
- Backup and Demand Side Management Options. The subUnivers
ity
Backup and Demand Side Management Options. The sub
Of Cap
e Tow
n
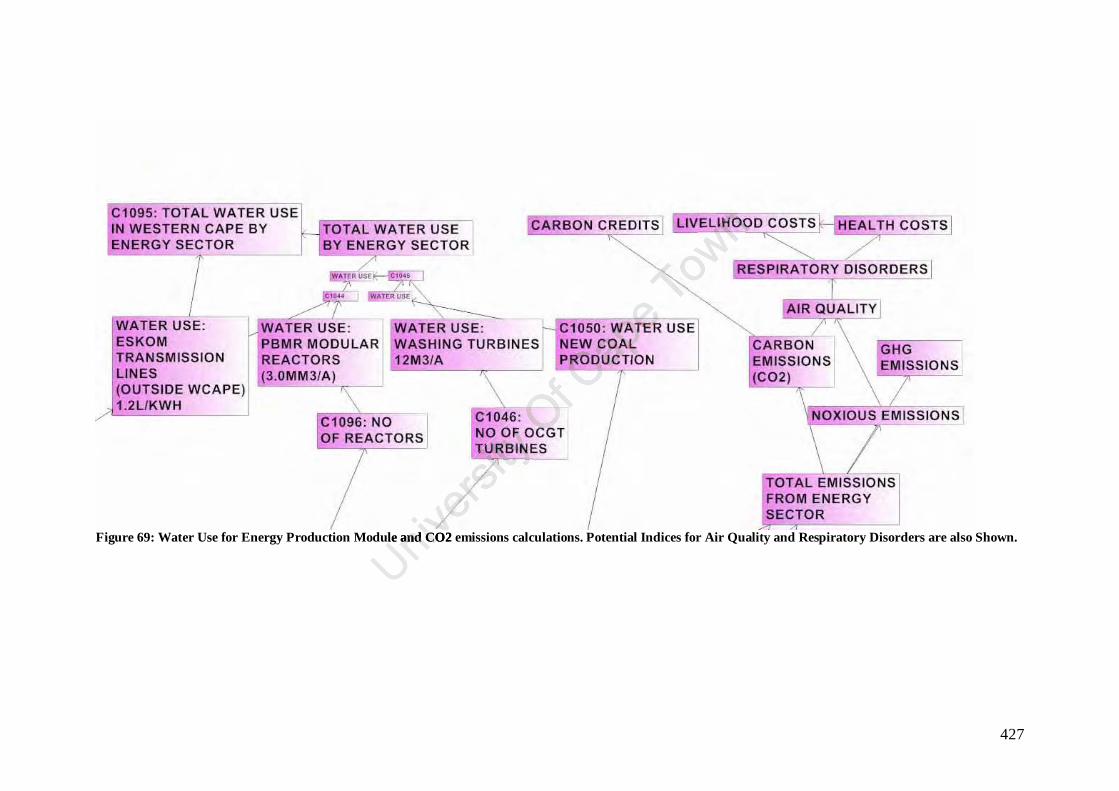
427
Figure 69: Water Use for Energy Production Module and CO2 emissions calculations. Potential Indices for Air Quality and Respiratory Disorders are also Shown.
Univers
ity
Univers
ity
: Water Use for Energy Production Module and CO2 emissions calculations. Potential Indices for Air Quality and Respiratory Disorders are also Show
Univers
ity
: Water Use for Energy Production Module and CO2 emissions calculations. Potential Indices for Air Quality and Respiratory Disorders are also Show
Of Cap
e Tow
n

428
Figure 70: A Range of Renewable and Non-Renewable Electricity Production Options are Illustrated. In this module the user can experiment with and test a variety of combinations and permutations of renewable and non-renewable electricity production options. The carbon emissions, water use, and cost of production are also calculated for each scenario. Moreover, the growth in electrified households can also be tested over a range of projected possible futures. Univ
ersity
Univers
ity
Renewable Electricity Production Options are Illustrated.
Univers
ity
Renewable Electricity Production Options are Illustrated.variety of combinations and permutations of renewable and non
Univers
ity
variety of combinations and permutations of renewable and nonare also calculated for each scenario. Moreover, the growth in electrified households can also be tested over a range of projected possible futures. Univ
ersity
are also calculated for each scenario. Moreover, the growth in electrified households can also be tested over a range of projected possible futures.
Of Cap
e Tow
n

429
Figure 71: Illustration of Provincial Gross Geographic Product (GGP) Drivers Included in Western Cape Provincial Model. In particular, the sub-module here calculates the potential GGP for the Western Cape, if energy and water limitations are not taken into account. This is compared with another replicate module, butwhere energy and water limitations are taken into account.
Univers
ity O
f Cap
e
Cape P) Drivers Included in Western Cape Provincial Model.
Cape P) Drivers Included in Western Cape Provincial Model.
Cape
calculates the potential GGP for the Western Cape, if energy and water limitations are not taken into account. This is compar
Cape
calculates the potential GGP for the Western Cape, if energy and water limitations are not taken into account. This is compar
Town

430
Figure 72: Illustration of Employment Sector Drivers Included in Western Cape Provincial Model. In this model the user can assess how projected or envisaged changes in sector levels of growth and production will affect employment in the Western Cape. The user can experiment with different combinations of multi-sector growth and assess possible changes in employment, given current employment rates in the sectors. This is compared with another replicate module, but where energy and water limitations are taken into account.
Univers
ity O
f : Illustration of Employment Sector Drivers Included in Western Cape Provincial Model.
Of : Illustration of Employment Sector Drivers Included in Western Cape Provincial Model.changes in sector levels of growth and production will affect employment in the Western Cape. The user can experiment with different combinations of multi
Of changes in sector levels of growth and production will affect employment in the Western Cape. The user can experiment with different combinations of multisector growth and assess possible changes in employment, given current employment rates in the sectors.Of sector growth and assess possible changes in employment, given current employment rates in the sectors.
Cape
Cape
: Illustration of Employment Sector Drivers Included in Western Cape Provincial Model.Cape
: Illustration of Employment Sector Drivers Included in Western Cape Provincial Model.changes in sector levels of growth and production will affect employment in the Western Cape. The user can experiment with different combinations of multi
Cape
changes in sector levels of growth and production will affect employment in the Western Cape. The user can experiment with different combinations of multi
Town

431
Figure 73: Illustration of Provincial Gross Domestic Product (GDP) Drivers Included in Western Cape Provincial Model. In particular, the sub-module here calculates the potential GDP for the Western Cape, if energy and water limitations are not taken into account. This is compared with another module, where limitations are taken into account. This is compared with another replicate module, but where energy and water limitations are taken into account.
Univers
ity O
f : Illustration of Provincial Gross Domestic Product (GDP) Drivers Included in Western Cape Provincial Model.
Of : Illustration of Provincial Gross Domestic Product (GDP) Drivers Included in Western Cape Provincial Model.ial GDP for the Western Cape, if energy and water limitations are not taken into account. This is compared with another modul
Of ial GDP for the Western Cape, if energy and water limitations are not taken into account. This is compared with another modulThis is compared with another replicate module, but where energy and water limitations are taken into account.Of This is compared with another replicate module, but where energy and water limitations are taken into account.
Cape
Cape
: Illustration of Provincial Gross Domestic Product (GDP) Drivers Included in Western Cape Provincial Model.Cape
: Illustration of Provincial Gross Domestic Product (GDP) Drivers Included in Western Cape Provincial Model.ial GDP for the Western Cape, if energy and water limitations are not taken into account. This is compared with another modulCap
e
ial GDP for the Western Cape, if energy and water limitations are not taken into account. This is compared with another modul
Town

432
Figure 74: Illustration of Noxious Emissions Drivers Included in Western Cape Provincial Model. Multi-sector sources of noxious emission levels are calculated in this model, according to their current rates of emission. The user can experiment with how changes in sector growth may affect noxious emissions, should sectors continue to emit at their current levels. In this way, interventions can be envisaged and designed for encouraging or regulating sector compliance to lower levels give their current and projected rates of growth.
Univers
ity
Univers
ity : Illustration of Noxious Emissions Drivers Included in Western Cape Provincial Model.
Univers
ity : Illustration of Noxious Emissions Drivers Included in Western Cape Provincial Model.
this model, according to their current rates of emission. The user can experiment with how changes in sector growth may affect noxious emissions, should sectors
Univers
ity
this model, according to their current rates of emission. The user can experiment with how changes in sector growth may affect noxious emissions, should sectors continue to emit at their current levels. In this way, interventions can be envisaged and designed for encouraging or regula
Univers
ity
continue to emit at their current levels. In this way, interventions can be envisaged and designed for encouraging or regula
Of Cap
e Tow
n

433
Figure 75: Illustration of Provincial Water Use Drivers Included in Western Cape Provincial Model. Water use levels for different sectors are used to calculate the total water use for the province given levels of growth of sectors. The user can also assess how interventions effective interventions such as alien clearance, reduced non-indigenous afforestation and interventions in the transport, household, agricultural, commercial and industrial sectors play out against each other in terms of total water use. Univ
ersity
Univers
ity
: Illustration of Provincial Water Use Drivers Included in Western Cape Provincial Model
Univers
ity
: Illustration of Provincial Water Use Drivers Included in Western Cape Provincial Modeltotal water use for the province given levels of growth of sectors. The user can also assess how interventions effective interventions such as alien clearance, reduced
Univers
ity
total water use for the province given levels of growth of sectors. The user can also assess how interventions effective interventions such as alien clearance, reduced non-indigenous afforestation and interventions in the transport, household, agricultural, commercial and industrial sectors play out against each other in terms of Univ
ersity
non-indigenous afforestation and interventions in the transport, household, agricultural, commercial and industrial sectors play out against each other in terms of
Of Cap
e Tow
n

434
Figure 76: Illustration of Solid Waste, Energy Consumption, Water Consumption and Carbon Emission Modules in Western Cape Provincial Model. Solid waste, energy and water consumption and carbon emissions are calculated in terms of their sector contributions. This includes transport, mining, agriculture, residential, commercial, industry and construction sectors. The user has the flexibility to test different rates of sector growth against solid waste output, water consumption and carbon emission footprints, according to their current rates of sector consumption or production.
Univers
ity
Univers
ity
76: Illustration of Solid Waste, Energy Consumption, Water Consumption and Carbon
Univers
ity
76: Illustration of Solid Waste, Energy Consumption, Water Consumption and Carbon energy and water consumption and carbon emissions are calculated in terms of their sector contributions. This includes transpUniv
ersity
energy and water consumption and carbon emissions are calculated in terms of their sector contributions. This includes transpcommercial, industry and construction sectors. The user has the flexibility to test different rates of sector growth against solid waste output, water consumption Univ
ersity
commercial, industry and construction sectors. The user has the flexibility to test different rates of sector growth against solid waste output, water consumption
Of Cap
e Tow
n

435
Figure 77: Integrator Module for Western Cape Bayesian Module: These variables are aggregated from embedded modules and combined in known weighted ratios to assess responses in systems level measures of performance e.g. GDP, GGP, etc. Some classes were aggregated in order to fit into the classes of available data and information that was available on the output (i.e. measure of performance) end. Careful considerations were given to how these aggregations were made, and as far as possible it was based on actual estimates of their percentage contributions to the cause-effect relationships that drive the measure of performance modules.
Univers
ity
Univers
ity
Integrator Module for Western Cape Bayesian Module: These variables are aggregated from embedded modules and combined in know
Univers
ity
Integrator Module for Western Cape Bayesian Module: These variables are aggregated from embedded modules and combined in knowratios to assess responses in systems level measures of performance e.g. GDP, GGP, etc.
Univers
ity
ratios to assess responses in systems level measures of performance e.g. GDP, GGP, etc.data and information that was available on the output (i.e. measure of performance) end.
Univers
ity
data and information that was available on the output (i.e. measure of performance) end.
Univers
ity
tes of their percentage contributions to the cause
Univers
ity
tes of their percentage contributions to the cause
Of Cap
e Tow
n

436
Figure 78: Illustration of Informal Sector & SMME Drivers Included in Western Cape Provincial Model. The total revenue generated by the informal sector, and by SMMEs can be assessed across different projected growth scenarios, according to their current rates of revenue generation. This model is extremely useful in understanding micro-economic changes, and if more data is collected, this can be developed into a very detailed model of the informal and SMME sectors, which is of critical importance in understanding the Western Cape and South African economies, where dual economic activities are at work and are equally important to understand.
Univers
ity by SMMEs can be assessed across different projected growth scenarios, according to their current rates of revenue generation.
Univers
ity by SMMEs can be assessed across different projected growth scenarios, according to their current rates of revenue generation.
re data is collected, this can be developed into a very detailed model of the informal and SMME sectors, which is
Univers
ity re data is collected, this can be developed into a very detailed model of the informal and SMME sectors, which is
Univers
ity
of critical importance in understanding the Western Cape and South African economies, where dual economic activities are at work and are equal
Univers
ity
of critical importance in understanding the Western Cape and South African economies, where dual economic activities are at work and are equalOf Of : Illustration of Informal Sector & SMME Drivers Included in Western Cape Provincial Model.Of : Illustration of Informal Sector & SMME Drivers Included in Western Cape Provincial Model.
by SMMEs can be assessed across different projected growth scenarios, according to their current rates of revenue generation.Of by SMMEs can be assessed across different projected growth scenarios, according to their current rates of revenue generation.
re data is collected, this can be developed into a very detailed model of the informal and SMME sectors, which is Of re data is collected, this can be developed into a very detailed model of the informal and SMME sectors, which is
Cape T
own

437
Figure 79: Illustration of Construction Sector Drivers Breakdown Included in Western Cape Provincial Model. The model is formulated according to the classes provided in the available data and information on the construction industry. The classes (large, medium, micro, small and usual) can be expanded as more in depth information and research becomes available on the construction sector. As it stands, the user can experiment with different rates of growth in the sector, according to the provided classes, at current rates of revenue production. Improved efficiencies in production, leading to cost savings, can also be assessed, but indirectly at this stage. Univ
ersity
Univers
ity
: Illustration of Construction Sector Drivers Breakdown Included in Western Cape Provincial Model.
Univers
ity
: Illustration of Construction Sector Drivers Breakdown Included in Western Cape Provincial Model.tion on the construction industry. The classes (large, medium, micro, small and usual) can be expanded as more in depth
Univers
ity
tion on the construction industry. The classes (large, medium, micro, small and usual) can be expanded as more in depth information and research becomes available on the construction sector. As it stands, the user can experiment with different
Univers
ity
information and research becomes available on the construction sector. As it stands, the user can experiment with different
Univers
ity
to the provided classes, at current rates of revenue production. Improved efficiencies in production, leading to cost savings, can also be assessed, but indirectly at Univers
ity
to the provided classes, at current rates of revenue production. Improved efficiencies in production, leading to cost savings, can also be assessed, but indirectly at
Of Cap
e Tow
n
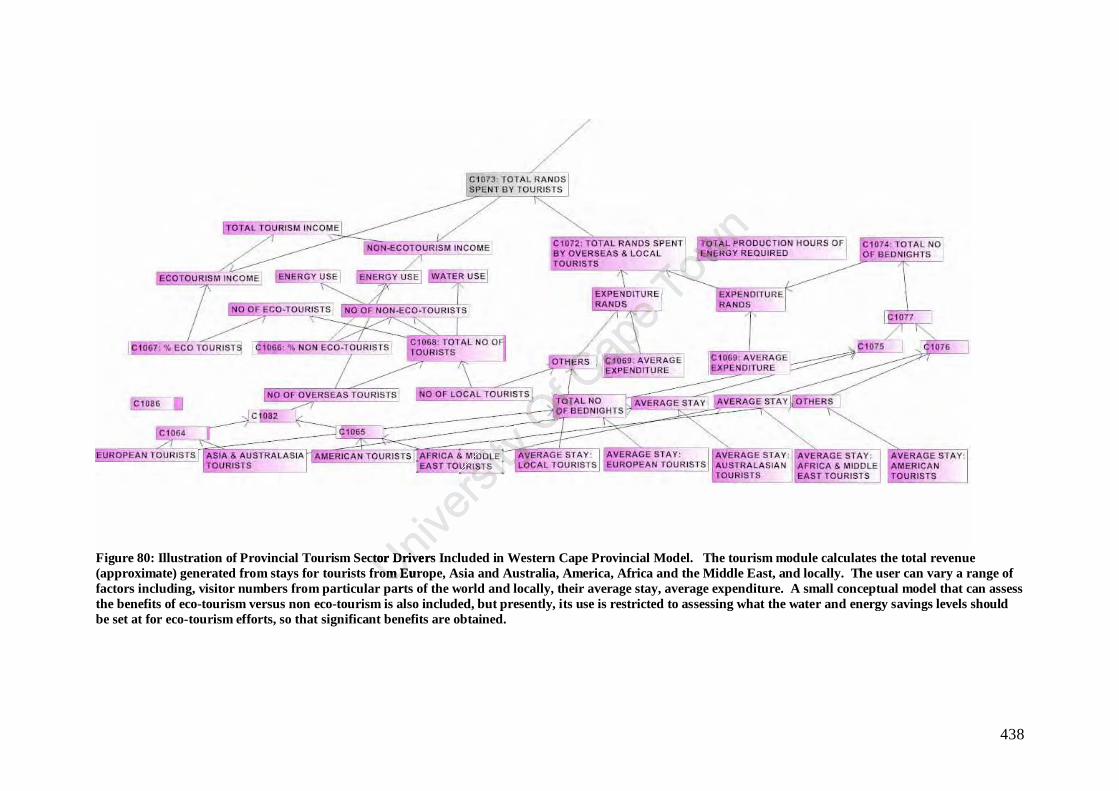
438
Figure 80: Illustration of Provincial Tourism Sector Drivers Included in Western Cape Provincial Model. The tourism module calculates the total revenue (approximate) generated from stays for tourists from Europe, Asia and Australia, America, Africa and the Middle East, and locally. The user can vary a range of factors including, visitor numbers from particular parts of the world and locally, their average stay, average expenditure. A small conceptual model that can assess the benefits of eco-tourism versus non eco-tourism is also included, but presently, its use is restricted to assessing what the water and energy savings levels should be set at for eco-tourism efforts, so that significant benefits are obtained.
Univers
ity
Univers
ity
ation of Provincial Tourism Sector Drivers Included in Western Cape Provincial Model.Univers
ity
ation of Provincial Tourism Sector Drivers Included in Western Cape Provincial Model.(approximate) generated from stays for tourists from Europe, Asia and Australia, America, Africa and the Middle East, and locally. The user can vary a range of Univ
ersity
(approximate) generated from stays for tourists from Europe, Asia and Australia, America, Africa and the Middle East, and locally. The user can vary a range of factors including, visitor numbers from particular parts of the world and locally, their average stay, average expenditure. Univ
ersity
factors including, visitor numbers from particular parts of the world and locally, their average stay, average expenditure.
Of Cap
e Tow
n

439
Figure 81: Household Water-Intensive Informal Activities Module. This module allows the user to test how different water-based activities at the informal and household level can be stimulated through water provision, and calculates the potential total earnings from these activities, based on the study conducted of Bushbuckridge by de Mendiguren & Castresana (2003). This model was of particular significance to Western Cape decision-makers as it afforded them to envisage the direct benefits that water as a 'service' brought to households, as opposed to trickle-down economic views, which would see household revenue generated from
Univers
ity
Univers
ity
sive Informal Activities Module.Univers
ity
sive Informal Activities Module.
Of Cap
e Tow
n

440
employment in the formal sector. It is of increasing importance in South Africa to address the issue of benefits derived from services. The model was constructed according the classes in which data and information have been made available.
Figure 82: Illustration of Textile Module in Manufacturing Module – Western Cape Province Bayesian Model. The user can experiment with detailed changes in growth in the different textile making operations that are currently underway in the Western Cape, according to their current revenue contribution rates. The model was constructed according the classes in which data and information have been made available.
Univers
ity
Univers
ity
: Illustration of Textile Module in Manufacturing Module Univers
ity
: Illustration of Textile Module in Manufacturing Module growth in the different textile making operations that are currently underway in the Western Cape, according to their currentUniv
ersity
growth in the different textile making operations that are currently underway in the Western Cape, according to their current
Of Cap
e Tow
n

441
Figure 83: Illustration of Fish Products Module in Manufacturing Module – Western Cape Province Bayesian Model. The user can experiment with detailed changes in growth in the different fisheries operations that are currently underway in the Western Cape, according to their current revenue contribution rates. The model was constructed according the classes in which data and information have been made available.
Univers
ity
Univers
ity
: Illustration of Fish Products Module in Manufacturing Module
Univers
ity
: Illustration of Fish Products Module in Manufacturing Module changes in growth in the different fisheries operations that are currently underway in the Western Cape, according to their current revenue contribution rates. The
Univers
ity
changes in growth in the different fisheries operations that are currently underway in the Western Cape, according to their current revenue contribution rates. The model was constructed according the classes in which data and information have been made available.
Univers
ity
model was constructed according the classes in which data and information have been made available.
Of Cap
e Tow
n

442
Figure 84: Illustration of Clothing Module in Manufacturing Module – Western Cape Province Bayesian Model. The user can experiment with detailed changes in growth in the different clothing operations that are currently underway in the Western Cape, according to their current revenue contribution rates. The model was constructed according the classes in which data and information have been made available.
Univers
ity
Univers
ity
hing Module in Manufacturing Module
Univers
ity
hing Module in Manufacturing Module growth in the different clothing operations that are currently underway in the Western Cape, according to their current revenue contribution rates. The model was
Univers
ity
growth in the different clothing operations that are currently underway in the Western Cape, according to their current revenue contribution rates. The model was constructed according the classes in which data and information have been made available.
Univers
ity
constructed according the classes in which data and information have been made available.
Of Cap
e Tow
n

443
Figure 85: Illustration of Beverages Sub-Module in Manufacturing Module – Western Cape Province Bayesian Model. The user can experiment with detailed changes in growth in the different alcoholic beverage operations that are currently underway in the Western Cape, according to their current revenue contribution rates. The model was constructed according the classes in which data and information have been made available.
Univers
ity
Univers
ity
Module in Manufacturing Module
Univers
ity
Module in Manufacturing Module changes in growth in the different alcoholic beverage operations that are currently underway in the Western Cape, according to their current revenue contribution
Univers
ity
changes in growth in the different alcoholic beverage operations that are currently underway in the Western Cape, according to their current revenue contribution sses in which data and information have been made available.
Univers
ity
sses in which data and information have been made available.
Of Cap
e Tow
n

444
Figure 86: Illustration of Yacht & Boating Sub-Module in Manufacturing Module – Western Cape Province Bayesian Model. The user can experiment with detailed changes in growth in the different boating and yachting operations that are currently underway in the Western Cape, according to their current revenue contribution rates. The model was constructed according the classes in which data and information have been made available.
Univers
ity
Univers
ity
Module in Manufacturing Module
Univers
ity
Module in Manufacturing Module detailed changes in growth in the different boating and yachting operations that are currently underway in the Western Cape, according to their
Univers
ity
detailed changes in growth in the different boating and yachting operations that are currently underway in the Western Cape, according to theircontribution rates. The model was constructed according the classes in which data and information have been made a
Univers
ity
contribution rates. The model was constructed according the classes in which data and information have been made a
Of Cap
e Tow
n

445
Figure 87: Illustration of Automotive Production Sub-Module in Manufacturing Module – Western Cape Province Bayesian Model. The user can experiment with detailed changes in growth in the different motoring operations that are currently underway in the Western Cape, according to their current revenue contribution rates. The model was constructed according the classes in which data and information have been made available.
Univers
ity
Univers
ity
Module in Manufacturing Module
Univers
ity
Module in Manufacturing Module detailed changes in growth in the different motoring operations that are currently underway in the Western Cape, according to their current revenue contribution
Univers
ity
detailed changes in growth in the different motoring operations that are currently underway in the Western Cape, according to their current revenue contribution rates. The model was constructed according the classes in which data and information have been made available.
Univers
ity
rates. The model was constructed according the classes in which data and information have been made available.
Of Cap
e Tow
n

446
Figure 88: Illustration of Foodstuff Sub-Module in Manufacturing Module – Western Cape Province Bayesian Model. The user can experiment with detailed changes in growth in the different fruit production operations that are currently underway in the Western Cape, according to their current revenue contribution rates. The model was constructed according the classes in which data and information have been made available.Univ
ersity
Univers
ity
Module in Manufacturing Module
Univers
ity
Module in Manufacturing Module changes in growth in the different fruit production operations that are currently underway in the Western Cape, according
Univers
ity
changes in growth in the different fruit production operations that are currently underway in the Western Cape, accordingrates. The model was constructed according the classes in which data and information have been made available.Univ
ersity
rates. The model was constructed according the classes in which data and information have been made available.
Of Cap
e Tow
n

447
Figure 89: Illustration of Transport Module – Western Cape Province Bayesian Model. The user can experiment with detailed changes in growth in the different vehicle classes that are present in the Western Cape, according to their current revenue contribution rates. The model was constructed according the classes in which data and information have been made available. The user can experiment with different permutations of projected vehicle growth and road use patterns, and compare this with emission outputs. The model also caters for new and different classes of vehicles such as electric cars. The user can experiment with switching from private to public transport, and from petrol to diesel and biodiesel.
Univers
ity O
f Cap
e Tow
n

448
Univers
ity O
f Cap
e Tow
n

449
15. Appendix D: Mbombela Model Sub-System Modules
In this section, the Mbombela model is shown in various parts. Thereafter, the conditional probability tables of two variables are shown as
examples to the reader. These were chosen from the water module of the Mbombela model. These modules match their 'kin' as embedded units
in other case studies as far as causal structure is concerned (however contextual changes may cause them to differ slightly), but their main
differences lie in the equations used (their particular weighted relationships) and the marginal probabilities, which naturally have to be changed
with the new context of application of the model.
Univers
ity O
f Cap
e differences lie in the equations used (their particular weighted relationships) and the marginal probabilities, which natural
Cape differences lie in the equations used (their particular weighted relationships) and the marginal probabilities, which naturalTow
n conditional probability tables of two variables are shown as
Town conditional probability tables of two variables are shown as
examples to the reader. These were chosen from the water module of the Mbombela model. These modules match their 'kin' as em
Town examples to the reader. These were chosen from the water module of the Mbombela model. These modules match their 'kin' as em
erned (however contextual changes may cause them to differ slightly), but their main Town
erned (however contextual changes may cause them to differ slightly), but their main
differences lie in the equations used (their particular weighted relationships) and the marginal probabilities, which naturalTown
differences lie in the equations used (their particular weighted relationships) and the marginal probabilities, which natural
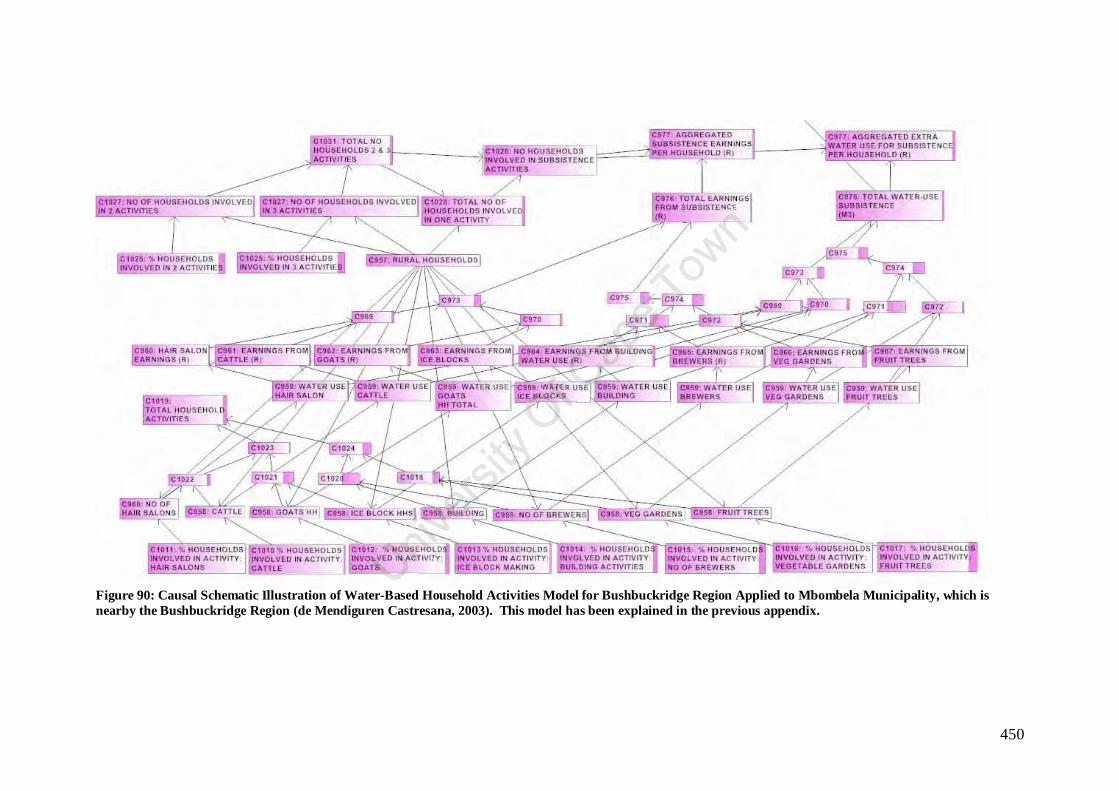
450
Figure 90: Causal Schematic Illustration of Water-Based Household Activities Model for Bushbuckridge Region Applied to Mbombela Municipality, which is nearby the Bushbuckridge Region (de Mendiguren Castresana, 2003). This model has been explained in the previous appendix.
Univers
ity
Univers
ity
Based Household Activities Model for Bushbuckridge Region Applied to Mbombela Municipality, which is Univ
ersity
Based Household Activities Model for Bushbuckridge Region Applied to Mbombela Municipality, which is
Of Cap
e Tow
n

451
Figure 91: Biodiversity Intactness Index Module for Mbombela: A Generic Module That Can Be Adapted for Different Contexts. In this model, the biodiversity intactness index for the Western Cape is shown. It is still a conceptual model however, as the specific sensitivities of the Western Cape ecosystem, as a whole, have
Univers
ity O
f Cap
e Tow
n

452
not been researched yet. Currently, the model is constrained by probabilities that were obtained from ongoing research efforts on South Africa in general, and at a large, aggregative scale. Only in the Mbombela and Nelspruit models were the BII modules correctly constrained, as they were based on evidence from studies conducted on BII in the Incomati catchment. However, even as constrained, the BII, as a relative indicator, is a useful and interesting filter through which to envisage large scale changes in land use. In particular, it provides a very useful way of assessing how changes in land-use affect biodiversity at large scales.
Univers
ity O
f Cap
e Tow
n
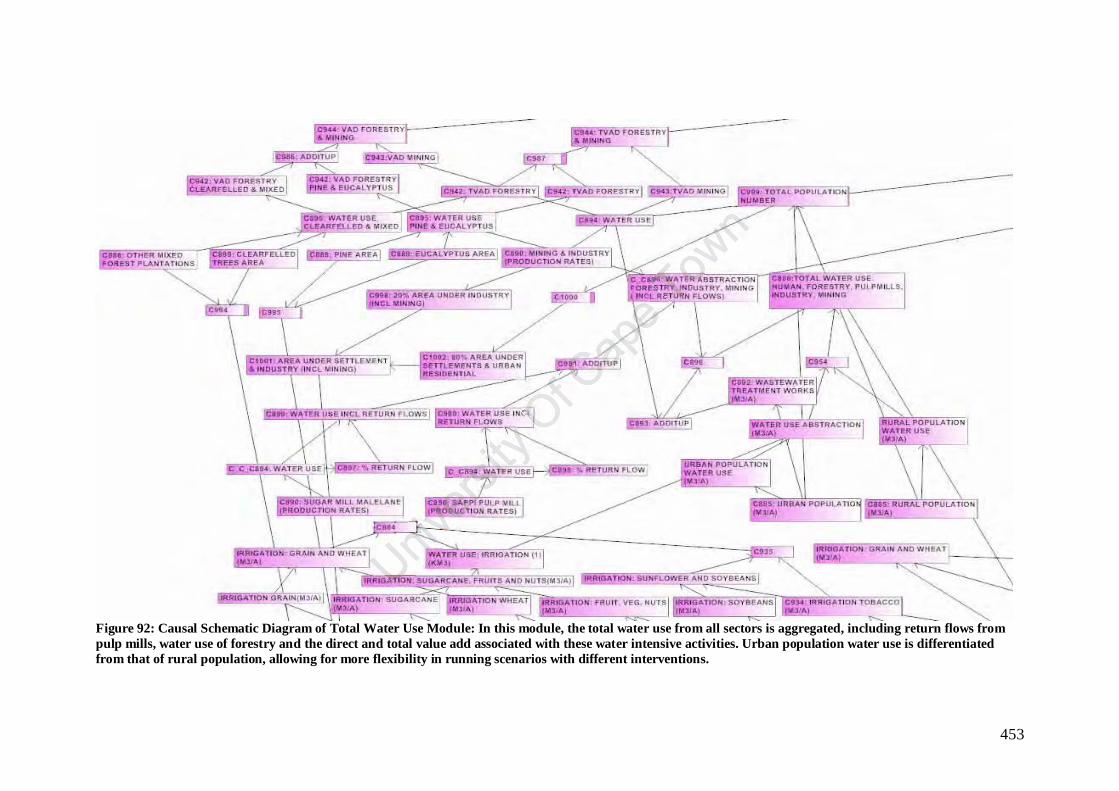
453
Figure 92: Causal Schematic Diagram of Total Water Use Module: In this module, the total water use from all sectors is aggregated, including return flows from pulp mills, water use of forestry and the direct and total value add associated with these water intensive activities. Urban population water use is differentiated from that of rural population, allowing for more flexibility in running scenarios with different interventions.
Univers
ity O
f Cap
e Tow
n

454
Figure 93: Schematic of Irrigated Agriculture Module: Mbombela Municipality Bayesian Model.
Univers
ity O
f Cap
e Tow
n

455
Univers
ity O
f Cap
e Tow
n
456
Figure 94: Schematic of Dryland Agriculture Module: Mbombela Municipality Bayesian Model. Irrigated agricultural activities, as conducted in the Western Cape, are catered for in this module. In particular, crop choice changes can be assessed against different water regime requirements, and evaluated further against projected changes in water supply in the future.
In the next part of this appendix, we show some examples of conditional probability tables. These tables were drawn from the water module of
the Mbombela model. As can clearly be seen, the feasibility of illustrating every probability table is low because of the sheer size of conditional
probability tables. Instead, we present a number of slides of the same probability table, to help the user understand how conditional probability
tables are generated by the software.
Univers
ity O
f Cap
e Tow
n In the next part of this appendix, we show some examples of conditional probability tables. These tables were drawn from the
Town
In the next part of this appendix, we show some examples of conditional probability tables. These tables were drawn from the
bility table is low because of the sheer size of conditional
Town bility table is low because of the sheer size of conditional
Town
probability tables. Instead, we present a number of slides of the same probability table, to help the user understand how con
Town
probability tables. Instead, we present a number of slides of the same probability table, to help the user understand how con

457
Figure 95: Schematic of Water Availability Module: Mbombela Municipality Bayesian Model
Univers
ity O
f Cap
e Tow
n

458
Univers
ity O
f Cap
e Tow
n

459
Figure 96: Schematic of Water Availability Module - Highlighted Section: Mbombela Municipality Bayesian Model. Mean Annual Runoff (MAR) and Expected Net MAR were selected for illustrating CPTs.
Figure 97: Conditional Probability Table of Marginal Probability - Mean Annual Runoff. Variable C1_1_1 is the 'rainfall' variable.
In this section we illustrate the conditional probability tables of the variables shown in Figure 96, Figure 97. The marginal probability table of
the mean annual runoff variable is shown in Figure 98. It has one input node i.e. C1_1_1 or rainfall. However, when considering the conditional
probability table of the expected net mean annual runoff, which has two input nodes, an extremely long probability table is generated. As shown
Univers
ity
Univers
ity
97: Conditional Probability Table of Marginal Probability - Mean Annual Runoff. Variable C1_1_1 is the 'rainfall' variable. Univers
ity
97: Conditional Probability Table of Marginal Probability - Mean Annual Runoff. Variable C1_1_1 is the 'rainfall' variable.
In this section we illustrate the conditional probability tableUniv
ersity
In this section we illustrate the conditional probability table
Of Cap
e Tow
n

460
in Figure 99 to Figure 108, the conditional probability table spans the whole range of C31_1_1 - the 'Evaporation Losses' variable, which runs
until the 100th percentile. Conditional probability tables were not included in full in this dissertation, for this reason.
Univers
ity O
f Cap
e Tow
n
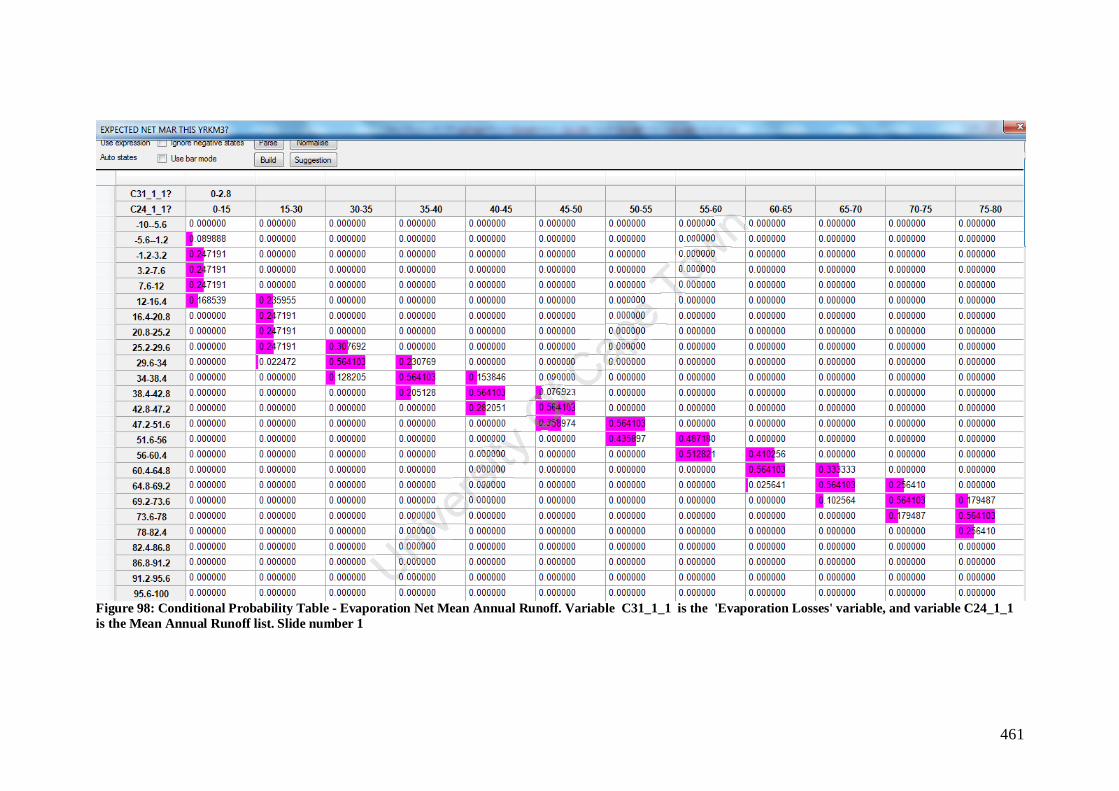
461
Figure 98: Conditional Probability Table - Evaporation Net Mean Annual Runoff. Variable C31_1_1 is the 'Evaporation Losses' variable, and variable C24_1_1 is the Mean Annual Runoff list. Slide number 1
Univers
ity O
f Cap
e Tow
n

462
Figure 99: Conditional Probability Table - Evaporation Net Mean Annual Runoff. Variable C31_1_1 is the 'Evaporation Losses' variable, and variable C24_1_1 is the Mean Annual Runoff list. Slide number 2
Univers
ity O
f Cap
e Tow
n

463
Figure 100: Conditional Probability Table - Evaporation Net Mean Annual Runoff. Variable C31_1_1 is the 'Evaporation Losses' variable, and variable C24_1_1 is the Mean Annual Runoff list. Slide number 3
Univers
ity O
f Cap
e Tow
n

464
Figure 101: Conditional Probability Table - Evaporation Net Mean Annual Runoff. Variable C31_1_1 is the 'Evaporation Losses' variable, and variable C24_1_1 is the Mean Annual Runoff list. Slide number 4
Univers
ity
Univers
ity
- Evaporation Net Mean Annual Runoff. Variable C31_1_1 is the 'Evaporation Losses' variable, and variable C24_1_1 Univers
ity
- Evaporation Net Mean Annual Runoff. Variable C31_1_1 is the 'Evaporation Losses' variable, and variable C24_1_1
Of Cap
e Tow
n

465
Figure 102: Conditional Probability Table - Evaporation Net Mean Annual Runoff. Variable C31_1_1 is the 'Evaporation Losses' variable, and variable C24_1_1 is the Mean Annual Runoff list. Slide number 5 Univ
ersity
Univers
ity
- Evaporation Net Mean Annual Runoff. Variable C31_1_1 is the 'Evaporation Losses' variable, and variable C24_1_1 Univers
ity
- Evaporation Net Mean Annual Runoff. Variable C31_1_1 is the 'Evaporation Losses' variable, and variable C24_1_1
Of Cap
e Tow
n

466
Figure 103: Conditional Probability Table - Evaporation Net Mean Annual Runoff. Variable C31_1_1 is the 'Evaporation Losses' variable, and variable C24_1_1 is the Mean Annual Runoff list. Slide number 5 Univ
ersity
Univers
ity
- Evaporation Net Mean Annual Runoff. Variable C31_1_1 is the 'Evaporation Losses' variable, and variable C24_1_1 Univers
ity
- Evaporation Net Mean Annual Runoff. Variable C31_1_1 is the 'Evaporation Losses' variable, and variable C24_1_1
Of Cap
e Tow
n

467
Figure 104: Conditional Probability Table - Evaporation Net Mean Annual Runoff. Variable C31_1_1 is the 'Evaporation Losses' variable, and variable C24_1_1 is the Mean Annual Runoff list. Slide number 6
Univers
ity
Univers
ity
- Evaporation Net Mean Annual Runoff. Variable C31_1_1 is the 'Evaporation Losses' variable, and variable C24_1_1 Univers
ity
- Evaporation Net Mean Annual Runoff. Variable C31_1_1 is the 'Evaporation Losses' variable, and variable C24_1_1
Of Cap
e Tow
n

468
Figure 105: Conditional Probability Table - Evaporation Net Mean Annual Runoff. Variable C31_1_1 is the 'Evaporation Losses' variable, and variable C24_1_1 is the Mean Annual Runoff list. Slide number 6 Univ
ersity
Univers
ity
- Evaporation Net Mean Annual Runoff. Variable C31_1_1 is the 'Evaporation Losses' variable, and variable C24_1_1 Univers
ity
- Evaporation Net Mean Annual Runoff. Variable C31_1_1 is the 'Evaporation Losses' variable, and variable C24_1_1
Of Cap
e Tow
n

469
Figure 106: Conditional Probability Table - Evaporation Net Mean Annual Runoff. Variable C31_1_1 is the 'Evaporation Losses' variable, and variable C24_1_1 is the Mean Annual Runoff list. Slide number 7
Univers
ity
Univers
ity
- Evaporation Net Mean Annual Runoff. Variable C31_1_1 is the 'Evaporation Losses' variable, and variable C24_1_1 Univers
ity
- Evaporation Net Mean Annual Runoff. Variable C31_1_1 is the 'Evaporation Losses' variable, and variable C24_1_1
Of Cap
e Tow
n

470
Figure 107: Conditional Probability Table - Evaporation Net Mean Annual Runoff. Variable C31_1_1 is the 'Evaporation Losses' variable, and variable C24_1_1 is the Mean Annual Runoff list. Slide number 7. C31_1_1 continues until the 100th percentile. Univ
ersity
Univers
ity
- Evaporation Net Mean Annual Runoff. Variable C31_1_1 is the 'Evaporation Losses' variable, and variable C24_1_1 Univers
ity
- Evaporation Net Mean Annual Runoff. Variable C31_1_1 is the 'Evaporation Losses' variable, and variable C24_1_1 . C31_1_1 continues until the 100th percentile. Univ
ersity
. C31_1_1 continues until the 100th percentile.
Of Cap
e Tow
n

471
Figure 108: Conditional Probability Table - Evaporation Net Mean Annual Runoff. Variable C31_1_1 is the 'Evaporation Losses' variable, and variable C24_1_1 is the Mean Annual Runoff list. Slide number 7. C31_1_1 continues until the 100th percentile. C31_1_1 continues until the 100th percentile. As can be seen from the sequence of slides, the CPTs are too exhaustive in length to be incorporated in full.
Univers
ity
Univers
ity
- Evaporation Net Mean Annual Runoff. Variable C31_1_1 is the 'Evaporation Losses' variable, and variable C24_1_1 Univers
ity
- Evaporation Net Mean Annual Runoff. Variable C31_1_1 is the 'Evaporation Losses' variable, and variable C24_1_1 is the Mean Annual Runoff list. Slide number 7. C31_1_1 continues until the 100th percentile. C31_1_1 continues until the 10Univ
ersity
is the Mean Annual Runoff list. Slide number 7. C31_1_1 continues until the 100th percentile. C31_1_1 continues until the 10
Of Cap
e Tow
n

472
Univers
ity O
f Cap
e Tow
n

473
16. Appendix E
Table 21:
Table Illustrating Factors of Increasing Complexity as Addressed by Single Case Studies. A score of 1-5 has been used to estimate the degree to which each case study engaged with the full range of factors. This helps illustrate the matrix of complex challenges, as they were engaged with each successive case study.
Case Study Cross-Scale Effects
Cross-Sector Effects
New Indices
Resilience &Adaptive Capacity
Adaptability Participatory Processes
Decision Support
Incomati-Maputo Catchment2Coast Study
1 1 1 1 1 1 1
Climate Change - Irrigated Agriculture Study
2 2 2 2 2 2 2
Climate Change - Irrigated Agriculture - Biofuels Study
3 3 3 4 3.5 4 4 Univ
ersity
Univers
ity
2
Univers
ity
2
Univers
ity
Univers
ity
Univers
ity
Univers
ity O
f Capacity
Of Capacity
Of Of Of Cap
e silience
Cape silience
Adaptive Cape
Adaptive CapacityCap
e Capacity
Adaptability
Cape Adaptability
Cape
Cape
Cape T
own Table Illustrating Factors of Increasing Complexity as Addressed by Single Case Studies. A score of 1
Town Table Illustrating Factors of Increasing Complexity as Addressed by Single Case Studies. A score of 1
which each case study engaged with the full range of factors. This helps illustrate the matrix of complex challenges, as they were engaged with
Town which each case study engaged with the full range of factors. This helps illustrate the matrix of complex challenges, as they were engaged with
AdaptabilityTown
AdaptabilityTown

474
Magisterial District Scales: Nelspruit & Mbombela Scales
3.5 4 3.5 4 4 3 3
Western Cape Province Climate Change Strategy Review
5 5 5 5 5 4.5 4.5
Univers
ity O
f Cap
e
Cape
Cape T
own
5
Town
5
Town
Town