Embed Size (px)
Citation preview
1620 SSSAJ: Volume 71: Number 5 • September–October 2007
SOIL
CH
EMIS
TRY
Soil Sci. Soc. Am. J. 71:1620–1628doi:10.2136/sssaj2006.0400Received 22 Nov. 2006.*Corresponding author ([email protected]).© Soil Science Society of America677 S. Segoe Rd. Madison WI 53711 USAAll rights reserved. No part of this periodical may be reproduced or transmitted in any form or by any means, electronic or mechanical, including photocopying, recording, or any information storage and retrieval system, without permission in writing from the publisher. Permission for printing and for reprinting the material contained herein has been obtained by the publisher.
Tillage infl uences soil properties by causing physical disruption of the soil structure, thereby altering the soil water and O2
content (Curci et al., 1997). Furthermore, the intensity of tillage determines the stability and turnover of soil aggregates and thus the presence of organic matter (OM) within or between aggregates. The accessibility of organic substrates for microbial activity, and hence their susceptibility to decomposition, depends on this spatial loca-tion of a substrate in the soil matrix because: (i) there is reduced access for the microorganisms and reduced diffusion of their enzymes into the intraaggregate space; and (ii) aerobic decomposi-tion is restricted due to a reduced diffusion of O2. Consequently, there exists a very intimate link between tillage, soil aggregation, and SOM turnover. Indeed, a decreased macroaggregate turnover under RT compared with CT was found to lead to a stabilization of POM
in stable microaggregates (Six et al., 2000). Higher C mineraliza-tion following crushing of microaggregates (Mikha and Rice, 2004; Bossuyt et al., 2002) corroborates the theory that more otherwise mineralizable, i.e., labile, SOM is stored as occluded POM in less disturbed soils (Elliot, 1986). This occluded POM may account for an important part (10–60%) of the total gain in SOM in no-till soils compared with CT (Six et al., 1999). Next to the differences in the relative distribution of OM across OM fractions between RT and CT managed fi elds, RT management also signifi cantly increases soil microbial activity (e.g., Granatstein et al., 1987) and enzyme activity (e.g., Curci et al., 1997) and favors a more fungi-domi-nated microbial biomass, particularly in the surface layer (Frey et al., 1999). The microbial activity and community structure, in turn, are directly determinant on SOM turnover because soil biota mediate decomposition and humifi cation processes and indirectly through the role that bacteria and fungi and their mucilages play in aggregate stabilization (Oades, 1984).
Very few studies, however, have looked into differences in the chemical composition of the SOM between CT and RT managed soils that may result from the above reported shifts in microbial activ-ity, in the microbial community’s composition, and in the distribu-tion of SOM across different POM fractions after establishment of RT. Using solid-state 13C nuclear magnetic resonance (NMR), Golchin et al. (1994) and Kölbl and Kögel-Knabner (2004) found occluded light fraction (LF) and POM to contain more alkyl C and less O-alkyl C than the free LF and POM. These data suggest that
Steven Sleutel*Mohammed Abdul KaderDep. of Soil Management and Soil CareGhent Univ.Coupure Links 6539000 GentBelgium
Peter LeinweberInstitute for Land Use, Univ. of RostockJustus von Liebig Weg 618059 RostockGermany
Karoline D’HaeneStefaan De NeveDep. of Soil Management and Soil CareGhent Univ.Coupure Links 6539000 GentBelgium
Abbreviations: CT, conventional tillage; fPOM, free particulate organic matter; iPOM, intramicroaggregate particulate organic matter; LF, light fraction; NMR, nuclear magnetic resonance; OC, organic carbon; OM, organic matter; Py-FIMS, pyrolysis–fi eld ionization mass spectroscopy; RT, reduced tillage; SOC, soil organic carbon; SOM, soil organic matter; TII, total ion intensity.
We examined the effects of 10 yr of reduced tillage (RT) management, compared with con-ventional tillage (CT), on the chemical composition of soil organic matter (SOM) using a combination of physical fractionation and pyrolysis–fi eld ionization mass spectroscopy (Py–FIMS). Surface soil samples (0–10 cm), which were collected from two adjacent CT and RT managed fi elds, were separated into particulate organic matter (POM) fractions and sand, silt, and clay size separates. Higher amounts of C (77%) and N (64%) were observed in all size separates of the RT soil and, in particular, the proportion of intramicroaggregate POM was two times as large as in the CT soil. The Py–FIMS spectra showed that larger proportions of free fatty acids, sterols, and N-containing compounds were present in the RT soil’s sand fraction than in the CT soil. Similar observations were also made for both free and intramicroaggregate POM fractions. In the silt and clay size fractions, no substantial differences in SOM composition were measured between tillage treatments, except that the RT soil’s clay fraction had a higher proportion of N-containing compounds and a lower pro-portion of alkylaromatics. Ratios of carbohydrate hexose to pentose subunits and of lignin monomers + phenols to lignin dimers confi rmed a less decomposed character of the SOM in the silt and clay size fractions of the RT soil. These observations can be logically linked to the reduced mixing of crop residues and manure in the soil profi le and higher surface soil microbial biomass under RT.
Tillage Management Alters Surface Soil Organic Matter Composition: A Pyrolysis Mass Spectroscopy Study
Published online August 27, 2007
SSSAJ: Volume 71: Number 5 • September –October 2007 1621
during the inclusion of occluded OM, there is a selective decompo-sition of carbohydrates and relative enrichment of more stable OM compounds compared with free OM. Elaborate investigations on this subject will, however, require more detailed analytical chemical methods. In this context, Py–FIMS has been shown to uniquely yield a detailed chemical characterization of SOM combined with data on the thermal stability of individual SOM compounds (Leinweber and Schulten, 1995). The thermal stability of SOM compounds depends strongly on the strengths of the chemical bonds within the organic macromolecules or between organic materials and miner-als and thus provides additional important information on SOM quality. As such, based on Py–FIMS analysis, Monreal et al. (1995) found positive correlations between macroaggregation (>250 µm) and the proportions of lignin dimers, sterols, lipids, and alkylaro-matics in the >250-µm aggregate fraction.
With a particular focus on OM in free and microaggregate-associated POM, however, none of these very few studies have yet addressed the effects of RT management on the whole SOM compo-sition. In a review of the literature, Schulten and Leinweber (2000) found not only sand but also silt size fractions to be enriched in rela-tively undecomposed OM under SOM-conserving management. Clay fractions, in turn, are unequivocally richer in OM from the soil biomass and its metabolites, which are represented by N-containing compounds and carbohydrates (Leinweber and Schulten, 1995). A larger input of fresh plant material and a larger soil microbial activity in the surface layer of RT soils could therefore possibly alter SOM composition in silt and clay fractions under RT as well. Detailed investigations on this matter are at present absent, which obstructs our understanding of processes involved in tillage-induced changes in SOM content and quality.
Accordingly, the underlying aim of this study was to further elucidate the relationship between tillage management and SOM quality. Specifi c objectives were: (i) to verify the hypothesized accu-mulation of biochemically labile OM in the surface layer brought about by a shift in management to RT by assessing the distribution of SOM across individual soil size fractions and POM fractions; and (ii) to examine the effects of RT on the chemical composition of SOM in sand, silt, and clay size separates as well as in the whole soil and intramicroaggregate particulate organic matter (iPOM) and free particulate organic matter (fPOM) fractions compared with CT.
Based on the above considerations, we used physical fraction-ation and Py–FIMS to study SOM and SOM fractions in the surface soil of two adjacent RT and CT fi elds to address these objectives.
MATERIALS AND METHODSSite Description and Sampling
The soil samples were collected from two adjacent farm fi elds located in Villers-le-Bouillet (Belgium) under RT (for the past 10 yr) and CT (soil type: Alfi sol, silt). The RT fi eld has a slightly higher clay percentage than the CT fi eld. The annual mean temperature is 9.8°C and the mean annual rainfall 780 mm. A three-year crop rotation of winter barley (Hordeum vulgare L.)–sugarbeet (Beta vulgaris L.) or potato (Solanum tuberosum L.)–winter wheat (Triticum aestivum L.) was established 25 yr ago. White mustard (Sinapis alba L.) and win-ter oat (Avena sativa L.) were sown as green manures
after harvest of winter barley and potato, respectively. An average dose of cattle farmyard manure of 25 Mg ha−1 was applied right before sowing of the green manure on both RT and CT fi elds. Moldboard plowing (20–25 cm) was performed annually in the CT treatment. Tillage operations for the RT treatment consisted of chopping and superfi cial incorporation of harvest residues before seedbed preparation and sowing of sugarbeet or potato and of direct drilling of winter wheat. Harvest of beet or potato also constituted an additional heavy soil disturbance every 2 or 3 yr in both RT and CT fi elds. The exact cropping history of these fi elds is unknown but arable cereal–root crop based rotations have been practiced for at least 50 yr. Three plots of 150 m2 (10 by 15 m), each spaced 10 m apart, were sampled in the RT and CT fi elds in March 2005 by boring fi ve times per subplot with an auger (0–10, 10–20, 20–30, 30–40, and 40–60 cm). Soil samples were air dried at room temperature. The main physicochemical properties of the different soil layers were determined per subplot (Table 1). For each depth layer, the subplot soil samples of the replicate plots were then bulked for subsequent texture analysis, physical fractionation, and mass spectro-scopic analyses. Microbial biomass organic C (OC) was measured with a chloroform fumigation extraction using a 0.1 M KCl extractant (1:2 soil /extractant w/v) (Voroney et al., 1993). The OC in the extracts was analyzed with a total organic C analyzer (TOC-V CPN, Shimadzu Corp., Kyoto, Japan). An extraction effi ciency KEC value of 0.25 was used, as suggested by Voroney et al. (1993).
Particle Size SeparationBulked (three fi eld replicates) whole-soil samples of the 0- to
10-cm depth layer were separated into three particle size fractions: clay (<2 µm), silt (2–63 µm), and sand (63–2000 µm). For this pur-pose, soil samples were dispersed in a two-step procedure according to Amelung (1997) and Thiele-Bruhn et al. (2004) using an ultra-sonic vibrator (Sonics Vibracell 600 with Sonotrode CV 26, Sonics & Materials Inc., Newton, CT). A 30-g sample was weighed into a bea-ker and 500 mL of deionized H2O was added. To preserve particulate organic matter from disruption, the soil slurry was fi rst sonicated at 60 J mL−1 while the temperature was kept constant at 20°C. The sand fraction was separated by wet sieving through a 63-µm mesh screen. Deionized H2O was added to the remaining soil suspension, giving a soil/solution ratio of 1:20, and it was additionally sonicated at 440 J mL−1. The energy input was calibrated from the heating of H2O in a Dewar vessel, as described by Thiele-Bruhn et al. (2004).
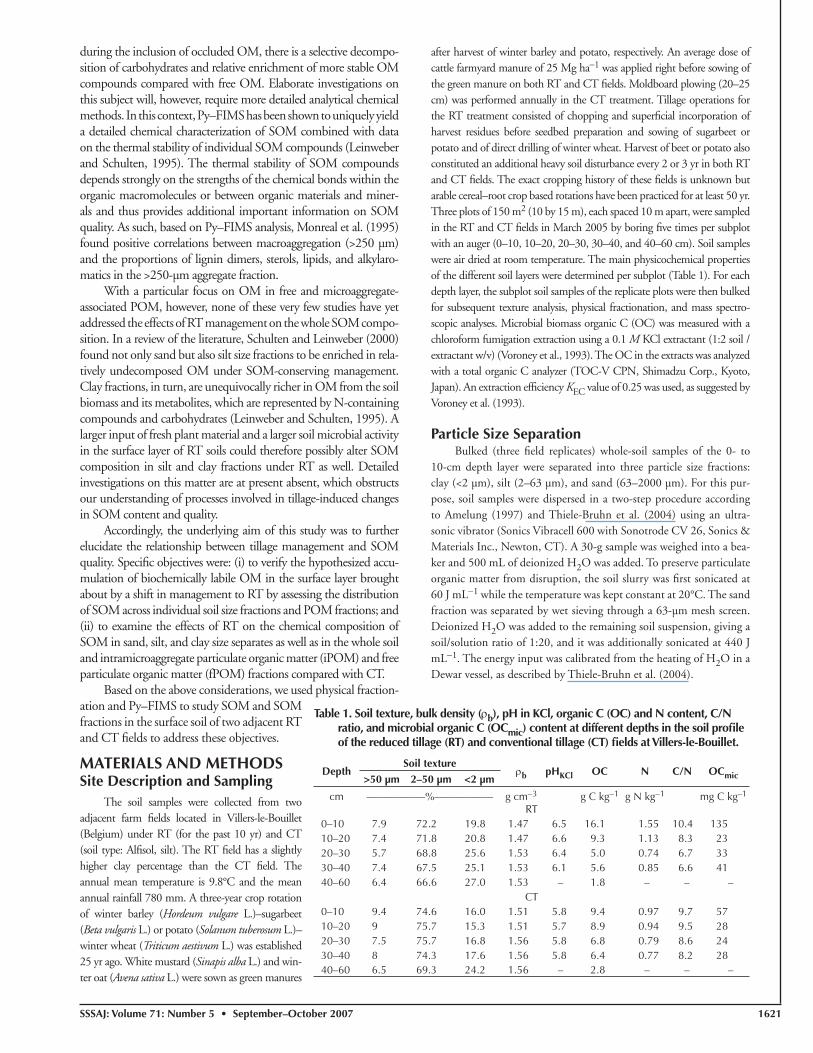
Table 1. Soil texture, bulk density (ρb), pH in KCl, organic C (OC) and N content, C/N ratio, and microbial organic C (OCmic) content at different depths in the soil profi le of the reduced tillage (RT) and conventional tillage (CT) fi elds at Villers-le-Bouillet.
DepthSoil texture
ρb pHKCl OC N C/N OCmic>50 µm 2–50 µm <2 µm
cm –––––––––––%––––––––––– g cm−3 g C kg−1 g N kg−1 mg C kg–1
RT0–10 7.9 72.2 19.8 1.47 6.5 16.1 1.55 10.4 13510–20 7.4 71.8 20.8 1.47 6.6 9.3 1.13 8.3 2320–30 5.7 68.8 25.6 1.53 6.4 5.0 0.74 6.7 3330–40 7.4 67.5 25.1 1.53 6.1 5.6 0.85 6.6 4140–60 6.4 66.6 27.0 1.53 – 1.8 – – –
CT0–10 9.4 74.6 16.0 1.51 5.8 9.4 0.97 9.7 5710–20 9 75.7 15.3 1.51 5.7 8.9 0.94 9.5 2820–30 7.5 75.7 16.8 1.56 5.8 6.8 0.79 8.6 2430–40 8 74.3 17.6 1.56 5.8 6.4 0.77 8.2 2840–60 6.5 69.3 24.2 1.56 – 2.8 – – –
1622 SSSAJ: Volume 71: Number 5 • September –October 2007
The resulting soil suspension was separated into the clay and silt particle size fractions by gravity sedimentation in water following Stoke’s law. Sedimentation was repeated up to 10 times, and about 4 L of suspension containing the clay fraction was collected. A 1-L sub-sample of the clay suspension was centrifuged at 16,900 × g. Clay and silt fractions were dried at 50°C after decanting the clear supernatant. Particle size fractionations were performed in duplicate.
Particulate Organic Matter FractionationSoil organic matter in the bulked (three fi eld replicates) surface soil
samples (0–10 cm) was physically fractionated into OM associated with the clay + silt particles, OM residing in stable microaggregates (53–250 µm), and the free POM based on the “microaggregate isolation” methodology proposed by Six et al. (2000). The applied methodology, described in detail in Sleutel et al. (2006), results in the sequential isolation of (i) water-stable microaggregates from coarse fPOM (>250 µm) and silt- and clay-associated OM (<53 µm) by means of wet sieving, (ii) density separation of fi ne fPOM (53–250 µm) from iPOM and intramicroaggregate silt- and clay-associated OM (<53 µm), and (iii) isolation of iPOM (53–250 µm) from the latter
OM fraction. The fi eld-moist soil was gently broken apart by hand and was passed through an 8-mm sieve to break down large macroaggregates. The soil was then dried at 50°C. Three replicate 10-g subsamples were used for the physical fractionation procedure. Subsamples of fractions or entire frac-tions were analyzed for their total C and N content with a Variomax CNS analyzer (Elementar Analysensysteme, Hanau, Germany).
Pyrolysis–Field Ionization Mass SpectroscopyWhole soil samples, size separates, and POM fractions were ana-
lyzed by means of Py–FIMS. The coarse fPOM and fi ne fPOM were combined into one fPOM fraction for Py–FIMS analysis. For tem-perature-resolved Py–FIMS, about 2 to 5 mg of sample material was thermally degraded in the ion source of a modifi ed Finnigan MAT 731 high-performance mass spectrometer (Finnigan MAT, San Jose, CA). The samples were heated under a high vacuum from ambient temperature to 700°C at a heating rate of 10 K per magnetic scan (~1.7 K s−1) (three replicates). After about 20 min of total registration time, about 60 magnetic scans were recorded for the mass range 16 to 1000 Da (single spectra). The single-scan spectra were integrated to obtain one summed spectrum. In general, the summed spectra of three replicates were averaged to give the fi nal survey spectrum. These survey spectra, in particular the assignment of marker signals to chemical compounds, were interpreted as described by Schulten and Leinweber (1999), modifi ed to include 10 compound classes. These are (i) carbohydrates with pentose and hexose subunits, (ii) phenols and lignin monomers, (iii) lignin dimers, (iv) lipids, alkanes, alkenes, bound fatty acids, and alkylmonoesters, (v) alkylaromatics, (vi) mainly heterocyclic N-containing compounds, (vii) sterols, (viii) pep-tides, (ix) suberin, and (x) free fatty acids. As well as series of marker signals, the volatilization temperature is also considered for identi-fi cation. For each of the 60 single scans, the ion intensities of these marker signals were calculated and the average ion intensities for each class of compound were plotted against the pyrolysis temperature, giv-ing characteristic thermograms. All samples were weighed before and after Py–FIMS to normalize ion intensities per milligram of sample. Detailed descriptions of the Py–FIMS methodology (Schulten, 1993) and statistical evaluations of sample weight and residue, volatilized matter, and total ion intensities are given by Sorge et al. (1993).
RESULTS AND DISCUSSIONSoil Organic Carbon, Nitrogen, and Microbial Organic Carbon Depth Profi les
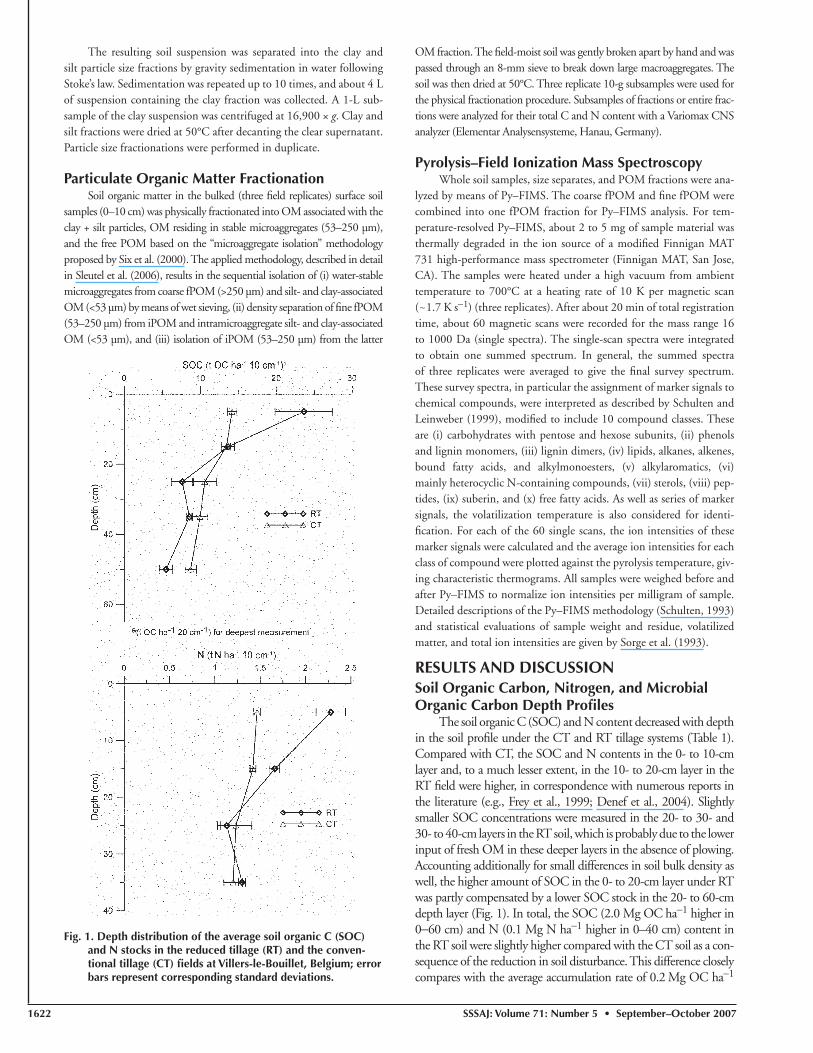
The soil organic C (SOC) and N content decreased with depth in the soil profi le under the CT and RT tillage systems (Table 1). Compared with CT, the SOC and N contents in the 0- to 10-cm layer and, to a much lesser extent, in the 10- to 20-cm layer in the RT fi eld were higher, in correspondence with numerous reports in the literature (e.g., Frey et al., 1999; Denef et al., 2004). Slightly smaller SOC concentrations were measured in the 20- to 30- and 30- to 40-cm layers in the RT soil, which is probably due to the lower input of fresh OM in these deeper layers in the absence of plowing. Accounting additionally for small differences in soil bulk density as well, the higher amount of SOC in the 0- to 20-cm layer under RT was partly compensated by a lower SOC stock in the 20- to 60-cm depth layer (Fig. 1). In total, the SOC (2.0 Mg OC ha−1 higher in 0−60 cm) and N (0.1 Mg N ha−1 higher in 0–40 cm) content in the RT soil were slightly higher compared with the CT soil as a con-sequence of the reduction in soil disturbance. This difference closely compares with the average accumulation rate of 0.2 Mg OC ha−1
Fig. 1. Depth distribution of the average soil organic C (SOC) and N stocks in the reduced tillage (RT) and the conven-tional tillage (CT) fi elds at Villers-le-Bouillet, Belgium; error bars represent corresponding standard deviations.
SSSAJ: Volume 71: Number 5 • September –October 2007 1623
yr−1 in the 0- to 30-cm layer in temperate soils under no-till, as calculated by Six et al. (2004). In the RT fi eld, the microbial biomass OC was 2.5 times higher than in the 0- to 10-cm layer of the CT fi eld, but not in the deeper soil layers. Under a temperate climate, higher surface layer microbial biomass OC contents following the adoption of RT have indeed often been observed (Höfl ich et al., 1999; Kandeler et al., 1999). Changes in SOM stocks are generally accompa-nied by a redistribution of SOM across individual fractions (Tiessen and Stewart, 1983) and changes in SOM composition (Schulten et al., 1990). Potential changes in SOM fractions were here further investigated by assessing the distribution of SOM in size separates and POM fractions of the 0- to 10-cm depth layer.
Surface Soil Organic Carbon and Nitrogen Distribution in Isolated Size and Particulate Organic Matter Fractions
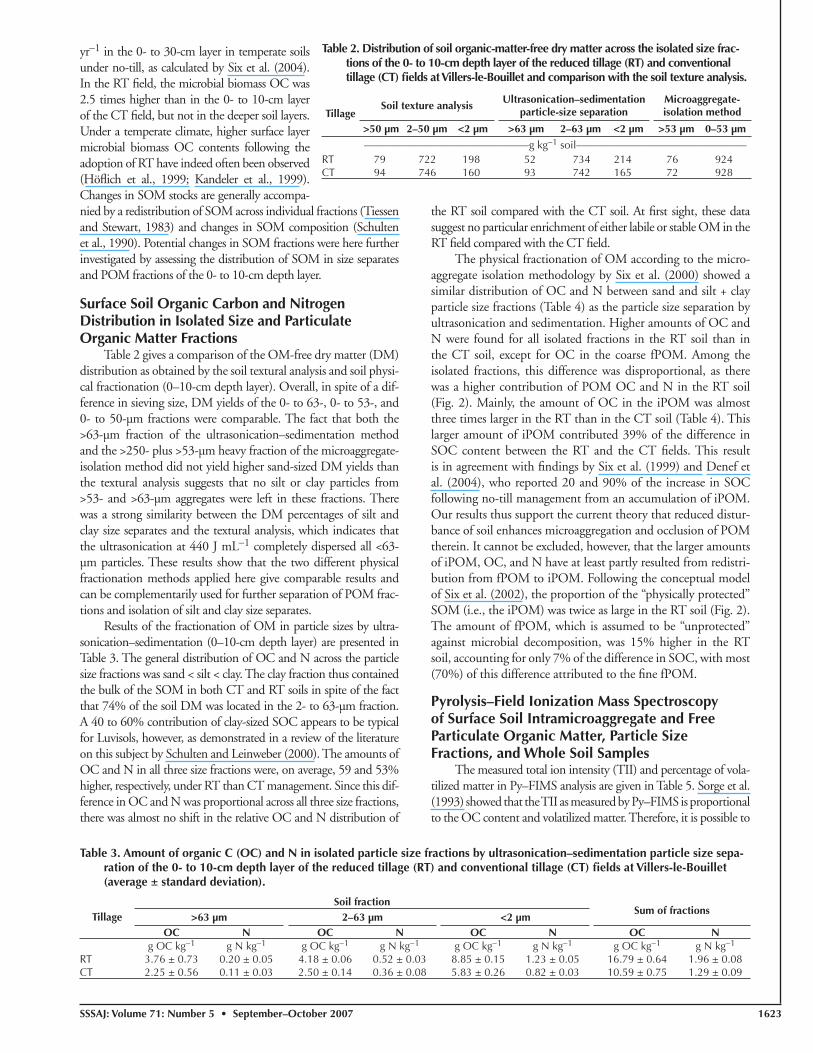
Table 2 gives a comparison of the OM-free dry matter (DM) distribution as obtained by the soil textural analysis and soil physi-cal fractionation (0–10-cm depth layer). Overall, in spite of a dif-ference in sieving size, DM yields of the 0- to 63-, 0- to 53-, and 0- to 50-µm fractions were comparable. The fact that both the >63-µm fraction of the ultrasonication–sedimentation method and the >250- plus >53-µm heavy fraction of the microaggregate-isolation method did not yield higher sand-sized DM yields than the textural analysis suggests that no silt or clay particles from >53- and >63-µm aggregates were left in these fractions. There was a strong similarity between the DM percentages of silt and clay size separates and the textural analysis, which indicates that the ultrasonication at 440 J mL−1 completely dispersed all <63-µm particles. These results show that the two different physical fractionation methods applied here give comparable results and can be complementarily used for further separation of POM frac-tions and isolation of silt and clay size separates.
Results of the fractionation of OM in particle sizes by ultra-sonication–sedimentation (0–10-cm depth layer) are presented in Table 3. The general distribution of OC and N across the particle size fractions was sand < silt < clay. The clay fraction thus contained the bulk of the SOM in both CT and RT soils in spite of the fact that 74% of the soil DM was located in the 2- to 63-µm fraction. A 40 to 60% contribution of clay-sized SOC appears to be typical for Luvisols, however, as demonstrated in a review of the literature on this subject by Schulten and Leinweber (2000). The amounts of OC and N in all three size fractions were, on average, 59 and 53% higher, respectively, under RT than CT management. Since this dif-ference in OC and N was proportional across all three size fractions, there was almost no shift in the relative OC and N distribution of
the RT soil compared with the CT soil. At fi rst sight, these data suggest no particular enrichment of either labile or stable OM in the RT fi eld compared with the CT fi eld.
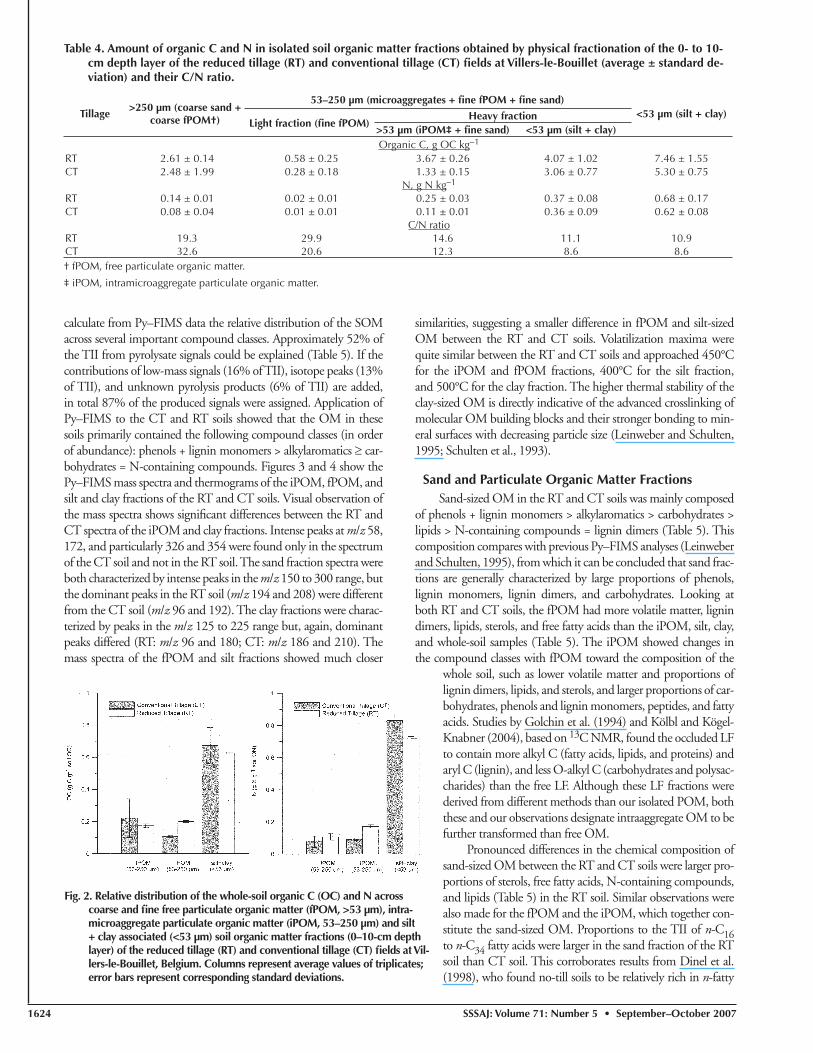
The physical fractionation of OM according to the micro-aggregate isolation methodology by Six et al. (2000) showed a similar distribution of OC and N between sand and silt + clay particle size fractions (Table 4) as the particle size separation by ultrasonication and sedimentation. Higher amounts of OC and N were found for all isolated fractions in the RT soil than in the CT soil, except for OC in the coarse fPOM. Among the isolated fractions, this difference was disproportional, as there was a higher contribution of POM OC and N in the RT soil (Fig. 2). Mainly, the amount of OC in the iPOM was almost three times larger in the RT than in the CT soil (Table 4). This larger amount of iPOM contributed 39% of the difference in SOC content between the RT and the CT fi elds. This result is in agreement with fi ndings by Six et al. (1999) and Denef et al. (2004), who reported 20 and 90% of the increase in SOC following no-till management from an accumulation of iPOM. Our results thus support the current theory that reduced distur-bance of soil enhances microaggregation and occlusion of POM therein. It cannot be excluded, however, that the larger amounts of iPOM, OC, and N have at least partly resulted from redistri-bution from fPOM to iPOM. Following the conceptual model of Six et al. (2002), the proportion of the “physically protected” SOM (i.e., the iPOM) was twice as large in the RT soil (Fig. 2). The amount of fPOM, which is assumed to be “unprotected” against microbial decomposition, was 15% higher in the RT soil, accounting for only 7% of the difference in SOC, with most (70%) of this difference attributed to the fi ne fPOM.
Pyrolysis–Field Ionization Mass Spectroscopy of Surface Soil Intramicroaggregate and Free Particulate Organic Matter, Particle Size Fractions, and Whole Soil Samples
The measured total ion intensity (TII) and percentage of vola-tilized matter in Py–FIMS analysis are given in Table 5. Sorge et al. (1993) showed that the TII as measured by Py–FIMS is proportional to the OC content and volatilized matter. Therefore, it is possible to
Table 2. Distribution of soil organic-matter-free dry matter across the isolated size frac-tions of the 0- to 10-cm depth layer of the reduced tillage (RT) and conventional tillage (CT) fi elds at Villers-le-Bouillet and comparison with the soil texture analysis.
TillageSoil texture analysis
Ultrasonication–sedimentation particle-size separation
Microaggregate- isolation method
>50 µm 2–50 µm <2 µm >63 µm 2–63 µm <2 µm >53 µm 0–53 µm
–––––––––––––––––––––––––––––––g kg−1 soil––––––––––––––––––––––––––––––––RT 79 722 198 52 734 214 76 924CT 94 746 160 93 742 165 72 928
Table 3. Amount of organic C (OC) and N in isolated particle size fractions by ultrasonication–sedimentation particle size sepa-ration of the 0- to 10-cm depth layer of the reduced tillage (RT) and conventional tillage (CT) fi elds at Villers-le-Bouillet (average ± standard deviation).
TillageSoil fraction
Sum of fractions>63 µm 2–63 µm <2 µm
OC N OC N OC N OC Ng OC kg−1 g N kg−1 g OC kg−1 g N kg−1 g OC kg−1 g N kg−1 g OC kg−1 g N kg−1
RT 3.76 ± 0.73 0.20 ± 0.05 4.18 ± 0.06 0.52 ± 0.03 8.85 ± 0.15 1.23 ± 0.05 16.79 ± 0.64 1.96 ± 0.08CT 2.25 ± 0.56 0.11 ± 0.03 2.50 ± 0.14 0.36 ± 0.08 5.83 ± 0.26 0.82 ± 0.03 10.59 ± 0.75 1.29 ± 0.09
1624 SSSAJ: Volume 71: Number 5 • September –October 2007
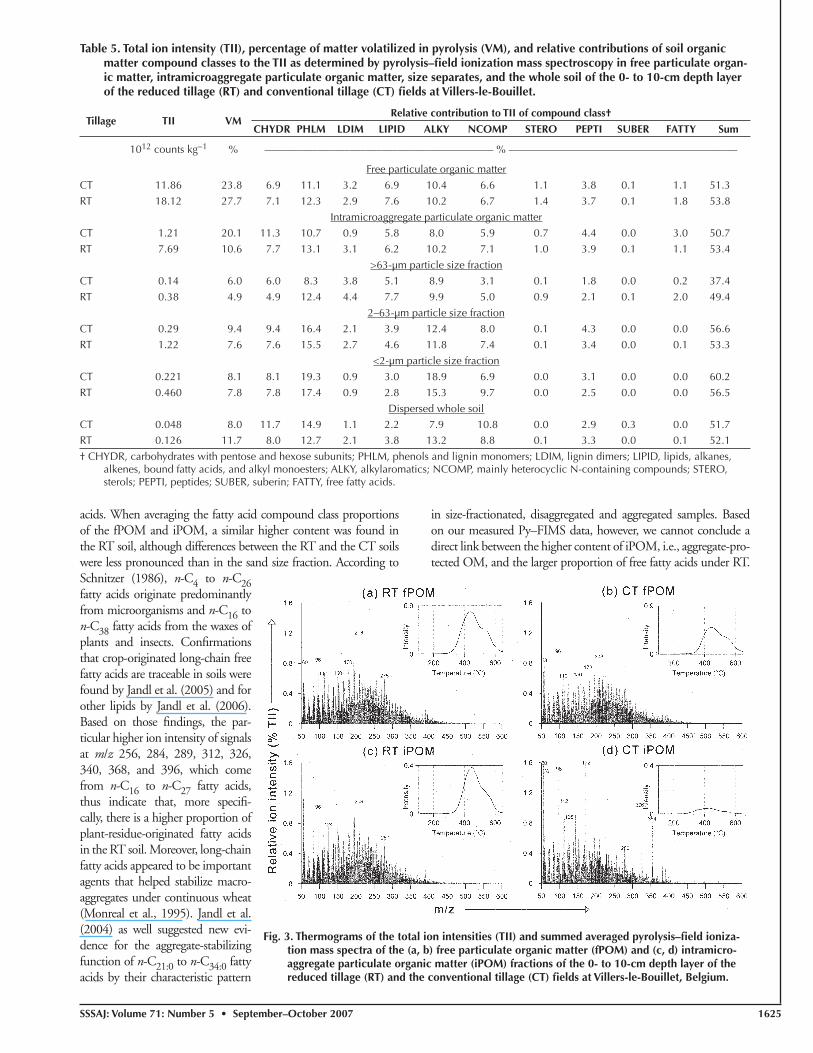
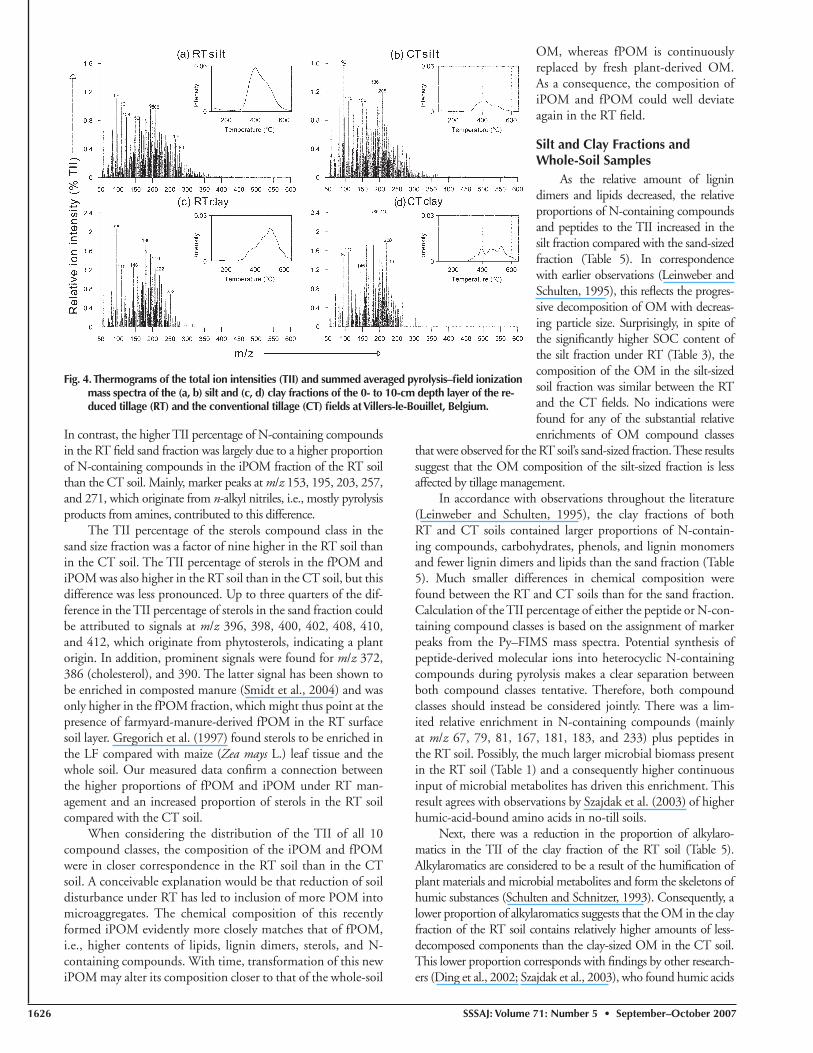
calculate from Py–FIMS data the relative distribution of the SOM across several important compound classes. Approximately 52% of the TII from pyrolysate signals could be explained (Table 5). If the contributions of low-mass signals (16% of TII), isotope peaks (13% of TII), and unknown pyrolysis products (6% of TII) are added, in total 87% of the produced signals were assigned. Application of Py–FIMS to the CT and RT soils showed that the OM in these soils primarily contained the following compound classes (in order of abundance): phenols + lignin monomers > alkylaromatics ≥ car-bohydrates = N-containing compounds. Figures 3 and 4 show the Py–FIMS mass spectra and thermograms of the iPOM, fPOM, and silt and clay fractions of the RT and CT soils. Visual observation of the mass spectra shows signifi cant differences between the RT and CT spectra of the iPOM and clay fractions. Intense peaks at m/z 58, 172, and particularly 326 and 354 were found only in the spectrum of the CT soil and not in the RT soil. The sand fraction spectra were both characterized by intense peaks in the m/z 150 to 300 range, but the dominant peaks in the RT soil (m/z 194 and 208) were different from the CT soil (m/z 96 and 192). The clay fractions were charac-terized by peaks in the m/z 125 to 225 range but, again, dominant peaks differed (RT: m/z 96 and 180; CT: m/z 186 and 210). The mass spectra of the fPOM and silt fractions showed much closer
similarities, suggesting a smaller difference in fPOM and silt-sized OM between the RT and CT soils. Volatilization maxima were quite similar between the RT and CT soils and approached 450°C for the iPOM and fPOM fractions, 400°C for the silt fraction, and 500°C for the clay fraction. The higher thermal stability of the clay-sized OM is directly indicative of the advanced crosslinking of molecular OM building blocks and their stronger bonding to min-eral surfaces with decreasing particle size (Leinweber and Schulten, 1995; Schulten et al., 1993).
Sand and Particulate Organic Matter FractionsSand-sized OM in the RT and CT soils was mainly composed
of phenols + lignin monomers > alkylaromatics > carbohydrates > lipids > N-containing compounds = lignin dimers (Table 5). This composition compares with previous Py–FIMS analyses (Leinweber and Schulten, 1995), from which it can be concluded that sand frac-tions are generally characterized by large proportions of phenols, lignin monomers, lignin dimers, and carbohydrates. Looking at both RT and CT soils, the fPOM had more volatile matter, lignin dimers, lipids, sterols, and free fatty acids than the iPOM, silt, clay, and whole-soil samples (Table 5). The iPOM showed changes in the compound classes with fPOM toward the composition of the
whole soil, such as lower volatile matter and proportions of lignin dimers, lipids, and sterols, and larger proportions of car-bohydrates, phenols and lignin monomers, peptides, and fatty acids. Studies by Golchin et al. (1994) and Kölbl and Kögel-Knabner (2004), based on 13C NMR, found the occluded LF to contain more alkyl C (fatty acids, lipids, and proteins) and aryl C (lignin), and less O-alkyl C (carbohydrates and polysac-charides) than the free LF. Although these LF fractions were derived from different methods than our isolated POM, both these and our observations designate intraaggregate OM to be further transformed than free OM.
Pronounced differences in the chemical composition of sand-sized OM between the RT and CT soils were larger pro-portions of sterols, free fatty acids, N-containing compounds, and lipids (Table 5) in the RT soil. Similar observations were also made for the fPOM and the iPOM, which together con-stitute the sand-sized OM. Proportions to the TII of n-C16 to n-C34 fatty acids were larger in the sand fraction of the RT soil than CT soil. This corroborates results from Dinel et al. (1998), who found no-till soils to be relatively rich in n-fatty
Table 4. Amount of organic C and N in isolated soil organic matter fractions obtained by physical fractionation of the 0- to 10-cm depth layer of the reduced tillage (RT) and conventional tillage (CT) fi elds at Villers-le-Bouillet (average ± standard de-viation) and their C/N ratio.
Tillage>250 µm (coarse sand +
coarse fPOM†)
53–250 µm (microaggregates + fi ne fPOM + fi ne sand)<53 µm (silt + clay)
Light fraction (fi ne fPOM)Heavy fraction
>53 µm (iPOM‡ + fi ne sand) <53 µm (silt + clay)Organic C, g OC kg−1
RT 2.61 ± 0.14 0.58 ± 0.25 3.67 ± 0.26 4.07 ± 1.02 7.46 ± 1.55CT 2.48 ± 1.99 0.28 ± 0.18 1.33 ± 0.15 3.06 ± 0.77 5.30 ± 0.75
N, g N kg−1
RT 0.14 ± 0.01 0.02 ± 0.01 0.25 ± 0.03 0.37 ± 0.08 0.68 ± 0.17CT 0.08 ± 0.04 0.01 ± 0.01 0.11 ± 0.01 0.36 ± 0.09 0.62 ± 0.08
C/N ratioRT 19.3 29.9 14.6 11.1 10.9CT 32.6 20.6 12.3 8.6 8.6† fPOM, free particulate organic matter.
‡ iPOM, intramicroaggregate particulate organic matter.
Fig. 2. Relative distribution of the whole-soil organic C (OC) and N across coarse and fi ne free particulate organic matter (fPOM, >53 µm), intra-microaggregate particulate organic matter (iPOM, 53–250 µm) and silt + clay associated (<53 µm) soil organic matter fractions (0–10-cm depth layer) of the reduced tillage (RT) and conventional tillage (CT) fi elds at Vil-lers-le-Bouillet, Belgium. Columns represent average values of triplicates; error bars represent corresponding standard deviations.
SSSAJ: Volume 71: Number 5 • September –October 2007 1625
acids. When averaging the fatty acid compound class proportions of the fPOM and iPOM, a similar higher content was found in the RT soil, although differences between the RT and the CT soils were less pronounced than in the sand size fraction. According to Schnitzer (1986), n-C4 to n-C26 fatty acids originate predominantly from microorganisms and n-C16 to n-C38 fatty acids from the waxes of plants and insects. Confi rmations that crop-originated long-chain free fatty acids are traceable in soils were found by Jandl et al. (2005) and for other lipids by Jandl et al. (2006). Based on those fi ndings, the par-ticular higher ion intensity of signals at m/z 256, 284, 289, 312, 326, 340, 368, and 396, which come from n-C16 to n-C27 fatty acids, thus indicate that, more specifi -cally, there is a higher proportion of plant-residue-originated fatty acids in the RT soil. Moreover, long-chain fatty acids appeared to be important agents that helped stabilize macro-aggregates under continuous wheat (Monreal et al., 1995). Jandl et al. (2004) as well suggested new evi-dence for the aggregate-stabilizing function of n-C21:0 to n-C34:0 fatty acids by their characteristic pattern
in size-fractionated, disaggregated and aggregated samples. Based on our measured Py–FIMS data, however, we cannot conclude a direct link between the higher content of iPOM, i.e., aggregate-pro-tected OM, and the larger proportion of free fatty acids under RT.
Table 5. Total ion intensity (TII), percentage of matter volatilized in pyrolysis (VM), and relative contributions of soil organic matter compound classes to the TII as determined by pyrolysis–fi eld ionization mass spectroscopy in free particulate organ-ic matter, intramicroaggregate particulate organic matter, size separates, and the whole soil of the 0- to 10-cm depth layer of the reduced tillage (RT) and conventional tillage (CT) fi elds at Villers-le-Bouillet.
Tillage TII VMRelative contribution to TII of compound class†
CHYDR PHLM LDIM LIPID ALKY NCOMP STERO PEPTI SUBER FATTY Sum
1012 counts kg−1 % ––––––––––––––––––––––––––––––––––––––––––– % –––––––––––––––––––––––––––––––––––––––––––
Free particulate organic matter
CT 11.86 23.8 6.9 11.1 3.2 6.9 10.4 6.6 1.1 3.8 0.1 1.1 51.3
RT 18.12 27.7 7.1 12.3 2.9 7.6 10.2 6.7 1.4 3.7 0.1 1.8 53.8
Intramicroaggregate particulate organic matter
CT 1.21 20.1 11.3 10.7 0.9 5.8 8.0 5.9 0.7 4.4 0.0 3.0 50.7
RT 7.69 10.6 7.7 13.1 3.1 6.2 10.2 7.1 1.0 3.9 0.1 1.1 53.4
>63-µm particle size fraction
CT 0.14 6.0 6.0 8.3 3.8 5.1 8.9 3.1 0.1 1.8 0.0 0.2 37.4
RT 0.38 4.9 4.9 12.4 4.4 7.7 9.9 5.0 0.9 2.1 0.1 2.0 49.4
2–63-µm particle size fraction
CT 0.29 9.4 9.4 16.4 2.1 3.9 12.4 8.0 0.1 4.3 0.0 0.0 56.6
RT 1.22 7.6 7.6 15.5 2.7 4.6 11.8 7.4 0.1 3.4 0.0 0.1 53.3
<2-µm particle size fraction
CT 0.221 8.1 8.1 19.3 0.9 3.0 18.9 6.9 0.0 3.1 0.0 0.0 60.2
RT 0.460 7.8 7.8 17.4 0.9 2.8 15.3 9.7 0.0 2.5 0.0 0.0 56.5
Dispersed whole soil
CT 0.048 8.0 11.7 14.9 1.1 2.2 7.9 10.8 0.0 2.9 0.3 0.0 51.7RT 0.126 11.7 8.0 12.7 2.1 3.8 13.2 8.8 0.1 3.3 0.0 0.1 52.1
† CHYDR, carbohydrates with pentose and hexose subunits; PHLM, phenols and lignin monomers; LDIM, lignin dimers; LIPID, lipids, alkanes, alkenes, bound fatty acids, and alkyl monoesters; ALKY, alkylaromatics; NCOMP, mainly heterocyclic N-containing compounds; STERO, sterols; PEPTI, peptides; SUBER, suberin; FATTY, free fatty acids.
Fig. 3. Thermograms of the total ion intensities (TII) and summed averaged pyrolysis–fi eld ioniza-tion mass spectra of the (a, b) free particulate organic matter (fPOM) and (c, d) intramicro-aggregate particulate organic matter (iPOM) fractions of the 0- to 10-cm depth layer of the reduced tillage (RT) and the conventional tillage (CT) fi elds at Villers-le-Bouillet, Belgium.
1626 SSSAJ: Volume 71: Number 5 • September –October 2007
In contrast, the higher TII percentage of N-containing compounds in the RT fi eld sand fraction was largely due to a higher proportion of N-containing compounds in the iPOM fraction of the RT soil than the CT soil. Mainly, marker peaks at m/z 153, 195, 203, 257, and 271, which originate from n-alkyl nitriles, i.e., mostly pyrolysis products from amines, contributed to this difference.
The TII percentage of the sterols compound class in the sand size fraction was a factor of nine higher in the RT soil than in the CT soil. The TII percentage of sterols in the fPOM and iPOM was also higher in the RT soil than in the CT soil, but this difference was less pronounced. Up to three quarters of the dif-ference in the TII percentage of sterols in the sand fraction could be attributed to signals at m/z 396, 398, 400, 402, 408, 410, and 412, which originate from phytosterols, indicating a plant origin. In addition, prominent signals were found for m/z 372, 386 (cholesterol), and 390. The latter signal has been shown to be enriched in composted manure (Smidt et al., 2004) and was only higher in the fPOM fraction, which might thus point at the presence of farmyard-manure-derived fPOM in the RT surface soil layer. Gregorich et al. (1997) found sterols to be enriched in the LF compared with maize (Zea mays L.) leaf tissue and the whole soil. Our measured data confi rm a connection between the higher proportions of fPOM and iPOM under RT man-agement and an increased proportion of sterols in the RT soil compared with the CT soil.
When considering the distribution of the TII of all 10 compound classes, the composition of the iPOM and fPOM were in closer correspondence in the RT soil than in the CT soil. A conceivable explanation would be that reduction of soil disturbance under RT has led to inclusion of more POM into microaggregates. The chemical composition of this recently formed iPOM evidently more closely matches that of fPOM, i.e., higher contents of lipids, lignin dimers, sterols, and N-containing compounds. With time, transformation of this new iPOM may alter its composition closer to that of the whole-soil
OM, whereas fPOM is continuously replaced by fresh plant-derived OM. As a consequence, the composition of iPOM and fPOM could well deviate again in the RT fi eld.
Silt and Clay Fractions and Whole-Soil Samples
As the relative amount of lignin dimers and lipids decreased, the relative proportions of N-containing compounds and peptides to the TII increased in the silt fraction compared with the sand-sized fraction (Table 5). In correspondence with earlier observations (Leinweber and Schulten, 1995), this refl ects the progres-sive decomposition of OM with decreas-ing particle size. Surprisingly, in spite of the signifi cantly higher SOC content of the silt fraction under RT (Table 3), the composition of the OM in the silt-sized soil fraction was similar between the RT and the CT fi elds. No indications were found for any of the substantial relative enrichments of OM compound classes
that were observed for the RT soil’s sand-sized fraction. These results suggest that the OM composition of the silt-sized fraction is less affected by tillage management.
In accordance with observations throughout the literature (Leinweber and Schulten, 1995), the clay fractions of both RT and CT soils contained larger proportions of N-contain-ing compounds, carbohydrates, phenols, and lignin monomers and fewer lignin dimers and lipids than the sand fraction (Table 5). Much smaller differences in chemical composition were found between the RT and CT soils than for the sand fraction. Calculation of the TII percentage of either the peptide or N-con-taining compound classes is based on the assignment of marker peaks from the Py–FIMS mass spectra. Potential synthesis of peptide-derived molecular ions into heterocyclic N-containing compounds during pyrolysis makes a clear separation between both compound classes tentative. Therefore, both compound classes should instead be considered jointly. There was a lim-ited relative enrichment in N-containing compounds (mainly at m/z 67, 79, 81, 167, 181, 183, and 233) plus peptides in the RT soil. Possibly, the much larger microbial biomass present in the RT soil (Table 1) and a consequently higher continuous input of microbial metabolites has driven this enrichment. This result agrees with observations by Szajdak et al. (2003) of higher humic-acid-bound amino acids in no-till soils.
Next, there was a reduction in the proportion of alkylaro-matics in the TII of the clay fraction of the RT soil (Table 5). Alkylaromatics are considered to be a result of the humifi cation of plant materials and microbial metabolites and form the skeletons of humic substances (Schulten and Schnitzer, 1993). Consequently, a lower proportion of alkylaromatics suggests that the OM in the clay fraction of the RT soil contains relatively higher amounts of less-decomposed components than the clay-sized OM in the CT soil. This lower proportion corresponds with fi ndings by other research-ers (Ding et al., 2002; Szajdak et al., 2003), who found humic acids
Fig. 4. Thermograms of the total ion intensities (TII) and summed averaged pyrolysis–fi eld ionization mass spectra of the (a, b) silt and (c, d) clay fractions of the 0- to 10-cm depth layer of the re-duced tillage (RT) and the conventional tillage (CT) fi elds at Villers-le-Bouillet, Belgium.
SSSAJ: Volume 71: Number 5 • September –October 2007 1627
in no-till soils to be less aromatic than in CT soils, although their analytical methodologies differed from the one used here.
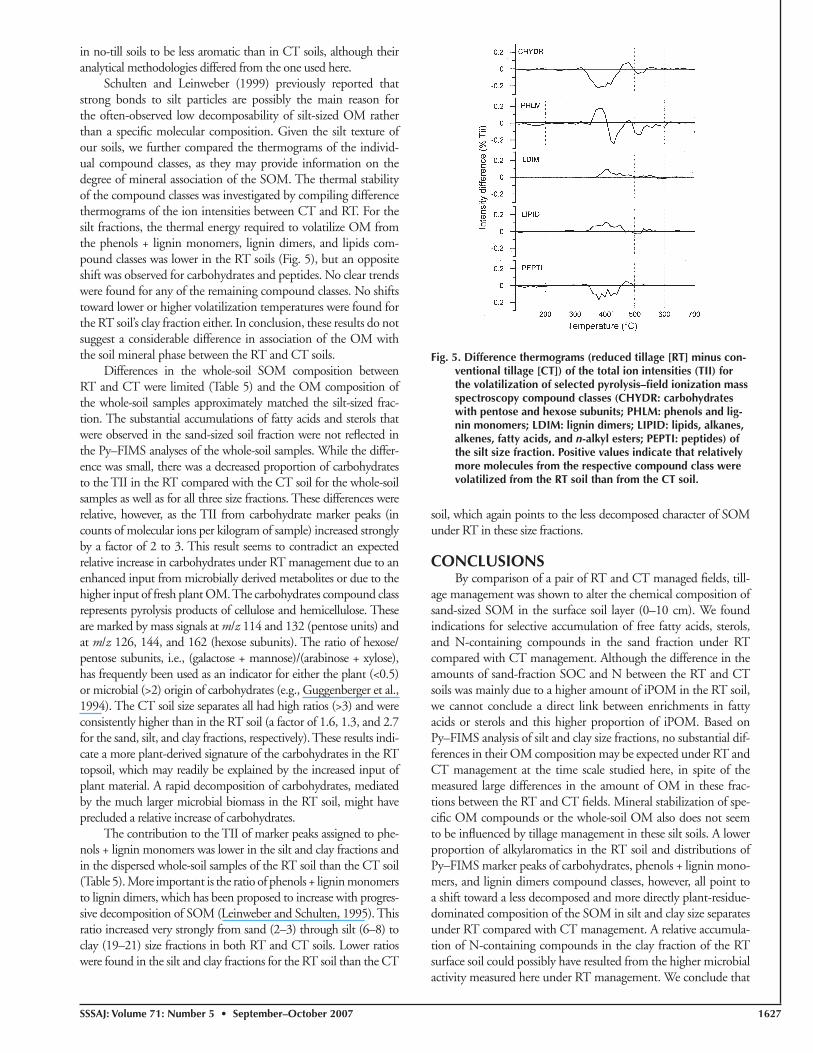
Schulten and Leinweber (1999) previously reported that strong bonds to silt particles are possibly the main reason for the often-observed low decomposability of silt-sized OM rather than a specifi c molecular composition. Given the silt texture of our soils, we further compared the thermograms of the individ-ual compound classes, as they may provide information on the degree of mineral association of the SOM. The thermal stability of the compound classes was investigated by compiling difference thermograms of the ion intensities between CT and RT. For the silt fractions, the thermal energy required to volatilize OM from the phenols + lignin monomers, lignin dimers, and lipids com-pound classes was lower in the RT soils (Fig. 5), but an opposite shift was observed for carbohydrates and peptides. No clear trends were found for any of the remaining compound classes. No shifts toward lower or higher volatilization temperatures were found for the RT soil’s clay fraction either. In conclusion, these results do not suggest a considerable difference in association of the OM with the soil mineral phase between the RT and CT soils.
Differences in the whole-soil SOM composition between RT and CT were limited (Table 5) and the OM composition of the whole-soil samples approximately matched the silt-sized frac-tion. The substantial accumulations of fatty acids and sterols that were observed in the sand-sized soil fraction were not refl ected in the Py–FIMS analyses of the whole-soil samples. While the differ-ence was small, there was a decreased proportion of carbohydrates to the TII in the RT compared with the CT soil for the whole-soil samples as well as for all three size fractions. These differences were relative, however, as the TII from carbohydrate marker peaks (in counts of molecular ions per kilogram of sample) increased strongly by a factor of 2 to 3. This result seems to contradict an expected relative increase in carbohydrates under RT management due to an enhanced input from microbially derived metabolites or due to the higher input of fresh plant OM. The carbohydrates compound class represents pyrolysis products of cellulose and hemicellulose. These are marked by mass signals at m/z 114 and 132 (pentose units) and at m/z 126, 144, and 162 (hexose subunits). The ratio of hexose/pentose subunits, i.e., (galactose + mannose)/(arabinose + xylose), has frequently been used as an indicator for either the plant (<0.5) or microbial (>2) origin of carbohydrates (e.g., Guggenberger et al., 1994). The CT soil size separates all had high ratios (>3) and were consistently higher than in the RT soil (a factor of 1.6, 1.3, and 2.7 for the sand, silt, and clay fractions, respectively). These results indi-cate a more plant-derived signature of the carbohydrates in the RT topsoil, which may readily be explained by the increased input of plant material. A rapid decomposition of carbohydrates, mediated by the much larger microbial biomass in the RT soil, might have precluded a relative increase of carbohydrates.
The contribution to the TII of marker peaks assigned to phe-nols + lignin monomers was lower in the silt and clay fractions and in the dispersed whole-soil samples of the RT soil than the CT soil (Table 5). More important is the ratio of phenols + lignin monomers to lignin dimers, which has been proposed to increase with progres-sive decomposition of SOM (Leinweber and Schulten, 1995). This ratio increased very strongly from sand (2–3) through silt (6–8) to clay (19–21) size fractions in both RT and CT soils. Lower ratios were found in the silt and clay fractions for the RT soil than the CT
soil, which again points to the less decomposed character of SOM under RT in these size fractions.
CONCLUSIONSBy comparison of a pair of RT and CT managed fi elds, till-
age management was shown to alter the chemical composition of sand-sized SOM in the surface soil layer (0–10 cm). We found indications for selective accumulation of free fatty acids, sterols, and N-containing compounds in the sand fraction under RT compared with CT management. Although the difference in the amounts of sand-fraction SOC and N between the RT and CT soils was mainly due to a higher amount of iPOM in the RT soil, we cannot conclude a direct link between enrichments in fatty acids or sterols and this higher proportion of iPOM. Based on Py–FIMS analysis of silt and clay size fractions, no substantial dif-ferences in their OM composition may be expected under RT and CT management at the time scale studied here, in spite of the measured large differences in the amount of OM in these frac-tions between the RT and CT fi elds. Mineral stabilization of spe-cifi c OM compounds or the whole-soil OM also does not seem to be infl uenced by tillage management in these silt soils. A lower proportion of alkylaromatics in the RT soil and distributions of Py–FIMS marker peaks of carbohydrates, phenols + lignin mono-mers, and lignin dimers compound classes, however, all point to a shift toward a less decomposed and more directly plant-residue-dominated composition of the SOM in silt and clay size separates under RT compared with CT management. A relative accumula-tion of N-containing compounds in the clay fraction of the RT surface soil could possibly have resulted from the higher microbial activity measured here under RT management. We conclude that
Fig. 5. Difference thermograms (reduced tillage [RT] minus con-ventional tillage [CT]) of the total ion intensities (TII) for the volatilization of selected pyrolysis–fi eld ionization mass spectroscopy compound classes (CHYDR: carbohydrates with pentose and hexose subunits; PHLM: phenols and lig-nin monomers; LDIM: lignin dimers; LIPID: lipids, alkanes, alkenes, fatty acids, and n-alkyl esters; PEPTI: peptides) of the silt size fraction. Positive values indicate that relatively more molecules from the respective compound class were volatilized from the RT soil than from the CT soil.
1628 SSSAJ: Volume 71: Number 5 • September –October 2007
reduction of tillage has probably driven these observed changes in surface soil OM between the RT and CT fi elds both directly through a reduction of mixing of fresh OM to deeper soil layers and indirectly through enhanced microbial activity under RT.
ACKNOWLEDGMENTSThis research was fi nanced by the Flemish Institute for the Promotion of Innovation by Science and Technology in Flanders (IWT). The Py–FIMS analyses were partly funded by the DFG priority program “Soils as source and sink for CO2—Mechanisms and regulation of organic matter stabilization in soil” (Project LE 903/3).We wish to thank K.U. Eckhardt and R. Beese for their skillful technical assistance with Py–FIMS measurements and S. Thiele-Bruhn for assistance with the physical fractionation. S. Sleutel is working as a post-doctoral researcher for the Flemish Research Foundation (FWO).
REFERENCESAmelung, W. 1997. Zum Klimaeinfl uß auf die organische Substanz nordamerikanischer
Prärieböden. (In German.). Bayreuther Bodenkundliche Berichte 53. Inst. of Soil Sci. and Soil Geogr., Univ. of Bayreuth, Bayreuth, Germany.
Bossuyt, H., J. Six, and P.F. Hendrix. 2002. Aggregate-protected carbon in no-tillage and conventional tillage agroecosystems using carbon-14 labeled plant residue. Soil Sci. Soc. Am. J. 66:1965–1973.
Curci, M., M.D.R. Pizzigallo, C. Crecchio, R. Mininni, and P. Ruggiero. 1997. Effects of conventional tillage on biochemical properties of soils. Biol. Fertil. Soils 25:1–6.
Denef, K., J. Six, R. Merckx, and K. Paustian. 2004. Carbon sequestration in microaggregates of no-tillage soils with different clay mineralogy. Soil Sci. Soc. Am. J. 68:1935–1944.
Dinel, H., C.M. Monreal, and M. Schnitzer. 1998. Extractable lipids and organic matter status in two soil catenas as infl uenced by tillage. Geoderma 86:279–293.
Ding, G., J.M. Novak, D. Amarasiriwardena, P.G. Hunt, and B. Xing. 2002. Soil organic matter characteristics as affected by tillage management. Soil Sci. Soc. Am. J. 66:421–429.
Elliot, E.T. 1986. Aggregate structure and carbon, nitrogen, and phosphorus in native and cultivated soils. Soil Sci. Soc. Am. J. 50:627–633.
Frey, S.D., E.T. Elliott, and K. Paustian. 1999. Bacterial and fungal abundance and biomass in conventional and no-tillage agroecosystems along two climatic gradients. Soil Biol. Biochem. 31:573–585.
Golchin, A., J.M. Oades, J.O. Skjemstad, and P. Clarke. 1994. Study of free and occluded particulate organic matter in soil by solid state 13C CP/MAS NMR spectroscopy and scanning electron microscopy. Aust. J. Soil Res. 32:285–309.
Granatstein, D.M., D.F. Bezdicek, V.L. Cochran, L.F. Elliot, and J. Hammel. 1987. Long-term tillage and rotation effects on soil microbial biomass, carbon and nitrogen. Biol. Fertil. Soils 5:265–270.
Gregorich, E.G., C.M. Monreal, M. Schnitzer, and H.-R. Schulten. 1997. Transformation of plant residues into soil organic matter: Chemical characterization of plant tissue, isolated soil fractions, and whole soils. Soil Sci. 161:680–693.
Guggenberger, G., B.T. Christensen, and W. Zech. 1994. Land-use effects on the composition of organic matter in particle-size separates of soil: I. Lignin and carbohydrate signature. Eur. J. Soil Sci. 45:449–458.
Höfl ich, G., M. Tauschke, G. Kuhn, K. Werner, M. Frielinghaus, and W. Hohn. 1999. Infl uence of long-term conservation tillage on soil and rhizosphere microorganisms. Biol. Fertil. Soils 29:81–86.
Jandl, G., P. Leinweber, and H.-R. Schulten. 2006. Origin and fate of soil lipids in a Phaeozem under rye and maize monoculture in central Germany. Biol. Fertil. Soils 43:321–332.
Jandl, G., P. Leinweber, H.-R. Schulten, and K. Ekschmitt. 2005. Contribution of primary organic matter to the fatty acid pool in agricultural soils. Soil Biol. Biochem. 37:1033–1041.
Jandl, G., P. Leinweber, H.-R. Schulten, and K. Eusterhues. 2004. The concentrations of fatty acids in organo-mineral particle-size fractions of a Chernozem. Eur. J. Soil Sci. 55:459–469.
Kandeler, E., D. Tscherko, and H. Spiegel. 1999. Long-term monitoring of microbial biomass, N mineralisation and enzyme activities of a Chernozem under
different tillage management. Biol. Fertil. Soils 28:343–351.Kölbl, A., and I. Kögel-Knabner. 2004. Content and composition of free
and occluded particulate organic matter in a differently textured arable Cambisol as revealed by solid-state 13C NMR spectroscopy. J. Plant Nutr. Soil Sci. 167:45–53.
Leinweber, P., and H.-R. Schulten. 1995. Composition, stability and turnover of soil organic matter: Investigations by off-line pyrolysis and direct pyrolysis–mass spectrometry. J. Anal. Pyrol. 32:91–110.
Mikha, M.M., and C.W. Rice. 2004. Tillage and manure effects on soil and aggregate-associated carbon and nitrogen. Soil Sci. Soc. Am. J. 68:809–816.
Monreal, C.M., M. Schnitzer, H.-R. Schulten, C.A. Campbell, and D.A. Anderson. 1995. Soil organic structures in macro and microaggregates of a cultivated Brown Chernozem. Soil Biol. Biochem. 27:845–853.
Oades, J.M. 1984. Soil organic matter and structural stability: Mechanisms and implications for management. Plant Soil 76:319–337.
Schnitzer, M. 1986. Binding of humic substances by soil mineral colloids. p. 77–101. In P.M. Huang and M. Schnitzer (ed.) Interactions of soil minerals with natural organics and microbes. SSSA Spec. Publ. 17. SSSA, Madison, WI.
Schulten, H.-R. 1993. Analytical pyrolysis of humic substances and soils. Geochemical, agricultural and ecological consequences. J. Anal. Appl. Pyrolysis 25:97–122.
Schulten, H.-R., R. Hempfl ing, K. Haider, F.F. Gröblinghoff, H.-D. Lüdemann, and R. Fründ. 1990. Characterization of cultivation effects on soil organic matter. J. Plant Nutr. Soil Sci. 153:97–105.
Schulten, H.-R., and P. Leinweber. 1999. Thermal stability and composition of mineral-bound organic matter in density fractions of soil. Eur. J. Soil Sci. 50:237–248.
Schulten, H.-R., and P. Leinweber. 2000. New insights into organic–mineral particles: Composition, properties and models of molecular structure. Biol. Fertil. Soils 30:399–432.
Schulten, H.-R., P. Leinweber, and C. Sorge. 1993. Composition of organic matter in particle-size fractions of an agricultural soil. J. Soil Sci. 44:677–691.
Schulten, H.-R., and M. Schnitzer. 1993. A state of the art structural concept for humic substances. Naturwissenschaften 80:9–30.
Six, J., R.T. Conant, E.A. Paul, and K. Paustian. 2002. Stabilization mechanisms of soil organic matter: Implications for C-saturation of soils. Plant Soil 241:155–176.
Six, J., E.T. Elliott, and K. Paustian. 1999. Aggregate and soil organic matter dynamics under conventional and no-tillage systems. Soil Sci. Soc. Am. J. 63:1350–1358.
Six, J., E.T. Elliott, and K. Paustian. 2000. Soil macroaggregate turnover and microaggregate formation: A mechanism for C sequestration under no-tillage agriculture. Soil Biol. Biochem. 32:2099–2103.
Six, J., M.O. Ogle, F.J. Breidt, R.T. Conant, A.R. Mosier, and K. Paustian. 2004. The potential to mitigate global warming with no-tillage management is only realized when practiced in the long term. Global Change Biol. 10:155–160.
Sleutel, S., S. De Neve, B. Singier, and G. Hofman. 2006. Organic C levels in intensively managed arable soils: Long-term regional trends and characterization of fractions. Soil Use Manage. 22:188–196.
Smidt, E., K.-U. Eckhardt, P. Lechner, H.-R. Schulten, and P. Leinweber. 2004. Characterization of different decomposition stages of biowaste using FT-IR spectroscopy and pyrolysis–fi eld ionization mass spectrometry. Biodegradation 16:67–79.
Sorge, C., R. Müller, P. Leinweber, and H.-R. Schulten. 1993. Pyrolysis–mass spectroscopy of whole soils, soil particle size fractions, litter materials and humic substances: Statistical evaluation of sample weight, residue, volatilized matter and total ion intensity. Fresenius J. Anal. Chem. 346:697–703.
Szajdak, L., A. Jezierski, and M.L. Cabrera. 2003. Impact of conventional and no-tillage management on soil amino acids, stable and transient radicals and properties of humic and fulvic acids. Org. Geochem. 34:693–700.
Thiele-Bruhn, S., T. Seibicke, H.-R. Schulten, and P. Leinweber. 2004. Sorption of sulfonamide pharmaceutical antibiotics on whole soils and particle-size fractions. J. Environ. Qual. 33:1331–1342.
Tiessen, H., and J.W.B. Stewart. 1983. Particle size fractions and their use in studies of soil organic matter: II. Cultivation effects on organic matter composition in size fractions. Soil Sci. Soc. Am. J. 47:509–514.
Voroney, R.P., J.P. Winter, and R.P. Beyaert. 1993. Soil microbial biomass C and N. p. 277–286. In M.R. Carter (ed.) Soil sampling and methods of analysis. Lewis Publ., Boca Raton, FL.


