Embed Size (px)
Citation preview

Tornado and Severe Thunderstorm Warning Forecast Skill and its Relationship to Storm
Type
Eric M. Guillot National Weather Center Research for Undergraduates, University of Oklahoma, Norman, Oklahoma and
Lyndon State College, Lyndonville, Vermont
Travis M. Smith, Valliappa Lakshmanan, Kimberly L. Elmore, and Donald W. Burgess Cooperative Institute of Mesoscale Meteorological Studies, University of Oklahoma, and NOAA/National
Severe Storms Laboratory, Norman, Oklahoma
Gregory J. Stumpf Cooperative Institute of Mesoscale Meteorological Studies, University of Oklahoma, Norman, Oklahoma, and Meteorological Development Laboratory, National Weather Service, Silver Spring, Maryland
ABSTRACT
The amount of forecast skill involved when issuing tornado and severe thunderstorm warnings is closely related to the type of storm that causes the severe weather. Storms from eight tornado outbreaks are classified and correlated with tornado warnings and severe thunderstorm warnings. These warnings were verified, missed, or shown to be false alarms by relating them with storm reports that match temporally and spatially with those in the Storm Prediction Center’s database. Certain forecast parameters, including the critical success index (CSI), probability of detection (POD), false alarm ratio (FAR), and warning lead time are calculated for each storm type and for each type of warning. Because it was not practical to manually classify these storms (~50,000 entities), a decision tree was trained on a subset of manually classified storms using Quinlan’s C4.5 algorithm. The decision tree was then used to automatically classify storms as being of one of four types: supercellular, linear, pulse or unorganized. It was found that both tornado warnings and severe thunderstorm warnings issued for isolated supercells and convective line storms have higher CSI, higher POD, and lower FAR scores than those issued for pulse and non-organized storms. Lead times were consistently longer for supercell and line storms, while usually very short for pulse and non-organized storms. We conclude that measures of forecast skill are particularly sensitive to the type of storm. Thus, any measurement of forecast skill, such as the year-over-year skill measure of an individual forecast office, has to take into account the types of storms in that office’s warning area in the time period considered.
_______________________________ 1. MOTIVATION Verifying that a tornado which was warned for did in fact occur assures a forecaster that he/she made the right decision in a dangerous situation. Conversely, issuing a tornado warning when conditions seem imminent, and having no tornado touch down can baffle a forecaster many times during his/her career. Studies have shown that tornado warnings have improved since the introduction of the WSR-88D (Simmons and Sutter 2005). Even so, there is still much room for improvement. This raises the question if other factors aside from our technological limitations are responsible for the quality of our tornado warnings.
We hypothesize that the type of the storm that spawns these tornadoes makes it easier or more difficult to warn for them. Surely, the presence of forecast parameters such as vertical wind shear, instability, and lift are key players in tornado and severe thunderstorm development. However, do certain parameters carry more weight than others, and if so, do their individual values vary in magnitude depending on the type of storm in question? In this paper, we will define and analyze certain types of storms and their parameters, establish a methodology to automatically classify storms, and examine if certain types of storms spawn tornadoes or

become severe that are either easier or more difficult for which to warn. 2. PARAMETERS a. Storm-Type Classification In order to pair a tornado or severe thunderstorm warning to a specific storm type, a storm classification system must be defined. For the sake of simplicity, four different storm types were identified. The first is “isolated supercell”, defined as a thunderstorm with a rotating updraft. (Browning 1977) (Doswell and Burgess 1993). Secondly, we examined a “convective line” of storms, defined by Doswell (2001) as two or more cells that are close enough together to produce one single outflow boundary. It should be noted that the presence of said outflow boundary in the radar reflectivity field is not the primary trait for identification of convective lines – instead we looked for cells that were close together. Third, we examined “pulse storms”, defined for our purposes as any thunderstorm that is strong or severe but does not possess a mesocyclone and rotating updraft. Such a storm could expect to produce a landspout tornado (Lee 1997). Lastly, any storm that does not meet the previous criteria was classified as a “non-organized storm”. Originally, the storm-type “convective line” was to be further delineated into “embedded supercells” and “squall line,” however this distinction was abandoned for the sake of simplicity. Since it would have been too time-consuming to manually classify all of the storms in all of the radar images for all of the cases, we sought to automatically classify the cases. In order to do so, a decision tree (Quinlan 1996) was trained against the manual classification of all the storms (about 1000 total) in 31 different radar images from three different days. It is important to note that the purpose of this project was not to establish a more detailed SCIT-type algorithm for automated storm type identification (Johnson et al. 1998). Rather, it was necessary to analyze larger data sets in a more practical and less time consuming manner instead of identifying each and every storm through hand analysis. b. Identification Variables In order to properly classify these storms manually in our training cases, certain fields/variables were used for identification purposes. The most obvious variable is radar
reflectivity, as seen in our study in the reflectivity as the lowest altitude (0.5 degree beam tilt). However, the radar reflectivity alone is not enough to draw conclusions necessary for our storm type classification system. Thus, we incorporate many experimental WSR-88D and multi-sensor algorithms. Perhaps most important is the 0 – 3 kilometer merged azimuthal shear, a three-dimensional wind parameter calculated by using a linear, least squares mathematical process blended together from multiple radars (Smith and Elmore, 2004). Such a parameter allows us to easily pick out low-altitude rotation and thus determine if the storm has rotation associated with it. Almost as important for manually classifying these storms is the thirty minute rotation track, allowing us to easily classify storms that have a history of rotation. Two hail parameters, POSH (Probability of Severe Hail) and MESH (Maximum Expected Size of Hail) also proved invaluable in identifying storm types manually (Witt et al. 1998). High values of POSH and MESH almost always coincide with high values of merged azimuthal shear and thirty minute rotation track values, further supporting distinctions between isolated supercells and single-cell pulse storms. It is intuitive that the largest hail exists in the strongest updraft, and a supercell thunderstorm possesses the strongest updraft of any thunderstorm. Lastly, the VIL (Vertically Integrated Liquid) also plays a key role in storm cell identification (Green and Clark 1972). Large values of VIL imply large hail and/or very heavy rain, both distinctive qualities of most supercell thunderstorms.
3. METHODOLOGY a. Polygon Identification and Computer Training Three cases of tornado outbreaks were chosen to be manually classified for this project: 28 March 2007, 5 May 2007, and 23 May 2007. All of the collected data was gathered from the CONUS WDSS-II system – a multi-radar, multi-sensor severe weather applications package (Lakshmanan et al. 2007). Utilizing the variables listed in the previous section in the radar data, polygons were manually drawn around individual storm cells. Each polygon corresponded to a specific type of storm, thus completing the classification of each storm in range of the radar (FIGURE 1 TOP A). For each training data set, this was done every one to two hours of the available radar data. Once the manual

FIGURE 1. Illustration of the manual classification of storms and the different parameters used to classify them. Storms over central Kansas at 5:02:01 UTC on 6 May 2007: Top A: Reflectivity at lowest altitude and hand-drawn polygon of storms, Top B: Grid hand analysis of storms, Top C: Max MESH over 30 minute interval, Middle A: Merged 0-3 km Azimuthal Shear, Middle B: Merged Reflectivity Composite, Middle C: MESH, Bottom A: POSH, Bottom B: 30 min rotation track, Bottom C: VIL
classification was completed, the unmodified original radar images were processed with a “k-means” clustering program (Lakshmanan et al. 2003) in order to identify storms at different resolutions (FIGURE 2). Various statistical properties such as the minimum, average and maximum values of other gridded fields (POSH, MESH, azimuthal shear, etc.) were computed within each cluster. These clusters were then overlaid with the drawn polygons to see which level of the k-means cluster identification performed the best in identifying storm clusters. Cluster attributes at the desired scale (160 and
480 square kilometers for our study) were then used to classify the storms automatically (FIGURE 3 TOP A) using a decision tree. We used Quinlan’s C4.5 algorithm for creating decision trees, which examines the cluster attributes of our data one-by-one and picks the cluster attribute and threshold at which the information gain is maximized (Kullback and Leibler 1951). Intuitively, this step can be thought of as finding the attribute that will separate the training dataset into two parts, such that the two parts are as difference from one another as possible. The training set is then divided into two

FIGURE 2. The different scales of K-means as they correspond to the radar reflectivity. Storms in Texas panhandle at 5:58:00
UTC on 6 May 2007: A: Reflectivity at Lowest Altitude, B: K-means scale 0 (20 square kilometer resolution), C: K-means scale 1 (160 square kilometer resolution), D: K-means scale 2 (480 square kilometer resolution)
parts based on this attribute and threshold and the C4.5 algorithm is applied recursively to each part. The algorithm stops when all the samples at any leaf of the tree correspond to the same storm type. In our study, we kept behind a randomly chosen 10% of the training samples as a validation set. The decision tree extracted from 90% of the training set was pruned (branches cut off) based on this validation set (i.e. any branch of the decision tree that gave the wrong result for the storm type was pruned to prevent overfitting of the decision tree to the training data). Each node of the pruned decision tree provides the storm type corresponding to the majority of the samples from which the node was trained. Although the storms
classified by the decision tree would not always be labeled correctly (the decision tree did not have a 100% success rate when classifying these storms), one must keep in mind that on any single radar image, usually containing in upwards of fifty storms, very few of these actually spawned a tornado or became severe at any particular time. The decision tree that was automatically extracted was then analyzed to ensure that the embedded logic was reasonable. The decision tree logic was as follows (FIGURE 4): If the mean reflectivity within the cluster is less than a certain value, the decision tree returns a non-organized storm. If the mean reflectivity is above this value, the decision tree moves on to the direction

FIGURE 3. Storms classified by the decision tree and the variables used to classify them. Storms in Texas panhandle at 5:58:00 UTC on 6 May 2007: TOP A: Reflectivity at lowest altitude and unbiased automated storm-type classification at storm centroid by decision tree (“L” stands for convective line, “S” stands for supercell thunderstorm), TOP B: Reflectivity at lowest altitude and hand analysis of storms, TOP C: Max MESH over 30 minute interval, MIDDLE A: Merged 0-3 km Azimuthal Shear, MIDDLE B: Merged Reflectivity Composite, MIDDLE C: MESH, BOTTOM A: POSH, BOTTOM B: 30 min rotation track, BOTTOM C: VIL
(movement of storm), low level shear and VIL parameters. If the low level shear is below a certain value and the maximum VIL is also below a certain value, the decision tree yields a non-organized storm. If the maximum VIL is above this value however, the decision tree yields a pulse storm. This process continues through all of the available variables until every identified storm is classified. It is important to note that one of the most influential parameters in the decision tree when identifying a convective line of storms is the aspect ratio. In addition, although some of these traits are not accurate for all storms (i.e. dBZ can
be quite low in a low-precipitation supercell) the decision tree was built such that the traits are correct in the gross statistical sense. b. Warning Verification With the decision tree trained, those same cases were run through it a second time, along with cases from 21 April 2007, 10 May 2006 and 14 May 2006. The classified storm data was then overlaid with the tornado warning polygons issued by the respective National Weather Service Forecast Offices for that particular area, in addition

MaxRef < 4.4?
Non-Organized Storm LowLvlShear < 0.85?
Non-Organized Storm Direction < 74?
LowLvlShear < 3.8?
MaxVIL < 36?
Pulse StormNon-Organized Storm
30 Min Rot Track < 0.007?
LowLvlShear < 1.9?
Pulse Storm
> 4.4
> 3.8
< 1.9
< 0.007< 74
< 0.85 > 0.85
> 74
Pulse Storm< 3.8
< 36 > 36
< 4.4
MaxRef < 4.4?
Non-Organized Storm LowLvlShear < 0.85?
Non-Organized Storm Direction < 74?
LowLvlShear < 3.8?
MaxVIL < 36?
Pulse StormNon-Organized Storm
30 Min Rot Track < 0.007?
LowLvlShear < 1.9?
Pulse Storm
> 4.4
> 3.8
< 1.9
< 0.007< 74
< 0.85 > 0.85
> 74
Pulse Storm< 3.8
< 36 > 36
< 4.4
FIGURE 4. Visual representation of low precipitation part of the decision tree used to automatically classify storms to the local storm reports taken from the Storm Prediction Center’s database. This database is a collection of all the storm reports gathered by the local National Weather Service Forecast Offices. Although this data is considered preliminary and needed to be slightly quality-controlled at times, we believe that the data are sufficient for what we are trying to accomplish. Note that a tornado was considered warned if its touchdown coincided both temporally and spatially with a warning polygon. Conversely, if a tornado touched down and no warning was issued, the tornado was considered “missed.” Furthermore, if a warning was issued and no tornado occurred, the warning was considered a “false alarm.” The same method was used for severe thunderstorm warnings, using a hail report, a high wind report, a tornado report,
or a combination of these three to confirm the occurrence of a severe thunderstorm. The forecast skill of a set of warnings is measured in terms of the Critical Skill Index (CSI), Probability of Detection (POD) and False Alarm Ratio (FAR). The CSI is equal to: hits_________
hits + misses + false alarms The POD is equal to: hits____
hits + misses
The FAR is equal to: false alarms______ hits + false alarms

The automated classification creates multi-category results. The skill of the classifier can be measured in terms of category-by-category accuracy. The overall skill can be measured using the True Skill Statistic (TSS) (Woodcock 1976). The TSS is equal to: hits____ - false alarms__________ hits + misses false alarms + correct negatives 4. RESULTS a. Decision Tree
A multi-category classification decision tree was generated from the manually classified images to automatically classify storms in a much bigger data set. The training set consisted of 28 snapshots (1,356 storms) chosen from 28 March 2007, 5 May 2007 and 23 May 2007. The three days worth of data to train this program resulted in hundreds of storms that were classified manually. The decision tree was able to capture the data set (TABLE 1). Isolated supercells were identified correctly about 73% of the time, while convective lines were identified correctly 80% of the time and pulse storms 72%. The overall True Skill Statistic of the decision tree for the training set was 0.71. FIGURE 3 TOP A illustrates the automated classification of storms from the decision tree. Note that “L” stands for convective line, while “S” stands for supercell thunderstorm. We than tested this decision tree on an independent testing set consisting of 22 snapshots (1,069 storms) chosen from 21 April 2007, 10 May 2006 and 14 May 2006. The decision tree had an overall True Skill Statistic of 0.58 (TABLE 2). It should be noted that the decision tree is unbiased on all four categories. For example, supercells are correctly identified 63% of the time while 61% of all storms that are identified as supercells are truly supercells. For our final statistical output, we added two more cases to our study: 2 January 2006 and 13 January 2006. This brought our final tornado count to 263. B. Tornado Warning Forecast Skill Parameters From the gathered data, we can compute certain tornado warning diagnostic parameters, such as Critical Success Index (CSI), Probability of Detection (POD) and False Alarm Ratio (FAR)
(Donaldson et al. 1975). These three parameters are computed by using the data for hits, misses, and false alarms for each individual storm type, yielding insightful information regarding tornado warning skill and tornado warning shortcomings with respect to the type of storm that spawns them. It is important to note that our sample size consisted of 45 different forecast offices geographically located from the Plaines to the Mid-West to the Southeastern United States. FIGURE 5 summarizes our results regarding these forecast parameters. Overall, tornadoes spawned by isolated supercells received the best forecast skill ratings, with an over 45% critical success index and a less than 50% false alarm ratio. However, the data clearly shows that as tornadic storm type became less obvious (an isolated supercell is more likely to spawn a tornado than a pulse storm), forecast skill became progressively worse. Although convective line-induced tornadoes had a probability of detection slightly higher than that of isolated supercells (82%) they also had a significantly lower CSI (~ 36%) and higher FAR (~ 61%). This trend continued with pulse storms, sporting a lower CSI (~ 20%), lower POD (~48%) and higher FAR (~ 74%). Non-organized storm tornadoes sported the worst CSI (~ 19%) and highest FAR (~ 77%), while possessing a slightly higher POD than pulse storms (~ 54%). Confidence intervals for these forecast parameters were calculated using the statistical method of bootstrap tilting (Hjorth 1994). It was found that for isolated supercells, one can say with 95% confidence that CSI will be at least 50.2%, POD will be at least 86.3% and FAR will be at least 54.9%. For convective line storms, one can say with 95% confidence that CSI will be at least 45.1%, POD will be at least 90.4% and FAR will be at least 69.6%. For pulse storms, one can say with 95% confidence that CSI will be at least 27.8%, POD will be at least 59.9% and FAR will be at least 81.2%. Non-organized storms at the 95% confidence level will have a CSI at least 33.7%, a POD at least 74.7% and an FAR at least 87.7%. Thus, the average values appear to be supported by this bootstrapping technique. Further statistics can be done through permutation tests (Hjorth 1994) to see if the difference between forecast parameters is statistically significant. We can say with 95% confidence that forecasters do better (on the order of 25% difference in CSI) when predicting tornadoes that come out of convective lines or supercells than they do on tornadoes in pulse storms or "non-organized" storms. In addition,

Classified Non-
Organized Classified Supercell
Classified Line
Classified Pulse Accuracy
Observed Non-Organized: 464 2 2 58 88.20% Observed Isolated Supercell: 5 167 16 34 75.20%
Observed Convective Line: 8 47 122 31 58.70% Observed Pulse Storm: 50 13 15 322 80.50%
Accuracy: 88.00% 72.90% 78.70% 72.40% TABLE 1. Performance of decision tree based on training data set.
Classified Non-
Organized Classified Supercell
Classified Line
Classified Pulse Accuracy
Observed Non-Organized: 498 0 3 68 87.50% Observed Isolated Supercell: 2 82 14 33 62.60%
Observed Convective Line: 4 28 41 22 43.20% Observed Pulse Storm: 57 24 25 168 61.30%
Accuracy: 88.80% 61.20% 49.40% 57.70% TABLE 2. Performance of decision tree based on testing data set.
Tornado Warning Forecast Skill by Storm Type
0.0010.00
20.0030.0040.00
50.0060.0070.00
80.0090.00
CSI POD FAR
Valu
e (%
)
Supercell Line Pulse Non-Organized
FIGURE 5. Critical success index, probability of detection, and false alarm ratio for tornado warnings broken down by type of storm

forecasters seem to have better performance (on the order of a 9% difference in CSI) on isolated supercells than on line storms, but that difference is not statistically significant at the 95% confidence level. The average lead times for tornadoes also illustrate a significant difference between storm types. There are two ways to calculate lead times: the method utilized by the National Weather Service (missed tornado warnings equal zero lead time) and calculating lead time based on verified warnings only (FIGURE 6). The National Weather Service (NWS) method for tornadic isolated supercell average lead time was slightly less than 17 minutes. However, if we consider only the hits (that is, the confirmed tornado warnings) then lead time goes up to almost 20.5 minutes. For all convective line storms, average NWS method lead time dropped to just over 15 minutes, but for the confirmed warnings it was still a respectable 18.6 minutes. All pulse storms calculated by the NWS method had average lead times of just over 7.5 minutes, while the warned pulse storms had
average lead times of 16 minutes. Non-organized storms performed the worst of the four storm types, yielding an average NWS method lead time for all of the storms of just over 6 minutes. The non-organized storms that were warned sported a lead time of less than 12 minutes. To verify if this data set is large enough to represent all tornado warnings, the NWS and hits only method of calculating lead times was computed for all storms in the set and compared to the average of all tornado warning lead times since the introduction of the WSR-88D network (early 1990s). For the NWS method, we calculate an average lead time of 14.43 minutes, while the average value since the early 1990s is 13 minutes (Erickson 2007). We calculate an average lead time of 19.37 minutes using the hits only method, while the average value since the early 1990s is 18.5 minutes (Erickson 2007). These values are both quite close; therefore we conclude this data is representative enough to make conclusions for all tornado warnings.
Tornado Warning Lead Time by Storm Type
0.00
5.00
10.00
15.00
20.00
25.00
NWS Method Hits Only Method
Lead
Tim
e (m
in)
Supercell Line Pulse Non-Organized
FIGURE 6. National Weather Service method of calculating lead times (0 sec lead time on missed warnings) vs. calculating lead times based upon the warned storms only, broken down by storm type for tornado warnings
Severe Thunderstorm Warning Forecast Skill by Storm Type
0.0010.0020.0030.0040.0050.0060.0070.0080.0090.00
CSI POD FAR
Valu
e (%
)
Supercell Line Pulse Non-Organized
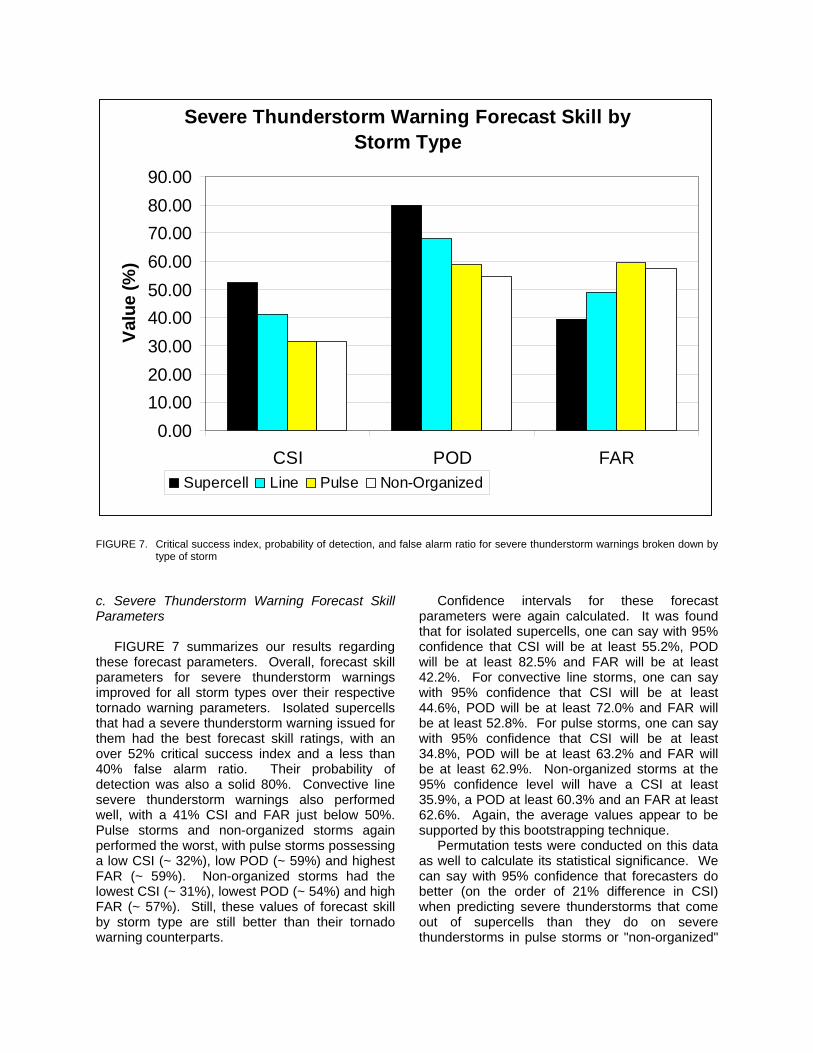
FIGURE 7. Critical success index, probability of detection, and false alarm ratio for severe thunderstorm warnings broken down by type of storm
c. Severe Thunderstorm Warning Forecast Skill Parameters FIGURE 7 summarizes our results regarding these forecast parameters. Overall, forecast skill parameters for severe thunderstorm warnings improved for all storm types over their respective tornado warning parameters. Isolated supercells that had a severe thunderstorm warning issued for them had the best forecast skill ratings, with an over 52% critical success index and a less than 40% false alarm ratio. Their probability of detection was also a solid 80%. Convective line severe thunderstorm warnings also performed well, with a 41% CSI and FAR just below 50%. Pulse storms and non-organized storms again performed the worst, with pulse storms possessing a low CSI (~ 32%), low POD (~ 59%) and highest FAR (~ 59%). Non-organized storms had the lowest CSI (~ 31%), lowest POD (~ 54%) and high FAR (~ 57%). Still, these values of forecast skill by storm type are still better than their tornado warning counterparts.
Confidence intervals for these forecast parameters were again calculated. It was found that for isolated supercells, one can say with 95% confidence that CSI will be at least 55.2%, POD will be at least 82.5% and FAR will be at least 42.2%. For convective line storms, one can say with 95% confidence that CSI will be at least 44.6%, POD will be at least 72.0% and FAR will be at least 52.8%. For pulse storms, one can say with 95% confidence that CSI will be at least 34.8%, POD will be at least 63.2% and FAR will be at least 62.9%. Non-organized storms at the 95% confidence level will have a CSI at least 35.9%, a POD at least 60.3% and an FAR at least 62.6%. Again, the average values appear to be supported by this bootstrapping technique. Permutation tests were conducted on this data as well to calculate its statistical significance. We can say with 95% confidence that forecasters do better (on the order of 21% difference in CSI) when predicting severe thunderstorms that come out of supercells than they do on severe thunderstorms in pulse storms or "non-organized"

Severe Thunderstorm Warning Lead Time by Storm Type
0.00
5.00
10.00
15.00
20.00
25.00
NWS Method Hits Only Method
Lead
Tim
e (M
in)
Supercell Line Pulse Non-Organized
FIGURE 8. National Weather Service method of calculating lead times (0 second lead time on missed warnings) vs. calculating lead times based upon the warned storms only, broken down by storm type for severe thunderstorm warnings
storms. They also do better (on the order of 10% CSI) when predicting severe thunderstorms that come out of convective line storms than they do on pulse or “non-organized” storms. In addition, we can say with 95% confidence that forecasters do better (on the order of 11% CSI) when issuing severe thunderstorm warnings that come out of supercells than they do on severe thunderstorm warnings in convective line storms. This could not be said of the tornado warning data (due to the much smaller data set). The difference in CSI between pulse and “non-organized” storms is not significant at the 95% confidence level. The average lead time for severe thunderstorm warnings is also insightful (FIGURE 8). Once again, we calculated lead time by both the NWS method and the “hits only” (verified warnings only) method. For isolated supercells, the average lead time for a severe thunderstorm by the NWS method is 17.47 minutes, while it rises to over 21.84 minutes with the hits only method. Convective line average lead times are also quite good, at 14.91 minutes NWS and 21.91 minutes
“hits only.” Lead time dropped off for pulse storms and non-organized storms, but not as severely as in tornado warnings. That is, pulse storms had an NWS method average lead time of 11.24 minutes and a verified warning lead time of 19.09 minutes. Non-organized storms once again had the lowest NWS method average lead time (10.47 minutes), but surprisingly had a slightly higher verified warnings lead time than pulse storms (19.24 minutes). The average size of the severe thunderstorm warning polygons by storm type is also insightful. Isolated supercells had an average warning size of about 1,250 square kilometers, while convective line storm warnings were larger at about 1,525 square km. Both pulse storm warnings and non-organized storm warnings were smaller than isolated supercell and convective line warnings in our data set, both at about 1,100 square kilometers.

5. Conclusions
a. Data Interpretation
Several conclusions can be drawn from the analysis of our data. It is significant that tornadic isolated supercell thunderstorms and convective line storms sport higher CSI, higher POD, and lower FAR than pulse storms and non-organized storms. This makes sense however, since pulse storms and non-organized storms do not have rotating updrafts (as do isolated supercells or embedded supercells in a line of storms), thus they are usually not expected to spawn a tornado. In fact, many National Weather Service forecast offices are unaware of a pulse or non-organized storm spawning a tornado until after a trained spotter has reported a tornado on the ground. Thus, the tornado warning can be much delayed and negatively affect the WFO’s respective CSI, POD, and FAR scores. Comparison of the tornado warning lead times by storm type also yields insightful results. Isolated supercells and convective line storms, regardless of the method used to calculate tornado warning lead times, have the highest lead times of any storm type (at least 15 minutes). This makes sense considering that forecasters do better recognizing tornadic traits in both isolated supercells and convective line storms Conversely, pulse storms and non-organized storms have the lowest lead times (below 7.5 minutes), which also makes sense considering forecasters have the most difficult time predicting tornadoes in storms with no rotating updraft. This difference is significant because individual forecast offices could potentially report very high CSI, POD, and low FAR scores for a certain tornado season, when in fact they only received isolated supercells and convective line storms for the entire period. These storms are statistically easier to issue warnings for, thus these forecast score values would not be a good representation of the skill exhibited by this particular forecast office. On the other hand, a particular forecast office could report very low CSI, POD, and high FAR scores for a certain tornado season, when in fact they only received pulse storms and non-organized storms for the entire period. These storms are statistically very difficult to issue warnings for, thus these forecast score values would also not be a good representation of the skill exhibited by this particular forecast office. The severe thunderstorm warning forecast skill calculations yield quite similar results to the tornado warning skill calculations. That is, that
isolated supercell and convective line severe thunderstorms sport higher CSI, higher POD, and lower FAR scores than severe pulse storms or non-organized storms, thus making them statistically easier to issue warnings for. This too makes sense, since an isolated supercell or convective line is usually much more intense than a pulse or non-organized storm, thus forecasters may pay more attention to it and issue a severe thunderstorm warning for it more easily. The permutation tests confirm (due to a much larger data set) the significance of the difference in CSI scores (11%) between isolated supercell severe thunderstorms and convective line severe thunderstorms, which is interesting since this difference was only suggestive for the tornado warning skill scores. Forecasters thus statistically have the easiest time issuing severe thunderstorm warnings for isolated supercells. b. Limitations Although this study has yielded much insight into the ability of forecasters to issue timely tornado warnings based on the type of storm that spawned them, it is possible, but not likely, that certain limitations may have affected our results. Our sample size included only 263 tornado reports, with a total of 532 issued tornado warnings; in addition, although the sample size for isolated supercells was reasonable (299 storms), the number of other storm types may have been too low to draw absolute conclusions (89 convective line storms, 108 pulse storms, and 36 non-organized storms). However, the statistical tests (bootstrapping and permutation tests) indicate that our conclusions are statistically significant (at the 95% level) except for those differences in skill apparent between supercells and convective lines. We do not suspect the same problem exists with our severe thunderstorm data due to our much larger sample size (1,531 storms, with 2,530 warnings issued). All of our data cases were selected from tornado outbreaks, which may explain why our calculated tornado warning lead times are slightly higher than the national average (during an outbreak, a forecaster may have an easier time issuing a warning since tornadoes have already been reported). Also, although the decision tree did a decent job classifying storms, it is indeed possible that some storms were misclassified, thus slightly modifying our results. Even so, since the decision tree was not biased towards any particular storm type (See FIGURE

4), we believe that any misclassifications should not introduce any systematic bias into our results. c. Future Work The creation of an automatic classification algorithm of storms and the relationship between severe weather warnings and storm type provides a plethora of options to pursue future work. The most obvious of these is improvement of the storm-typing algorithm to incorporate more categories of storms. Storm types such as tropical supercells and mini-supercells are particularly difficult to warn for, especially in the Southeast United States. Such an improvement to the algorithm could probably reduce the false-alarm rate in that part of the country. Range from the radar site should also be considered, since many storms far away from individual WRS-88D radars can be under the beam and not be properly detected. Tornado warning lead time by storm type can also be calculated by eliminating subsequent warnings. Since warnings following the very first one tend to have lower lead times, it may be insightful to calculate lead times based on the first warning issued for a particular storm only. Population density should also be considered. There are many tornadoes that never get reported because of a lack of people in the area calling in reports to their local WFOs. More reports can significantly improve the CSI, POD, and FAR scores of an individual forecast office. Although the goal of this project was not to create storm type classification algorithm, it was certainly a useful result yielded from our methodology. This algorithm can be used to assist in issuing severe weather warnings as an additional forecast tool. Acknowledgements. The authors would like to thank Kiel Ortega for computer assistance throughout this project. This material is based upon work supported by the National Science Foundation under Grant No. ATM-0648566. Any opinions, findings, and conclusions or recommendations expressed in this material are those of the authors and do not necessarily reflect the views of the National Science Foundation.
REFERENCES
Browning, K. A., 1977: The structure and mechanism of hailstorms. Hail: A Review of Hail Science and Hail Suppression, Meteor. Monogr., No. 38, Amer. Meteor. Soc., 1–39.
Donaldson, R. J., R. M. Dyer, and M. J. Krauss, 1975: An objective evaluator of techniques for predicting severe weather events. Preprints, Ninth Conf. Severe Local Storms, Norman, Oklahoma, Amer. Meteor. Soc., 321–326.
Doswell, C. A. and D. W. Burgess, 1993: Tornadoes
and tornadic storms: A review of conceptual models. The Tornado: Its Structure, Dynamics, Prediction, and Hazards, Geophys. Monogr., No. 79, Amer. Geophys. Union, 161–172.
______ , 2001: Severe convective storms – an
overview. Severe Convective Storms, Meteor. Monogr., No. 50, Amer. Meteor. Soc., 1–26.
Erickson, Somer Alane, 2007: U.S. tornado warnings
1986 – 2004: Lead time, time spent under warning and economics; a different perspective. University of Oklahoma, MS thesis, The University of Oklahoma, 56pp.
Green, D. R., and R. A. Clark, 1972: Vertically
integrated liquid—A new analysis tool. Mon. Wea. Rev., 100, 548–552.
Hjorth, J. S. U., 1994: Computer intensive statistical
methods: Validation model selection and bootstap. CRC Press. 263 pp.
Lee, B. D., and R. B. Wilhelmson, 1997a: The numerical
simulation of non-supercell tornadogenesis. Part I: Initiation and evolution of pretornadic misocyclone circulations along a dry outflow boundary. J. Atmos. Sci., 54, 32–60.
Johnson, J. T., P. L. MacKeen, A. Witt, E. D. Mitchell, G.
J. Stumpf, M. D. Eilts, and K. W. Thomas, 1998: The Storm Cell Identification and Tracking (SCIT) algorithm: An enhanced WSR-88D algorithm. Wea. Forecasting, 13, 263–276.
Kullback, S., and Leibler, R. A., 1951: On information
and sufficiency, Annals of Mathematical Statistics, 22, 79-86
Lakshmanan, V., R. Rabin, and V. DeBrunner, 2003c:
Multiscale storm identification and forecast. J. Atm. Res., 67, 367–380.
______ , T. Smith, G. Stumpf, K. Hondl, 2007: The
warning decision support system-integrated information. Wea. Forecasting, 22, 596–612.
Quinlan, J. R., 1996: Improved use of continuous
attributes. Journal of Artificial Intelligence Research, 4, 77–90.

Simmons, K. M. and D. Sutter, 2005: WSR-88D Radar, tornado warnings, and tornado casualties. Wea. Forecasting, 17, 301–310.
Smith T., and K. L. Elmore, 2004: The use of radial
velocity derivatives to diagnose rotation and divergence. Preprints, 11th Conf. on Aviation, Range, and Aerospace, Hyannis, MA, Amer. Meteor. Soc., CD-ROM, P5.6.
Witt, A., M. D. Eilts, G. J. Stumpf, J. T. Johnson, E. D.
Mitchell, and K. W. Thomas, 1998: An enhanced hail detection algorithm for the WSR-88D. Wea. Forecasting, 13, 513–518.
Woodcock, F., 1976: The evaluation of yes/no forecasts
for scientific and administrative purposes. Mon. Wea. Rev., 104, 1209-1214


