Embed Size (px)
Citation preview
Towards angiosperms genome evolution in time
Serge N. Sheremet’ev1 and Yuri V. Gamalei
Department of Ecological Physiology, Komarov Botanical Institute, Russian Academy of Sciences, St. Petersburg
197376, Russia
Abstract In this communication, direction of evolutionary variability of parameters of genome size and structurally functional activity of plants in angiosperm taxa among life forms, are analyzed. It is shown that, in the Cretaceous–Cenozoic era, the nuclear genome of the plants tended to increase. Functional genome efficiency (intensity of functions per pg of DNA) decreased as much as possible from highest, at trees and lianas of rain and monsoonal forests of the Paleogene, to minimum, at shrubs, perennial and annual grasses of meadow–steppe vegetation appeared in the Neogene. Environmental changes in temperature, humidity and CO2 concentration in adverse direction, critical for vegetation, are discussed as the cause of growth of evolutionary genome size and loss in its functional efficiency. The growth of the genome in the Cenozoic did not lead to the intensification of functions, but rather led to the expansion of the adaptive capacity of species. Growth of nuclear DNA content can be considered as one of the effective tools of an adaptogenesis.
INTRODUCTION
Nuclear DNA content (nDNAc) in plant and animal cells is being investigated for more
than 50 years (Bennett and Leitch, 2005a); and so far, the nDNAc has been defined for 6.5
thousand angiosperm species. This information is summarized in tabular forms in several
publications (Bennett, 1972; Bennett and Smith, 1976, 1991; Bennett et al., 1982, 1998, 2000;
Bennett and Leitch, 1995, 1997, 2005a; Hanson et al., 2001a, b; Hanson et al., 2003, 2005;
Suda et al., 2003; Zonneveld et al., 2005) and in free online database (Bennett and Leitch,
2005b). We enlarged this database by adding more information about geological age of plant
genera (after Daghlian, 1981; Muller, 1981; Zavada and Benson, 1987; Benton, 1993;
Collinson et al., 1993; Herendeen and Crane, 1995; Wing and Boucher, 1998; Crepet et al.,
2004; Song Zhi–Chen et al., 2004; Martínez–Millán, 2010; Grimsson et al., 2011 and The
Paleobiology Database (PBDB – http://flatpebble.nceas.ucsb.edu/cgi–bin/bridge.pl)) and their
growth forms.
This research is undertaken to detect changes in nDNAc, number of chromosomes, ploidy
levels in angiosperms and their taxonomical subunits and different growth forms, during the
course of evolution from late Cretaceous to Plio–Pleistocene. Influence on dynamics of the
climatic factors as well synchronism with changes of structurally functional characteristics of
1
Corresponding author. E-mail: Serge Sheremet’ev, [email protected]
1
plants is studied. On possibility of such coordination point the known facts of influence on a
wide range of properties of plant nDNAc is documented (Grime, 1998; Reeves et al., 1998;
Prokopowich et al., 2003; Jovtcheva et al., 2006; Beaulieu et al., 2007a, b; Beaulieu et al.,
2008; Knight and Beaulieu, 2008 и др.).
Being engaged in this work, we understood nevertheless some vagueness of such
constructions about the assumption what data obtained from extant species has remained
unchanged over geological time. This assumption is quite vulnerable relative to ploidy levels,
to a lesser extent – relative to the numbers of chromosomes and the amount of DNA content
in haploid sets of chromosomes. However this question, in our opinion, is interesting and
demands the preliminary analysis and discussion at least. We offer the certain probabilistic
approach which correctness can be estimated by the general logic of angiosperms evolution,
and also by coincidence of the received curves with climatic data. However, it should be
noted that there are different approaches to this problem (Masterson, 1994; Franks et al.,
2012). We dare to hope that in the future, these approaches would supplement each other.
DATA SETS
In addition to above mentioned data, following data sets were also used: cell cycle time
(Francis et al., 2008), leaf functional traits Amax (photosynthetic capacity, per leaf dry mass)
and SLA (specific leaf area, per leaf dry mass) (Wright et al., 2004), leaf vein density
(Brodribb and Field, 2010; Feild et al., 2011), plant water relations (index of plant water
relations complexity and partial volume of intercellular spaces) (Sheremet’ev, 2005), and
chlorophyll content (per leaf dry mass) (Lubimenko, 1916), oxygen isotope ratio in shells of
planktonic foraminifera and brachiopods from J. Veizer’s database
(http://www.science.uottawa.ca/geology/isotope_data/) (Veizer et al., 1999), arid areas
(computed after paleomaps by Scotese, 2003; Akhmetiev, 2004; Chumakov, 2004a). All data
were averaged by epochs (Ogg et al., 2008).
TERMINOLOGY
The labeling of nDNAc is done by the use of the term "C–value" with various prefixes –
1С, 2С, 3С etc. It was used for the first time by Swift (Swift, 1950) without any definition.
Later Bennett and Smith (1976) pointed out, that Swift in personal communication informed
that the letter C stands for 'constant', i.e. the amount of DNA characteristic of a particular
genotype. They defined the C–value (or 1C value) for any genotype as the DNA content of
the unreplicated haploid chromosome complement (Bennett and Smith, 1976). Similarly, the
2
measure of DNA content of unreplicated non–reduced (zygotic, diplophasic) complements
will be 2C (irrespective to ploidy level) (Greilhuber et al., 2005).
Unlike the term "C–value" the term “genome size” is often used to designate the quantity
of DNA in meiotic reduced diploid set of chromosomes or monoploid one (meaning the
polyploid set contains more that one genome) (Bennett et al., 1998). Consistent use of the
term "genome size" in a narrow sense is often impossible due to uncertainty of the degree of
ploidy. Therefore many authors prefer to use this term, as well as "C–value" in a broader
sense irrespective of the ploidy level. In this sense, the terms "C–value" (with prefix 1) and
"genome size" are synonymous (Greilhuber et al., 2005).
The complete chromosome set with number n (reduced) irrespective of the degree of
generative polyploidy was offered the term "holoploid genome" (Greilhuber et al., 2005;
Greilhuber and Doležel, 2009). It was proposed to use the terms "holoploid genome size" and
"C–value" (or 1C) to determine size of genome (Greilhuber et al., 2005). In that case 2C will
be related to an unreplicated, unreduced chromosome set (2n) regardless the degree of ploidy
and will characterize total amount of the nuclear DNA (in diplophase), and the genome size
will correspond to the term "holoploid genome size" (or 1C). In this article, we will hold these
definitions for these terms.
VARIABILITY OF TRAITS
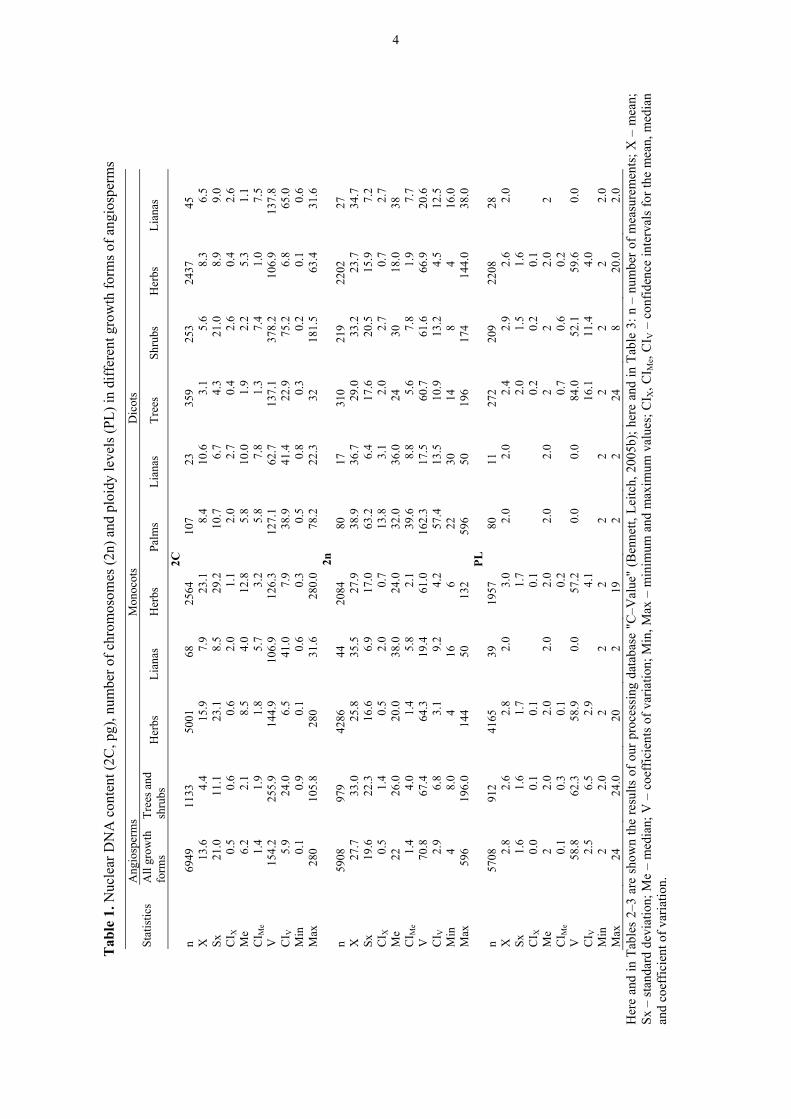
Traits that characterize nuclear DNA of angiosperms (2C, the number of chromosomes
and ploidy level) vary at broad limits. Especially it concerns the nDNAc whose coefficient of
variation is more than 150 % (Table 1). More moderate variations are discovered in
chromosome numbers (71%) and ploidy levels (59%). The wide variation of genome size in
flowering plants (from 0.05 to 140 pg) is a part of greater variety of 1С among eukaryotic
organisms – from 0.009 to 700 pg (see, for example: Leitch et al., 1998; Gregory, 2005;
Patrushev and Minkevich, 2006, 2007). This variation, which is not related with the
taxonomic positions of the species and their phenotypic complexity, was called the "C–value
paradox" (Thomas, 1971).
However, the fractile analysis shows that the variability of the data is not so considerable
(Table 2). The difference of the nDNAc between the top and bottom deciles (fractiles 0.9 and
0.1 respectively) makes only 32.3 pg. In other words, the vast majority of array values (80%)
are in limits of 1.2–33.5 pg. By such consideration the genome sizes are limited at a range of
0.6–16.7 pg; when, number of the chromosomes changes from 14 to 48, the ploidy levels do
not exceed 4 (Table 2). Comparison of these data with the variability which is shown in
3
Tab
le 1
. Nuc
lear
DN
A c
onte
nt (2
C, p
g), n
umbe
r of c
hrom
osom
es (2
n) a
nd p
loid
y le
vels
(PL)
in d
iffer
ent g
row
th fo
rms o
f ang
iosp
erm
s
Stat
istic
s A
ngio
sper
ms
Mon
ocot
s D
icot
s A
ll gr
owth
fo
rms
Tree
s and
sh
rubs
H
erbs
Li
anas
H
erbs
Pa
lms
Lian
as
Tree
s Sh
rubs
H
erbs
Li
anas
2C
n 69
49
1133
50
01
68
2564
10
7 23
35
9 25
3 24
37
45
X
13.6
4.
4 15
.9
7.9
23.1
8.
4 10
.6
3.1
5.6
8.3
6.5
Sx
21.0
11
.1
23.1
8.
5 29
.2
10.7
6.
7 4.
3 21
.0
8.9
9.0
CI X
0.
5 0.
6 0.
6 2.
0 1.
1 2.
0 2.
7 0.
4 2.
6 0.
4 2.
6 M
e 6.
2 2.
1 8.
5 4.
0 12
.8
5.8
10.0
1.
9 2.
2 5.
3 1.
1 C
I Me
1.4
1.9
1.8
5.7
3.2
5.8
7.8
1.3
7.4
1.0
7.5
V
154.
2 25
5.9
144.
9 10
6.9
126.
3 12
7.1
62.7
13
7.1
378.
2 10
6.9
137.
8 C
I V
5.9
24.0
6.
5 41
.0
7.9
38.9
41
.4
22.9
75
.2
6.8
65.0
M
in
0.1
0.9
0.1
0.6
0.3
0.5
0.8
0.3
0.2
0.1
0.6
Max
28
0 10
5.8
280
31.6
28
0.0
78.2
22
.3
32
181.
5 63
.4
31.6
2n
n
5908
97
9 42
86
44
2084
80
17
31
0 21
9 22
02
27
X
27.7
33
.0
25.8
35
.5
27.9
38
.9
36.7
29
.0
33.2
23
.7
34.7
Sx
19
.6
22.3
16
.6
6.9
17.0
63
.2
6.4
17.6
20
.5
15.9
7.
2 C
I X
0.5
1.4
0.5
2.0
0.7
13.8
3.
1 2.
0 2.
7 0.
7 2.
7 M
e 22
26
.0
20.0
38
.0
24.0
32
.0
36.0
24
30
18
.0
38
CI M
e 1.
4 4.
0 1.
4 5.
8 2.
1 39
.6
8.8
5.6
7.8
1.9
7.7
V
70.8
67
.4
64.3
19
.4
61.0
16
2.3
17.5
60
.7
61.6
66
.9
20.6
C
I V
2.9
6.8
3.1
9.2
4.2
57.4
13
.5
10.9
13
.2
4.5
12.5
M
in
4 8.
0 4
16
6 22
30
14
8
4 16
.0
Max
59
6 19
6.0
144
50
132
596
50
196
174
144.
0 38
.0
PL
n 57
08
912
4165
39
19
57
80
11
272
209
2208
28
X
2.
8 2.
6 2.
8 2.
0 3.
0 2.
0 2.
0 2.
4 2.
9 2.
6 2.
0 Sx
1.
6 1.
6 1.
7
1.7
2.0
1.5
1.6
C
I X
0.0
0.1
0.1
0.
1
0.
2 0.
2 0.
1
Me
2 2.
0 2.
0 2.
0 2.
0 2.
0 2.
0 2
2 2.
0 2
CI M
e 0.
1 0.
3 0.
1
0.2
0.7
0.6
0.2
V
58
.8
62.3
58
.9
0.0
57.2
0.
0 0.
0 84
.0
52.1
59
.6
0.0
CI V
2.
5 6.
5 2.
9
4.1
16.1
11
.4
4.0
M
in
2 2.
0 2
2 2
2 2
2 2
2 2.
0 M
ax
24
24.0
20
2
19
2 2
24
8 20
.0
2.0
Her
e an
d in
Tab
les
2–3
are
show
n th
e re
sults
of o
ur p
roce
ssin
g da
taba
se "
C–V
alue
" (B
enne
tt, L
eitc
h, 2
005b
); he
re a
nd in
Tab
le 3
: n –
num
ber o
f mea
sure
men
ts; X
– m
ean;
Sx
– s
tand
ard
devi
atio
n; M
e –
med
ian;
V –
coe
ffic
ient
s of
var
iatio
n; M
in, M
ax –
min
imum
and
max
imum
val
ues;
CI X
, CI M
e, C
I V –
con
fiden
ce in
terv
als
for t
he m
ean,
med
ian
and
coef
ficie
nt o
f var
iatio
n.
4
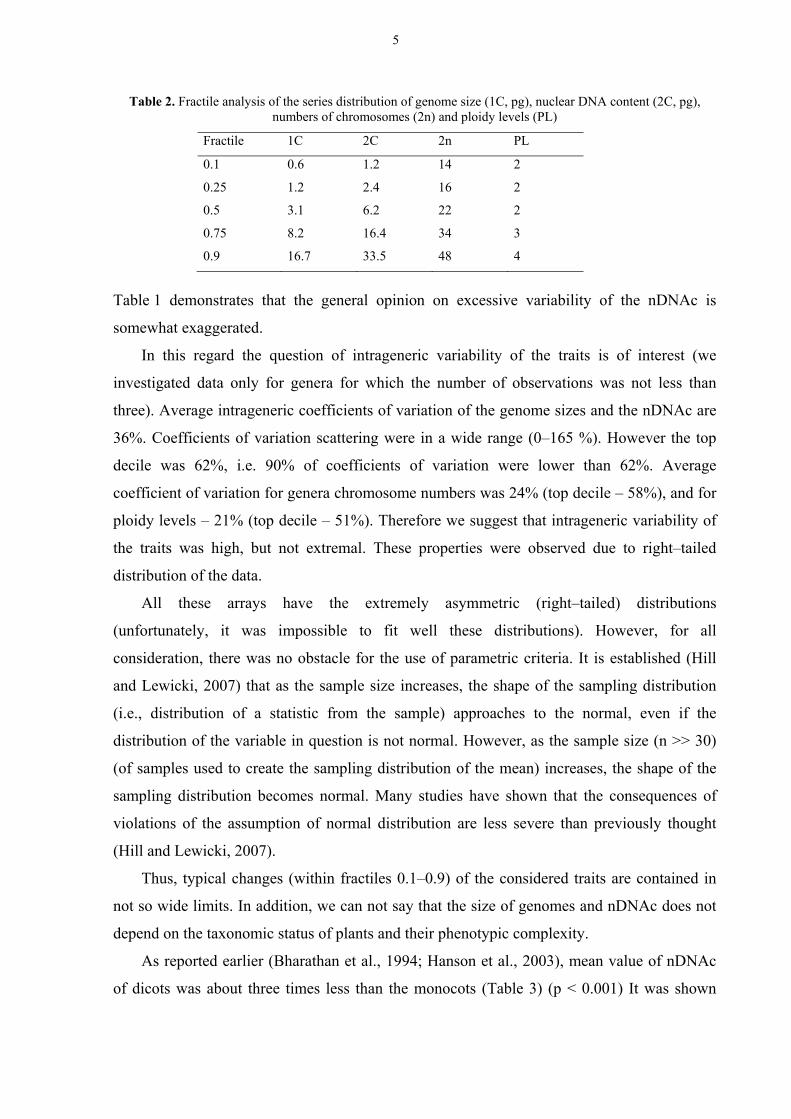
Table 1 demonstrates that the general opinion on excessive variability of the nDNAc is
somewhat exaggerated.
In this regard the question of intrageneric variability of the traits is of interest (we
investigated data only for genera for which the number of observations was not less than
three). Average intrageneric coefficients of variation of the genome sizes and the nDNAc are
36%. Coefficients of variation scattering were in a wide range (0–165 %). However the top
decile was 62%, i.e. 90% of coefficients of variation were lower than 62%. Average
coefficient of variation for genera chromosome numbers was 24% (top decile – 58%), and for
ploidy levels – 21% (top decile – 51%). Therefore we suggest that intrageneric variability of
the traits was high, but not extremal. These properties were observed due to right–tailed
distribution of the data.
All these arrays have the extremely asymmetric (right–tailed) distributions
(unfortunately, it was impossible to fit well these distributions). However, for all
consideration, there was no obstacle for the use of parametric criteria. It is established (Hill
and Lewicki, 2007) that as the sample size increases, the shape of the sampling distribution
(i.e., distribution of a statistic from the sample) approaches to the normal, even if the
distribution of the variable in question is not normal. However, as the sample size (n >> 30)
(of samples used to create the sampling distribution of the mean) increases, the shape of the
sampling distribution becomes normal. Many studies have shown that the consequences of
violations of the assumption of normal distribution are less severe than previously thought
(Hill and Lewicki, 2007).
Thus, typical changes (within fractiles 0.1–0.9) of the considered traits are contained in
not so wide limits. In addition, we can not say that the size of genomes and nDNAc does not
depend on the taxonomic status of plants and their phenotypic complexity.
As reported earlier (Bharathan et al., 1994; Hanson et al., 2003), mean value of nDNAc
of dicots was about three times less than the monocots (Table 3) (p < 0.001) It was shown
Table 2. Fractile analysis of the series distribution of genome size (1C, pg), nuclear DNA content (2C, pg), numbers of chromosomes (2n) and ploidy levels (PL)
Fractile 1С 2С 2n PL
0.1 0.6 1.2 14 2
0.25 1.2 2.4 16 2
0.5 3.1 6.2 22 2
0.75 8.2 16.4 34 3
0.9 16.7 33.5 48 4
5
earlier that the ancestral monocot groups (as well as the ancestral groups of dicotyledons) had
the small genome sizes, in contrast to the derivative taxa those had very high content of
nDNAc (Leitch et al., 1998; Soltis et al., 2003; Leitch et al., 2005). This view is confirmed by
quantitative analysis of the data.
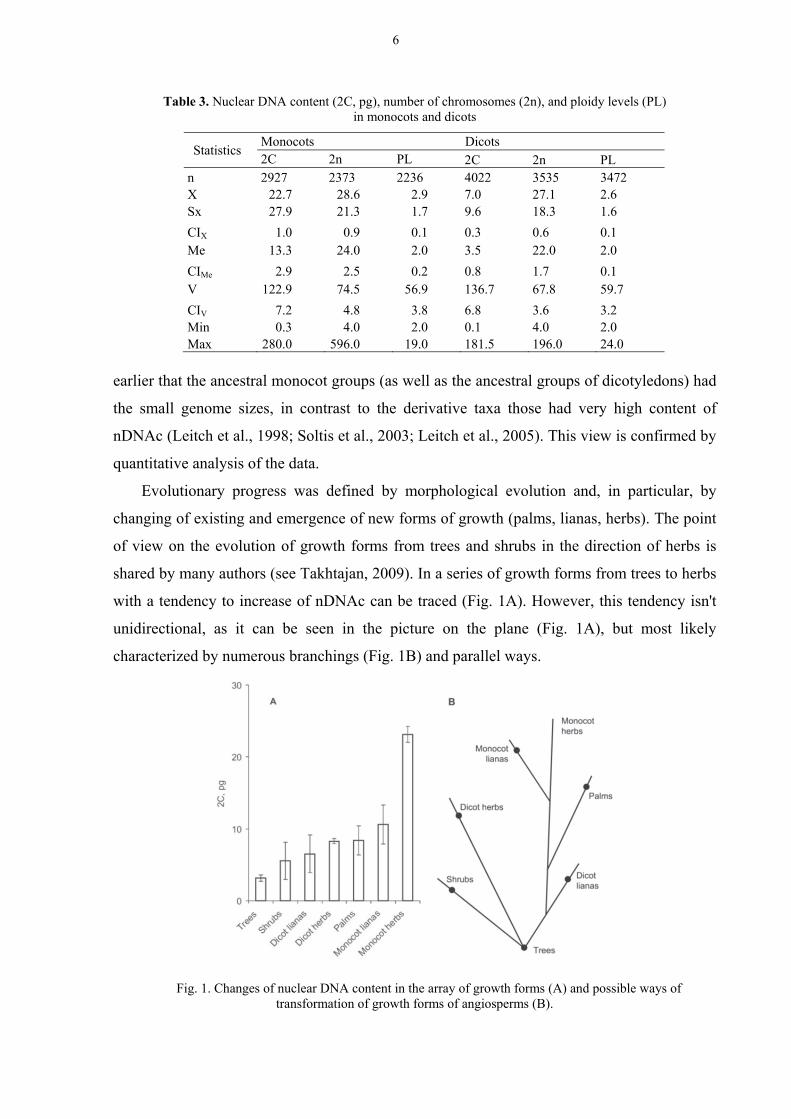
Evolutionary progress was defined by morphological evolution and, in particular, by
changing of existing and emergence of new forms of growth (palms, lianas, herbs). The point
of view on the evolution of growth forms from trees and shrubs in the direction of herbs is
shared by many authors (see Takhtajan, 2009). In a series of growth forms from trees to herbs
with a tendency to increase of nDNAc can be traced (Fig. 1A). However, this tendency isn't
unidirectional, as it can be seen in the picture on the plane (Fig. 1A), but most likely
characterized by numerous branchings (Fig. 1B) and parallel ways.
Table 3. Nuclear DNA content (2C, pg), number of chromosomes (2n), and ploidy levels (PL) in monocots and dicots
Statistics Monocots Dicots 2С 2n PL 2C 2n PL
n 2927 2373 2236 4022 3535 3472 X 22.7 28.6 2.9 7.0 27.1 2.6 Sx 27.9 21.3 1.7 9.6 18.3 1.6
CIX 1.0 0.9 0.1 0.3 0.6 0.1 Me 13.3 24.0 2.0 3.5 22.0 2.0
CIMe 2.9 2.5 0.2 0.8 1.7 0.1 V 122.9 74.5 56.9 136.7 67.8 59.7
CIV 7.2 4.8 3.8 6.8 3.6 3.2 Min 0.3 4.0 2.0 0.1 4.0 2.0 Max 280.0 596.0 19.0 181.5 196.0 24.0
Fig. 1. Changes of nuclear DNA content in the array of growth forms (A) and possible ways of
transformation of growth forms of angiosperms (B).
6
CHANGES OF TRAITS IN LATE CRETACEOUS–CENOZOIC
Determination of geologic age of angiosperm genera allowed to trace the changes of
nDNAc, chromosome numbers, and ploidy levels in late Cretaceous–Cenozoic and compared
these time series with important characters of paleoclimates.
NUCLEAR DNA CONTENT
The nDNAc of angiosperms, as already noted, had a tendency to increase during the
course of biological evolution. A more detailed study of this trend showed that the minimum
value of nDNAc was observed in the initial period of the evolution of angiosperms – in Early
and Late Cretaceous (Fig. 2A). In the Paleocene there was some increase in nDNAc, followed
by a decrease in the Eocene. Rate of angiosperms evolution (as number of families appeared
in some geological epoch divided by duration of this epoch) changed in an antiphase. In other
words, the rate of appearing of new families of angiosperms increased in geological epochs
when nDNAc decreased. On the contrary the increase of nDNAc was accompanied by a
decrease in the rate of evolution.
A slow decrease in temperature after the early Eocene climatic optimum was followed by
a drastic climatic cooling and large–scale glaciation of the Antarctica (Kennett 1977; Lear et
al., 2000; Zachos et al., 2001; DeConto and Pollard 2003a, b; Pollard and DeConto 2003,
2005). Sometimes later, glaciation spread over Greenland (later Eocene–early Oligocene:
Eldrett et al., 2007). After that, symmetric glaciation of both the poles occurred (Tripati et al.,
2005; Moran et al., 2006), and the temperature gradient between the equatorial zone and the
poles increased (Nikolaev et al., 1998). It resulted in beginning of transition from the ‘‘warm
biosphere’’ to the ‘‘cold biosphere’’ (Akhmetiev, 2004).
In these conditions of Oligocene glaciation, a steep increase in nDNAc and a steep
decrease in the rate of angiosperms evolution occurred (Fig. 2A). Then, starting from the
Miocene, the nDNAc gradually decreased, with the onset of the rise of the rate of angiosperm
evolution.
In monocots and dicots the changes of nDNAc in Cretaceous–Eocene occurred more or
less in parallel (Fig. 2B). However in Oligocene, reactions of plants to climatic changes were
opposite. As a response to cooling and reduction of carbon dioxide in the atmosphere in
Oligocene, the nDNAc in dicots dramatically increased, and by contrast, sharply declined in
monocots. Reaction of these angiospermic groups to a relative warming in Miocene remained
opposite. It is not possible to find an explanation for this observation at this stage of research.
7
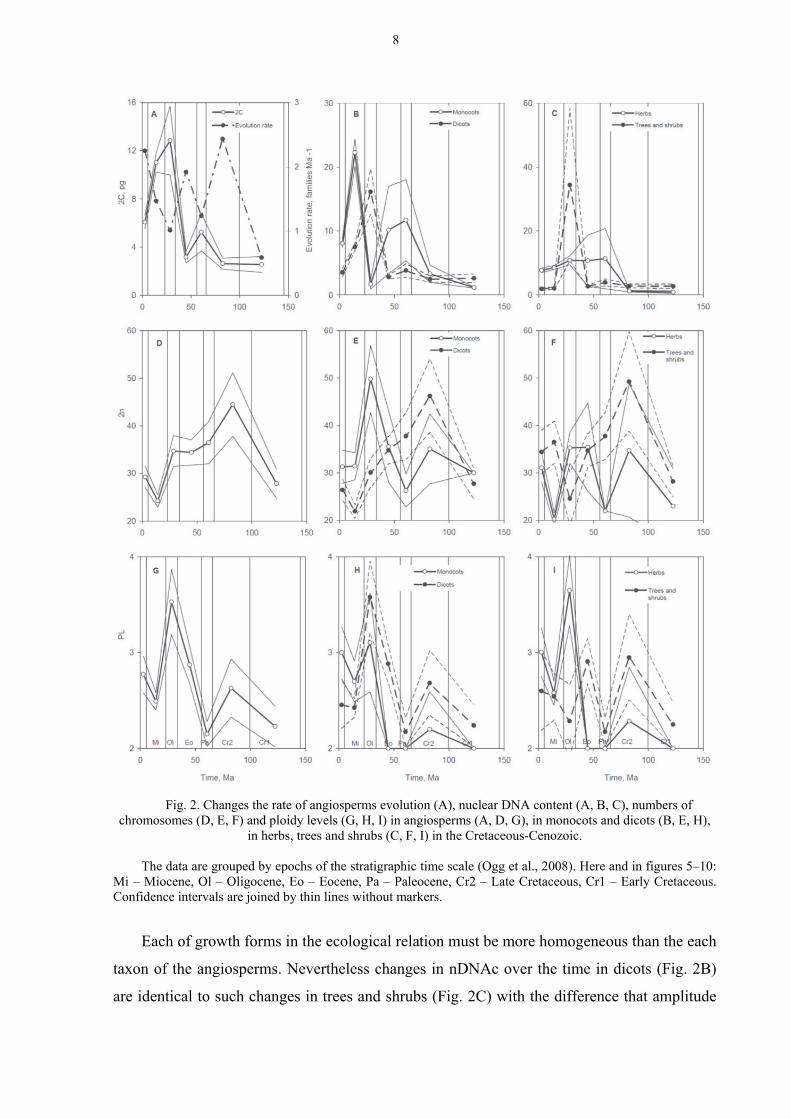
Fig. 2. Changes the rate of angiosperms evolution (A), nuclear DNA content (A, B, C), numbers of
chromosomes (D, E, F) and ploidy levels (G, H, I) in angiosperms (A, D, G), in monocots and dicots (B, E, H), in herbs, trees and shrubs (C, F, I) in the Cretaceous-Cenozoic.
The data are grouped by epochs of the stratigraphic time scale (Ogg et al., 2008). Here and in figures 5–10:
Mi – Miocene, Ol – Oligocene, Eo – Eocene, Pa – Paleocene, Cr2 – Late Cretaceous, Cr1 – Early Cretaceous. Confidence intervals are joined by thin lines without markers.
Each of growth forms in the ecological relation must be more homogeneous than the each
taxon of the angiosperms. Nevertheless changes in nDNAc over the time in dicots (Fig. 2B)
are identical to such changes in trees and shrubs (Fig. 2C) with the difference that amplitude
8
of the plots is approximately twice higher in the woody plants. Herbs in Cretaceous–Eocene
(Fig. 2C) approximately repeated the course of changes of nDNAc in monocots (Fig. 2B).
However since Eocene the nDNAc of herbs changed slightly.
NUMBERS OF CHROMOSOMES
Number of chromosomes (2n) in most cases (90 %) is in not so widely limited from
above 48 chromosomes (Table 2). It finds reflection on a curve of changes of 2n in
angiosperms in time (Fig. 2D). In the angiosperms (on average) very large 2n at the initial
stage of evolution (Early Cretaceous) was not there. However, in the Late Cretaceous the 2n
had reached the maximum value in the history of this group of the plants (Fig. 2D) and was
coincided with very high rate of evolution (Fig. 2A). The subsequent history of angiosperms
showed a gradual reduction in the number of chromosomes in cell nuclei. The absolute
minimum was passed in Miocene. In Pliocene–Pleistocene, approximately the same value was
restored with which the history of the angiosperms began.
During the evolution of dicots, changes in 2n (Fig. 2E) were similar to the changes in 2n
of trees and shrubs (Fig. 2F). In monocotyledonous plants (Fig. 2E) and dicotyledonous herbs
(Fig. 2F) similar dynamics of 2n were observed in the Cretaceous–Cenozoic, except for a
significant peak of this feature in monocots in the Oligocene.
RELATIONS BETWEEN 2N AND NDNAC
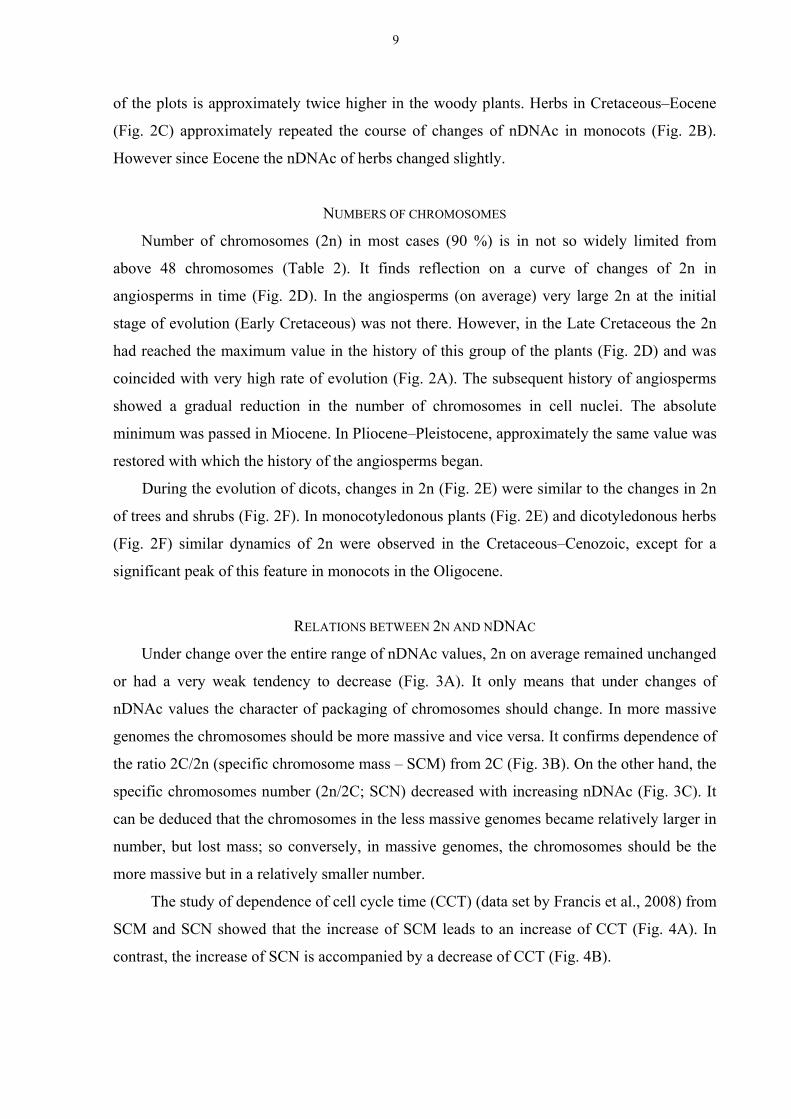
Under change over the entire range of nDNAc values, 2n on average remained unchanged
or had a very weak tendency to decrease (Fig. 3A). It only means that under changes of
nDNAc values the character of packaging of chromosomes should change. In more massive
genomes the chromosomes should be more massive and vice versa. It confirms dependence of
the ratio 2C/2n (specific chromosome mass – SCM) from 2С (Fig. 3B). On the other hand, the
specific chromosomes number (2n/2C; SCN) decreased with increasing nDNAc (Fig. 3C). It
can be deduced that the chromosomes in the less massive genomes became relatively larger in
number, but lost mass; so conversely, in massive genomes, the chromosomes should be the
more massive but in a relatively smaller number.
The study of dependence of cell cycle time (CCT) (data set by Francis et al., 2008) from
SCM and SCN showed that the increase of SCM leads to an increase of CCT (Fig. 4A). In
contrast, the increase of SCN is accompanied by a decrease of CCT (Fig. 4B).
9
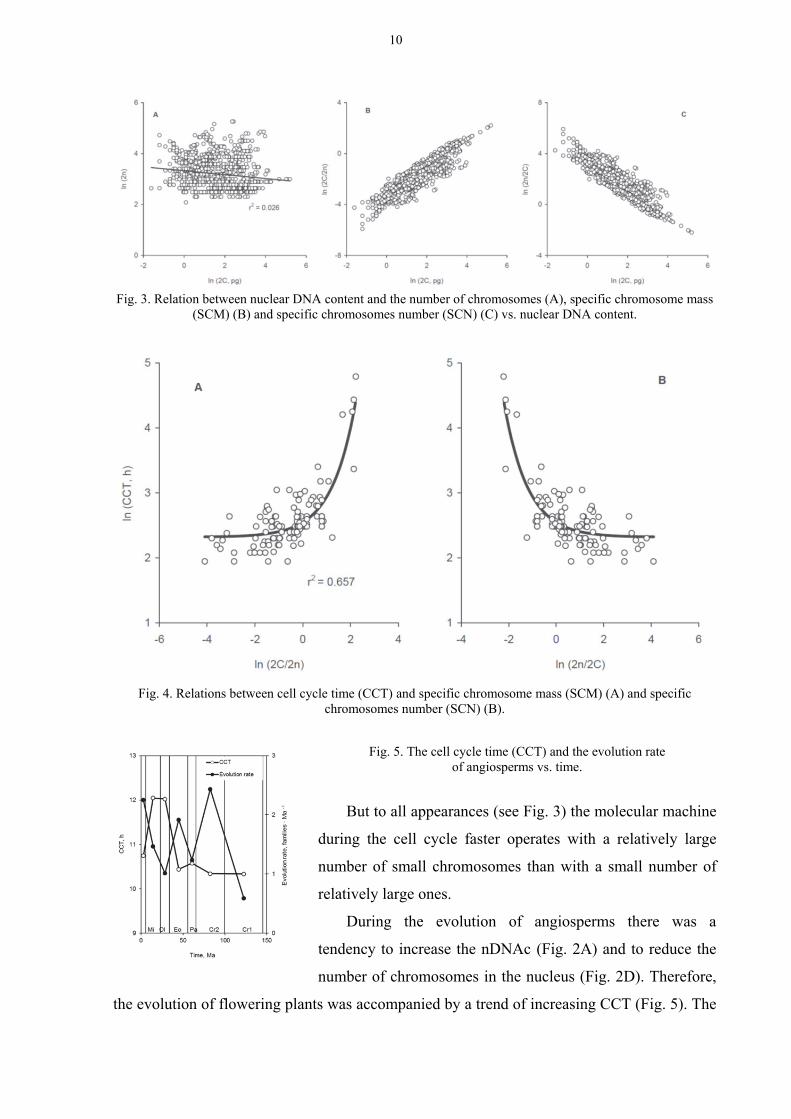
Fig. 3. Relation between nuclear DNA content and the number of chromosomes (A), specific chromosome mass (SCM) (B) and specific chromosomes number (SCN) (C) vs. nuclear DNA content.
Fig. 4. Relations between cell cycle time (CCT) and specific chromosome mass (SCM) (A) and specific
chromosomes number (SCN) (B).
Fig. 5. The cell cycle time (CCT) and the evolution rate of angiosperms vs. time.
But to all appearances (see Fig. 3) the molecular machine
during the cell cycle faster operates with a relatively large
number of small chromosomes than with a small number of
relatively large ones.
During the evolution of angiosperms there was a
tendency to increase the nDNAc (Fig. 2A) and to reduce the
number of chromosomes in the nucleus (Fig. 2D). Therefore,
the evolution of flowering plants was accompanied by a trend of increasing CCT (Fig. 5). The
10
maximum values of the CCT were achieved in the Oligocene and Miocene coinciding with
the significant decrease in the rate of evolution of angiosperms (Fig. 5).
PLOIDY LEVELS
Polyploidy is widespread among the angiosperms (Wendel and Doyle, 2005; Cui et al.,
2006; Chen, 2007; Doyle et al., 2008; Soltis and Soltis, 2009; Jackson and Chen, 2010; Doyle
and Egan, 2010). An important and integral part of the speciation and evolution of the
flowering plants is an interspecific hybridization based on the duplication of the genome (De
Bodt et al., 2005; Hegarty and Hiscock, 2005; Baack and Rieseberg, 2007; Mallet, 2007,
2008; Rieseberg and Willis, 2007; Soltis and Soltis, 2009; Wood et al., 2009; Whitney et al.,
2010). According to some authors, it has become increasingly clear that the genome
duplication events were associated with the most important steps in the evolution of
angiosperms, such as the origin and early divergence, the evolution of the flower or the
overcoming of the Cretaceous–Cenozoic boundary (Van de Peer et al., 2009а, b).
The study of database "C–Value" (Bennett and Leitch, 2005b) showed that the ploidy
levels (PL) of most of the species does not exceed 4 (Table 2). Presumably the fluctuations of
PL (on average) in the evolution did not exceed this limit (Fig. 2G–I). However, there was
trend of some increase of PL during of the angiosperms evolution. The exceptions are woody
plants (trees and shrubs), in them variations of PL occurred near the one level (without any
trends) (Fig. 2I).
CLIMATIC CONTROL OF DYNAMICS OF THE TRAITS
NUCLEAR DNA CONTENT
The important climatic factors such as global temperature and the activity of the
hydrological cycle appeared to have a significant influence on nDNAc of the angiosperms
(Fig. 6A, B). The nDNAc of the angiosperms remained rather low during the warmer
geological epochs (Cretaceous–Eocene) (Fig. 6A). Global cooling in the Oligocene coincided
with a significant increase of the nDNAc (Fig. 6A). In addition, the narrowing of the arid
areas was accompanied by a relative decrease of the nDNAc (Fig. 6B). Climate aridization in
the Oligocene (as well as global cooling) coincided with an increase of the nDNAc (Fig. 6B).
NUMBERS OF CHROMOSOMES
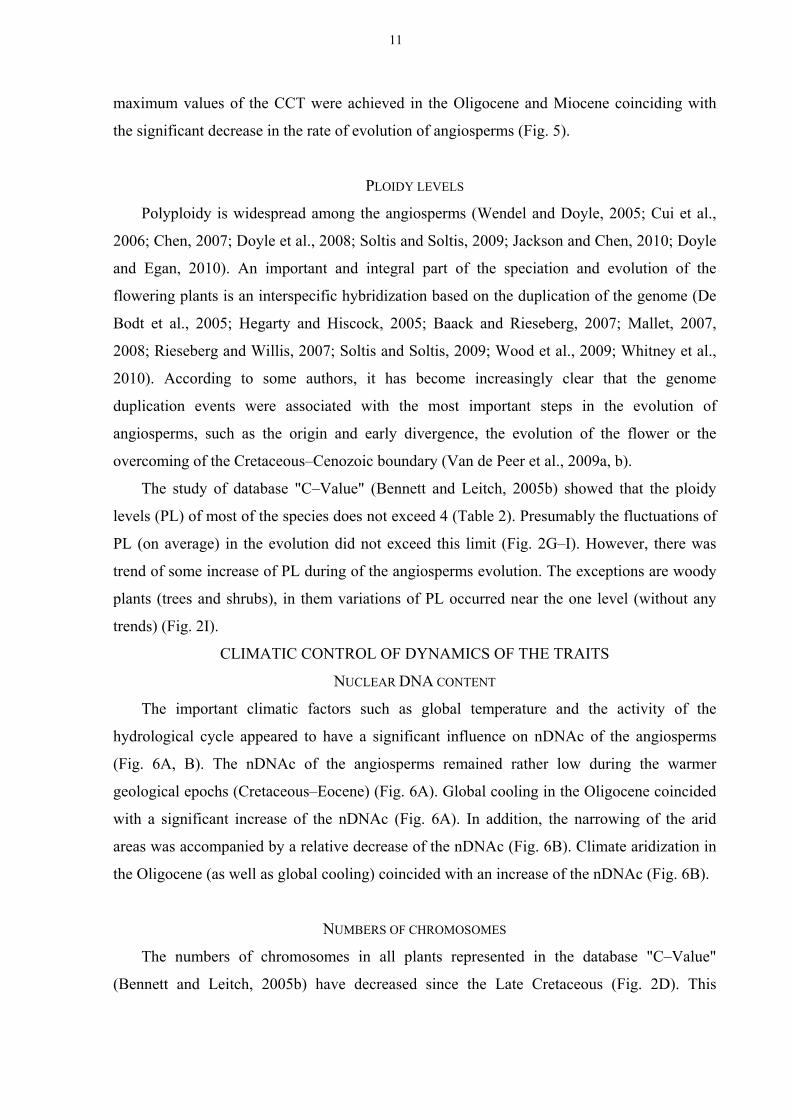
The numbers of chromosomes in all plants represented in the database "C–Value"
(Bennett and Leitch, 2005b) have decreased since the Late Cretaceous (Fig. 2D). This
11

dynamics of 2n is almost identical to the dynamics of the decline in the global temperature
(Fig. 7A). Similarly, the SCN was also decreased (i.e., the number of chromosomes per pg).
The global humidization of climate in Cretaceous–Paleocene was accompanied by a
decrease of 2n in monocots (i.e., predominantly in herbaceous plants) (Fig. 7B). On the
contrary, the arid climate in the Oligocene was related with the significant increase of 2n in
this group of plants (Fig. 7B).
Dicots (Fig. 7C) (and also trees and shrubs) show the same picture of dynamics of 2n in
Cretaceous–Cenozoic, as well as angiosperms as a whole (Fig. 7A) – in connection with
changes in the global temperature.
PLOIDY LEVELS
The PL in the angiosperms (as well as in the monocots and dicots) (Fig. 8A) and in the
herbaceous plants (Fig. 8B) was varied in the geological past in accordance with the changes
of climate aridity. The PL went down during humid epochs (Late Cretaceous–Eocene).
Fig. 6. The nuclear DNA content and the climate (A – δ18O; B – area of arid territories) vs. time.
Data detrended. δ18O – oxygen isotope ratio in shells of planktonic foraminifera and brachiopods, data averaging by epochs (Ogg et al., 2008) from J. Veizer’s database (http://www.science.uottawa.ca/geology/isotope_data/) (Veizer et al., 1999). Arid area (here and in figures 7B, 8A-B white points – computed after maps by Scotese 2003, black points – after maps by Akhmetiev 2004 and by Chumakov 2004a, b, zero point – contemporary hyperarid, arid, and semi-arid areas of ice-free land after Middleton and Thomas 1997).
12
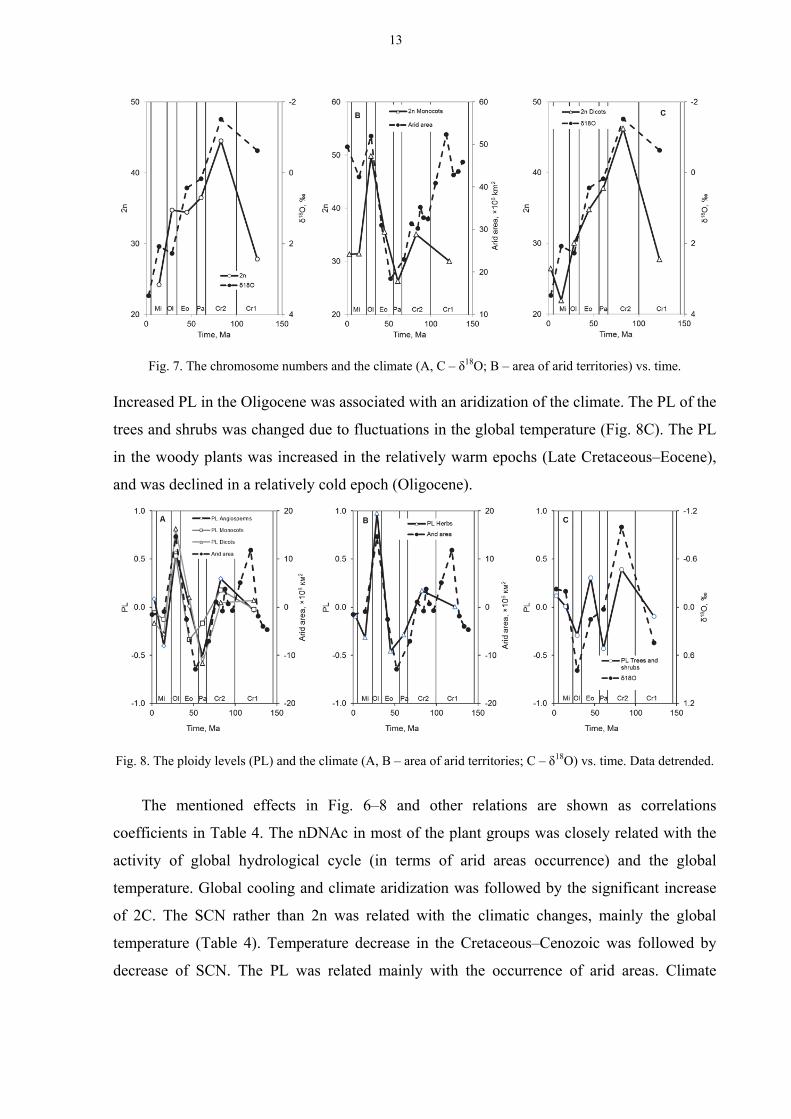
Increased PL in the Oligocene was associated with an aridization of the climate. The PL of the
trees and shrubs was changed due to fluctuations in the global temperature (Fig. 8C). The PL
in the woody plants was increased in the relatively warm epochs (Late Cretaceous–Eocene),
and was declined in a relatively cold epoch (Oligocene).
Fig. 8. The ploidy levels (PL) and the climate (A, B – area of arid territories; C – δ18O) vs. time. Data detrended.
The mentioned effects in Fig. 6–8 and other relations are shown as correlations
coefficients in Table 4. The nDNAc in most of the plant groups was closely related with the
activity of global hydrological cycle (in terms of arid areas occurrence) and the global
temperature. Global cooling and climate aridization was followed by the significant increase
of 2C. The SCN rather than 2n was related with the climatic changes, mainly the global
temperature (Table 4). Temperature decrease in the Cretaceous–Cenozoic was followed by
decrease of SCN. The PL was related mainly with the occurrence of arid areas. Climate
Fig. 7. The chromosome numbers and the climate (A, C – δ18O; B – area of arid territories) vs. time.
13
aridization was followed by increase of PL in all plant groups not only in angiosperms as
whole.
THE NUCLEAR DNA CONTENT AND THE LEAF
STRUCTURAL–FUNCTIONAL TRAITS
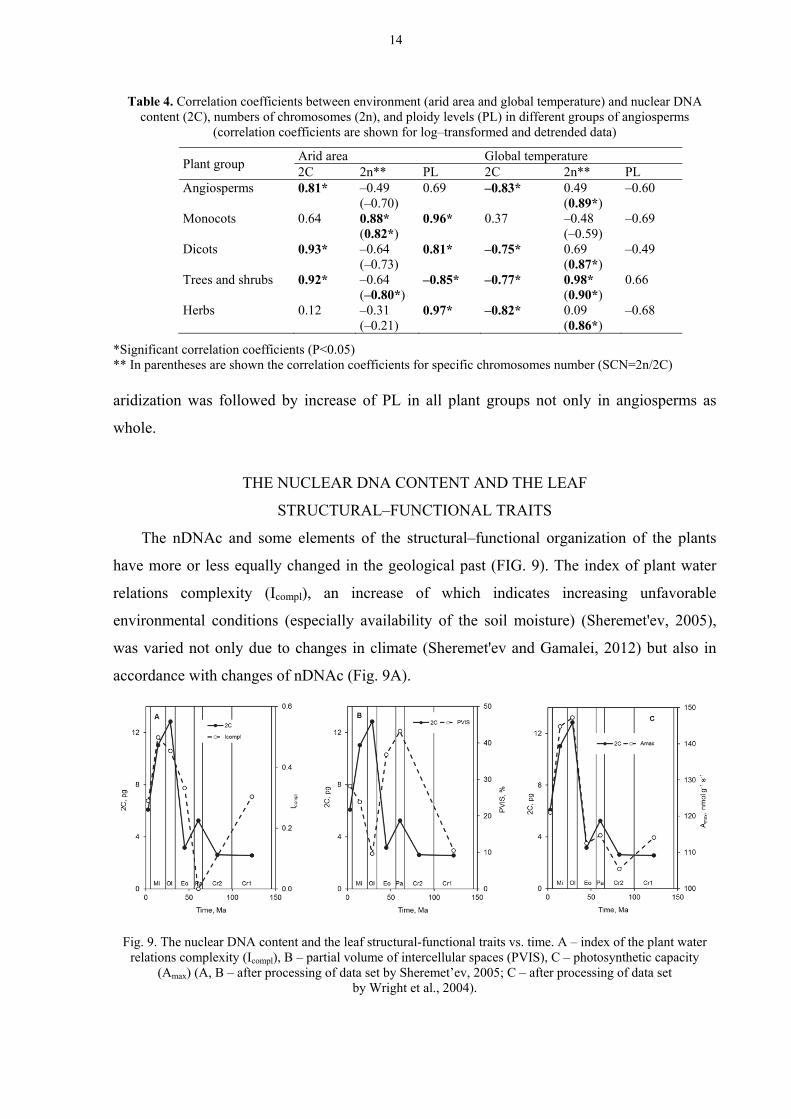
The nDNAc and some elements of the structural–functional organization of the plants
have more or less equally changed in the geological past (FIG. 9). The index of plant water
relations complexity (Icompl), an increase of which indicates increasing unfavorable
environmental conditions (especially availability of the soil moisture) (Sheremet'ev, 2005),
was varied not only due to changes in climate (Sheremet'ev and Gamalei, 2012) but also in
accordance with changes of nDNAc (Fig. 9A).
Fig. 9. The nuclear DNA content and the leaf structural-functional traits vs. time. A – index of the plant water
relations complexity (Icompl), B – partial volume of intercellular spaces (PVIS), C – photosynthetic capacity (Amax) (A, B – after processing of data set by Sheremet’ev, 2005; C – after processing of data set
by Wright et al., 2004).
Table 4. Correlation coefficients between environment (arid area and global temperature) and nuclear DNA content (2C), numbers of chromosomes (2n), and ploidy levels (PL) in different groups of angiosperms
(correlation coefficients are shown for log–transformed and detrended data)
Plant group Arid area Global temperature 2C 2n** PL 2C 2n** PL
Angiosperms 0.81* –0.49 (–0.70)
0.69 –0.83* 0.49 (0.89*)
–0.60
Monocots 0.64 0.88* (0.82*)
0.96* 0.37 –0.48 (–0.59)
–0.69
Dicots 0.93* –0.64 (–0.73)
0.81* –0.75* 0.69 (0.87*)
–0.49
Trees and shrubs 0.92* –0.64 (–0.80*)
–0.85* –0.77* 0.98* (0.90*)
0.66
Herbs 0.12 –0.31 (–0.21)
0.97* –0.82* 0.09 (0.86*)
–0.68
*Significant correlation coefficients (P<0.05) ** In parentheses are shown the correlation coefficients for specific chromosomes number (SCN=2n/2C)
14
Partial volume of intercellular spaces in leaves (PVIS) (lower values of this trait indicate
strengthening of the xeromorphic organization of plants) was minimal in the most arid epochs
of the Cretaceous–Cenozoic (Early Cretaceous, Oligocene, Miocene) and was maximal in the
more humid epochs (Paleocene, Eocene) (Fig. 9B).
Photosynthetic capacity (Amax) of plants (data set by Wright et al., 2004) was closely
correlated with the nDNAc (Fig. 9C) during Cretaceous–Cenozoic.
DISCUSSION
The available literatures discuss two options for the possible consequences of the genome
increase: 1) an increase in functional capacity, 2) widening of the adaptive potentials of the
species (Grime et al., 1985; Vinogradov, 2001, 2003; Gregory, 2001, 2002).
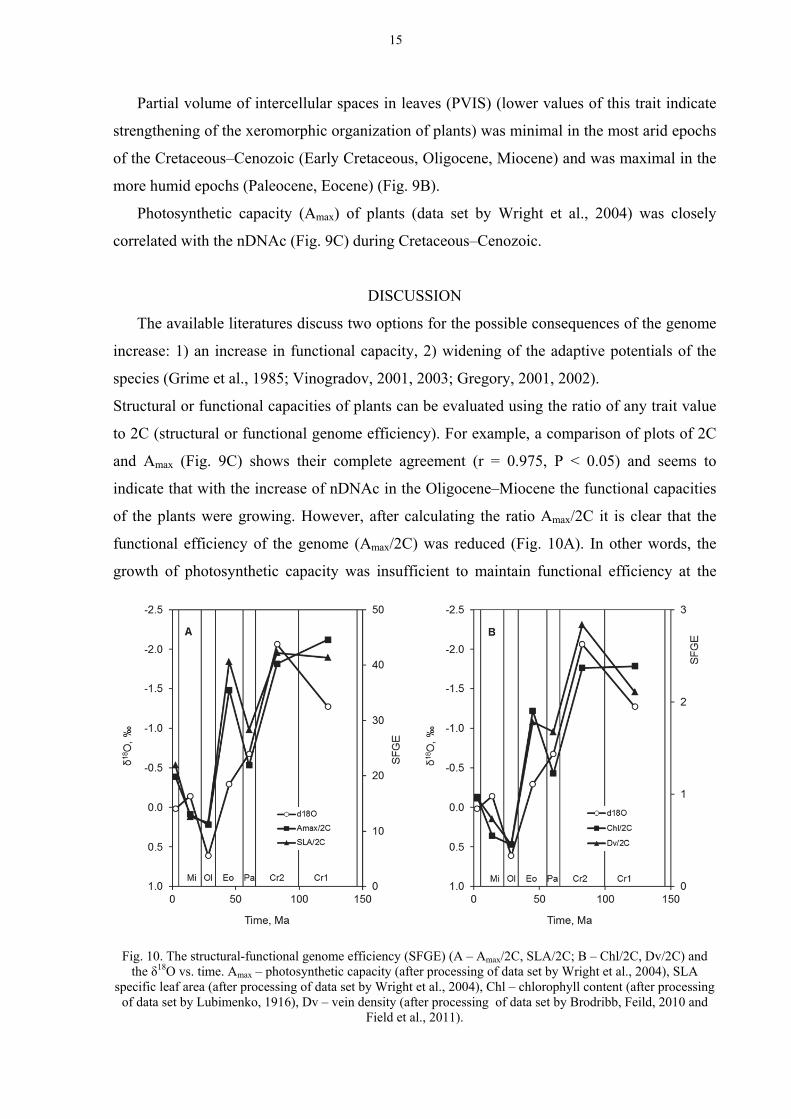
Structural or functional capacities of plants can be evaluated using the ratio of any trait value
to 2C (structural or functional genome efficiency). For example, a comparison of plots of 2C
and Amax (Fig. 9C) shows their complete agreement (r = 0.975, P < 0.05) and seems to
indicate that with the increase of nDNAc in the Oligocene–Miocene the functional capacities
of the plants were growing. However, after calculating the ratio Amax/2C it is clear that the
functional efficiency of the genome (Amax/2C) was reduced (Fig. 10A). In other words, the
growth of photosynthetic capacity was insufficient to maintain functional efficiency at the
Fig. 10. The structural-functional genome efficiency (SFGE) (A – Amax/2C, SLA/2C; B – Chl/2C, Dv/2C) and
the δ18O vs. time. Amax – photosynthetic capacity (after processing of data set by Wright et al., 2004), SLA specific leaf area (after processing of data set by Wright et al., 2004), Chl – chlorophyll content (after processing
of data set by Lubimenko, 1916), Dv – vein density (after processing of data set by Brodribb, Feild, 2010 and Field et al., 2011).
15
original level. The decrease of ratio
Amax/2C in the Cretaceous–Cenozoic was
closely correlated with the decrease in the
global temperature (Fig. 10A) (r = 0.813,
P < 0.05). It seems that this global
temperature trend was the cause of
insufficient increase in Amax in response
to increased nDNAc.
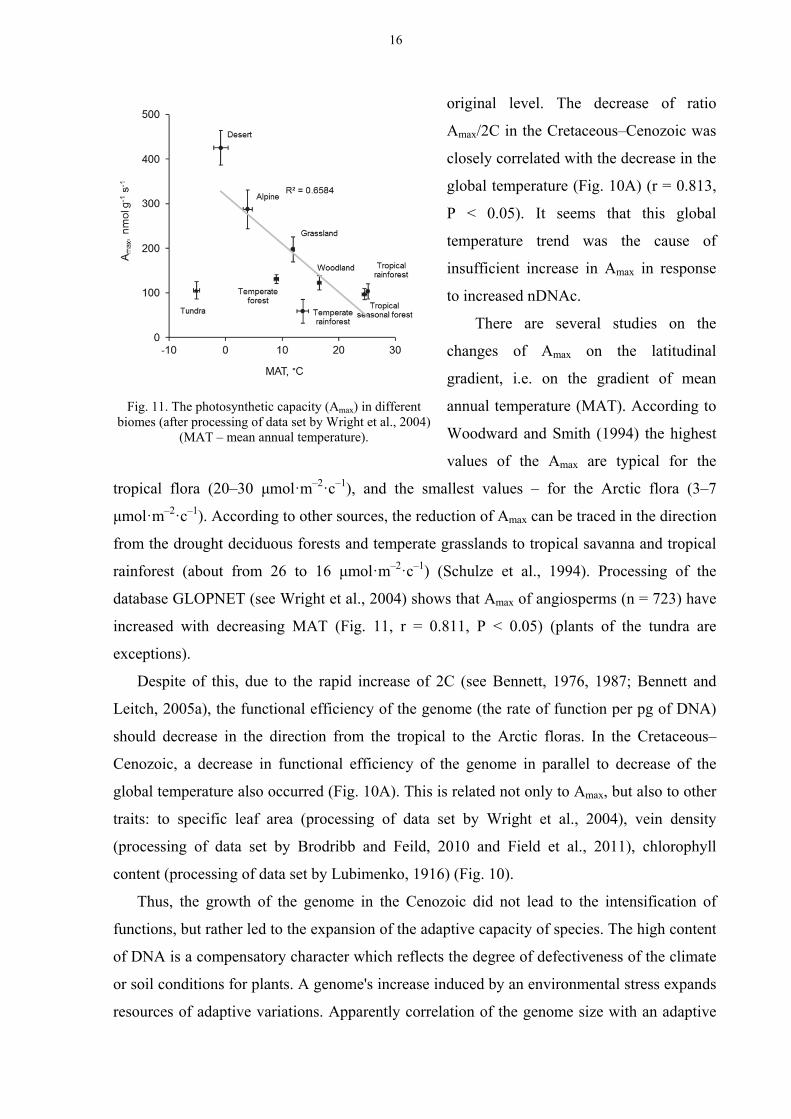
There are several studies on the
changes of Amax on the latitudinal
gradient, i.e. on the gradient of mean
annual temperature (MAT). According to
Woodward and Smith (1994) the highest
values of the Amax are typical for the
tropical flora (20–30 μmol·m–2·с–1), and the smallest values – for the Arctic flora (3–7
μmol·m–2·с–1). According to other sources, the reduction of Amax can be traced in the direction
from the drought deciduous forests and temperate grasslands to tropical savanna and tropical
rainforest (about from 26 to 16 μmol·m–2·с–1) (Schulze et al., 1994). Processing of the
database GLOPNET (see Wright et al., 2004) shows that Amax of angiosperms (n = 723) have
increased with decreasing MAT (Fig. 11, r = 0.811, P < 0.05) (plants of the tundra are
exceptions).
Despite of this, due to the rapid increase of 2C (see Bennett, 1976, 1987; Bennett and
Leitch, 2005а), the functional efficiency of the genome (the rate of function per pg of DNA)
should decrease in the direction from the tropical to the Arctic floras. In the Cretaceous–
Cenozoic, a decrease in functional efficiency of the genome in parallel to decrease of the
global temperature also occurred (Fig. 10A). This is related not only to Amax, but also to other
traits: to specific leaf area (processing of data set by Wright et al., 2004), vein density
(processing of data set by Brodribb and Feild, 2010 and Field et al., 2011), chlorophyll
content (processing of data set by Lubimenko, 1916) (Fig. 10).
Thus, the growth of the genome in the Cenozoic did not lead to the intensification of
functions, but rather led to the expansion of the adaptive capacity of species. The high content
of DNA is a compensatory character which reflects the degree of defectiveness of the climate
or soil conditions for plants. A genome's increase induced by an environmental stress expands
resources of adaptive variations. Apparently correlation of the genome size with an adaptive
Fig. 11. The photosynthetic capacity (Amax) in different
biomes (after processing of data set by Wright et al., 2004) (MAT – mean annual temperature).
16
potential is a peculiar property not only of vascular plants (Bennett and Leitch, 2005a, b;
Knight et al., 2005), but also of other eukaryotes (Vinogradov, 1995, 1997, 1999; Gregory,
2001, 2002).
Growth of nuclear DNA content can be considered as one of the effective tools of an
adaptogenesis. Herbaceous plants of the Neogene possessed, an order of magnitude larger
genome size, and had a much broader ecological range than woody plants of the Paleogene.
Herbs and shrubs turned out to be less specialized than the trees. They were able to grow in
those climates, where the trees had no place. Herbal biomes ousted the forests over large areas
in Neogene due to less demands to the environment. If the general trend of climate changes
can be defined as a stepwise cooling, then at each stage, the growth of the genome size and
the partial reset of the structural and functional specialization can be predicted.
ACKNOWLEDGEMENTS
This work was supported by a research grant from “The Russian Foundation for Basic
Research” (10–04–01165–a).
17
REFERENCES
Akhmetiev MA. 2004. Globe climate in Palaeocene and Eocene according to data of
paleobotany. In: Semikhatov MA, Chumakov NM, eds. Climate in the epochs of major
biosphere transformations. Moscow: Nauka, 10–43 (In Russian).
Baack EJ, Rieseberg LH. 2007. A genomic view of introgression and hybrid speciation.
Current Opinion in Genetics & Development 17: 513-518.
Beaulieu JM, Leitch IJ, Knight CA. 2007a. Genome size evolution in relation to leaf
strategy and metabolic rates revisited. Annals of Botany 99: 495–505.
Beaulieu JM, Leitch IJ, Patel S, Pendharkar A, Knight CA. 2008. Genome size is a strong
predictor of cell size and stomatal density in angiosperms. New Phytologist 179: 975–986.
Beaulieu JM, Moles AT, Leitch IJ, Bennett MD, Dickie JB, Knight CA. 2007b.
Correlated evolution of genome size and seed mass. New Phytologist 173: 422–437.
Bennett MD. 1972. Nuclear DNA content and minimum generation time in herbaceous
plants. Proceedings of the Royal Society B: Biological Sciences 181: 109–135.
Bennett MD. 1976. DNA amount, latitude, and crop plant distribution. Environmental and
Experimental Botany 16: 93–108.
Bennett MD. 1987. Variations in genomic form in plants and its ecological implications. New
Phytologist 106: 177–200.
Bennett MD, Bhandol P, Leitch IJ. 2000. Nuclear DNA amounts in angiosperms and their
modern uses – 807 new estimates. Annals of Botany 86: 859–909.
Bennett MD, Leitch IJ. 1995. Nuclear DNA amounts in angiosperms. Annals of Botany 76:
113–176.
Bennett MD, Leitch IJ. 1997. Nuclear DNA amounts in angiosperms – 583 new estimates.
Annals of Botany 80: 169–196.
Bennett MD, Leitch IJ. 2005a. Nuclear DNA amounts in angiosperms: progress, problems
and prospects. Annals of Botany 95: 45–90.
Bennett MD, Leitch IJ. 2005b. Plant DNA C–values database (release 4.0, Oct. 2005):
http://www.kew.org/cvalues/.
Bennett MD, Leitch IJ, Hanson L. 1998. DNA amounts in two samples of angiosperm
weeds. Annals of Botany 82 (Suppl. 1): 121–134.
Bennett MD, Smith JB. 1976. Nuclear DNA amounts in angiosperms. Philosophical
Transactions of the Royal Society B: Biological Sciences 274: 227–274.
18
Bennett MD, Smith JB. 1991. Nuclear DNA amounts in angiosperms. Philosophical
Transactions of the Royal Society B: Biological Sciences 334: 309–345.
Bennett MD, Smith JB, Heslop-Harrison JS. 1982. Nuclear DNA amounts in angiosperms.
Proceedings of the Royal Society B: Biological Sciences 216: 179–199.
Benton MJ. 1993. The Fossil Record 2. London: Chapman & Hall.
Bharathan G, Lambert G, Galbraith DW. 1994. Nuclear DNA content of monocotyledons
and related taxa. American Journal of Botany 81: 381-386.
Brodribb TJ, Feild TS. 2010. Leaf hydraulic evolution led a surge in leaf photosynthetic
capacity during early angiosperm diversification. Ecology Letters 13: 175-83.
Chen ZJ. 2007. Genetic and epigenetic mechanisms for gene expression and phenotypic
variation in plant polyploids. Annual Review of Plant Biology 58: 377-406.
Chumakov NM. 2004a. The general review of late Mesozoic climate and events. In:
Semikhatov MA, Chumakov NM, eds. Climate in the epochs of major biosphere
transformations. Moscow: Nauka, 44–51 (In Russian).
Chumakov NM. 2004b. Climate zonality and climate of the Cretaceous. In: Semikhatov MA,
Chumakov NM, eds. Climate in the epochs of major biosphere transformations. Moscow:
Nauka, 105–123 (In Russian).
Collinson ME, Boulter MC, Holmes PL. 1993. Magnoliophyta (Angiospermae). In: Benton
MJ, ed. The Fossil Record 2. London: Chapman & Hall, 809-841.
Crepet WL, Nixon KC, Gandolfo MA. 2004. Fossil evidence and phylogeny: the age of
major angiosperm clades based on mesofossil and macrofossil evidence from Cretaceous
deposits. American Journal of Botany 91: 1666-1682.
Cui L, Wall PK, Leebens-Mack JH, Lindsay BG, Soltis DE, Doyle JJ, Soltis PS, Carlson
JE, Arumuganathan K, Barakat A, Albert VA, Ma H, dePamphilis CW. 2006.
Widespread genome duplications throughout the history of flowering plants. Genome
Research 16: 738-749.
Daghlian CP. 1981. A review of the fossil record of monocotyledons. Botanical Review 47:
517-555.
De Bodt S, Maere S, Van de Peer Y. 2005. Genome duplication and the origin of
angiosperms. Trends in Ecology & Evolution 20: 591-597.
DeConto RM, Pollard D. 2003a. Rapid Cenozoic glaciation of Antarctica induced by
declining atmospheric CO2. Nature 421: 245-249.
19
DeConto RM, Pollard D. 2003b. A coupled climate-ice sheet modeling approach to the
Early Cenozoic history of the Antarctic ice sheet. Palaeogeography, Palaeoclimatology,
Palaeoecology 198: 39-52.
Doyle JJ, Egan AN. 2010. Dating the origins of polyploidy events. New Phytologist 186: 73-
85.
Doyle JJ, Flagel LE, Paterson AH, Rapp RA, Soltis DE, Soltis PS, Wendel JF. 2008.
Evolutionary genetics of genome merger and doubling in plants. Annual Review of
Genetics 42: 443–461.
Eldrett JS, Harding IC, Wilson PA, Butler E, Roberts AP. 2007. Continental ice in
Greenland during the Eocene and Oligocene. Nature 446: 176-179.
Feild TS, Brodribb TJ, Iglesias A, Chatelet DS, Baresch A, Upchurch GR, Gomez B,
Mohr BA, Coiffard C, Kvacek J, Jaramillo C. 2011. Fossil evidence for Cretaceous
escalation in angiosperm leaf vein evolution. Proceedings of the National Academy of
Sciences 108: 8363-8366.
Francis D, Davies MS, Barlow PW. 2008. A strong nucleotypic effect on the cell cycle
regardless of ploidy level. Annals of Botany 101: 747–757.
Franks PJ, Freckleton RP, Beaulieu JM, Leitch IJ, Beerling DJ. 2012. Megacycles of
atmospheric carbon dioxide concentration correlate with fossil plant genome size.
Philosophical Transactions of the Royal Society B: Biological Sciences 367: 556-564.
Gregory TR. 2001. The bigger the C-Value, the larger the cell: genome size and red blood
cell size in vertebrates. Blood Cells, Molecules, and Diseases 27: 830-843.
Gregory TR. 2002. A bird's-eye view of the C-value enigma: genome size, cell size, and
metabolic rate in the class aves. Evolution 56: 121-130.
Gregory TR. 2005. The C-value enigma in plants and animals: a review of parallels and an
appeal for partnership. Annals of Botany 95: 133–146.
Greilhuber J, Doležel J. 2009. 2C or not 2C: a closer look at cell nuclei and their DNA
content. Chromosoma 118: 391–400.
Greilhuber J, Doležel J, Lysák MA, Bennett MD. 2005. The origin, evolution and proposed
stabilization of the terms ‘genome size’ and ‘C–value’ to describe nuclear DNA contents.
Annals of Botany 95: 255–260.
Grime JP. 1998. Plant classification for ecological purposes: is there a role for genome size?
Annals of Botany 82 (Suppl. 1): 117–120.
Grime JP, Shacklock JML, Band SR. 1985. Nuclear DNA contents, shoot phenology and
species co-existence in a limestone grassland community. New Phytologist 100: 435-445.
20
Grimsson F, Zetter R, Hofmann CC. 2011. Lythrum and Peplis from the Late Cretaceous
and Cenozoic of North America and Eurasia: New evidence suggesting early
diversification within the Lythraceae. American Journal of Botany 98: 1801-1815.
Hanson L, Boyd A, Johnson MAT, Bennett MD. 2005. First nuclear DNA C–values for 18
eudicot families. Annals of Botany 96: 1315–1320.
Hanson L, Brown RL, Boyd A, Johnson MAT, Bennett MD. 2003. First nuclear DNA C–
values for 28 angiosperm genera. Annals of Botany 91: 31–38.
Hanson L, McMahon KA, Johnson MAT, Bennett MD. 2001a. First nuclear DNA C–
values for 25 angiosperm families. Annals of Botany 87: 251–258.
Hanson L, McMahon KA, Johnson MAT, Bennett MD. 2001b. First nuclear DNA C–
values for another 25 angiosperm families. Annals of Botany 88: 851–858.
Hegarty MJ, Hiscock SJ. 2005. Hybrid speciation in plants: new insights from molecular
studies. New Phytologist 165: 411-423.
Herendeen PS, Crane PR. 1995. The fossil history of the monocotyledons. In: Rudall PJ,
Cribb PJ, Cutler DF, Humphries CJ, eds. Monocotyledons: systematics and evolution.
Volume 1. Kew: Royal Botanic Gardens, 1-21.
Hill T, Lewicki P. 2007. STATISTICS: Methods and Applications. Tulsa, Oklahoma, USA:
StatSoft.
Jackson S, Chen ZJ. 2010. Genomic and expression plasticity of polyploidy. Current
Opinion in Plant Biology 13: 153-159.
Jovtcheva G, Schuberta V, Meistera A, Barowa M, Schuberta I. 2006. Nuclear DNA
content and nuclear and cell volume are positively correlated in angiosperms. Cytogenetic
and Genome Research 114: 77–82.
Kennett JP. 1977. Cenozoic evolution of Antarctic glaciation, the Circum-Antarctic Ocean,
and their impact on global paleoceanography. Journal of Geophysical Research 82: 3843-
3860.
Knight CA, Beaulieu JM. 2008. Genome size scaling through phenotype space. Annals of
Botany 101: 759–766.
Knight CA, Molinari NA, Petrov DA. 2005. The large genome constraint hypothesis:
evolution, ecology and phenotype. Annals of Botany 95: 177-190.
Lear CH, Elderfield H, Wilson PA. 2000. Cenozoic deep-sea temperatures and global ice
volumes from Mg/Ca in benthic foraminiferal calcite. Science 287: 269-272.
21
Leitch IJ, Chase MW, Bennett MD. 1998. Phylogenetic analysis of DNA C-values provides
evidence for a small ancestral genome size in flowering plants. Annals of Botany 82
(Suppl. 1): 85-94.
Leitch IJ, Soltis DE, Soltis PS, Bennett MD. 2005. Evolution of DNA amounts across land
plants (Embryophyta). Annals of Botany 95: 207–217.
Lubimenko VN. 1916. On transformations of plastid pigments in living plant tissue.
Petrograd: Imperial Academy of Sciences (In Russian).
Mallet J. 2007. Hybrid speciation. Nature 446: 279-283.
Mallet J. 2008. Hybridization, ecological races and the nature of species: empirical evidence
for the ease of speciation. Philosophical Transactions of the Royal Society B: Biological
Sciences 363: 2971-2986.
Martínez-Millán M. 2010. Fossil record and age of the Asteridae. Botanical Review 76: 83-
135.
Masterson J. 1994. Stomatal Size in Fossil Plants: Evidence for Polyploidy in Majority of
Angiosperms. Science 264: 421-424.
Middleton N, Thomas D. 1997. World atlas of desertification, 2nd edn. London: Arnold.
Moran K, Backman J, Brinkhuis H, Clemens SC, Cronin T, Dickens GR, Eynaud F,
Gattacceca J, Jakobsson M, Jordan RW, Kaminski M, King J, Koc N, Krylov A,
Martinez N, Matthiessen J, McInroy D, Moore TC, Onodera J, O'Regan M, Pälike H,
Rea B, Rio D, Sakamoto T, Smith DC, Stein R, St John K, Suto I, Suzuki N,
Takahashi K, Watanabe M, Yamamoto M, Farrell J, Frank M, Kubik P, Jokat W,
Kristoffersen Y. 2006. The Cenozoic palaeoenvironment of the Arctic Ocean. Nature 441:
601-605.
Muller J. 1981. Fossil pollen record of extant angiosperms. Botanical Review 47: 1–142.
Nikolaev SD, Oskina NS, Blyum NS, Bubenshchikova NV. 1998. Neogene–Quaternary
variations of the ‘Pole–Equator’ temperature gradient of the surface oceanic waters in the
North Atlantic and North Pacific. Global and Planetary Change 18: 85–111.
Ogg JG, Ogg G, Gradstein FM. 2008. The concise geologic time scale. New York:
Cambridge University Press.
Patrushev LI, Minkevich IG. 2006. Noncoding sequences of the eukaryotic genome as an
additional protection og genes from chemical mutagens. Bioorganic Chemistry 32: 408–
413 (In Russian).
Patrushev LI, Minkevich IG. 2007. The problem of the size of eukaryotic genomes.
Progress of biological chemistry 47: 293–370 (In Russian).
22
Pollard D, DeConto RM. 2003. Antarctic ice and sediment flux in the Oligocene simulated
by a climate-ice sheet-sediment model. Palaeogeography, Palaeoclimatology,
Palaeoecology 198: 53–67.
Pollard D, DeConto RM. 2005. Hysteresis in Cenozoic Antarctic ice-sheet variations.
Global and Planetary Change 45: 9–21.
Prokopowich CD, Gregory TR, Crease TJ. 2003. The correlation between rDNA copy
number and genome size in eukaryotes. Genome 46: 48–50.
Reeves G, Francis D, Davies MS, Rogers HJ, Hodkinson TR. 1998. Genome size is
negatively correlated with altitude in natural populations of Dactylis glomerata. Annals of
Botany 82 (Suppl. 1): 99–105.
Rieseberg LH, Willis JH. 2007. Plant Speciation. Science 317: 910–914.
Schulze E-D, Kelliher FM, Korner C, Lloyd J, Leuning R. 1994. Relationships among
maximum stomatal conductance, ecosystem surface conductance, carbon assimilation rate,
and plant nitrogen nutrition: A global ecology scaling exercise. Annual Review of Ecology
and Systematics 25: 629-660.
Scotese CR. 2003. PALEOMAP Project (http://www.scotese.com).
Sheremet’ev SN. 2005. Herbs on the soil moisture gradient (water relations and the
structural-functional organization). Moscow: KMK (In Russian).
Sheremet’ev SN, Gamalei YuV. 2012. Trends of the herbs ecological evolution. In:
Pontarotti P, ed. Evolutionary biology: Mechanisms and Trends. Berlin, Heidelberg:
Springer-Verlag, 189-212
Soltis PS, Soltis DE. 2009. The role of hybridization in plant speciation. Annual Review of
Plant Biology 60: 561–588.
Soltis DE, Soltis PS, Bennett MD, Leitch IJ. 2003. Evolution of genome size in the
angiosperms. American Journal of Botany 90: 1596–1603.
Song Zhi–chen, Wang Wei–ming, Huang Fei. 2004. Fossil pollen records of extant
angiosperms in China. Botanical Review 70: 425-458.
Suda J, Kyncl T, Freiová R. 2003. Nuclear DNA amounts in Macaronesian angiosperms.
Annals of Botany 92: 153–164.
Swift H. 1950. The constancy of desoxyribose nucleic acid in plant nuclei. Proceedings of the
National Academy of Sciences 36: 643–654.
Takhtajan AL. 2009. Flowering Plants. Netherlands: Springer.
Thomas CA. 1971. The genetic organization of chromosomes. Annual Review of Genetics 5:
237-256.
23
Tripati A, Backman J, Elderfield H, Ferretti P. 2005. Eocene bipolar glaciation associated
with global carbon cycle changes. Nature 436: 341-346.
Van de Peer Y, Fawcett JA, Proost S, Sterck L, Vandepoele K. 2009a. The flowering
world: a tale of duplications. Trends in Plant Science 14: 680-688.
Van de Peer Y, Maere S, Meyer A. 2009b. The evolutionary significance of ancient genome
duplications. Nature Reviews Genetics 10: 725-732.
Veizer J, Ala D, Azmy K, Bruckschen P, Buhl D, Bruhn F, Carden GAF, Diener A,
Ebneth S, Godderis Y, Jasper T, Korte C, Pawellek F, Podlaha OG, Strauss H. 1999. 87Sr/86Sr, δ18O and δ13C evolution of phanerozoic sea-water. Chemical Geology 161: 59-
88. WEB Update 2004 (http://mysite.science.uottawa.ca/jveizer/isotope_data/).
Vinogradov AE. 1995. Nucleotypic effect in homeotherms: body-mass-corrected basal
metabolic rate of mammals is related to genome size. Evolution 49: 1249-1259.
Vinogradov AE. 1997. Nucleotypic effect in homeotherms: body-mass independent resting
metabolic rate of passerine birds is related to genome size. Evolution 51: 220-225.
Vinogradov AE. 1999. Intron–genome size relationship on a large evolutionary scale.
Journal of Molecular Evolution 49: 376-384.
Vinogradov AE. 2001. Mirrored genome size distributions in monocot and dicot plants. Acta
biotheoretica 49: 43-51.
Vinogradov AE. 2003. Selfish DNA is maladaptive: evidence from the plant Red List.
Trends in Genetics 19: 609–614.
Wendel J, Doyle J. 2005. Polyploidy and evolution in plants. In: Henry RJ, ed. Plant
diversity and evolution. Genotypic and phenotypic variation in higher plants. Wallingford,
UK: CABI Publishing, 97-118.
Whitney KD, Ahern JR, Campbell LG, Albert LP, King MS. 2010. Patterns of
hybridization in plants. Perspectives in Plant Ecology, Evolution and Systematics 12: 175-
182.
Wing SL, Boucher LD. 1998. Ecological aspects of the Cretaceous flowering plant radiation.
Annual Review of Earth and Planetary Sciences 26: 379-421.
Wood TE, Takebayashi N, Barker MS, Mayrose I, Greenspoon PB, Rieseberg LH. 2009.
The frequency of polyploid speciation in vascular plants. Proceedings of the National
Academy of Sciences 106: 13875-13879.
Woodward FI, Smith TM. 1994. Predictions and measurements of the maximum
photosynthetic rate, Amax, at the global scale. In: Schulze E-D, Caldwell MM, eds.
24
Ecophysiology of Photosynthesis (Ecological studies: analysis and synthesis, vol. 100).
Berlin, Heidelberg: Springer-Verlag, 491–509.
Wright IJ, Reich PB, Westoby M, Ackerly DD, Baruch Z, Bongers FJJM, Cavender-
Bares J, Chapin T, Cornelissen JHC, Diemer M, Flexas J, Garnier E, Groom PK,
Gulias J, Hikosaka K, Lamont BB, Lee T, Lee W, Lusk C, Midgley JJ, Navas ML,
Niinements Ü, Oleksyn J, Osada N, Poorter H, Poot P, Prior L, Pyankov VI, Roumet
C, Thomas SC, Tjoelker MG, Veneklaas EJ, Villar R. 2004. The worldwide leaf
economics spectrum. Nature 428: 821–827.
Zachos J, Pagani M, Sloan L, Thomas E, Billups K. 2001. Trends, rhythms, and
aberrations in global climate 65 ma to present. Science 292: 686-693.
Zavada MS, Benson JM. 1987. First fossil evidence for the primitive angiosperm family
Lactoridaceae. American Journal of Botany 74: 1590-1594.
Zonneveld BJM, Leitch IJ, Bennett MD. 2005. First nuclear DNA amounts in more than
300 angiosperms. Annals of Botany 96: 229–244.
25


