Embed Size (px)
Citation preview
This article was downloaded by: [SLU Library]On: 15 January 2014, At: 01:56Publisher: RoutledgeInforma Ltd Registered in England and Wales Registered Number: 1072954 Registeredoffice: Mortimer House, 37-41 Mortimer Street, London W1T 3JH, UK
Landscape ResearchPublication details, including instructions for authors andsubscription information:http://www.tandfonline.com/loi/clar20
Trajectory Analysis of Forest CoverChange in the Tropical Dry Forest ofBurkina Faso, West AfricaIssa Ouedraogo a , Patrice Savadogo a b , Mulualem Tigabu a , RoyCole c , Per Christer Oden a & Jean-Marie Ouadba ba Southern Swedish Forest Research Centre, Swedish University ofAgricultural Sciences (SLU) , Swedenb Centre National de la Recherche Scientifique et Technologique,Institut de l'Environnement et de Recherches Agricoles ,Ouagadougou , Burkina Fasoc Geography and Planning Department , Grand Valley StateUniversity , USAPublished online: 23 May 2011.
To cite this article: Issa Ouedraogo , Patrice Savadogo , Mulualem Tigabu , Roy Cole , PerChrister Oden & Jean-Marie Ouadba (2011) Trajectory Analysis of Forest Cover Change in theTropical Dry Forest of Burkina Faso, West Africa, Landscape Research, 36:3, 303-320, DOI:10.1080/01426397.2011.564861
To link to this article: http://dx.doi.org/10.1080/01426397.2011.564861
PLEASE SCROLL DOWN FOR ARTICLE
Taylor & Francis makes every effort to ensure the accuracy of all the information (the“Content”) contained in the publications on our platform. However, Taylor & Francis,our agents, and our licensors make no representations or warranties whatsoever as tothe accuracy, completeness, or suitability for any purpose of the Content. Any opinionsand views expressed in this publication are the opinions and views of the authors,and are not the views of or endorsed by Taylor & Francis. The accuracy of the Contentshould not be relied upon and should be independently verified with primary sourcesof information. Taylor and Francis shall not be liable for any losses, actions, claims,proceedings, demands, costs, expenses, damages, and other liabilities whatsoever orhowsoever caused arising directly or indirectly in connection with, in relation to or arisingout of the use of the Content.
This article may be used for research, teaching, and private study purposes. Anysubstantial or systematic reproduction, redistribution, reselling, loan, sub-licensing,
systematic supply, or distribution in any form to anyone is expressly forbidden. Terms &Conditions of access and use can be found at http://www.tandfonline.com/page/terms-and-conditions
Dow
nloa
ded
by [S
LU L
ibra
ry] a
t 01:
56 1
5 Ja
nuar
y 20
14
Trajectory Analysis of Forest CoverChange in the Tropical Dry Forestof Burkina Faso, West Africa
ISSA OUEDRAOGO*, PATRICE SAVADOGO*{,MULUALEM TIGABU*, ROY COLE{, PER CHRISTER ODEN* &JEAN-MARIE OUADBA{*Southern Swedish Forest Research Centre, Swedish University of Agricultural Sciences (SLU), Sweden{Centre National de la Recherche Scientifique et Technologique, Institut de l’Environnement et deRecherches Agricoles, Ouagadougou, Burkina Faso {Geography and Planning Department, Grand ValleyState University, USA
ABSTRACT Forest cover decline is one of the most important environmental issues in the tropics.The present study was carried out in Burkina Faso, West Africa, and aimed at assessing thetrajectories of forest cover change and measuring landscape metrics of the trajectory classes inorder to better understand the processes of change. Landsat and ASTER images acquired over aperiod of 30 years were used for cover change detection and the Fragstats package was used tocompute landscape metrics with five unifying change classes. Results showed a substantialincrease in cropland with concurrent decline in forest cover. Deforestation represented 63% of thePercentage of Landscape (PLAND) in 2006, while reforestation accounted for only 28%. Bothof these classes had high Normalized Landscape Shape Index (NLSI) values, indicating that theywere present as scattered small patches. The old cultivation (30-year permanent cropland) wasaggregated (IJI ! 0) while deforestation exhibited highly interspersed patches. The old forestand old cultivation presented lower Area Weighted Fractal Dimension Index (FRAC_AM), butdeforestation and reforestation had the higher FRAC_AM. These results confirmed that therewas a high level of deforestation and fragmentation in southern Burkina Faso and justify the needfor a proper management plan to ensure the sustainable use of forest resources.
KEY WORDS: Landscape metrics, deforestation, dry forest, land cover change, Fragstats
1. Introduction
Forest cover decline is one of the most important environmental issues in the tropicswhere forest resources contribute significantly to the national economies and providethe majority of domestic energy and housing requirements (Geist & Lambin, 2001).However, in most tropical African countries, little effort has been made to efficientlyestimate forest extent and stocking to support the social, economic and environ-mental objectives related to forestry (FAO, 2006).
Correspondence Address: Issa Ouedraogo, Southern Swedish Forest Research Centre, Tropical Silvicultureand Seed Laboratory, Swedish University of Agricultural Sciences (SLU), PO Box 49, SE-230 53 Alnarp,Sweden. Email: [email protected]; [email protected]
Landscape Research,Vol. 36, No. 3, 303–320, June 2011
ISSN 0142-6397 Print/1469-9710 Online/11/030303-18 ! 2011 Landscape Research Group LtdDOI: 10.1080/01426397.2011.564861
Dow
nloa
ded
by [S
LU L
ibra
ry] a
t 01:
56 1
5 Ja
nuar
y 20
14
Remotely sensed data have been used for forest cover change studies for decades(Zhou et al., 2008a, 2008b) and the availability of multi-temporal imagery has madelong-term land cover change analysis possible (Achard et al., 2002; Braimoh &Vlek, 2005; Focardi et al., 2008; Lambin et al., 2003; Ouedraogo et al., 2009). Thesestudies have demonstrated that remote sensing is an efficient tool for detectingchanges and for interpreting the causes of deforestation and the impacts of suchchanges at different spatial scales. Monitoring land cover change is also perceivedas one of the most important contributions of remote sensing technology to thestudy of global ecological and environmental change (Southworth et al., 2002).Some researchers (Borak et al., 2000; Crews-Meyer, 2004; Zhou et al., 2008a) haveused this technology to analyze landscape patterns and showed that patterns ofdeforestation and reforestation most frequently relate to human impacts and areextremely complex, due to changes occurring across multiple temporal and spatialscales.
The spatial pattern of landscape change is an important indicator ofenvironmental monitoring and has been subjected to intensive investigations(Nagendra et al., 2004; Zhou et al., 2008b). Methods for studying the spatial patternof forest cover change include the measurement of landscape metrics of categoricaltrajectories derived from the multi-temporal images. These methods were recentlydeveloped to trace paths of land cover change for a given location (Zhou et al.,2008b). Examples of such studies include Mertens and Lambin (2000) in Cameroon,Petit et al. (2001) in Zambia, and Liu and Zhou (2004) in China. Zhou et al. (2008b)reported that the majority of spatial pattern analyses are based on the ‘snapshot’method, which attempts to determine the track of spatial patterns and hence inferthe ecological processes (Crews-Meyer, 2004; Southworth et al., 2002). However,this approach does not provide sufficient information to understand the causes ofland cover change. Mertens and Lambin (2000) suggested that landscape processescan be better measured and understood through an examination of the change ofthe trajectory patterns, rather than the ‘snapshot’ approach. Therefore, Zhou et al.(2008b) analyzed the spatial patterns of land cover change trajectories in northwestChina using the landscape metrics measurement approach and derivedaccurately ranked factors, both natural and human, driving land cover change inthe region. Their investigation extended the scope of categorical change trajectoryanalysis.
We used the recently improved landscape metrics measurement approach ofZhou et al. (2008b) to better understand the processes of change in the dry forestecosystem of southern Burkina Faso. We highlighted the importance of analyzinglandscape metrics measurement as an addition to the static land cover/land useclasses that are more commonly studied in southern Burkina Faso (e.g.Ouedraogo, 2006b; Ouedraogo et al., 2009; Pare et al., 2008). Our analysis wasperformed for To District of Sissili Province in southern Burkina Faso, thought tobe experiencing important forest losses conjointly due to uncontrolled farmlandexpansion, extensive wood extraction, overgrazing and bushfires (Ouedraogoet al., 2009). The basic approach was to derive and interpret spatial patternmetrics of multi-epoch trajectories of forest cover change using high resolutionimagery from different sources and background over a monitoring time frame of30 years.
304 I. Ouedraogo et al.
Dow
nloa
ded
by [S
LU L
ibra
ry] a
t 01:
56 1
5 Ja
nuar
y 20
14
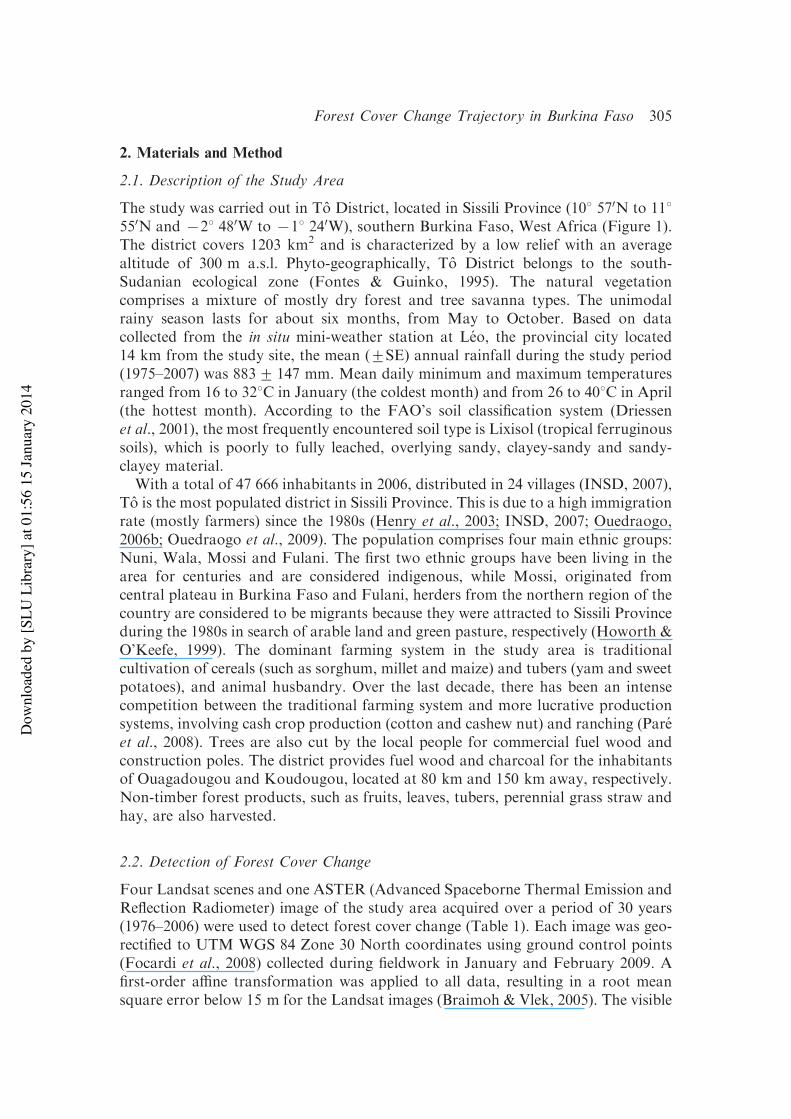
2. Materials and Method
2.1. Description of the Study Area
The study was carried out in To District, located in Sissili Province (108 570N to 118550N and 728 480W to 718 240W), southern Burkina Faso, West Africa (Figure 1).The district covers 1203 km2 and is characterized by a low relief with an averagealtitude of 300 m a.s.l. Phyto-geographically, To District belongs to the south-Sudanian ecological zone (Fontes & Guinko, 1995). The natural vegetationcomprises a mixture of mostly dry forest and tree savanna types. The unimodalrainy season lasts for about six months, from May to October. Based on datacollected from the in situ mini-weather station at Leo, the provincial city located14 km from the study site, the mean (+SE) annual rainfall during the study period(1975–2007) was 883+ 147 mm. Mean daily minimum and maximum temperaturesranged from 16 to 328C in January (the coldest month) and from 26 to 408C in April(the hottest month). According to the FAO’s soil classification system (Driessenet al., 2001), the most frequently encountered soil type is Lixisol (tropical ferruginoussoils), which is poorly to fully leached, overlying sandy, clayey-sandy and sandy-clayey material.
With a total of 47 666 inhabitants in 2006, distributed in 24 villages (INSD, 2007),To is the most populated district in Sissili Province. This is due to a high immigrationrate (mostly farmers) since the 1980s (Henry et al., 2003; INSD, 2007; Ouedraogo,2006b; Ouedraogo et al., 2009). The population comprises four main ethnic groups:Nuni, Wala, Mossi and Fulani. The first two ethnic groups have been living in thearea for centuries and are considered indigenous, while Mossi, originated fromcentral plateau in Burkina Faso and Fulani, herders from the northern region of thecountry are considered to be migrants because they were attracted to Sissili Provinceduring the 1980s in search of arable land and green pasture, respectively (Howorth &O’Keefe, 1999). The dominant farming system in the study area is traditionalcultivation of cereals (such as sorghum, millet and maize) and tubers (yam and sweetpotatoes), and animal husbandry. Over the last decade, there has been an intensecompetition between the traditional farming system and more lucrative productionsystems, involving cash crop production (cotton and cashew nut) and ranching (Pareet al., 2008). Trees are also cut by the local people for commercial fuel wood andconstruction poles. The district provides fuel wood and charcoal for the inhabitantsof Ouagadougou and Koudougou, located at 80 km and 150 km away, respectively.Non-timber forest products, such as fruits, leaves, tubers, perennial grass straw andhay, are also harvested.
2.2. Detection of Forest Cover Change
Four Landsat scenes and one ASTER (Advanced Spaceborne Thermal Emission andReflection Radiometer) image of the study area acquired over a period of 30 years(1976–2006) were used to detect forest cover change (Table 1). Each image was geo-rectified to UTM WGS 84 Zone 30 North coordinates using ground control points(Focardi et al., 2008) collected during fieldwork in January and February 2009. Afirst-order affine transformation was applied to all data, resulting in a root meansquare error below 15 m for the Landsat images (Braimoh & Vlek, 2005). The visible
Forest Cover Change Trajectory in Burkina Faso 305
Dow
nloa
ded
by [S
LU L
ibra
ry] a
t 01:
56 1
5 Ja
nuar
y 20
14
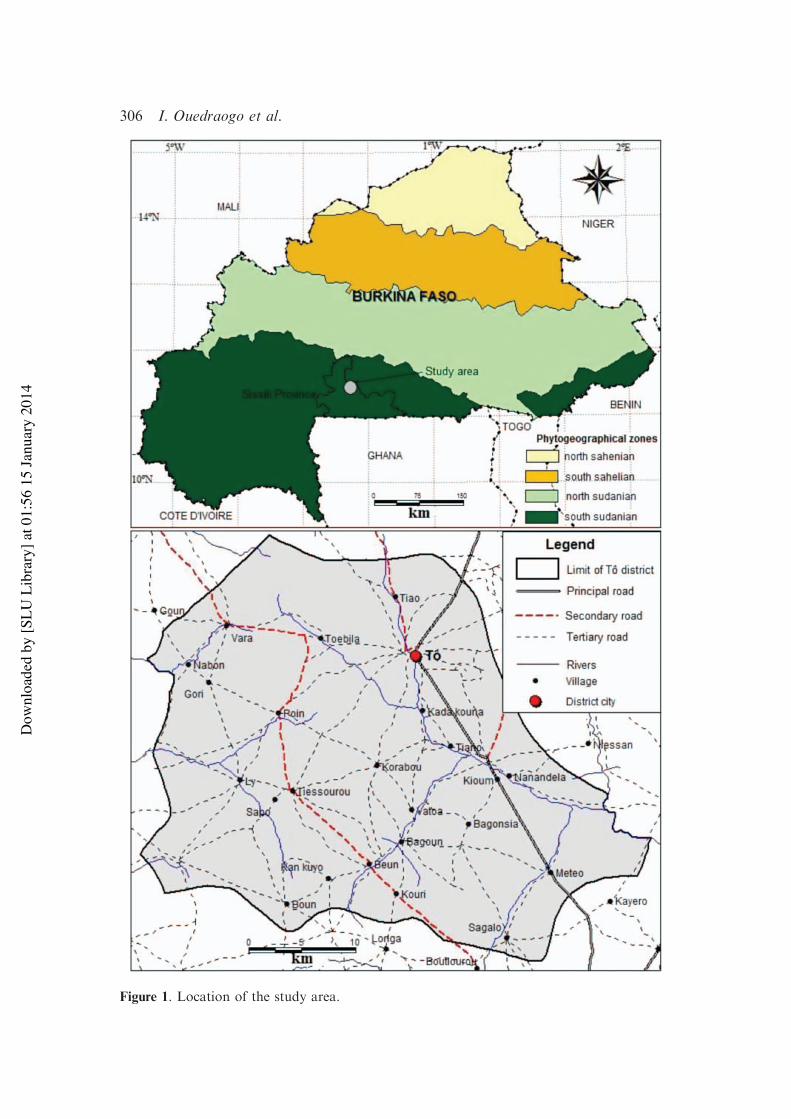
Figure 1. Location of the study area.
306 I. Ouedraogo et al.
Dow
nloa
ded
by [S
LU L
ibra
ry] a
t 01:
56 1
5 Ja
nuar
y 20
14
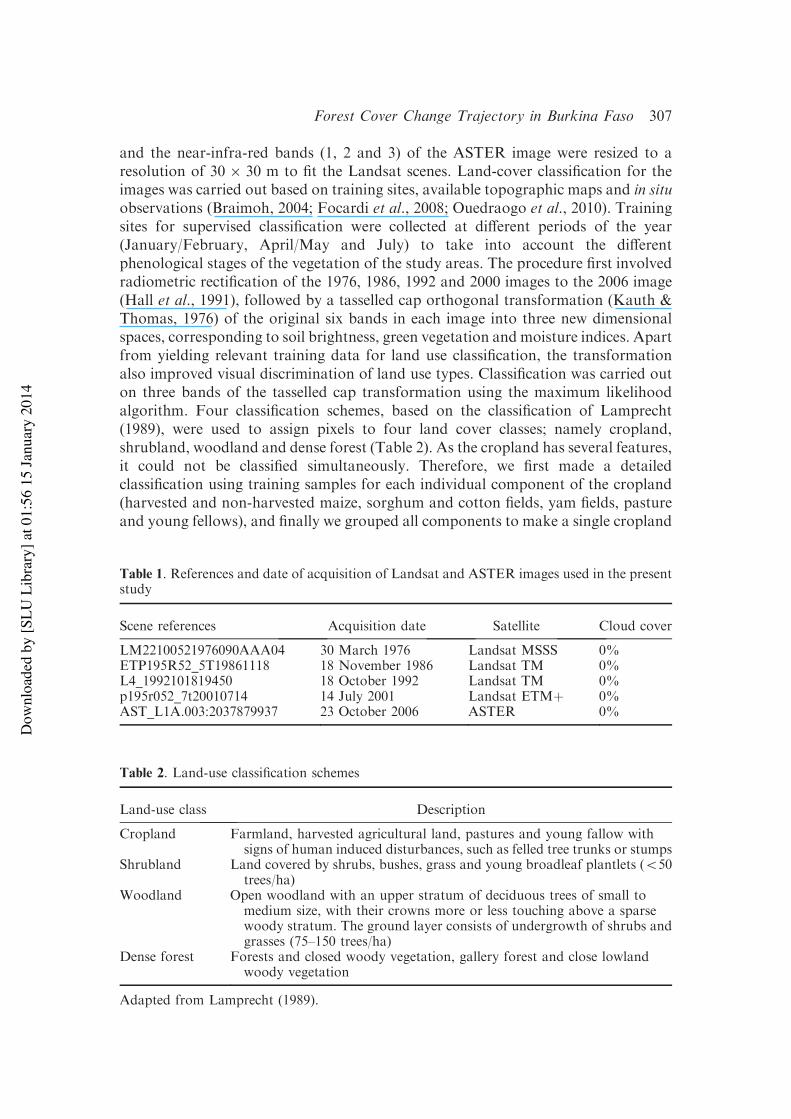
and the near-infra-red bands (1, 2 and 3) of the ASTER image were resized to aresolution of 306 30 m to fit the Landsat scenes. Land-cover classification for theimages was carried out based on training sites, available topographic maps and in situobservations (Braimoh, 2004; Focardi et al., 2008; Ouedraogo et al., 2010). Trainingsites for supervised classification were collected at different periods of the year(January/February, April/May and July) to take into account the differentphenological stages of the vegetation of the study areas. The procedure first involvedradiometric rectification of the 1976, 1986, 1992 and 2000 images to the 2006 image(Hall et al., 1991), followed by a tasselled cap orthogonal transformation (Kauth &Thomas, 1976) of the original six bands in each image into three new dimensionalspaces, corresponding to soil brightness, green vegetation and moisture indices. Apartfrom yielding relevant training data for land use classification, the transformationalso improved visual discrimination of land use types. Classification was carried outon three bands of the tasselled cap transformation using the maximum likelihoodalgorithm. Four classification schemes, based on the classification of Lamprecht(1989), were used to assign pixels to four land cover classes; namely cropland,shrubland, woodland and dense forest (Table 2). As the cropland has several features,it could not be classified simultaneously. Therefore, we first made a detailedclassification using training samples for each individual component of the cropland(harvested and non-harvested maize, sorghum and cotton fields, yam fields, pastureand young fellows), and finally we grouped all components to make a single cropland
Table 1. References and date of acquisition of Landsat and ASTER images used in the presentstudy
Scene references Acquisition date Satellite Cloud cover
LM22100521976090AAA04 30 March 1976 Landsat MSSS 0%ETP195R52_5T19861118 18 November 1986 Landsat TM 0%L4_1992101819450 18 October 1992 Landsat TM 0%p195r052_7t20010714 14 July 2001 Landsat ETMþ 0%AST_L1A.003:2037879937 23 October 2006 ASTER 0%
Table 2. Land-use classification schemes
Land-use class Description
Cropland Farmland, harvested agricultural land, pastures and young fallow withsigns of human induced disturbances, such as felled tree trunks or stumps
Shrubland Land covered by shrubs, bushes, grass and young broadleaf plantlets (550trees/ha)
Woodland Open woodland with an upper stratum of deciduous trees of small tomedium size, with their crowns more or less touching above a sparsewoody stratum. The ground layer consists of undergrowth of shrubs andgrasses (75–150 trees/ha)
Dense forest Forests and closed woody vegetation, gallery forest and close lowlandwoody vegetation
Adapted from Lamprecht (1989).
Forest Cover Change Trajectory in Burkina Faso 307
Dow
nloa
ded
by [S
LU L
ibra
ry] a
t 01:
56 1
5 Ja
nuar
y 20
14
cover class. All image processing was done using ENVI (ENVI Version 4.2,Copyright 2005, Research Systems, Inc. 4990 Pearl East Circle) and the vectorizeddata were processed with MapInfo 7.5 (MapInfo Professional Version 7.5, ReleaseBuild 23, Copyright 1985–2003 MapInfo Corporation).
2.3. Accuracy Assessment
Stratified random sampling methods were used to select, at different periods of theyear, reference sample points for classification accuracy assessment. Three hundredand twelve sample points were generated and transferred to a Geographic InformationSystems (GIS) program, in which they were overlaid with the classified images, as wellas the high-resolution visible and near-infra-red bands (1, 2 and 3) of the ASTERimage (Zhou et al., 2008a, 2008b). The high-resolution visible and near-infra-red bandsof the ASTER image served as a basis for the assessment of the accuracy together withhistorical panchromatic aerial photographs of the study area. The in situ datacollection is basically the ground truthing: delineation of homogeneous training sitesfor the supervised classification as well as the collection of sampling points for the geo-rectification of the images and the accuracy assessment. This was done using highlyprecise GPS, sample historical aerial photographs from 1976, 1986, 1991 and 2001.The topographic map helped to find the sites, and also contributed to fix the geo-rectification issues of the images, where mean root square after the geometricalcorrection is below half of their pixel resolution (15 m for Landsat and 7.5 m forASTER). The coordinates of reference points for the geo-rectification was measured inJanuary/February, but training sites for supervised classification and sampling pointsfor the accuracy assessment were collected at different periods of the year (January/February, April/May and July) to take into account the different phenological stagesof the vegetation of the study areas. A total of 312 sample points were randomlyselected for accuracy assessment, of which 15 points showed discrepancy between thepresent and historical images (satellite images and panchromatic aerial photographs).These points were clarified by interviewing elderly people (n¼ 30) living and farmingaround these sample points. The information obtained from them was used to correctthe land use classes at a particular time. The sample points (312) were then used tocompute the error matrix for each time period and land use class following theprocedure of Lillesand et al. (2008) and Congalton and Green (2009).
2.4. Trajectory Analysis
The term ‘trajectory of forest cover change’ refers here to successions of land covertypes for a given sample unit over more than two observations (Liu & Zhou, 2004;Mertens & Lambin, 2000; Petit et al., 2001; Zhou et al., 2008a, 2008b). The numberof trajectories (T) is given by T¼ nx where n is the number of land cover classes and xthe number of observations. In the present study, three time series (1976, 1992 and2006) were used to analyze forest cover trajectories. To simplify the analysis, eachland cover class was coded as C for cropland, S for shrubland, W for woodland andD for dense forest land. Thus, the three observations (time series) and the four landcover classes resulted in 64 trajectories (Figure 2). A forest cover change trajectorycan be specified for instance as C-C-C, meaning that the land was found to be
308 I. Ouedraogo et al.
Dow
nloa
ded
by [S
LU L
ibra
ry] a
t 01:
56 1
5 Ja
nuar
y 20
14
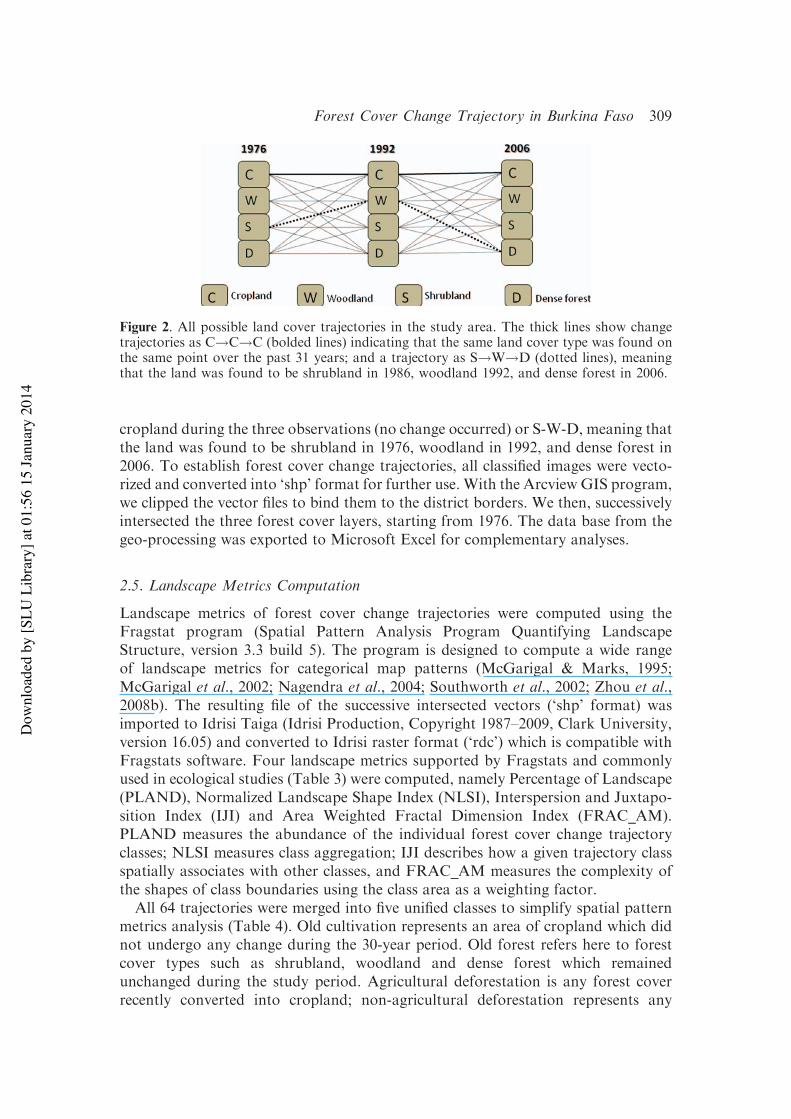
cropland during the three observations (no change occurred) or S-W-D, meaning thatthe land was found to be shrubland in 1976, woodland in 1992, and dense forest in2006. To establish forest cover change trajectories, all classified images were vecto-rized and converted into ‘shp’ format for further use. With the Arcview GIS program,we clipped the vector files to bind them to the district borders. We then, successivelyintersected the three forest cover layers, starting from 1976. The data base from thegeo-processing was exported to Microsoft Excel for complementary analyses.
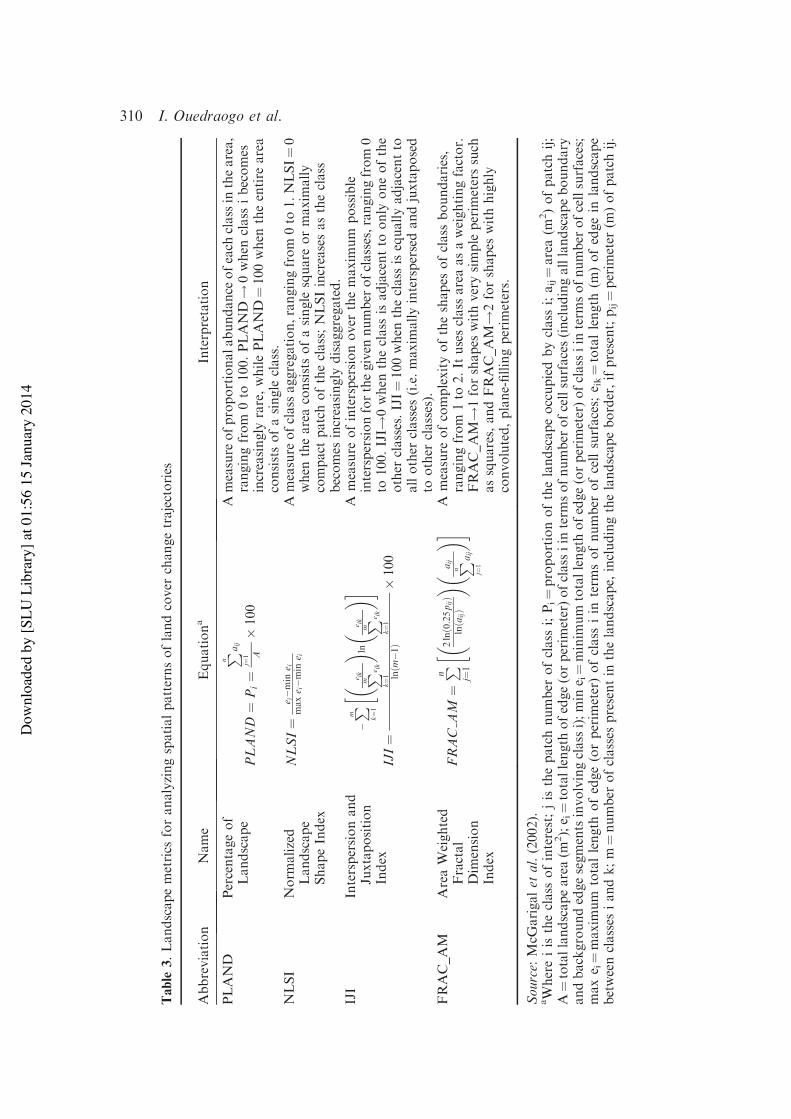
2.5. Landscape Metrics Computation
Landscape metrics of forest cover change trajectories were computed using theFragstat program (Spatial Pattern Analysis Program Quantifying LandscapeStructure, version 3.3 build 5). The program is designed to compute a wide rangeof landscape metrics for categorical map patterns (McGarigal & Marks, 1995;McGarigal et al., 2002; Nagendra et al., 2004; Southworth et al., 2002; Zhou et al.,2008b). The resulting file of the successive intersected vectors (‘shp’ format) wasimported to Idrisi Taiga (Idrisi Production, Copyright 1987–2009, Clark University,version 16.05) and converted to Idrisi raster format (‘rdc’) which is compatible withFragstats software. Four landscape metrics supported by Fragstats and commonlyused in ecological studies (Table 3) were computed, namely Percentage of Landscape(PLAND), Normalized Landscape Shape Index (NLSI), Interspersion and Juxtapo-sition Index (IJI) and Area Weighted Fractal Dimension Index (FRAC_AM).PLAND measures the abundance of the individual forest cover change trajectoryclasses; NLSI measures class aggregation; IJI describes how a given trajectory classspatially associates with other classes, and FRAC_AM measures the complexity ofthe shapes of class boundaries using the class area as a weighting factor.
All 64 trajectories were merged into five unified classes to simplify spatial patternmetrics analysis (Table 4). Old cultivation represents an area of cropland which didnot undergo any change during the 30-year period. Old forest refers here to forestcover types such as shrubland, woodland and dense forest which remainedunchanged during the study period. Agricultural deforestation is any forest coverrecently converted into cropland; non-agricultural deforestation represents any
Figure 2. All possible land cover trajectories in the study area. The thick lines show changetrajectories as C!C!C (bolded lines) indicating that the same land cover type was found onthe same point over the past 31 years; and a trajectory as S!W!D (dotted lines), meaningthat the land was found to be shrubland in 1986, woodland 1992, and dense forest in 2006.
Forest Cover Change Trajectory in Burkina Faso 309
Dow
nloa
ded
by [S
LU L
ibra
ry] a
t 01:
56 1
5 Ja
nuar
y 20
14
Table
3.Lan
dscap
emetrics
foran
alyzingspatialpatternsoflandcoverchan
getrajectories
Abbreviation
Nam
eEquationa
Interpretation
PLAND
Percentage
of
Lan
dscap
ePLAND¼
Pi¼
Pn j¼1
a ij
A$100
Ameasure
ofproportional
abundan
ceofeach
classin
thearea,
rangingfrom
0to
100.
PLAND!
0when
classibecomes
increasinglyrare,whilePLAND¼100when
theentire
area
consistsofasingleclass.
NLSI
Norm
alized
Lan
dscap
eShap
eIndex
NLSI¼
e i%min
e imax
e i%min
e iA
measure
ofclassag
gregation,rangingfrom
0to
1.NLSI¼0
when
thearea
consistsofasinglesquareormaxim
ally
compactpatch
oftheclass;NLSIincreasesas
theclass
becomes
increasinglydisaggregated.
IJI
Interspersionan
dJuxtap
osition
Index
IJI¼
%Pm k¼1
!"e ik
Pm k¼1
e ik
#ln
"e ik
Pm k¼1
e ik
#$
lnðm%1Þ
$100
Ameasure
ofinterspersionoverthemaxim
um
possible
interspersionforthegivennumber
ofclasses,rangingfrom
0to
100.
IJI!
0when
theclassisad
jacentto
only
oneofthe
other
classes.IJI¼100when
theclassisequally
adjacentto
allother
classes(i.e.maxim
ally
interspersedan
djuxtap
osed
toother
classes).
FRAC_A
MAreaWeigh
ted
Fractal
Dim
ension
Index
FRAC
AM¼Pn j¼
1
!"2lnð0:25p ijÞ
lnða
ijÞ
#"
a ij
Pn j¼1
a ij#$
Ameasure
ofcomplexity
oftheshap
esofclassboundaries,
rangingfrom
1to
2.It
usesclassarea
asaweigh
tingfactor.
FRAC_A
M!1forshap
eswithvery
simple
perim
eterssuch
assquares,an
dFRAC_A
M!2forshap
eswithhighly
convo
luted,plane-fillingperim
eters.
Source:
McG
arigal
etal.(200
2).
aWhereiis
theclassofinterest;jis
thepatch
number
ofclassi;Pi¼proportionofthelandscap
eoccupiedbyclassi;a ij¼area
(m2)ofpatch
ij;
A¼totallandscap
earea
(m2);e i¼totallengthofedge
(orperim
eter)ofclassiin
term
sofnumber
ofcellsurfaces
(includingalllandscap
eboundary
andbackgroundedge
segm
entsinvo
lvingclassi);min
e i¼minim
um
totallengthofedge
(orperim
eter)ofclassiin
term
sofnumber
ofcellsurfaces;
max
e i¼maxim
um
totallengthofedge
(orperim
eter)ofclassiin
term
sofnumber
ofcellsurfaces;e ik¼totallength(m
)ofedge
inlandscap
ebetweenclassesian
dk;m¼number
ofclassespresentin
thelandscap
e,includingthelandscap
eborder,ifpresent;pij¼perim
eter
(m)ofpatch
ij.
310 I. Ouedraogo et al.
Dow
nloa
ded
by [S
LU L
ibra
ry] a
t 01:
56 1
5 Ja
nuar
y 20
14
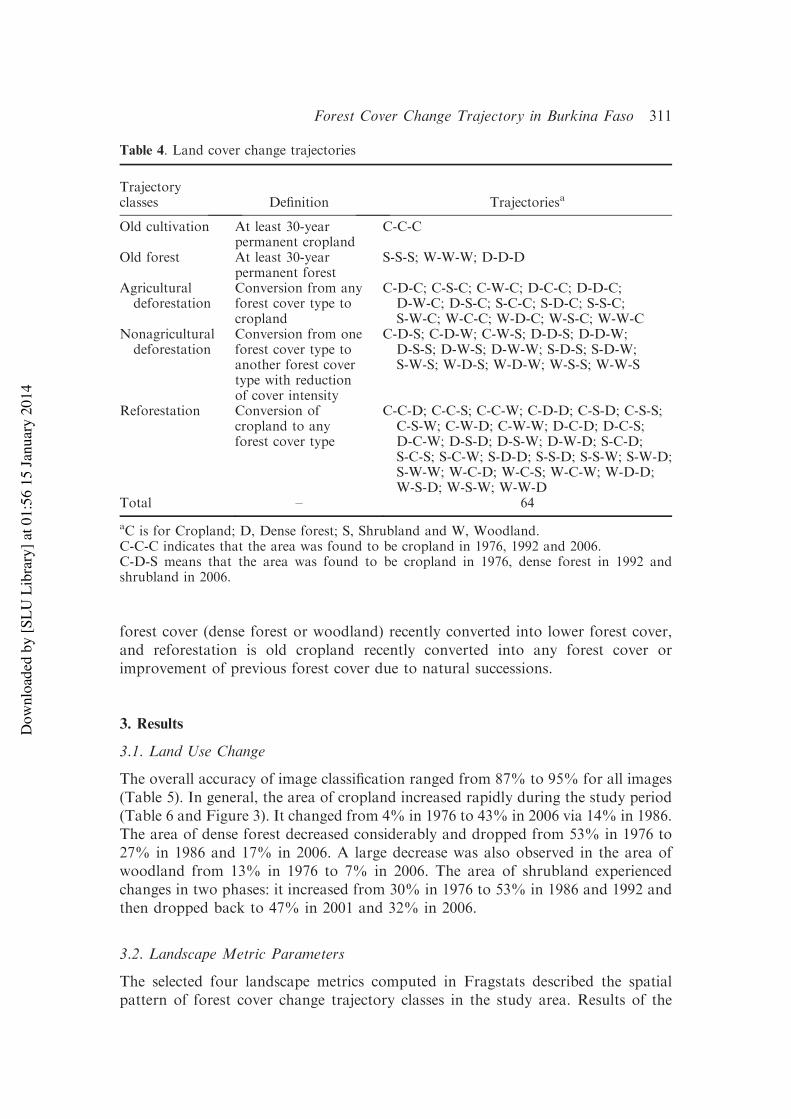
forest cover (dense forest or woodland) recently converted into lower forest cover,and reforestation is old cropland recently converted into any forest cover orimprovement of previous forest cover due to natural successions.
3. Results
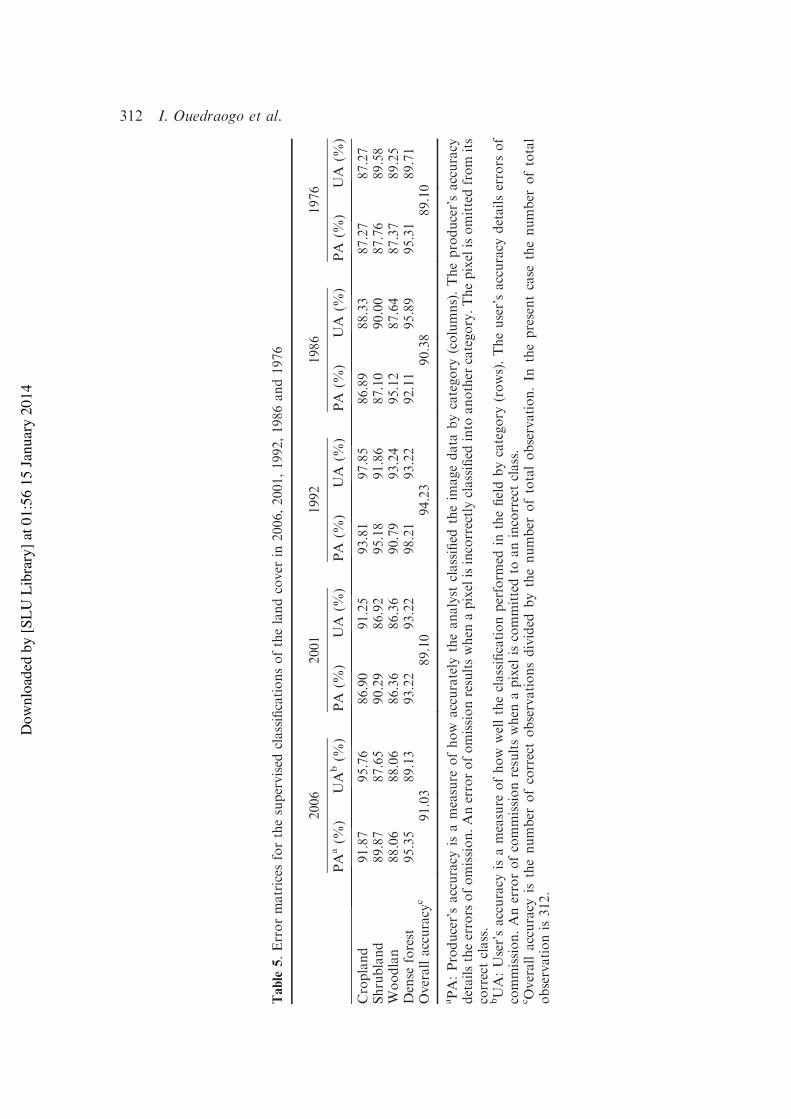
3.1. Land Use Change
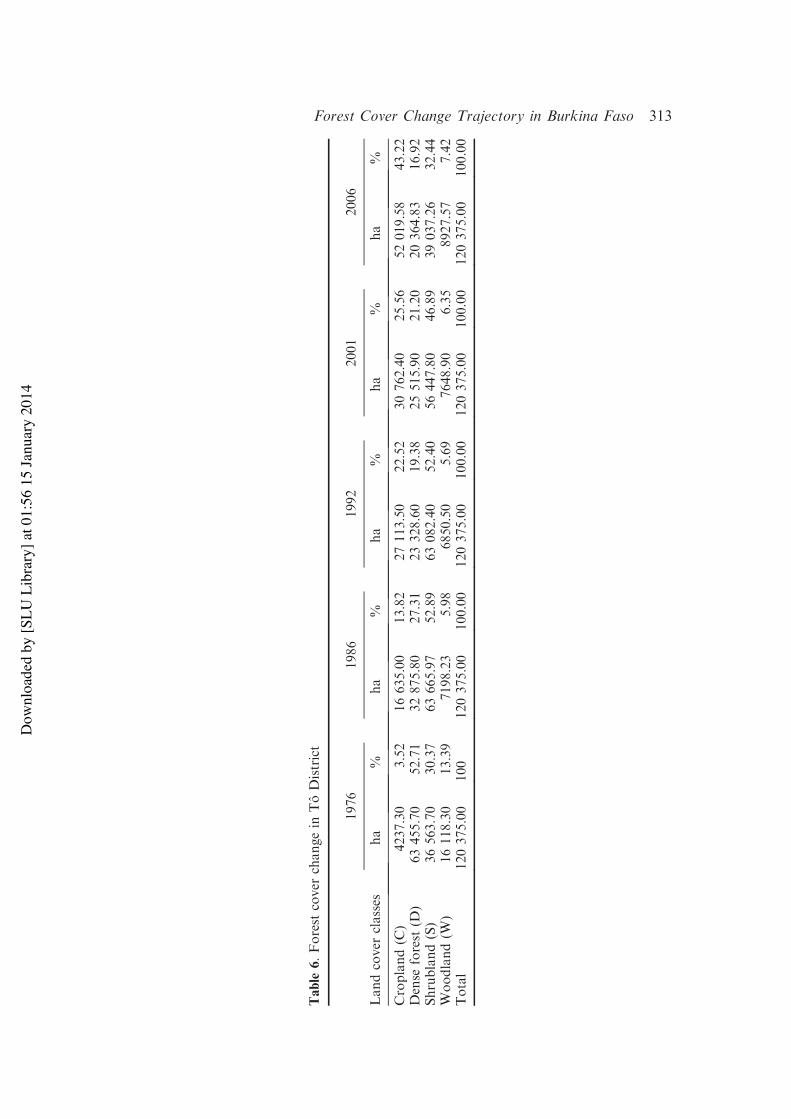
The overall accuracy of image classification ranged from 87% to 95% for all images(Table 5). In general, the area of cropland increased rapidly during the study period(Table 6 and Figure 3). It changed from 4% in 1976 to 43% in 2006 via 14% in 1986.The area of dense forest decreased considerably and dropped from 53% in 1976 to27% in 1986 and 17% in 2006. A large decrease was also observed in the area ofwoodland from 13% in 1976 to 7% in 2006. The area of shrubland experiencedchanges in two phases: it increased from 30% in 1976 to 53% in 1986 and 1992 andthen dropped back to 47% in 2001 and 32% in 2006.
3.2. Landscape Metric Parameters
The selected four landscape metrics computed in Fragstats described the spatialpattern of forest cover change trajectory classes in the study area. Results of the
Table 4. Land cover change trajectories
Trajectoryclasses Definition Trajectoriesa
Old cultivation At least 30-yearpermanent cropland
C-C-C
Old forest At least 30-yearpermanent forest
S-S-S; W-W-W; D-D-D
Agriculturaldeforestation
Conversion from anyforest cover type tocropland
C-D-C; C-S-C; C-W-C; D-C-C; D-D-C;D-W-C; D-S-C; S-C-C; S-D-C; S-S-C;S-W-C; W-C-C; W-D-C; W-S-C; W-W-C
Nonagriculturaldeforestation
Conversion from oneforest cover type toanother forest covertype with reductionof cover intensity
C-D-S; C-D-W; C-W-S; D-D-S; D-D-W;D-S-S; D-W-S; D-W-W; S-D-S; S-D-W;S-W-S; W-D-S; W-D-W; W-S-S; W-W-S
Reforestation Conversion ofcropland to anyforest cover type
C-C-D; C-C-S; C-C-W; C-D-D; C-S-D; C-S-S;C-S-W; C-W-D; C-W-W; D-C-D; D-C-S;D-C-W; D-S-D; D-S-W; D-W-D; S-C-D;S-C-S; S-C-W; S-D-D; S-S-D; S-S-W; S-W-D;S-W-W; W-C-D; W-C-S; W-C-W; W-D-D;W-S-D; W-S-W; W-W-D
Total – 64
aC is for Cropland; D, Dense forest; S, Shrubland and W, Woodland.C-C-C indicates that the area was found to be cropland in 1976, 1992 and 2006.C-D-S means that the area was found to be cropland in 1976, dense forest in 1992 andshrubland in 2006.
Forest Cover Change Trajectory in Burkina Faso 311
Dow
nloa
ded
by [S
LU L
ibra
ry] a
t 01:
56 1
5 Ja
nuar
y 20
14
Table
5.Errormatricesforthesupervisedclassificationsofthelandcoverin
2006,2001,1992,1986
and1976
2006
2001
1992
1986
1976
PA
a(%
)UA
b(%
)PA
(%)
UA
(%)
PA
(%)
UA
(%)
PA
(%)
UA
(%)
PA
(%)
UA
(%)
Cropland
91.87
95.76
86.90
91.25
93.81
97.85
86.89
88.33
87.27
87.27
Shrubland
89.87
87.65
90.29
86.92
95.18
91.86
87.10
90.00
87.76
89.58
Woodlan
88.06
88.06
86.36
86.36
90.79
93.24
95.12
87.64
87.37
89.25
Dense
forest
95.35
89.13
93.22
93.22
98.21
93.22
92.11
95.89
95.31
89.71
Overallaccuracy
c91.03
89.10
94.23
90.38
89.10
aPA:Producer’saccuracy
isameasure
ofhow
accurately
thean
alystclassified
theim
agedatabycatego
ry(columns).Theproducer’saccuracy
detailstheerrors
ofomission.Anerrorofomissionresultswhen
apixelisincorrectlyclassified
into
another
catego
ry.Thepixelisomittedfrom
its
correctclass.
bUA:User’saccuracy
isameasure
ofhow
welltheclassificationperform
edin
thefieldbycatego
ry(rows).Theuser’saccuracy
details
errors
of
commission.Anerrorofcommissionresultswhen
apixel
iscommittedto
anincorrectclass.
c Overallaccuracy
isthenumber
ofcorrectobservationsdivided
bythenumber
oftotalobservation.In
thepresentcase
thenumber
oftotal
observationis312.
312 I. Ouedraogo et al.
Dow
nloa
ded
by [S
LU L
ibra
ry] a
t 01:
56 1
5 Ja
nuar
y 20
14
Table
6.Forest
coverchan
gein
ToDistrict
Lan
dcoverclasses
1976
1986
1992
2001
2006
ha
%ha
%ha
%ha
%ha
%
Cropland(C
)4237.30
3.52
16635.00
13.82
27113.50
22.52
30762.40
25.56
52019.58
43.22
Dense
forest
(D)
63455.70
52.71
32875.80
27.31
23328.60
19.38
25515.90
21.20
20364.83
16.92
Shrubland(S)
36563.70
30.37
63665.97
52.89
63082.40
52.40
56447.80
46.89
39037.26
32.44
Woodland(W
)16
118.30
13.39
7198.23
5.98
6850.50
5.69
7648.90
6.35
8927.57
7.42
Total
120375.00
100
120375.00
100.00
120375.00
100.00
120375.00
100.00
120375.00
100.00
Forest Cover Change Trajectory in Burkina Faso 313
Dow
nloa
ded
by [S
LU L
ibra
ry] a
t 01:
56 1
5 Ja
nuar
y 20
14
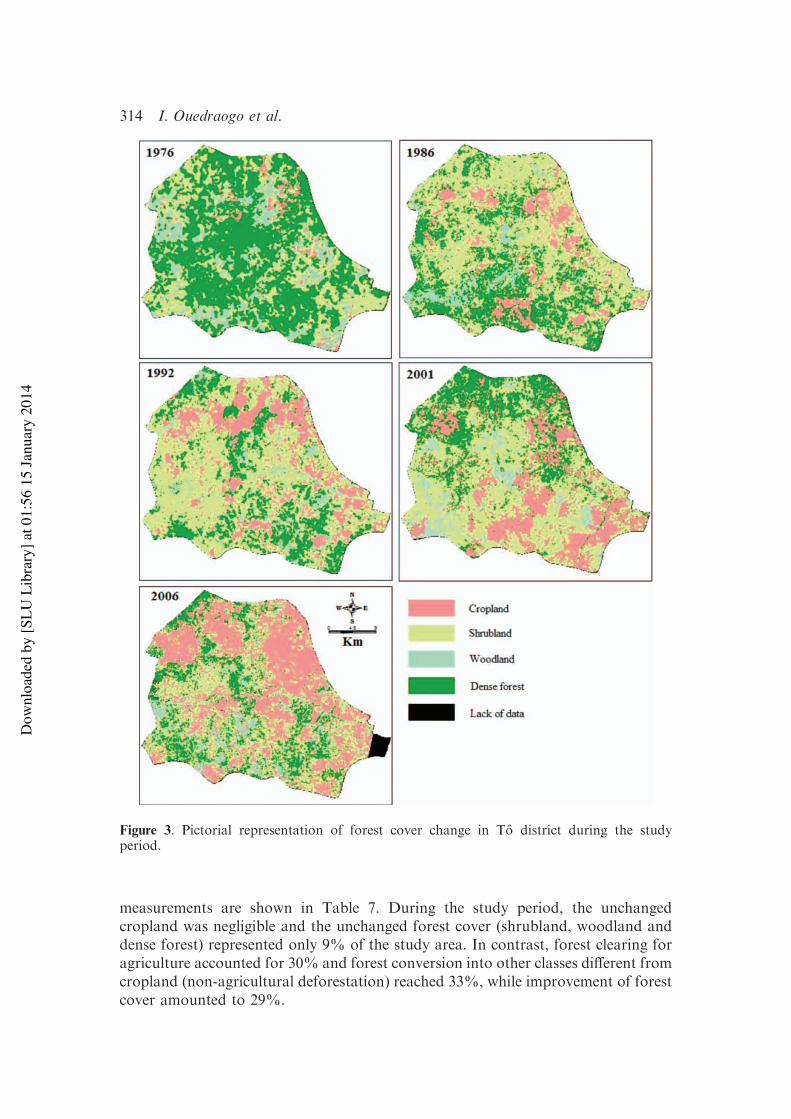
measurements are shown in Table 7. During the study period, the unchangedcropland was negligible and the unchanged forest cover (shrubland, woodland anddense forest) represented only 9% of the study area. In contrast, forest clearing foragriculture accounted for 30% and forest conversion into other classes different fromcropland (non-agricultural deforestation) reached 33%, while improvement of forestcover amounted to 29%.
Figure 3. Pictorial representation of forest cover change in To district during the studyperiod.
314 I. Ouedraogo et al.
Dow
nloa
ded
by [S
LU L
ibra
ry] a
t 01:
56 1
5 Ja
nuar
y 20
14
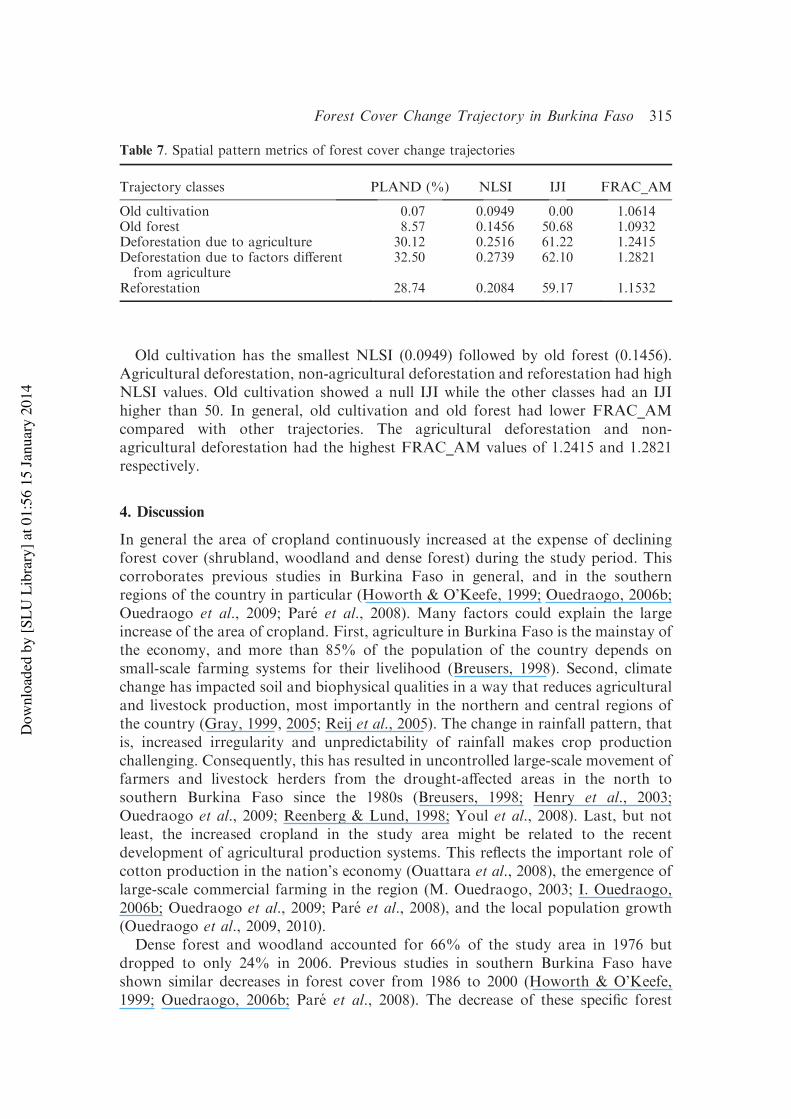
Old cultivation has the smallest NLSI (0.0949) followed by old forest (0.1456).Agricultural deforestation, non-agricultural deforestation and reforestation had highNLSI values. Old cultivation showed a null IJI while the other classes had an IJIhigher than 50. In general, old cultivation and old forest had lower FRAC_AMcompared with other trajectories. The agricultural deforestation and non-agricultural deforestation had the highest FRAC_AM values of 1.2415 and 1.2821respectively.
4. Discussion
In general the area of cropland continuously increased at the expense of decliningforest cover (shrubland, woodland and dense forest) during the study period. Thiscorroborates previous studies in Burkina Faso in general, and in the southernregions of the country in particular (Howorth & O’Keefe, 1999; Ouedraogo, 2006b;Ouedraogo et al., 2009; Pare et al., 2008). Many factors could explain the largeincrease of the area of cropland. First, agriculture in Burkina Faso is the mainstay ofthe economy, and more than 85% of the population of the country depends onsmall-scale farming systems for their livelihood (Breusers, 1998). Second, climatechange has impacted soil and biophysical qualities in a way that reduces agriculturaland livestock production, most importantly in the northern and central regions ofthe country (Gray, 1999, 2005; Reij et al., 2005). The change in rainfall pattern, thatis, increased irregularity and unpredictability of rainfall makes crop productionchallenging. Consequently, this has resulted in uncontrolled large-scale movement offarmers and livestock herders from the drought-affected areas in the north tosouthern Burkina Faso since the 1980s (Breusers, 1998; Henry et al., 2003;Ouedraogo et al., 2009; Reenberg & Lund, 1998; Youl et al., 2008). Last, but notleast, the increased cropland in the study area might be related to the recentdevelopment of agricultural production systems. This reflects the important role ofcotton production in the nation’s economy (Ouattara et al., 2008), the emergence oflarge-scale commercial farming in the region (M. Ouedraogo, 2003; I. Ouedraogo,2006b; Ouedraogo et al., 2009; Pare et al., 2008), and the local population growth(Ouedraogo et al., 2009, 2010).
Dense forest and woodland accounted for 66% of the study area in 1976 butdropped to only 24% in 2006. Previous studies in southern Burkina Faso haveshown similar decreases in forest cover from 1986 to 2000 (Howorth & O’Keefe,1999; Ouedraogo, 2006b; Pare et al., 2008). The decrease of these specific forest
Table 7. Spatial pattern metrics of forest cover change trajectories
Trajectory classes PLAND (%) NLSI IJI FRAC_AM
Old cultivation 0.07 0.0949 0.00 1.0614Old forest 8.57 0.1456 50.68 1.0932Deforestation due to agriculture 30.12 0.2516 61.22 1.2415Deforestation due to factors differentfrom agriculture
32.50 0.2739 62.10 1.2821
Reforestation 28.74 0.2084 59.17 1.1532
Forest Cover Change Trajectory in Burkina Faso 315
Dow
nloa
ded
by [S
LU L
ibra
ry] a
t 01:
56 1
5 Ja
nuar
y 20
14
covers could be due to the fact that southern Burkina Faso supplies wood andcharcoal to Ouagadougou and Koudougou, the two nearby cities that have a highdemand for wood and charcoal (Ouedraogo, 2006a, 2006b). Indeed, 90% of the 1.7million inhabitants of these cities (INSD, 2007) depend on wood and charcoal fortheir energy requirements (Kramer, 2002). This is extracted from dense forest andwoodland. Tree cutting in dense forest and woodland has converted most of theseforest cover types into shrubland, hence resulting in considerable increase in the areaof shrubland during the 2000s. The fertile soils of dense forest and woodland areas(Jeune Afrique, 1998) are as suitable for agriculture as the shrublands, which areeasier to clear.
Computed spatial pattern metrics of forest cover change trajectories showeddifferences between classes for the four landscape metrics: PLAND, NLSI, IJI andFRAC_AM. The low proportion of PLAND for old cultivation (0.07%) suggeststhat 30 year-old cropland was very rare. This reflects the prevalence of shiftingcultivation in the study area that involves fallowing of cultivated lands whileclearing the forest for new ones. Old forests were also rare (PLAND¼ 9%),indicating that most forest covers were a result of re-growth from fallow areas orreconversion from one forest cover type to another. Gross deforestation had aPLAND of 63%, while reforestation accounted for nearly 29%. This gives a netdeforestation of 34%, showing the high level of deforestation in the region. Theseresults are consistent with reports that have claimed that serious deforestation isoccurring in southern Burkina Faso (Ouedraogo et al., 2009; Pare et al., 2008). Inaddition to the farming activities which have contributed to deforestation(PLAND¼ 30%), many other factors may also be associated with the changesin southern Burkina Faso (PLAND¼ 33%). These could be the combination ofenergy requirements (wood and charcoal production), over-grazing, bush fires(Ouedraogo, 2006b; Ouedraogo et al., 2009; Pare et al., 2008) and rainfallirregularity in the study zone (Yameogo, 2005). Indeed, the magnitude of landcover change is reported to be significantly related to inter- and intra-annualrainfall variability in several ecosystems across sub-Saharan Africa (Vanackeret al., 2005).
Among all land cover trajectory classes old cultivation had the smallest NLSIvalue (0.095), confirming that it exhibited a highly concentrated and aggregatedspatial pattern with patches surrounding the settlements, as reported by Ouedraogoet al. (2009). The old forest was also aggregated. Deforested areas and reforestationhad the highest NLSI values indicating that they were spatially scattered in smallpatches. This means that current agricultural practice is still dominated by small-scale and diffused farming systems that have significant impacts on environmentalsustainability and forest fragmentation. The NLSI also indicates a lack of propermanagement plan regulating wood cutting and grazing in the forest. The NLSI fornon-agricultural deforestation, for instance, was 0.274, suggesting uncontrolledexploitation of the forest in time and space.
Old cultivation had an IJI of zero, indicating that patches of this trajectory classwere aggregated and spatially adjacent to few other trajectory classes. This is in linewith studies that have shown that in the 1970s, southern Burkina Faso was sparselypopulated by the native Nuni people who were practicing subsistence farming withminimal environmental impact (Howorth & O’Keefe, 1999; Ouedraogo et al., 2009).
316 I. Ouedraogo et al.
Dow
nloa
ded
by [S
LU L
ibra
ry] a
t 01:
56 1
5 Ja
nuar
y 20
14
Old forest, deforestation and reforestation classes had IJI values above 50, showing atendency to be associated each with other trajectory classes with highly interspersedpatches.
The measurement of the Area Weighted Fractal Dimension Index showed lowervalues for both old cultivation and forest, indicating less complex patch shapesthan the other trajectory classes. This also suggests that patches were lessexpanded in the study area (PLAND¼ 9%). Conversely, deforestation (bothagricultural and non-agricultural activities) had the highest FRAC_AM (1.242 and1.282 respectively), suggesting more complex patch shapes, expanded around theother classes in 2006 (PLAND¼ 63%). Reforestation also had a high FRAC_AMvalue, compared with the unchanged trajectory classes (old cultivation and oldforest).
It should be noted that when PLAND increases, NLSI, IJI and FRAC_AM alsoincrease (Table 7), suggesting that they might be correlated. This could be due to thefact that the number of land use categories used has a significant effect on the valuesof some selected landscape metrics (Shen et al., 2003). It also lends credence to Penget al. (2007) who performed correlation tests between 24 different landscape metricsand found a high magnitude of relationship between them. Therefore, further studiesthat use other landscape metrics or other spatial pattern measures may contribute tominimizing the suspected correlative effects on the results while depicting thecombination of pattern metrics that would be optimal for future trajectory analysisof land cover change.
5. Conclusions
The shrub- and woodlands in southern Burkina Faso have been subjected todeforestation caused mostly by farming, other land uses, and biophysical factorswhile most of the dense forest cover has been converted to shrubland. The forestcover in some areas has been expanded but such change falls far short of reversingthe process of deforestation and forest degradation. Methodology that combinesmulti-temporal remotely sensed imagery to detect forest cover trajectories and thecomputation of landscape metrics of the change trajectories helped to efficientlyestimate and describe the dominance and spatial distribution of the changes in thearea studied. Interpretation of the metrics of spatial patches described the nature ofchange trajectories and served as a basis to predict the spatial pattern of forestchange. The categorization of the 64 trajectories of the cover change into fiveunifying classes for the landscape metrics analysis might have somehow affected thedata, as pointed out by Peng et al. (2007). Therefore, there is a need to systematicallyinvestigate how landscape metrics behave with respect to changing class categories.Further investigations must also be done to find out the role of policy, socio-economic and climate change on the trajectory process in the study area. Finally, werecommend that a management plan be prepared for the remaining forests andwoodlands in the study area, focusing on forest regeneration and planning of treecutting for energy. This should be done through dialogue with stakeholders andparticipatory forest management involving local people in conservation andreforestation programs. In addition, intensification of agricultural practices isessential to halt the conversion of other land use classes to cropland.
Forest Cover Change Trajectory in Burkina Faso 317
Dow
nloa
ded
by [S
LU L
ibra
ry] a
t 01:
56 1
5 Ja
nuar
y 20
14
Acknowledgements
Funding for this study was provided by Swedish International DevelopmentCooperation Agency (Sida). We thank Djibril S. Dayamba who commented the firstdraft of the manuscript. We also thank Dr John Blackwell and Sees-editing Ltd forlinguistic improvements.
References
Achard, F., Eva, H. D., Stibig, H. J., Mayaux, P., Gallego, J., Richards, T. & Malingreau, J. P. (2002)Determination of deforestation rates of the world’s humid tropical forests, Science, 297, pp. 999–1002.
Borak, J. S., Lambin, E. F. & Strahler, A. H. (2000) The use of temporal metrics for land cover changedetection at coarse spatial scales, International Journal of Environmental, 21, pp. 1415–1432.
Braimoh, A. K. (2004) Seasonal migration and land-use change in Ghana, Land Degradation &Development, 15, pp. 37–47.
Braimoh, A. K. & Vlek, P. L. G. (2005) Land-cover change trajectories in Northern Ghana, EnvironmentalManagement, 36, pp. 356–373.
Breusers, M. (1998) On the move: Mobility, land use and livelihood practices on the Central Plateau inBurkina Faso. Thesis, Wageningen Agricultural University, Wageningen, The Netherlands, 349p.
Congalton, R. G. & Green, K. (2009) Assessing the Accuracy of Remotely Sensed Data. Principles andPractices, 2nd edn (New York: Taylor & Francis Group).
Crews-Meyer, K. A. (2004) Agricultural landscape change and stability in northeast Thailand: historicalpatch-level analysis, Agriculture Ecosystems & Environment, 101, pp. 155–169.
Driessen, P., Deckers, J. & Spaargaren, O. (2001) Lectures notes on the major soils of the world. FAOWorld Soil Resources. Report 94. Food and Agriculture Organization of the United Nations, Rome,Italy.
FAO (2006) Global Forest Resource Assessment (FRA) 2005. Main report. Food and AgricultureOrganization of the United Nations, Rome, Italy.
Focardi, S., Loiselle, S. A., Mazzuoli, S., Bracchini, L., Dattilo, A. M. & Rossi, C. (2008) Satellite-basedindices in the analysis of land cover for municipalities in the province of Siena, Italy, Journal ofEnvironmental Management, 86, pp. 383–389.
Fontes, J. & Guinko, S. (1995) Carte de vegetation et de l’occupation du sol du Burkina Faso. ProjetCampus. UPS, ICIV Toulouse, France.
Geist, H. J. & Lambin, E. F. (2001) What Drives Tropical Deforestation? A Meta-analysis of Proximateand Underlying Causes of Deforestation Based on Subnational Case Study Evidence. LUCCInternational Project Office, University of Louvain; Louvain-la-Neuve; Belgium.
Gray, L. C. (1999) Is land being degraded? A multi-scale investigation of landscape change insouthwestern Burkina Faso, Land Degradation & Development, 10, pp. 329–343.
Gray, L. C. (2005) What kind of intensification? Agricultural practice, soil fertility and socioeconomicdifferentiation in rural Burkina Faso, Geographical Journal, 171, pp. 70–82.
Hall, F. G., Strebel, D. E., Nickeson, J. E. & Goetz, S. J. (1991) Radiometric rectification: toward acommon radiometric response among multidate, multisensor images, Remote Sensing of Environment,35, pp. 11–27.
Henry, S., Boyle, P. & Lambin, E. F. (2003) Modelling inter-provincial migration in Burkina Faso, WestAfrica: the role of socio-demographic and environmental factors, Applied Geography, 23, pp. 115–136.
Howorth, C. & O’Keefe, P. (1999) Farmers do it better: local management of change in southern BurkinaFaso, Land Degradation & Development, 10, pp. 93–109.
INSD (2007) Resultats preliminaires du recensement general de la population et de l’habitat de 2006.Institut National des Statistiques et de la Demographie (INSD). Direction de la Demographie,Ouagadougou. Burkina Faso.
Jeune Afrique (1998) Atlas of Burkina Faso (Paris: Les Editions Jeune Afrique (J.A.)), 62 p.Kauth, R. J. & Thomas, G. S. (1976) The tasselet cap: A graphic description of the spectral-temporaldevelopment of agricultural crops as seen by LANDSAT, in: Proceedings of the Symposium onMachine Processing of Remotely Sensed Data, Purdue University, West Layfayette, IN.
318 I. Ouedraogo et al.
Dow
nloa
ded
by [S
LU L
ibra
ry] a
t 01:
56 1
5 Ja
nuar
y 20
14
Kramer, P. (2002) The fuel wood crisis in Burkina Faso, solar cooker as an alternative. Solar cookerarchive, Ouagadougou, Burkina Faso.
Lambin, E. F., Geist, H. J. & Lepers, E. (2003) Dynamics of land use and land cover change in tropicalregions, Annual Review of Environment and Resources, 28, pp. 205–241.
Lamprecht, H. (1989) Silviculture in the Tropics: Tropical Forest Ecosystems and Their Tree Species,Possibilities and Methods for Their Long Term Utilization (Eschborn: GTZ).
Lillesand, T. M., Kiefer, R. W. & Chipman, J. W. (2008) Remote Sensing and Image Interpretation, 6th edn(Danvers, MA: John Wiley & Sons).
Liu, H. & Zhou, Q. (2004) Accuracy analysis of remote sensing change detection by rule-based rationalityevaluation with post-classification comparison, International Journal of Remote Sensing, 25, pp. 1037–1050.
McGarigal, K. & Marks, B. J. (1995) FRAGSTATS: spatial pattern analysis program for quantifyinglandscape structure. USDA Forest Service General Technical Report.
McGarigal, K., Cushman, S. A., Neel, M. C. & Ene, E. (2002) FRAGSTATS: spatial pattern analysisprogram for categorical maps. Computer software program produced by the authors at the Universityof Massachusetts, Amherst.
Mertens, B. & Lambin, E. F. (2000) Land-cover-change trajectories in southern Cameroon, Annals of theAssociation of American Geographers, 90, pp. 467–494.
Nagendra, H., Munroe, D. K. & Southworth, J. (2004) From pattern to process: Landscape fragmentationand the analysis of land use/land cover change, Agriculture Ecosystems & Environment, 101, pp. 111–115.
Ouattara, K., Ouattara, B., Nyberg, G., Sedogo, M. P. & Malmer, A. (2008) Effects of ploughingfrequency and compost on soil aggregate stability in a cotton-maize (Gossypium hirsutum-Zea mays)rotation in Burkina Faso, Soil Use and Management, 24, pp. 19–28.
Ouedraogo, B. (2006a) Household energy preferences for cooking in urban Ouagadougou, Burkina Faso,Energy Policy, 34, pp. 3787–3795.
Ouedraogo, I. (2006b) Land use dynamics in Bieha district, Sissili province; southern Burkina Faso, WestAfrica, Umoja: Bulletin of the African and African American Studies, 1, pp. 18–34.
Ouedraogo, I., Savadogo, P., Tigabu, M., Cole, R., Oden, P. C. & Ouadba, J. M. (2009) Is rural migrationa threat to environmental sustainability in Southern Burkina Faso?, Land Degradation & Development,20, pp. 217–230.
Ouedraogo, I., Tigabu, M., Savadogo, P., Compaore, H., Oden, P. C. & Ouadba, J. M. (2010) Land coverchange and its relation with population dynamics in Burkina Faso, West Africa, Land Degradation &Development (doi: 10.1002/Idr.981), p. n/a.
Ouedraogo, M. (2003) New stakeholders and the promotion of agro-silvo-pastoral activities in SouthernBurkina Faso: False start or inexperience. IIED, Dryland Programme, 118 pp.
Pare, S., Soderberg, U., Sandewall, M. & Ouadba, J. M. (2008) Land use analysis from spatial and fielddata capture in southern Burkina Faso, West Africa, Agriculture, Ecosystems & Environment, 127, pp.277–285.
Peng, J., Wang, Y., Ye, M., Wu, J. & Zhang, Y. (2007) Effects of land-use categorization on landscapemetrics: A case study in urban landscape of Shenzhen, China, International Journal of Remote Sensing,28, pp. 4877–4895.
Petit, C., Scudder, T. & Lambin, E. (2001) Quantifying processes of land-cover change by remote sensing:Resettlement and rapid land-cover changes in south-eastern Zambia, International Journal of RemoteSensing, 22, pp. 3435–3456.
Reenberg, A. & Lund, C. (1998) Land use and land right dynamics: Determinants for resourcemanagement options in eastern Burkina Faso, Human Ecology, 26, pp. 599–620.
Reij, C., Tappan, G. & Belemvire, A. (2005) Changing land management practices and vegetation on theCentral Plateau of Burkina Faso (1968–2002), Journal of Arid Environments, 63, pp. 642–659.
Shen, W., Wu, J. & Ren, H. (2003) Effects of changing spatial extent on landscape pattern analysis, ActaEcologica Sinica, 23, pp. 2219–2231.
Southworth, J., Nagendra, H. & Tucker, C. (2002) Fragmentation of a landscape: Incorporating landscapemetrics into satellite analyses of land-cover change, Landscape Research, 27, 253–269.
Vanacker, V., Linderman, M., Lupo, F., Flasse, S. & Lambin, E. (2005) Impact of short-term rainfallfluctuation on interannual land cover change in sub-Saharan Africa, Global Ecology and Biogeography,14, pp. 123–135.
Forest Cover Change Trajectory in Burkina Faso 319
Dow
nloa
ded
by [S
LU L
ibra
ry] a
t 01:
56 1
5 Ja
nuar
y 20
14
Yameogo, U. G. (2005) Le feu, un outil d’ingenierie ecologique au ranch de gibier de Nazinga au BurkinaFaso. These de doctorat, Universite d’Orleans, France.
Youl, S., Barbier, B., Moulin, C. H., et al. (2008) Modelisation empirique des principaux determinantssocio-economiques de la gestion des exploitations agricoles au sud-ouest du Burkina Faso,Biotechnologie Agronomie Societe Et Environnement, 12, pp. 9–21.
Zhou, Q., Li, B. & Kurban, A. (2008a) Trajectory analysis of land cover change in arid environment ofChina, International Journal of Remote Sensing, 29, pp. 1093–1107.
Zhou, Q. M., Li, B. L. & Kurban, A. (2008b) Spatial pattern analysis of land cover change trajectories inTarim Basin, northwest China, International Journal of Remote Sensing, 29, pp. 5495–5509.
320 I. Ouedraogo et al.
Dow
nloa
ded
by [S
LU L
ibra
ry] a
t 01:
56 1
5 Ja
nuar
y 20
14


