Embed Size (px)
Citation preview

Transcriptome analysis of nitrate assimilation in Aspergillusnidulans reveals connections to nitric oxide metabolismmmi_7363 720..738
Thorsten Schinko,1§ Harald Berger,1†§ Wanseon Lee,2
Andreas Gallmetzer,1 Katharina Pirker,3‡
Robert Pachlinger,1 Ingrid Buchner,1
Thomas Reichenauer,3 Ulrich Güldener2 andJoseph Strauss1,2*1Fungal Genetics and Genomics Unit, Department ofApplied Genetics and Cell Biology, Austrian Institute ofTechnology and BOKU University Vienna, Muthgasse18, 1190 Vienna, Austria.2Institute of Bioinformatics and Systems Biology,Helmholtz Zentrum München, 85764 Neuherberg,Germany.3Austrian Institute of Technology, A-2444 Seibersdorf,Austria.
Summary
Nitrate is a dominant form of inorganic nitrogen (N) insoils and can be efficiently assimilated by bacteria,fungi and plants. We studied here the transcriptomeof the short-term nitrate response using assimilatingand non-assimilating strains of the model asco-mycete Aspergillus nidulans. Among the 72 genespositively responding to nitrate, only 18 genes carrybinding sites for the pathway-specific activatorNirA. Forty-five genes were repressed by nitratemetabolism. Because nirA - strains are N-starved atnitrate induction conditions, we also compared thenitrate transcriptome with N-deprived conditions andfound a partial overlap of differentially regulatedgenes between these conditions. Nitric oxide (NO)-metabolizing flavohaemoglobins were found to beco-regulated with nitrate assimilatory genes. Subse-quent molecular characterization revealed that thestrongly inducible FhbA is required for full activityof nitrate and nitrite reductase enzymes. Theco-regulation of NO-detoxifying and nitrate/nitriteassimilating systems may represent a conserved
mechanism, which serves to neutralize nitrosativestress imposed by an external NO source insaprophytic and pathogenic fungi. Our analysis usingmembrane-permeable NO donors suggests that sig-nalling for NirA activation only indirectly depends onthe nitrate transporters NrtA (CrnA) and NrtB (CrnB).
Introduction
Nitrate (NO3-) is the most abundant inorganic nitrogen (N)
form in soils, and plants (Song et al., 2007), fungi (Joer-gensen and Wichern, 2008; Inselsbacher et al., 2009),bacteria (Klotz and Stein, 2008) and archaea (Erguderet al., 2009) all compete for this resource. Fungal biomassdominates in many soil types and although some fungishow denitrifying activities (Takaya, 2002; Fujii andTakaya, 2008; Kim et al., 2009) the presence of nitrate andnitrite assimilation genes in most fungal phyla (M. Gorferand J. Strauss, unpubl. obs.) indicates a relevant ecologi-cal function of this metabolic system in soil nitrogencycling. Provided sufficient carbon supply, fungi are able toefficiently utilize nitrate and nitrite for growth and incorpo-rate this nitrogen source into biomass through reduction toammonium and subsequent metabolization to glutamateand glutamine (Cove, 1979). Because of the high meta-bolic cost of nitrate reduction, negative feedback regulationby ammonium and glutamine prevents the expression ofgenes required for the uptake and assimilation of nitrate ornitrite (Caddick et al., 1994; Marzluf, 1997; Berger et al.,2008). Phenomenologically similar circuits also regulatenitrate assimilation in photosynthetic eukaryotes such asthe algae Chlamydomonas reinhardii (Fernandez andGalvan, 2008) and plants (Crawford and Arst, 1993).However, because of additional constitutively expressednitrate transporters, regulation of nitrate reductase (NR) bylight and the function of nitrate as a developmental signal,nitrate regulation in plants is more complex (Daniel-Vedeleet al., 1998; Zhang and Forde, 2000; Glass et al., 2002;Wang et al., 2003; Miller et al., 2007).
In Aspergillus nidulans, the transcriptional control of theassimilatory system is carried out by the synergistic actionof the nitrate-specific activator NirA (Burger et al., 1991;Strauss et al., 1998) and the nitrogen status-sensingregulator AreA (Kudla et al., 1990). Nitrate and nitriteuptake is carried out via specific permeases (Brownlee
Accepted 19 August, 2010. *For correspondence. E-mail [email protected]; Tel. (+43) 1 36006 6720; Fax (+43) 1 360066392. Present addresses: †Wellcome Trust Centre for Cell Biology,University of Edinburgh, Mayfield Road, Edinburgh EH9 3JR, UK;‡Institute of Structural and Molecular Biology, University CollegeLondon, Gower Street, London WC1E 6BT, UK. §These authors con-tributed equally to this work.
Molecular Microbiology (2010) 78(3), 720–738 � doi:10.1111/j.1365-2958.2010.07363.xFirst published online 27 September 2010
© 2010 Blackwell Publishing Ltd

and Arst, 1983; Unkles et al., 1991; 2001; Wang et al.,2008) and subsequently, intracellular nitrate mediatesaccumulation of NirA in the nucleus. We have previouslyshown that nitrate functions to disrupt the interactionbetween the NirA nuclear export signal and the KapK–NplA nuclear export complex (Bernreiter et al., 2007).However, nuclear accumulation is required, but not suffi-cient for NirA activity but the exact mechanism by whichnitrate acts to transform NirA into an active transcriptionfactor has not been elucidated so far. Interestingly, in thesimultaneous presence of external nitrate and ammoniumNirA remains nuclear, but does not efficiently bind DNA. Invivo DNA binding of NirA requires, in addition to nitrate,an active, DNA-bound form of AreA (Narendja et al.,2002). The two transcription factors physically interact(Muro-Pastor et al., 2004; Berger et al., 2008) recruitchromatin remodelling complexes (Muro-Pastor et al.,1999; Berger et al., 2008) and act synergistically to acti-vate transcription. The recruitment of chromatin remodel-ling complexes to the nitrate locus by AreA can beartificially triggered by extended nitrogen starvation(Berger et al., 2008), a condition in which very high levelsof AreA accumulate in the nucleus (Todd et al., 2005).AreA is not only required for expression of nitrate genes,but positively regulates, in most cases in cooperation withthe respective pathway-specific transcription factor, arange of permeases and catabolic enzymes required forthe utilization of alternative, metabolically ‘costly’ nitrogensources such as nucleotides, amino acids or primary andsecondary amides (Caddick et al., 1994; Scazzocchio,2000 and references therein). Several positive and nega-tive feedback mechanisms operate to ensure that AreA isonly active when available nitrogen is limited. Under nitro-gen limitation conditions, AreA abundance and activityincreases because of higher areA gene transcription(Langdon et al., 1995) and mRNA stability (Morozov et al.,2000; 2001; 2010; Caddick et al., 2006), and a preferen-tial nuclear localization of the protein (Todd et al., 2005).Nitrogen sufficiency reduces AreA abundance and theactivity of the protein is reduced by interaction with thenegative regulatory protein NmrA (Andrianopoulos et al.,1998; Wong et al., 2007).
At the genomic level, the response to nitrate has beenextensively studied in plants. Roughly 10% of the Arabi-dopsis thaliana detectable transcriptome responds tonitrate supply (primary response) and includes upregula-tion of genes involved in nitrate transport and assimilation.Plant nitrate assimilation is strongly influenced by lightand the circadian rhythm, and responds to the carbonstatus, as well as hormonal and developmental signals(reviewed in Krouk et al., 2010). Because of this complex-ity, the nitrate response has been found to be highlycontext-dependent (genotypes, slight differences inexperimental design) as only about 300 genes were iden-
tified in a meta-analysis of transcriptome datasets fromdifferent laboratories to be consistently nitrate-regulated(Gutierrez et al., 2007). It has been hypothesized that thehigh variability between different datasets might reflect acomplex gene network providing the necessary nutritionaladaptability of sessile organisms to fluctuating environ-mental conditions. Despite the enormous progress madein understanding the interface between nitrogen andother regulatory sub-networks using Systems Biologyapproaches, little is still known on transcriptional regula-tors of plant nitrate assimilation genes. Several regulatoryproteins have been identified as responding to NO3
-, suchas the MADS-box NAR1 protein controlling lateral rootdevelopment (Zhang and Forde, 2000), several proteinkinases regulating the uptake system (Ho et al., 2009; Huet al., 2009), and NLP7, a nuclear protein with putativeregulatory functions in nitrate signalling and the starvationresponse (Castaings et al., 2009). NLP7 is similar to theC. reinhardii NIT2 regulator, which was shown to be thepathway-specific activator for nitrate assimilation genesin this unicellular algae (Camargo et al., 2007). Initialprotein–DNA interaction studies in the tobacco NR genepromoter showed a nitrate-inducible protection of GATAsites (Rastogi et al., 1997) reminiscent of AreA binding inAspergillus nitrate-inducible genes (Muro-Pastor et al.,1999; Berger et al., 2008). Unfortunately, the involvementof putative plant GATA factors in nitrogen regulation wasnot substantiated by further studies leaving the nature ofplant nitrate assimilation regulators still uncertain.
The work presented here shows that the fungal nitrateresponse reprograms about 1% of the A. nidulans tran-scriptome including genes for nitrate transport andmetabolism. Several novel genes coding for putativeregulators of the nitrate response were uncovered and wealso found an inducible nitric oxide-detoxifying flavohae-moglobin (FhbA) as target of the pathway-specific regu-lator NirA. Characterization of fhb genes providedevidence for an important physiological role of theenzymes under a variety of environmental conditions.Results using membrane-permeable NO donors suggestthat signalling for NirA activation only indirectly dependson the nitrate transporters NrtA/CrnA and NrtB/CrnB.
Results
Experimental set-up and physiological responses tonitrate induction and N-starvation
Our interest was to identify A. nidulans genes that showeda short-term response to the presence of nitrate in thegrowth medium (induced conditions), as compared withgrowth conditions in which ammonium was supplied to thecultures (repressed conditions). In order to limit indirecteffects from downstream metabolites of nitrate assimila-
Aspergillus nitrate transcriptome 721
© 2010 Blackwell Publishing Ltd, Molecular Microbiology, 78, 720–738

tion, i.e. the formation of repressing nitrogen metabolitesduring continuous nitrate assimilation, we first performeda time series of nitrate induction. In these cultures wemonitored the expression of marker genes, which areknown to sensitively respond to the intracellular nitrogenstatus (Fig. 1A) and free amino acid pools (Fig. 1B andTable S1). Maximum niiA mRNA levels were reached after40 and 50 min of induction, indicating maximum synergis-tic NirA–AreA activity. Maximum niiA levels coincided witha minimum of intracellular glutamine concentration. areAand gdhA levels responded roughly 20 min earlier andreached maximum transcript levels after 30 min. Up until50 min of nitrate induction intracellular Gln levels contin-ued to decline despite fully induced NR enzyme levels(Fig. S1). This indicates that the low Gln levels found atthis time point are the result of increasing metabolic activ-ity, which creates a higher demand for amino acids. Inagreement with our previous results (Berger et al., 2008)Gln, but not Glu, appears to serve as intracellular aminoacid storage and signalling pool (Fig. S2). ContinuousNO3
- assimilation (starting from 50 min onwards) pro-duced more Gln than was utilized by metabolic activitiesand this led to a replenishment of the free Gln pool(Fig. 1B). Consequently, higher Gln levels led to partialAreA inactivation and thus to reduced transcriptionalactivity of the NirA–AreA activator complex and to a dropin amounts of niiA mRNA (Fig. 1A). Interestingly, areA andgdhA mRNA levels were continuously decreasingbetween 30 and 60 min of nitrate induction although thelowest levels of Gln were found at 50 min. This indicatesthat transcription and/or mRNA stability of areA and gdhAresponds to additional metabolic signals related to theintracellular nitrogen or carbon status. The exact nature ofsuch signals remains to be identified.
Growth conditions for transcriptome analysis
As a consequence of the time series experiments, weperformed our transcriptome analysis with RNA derivedfrom 30 min induced cultures because the low free Glnpool would prevent negative interference of assimilationproducts with the induction process. The 30 min inducedcultures were compared with fully repressed cultures(e1 = WTNH
4_vs_WTNO3
-), i.e. cells that were transferredafter pre-growth on ammonium again to ammonium-containing medium without an interim starvation period. Inorder to test which of the nitrate-regulated genes aredependent on the pathway-specific activator NirA, weperformed an identical set of induction experiments witha nirA637 loss-of-function strain (e3 = nirA637NH
4_vs_nirA637NO
3-). It is important to note that nitrate uptake is
only slightly impaired in nirA - strains (Brownlee andArst, 1983). This experiment allowed us to differentiatebetween nitrate-regulated genes that are a direct target of
NirA and genes, which respond to nitrate induction inde-pendently of the transcription factor.
Physiologically, nitrate induction in a nirA loss-of-function strain is equivalent to strong nitrogen limitation,because the NR activities found during the inductionperiod in the wild-type strain were reduced to very lowlevels in the nirA637 mutant (Fig. S1). Therefore, we alsoperformed transcriptome analysis of wild-type cells sub-jected to continuous nitrogen starvation by incubation onnitrogen-free medium (-N conditions) for 60 min and com-pared this transcriptome with cells continuously grown onammonium (e2 = WTNH
4+_vs_WT-N). We reasoned that
these conditions would enable us to differentiate betweengenes responding to nitrogen limitation and genesresponding to nitrate in the absence of the transcriptionfactor.
Overview of differentially expressed genes
Analysis of the microarray data revealed a total of 135differentially expressed genes (DEGs) for all three experi-mental set-ups when thresholds of fourfold change(log2 � 2) and a t-test value of P � 0.05 were applied (seeExperimental procedures for details). Eighty-four genesresponded to nitrate induction or nitrogen starvation byupregulation whereas 51 genes showed lower expressionunder these conditions. The Venn diagram in Fig. 2 showsa synopsis of DEGs from all experiments. Among thegenes upregulated by at least fourfold 76 genesresponded to NO3
- (72 in WT and four in nirA -) whereasfour genes were also upregulated by N-limitation (one inWT-N and three in nirA -NO
3-). An additional four genes
positively responded to N-limitation in the wild type andthree genes showed upregulation only in NO3
--inducedcultures in nirA - strains. Also surprising is the compara-tively low number of genes responding by at least fourfoldupregulation to the limited time of nitrogen starvation(60 min total) applied in this experiment. The regulatoryresponse during N-starvation (compare Tables S3 andS4) seemed to be less strong (5- to 10-fold upregulation),compared with the nitrate induction response (up to60-fold upregulation). It should be noted, however, thatour experimental conditions most probably do not repre-sent full nitrogen starvation. A much more pronouncedchange in global gene transcription could be expected inthis case, similar to what has been observed in other fungi(Matsuo et al., 2007; Schonig et al., 2008; Staschke et al.,2010).
A considerably high number of genes (45 DEGs) weredownregulated in response to NO3
- induction in the wildtype. This negative response depended on NirA functionand/or the nitrate assimilation process because no down-regulated gene was detected in nirA637 under NO3
-
conditions. N-limited cells (WT-N) did not respond strongly
722 T. Schinko et al. �
© 2010 Blackwell Publishing Ltd, Molecular Microbiology, 78, 720–738

Fig. 1. A. Transcriptional profile of markergenes niiA (nitrite reductase), areA (GATA TF)and gdhA (NADPH-glutamate dehydrogenase)during the nitrate induction process in thewild-type strain. mRNA levels weredetermined by RT-qPCR (see Experimentalprocedures). The normalized levels of specifictranscripts are shown relative to acnA (actin)over a time period of 180 min. Aliquots weretaken from the cultures at the inductionstarting point (0 min) and then after 10, 20, 3040, 50, 60, 90, 120 and 180 min followinginduction by 10 mM NaNO3. Standarddeviations are calculated from threeindependent biological replicates.B. Schematic representation of experimentaldesign and measurements of intracellular freeamino acid levels. Cultures were grown inglucose minimal medium (GMM) in thepresence of 10 mM NH4
+ as the sole N-sourcefor 14 h (preculture NH4), harvested, washed,resuspended in GMM lacking any nitrogensource and incubated under these conditionsfor 30 min (-N). Wild-type and nirA - cellssubsequently received 10 mM NaNO3 (NO3),whereas starved wild-type cells were furtherincubated without nitrogen addition (-N).Incubation proceeded for another 30 min untilthey were harvested for the microarrayexperiment (harvest point). For qPCR analysisand amino acid level determination cells werefurther incubated until 180 min. The graphshows intracellular free glutamine (Gln) levelsmeasured immediately before the starvationperiod (-30), at the end of the starvationperiod (0) and then subsequently after 10, 20,30, 40, 50, 60, 90, 120 and 180 min of NO3
-
induction (full lines) or after 30, 60, 90 and150 min of continuous starvation (dotted lines)in wild-type cells. Values on the y-axisrepresent nmoles free Gln mg-1 dry weight(DW), standard deviations are from threeindependent experiments.
A
B
Aspergillus nitrate transcriptome 723
© 2010 Blackwell Publishing Ltd, Molecular Microbiology, 78, 720–738

by downregulation: only six genes were repressed by atleast fourfold, but as in this case, like in upregulatedDEGs, the limited time of N-deprivation might haverestricted the response.
The function of NirA in the induction process
A vast majority (72 genes) of the total 80 genes positivelyresponding to NO3
- induction in e1 (WT) and e3 (nirA -)required the function of NirA. The central importance ofNirA in the induction process is evident from the Venndiagram (Fig. 2) and functional assignments (Table 1 andTable S2), which shows that only seven genes respondedto NO3
- in the nirA - mutant and three of these genesoverlapped with the group of starvation-induced genes,making 95% of DEGs NirA-dependent for NO3
- induction.NirA requirement could be either direct, i.e. promoterscarry functional 5′CTCCGHGG consensus target bindingsites for NirA, or indirect, i.e. the upregulation responsedepends on nitrate or its metabolism. Bioinformatic analy-
sis of 1 kb upstream regions of the 72 open readingframes revealed 16 promoters, which carry either con-firmed or putative NirA binding sites (Table S3). Thus, for51 NO3
-- and NirA-dependent genes upregulation wasindirect, most probably depending on the active nitrateassimilation process in which the transcriptionally activeNirA–AreA complex would trigger secondary transcrip-tional activation events. In contrast, only seven genespositively responded to nitrate in a nirA637 loss-of-function mutant. Three of those genes are identical togenes responding to nitrogen starvation and thus aregenes not requiring NO3
- for upregulation. Only one genewas commonly upregulated by NO3
- (but not under -Nconditions) in the nirA + and nirA - strain and thereforeshould be classified as a gene directly responding to thepresence of NO3
- in the cell. Interestingly, three geneswere upregulated by NO3
- only when NirA is not functionalsuggesting a negative role for NirA and/or NO3
- metabo-lism in the transcriptional activation process of thesegenes. Because none of the three genes carries predicted
Fig. 2. Differentially expressed genes in thenitrate and starvation response. The Venndiagram shows genes at least fourfold(log2 � 2) upregulated (A) or downregulated(B) in response to different treatments.Numbers in the circles represent numbers ofresponding genes and numbers inoverlapping sections represent genes that arecommonly regulated by two or threeconditions and/or in different strains. Circle 1represents genes differentially regulated byNO3
- induction in the wild type (experimente1. WTNH4_vs_WTNO3), circle 2 representsgenes regulated by nitrogen depletion inwild-type cells (experiment e2.WTNH4_vs_WT-N), whereas circle 3 representsgenes of NO3
--treated nirA - cells that can notmetabolize this nitrogen source (experimente3. nirA -NH4_vs_nirA -NO3).
Table 1. Summary of DEGs in different functional categories.
Main categoriesaNO3-inducedWT
NO3-repressedWT
-N-inducedWT, nirA -
-N-repress.WT, nirA -
Total number of genes 72 45 12 6NO3 metabolism, direct NirA targetsb 16 0 0 0NirA targets, known functions 6 0 0 0NirA targets, predicted or unknown function 10 0 0 0Regulatory rolec 8 8 2 2Amino acid metabolismc 11 0 8 3Carbon metabolismc 5 5 1 0Lipid/secondary metabolismc 11 6 0 1Hypothetical proteins, no known functionc 31 25 1 0
a. Genes are grouped according to major metabolic categories, including a subcategory for genes putatively playing a role in nitrate assimilation.Genes can be grouped into more than one subcategory.b. Classification based on gene regulation (only induced in WT) and known or putative NirA binding consensus sites present in the 1 kb upstreamregion.c. Function in the metabolic pathways could be known or predicted based on similarity to proteins with known function.
724 T. Schinko et al. �
© 2010 Blackwell Publishing Ltd, Molecular Microbiology, 78, 720–738
NirA binding targets in their 1 kb upstream region, thenegative function of NirA is most likely indirect.
Established and putative functions of genes positivelyresponding to NO3
-
Among the genes that most strongly responded to nitrateby 15- to 60-fold upregulation are the extensively charac-terized genes known to be involved in the nitrate assimi-lation process, such as niaD and niiA [coding for NR andnitrite reductase (NiR) respectively], the two nitrate trans-porter genes crnA/nrtA and crnB/nrtB, and the nitritetransporter gene nitA. A gene strongly upregulated(12-fold increase) but so far not known to respond tonitrate induction encodes a putative flavohaemoglobin(AN07169.1). This family of proteins is known to functionin nitric oxide (NO) detoxification, converting the short-lived NO radical to nitrate (Gardner et al., 1998; Fosteret al., 2009). The A. nidulans genome shows two highlyconserved putative flavohaemoglobins and based on theknown function of NO in signalling events, we studiedthese genes in more detail (see below). It is noteworthythat genes with a putative involvement in morphologydetermination and cytoskeleton function (putative chitinsynthethase III, AN4367.3; putative hydrophobin geneAN7539.3; putative fluffy-determinant gene AN9451.3;)were upregulated by NO3
- induction, although thesegenes do not carry predicted NirA binding sites in their5′UTR and thus the response is likely to be a conse-quence of the nitrate assimilation process. (Table S3).Several other novel genes that positively responded tonitrate encode proteins with a predicted function in themobilization of extracellular and internal nitrogen sources.For example, we find genes coding for proteases andgenes involved in the metabolism and transport ofnitrogen-containing compounds such as amino acids,urea, allantoin and nucleotides (see Table S3). Ourexperimental set-up also revealed the activation of genescoding for putative signalling and regulatory proteins,such as kinases, GTP-binding proteins, guanylate kinase,helicase and transcriptional activators and repressors.Leucine biosynthesis and acetyl-coenzyme-A metabolismseem to occupy a special position in nitrate assimilation.Hypothetical isopropylmalate dehydrogenase (AN2793)and isomerase (AN5886) as well as dihydroxy-acid dehy-dratase (AN7358) genes are proposed to be involved inleucine biosynthesis and are upregulated by NO3
-. Asthey do not contain predicted NirA binding sites within1 kb of their 5′regions, the induction is indirect throughthe NO3
- assimilation process. Acetyl-coA metabolism(putative D-lactate dehydrogenase AN0628; enoyl-coAhydratase AN0180) and connected lipid metabolic genes(putative mitochondrial malic enzyme AN6933; lipaseAN2602; esterase AN2834) also appear to be an overrep-
resented category. As two of these genes contain pre-dicted NirA binding sites in their promoters (AN2834 andAN0628) the induction response might be directly per-formed by NirA. The connection of NO3
- and leucine/coenzyme-A metabolism might provide a link tosecondary metabolism. It is known that NO3
- stimulatesproduction of sterigmatocystin and penicillin in A. nidulans(Brakhage, 1998; Feng and Leonard, 1998) and acetyl-coA is a crucial precursor for the vast majority of fungalsecondary metabolites including antibiotics (Keller et al.,2005). The elevated transcription of genes responsible foracetyl-coA, isopropylmalate and L-leucine biosynthesis(pathways connected to the penicillin precursors valineand a-L-aminoadipic acid) would be a logical hypothesisto explain the stronger production of secondary metabo-lites on nitrate as sole N-source in A. nidulans.
Genes positively responding to nitrogen limitation
Under the conditions (1 h nitrogen limitation) and thresh-olds (at least fourfold upregulation) applied in this study,only 12 genes were significantly upregulated by nitrogenlimitation (Table 1 and Table S4). Four of these genesoverlapped with the group of nitrate-induced DEGs andthus upregulation was most likely directly related to theintracellular glutamine level, which was basically identi-cal between the nitrate-induced and the N-starved con-ditions. A strong response was obtained for genesinvolved in ammonium uptake and metabolism: meaA,the low-affinity transporter (AN7463), gdhA, the NADPH-dependent glutamate dehydrogenase (AN4376) andglnA, glutamine synthethase (AN4159). Also the recentlyconfirmed major urea transporter similar to Dur3(AN0418) (Abreu et al., 2010) responded positively tonitrogen limitation. The remaining four DEGs, whichcode for a peptide transporter (AN8903), a putativedipeptidyl-peptidase (AN2572), a putative Zn-clustertranscription factor (AN1927) and a conserved hypotheti-cal gene (AN1404) did not overlap with the NO3
--induced group despite the fact that identical Gln levelswere observed between these two conditions. Wehypothesize that these four latter genes respond to addi-tional signals, e.g. low metabolic activities. In thiscontext it is interesting to note that concentrations ofsome free amino acids were significantly higher after 1 hstarvation than after 30 min NO3
- induction. This mightbe due to re-assuming metabolic activity and demandfor amino acids in the NO3
--induced cells, comparedwith lower activities in the N-starved cells. Table S1shows a comparison of amino acid concentrations in thewild type between these two conditions and for Asp,Asn, Arg, Ala and Tyr the values in NO3
--induced cellswere significantly lower than in the metabolically lessactive cells incubated under N-limitation.
Aspergillus nitrate transcriptome 725
© 2010 Blackwell Publishing Ltd, Molecular Microbiology, 78, 720–738

Genes negatively responding to NO3- and N-limitation
Addition of NO3- resulted in downregulation of 45 genes
(Table S5). None of these genes appeared to berepressed in the nirA - strain suggesting that the functionof NirA is required directly or indirectly for this negativeresponse. Only one out of the 45 genes, i.e. AN10059,which putatively encodes a fungal-specific C6 transcrip-tion factor, harbours a consensus NirA binding site. There-fore, all the other 44 genes most likely responded to theactive nitrate assimilation process. The majority ofrepressed genes (25 genes) encode hypothetical or con-served hypothetical proteins with no predicted functions.As shown in Table S5, five genes encode proteins withsimilarities to enzymes involved in the breakdown ofcomplex carbon sources (a- and b-galactosidase, man-nanase and rhamnogalacturan-lyase) and the products ofeight of these genes show similarities to proteins, whichregulate cellular metabolism (e.g. putative signallingkinase, mRNA stability regulation, transcription of riboso-mal genes).
Not overlapping with the NO3--repressed genes was a
group of six genes that were downregulated by 60 minN-limitation (Table S6). These genes putatively encodeproteins functioning in diverse cellular processes with nopreference to a specific pathway.
Flavohaemoglobin fhbA is co-regulated with the nitrateassimilation system
To gain further insight into the role of flavohaemoglobinsduring nitrate assimilation we studied these genes in moredetail. The NO3
--inducible gene is most similar to yeastYHB1 and Cryptococcus neoformans FHB1 and was des-ignated fhbA according to the A. nidulans nomenclature.The second putative flavohaemoglobin gene (designatedfhbB) was only twofold induced by nitrate (data notshown) and the predicted protein carries a putative mito-chondrial target sequence similar to fhbB in Aspergillusoryzae (Zhou et al., 2009). Both genes were deleted indi-vidually and in combination in order to study their functionduring the NO3
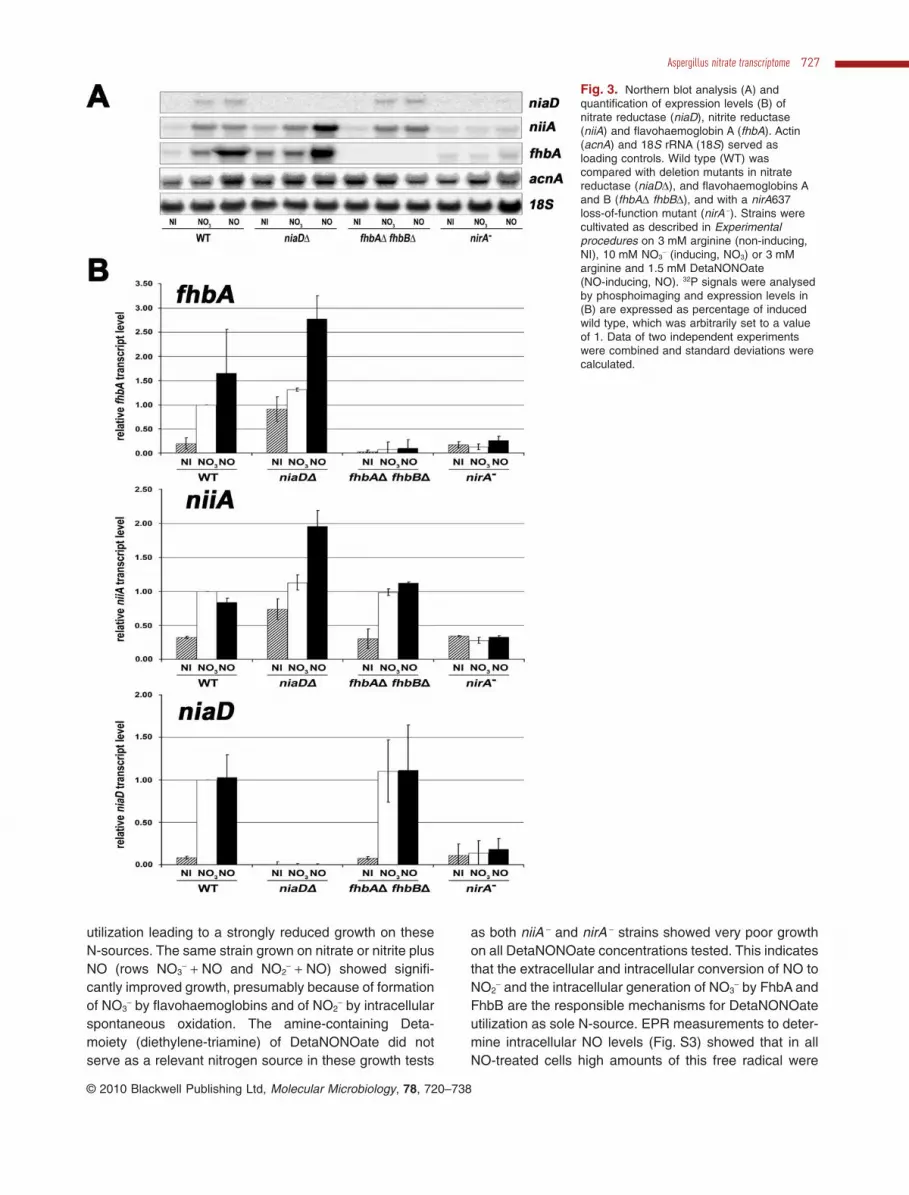
- induction process. Northern analysis(Fig. 3) of fhbA confirmed microarray data and showedthat fhbA is co-regulated with the main assimilatory genessuch as niaD and niiA. Strong nirA-dependent inductionby NO3
- conditions and high constitutive transcript levelsin a niaDD background (Cove and Pateman, 1969;Hawker et al., 1992) were observed for fhbA.
FhbA expression is AreA-independent
We tested if fhbA is regulated as other known nitrate-responsive genes, i.e. induced by NO3
- and subject tonitrogen metabolite repression by external ammonium(NH4
+) mediated through the inactivation of the
co-activator AreA. Figures 3 and 4 also show the expres-sion profile of the niiA gene used as internal control. niiAwas strongly induced by NO3
- and NO, dependent onAreA function, and subject to nitrogen metabolite repres-sion when NH4
+ was added to the medium simultaneouslywith NO. In contrast, expression of fhbA was independentof AreA, showing no ammonium-induced repression in thepresence of NO and even a slight constitutive level underfully repressing conditions (NH4
+ in WT and areA -). This isa surprising result, as all genes known so far to be regu-lated by NirA depend also on functional AreA. Moreover,four AreA consensus binding sites (5′WGATAR) arepresent within 500 bp of the fhbA promoter, in addition toa perfectly matching NirA site at position -225 from theATG start codon. This sequence arrangement wouldsuggest a canonical NirA–AreA synergism in fhbA activa-tion although this is not the case. There are at least fiveother transcriptional regulators known in A. nidulans tocontain functional GATA-type DNA-binding domains andsome of these proteins, such as the iron-responsiverepressor SreA (Oberegger et al., 2001) or the light-responsive regulators of sexual development LreA andLreB (Purschwitz et al., 2008), might bind to the fhbApromoter and participate in transcriptional regulation ofthis gene.
The role of NO in the regulation process
Treatment of the cells with the synthetic NO donor Det-aNONOate led to a strong upregulation of all tested nitrateassimilation genes. The transcriptional response to NOwas not dependent on FhbA or FhbB function, i.e. occur-ring equally well in the fhbAD fhbBD double mutant,making it unlikely that the induction by NO is only aconsequence of NO3
- formation by flavohaemoglobinactivities. DetaNONOate induction could also be triggeredby formation of NO2
-, which arises spontaneously fromNO oxidation in the medium and inside the fungal cell(Yamasaki, 2000). To differentiate effects of NO and NO2
-,we measured the intracellular concentrations of NO (Fig.S3) by electron paramagnetic resonance (EPR) spec-troscopy (Xu et al., 2005; Pirker et al., 2008) and of NO2
-
and NO3- (Fig. 6) by a modified colorimetric assay (Insels-
bacher et al., 2009). EPR is based on the trapping of NOradicals by the spin trap Fe2+-diethyldithiocarbamate(Fe2+-DETC) forming a Fe2+-DETC–NO complex. Thiscomplex is detected as triplet in the EPR spectrum, whicharises from the interaction of the unpaired electron with anitrogen nucleus (spin I = 1) in the complex. Additionally,growth tests were performed (Fig. 5) using strains, whichlack or have strongly reduced NO3
- and NO2- transport
respectively (Unkles et al., 2001; Wang et al., 2008). Thegrowth tests (Fig. 5) showed that the transporter doublemutant (lane crnA -crnB -) is impaired in NO3
- and NO2-
726 T. Schinko et al. �
© 2010 Blackwell Publishing Ltd, Molecular Microbiology, 78, 720–738
utilization leading to a strongly reduced growth on theseN-sources. The same strain grown on nitrate or nitrite plusNO (rows NO3
- + NO and NO2- + NO) showed signifi-
cantly improved growth, presumably because of formationof NO3
- by flavohaemoglobins and of NO2- by intracellular
spontaneous oxidation. The amine-containing Deta-moiety (diethylene-triamine) of DetaNONOate did notserve as a relevant nitrogen source in these growth tests
as both niiA - and nirA - strains showed very poor growthon all DetaNONOate concentrations tested. This indicatesthat the extracellular and intracellular conversion of NO toNO2
- and the intracellular generation of NO3- by FhbA and
FhbB are the responsible mechanisms for DetaNONOateutilization as sole N-source. EPR measurements to deter-mine intracellular NO levels (Fig. S3) showed that in allNO-treated cells high amounts of this free radical were
Fig. 3. Northern blot analysis (A) andquantification of expression levels (B) ofnitrate reductase (niaD), nitrite reductase(niiA) and flavohaemoglobin A (fhbA). Actin(acnA) and 18S rRNA (18S) served asloading controls. Wild type (WT) wascompared with deletion mutants in nitratereductase (niaDD), and flavohaemoglobins Aand B (fhbAD fhbBD), and with a nirA637loss-of-function mutant (nirA -). Strains werecultivated as described in Experimentalprocedures on 3 mM arginine (non-inducing,NI), 10 mM NO3
- (inducing, NO3) or 3 mMarginine and 1.5 mM DetaNONOate(NO-inducing, NO). 32P signals were analysedby phosphoimaging and expression levels in(B) are expressed as percentage of inducedwild type, which was arbitrarily set to a valueof 1. Data of two independent experimentswere combined and standard deviations werecalculated.
Aspergillus nitrate transcriptome 727
© 2010 Blackwell Publishing Ltd, Molecular Microbiology, 78, 720–738

captured. Interestingly, we also detected low levels of NOin wild-type and fhbAB deletion mutants grown on nitrate.These data indicate that NO3
- assimilation in A. nidulans,similar to the situation reported in plants, results in theformation of NO and provides a physiological link to theobserved co-regulation of assimilatory genes withflavohaemoglobins.
When we measured intracellular NO2- levels in
NO-treated cells (Fig. 6B) we found about 20 mg NO2-
per gram dry weight (g-1 DW). This was a roughly10-fold higher NO2
- concentration compared with theone found in actively nitrate-reducing cells. NeitherFhb nor NR activities were needed for the conversion ofNO to NO2
-, consistent with a spontaneous intracellularNO oxidation. Intracellular NO3
- levels measured inNO-treated cells (Fig. 6A) confirmed the in vivo functionof Fhb enzymes in the conversion of NO to NO3
-
because the fhbAD fhbBD strain showed no detectable(n.d.) NO3
- accumulation after NO treatment. Surpris-ingly, the wild-type and nirA - strains also showed nodetectable intracellular NO3
- accumulation after Det-aNONOate treatment. The simplest explanation consis-tent with these results is that, in the wild type, thesimultaneously induced NR would effectively reduce theFhb-generated NO3
- to NO2-. Indeed, a control strain
lacking NR activity (niaDD) showed very high NO3-
levels after NO addition whereas in nirA - strains, lackingniaD and fhb expression, NO conversion into NO3
- andsubsequently accumulation, was not observed. Interest-ingly, the basal level expression of putative FhbB did notresult in sufficient activity that would allow the detectionof NO3
- in a nirA - strain. In contrast, a niaDD strainshowed clearly detectable NO3
- levels under non-induced (arginine) growth conditions (see insert panel inFig. 6A) and these nitrate levels might be sufficientlyhigh to promote expression of NirA target genes (niiA,fhbA) under non-induced conditions.
During these experiments we noted that the fhb doubledeletion strain displayed considerably lowered intracellu-lar NO3
- levels (25% of WT) when grown on NO3-
(Fig. 6A). This could be the consequence of reduced NO3-
transporters function similar to the nirA - strain (50% ofWT) or could be due to increased NR activities. We there-fore analysed NR activities under all relevant conditions(Fig. 7). We found that NR activities were not changed infhb double mutants during growth on NO3
- but were dras-tically reduced in the mutants when DetaNONOate wasadded to the medium. These results provide evidence foran important role of flavohaemoglobins in protecting NRactivity from damage directly by the NO radicals or indi-rectly by NO-derived reactive nitrogen species. This regu-latory role of flavohaemoglobins seems to be relevantonly at high concentrations of NO, as fhbAD single andfhbADfhbBD double mutants grew normally on NO3
- asthe sole N-source (Fig. 5). In contrast, stronger growthsuppression was seen in fhb mutants compared with thewild type on NO3
- + NO, consistent with considerablyreduced NR activities in the presence of the NO donorDetaNONOate (Fig. 7).
A role for flavohaemoglobins in Aspergillus naturalenvironments?
Growth tests performed under a variety of conditions(Fig. 5) provided support for the important function of theinducible fhbA flavohaemoglobin in protecting A. nidulanscells from nitrosative damage. The stronger toxic effect ofNO in fhbAD strains could indicate that not only NR, asshown above by enzymatic assays, but also NiR activity issensitive to NO and that FhbA protects against thisdamage. Growth tests performed at different ambient pHvalues (Fig. 8) provided evidence that FhbA function isnecessary to allow optimal NiR activity. Whereas the wild-type and fhbBD strains utilized NO2
- over the whole range
Fig. 4. Northern blot analysis offlavohaemoglobinA (fhbA), nitrite reductase(niiA) and 18S rRNA (loading control)transcript levels. Wild type (WT) and areA600loss-of-function mutant (areA -) were cultivatedunder different nitrogen conditions asdescribed in Experimental procedures underrepressed (NH4); NO-induced and repressed(NH4
NO), non-induced (NI); and NO-induced(NO) conditions. Northern blots were probedwith 32P-labelled niiA and fhbA probes andsignals were analysed by phosphoimaging.Numbers below the signals indicate relativeexpression levels in comparison with 18SrRNA, which was arbitrarily set to 100%.
728 T. Schinko et al. �
© 2010 Blackwell Publishing Ltd, Molecular Microbiology, 78, 720–738

of acidic pH values tested here (pH 6.8 to pH 4.5), thestrain carrying fhbA deletions (fhbAD, fhbADfhbBD andfhbADfhbBDniaDD) showed increasing sensitivity to10 mM NO2
- when ambient pH was reduced stepwise. Asthe growth reduction could also be due to generally higherNO stress susceptibility in fhbAD strains and only indi-rectly related to NiR activity we tested growth in the pres-
ence of an additional nitrogen source, 3 mM L-arginine.When growth became independent from utilization ofNO2
- as the sole N-source and hence on functional NiR,the fhbAD strains grew as well as the wild type over thewhole range of pH conditions. These data support theresults from growth tests using the NO donor Det-aNONOate (compare Fig. 6, row NO2
- + NO) and strongly
Fig. 5. Growth test on solid glucose minimal media at pH 6.8, and supplements according to strain requirements. Plates were preparedcontaining the following N-sources: 10 mM ammonium (NH4), 10 mM ammonium + 1.5 mM DetaNONOate (NH4 + NO), 3 mM arginine (Arg),3 mM arginine + 1.5 mM DetaNONOate (Arg + NO), 10 mM nitrate (NO3), 10 mM nitrate + 1.5 mM DetaNONOate (NO3 + NO), 10 mM nitrite(NO2), nitrite + 1.5 mM DetaNONOate (NO2 + NO) and different nitric oxide (NO) concentrations (0.75, 1.5 and 3 mM). A. nidulans wild-typestrain (WT), nitrate reductase mutant (niaDD), nitrite reductase mutant niiA4 (niiA -), nirA637 mutant (nirA -), single and doubleflavohaemoglobin mutants (fhbAD; fhbBD; fhbADfhbBD) and nitrate transporter deficient strains (crnA - crnB -) were used in the growthexperiment. After 72 h at 37°C growth was documented by light scanning and the figure was composed using Photoshop 8.0.
Aspergillus nitrate transcriptome 729
© 2010 Blackwell Publishing Ltd, Molecular Microbiology, 78, 720–738

suggest that NiR activity is sensitive to high levels of NOand that FhbA function is required for NiR activities underthese conditions. Unfortunately, because of the significantspontaneous oxidation of NO to NO2
- we were not able todirectly measure NiR activities under these conditions(data not shown). Finally, an interesting phenotype wasobtained in these pH dependence tests in strains lackingeither NiR (niiA -) or NirA (nirA -, nirAD) activity. In bothgenetic backgrounds the utilization of arginine wasimpaired in the presence of NO2
- already at the standardpH 6.8 of the medium and was almost totally inhibited aspH gradually decreased (Fig. 8, lanes niiA -, nirA - andnirAD: compare rows arg at different pH with rows NO2
-/arg at different pH). These phenotypes indicate that highintracellular NO2
- levels (present in niiA - and nirA - strainsincubated on NO2
- + arginine; T. Schinko and J. Strauss,unpubl. obs.) negatively influence transporters, enzymes
or regulators of the arginine catabolic pathway. At themoment it is not clear whether the utilization of otheramino acids is also affected by NO2
- at low ambient pH.As no typical NO synthetase producing NO and citrullinefrom L-arginine has yet been identified in fungi, it will beinteresting in future to see if NO generating and detoxify-ing activities in A. nidulans may be related to argininemetabolism.
Discussion
We have shown here that the nitrate assimilation processin A. nidulans remodels central components of the nitrogenmetabolism. As expected from previous studies, genesinvolved in uptake and reduction of nitrate to ammoniumare induced by the main transcriptional activator NirA andall of these pathway-specific genes carry functionally char-
Fig. 6. Intracellular nitrate (A) and nitrite (B)levels on different nitrogen sources. Thelevels were measured according to themethod described in Experimental proceduresin A. nidulans wild-type cells (WT), and inmutants lacking nitrate reductase (niaDD),both flavohaemoglobin genes (fhbAD fhbBD),or functional NirA (nirA -). As for Northernanalysis, strains were pre-grown on arginineas a non-inducing nitrogen source andharvested mycelia N-starved prior to shift tomedia containing different nitrogen sources:3 mM arginine (NI, shaded bars);nitrate-inducing conditions with 3 mMarginine + 10 mM nitrate (NO3, white bars); ornitric oxide-inducing conditions with, 3 mMarginine + 1.5 mM DetaNONOate (NO, filledbars). NO3
- values under NI conditions areshown in the magnified insert panel. Data of arepresentative experiment, reflecting theobserved overall pattern, are shown and theamounts and calculated standard deviationsof NO3
- and NO2- are expressed as mg per
gram dry weight (mg g-1 DW). n.d. denotesnon-detectable amounts of NO3
- (for detailssee Supplementary Experimental procedures).
730 T. Schinko et al. �
© 2010 Blackwell Publishing Ltd, Molecular Microbiology, 78, 720–738

acterized or putative NirA binding sites (consensus 5′CTC-CGHGG). Although more than 800 genes in the genomeshow the presence of NirA consensus sites within 1 kb oftheir 5′region, only roughly 80 genes are positively regu-lated by NO3
-. The vast majority of these genes requirenitrate metabolism, and thus NirA, for this response, butonly 19 of these NO3
--responsive genes carry confirmed orpredicted NirA consensus sites in their promoters.
We identified more than 50 novel genes, which wereupregulated by nitrate and some of them encode enzymesthat are required for the subsequent metabolization of theassimilation product (NH4
+), e.g. two types of glutamatedehydrogenases, glutamine synthetase, and threeenzymes involved in leucine and coenzyme-A biosynthe-sis. Notably, the latter genes and some additional genescoding for amino acid transport and metabolism alsoresponded to N-limiting conditions (60 min starvation).This regulatory response suggests that under our condi-tions (30 min NO3
- induction after 30 min of N-starvation)the amount of NO3
- channelled through the assimilatorysystem was still not producing sufficient amounts of assimi-lation products as to fully relieve the starvation response.This metabolic status was also seen in direct amino acidmeasurements. Despite induced NR activity on NO3
-
medium (Fig. S1), the intracellular level of glutamine,which is the molecule known to signal the intracellularnitrogen status(Margelis et al., 2001; Berger et al., 2008),continued to decline during the first 30 min of nitrateassimilation, identical to the falling Gln levels underN-starvation (Table S1). This apparent discrepancy couldbe explained by the increasing metabolic demand for
amino acids in NO3--induced cells, which presumably
resumed growth after NO3- supply. It was only after
approximately 60 min of continuous assimilation that thepool of free Gln started to increase again reaching asteady-state level of balanced repletion/depletion afterroughly 2 h. Because little is known about the eukaryoticnitrate signalling cascade, we were mainly interested in theshort-term response to nitrate. Thus, our experimentalset-up was generally designed to largely avoid the interfer-ence with nitrate metabolism, using short incubation timesas well as a nirA - mutant unable to turn on the assimilatorysystem. Doing so, we identified several putative regulatorycomponents that might be involved in the signallingcascade, e.g. hypothetical proteins with similarity to gua-nylate kinases (AN10188), protein kinases (AN3181), tran-scription factors (AN7343, AN5405) or GTP-bindingproteins (AN7222). On the other hand, several genes wererepressed by the addition of NO3
- (predicted transcriptionfactor AN10059, kinase AN10082 or nucleotide-bindingdomain protein AN10344) and these putative regulatorsmight also be involved in NO3
--specific signalling.A novel target of NirA was found to be a
flavohaemoglobin-encoding gene (AN7169). This is amember of a gene family encoding evolutionarily con-served proteins, which appear to be widely distributed inbacteria and fungi. Their main role is to metabolize NOradicals, reactive nitrogen species implicated in proteinnitrosylation, signalling and nitrosative stress. Flavohae-moglobins are known to catalyse NO di-oxgenation, theNADPH, FAD and O2-dependent conversion of NO toNO3
- (Gardner et al., 1998; Poole and Hughes, 2000). In
Fig. 7. Nitrate reductase (NR) activity was measured in A. nidulans wild type (WT), and in mutants lacking nitrate reductase (niaDD), bothflavohaemoglobin genes (fhbAD fhbBD), or NirA function (nirA -). Strains were pre-grown on arginine as non-inducing nitrogen source andharvested mycelia were starved prior to shift to media containing different nitrogen sources: 3 mM arginine (NI, shaded bars); nitrate-inducingconditions with 3 mM arginine + 10 mM nitrate (NO3, white bars); or nitric oxide-inducing conditions with, 3 mM arginine + 1.5 mMDetaNONOate (NO, black bars). Data of two independent biological experiments were merged and the activities of the wild-type NR undernitrate-inducing conditions were arbitrarily given a value of 1 (100%). Bars and respective standard deviations show NR activities relative towild type under NO3
--induced conditions.
Aspergillus nitrate transcriptome 731
© 2010 Blackwell Publishing Ltd, Molecular Microbiology, 78, 720–738

732 T. Schinko et al. �
© 2010 Blackwell Publishing Ltd, Molecular Microbiology, 78, 720–738

fungi they have been studied in several systems. Sac-charomyces cerevisiae yhb1D (Liu et al., 2000), Cr. neo-formans fhb1D (de Jesus-Berrios et al., 2003) or Candidaalbicans yhb1D (Hromatka et al., 2005) lack both signifi-cant aerobic NO metabolic activity and detoxification, andtherefore are more sensitive to toxic effects of NO. Fla-vohaemoglobins also work as defence system during thehost response to microbial pathogens and mutants showreduced virulence (Crawford and Goldberg, 1998; Idnurmet al., 2004). NO detoxification systems might be of sig-nificant importance to different fungal species in theirnatural environments. For pathogenic fungi such asAspergillus fumigatus, detoxification of NO produced asdefence molecule by macrophages during the infectionprocess could be essential to counteract nitrosativestress and enhance the infection process. Such adefence system has already been observed for Cr. neo-formans to be one of the pathogenicity factors (de Jesus-Berrios et al., 2003) and Histoplasma capsulatum, apathogenic fungus not known to possess flavohaemoglo-bins, which uses a nitric oxide reductase to counteractthe NO burst employed by infected macrophages as partof the antimicrobial defence system (Nittler et al., 2005).A. nidulans is not pathogenic but grows on a wide varietyof organic substrates and is a common soil inhabitant. Insuch environments elevated NO concentrations can bereleased from NO2
- at acidic pH and it is known that aside-reaction of bacterial nitrification results in release ofNO (Klotz and Stein, 2008). This reaction product orderivatives thereof such as nitrous oxide or peroxynitritemay impose nitrosative stress on the surrounding micro-bial community.
In aspergilli, flavohaemoglobins have been biochemi-cally characterized as NO dioxygenases (Zhou et al.,2009) with an additional, and unexpected function in pro-moting oxidative stress (Zhou et al., 2010). Phylogeneticanalysis of fungal flavohaemoglobin proteins showed thepresence of an Aspergillus sp.-specific group, which wasproposed to have a function in mycelial branching (TeBiesebeke et al., 2010).
While the enzymatic activity of filamentous fungal Fhbenzymes has been confirmed in vitro (Zhou et al., 2009),their regulatory context and in vivo role has not yet beenelucidated. Our characterization of the two flavohaemo-globins during nitrate induction yielded novel insights notonly into nitric oxide metabolism, but also nitrate andnitrite metabolism in A. nidulans. As expected, deletion
of the NO-metabolizing genes resulted in higher suscep-tibility to nitrosative stress imposed by externally sup-plied nitric oxide. Enzymatic measurements and growthtests, however, provided solid evidence that both NRand NiR are protected by the inducible FhbA flavohae-moglobin from damage by high NO concentrations. Asboth NR and NiR carry Fe++-containing prosthetic groups(haem and Fe-S cluster respectively) this protectivefunction of Fhb proteins might be relevant to nitrogenmetabolism under special ecological conditions, such ashigh NO2
- concentrations at low external pH, which isknown to spontaneously generate high NO concentra-tions. In plants, NO has been shown to act as a signal-ling molecule for growth, development and resistanceto biotic and abiotic stress (Perazzolli et al., 2006).Although the synthesis of NO in plants by enzymaticactivities of nitric oxide synthases still remains a matterof debate (Gas et al., 2009), intracellular NO generationfrom NO2
- by NR activity and spontaneous decomposi-tion at low pH is well established (reviewed byYamasaki, 2000). Plant flavohaemoglobins, termed non-symbiotic haemoglobins, have been shown to beinduced by NO3
- in A. thaliana (Wang et al., 2000) andwere shown to be responsive to NO3
-, NO2- and NO
donors in cultured rice cells (Ohwaki et al., 2005). Inter-estingly, also in rice cells, the expression of flavohaemo-globin GLB1 genes is not repressible by nitrogenmetabolites (Gln or Asn), identical to what we found forA. nidulans fhbA. Recently, NO has also been shown tomediate a negative function on the expression of severalnitrate-responsive genes in Chlamydomonas and Arabi-dopsis (de Montaigu et al., 2010). Low concentrations ofNO (10 m; DetaNONOate) efficiently repressed NO3
--induced genes via a cGMP-mediated pathway, effec-tively mimicking nitrogen metabolite repression byammonium. Whether or not low concentrations of Det-aNONOate mediate a negative effect on nitrate assimi-latory gene expression in A. nidulans is not yet known.
FhbA is the first reported AreA-independent NirAtarget thus escaping nitrogen metabolite repression. Thisregulation could reflect the important role of counteract-ing NO stress, regardless of the cellular nitrogen status.Using NirA as one of the principal transcriptional activa-tors of FhbA seems to be a good choice as the presenceof NO inside or outside the cell always results in spon-taneous NO2
- generation and thus activation of NirA. Inaddition, intracellular NO may be converted to NO3
- by
Fig. 8. Growth test at different pH values on solid minimal media supplemented according to strain requirements. Plates were preparedcontaining the following N-sources: 10 mM ammonium (NH4), 3 mM arginine (Arg), 10 mM nitrate (NO3) or nitrite (NO2), or 10 mMnitrite + 3 mM arginine (NO2/arg). A. nidulans wild-type strain (WT), nitrate reductase mutant (niaDD), nitrite reductase mutant niiA4 (niiA -),nirA637 mutant (nirA -), single and double flavohaemoglobin mutants (fhbAD; fhbBD; fhbADfhbBD), nitrate transporter deficient strains (crnA -
crnB -) and nirA deletion mutant (nirAD) were used in the growth experiment. Flavohaemoglobin and transporter mutants were also combinedwith a niaDD mutation. After 72 h at 37°C, growth was documented by light scanning and the figure was composed using Photoshop 8.0.
Aspergillus nitrate transcriptome 733
© 2010 Blackwell Publishing Ltd, Molecular Microbiology, 78, 720–738

the constitutive FhbB protein also leading to NirA acti-vation and subsequent upregulation of FhbA. This regu-latory circuit, presented in Fig. 9, ensures an optimalcounterstrike against internal and external NO stressand provides protection for the by-products of their enzy-matic reactions. Furthermore, the use of membrane-permeable NO has provided strong evidence that in A.nidulans, the nitrate transporters do not seem to beinvolved in transmitting the induction signal to thepathway-specific activator NirA and the intracellularpresence of NO, NO3
- or NO2- is evidently sufficient to
activate NirA. These results agree with earlier findingsby Unkles et al. (2001) who reported induction of niiAand niaD by external NO3
- in nrtA/crnA, nrtB/crnBdouble mutant cells. Although very young mycelium (ger-mling state) was used in the experiments by Unkles andcolleges and nitrate uptake kinetics are differentbetween germlings and the mature mycelium (14 hgrowth) used in our experiments, transporter-independent sensing for the NirA-mediated inductionprocess remains a distinct possibility. This is in contrastto findings in Arabidopsis (Ho et al., 2009) and Chlamy-domonas (Rexach et al., 2002) where nitrate transport-ers have been shown to participate in the signaltransduction process.
Experimental procedures
Strains, growth conditions and genetic techniques
Genotypes of strains used in this study are listed in Table S7.Combinations of traits were obtained by sexual crosses andstrains were grown under standard conditions on liquid orsolid glucose minimal medium (GMM) with the appropriatesupplements and pH adjusted to 6.8 as previously described(Pontecorvo et al., 1953). Final concentrations of nitrogensources were as following: 5 mM di-ammonium tartrate(Fluka), 10 mM NaNO3 (Roth), 10 mM NaNO2 (Riedel-deHaen), 3 mM (L)-arginine (Sigma), 0.75–3 mM Det-aNONOate (Sigma). For growth experiments on solid GMMat low ambient pH (4.5; 5.0 and 5.5) the pH was adjustedprior to sterilization and agar concentration was increased to3%. Plates were incubated at 37°C up to 72 h and scannedfor documentation (300 dpi). Images were processed byusing the Photoshop 8.0 software. Conditions for liquid cul-tures were generally as previously described (Narendja et al.,2002), a detailed description is provided in Supporting Infor-mation on Experimental procedures. Transcriptional analysisfor selected genes (Northern analysis) followed our publishedprocedures (Narendja et al., 2002), details for probes andisolation can be found in Supporting Materials. Analysis ofintracellular nitrate and nitrite levels was performed as previ-ously described for A. nidulans by our laboratory (Bergeret al., 2008) with minor modifications according to Insels-bacher et al. (2009). Details are provided in Supporting Infor-mation on Experimental procedures.
Microarray experiment
Aspergillus nidulans strains used in the transcriptome studywere pabaA1 (wild type) and the nirA loss-of-function strainnirA637 (Muro-Pastor et al., 1999) pabaA1 (nirA -). A fulldescription of the experimental set-up is found in SupportingMaterials and Methods. Briefly, strains were initially pre-grown on GMM for 16 h with 5 mM di-ammonium-tartrate asnitrogen source and then switched to either ammonium(repressed conditions) or to N-free medium for 30 min toprepare the cells for nitrate induction (induced conditions) orfor continuous nitrogen depletion (-N conditions). For thewild-type experiments comparing repressed versus inducedconditions, seven biologically independent experiments wereperformed and analysed separately. For the experimentscomparing wild type repressed versus N-starved and nirA -
comparing repressed versus induced, four independentexperiments were each performed and analysed separately.
Analysis of microarray data. The experimental dataset withdetails on the microarray obtained from TIGR-PFGRC (ThePathogen Functional Genomics Resource Center; http://pfgrc.jcvi.org/index.php/microarray/protocols.html) has beensubmitted to the GEO database with accession numberGSE10475. For the three conditions, further data analysiswas performed in the Biconductor R package (http://www.bioconductor.org/) using the same criteria. Raw medianintensity values were imported into R for statistical analysisusing the Limma package. Data were normalized within eacharray using Loess normalization and between arrays using
Fig. 9. Schematic overview of the interaction between the nitrateassimilation and NO detoxification pathways in A. nidulans. Uptakeof nitrate (NO3
-) and nitrite (NO2-) from the outside is enabled by
transporters localized in the plasma membrane whereas nitric oxide(NO) passes the plasma membrane by free diffusion independentof any transport system. Following uptake NO3
- is reduced to NO2-
by nitrate reductase (NR) and nitrite reductase (NiR) furtherreduces NO2
- to NH4+. Ammonium is incorporated into the cellular
amino acid pool (aa) via glutamate and glutamine biosynthesis.Reactive nitric oxide diffuses into the cell and is converted to NO3
-
mainly via the function of the inducible flavohaemoglobins (FhbA).Additionally, NO spontaneously oxidises to NO2
-. This conversion isreversible at a low prevailing pH, e.g. in the fungal vacuole. NO3
-
and NO2-, originating from NO, again serves as substrate for NR or
NiR. Results from enzyme assays and growth tests suggest thatelevated intracellular NO levels reduce the function of both NR andNiR and thus FhbA seems to possess a protective function forthese two central enzymes in the nitrate assimilation pathway.
734 T. Schinko et al. �
© 2010 Blackwell Publishing Ltd, Molecular Microbiology, 78, 720–738

the Aquantile normalization algorithm (Smyth and Speed,2003). The duplicate correlation function was used tocalculate replicate correlations (Smyth et al., 2005). The log2
expression values for each probe were fitted to a linear modelusing lmFit (Linear Model for Series of Arrays) and moder-ated t-statistics were calculated by eBayes (empirical BayesStatistics for Differential Expression) (Smyth, 2004). Geneswere considered to be differentially expressed by each treat-ment if they satisfied both the P-value lower than 0.05 and atleast a fourfold change.
Functional enrichment in DEGs
Proteins are functionally classified using the MIPS Functionalcatalogue (FunCat) (Ruepp et al., 2004). Genome-wide datawere retrieved from the Pedant A. nidulans database (http://pedant.gsf.de/pedant3htmlview/pedant3view?Method=analysis&Db=p3_p130_Asp_nidul) (Walter et al., 2009). Tostatistically assess functional enrichment of DEGs, the prob-ability was calculated using the hypergeometric distribution.In the equation, m is the number of genes that contain thesame FunCat in n selected DEGs, relative to M genes thatcontain the FunCat in all N genes of a genome. The functionalenrichment of each FunCat was considered significant if theP-value was < 0.05.
P value
M
m
N M
n mN
nm
n
− =
⎛⎝⎜
⎞⎠⎟
−−
⎛⎝⎜
⎞⎠⎟
⎛⎝⎜
⎞⎠⎟
∑
NirA binding sites were identified in the genome using the‘fuzznuc’ program from the EMBOSS package (Rice et al.,2000) for regular expression search in nucleotide sequences.The regular expression of the NirA binding site was definedas 5′-CTCCG[ATC]GG and both strands were searched.
Construction of fhbA and fhbB deletion cassettes. The twoputative flavohaemoglobin genes designated flavohaemoglo-bin A (fhbA, AN7169.3) and flavohaemoglobin B (fhbB,AN3522.3), were deleted using overlapping chimeric poly-merase chain reaction fragments produced according to pub-lished procedures (Yu et al., 2004) and described in detail inSupporting Information on Experimental procedures. Theprimers employed for fragment generation are described inTable S7.
Nitric oxide (NO) quantification [(DETC)2-Fe2+–NO; EPR].Quantification of NO was performed according to Xu et al.(Xu et al., 2005). In brief, approximately 0.3 g of frozensample powder was mixed with 800 ml phosphate buffer(100 mM) containing 0.32 M sucrose, 0.1 mM EDTA and5 mM thioethylenglycol (pH 7.4). After centrifugation(13 000 g, 20 min, 4°C) the supernatant was incubated with400 ml of the spin trapping reagent for 60 min. The stocksolutions for the spin trap reagent consisted of 7.5 mMaqueous FeSO4 and 15 mM aqueous DETC containing 0.5 MNa2S2O4. FeSO4 and DETC solutions were mixed 1:1 justbefore addition to the sample solution. Ethyl acetate (800 ml)was subsequently added and the mixture was then shakenfor 3 min. After centrifugation (13 000 g, 6 min, 4°C), the
organic solvent layer was transferred into a quartz flat cell forEPR measurement.
Electron paramagnetic resonance spectra were acquiredas first derivatives of the microwave absorption with a BrukerEMX CW spectrometer, operating at X-band frequencies(9 GHz) and using a high sensitivity cavity. Microwaves weregenerated by a Gunn diode and the microwave frequencywas recorded continuously with an in-line frequencycounter. Spectra were recorded using 20 mW microwavepower, 100 kHz modulation frequency and 1 G modulationamplitude. Signal intensities were determined by double inte-gration using the Bruker WINEPR software, and then werecorrected for the dry weight of input material.
NR activity assay
Nitrate reductase activity measurements are based on forma-tion of nitrite from externally added nitrate in cellular extractsand nitrite formation was quantified with the diazo-dye adductcolorimetric kit (Roche) at 540 nm. Details of the experimen-tal set-up are given in Supporting Information on Experimen-tal procedures.
Acknowledgements
I.B. and J.S. are grateful to Dr Jesus Aguirre, UniversidadNacional Autónoma de México, for hosting I.B. as a visitingscientist and for providing laboratory infrastructure andsupport. We thank Sheila Unkles for providing nitrate trans-porter mutant strains, Sotiris Amillis (University Athens, GR)for stimulating discussions and Bradley Mathews for criticalreading of the manuscript. This work was supported by Aus-trian Science Fund (FWF) project P 20630-B17 to J.S. andVienna Science and Technology Fund (WWTF) projectLS05036-Nitro-Genome.
References
Abreu, C., Sanguinetti, M., Amillis, S., and Ramon, A. (2010)UreA, the major urea/H(+) symporter in Aspergillus nidu-lans. Fungal Genet Biol doi: 10.1016/j.fgb.2010.07.004.
Andrianopoulos, A., Kourambas, S., Sharp, J.A., Davis, M.A.,and Hynes, M.J. (1998) Characterization of the Aspergillusnidulans nmrA gene involved in nitrogen metaboliterepression. J Bacteriol 180: 1973–1977.
Berger, H., Basheer, A., Bock, S., Reyes-Dominguez, Y.,Dalik, T., Altmann, F., and Strauss, J. (2008) Dissectingindividual steps of nitrogen transcription factor cooperationin the Aspergillus nidulans nitrate cluster. Mol Microbiol 69:1385–1398.
Bernreiter, A., Ramon, A., Fernandez-Martinez, J., Berger,H., Araujo-Bazan, L., Espeso, E.A., et al. (2007) Nuclearexport of the transcription factor NirA is a regulatory check-point for nitrate induction in Aspergillus nidulans. Mol CellBiol 27: 791–802.
Brakhage, A.A. (1998) Molecular regulation of beta-lactambiosynthesis in filamentous fungi. Microbiol Mol Biol Rev62: 547–585.
Brownlee, A.G., and Arst, H.N., Jr (1983) Nitrate uptake in
Aspergillus nitrate transcriptome 735
© 2010 Blackwell Publishing Ltd, Molecular Microbiology, 78, 720–738

Aspergillus nidulans and involvement of the third gene ofthe nitrate assimilation gene cluster. J Bacteriol 155: 1138–1146.
Burger, G., Tilburn, J., and Scazzocchio, C. (1991) Molecularcloning and functional characterization of the pathway-specific regulatory gene nirA, which controls nitrate assimi-lation in Aspergillus nidulans. Mol Cell Biol 11: 795–802.
Caddick, M.X., Peters, D., and Platt, A. (1994) Nitrogen regu-lation in fungi. Antonie Van Leeuwenhoek 65: 169–177.
Caddick, M.X., Jones, M.G., van Tonder, J.M., Le Cordier, H.,Narendja, F., Strauss, J., and Morozov, I.Y. (2006) Oppos-ing signals differentially regulate transcript stability inAspergillus nidulans. Mol Microbiol 62: 509–519.
Camargo, A., Llamas, A., Schnell, R.A., Higuera, J.J.,Gonzalez-Ballester, D., Lefebvre, P.A., et al. (2007) Nitratesignaling by the regulatory gene NIT2 in Chlamydomonas.Plant Cell 19: 3491–3503.
Castaings, L., Camargo, A., Pocholle, D., Gaudon, V., Texier,Y., Boutet-Mercey, S., et al. (2009) The nodule inception-like protein 7 modulates nitrate sensing and metabolism inArabidopsis. Plant J 57: 426–435.
Cove, D.J. (1979) Genetic studies of nitrate assimilation inAspergillus nidulans. Biol Rev Camb Philos Soc 54: 291–327.
Cove, D.J., and Pateman, J.A. (1969) Autoregulation of thesynthesis of nitrate reductase in Aspergillus nidulans.J Bacteriol 97: 1374–1378.
Crawford, M.J., and Goldberg, D.E. (1998) Role for the Sal-monella flavohemoglobin in protection from nitric oxide.J Biol Chem 273: 12543–12547.
Crawford, N.M., and Arst, H.N., Jr (1993) The moleculargenetics of nitrate assimilation in fungi and plants. AnnuRev Genet 27: 115–146.
Daniel-Vedele, F., Filleur, S., and Caboche, M. (1998) Nitratetransport: a key step in nitrate assimilation. Curr Opin PlantBiol 1: 235–239.
Erguder, T.H., Boon, N., Wittebolle, L., Marzorati, M., andVerstraete, W. (2009) Environmental factors shaping theecological niches of ammonia-oxidizing archaea. FEMSMicrobiol Rev 33: 855–869.
Feng, G.H., and Leonard, T.J. (1998) Culture conditionscontrol expression of the genes for aflatoxin and sterigma-tocystin biosynthesis in Aspergillus parasiticus and A.nidulans. Appl Environ Microbiol 64: 2275–2277.
Fernandez, E., and Galvan, A. (2008) Nitrate assimilation inChlamydomonas. Eukaryot Cell 7: 555–559.
Foster, M.W., Liu, L., Zeng, M., Hess, D.T., and Stamler, J.S.(2009) A genetic analysis of nitrosative stress. Biochemis-try 48: 792–799.
Fujii, T., and Takaya, N. (2008) Denitrification by the fungusFusarium oxysporum involves NADH-nitrate reductase.Biosci Biotechnol Biochem 72: 412–420.
Gardner, P.R., Gardner, A.M., Martin, L.A., and Salzman, A.L.(1998) Nitric oxide dioxygenase: an enzymic function forflavohemoglobin. Proc Natl Acad Sci USA 95: 10378–10383.
Gas, E., Flores-Perez, U., Sauret-Gueto, S., and Rodriguez-Concepcion, M. (2009) Hunting for plant nitric oxide syn-thase provides new evidence of a central role for plastids innitric oxide metabolism. Plant Cell 21: 18–23.
Glass, A.D., Britto, D.T., Kaiser, B.N., Kinghorn, J.R., Kro-
nzucker, H.J., Kumar, A., et al. (2002) The regulation ofnitrate and ammonium transport systems in plants. J ExpBot 53: 855–864.
Gutierrez, R.A., Gifford, M.L., Poultney, C., Wang, R.,Shasha, D.E., Coruzzi, G.M., and Crawford, N.M. (2007)Insights into the genomic nitrate response using geneticsand the Sungear Software System. J Exp Bot 58: 2359–2367.
Hawker, K.L., Montague, P., and Kinghorn, J.R. (1992)Nitrate reductase and nitrite reductase transcript levels invarious mutants of Aspergillus nidulans: confirmation ofautogenous regulation. Mol Gen Genet 231: 485–488.
Ho, C.H., Lin, S.H., Hu, H.C., and Tsay, Y.F. (2009) CHL1functions as a nitrate sensor in plants. Cell 138: 1184–1194.
Hromatka, B.S., Noble, S.M., and Johnson, A.D. (2005) Tran-scriptional response of Candida albicans to nitric oxide andthe role of the YHB1 gene in nitrosative stress andvirulence. Mol Biol Cell 16: 4814–4826.
Hu, H.C., Wang, Y.Y., and Tsay, Y.F. (2009) AtCIPK8, a CBL-interacting protein kinase, regulates the low-affinity phaseof the primary nitrate response. Plant J 57: 264–278.
Idnurm, A., Reedy, J.L., Nussbaum, J.C., and Heitman, J.(2004) Cryptococcus neoformans virulence gene discoverythrough insertional mutagenesis. Eukaryot Cell 3: 420–429.
Inselsbacher, E., Ripka, K., Klaubauf, S., Fedosoyenko, D.,Hackl, E., Gorfer, M., et al. (2009) A cost-effective high-throughput microcosm system for studying nitrogendynamics at the plant-microbe-soil interface. Plant Soil317: 293–307.
de Jesus-Berrios, M., Liu, L., Nussbaum, J.C., Cox, G.M.,Stamler, J.S., and Heitman, J. (2003) Enzymes that coun-teract nitrosative stress promote fungal virulence. Curr Biol13: 1963–1968.
Joergensen, R.D., and Wichern, F. (2008) Quantitativeassessment of the fungal contribution to microbial tissue insoil. Soil Biol Biochem 40: 2977–2991.
Keller, N.P., Turner, G., and Bennett, J.W. (2005) Fungalsecondary metabolism – from biochemistry to genomics.Nat Rev Microbiol 3: 937–947.
Kim, S.W., Fushinobu, S., Zhou, S., Wakagi, T., and Shoun,H. (2009) Eukaryotic nirK genes encoding copper-containing nitrite reductase: originating from the protomito-chondrion? Appl Environ Microbiol 75: 2652–2658.
Klotz, M.G., and Stein, L.Y. (2008) Nitrifier genomics andevolution of the nitrogen cycle. FEMS Microbiol Lett 278:146–156.
Krouk, G., Crawford, N.M., Coruzzi, G.M., and Tsay, Y.F.(2010) Nitrate signaling: adaptation to fluctuatingenvironments. Curr Opin Plant Biol 13: 1–8.
Kudla, B., Caddick, M.X., Langdon, T., Martinez-Rossi, N.M.,Bennett, C.F., Sibley, S., et al. (1990) The regulatory geneareA mediating nitrogen metabolite repression in Aspergil-lus nidulans. Mutations affecting specificity of gene activa-tion alter a loop residue of a putative zinc finger. EMBO J9: 1355–1364.
Langdon, T., Sheerins, A., Ravagnani, A., Gielkens, M.,Caddick, M.X., and Arst, H.N., Jr (1995) Mutational analy-sis reveals dispensability of the N-terminal region of theAspergillus transcription factor mediating nitrogen metabo-lite repression. Mol Microbiol 17: 877–888.
736 T. Schinko et al. �
© 2010 Blackwell Publishing Ltd, Molecular Microbiology, 78, 720–738
Liu, L., Zeng, M., Hausladen, A., Heitman, J., and Stamler,J.S. (2000) Protection from nitrosative stress by yeastflavohemoglobin. Proc Natl Acad Sci USA 97: 4672–4676.
Margelis, S., D’Souza, C., Small, A.J., Hynes, M.J., Adams,T.H., and Davis, M.A. (2001) Role of glutamine synthetasein nitrogen metabolite repression in Aspergillus nidulans.J Bacteriol 183: 5826–5833.
Marzluf, G.A. (1997) Genetic regulation of nitrogen metabo-lism in the fungi. Microbiol Mol Biol Rev 61: 17–32.
Matsuo, T., Otsubo, Y., Urano, J., Tamanoi, F., and Yama-moto, M. (2007) Loss of the TOR kinase Tor2 mimicsnitrogen starvation and activates the sexual developmentpathway in fission yeast. Mol Cell Biol 27: 3154–3164.
Miller, A.J., Fan, X., Orsel, M., Smith, S.J., and Wells, D.M.(2007) Nitrate transport and signalling. J Exp Bot 58:2297–2306.
de Montaigu, A., Sanz-Luque, E., Galvan, A., and Fernandez,E. (2010) A soluble guanylate cyclase mediates negativesignaling by ammonium on expression of nitrate reductasein Chlamydomonas. Plant Cell 22: 1532–1548.
Morozov, I.Y., Martinez, M.G., Jones, M.G., and Caddick,M.X. (2000) A defined sequence within the 3’ UTR of theareA transcript is sufficient to mediate nitrogen metabolitesignalling via accelerated deadenylation. Mol Microbiol 37:1248–1257.
Morozov, I.Y., Galbis-Martinez, M., Jones, M.G., andCaddick, M.X. (2001) Characterization of nitrogen metabo-lite signalling in Aspergillus via the regulated degradationof areA mRNA. Mol Microbiol 42: 269–277.
Morozov, I.Y., Jones, M.G., Razak, A.A., Rigden, D.J., andCaddick, M.X. (2010) CUCU modification of mRNA pro-motes decapping and transcript degradation in Aspergillusnidulans. Mol Cell Biol 30: 460–469.
Muro-Pastor, M.I., Gonzalez, R., Strauss, J., Narendja, F.,and Scazzocchio, C. (1999) The GATA factor AreA isessential for chromatin remodelling in a eukaryotic bidirec-tional promoter [published erratum appears in EMBO J1999 May 4;18(9):2670]. EMBO J 18: 1584–1597.
Muro-Pastor, M.I., Strauss, J., Ramon, A., and Scazzocchio,C. (2004) A paradoxical mutant GATA factor. Eukaryot Cell3: 393–405.
Narendja, F., Goller, S.P., Wolschek, M., and Strauss, J.(2002) Nitrate and the GATA factor AreA are necessary forin vivo binding of NirA, the pathway-specific transcriptionalactivator of Aspergillus nidulans. Mol Microbiol 44: 573–583.
Nittler, M.P., Hocking-Murray, D., Foo, C.K., and Sil, A. (2005)Identification of Histoplasma capsulatum transcriptsinduced in response to reactive nitrogen species. Mol BiolCell 16: 4792–4813.
Oberegger, H., Schoeser, M., Zadra, I., Abt, B., and Haas, H.(2001) SREA is involved in regulation of siderophore bio-synthesis, utilization and uptake in Aspergillus nidulans.Mol Microbiol 41: 1077–1089.
Ohwaki, Y., Kawagishi-Kobayashi, M., Wakasa, K., Fujihara,S., and Yoneyama, T. (2005) Induction of class-1 non-symbiotic hemoglobin genes by nitrate, nitrite and nitricoxide in cultured rice cells. Plant Cell Physiol 46: 324–331.
Perazzolli, M., Romero-Puertas, M.C., and Delledonne, M.(2006) Modulation of nitric oxide bioactivity by planthaemoglobins. J Exp Bot 57: 479–488.
Pirker, K.F., Severino, J.F., Reichenauer, T.G., andGoodman, B.A. (2008) Free radical processes in green teapolyphenols (GTP) investigated by electron paramagneticresonance (EPR) spectroscopy. Biotechnol Annu Rev 14:349–401.
Pontecorvo, G., Roper, J.A., Hemmons, L.M., MacDonald,K.D., and Bufton, A.W.J. (1953) The genetics of Aspergillusnidulans. Adv Genet 5: 141–238.
Poole, R.K., and Hughes, M.N. (2000) New functions for theancient globin family: bacterial responses to nitric oxideand nitrosative stress. Mol Microbiol 36: 775–783.
Purschwitz, J., Muller, S., Kastner, C., Schoser, M., Haas, H.,Espeso, E.A., et al. (2008) Functional and physical inter-action of blue- and red-light sensors in Aspergillusnidulans. Curr Biol 18: 255–259.
Rastogi, R., Bate, N.J., Sivasankar, S., and Rothstein, S.J.(1997) Footprinting of the spinach nitrite reductase genepromoter reveals the preservation of nitrate regulatory ele-ments between fungi and higher plants. Plant Mol Biol 34:465–476.
Rexach, J., Llamas, A., Fernandez, E., and Galvan, A. (2002)The activity of the high-affinity nitrate transport system I(NRT2;1, NAR2) is responsible for the efficient signalling ofnitrate assimilation genes in Chlamydomonas reinhardtii.Planta 215: 606–611.
Rice, P., Longden, I., and Bleasby, A. (2000) EMBOSS: theEuropean molecular biology open software suite. TrendsGenet 16: 276–277.
Ruepp, A., Zollner, A., Maier, D., Albermann, K., Hani, J.,Mokrejs, M., et al. (2004) The FunCat, a functional anno-tation scheme for systematic classification of proteins fromwhole genomes. Nucleic Acids Res 32: 5539–5545.
Scazzocchio, C. (2000) The fungal GATA factors. Curr OpinMicrobiol 3: 126–131.
Schonig, B., Brown, D.W., Oeser, B., and Tudzynski, B.(2008) Cross-species hybridization with Fusarium verticil-lioides microarrays reveals new insights into Fusariumfujikuroi nitrogen regulation and the role of AreA and NMR.Eukaryot Cell 7: 1831–1846.
Smyth, G.K. (2004) Linear models and empirical bayesmethods for assessing differential expression in microarrayexperiments. Stat Appl Genet Mol Biol 3: Article 3.
Smyth, G.K., and Speed, T. (2003) Normalization of cDNAmicroarray data. Methods 31: 265–273.
Smyth, G.K., Michaud, J., and Scott, H.S. (2005) Use ofwithin-array replicate spots for assessing differentialexpression in microarray experiments. Bioinformatics 21:2067–2075.
Song, M.H., Xu, X.L., Hu, Q.W., Tian, Y.Q., Hua, O.Y., andZhou, C.P. (2007) Interactions of plant species mediatedplant competition for inorganic nitrogen with soil microor-ganisms in an alpine meadow. Plant Soil 297: 127–137.
Staschke, K.A., Dey, S., Zaborske, J.M., Palam, L.R.,McClintick, J.N., Pan, T., et al. (2010) Integration of generalamino acid control and target of rapamycin (TOR) regula-tory pathways in nitrogen assimilation in yeast. J Biol Chem285: 16893–16911.
Strauss, J., Muro-Pastor, M.I., and Scazzocchio, C. (1998)The regulator of nitrate assimilation in ascomycetes is adimer which binds a nonrepeated, asymmetrical sequence.Mol Cell Biol 18: 1339–1348.
Aspergillus nitrate transcriptome 737
© 2010 Blackwell Publishing Ltd, Molecular Microbiology, 78, 720–738

Takaya, N. (2002) Dissimilatory nitrate reduction metabo-lisms and their control in fungi. J Biosci Bioeng 94: 506–510.
Te Biesebeke, R., Levasseur, A., Boussier, A., Record, E.,Hondel, C.A., and Punt, P.J. (2010) Phylogeny of fungalhemoglobins and expression analysis of the Aspergillusoryzae flavohemoglobin gene fhbA during hyphal growth.Mycol Res 114: 135–143.
Todd, R.B., Fraser, J.A., Wong, K.H., Davis, M.A., and Hynes,M.J. (2005) Nuclear accumulation of the GATA factor AreAin response to complete nitrogen starvation by regulation ofnuclear export. Eukaryot Cell 4: 1646–1653.
Unkles, S.E., Hawker, K.L., Grieve, C., Campbell, E.I., Mon-tague, P., and Kinghorn, J.R. (1991) crnA encodes a nitratetransporter in Aspergillus nidulans [published errataappear in Proc Natl Acad Sci USA 1991 May15;88(10):4564 and 1995 Mar 28;92(7):3076]. Proc NatlAcad Sci USA 88: 204–208.
Unkles, S.E., Zhou, D., Siddiqi, M.Y., Kinghorn, J.R., andGlass, A.D. (2001) Apparent genetic redundancy facilitatesecological plasticity for nitrate transport. EMBO J 20:6246–6255.
Walter, M.C., Rattei, T., Arnold, R., Guldener, U., Munsterkot-ter, M., Nenova, K., et al. (2009) PEDANT covers all com-plete RefSeq genomes. Nucleic Acids Res 37: D408–D411.
Wang, R., Guegler, K., LaBrie, S.T., and Crawford, N.M.(2000) Genomic analysis of a nutrient response in Arabi-dopsis reveals diverse expression patterns and novelmetabolic and potential regulatory genes induced bynitrate. Plant Cell 12: 1491–1509.
Wang, R., Okamoto, M., Xing, X., and Crawford, N.M. (2003)Microarray analysis of the nitrate response in Arabidopsisroots and shoots reveals over 1,000 rapidly respondinggenes and new linkages to glucose, trehalose-6-phosphate, iron, and sulfate metabolism. Plant Physiol132: 556–567.
Wang, Y., Li, W., Siddiqi, Y., Symington, V.F., Kinghorn, J.R.,Unkles, S.E., and Glass, A.D. (2008) Nitrite transport is
mediated by the nitrite-specific high-affinity NitA transporterand by nitrate transporters NrtA, NrtB in Aspergillusnidulans. Fungal Genet Biol 45: 94–102.
Wong, K.H., Hynes, M.J., Todd, R.B., and Davis, M.A. (2007)Transcriptional control of nmrA by the bZIP transcriptionfactor MeaB reveals a new level of nitrogen regulation inAspergillus nidulans. Mol Microbiol 66: 534–551.
Xu, Y., Cao, Y., Tao, Y., and Zhao, B. (2005) The ESR methodto determine nitric oxide in plants. Methods Enzymol 396:84–92.
Yamasaki, H. (2000) Nitrite-dependent nitric oxide productionpathway: implications for involvement of active nitrogenspecies in photoinhibition in vivo. Philos Trans R Soc LondB Biol Sci 355: 1477–1488.
Yu, J.H., Hamari, Z., Han, K.H., Seo, J.A., Reyes-Dominguez, Y., and Scazzocchio, C. (2004) Double-jointPCR: a PCR-based molecular tool for gene manipulationsin filamentous fungi. Fungal Genet Biol 41: 973–981.
Zhang, H., and Forde, B.G. (2000) Regulation of Arabidopsisroot development by nitrate availability. J Exp Bot 51:51–59.
Zhou, S., Fushinobu, S., Nakanishi, Y., Kim, S.W., Wakagi, T.,and Shoun, H. (2009) Cloning and characterization of twoflavohemoglobins from Aspergillus oryzae. BiochemBiophys Res Commun 381: 7–11.
Zhou, S., Fushinobu, S., Kim, S.W., Nakanishi, Y., Wakagi, T.,and Shoun, H. (2010) Aspergillus oryzae flavohemoglobinspromote oxidative damage by hydrogen peroxide. BiochemBiophys Res Commun 394: 558–561.
Supporting information
Additional supporting information may be found in the onlineversion of this article.
Please note: Wiley-Blackwell are not responsible for thecontent or functionality of any supporting materials suppliedby the authors. Any queries (other than missing material)should be directed to the corresponding author for the article.
738 T. Schinko et al. �
© 2010 Blackwell Publishing Ltd, Molecular Microbiology, 78, 720–738
1
Supporting Information on Experimental Procedures and Materials
Growth conditions for different nitrogen treatments and genetic techniques
A. nidulans strains were grown for 14 h at 37°C in a rotary shaker (180 rpm). (L)-arginine (3
mM) served as nitrogen source for pre-growth, except for the microarray experiment in which
ammonium was sued as N-source. After pre-cultivation biomass was collected by filtration
through Miracloth (Calbiochem), washed with sterile GMM, and resuspended in fresh GMM
(120 ml) lacking any nitrogen source. Aliquots (30 ml) were further incubated for 30 minutes
in this medium and subsequently different nitrogen sources were added to specify the
condition. Repressed [NH4], 5 mM di-ammonium tartrate; repressed-induced NO [NH4NO], 5
mM di-ammonium (D)-tartrate + 1.5 mM DetaNONOate; non induced [NI], 3 mM (L)-
arginine; induced NO3- [NO3], 3 mM (L)-arginine + 10 mM NaNO3; induced nitric oxide
(Adams et al.): 3 mM (L)-arginine + 1.5 mM DetaNONOate). Biomass was harvested by
filtration, washed with cold deionised H2O and biomass was split into portions for subsequent
parallel analysis of different markers (nitrate reductase activity assay, transcriptional analysis,
and measurement of intracellular nitrate/ nitrite or nitric oxide). Transformation of A. nidulans
strains was performed as described (Tilburn et al., 1983) using 500ng of PCR fragment.
Correct integration events for the fhbA and fhbB deletion PCR fragments were verified by
Southern and PCR analysis using primers flav 35 P F check / flav35 T R check or flav 71 P F
check / flav 71 T R check, respectively (primer sequences are given in Supporting Table ST
8).
Growth conditions for the generation of RNA for transcriptome analysis
After pregrowth on GMM for 16 hours with 5mM di-ammonium-tartrate as nitrogen source
cells were harvested, washed and replaced in fresh minimal media either lacking any nitrogen
source (for induced and starved conditions) or containing 10mM ammonium (for repressed

2
conditions). After 30 minutes of incubation in N-free medium, 10mM NaNO3 (in 2ml of 1M
NaNO3) was added to generate inducing conditions, or 2 ml sterile water was added to
generate N-starved conditions. Both types of samples were further incubated for 30 minutes
before harvesting for RNA extraction. For generating repressed conditions, cells incubated on
10 mM NH4+ were further incubated for 30 minutes on this nitrogen source and finally
harvested for RNA extraction. Mycelia were harvested by filtration and quickly frozen in
liquid nitrogen. For total RNA isolation, the mycelia were disrupted by grinding in liquid
nitrogen and total RNA was extracted with Trizol reagent (Invitrogen). Ten micrograms of
RNA from each treatment were then fractionated in a 0.8% agarose gel, stained with ethidium
bromide, and then visualized with UV-light. The presence of intact 28S and 18S ribosomal
RNA bands was used as a criterion to assess the integrity of the RNA. For the wild type
experiments comparing repressed versus induced conditions seven biologically independent
experiments were performed and analyzed separately. For the experiments comparing wild
type repressed versus N-starved and nirA- comparing repressed versus induced, four
independent experiments were performed each and analyzed separately. From each
experiment 10 µg of total RNA samples were labelled by incorporation of aminoallyl-dUTP
followed by a coupling of the aminoallyl groups to either Cyanine-3 or Cyanine-5 and
hybridized according to the provided protocol (see protocols at
http://pfgrc.tigr.org/protocols.shtml). For scanning, an Agilent DNA Microarray scanner G 25
65 B was used to obtain TIFF files. These were processed using Agilent Feature extractor
software version 9.1.
Determination of intracellular amino acid pools
For determination of intracellular free amino acid pools, wild type cells were incubated in
triplicate under the conditions described above. Samples were harvested after 16h pre-growth
(time point -30 min.), and after the 30 min. incubation time on N-free medium (time point 0
3
min.). For the induction experiment, 10mM NaNO3 was added to the medium and samples
were harvested after 10, 20, 30, 40, 50, 60, 90, 120 and 180 minutes of incubation on the
inducing medium. For the starvation experiment, samples were harvested directly after pre-
growth on ammonium (time point -30 min.), after the initial incubation on N-free medium
(time point 0 min.) and subsequently after 30, 60, 90 and 120 minutes of incubation in N-free
medium. Treatment of cells for determination of intracellular free amino acid pools and
subsequent analysis was performed as described previously (Berger et al., 2008).
Northern Blot analysis
Total RNA was isolated from frozen mycelia using TRIzol ® Reagent (Invitrogen, USA) and
previously published protocols were applied for Northern blotting and hybridization(Narendja
et al., 2002). Membranes were hybridized with 32P (PerkinElmer) labelled probes derived
from PCR products of niaD, niiA, fhbA, acnA and 18S genes (see Supporting Table ST 8 for
primer sequences). Hybridization signals were analyzed on a phosphoimager (Storm;
Molecular Dynamics, Inc.) and signal intensities were quantified using the Image-Quant
(Molecular Dynamics) software. Specific signals were normalized to actin (acnA) or 18S
values used as loading controls. Calculations included at least two independent biological
experiments.
Construction of fhbA and fhbB deletion cassettes
The two putative flavohemoglobin genes designated flavohemoglobin A (fhbA, AN7169.3),
and flavohemoglobin B (fhbB, AN3522.3), were deleted using overlapping chimeric PCR
fragments constructed according to published procedures (Yu et al., 2004). Primer sequences
used for construction of the deletion cassettes are listed in Supporting Table ST 8. For cloning
the arginine auxotrophy marker argB (AN04409) sequence obtained from pMS12
(http://www.fgsc.net/plasmid/nidplas.html), harbouring a ClaI restriction site at the 5’-end or
4
a BamHI restriction site at the 3’-end, was used. The upstream region of AN3522.3 was
amplified with primers flav 35 Pr F and flav 35 Pr R ClaI using REDTaq® ReadyMix™
(Sigma Aldrich) from genomic wild type DNA and the resulting fragment (∼ 3.9 kb) was
ligated to argB via generated ClaI site. The downstream fragment of the AN3522.3 was
amplified using primers flav 35 T F BamHI and flav 35 T R ligated to argB via introduced
BamHI restriction site. The chimeric ligation products fragments were used for High Fidelity
PCR Mix (Fermentas) with primers flav 35 Pr F / arg flavo ko R and arg flavo ko F / flav 35 T
R, respectively. 1 µg of each PCR product was used for transformation. The construction of
the AN7169.3 deletion cassette followed the same scheme. AN7169.3 upstream region was
obtained by PCR using primers flav 71 Pr F and flav 71 Pr R EcoRI and ligated to an argB
fragment bearing a EcoRI restriction site at the 5’-end. The downstream sequence of
AN7169.3 was obtained using primers flav 71 T F ClaI and flav 71 T R and ligation to argB
coding sequence possessing a ClaI at the 3’-end. The chimeric fragments were amplified
using High Fidelity PCR Mix (Fermentas) with primers combination flav 71 pr F / arg flavo
ko R or arg flavo ko F / flav 71 T R, and 1 µg of PCR product was used for transformation.
Construction of nirA deletion cassettes
A complete nirA (AN0098) deletion mutant was generated by replacement of nirA open
reading frame (ORF) by riboBfum (Afu1g13300) coding sequence complementing riboflavin
auxotrophy. The upstream region of AN0098 was amplified with primers nirA Pr-1790 F and
nirA Pr-1 ClaI R using REDTaq® ReadyMix™ (Sigma Aldrich) and genomic wild type DNA.
Likewise the downstream region was amplified with primers nirA T+1 BamHI F and nirA
T+1658 R. Together with the riboBfum fragment, possessing a ClaI and BamHI restriction site,
the promoter (∼ 1.7 kb) and terminator (∼ 1.7 kb) fragments were ligated into pGEM-Teasy
plasmid (Promega) obtaining the nirA deletion cassette. For transformation the cassette was

5
NotI released from the plasmid and 1 µg of the linear fragment used for transformation.
Deletion of nirA was screened by PCR using primers nirA Pr-1790 F / nirA 557 R and
confirmed by Southern blot analysis.
Construction of niaD deletion cassettes
To generate a nitrate reductase (niaD) mutant in a nitrate transporter deficient A. nidulans
strain the AN1006 ORF was disrupted and partially deleted by the insertion of an argB coding
sequence derived from pMS12. The 5’-fragment of the niaD ORF was amplified by PCR
using genomic wild type DNA and primer niaD ATG F and niaD 1428 EcoRI R. Use of
primer niaD 1557 BamHI F and niaD 2957 R yielded the 3’-fragment of the niaD ORF.
Together with the argB coding fragment, possessing EcoRI and BamHI restriction site, the 5’-
ORF (∼ 1.4 kb) and 3’-ORF (∼ 1.4 kb) fragments were ligated into pGEM-Teasy plasmid
(Promega) via T/A overhangs obtaining the niaD deletion cassette. For transformation the
cassette was NotI released from the plasmid and 1 µg of the linear fragment used for
transformation of strain crnA- crnB-. niaD replacement was screened by PCR using primer
niaD F / arg flavo ko R and niaD ATG F / niaD 2957 R and confirmed by Southern blot
analysis.
Intracellular NO3-and NO2
- measurements
The method is based on published procedures by Narendja et al., 2002, Miranda et al., 2001
and Inselbacher et al., 2009 with minor modifications as described herein. Approximately 150
mg frozen mycelia (wet weight) were extracted with 1 ml 70% ethanol, using 200 µl glass
beads (0,75-1 mm, Roth) in a RiboLyser (Hybaid, amplitude 4.5, 45 seconds). After pelleting
of cell debris (Biofuge pico, Heraeus, 13,000rpm, 4°C) the supernatant was transferred into a
fresh 2 ml Eppendorf tube, and the pellet re-extraced once again. Pooled phases were
evaporated in a Speed Vac Concentrator (Savant). Until further analysis samples were stored

6
at -20 °C. Dried sample were dissolved in 600 µl bi-destilled water and turbidity reduced by
extraction with equal volume of chloroform. Further measurement was performed in 96 wells
microtitre plates. 50 µl of the aqueous layer were mixed with 50 µl vanadium(III)chloride
solution (Sigma, 0.8% (w/v) in 1 M HCl) chemically reducing present NO3- to NO2
-.
Subsequently, 50 µl of a 1:1 mix of N-(1-Naphthyl)ethylendiamine didydrochloride (Sigma,
NEDD, 0.02% (w/v)) and sulfanilamide (Sigma, SULF, 1% (w/v)) were added and the plate
incubated at 37 °C for 45 minutes. Absorbance of the coloured product was measured at 540
nm using a plate reader (Victor2, Wallac, 1420 Multilabel Counter) representing total NO2-
levels. To quantify NO2- concentrations addition of vanadium(III)chloride was skipped.
Nitrogen standards, NO3- or NO2
-, ranging from 0.02 to 5 ppm nitrogen were used for
calculation of NO3- and NO2
- values. NO3- was calculated as difference of total NO2
-,
including chemically reduced NO3-, and intrinsic NO2
- amounts. Detected µg of NO3- or NO2
-
were normalized to dry weight (DW) values of the extracted biomass, after 72 h at 60°C,
resulting in µg NO3- or NO2
- g-1 DW ratios. For detection of low NO3- values in presence of
high NO2- background the analytical setup was limited. Analysis of NO3
- standards in
presence of increasing NO2- showed bias from standard dilutions without NO2
- addition.
Therefore, NO3- levels of WT [NO], fhbAΔ fhbBΔ [NO] and nirA- [NO] samples, showing
high NO2- concentrations, are regarded as non detectable (n.d.). Results of a representative
experiment, including standard deviation of a technical repetition are given in Figure 6.
Nitrate reductase (NR) activity assay.
After cultivation on various N-sources, 200 mg mycelia (wet weight) were directly processed
without an intermediate freezing step. Aliquots were placed in 1.5 ml reaction tubes
containing 500 µl glass beads (0.75-1 mm) and 500 µl pre-chilled protein extraction buffer
(100 mM phosphate buffer pH 7.5, 1 mM EDTA, 1 mM PMSF and a protease inhibitors
(Sigma). Cells were broken using the Ribolyzer (Hybaid) at settings amplitude 4.5 for 35

7
seconds. Prior and after cell disruption samples were cooled on ice. Cell debris was
sedimented by centrifugation (4°C, 13,000 rpm, 15 min), the supernatant was recovered and
stored on ice until further use. The protein concentration of cell lysates was determined using
BCA assay (Pierce) and samples were diluted to a protein concentration of 1 mg/ml. The
nitrate reductase assay mixture comprised 100 µl 8 mM NaNO3, 50 µl NAD(P)H/FAD
solution, prepared according to manufacturer’s instructions (Roche), and 4 µl protein extract
(1 mg/ml) or 4 µl fungal nitrate reductase (0,005 – 1 U/ml) supplied with the kit. Mixtures
were incubated at 25°C for 30 minutes before addition of 50 µl colour reagent I and 50 µl
colour reagent II. The reaction of NO2- with sulfanilamide and N-(1-naphthyl)-ethylene-
diamine resulting in the diazo-dye adduct was detected (540 nm) after 15 minutes of
incubation in the dark. Units were calculated by referring to the linear range of the nitrate
reductase calibration curve obtained with purified NR from the kit.

Supplementary Table 1
Amino acid levels (nmol/mg DW) in the wild type at time point 0 (after starvation period of 30 min.) and subsequently after induction by 10 mM NO3
time[min]mean sd mean sd mean sd mean sd mean sd mean sd mean sd mean sd mean sd mean sd
Asp 11,45 2,34 14,54 3,71 14,86 4,87 14,66 3,34 12,46 4,01 11,16 2,94 8,52 0,44 8,37 0,99 9,39 1,06 12,05 1,74Glu 61,77 1,71 68,53 1,46 68,31 3,72 69,05 1,46 60,66 0,86 54,75 2,43 49,96 5,42 54,64 6,13 57,55 0,63 63,04 8,72Asn 14,49 1,48 14,41 0,10 10,67 0,76 7,07 1,01 4,11 0,79 3,04 1,33 2,69 0,95 3,95 1,06 4,58 0,68 6,28 0,853Ser 7,62 0,95 8,25 0,15 8,06 0,49 7,33 1,29 6,72 0,56 7,07 0,42 7,21 0,68 7,07 1,19 6,70 0,09 7,63 1,146His 4,08 0,47 4,40 0,62 4,20 0,17 4,50 0,04 5,09 1,62 5,40 1,35 4,85 1,31 2,90 0,64 2,44 0,64 2,29 0,771Gln 61,82 10,56 58,69 5,24 47,75 4,44 34,98 9,80 20,99 9,64 16,78 9,23 22,78 6,39 60,82 2,37 49,82 3,58 70,07 2,754Gly 7,32 2,36 7,35 0,38 6,82 1,43 5,03 1,97 3,63 1,17 2,94 1,13 2,72 1,08 2,31 1,20 1,83 0,77 2,39 1,208Thr 3,18 0,02 3,14 0,01 3,05 0,02 2,78 0,18 2,65 0,44 2,53 0,38 2,32 0,37 2,16 0,21 2,10 0,03 2,54 0,226Arg 32,08 3,54 33,88 3,07 33,47 2,03 34,49 4,14 30,20 2,91 30,63 1,04 29,83 1,42 26,79 4,21 23,92 1,53 23,58 3,166Ala 12,33 5,91 13,58 2,92 14,90 4,02 11,95 4,57 9,53 4,88 7,51 5,05 7,20 4,78 12,00 5,51 10,57 2,31 16,73 4,173Tyr 1,07 0,46 0,92 0,37 0,84 0,36 0,80 0,40 0,76 0,37 0,77 0,31 0,74 0,28 0,82 0,43 0,74 0,43 0,82 0,404Val 2,58 0,63 2,28 0,76 1,89 0,64 1,69 0,60 1,66 0,60 1,62 0,63 1,55 0,63 1,76 0,89 1,49 0,61 1,76 0,751Ile 0,89 0,12 0,76 0,18 0,63 0,15 0,55 0,14 0,54 0,14 0,54 0,17 0,51 0,18 0,53 0,30 0,45 0,23 0,58 0,297Phe 0,25 0,10 0,18 0,06 0,15 0,04 0,14 0,03 0,15 0,04 0,21 0,05 0,22 0,03 0,24 0,10 0,20 0,09 0,26 0,133Leu 1,00 0,30 0,82 0,25 0,87 0,19 0,86 0,16 0,96 0,20 1,07 0,13 1,07 0,17 0,98 0,47 0,87 0,37 1,04 0,431Lys 16,52 3,45 17,11 2,78 17,17 3,77 17,26 4,07 15,10 3,97 14,51 1,69 6,17 0,86 11,39 5,04 9,98 4,66 9,53 4,616Met 0,48 0,12 0,44 0,05 0,44 0,00 0,40 0,05 0,37 0,00 0,40 0,01 0,39 0,01 0,44 0,05 0,42 0,04 0,52 0,05
Amino acid levels (nmol/mg DW)in the wild type at the beginning of starvation period (-30), at time point 0 (after starvation period of 30 min.) and subsequent incubation in the absence of any nitrogen source
time[min]mean sd mean sd mean sd mean sd mean sd mean sd
Asp 13,21 1,33 7,507 0,179 20,27 0,369 22,99 0,777 19,6 1,734 17,67 1,363Glu 65,17 5,05 44,14 0,945 74,4 1,12 66,94 1,753 48,76 2,439 54,65 3,543Asn 18,72 1,95 20,05 0,662 18,93 0,183 10,66 0,397 1,98 0,24 1,7 0,298Ser 8,632 0,45 6,387 0,395 9,138 0,159 6,946 0,168 5,972 0,007 6,912 0,753His 6,895 0,56 5,52 0,268 5,959 0,167 6,177 0,234 6,717 1,046 6,414 0,716Gln 148,3 9,14 94,24 2,291 61,9 0,861 32,36 0,953 7,218 0,305 9,254 0,737Gly 7,132 0,29 5,43 0,859 6,596 0,103 4,118 0,127 2,604 0,069 3,183 0,645Thr 3,196 0,2 3,329 0,097 3,371 0,04 2,744 0,191 2,904 0,294 3,162 0,428Arg 41,19 2,81 35,01 0,921 39,67 0,458 36,54 1,038 33,3 0,99 31,25 2,871Ala 37,62 1,23 23,67 0,292 20,89 0,507 13,98 0,047 5,761 0,022 8,546 1,026Tyr 1,392 0,05 1,911 0,045 1,455 0,131 1,198 0,027 1,368 0,026 1,263 0,084Val 2,44 0,2 4,147 0,114 2,513 0,022 1,537 0,02 1,492 0,102 1,516 0,259Ile 0,911 0,06 1,756 0,072 0,908 0,006 0,517 0,007 0,781 0,015 0,72 0,081Phe 0 0 0 0 0 0 0,132 0,015 0,314 0,16 0,497 0,102Leu 0,895 0,04 1,766 0,032 0,957 0,02 0,918 0,011 1,452 0,052 1,32 0,208Lys 16,61 0,67 15,25 0,293 18,48 0,463 16,76 0,523 15,37 0,573 15,94 1,851Met 0,412 0 0,316 0,014 0,273 0,043 0,341 0,018 0,376 0,023 0,367 0,077
-30 0 30 60 90 120
0 10 20 30 120 18040 50 60 90
Supporting Table ST 1. Levels of free amino acids determined by HPLC according to
previously published procedures (Berger et al., 2008). The mean of three independent
experiments are shown along with the calculated standard deviation (sd).

Supporting Table ST 2A: Functional Categories (FunCat) FunCat 6(-d-) 45(d--) 3(--u) 4(-u-) 72(u--) 1(u-u) 1(uu-) 3(uuu)amino acid metabolism (01.01) 1 1 8 1 1 1nitrogen, sulfur and selenium metabolism (01.02) 1 5 1 1 1nucleotide/nucleoside/nucleobase metabolism (01.03) 2phosphate metabolism (01.04) 1C-compound and carbohydrate metabolism (01.05) 1 2 7lipid, fatty acid and isoprenoid metabolism (01.06) 2 4metabolism of vitamins, cofactors, and prosthetic groups (01.07) 1secondary metabolism (01.20) 2 4glycolysis and gluconeogenesis (02.01) 2anaplerotic reactions (02.09) 1tricarboxylic-acid pathway (citrate cycle, Krebs cycle, TCA cycle) (02.10) 2 1electron transport and membrane-associated energy conservation (02.11) 1respiration (02.13) 1fermentation (02.16) 1energy conversion and regeneration (02.45) 1DNA processing (10.01) 1cell cycle (10.03) 2 1RNA synthesis (11.02) 1 1RNA processing (11.04) 1 2protein folding and stabilization (14.01) 2protein modification (14.07) 1 2protein/peptide degradation (14.13) 1 2protein binding (16.01) 2nucleic acid binding (16.03) 2nucleotide/nucleoside/nucleobase binding (16.19) 1complex cofactor/cosubstrate/vitamine binding (16.21) 4 1transported compounds (substrates) (20.01) 2 1 1 13 2transport facilities (20.03) 1 1 8 1transport routes (20.09) 1 1 1 5 1cellular signalling (30.01) 1stress response (32.01) 1 6disease, virulence and defense (32.05) 1 3detoxification (32.07) 1 2degradation / modification of foreign (exogenous) compounds (32.10) 1homeostasis (34.01) 2 2cellular sensing and response to external stimulus (34.11) 1 3cell wall (42.01) 2 1 1fungal/microorganismic cell type differentiation (43.01) 1 2 1 Supporting Table ST2A. Number of DEGs asssigned to functional classifications (reduced
to the a second level). The total number of genes affected by the three different conditions are
given in front of the brackets, symbols within brackets are according to nomenclature used in
the VENN diagram (Figure 2). d, down-regulated, u, up-regulated. The sum of the individual
FunCat-assigned genes can exceed the total number of DEGs for a given condition because
one gene can be assigned to more than category

Supportiung Table ST2B: Significantly over-represented categories FunCat 6(-d-) 45(d--) 3(--u) 4(-u-) 72(u--) 1(u-u) 1(uu-) 3(uuu)amino acid metabolism (01.01) 8 1 1nitrogen, sulfur and selenium metabolism (01.02) 5 1 1anaplerotic reactions (02.09) 1tricarboxylic-acid pathway (citrate cycle, Krebs cycle, TCA cycle) (02.10) 2 1transported compounds (substrates) (20.01) 13 2transport facilities (20.03) 8homeostasis (34.01) 2cell wall (42.01) 1 Supporting Table ST2B. Number of genes asssigned to functional classifications (reduced to
the a second level). Only categories which are significantly overrepresented compared to the
genomic distribution are shown.

Supporting Table 3. A. nidulans genes that positively respond to NO3 induction in the wild type
Gene number1 ratio2 P-value known or putative function3 NirA-BS4
AN1007 5,90 2,64E-07 niiA ; nitrite reductase 2 [IGR]AN0399 5,31 4,40E-09 crnB (nrtB) ; NO3 transporter high affinity -454AN5120 4,90 1,08E-02 hypothetical protein -379AN2134 4,90 1,58E-02 conserved hypothetical proteinAN7539 4,77 7,27E-10 putative hydrophobin AN3206 4,69 1,75E-02 similar to glucose-methanol-choline (GMC) oxidoreductases AN7343 4,50 1,93E-02 predicted Zn(II)2Cys6-domain containing transcription factorAN11493 4,42 2,02E-02 hypothetical protein (predicted 54 aa)AN3968 4,13 2,36E-02 conserved hypothetical proteinAN1008 4,02 1,85E-07 crnA (nrtA) ; NO3 transport high affinity -767AN11628 3,89 2,71E-02 hypothetical protein (predicted 51 aa)AN1006 3,85 9,39E-07 niaD ; nitrate reductase 2 [IGR]AN1791 3,85 2,77E-02 conserved hypothetical proteinAN5405 3,81 2,84E-02 predicted bZIP-containing transcription factor similar to stress-induced XBP1AN5558 3,62 4,89E-08 alp1 ; starvation-induced vacuolar proteaseAN10464 3,60 3,22E-02 conserved hypothetical protein -84AN7169 3,60 7,66E-07 fhbA ; NirA-dependent flavohemoglobin -225AN0180 3,59 3,17E-03 predicted enoyl-coA hydratase involved in acetyl coA and lipid metabolismAN11316 3,53 3,37E-02 hypothetical protein (predicted 55 aa)AN3541 3,53 3,38E-02 conserved hypothetical proteinAN1261 3,51 2,74E-02 conserved hypothetical proteinAN1659 3,50 2,80E-08 predicted amino acid transporterAN2834 3,43 3,59E-02 conserved hypothetical protein with similarity to GDSL-type lipaseAN1737 3,43 3,61E-02 conserved hypothetical protein with predicted cyt. P450 domainAN10289 3,39 3,70E-02 predicted SM-related DMATS-type aromatic prenyltransferasesAN7988 3,39 3,70E-02 conserved hypothetical proteinAN6414 3,39 3,70E-02 conserved hypothetical protein with predicted cyt. P450 domain -673
1 Gene number according to Fungal Genome Database at Broad Institute2 ratio between NH4-repressed and NO3-induced cells expressed as log2 value3 established gene function or predicted function according to CADRE Initiative annotation4 NirA binding sites have been studied for the 4 sites present in the niiA-niaD intergenic region (IGR)
position of other binding sites are derived from bioinformatic analysis of -1kb regions

Gene number1 ratio2 P-value known or putative function3 NirA-BS4
AN9242 3,37 1,82E-02 conserved hypothetical protein AN11030 3,32 3,87E-02 predicted NADP-coupled glycerol dehydrogenaseAN6942 3,28 3,97E-02 conserved hypothetical proteinAN7358 3,20 1,15E-02 predicted dihydroxy-acid dehydratase; biosynthesis of Val, Leu, Iso and coA AN3611 3,20 4,21E-02 conserved hypothetical protein -500AN3340 3,16 4,31E-02 conserved hypothetical proteinAN11471 3,16 4,32E-02 hypothetical protein (predicted 51 aa)AN10188 3,16 4,32E-02 conserved hypothetical protein with guanylate kinase domain -767AN0587 3,12 4,46E-02 conserved hypothetical protein with similarity to HSP70 chaperoneAN6410 3,06 4,62E-02 conserved hypothetical proteinAN2793 3,04 4,82E-09 leu2B ; isopropylmalat-dehydrogenase involved in Leu and Glu biosynthesis AN9215 3,04 4,72E-02 hypothetical proteinAN8027 3,03 1,56E-02 conserved hypothetical proteinAN10431 3,02 4,76E-02 conserved hypothetical protein -844AN7222 3,02 4,76E-02 conserved hypothetical protein with GTP-binding domainAN4367 2,99 4,89E-02 predicted class-III chitin synthetaseAN9185 2,98 4,91E-02 conserved hypothetical proteinAN10049 2,76 7,39E-03 scytalone dehydratase involved in monodictyphenone biosynthesisAN11046 2,72 1,24E-06 conserved hypothetical proteinAN5886 2,71 6,25E-06 luA ; isopropylmalat isomerase involved in biosynthesis of LeuAN8445 2,65 1,09E-05 predicted mainopeptoidase-Y involved in vacuolar protein degradationAN6633 2,53 3,03E-02 conserved hypothetical proteinAN2602 2,53 3,45E-02 conserved hypothetical protein with lipase/esterase domainAN3181 2,51 7,72E-05 conserved hypothetical protein with protein kinase domain -918AN3504 2,50 6,90E-03 conserved hypothetical protein with similarity to alpha-glucosidase AN2944 2,46 2,30E-07 tamA; transcriptional co-actictivator interacting with AreAAN8647 2,44 4,39E-05 nitA; nitrite transporter -344AN6933 2,44 5,86E-03 conserved hypothetical protein with similarity to mitochondrial malic enzyme
1 Gene number according to Fungal Genome Database at Broad Institute2 ratio between NH4-repressed and NO3-induced cells expressed as log2 value3 established gene function or predicted function according to CADRE Initiative annotation4 NirA binding sites have been studied for the 4 sites present in the niiA-niaD intergenic region (IGR)
position of other binding sites are derived from bioinformatic analysis of -1kb regions

Gene number1 ratio2 P-value known or putative function3 NirA-BS4
AN6118 2,41 1,31E-02 conserved hypothetical protein with similarity to amino acid transportersAN9329 2,40 1,68E-02 conserved hypothetical proteinAN5771 2,34 1,82E-03 conserved hypothetical proteinAN0660 2,34 4,91E-04 furA ; allantoin transporter proteinAN1061 2,25 7,19E-06 conserved hypothetical protein with similarity to GABA permeasesAN0627 2,25 1,53E-08 conserved hypothetical protein with PI-3-P membrane binding domain -803AN0811 2,23 2,23E-02 conserved hypothetical protein with similarity to amino acid transportersAN7769 2,23 3,24E-02 conserved hypothetical proteinAN6076 2,19 2,78E-02 conserved hypothetical protein with SNF2-type helicase domainAN8439 2,16 4,06E-02 conserved hypothetical protein -598AN0380 2,14 4,75E-02 conserved hypothetical protein with similarity to prolyl cis-trans isomerases -644AN11489 2,14 2,89E-11 hypothetical protein (predicted 23 aa)AN9451 2,08 1,22E-08 conserved hypothetical proteinAN8557 2,06 3,79E-02 conserved hypothetical proteinAN8558 2,05 4,11E-02 conserved hypothetical proteinAN0628 2,00 3,33E-04 predicted D-lactate dehydrogenase involved in pyruvate-acetyl-coA metabolism

Supporting Table 4. A. nidulans genes that positively respond to N-limitation in the wild type and nirA - strain
Gene number1 Group3 ratio e2 P-value ratio e3 P-value known or putative function4
WT- N
AN8903 (-u-) 3,27 1,07E-02 1,64 2,31E-03 hypothetical protein with similarity to MFS-family peptide transporter AN2572 (-u-) 2,94 2,29E-02 0,81 4,03E-04 hypothetical protein with similarity to dipeptidyl-peptidaseAN1404 (-u-) 2,57 1,66E-02 -2,43 2,61E-01 conserved hypothetical protein with predicted diacylglycerol kinase domainAN1927 (-u-) 2,39 1,22E-02 0,58 6,00E-01 predicted Zn(II)2Cys6-domain containing transcription factor
WT- N WTNO3
AN4159 (uu-) 2,22 1,16E-02 1,98 3,14E-03 glnA ; glutamine synthetaseWT all
AN0418 (uuu) 3,85 1,05E-03 2,88 3,90E-05 dur3 ; urea transporterAN4376 (uuu) 3,18 3,73E-04 4,97 5,33E-09 gdhA ; NADP-specific glutamate dehydrogenaseAN7463 (uuu) 2,43 7,42E-04 4,50 2,16E-06 meaA ; low affinity ammonium transporter
WT/nirANO3
AN5134 (u-u) 1,58 1,87E-02 2,76 6,10E-06 gltA ; NAD-specific glutamate dehydrogenasenirANO3
AN3991 (--u) 1,96 4,71E-02 5,82 9,77E-03 hypothetical protein with similarity to glucuronyl hydrolasesAN7183 (--u) 1,04 2,00E-01 2,90 5,34E-03 conserved hypothetical protein AN1731 (--u) 0,31 4,27E-01 2,27 2,77E-04 prnD ; proline dehydrogenase
1 Gene number according to Fungal Genome Database at Broad Institute2 ratio between two conditions in each of the experiments expressed as log2 value3 (-u-), upregulated in WT/ -N (e2); (uu-), upregulated in WT -N (e2) and WT/NO 3 (e1); (uuu), upregulated in (e1), (e2) and (e3)
(u-u), upregulated in WT/-N (e2) and nirA -/NO3 (e3); (--u), upregulated in nirA -/NO3
4 established gene function or predicted function according to CADRE Initiative annotation
ratios in different experiments2

Supporting Table 5. A. nidulans genes that negatively respond to NO3 induction in the wild type
Gene number1 ratio2 P-value known or putative function3
AN11308 -4,29 2,16E-02 hypothetical proteinAN10470 -4,00 2,53E-02 predicted DNA-polymerase III delta subunitAN8788 -4,00 7,40E-04 Mariner-6 transposase; overlaps with monocarboxylate transporterAN11326 -3,77 2,91E-02 hypothetical proteinAN7811 -3,74 2,96E-02 stcO; sterigmatocystin biosynthesis geneAN1587 -3,67 3,09E-02 hypothetical proteinAN11293 -3,64 3,14E-02 hypothetical proteinAN5326 -3,62 3,18E-02 conserved hypothetical proteinAN11624 -3,62 3,19E-02 hypothetical proteinAN8435 -3,57 3,30E-02 hypothetical proteinAN11403 -3,54 7,98E-03 hypothetical proteinAN10951 -3,42 3,73E-03 conserved hypothetical proteinAN11255 -3,40 3,67E-02 hypothetical proteinAN6001 -3,35 3,79E-02 asperthicin-biosynthesis geneAN7772 -3,26 4,04E-02 conserved hypothetical protein with predicted cyt. P450 domainAN7820 -3,26 4,04E-02 aflR; sterigmatocystin cluster transcriptional activatorAN2543 -3,24 4,09E-02 conserved hypothetical protein similar to rhamnogalacturan lyaseAN2483 -3,22 4,15E-02 conserved hypothetical proteinAN11101 -3,15 4,34E-02 conserved hypothetical proteinAN8980 -3,12 4,43E-02 alcM; ethanol catabolic geneAN10812 -3,04 4,71E-02 conserved hypothetical proteinAN11210 -3,01 4,80E-02 conserved hypothetical proteinAN2804 -2,97 4,95E-02 conserved hypothetical protein similar to beta galactosidaseAN6160 -2,87 1,97E-03 conserved hypothetical protein similar to Psf2 3´end mRNA processing proteinAN8142 -2,81 2,60E-03 conserved hypothetical protein similar to UbiA-like prenyltransferaseAN10746 -2,80 1,74E-02 conserved hypothetical protein similar to MOSC-domain containing Fe-S cluster delivering enzymesAN10082 -2,74 3,05E-02 conserved hypothetical protein with Ser/Thr kinase domainAN6736 -2,72 1,94E-02 conserved hypothetical protein
1 Gene number according to Fungal Genome Database at Broad Institute2 ratio between NH4-repressed and NO3-induced cells expressed as log2 value3 established gene function or predicted function according to CADRE Initiative annotation

Gene number1 ratio2 P-value known or putative function3
AN1649 -2,66 9,76E-03 conserved hypothetical proteinAN3409 -2,63 2,53E-02 hypothetical proteinAN7665 -2,59 4,25E-02 conserved hypothetical protein similar to exosome complex subunit Rrp46AN8323 -2,49 4,45E-02 conserved hypothetical proteinAN0482 -2,36 1,40E-02 conserved hypothetical protein with ubiquitin-conjugating enzyme domainAN11449 -2,34 2,71E-02 hypothetical proteinAN7728 -2,30 1,73E-02 conserved hypothetical proteinAN1574 -2,28 3,36E-02 hypothetical proteinAN6693 -2,25 1,24E-02 hypothetical proteinAN11121 -2,24 1,85E-02 hypothetical proteinAN0383 -2,19 2,23E-02 conserved hypothetical protein similar to endo mannanaseAN11480 -2,18 4,09E-02 hypothetical proteinAN3549 -2,16 1,74E-02 conserved hypothetical proteinAN10059 -2,08 3,22E-04 predicted ZN(II)C6 domain containing transcription factor; NirA binding site in 1kb 5´regionAN10344 -2,02 2,89E-05 conserved hypothetical protein with predicted nucleotide-binding domainAN8405 -2,02 1,94E-02 conserved hypothetical protein with similarity to aspyridone monooxygenase

Supporting Table 6. A. nidulans genes that negatively respond to N-limitation in the wild type
Gene number1 ratio2 P-valueAN3396 -3,69 1,22E-02 conserved hypothetical protein with similarity to panthotenyltrasnferase (NRPS)AN1825 -2,56 2,41E-02 conserved hypothetical protein with similarity to sulfide:quinone oxidoreductaseAN5734 -2,45 2,61E-02 conserved hypothetical protein with similarity to MFS-type quinate transporterAN0944 -2,27 3,01E-02 predicted ATP-dependent RNA helicase similar to Rok1AN9140 -2,17 3,27E-02 conserved hypothetical protein with similarity to MFS-type amino acid transporterAN1303 -2,07 2,35E-02 predicted Zn(II)2Cys6-domain containing transcription factor
1 Gene number according to Fungal Genome Database at Broad Institute2 ratio between NH4-repressed and N-limited cells (60 min.) expressed as log2 value3 established gene function or predicted function according to CADRE Initiative annotation
known or putative function3

Supporting Table 7.: A.nidulans strain list.
Strain Genotype Reference Wild type bio veA1, biA1, yA2 this study Wild type paba veA1, pabaA1 FGSC WT hER II/4 veA1, argB2 Bgl II , riboA1 (Pachlinger et al., 2005) SAA.111 veA1, biA1, Δ argB :: trpC, riboB2, pyroA4, wA3 (Monahan et al., 2002) niaDΔ veA1, biA1, pyrG89, niaDΔ, wA3 this study fhbAΔ veA1, biA1, yA2 this study fhbBΔ veA1, biA1, yA2 this study fhbAΔ fhbBΔ veA1, biA1,argB2, fhbAΔ::argB, fhbBΔ::argB, yA2 this study fhbAΔ fhbBΔ niaDΔ veA1, biA1, fhbAΔ::argB, fhbBΔ::argB, niaDΔ this study nirA- veA1, pabaA1, nirA637 (Muro-Pastor et al., 1999) areA- veA1, biA1, pantoB100 (Kudla et al., 1990) crnA- crnB- veA1, biA1, pabaA1,argB2, crnA747, crnB110, argB
complemented (Unkles et al., 2001) and this study
crnA- crnB- niaDΔ veA1, biA1, pabaA1,argB2, crnA747, crnB110, niaDΔ::argB
this study
niiA- veA1, biA1, niiA4, pyroA4, nkuAΔ::bar (Cove and Pateman, 1963) nirAΔ veA1, pyrG89, argB2, riboB2, pyroA4, nkuΔ::argB,
nirAΔ::riboB fum, this study
References for Supporting Table 7 Cove, D.J., and Pateman, J.A. (1963) Independently segregating genetic loci concerned with
nitrate reductase activity in Aspergillus nidulans. Nature 198: 262-263. Kudla, B., Caddick, M.X., Langdon, T., Martinez-Rossi, N.M., Bennett, C.F., Sibley, S.,
Davies, R.W., and Arst, H.N., Jr. (1990) The regulatory gene areA mediating nitrogen metabolite repression in Aspergillus nidulans. Mutations affecting specificity of gene activation alter a loop residue of a putative zinc finger. EMBO J 9: 1355-1364.
Monahan, B.J., Unkles, S.E., Tsing, I.T., Kinghorn, J.R., Hynes, M.J., and Davis, M.A. (2002) Mutation and functional analysis of the Aspergillus nidulans ammonium permease MeaA and evidence for interaction with itself and MepA. Fungal Genet Biol 36: 35-46.
Muro-Pastor, M.I., Gonzalez, R., Strauss, J., Narendja, F., and Scazzocchio, C. (1999) The GATA factor AreA is essential for chromatin remodelling in a eukaryotic bidirectional promoter [published erratum appears in EMBO J 1999 May 4;18(9):2670]. EMBO J 18: 1584-1597.
Pachlinger, R., Mitterbauer, R., Adam, G., and Strauss, J. (2005) Metabolically independent and accurately adjustable Aspergillus sp. expression system. Appl Environ Microbiol 71: 672-678.
Unkles, S.E., Zhou, D., Siddiqi, M.Y., Kinghorn, J.R., and Glass, A.D. (2001) Apparent genetic redundancy facilitates ecological plasticity for nitrate transport. EMBO J 20: 6246-6255.

Supporting Table 8.: Primers used for cloning and Northern probes. primers for fhbA and fhbB deletion cassette construction
flav 35 Pr F GGAAATTGACATCAGCAGTGGGT flav 35 Pr R ClaI TATATCGATGTGCAAAAAACCGTATTGTCTCA flav 35 T F BamHI CGAGGATCCCATAACCAGCAGCATTCACGA flav 35 T R ATCACTCCGGCGAAATCTCATC flav 71 Pr F ACCACGGTCGCGATTATGAG flav 71 Pr R EcoRI GAAGAATTCATGATGATGGCTGTCTGTCTGTG flav 71 T F ClaI TAGATCGATCCATCACGGGAGCTTCAAAACT flav 71 T R AGCAAAGAAACTCCGAAAAACACC arg flavo ko R CATGAACTTCCAGCCCTCCTTAG arg flavo ko F GGGCTATCAAGTCGGGGTCAAT arg flavo ko ClaI TCGATCGATAGCCATTGCGAAACCTCAGAAG flav 35 P F check CCGCTGCTCCTTGTCTCTTGA flav35 T R check TTCGTGAATGCTGCTGGTTA flav 71 P F check CCCGACATTGAAAGCAGGACAG flav 71 T R check CGAAAAAATACAGTCAAATCAGAAGAA
primers for fhbA and fhbB knock out screening flav 35 ORF F GCCTGCCGCTCTTGCTCAT flav 35 ORF R CATGATATTGGCTAGCGTCTCCTT flav 71 ORF F CGAACAAATCCAGCTCATCAAGG flav 71 ORF R ACGCGACCCTTGTATGTGTAGTTC
primers for nirAΔ deletion cassette construction nirA Pr-1714_F CAACGGATGGTGCTAAGGAAAGAAG nirA Pr-1_ClaI_R AATCAATCGATGGTAAATCAAGCCCAGACAGATATGTTC nirA T+1_BamHI_F AATCAGGATCCCAGGCCTATTCACCGCTGCGGATA nirA_T+1658_R CGGAGAAGAAGCGCATAAGTGATAGG
primers for nirA knock out screening nirA Pr -1790_F GTCTCACGGTCGGGAAGAACAGC nirA 557 R ATGTATTACCGCATTTGACA
primers for niaDΔ deletion cassette construction niaD_ATG_F ATGTCTACAACCGTCACACAAGTGC niaD_1428_EcoRI_R AATCAGAATTCGGTATTTGTCTTCGGCGTATTCG niaD_1557_BamHI_F AATCAGGATCCCGCGCAATGGACGAAGCAC niaD_2957_R CTCCTCTTTCCATCCCAACGAC
primers for niaD knock out screening niaD_F GCAGCGGGCGGCTGCCAACTG arg flavo ko R CATGAACTTCCAGCCCTCCTTAG niaD_ATG_F ATGTCTACAACCGTCACACAAGTGC niaD_2957_R CTCCTCTTTCCATCCCAACGAC
primers for Northern probes niaD (∼ 2950 bp)
niaD ATG F ATGTCTACAACCGTCACACAAGTGC niaD 2957 R CTCCTCTTTCCATCCCAACGAC
niiA (∼ 1320 bp) niiA F CATCATGCCGTTGCTGGACG niiA R GCTTAGGTCCGGCCTGTTG
fhbA (∼ 1040 bp) flav 71 ORF F CGAACAAATCCAGCTCATCAAGG flav 71 ORF R ACGCGACCCTTGTATGTGTAGTTC
acnA (∼ 750 bp) actin F GATCGGTATGGGTCAGAAGGA actin R CGATGTTGCCGTACAGATCC
18S (1600 bp) 18S F GAATGGCTCATTAAATCAGTTATCG 18S R CGGGTTTAACCAGCTTTCCGGC

0,08
0,1
0,12
tal p
rote
in
0,02
0,04
0,06
units
NR
/mg
tot
0o.n. 30 min
starv60 minstarv
30 minNH4
60 minNH4
30 starve30 NH4
30 starve30 NO3
Supporting Figure S1. Nitrate reductase (NR) activity assays of wild type (open columns) andnirA- (filled columns) cells used for the transcriptome analysis. The assay was carried out asnirA (filled columns) cells used for the transcriptome analysis. The assay was carried out asdescribed in detail in Supporting Materials and Methods. Each strain was grown in triplicates on10 mM ammonium over night (o.n.), harvested, washed and subjected to different nitrogentreatments before determining NR activity. As expected, neither N-starvation (starv) norammonium treatment (NH4
+) resulted in elevated NR activity. In contrast, a starvation period for30 min. followed by addition of 10mM NaNO3 (30 starve, 30 NO3
-) resulted in a strong inductionof NR activities in wild type, but not in nirA- cells. The NR activity values in the wild type weresimilar to those recorded after 120 minutes of nitrate induction (data not shown) Values are thesimilar to those recorded after 120 minutes of nitrate induction (data not shown). Values are themean of three independent experiments and standard deviations are shown in the bar graphs.Despite the fully induced nitrate reductase activity in wild type cells at 30starve, 30 NO3
-, whichcorresponds to the harvest point for the transcriptome analysis (compare Supp. Fig. S2), Gln poollevels continued to decline until 50 minutes of incubation with nitrate.
Schinko et al., Supp.Fig S 1

160
Gln
nmol mg-1 DW
80
100
120
140GlnGlu
harvestpoint
20
40
60
80
0-60 -30 0 30 60 90 120 150 180
-N NO3-preculture NH4
+
min
Supporting Figure S2. Graphical representation of glutamine (Gln) and glutamate (Glu) poollevels during the nitrate induction experiment (data derived from Supporting Table ST1). Cellswere pre-grown for 14h on ammonium (NH4
+), harvested, washed, shifted to N-free GMM andincubated in a rotary shaker for 30 minutes (-N) To this end 10mM NaNO was added to theincubated in a rotary shaker for 30 minutes (-N). To this end, 10mM NaNO3 was added to thecultures which were further incubated for the time indicated in the x-axis (minutes). Squares anddiamonds indicate sampling points for glutamine and glutamate, respectively. Despite a fullyinduced nitrate reductase activity at the harvest point (compare Supp. Fig. S1), Gln levelscontinued to decline until 50 minutes of incubation with nitrate, presumably due to a higherdemand for Gln than can be supplied by the nitrate assimilation process. Interestingly andconsistent with our previous observations (Berger et al., 2008), Glu levels stay relatively constant
th h l i b ti i d ( l d i N t ti )
Schinko et al., Supp. Fig. S 2
over the whole incubation period (also during N-starvation)

NO3-nirAA NO3- nirA-
inte
nsity
[a.u
.]
d t NONO WT
NO3-WT
DetaNONOate
NO3- WT
3390 3400 3410 3420 3430 3440 3450 3460 3470 3480
magnetic field [G]
detaNONO-WT
Supporting Figure S 3A Typical EPR spectra of Fe2+ DETC NO in sample extracts
DetaNONOate WT
Sample name 1st i
2nd i
3rd i
Supporting Figure S 3A. Typical EPR spectra of Fe -DETC-NO in sample extractsshowing no Fe2+-DETC-NO adduct (NO3
- induced, nirA-), medium amount of Fe2+-DETC-NO adduct (NO3
- induced, WT), or high amount of Fe2+-DETC-NO adduct (DetaNONOateinduced, WT).
B experiment experiment experiment
arg / fhbAΔfhbBΔ - - -
arg / niaDΔ - - -
arg / nirA- - - -
arg / WT (+) - -
NO3- / fhbAΔfhbBΔ + + +
B
3 f f
NO3- / niaDΔ - - -
NO3- / nirA- - - -
NO3- / WT + + +
DetaNONOate / fhbAΔfhbBΔ
++ ++ ++
DetaNONOate / ++ ++ ++
Supporting Figure S 3B. Fe2+-DETC-NO signal in sample extracts. - , no signal; (+),very weak signal; + clear but weak signal; ++ strong signal; +++ very strong signal
DetaNONOate / niaDΔ
++ ++ ++
DetaNONOate / nirA-
+++ ++ ++
DetaNONOate / WT
++ ++ ++
very weak signal; +, clear, but weak signal; ++, strong signal; +++, very strong signal.Arg (3 mM arginine), non-inducing conditions; NO3
- (10 mM NO3-, 3mM arginine),
inducing conditions, DetaNONOate (1.5 mM DetaNONOate, 3mM arginine), nitricoxide treatment conditions. Strain designations are described in strain list SupportingTable ST 7.
Schinko et al., Supp.Fig S3


