Embed Size (px)
Citation preview
27/02/2013 Page 1 of 57
Title of Report
Course & Course Code
Names, ID’s and Course
Content
Geotechnics MEng/BEng Civil Engineering
27/02/2013 Page 2 of 57
sCourse & Course Code...............................................1
Names, ID’s and Course...........................................1
1 Abstract.........................................................3
2 Introduction.....................................................4
2.1 Aim..........................................................42.2 Learning Outcomes............................................4
3 Theory...........................................................5
4 Values and Assumptions...........................................6
5 Apparatus and Methodology........................................7
5.1 Equipment....................................................7
5.2 Diagrams.....................................................86 Calculations.....................................................9
7 Results.........................................................10
8 Graphs..........................................................11
9 Discussions and Conclusions.....................................12
9.1 Errors......................................................12
9.11 Human Errors.............................................129.12 Equipment Errors.........................................12
9.13 Error due to Assumptions.................................129.14 Actual Error.............................................12
9.15 How can we improve on this error?........................129.2 Final Conclusion............................................12
Bibliography......................................................13
Geotechnics MEng/BEng Civil Engineering
27/02/2013 Page 3 of 57
1 Abstract
Triaxial test is one of the best method for measuring mechanical properties of many deformable solids such as sand. There are a couple of changes in this kind of tests. Mainly this kind of experiments showus how to find apparent cohesion and the angle of shearing resistance of the material (soil). we obtained the values which allow us to specify that the sample that was tested is clay.An application for theunconsildated-undrained test would be to find the initial stability ofa footing on saturated clay.Initially there will be an increase in pore water pressure and as consolidation occurs over time,the pore water and effective stress also increase. Triaxial vs. True triaxial tests: As we can understand from the name triaxial test has got stresses in 3 different dimensions. This cannot be always right as it is usually done. However only true triaxial testit can have different stresses (directions) stress1 is not equal stress 2 also stress 2 is not equal stress3. Loose granular materials:We should give the example for this materials as sand or gravel the material will be contained in metal plates and we apply the force and squeeze the material Basic concept: The main principle in this kind of test is applying thevertical stress which can be different than other horizontal directions. Basically triaxial test designed to measure limit which shows how much shear stress it can support.
Geotechnics MEng/BEng Civil Engineering
27/02/2013 Page 4 of 57
2 Introduction and Summary
Laboratory testing of soils and rocks is one of the most important concepts of geotechnical engineering. The tests can be really complex and depend in the project needs. A laboratory test should be planned and executed carefully to optimize the test data for design and construction. The shear strength of soils is a very important element to foundation design. In addition, slopes of all kinds, including hills, river banks, and man-made cuts and fills, stay in place only because of the shear strength of the material of which they are composed. Deep understanding and knowledge of the shear strength of soil is important for the design of structural foundations, embankments, retaining walls, pavements, and cuts.
In the Soil Mechanics Laboratory, a lab session about two different shear strength tests took place. The shear strength of a soil is the maximum shear stress that the soil structure can resist before failure. Failure is generally defined as continuing displacement without an increase in applied stress.
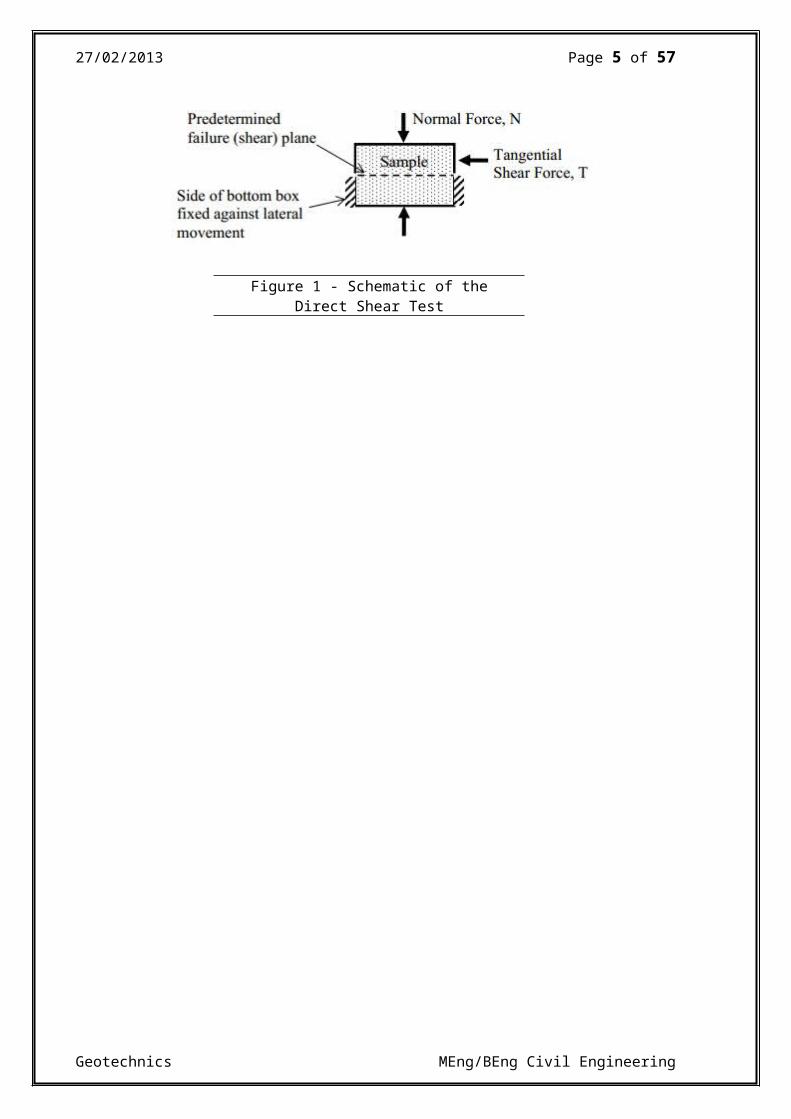
The first experiment that took place was the Direct Shear Test of a sand sample in a shear box. The direct shear strength test is used mostly to predict quickly, some useful parameters that are required for the design of a project. The shear box’s bottom portion is usuallyfixed against lateral movement. A force, N, is applied, and then a tangential shear force, T, is applied so as to cause relative displacement between the two parts of the box. The magnitude of the shear force is recorded as a function of the shear displacement, and usually, the change in thickness of the soil sample is also recorded. The direct shear device is not being used widely due to the fact that its applications are limited and for example there is no way to control the confining pressure. Also, since there is no way to measureexcess pore water pressures generated during shearing of saturated clay specimens, use of the direct shear test is generally limited to cohesionless soils.
Geotechnics MEng/BEng Civil Engineering
27/02/2013 Page 5 of 57
Figure 1 - Schematic of theDirect Shear Test
Geotechnics MEng/BEng Civil Engineering
27/02/2013 Page 6 of 57
2.1 Objective
The objectives of the lab session were depending on the experiment that was being executed. The students learned how to obtain the angle of shearing resistance for the given sand sample by means of the direct shear test.
2.2 Learning Objectives
At the end of the experiment the students were able to
develop laboratory and experimental skills
understand practical and theoretical concepts in relation to theshear strength of the soils
Geotechnics MEng/BEng Civil Engineering
27/02/2013 Page 7 of 57
3 Theory
3.1 Direct shear stress
Direct shear test is the oldest test that is used to determine the strength for soils. In this experiment a direct shear devicewas connected to determine the shear strength of a cohesionless soil. From this information we can then calculated the angle of internal friction and plot the horizontal displacement against shear force graph. The maximum shear stress is obtained for a specific vertical confining stress. After the experiment is run several times for various vertical confining stresses, we can plot the maximum shear stress againstthe normal confining stresses for each of the tests that are produced. From the plot a straight line approximation of the Mohr-Coulumb failure envelope curve can be drawn. This can be used to determine the force and for cohesionless soils. By using computer programmes we can determine the shear strength by the following equation: S =s tanf.
Consolidation pressure is added to the top of the sample as the load application system of apparatus. The consolidation stage then proceeds as for standard incremental one dimensional consolidation test
Loads are typically applied with a ratio of load increment whichis equal to one to minimize problems. Readings of settlement or expansion are taken to allow appropriate and accurate calculation of consolidation coefficients and to minimize errors. This ensures that the sample has come to equilibrium prior to the initial start of the shear force applied.
Geotechnics MEng/BEng Civil Engineering
27/02/2013 Page 8 of 57
Geotechnics MEng/BEng Civil Engineering
27/02/2013 Page 9 of 57
4 Apparatus andMethodology
4.1 EquipmentThe shear box test is the oldest form of shear test, which was firstused in 1776. Although it is widely used in practice, the directshear device lacks a number of features that limit is applicability.As an example, this test does not allow to control the confiningpressure. Additionally, while testing saturated clay specimens,there is no way to measure the excess of pore water. So the directshear test is generally limited to cohesionless soils.
Basic information about the equipment used for this experiment:
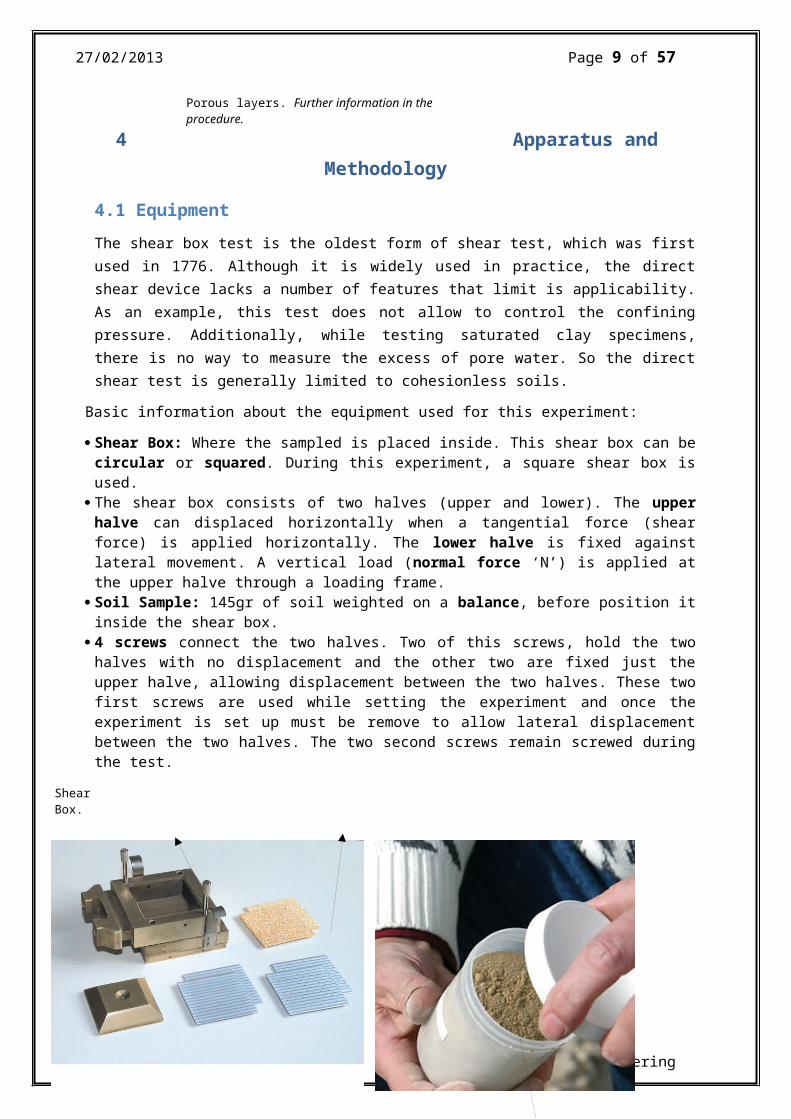
Shear Box: Where the sampled is placed inside. This shear box can becircular or squared. During this experiment, a square shear box isused.
The shear box consists of two halves (upper and lower). The upperhalve can displaced horizontally when a tangential force (shearforce) is applied horizontally. The lower halve is fixed againstlateral movement. A vertical load (normal force ‘N’) is applied atthe upper halve through a loading frame.
Soil Sample: 145gr of soil weighted on a balance, before position itinside the shear box.
4 screws connect the two halves. Two of this screws, hold the twohalves with no displacement and the other two are fixed just theupper halve, allowing displacement between the two halves. These twofirst screws are used while setting the experiment and once theexperiment is set up must be remove to allow lateral displacementbetween the two halves. The two second screws remain screwed duringthe test.
Geotechnics MEng/BEng Civil Engineering
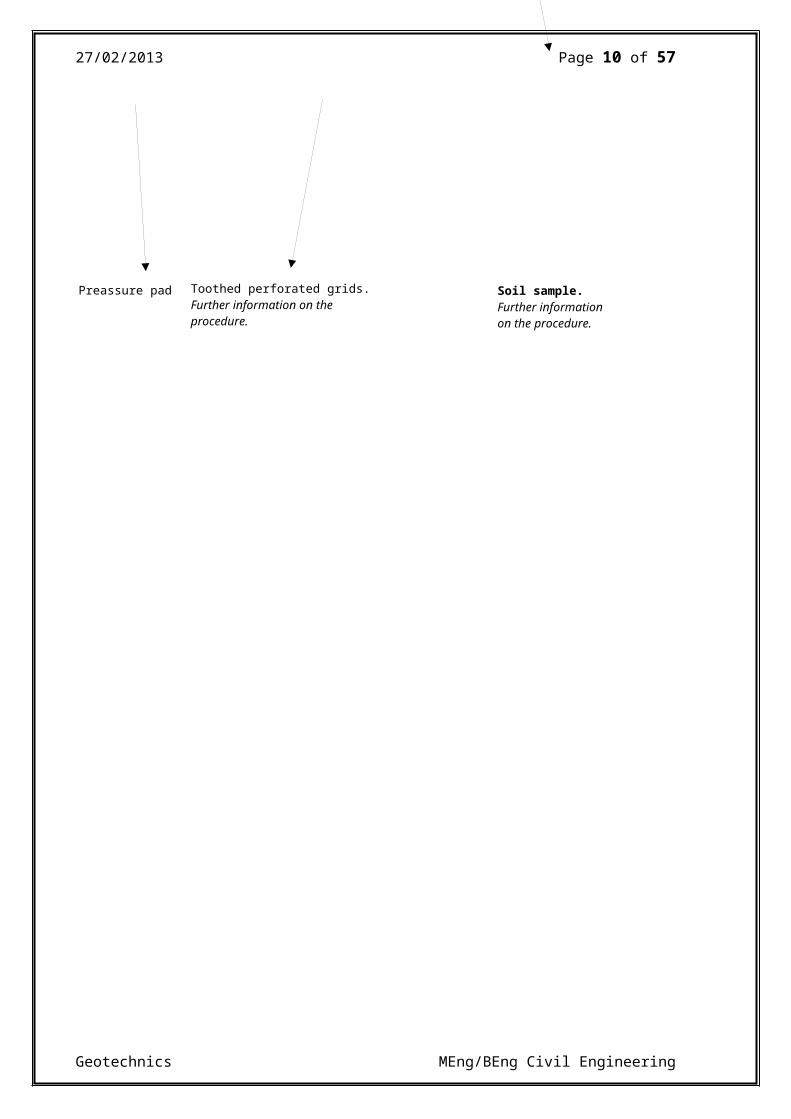
Porous layers. Further information in the procedure.
Shear Box.
27/02/2013 Page 10 of 57
Geotechnics MEng/BEng Civil Engineering
Toothed perforated grids.Further information on the procedure.
Soil sample. Further informationon the procedure.
Preassure pad
27/02/2013 Page 11 of 57
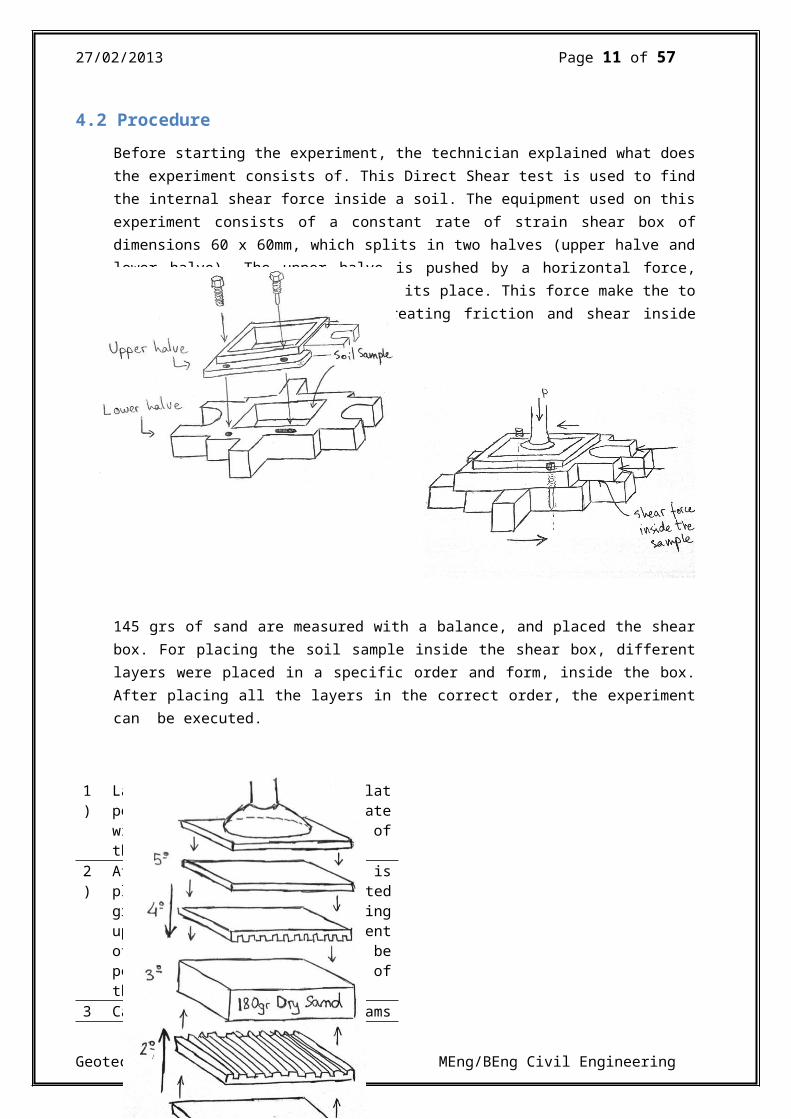
4.2 ProcedureBefore starting the experiment, the technician explained what doesthe experiment consists of. This Direct Shear test is used to findthe internal shear force inside a soil. The equipment used on thisexperiment consists of a constant rate of strain shear box ofdimensions 60 x 60mm, which splits in two halves (upper halve andlower halve). The upper halve is pushed by a horizontal force,while the lower halve remains on its place. This force make the tohalves separate horizontally creating friction and shear insidethe sample.
145 grs of sand are measured with a balance, and placed the shearbox. For placing the soil sample inside the shear box, differentlayers were placed in a specific order and form, inside the box.After placing all the layers in the correct order, the experimentcan be executed.
1)
Layers (1) and (5) are flatporous plates. The first platewill be placed at the bottom ofthe box.
2)
After the first porous plate isplaced, a toothed perforatedgrid will be placed facingupwards the grid. The alignmentof the grid must beperpendicular to the vector ofthe direction of the rub.
3 Carefully place the 180 grams
Geotechnics MEng/BEng Civil Engineering
27/02/2013 Page 12 of 57
) of dry sand over the grid.Specific tools such usflatteners will be providedduring the experiment to levelthe surface of the sample.
4)
Place the second toothedperforated grid on the top ofthe sample, facing downward andaligned as the first one (2).
5)
Finally add the last porouslayer over the flat side of thetoothed perforated grid. Onceis placed, ensure that thepressure pad is well located inthe middle of the layers andthat the two slotted retainingscrews in the shear box areremoved.
Geotechnics MEng/BEng Civil Engineering
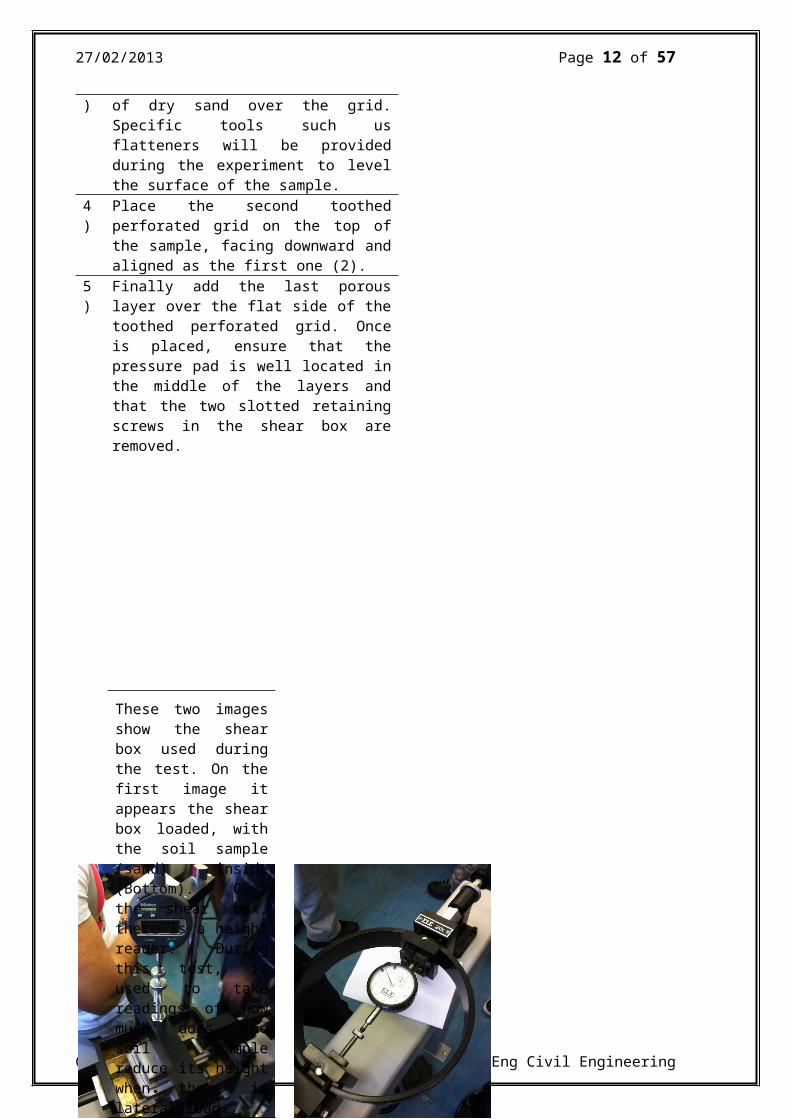
These two imagesshow the shearbox used duringthe test. On thefirst image itappears the shearbox loaded, withthe soil sample(sand) inside(Bottom). Overthe shear box,there is a heightreader. Duringthis test, isused to takereadings of howmuch does thesoil samplereduce its heightwhen there islateral load.
27/02/2013 Page 13 of 57
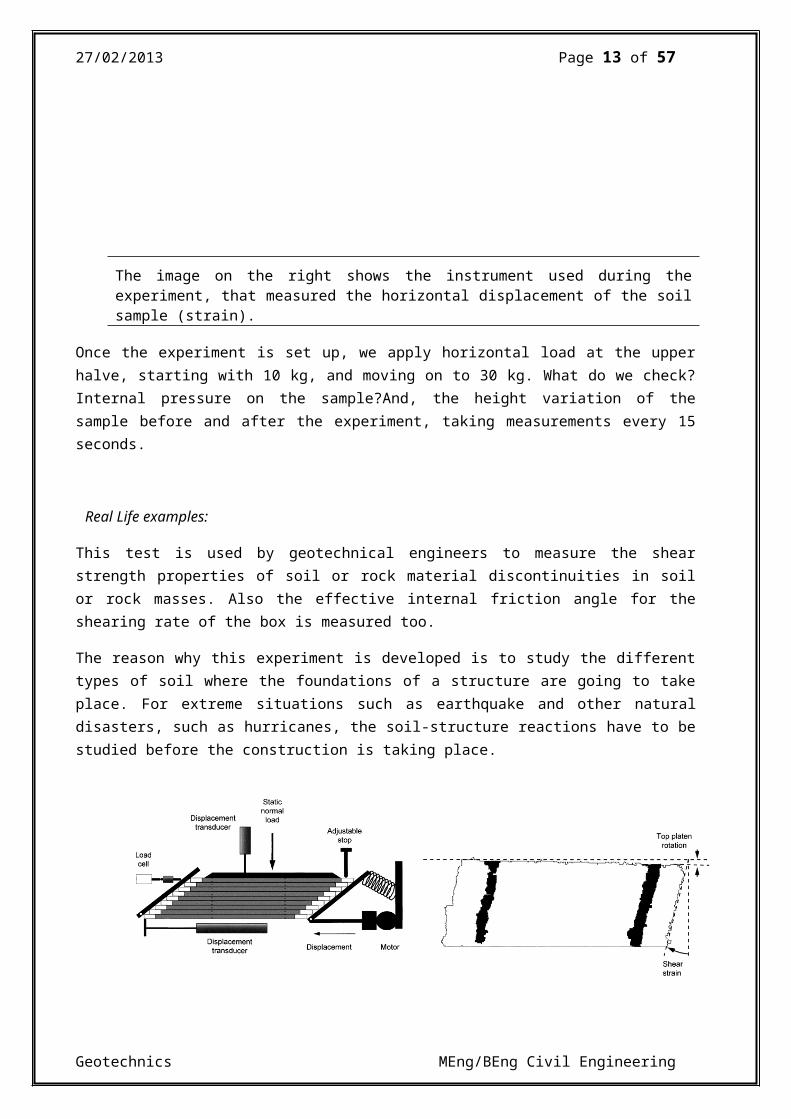
Once the experiment is set up, we apply horizontal load at the upperhalve, starting with 10 kg, and moving on to 30 kg. What do we check?Internal pressure on the sample?And, the height variation of thesample before and after the experiment, taking measurements every 15seconds.
Real Life examples:
This test is used by geotechnical engineers to measure the shearstrength properties of soil or rock material discontinuities in soilor rock masses. Also the effective internal friction angle for theshearing rate of the box is measured too.
The reason why this experiment is developed is to study the differenttypes of soil where the foundations of a structure are going to takeplace. For extreme situations such as earthquake and other naturaldisasters, such as hurricanes, the soil-structure reactions have to bestudied before the construction is taking place.
Geotechnics MEng/BEng Civil Engineering
The image on the right shows the instrument used during theexperiment, that measured the horizontal displacement of the soilsample (strain).
27/02/2013 Page 14 of 57
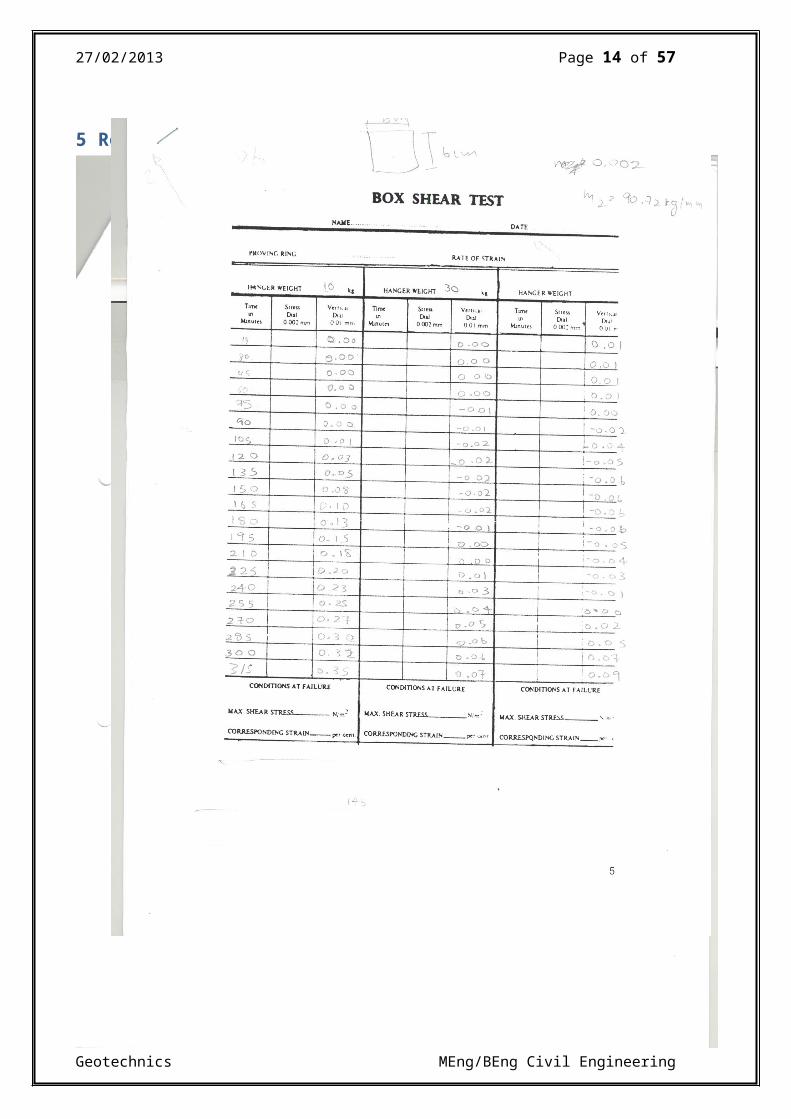
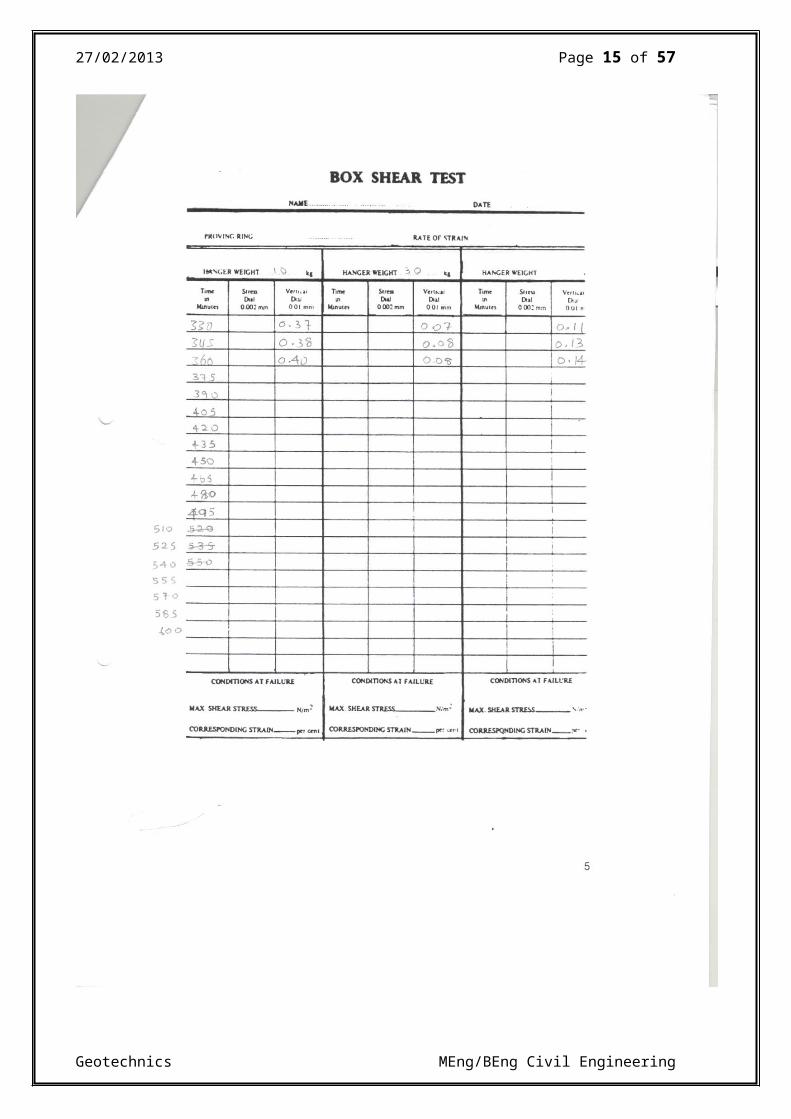
5 Results
Geotechnics MEng/BEng Civil Engineering
27/02/2013 Page 15 of 57
Geotechnics MEng/BEng Civil Engineering
27/02/2013 Page 16 of 57
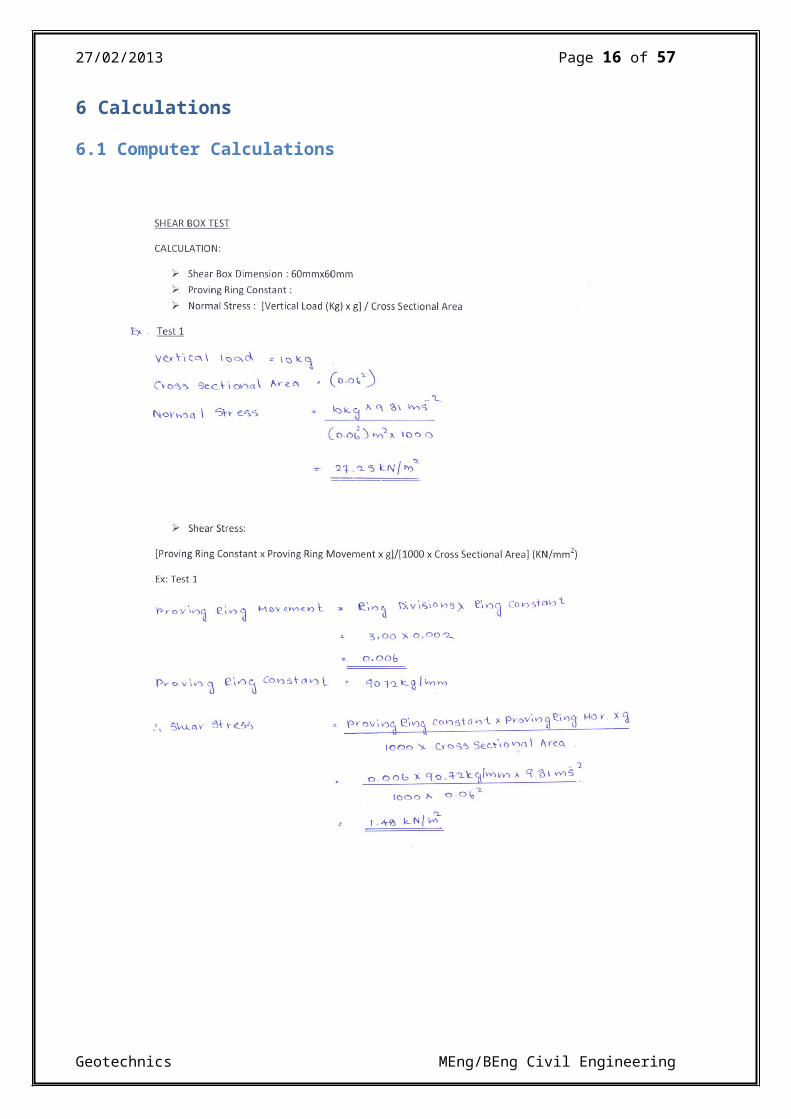
6 Calculations
6.1 Computer Calculations
Geotechnics MEng/BEng Civil Engineering
27/02/2013 Page 17 of 57
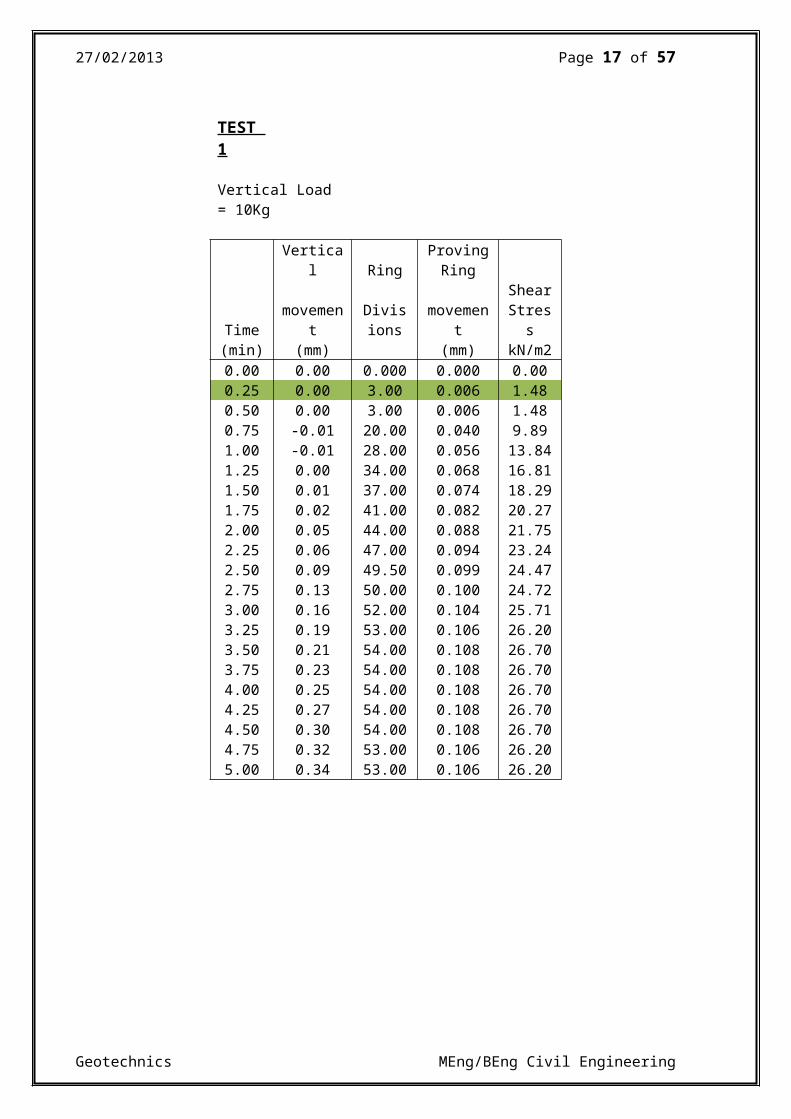
TEST 1
Vertical Load = 10Kg
Vertica
l Ring ProvingRing
Timemovemen
tDivisions
movement
ShearStres
s(min) (mm) (mm) kN/m20.00 0.00 0.000 0.000 0.000.25 0.00 3.00 0.006 1.480.50 0.00 3.00 0.006 1.480.75 -0.01 20.00 0.040 9.891.00 -0.01 28.00 0.056 13.841.25 0.00 34.00 0.068 16.811.50 0.01 37.00 0.074 18.291.75 0.02 41.00 0.082 20.272.00 0.05 44.00 0.088 21.752.25 0.06 47.00 0.094 23.242.50 0.09 49.50 0.099 24.472.75 0.13 50.00 0.100 24.723.00 0.16 52.00 0.104 25.713.25 0.19 53.00 0.106 26.203.50 0.21 54.00 0.108 26.703.75 0.23 54.00 0.108 26.704.00 0.25 54.00 0.108 26.704.25 0.27 54.00 0.108 26.704.50 0.30 54.00 0.108 26.704.75 0.32 53.00 0.106 26.205.00 0.34 53.00 0.106 26.20
Geotechnics MEng/BEng Civil Engineering
27/02/2013 Page 18 of 57
0 1 2 3 4 5 60
5
10
15
20
25
30
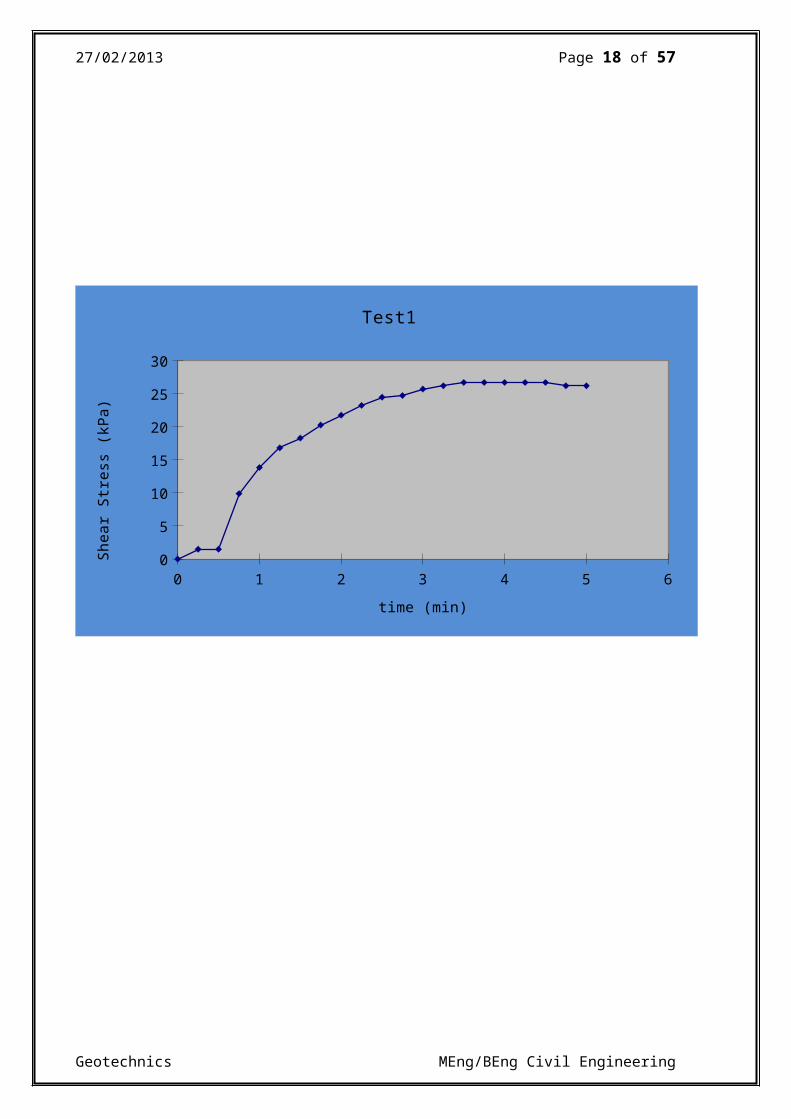
Test1
time (min)
Shea
r St
ress
(kP
a)
Geotechnics MEng/BEng Civil Engineering
27/02/2013 Page 19 of 57
0 1 2 3 4 5 6-0.050.000.050.100.150.200.250.300.350.40
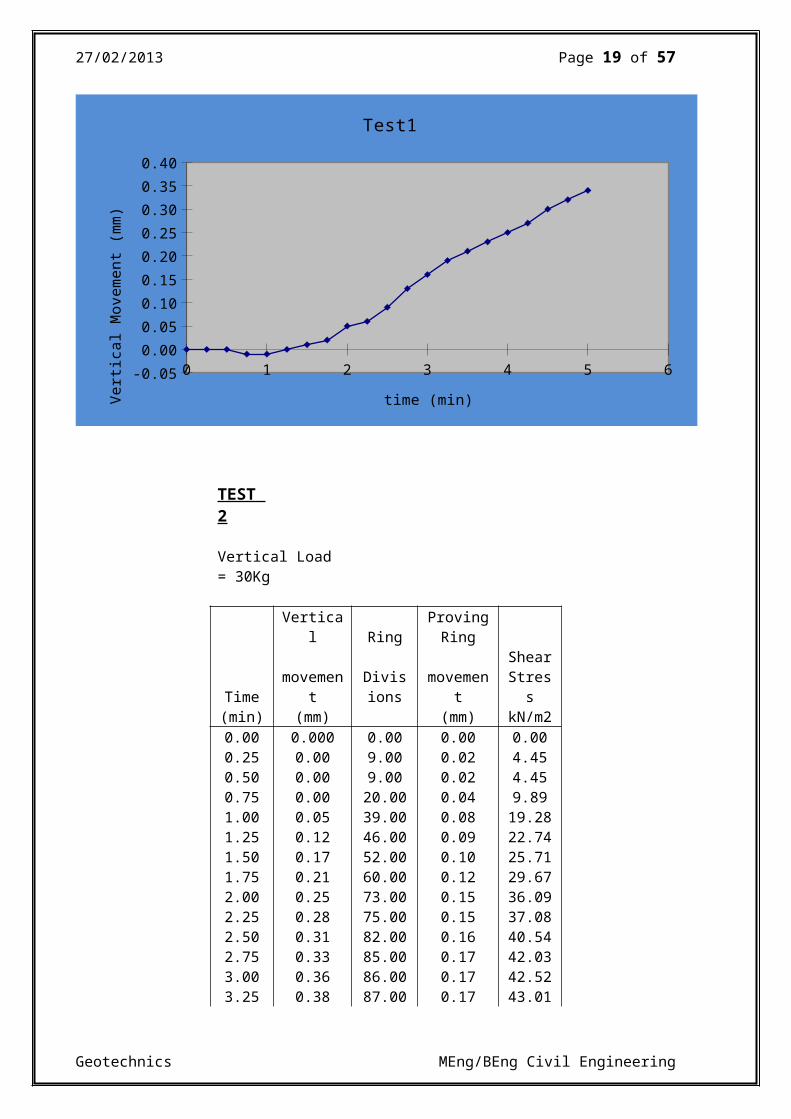
Test1
time (min)Vert
ical
Mov
emen
t (m
m)
TEST 2
Vertical Load = 30Kg
Vertica
l Ring ProvingRing
Timemovemen
tDivisions
movement
ShearStres
s(min) (mm) (mm) kN/m20.00 0.000 0.00 0.00 0.000.25 0.00 9.00 0.02 4.450.50 0.00 9.00 0.02 4.450.75 0.00 20.00 0.04 9.891.00 0.05 39.00 0.08 19.281.25 0.12 46.00 0.09 22.741.50 0.17 52.00 0.10 25.711.75 0.21 60.00 0.12 29.672.00 0.25 73.00 0.15 36.092.25 0.28 75.00 0.15 37.082.50 0.31 82.00 0.16 40.542.75 0.33 85.00 0.17 42.033.00 0.36 86.00 0.17 42.523.25 0.38 87.00 0.17 43.01
Geotechnics MEng/BEng Civil Engineering
27/02/2013 Page 20 of 57
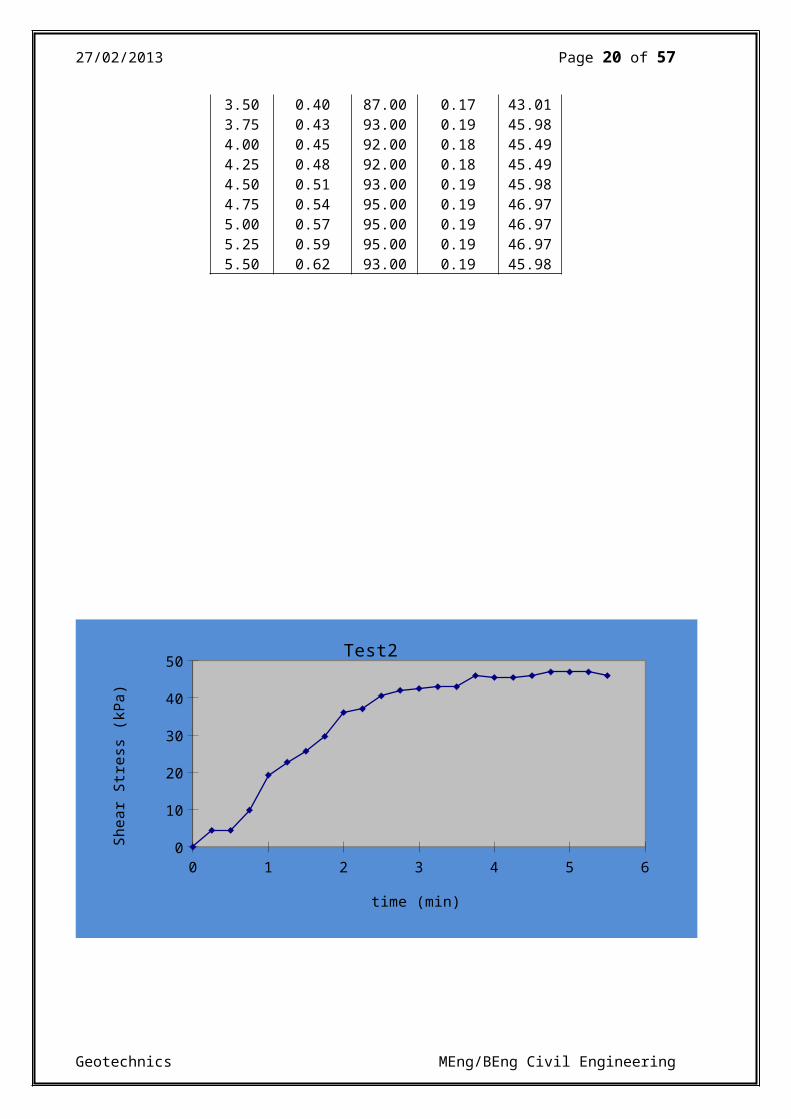
3.50 0.40 87.00 0.17 43.013.75 0.43 93.00 0.19 45.984.00 0.45 92.00 0.18 45.494.25 0.48 92.00 0.18 45.494.50 0.51 93.00 0.19 45.984.75 0.54 95.00 0.19 46.975.00 0.57 95.00 0.19 46.975.25 0.59 95.00 0.19 46.975.50 0.62 93.00 0.19 45.98
0 1 2 3 4 5 60
10
20
30
40
50 Test2
time (min)
Shea
r St
ress
(kP
a)
Geotechnics MEng/BEng Civil Engineering
27/02/2013 Page 21 of 57
0 1 2 3 4 5 60.000
0.100
0.200
0.300
0.400
0.500
0.600
0.700
Series2
Axis Title
Axis Title
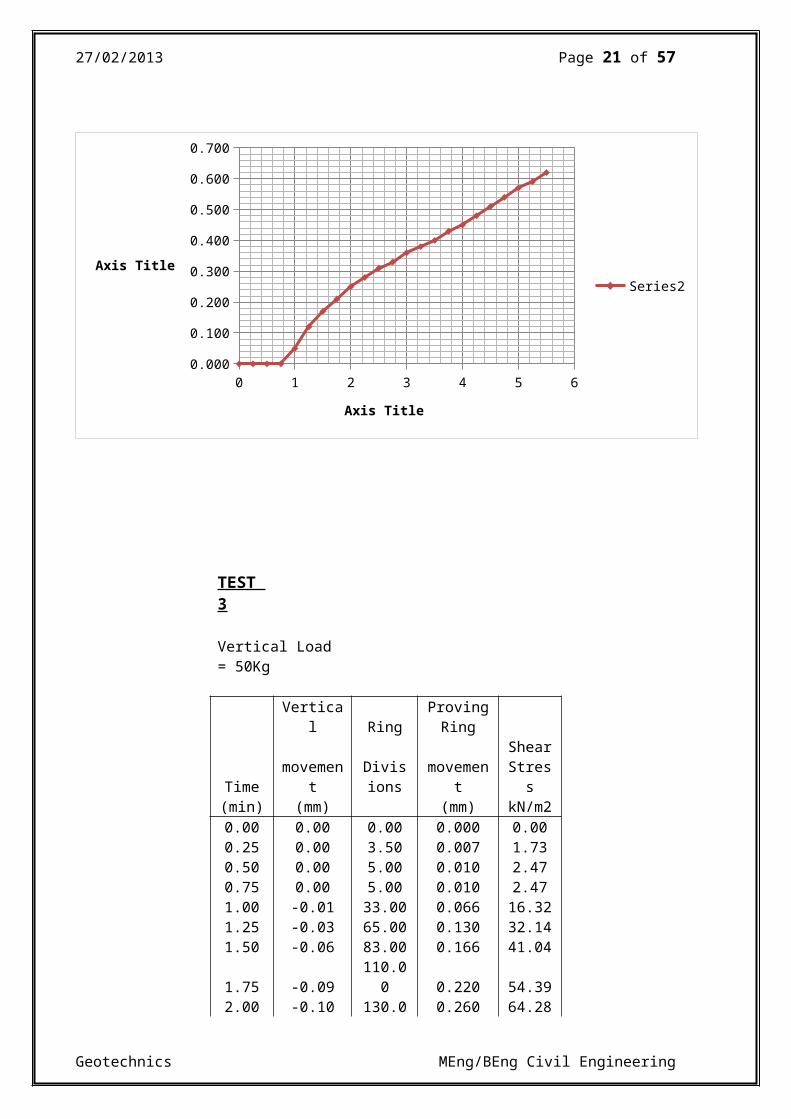
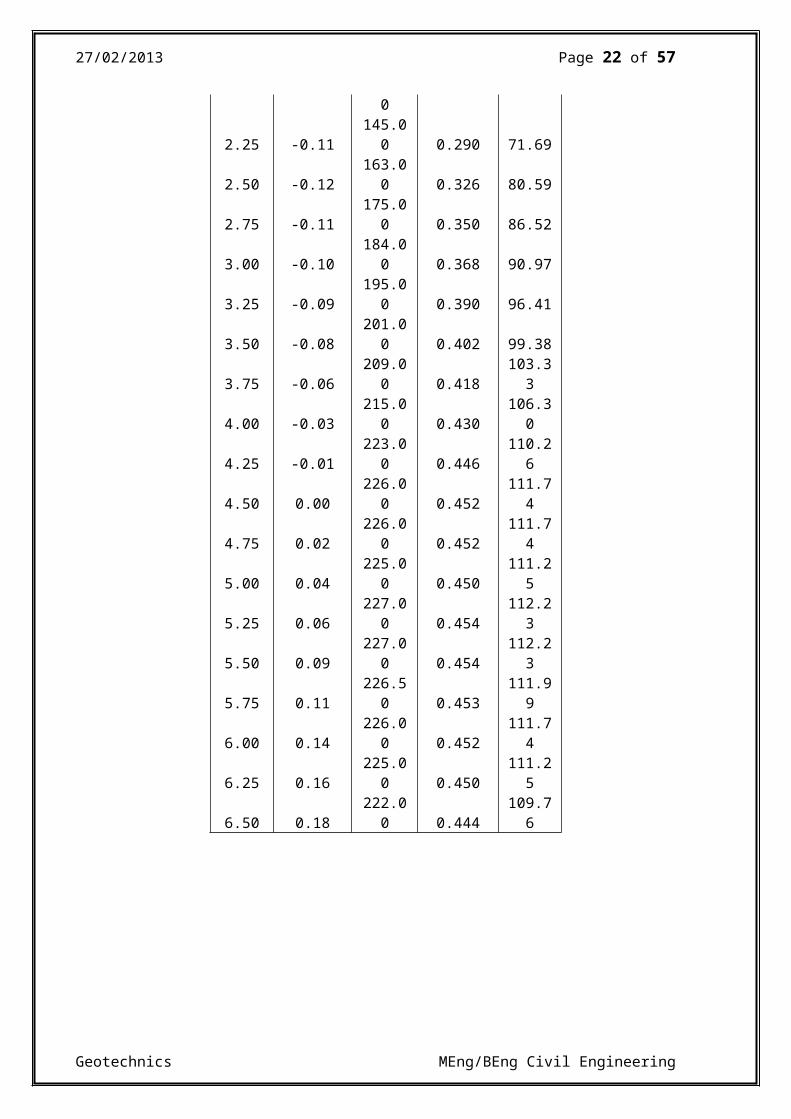
TEST 3
Vertical Load = 50Kg
Vertica
l Ring ProvingRing
Timemovemen
tDivisions
movement
ShearStres
s(min) (mm) (mm) kN/m20.00 0.00 0.00 0.000 0.000.25 0.00 3.50 0.007 1.730.50 0.00 5.00 0.010 2.470.75 0.00 5.00 0.010 2.471.00 -0.01 33.00 0.066 16.321.25 -0.03 65.00 0.130 32.141.50 -0.06 83.00 0.166 41.04
1.75 -0.09110.0
0 0.220 54.392.00 -0.10 130.0 0.260 64.28
Geotechnics MEng/BEng Civil Engineering
27/02/2013 Page 22 of 57
0
2.25 -0.11145.0
0 0.290 71.69
2.50 -0.12163.0
0 0.326 80.59
2.75 -0.11175.0
0 0.350 86.52
3.00 -0.10184.0
0 0.368 90.97
3.25 -0.09195.0
0 0.390 96.41
3.50 -0.08201.0
0 0.402 99.38
3.75 -0.06209.0
0 0.418103.3
3
4.00 -0.03215.0
0 0.430106.3
0
4.25 -0.01223.0
0 0.446110.2
6
4.50 0.00226.0
0 0.452111.7
4
4.75 0.02226.0
0 0.452111.7
4
5.00 0.04225.0
0 0.450111.2
5
5.25 0.06227.0
0 0.454112.2
3
5.50 0.09227.0
0 0.454112.2
3
5.75 0.11226.5
0 0.453111.9
9
6.00 0.14226.0
0 0.452111.7
4
6.25 0.16225.0
0 0.450111.2
5
6.50 0.18222.0
0 0.444109.7
6
Geotechnics MEng/BEng Civil Engineering
27/02/2013 Page 23 of 57
0 1 2 3 4 5 60
20406080
100120 Test3
time (min)
Shea
r St
ress
(kP
a)
0 1 2 3 4 5 6
-0.15-0.10-0.050.000.050.100.150.20
Test3
time (min)
Vert
ical
Mov
emen
t (m
m)
Geotechnics MEng/BEng Civil Engineering
27/02/2013 Page 24 of 57
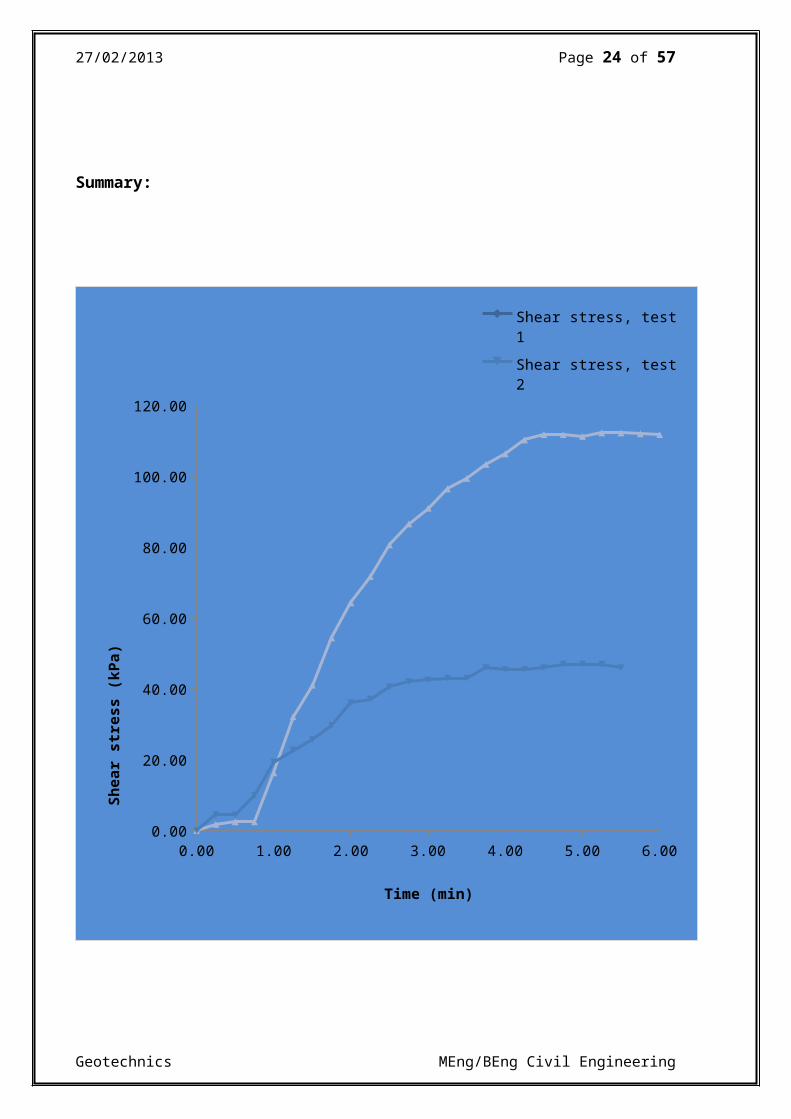
Summary:
0.00 1.00 2.00 3.00 4.00 5.00 6.000.00
20.00
40.00
60.00
80.00
100.00
120.00
Shear stress, test 1Shear stress, test 2
Time (min)
Shea
r st
ress
(kP
a)
Geotechnics MEng/BEng Civil Engineering
27/02/2013 Page 25 of 57
0.00 1.00 2.00 3.00 4.00 5.00 6.00
-0.20
-0.10
0.00
0.10
0.20
0.30
0.40
0.50
0.60
0.70
Uv test1
Time (min)
Vertical Movement (mm)
TEST NORMALSHEAR(KPa)
SHEARSTRESS(KPa)
PEAK SHEARSTRESS
1 27.25 26.70 46.702 81.75 46.97 45.983 136.25 112.23 111.74
Geotechnics MEng/BEng Civil Engineering
27/02/2013 Page 26 of 57
0 20 40 60 80 100 120 140 1600
20
40
60
80
100
120
Normal stress (kPa)
Shea
r st
ress
(kP
a)
Geotechnics MEng/BEng Civil Engineering
27/02/2013 Page 27 of 57
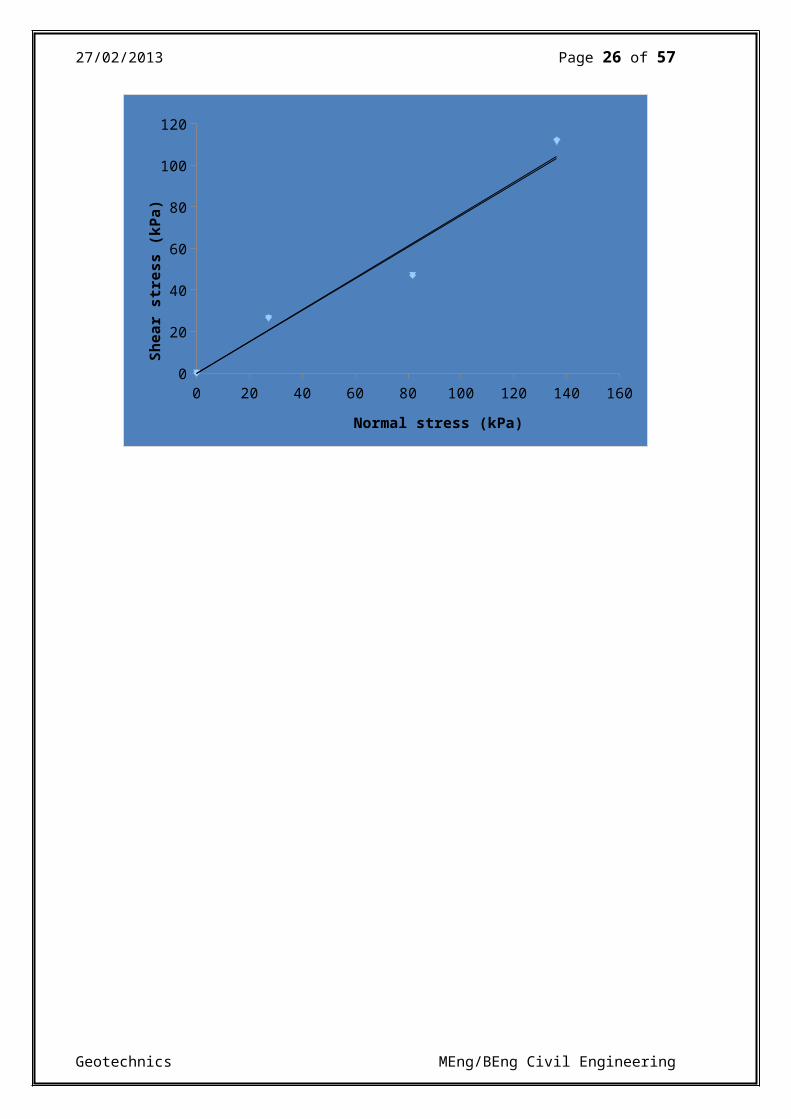
7 Discussions and ConclusionsShear stress/Normal Pressure Graph
The shear stress/Normal Pressure Graph for the peak and residual shearstress is a linear graph. For both shear stresses, as the normal pressure increases, the shear stress also increases. As we can see from our normal against shear graph, the shear strength gives a greater frictional angle and failure the failure envelope is higher than that of the residual strength as expected.
The assumption of area as a constant is not correct. This could be considered in our results by analysing the horizontal movement of the box that can occur and recalculating the values of the area each time.
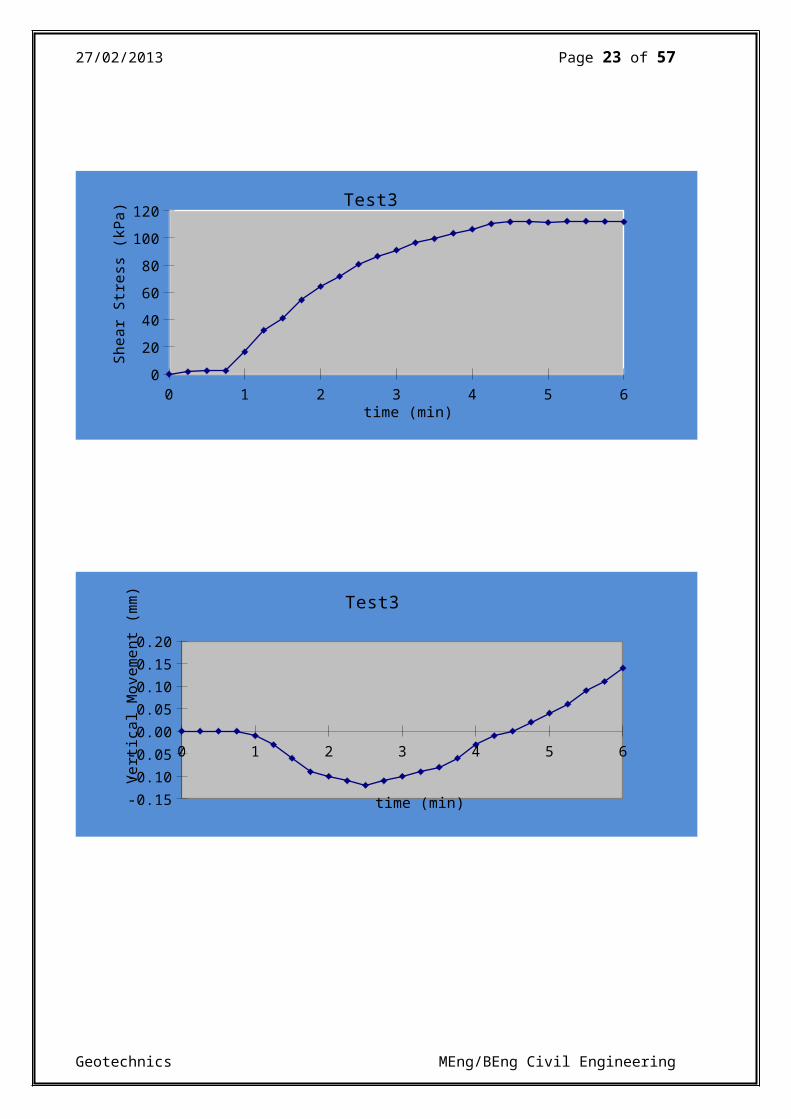
Shear Stress/Time Graph
With the 20, 40 and 60 kg masses applied, Shear stress increased rapidly until after 30 seconds where increase reduced. Comparing the shear stresses when the 20, 40 and 60 kg masses were applied, the shear stresses increased with increasing loads. In this cases, Shear Stress was maximum after times between 150 to 300 seconds.When 10, 30 and 50 kg loads were applied, the shear stress increased slightly until after about 50 seconds, where there was a larger increase in theshear stress. The graph shows a clear strong positive increase in the value of shear strength until the peak where the slope gradually decreases into a shallow gradient. This is the point we get the residual stress. The range for effective angles of friction range between 35 degrees for dense sands and 27 degrees for loose sands. Ourresults fall into these values that gives a medium density outcome forour sample. As expected, the peak strength is greater than residual strength of the soil.
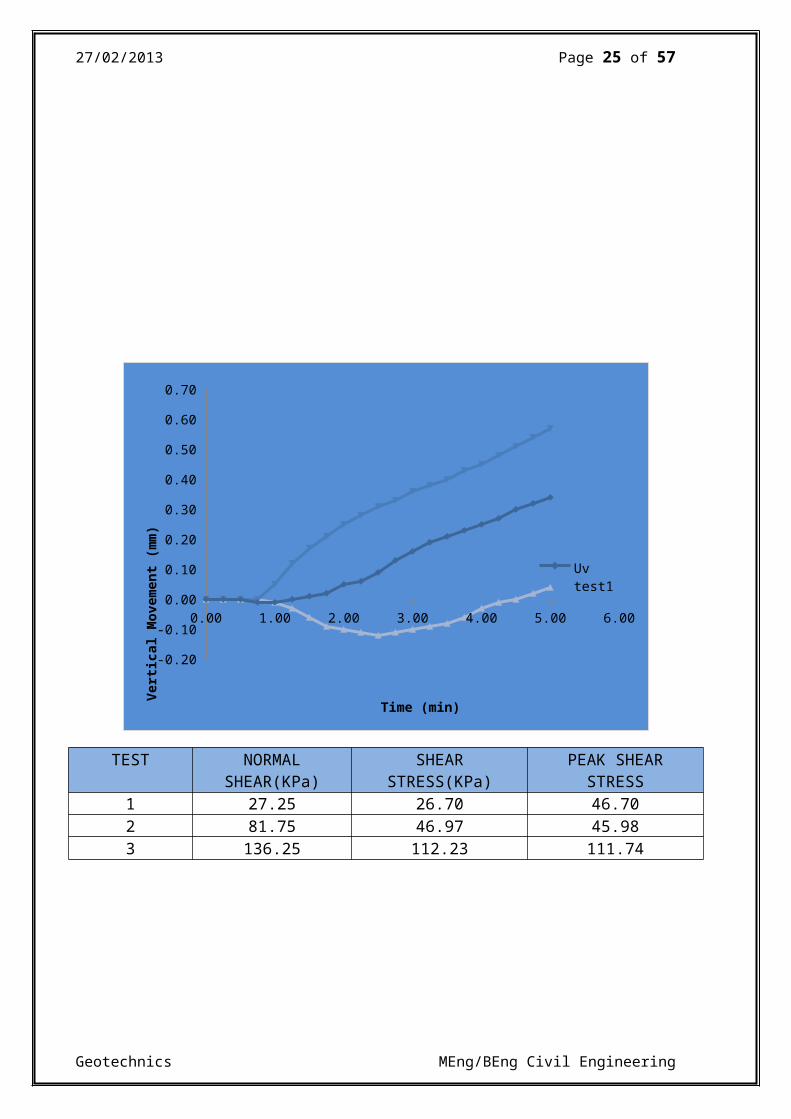
Vertical Displacement/Time Rig Graph
This graph shows that for the 10, 20 30 and 40 kg masses applied, the vertical displacement was constant for a short period of time (until after 90 seconds for the 20 and 40 kg, and after about 60 seconds for the 10 and 30 kg masses) after these times, the vertical displacement increased linearly with increasing time. When the 50kg mass was applied, the vertical displacement remained constant for about 60 seconds, then decreased until after 150 seconds, and finally increased
Geotechnics MEng/BEng Civil Engineering
27/02/2013 Page 28 of 57
linearly with increasing time. Applying 60kg of mass resulted in the vertical displacement decreasing linearly until after about 100 seconds, and then increased with increasing time. The graph shows thatinitially there is a negative slope gradient indicating contraction inthe sample. A positive slope is later formed indicating dilation. The curve straightens out which shows the point of constant volume deformation.
7.1 ErrorsIn all laboratory experiments, to obtain perfect results is impossibledue to the various influences that can affect the accuracy and the reliability of the results. These influences are known as errors and are split in terms of human and equipment error.
7.11 Human ErrorsHuman error involves mistakes that are made from the mistakes of the people conducting the laboratory tests. In this experiment human errorcan occur with the accuracy of reading the write value at the accurateincrement with time. This can decrease the accuracy of our results. Also setting up the equipment is a vital aspect into conducting an accurate test. If the equipment is not set up correctly we will see incorrect fluctuations in our graphs which will make our results and overall our conclusion inaccurate.
7.12 Equipment ErrorsEquipment errors occur when there is a problem with the apparatus thatis used for the experiment. For example if the soil was not pure or the measuring device was tampered with. These errors can also lead to inaccurate results as wrong values will be taken for the results.
7.13 Error due to AssumptionsAssumptions are made for unknown values. If this assumption is far from the actual value, this can lead to error in our results as well as our calculations.
7.14 How can we improve on this error?We can improve on human error by increasing the reliability of our results. For example if more than one person reads the value and confirms the reading this will make our results more reliable, thus, increasing the accuracy of our results and minimising the error. The
Geotechnics MEng/BEng Civil Engineering
27/02/2013 Page 29 of 57
chance of equipment error can be reduced by checking the equipment before conducting the experiment. Also taking more readings will increase the reliability of our results, but if the system is not working as it should, then we would conclude in a wrong trend.
Geotechnics MEng/BEng Civil Engineering
27/02/2013 Page 30 of 57
7.2 Final ConclusionShear stress/Normal stress
This graph as shown above is a linear graph as both normal stress andshear stress increase perpendicularly. The graph as we can observe from above gives a greater frictional angle and failure envelope is higher as expected from our theoretical results.
Shear/Time Graph
The range for angle of friction is between 35 and 27 degrees showing that all our results fall into these values. This ensures that our results for the soil are of medium density. The graph in this case also shows a linear strong and positive correlation because as the time increases the shear also increases as shown on the graph plotted. There is a linear increase until the peak where the slope decreases. The peak strength is greater than residual strength of thesoil.
Velocity displacement/Time graph
The vertical displacement increased linearly as time increased. As a heavier weight was applied the displacement remained constant and then again increased with increasing time. The graph initially shows there is a negative slope gradient. As the curve straightens this is where we can tell that there is a constant volume of deformation.
Geotechnics MEng/BEng Civil Engineering
27/02/2013 Page 31 of 57
ReferencesThere are no sources in the current document.
Geotechnics MEng/BEng Civil Engineering
27/02/2013 Page 32 of 57
Triaxial Test
1 Introduction and Summary
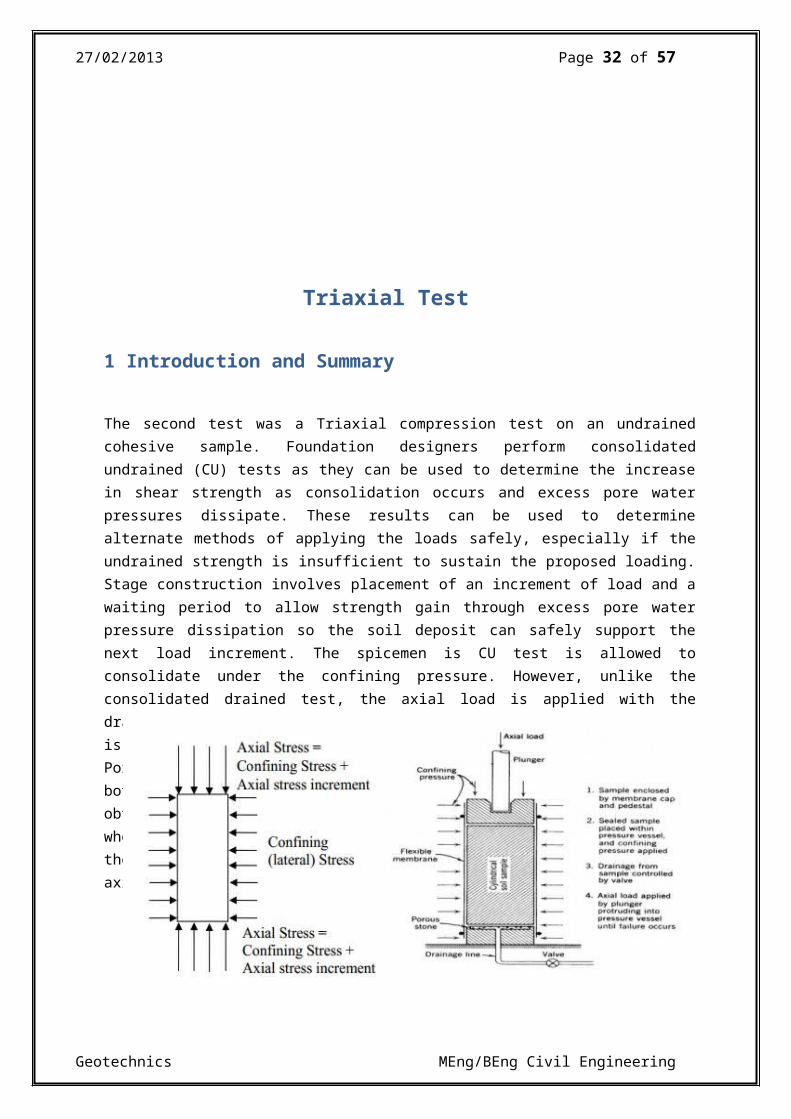
The second test was a Triaxial compression test on an undrainedcohesive sample. Foundation designers perform consolidatedundrained (CU) tests as they can be used to determine the increasein shear strength as consolidation occurs and excess pore waterpressures dissipate. These results can be used to determinealternate methods of applying the loads safely, especially if theundrained strength is insufficient to sustain the proposed loading.Stage construction involves placement of an increment of load and awaiting period to allow strength gain through excess pore waterpressure dissipation so the soil deposit can safely support thenext load increment. The spicemen is CU test is allowed toconsolidate under the confining pressure. However, unlike theconsolidated drained test, the axial load is applied with thedrainage lines closed in the CU test. Thus, during shearing thereis continual development (+ or -) of excess pore water pressure.Pore pressures are typically measured during the CU test so thatboth total stress and effective stress strength parameters can beobtained. The pore water pressure may be + or – depending uponwhether the specimen dilates or compresses during application ofthe axial load. The shear stresses induced in the specimen by theaxial load result in failure.
Geotechnics MEng/BEng Civil Engineering
27/02/2013 Page 33 of 57
Geotechnics MEng/BEng Civil Engineering
Figure 2- Schematic of a triaxialcompression test
27/02/2013 Page 34 of 57
In our experiment, we are going to simulate field conditions in the laboratory by taking a representative undisturbed sample of soil and make some laboratory tests on it. We will apply a confining pressure to our specimen that has a cylindrical shape.
As different lateral hydraulic pressures are subjected on a soil element, if we apply a vertical load on the sample (stress), we will be able to measure its resistance to shear failure. In this experiment, we will look at soils under undrained conditions. However,the sample has to be tested with appropriate and constant drainage to make errors insignificant.
2.1 Objective
Determine the apparent cohesion and angle of shearing resistance of the sample of a cohesive soil by means of an undrainedtriaxial compression test.
2.2 Learning Objectives
At the end of the experiment the students were able to
develop laboratory and experimental skills
understand practical and theoretical concepts in relation to the shear strength of the soils
2.3 AimThe apparatus is used for:
Finding shear strength parameters by applying various elements ofsoils and various confining pressures.
Determining the apparent cohesion and angle of shearing resistance of a given sample of cohesive soil by means of an undrained triaxial compression test.
Geotechnics MEng/BEng Civil Engineering
27/02/2013 Page 35 of 57
Also laboratory exercises offer procedural skills and insights throughmanipulation of the equipment and materials. Students will appreciate laboratory techniques and will experience active learning.
The aims of the Triaxial Compression Test is to find the maximum resistance to shear and establish deformation behaviour of soil elements. By conducting such a test, Engineers and laboratory staff try to analyse bank stability and to find sheet piles solutions to problems. The apparatus is used for:
Finding shear strength parameters by applying various elements ofsoils and various confining pressures.
Determining the apparent cohesion and angle of shearing resistance of a given sample of cohesive soil by means of an undrained triaxial compression test.
Also laboratory exercises offer procedural skills and insights throughmanipulation of the equipment and materials. Students will appreciate laboratory techniques and will experience active learning.
The purpose of the triaxial test is to determine the shear strength and the deformation behaviour of the soil. The test is used for many reasons, but mainly to determine bank stability and for deformation calculations for sheet piles. A cylindrical soil sample is tested whilst confined between a rigid bottom and top plate covered with a rubber membrane. A vertical load is then placed on the sample. Horizontal pressure is exerted on all sides of the soil sample by applying pressure to the water around the sample. The rubber membrane around the sample prevents the water from penetrating.
The water pressure is maintained at a constant level throughout the test. By increasing the vertical force at a constant velocity the sample gradually compresses until shearing occurs. The shear strength parameters usually derived from the triaxial test are the cohesion andthe angle of internal friction. The test can however also be used to determine rigidity parameters such as Young's modulus E.
Geotechnics MEng/BEng Civil Engineering
27/02/2013 Page 36 of 57
Geotechnics MEng/BEng Civil Engineering
27/02/2013 Page 37 of 57
3. TheoryMostly we should have 3 different stresses can be created on soils in field those are a.) Axial stress sb.) Water Pressure U c.) Ambience stress s3
Using triaxial stress, all stresses might be applied on the soil sample in different ways. Basically Axial stress can be applied to specimen until fail becomes by vertical force which is loading ram. The stress this axial load gives is named the deviator stress σd. Tri axial test can balance the circumstances of consilation and raining ofwater when we apply the force which means of connectors in device.
Tri-axial test can be classified into the following: Consilidated drained test means the connection of drainage is opened during the whole test so the sample is allowed to consolidate under confining pressure. When the deviator stress is applied the water is allowed to be drained. With this the pore water pressure provided and deviator stress is zero. For this type of test only one failure shear envelope well exist as total stresses are equivalent to the effective stresses.Consolidated undrained is where the connection is only opened till application of the deviated stress so that consolidation occurs under the stress, and pore water pressure will be zero. When the stress is applied there will be no drainage allowed so pore water pressure will exist. In this exist different failure envelopes can be plotted depending on the total or effective stress are used. U-U test, the drainage connection remains closed for the whole test and water is not permitted to drain during the application of the stress. The failure shear envelope in the test is a straight line because the deviator stress will be constant regardless of the pressure. In this test the stress is provided by water which is measured by pressure gauge connected to a piston. The deviator stress is measured by loading ring known as LRC.In theory, shear strength parameters for various samples of soils under drained and undrained conditions would be determined by doing a Triaxial Test in laboratory. Deformations of the soil specimen could be easily detected and the Poisson’s ratio appraised.
Geotechnics MEng/BEng Civil Engineering
27/02/2013 Page 38 of 57
A vertical load at constant velocity is exerted on the soil element until shearing followed. We then establish cohesion and angle of internal friction. Shear strength of soil specimen and strain and stresses relationship could then be established. Hydraulic effect and mechanical properties of the soil relationship will be also determinedas porewater and drainage would be regulated.
The soil element will be tested to failure under confining or lateral hydraulic pressure. Young's modulus demonstrating rigidity parameters would be obtained by doing this kind of laboratory experiment.
A membrane is mounted on the envelope surface of the specimen inorder to seal the specimen from the surrounding pressure media. Deformation measurement equipment are mounded on the specimen and the specimen is inserted into the pressure cell whereupon the cell is closed and filled with oil. A hydrostatic pressure is applied in the first step. The specimen is then further loaded by increasing the axial load under constant or increasingcell pressure up to failure or any other pre-defined load level.
The triaxial test is common for shear strength due to it being compatible with almost all types of soils. The only soils that are notcompatible with this test are very sensitive clays. The triaxial test is conducted on a soil sample that is of a cylindrical shape. This specimen is enclosed between the rubber membrane that gets rid of the air between the membrane and the specimen and seal it from the water.
Deviator load is then applied onto the specimen increasing the pressure steadily until the specimen develops and shows signs of failure. This method can then be repeated for different confining pressures and then the values are compared to notice a trend. Once experiment has been done, we can construct he Mohr’s circle to show the Mohr envelope by drawing a tangent to the Mohr’s circles. Triaxial compression test is performed to obtain data points so failure locus can be determined. Mohr’s circle can also be obtained using this data. The data can also be used to calculatenumerical stability and engage in constitutive modelling. It canbe used for excavation design as well as hydraulic fracturing design.
Geotechnics MEng/BEng Civil Engineering
27/02/2013 Page 39 of 57
The lateral pressure produces a normal horizontal stress on the vertical planes of the specimen. No shear stresses are produced on thehorizontal planes by either the axial load or the confining pressure.
The triaxial compression test is most commonly used from shear strength test due to its compatibility with all types of soil, except for very sensitive clays. The test is conducted on a cylindrical specimen enclosed between rigid end-caps inside a thin rubber membrane. This membrane is to seal the specimen fromthe cell water. An axial load, also known as deviator load, Is then applied and steadily increased until the specimen fails. This procedure could be repeated for different confining pressure as well as different loads. Once the experiment has been conducted, Mohr’s circle can be constructed. The tangent tothe resulting circles becomes the Mohr envelope
Geotechnics MEng/BEng Civil Engineering
27/02/2013 Page 40 of 57
4 Apparatus and Methodology
4.1 Equipment
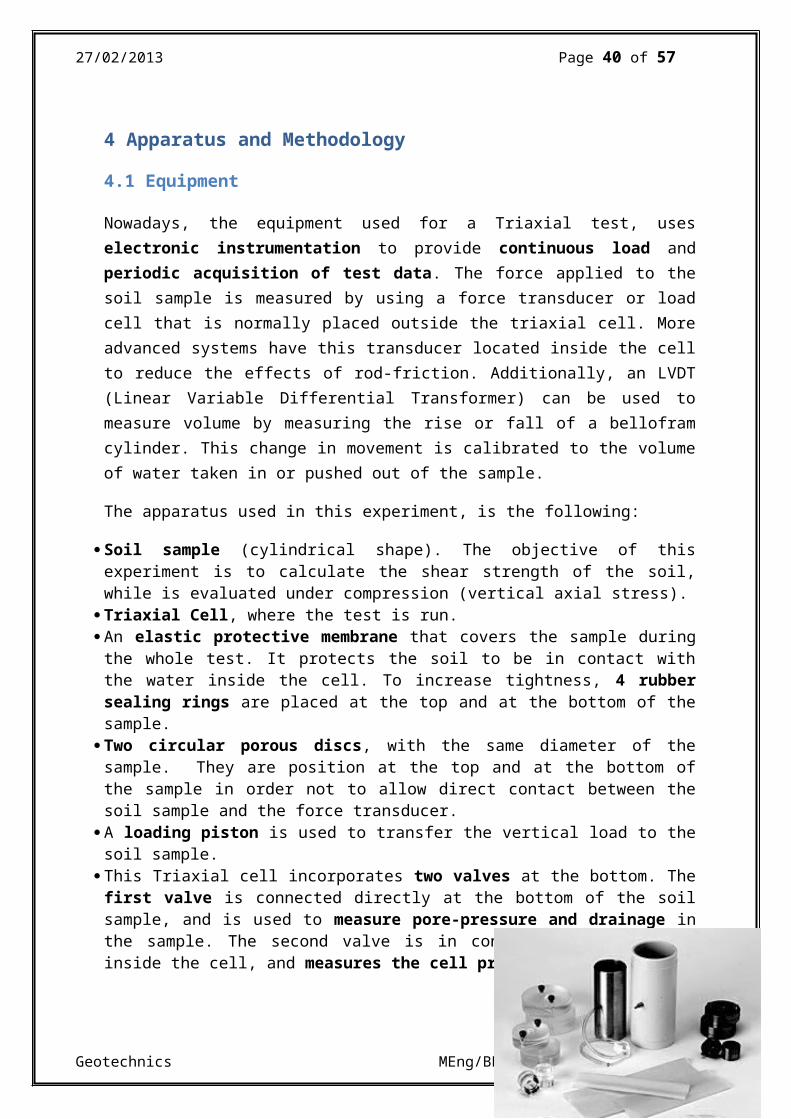
Nowadays, the equipment used for a Triaxial test, useselectronic instrumentation to provide continuous load andperiodic acquisition of test data. The force applied to thesoil sample is measured by using a force transducer or loadcell that is normally placed outside the triaxial cell. Moreadvanced systems have this transducer located inside the cellto reduce the effects of rod-friction. Additionally, an LVDT(Linear Variable Differential Transformer) can be used tomeasure volume by measuring the rise or fall of a belloframcylinder. This change in movement is calibrated to the volumeof water taken in or pushed out of the sample.
The apparatus used in this experiment, is the following:
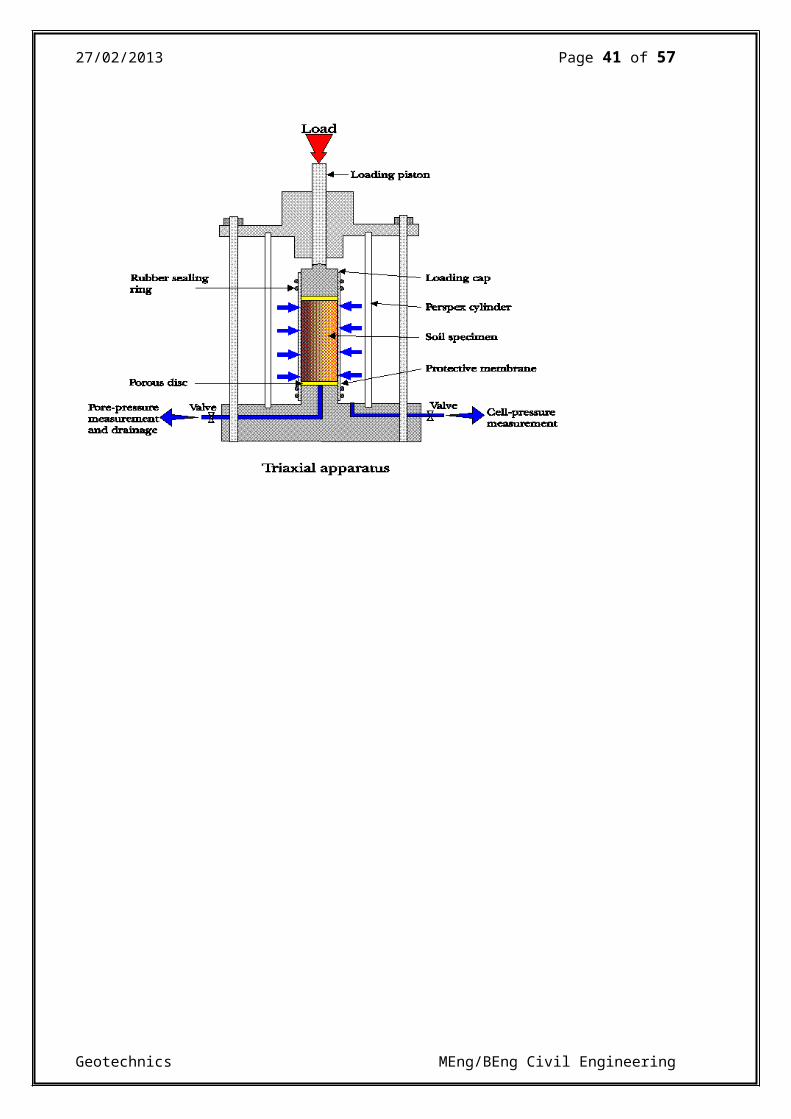
Soil sample (cylindrical shape). The objective of thisexperiment is to calculate the shear strength of the soil,while is evaluated under compression (vertical axial stress).
Triaxial Cell, where the test is run. An elastic protective membrane that covers the sample duringthe whole test. It protects the soil to be in contact withthe water inside the cell. To increase tightness, 4 rubbersealing rings are placed at the top and at the bottom of thesample.
Two circular porous discs, with the same diameter of thesample. They are position at the top and at the bottom ofthe sample in order not to allow direct contact between thesoil sample and the force transducer.
A loading piston is used to transfer the vertical load to thesoil sample.
This Triaxial cell incorporates two valves at the bottom. Thefirst valve is connected directly at the bottom of the soilsample, and is used to measure pore-pressure and drainage inthe sample. The second valve is in contact with the waterinside the cell, and measures the cell pressure.
Geotechnics MEng/BEng Civil Engineering
27/02/2013 Page 41 of 57
Geotechnics MEng/BEng Civil Engineering
27/02/2013 Page 42 of 57
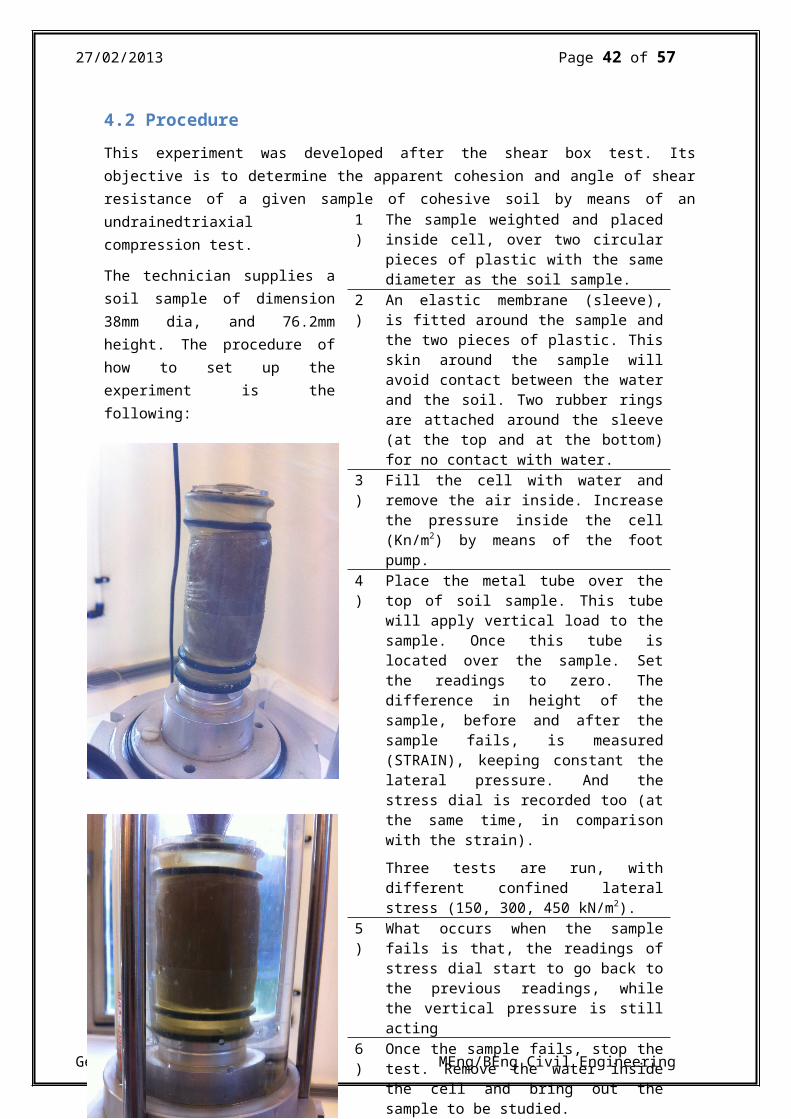
4.2 ProcedureThis experiment was developed after the shear box test. Itsobjective is to determine the apparent cohesion and angle of shearresistance of a given sample of cohesive soil by means of anundrainedtriaxialcompression test.
The technician supplies asoil sample of dimension38mm dia, and 76.2mmheight. The procedure ofhow to set up theexperiment is thefollowing:
Geotechnics MEng/BEng Civil Engineering
1)
The sample weighted and placedinside cell, over two circularpieces of plastic with the samediameter as the soil sample.
2)
An elastic membrane (sleeve),is fitted around the sample andthe two pieces of plastic. Thisskin around the sample willavoid contact between the waterand the soil. Two rubber ringsare attached around the sleeve(at the top and at the bottom)for no contact with water.
3)
Fill the cell with water andremove the air inside. Increasethe pressure inside the cell(Kn/m2) by means of the footpump.
4)
Place the metal tube over thetop of soil sample. This tubewill apply vertical load to thesample. Once this tube islocated over the sample. Setthe readings to zero. Thedifference in height of thesample, before and after thesample fails, is measured(STRAIN), keeping constant thelateral pressure. And thestress dial is recorded too (atthe same time, in comparisonwith the strain).Three tests are run, withdifferent confined lateralstress (150, 300, 450 kN/m2).
5)
What occurs when the samplefails is that, the readings ofstress dial start to go back tothe previous readings, whilethe vertical pressure is stillacting
6)
Once the sample fails, stop thetest. Remove the water insidethe cell and bring out thesample to be studied.
27/02/2013 Page 43 of 57
Geotechnics MEng/BEng Civil Engineering
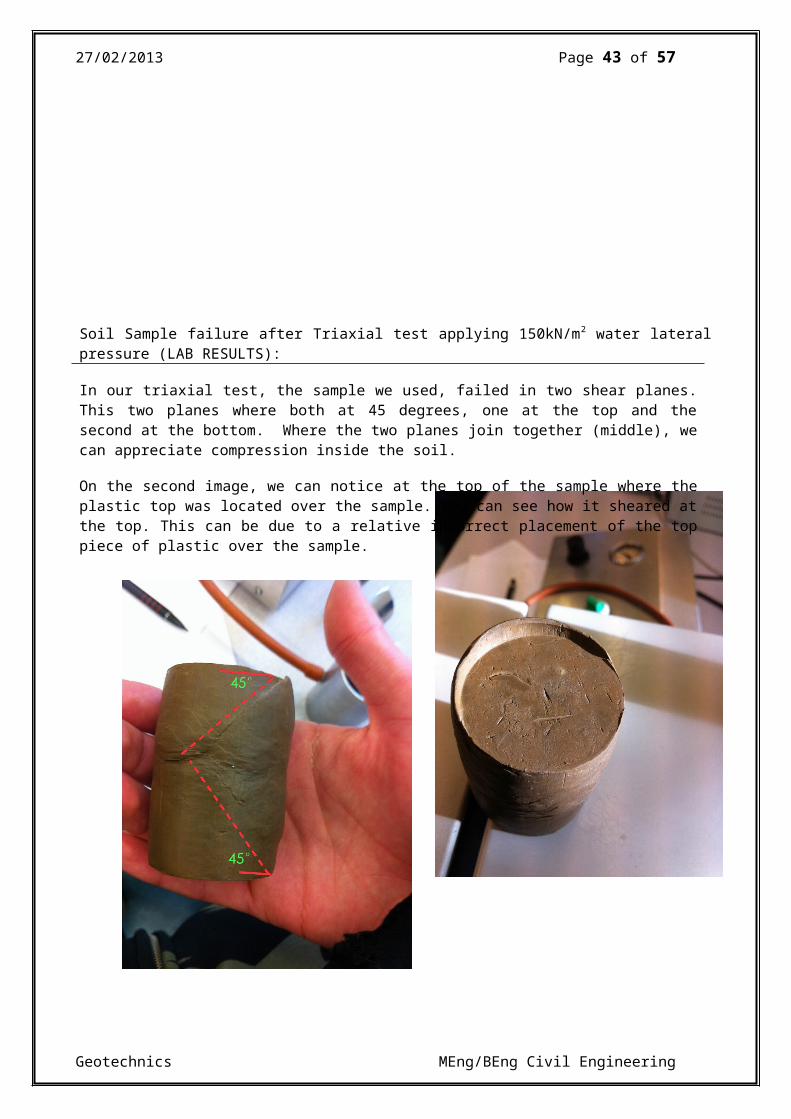
Soil Sample failure after Triaxial test applying 150kN/m2 water lateralpressure (LAB RESULTS):
In our triaxial test, the sample we used, failed in two shear planes.This two planes where both at 45 degrees, one at the top and thesecond at the bottom. Where the two planes join together (middle), wecan appreciate compression inside the soil.
On the second image, we can notice at the top of the sample where theplastic top was located over the sample. You can see how it sheared atthe top. This can be due to a relative incorrect placement of the toppiece of plastic over the sample.
27/02/2013 Page 44 of 57
Health and Safety
Procedure for Conducting the Experiment in the Laboratory
Before to start any experiment Personal Protective Equipment specified(laboratory coat and safety footwear) should be worn. Ideally, membersof staff should brief students on any relevant Health and Safetymatters. Students should read the brief before getting to thelaboratory such as they might identify Health and Safety issues oncethey get into the experiment room inside the building. Also notices ofthe equipment should be on noticeboards to help students understand theway the apparatus should be used and identify any Health and Safetyrisks associated with the experiment. All instructions have to befollowed rigorously.
If adequate samples of variable rock properties are available, repeating the test can be merited to increase the reliability and determine average values. If the test is carried out under different pressures, a failure chart can be constructed using computer programmes. The selected pressures that are used duringthe test are generally ranged from very low to above maximum foreffective stress conditions.
A failure envelope is a representation of the strength of the material under different pressures. The simplest version of thisis linear and known as the Coulomb failure envelope. Mohr’s circles are plotted with the data obtained from axial forces andpressures at failure as the major and minor principal stresses.
Geotechnics MEng/BEng Civil Engineering
27/02/2013 Page 45 of 57
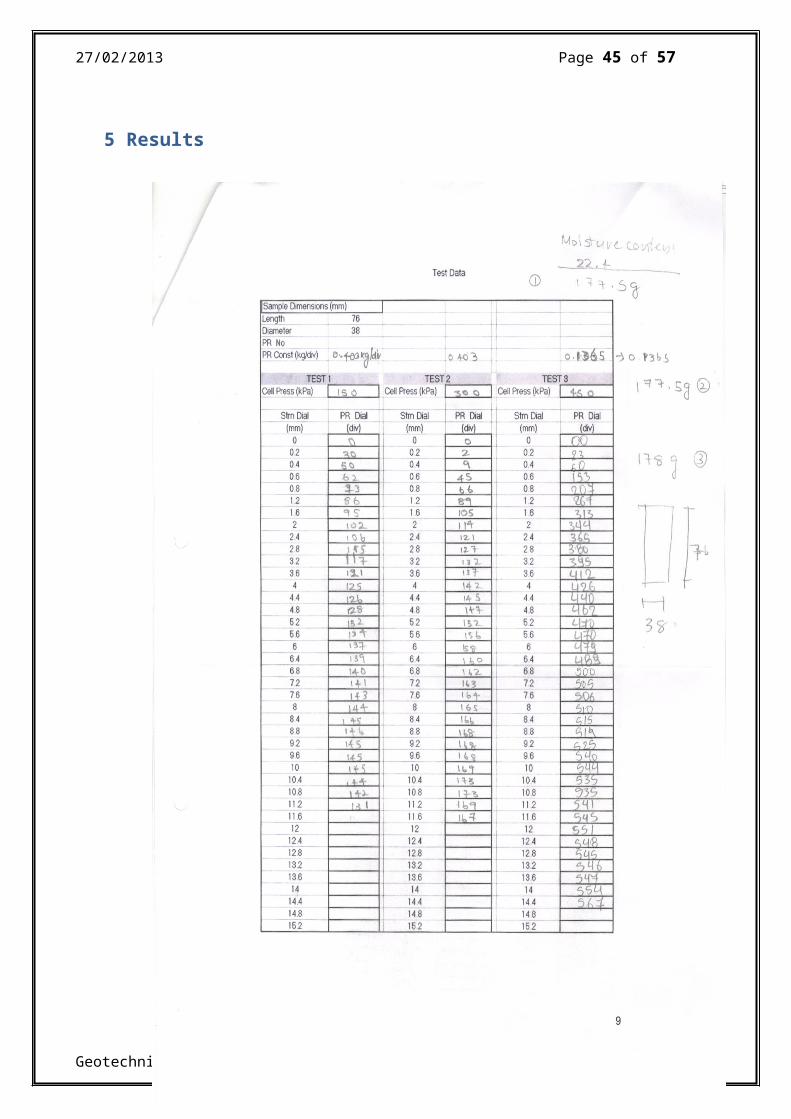
5 Results
Geotechnics MEng/BEng Civil Engineering
27/02/2013 Page 46 of 57
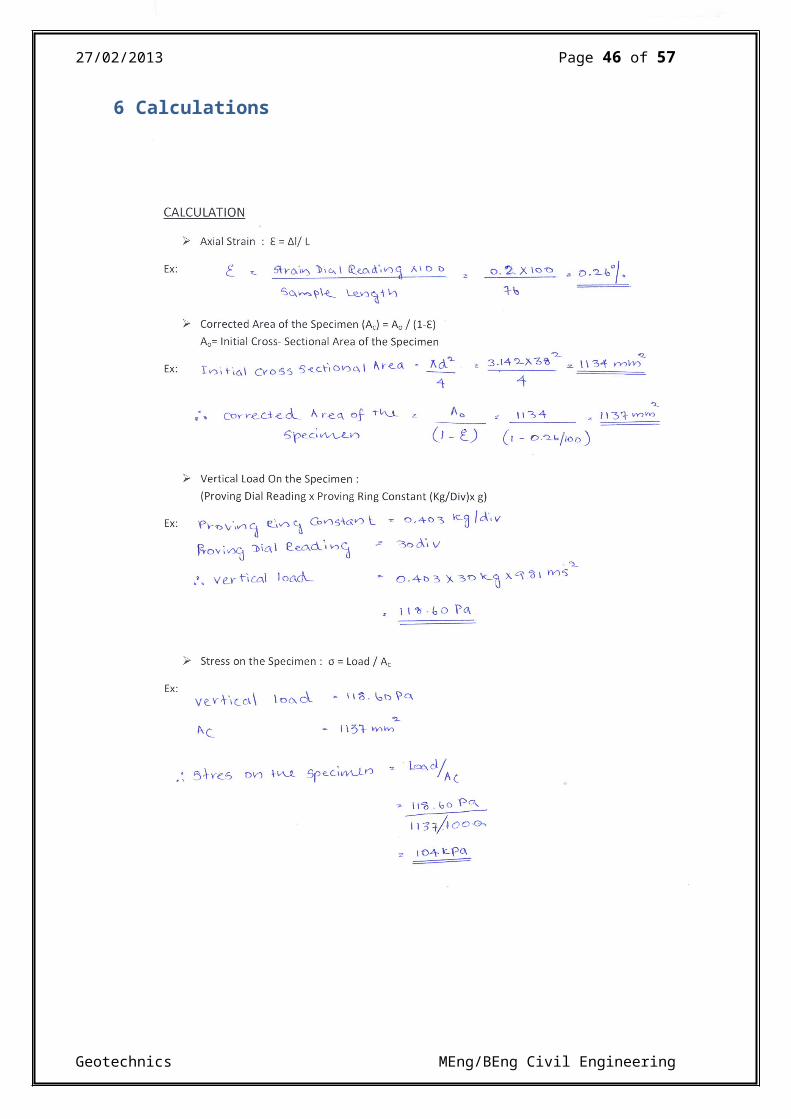
6 Calculations
Geotechnics MEng/BEng Civil Engineering
27/02/2013 Page 47 of 57
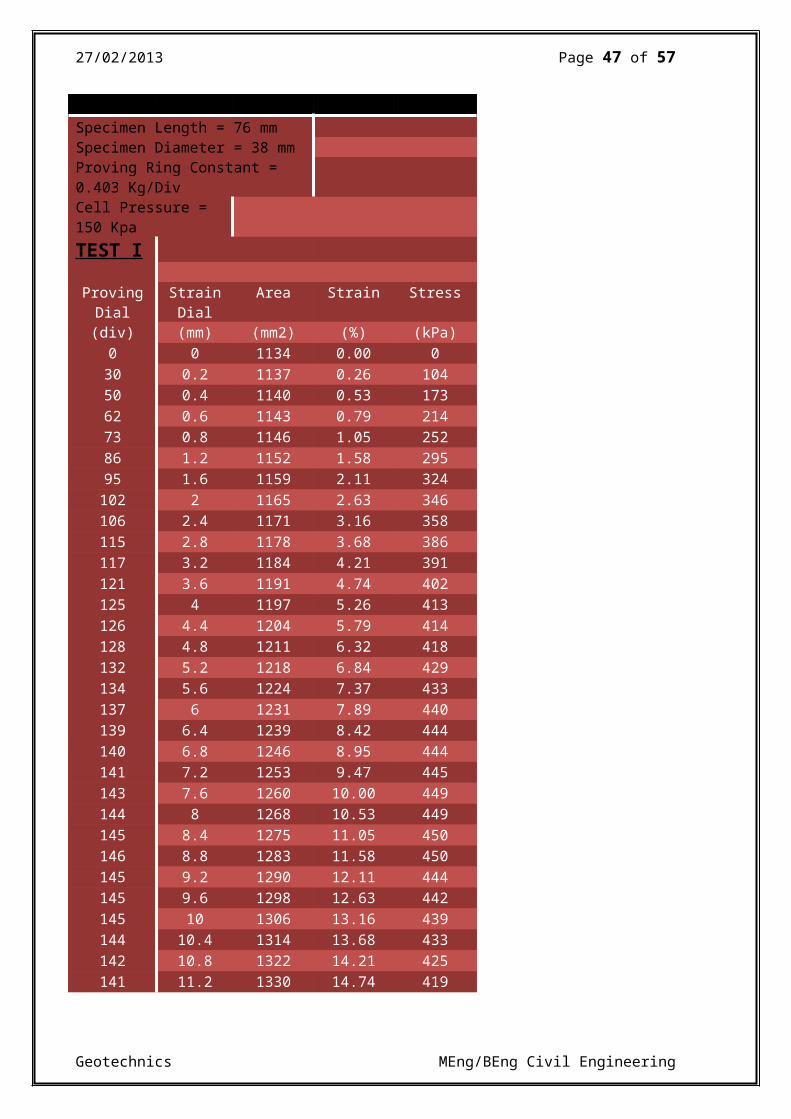
Specimen Length = 76 mmSpecimen Diameter = 38 mmProving Ring Constant = 0.403 Kg/DivCell Pressure = 150 KpaTEST I
ProvingDial
StrainDial
Area Strain Stress
(div) (mm) (mm2) (%) (kPa)0 0 1134 0.00 030 0.2 1137 0.26 10450 0.4 1140 0.53 17362 0.6 1143 0.79 21473 0.8 1146 1.05 25286 1.2 1152 1.58 29595 1.6 1159 2.11 324102 2 1165 2.63 346106 2.4 1171 3.16 358115 2.8 1178 3.68 386117 3.2 1184 4.21 391121 3.6 1191 4.74 402125 4 1197 5.26 413126 4.4 1204 5.79 414128 4.8 1211 6.32 418132 5.2 1218 6.84 429134 5.6 1224 7.37 433137 6 1231 7.89 440139 6.4 1239 8.42 444140 6.8 1246 8.95 444141 7.2 1253 9.47 445143 7.6 1260 10.00 449144 8 1268 10.53 449145 8.4 1275 11.05 450146 8.8 1283 11.58 450145 9.2 1290 12.11 444145 9.6 1298 12.63 442145 10 1306 13.16 439144 10.4 1314 13.68 433142 10.8 1322 14.21 425141 11.2 1330 14.74 419
Geotechnics MEng/BEng Civil Engineering

27/02/2013 Page 48 of 57
Geotechnics MEng/BEng Civil Engineering
27/02/2013 Page 49 of 57
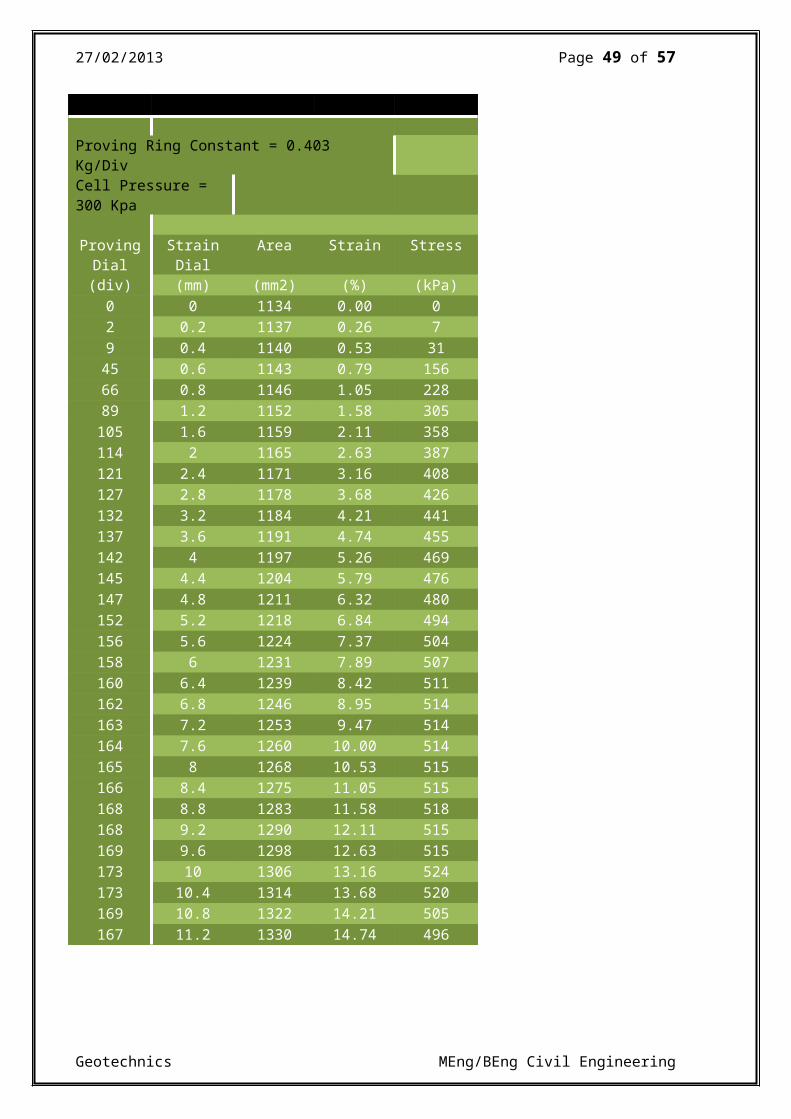
TEST 2
Proving Ring Constant = 0.403 Kg/DivCell Pressure = 300 Kpa
ProvingDial
StrainDial
Area Strain Stress
(div) (mm) (mm2) (%) (kPa)0 0 1134 0.00 02 0.2 1137 0.26 79 0.4 1140 0.53 3145 0.6 1143 0.79 15666 0.8 1146 1.05 22889 1.2 1152 1.58 305105 1.6 1159 2.11 358114 2 1165 2.63 387121 2.4 1171 3.16 408127 2.8 1178 3.68 426132 3.2 1184 4.21 441137 3.6 1191 4.74 455142 4 1197 5.26 469145 4.4 1204 5.79 476147 4.8 1211 6.32 480152 5.2 1218 6.84 494156 5.6 1224 7.37 504158 6 1231 7.89 507160 6.4 1239 8.42 511162 6.8 1246 8.95 514163 7.2 1253 9.47 514164 7.6 1260 10.00 514165 8 1268 10.53 515166 8.4 1275 11.05 515168 8.8 1283 11.58 518168 9.2 1290 12.11 515169 9.6 1298 12.63 515173 10 1306 13.16 524173 10.4 1314 13.68 520169 10.8 1322 14.21 505167 11.2 1330 14.74 496
Geotechnics MEng/BEng Civil Engineering
27/02/2013 Page 50 of 57
Geotechnics MEng/BEng Civil Engineering
27/02/2013 Page 51 of 57
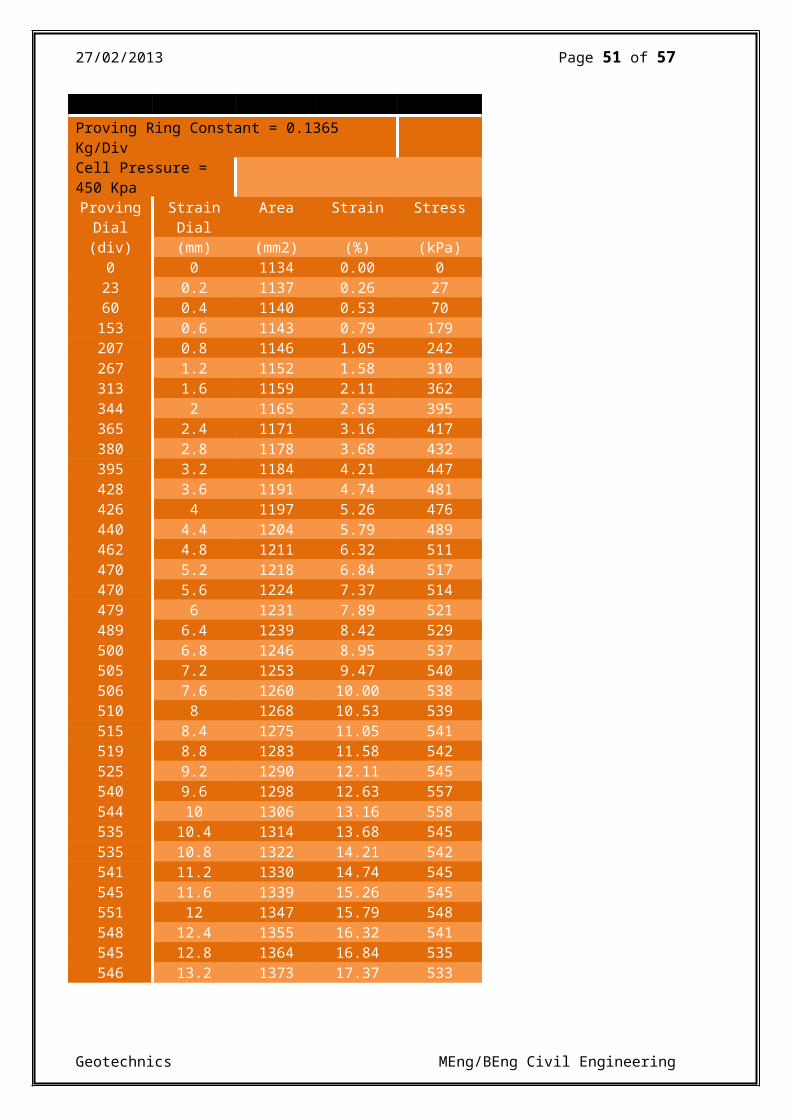
TEST 3Proving Ring Constant = 0.1365 Kg/DivCell Pressure = 450 KpaProvingDial
StrainDial
Area Strain Stress
(div) (mm) (mm2) (%) (kPa)0 0 1134 0.00 023 0.2 1137 0.26 2760 0.4 1140 0.53 70153 0.6 1143 0.79 179207 0.8 1146 1.05 242267 1.2 1152 1.58 310313 1.6 1159 2.11 362344 2 1165 2.63 395365 2.4 1171 3.16 417380 2.8 1178 3.68 432395 3.2 1184 4.21 447428 3.6 1191 4.74 481426 4 1197 5.26 476440 4.4 1204 5.79 489462 4.8 1211 6.32 511470 5.2 1218 6.84 517470 5.6 1224 7.37 514479 6 1231 7.89 521489 6.4 1239 8.42 529500 6.8 1246 8.95 537505 7.2 1253 9.47 540506 7.6 1260 10.00 538510 8 1268 10.53 539515 8.4 1275 11.05 541519 8.8 1283 11.58 542525 9.2 1290 12.11 545540 9.6 1298 12.63 557544 10 1306 13.16 558535 10.4 1314 13.68 545535 10.8 1322 14.21 542541 11.2 1330 14.74 545545 11.6 1339 15.26 545551 12 1347 15.79 548548 12.4 1355 16.32 541545 12.8 1364 16.84 535546 13.2 1373 17.37 533
Geotechnics MEng/BEng Civil Engineering
27/02/2013 Page 52 of 57
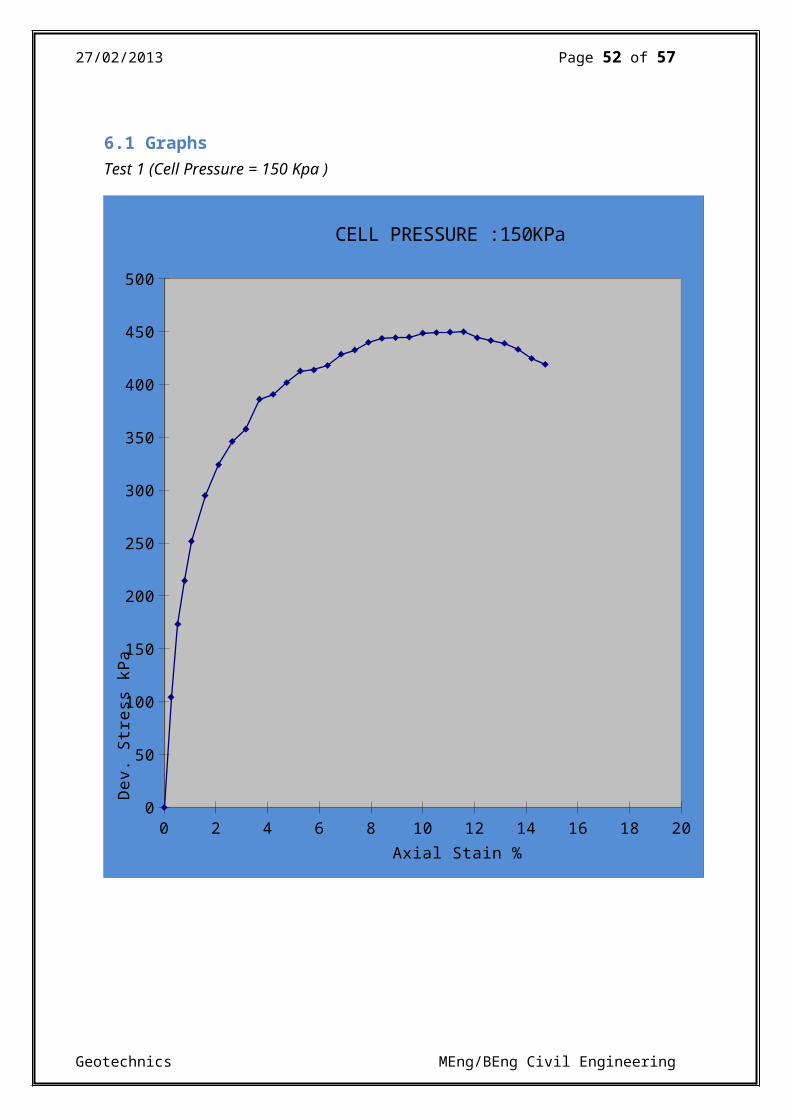
6.1 GraphsTest 1 (Cell Pressure = 150 Kpa )
0 2 4 6 8 10 12 14 16 18 200
50
100
150
200
250
300
350
400
450
500
CELL PRESSURE :150KPa
Axial Stain %
Dev.
Str
ess
kPa
Geotechnics MEng/BEng Civil Engineering
27/02/2013 Page 53 of 57
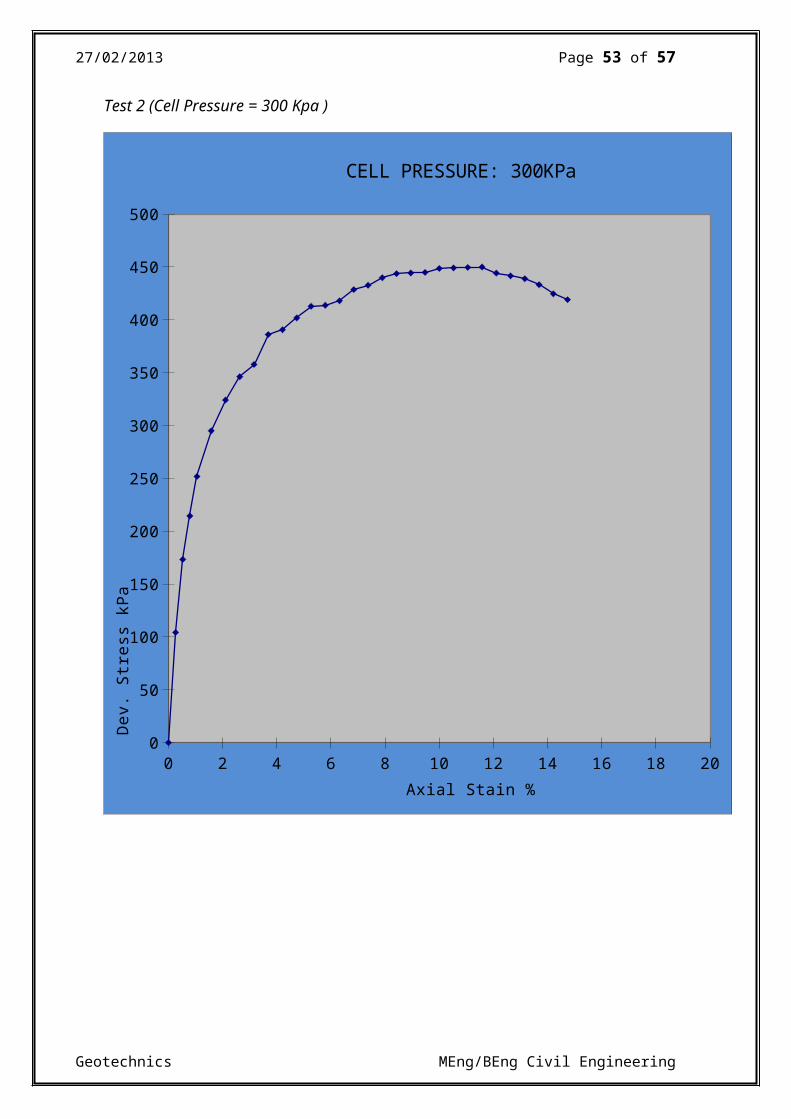
Test 2 (Cell Pressure = 300 Kpa )
0 2 4 6 8 10 12 14 16 18 200
50
100
150
200
250
300
350
400
450
500
CELL PRESSURE: 300KPa
Axial Stain %
Dev.
Str
ess
kPa
Geotechnics MEng/BEng Civil Engineering
27/02/2013 Page 54 of 57
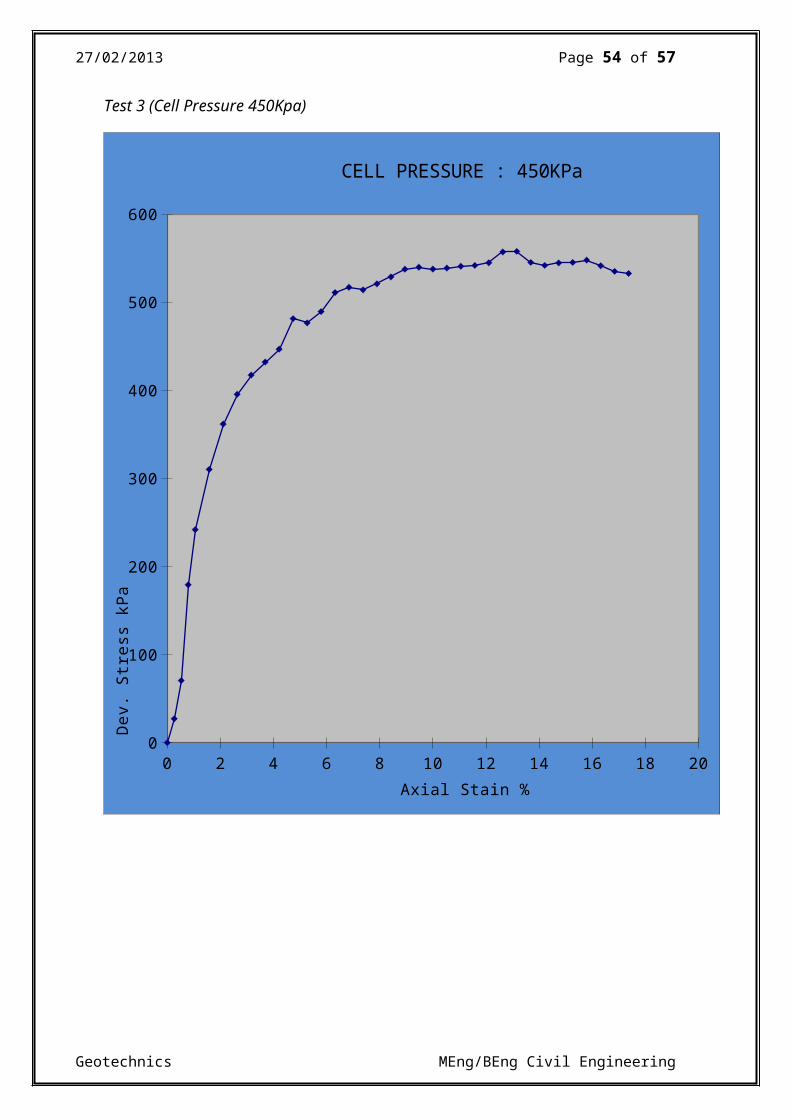
Test 3 (Cell Pressure 450Kpa)
0 2 4 6 8 10 12 14 16 18 200
100
200
300
400
500
600
CELL PRESSURE : 450KPa
Axial Stain %
Dev.
Str
ess
kPa
Geotechnics MEng/BEng Civil Engineering
27/02/2013 Page 55 of 57
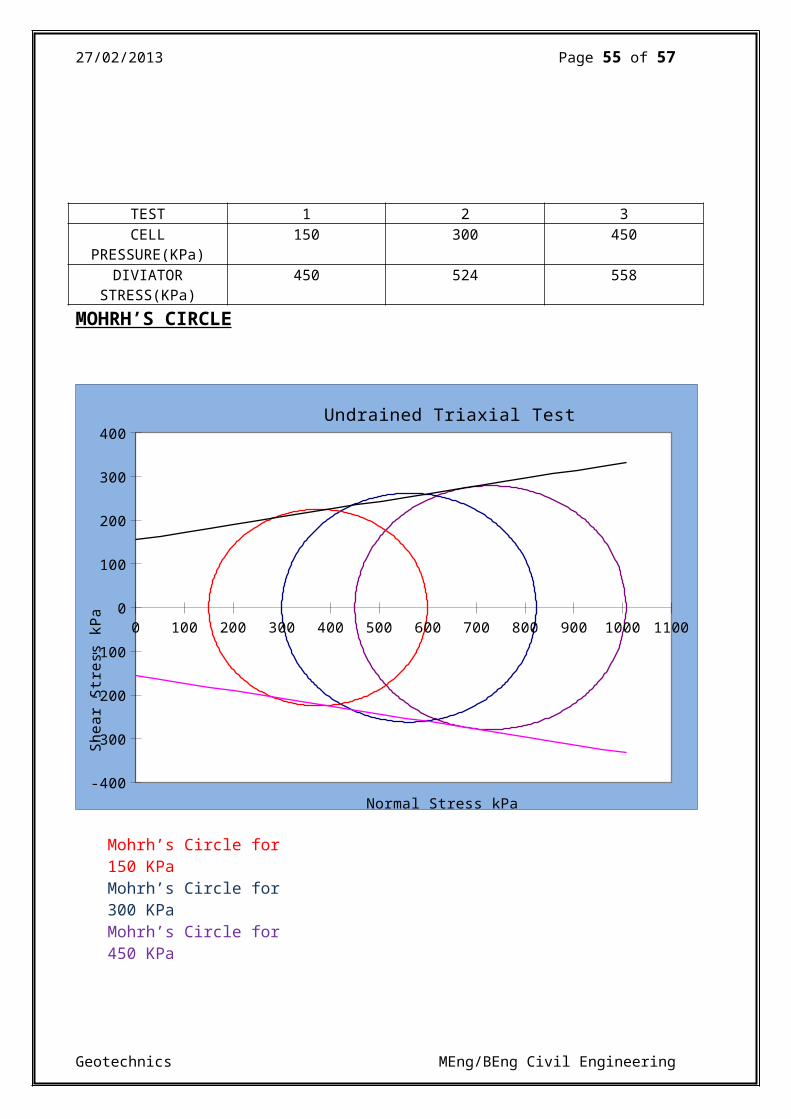
TEST 1 2 3CELL
PRESSURE(KPa)150 300 450
DIVIATORSTRESS(KPa)
450 524 558
MOHRH’S CIRCLE
0 100 200 300 400 500 600 700 800 900 1000 1100
-400
-300
-200
-100
0
100
200
300
400Undrained Triaxial Test
Normal Stress kPa
Shea
r St
ress
kPa
Mohrh’s Circle for 150 KPaMohrh’s Circle for 300 KPaMohrh’s Circle for 450 KPa
Geotechnics MEng/BEng Civil Engineering
27/02/2013 Page 56 of 57
9 Discussions and Conclusions
As the axial load on the specimen increases a shortening in length takes place with a corresponding increase in diameter. When drainage becomes allowable the volume of the sample will decrease. This was measured by the strain dial gauge which indicates the change in lengthof the specimen.
Drainage conditions during shearing will heavily affect the strength parameters of the soils. If the samples are drained allowing slow shearing to take place, pore pressures will not be able to develop. This type of test is known as the “drained test”. However, if the samples are not allowed to drain or shearing occurs quickly, pore pressures are able to develop in the specimen. This is called “undrained test”.
The specimen is subject to compressive stresses resolved along three orthogonal axes and then applied in two stages. An isotropic consolidation stress is then applied and during this stage the volume decreases because of the consolidation. The test is continued by increasing the axial load as the cell pressure is held constant. The compressive stress is increased with deviator stress.
Failure occurs at the peak of the graph as shown above on the different specimens used. This is where the deviator stress has been reached. If the stage is undrained the pore pressure will have risen. If the stage is drained the volume will have decreased. This is all shown in the graphs that our provided above in the report. Since thereis no shear stress developed on the sides, the vertical and lateral axial stresses are known as principal stresses.
As the specimen shortens under the load the diameter will increase, Indense or over consolidated samples the specimen may shear clearly along the slip surface as the peak stress is reached. In lightly overconsolidated soil the shear will be less definite.
Mohr’s circle
Geotechnics MEng/BEng Civil Engineering
27/02/2013 Page 57 of 57
Many of the problems in geotechnical design require only shear strength parameters that relate to normal consolidate soils or to measure the peak stress. In this case Mohr’s circle is created for each peak or failing stresses. The tangent to these circles is then drawn to prove a reasonable good of observation. Strength envelope andangle of friction can all be determined from the Mohr’s circle graph that was produced on excel as shown above. The results, as far as the Mohr’s circle is concerned, due to the no strength gain, i the angle of the failure envelope would be zero. Thetotal stress takes into account the stress minus the pore pressure. The pore pressure in all 3 is increases but at a slower rate a. Due tothis reason the deviator stress value for the effective stress circlesis lower than the total stress.
Both of these values are extremely important when from an engineering analysis point of view. It gives us a clear understanding of what is occurring as we would not be able to assess the values or compare the relationships between effect stress, pore pressure and total stress.
The aim of this experiment was to determine the apparent cohesion and the angle of shearing resistance of the given sample soil. During the tests we obtained accurate values which were theoretically correct. Anexample of where this type of triaxial test would be used in the case of finding the initial stability of a footing on saturated clay. Due to the initial increase in pore water pressure of the clay, the effective stress will increase over a long period of time as consolidation occurs.
Geotechnics MEng/BEng Civil Engineering


