Embed Size (px)
Citation preview

MARINE ECOLOGY PROGRESS SERIESMar Ecol Prog Ser
Vol. 462: 125–142, 2012doi: 10.3354/meps09824
Published August 21
INTRODUCTION
Oyster reefs have been identified as essential fishhabitat for resident and transient species, and pro-vide higher diversity and availability of food or agreater amount of higher quality food compared toother habitats (Breitburg 1999, Coen et al. 1999,Harding & Mann 2001, Grabowski et al. 2005). Wells(1961) collected 303 different species that utilizedoyster reefs, segregating species that use the reef pri-marily as shelter from those that depend on the reeffor food. Fish species can be separated into 3 cate-gories based on their dependence on oyster reefs forhabitat: (1) resident oyster reef fishes are dependent
on oyster reefs as their primary habitat, (2) facultativeresidents utilize the structured habitat of the reef andare not wide ranging species, and (3) transients thatare wide ranging, especially as adults, use the reefsas feeding grounds (Breitburg 1999). The oyster reef-resident organisms are consumed by finfish andcrusta cean species that may be recreationally orcommercially valuable (Grabowski et al. 2005, Gra -bowski & Peterson 2007).
Several species of fishes have been identified asoyster reef residents and include the naked gobyGobiosoma bosc, Florida blenny Chasmodes sabur-rae, striped blenny Chasmodes bosquianus, featherblenny Hypsoblennius hentz, skilletfish Gobiesox
© Inter-Research 2012 · www.int-res.com*Corresponding author. Email: [email protected]
Trophic transfer and habitat use of oysterCrassostrea virginica reefs in southwest Florida,
identified by stable isotope analysis
Holly A. Abeels1,2, Ai Ning Loh1, Aswani K. Volety1,*
1Florida Gulf Coast University, Fort Myers, Florida 33965, USA
2Present address: University of Florida/Institute of Food and Agricultural Sciences, Brevard County Extension Service, Cocoa, Florida 32926, USA
ABSTRACT: Oyster reefs have been identified as essential fish habitat for resident and transientspecies. Many organisms found on oyster reefs, including shrimp, crabs, and small fishes, findshelter and food on the reef and in turn provide food for transient species that frequent oysterreefs. The objective of this study was to determine trophic transfer on oyster reefs in a subtropicalenvironment using stable isotope compositions. Water, sediment, particulate organic matter, vari-ous crustaceans, fishes, as well as oysters were collected at 2 sites in Estero Bay, Florida, duringthe wet and dry seasons, and processed for δ13C and δ15N stable isotope analyses. Differences infreshwater input (salinity) resulted in differences in carbon and nitrogen isotope ratios. Overall,fish and shrimp are secondary consumers, with crabs and oysters as primary consumers, andorganic matter sources at the lowest trophic level. Results of the study further demonstrate thatreef-resident organisms consume other organisms found on the reef and/or primary producersand detrital organic matter on the reef. Transient fish species come to the reef to feed on the reef-resident species.
KEY WORDS: Oysters · Crassostrea virginica · Carbon and nitrogen isotopes · Trophic transfer ·Estuaries
Resale or republication not permitted without written consent of the publisher

Mar Ecol Prog Ser 462: 125–142, 2012
stru mosus, gulf toadfish Opsanus beta, and oystertoadfish Opsanus tau (Zimmerman et al. 1989, Wen-ner et al. 1996, Breitburg 1999, Coen et al. 1999,Lenihan et al. 2001, Tolley & Volety 2005, Tolley et al.2006). These fishes use the oyster reef as spawningand feeding habitat and as shelter from predators.Resident oyster reef fishes typically feed on benthicinvertebrates such as amphipods, mud crabs, andgrass shrimps but can also prey on benthic fishes(Breitburg 1999, Lenihan et al. 2001). The nakedgoby, striped blenny, and skilletfish attach their eggsto the insides of recently dead, clean, articulated oys-ter shells and the oyster toadfish attaches its eggs tothe underside of consolidated oyster shells (Breitburg1999, Coen et al. 1999).
Fishes are not the only species that utilize oysterreefs as habitat. Several species of decapod crusta -ceans are found on oyster reefs: Petrolisthes armatus,Panopeus spp., Eurypanopeus depressus, Menippemercenaria, Alpheus heterochaelis and Palaemon-etes pugio (Zimmerman et al. 1989, Wenner et al.1996, Coen et al. 1999, Luckenbach et al. 2005, Tolley& Volety 2005, Tolley et al. 2005, 2006). The xanthidcrab Panopeus herbstii is a predator of the easternoyster and is generally found along the boundaries ofoyster reefs (McDermott 1960, McDonald 1982). Incontrast, the flatback mud crab E. depressus is anomnivore that uses the narrow spaces between deadshells and living oysters as shelter from predationand to avoid desiccation (Grant & McDonald 1979,McDonald 1982). The porcelain crab Petrolisthesarmatus is also abundant in oyster clusters andamong dead articulated shells, perched atop oysterclusters and reaching up into the water column to fil-ter feed (Caine 1975, Tolley & Volety 2005). Penaeidand caridean shrimp such as grass shrimp Palaemon-etes spp. are also frequently found on oyster reefsand serve as an important trophic link in both detritaland higher food webs (Coen et al. 1999). Grassshrimp also probably use the reef in order to avoidpredators (Posey et al. 1999).
Trophic relationships in a specific environment canbe inferred from previous dietary studies such as gutcontent analyses, but analysis of stable isotopes ofseveral biologically important elements permit quan-titative analysis of in situ trophic dynamics. Stableisotopes are especially useful in ecological studiesfocusing on food webs. Natural abundances of stableisotopes can be used as tracers and as a way of char-acterizing trophic structure. The measurement ofnaturally occurring stable isotopes in an organismallows for the examination of the dietary organiza-tion in a food web (DeNiro & Epstein 1978, 1981,
Gearing 1991). Stable isotopes are used to determineboth source and trophic level information, with sulfurand carbon isotopes typically used for source infor-mation (e.g. source of dietary carbon) and nitrogenisotopes used in trophic level information (i.e. trophicposition) (DeNiro & Epstein 1978, Fry & Sherr 1984,Minagawa & Wada 1984, Post 2002, Michener &Kaufman 2007).
Many studies conducted in estuarine systems haveshown the usefulness of stable isotope analysis inecology. Haines & Montague (1979) sampled stablecarbon isotopes of major flora and fauna in a Georgiasalt marsh and determined that δ13C values of inver-tebrates known to feed on Spartina closely matchedthe δ13C values of that plant, confirming it as a foodsource. Crabs and mussels in this same area werefound to consume benthic diatoms and phytoplank-ton instead of Spartina (Haines & Montague 1979).Another study examined food sources and trophicrelationships for the blue crab Callinectes sapidusbased on water quality differences in 2 estuaries inNorth Carolina (Bucci et al. 2007). Results showedthat blue crab δ15N values were elevated at sites withhigher nitrate concentrations and that δ13C valuesincreased with salinity (Bucci et al. 2007). The majorfood sources of the blue crab were determined to bevascular plant material and bivalves (Bucci et al.2007).
Although previous studies have examined habitatutilization of oyster reefs, little work has been doneexamining trophic transfer using stable isotope com-positions within oyster-reef communities, includingdecapod crustaceans and fishes. The objective of thisstudy was to determine trophic transfer on oysterreefs with differing degrees of freshwater input in asubtropical environment using stable isotope compo-sitions. Stable carbon and nitrogen isotope composi-tions were used to establish food sources of differentspecies that make use of oyster reefs as habitat andthat may consume the oysters themselves.
MATERIALS AND METHODS
Study location
Estero Bay was designated Florida’s first aquaticpreserve in 1966 and is located approximately 24 kmsouth of Fort Myers and 26 km north of Naples,entirely within Lee County (Florida Department ofNatural Resources 1983) (Fig. 1). Surface waterscomprise over 38 km2 and the drainage basin758.5 km2 (Florida Department of Natural Resources
126

Abeels et al.: Trophic transfer on oyster reefs
1983). Estero Bay is supplied with freshwater by anumber of small rivers and creeks, and major flush-ing is through tidal forces (Florida Department ofNatural Resources 1983, Estero Bay Marine Labora-tory 2004). This estuary is considered microtidalbecause its tidal amplitude is ≤2 m, and the oysterreefs found here are mainly intertidal with limitedvertical relief (Tolley et al. 2005, 2006). The lowerpart of the estuary is mostly protected, but its maintributaries, which include the Estero River andHendry and Mullock Creeks, are experiencing in -creasing development in the upper portions of theirwatersheds (Tolley et al. 2005, 2006).
Two oyster reefs in Estero Bay were selected forthis study, each experiencing different levels offreshwater inflow: one located near the mouth of theEstero River and the other located near the conflu-ence of Hendry and Mullock Creeks (Fig. 1). Rainfallis seasonal in southwest Florida with rain generallyfalling from May to September. Estero River receiveslittle freshwater runoff from the watershed and thushas higher salinities, while Hendry/Mullock Creekreceives greater freshwater input from its watershed,including that from the City of Ft. Myers, via the Ten
Mile Canal, and thus has lower salinities, especiallyduring summer months when heavy rainfall is com-mon. The 2 sites were sampled quarterly starting inApril 2008 and ending in February 2009 for a total of4 sampling periods. Quarterly sampling was con-ducted to examine seasonal differences in tropho -dynamics.
Sampling protocol
Suspended particulate organic matter (POM), ben-thic microalgae, sediment, sinking POM, oysters(Crassostrea virginica), crabs (e.g. Eurypanopeus de -pres sus, Petrolisthes armatus), shrimp (Palaemonetesspp. and Alpheus heterochaelis) and fishes (e.g.Opsa nus beta, Chasmodes saburrae, Archosargusprobatoce phalus, Gobiosoma spp.) were sampled ateach site during May, August and September (wetseason), and in November 2008 and February 2009(dry season). These species were chosen since theyare the dominant species in oyster reefs from south-west Florida (Tolley & Volety 2005). Triplicate sam-ples (excluding oysters) were collected during eachsampling effort.
Organic matter sources collection and processing
Organic matter sources including suspendedPOM, sinking POM, and benthic microalgae wereat the base of the food chain in this community.Water samples for suspended POM were collectedat each site in clean (acid-washed) polycarbonatebottles and then transported on ice back to the labo-ratory. There, water samples were vacuum-filteredon pre- com busted (500°C, 4 h) 4.7 cm WhatmanGF/F glass microfiber filters, dried at 60 to 65°Cin an oven for at least 24 h, and stored in pre- combusted (500°C, 4 h) 20 ml glass scintillation vialsat −20°C until further processing (Riera & Richard1996, Loh et al. 2006, Decottignies et al. 2007).
Sediment traps for sinking POM as well as glassplates for benthic microalgae collection were de -ployed at each site for approximately 1 wk. Sedimenttraps were retrieved on the same sampling day asfish and decapods were collected from lift nets. Thetraps were transported on ice back to the laboratorywhere particles were filtered onto pre-combusted(500°C, 4 h) 4.7 cm Whatman GF/F glass microfiberfilters, dried at 60 to 65°C in an oven for at least 24 h,and stored in pre-combusted (500°C, 4 h) 20 ml glassscintillation vials at −20°C until further processing.
127
Fig. 1. Location of study sites in Estero Bay Aquatic Preserve in southwest Florida

Mar Ecol Prog Ser 462: 125–142, 2012
Glass plates were transported on ice back to the lab-oratory where they were thoroughly washed underwater. The benthic microalgae from the plates werescraped onto pre-combusted (500°C, 4 h) 4.7 cmWhatman GF/F glass microfiber filters and dried at60 to 65°C in an oven for at least 24 h, then stored inpre-combusted (500°C, 4 h) 20 ml glass scintillationvials at −20°C until further processing. Surface sedi-ment samples were also collected using 20 ml glassscintillation vials and stored at −20°C until furtherprocessing.
Oyster collection and processing
Ten oysters were collected at each site and trans-ported on ice back to the laboratory. Oysters werecleaned of epibionts and kept alive for 12 h in sea -water prepared with deionized water and InstantOcean® at the salinity of collection site to allow forevacuation of their gut contents (Gearing 1991,Decottignies et al. 2007, Dubois et al. 2007). Tissuesfrom individual oysters were removed from the shellsand stored in pre-combusted (500°C, 4 h) 20 ml glassscintillation vials at −20°C until further processing(Dubois et al. 2007).
Decapod and fish collection and processing
Lift nets were deployed at each site just belowmean low water in the intertidal zone on the livingoyster reef for approximately 30 d per sampling effort(Tolley et al. 2005). Lift nets (1 m2) were constructedof 3.2 cm diameter PVC pipe frames and 6.4 mmdelta-weave netting dipped in vinyl, with a netheight of 0.5 m and a bottom made of 1.6 mm nettingto prevent the escape of small organisms (Crabtree &Dean 1982, Tolley et al. 2005). During deployment, a1 m2 area of the bottom was cleared of oyster shelland the net secured to the substrate with two 45 cmlengths of PVC attached to PVC T-fittings placedthrough a zip-tie loop on the net (Tolley et al. 2005).Live oyster clusters of approximately 3 l volume dis-placement were collected from the adjacent reef areaand placed in each net (Tolley et al. 2005). Uponretrieval the oyster clusters were removed, placed inbuckets, and sorted to collect any decapods or fishesfrom the clusters with the use of forceps. Any remain-ing decapods or fishes in the net and/or bucket werecollected by hand or with the use of dip nets. Allorganisms were transported back to the laboratoryand stored at −20°C until processed. Organisms were
subsequently identified to the lowest taxonomic levelpractical and then stored in separate pre-combusted(500°C, 4 h) 20 ml glass scintillation vials for eachspecies at −20°C until further processing.
Stable isotope sample processing
During processing, samples on filters were dried at60 to 65°C in an oven for at least 24 h, then under-went acid fumigation in a desiccator containing asmall, pre-combusted (500°C, 4 h) jar of 12 N HCl(trace metal grade) for at least 24 h. Filters were driedagain at 60 to 65°C in an oven and then stored in pre-combusted (500°C, 4 h) 20 ml glass scintillation vialsin a desiccator (Loh et al. 2006).
Individuals from each species, sediment, andmicro algae were placed in separate, labeled pre-combusted (500°C, 4 h) 20 ml glass scintillation vialsand freeze-dried for at least 48 h. The samples werethen ground to a fine powder using a clean (baked at550°C) porcelain mortar and pestle and placed backin their individual vials. Both mortar and pestle wererinsed with deionized water, wiped with a Kimwipe,and then rinsed with 10% HCl and deionized waterbetween samples. Once all samples for a site andmonth were ground, subsamples collected from eachindividual were weighed on pre-combusted (500°C,4 h) aluminum dishes and dried at 60 to 65°C in anoven for at least 24 h. Each sample was transferred toa pre-combusted (500°C, 4 h) 7 ml glass scintillationvial and acidified with drops of 10% HCl (TraceMetal grade) to remove any carbonates (Boutton1991, Gearing 1991, Loh et al. 2006). Vials were thenplaced in a fume hood on a hot plate set to 65°C toevaporate the acid for at least 12 h. All samples weredried again at 60 to 65°C in an oven and then storedin a desiccator (Loh et al. 2006).
Micrograms (~1 mg for animal samples, ~30 mg forsediment samples, and ~3 to 5 mg for benthic micro -algae samples) of the dried and acidified sampleswere weighed into clean (rinsed with acetone) 5 ×9 mm (for ground samples) tin capsules and placed ina numbered 96-well plate. A small subsample of fil-ters were weighed into clean (rinsed with acetone)9 × 10 mm (for samples on filters) tin capsules andplaced in a numbered 96 well plate. The plates weresent to the University of California Davis Stable Iso-tope Facility for δ13C and δ15N analyses (Loh et al.2006). Tissue samples were analyzed for δ13C andδ15N using a PDZ Europa ANCA-GSL elemental ana-lyzer interfaced to a PDZ Europa 20-20 isotope ratiomass spectrometer (Sercon). Samples were com-
128

Abeels et al.: Trophic transfer on oyster reefs
busted at 1000°C in a reactor packed with chromiumoxide and silvered co bal tous/cobaltic oxide. Follow-ing com bustion, oxides were removed in a reductionreactor (reduced copper at 650°C). N2 and CO2 wereseparated on a Carbosieve GC column (65°C, 65 mlmin−1) before entering the isotope ratio mass spec-trometer. Samples were analyzed using laboratorystandards, which were selected to be com po sitionallysimilar to the samples being analyzed, and had beenpreviously calibrated against National Institute ofStandards and Technology Standard ReferenceMaterials. Details of stable isotope analyses are available at: http://stableisotopefacility.ucdavis.edu/13 cand 15n. html
Data analysis
Isotope data were analyzed using principal compo-nent analysis after determining that the data wasnormally distributed using the Kolmo gorov-Smirnovtest (SPSS 16.0).
RESULTS
Decapod and fish abundances
At the Estero River site, 1823 in di viduals were col-lected, representing 21 species. At the Hendry/Mullock Creeks site, 15 species were collected witha total of 462 in dividuals. Species in commonfor both sites were the snapping shrimp Alpheushetero chaelis; the crabs Panopeus simpsoni, Eury -pa nopeus depressus, Petrolisthes ar matus, and Libi -nia spp.; and the fishes Opsanus beta, Gobiosomaro bustum, Archosargus probatoce phalus, Chasmo -des saburrae, and Bathygobius soporator. Speciesfound only at the Estero River site included theshrimps Palaemonetes pugio, Palaemonetes vulga -ris, and Lysmata wurdemanni; the crabs Panopeuslacustris, Menippe mercenaria, and Rhithro pa no -peus harrisii; and the fishes Orthopristis chry -soptera, Lutjanus griseus, Lutjanus synagris, andAchirus lineatus. The most abundant species col-lected at this site was the green porcelain crabPetrolisthes armatus with 973 individuals. Speciesfound only at the Hendry/Mullock Creeks siteincluded the fishes Gobiosoma bosc, Lophogobiuscyprinoides, Gobiesox strumosus, and Lupinoblen -nius nicholsi. The most abundant species collectedat this site was the flatback mud crab Eurypanopeusdepressus with 263 individuals (Table 1).
Isotope analysis
Estero River
Fishes and shrimp were more enriched in δ15N,ranging from 2.5 to 4.4‰ compared to crabs and oys-ters for all sampling periods at the Estero River site.Enrichment in δ13C was not as clear in fishes, shrimp,crabs, and oysters. Organic matter sources weredepleted in δ15N compared to all other samples andwith the exception of surface sediments, weredepleted in δ13C when compared to crabs, shrimp,and fishes (Table 2). Surface sediments at this sitewere all enriched in δ13C (−12.42 to −6.16‰; see ‘Discussion’).
In May 2008, the 4 identified fish (δ15N of 7.39 to8.11‰) and 3 identified shrimp (δ15N of 6.42 to8.19‰) species were more enriched in δ15N com-pared to crabs (3.27 to 5.62‰) and oysters (4.26‰)(Fig. 2a, Table 2). In September 2008, the organicmatter sources were depleted in δ13C (−25.61 and−21.64‰) compared to all other samples, whichranged from −22.38 to −17.34‰ (Fig. 2b, Table 2).The 2 identified fish species were more enriched inδ15N (6.90 to 7.30‰) compared to crabs (3.58 to5.88‰), oysters (4.73‰), and shrimp (5.19 to 6.42‰)(Fig. 2b, Table 2). In November 2008, the 3 identifiedfish species were more enriched in δ15N (7.31 to9.45‰) compared to oysters (4.55 to 5.65‰), crabs(4.01 to 5.70‰), and shrimp (6.26‰) (Fig. 2c,Table 2). Sinking POM had similar δ15N and δ13Ccompositions to crabs and shrimp (4.91 and −17.18‰,respectively) (Fig. 2c, Table 2). In February 2009, the4 identified fish (δ15N of 8.02 to 9.67‰) and 3 identi-fied shrimp (δ15N of 6.87 to 8.85‰) species weremore enriched in δ15N compared to oysters (5.32‰)and crabs (4.24 to 5.91‰) (Fig. 2d, Table 2). Organicmatter sources had a wide range of δ13C values, from−22.59 to −12.75‰, with sinking POM having δ13Ccompositions similar to sediment (−12.75 and−12.42‰, respectively) (Fig. 2d, Table 2).
In September and November, shrimp occupied thesame trophic level as crabs and oysters. In Novem-ber, sinking POM was at the same trophic level as theoysters, crabs and shrimp. Although sinking POMwas at this second trophic level, the other 2 organicmatter sources (suspended POM and benthic micro -algae) were at the lowest trophic level. In February,with the exception of benthic microalgae which hadan average δ15N value that was similar to the 2 crabsPetrolisthes armatus and Eurypanopeus depressus,the organic matter sources were at the lowest trophiclevel.
129

Mar Ecol Prog Ser 462: 125–142, 2012
Animals are enriched by about 1‰in the heavier isotope (13C) comparedto their diet. Thus, trophic level identi-fication is based on δ13C and δ15N val-ues (1‰ and 3‰ per trophic level, re-spectively). Based on the δ13C values,the carbon sources for fishes were de-termined to be from other fish es,shrimp, crabs, worms, oysters, benthicmicroalgae, and suspended POM(Fig. 2). Carbon sources for shrimpspecies were from other shrimp,worms, amphipods, crabs, sinkingPOM, suspended POM, and benthicmicroalgae (Fig. 2). Carbon sourcesfor crab species were from othercrabs, shrimp, oysters, worms, amphi -pods, benthic micro algae, sinkingPOM, and suspended POM (Fig. 2).The carbon sources for oysters werefrom benthic microalgae, sinkingPOM, and suspended POM (Fig. 2).
Hendry/Mullock Creeks
At the Hendry/Mullock Creeks site,fishes and shrimp were more en -riched in δ15N, with an average rangeof 1.1 to 3.9‰, relative to crabs andoysters for all sampling periods.Organic matter sources, crabs, shrimpand fishes all had similar δ13C values,with an average range of −25.3 to−24.9‰, but oysters were less en -riched at −27.5‰. Organic mattersources were depleted in δ15N com-pared to all other samples and, withthe exception of surface sediments,were depleted in δ13C when com-pared to crabs, shrimp, and fish(Table 3). Surface sediments atthis site were all enriched in δ13C(−16.65 to −9.66‰; see ‘Discussion’).
In May 2008, the 4 identified fishspecies were more enriched in δ15N(7.95 to 9.15‰) compared to crabs(3.34 to 4.00‰), shrimp (5.65‰) andoysters (4.81‰) (Fig. 3a, Table 3).Organic matter sources all had similarδ15N values, ranging from 2.81 to3.14‰, but their δ13C values variedwidely, ranging from −26.61 to
130T
able
1. A
bu
nd
ance
s of
dec
apod
cru
stac
ean
s an
d f
ish
es c
olle
cted
at
the
Est
ero
Riv
er a
nd
Hen
dry
/Mu
lloc
k C
reek
s si
tes
for
each
qu
arte
r d
uri
ng
th
e st
ud
y p
erio
d
Sp
ecie
sC
omm
on
Nu
mb
er c
olle
cted
nam
eE
ster
o R
iver
Hen
dry
/Mu
lloc
k C
reek
sM
ay 0
8S
ept
08N
ov 0
8F
eb 0
9T
otal
no.
May
08
Sep
t 08
Nov
08
Feb
09
Tot
al n
o.
Pal
aem
onet
es p
ug
iog
rass
sh
rim
p15
21
220
00
00
0P
alae
mon
etes
vu
lgar
ism
arsh
gra
ss s
hri
mp
00
01
10
00
00
Alp
heu
s h
eter
och
aeli
sb
igcl
aw s
nap
pin
g s
hri
mp
2740
82
778
91
624
Lys
mat
a w
urd
eman
ni
pep
per
min
t sh
rim
p6
01
07
00
00
0P
anop
eus
spp
.m
ud
cra
b24
253
153
93
00
12P
anop
eus
lacu
stri
sk
not
fin
ger
mu
d c
rab
01
00
10
00
00
Pan
opeu
s si
mp
son
ioy
ster
shel
l m
ud
cra
b4
11
17
00
21
3E
ury
pan
opeu
s d
epre
ssu
sfl
atb
ack
mu
d c
rab
6015
423
417
862
661
7364
6526
3P
etro
list
hes
arm
atu
sg
reen
por
cela
in c
rab
119
572
190
9297
354
2711
910
1M
enip
pe
mer
cen
aria
Flo
rid
a st
one
crab
46
10
110
00
00
Lib
inia
spp
.sp
ider
cra
b3
00
03
00
00
0L
ibin
ia d
ub
iasp
ider
cra
b0
00
00
20
00
2R
hit
hro
pan
opeu
s h
arri
sii
Har
ris
mu
d c
rab
01
10
20
00
00
Op
san
us
bet
ag
ulf
toa
dfi
sh5
62
720
32
20
7G
obio
som
a ro
bu
stu
mco
de
gob
y3
120
015
01
01
2G
obio
som
a b
osc
nak
ed g
oby
00
00
00
30
25
Ort
hop
rist
is c
hry
sop
tera
pig
fish
10
00
10
00
00
Arc
hos
arg
us
pro
bat
ocep
hal
us
shee
psh
ead
10
00
12
01
03
Lu
tjan
us
gri
seu
sg
ray
snap
per
00
10
10
00
00
Lu
tjan
us
syn
agri
sla
ne
snap
per
00
10
10
00
00
Ch
asm
odes
sab
urr
aeF
lori
da
ble
nn
y0
00
11
01
11
3A
chir
us
lin
eatu
sli
ned
sol
e0
00
11
00
00
0B
ath
ygob
ius
sop
orat
orfr
illf
in g
oby
00
01
10
01
12
Lop
hog
obiu
s cy
pri
noi
des
cres
ted
gob
y0
00
00
32
183
26G
obie
sox
stru
mos
us
skil
letf
ish
00
00
04
13
08
Lu
pin
oble
nn
ius
nic
hol
sih
igh
fin
ble
nn
y0
00
00
00
01
1
Tot
al i
nd
ivid
ual
s co
llec
ted
272
820
444
287
1823
146
122
104
9046
2

Abeels et al.: Trophic transfer on oyster reefs 131
Tab
le 2
. Est
ero
Riv
er s
ite
mea
n δ
13C
an
d δ
15N
sta
ble
isot
ope
valu
es d
uri
ng
eac
h s
amp
lin
g m
onth
of
the
stu
dy
per
iod
. –: n
ot f
oun
d
Sam
ple
δ13C
δ15N
May
200
8S
ept
2008
Nov
200
8F
eb 2
009
May
200
8S
ept
2008
Nov
200
8F
eb 2
009
(±S
E)
(±S
E)
(±S
E)
(±S
E)
(±S
E)
(±S
E)
(±S
E)
(±S
E)
Sed
imen
t−
10.9
2±
1.11
−11
.57
±0.
23−
6.16
±0.
76−
12.4
2±
0.12
3.40
±0.
352.
11±
0.06
2.67
±0.
033.
02±
0.04
Wor
ms
−20
.95
−17
.40
––
5.31
7.43
––
Am
ph
ipod
s–
−23
.59
−22
.33
−20
.91
±0.
26–
0.10
2.83
3.14
±0.
45
En
d-m
emb
ers
Sin
kin
g P
OM
−17
.73
±0.
55−
21.6
4±
0.37
−17
.18
±1.
76−
12.7
5±
0.21
3.13
±0.
051.
91±
0.08
4.91
±1.
563.
27±
0.10
Su
spen
ded
PO
M−
24.0
8±
0.15
−25
.20
±0.
25−
23.4
3±
1.15
−22
.40
±1.
101.
85±
0.18
1.92
±0.
111.
09±
0.09
2.24
±0.
11B
enth
ic m
icro
alg
ae−
21.8
0±
0.72
−25
.61
±0.
23−
23.5
5±
0.24
−22
.59
±0.
283.
20±
0.13
−0.
36±
0.41
2.34
±0.
414.
56±
1.63
Oys
ters
Cra
ssos
trea
vir
gin
ica
−22
.51
±0.
27−
22.3
8±
0.42
−22
.24
±0.
19−
23.1
2±
0.25
4.26
±0.
124.
73±
0.19
5.65
±0.
195.
32±
0.11
Cra
ssos
trea
vir
gin
ica
spat
––
−23
.44
±0.
33–
––
4.55
±0.
15–
Dec
apo
ds
Eu
ryp
anop
eus
dep
ress
us
−19
.52
±0.
42−
17.3
4±
0.53
−17
.22
±0.
33−
17.4
8±
0.66
3.97
±0.
223.
73±
0.29
4.27
±0.
134.
24±
0.17
Lib
inia
spp
.−
21.8
5±
1.28
––
–3.
27±
0.50
––
–M
enip
pe
mer
cen
aria
−21
.43
±0.
90−
18.6
7±
0.80
−18
.40
–5.
62±
0.07
4.50
±0.
215.
70–
Pan
opeu
s la
cust
ris
–−
17.6
2–
––
5.88
––
Pan
opeu
s si
mp
son
i−
19.9
6±
0.54
−17
.50
−17
.72
−21
.13
4.91
±0.
445.
214.
015.
91P
anop
eus
spp
.−
21.6
8±
0.50
−18
.50
±0.
61−
20.6
9±
1.06
−21
.78
3.98
±0.
163.
88±
0.27
4.14
±0.
585.
23P
etro
list
hes
arm
atu
s−
22.2
4±
0.24
−20
.15
±0.
16−
20.8
5±
0.35
−20
.29
±0.
283.
62±
0.11
3.68
±0.
154.
02±
0.13
4.64
±0.
12R
hit
hro
pan
opeu
s h
arri
sii
–−
21.5
2−
20.6
1–
–3.
584.
01–
Alp
heu
s h
eter
och
aeli
s−
19.8
8±
0.28
−20
.61
±0.
26−
20.6
7±
0.05
−20
.40
±0.
226.
42±
0.07
5.19
±0.
136.
26±
0.12
6.87
±0.
16L
ysm
ata
wu
rdem
ann
i−
20.6
4±
0.08
––
–6.
89±
0.05
––
–P
alae
mon
etes
pu
gio
−18
.54
±0.
33−
20.6
0±
0.39
–−
20.3
88.
19±
0.38
6.42
±0.
81–
7.61
Pal
aem
onet
es v
ulg
aris
––
–−
18.8
3–
––
8.85
Fis
hes
Ach
iru
s li
nea
tus
––
–−
22.7
8–
––
8.02
Arc
hos
arg
us
pro
bat
ocep
hal
us
−20
.71
––
–7.
42–
––
Bat
hyg
obiu
s so
por
ator
––
–−
18.9
3–
––
8.82
Ch
asm
odes
sab
urr
ae–
––
−21
.36
––
–9.
67G
obio
som
a ro
bu
stu
m−
18.7
4±
0.09
−18
.03
±0.
27–
–8.
11±
0.24
7.30
±0.
13–
–L
utj
anu
s g
rise
us
––
−19
.49
––
–8.
73–
Lu
tjan
us
syn
agri
s–
–−
20.3
7–
––
9.45
–O
psa
nu
s b
eta
−19
.19
±0.
16−
18.3
6±
0.26
−19
.94
±1.
02−
18.8
8±
0.25
7.39
±0.
386.
90±
0.21
7.31
±0.
348.
04±
0.16
Ort
hop
rist
is c
hry
sop
tera
−20
.53
––
–7.
85–
––
Mar Ecol Prog Ser 462: 125–142, 2012
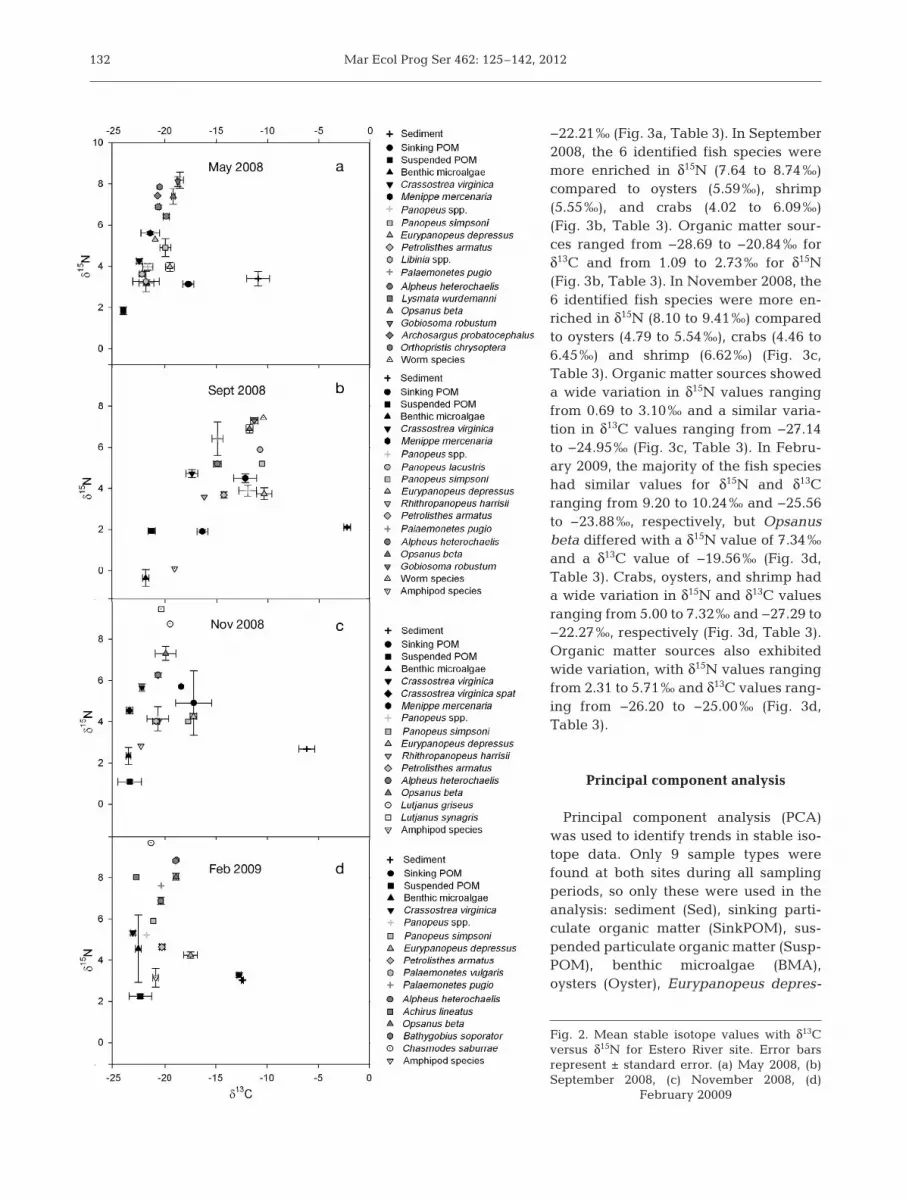
−22.21‰ (Fig. 3a, Table 3). In September2008, the 6 identified fish species weremore enriched in δ15N (7.64 to 8.74‰)compared to oysters (5.59‰), shrimp(5.55‰), and crabs (4.02 to 6.09‰)(Fig. 3b, Table 3). Organic matter sour -ces ranged from −28.69 to −20.84‰ forδ13C and from 1.09 to 2.73‰ for δ15N(Fig. 3b, Table 3). In No vember 2008, the6 identified fish species were more en -riched in δ15N (8.10 to 9.41‰) comparedto oysters (4.79 to 5.54‰), crabs (4.46 to6.45‰) and shrimp (6.62‰) (Fig. 3c,Table 3). Organic matter sources showeda wide variation in δ15N values rangingfrom 0.69 to 3.10‰ and a similar varia-tion in δ13C values ranging from −27.14to −24.95‰ (Fig. 3c, Table 3). In Febru-ary 2009, the majority of the fish specieshad similar values for δ15N and δ13Cranging from 9.20 to 10.24‰ and −25.56to −23.88‰, respectively, but Opsanusbeta differed with a δ15N value of 7.34‰and a δ13C value of −19.56‰ (Fig. 3d,Table 3). Crabs, oysters, and shrimp hada wide variation in δ15N and δ13C valuesranging from 5.00 to 7.32‰ and −27.29 to−22.27‰, respectively (Fig. 3d, Table 3).Organic matter sources also exhibitedwide variation, with δ15N values rangingfrom 2.31 to 5.71‰ and δ13C values rang-ing from −26.20 to −25.00‰ (Fig. 3d,Table 3).
Principal component analysis
Principal component analysis (PCA)was used to identify trends in stable iso-tope data. Only 9 sample types werefound at both sites during all samplingperiods, so only these were used in theanalysis: sedi ment (Sed), sinking par ti -cu late organic matter (Sink POM), sus-pended particulate organic matter (Susp -POM), benthic microalgae (BMA),oys ters (Oyster), Eurypanopeus depres-
132
Fig. 2. Mean stable isotope values with δ13Cversus δ15N for Estero River site. Error barsrepresent ± standard error. (a) May 2008, (b)September 2008, (c) November 2008, (d)
February 20009

Abeels et al.: Trophic transfer on oyster reefs
sus (Eury panopeus), Petrolisthes ar -ma tus (Petrolisthes), Alpheus hete -ro chaelis (Alpheus), and Opsanusbeta (Opsanus). As sediment sam-ples had isotope values that differedgreatly from all other samples, PCAwas run a second time ex cludingsediment samples to determine howmuch the inclusion of sedimentsamples influenced the analysis.
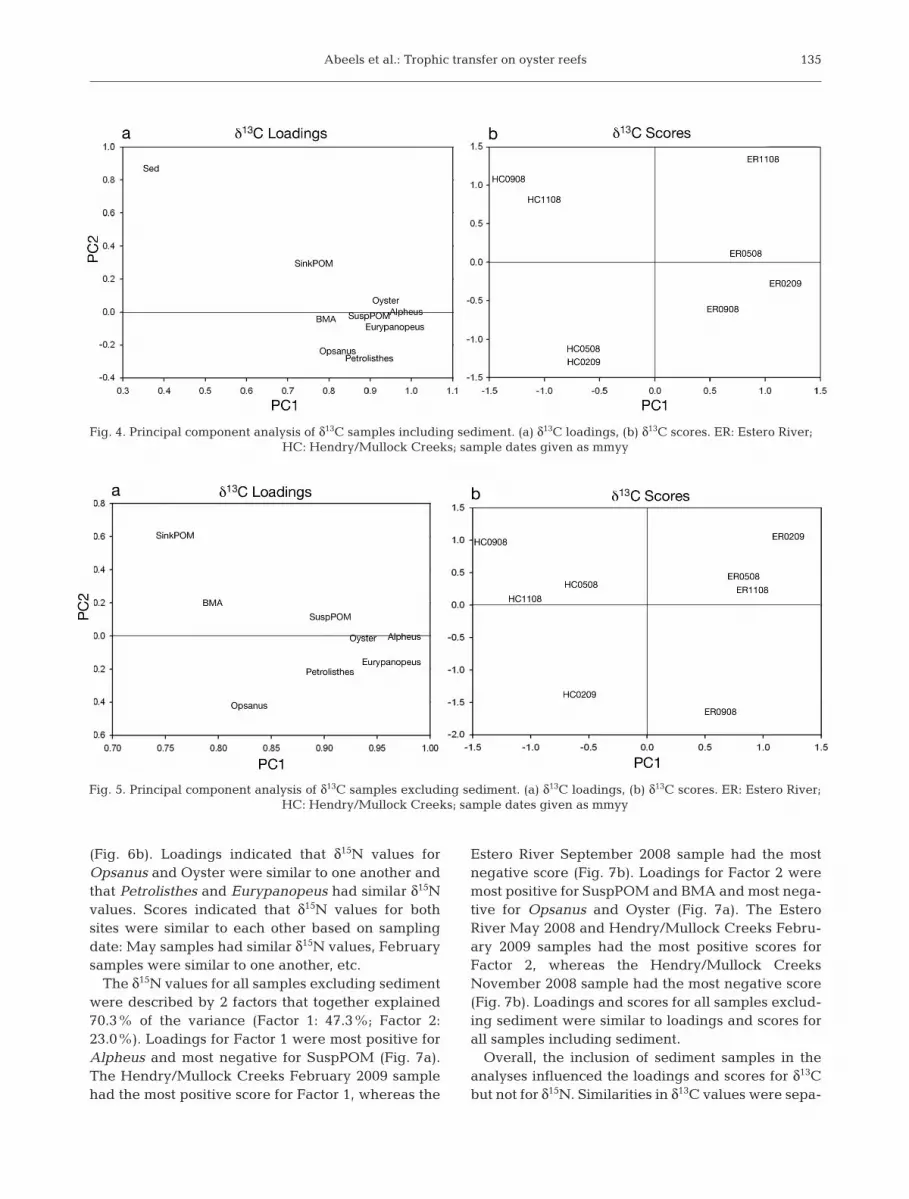
Using PCA, the δ13C values for allsamples including sediment weredescribed by 2 factors that togetherexplained 82.4% of the variance(Factor 1: 71.3%; Factor 2: 11.1%).Loadings for Factor 1 were mostpositive for Alpheus, Eurypanopeus,and Oyster, with Sed being the leastpositive (Fig. 4a). All Estero Riversamples had positive scores for Fac-tor 1, whereas all Hendry/MullockCreeks samples had negative scores(Fig. 4b). Loadings for Factor 2 weremost positive for Sed and most neg-ative for Petrolisthes and Opsanus(Fig. 4a). Estero River November2008 and Hendry/Mullock CreeksSeptember 2008 and November2008 samples had the most positivescores for Factor 2, whereas Hen -dry/Mullock Creeks February 2009and May 2008 samples had the mostnegative scores along Factor 2(Fig. 4b). Loadings indicated that allsamples had similar δ13C values ex -cept for sediment. Scores indicatedthat δ13C values for Hendry/MullockCreeks were distinct from δ13C val-ues of Estero River.
The δ13C values for all samplesexcluding sediment were describedby 2 factors that together ex plained87.2% of the variance (Factor 1:78.7%; Factor 2: 8.5%). Loadings forFactor 1 were most positive forAlpheus, Eurypanopeus, and Oysterand least positive for SinkPOM(Fig. 5a). All Estero River sampleshad positive scores for Factor 1,whereas all Hendry/Mullock Creekssamples had negative scores forFactor 1 (Fig. 5b). Loadings for Factor 2 were most positive for
133T
able
3. H
end
ry C
reek
sit
e m
ean
δ13
C a
nd
δ15
N s
tab
le i
soto
pe
valu
es d
uri
ng
eac
h s
amp
lin
g m
onth
of
the
stu
dy
per
iod
. –: n
ot f
oun
d
Sam
ple
δ13C
δ15N
May
200
8S
ept
2008
Nov
200
8F
eb 2
009
May
200
8S
ept
2008
Nov
200
8F
eb 2
009
(±S
E)
(±S
E)
(±S
E)
(±S
E)
(±S
E)
(±S
E)
(±S
E)
(±S
E)
Sed
imen
t−
16.6
5±
1.01
−11
.42
±0.
48−
9.66
±0.
90−
15.1
4±
0.38
2.54
±0.
162.
99±
0.14
3.32
±0.
293.
28±
0.03
Wor
ms
−24
.96
−27
.00
−26
.63
±0.
15−
25.4
3±
0.24
5.79
6.47
7.24
±0.
067.
77±
0.03
Am
ph
ipod
s–
−28
.71
−27
.08
±0.
06−
26.2
3±
0.18
–3.
053.
47±
0.17
3.88
±0.
29
En
d-m
emb
ers
Sin
kin
g P
OM
−22
.21
±0.
62−
20.8
4±
0.30
−24
.50
±0.
58−
26.2
0±
1.43
3.09
±0.
301.
89±
0.14
3.10
±0.
125.
71±
0.76
Su
spen
ded
PO
M−
26.6
1±
0.02
−26
.81
±0.
10−
27.1
4±
0.05
−25
.00
±0.
042.
81±
0.27
2.73
±0.
070.
69±
0.20
2.31
±0.
19B
enth
ic m
icro
alg
ae−
25.0
2±
0.61
−28
.69
±0.
05−
24.9
5±
0.34
−25
.98
±0.
193.
14±
0.16
1.09
±0.
221.
01±
0.23
4.50
±1.
84
Oys
ters
Cra
ssos
trea
vir
gin
ica
−26
.24
±0.
06−
27.0
6±
0.09
−28
.32
±0.
09−
27.2
9±
0.15
4.81
±0.
165.
59±
0.09
5.54
±0.
165.
03±
0.08
Cra
ssos
trea
vir
gin
ica
spat
––
−28
.73
±0.
15–
––
4.79
±0.
10–
Dec
apo
ds
Eu
ryp
anop
eus
dep
ress
us
−21
.77
±0.
33−
24.9
8±
0.33
−23
.70
±0.
59−
22.2
7±
0.43
3.69
±0.
264.
44±
0.24
5.08
±0.
315.
73±
0.15
Lib
inia
du
bia
−23
.26
±0.
16–
––
4.00
±0.
08–
––
Pan
opeu
s si
mp
son
i–
–−
24.5
9±
0.07
−26
.95
––
6.45
±0.
356.
98P
anop
eus
spp
.–
−26
.06
±0.
15–
––
6.09
±0.
16–
–P
etro
list
hes
arm
atu
s−
22.5
7±
0.62
−27
.44
±0.
25−
24.9
9±
0.16
−24
.10
±0.
343.
34±
0.21
4.02
±0.
204.
46±
0.06
5.00
±0.
11A
lph
eus
het
eroc
hae
lis
−24
.01
±0.
23−
25.8
9±
0.30
−25
.18
−24
.86
±0.
205.
65±
0.32
5.55
±0.
166.
627.
32±
0.15
Fis
hes
Arc
hos
arg
us
pro
bat
ocep
hal
us
−23
.36
±0.
05–
−25
.94
–8.
87±
0.00
–8.
82–
Bat
hyg
obiu
s so
por
ator
––
−23
.47
−24
.66
––
8.73
9.88
Ch
asm
odes
sab
urr
ae–
−25
.86
−25
.99
−25
.56
–8.
749.
419.
55G
obie
sox
stru
mos
us
−23
.67
±0.
39−
23.4
5−
24.0
7±
0.61
–8.
01±
0.05
8.26
8.10
±0.
08–
Gob
ioso
ma
bos
c–
−25
.80
±0.
42–
−24
.49
±0.
13–
8.14
±0.
05–
10.2
4±
0.10
Gob
ioso
ma
rob
ust
um
–−
25.7
9–
−24
.01
–7.
64–
9.20
Lop
hog
obiu
s cy
pri
noi
des
−23
.59
±0.
26−
26.0
5±
0.89
−24
.65
±0.
31−
24.6
0±
0.10
9.15
±0.
228.
30±
0.28
8.98
±0.
079.
46±
0.19
Lu
pin
oble
nn
ius
nic
hol
si–
––
−23
.88
––
–9.
96O
psa
nu
s b
eta
−23
.83
±0.
11−
23.8
7±
0.23
−23
.16
±0.
11−
19.5
67.
95±
0.12
7.92
±0.
218.
89±
0.01
7.34

Mar Ecol Prog Ser 462: 125–142, 2012
SinkPOM and most negative forOpsanus (Fig. 5a). Samples collec -ted from Hendry/Mullock Creeksin February 2009 and from EsteroRiver in September 2008 had themost negative scores for Factor 2,while Hendry/Mullock Creeks Sep -tember 2008 and Estero River Feb-ruary 2009 samples had the mostpositive scores (Fig. 5b). Loadingsin dicated that δ13C values for Susp-POM, Oyster, Alpheus, Eurypa no -peus, and Petrolisthes were moresimilar to one another based ontheir ordination compared to theother samples. Scores indicatedthat δ13C values for Hendry/Mul-lock Creeks were distinct fromδ13C values for Estero River. Load-ings and scores for all samplesexcluding sediment were differentfrom the loadings and scores for allsamples including sediment.
The δ15N values for all samplesincluding sediment were describedby 2 factors that together explained68.2% of the variance (Factor 1:47.8%; Factor 2: 20.4%). Loadingsfor Factor 1 were most positive forAlpheus and most negative forSuspPOM (Fig. 6a). The Hendry/Mullock Creeks February 2009sample had the most positive scorefor Factor 1, whereas the EsteroRiver September 2008 sample hadthe most negative score (Fig. 6b).Loadings for Factor 2 were mostpositive for SuspPOM and BMAand most nega tive for Opsanus andOyster (Fig. 6a). The Estero RiverMay 2008 and Hendry/MullockCreeks February 2009 samples hadthe most positive scores for Factor2, whereas the Hendry/MullockCreeks November 2008 samplehad the most negative score
134
Fig. 3. Mean stable isotope values withδ13C versus δ15N for Hendry/MullockCreeks site. Error bars represent ± stan-dard error. (a) May 2008, (b) September2008, (c) November 2008, (d) February
2009
Abeels et al.: Trophic transfer on oyster reefs
(Fig. 6b). Loadings indicated that δ15N values forOpsa nus and Oyster were similar to one another andthat Petrolisthes and Eurypanopeus had similar δ15Nvalues. Scores indicated that δ15N values for bothsites were similar to each other based on samplingdate: May samples had similar δ15N values, Februarysamples were similar to one another, etc.
The δ15N values for all samples excluding sedimentwere described by 2 factors that together explained70.3% of the variance (Factor 1: 47.3%; Factor 2:23.0%). Loadings for Factor 1 were most positive forAlpheus and most negative for SuspPOM (Fig. 7a).The Hendry/Mullock Creeks February 2009 samplehad the most positive score for Factor 1, whereas the
Estero River September 2008 sample had the mostnegative score (Fig. 7b). Loadings for Factor 2 weremost positive for SuspPOM and BMA and most nega -tive for Opsanus and Oyster (Fig. 7a). The EsteroRiver May 2008 and Hendry/Mullock Creeks Febru-ary 2009 samples had the most positive scores forFactor 2, whereas the Hendry/Mullock CreeksNovember 2008 sample had the most negative score(Fig. 7b). Loadings and scores for all samples exclud-ing sediment were similar to loadings and scores forall samples including sediment.
Overall, the inclusion of sediment samples in theanalyses influenced the loadings and scores for δ13Cbut not for δ15N. Similarities in δ13C values were sepa-
135
Fig. 4. Principal component analysis of δ13C samples including sediment. (a) δ13C loadings, (b) δ13C scores. ER: Estero River; HC: Hendry/Mullock Creeks; sample dates given as mmyy
Fig. 5. Principal component analysis of δ13C samples excluding sediment. (a) δ13C loadings, (b) δ13C scores. ER: Estero River; HC: Hendry/Mullock Creeks; sample dates given as mmyy

Mar Ecol Prog Ser 462: 125–142, 2012136
rated based on site, but all samples had similar valuesoverall. Similarities in δ15N values were separatedbased on sampling period. Although primary con-sumers had similar δ15N values, the secondary con-sumer (Opsanus) had a δ15N value similar to oysters.
DISCUSSION
The objective of this study was to determine oysterreef trophic dynamics by investigating isotopic com-position of reef-resident decapod crustaceans andfishes and their possible food sources, including oys-ters. Many investigators have used δ13C and δ15N iso-tope values to determine both the source of carbonfor an organism and its trophic level (DeNiro &Epstein 1978, 1981, Minagawa & Wada 1984, Peter-
son & Fry 1987). Distinct trophic levels can be identi-fied based on average δ15N values because animalsare enriched by 3‰ in the heavier isotope (15N) com-pared to their diet. Overall, fishes and shrimp are atthe highest trophic level and are considered second-ary consumers, with crabs and oysters as primaryconsumers, and organic matter sources at the lowesttrophic level. Based on δ13C and δ15N values obtainedin this study, reef-resident organisms consume otherorganisms found on the reef and/or primary produc-ers and detrital organic matter on the reef.
The isotopic composition of an organism is a reflec-tion of the isotopic composition of its diet (DeNiro &Epstein 1978, 1981, Gearing 1991). In general, δ13Cand δ15N are more positive (enriched) in organismshigher in the trophic level relative to their dietbecause consumers retain the stable isotope signa-
Fig. 6. Principal component analysis of δ15N samples including sediment. (a) δ15N loadings, (b) δ15N scores. ER: Estero River; HC: Hendry/Mullock Creeks; sample dates given as mmyy
Fig. 7. Principal component analysis of δ15N samples excluding sediment. (a) δ15N loadings, (b) δ15N scores. ER: Estero River; HC: Hendry/Mullock Creeks; sample dates given as mmyy

Abeels et al.: Trophic transfer on oyster reefs
tures of the foods they assimilate (i.e. you are whatyou eat) (DeNiro & Epstein 1978, 1981). The carbonisotopic composition of animals reflects their dietwithin about 1‰, indicating a small enrichment inthe heavier isotope (13C) in the animal relative to itsdiet (DeNiro & Epstein 1978, Michener & Kaufman2007). There are several biological processes that canaccount for this enrichment in carbon: (1) loss of 12Cduring respiration, (2) uptake of 13C during digestion,or (3) metabolic fractionation during synthesis of dif-ferent tissue types (Michener & Kaufman 2007). Thenitrogen isotopic composition reflects enrichment by3 to 4‰ in the heavier isotope (15N) in the animal rel-ative to its diet (DeNiro & Epstein 1981, Minagawa &Wada 1984, Michener & Kaufman 2007). Enrichmentoccurs due to excretion of 15N-depleted nitrogen,usually in the form of urea and ammonia (Michener &Kaufman 2007).
Trophic dynamics — decapods
Eurypanopeus depressus and Petrolisthes armatuswere the most abundant species found on oysterreefs in Estero Bay, both in this study and in previouswork by Tolley et al. (2005, 2006). In the currentstudy, E. depressus was more abundant at theHendry/Mullock Creeks site and P. armatus wasmore abundant at the Estero River site (Table 1).P. armatus is a stenohaline crab and has a lower toler-ance to reduced salinity compared to E. depressus, aeuryhaline species (Shumway 1983). As salinity wasgenerally higher at the Estero River site (Fig. 8), thegreater abundance of P. armatus there was not unex-pected. E. depressus is an omnivore and consumesprimarily algae and detritus, with gut contents in-
cluding shell fragments, polychaete setae, and piecesof crustacean exoskeleton (McDonald 1982). Thisspecies has also been known to feed on oyster spatand bivalves (McDermott 1960, Milke & Kennedy2001). Stable carbon isotope values indicated that thefood source for E. depressus is other crabs, sinkingPOM, benthic microalgae, worms, and shrimp; theseresults are consistent with known food sources iden-tified by other investigators. In contrast, P. armatusprimarily sweeps seston from the water column andits stable carbon isotope values indicated that its foodsource is sinking POM, benthic microalgae, and sus-pended POM. This species is able to feed directly onbenthic microalgae by scraping shells with its chelaeand moving the material to its mouth (Caine 1975).
Alpheus heterochaelis is another abundant organ-ism found on oyster reefs in this study. This shrimpuses its big-claw to stun or even kill small prey suchas grass shrimp and gobies (Hazlett 1962, Herberholz& Schmitz 1998). Stomach contents have includedvascular plant detritus, inorganic particles, cope-pods, and amphipods, indicating an omnivorousfeeding regime (Williams 1984). Nolan & Salmon(1970) reported that, in the laboratory, this specieswill graze on algae attached to shells. Food sourcesfor A. heterochaelis identified in the current studyinclude benthic microalgae, worms, sinking POM,grass shrimp, suspended POM, and amphipods, andare thus consistent with previous studies.
The δ13C values determined in this study indicatedthat the crabs Panopeus spp., Panopeus simpsoni,and Menippe mercenaria feed directly on oysters.These species are known to consume oysters andother bivalves (Menzel & Hopkins 1956, McDermott1960, Reames & Williams 1983, Hughes & Grabowski2006). Stable carbon isotope values for both P. simp-soni and P. lacustris indicated that their food sourcesare other crabs, oysters, shrimp, worms, amphipods,and benthic microalgae. P. simpsoni has been knownto feed on algae, bryozoans, and smaller crabs(Reames & Williams 1983). Stable carbon isotope val-ues for M. mercenaria indicated that its food sourcesare oysters, other crabs, shrimp, and worms.
Trophic dynamics — oysters
In this study, Crassostrea virginica was found toconsume benthic microalgae and both sinking andsuspended POM (Tables 2 & 3, Figs. 2 & 3). Oysterscan feed directly on benthic microalgae when it isresuspended in the water column (Fukumori et al.2008). Other studies have shown similar food sources
137
Fig. 8. Discharge data for Estero River and Ten Mile Canal

Mar Ecol Prog Ser 462: 125–142, 2012
being consumed. Conkright & Sackett (1986) foundthat oysters in Tampa Bay, Florida, utilized bothphytoplankton and terrestrial carbon. Peterson &Howarth (1987) found that C. virginica had the high-est δ15N values compared to other detritivores andherbivores and was similar isotopically to plankton.One study involving the Pacific oyster C. gigas deter-mined its dietary food sources to be macroalgae, C4
plants such as Spartina sp., benthic diatoms, and sus-pended POM, with approximately 30% of the dietcoming from benthic diatoms and 20 to 60% frommarine POM depending on the time of year (Decot-tignies et al. 2007). Using a mixing model, Dubois etal. (2007) found that C. gigas consumed 4 differentfood sources (terrestrial organic matter, microphyto-benthos, Ulva, and marine POM) in different quanti-ties at different sites depending on which food sourcewas available.
Trophic dynamics — fishes
The sheepshead Archosargus probatocephalus didnot acquire any carbon from oysters (Tables 2 & 3,Figs. 2 & 3) even though it is known to feed on them(Jennings 1985). Sheepshead are omnivores and canfeed on worms, amphipods, shrimp, plant matter,crabs, small fishes, bivalves, and gastropods (Over-street & Heard 1982, Jennings 1985, Cutwa & Turin -gan 2000, Lenihan et al. 2001). In the current study,this species mainly consumed crabs and shrimps andpossibly other smaller fishes found on the reef(Tables 2 & 3, Figs. 2 & 3). Since smaller individualsof this species were present in the net and samples(3.1 to 6.1 cm), lack of oysters in the diet of this fish(based on carbon signature) may be due to thesmaller size and thus may be a sampling bias.
Other abundant fishes found on the study reefswere gulf toadfish Opsanus beta, code goby Gobio-soma robustum, crested goby Lophogobius cypri-noides, and skilletfish Gobiesox strumosus. Toadfish,in general, are known to feed on mud crabs (Gra -bowski 2004). In the current study, the food sourcesof toadfish were shrimp and crabs (Tables 2 & 3,Figs. 2 & 3). Gobiosoma spp. are known to feed onsmall invertebrates such as shrimp, amphipods, andworms (Breitburg 1999) and their food source in thecurrent study was mainly comprised of worms(Tables 2 & 3, Figs. 2 & 3). The crested goby is anopportunistic feeder that feeds on algae, detritus,amphipods, isopods, copepods, polychaetes, mol-lusks, bivalves, small crabs, and barnacles (Darcy1981, Yeager &6 Layman 2011). They have been
found to be an important link of sestonic productionto higher trophic levels (Yeager & Layman 2011). Itsmain food sources in the current study were benthicmicroalgae, worms, crabs, shrimp, and sinking POM(Table 3, Fig. 3). The skilletfish food sources werebenthic microalgae, worms, and sinking POM(Table 3, Fig. 3).
Oyster reefs provide high densities of prey items,such as polychaetes, mollusks, and crustaceans, forresident predators, juvenile fishes, and adult tran-sient fishes. This is especially the case for restoredreefs when placed in areas such as mudflats whereno shelter existed previously (Grabowski et al.2005). Juveniles of several transient fishes were col-lected during the current study: pigfish Orthopristischry soptera, gray snapper Lutjanus griseus, lanesnapper Lutjanus synagris, and lined sole Achiruslineatus. Juvenile pigfish are known to consumecopepods, amphipods, polychaetes, shrimp, andother benthic invertebrates and are found on shal-low flats with plant growth during the spring andearly summer (Sutter & McIlwain 1987, Lenihan etal. 2001). The single pigfish collected in the currentstudy could have been consuming crabs and wormsfound on the oyster reef based on its stable carbonisotope value (Table 2, Fig. 2), but because it is not aresident species it could have been feeding else-where as well. Snappers feed on a variety of organ-isms, including amphipods, shrimps, crabs, andfishes, and are found inshore near grass beds or softand sandy bottom areas (Bortone & Williams 1986).Yeager & Layman (2011) found that juvenile graysnapper fed almost entirely on oyster reef-associ-ated prey items such as crabs, shrimp and fish,while subadults fed on both oyster reef- and man-grove-associated prey. Based on isotope values,they were likely consuming smaller fishes, crabs,and shrimps found on oyster reefs (Table 2, Fig. 2),depending on previous feeding areas. The linedsole feeds on worms, crustaceans, and small fishes,but in this study its carbon isotope values point tobenthic microalgae, suspended POM, and oysters asfood sources on the reef (Table 2, Fig. 2). More thanlikely this fish was not feeding on the reef and wasprobably resting between traveling from one area toanother when it was collected.
Trophic dynamics — overall
Resident decapod crustaceans and fishes found onoyster reefs in this study, in addition to feeding onoyster directly, seem to be using the oyster reef
138

Abeels et al.: Trophic transfer on oyster reefs
mainly as habitat and shelter whilealso feeding on other reef-residentorganisms. Based on an ana lysis ofoyster shell habitat use in southwestFlorida, Tolley & Volety (2005) pro-posed that most resident species usedthe reef for the structure and refugethat oysters provide. It should be cau-tioned that their study examined thehabitat utilization by various residentdecapods and fishes, but did not exa -mine the trophodynamics within anoyster reef. Eurypano peus de pressus,Petrolisthes armatus, and Alpheushetero chaelis all use the spaces be -tween oysters and in oyster shellsthemselves for shelter and to avoiddesiccation and predation (Grant &McDonald 1979, McDonald 1982,Williams 1984, Tolley & Volety 2005,Van Horn & Tolley 2009). Wasno et. al.(2009) found that these crab speciesare consumed by transient fish, and thus the carbonand biomass is transferred from within oyster reefs tohigher trophic levels (Fig. 9). The results of that studydemonstrated the ecological importance of oysterreefs in trophic transfer. Many resident fish speciesare known to attach their eggs to the insides ofunfouled, articulated oyster shells, including thegobies Gobiosoma bosc, Gobiosoma robustum, andBathygobius soporator, skilletfish Gobiesox strumo-sus, and Florida blenny Chasmodes saburrae (Peters1981, 1983, Breitburg 1999). The oysters themselvesprovide the shelter, habitat, and food in the form ofmucus-bound bio deposits (Newell 1988, 2004).
Seasonal influences
PCA revealed a couple of trends. First, Hendry/Mullock Creeks samples showed differences in δ13Cvalues during all sampling months, and Estero Riversamples showed the same trend; the 2 sites were alsodistinct from one another. Depending on tissue turn-over rates, δ13C values will be biased towards themost recent feeding patterns (Michener & Kaufman2007). The average δ13C values for the sites sug-gested that carbon sources for these 2 systems mustbe different. Average Estero River values werebetween −21 and −20‰, which is indicative of aphytoplankton carbon source (−21‰: Fry & Sherr1984). Average Hendry/Mullock Creeks values werebetween −25 and −24‰, which is indicative of a ter-
restrial C3 plant carbon source (−23 to −30‰: Fry &Sherr 1984). Based on δ13C scores (Figs. 4 & 5), Factor1 seems to be driven by site. During the wet season,more water and nutrients are brought into the estu-ary due to the increase in rainfall. As the Hendry/Mullock Creeks site had a higher flow rate from up -stream sources, it received more runoff and nutrientsfrom upland plants especially during the wet season(Fig. 8). This would explain the grouping of sites seenalong Factor 1. The loadings indicated that thesegroupings are driven by the samples Sediment (Sed),Oyster, Alpheus, Eurypanopeus, Petro listhes, andOpsa nus depending on whether Sed was in cluded inthe analysis.
Second, δ15N values indicated that samples col-lected at different times of the year were similar toone another. This is most likely due to seasonalchanges in species composition on the reefs as wellas increases in water temperature and spawning pro-cesses in the estuary that caused the trophic positionof each species to change based on availability offood sources. Factor 1 seemed to be driven by watertemperature increases and spawning processesoccurring on the reef during May and September.
Temperature is an important factor that influencesgonadal development and spawning in oysters(Shumway 1996, Thompson et al. 1996). In southwestFlorida estuaries, oysters appear to continuouslyspawn between April/May and October (Volety2008, Volety et al. 2009). Warm water temperaturesand abundance of food seem to facilitate continuous
139
Fig. 9. Conceptual model of trophic relationships

Mar Ecol Prog Ser 462: 125–142, 2012
reproductive activity in oysters from southwestFlorida (Volety 2008).
Oysters are not the only organisms spawning onthe reef. The number of ovigerous crabs and shrimpobserved during the current study was much higherduring May and September compared to Novemberand February at the Estero River site (data notshown). The spawning season for grass shrimp isfrom March to October, with eggs hatching 12 to 60 dafter fertilization, depending on species and geo-graphical location (Anderson 1985). Ovigerous fe -males of Eurypanopeus depressus and Panopeusspp. have been found from March through Octoberwith peak numbers occurring in late April to Mayand in September (McDonald 1982).
These changes in temperature and spawning pro-cesses for the organisms in this study influenced thedifferences seen between the sites, with Alpheus,Opsanus, and Oyster driving these differences basedon the δ15N loadings. The organisms used in the PCAall spawn and carry eggs during the same timeperiod (April to October). This caused the trophicrelationships within the community to change be -cause organisms that were actively spawning or car-rying eggs may not have been actively feeding orwere avoiding predators. Also, as these juvenileorganisms developed and grew in size there wouldbe a shift in their diet that would alter their trophicrelationships on the reef. The trophic dynamics onthe reef seemed to change during different times ofthe year due to these changing processes.
Freshwater inflow influences the diversity andabundance of organisms found on oyster reefs. Theabundance and diversity of organisms at the Hendry/Mullock Creeks site were lower compared to theEstero River site, indicating that freshwater flow didhave an influence. Also, the Hendry/Mullock Creekssamples showed a difference in carbon isotopic com-positions compared to the Estero River samples, indi-cating that freshwater inflows influenced the carbonsource and thus the quality of food at this site. Qual-ity of food has an effect on the energetics of marineorganisms, including oysters and oyster reef-residentorganisms, and may have implications for reproduc-tion, recruitment, and ultimately survival of theseorganisms in estuaries.
SUMMARY
This study provides additional evidence that asessential fish habitat, oyster reefs provide 3-dimen-sional structure, habitat, and shelter for many resi-
dent species and food for resident and transient spe-cies. This study is also unique because multipletrophic levels in an oyster reef system were investi-gated simultaneously. Stable isotope analysis wasused to determine trophic relationships within multi-ple levels of the community found on oyster reefs.Fig. 9 is a conceptual model of these trophic relation-ships. The organic matter sources, amphipods, andworms are at the lowest level and are consumed byoysters, resident crabs, shrimp, and fishes. The crabsand shrimp are then consumed by other residentcrabs and fish species. Transient fish species such asLutjanus spp. come to the reef to feed on the reef- resident crab, shrimp, and fish species. The stableisotope signatures of the food sources for variousorganisms corroborated with previously reported gutcontent analysis and observed feeding behavior data.
Acknowledgements. The South Florida Water ManagementDistrict provided grant funding to support this researchwithin a larger project. Grant funding from the ExplorersClub of Southwest Florida, the Marco Island Shell Club, andthe Office of Research and Sponsored Programs was used tosupport stable isotope analysis of samples and travel to con-ferences. Field and laboratory support was provided by theCoastal Watershed Institute Marine Laboratory. Stable iso-tope analyses were performed at the University of CaliforniaDavis Stable Isotope Facility.
LITERATURE CITED
Anderson G (1985) Species profiles: life histories and envi-ronmental requirements of coastal fishes and inverte-brates (Gulf of Mexico) — grass shrimp. US Fish andWildlife Service Biological Report 82(11.35) US ArmyCorps of Engineers, TR EL-82-4
Bortone SA, Williams JL (1986) Species profiles: life historiesand environmental requirements of coastal fishes andinvertebrates (South Florida) — gray, lane, mutton, andyellowtail snappers. US Fish and Wildlife Service Biolog-ical Report 82(11.52). US Army Corps of Engineers, TREL-82-4
Boutton TW (1991) Stable carbon isotope ratios of naturalmaterials: I. Sample preparation and mass spectrometricanalysis In: Coleman DC, Fry B (eds) Carbon isotopetechniques. Academic Press, San Diego, CA, p 155–171
Breitburg DL (1999) Are three-dimensional structure andhealthy oyster populations the key to an ecologicallyinteresting and important fish community? In: Lucken-bach MW, Mann R, Wesson JA (eds) Oyster reef habitatrestoration: a synopsis and synthesis of approaches. Virginia Institute of Marine Science Press, GloucesterPoint, VA, p 239–250
Bucci JP, Showers WJ, Rebach S, DeMaster D, Genna B(2007) Stable isotope analyses (δ15N and δ13C) of thetrophic relationships of Callinectes sapidus in two NorthCarolina estuaries. Est Coasts 30: 1049−1059
Caine EA (1975) Feeding and masticatory structures of
140

Abeels et al.: Trophic transfer on oyster reefs
selected Anomura (Crustacea). J Exp Mar Biol Ecol 18: 277−301
Coen LD, Luckenbach MW, Breitburg DL (1999) The role ofoyster reefs as essential fish habitat: A review of currentknowledge and some new perspectives. Am Fish SocSymp 22: 438−454
Conkright ME, Sackett WM (1986) A stable carbon isotopeevaluation of the contribution of terriginous carbon to themarine food web in Bayboro Harbor, Tampa Bay, Florida.Contrib Mar Sci 29: 131−139
Crabtree RE, Dean JM (1982) The structure of two SouthCarolina estuarine tide pool fish assemblages. Estuaries5: 2−9
Cutwa MM, Turingan RG (2000) Intralocality variation infeeding biomechanics and prey use in Archosargus pro-batocephalus (Teleostei, Sparidae), with implications forthe ecomorphology of fishes. Environ Biol Fishes 59: 191−198
Darcy GH (1981) Food habits of the crested goby, Lopho -gobius cyprinoides, in two Dade County, Florida, water-ways. Bull Mar Sci 31: 928−932
Decottignies P, Beninger PG, Rincé Y, Riera P (2007) Trophicinteractions between two introduced suspension-feed-ers, Crepidula fornicata and Crassostrea gigas, are influ-enced by seasonal effects and qualitative selectioncapacity. J Exp Mar Biol Ecol 342: 231−241
DeNiro MJ, Epstein S (1978) Influence of diet on the distri-bution of carbon isotopes in animals. Geochim Cos-mochim Acta 42: 495−506
DeNiro MJ, Epstein S (1981) Influence of diet on the distri-bution of nitrogen isotopes in animals. Geochim Cos-mochim Acta 45: 341−351
Dubois S, Orvain F, Marin-Léal JC, Ropert M, Lefebvre S(2007) Small-scale spatial variability of food partitioningbetween cultivated oysters and associated suspension-feeding species, as revealed by stable isotopes. Mar EcolProg Ser 336: 151−160
Estero Bay Marine Laboratory (2004) Estero Bay ResearchStudies: 9th Annual Report Water Year 2003−2004
Florida Department of Natural Resources (1983) Estero BayAquatic Preserve Management Plan, Tallahasse, FL
Fry B, Sherr EB (1984) δ13C measurements as indicators ofcarbon flow in marine and freshwater ecosystems. Con-trib Mar Sci 27: 13−47
Fukumori K, Oi M, Doi H, Okuda N and others (2008) Foodsources of the pearl oyster in coastal ecosystems ofJapan: evidence from diet and stable isotope analysis.Estuar Coast Shelf Sci 76: 704−709
Gearing JN (1991) The study of diet and trophic relation-ships through natural abundance 13C. In: Coleman DC,Fry B (eds) Carbon isotope techniques. Academic Press,San Diego, CA, p 201–218
Grabowski JH (2004) Habitat complexity disrupts predator-prey interactions but not the trophic cascade on oysterreefs. Ecology 85: 995−1004
Grabowski JH, Peterson CH (2007) Restoring oyster reefs torecover ecosystem services. In: Cuddington K, Byers JE,Wilson WG, Hastings A (eds) Ecosystem engineers. Else-vier, Burlington, MA, p 281–298
Grabowski JH, Hughes AR, Kimbro DL, Dolan MA (2005)How habitat setting influences restored oyster reef com-munities. Ecology 86: 1926−1935
Grant J, McDonald J (1979) Desiccation tolerance of Eury-panopeus depressus (Smith) (Decapoda: Xanthidae) andthe exploitation of microhabitat. Estuaries 2: 172−177
Haines EB, Montague CL (1979) Food sources of estuarineinvertebrates analyzed using 13C/12C ratios. Ecology 60: 48−56
Harding JM, Mann R (2001) Oyster reefs as fish habitat: opportunistic use of restored reefs by transient fishes.J Shellfish Res 20: 951−959
Hazlett BA (1962) Aspects of the biology of snapping shrimp(Alpheus and Synalpheus). Crustacaceana 4: 82−83
Herberholz J, Schmitz B (1998) Role of mechanosensorystimuli in intraspecific agonistic encounters of the snap-ping shrimp (Alpheus heterochaelis). Biol Bull 195: 156−167
Hughes AR, Grabowski JH (2006) Habitat context influ-ences predator interference interactions and the strengthof resource partitioning. Oecologia 149: 256−264
Jennings CA (1985) Species profiles: life histories and envi-ronmental requirements of coastal fishes and inverte-brates (Gulf of Mexico) — sheepshead. US Fish andWildlife Service Biological Report 82(11.29). US ArmyCorps of Engineers, TR EL-82-4
Lenihan HS, Peterson CH, Byers JE, Grabowski JH, ThayerGW, Colby DR (2001) Cascading of habitat degradation: oyster reefs invaded by refugee fishes escaping stress.Ecol Appl 11: 764−782
Loh AN, Bauer JE, Canuel EA (2006) Dissolved and par -ticulate organic matter source-age characterization inthe upper and lower Chesapeake Bay: a combined iso-tope and biochemical approach. Limnol Oceanogr 51: 1421−1431
Luckenbach MW, Coen LD, Ross PG Jr, Stephen JA (2005)Oyster reef habitat restoration: relationships betweenoyster abundance and community development basedon two studies in Virginia and South Carolina. J CoastRes 40(Spec Issue): 64−78
McDermott J (1960) The predation of oysters and barnaclesby crabs of the family Xanthidae. Proc PennsylvaniaAcad Sci 34: 199−211
McDonald J (1982) Divergent life history patterns in the co-occurring intertidal crabs Panopeus herbstii and Eury-panopeus depressus (Crustacea: Brachyura: Xanthidae).Mar Ecol Prog Ser 8: 173−180
Menzel RW, Hopkins SH (1956) Crabs as predators of oys-ters in Louisiana. Proc Natl Shellfish Assoc 46: 177−184
Michener RH, Kaufman L (2007) Stable isotope ratios astracers in marine food webs: an update. In: Michener R,Lajtha K (eds) Stable isotopes in ecology and environ-mental science, 2nd edn. Blackwell Publishing, Malden,MA, p 238–282
Milke LM, Kennedy VS (2001) Mud crabs (Xanthidae) inChesapeake Bay: claw characteristics and predation onepifaunal bivalves. Invertebr Biol 120: 67−77
Minagawa M, Wada E (1984) Stepwise enrichment of 15Nalong food chains: Further evidence and the relationbetween δ15N and animal age. Geochim CosmochimActa 48: 1135−1140
Newell RIE (1988) Ecological changes in Chesapeake Bay: are they the result of overharvesting the American oys-ter, Crassostrea virginica? In: Lynch MP, Krome EC (eds)Understanding the estuary: advances in ChesapeakeBay research. Chesapeake Research Consortium, Glou -cester Point, VA, Publication 129 CBP/TRS 24/88,p 536–546
Newell RIE (2004) Ecosystem influences of natural and cul-tivated populations of suspension-feeding bivalve mol-luscs: a review. J Shellfish Res 23: 51−61
141

Mar Ecol Prog Ser 462: 125–142, 2012
Nolan AN, Salmon M (1970) The behavior and ecology ofsnapping shrimp (Crustacea: Alpheus heterochaelis andAlpheus normanni). Forma Functio 2: 289−335
Overstreet RM, Heard RW (1982) Food contents from sixcommercial fishes from Mississippi Sound. Gulf Res Rep7: 137−149
Peters KM (1981) Reproductive biology and developmentosteology of the Florida blenny, Chasmodes saburrae(Perciformes: Blenniidae). Northeast Gulf Sci 4: 79−98
Peters KM (1983) Larval and early juvenile development ofthe frillfin goby, Bathygobius soporator (Perciformes: Gobiidae). Northeast Gulf Sci 6: 137−153
Peterson BJ, Fry B (1987) Stable isotopes in ecosystem stud-ies. Annu Rev Ecol Evol Syst 18: 293−320
Peterson BJ, Howarth RW (1987) Sulfur, carbon, nitrogenisotopes used to trace organic matter flow in the salt-marsh estuaries of Sapelo Island, Georgia. LimnolOceanogr 32: 1195−1213
Posey MH, Alphin TD, Powell CM, Townsend E (1999) Useof oyster reefs as habitat for epibenthic fish and deca -pods. In: Luckenbach MW, Mann R, Wesson JA (eds)Oyster reef habitat restoration: a synopsis and synthesisof approaches. Virginia Institute of Marine Science,School of Marine Science, College of William and Mary,VIMS Press, p 229–237
Post DM (2002) Using stable isotopes to estimate trophicposition: models, methods, and assumptions. Ecology 83: 703−718
Reames RC, Williams AB (1983) Mud crabs of the Panopeusherbstii H.M. Edw., s.l., complex in Alabama, U.S.A. FishBull 81: 885−890
Riera P, Richard P (1996) Isotopic determination of foodsources of Crassostrea gigas along a trophic gradient inthe estuarine bay of Marennes-Oléron. Estuar CoastShelf Sci 42: 347−360
Shumway SE (1983) Oxygen consumption and salinity toler-ance in four Brazilian crabs. Crustacaceana 44: 76−82
Shumway SE 1996. Natural environmental factors. In:Kennedy VS, Newell RIE, Eble AF (eds). The EasternOyster Crassostrea virginica. Maryland Sea Grant Col-lege, University of Maryland System, College Park, MD,p 467–513
Sutter FC, McIlwain TD (1987) Species profiles: life historiesand environmental requirements of coastal fishes andinvertebrates (Gulf of Mexico) — pigfish. US Fish and
Wildlife Service Biological Report 82(11.71). US ArmyCorps of Engineers, TR EL-82-4
Thompson RJ, Newell RIE, Kennedy VS, Mann R 1996. Re -productive processes and early development. In: Ken -nedy VS, Newell RIE, Eble AF (eds) The eastern oysterCrasso strea virginica. Maryland Sea Grant College, Uni-versity of Maryland System, College Park, MD, p 335–370
Tolley SG, Volety AK (2005) The role of oysters in habitatuse of oyster reefs by resident fishes and decapod crus-taceans. J Shellfish Res 24: 1007−1012
Tolley SG, Volety AK, Savarese M (2005) Influence of salin-ity on the habitat use of oyster reefs in three southwestFlorida estuaries. J Shellfish Res 24: 127−137
Tolley SG, Volety AK, Savarese M, Walls LD, Linardich C,Everham EM III (2006) Impacts of salinity and freshwaterinflow on oyster-reef communities in Southwest Florida.Aquat Living Resour 19: 371−387
Van Horn J, Tolley SG (2009) Acute response of the estuar-ine crab Eurypanopeus depressus to salinity and desicca-tion stress. J Crustac Biol 29: 556−561
Volety AK (2008) Effects of salinity, heavy metals, and pesti-cides on health and physiology of oysters in the Caloosa-hatchee Estuary. Ecotoxicology 17: 579−590
Volety AK, Savarese M, Tolley SG, Sime P, Goodman P,Doering P (2009) Eastern oysters (Crassostrea virginica)as an indicator for restoration of Everglades Ecosystems.Ecol Indic 9: S120−S136
Wasno RM, Volety AK, Doering PH, Crean D (2009) Theimportance of oyster reef community in the diet of preda-tory fish. Book of abstracts, Am Soc Limnol Oceanogr,Nice
Wells HW (1961) The fauna of oyster beds, with special ref-erence to the salinity factor. Ecol Monogr 31: 239−266
Wenner E, Beatty HR, Coen L (1996) A method for quantita-tively sampling nekton on intertidal oyster reefs. J Shell-fish Res 15: 769−775
Williams AB (1984) Shrimps, lobsters, and crabs of theAtlantic coast of the Eastern United States, Maine toFlorida. Smithsonian Institution Press, Washington, DC
Yeager LA, Layman CA (2011) Energy flow to two abundantconsumers in a subtropical oyster reef food web. AquatEcol 45: 267−277
Zimmerman RJ, Minello TJ, Baumer TJ, Castiglione MC(1989) Oyster reef as habitat for estuarine macrofauna.NOAA Technical Memorandum, NMFS-SEFC-249
142
Editorial responsibility: Roger Hughes, Bangor, UK
Submitted: February 10, 2012; Accepted: May 15, 2012Proofs received from author(s): August 6, 2012


