Embed Size (px)
Citation preview

Dávila-Hernández et al.630
ABSTRACT
For the evaluation of recent lahar deposits, we propose a Normalized Difference Lahar Index (NDLI) based on the analysis of eigenvectors of Principal Components Analysis (PCA) applied to Terra/Aster and Spot 5 multispectral images of the Colima Volcano. As a result, the normalization of bands 3 and 4 of both sensors produces the best results for the spectral enhancement of lahar deposits with respect to the rest of the components in the image. Such normalization is the basis for the NDLI. For the validation of results in this case of study, fieldwork was carried out based on ground control points (GCP) on the hillsides of Colima Volcano. Likewise, to corroborate the validity of the NDLI, we performed enhancements and segmentations of lahar deposits using a Variant of Principal Component Analysis (VPCA) and a region growth algorithm. These enhancements and segmentations were compared with results from the NDLI. The application of the NDLI allows the identification of new deposit units and new alluvial fan forms from recurrent lahar deposits, principally on Montegrande and San Antonio ravines on the south flank of the volcano. The application of remote sensing techniques, as the introduction of the NDLI, is a useful tool for the identification of lahar deposits associated to recent volcanic activity.
Key words: lahar deposits, spectral enhancement, lahar segmentation, variant of Principal Components Analysis, Terra/Aster image, Spot 5 image.
RESUMEN
Con la finalidad de evaluar el alcance de un evento lahárico, se propone un Indice Espectral Normalizado de Lahares (NDLI, por sus siglas en inglés) basado en el análisis de los eigenvectores del Análisis de Componentes Principales (PCA, por sus siglas en inglés) aplicado a imágenes Terra/Aster y Spot 5 del Volcán de Colima. Como resultado, se obtuvo que la normalización de las bandas 3 y 4 de ambos sensores produce el mejor realce espectral de los depósitos de lahar con respecto al resto de los componentes de la imagen. Esta normalización es la base para el NDLI. Para la comprobación de resultados del estudio de caso, se realizó un trabajo de campo con puntos de control en las laderas
AnormalizeddifferencelaharindexbasedonTerra/AsterandSpot5images:anapplicationatColimaVolcano,Mexico
Norma Dávila-Hernández1,*, Jorge Lira2, Lucia Capra-Pedol3, and Francesco Zucca4
1 Posgrado en Ciencias de la Tierra, Instituto de Geofísica, Universidad Nacional Autónoma de México, 04510 México D.F., Mexico.
2 Departamento de Recursos Naturales, Instituto de Geofísica, Universidad Nacional Autónoma de México, 04510 México D.F., Mexico.
3 Centro de Geociencias, Universidad Nacional Autónoma de México, Campus Juriquilla, 76230 Querétaro, Mexico.
4 Università degli Studi di Pavia, Strada Nuova 65, 27100 Pavia, Italy.* [email protected]
Revista Mexicana de Ciencias Geológicas, v. 28, núm. 3, 2011, p. 630-644
Dávila-Hernández,N.,Lira,J.,Capra-Pedol,L.,Zucca,F.,2011,AnormalizeddifferencelaharindexbasedonTerra/AsterandSpot5images:anapplicationatColimaVolcano,Mexico:RevistaMexicanadeCienciasGeológicas,v.28,núm.3,p.630-644.

A normalized difference lahar index based on Terra/Aster and Spot 5 images 631
del Volcán de Colima. De igual forma, para corroborar la validez del NDLI, se realizaron realces y segmentaciones de depósitos de lahar con base en un Análisis a la Variante de Componentes Principales (VPCA, por sus siglas en inglés) y un algoritmo de crecimiento de regiones. Estos realces y segmentaciones fueron comparados con los resultados del NDLI. De esta forma, la aplicación del NDLI permite identificar nuevas unidades de depósito y nuevos abanicos aluviales a partir de depósitos de lahar recurrentes, principalmente sobre las desembocaduras de las barrancas San Antonio y Montegrande en el Volcán de Colima. Por tanto, se demuestra que la aplicación de técnicas de percepción remota, como lo es el realce espectral del NDLI, son una herramienta útil para la identificación de depósitos asociados a actividad volcánica reciente.
Palabras clave: depósitos de lahar, realce espectral, segmentación de lahares, variante de Componentes Principales, imágenes Terra/Aster, imágenes Spot 5.
INTRODUCTION
Theassessmentoftheprobabilitiesofvolcanicerup-tionoccurrenceandrelatedvolcanicphenomenahasre-ceived significant attention in the last few decades. The applicationofremotesensinginvolcanicterrainshasproventobeusefulindiverseactivevolcaniczonesaroundtheworld. In particular, in monitoring fumarolic activity, ther-mal variation, advance of lava flows and domic intrusions (Oppenheimer, 1991; Rothery et al.,1992;Oppenheimerand Francis, 1997; Wooster and Rothery, 1997; Flynn et al.,1994;Woosteret al., 2000; Flynn et al.,2001).
Theuseofdigitalelevationmodels(DEM)foras-sessmentoftopographicchangesinvolcanicenvironmentsisnotable.Thus,severaltechniqueshavebeendevelopedusing radar interferometry (InSAR) applied to superficial morphologic modifications. These developments are due to the urgency of results and generation of new information in areas of difficult access (Mouginis et al.,2001;Stevenset al.,2001;Hubbardet al.,2007;Huggelet al.,2008).
The spatial recognition and mapping of superficial deposits related to recent volcanic activity allow the char-acterization of areas affected by lahar flow paths, which isusefulindisastermanagement.Suchmappinghasbeenachieved by using optical and radar sensors of different spatialandtemporalresolution.Thereareseveralstudiesrelated to temporal and spatial variation of the frequency and distributionofrain-inducedlaharsinactivevolcanoes.ThePinatubo(Philippines)andLaCasita(Nicaragua)volcanoesareamongthemostmonitoredusingremotesensingtools.Such monitoring is based on textural features, superficial sedimentology and morphology of lahar deposits (Torres et al., 1996; Chorowicz et al.,1997,Lópezet al.,1998;1996;Van Wyk de Vries et al.,2000,KerleandOppenheimer,2002;Kerleet al.,2003;Torreset al.,2004).
In this paper, we propose a new lahar index (NDLI) us-ingremotesensingtechniquesappliedtoColimaVolcanoinwestern México. The basis of this index resides on the spatial evaluation and spectral enhancement of lahar deposits by applying a set of transformations to a Terra/Aster (Advanced Spaceborne Emission and Reflection Radiometer) and Spot 5images(Système Pour l’Observation de la Terre)im-ages. This approach is useful in volcanic areas of difficult
access due to high frequency occurrence of laharic events. The spatial evaluation of the NDLI is based on fieldwork and segmentation by means of a region growth algorithm. We compare the spectral enhancement from the NDLI with that obtained from Variant of Principal Component Analysis (VPCA) and we assess a statistical validation for theseresults.TheenhancementoflahardepositsachievedfromtheVPCAandtheirsegmentationfromtheregiongrowth algorithm are used to corroborate the validity of the NDLI.
THE COLIMA VOLCANO
The Colima Volcano is the youngest active edifice of the Colima Volcanic Complex and is located in the western sectoroftheTrans-MexicanVolcanicBelt(Figure1).TheColimaVolcanoisastratovolcanothatreachesanaltitudeof3820metersabovesealevelandisandesiticincomposi-tion. The volcano began its activity ~50 ky ago (Robin et al.,1987)anditisconsideredoneofthemostactivevolcanoesin North America. In the last 430 years, 50 eruptive phases have occurred (De la Cruz-Reyna, 1993; Saucedo-Girón, 2000). At present, volcanic activity consists of dome growth and collapse that produce block and ash flow deposits. Those deposits are subsequently remobilized by heavy rains and form lahars on main ravines on the southern flank of the volcano.
Lahars at Colima Volcano
Lahar is any kind of gravitational flow of water-satu-rated volcanic debris flowing down slope. Thus, a lahar can be related to different types of flows depending on the proportion of volcanic debris (solid fraction): 40–70 wt. % is linked to hyperconcentrated flows and 70–90 wt. % is associated to debris flows (Pierson, 1985, Scott, 1988). However, in this work use the term “laharic events” or “lahar deposits” in indistinct form to refer to lahar inundation zones onasatelliteimageincludingboththedepositsproducedby debris and by hyperconcentrated flows.
Lahar events at Colima Volcano are associated with
Dávila-Hernández et al.632
transformation. The VPCA and the region growth algorithm are used to assess the utility of the NDLI. We introduced an explanation of the VPCA and we provide proper references for the region growth algorithm, the PCA and the VPCA.
Satellite images of Colima Volcano
The Terra/Aster imagery was obtained from the Land ProcessesDistributedActiveArchiveCenter(LPDAAC),located in the United States Geological Survey (USGS) EarthResourcesObservationandScienceCenter(EROS)(<http://asterweb.jpl.nasa.gov/>). The Spot 5 imagery was provided by Secretaría de Marina under the terms of an agreement with the Universidad Nacional Autónoma de México (UNAM) (<http://catalog.spotimage.com/PageSearch.aspx>).
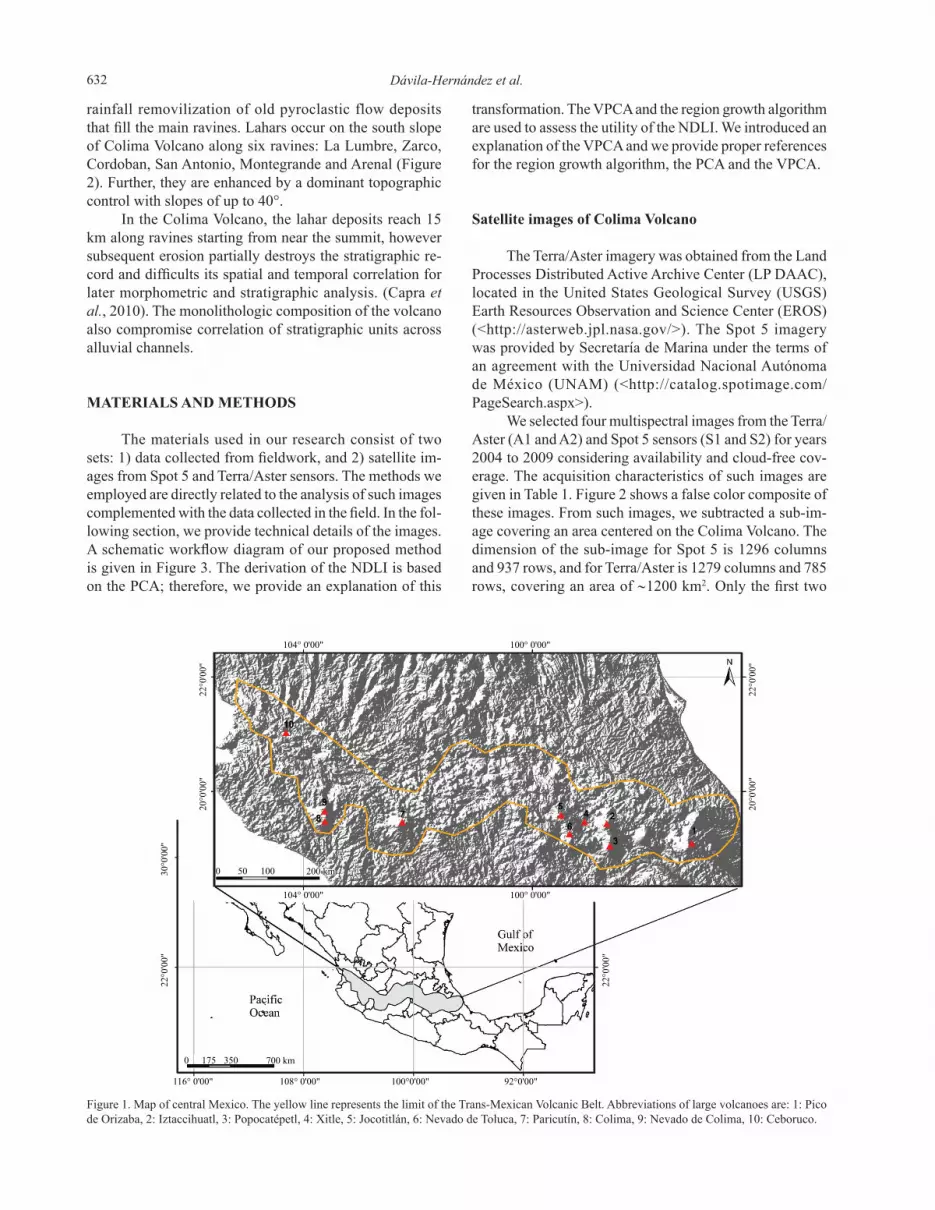
WeselectedfourmultispectralimagesfromtheTerra/Aster (A1 and A2) and Spot 5 sensors (S1 and S2) for years 2004 to 2009 considering availability and cloud-free cov-erage.TheacquisitioncharacteristicsofsuchimagesaregiveninTable1.Figure 2 shows a false color composite of these images. From such images, we subtracted a sub-im-agecoveringanareacenteredontheColimaVolcano.Thedimensionofthesub-imageforSpot5is1296columnsand 937 rows, and for Terra/Aster is 1279 columns and 785 rows, covering an area of ∼1200 km2. Only the first two
rainfall removilization of old pyroclastic flow deposits that fill the main ravines. Lahars occur on the south slope ofColimaVolcanoalongsixravines:LaLumbre,Zarco,Cordoban,SanAntonio,MontegrandeandArenal(Figure2). Further, they are enhanced by a dominant topographic control with slopes of up to 40°.
In the Colima Volcano, the lahar deposits reach 15 km along ravines starting from near the summit, however subsequent erosion partially destroys the stratigraphic re-cord and difficults its spatial and temporal correlation for later morphometric and stratigraphic analysis. (Capra et al.,2010).Themonolithologiccompositionofthevolcanoalsocompromisecorrelationofstratigraphicunitsacrossalluvialchannels.
MATERIALS AND METHODS
The materials used in our research consist of two sets: 1) data collected from fieldwork, and 2) satellite im-ages from Spot 5 and Terra/Aster sensors. The methods we employed are directly related to the analysis of such images complemented with the data collected in the field. In the fol-lowing section, we provide technical details of the images. A schematic workflow diagram of our proposed method is given in Figure 3. The derivation of the NDLI is based on the PCA; therefore, we provide an explanation of this
Figure 1. Map of central Mexico. The yellow line represents the limit of the Trans-Mexican Volcanic Belt. Abbreviations of large volcanoes are: 1: Pico de Orizaba, 2: Iztaccihuatl, 3: Popocatépetl, 4: Xitle, 5: Jocotitlán, 6: Nevado de Toluca, 7: Paricutín, 8: Colima, 9: Nevado de Colima, 10: Ceboruco.
A normalized difference lahar index based on Terra/Aster and Spot 5 images 633
subsystems of Terra/Aster (visible, near-infrared,VNIR, and shortwave-infrared,SWIR) were used for the spectral analy-sis (first nine spectral bands), this is because the thermal infrared (TIR) subsystem is at low resolution (Table 1).
Fieldwork rationale
In this paragraph we introduce the fieldwork rationale to assess the results produced by the Normalized Difference Lahar Index (NDLI). As explained above, four multispectral images (Terra/Aster and Spot 5) for years 2004 to 2009 were used. This allowed a time characterization of the study site. Thus, for the verification of results, two field campaigns were carried out on April 2008 and April 2010. The fieldwork was feasible in the principal ravines of the southslope:SanAntonioandMontegrande.FifteenGroundControl Points (GCP) were sampled using a high-resolution Geo-Positioning System (GPS). Such GCPs were loaded into a Geographic Information System and overlaid on the final images. The selection criteria of GCPs were based on
a random sampling scheme. The tracking of a single deposit is not possible due to high erosive activity on (within) the ravines. Each GCP was stored with an in situ descriptionof textural characteristics, thickness, basic layers compo-sition and dimension of fans in the distal zones linked to lahar deposits. The deposit description was used as a tool to gather significant differences in the field between lahar and other sedimentary deposits.
Principal component analysis (PCA)
ThelaharindexisbaseduponavariantofthePrincipalComponent Analysis (PCA). Therefore, we briefly introduce a description of the PCA followed by a detailed account of such variant. Details of PCA may be found in Lira (2010). The PCA is defined as
g(r)=A{F(r)} (1)
WhereA is the kernel of the transformation and risthe
Figure 2. Original Terra/Aster (A1 and A2) and Spot 5 (S1 and S2) images of the Colima volcano region in west-central Mexico (no. 8 in Figure 1). Ravines in the southern flank of the volcano produce laharic flows and deposits. Arrows indicate ravines studied in this work. False color composite of Asterimage:[R,G,B]=[4,3,2]andSpot5:[R,G,B]=[4,3,2].

Dávila-Hernández et al.634
vectorofthepixelvaluesintheoriginalbandsoftheimage.The kernel A is formed by the eigenvectors of the covari-ancematrixKfoftheoriginalimageF(r).Non-correlatedbandsnamedprincipalcomponentsformthetransformedimage,g(r).TheeigenvectorsofKf generate a new system of orthogonal axes, where the variance values are maximized amongeachprincipalcomponent.
Thus,PCAisausefultooltoeliminateredundantin-formationamongbandsoftheoriginalimage(Lira,2010).In Terra/Aster and Spot images, the first three principal components carry almost the whole of information of the imageF(r).
For the spectral lahar index construction, an analysis was undertaken on the weight factors of the linear combina-tion of bands provided by PCA. These weight factors are defined by the eigenvectors of the covariance matrix Kf.
To look further into the detail of the derivation of the
laharindex,avariantofthePCAneedstobeconsidered;this is explained in the following section.
Variant of Principal Components Analysis (VPCA)
In Equation (1), the kernel A is obtained by means of theeigenvectorsofthecovariancematrixKf, Thismatrixiscalculated using the whole set of pixels of the image F(r).The variant of PCA uses only a set of pixels that refers to a spectral class previously defined (Lira, 2006; Lira, 2010). Acovariancematrixiscalculatedonthegroundsofthissetofpixels;letthiscovariancematrixbeKf
ω.Thus,theVPCA is written as
gω(r)=Aω{F(r)} (2)
WhereAω is the kernel formed by the eigenvectors
Figure 3. Schematic diagram of the methodology for the Normalized Difference Lahar Index (NDLI).
ID Image Date Pixel size (m) Bands Wavelength range ( μm)
A1 Aster 25/04/2006 VNIR: 15, SWIR: 30, TIR: 90 14 0.52–11.650A2 Aster 18/03/2008 VNIR: 15, SWIR: 30, TIR: 90 14 0.52–11.650S1 Spot5 17/11/2004 10 4 0.50–1.75S2 Spot5 24/06/2009 10 4 0.50–1.75
Table 1. Acquisition characteristics of Spot 5 and Aster images. Terra/Aster is constituted in three subsystems (regions of the spectrum): VNIR, visible-near-infrared; SWIR, shortwave-infrared; TIR, thermal infrared.
A normalized difference lahar index based on Terra/Aster and Spot 5 images 635
obtainedfromthecovariancematrixKfωandωisthespectral
class previously defined. The VPCA minimizes the disper-sion between targets and emphasizes or spectrally separates a cover-type with respect to the rest of coverages or targets that form the satellite image. This generates a new spec-tral projection where the maximum spectral separation is achievedandisrelatedtothemaximumvariance(RichardsandJia,1999;Lira,2006).
The operation of the VPCA was as follows: we ex-tractedfromtheoriginalimageanareathatrepresentsanactive fan where lahars accumulate each year during the rainy season. We read the values of the pixels included in thisareaandobtaineditsassociatedcovariancematrix.Then, we applied Equation (2) to derive output components according to VPCA. The active fans where lahar deposits are apparent is the one cover-type that is spectrally separated fromtotherestoftheimage.Thisspectralseparationis
maximum,leadingtotheenhancementoflaharsachievedby means of the VPCA.
Grounds for the generation of a lahar index
Data derived from PCAThe first three eigenvectors are depicted in Table 2.
Each of these first components shows different aspects of theimagethatcannotbeappreciatedintheoriginalbands.Figures 4a-4b depict the first three principal components.
For Terra/Aster images, the first principal compo-nents are associated with the highest variance of 74.4 % (A1),and53.9%(A2),andhighcontrastandbrightness(Table 2, Figure 4). In the case of Spot 5 images, the first principalcomponentshaveavarianceof63.6%(S1)and54.1 % (S2) respectively. However, based on a visual examinationofcontrastandbrightness,thespectralen-hancement of deposits linked to recent volcanic activity is associated with the third component. On the image, suchenhancementisassociatedtohighdigitalnumbersorbrightcolors.Thisenhancementisobservableinthethirdcomponentofbothimages,forTerra/Asterimages:PCA3-A1andPCA3-A2andforSpot5images:PCA3-S1,PCA3-S2(Figure4).
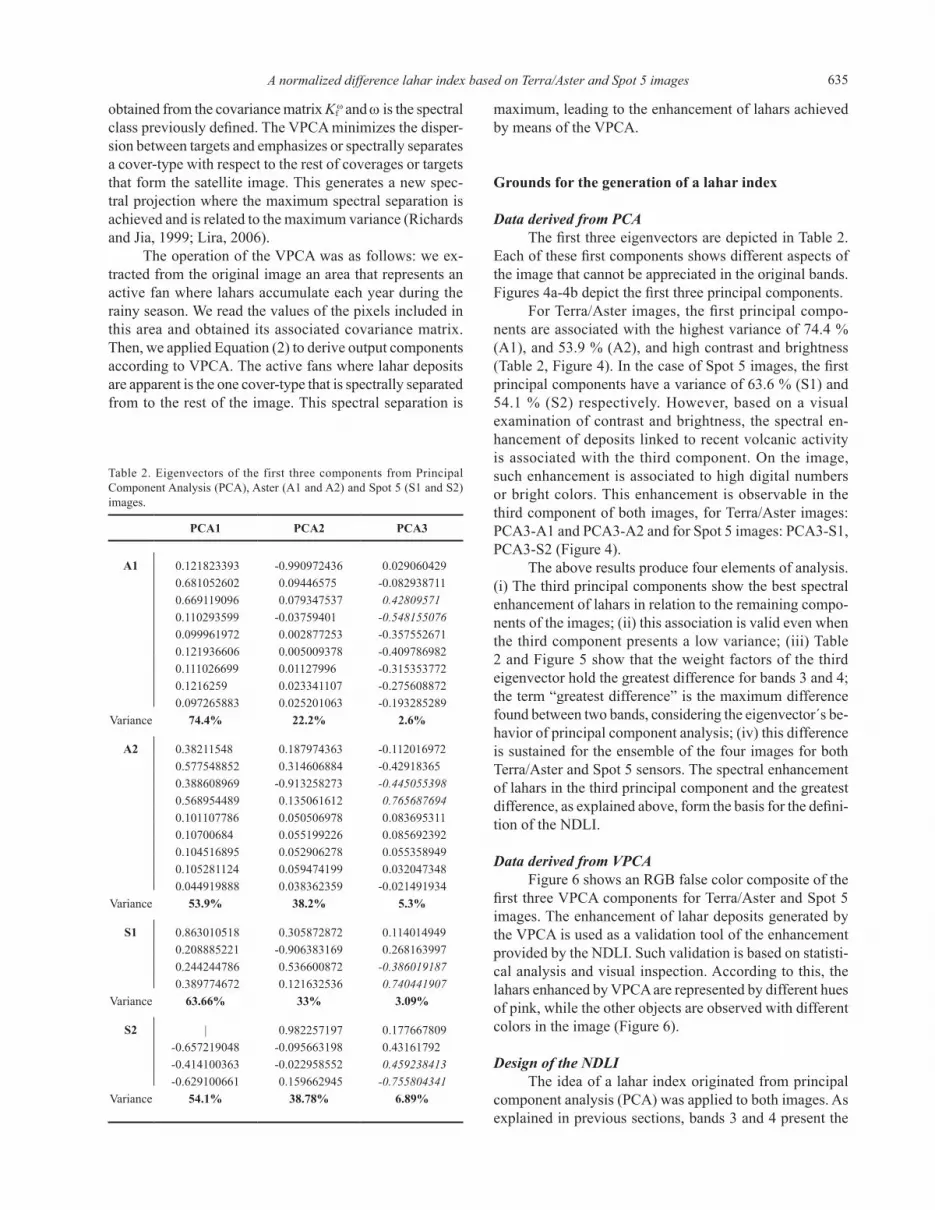
The above results produce four elements of analysis. (i) The third principal components show the best spectral enhancementoflaharsinrelationtotheremainingcompo-nents of the images; (ii) this association is valid even when the third component presents a low variance; (iii) Table 2 and Figure 5 show that the weight factors of the third eigenvectorholdthegreatestdifferenceforbands3and4;the term “greatest difference” is the maximum difference found between two bands, considering the eigenvector´s be-havior of principal component analysis; (iv) this difference issustainedfortheensembleofthefourimagesforbothTerra/AsterandSpot5sensors.Thespectralenhancementoflaharsinthethirdprincipalcomponentandthegreatestdifference, as explained above, form the basis for the defini-tion of the NDLI.
Data derived from VPCAFigure 6 shows an RGB false color composite of the
first three VPCA components for Terra/Aster and Spot 5 images. The enhancement of lahar deposits generated by theVPCAisusedasavalidationtooloftheenhancementprovided by the NDLI. Such validation is based on statisti-cal analysis and visual inspection. According to this, the lahars enhanced by VPCA are represented by different hues of pink, while the other objects are observed with different colorsintheimage(Figure6).
Design of the NDLITheideaofalaharindexoriginatedfromprincipal
component analysis (PCA) was applied to both images. As explainedinprevioussections,bands3and4presentthe
PCA1 PCA2 PCA3
A1 0.121823393 -0.990972436 0.0290604290.681052602 0.09446575 -0.0829387110.669119096 0.079347537 0.428095710.110293599 -0.03759401 -0.5481550760.099961972 0.002877253 -0.3575526710.121936606 0.005009378 -0.4097869820.111026699 0.01127996 -0.3153537720.1216259 0.023341107 -0.2756088720.097265883 0.025201063 -0.193285289
Variance 74.4% 22.2% 2.6%
A2 0.38211548 0.187974363 -0.1120169720.577548852 0.314606884 -0.429183650.388608969 -0.913258273 -0.4450553980.568954489 0.135061612 0.7656876940.101107786 0.050506978 0.0836953110.10700684 0.055199226 0.0856923920.104516895 0.052906278 0.0553589490.105281124 0.059474199 0.0320473480.044919888 0.038362359 -0.021491934
Variance 53.9% 38.2% 5.3%
S1 0.863010518 0.305872872 0.1140149490.208885221 -0.906383169 0.2681639970.244244786 0.536600872 -0.3860191870.389774672 0.121632536 0.740441907
Variance 63.66% 33% 3.09%
S2 | 0.982257197 0.177667809-0.657219048 -0.095663198 0.43161792-0.414100363 -0.022958552 0.459238413-0.629100661 0.159662945 -0.755804341
Variance 54.1% 38.78% 6.89%
Table2.Eigenvectorsof thefirst threecomponentsfromPrincipalComponent Analysis (PCA), Aster (A1 and A2) and Spot 5 (S1 and S2) images.

Dávila-Hernández et al.636
Figure 4. a: RGB image of first three PCA and third component of A1 and A2 (image in gray tones). b: RGB image of first three PCA and third component of S1 and S2 (image in gray tones). In both cases (a and b), the RGB represent the best information considering all elements of the image; the lahars are represented with indistinct color tones. However, only the third PCA (PCA3) shows an evident spectral enhancement of the lahar flow path. On the image (A1, A2, S1, S2) this path is represented in white color, except for A2 where the lahar flow path is shown in black color.
greatest difference for the third component PCA3, in which the lahars are spectrally enhanced.
In order to compare the areas of lahars enhanced by the VPCA and the NDLI we performed a segmentation of lahars. This segmentation was achieved in terms of canoni-
calvariablesusingtheTerra/Asterimageof2005.Thisseg-mentation is to corroborate that VPCA and the NDLI indeed enhancetheareasoflaharsinthemultispectralimage.
The segmentation of lahar deposits was achieved on the basis of a canonical expansion (Lira and García, 2003;

A normalized difference lahar index based on Terra/Aster and Spot 5 images 637
Lira,2010).Thecanonicalvariablesconsideredare:Thealbedo of lahars (X1),thethirdprincipalcomponentofthe(X2), and Humidity from Kauth and Thomas transformation (X3)(Kauthet al.,1979).Uponvisualinspection,thethirdprincipal component was selected because lahar deposits are well differentiated from the rest of the image. The albedo of lahar (X1) results from the first component of VPCA (Lira and García, 2003). The variable X2isthethirdprincipalcomponentfromPCA.
The variables {X1, X2 and X3} were put into a hier-archical region-growth algorithm (RHSEG) (Tilton et al.,2006). The result of this algorithm is an image with a number of regions. By means of an agglomerative process, a final binary image is obtained where two classes are identified, the first one is the laharic event and the second one includes the rest of the image (Figure 7). Figure 8 depicts a block diagramofthesegmentationprocessoflahars.
According with Figure 7, comparison of the binary image with the spectral enhancement produced by the VPCA shows a match of the areas occupied by the lahars. In the same way, a comparison of the binary image with
the enhancement of deposits produced by the PCA3 shows a match as well. However, there is a difference in VPCA with respect to PCA3. For VPCA, the lahar deposits show inwards, enhanced borders linked to several lahar pulses (alluvial pulses) located toward the ravine mouth. Such spectral borders are represented by alternation of high and low digital values along enhanced deposits. This is not the case for PCA3, where mostly high digital numbers represent the complete area covered by lahar deposits. In brief, we have the following results: a) an enhancement of deposits fromthePCA,b)auniquerelationshipamongbands3and4,c)anenhancementoflaharsfromVPCA,andd)asegmentation from region growth that matches the spectral enhancementoflahars.
Basedon theabovediscussion, theNormalizedDifference Lahar Index (NDLI) is defined as
NDLI = B3-B4
B4+B3
Thisindexisvalidforbothimages:Terra/AsterandSpot.B3isthebandnumberthreethatcorrespondstothe
Figure 5. Plot of the first three eigenvectors (PCA1, PCA2, PCA3) in relation to original bands: Terra/Aster (A1, A2) and Spot 5 (S1, S2). Each eigenvector (PCA) shows the weight factors between original bands. In specific, the third eigenvector (PCA3) hold the greatest difference (weight factor) for bands 3 and 4. Terra/Aster is constituted in three subsystems (regions of the spectrum): VNIR, visible-near-infrared; SWIR shortwave-infrared, TIR thermal infrared. In this work only the first two subsystems were used.

Dávila-Hernández et al.638
These GCP were dubbed COL10-i, i = 1 – 15. A general field description at each site was annotated for each GCP. For the NDLI, 80% of the points were indeed verified as
Figure 6. RGB false color composite of the first three VPCA (Variant of Principal Component Analysis) for Terra/Aster (A1, A2) and Spot 5 (S1, S2) images. VPCA enhances the lahar flow path and it is only used as a validation tool of the spectral enhancement obtained with NDLI. The lahar deposits enhancement by VPCA are represented by different hues of pink, linked to high digital numbers (DN); other elements are showed with different colors on the scene, linked to low digital numbers (DN).
nearinfrared,andB4isthebandnumber4thatcorrespondstothemiddleinfrared.
RESULTS
Statistical validation of the NDLI
The results derived from NDLI are shown in Figure 9. A statistical validation of the NDLI was undertaken. An inspectionofthecomponentsfromPCA(Figures4and5)leadstotheconclusionthataparticularrelationshipofbands 3 and 4 set the grounds for the design of the NDLI as explained in the previous section. The VPCA specifi-cally enhances the lahar deposits; therefore, a correlation between the VPCA and the NDLI should be high for those areas occupied by lahar deposits.
To establish a comparison between VPCA and NDLI (Figure 6 and 9), a descriptive statistical analysis was under-taken. This comparison is based on correlation coefficients between VPCA and NDLI. A large area of the Terra/Aster and Spot 5 images is covered by vegetation, which might lead to an error in the statistical comparison analysis. Therefore, to obtain a meaningful correlation coefficient, a sample area was selected, where the lahar deposits are significant. For the selected sample area, the correlation coefficients between VPCA and NDLI for Spot 5 images S1 and S2 are 0.75 and 0.72, respectively. For Terra/Aster images A1 and A2, the correlation produced coefficients of 0.67 and 0.63, respectively. This statistical relationship can be associated with a better spatial definition of the lahar de-posits in Spot 5 images (S1, S2) with respect to Terra/Aster images (A1, A2) resulting from VPCA and NDLI. This is for specific areas related to down-flow inundation in San AntonioandMontegranderavines.Thehighcorrelationandspatial definition for S1 can be associated to the eruptive eventsof2004-2005.
Basedonsuchcorrelationresults,adirectrelation-ship is established between the spectral behavior of lahars enhanced by the VPCA and the NDLI. From the above analysis, we conclude that the VPCA and the NDLI set the basis to segment lahar deposits by means of maximum spectral separation with respect to the rest of the image components. While the VPCA is not easily available in commercial software, the NDLI is readily calculated from asimplerelationshipoftheoriginalbands3and4.
Fieldwork validation
The fieldwork details are as follows. To verify the results derived from NDLI, final images from the NDLI (Figure 9) were loaded into a Geo-Positioning System (GPS) Juno SC-Trimble Handheld with 1.5 meters of accuracy. Fifteen ground control points (GCP) were randomly selected alongtheprincipalravines(laharareasandnolaharareas).

A normalized difference lahar index based on Terra/Aster and Spot 5 images 639
lahars, while for VPCA the success rate was 60%.In particular, from those GCP, the control points
COL10-1andCOL10-2correspondtoatopographicchangefromthedistallimitoftheravinetothebeginningofitsdepositionalfan(Figure10).Thetransectdimensionde-fined by COL10-1 and COL10-2 is 260 m long. According with this field description, the depositional fan is cut off by parallel gullies that expose a sequence of recent lahar deposits. This sequence is up to 3.5 m thick and is com-posed by a sequence of heterolithological units of massive, matrix-supported debris flows deposits with clasts up to 6 cm in diameter. Clast-supported layers constitute the top of this deposit with fragments up to 30 cm in diameter. Thus, based on the spectral enhancement of lahars by the NDLI
and the high rate of success, we conclude that their field identification might be easily achieved.
Fieldwork was concentrated along main ravines on the southern flank of the volcano. In such areas, the slope varies between 35° and 40° from the summit at 3850 to 3200 m above sea level, and decreases to ~10° at its base, at 2500 m. In areas more distal from the summit (up to 20 km), slope progressively decreases to lower values. Lahars mainly occur at the distal end of the main ravines, where they open up to form alluvial fans that result from the deposition of several units of debris flow deposits, as isthecaseattheSanAntonioandMontegranderavines.In particular, at the distal portion of main ravines, lahar deposition forms wide fans.
Figure 7. This figure shows a spatial evaluation between RHSEG segmentation, and PCA and VPCA techniques. A binary image of lahar deposits derived from a hierarchical region-growth algorithm (RHSEG) was converted into shapefile format (yellow isoline). The image above is based on a Geographic Information System and the yellow isoline is overlapping with respect to PCA3 for A1; whereas in the image below, the yellow isoline is overlapping with respect to VPCA for A1.

Dávila-Hernández et al.640
Figure 8. Schematic diagram showing the procedure that led to the generation of the Normalized Difference Lahar Index (NDLI).
Figure 9. In these four cases the lahars flow path are spectrally enhanced by means of a simple normalization of bands 2 and 4. Lahars are represented by white tones for A1 (9a) and S1 (9c), linked to high values of Digital Numbers (near to 256 DN), and dark tones for A2 (9a) and S2 (9d), linked to low values of Digital Numbers (near to 0 DN). This type of spectral enhancement does not occur with other elements in the scene. The results of the simple normalization between bands 3 and 4 is the basis of the Normalized Difference Lahar Index (NDLI).

A normalized difference lahar index based on Terra/Aster and Spot 5 images 641
Spatial and temporal distribution of lahars
The validity of the NDLI as a spectral enhancer of lahars was explained in previous sections. Therefore, we may use this index to segment areas occupied by lahars in two different periods linked probably to dissimilar volcanic activity. In order to assess the spatial distribution of lahars enhanced by the NDLI, a spatial comparison of Spot images from different years (2004 and 2009) was carried out. The lahars were spectrally enhanced by means of the NDLI. Thus, the images resulting from the NDLI (Figure 9) were introduced into a region growth algorithm (RHSEG) (Tilton, 2006).TheRHSEGalgorithmproducesasetofclustersthatare easily associated with lahars. From this, two binary im-ages were produced, one for the year 2004 and the other for the year 2009. The binary images represent the segmentation of lahars. Both segmentations were spatially overlapped using the Geographic Information System ArcGis 9.3 (Figure 10). In the image of 2004, the NDLI shows a good spatial definition of alluvial fans related to lahar events. Whileinthe2009image,itispossibletodetecttheforma-tion of new erosive channels associated to a higher lahar frequency along the San Antonio ravine. At the end of the Montegrande ravines, it is clear that a large fan formed by severalepiclasticdepositsoriginatedfromintenselaharicactivity. A detailed fieldwork was undertaken to corroborate the above statements. Figure 11 shows a spatial view of lahardepositsofsuchimagesegmentation.
DISCUSSION
Spectral behavior of lahar deposit
In the following discussion, we focus on the relative spectral differences between coverage deposits, which imply that no absolute reflectance values are required. The spectral difference is preserved whether as reflectance values or as digitalnumber(DN)values.Toevaluatetherelativespectraldifferences between superficial deposits, a kernel of 3×3 was slipped over representative areas of each kind of deposit toobtainanaverageofthedigitalnumber(DN)ofapixelfromTerra/Asterimages.Thus,theconsideredcoverageswere: 1) lahar deposits, 2) undifferentiated deposits, 3) and pyroclastic flows (Figure 12). The spectral behavior of such coverages is as follows. These three spectral coverages show a similar spectral behavior, with a maximum difference between bands 3 and 4. This spectral difference is charac-terized as follows: for lahar deposits, signature (1) presents a maximum of 120 DN in band 3 and 49 DN in band 4. In thecaseofundifferentiateddeposits(2)similarvaluesareobserved. However, signature of pyroclastic deposits (3) presentsthehighestdifferenceatamaximumof229DNinband3and57DNinband4.Thelahardepositspresenta similar curve behavior with respect to spectral coverages (1) and (2) but with lower DN values; this is because the pyroclastic flow deposits are the source material for a lahar event because they are easily remobilized as lahars during
Figure 10. Segmentation of lahars using the NDLI on Spot 5 images for change evaluation in two periods: S1 (2004), S2 (2009). Spatial differences in areas inundated by lahars are found. Those differences correspond to depositional fans in Montegrande and San Antonio ravines placed on the outfall of theravines.Theredtrianglesrepresentthegroundcontrolpoints(GCP)dubbedCOL10-i,i=1-15.

Dávila-Hernández et al.642
rainy seasons.Thesimilarcurvebehaviorofthesethreespectral
coveragesisafactthatcanberelatedtotheirspectralprop-erties, which means that their monolitologic composition determines the spectral behavior. As mentioned previously, the Colima Volcano composition is predominantly andesitic; thus,thespectralbehaviorofandesiteisexpectedinthethreecases.Thenormalizedandesitesignatures(AHA-h1,AHA-h2, AHA-h3) were extracted from the Terra/Aster spectral library (Balbridge et al.,2009)(Figure.13).Theandesite signature was compared with respect to Terra/Aster andSpot5images,consideringthespectralcoverages1to3 previously defined (Figure 12). According to Figure 13, forTerra/AsterandSpot5images,thelaharcurvepresentsasimilarbehaviorastheandesitecurve.Nonetheless,achangeofslopefrom0.8to1.5µmisobservedinbothcases.Thespectraldifferenceamongbands3and4matchesthe change of slope previously mentioned when comparing thelaharscurveinFigure12.
Sincethespectraldifferenceisthehighestamongbands3and4forlahardeposits,thisenablesustocon-clude that the NDLI allows the spectral separation of lahar deposits from the rest of the spectral coverages in the study area.
SUMMARY AND CONCLUSION
A Normalized Difference Lahar Index (NDLI) was generated on the basis of Principal Component Analysis (PCA).Thesetransformationsindicatethatanormalizedrelationshipofbands3and4forTerra/AsterandSpotimagesproducesaspectralenhancementoflahardeposits
linked to remobilization of older pyroclastic flow deposits during rainfall events. For the ratification of NDLI we have realizedastatisticalvalidationbasedonacomparisonbe-tween NDLI and Variant of Principal Component Analysis (VPCA), fieldwork and spatial distribution of lahar deposits ofdifferentvolcanicperiods.Thus,thestatisticalvalidationis based on the correlation coefficient of NDLI with VPCA, which shows the highest values for lahar deposits on Spot 5 images (S1, S2). Furthermore, on the basis of fieldwork validation, 80% accuracy was obtained. The spatial dis-tribution of lahars obtained with NDLI, permitted to get a better segmentation of lahar flow paths on Spot 5 images (S1, S2) in comparison with Terra/Aster images (A1 and A2); specifically for S1 where new erosive channels linked
Figure 11. View of recent lahar deposits at the mouth of Montegrande ravine. a:) Lahar deposit partially eroded by a subsequent flow along the aluvial channel. b: Vertical sequence of a erosive channel constituted by multiple lahar deposits.
Figure12.Nine-bandsspectralsignaturesfromTerra/Astersensorforlahardeposits (1), undifferentiated deposits (2) and pyroclastic flows (3).

A normalized difference lahar index based on Terra/Aster and Spot 5 images 643
to the highest lahar frequency along San Antonio Ravine were detected. The detection of this change would not have beenpossibleusingtheoriginalbands.
The spectral comparison between relative signatures of volcanic deposits extracted from Terra/Aster images with respecttotheandesitesignatureobtainedfromtheTerra/Aster library showed the influence of the monolithologic compositionatColimaVolcano.Allsignaturespresentedasimilarbehavior,itmeansthesamechangeofslopefrom0.8 to 1.5 µm and corresponding with the original bands 3 and4(bothSpot5andTerra/Aster).
Therefore, the NDLI is a useful technique and can be applied in volcanoes with a high explosive component such as the Colima Volcano or in volcanic areas with difficult ac-cess.Themonitoringofremotesensinginformationcanbea very useful tool during a volcanic crisis to detect potential inundation areas by lahar events.
ACKNOWLEDGEMENTS
This study is part of the project: DGAPA-UNAM IN123209. We gratefully acknowledge the Secretaría de Marina, which provided the Spot 5 data. Professor Tilton of NASA-JPL kindly provided a temporary license of the software RHSEG. The authors thank to the reviewers S. V. Smith, C. Puente, and A. Hinojosa for their helpful and constructive reviews. Finally, we would like thank A.Martin,RMCGeditor,forhisvaluablecommentstoimprove this work.
REFERENCES
Balbridge, A.M., Hook, S.J., Rivera, G., 2009, The ASTER spectral library version2.0:RemoteSensingofEnvironment,113,711-715.
Figure13.Spectralcomparisonofnormalizedandesitesignatures(AHA-h1,AHA-h2,AHA-h3)fromdifferentAsterlibraries(Balbridgeet al.,2009),and their relative spectral differences from Terra/Aster and Spot 5 data signatures showed in Figure 12.

Dávila-Hernández et al.644
Capra, L., Borselli, L., Varley, N., Norini, G., Gavilanes, J.C., Sarocchi, D., Caballero,L.,2010,Rainfall-triggeredlaharsatVolcándeColima,Mexico: surface hydro-repellency as initiation process: Journal of Volcanology and Geothermal research, 189(1-2), 105-117.
Chorowicz, J., López, E., Garcia, F., Parrot, J.F., Rudant, J.P., Vinluan, R., 1997, Keys to analyze active lahars from Pinatubo on SAR ERS imagery: Remote Sensing of Environment, 62, 20-29.
De la Cruz-Reyna, C., 1993, The historical eruptive activity of Colima Volcano, Mexico: Journal of Volcanology and Geothermal Research,55,51-58.
Flynn, L.P., Mouginis-Mark, P.J., Horton, K.A., 1994, Distribution of thermal areas on an active lava flow field: Landsat observations of Kilauea, Hawaii, July 1991: Bulletin of Volcanology, 56, 284-296.
Flynn, L.P., Harris, A.J.L., Wright, R., 2001, Improved identification of volcanicfeaturesusingLandsat7ETM+:RemoteSensingofEnvironment,78,180-193.
Hubbard, B.E., Sheridan, M.F., Carrasco-Núñez, G., Díaz-Castellón, R., Rodríguez, S.R., 2007, Comparative lahar hazard mapping at Volcán Citlaltépetl, Mexico using SRTM, ASTER and DTED-1 Digital Topographic Data: Journal of Volcanology and Geothermal Research,60,99-124.
Huggel,C.,Schneider,D.,Miranda,J.,Delgado,H.,Kääb,A.,2008,EvaluationofASTERandSRTMDEMdataforlaharmodeling:Acase study on lahars from Popocatépetl Volcano, Mexico; Journal of Volcanology and Geothermal Research, 170, 99–110.
Kauth, R.J., Lambeck, P.F., Richardson, W., Thomas, G.S., Pentland, A.P., 1979,Featureextractionappliedtoagriculturalcropsasseenby Landsat, in Proceedings of the Large Area Crop Inventory Experiment (LACIE) Symposium, Houston TX, NASA/Johnson SpaceCenter,705-721.
Kerle,N.,Oppenheimer,C.,2002,SatelliteRemoteSensingasaToolinLaharDisasterManagement:Disasters,26(2),140-160.
Kerle. N., Van Wyk de Vries, V., Oppenheimer. C., 2003, New insight into the factors leading to the 1998 flank collapse and lahar disaster at Casita Volcano, Nicaragua: Bulletin of Volcanology, 65,331–345.
Lira, J., 2006, Segmentation and morphology of open water bodies from multispectral images: International Journal of Remote Sensing, 27(18),4015-4038.
Lira,J.,2010,Tratamientodigitaldeimágenesmultiespectrales:UniversidadNacional Autónoma de México, 632 pp.
Lira, J., García, E., 2003, Characterization of vegetation in the south of Mexico by means of a canonical expansion: International Journal ofRemoteSensing,24,1083-1093.
López, E.D., Chorowicz, J., García, F., Parrot, J.F., Vinluan, R.J.N., 1996, Mount Pinatubo lahar damage assessment using ERS-1 synthetic aperture radar data: International Archives of Photogrammetry andRemoteSensing,31,partB7,434-447.
López,E.D.,Vinluan,R.J.N.,Paringit,E.C.,1998,Lahardamageassessmentusingsatelliteremotesensing:TheMountPinatuboexperience, in Proceedings of the Workshop on Information Technology Tools for Natural Disaster Risk Management, Bangkok, February 4-6: International Center for Disaster-Mitigation Engineering (INCEDE) of the University of Tokio, United Nations University (UNU). Asian Center for Research onRemoteSensing(ACRoRS),175-182.
Mouginis-Mark, M.J., Rowland, K.S., Garbeil. H., Amelung. F., 2001, Topographic changeonvolcanoes fromSRTMandotherinteferometricradars,in International Geoscience and Remote Sensing Symposium (IGARSS), Sidney, July 9-13: Institute of Electrical and Electronics Engineers (IEEE) Conference Proceedings,no.2,757-758.
Oppenheimer, C., 1991, Lava flow cooling estimated from Landsat Thematic Mapper infrared data: the Lonquimay eruption: Journal of Geophysical Research, 96, 21865-21878.
Oppenheimer,C.,Francis,P.,1997,Remotesensingofheat, lava,andfumaroleemissionsfromErta’AleVolcano,Ethiopia:International Journal of Remote Sensing, 18, 1661-1692.
Pierson, T. C., 1985, Initiation and flow behavior of the 1980 Pine Creek and Muddy River lahars, Mount St. Helens, Washington: Geological Society of American Bulletin, 96, 1056-1069.
Richards, J.A., Jia, X., 1999, Remote sensing digital image analysis: An introduction:Berlin,Heidelberg,Springer-Verlag,363pp.
Robin,C.,Mossand,P.,Camus,G.,Cantagrel,J.M.,Gorgaud.,A.,Vincent,P.M., 1987, Eruptive history of the Colima volcanic complex (Mexico): Journal of Volcanology and Geothermal Research, 31,99-113.
Rothery, D.A., Borgia, A., Carlton, R.W., Oppenheimer, C.,1992, The 1992 Etna lava flow imaged by Landsat TM: International Journal of RemoteSensing,13,2759-2763.
Saucedo-Girón, R., 2000, Erupciones de 1991 y 1998-1999 del Volcán de Colima: mecanismos de transporte y depositación de los flujos piroclásticos y de bloques y ceniza: Universidad Nacional Autónoma de México, Posgrado en Ciencias de la Tierra, Ph. D. Thesis,132pp.
Scott, K.M., 1988, Origins, behavior, and sedimentology of lahars and lahar-runout flows in the Toutle-Cowlitz River System: United States Geological Survey, Professional Paper 1447-A, 74 pp.
Stevens,N.F.,Wadge,G.,William,C.A.,2001,Post-emplacementlavasubsidence and the accuracy of ERS InSAR digital elevation models of volcanoes: International Journal of Remote Sensing, 22(5),819-828.
Tilton, J.C., 2006, RHSEG User´s Manual: National Aeronautics and Space Administration,53pp.
Tilton, J.C., Lawrence, W.T., Plaza, A.J., 2006, Utilizing hierarchical segmentation to generate water and snow masks to facilitate monitoring change with remotely sensed image data: GIScience andRemoteSensing,43,39-66.
Torres, R.C., Self, S., Martinez, M.L., 1996, Secondary pyroclastic flows fromtheJune15,1991,ignimbriteofMountPinatubo,in Newhall, C.G., Punongbayan, R.S. (eds.), Fire and mud: Eruptions and lahars of Mount Pinatubo, Philippines: Seattle, University of Washington Press and Philippine Institute of Volcanology and Seismology, 665– 678.
Torres, R., Mouginis-Mark, P., Self, S., Garbeil, H., Kallianpur, K., Quiambao,R.,2004,MonitoringtheevolutionofthePasig–Potreroalluvialfan,PinatuboVolcano,usingadecadeofremotesensing data: Journal of Volcanology and Geothermal Research, 138,371-392.
Van Wyk de Vries, B., Kerle N., Petley, D., 2000, Sector collapse forming at Casita Volcano, Nicaragua: Geology, 28( 2), 167-170.
Wooster, M.J., Rothery, D.A., 1997, Thermal monitoring of Lascar Volcano, Chile, using infrared data from the along-track scanning radiometer: a 1992 – 1995 time series: Bulletin of Volcanology, 58,566-579.
Wooster, M.J., Kaneko, T., Nakada, S., Shimizu, H., 2000, Discrimination of lava dome activity styles using satellite-derived thermal structures: Journal of Volcanology and Geothernal Reseach, 102,97-118.
Manuscriptreceived:September5,2010Correctedmanuscriptreceived:March10,2011Manuscript accepted: May 30, 2011