Embed Size (px)
Citation preview

This article was downloaded by: [Anne Gobin]On: 20 March 2014, At: 06:46Publisher: Taylor & FrancisInforma Ltd Registered in England and Wales Registered Number: 1072954 Registered office: Mortimer House,37-41 Mortimer Street, London W1T 3JH, UK
Chinese Journal of Population Resources andEnvironmentPublication details, including instructions for authors and subscription information:http://www.tandfonline.com/loi/tpre20
Uncovering causes and effects of desertification usinga Leopold matrix in Binh Thuan Province, VietnamLe Trinh Haiab, Anne Gobinb & Luc Hensb
a Institute of Geography, Vietnam Academy of Science and Technology, Hanoi, Vietnamb Flemish Institute for Technological Research (VITO), Mol, BelgiumPublished online: 18 Mar 2014.
To cite this article: Le Trinh Hai, Anne Gobin & Luc Hens (2014) Uncovering causes and effects of desertification using aLeopold matrix in Binh Thuan Province, Vietnam, Chinese Journal of Population Resources and Environment, 12:1, 57-67, DOI:10.1080/10042857.2014.883052
To link to this article: http://dx.doi.org/10.1080/10042857.2014.883052
PLEASE SCROLL DOWN FOR ARTICLE
Taylor & Francis makes every effort to ensure the accuracy of all the information (the “Content”) containedin the publications on our platform. However, Taylor & Francis, our agents, and our licensors make norepresentations or warranties whatsoever as to the accuracy, completeness, or suitability for any purpose of theContent. Any opinions and views expressed in this publication are the opinions and views of the authors, andare not the views of or endorsed by Taylor & Francis. The accuracy of the Content should not be relied upon andshould be independently verified with primary sources of information. Taylor and Francis shall not be liable forany losses, actions, claims, proceedings, demands, costs, expenses, damages, and other liabilities whatsoeveror howsoever caused arising directly or indirectly in connection with, in relation to or arising out of the use ofthe Content.
This article may be used for research, teaching, and private study purposes. Any substantial or systematicreproduction, redistribution, reselling, loan, sub-licensing, systematic supply, or distribution in anyform to anyone is expressly forbidden. Terms & Conditions of access and use can be found at http://www.tandfonline.com/page/terms-and-conditions

Uncovering causes and effects of desertification using a Leopold matrix in Binh Thuan Province,Vietnam
Le Trinh Haia,b, Anne Gobinb* and Luc Hensb
aInstitute of Geography, Vietnam Academy of Science and Technology, Hanoi, Vietnam; bFlemish Institute for Technological Research(VITO), Mol, Belgium
(Received 29 August 2013; accepted 11 December 2013)
Vietnam is a coastal country projected to be heavily affected by climate change. Binh Thuan Province is part of the driestregion of Vietnam and is prone to desertification. An expert panel participated in developing a Leopold matrix whichallowed for identification of desertification impact factors on the province’s socioeconomic activities and assessment of thestrength of cause–effect relationships in terms of magnitude and importance. Land use planning, surface water, and thelength of the dry season are considered the most important causes, with the overall highest scores for both magnitude andimportance in the cause–effect relationship. The largest effects of the different factors are perceived on water supply foragriculture and household use. Water availability and land use planning are important remedial action domains, whiledrought and land cover require monitoring to assess impacts. The indicators of cause and effect can be used in a longer-termgeneral monitoring and assessment framework to combat desertification in the area.
Keywords: desertification; drought; impact; Leopold matrix; Binh Thuan Province; Vietnam
1. Introduction
The most frequently used definition of desertification isthe degradation of drylands in arid, semi-arid, and dry sub-humid areas. It involves the loss of biological or economicproductivity and complexity in croplands, pastures, andwoodlands mainly due to climate variability and unsus-tainable human activities (UNCCD 1994). Desertificationthreatens the livelihoods and the lives of nearly a billionpeople in more than one hundred countries (UNDP 2004;Helmer & Hihorst 2006). Droughts occur frequently in theareas affected by desertification, and are generally a fea-ture of their natural climate.
Drought is one of the world’s most widespread threatsto affect agricultural production and water supplies. Notonly biophysical parameters such as changes in the onsetof the rainy season, moisture stress, and increasing tem-peratures contribute to drought, but also socioeconomicfactors may contribute to the effects of drought. Incomeand poverty can add to the region’s sensitivity to theeffects of drought (Simelton et al. 2009). The societalimpacts of drought result from the interplay between theduration of the natural meteorological event and thedemand placed by people or ecosystems on water supply.
Vietnam is one of the countries in South-East Asia thatis increasingly affected by climate change. Vietnam’s offi-cial scenario for climate change falls in the middle of arange of alternative climate scenarios for Vietnam whenarranged by their moisture indices, and fits current trendsin observations (MONRE 2009). During the period 1958–
2007 the average temperature increased by 0.5–0.7°C. By2050 an increase of another 0.4°C is projected as com-pared with the 2000 average temperature. During theperiod 1993–2008, the sea level increased on average by3 mm per year. By 2050 an increase of 28–33 cm isprojected. Flooding and sea level rise will affect coastalzones. Typhoons have moved further southwards andincreased in both frequency and intensity during pastdecades. Climate impacts on forestry occur mainly in thesouthern part of Central Vietnam, and depend largely onenvironmental factors such as drought as influenced bytemperature and rainfall (Booth et al. 1999). Droughtaffects 45% of the agricultural land (9.34 million ha outof 21 million ha of agricultural land and forests). Of this,30% (7.84 million ha) are severely degraded. Droughtmainly occurs in the southern part of Central Vietnam,with Binh Thuan, Ninh Thuan, and Khanh Hoa Provincesbeing most severely affected (MONRE 2009).
Binh Thuan Province is dominated by forestry andagriculture, with households enjoying an income ofaround 5000 USD per year which is relatively high com-pared with most other provinces in Vietnam (GSO 2012).The main forms of land degradation are shifting sanddunes over a stretch of about 10 km along the coastline,impinging on agricultural land. Other forms of land degra-dation are salinization, laterite formation, and acidifica-tion. The climate is characterized by high temperatures,long hours of sunshine, little rain, and high evapotran-spiration. In 2005, rainfall was almost zero in the northern
*Corresponding author. Email: [email protected]
Chinese Journal of Population Resources and Environment, 2014Vol. 12, No. 1, 57–67, http://dx.doi.org/10.1080/10042857.2014.883052
© 2014 Shandong Normal University
Dow
nloa
ded
by [
Ann
e G
obin
] at
06:
46 2
0 M
arch
201
4
Tuy Phong and Bac Binh Districts of the province. Thisdrought caused water shortages for 61,304 cattle, 23,582goats, and 4140 sheep representing 38%, 50%, and 85%of the total stock, respectively. That year, 50% of theagricultural land remained unused and the dams collectedonly 40% of the average amount of water (Binh ThuanProvince’s Committee 2005). In Binh Thuan Province,rice and other main crops (e.g. coffee, tea, and fruit)were damaged by drought and a shortage of fresh waterwas caused by drying up of water reservoirs and theintrusion of seawater in groundwater resources.
This research responds to the finding that socioeco-nomic factors in combination with biophysical and envir-onmental factors are important in determining theresilience, sensitivity, and adaptive capacity of productionsystems under drought stress. To identify the impacts ofdesertification, a Leopold matrix was constructed with apanel of experts for assessing the effects of environmentalconditions on socioeconomic activities.
2. Materials and methods: Leopold matrix
A Leopold matrix is used to facilitate the interactiveparticipation of varied and conceivably hierarchical andantagonistic experts and to capitalize on stakeholderknowledge and opinions as valid input to research in aninexact research area (Bunting 2010). The Leopold matrixis a semi-qualitative environmental impact assessmentmethod pioneered in the last century (Leopold et al.1971). It is often applied in environmental impact state-ments (EIS) to identify the potential impact of certainactions on the environment. In the very first study byLeopold et al. (1971), the matrix for a phosphate mininglease, the impact was numerically evaluated in terms ofmagnitude and importance of its cause (9 indicators) andeffect (13 indicators). A matrix with 100 specified actionsand 88 environmental components was designed wherebyeach action and its potential for impacting every environ-mental component was considered. Values assigned toeach cell in the matrix are based on scores or assignedratings, not on measurements as in experimentation. The
flexibility of the Leopold matrix is demonstrated by itswide application range (e.g. evaluation of industries (FAO1996), agriculture and rural development projects(Howells et al. 1998), and general land management(Scott et al. 2008)). The intersections of rows and columnsare completed by each expert to indicate the magnitudeand importance (from 1 to 10) of the impact of eachactivity on every socioeconomic aspect (Box 1) (Bisset1989). Assessments of magnitude and importance tend tobe related, but do not necessarily directly correlate(Leopold et al. 1971). Magnitude can be measured, interms of the area affected by the environmental conditionsand to what degree. Importance is a more subjectivemeasurement. While a proposed environmental conditionmay have a large impact in terms of magnitude, the effectsit causes may not actually affect the environment as awhole. Its main strength is a checklist that incorporatesinformation on cause-and-effect relationships, but it is alsoa useful means to communicate results (Kassim &Simoneit 2005).
We used a Leopold matrix to identify the extent, bothin terms of magnitude and importance, of the socioeco-nomic impacts of desertification processes in Binh ThuanProvince. The matrix consisted of columns representingenvironmental conditions such as potential biological/eco-logical and socioeconomic causes of desertification in theprovince. The rows represent the effects affecting socio-economic activities such as agriculture, water supply,income, expenses, and migration. The Leopold matrixwas established using a 4-step procedure (Bisset 1989):
(1) A list of indicators comprising the column and rowheadings of the matrix was uncovered during aworkshop held in July 2011 at the Institute ofGeography (IG) of the Vietnam Academy ofScience and Technology (VAST) (Gobin et al.2012). The Leopold matrix listed 27 indicators ofenvironmental conditions (causes) arranged verti-cally, and 22 socioeconomic activities (effects)arranged horizontally. The table was accompaniedby a letter of invitation and sent to 30 experts. The
Box 1. Instructions for a Leopold matrix (Bisset, 1989).
1/Identify all socioeconomic activities (located across the top of the matrix) that are potentially impacted bydesertification.2/Under each of the proposed socioeconomic activities, place a slash at the intersection of each environmental,socioeconomic, or biological factor at the side of the matrix if an impact is possible.3/Having completed the matrix, in the upper left-hand corner of each box with a slash, a number from 1 to 10 is placedto indicate the magnitude of the possible impact: 10 represents the highest magnitude and 1 the lowest (no zeroallowed). Before each number, + is placed if the impact would be beneficial. In the lower right-hand corner of the box, anumber from 1 to 10 is placed to indicate the importance of the possible impact: 10 represents the highest importanceand 1 the lowest (no zero allowed).
58 L. T. Hai et al.
Dow
nloa
ded
by [
Ann
e G
obin
] at
06:
46 2
0 M
arch
201
4

panel of experts consisting of researchers (15), envir-onmental experts (5), professors (5), and provincialmanagers (5) was consulted to rate the cause–effectrelationships; the response rate was 77%.
(2) The experts were invited to place two numbersfrom 1 to 10 into each cell of the matrix. In theupper left-hand corner of each cell, the numberrepresents the magnitude of the environmentalconditions (causes) that change the correspondingsocioeconomic activity (effects, e.g. agriculture,water supply, income, expenses, and migration).In the lower right-hand corner of the cell, thenumber indicates the importance of the respectivecause in regard to socioeconomic activities. ALeopold matrix was completed by all the experts.
(3) The assessment data from individual experts wereprocessed to obtain average values per cell andvalue sums per cause and per effect; this was donefor both magnitude and importance.
(4) Following the identification of cause and effectindicators, both were combined in a Leopoldmatrix. The experts were invited to assess bothmagnitude and importance of each cause–effectrelationship in the matrix. Twenty out of the 23experts (10 scientists, 5 managers, and 5 profes-sors) who participated in the identification roundsalso took part in this section of the assessment.
Descriptive statistics were calculated and included aver-age, value sums, quartiles, standard deviations, variance,and correlation coefficients.
3. Results: identification of the impacts ofdesertification
The assessment data (Figure 1) show the scores for themagnitude of impact of 13 environmental, 13 socioeco-nomic, and 2 bio-ecological factors on 14 agricultural, 2water resources, 2 income, 2 expense, and 2 migrationactivities; the results of the importance of the cause–effectrelationships are also provided. The general descriptivestatistics of magnitude and importance of impacts of envir-onmental and social factors on socioeconomic activities inBinh Thuan Province show a close fit between magnitudeand importance.
3.1. Magnitude of impacts
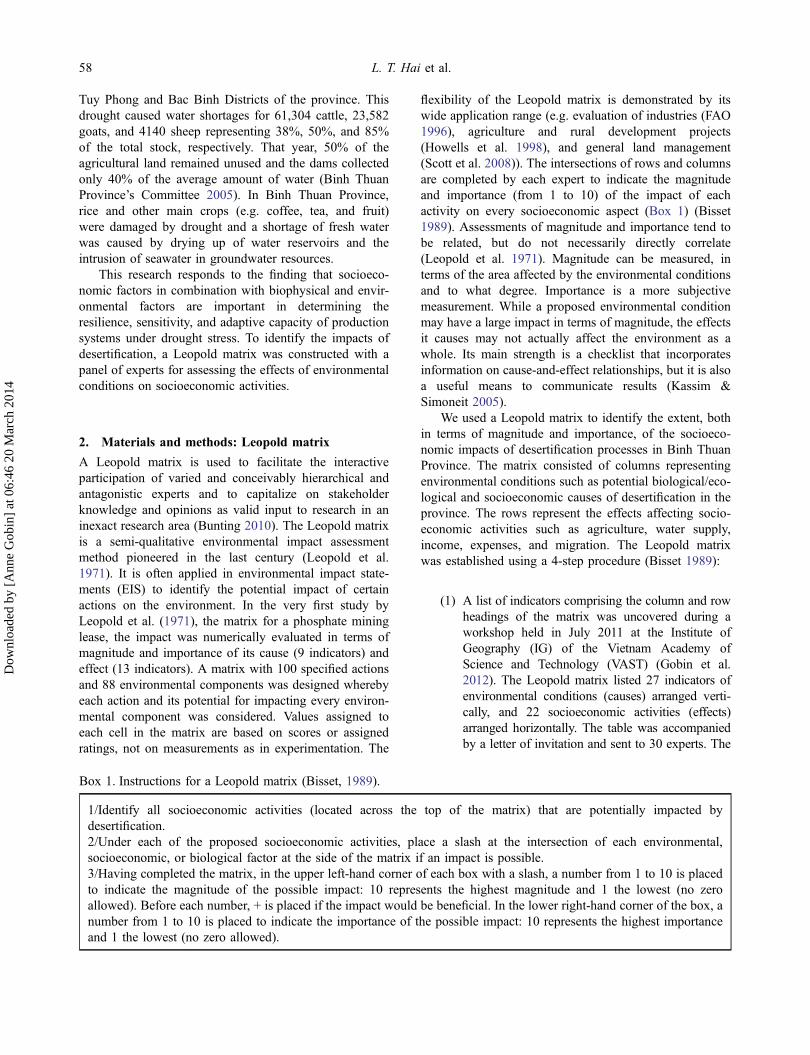
Most experts rated causes and effects low in magnitude:about 54% of the cause–effect relations received scoresbetween 1 and 3 (Figure 2). In 45% of cases, ratings werebetween 4 and 7 (i.e. important in regard to magnitude).Only four relations (1%) were rated as high or very highfor magnitude (scores of 8 or higher). The latter all relatedto water availability: rainfall, surface water bodies, and
dry periods in relation to water supply for agriculture andhousehold uses. Population density was also perceived asan important pressure on water supply for household use.An average minimum value of 0.3 was attributed to wind/wind direction (cause) as related to migration (effect),whereas a maximum average value was 7.6 for surfacewater (cause) related to agricultural water supply (effect).The quantiles of magnitude Q1 and Q3 were 1.89 and 4.32,respectively. The average, median, standard deviation, andvariance were 3.0, 2.7, 1.54, and 2.40, respectively, indi-cating a fairly large spread of scores.
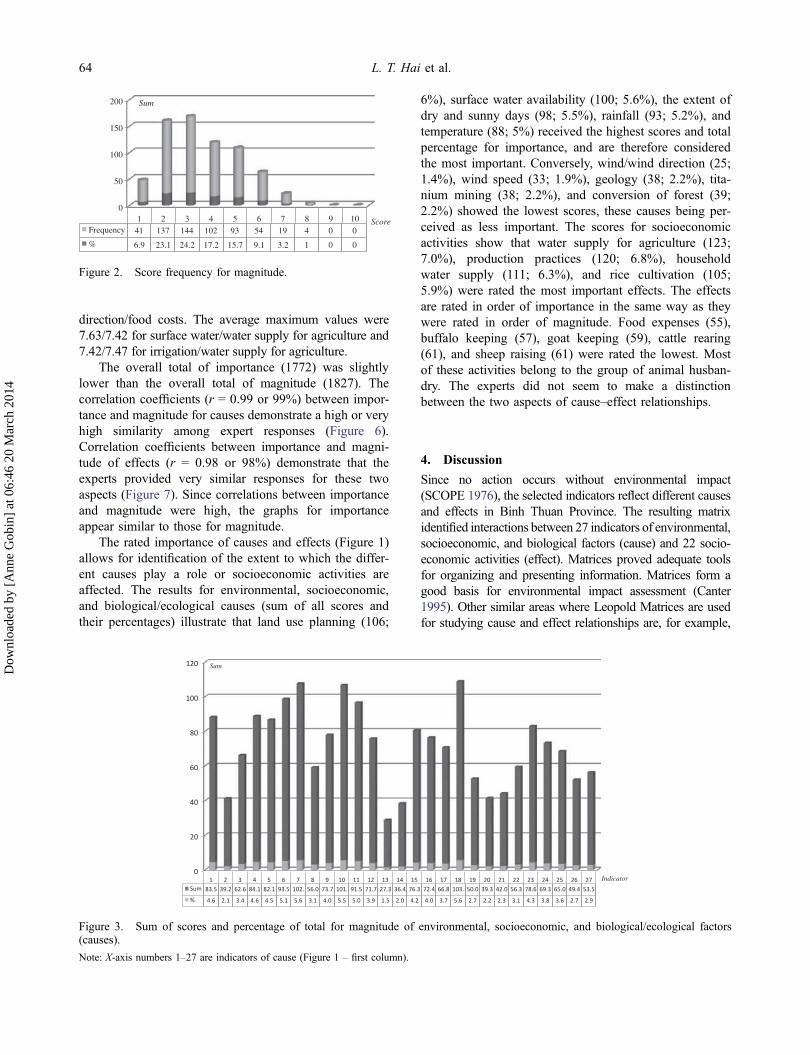
The rating of magnitude of causes and effects (Figure 1)allows for identifying the most important causes and theworst affected activities. The results of the environmental,socioeconomic, and biological causes (Figure 3) indicatethat land use planning (103.2), surface water availability(101.9), and the total of dry and sunny days (101) are themost important causes affecting socioeconomic activities inBinh Thuan. Conversely, wind/wind direction (27.3), windspeed (36.4), geology (39.2), and conversion of forest(39.3) recorded the lowest marks, and are therefore per-ceived as having a low impact on socioeconomic activities.The sum of all scores and their percentages (Figure 4) forthe socioeconomic activities agriculture, water supply,income, expense, and migration shows that the highestscores are attributed to water supply for agriculture (125)and production mode (120), followed by household watersupply (111) and rice cultivation (110). Rainfall, surfacewater bodies, dry period, and land use planning had thehighest impact. Conversely, food expenses (54.8), buffalokeeping (59.6), cattle rearing (59.8), and goat keeping(61.5) represented the lowest scores. These socioeconomicactivities are perceived to be less affected by environmen-tal, socioeconomic, and biological causes, with the excep-tion of dry period and temperature, and land use (planning)in the case of animal husbandry activities.
3.2. Importance of impacts
Most experts gave low scores (Figure 5) when assessing theimportance of cause–effect relationships: about 55% gavescores from 2 to 3 (low importance), 44% from 4 to 7(medium importance), and only five observations (1%)were awarded scores from 8 to 10 (high or very high impor-tance). The lowest average score (0.2) was attributed towind/wind direction (cause) related to both immigrationand outmigration (effect), while the highest average score(7.5) was for irrigation (cause) on water supply for agricul-ture (effect). The lowest (25 percentile) and highest (75percentile) for importance were 1.79 and 4.05, respectively.Average, median, standard deviation, and variance were 3.1,2.8, 1.54, and 2.38, respectively. There was a marked simi-larity between magnitude and importance. When comparingthe two, the average minimum values were 0.26/0.21 forwind direction/immigration and 0.58/0.47 for wind
Chinese Journal of Population Resources and Environment 59
Dow
nloa
ded
by [
Ann
e G
obin
] at
06:
46 2
0 M
arch
201
4

Figure1.
Magnitude
andim
portance
ofim
pactsof
environm
entalandsocial
factors(causes)
onsocioecono
mic
activ
ities
(effects)in
BinhThu
anProvince.
MA
GN
ITU
DE
IMP
OR
TA
NC
E
Agr
icul
ture
Wat
er
supp
lyIn
com
eE
xpen
dit
ure
Mig
rati
on
∑
Cul
tivat
ed c
rops
Rai
sing
ani
mal
s
Rice
Vegetable
Sweet potatoes
Cotton
Dragon fruit
Cassava
Maize
Buffaloes
Cattle
Goats
Shrimp aquaculture
Fresh water fish aquaculture
Sheep
Mode of crop production
Agriculture
Household
Agriculture
Industry
Health
Food
In migration
Out migration
12
34
56
78
910
1112
1314
1516
1718
1920
2122
Environmental
Geo
grap
hy1
1
3.9 3.
6
3.9 3.
6
3.0 2.
8
4.6 2.
4
4.8 4.
6
2.4 2.
3
2.7 2.
6
2.3 2.
1
2.2 2.
3
2.8 2.
5
4.0 4.
1
3.2 3.
2
3.7 3.
4
4.4 4.
5
6.5 6.
6
5.3 5.
7
4.7 4.
7
3.8 3.
7
3.6 3.
3
2.6 2.
5
4.5 4.
4
4.6 4.
4
83.5 79
.2
Geo
logy
2
2.0 1.
8
1.9 1.
9
1.8 1.
8
2.1 1.
8
2.2 2.
1
1.8 1.
6
1.6 1.
5
0.9 0.
9
0.9 0.
9
0.7 0.
9
1.9 1.
9
1.2 1.
2
1.0 1.
1
2.5 2.
7
3.7 3.7
3.4 3.5
1.8 1.8
2.1 1.9
1.2 1.2
0.5 0.5
1.9 1.7
1.9 1.
7
39.2 38
.4
Soil
char
acte
rist
ics
3
5.8 5.
8
5.5 5.
4
4.9 4.
9
5.3 4.
0
5.1 5.
3
4.3 4.
2
4.5 4.
6
1.0 0.
9
1.1 0.
9
1.5 1.
5
1.5 1.
4
1.1 1.
0
1.2 1.
1
4.8 4.
8
4.0 3.8
2.2 2.1
3.6 3.4
1.2 0.7
0.9 0.8
0.4 0.4
1.3 1.2
1.5 1.
3
62.6 59
.6
Lan
d us
e/la
nd
cove
r4
5.4 5.
2
5.3 5.
2
4.7 4.
7
5.5 4.
3
5.3 5.
5
4.4 4.
4
4.8 4.
9
4.3 4.
1
4.4 4.
2
4.5 4.
3
3.2 3.
2
2.8 2.
8
4.4 4.
1
5.1 5.
2
4.1 3.8
2.2 2.3
4.6 4.7
2.0 2.1
1.4 1.4
1.1 1.1
2.3 2.3
2.4 2.
4
84.1 82
.0
Top
ogra
phy
55.
8 5.7
4.5 4.
2
4.5 4.
3
4.7 3.
0
4.9 4.
7
3.9 3.
7
3.4 3.
3
2.3 2.
4
2.8 3.
0
2.8 2.
9
4.1 4.
1
4.0 3.
9
3.5 3.
4
5.4 5.
5
6.2 6.3
4.9 4.6
3.5 3.5
2.6 2.5
1.9 2.0
1.0 0.9
2.4 2.3
3.0 2.
9
82.1 79
.2
Rai
nfal
l6
6.8 6.
5
5.9 5.
8
4.9 4.
6
5.1 4.
0
5.3 5.
1
4.5 4.
6
4.7 4.
7
2.9 3.
3
2.7 3.
1
2.7 3.
2
4.7 4.
8
4.0 3.
8
3.1 2.
7
5.7 5.
8
7.1 7.
1
6.0 6.
4
4.9 4.
9
2.3 2.
3
3.3 3.
1
2.5 2.
5
2.2 2.
5
1.9 2.
2
93.5 92
.9
Surf
ace
wat
er7
6.6 6.
7
4.9 4.
9
4.1 3.
8
4.5 4.
0
4.7 4.
5
2.8 2.
5
3.8 3.
6
3.9 3.
4
3.6 3.
4
2.8 2.
8
6.3 6.
1
6.3 6.
1
3.1 3.
4
5.7 5.
5
7.6 7.
4
6.8 7.
1
5.4 5.
5
4.1 4.
5
4.2 4.
1
3.7 4.
0
3.6 3.
4
3.4 3.
1
101.
9
99.6
(con
tinued)
60 L. T. Hai et al.
Dow
nloa
ded
by [
Ann
e G
obin
] at
06:
46 2
0 M
arch
201
4

Figure1.
(Con
tinued).
MA
GN
ITU
DE
IMP
OR
TA
NC
E
Agr
icul
ture
Wat
er
supp
lyIn
com
eE
xpen
dit
ure
Mig
rati
on
∑
Cul
tivat
ed c
rops
Rai
sing
ani
mal
s
Rice
Vegetable
Sweet potatoes
Cotton
Dragon fruit
Cassava
Maize
Buffaloes
Cattle
Goats
Shrimp aquaculture
Fresh water fish aquaculture
Sheep
Mode of crop production
Agriculture
Household
Agriculture
Industry
Health
Food
In migration
Out migration
12
34
56
78
910
1112
1314
1516
1718
1920
2122
Gro
und
wat
er8
2.0 1.
9
2.1 2.
3
2.3 2.
5
3.0 2.
5
3.0 3.
0
1.3 1.
4
1.3 1.
4
1.3 1.
1
1.2 1.
1
1.2 1.
2
3.2 3.
2
2.2 2.
2
2.2 2.
4
3.4 3.
2
3.8 3.
6
6.4 6.
5
2.7 3.
2
3.2 3.
2
3.2 3.
3
3.1 3.
3
2.3 2.
2
1.9 1.
9
56.0 56
.3
Suns
hine
du
ratio
n9
5.4 5.
3
5.0 4.
9
4.5 4.
3
5.6 4.
5
5.6 5.
6
3.7 3.
6
4.4 4.
2
1.7 1.
7
2.1 2.
2
2.2 2.
1
2.6 2.
8
1.8 1.
9
2.8 2.
6
3.2 3.
4
4.7 4.
4
3.7 3.
6
3.8 3.
5
1.5 1.
5
4.0 3.
8
2.6 2.
3
1.3 1.
2
1.4 1.
3
73.7 70
.7
Ext
ent o
f dr
y,
sunn
y da
ys1 0
6.2 5.
9
6.3 6.
4
5.0 5.
0
5.2 4.
3
5.4 5.
2
4.4 4.
5
5.2 5.
2
4.6 4.
4
4.3 4.
2
4.3 4.
0
3.8 3.
5
3.6 3.
4
4.5 4.
1
4.1 4.
2
6.7 6.
3
5.8 5.
9
5.3 5.
3
2.7 2.
7
4.7 4.
8
4.2 4.
3
2.2 2.
1
2.4 2.
4
101.
0
98.0
Tem
pera
ture
1 1
5.2 5.
1
5.4 5.
5
4.6 4.
5
5.2 4.
4
5.3 5.
2
3.8 3.
8
4.2 4.
3
4.7 4.
6
4.6 4.
5
4.1 3.
9
4.8 4.
6
4.5 3.
9
4.8 4.
8
4.3 4.
5
5.1 4.
7
4.0 4.
1
3.5 3.
3
2.3 2.
3
4.4 4.
4
3.4 3.
3
1.8 1.
4
1.6 1.
3
91.5 88
.2
Hum
idity
1 2
5.2 4.
3
5.3 4.
7
4.3 3.
6
4.3 4.
0
5.1 4.
3
3.7 3.
2
4.1 3.
5
2.7 2.
4
2.6 2.
3
2.3 1.
9
2.1 1.
8
2.3 2.
1
3.4 3.
3
3.6 3.
7
4.5 4.1
3.3 3.2
3.1 2.7
1.8 1.8
4.1 4.1
1.9 1.9
1.0 1.1
0.9 0.
9
71.7 64
.9
Win
d di
rect
ion
1 3
1.7 1.
5
1.9 1.
8
1.4 1.
3
1.1 0.
9
1.3 1.
1
1.1 1.
0
1.5 1.
2
1.3 1.
2
1.3 1.
2
1.1 1.
0
0.8 0.
7
0.6 0.
6
1.3 1.
2
2.4 2.
4
1.6 1.
6
1.1 1.
1
1.2 1.
2
0.7 0.
7
2.8 2.
7
0.6 0.
5
0.3 0.
2
0.3 0.
2
27.3 25
.1
Win
d sp
eed
1 4
3.3 2.
8
2.7 2.
3
1.7 1.
4
2.7 2.
7
3.2 2.
7
2.0 1.
6
3.4 3.
2
1.0 0.
8
0.9 0.
8
0.8 0.
7
0.7 0.
6
0.5 0.
5
1.0 0.
8
2.4 2.
2
1.7 1.
8
1.2 1.
0
1.9 1.
9
0.9 0.
8
2.1 2.
3
1.0 1.
0
0.7 0.
7
0.6 0.
6
36.4 33
.3
Nat
ural
haz
ards
1 5
4.1 3.
6
4.0 3.
5
3.9 3.
4
3.2 2.
5
3.7 3.
2
3.6 3.
5
3.1 2.
9
2.7 2.
4
2.6 2.
4
2.6 2.
5
4.2 4.
1
3.8 3.
7
2.3 2.
2
4.5 4.
7
3.8 4.
0
3.8 3.
9
4.4 4.
4
2.7 2.
7
3.2 3.
2
2.9 3.
2
3.4 3.
2
3.8 3.
7
76.3 72
.9
(con
tinued)
Chinese Journal of Population Resources and Environment 61
Dow
nloa
ded
by [
Ann
e G
obin
] at
06:
46 2
0 M
arch
201
4

Figure1.
(Con
tinued).
MA
GN
ITU
DE
IMP
OR
TA
NC
E
Agr
icul
ture
Wat
er
supp
lyIn
com
eE
xpen
dit
ure
Mig
rati
on
∑
Cul
tivat
ed c
rops
Rai
sing
ani
mal
s
Rice
Vegetable
Sweet potatoes
Cotton
Dragon fruit
Cassava
Maize
Buffaloes
Cattle
Goats
Shrimp aquaculture
Fresh water fish aquaculture
Sheep
Mode of crop production
Agriculture
Household
Agriculture
Industry
Health
Food
In migration
Out migration
12
34
56
78
910
1112
1314
1516
1718
1920
2122
Socio-economic
Popu
latio
n de
nsity
1 6
3.6 3.
4
3.2 3.
2
1.9 1.
7
2.2 1.
8
2.2 2.
2
2.2 2.
1
2.2 2.
1
2.5 2.
5
2.7 2.
7
2.8 2.
8
2.1 2.
0
2.5 2.
5
1.9 1.
8
3.9 3.
8
4.7 4.
7
6.8 6.
9
4.4 4.
3
3.1 3.
2
4.1 3.
9
3.1 3.
0
5.1 5.
1
5.4 5.
1
72.4 70
.7
Soci
al
awar
enes
s1 7
2.6 2.
5
2.6 2.
5
2.1 2.
0
2.5 2.
1
2.8 2.
5
2.8 2.
5
2.7 2.
5
2.1 1.
9
2.2 2.
1
2.2 2.
1
3.3 3.
3
2.8 2.
5
2.5 2.
4
5.7 5.
7
2.7 2.
7
3.4 3.
4
3.7 3.
5
3.7 3.
5
4.0 3.
9
3.6 3.
6
3.2 3.
3
3.4 3.
4
66.8 63
.8
Lan
d us
e pl
anni
ng1 8
6.0 5.
7
5.5 5.
5
5.1 5.
2
5.0 4.
2
5.2 5.
0
4.9 5.
0
5.1 5.
1
4.5 4.
6
4.5 7.
2
4.4 4.
4
5.0 5.
2
4.7 4.
7
4.1 4.
0
6.6 6.
7
6.0 5.
9
4.8 4.
9
5.5 6.
1
3.5 3.
6
1.9 1.
7
1.3 1.
2
5.1 5.
0
4.6 4.
7
103.
2
105.
6
Fore
stry
1 9
3.1 2.
9
2.1 1.
9
1.7 1.
6
1.6 2.
1
1.6 1.
6
2.7 2.
8
2.5 2.
5
1.3 1.
3
1.2 1.
1
1.9 1.
4
1.9 2.
1
1.2 1.
4
1.5 1.
5
3.3 3.
4
4.5 4.
5
3.9 3.
8
3.6 3.
6
2.7 2.
4
1.9 1.
8
1.2 1.
1
2.6 2.
8
2.0 1.
9
49.9 49
.4
Con
vers
ion
of
fore
st2 0
2.3 2.
0
1.6 1.
5
1.4 1.
3
1.3 1.
6
1.4 1.
3
2.1 2.
1
1.9 1.
9
1.3 1.
3
1.3 1.
4
1.6 1.
7
0.9 0.
9
0.8 0.
7
1.0 1.
0
3.9 3.
9
3.1 3.
3
2.7 2.
8
2.2 1.
9
2.1 1.
9
1.9 2.
0
1.2 1.
1
1.9 1.
7
1.4 1.
2
39.3 38
.7
Tita
nium
m
inin
g2 1
1.4 0.
9
1.4 1.
2
1.5 1.
5
0.9 0.
5
1.0 0.
9
0.7 0.
6
0.7 0.
6
0.6 0.
5
0.8 0.
7
1.1 0.
9
2.6 2.
5
2.4 2.
3
1.2 1.
1
3.8 3.
5
2.3 2.
1
2.7 2.
5
2.0 1.
9
5.2 5.
0
2.5 2.
4
1.8 1.
7
2.9 2.
2
2.5 2.
8
41.9 38
.5
Aqu
acul
ture
2 2
3.6 3.
4
1.9 1.
8
1.6 1.
6
1.4 0.
8
1.3 1.
4
0.9 0.
9
0.9 0.
9
0.7 0.
7
0.7 0.
7
1.1 0.
8
7.1 6.
6
6.5 6.
1
0.8 0.
7
4.5 4.
3
3.6 4.
0
2.6 2.
9
4.9 4.
8
2.1 2.
3
2.8 2.
8
2.7 2.
7
2.4 2.
3
2.2 2.
0
56.3 54
.5
Irri
gatio
n2 3
6.5 6.
7
4.9 5.
0
3.3 3.
5
3.8 2.
8
3.5 3.
8
2.7 2.
8
3.3 3.
4
1.4 1.
4
1.3 1.
3
1.5 1.
5
4.2 4.
1
4.3 4.
2
1.4 1.
4
6.4 6.
4
7.4 7.
5
6.1 5.
9
6.2 6.
0
2.3 2.
3
2.3 2.
7
1.4 1.
7
2.2 2.
5
2.2 2.
2
78.6 79
.2
(con
tinued)
62 L. T. Hai et al.
Dow
nloa
ded
by [
Ann
e G
obin
] at
06:
46 2
0 M
arch
201
4

Figure1.
(Con
tinued).
MA
GN
ITU
DE
IMP
OR
TA
NC
E
Agr
icul
ture
Wat
er
supp
lyIn
com
eE
xpen
dit
ure
Mig
rati
on
∑
Cul
tivat
ed c
rops
Rai
sing
ani
mal
s
Rice
Vegetable
Sweet potatoes
Cotton
Dragon fruit
Cassava
Maize
Buffaloes
Cattle
Goats
Shrimp aquaculture
Fresh water fish aquaculture
Sheep
Mode of crop production
Agriculture
Household
Agriculture
Industry
Health
Food
In migration
Out migration
12
34
56
78
910
1112
1314
1516
1718
1920
2122
Hyd
roel
ectr
icit
y22 4
4.7 4.
7
3.9 4.
0
2.5 2.
7
3.0 2.
0
2.8 3.
0
2.0 2.
1
2.3 2.
4
1.4 1.
5
1.5 1.
5
1.6 1.
7
3.1 3.
1
3.6 3.
5
1.4 1.
5
5.3 5.
4
6.6 6.
4
4.8 4.
6
4.4 3.
9
3.6 3.
0
2.0 2.
0
1.3 1.
3
3.0 3.
1
4.4 4.
5
69.3 67
.8
Imm
igra
nt-r
ese
ttlem
ent
32 5
2.8 2.
5
2.6 2.
4
2.3 2.
1
1.6 1.
7
1.8 1.
6
2.2 2.
0
2.3 2.
1
2.2 2.
0
2.3 2.
2
2.3 2.
2
1.6 1.
5
2.3 2.
1
1.5 1.
3
5.2 5.
4
4.6 4.
5
5.2 5.
0
3.6 3.
8
1.8 1.
9
3.5 3.
3
2.8 2.
6
5.3 5.
2
5.3 5.
1
64.9 62
.3
Biological/ecology
Dun
es2 6
2.1 2.
5
2.7 3.
2
3.2 3.
4
2.8 1.
5
2.8 2.
8
2.1 2.
1
1.7 1.
8
1.3 1.
3
1.3 1.
3
1.5 1.
5
2.6 2.
4
2.6 2.
5
1.7 1.
8
3.8 3.
9
3.2 3.
2
2.8 3.
0
2.7 2.
5
1.6 1.
5
2.5 2.
4
1.6 1.
7
1.3 1.
3
1.4 1.
2
49.4 48
.8
Fore
st c
over
2 7
2.2 2.
2
1.9 1.
8
1.7 1.
8
1.8 1.
2
1.8 1.
8
1.7 1.
7
1.5 1.
5
2.6 2.
3
2.5 2.
3
3.0 2.
8
1.1 1.
3
1.2 1.
6
2.1 2.
4
5.5 5.
1
5.2 5.
3
4.7 4.
8
3.3 3.
3
1.9 1.
9
3.1 2.
9
1.3 1.
4
1.9 1.
7
1.5 1.
5
53.5 52
.4
∑
110.
3 105. 1
99.0 96
.5
83.9 81.5
89.9 71.7
93.1 89.9
74.6 72.5
79.8 77.9
59.6 56.9
59.8 61.1
61.5 59.3
83.5 81.2
76.6 74.4
63.3 61.2
119.
6 119. 7
124.
9 123. 4
110.
7 111. 5
100.
6 99.8
67.6 66.1
77.4 76.4
54.8 54.5
68.0 65.8
68.0 66.0
1826
.6
1772
. 2
Notes:The
causes
(m=27)arerepresentedby
rowsandtheeffects(n=22)by
columns
inthematrix.
1And
naturalterrain.
2Reservo
irop
erations.
3From
developm
entprojects.
Chinese Journal of Population Resources and Environment 63
Dow
nloa
ded
by [
Ann
e G
obin
] at
06:
46 2
0 M
arch
201
4
direction/food costs. The average maximum values were7.63/7.42 for surface water/water supply for agriculture and7.42/7.47 for irrigation/water supply for agriculture.
The overall total of importance (1772) was slightlylower than the overall total of magnitude (1827). Thecorrelation coefficients (r = 0.99 or 99%) between impor-tance and magnitude for causes demonstrate a high or veryhigh similarity among expert responses (Figure 6).Correlation coefficients between importance and magni-tude of effects (r = 0.98 or 98%) demonstrate that theexperts provided very similar responses for these twoaspects (Figure 7). Since correlations between importanceand magnitude were high, the graphs for importanceappear similar to those for magnitude.
The rated importance of causes and effects (Figure 1)allows for identification of the extent to which the differ-ent causes play a role or socioeconomic activities areaffected. The results for environmental, socioeconomic,and biological/ecological causes (sum of all scores andtheir percentages) illustrate that land use planning (106;
6%), surface water availability (100; 5.6%), the extent ofdry and sunny days (98; 5.5%), rainfall (93; 5.2%), andtemperature (88; 5%) received the highest scores and totalpercentage for importance, and are therefore consideredthe most important. Conversely, wind/wind direction (25;1.4%), wind speed (33; 1.9%), geology (38; 2.2%), tita-nium mining (38; 2.2%), and conversion of forest (39;2.2%) showed the lowest scores, these causes being per-ceived as less important. The scores for socioeconomicactivities show that water supply for agriculture (123;7.0%), production practices (120; 6.8%), householdwater supply (111; 6.3%), and rice cultivation (105;5.9%) were rated the most important effects. The effectsare rated in order of importance in the same way as theywere rated in order of magnitude. Food expenses (55),buffalo keeping (57), goat keeping (59), cattle rearing(61), and sheep raising (61) were rated the lowest. Mostof these activities belong to the group of animal husban-dry. The experts did not seem to make a distinctionbetween the two aspects of cause–effect relationships.
4. Discussion
Since no action occurs without environmental impact(SCOPE 1976), the selected indicators reflect different causesand effects in Binh Thuan Province. The resulting matrixidentified interactions between 27 indicators of environmental,socioeconomic, and biological factors (cause) and 22 socio-economic activities (effect). Matrices proved adequate toolsfor organizing and presenting information. Matrices form agood basis for environmental impact assessment (Canter1995). Other similar areas where Leopold Matrices are usedfor studying cause and effect relationships are, for example,
0
50
100
150
200
1 2 3 4 5 6 7 8 9 10Frequency 41 137 144 102 93 54 19 4 0 0
% 6.9 23.1 24.2 17.2 15.7 9.1 3.2 1 0 0
Sum
Score
Figure 2. Score frequency for magnitude.
0
20
40
60
80
100
120
1 2 3 4 5 6 7 8 9 10 11 12 13 14 15 16 17 18 19 20 21 22 23 24 25 26 27
Sum 83.5 39.2 62.6 84.1 82.1 93.5 102. 56.0 73.7 101. 91.5 71.7 27.3 36.4 76.3 72.4 66.8 103. 50.0 39.3 42.0 56.3 78.6 69.3 65.0 49.4 53.5
% 4.6 2.1 3.4 4.6 4.5 5.1 5.6 3.1 4.0 5.5 5.0 3.9 1.5 2.0 4.2 4.0 3.7 5.6 2.7 2.2 2.3 3.1 4.3 3.8 3.6 2.7 2.9
Sum
Indicator
Figure 3. Sum of scores and percentage of total for magnitude of environmental, socioeconomic, and biological/ecological factors(causes).
Note: X-axis numbers 1–27 are indicators of cause (Figure 1 – first column).
64 L. T. Hai et al.
Dow
nloa
ded
by [
Ann
e G
obin
] at
06:
46 2
0 M
arch
201
4

between development actions and landscape characteristicsand processes (Ndubisi 2002) or qualitative informationbetween surface and groundwater (Allard 2005). The strengthof using a Leopold matrix is that both important and lessimportant effects and their causes are elicited in situationswhere the environment is affected. The matrix identifies fac-tors that are perceived to influence certain activities (Howellset al. 1998). The disadvantages are that the method maysimplify pathway impacts, thereby not explicitly representingspatial or temporal considerations, and not adequately addres-sing synergistic impacts (Lohani et al. 1997).
Climate impacts have been reviewed for major sectorssuch as agriculture, horticulture, forestry, fisheries, andland conservation (Watson et al. 1996). The combined
0
20
40
60
80
100
120
140
1 2 3 4 5 6 7 8 9 10 11 12 13 14 15 16 17 18 19 20 21 22Sum 110 99 83.9 89.9 93.1 74.6 79.8 59.6 59.8 61.5 83.5 76.6 63.3 120 125 111 101 67.6 77.4 54.8 68 68
% 6.0 5.4 4.6 4.9 5.1 4.1 4.4 3.3 3.3 3.4 4.6 4.2 3.5 6.5 6.8 6.1 5.5 3.7 4.2 3.0 3.7 3.7
Sum
Indicator
Figure 4. Sum of scores and percentage of total for magnitude of socioeconomic activities (effects).
Note: X-axis numbers 1–22 are indicators of effect (Figure 1 – first row).
020406080
100120140160180
1 2 3 4 5 6 7 8 9 10Frequency 50 140 138 111 90 42 18 5 0 0
% 8.4 23.6 24.2 18.7 15.2 7.1 3 1 0 0
Sum
Score
Figure 5. Score frequency for importance.
20
30
40
50
60
70
80
90
100
110Sum
Magnitude Important
Figure 6. Correlation between importance and magnitude for the factors of cause.
Chinese Journal of Population Resources and Environment 65
Dow
nloa
ded
by [
Ann
e G
obin
] at
06:
46 2
0 M
arch
201
4
effects of desertification and climate change have aggra-vated environmental degradation with potential conse-quences such as population displacement in the worstaffected areas of the world (Warner et al. 2010). A studyof drought risk assessment in the western part ofBangladesh (Shahid & Behrawan 2008) shows that higherpoverty rates and dependence on irrigated agriculture havemade the northern and north-western parts more vulner-able to drought as compared with others. Serious threatsrelated to land degradation in less developed countriesinclude food insecurity and increased health risks, consid-erable economic decline, inundation of coastal areas, anddegradation of fresh water resources (Reuveny 2007). InBinh Thuan Province, however, there is no perceivedevidence of a sharp increase in desertification or droughtimpact. The causes and effects demonstrated in this studyneed monitoring to assess desertification processes. Wateravailability, water-demanding, activities and land use plan-ning are important in identifying potential actions forremediation whereas environmental factors such asdrought and land cover require monitoring in relation toadaptation.
To combat desertification, UNCCD (2007) argues thatassessment methods are needed not only to monitor thestate of dryland degradation, but also to identify the under-lying causes such that relevant issues can be addressed in atimely manner through appropriate interventions. Whileenvironmental and human pressures can cause land todegrade, sustainable land management (SLM) actions canhelp combat degradation (e.g. Nkonya et al. 2011). TheDriver – Pressure – State – Impact – Response (DPSIR)framework, developed by the European EnvironmentAgency (Smeets & Weterings 1999) for monitoring and
assessing environmental change and socioeconomic activ-ities, has the potential to include cause–effect relationshipsin UNCCD assessment methods. A cause–effect analysisinvokes policy factors that drive SLM to counteract agri-culturally related dryland degradation, as concluded byGeist and Lambin (2004) based on a meta-analysis of 132cases of desertification between the years 1700 and 2000. Inaddition, long-term monitoring and assessment can avoiderroneous assumptions and extrapolations that draw fromconventional narratives about causes and effects (Tiffen &Mortimore 1994; Swift 1996). We elicited causes andeffects of desertification in the Binh Thuan Province ofVietnam which, in turn, form a solid basis for furthermonitoring and assessment.
5. Conclusions
Important cause–effect relationships were elicited with thehelp of a Leopold matrix. General descriptive statistics ofmagnitude and importance of environmental, social, andbiological factors on socioeconomic activities in BinhThuan Province of Vietnam helped determine the mostimportant causes and effects related to desertification.Overall, surface water availability, dry period length, andland use planning scored highest for causes. Water supplyfo agriculture and household use, crop production mode,and rice cultivation received the highest score for effects.Water availability and water-demanding activities, as wellas population density and land use planning, are importantpotential action domains for remediation whereasenvironmental factors such as drought and land coverrequire monitoring in relation to adaptation. The indicatorsestablished can be used in a longer-term general
50
60
70
80
90
100
110
120
130Sum
Magnitude Important
Figure 7. Correlation between importance and magnitude for factors of effect.
66 L. T. Hai et al.
Dow
nloa
ded
by [
Ann
e G
obin
] at
06:
46 2
0 M
arch
201
4

monitoring and assessment framework to combat deserti-fication in this area.
AcknowledgmentsThis study is part of work package 3 (Societal Impacts ofDesertification (Gobin et al. 2012)) of the bilateral Vietnamese–Belgian research cooperation: “Impact of global climate changeand desertification on the environment and society in SouthCentral Vietnam (case study in the Binh Thuan province)”funded by the Ministry of Science and Technology (Vietnam)and the Belgian Federal Science Policy Office (Belspo) undercontract BL/03/V28. The authors are grateful to cooperatinghouseholds and provincial and district authorities. We wish tothank Mrs Pham Ha Linh (IG, VAST) for her kindness in helpingus distribute questionnaires.
ReferencesAllard B. 2005. Concepts; methodology and chemical analysis.
In: Kassim TA, Williamson KJ, editors. Environmentalimpact assessment of recycled wastes on surface and ground-waters, Vol. 1. Berlin: Springer-Verlag; p. 409.
Binh Thuan Province’s Committee. 2005. Report on drought andothers remedial measures to support farming. Binh Thuan:Department of Agriculture and Rural Development.
Bisset R. 1989. Introduction to environmental impact assessmentmethods. Proceedings of 10th International Seminar onEnvironmental Impact Assessment and Management,Scotland, University of Aberdeen.
Booth TH, Nghia NH, Kirschbaum MUF, Hackett C, Jovanovic T.1999. Assessing possible impacts of climate change on speciesimportant for forestry inVietnam.Climatic Change. 41:109–126.
Bunting SW. 2010. Assessing the stakeholder Delphi for facil-itating interactive participation and consensus building forsustainable aquaculture development. Society Nat Resour.28:758–775.
Canter LW. 1995. Environmental impact assessment. New York:McGraw-Hill.
FAO. 1996. Environmental impact assessment and environmen-tal auditing in the pulp and paper industry. Rome: FAOForestry Paper 129.
GSO. 2012. Statistical Yearbooks of Vietnam 1990–2011. GeneralStatistics Office. Hanoi: Statistical Publishing House.
Geist HJ, Lambin EF. 2004. Dynamic causal patterns of deserti-fication. BioScience. 54: 817–829.
Gobin A, Linh PH, Hai LT, Hens L. 2012. Societal impacts ofdesertification. Study in the frame of the Bilateral Belgian –Vietnamese Project on impact of global climate change anddesertification on the environment and society in SouthernCentre of Vietnam (case study in Binh Thuan Province).Mol: VITO.
Helmer M, Hihorst D. 2006. Natural disasters and climatechange. Disasters. 30:1–4.
Howells O, Edwards-Jones G, Morgan O. 1998. Ecozone II: adecision support system for aiding environmental impactassessments in agriculture and rural development projectsin developing countries. Comp Electronics Agricult. 20(2):145–164.
Kassim TA, Simoneit BRT. 2005. Environmental impact assess-ment: principles, methodology, and conceptual framework.Berlin: Springer-Verlag.
Leopold LB, Clarke FE, Hanshaw BB, Balsley JR. 1971. Aprocedure for evaluating environmental impact. GeologicalSurvey Circular No. 645. Washington (DC): GovernmentPrinting Office.
Lohani B, Evans JW, Ludwig H, Everitt RR, Carpenter RA, TuSL. 1997. Environmental impact assessment for developingcountries in Asia. Vol. 1 – Overview. Manila: ADB; p. 356.
MONRE. 2009. Climate change and sea level rise scenariosfor Vietnam. Hanoi [Internet]. [cited 2014 Jan 27].Available from: http://www.preventionweb.net/files/11348_ClimateChangeSeaLevelScenariosforVi.pdf
Ndubisi F. 2002. Ecological planning: a historical and compara-tive synthesis. Baltimore (MD): The Johns HopkinsUniversity Press; p. 304.
Nkonya E, Winslow M, Reed MS, Mortimore M, MirzabaevA. 2011. Monitoring and assessing the influence ofsocial, economic and policy factors on sustainable landmanagement in drylands. Land Degrad Develop. 22:240–247.
Reuveny R. 2007. Climate change-induced migration and violentconflict. Polit Geogr. 26(6):656–673.
Scope S. 1976. Environmental impact assessment – Scope 5 –principles and procedures. Social Indicators Res. 3:497–500.
Scott J, Williams G, Davies P. 2008. Building consensus throughthe application of a decision support tool for land managers.Aust J Environ Manag. 15(3):180–188.
Shahid S, Behrawan H. 2008. Drought risk assessment in thewestern part of Bangladesh. Nat Hazards. 46(2008):391–413.
Simelton E, Fraser EDG, Termansen M, Forster PM, Dougill AJ.2009. Typologies of crop-drought vulnerability: an empiricalanalysis of the socio-economic factors that influence thesensitivity and resilience to drought of three major foodcrops in China (1961–2001). Environ Sci Policy. 12:438–425.
Smeets E, Weterings R. 1999. Environmental indicators: topol-ogy and overview. Copenhagen: European EnvironmentAgency; p. 19.
Swift J. 1996. Desertification: narratives, winners and losers. In:Leach M, Mearns R, editors. The lie of the land: challen-ging received wisdom on the African Environment.London: James Currey/International African Institute;p. 73–90.
Tiffen M, Mortimore M. 1994. Malthus controverter: the role ofcapital and technology in growth and environment recoveryin Kenya. World Develop. 22:997–1010.
UNCCD. 1994. An introduction to the United NationsConvention to Combat Desertification. [cited 2011 Dec 6].Available from: http://www.unccd.int/publicinfo/.
UNCCD. 2007. Report of the Conference of the Parties on itsEighth Session. Bonn: Secretariat of the United NationsConvention to Combat Desertification.
UNDP. 2004. Reducing disaster risk: a challenge for develop-ment. New York: A global report.
Warner K, Hamza M, Oliver-Smith A, Renaud F, Julca A. 2010.Climate change, environmental degradation and migration.Nat Hazards. 55:689–715.
Watson RT, Zinyowera MC, Moss RH, editors. 1996. Impacts,adaptations and mitigation of climate change: scientific-tech-nical analyses. Contribution of Working Group II to theSecond Assessment Report of the Intergovernmental Panelon Climate Change. Cambridge: Cambridge UniversityPress; p. 879.
Chinese Journal of Population Resources and Environment 67
Dow
nloa
ded
by [
Ann
e G
obin
] at
06:
46 2
0 M
arch
201
4

![[123doc vn] - thiet ke he thong xu ly nuoc thai nha may che bien tinh bot khoai my binh duong](https://img.pdfslide.net/doc/110x75/631e8a194c5c8fb3a00e3c47/123doc-vn-thiet-ke-he-thong-xu-ly-nuoc-thai-nha-may-che-bien-tinh-bot-khoai.jpg)


